Embed Size (px)
Citation preview
Available online at www.sciencedirect.com
www.elsevier.com/locate/actamat
Acta Materialia 57 (2009) 1015–1025
Fracture mechanics and microstructure in NiTi shape memory alloys
S. Gollerthan a, M.L. Young a,*, A. Baruj a,1, J. Frenzel a, W.W. Schmahl b,c, G. Eggeler a
a Institut fur Werkstoffe, Ruhr-Universitat Bochum, Universitatsstraße 150, D-44801 Bochum, Germanyb Institut fur Geologie, Mineralogie und Geophysik, Ruhr-Universitat Bochum, D-44780 Bochum, Germany
c Department of Earth and Environmental Sciences, Materials Research, LMU Munich, Germany
Received 9 September 2008; received in revised form 16 October 2008; accepted 16 October 2008Available online 26 December 2008
Abstract
Crack extension under static loading in pseudoplastic and pseudoelastic binary NiTi shape memory alloy (SMA) compact tension(CT) specimens was examined. Two material compositions of 50.3 at.% Ni (martensitic/pseudoplastic) and 50.7 at.% Ni (austenitic/pseudoelastic) were investigated. The SMAs were characterized using differential scanning calorimetry to identify the phase transforma-tion temperatures and tensile testing to characterize the stress–strain behavior. A miniature CT specimen was developed, which yieldsreliable critical fracture mechanics parameters. At 295 K, cracks propagate at similar stress intensities of 30� 5 MPa
ffiffiffiffimp
into martensiteand pseudoelastic austenite. Integrating the miniature CT specimen into a small test device which can be fitted into a scanning electronmicroscope shows that this is due to cracks propagating into regions of detwinned martensite in both materials. Investigating a pseudo-elastic miniature CT specimen in a synchrotron beam proves that martensite forms in front of the crack in the center of the CT specimen,i.e. under plane strain conditions.� 2008 Acta Materialia Inc. Published by Elsevier Ltd. All rights reserved.
Keywords: Shape memory alloys (SMA); Mechanical properties testing; Stress-induced martensite; Tension test
1. Introduction
Microstructures and properties of NiTi shape memoryalloys (SMAs) have been described in detail [1–6]. NiTiSMAs are used in a wide range of applications in medicaltechnology and engineering [5–7], because they combinegood functional properties with good mechanical strength[1–6,8]. Their mechanical properties have been investigatedusing tensile (e.g. [9–11]) and fatigue testing (e.g. [9,12–17]).The formation of microcracks during cyclic loading hasbeen observed [15] and crack propagation under cyclicloading conditions has been monitored [16,18–25]. How-ever, the behavior of cracks under static loading conditionsin martensitic, pseudoplastic (50.3 at.% Ni) and austenitic,pseudoelastic (50.7 at.% Ni) NiTi microstructures is not yet
1359-6454/$34.00 � 2008 Acta Materialia Inc. Published by Elsevier Ltd. All
doi:10.1016/j.actamat.2008.10.055
* Corresponding author. Tel.: +49 176 24894769; fax: +49 234 32 14235.E-mail address: [email protected] (M.L. Young).
1 On leave from: TEMADI, Centro Atomico Bariloche, 8400 S.C.Bariloche, Argentina; and CONICET, Argentina.
clear. A systematic study on critical parameters, like KIC
values, has not yet been performed, and there is a needfor identification of conditions under which cracks in mar-tensitic and pseudoelastic NiTi SMAs become unstable. Asof yet, only critical stress intensities of 31 [19,26] and35 MPa
ffiffiffiffimp
[24] for martensitic NiTi SMAs and34 MPa
ffiffiffiffimp
[27,28] for pseudoelastic NiTi SMAs havebeen reported; the latter value comes from fatigue-loadedvery-thin-walled (�400 lm) compact tension (CT) speci-mens, which is most probably in a plane stress condition[27,28].
The elementary processes governing crack initiation andcrack instability are not well understood. Thus, McKelveyand Ritchie [20,21] investigated fatigue crack propagationin pseudoelastic and pseudoplastic NiTi SMAs usingdisk-shaped compact tension specimens of 9 mm thickness.They found that fatigue crack growth resistance increaseswith decreasing temperature and that fatigue thresholdswere higher and crack growth rates slower in martensiteas compared to austenite. They did not observe the forma-
rights reserved.
1016 S. Gollerthan et al. / Acta Materialia 57 (2009) 1015–1025
tion of martensite in front of fatigue cracks growing intopseudoelastic NiTi and relate this absence of stress-inducedmartensite to the triaxial stress state, which characterizestheir plane strain condition. Dauskardt et al. [22] suggestthat the formation of martensite in front of a crack tip isa beneficial process which renders the material more dam-age tolerant and that the absence of stress-induced mar-tensite decreases the material’s resistance to crackpropagation. It is well known that small plastic zones canform in CT specimens of ductile engineering alloys evenunder plane strain conditions. Such specimens yield reason-able fracture mechanics parameters as long as the size ofthe plastic zone (rp) is significantly smaller than the speci-men dimensions (a, B and W), where a, B and W representcrack length, specimen thickness and specimen width,respectively [29,30]. When plastic zones can form bydislocation activity in front of cracks under plane strainconditions, there is no reason why the formation ofstress-induced martensite in front of a pseudoelastic crackshould be suppressed, because both dislocation slip andmartensitic shear are driven by microscopic shear stresses.
The crack tip regions of NiTi SMA CT specimens havebeen studied using a variety of methods, including opticalmicroscopy [19,26], synchrotron [16,24,26] and neutron[23] diffraction. It has been shown that the size of pseudo-plastic zones (regions in front of cracks with favorably ori-ented martensitic variants) can be reasonably wellestimated using fracture mechanics approaches [19,26].Daymond et al. [24] showed that detwinning indeed occursin front of cracks in pseudoplastic martensitic NiTi, thoughVaidyanathan et al. [23] were unable to observe this due tothe limited lateral resolution in their neutron experiments.Robertson et al. [16] studied a thin miniature pseudoelasticNiTi CT specimen subjected to cyclic loading using syn-chrotron X-ray microdiffraction. In contrast to the conclu-sions of McKelvey and Ritchie [20,21], they observed theformation of stress-induced martensite very close to thecrack tip and were able to resolve the local microtexture[16]. Their thin specimen (thickness: 0.4 mm) was mostprobably in a plane stress condition and thus it remainsto be proven whether stress-induced martensite also formsunder plane strain conditions, i.e. in the center of a thickerCT specimen. In addition, a comprehensive comparison ofthe behavior of cracks in martensitic and austenitic NiTihas never been performed and would be very interesting.
The present work has four aspects. First, it provides acomprehensive treatment of the fracture mechanics charac-teristics of three material states in NiTi: martensitic,pseudoelastic (austenitic, but prone to the formation ofstress-induced martensite) and austenitic (without thepotential to form stress-induced martensite) NiTi. Sec-ondly, we compare and discuss the response of miniatureCT specimens to mechanical loading and provide criticaldata for crack extension under static loading for all threematerial states. We then study the evolution of microstruc-tures in front of cracks, which grow into martensitic andpseudoelastic NiTi using in situ experiments in a scanning
electron microscope. Finally, we perform in situ synchro-tron experiments to clarify whether stress-induced martens-ite forms in front of the central part of a crack in a thickpseudoelastic CT specimen (i.e. under plane strainconditions).
2. Materials and experiments
Two NiTi SMAs with 50.3 at.% Ni (martensitic/pseudo-plastic at room temperature) and 50.7 at.% Ni (austenitic/pseudoelastic at room temperature) were purchased fromMemory Metalle, Weil am Rhein. Both alloys were sub-jected to thermomechanical treatments (forming and agingsteps) including a final 6 min heat-treatment at 500 �C forthe pseudoelastic alloy. Both materials were characterizedusing differential scanning calorimetry (DSC), uniaxial ten-sile testing, CT fracture testing, optical and scanning elec-tron microscopy (SEM), and synchrotron diffraction.
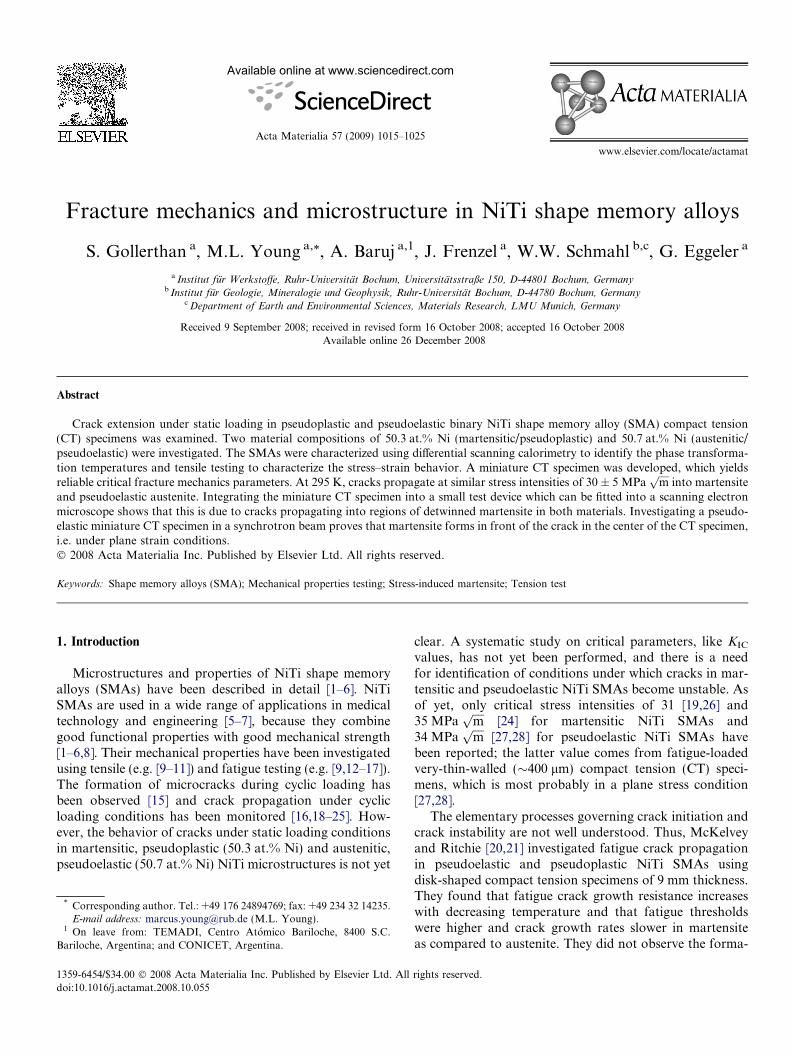
DSC was performed on both SMAs using a TA Instru-ments’ DSC 2920CE machine in a temperature range from123 to 423 K at a heating/cooling rate of 10 K min�1,whereby specimens were held for 5 min at the maximumund minimum temperatures. The details of DSC testinghave been described elsewhere [31]. Fig. 1a shows theDSC chart of the martensitic material investigated in thepresent study. When forward and reverse transformationsrepresent one-step events, the characteristic transformationtemperatures are defined as Ms (start of the martensitictransformation), Mf (temperature where the forward trans-formation is completed), As (start of the austenitic transfor-mation) and Af (temperature where the reversetransformation is completed). For the martensitic alloyinvestigated in the present study, the characteristic temper-atures were obtained as Ms = 317 K, Mf = 289 K,As = 333 K and Af = 357 K (Fig. 1a). As shown inFig. 1b, the austenitic pseudoelastic alloy shows a complexthree-step transformation upon cooling from the high tem-perature phase, which is typically related to the presence ofsmall- and large-scale microstructural heterogeneities [31–36]. We attribute the first peak upon cooling to the forma-tion of R-phase (Rs = 284 K and Rf = 267 K), where Rs
and Rf indicate the starting and finishing temperature ofthe R-phase formation. A small second peak indicates thestart of the formation of B190 (Ms = 229 K), whichaccounts for yet a third peak which ends at the martensitefinish temperature (Mf = 210 K). While the DSC chart fea-tures on cooling appear complex, our pseudoelastic alloyexhibits a simple one-step reverse transformation(As = 276 K and Af = 293 K). The DSC charts in Fig. 1aand b show that, at room temperature (295 K), the alloywith 50.3 at.% Ni is martensitic while the alloy with50.7 at.% Ni is fully austenitic. No further effort was madeto rationalize DSC chart features.
Uniaxial tensile tests, with dog-bone tensile specimensidentical in dimensions to those reported previously [19],were performed using a Zwick/Roell Z100 electromechan-ical test rig with a temperature chamber. These flat tensile
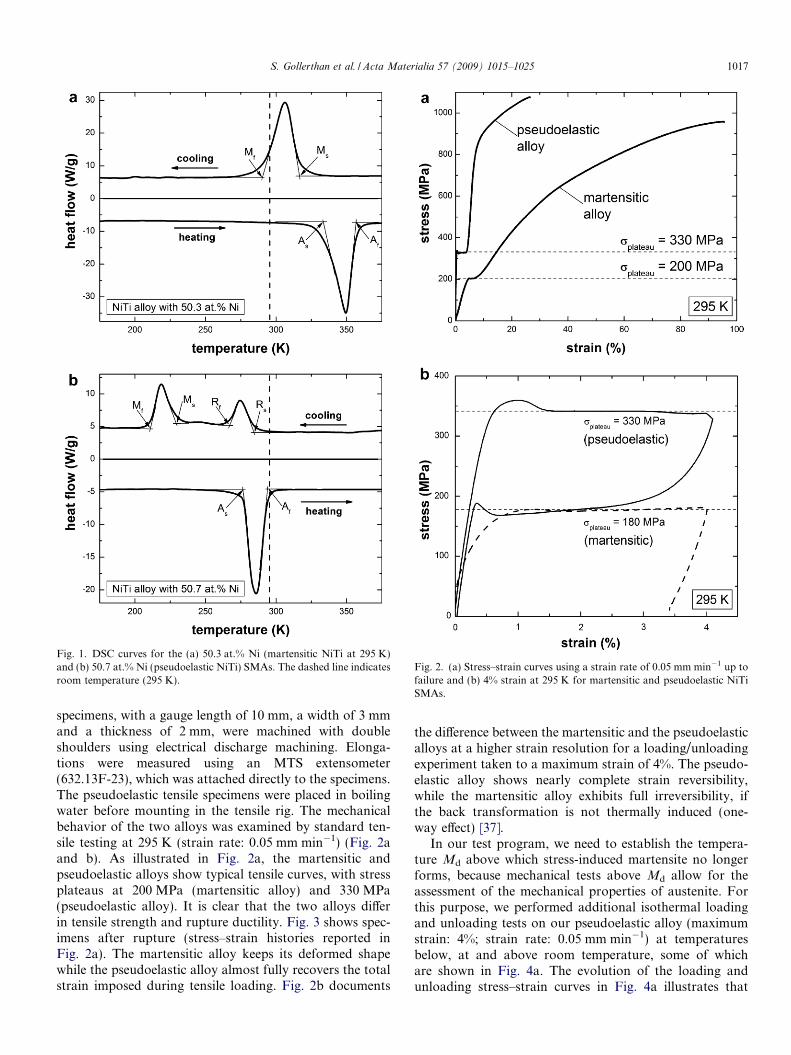
Fig. 1. DSC curves for the (a) 50.3 at.% Ni (martensitic NiTi at 295 K)and (b) 50.7 at.% Ni (pseudoelastic NiTi) SMAs. The dashed line indicatesroom temperature (295 K).
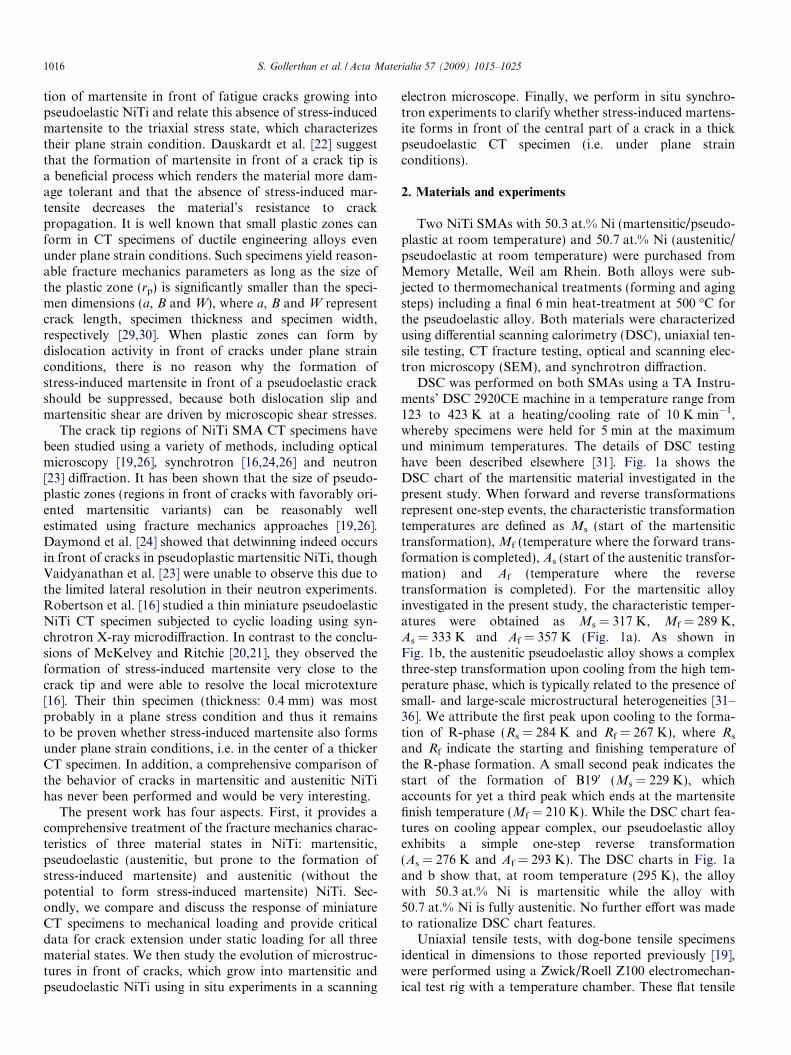
Fig. 2. (a) Stress–strain curves using a strain rate of 0.05 mm min�1 up tofailure and (b) 4% strain at 295 K for martensitic and pseudoelastic NiTiSMAs.
S. Gollerthan et al. / Acta Materialia 57 (2009) 1015–1025 1017
specimens, with a gauge length of 10 mm, a width of 3 mmand a thickness of 2 mm, were machined with doubleshoulders using electrical discharge machining. Elonga-tions were measured using an MTS extensometer(632.13F-23), which was attached directly to the specimens.The pseudoelastic tensile specimens were placed in boilingwater before mounting in the tensile rig. The mechanicalbehavior of the two alloys was examined by standard ten-sile testing at 295 K (strain rate: 0.05 mm min�1) (Fig. 2aand b). As illustrated in Fig. 2a, the martensitic andpseudoelastic alloys show typical tensile curves, with stressplateaus at 200 MPa (martensitic alloy) and 330 MPa(pseudoelastic alloy). It is clear that the two alloys differin tensile strength and rupture ductility. Fig. 3 shows spec-imens after rupture (stress–strain histories reported inFig. 2a). The martensitic alloy keeps its deformed shapewhile the pseudoelastic alloy almost fully recovers the totalstrain imposed during tensile loading. Fig. 2b documents
the difference between the martensitic and the pseudoelasticalloys at a higher strain resolution for a loading/unloadingexperiment taken to a maximum strain of 4%. The pseudo-elastic alloy shows nearly complete strain reversibility,while the martensitic alloy exhibits full irreversibility, ifthe back transformation is not thermally induced (one-way effect) [37].
In our test program, we need to establish the tempera-ture Md above which stress-induced martensite no longerforms, because mechanical tests above Md allow for theassessment of the mechanical properties of austenite. Forthis purpose, we performed additional isothermal loadingand unloading tests on our pseudoelastic alloy (maximumstrain: 4%; strain rate: 0.05 mm min�1) at temperaturesbelow, at and above room temperature, some of whichare shown in Fig. 4a. The evolution of the loading andunloading stress–strain curves in Fig. 4a illustrates that
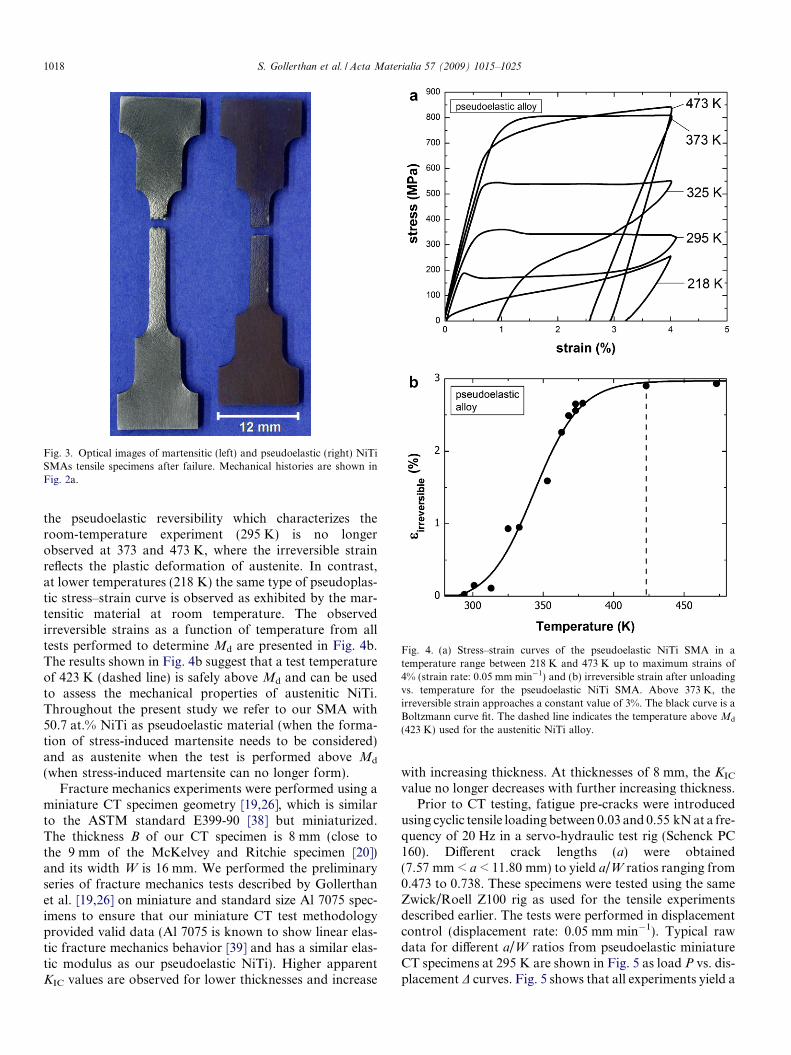
Fig. 3. Optical images of martensitic (left) and pseudoelastic (right) NiTiSMAs tensile specimens after failure. Mechanical histories are shown inFig. 2a.
Fig. 4. (a) Stress–strain curves of the pseudoelastic NiTi SMA in atemperature range between 218 K and 473 K up to maximum strains of4% (strain rate: 0.05 mm min�1) and (b) irreversible strain after unloadingvs. temperature for the pseudoelastic NiTi SMA. Above 373 K, theirreversible strain approaches a constant value of 3%. The black curve is aBoltzmann curve fit. The dashed line indicates the temperature above Md
(423 K) used for the austenitic NiTi alloy.
1018 S. Gollerthan et al. / Acta Materialia 57 (2009) 1015–1025
the pseudoelastic reversibility which characterizes theroom-temperature experiment (295 K) is no longerobserved at 373 and 473 K, where the irreversible strainreflects the plastic deformation of austenite. In contrast,at lower temperatures (218 K) the same type of pseudoplas-tic stress–strain curve is observed as exhibited by the mar-tensitic material at room temperature. The observedirreversible strains as a function of temperature from alltests performed to determine Md are presented in Fig. 4b.The results shown in Fig. 4b suggest that a test temperatureof 423 K (dashed line) is safely above Md and can be usedto assess the mechanical properties of austenitic NiTi.Throughout the present study we refer to our SMA with50.7 at.% NiTi as pseudoelastic material (when the forma-tion of stress-induced martensite needs to be considered)and as austenite when the test is performed above Md
(when stress-induced martensite can no longer form).Fracture mechanics experiments were performed using a
miniature CT specimen geometry [19,26], which is similarto the ASTM standard E399-90 [38] but miniaturized.The thickness B of our CT specimen is 8 mm (close tothe 9 mm of the McKelvey and Ritchie specimen [20])and its width W is 16 mm. We performed the preliminaryseries of fracture mechanics tests described by Gollerthanet al. [19,26] on miniature and standard size Al 7075 spec-imens to ensure that our miniature CT test methodologyprovided valid data (Al 7075 is known to show linear elas-tic fracture mechanics behavior [39] and has a similar elas-tic modulus as our pseudoelastic NiTi). Higher apparentKIC values are observed for lower thicknesses and increase
with increasing thickness. At thicknesses of 8 mm, the KIC
value no longer decreases with further increasing thickness.Prior to CT testing, fatigue pre-cracks were introduced
using cyclic tensile loading between 0.03 and 0.55 kN at a fre-quency of 20 Hz in a servo-hydraulic test rig (Schenck PC160). Different crack lengths (a) were obtained(7.57 mm < a < 11.80 mm) to yield a/W ratios ranging from0.473 to 0.738. These specimens were tested using the sameZwick/Roell Z100 rig as used for the tensile experimentsdescribed earlier. The tests were performed in displacementcontrol (displacement rate: 0.05 mm min�1). Typical rawdata for different a/W ratios from pseudoelastic miniatureCT specimens at 295 K are shown in Fig. 5 as load P vs. dis-placement D curves. Fig. 5 shows that all experiments yield a
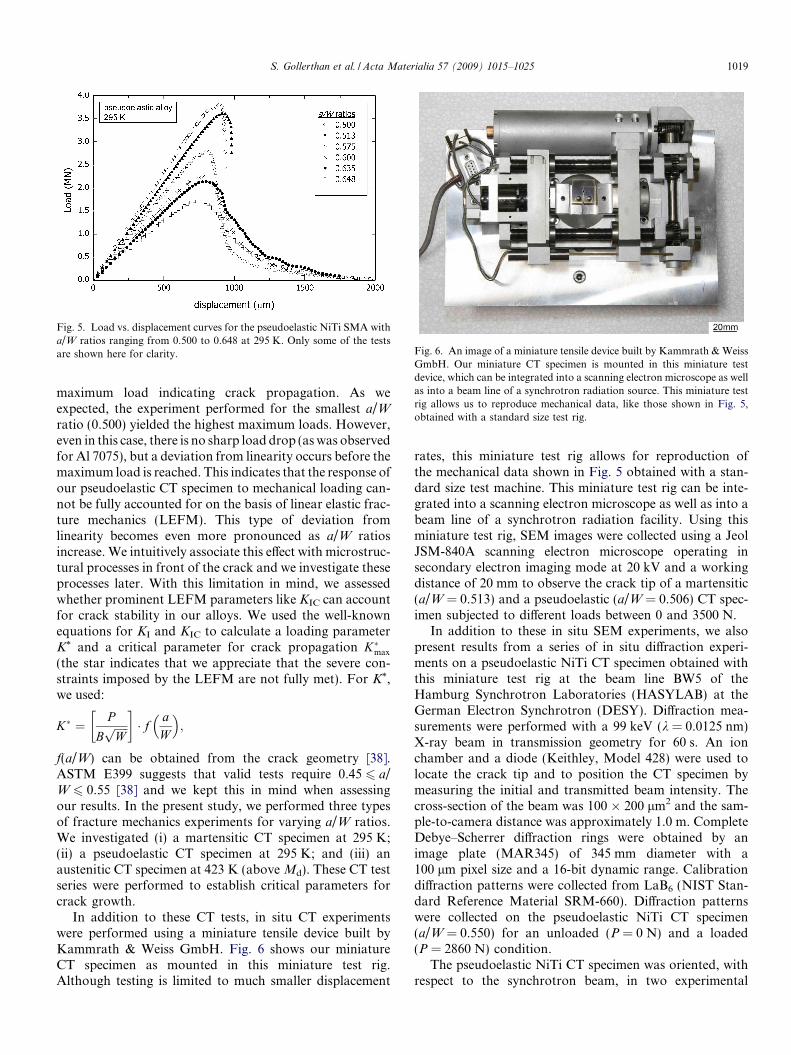
Fig. 5. Load vs. displacement curves for the pseudoelastic NiTi SMA witha/W ratios ranging from 0.500 to 0.648 at 295 K. Only some of the testsare shown here for clarity. Fig. 6. An image of a miniature tensile device built by Kammrath & Weiss
GmbH. Our miniature CT specimen is mounted in this miniature testdevice, which can be integrated into a scanning electron microscope as wellas into a beam line of a synchrotron radiation source. This miniature testrig allows us to reproduce mechanical data, like those shown in Fig. 5,obtained with a standard size test rig.
S. Gollerthan et al. / Acta Materialia 57 (2009) 1015–1025 1019
maximum load indicating crack propagation. As weexpected, the experiment performed for the smallest a/Wratio (0.500) yielded the highest maximum loads. However,even in this case, there is no sharp load drop (as was observedfor Al 7075), but a deviation from linearity occurs before themaximum load is reached. This indicates that the response ofour pseudoelastic CT specimen to mechanical loading can-not be fully accounted for on the basis of linear elastic frac-ture mechanics (LEFM). This type of deviation fromlinearity becomes even more pronounced as a/W ratiosincrease. We intuitively associate this effect with microstruc-tural processes in front of the crack and we investigate theseprocesses later. With this limitation in mind, we assessedwhether prominent LEFM parameters like KIC can accountfor crack stability in our alloys. We used the well-knownequations for KI and KIC to calculate a loading parameterK* and a critical parameter for crack propagation K�max
(the star indicates that we appreciate that the severe con-straints imposed by the LEFM are not fully met). For K*,we used:
K� ¼ P
BffiffiffiffiffiWp
� �� f a
W
� �;
f(a/W) can be obtained from the crack geometry [38].ASTM E399 suggests that valid tests require 0.45 6 a/W 6 0.55 [38] and we kept this in mind when assessingour results. In the present study, we performed three typesof fracture mechanics experiments for varying a/W ratios.We investigated (i) a martensitic CT specimen at 295 K;(ii) a pseudoelastic CT specimen at 295 K; and (iii) anaustenitic CT specimen at 423 K (above Md). These CT testseries were performed to establish critical parameters forcrack growth.
In addition to these CT tests, in situ CT experimentswere performed using a miniature tensile device built byKammrath & Weiss GmbH. Fig. 6 shows our miniatureCT specimen as mounted in this miniature test rig.Although testing is limited to much smaller displacement
rates, this miniature test rig allows for reproduction ofthe mechanical data shown in Fig. 5 obtained with a stan-dard size test machine. This miniature test rig can be inte-grated into a scanning electron microscope as well as into abeam line of a synchrotron radiation facility. Using thisminiature test rig, SEM images were collected using a JeolJSM-840A scanning electron microscope operating insecondary electron imaging mode at 20 kV and a workingdistance of 20 mm to observe the crack tip of a martensitic(a/W = 0.513) and a pseudoelastic (a/W = 0.506) CT spec-imen subjected to different loads between 0 and 3500 N.
In addition to these in situ SEM experiments, we alsopresent results from a series of in situ diffraction experi-ments on a pseudoelastic NiTi CT specimen obtained withthis miniature test rig at the beam line BW5 of theHamburg Synchrotron Laboratories (HASYLAB) at theGerman Electron Synchrotron (DESY). Diffraction mea-surements were performed with a 99 keV (k = 0.0125 nm)X-ray beam in transmission geometry for 60 s. An ionchamber and a diode (Keithley, Model 428) were used tolocate the crack tip and to position the CT specimen bymeasuring the initial and transmitted beam intensity. Thecross-section of the beam was 100 � 200 lm2 and the sam-ple-to-camera distance was approximately 1.0 m. CompleteDebye–Scherrer diffraction rings were obtained by animage plate (MAR345) of 345 mm diameter with a100 lm pixel size and a 16-bit dynamic range. Calibrationdiffraction patterns were collected from LaB6 (NIST Stan-dard Reference Material SRM-660). Diffraction patternswere collected on the pseudoelastic NiTi CT specimen(a/W = 0.550) for an unloaded (P = 0 N) and a loaded(P = 2860 N) condition.
The pseudoelastic NiTi CT specimen was oriented, withrespect to the synchrotron beam, in two experimental
1020 S. Gollerthan et al. / Acta Materialia 57 (2009) 1015–1025
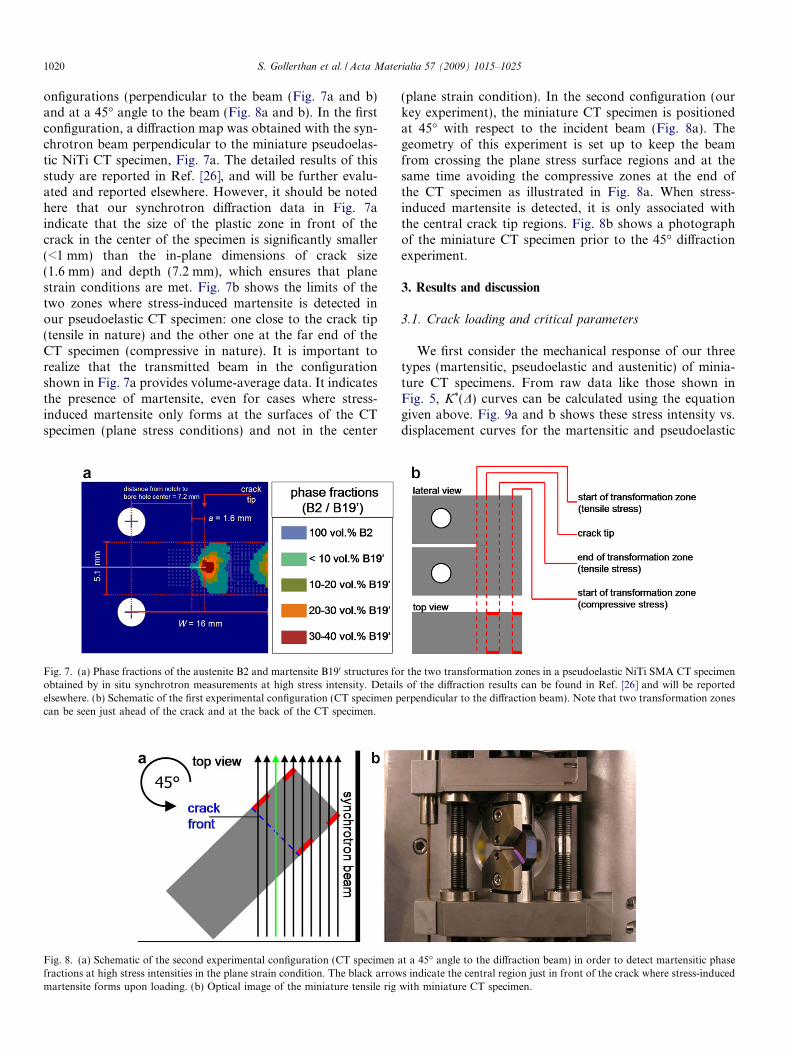
onfigurations (perpendicular to the beam (Fig. 7a and b)and at a 45� angle to the beam (Fig. 8a and b). In the firstconfiguration, a diffraction map was obtained with the syn-chrotron beam perpendicular to the miniature pseudoelas-tic NiTi CT specimen, Fig. 7a. The detailed results of thisstudy are reported in Ref. [26], and will be further evalu-ated and reported elsewhere. However, it should be notedhere that our synchrotron diffraction data in Fig. 7aindicate that the size of the plastic zone in front of thecrack in the center of the specimen is significantly smaller(<1 mm) than the in-plane dimensions of crack size(1.6 mm) and depth (7.2 mm), which ensures that planestrain conditions are met. Fig. 7b shows the limits of thetwo zones where stress-induced martensite is detected inour pseudoelastic CT specimen: one close to the crack tip(tensile in nature) and the other one at the far end of theCT specimen (compressive in nature). It is important torealize that the transmitted beam in the configurationshown in Fig. 7a provides volume-average data. It indicatesthe presence of martensite, even for cases where stress-induced martensite only forms at the surfaces of the CTspecimen (plane stress conditions) and not in the center
Fig. 7. (a) Phase fractions of the austenite B2 and martensite B190 structures foobtained by in situ synchrotron measurements at high stress intensity. Detailelsewhere. (b) Schematic of the first experimental configuration (CT specimen pcan be seen just ahead of the crack and at the back of the CT specimen.
Fig. 8. (a) Schematic of the second experimental configuration (CT specimenfractions at high stress intensities in the plane strain condition. The black arrowmartensite forms upon loading. (b) Optical image of the miniature tensile rig
(plane strain condition). In the second configuration (ourkey experiment), the miniature CT specimen is positionedat 45� with respect to the incident beam (Fig. 8a). Thegeometry of this experiment is set up to keep the beamfrom crossing the plane stress surface regions and at thesame time avoiding the compressive zones at the end ofthe CT specimen as illustrated in Fig. 8a. When stress-induced martensite is detected, it is only associated withthe central crack tip regions. Fig. 8b shows a photographof the miniature CT specimen prior to the 45� diffractionexperiment.
3. Results and discussion
3.1. Crack loading and critical parameters
We first consider the mechanical response of our threetypes (martensitic, pseudoelastic and austenitic) of minia-ture CT specimens. From raw data like those shown inFig. 5, K*(D) curves can be calculated using the equationgiven above. Fig. 9a and b shows these stress intensity vs.displacement curves for the martensitic and pseudoelastic
r the two transformation zones in a pseudoelastic NiTi SMA CT specimens of the diffraction results can be found in Ref. [26] and will be reportederpendicular to the diffraction beam). Note that two transformation zones
at a 45� angle to the diffraction beam) in order to detect martensitic phases indicate the central region just in front of the crack where stress-induced
with miniature CT specimen.
S. Gollerthan et al. / Acta Materialia 57 (2009) 1015–1025 1021
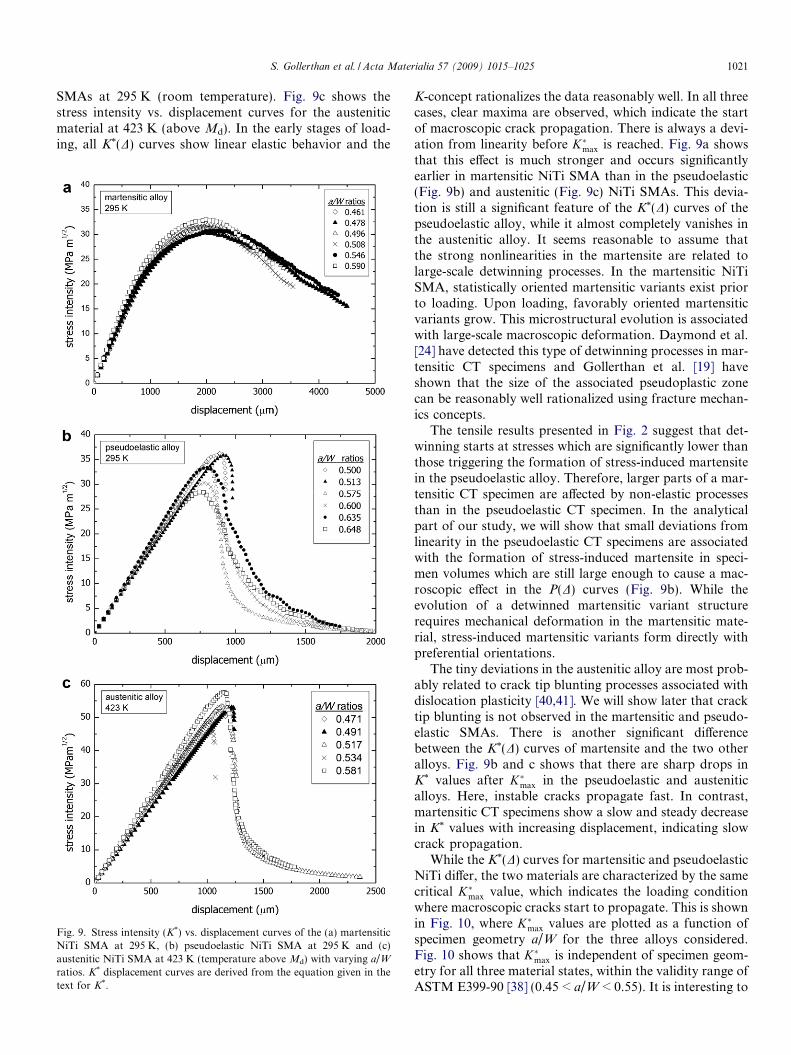
SMAs at 295 K (room temperature). Fig. 9c shows thestress intensity vs. displacement curves for the austeniticmaterial at 423 K (above Md). In the early stages of load-ing, all K*(D) curves show linear elastic behavior and the
Fig. 9. Stress intensity (K*) vs. displacement curves of the (a) martensiticNiTi SMA at 295 K, (b) pseudoelastic NiTi SMA at 295 K and (c)austenitic NiTi SMA at 423 K (temperature above Md) with varying a/Wratios. K* displacement curves are derived from the equation given in thetext for K*.
K-concept rationalizes the data reasonably well. In all threecases, clear maxima are observed, which indicate the startof macroscopic crack propagation. There is always a devi-ation from linearity before K�max is reached. Fig. 9a showsthat this effect is much stronger and occurs significantlyearlier in martensitic NiTi SMA than in the pseudoelastic(Fig. 9b) and austenitic (Fig. 9c) NiTi SMAs. This devia-tion is still a significant feature of the K*(D) curves of thepseudoelastic alloy, while it almost completely vanishes inthe austenitic alloy. It seems reasonable to assume thatthe strong nonlinearities in the martensite are related tolarge-scale detwinning processes. In the martensitic NiTiSMA, statistically oriented martensitic variants exist priorto loading. Upon loading, favorably oriented martensiticvariants grow. This microstructural evolution is associatedwith large-scale macroscopic deformation. Daymond et al.[24] have detected this type of detwinning processes in mar-tensitic CT specimens and Gollerthan et al. [19] haveshown that the size of the associated pseudoplastic zonecan be reasonably well rationalized using fracture mechan-ics concepts.
The tensile results presented in Fig. 2 suggest that det-winning starts at stresses which are significantly lower thanthose triggering the formation of stress-induced martensitein the pseudoelastic alloy. Therefore, larger parts of a mar-tensitic CT specimen are affected by non-elastic processesthan in the pseudoelastic CT specimen. In the analyticalpart of our study, we will show that small deviations fromlinearity in the pseudoelastic CT specimens are associatedwith the formation of stress-induced martensite in speci-men volumes which are still large enough to cause a mac-roscopic effect in the P(D) curves (Fig. 9b). While theevolution of a detwinned martensitic variant structurerequires mechanical deformation in the martensitic mate-rial, stress-induced martensitic variants form directly withpreferential orientations.
The tiny deviations in the austenitic alloy are most prob-ably related to crack tip blunting processes associated withdislocation plasticity [40,41]. We will show later that cracktip blunting is not observed in the martensitic and pseudo-elastic SMAs. There is another significant differencebetween the K*(D) curves of martensite and the two otheralloys. Fig. 9b and c shows that there are sharp drops inK* values after K�max in the pseudoelastic and austeniticalloys. Here, instable cracks propagate fast. In contrast,martensitic CT specimens show a slow and steady decreasein K* values with increasing displacement, indicating slowcrack propagation.
While the K*(D) curves for martensitic and pseudoelasticNiTi differ, the two materials are characterized by the samecritical K�max value, which indicates the loading conditionwhere macroscopic cracks start to propagate. This is shownin Fig. 10, where K�max values are plotted as a function ofspecimen geometry a/W for the three alloys considered.Fig. 10 shows that K�max is independent of specimen geom-etry for all three material states, within the validity range ofASTM E399-90 [38] (0.45 < a/W < 0.55). It is interesting to
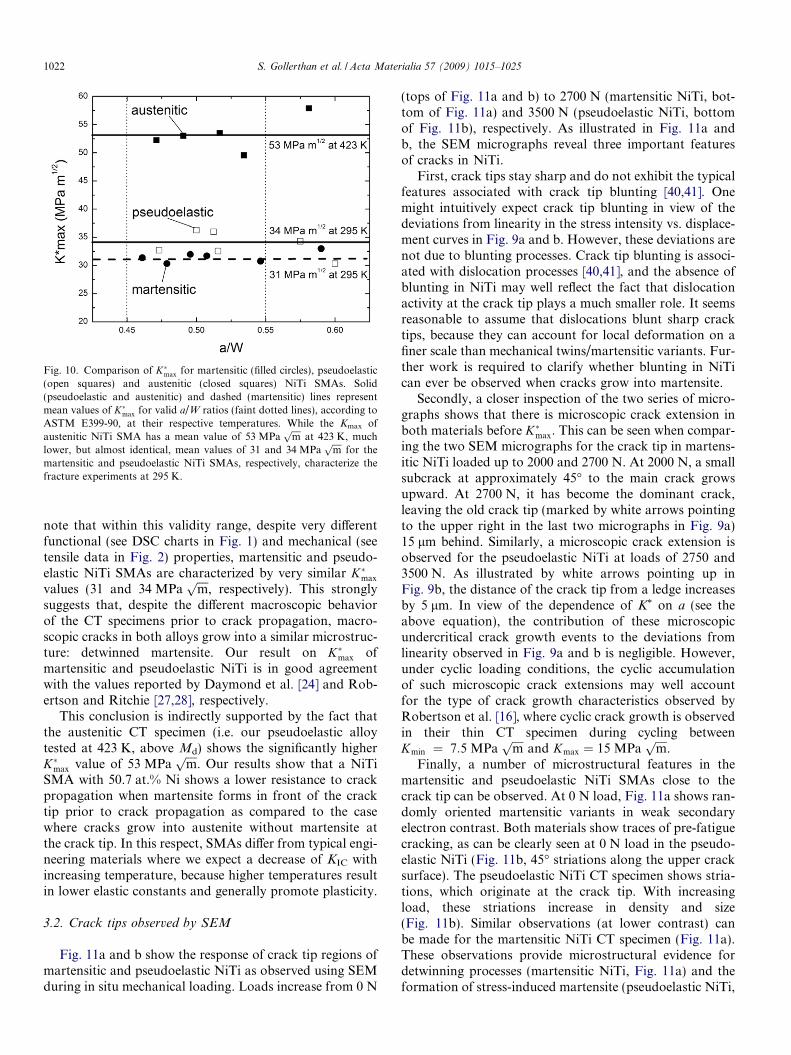
Fig. 10. Comparison of K�max for martensitic (filled circles), pseudoelastic(open squares) and austenitic (closed squares) NiTi SMAs. Solid(pseudoelastic and austenitic) and dashed (martensitic) lines representmean values of K�max for valid a/W ratios (faint dotted lines), according toASTM E399-90, at their respective temperatures. While the Kmax ofaustenitic NiTi SMA has a mean value of 53 MPa
ffiffiffiffimp
at 423 K, muchlower, but almost identical, mean values of 31 and 34 MPa
ffiffiffiffimp
for themartensitic and pseudoelastic NiTi SMAs, respectively, characterize thefracture experiments at 295 K.
1022 S. Gollerthan et al. / Acta Materialia 57 (2009) 1015–1025
note that within this validity range, despite very differentfunctional (see DSC charts in Fig. 1) and mechanical (seetensile data in Fig. 2) properties, martensitic and pseudo-elastic NiTi SMAs are characterized by very similar K�max
values (31 and 34 MPaffiffiffiffimp
, respectively). This stronglysuggests that, despite the different macroscopic behaviorof the CT specimens prior to crack propagation, macro-scopic cracks in both alloys grow into a similar microstruc-ture: detwinned martensite. Our result on K�max ofmartensitic and pseudoelastic NiTi is in good agreementwith the values reported by Daymond et al. [24] and Rob-ertson and Ritchie [27,28], respectively.
This conclusion is indirectly supported by the fact thatthe austenitic CT specimen (i.e. our pseudoelastic alloytested at 423 K, above Md) shows the significantly higherK�max value of 53 MPa
ffiffiffiffimp
. Our results show that a NiTiSMA with 50.7 at.% Ni shows a lower resistance to crackpropagation when martensite forms in front of the cracktip prior to crack propagation as compared to the casewhere cracks grow into austenite without martensite atthe crack tip. In this respect, SMAs differ from typical engi-neering materials where we expect a decrease of KIC withincreasing temperature, because higher temperatures resultin lower elastic constants and generally promote plasticity.
3.2. Crack tips observed by SEM
Fig. 11a and b show the response of crack tip regions ofmartensitic and pseudoelastic NiTi as observed using SEMduring in situ mechanical loading. Loads increase from 0 N
(tops of Fig. 11a and b) to 2700 N (martensitic NiTi, bot-tom of Fig. 11a) and 3500 N (pseudoelastic NiTi, bottomof Fig. 11b), respectively. As illustrated in Fig. 11a andb, the SEM micrographs reveal three important featuresof cracks in NiTi.
First, crack tips stay sharp and do not exhibit the typicalfeatures associated with crack tip blunting [40,41]. Onemight intuitively expect crack tip blunting in view of thedeviations from linearity in the stress intensity vs. displace-ment curves in Fig. 9a and b. However, these deviations arenot due to blunting processes. Crack tip blunting is associ-ated with dislocation processes [40,41], and the absence ofblunting in NiTi may well reflect the fact that dislocationactivity at the crack tip plays a much smaller role. It seemsreasonable to assume that dislocations blunt sharp cracktips, because they can account for local deformation on afiner scale than mechanical twins/martensitic variants. Fur-ther work is required to clarify whether blunting in NiTican ever be observed when cracks grow into martensite.
Secondly, a closer inspection of the two series of micro-graphs shows that there is microscopic crack extension inboth materials before K�max. This can be seen when compar-ing the two SEM micrographs for the crack tip in martens-itic NiTi loaded up to 2000 and 2700 N. At 2000 N, a smallsubcrack at approximately 45� to the main crack growsupward. At 2700 N, it has become the dominant crack,leaving the old crack tip (marked by white arrows pointingto the upper right in the last two micrographs in Fig. 9a)15 lm behind. Similarly, a microscopic crack extension isobserved for the pseudoelastic NiTi at loads of 2750 and3500 N. As illustrated by white arrows pointing up inFig. 9b, the distance of the crack tip from a ledge increasesby 5 lm. In view of the dependence of K* on a (see theabove equation), the contribution of these microscopicundercritical crack growth events to the deviations fromlinearity observed in Fig. 9a and b is negligible. However,under cyclic loading conditions, the cyclic accumulationof such microscopic crack extensions may well accountfor the type of crack growth characteristics observed byRobertson et al. [16], where cyclic crack growth is observedin their thin CT specimen during cycling betweenKmin ¼ 7:5 MPa
ffiffiffiffimp
and Kmax ¼ 15 MPaffiffiffiffimp
.Finally, a number of microstructural features in the
martensitic and pseudoelastic NiTi SMAs close to thecrack tip can be observed. At 0 N load, Fig. 11a shows ran-domly oriented martensitic variants in weak secondaryelectron contrast. Both materials show traces of pre-fatiguecracking, as can be clearly seen at 0 N load in the pseudo-elastic NiTi (Fig. 11b, 45� striations along the upper cracksurface). The pseudoelastic NiTi CT specimen shows stria-tions, which originate at the crack tip. With increasingload, these striations increase in density and size(Fig. 11b). Similar observations (at lower contrast) canbe made for the martensitic NiTi CT specimen (Fig. 11a).These observations provide microstructural evidence fordetwinning processes (martensitic NiTi, Fig. 11a) and theformation of stress-induced martensite (pseudoelastic NiTi,
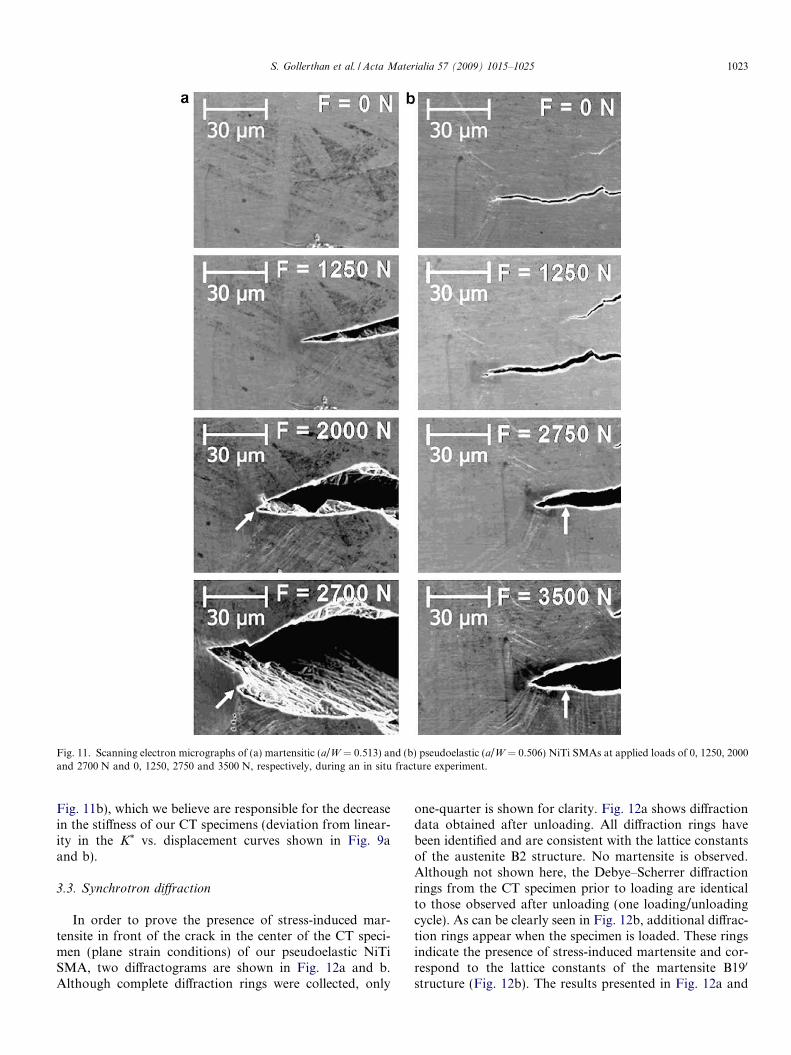
Fig. 11. Scanning electron micrographs of (a) martensitic (a/W = 0.513) and (b) pseudoelastic (a/W = 0.506) NiTi SMAs at applied loads of 0, 1250, 2000and 2700 N and 0, 1250, 2750 and 3500 N, respectively, during an in situ fracture experiment.
S. Gollerthan et al. / Acta Materialia 57 (2009) 1015–1025 1023
Fig. 11b), which we believe are responsible for the decreasein the stiffness of our CT specimens (deviation from linear-ity in the K* vs. displacement curves shown in Fig. 9aand b).
3.3. Synchrotron diffraction
In order to prove the presence of stress-induced mar-tensite in front of the crack in the center of the CT speci-men (plane strain conditions) of our pseudoelastic NiTiSMA, two diffractograms are shown in Fig. 12a and b.Although complete diffraction rings were collected, only
one-quarter is shown for clarity. Fig. 12a shows diffractiondata obtained after unloading. All diffraction rings havebeen identified and are consistent with the lattice constantsof the austenite B2 structure. No martensite is observed.Although not shown here, the Debye–Scherrer diffractionrings from the CT specimen prior to loading are identicalto those observed after unloading (one loading/unloadingcycle). As can be clearly seen in Fig. 12b, additional diffrac-tion rings appear when the specimen is loaded. These ringsindicate the presence of stress-induced martensite and cor-respond to the lattice constants of the martensite B190
structure (Fig. 12b). The results presented in Fig. 12a and
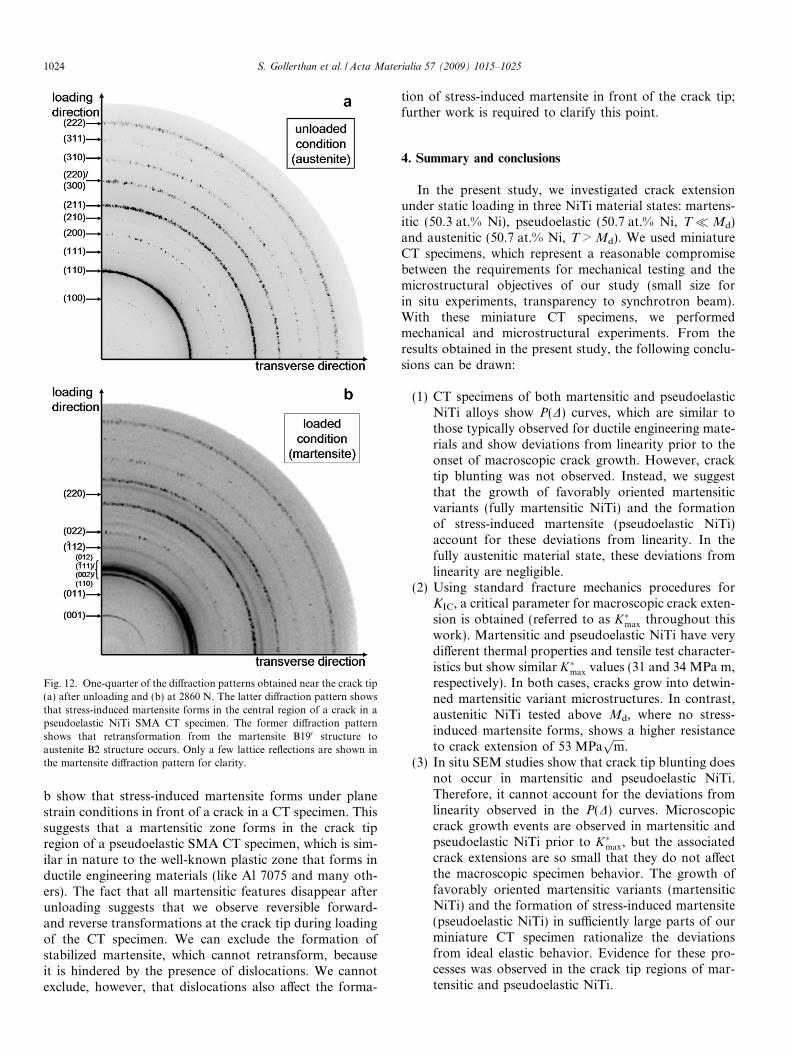
Fig. 12. One-quarter of the diffraction patterns obtained near the crack tip(a) after unloading and (b) at 2860 N. The latter diffraction pattern showsthat stress-induced martensite forms in the central region of a crack in apseudoelastic NiTi SMA CT specimen. The former diffraction patternshows that retransformation from the martensite B190 structure toaustenite B2 structure occurs. Only a few lattice reflections are shown inthe martensite diffraction pattern for clarity.
1024 S. Gollerthan et al. / Acta Materialia 57 (2009) 1015–1025
b show that stress-induced martensite forms under planestrain conditions in front of a crack in a CT specimen. Thissuggests that a martensitic zone forms in the crack tipregion of a pseudoelastic SMA CT specimen, which is sim-ilar in nature to the well-known plastic zone that forms inductile engineering materials (like Al 7075 and many oth-ers). The fact that all martensitic features disappear afterunloading suggests that we observe reversible forward-and reverse transformations at the crack tip during loadingof the CT specimen. We can exclude the formation ofstabilized martensite, which cannot retransform, becauseit is hindered by the presence of dislocations. We cannotexclude, however, that dislocations also affect the forma-
tion of stress-induced martensite in front of the crack tip;further work is required to clarify this point.
4. Summary and conclusions
In the present study, we investigated crack extensionunder static loading in three NiTi material states: martens-itic (50.3 at.% Ni), pseudoelastic (50.7 at.% Ni, T�Md)and austenitic (50.7 at.% Ni, T > Md). We used miniatureCT specimens, which represent a reasonable compromisebetween the requirements for mechanical testing and themicrostructural objectives of our study (small size forin situ experiments, transparency to synchrotron beam).With these miniature CT specimens, we performedmechanical and microstructural experiments. From theresults obtained in the present study, the following conclu-sions can be drawn:
(1) CT specimens of both martensitic and pseudoelasticNiTi alloys show P(D) curves, which are similar tothose typically observed for ductile engineering mate-rials and show deviations from linearity prior to theonset of macroscopic crack growth. However, cracktip blunting was not observed. Instead, we suggestthat the growth of favorably oriented martensiticvariants (fully martensitic NiTi) and the formationof stress-induced martensite (pseudoelastic NiTi)account for these deviations from linearity. In thefully austenitic material state, these deviations fromlinearity are negligible.
(2) Using standard fracture mechanics procedures forKIC, a critical parameter for macroscopic crack exten-sion is obtained (referred to as K�max throughout thiswork). Martensitic and pseudoelastic NiTi have verydifferent thermal properties and tensile test character-istics but show similar K�max values (31 and 34 MPa m,respectively). In both cases, cracks grow into detwin-ned martensitic variant microstructures. In contrast,austenitic NiTi tested above Md, where no stress-induced martensite forms, shows a higher resistanceto crack extension of 53 MPa
ffiffiffiffimp
.(3) In situ SEM studies show that crack tip blunting does
not occur in martensitic and pseudoelastic NiTi.Therefore, it cannot account for the deviations fromlinearity observed in the P(D) curves. Microscopiccrack growth events are observed in martensitic andpseudoelastic NiTi prior to K�max, but the associatedcrack extensions are so small that they do not affectthe macroscopic specimen behavior. The growth offavorably oriented martensitic variants (martensiticNiTi) and the formation of stress-induced martensite(pseudoelastic NiTi) in sufficiently large parts of ourminiature CT specimen rationalize the deviationsfrom ideal elastic behavior. Evidence for these pro-cesses was observed in the crack tip regions of mar-tensitic and pseudoelastic NiTi.
S. Gollerthan et al. / Acta Materialia 57 (2009) 1015–1025 1025
(4) In situ synchrotron diffraction experiments prove thatstress-induced martensite can be detected ahead of acrack in the center of the specimen (plane strain con-dition) in a pseudoelastic CT specimen (thickness:10 mm). The plane strain type of loading does notprohibit the formation of martensite. Our results sug-gest that the stress-induced formation of martensitein front of a crack produces process zones which exhi-bit the well-known dog-bone features associated withplastic zones in structural engineering alloys. Itremains to be clarified whether dislocations also affectthe process zone, where stress-induced martensiteforms.
Acknowledgements
The authors acknowledge funding by the DFG throughproject EG101/10-2 and by the Helmholtz Associationfunds VH-VI-102. M.L.Young acknowledges funding fromthe Alexander von Humboldt Foundation.
References
[1] Hornbogen E. In: Bunk WG J, editor. Advanced structural andfunctional materials. Heidelberg: Springer-Verlag; 1991. p. 133–63.
[2] Saburi T. In: Otsuka K, Wayman CM, editors. Shape memorymaterials. Cambridge: Cambridge University Press; 1998. p. 49–96.
[3] Van Humbeeck J. Mater Sci Eng A 1999;273–275:134–48.[4] Duerig T, Pelton A, Stockel D. Mater Sci Eng A 1999;273–
275:149–60.[5] Otsuka K, Wayman CM. Shape memory materials. Cambridge: Cam-
bridge University Press; 1998.[6] Otsuka K, Ren X. Intermetallics 1999;7:511–28.[7] Morgan NB. Mater Sci Eng A 2004;378:16–23.[8] Miyazaki S. Engineering aspects of shape memory alloys. Lon-
don: Butterworth-Heinemann; 1990.[9] Yawny A, Sade M, Eggeler G. Z MetaIlkd 2005;96:608–18.
[10] Schmahl WW, Khalil-Allafi J, Hasse B, Wagner M, Heckmann A,Somsen C. Mater Sci Eng A 2004;378:81–5.
[11] Chen JH, Sun W, Wang GZ. Metall Mater Trans A 2005;36:941–55.[12] Eggeler G, Hornbogen E, Yawny A, Heckmann A, Wagner M. Mater
Sci Eng A 2004;378:24–33.[13] Wagner M, Sawaguchi T, Kaustrater G, Hoffken D, Eggeler G.
Mater Sci Eng A 2004;378:105–9.[14] Melton KN, Mercier O. Acta Metall 1978;27:137–44.
[15] Sawaguchi T, Kaustrater G, Yawny A, Wagner M, Eggeler G. MetallMater Trans A 2003;34:2847–60.
[16] Robertson SW, Mehta A, Pelton AR, Ritchie RO. Acta Mater2007;55:6198–207.
[17] Stankiewicz JM, Robertson S, Ritchie RO. J Biomed Mater Res PartA 2006;81:685–91.
[18] Wang XM, Wang YF, Baruj A, Eggeler G, Yue ZF. Mater Sci Eng A2005;394:393–8.
[19] Gollerthan S, Herberg D, Baruj A, Eggeler G. Mater Sci Eng A2007;481–482:156–9.
[20] McKelvey A, Ritchie R. Metall Mater Trans A 2001;32:731–43.[21] McKelvey AL, Ritchie RO. J Biomed Mater Res Part A
1999;47:301–8.[22] Dauskardt RH, Duerig TW, Ritchie RO. In: Otsuka K. Shimizu K,
editors. Symposium on shape memory materials, Materials researchsociety international meeting on ‘‘advanced materials”, vol. 9, Berlin:Springer; 1989. p. 243–9.
[23] Vaidyanathan R, Dunand DC, Ramamurty U. Mater Sci Eng A2000;289:208–16.
[24] Daymond MR, Young ML, Almer JD, Dunand DC. Acta Mater2007;55:3929–42.
[25] Tong W, Tao H, Zhang N. In: Furuya Y, Quandt E, Zhang Q, InoueK, Shahinpoor M, editors. Materials research society proceedings:symposium D, Boston (MA), vol. 785; 2003. p. D7.7.1–6.
[26] Gollerthan S. Thesis, Ruhr-Universitat Bochum; 2007. p. 159.[27] Robertson SW, Ritchie RO. J Biomed Mater Res Part B: Appl
Biomater 2007;84:26–33.[28] Robertson SW, Ritchie RO. Biomaterials 2007;28:700–9.[29] Reed-Hill RE, Abbaschian R. Physical metallurgy principles. Boston
(MA): PWS Publishing Company; 1994. p. 926.[30] Courtney TH. Mechanical behavior of materials. Boston
(MA): McGraw Hill; 2000. p. 733.[31] Khalil Allafi J, Ren X, Eggeler G. Acta Mater 2002;50:793–803.[32] Khalil-Allafi J, Dlouhy A, Eggeler G. Acta Mater 2002;50:4255–74.[33] Nishida M, Wayman CM, Honma T. Metall Trans A
1986;17:1505–15.[34] Treppmann D. Thermomechanische Behandlungen von NiTi. Thesis,
Ruhr-Universitat Bochum; 2006.[35] Tadaki T, Nakata Y, Shimizu K, Otsuka K. Trans JIM
1986;27:731–40.[36] Eggeler G, Khalil Allafi J, Gollerthan S, Somsen C, Schmahl WW,
Sheptyakov D. Smart Mater Struct 2005;14:186–91.[37] Herberg D. Werkstoffkundliche Untersuchungen zum Risswachstum
in einer martensitischen Nickel-Titan-Formgedachtnislegierung.Thesis, Ruhr-Universitat Bochum; 2006.
[38] American Society for Testing and Materials, Annual book of ASTMstandards; 2004.
[39] Schijve J. Analysis of the fatigue phenomenon in aluminium alloys.In: NLR-TM M 2122, Amsterdam; 1964.
[40] Ritchie RO. Int J Fract 1999;100:55–83.[41] Zhou SJ, Carlsson AE, Thomson R. Phys Rev Lett 1994;72:852–5.