Embed Size (px)
Citation preview
H13
FLUME INVESTIGATIONS ON BED LOAD TRANSPORT AND BED FORMS IN SIMPLE CHANNELS
Mazlin Jumain 1*, Zulkiflee Ibrahim 2, Zulhilmi Ismail 2, Sobri Harun 3, Md Ridzuan Makhtar 4, Mohd Suhaimi Abd Rahman 4, Nur Atiah Zaini 5, Mohd
Fuad Samsudin 5 and Muhd Zubair Tajol Anuar 5 1Postgraduate Research Student, 2Senior Lecturer, 3Assoc. Professor, 4Hydraulic Laboratory Technical Staff, 5Undergraduate Research Student Faculty of Civil Engineering, Universiti Teknologi Malaysia, 81310 Johor Bahru, Johor, Malaysia
*Corresponding Author: [email protected]
Abstract: Massive floods hit various states in Malaysia such as Pahang, Kelantan, Johor, Terengganu, Sabah and Sarawak. It caused widespread damages to properties, infrastructures, human suffering and even deaths. More frequent floods incidents and soil erosion are reported which lead to sedimentation problems in the drainage and river systems due to urbanisation. It is important to understand the sedimentation process and the behaviour of bed forms in the water course for post-flood events. However, it is risky and dangerous to conduct field study during occurrence of flooding. Laboratory study has been chosen as an alternative to fulfill the objectives. Experimental investigations on the bed load transport and bed forms in simple channels have been undertaken. Small and large flume models are used in the laboratory. The effects of flow on mobile sandy bed channel and bed load transportation are studied by using a modified flume with an asymmetric straight compound channel. However, the findings on rate of transport and bed formation for non-flooding cases are presented in this paper. It is found that the bed formation profiles for both channels are different due to scale and flume characteristics. The bed forms, erosion and deposition processes are significantly influenced by the water velocity in the channel. The bed forms observed for large flume are repeating ripples and dunes; meanwhile variable of ripples are observed in small flume. Keywords: straight channel, inbank flow, velocity distribution, bed load transport, bed formation
1.0 Introduction The structure of the overbank flow in mobile bed channels are more complex than in non-mobile bed channels. In order to understand the more complex hydraulic characteristics of mobile bed compound channel flow, a basic understanding of inbank flow is necessary. Such understanding is important because it elucidate what happens in alluvial rivers especially under flood flow conditions. The mobile bed data are more difficult to obtain than the corresponding data for rigid boundary channels. The presence of the bed forms led to much greater variability in water surface slope, bed load rate and channel dimensions than anticipated (Knight et al., 1999).
The morphology of alluvial channels such as sandy bed reflects a complex interaction among flow hydraulics, channel geometry, energy dissipation and sediment transport. The transport of non-cohesive sediments during steady uniform flow is a complex process, which becomes more complex to be described mathematically during overbank flow because of the interaction between floodplain flow and main channel flow (Karamisheva et al., 2005). Bed load transport, which results from the motion of particles rolling, sliding or traveling in a succession of low jumps or saltations along the bed of a stream, is of fundamental importance for river morphodynamics. It may indeed represent an important fraction of the total sediment flux transported in a river (up to 60%), especially in gravel bed rivers (Métivier et al., 2004; Meunier et al., 2006; Liu et al., 2008).
Many aspects of morphologic changes in rivers are governed by bed load transport, including bank erosion, bed forms and the rate at which the river incises relief (Yalin and da Silva, 2001). Bed load transport rates depend on the near bed flow characteristics and sediment properties, such as shear stress, surface roughness, and particle size, density, and shape. The bed form of mobile sandy bed channels reflects a complex interaction among flow hydraulics, channel geometry, energy dissipation and sediment transport. The bed will deform under the action of flow, changing its roughness, and
then affecting the flow itself (Knight and Brown, 2001). It is important to understand the sediment transport process and the bed formation in order to maintain the rivers as safe from the sedimentation problems.
The approach proposed by van Rijn (1984a, 1984b, 1984c) gave very good predictions of the roughness effects of the mobile bed. Zang et al. (2010) and Ali et al. (2012) also stated that the roughness of non-mobile beds is noticeably less than those of mobile beds. Ackers (1992) predicted that the sediment transport will increase in most rivers up to bankfull discharge, but the sediment transportation process may diminish with further increase in discharge and roughness on overbank condition. Ayyoubzadeh (1997), Atabay et al. (2005) and Tang and Knight (2006) investigated and found that a very similar way to what Ackers predicted. It is due to significant influence of the interaction effect between main channel and floodplain.
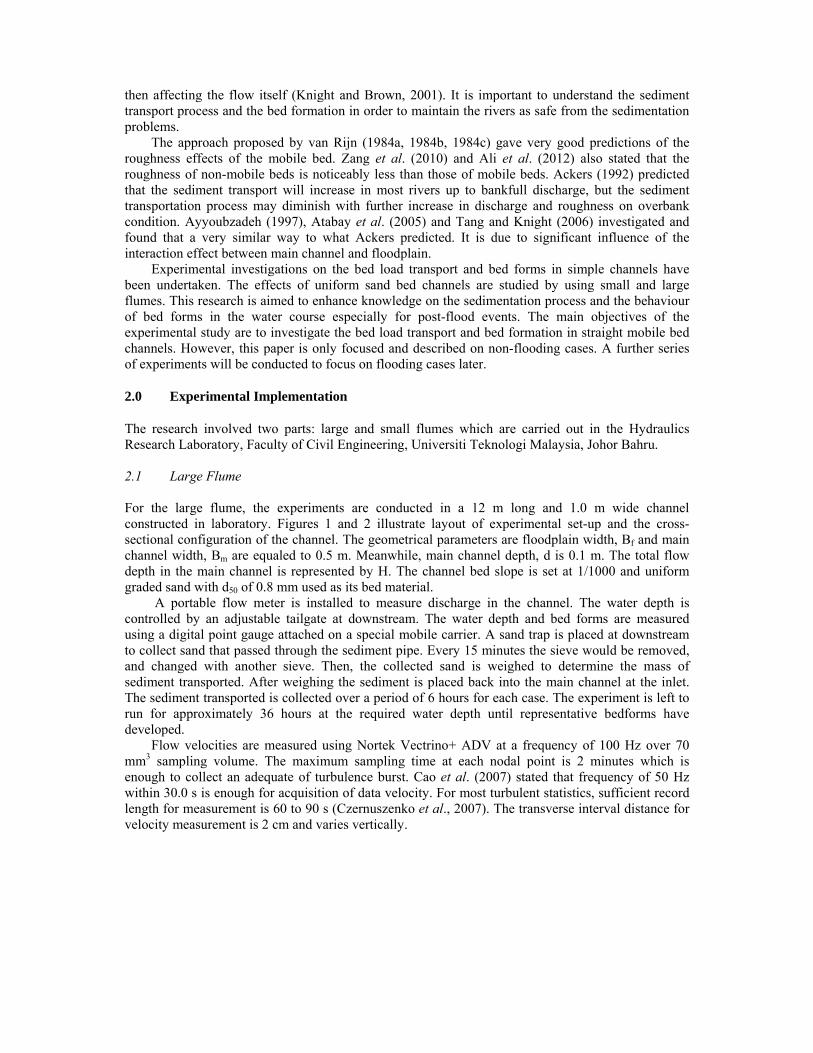
Experimental investigations on the bed load transport and bed forms in simple channels have been undertaken. The effects of uniform sand bed channels are studied by using small and large flumes. This research is aimed to enhance knowledge on the sedimentation process and the behaviour of bed forms in the water course especially for post-flood events. The main objectives of the experimental study are to investigate the bed load transport and bed formation in straight mobile bed channels. However, this paper is only focused and described on non-flooding cases. A further series of experiments will be conducted to focus on flooding cases later. 2.0 Experimental Implementation The research involved two parts: large and small flumes which are carried out in the Hydraulics Research Laboratory, Faculty of Civil Engineering, Universiti Teknologi Malaysia, Johor Bahru. 2.1 Large Flume For the large flume, the experiments are conducted in a 12 m long and 1.0 m wide channel constructed in laboratory. Figures 1 and 2 illustrate layout of experimental set-up and the cross-sectional configuration of the channel. The geometrical parameters are floodplain width, Bf and main channel width, Bm are equaled to 0.5 m. Meanwhile, main channel depth, d is 0.1 m. The total flow depth in the main channel is represented by H. The channel bed slope is set at 1/1000 and uniform graded sand with d50 of 0.8 mm used as its bed material.
A portable flow meter is installed to measure discharge in the channel. The water depth is controlled by an adjustable tailgate at downstream. The water depth and bed forms are measured using a digital point gauge attached on a special mobile carrier. A sand trap is placed at downstream to collect sand that passed through the sediment pipe. Every 15 minutes the sieve would be removed, and changed with another sieve. Then, the collected sand is weighed to determine the mass of sediment transported. After weighing the sediment is placed back into the main channel at the inlet. The sediment transported is collected over a period of 6 hours for each case. The experiment is left to run for approximately 36 hours at the required water depth until representative bedforms have developed.
Flow velocities are measured using Nortek Vectrino+ ADV at a frequency of 100 Hz over 70 mm3 sampling volume. The maximum sampling time at each nodal point is 2 minutes which is enough to collect an adequate of turbulence burst. Cao et al. (2007) stated that frequency of 50 Hz within 30.0 s is enough for acquisition of data velocity. For most turbulent statistics, sufficient record length for measurement is 60 to 90 s (Czernuszenko et al., 2007). The transverse interval distance for velocity measurement is 2 cm and varies vertically.
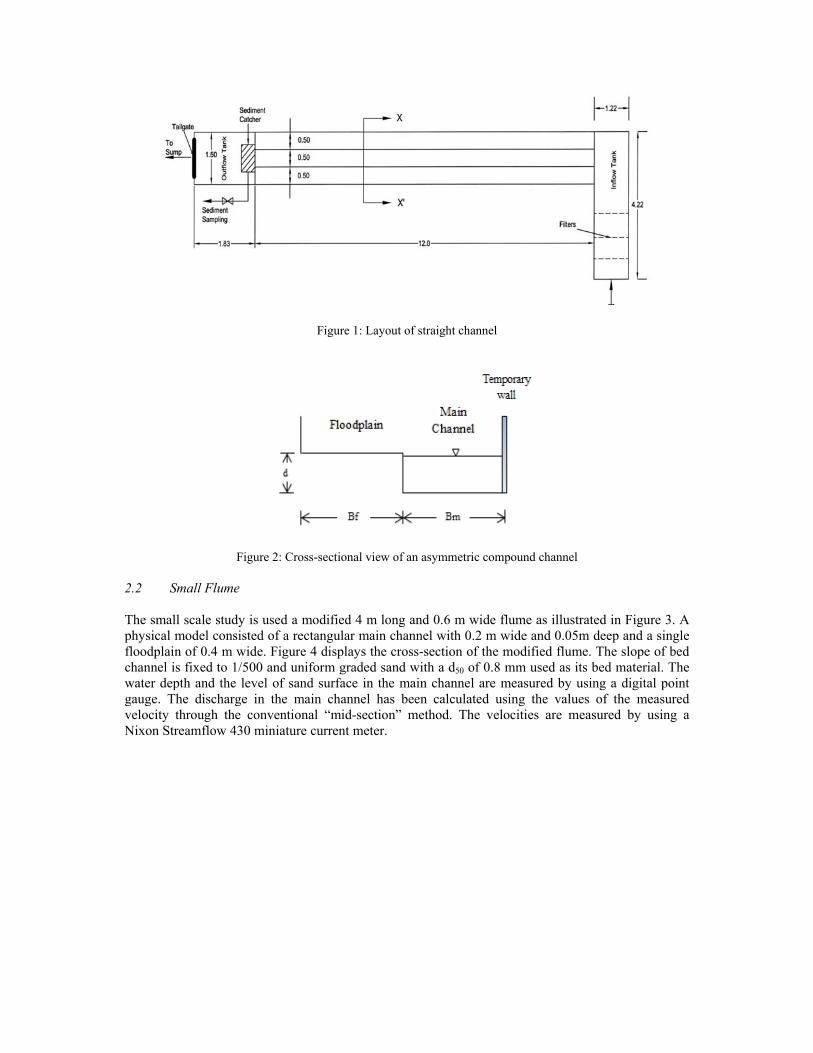
Figure 1: Layout of straight channel
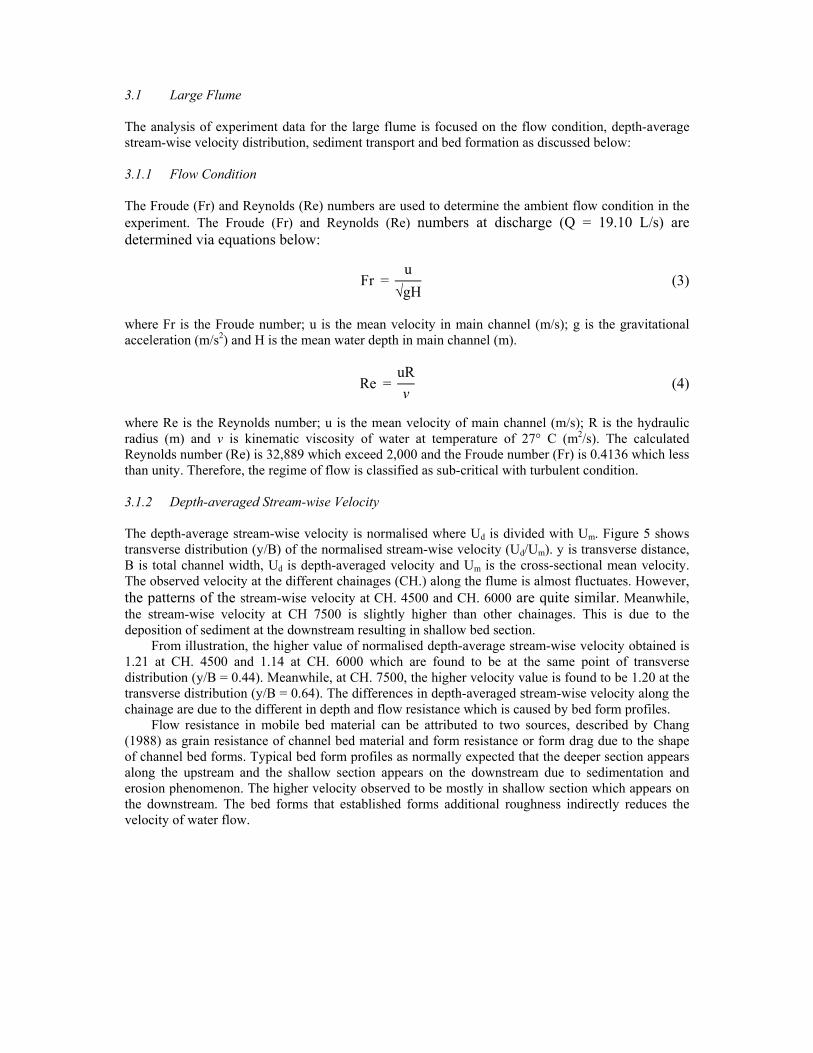
Figure 2: Cross-sectional view of an asymmetric compound channel 2.2 Small Flume The small scale study is used a modified 4 m long and 0.6 m wide flume as illustrated in Figure 3. A physical model consisted of a rectangular main channel with 0.2 m wide and 0.05m deep and a single floodplain of 0.4 m wide. Figure 4 displays the cross-section of the modified flume. The slope of bed channel is fixed to 1/500 and uniform graded sand with a d50 of 0.8 mm used as its bed material. The water depth and the level of sand surface in the main channel are measured by using a digital point gauge. The discharge in the main channel has been calculated using the values of the measured velocity through the conventional “mid-section” method. The velocities are measured by using a Nixon Streamflow 430 miniature current meter.
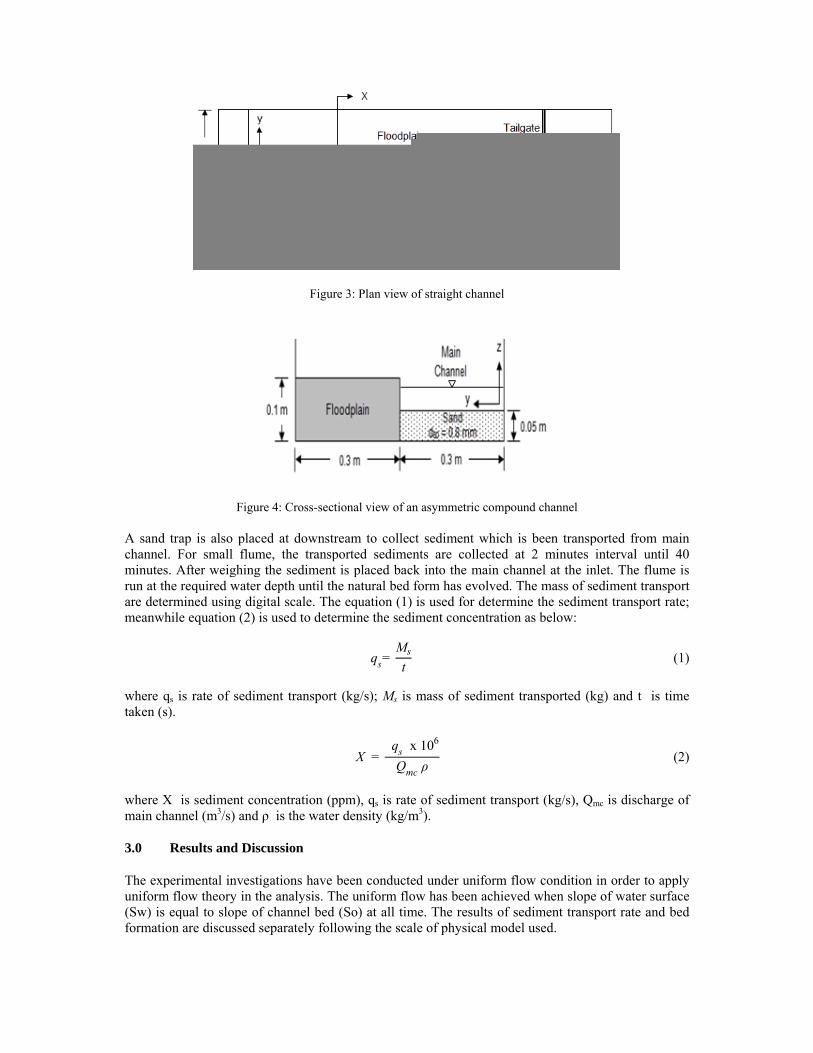
Figure 3: Plan view of straight channel
Figure 4: Cross-sectional view of an asymmetric compound channel A sand trap is also placed at downstream to collect sediment which is been transported from main channel. For small flume, the transported sediments are collected at 2 minutes interval until 40 minutes. After weighing the sediment is placed back into the main channel at the inlet. The flume is run at the required water depth until the natural bed form has evolved. The mass of sediment transport are determined using digital scale. The equation (1) is used for determine the sediment transport rate; meanwhile equation (2) is used to determine the sediment concentration as below:
qs= Ms
t (1)
where qs is rate of sediment transport (kg/s); Ms is mass of sediment transported (kg) and t is time taken (s).
X = qs x 106
Qmc ρ (2)
where X is sediment concentration (ppm), qs is rate of sediment transport (kg/s), Qmc is discharge of main channel (m3/s) and ρ is the water density (kg/m3). 3.0 Results and Discussion The experimental investigations have been conducted under uniform flow condition in order to apply uniform flow theory in the analysis. The uniform flow has been achieved when slope of water surface (Sw) is equal to slope of channel bed (So) at all time. The results of sediment transport rate and bed formation are discussed separately following the scale of physical model used.
3.1 Large Flume The analysis of experiment data for the large flume is focused on the flow condition, depth-average stream-wise velocity distribution, sediment transport and bed formation as discussed below: 3.1.1 Flow Condition The Froude (Fr) and Reynolds (Re) numbers are used to determine the ambient flow condition in the experiment. The Froude (Fr) and Reynolds (Re) numbers at discharge (Q = 19.10 L/s) are determined via equations below:
Fr= u√gH
(3)
where Fr is the Froude number; u is the mean velocity in main channel (m/s); g is the gravitational acceleration (m/s2) and H is the mean water depth in main channel (m).
Re= uRv(4)
where Re is the Reynolds number; u is the mean velocity of main channel (m/s); R is the hydraulic radius (m) and v is kinematic viscosity of water at temperature of 27° C (m2/s). The calculated Reynolds number (Re) is 32,889 which exceed 2,000 and the Froude number (Fr) is 0.4136 which less than unity. Therefore, the regime of flow is classified as sub-critical with turbulent condition. 3.1.2 Depth-averaged Stream-wise Velocity The depth-average stream-wise velocity is normalised where Ud is divided with Um. Figure 5 shows transverse distribution (y/B) of the normalised stream-wise velocity (Ud/Um). y is transverse distance, B is total channel width, Ud is depth-averaged velocity and Um is the cross-sectional mean velocity. The observed velocity at the different chainages (CH.) along the flume is almost fluctuates. However, the patterns of the stream-wise velocity at CH. 4500 and CH. 6000 are quite similar. Meanwhile, the stream-wise velocity at CH 7500 is slightly higher than other chainages. This is due to the deposition of sediment at the downstream resulting in shallow bed section.
From illustration, the higher value of normalised depth-average stream-wise velocity obtained is 1.21 at CH. 4500 and 1.14 at CH. 6000 which are found to be at the same point of transverse distribution (y/B = 0.44). Meanwhile, at CH. 7500, the higher velocity value is found to be 1.20 at the transverse distribution (y/B = 0.64). The differences in depth-averaged stream-wise velocity along the chainage are due to the different in depth and flow resistance which is caused by bed form profiles.
Flow resistance in mobile bed material can be attributed to two sources, described by Chang (1988) as grain resistance of channel bed material and form resistance or form drag due to the shape of channel bed forms. Typical bed form profiles as normally expected that the deeper section appears along the upstream and the shallow section appears on the downstream due to sedimentation and erosion phenomenon. The higher velocity observed to be mostly in shallow section which appears on the downstream. The bed forms that established forms additional roughness indirectly reduces the velocity of water flow.
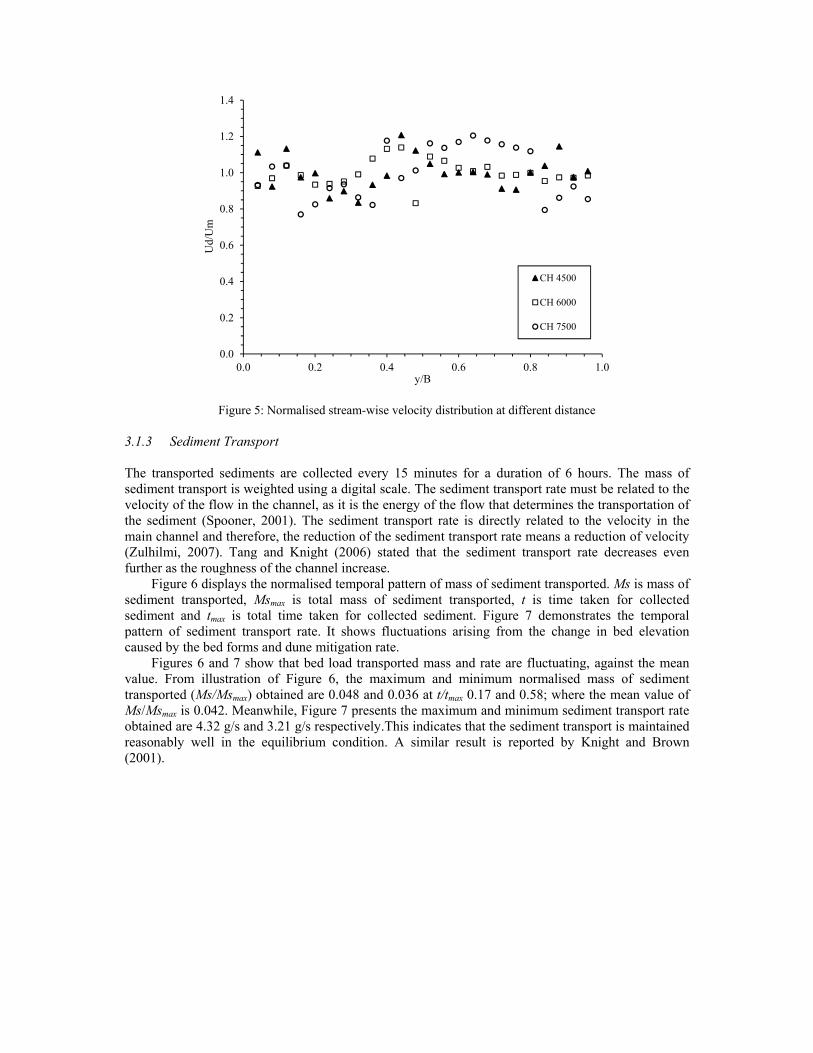
Figure 5: Normalised stream-wise velocity distribution at different distance 3.1.3 Sediment Transport The transported sediments are collected every 15 minutes for a duration of 6 hours. The mass of sediment transport is weighted using a digital scale. The sediment transport rate must be related to the velocity of the flow in the channel, as it is the energy of the flow that determines the transportation of the sediment (Spooner, 2001). The sediment transport rate is directly related to the velocity in the main channel and therefore, the reduction of the sediment transport rate means a reduction of velocity (Zulhilmi, 2007). Tang and Knight (2006) stated that the sediment transport rate decreases even further as the roughness of the channel increase.
Figure 6 displays the normalised temporal pattern of mass of sediment transported. Ms is mass of sediment transported, Msmax is total mass of sediment transported, t is time taken for collected sediment and tmax is total time taken for collected sediment. Figure 7 demonstrates the temporal pattern of sediment transport rate. It shows fluctuations arising from the change in bed elevation caused by the bed forms and dune mitigation rate.
Figures 6 and 7 show that bed load transported mass and rate are fluctuating, against the mean value. From illustration of Figure 6, the maximum and minimum normalised mass of sediment transported (Ms/Msmax) obtained are 0.048 and 0.036 at t/tmax 0.17 and 0.58; where the mean value of Ms/Msmax is 0.042. Meanwhile, Figure 7 presents the maximum and minimum sediment transport rate obtained are 4.32 g/s and 3.21 g/s respectively.This indicates that the sediment transport is maintained reasonably well in the equilibrium condition. A similar result is reported by Knight and Brown (2001).
0.0
0.2
0.4
0.6
0.8
1.0
1.2
1.4
0.0 0.2 0.4 0.6 0.8 1.0
Ud/
Um
y/B
CH 4500
CH 6000
CH 7500
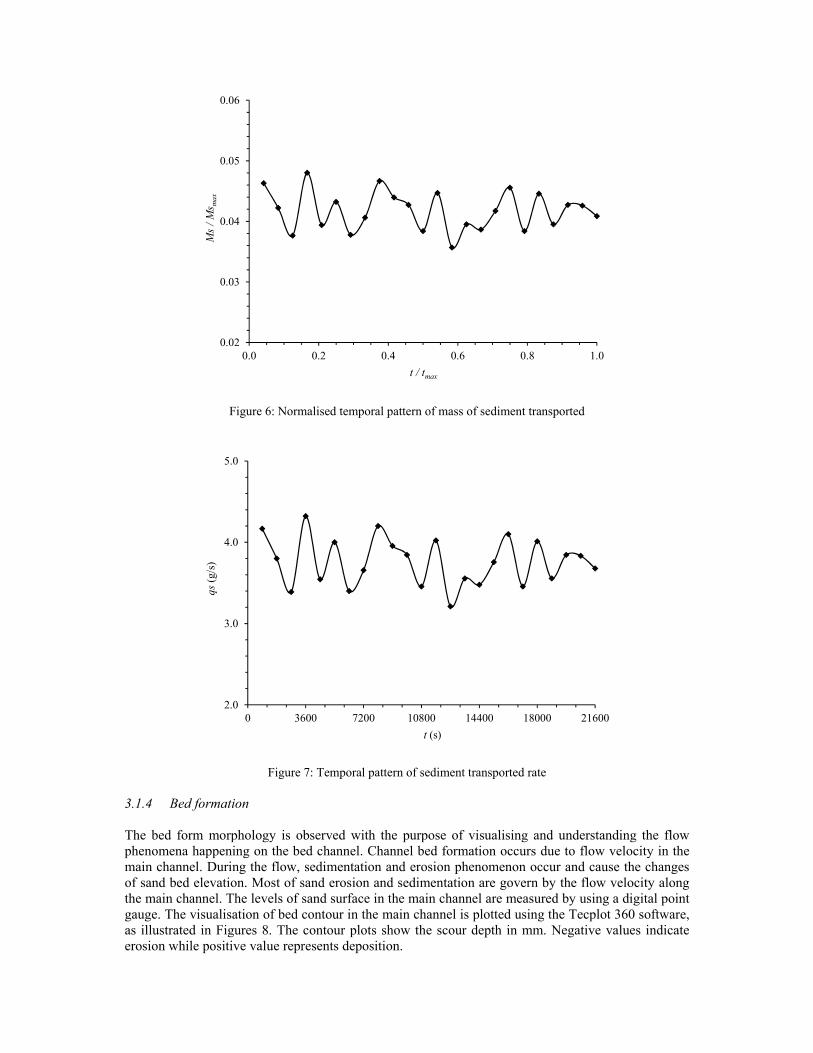
Figure 6: Normalised temporal pattern of mass of sediment transported
Figure 7: Temporal pattern of sediment transported rate 3.1.4 Bed formation The bed form morphology is observed with the purpose of visualising and understanding the flow phenomena happening on the bed channel. Channel bed formation occurs due to flow velocity in the main channel. During the flow, sedimentation and erosion phenomenon occur and cause the changes of sand bed elevation. Most of sand erosion and sedimentation are govern by the flow velocity along the main channel. The levels of sand surface in the main channel are measured by using a digital point gauge. The visualisation of bed contour in the main channel is plotted using the Tecplot 360 software, as illustrated in Figures 8. The contour plots show the scour depth in mm. Negative values indicate erosion while positive value represents deposition.
0.02
0.03
0.04
0.05
0.06
0.0 0.2 0.4 0.6 0.8 1.0
Ms /
Ms m
ax
t / tmax
2.0
3.0
4.0
5.0
0 3600 7200 10800 14400 18000 21600
qs(g
/s)
t (s)
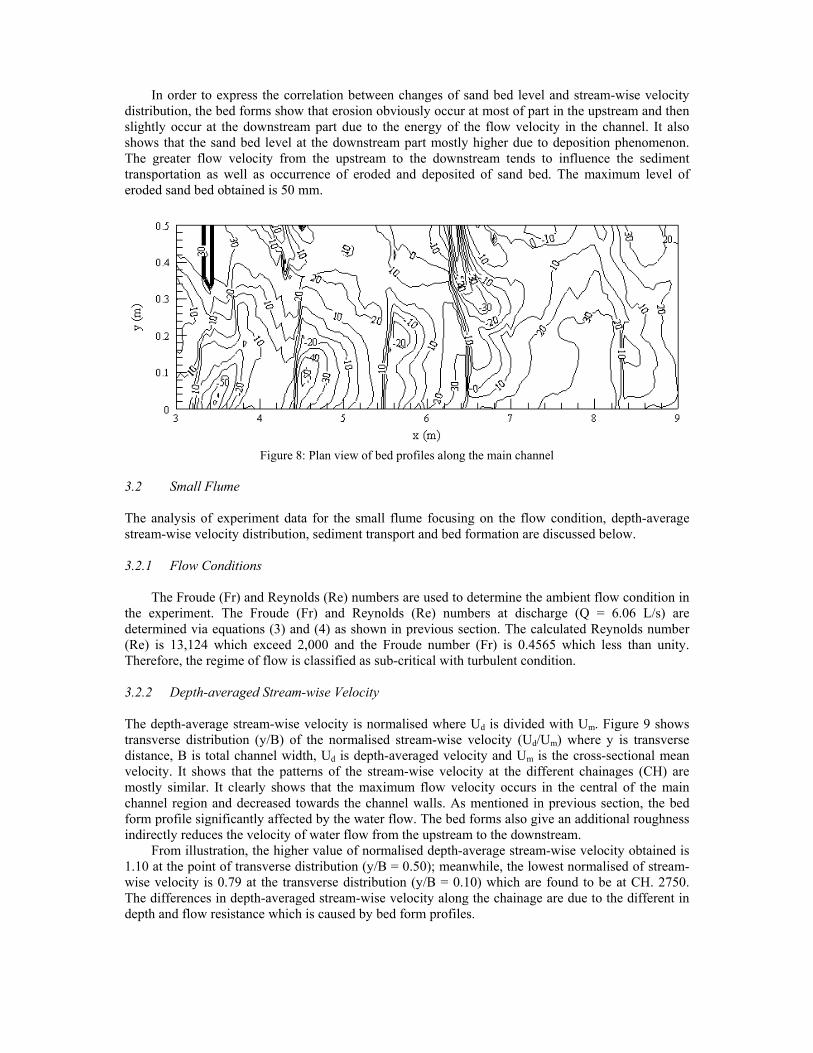
In order to express the correlation between changes of sand bed level and stream-wise velocity distribution, the bed forms show that erosion obviously occur at most of part in the upstream and then slightly occur at the downstream part due to the energy of the flow velocity in the channel. It also shows that the sand bed level at the downstream part mostly higher due to deposition phenomenon. The greater flow velocity from the upstream to the downstream tends to influence the sediment transportation as well as occurrence of eroded and deposited of sand bed. The maximum level of eroded sand bed obtained is 50 mm.
Figure 8: Plan view of bed profiles along the main channel
3.2 Small Flume The analysis of experiment data for the small flume focusing on the flow condition, depth-average stream-wise velocity distribution, sediment transport and bed formation are discussed below. 3.2.1 Flow Conditions
The Froude (Fr) and Reynolds (Re) numbers are used to determine the ambient flow condition in the experiment. The Froude (Fr) and Reynolds (Re) numbers at discharge (Q = 6.06 L/s) are determined via equations (3) and (4) as shown in previous section. The calculated Reynolds number (Re) is 13,124 which exceed 2,000 and the Froude number (Fr) is 0.4565 which less than unity. Therefore, the regime of flow is classified as sub-critical with turbulent condition. 3.2.2 Depth-averaged Stream-wise Velocity The depth-average stream-wise velocity is normalised where Ud is divided with Um. Figure 9 shows transverse distribution (y/B) of the normalised stream-wise velocity (Ud/Um) where y is transverse distance, B is total channel width, Ud is depth-averaged velocity and Um is the cross-sectional mean velocity. It shows that the patterns of the stream-wise velocity at the different chainages (CH) are mostly similar. It clearly shows that the maximum flow velocity occurs in the central of the main channel region and decreased towards the channel walls. As mentioned in previous section, the bed form profile significantly affected by the water flow. The bed forms also give an additional roughness indirectly reduces the velocity of water flow from the upstream to the downstream.
From illustration, the higher value of normalised depth-average stream-wise velocity obtained is 1.10 at the point of transverse distribution (y/B = 0.50); meanwhile, the lowest normalised of stream-wise velocity is 0.79 at the transverse distribution (y/B = 0.10) which are found to be at CH. 2750. The differences in depth-averaged stream-wise velocity along the chainage are due to the different in depth and flow resistance which is caused by bed form profiles.
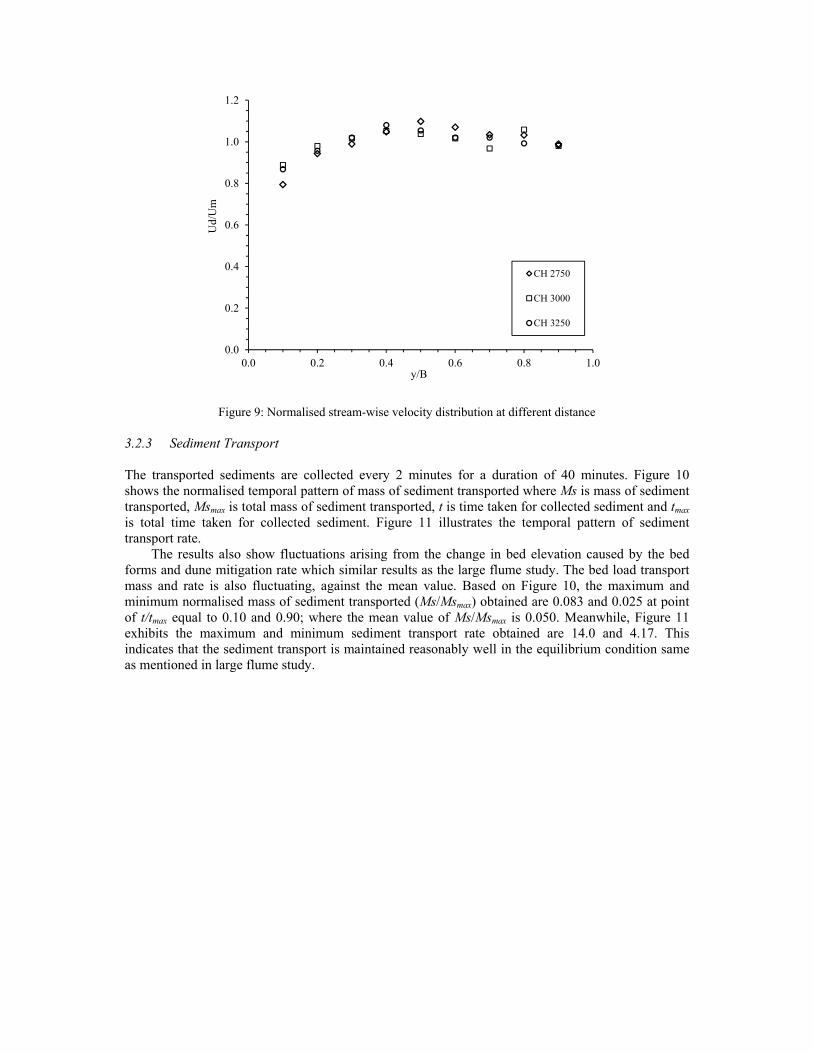
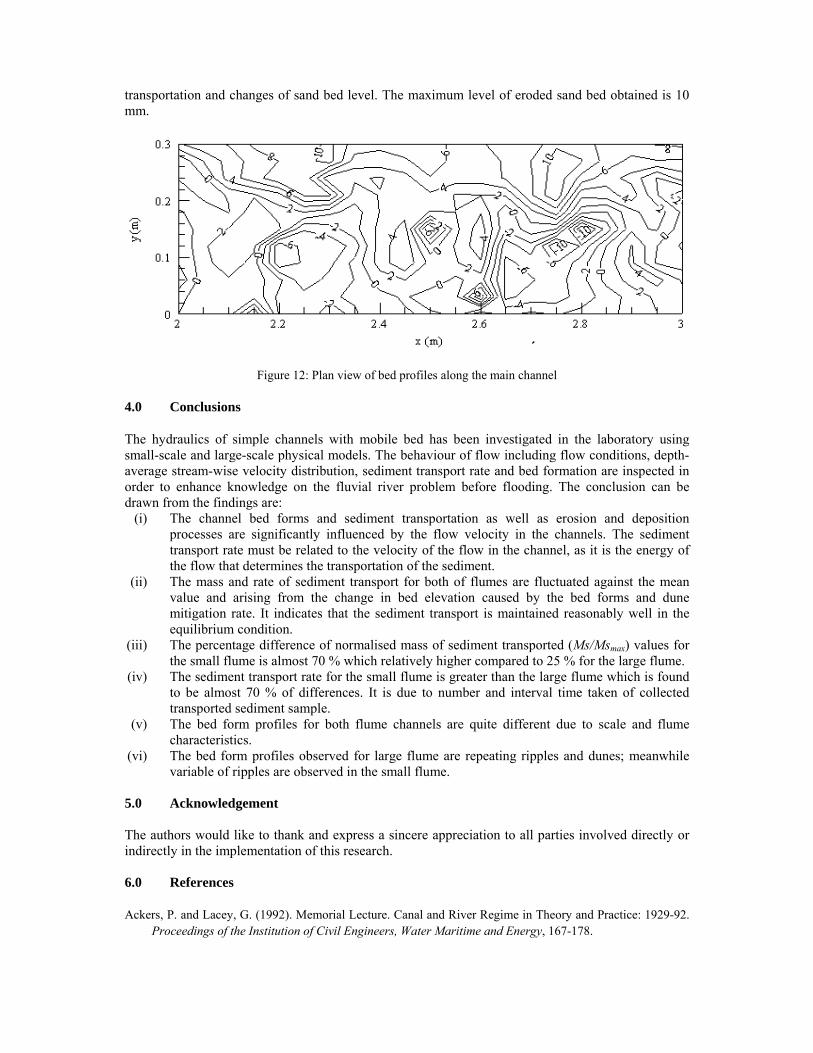
Figure 9: Normalised stream-wise velocity distribution at different distance 3.2.3 Sediment Transport The transported sediments are collected every 2 minutes for a duration of 40 minutes. Figure 10 shows the normalised temporal pattern of mass of sediment transported where Ms is mass of sediment transported, Msmax is total mass of sediment transported, t is time taken for collected sediment and tmax is total time taken for collected sediment. Figure 11 illustrates the temporal pattern of sediment transport rate.
The results also show fluctuations arising from the change in bed elevation caused by the bed forms and dune mitigation rate which similar results as the large flume study. The bed load transport mass and rate is also fluctuating, against the mean value. Based on Figure 10, the maximum and minimum normalised mass of sediment transported (Ms/Msmax) obtained are 0.083 and 0.025 at point of t/tmax equal to 0.10 and 0.90; where the mean value of Ms/Msmax is 0.050. Meanwhile, Figure 11 exhibits the maximum and minimum sediment transport rate obtained are 14.0 and 4.17. This indicates that the sediment transport is maintained reasonably well in the equilibrium condition same as mentioned in large flume study.
0.0
0.2
0.4
0.6
0.8
1.0
1.2
0.0 0.2 0.4 0.6 0.8 1.0
Ud/
Um
y/B
CH 2750
CH 3000
CH 3250
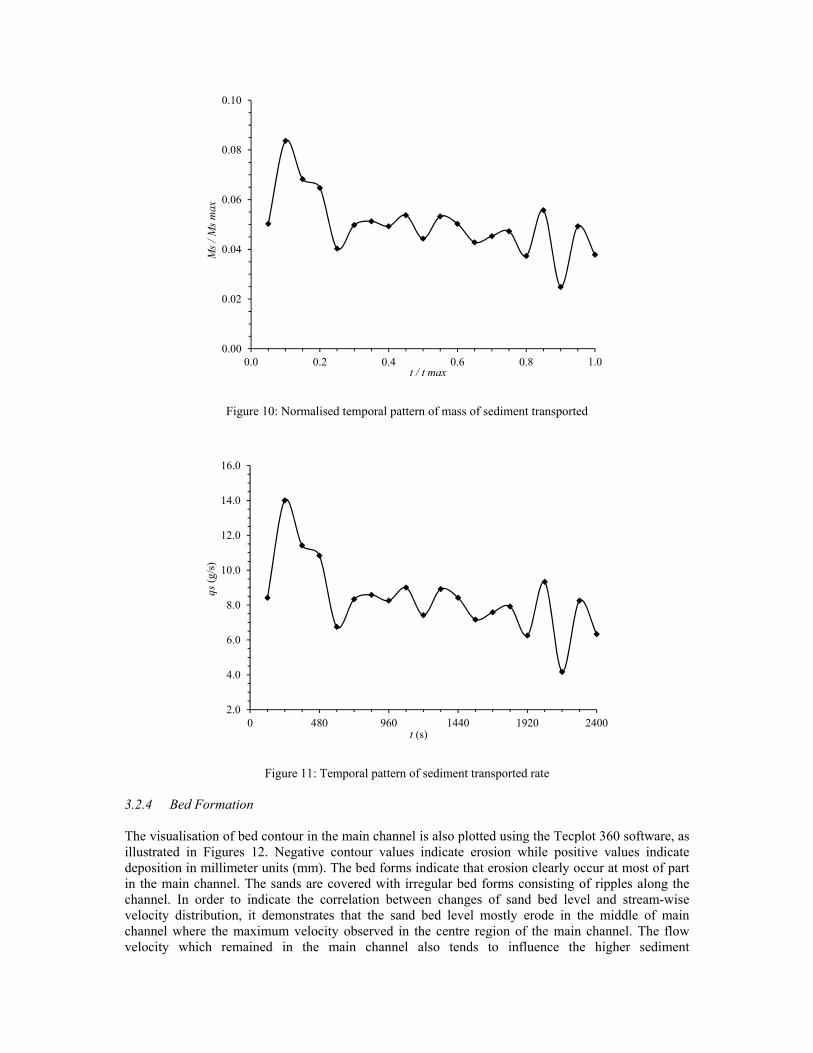
Figure 10: Normalised temporal pattern of mass of sediment transported
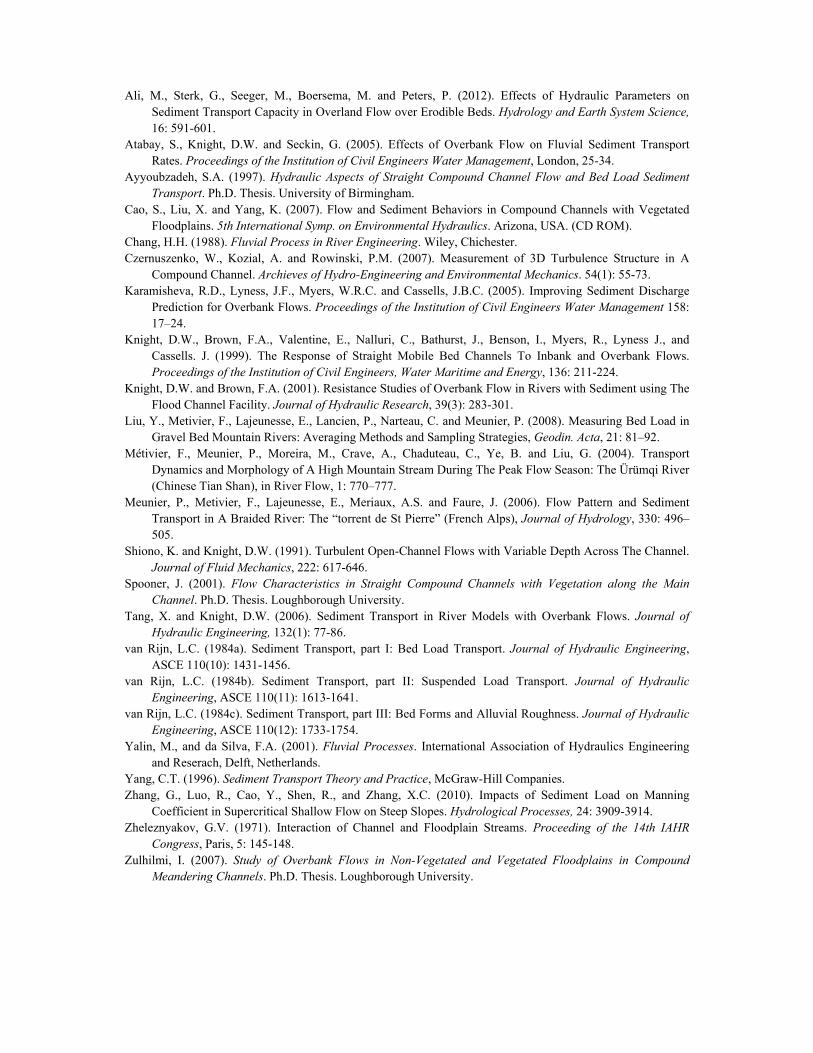
Figure 11: Temporal pattern of sediment transported rate 3.2.4 Bed Formation The visualisation of bed contour in the main channel is also plotted using the Tecplot 360 software, as illustrated in Figures 12. Negative contour values indicate erosion while positive values indicate deposition in millimeter units (mm). The bed forms indicate that erosion clearly occur at most of part in the main channel. The sands are covered with irregular bed forms consisting of ripples along the channel. In order to indicate the correlation between changes of sand bed level and stream-wise velocity distribution, it demonstrates that the sand bed level mostly erode in the middle of main channel where the maximum velocity observed in the centre region of the main channel. The flow velocity which remained in the main channel also tends to influence the higher sediment
0.00
0.02
0.04
0.06
0.08
0.10
0.0 0.2 0.4 0.6 0.8 1.0
Ms /
Ms m
ax
t / t max
2.0
4.0
6.0
8.0
10.0
12.0
14.0
16.0
0 480 960 1440 1920 2400
qs(g
/s)
t (s)
transportation and changes of sand bed level. The maximum level of eroded sand bed obtained is 10 mm.
Figure 12: Plan view of bed profiles along the main channel 4.0 Conclusions The hydraulics of simple channels with mobile bed has been investigated in the laboratory using small-scale and large-scale physical models. The behaviour of flow including flow conditions, depth-average stream-wise velocity distribution, sediment transport rate and bed formation are inspected in order to enhance knowledge on the fluvial river problem before flooding. The conclusion can be drawn from the findings are:
(i) The channel bed forms and sediment transportation as well as erosion and deposition processes are significantly influenced by the flow velocity in the channels. The sediment transport rate must be related to the velocity of the flow in the channel, as it is the energy of the flow that determines the transportation of the sediment.
(ii) The mass and rate of sediment transport for both of flumes are fluctuated against the mean value and arising from the change in bed elevation caused by the bed forms and dune mitigation rate. It indicates that the sediment transport is maintained reasonably well in the equilibrium condition.
(iii) The percentage difference of normalised mass of sediment transported (Ms/Msmax) values for the small flume is almost 70 % which relatively higher compared to 25 % for the large flume.
(iv) The sediment transport rate for the small flume is greater than the large flume which is found to be almost 70 % of differences. It is due to number and interval time taken of collected transported sediment sample.
(v) The bed form profiles for both flume channels are quite different due to scale and flume characteristics.
(vi) The bed form profiles observed for large flume are repeating ripples and dunes; meanwhile variable of ripples are observed in the small flume.
5.0 Acknowledgement The authors would like to thank and express a sincere appreciation to all parties involved directly or indirectly in the implementation of this research. 6.0 References Ackers, P. and Lacey, G. (1992). Memorial Lecture. Canal and River Regime in Theory and Practice: 1929-92.
Proceedings of the Institution of Civil Engineers, Water Maritime and Energy, 167-178.
Ali, M., Sterk, G., Seeger, M., Boersema, M. and Peters, P. (2012). Effects of Hydraulic Parameters on Sediment Transport Capacity in Overland Flow over Erodible Beds. Hydrology and Earth System Science, 16: 591-601.
Atabay, S., Knight, D.W. and Seckin, G. (2005). Effects of Overbank Flow on Fluvial Sediment Transport Rates. Proceedings of the Institution of Civil Engineers Water Management, London, 25-34.
Ayyoubzadeh, S.A. (1997). Hydraulic Aspects of Straight Compound Channel Flow and Bed Load Sediment Transport. Ph.D. Thesis. University of Birmingham.
Cao, S., Liu, X. and Yang, K. (2007). Flow and Sediment Behaviors in Compound Channels with Vegetated Floodplains. 5th International Symp. on Environmental Hydraulics. Arizona, USA. (CD ROM).
Chang, H.H. (1988). Fluvial Process in River Engineering. Wiley, Chichester. Czernuszenko, W., Kozial, A. and Rowinski, P.M. (2007). Measurement of 3D Turbulence Structure in A
Compound Channel. Archieves of Hydro-Engineering and Environmental Mechanics. 54(1): 55-73. Karamisheva, R.D., Lyness, J.F., Myers, W.R.C. and Cassells, J.B.C. (2005). Improving Sediment Discharge
Prediction for Overbank Flows. Proceedings of the Institution of Civil Engineers Water Management 158: 17–24.
Knight, D.W., Brown, F.A., Valentine, E., Nalluri, C., Bathurst, J., Benson, I., Myers, R., Lyness J., and Cassells. J. (1999). The Response of Straight Mobile Bed Channels To Inbank and Overbank Flows. Proceedings of the Institution of Civil Engineers, Water Maritime and Energy, 136: 211-224.
Knight, D.W. and Brown, F.A. (2001). Resistance Studies of Overbank Flow in Rivers with Sediment using The Flood Channel Facility. Journal of Hydraulic Research, 39(3): 283-301.
Liu, Y., Metivier, F., Lajeunesse, E., Lancien, P., Narteau, C. and Meunier, P. (2008). Measuring Bed Load in Gravel Bed Mountain Rivers: Averaging Methods and Sampling Strategies, Geodin. Acta, 21: 81–92.
Métivier, F., Meunier, P., Moreira, M., Crave, A., Chaduteau, C., Ye, B. and Liu, G. (2004). Transport Dynamics and Morphology of A High Mountain Stream During The Peak Flow Season: The Ürümqi River (Chinese Tian Shan), in River Flow, 1: 770–777.
Meunier, P., Metivier, F., Lajeunesse, E., Meriaux, A.S. and Faure, J. (2006). Flow Pattern and Sediment Transport in A Braided River: The “torrent de St Pierre” (French Alps), Journal of Hydrology, 330: 496–505.
Shiono, K. and Knight, D.W. (1991). Turbulent Open-Channel Flows with Variable Depth Across The Channel. Journal of Fluid Mechanics, 222: 617-646.
Spooner, J. (2001). Flow Characteristics in Straight Compound Channels with Vegetation along the Main Channel. Ph.D. Thesis. Loughborough University.
Tang, X. and Knight, D.W. (2006). Sediment Transport in River Models with Overbank Flows. Journal of Hydraulic Engineering, 132(1): 77-86.
van Rijn, L.C. (1984a). Sediment Transport, part I: Bed Load Transport. Journal of Hydraulic Engineering, ASCE 110(10): 1431-1456.
van Rijn, L.C. (1984b). Sediment Transport, part II: Suspended Load Transport. Journal of Hydraulic Engineering, ASCE 110(11): 1613-1641.
van Rijn, L.C. (1984c). Sediment Transport, part III: Bed Forms and Alluvial Roughness. Journal of Hydraulic Engineering, ASCE 110(12): 1733-1754.
Yalin, M., and da Silva, F.A. (2001). Fluvial Processes. International Association of Hydraulics Engineering and Reserach, Delft, Netherlands.
Yang, C.T. (1996). Sediment Transport Theory and Practice, McGraw-Hill Companies. Zhang, G., Luo, R., Cao, Y., Shen, R., and Zhang, X.C. (2010). Impacts of Sediment Load on Manning
Coefficient in Supercritical Shallow Flow on Steep Slopes. Hydrological Processes, 24: 3909-3914. Zheleznyakov, G.V. (1971). Interaction of Channel and Floodplain Streams. Proceeding of the 14th IAHR
Congress, Paris, 5: 145-148. Zulhilmi, I. (2007). Study of Overbank Flows in Non-Vegetated and Vegetated Floodplains in Compound
Meandering Channels. Ph.D. Thesis. Loughborough University.