Embed Size (px)
Citation preview
WHEC 16 / 13-16 June 2006 – Lyon France
1/12
Hydrogen Production from Optimal Wind-PV
Energies Systems
T. Tafticht and K. Agbossou*
Institut de recherche sur l’hydrogène, Université du Québec à Trois-Rivières,
C.P. 500, Trois-Rivières, (QC), G9A 5H7, Canada.
ABSTRACT: Electrolytic hydrogen offers a promising alternative for long-term energy storage of renewable energies (RE).
A stand-alone RE system based on hydrogen production has been developed at the Hydrogen Research
Institute and successfully tested for automatic operation with designed control devices. The system is
composed of a wind turbine, a photovoltaic (PV) array, an electrolyzer, batteries for buffer energy storage,
hydrogen and oxygen storage tanks, a fuel cell, AC and DC loads, power conditioning devices and different
sensors. The long-term excess energy with respect to load demand has been sent to the electrolyser for
hydrogen production and then the fuel cell has utilised this stored hydrogen to produce electricity when there
were insufficient wind and solar energies with respect to load requirements. The RE system components
have substantially different voltage-current characteristics and they are integrated on the DC bus through
power conditioning devices for optimal operation by using the developed Maximum Power Point Tracking
(MPPT) control method. The experimental results show that the power gain obtained by this method clearly
increases the hydrogen production and storage rate from wind-PV systems.
KEYWORDS: maximum power, photovoltaic, wind turbine, hydrogen, fuel cell.
I. Introduction Energy storage can play an important role in the development and operation of an environment friendly
renewable energy (RE) system. The integrated wind and solar energy system, based on long-term seasonal
storage as electrolytic hydrogen (H2), is considered a promising alternative to overcome the intermittence of
the RE sources [1-2]. In comparison to commonly used battery storage, H2 is well suited for seasonal
storage applications, because of its inherent high mass energy density. A typical self-sufficient RE system
must include both short-term and long-term energy storage. A battery bank is used for short-term energy
storage due to its high charging-discharging efficiency, and also to take care of the effects caused by
instantaneous load ripples / spikes, electrolyzer transients, wind energy peaks. However, batteries alone are
not appropriate for long-term storage because of their low energy density, self-discharge and leakage. The
combination of a battery bank with long-term energy storage in the form of H2 can significantly improve the
performance of stand-alone RE systems. In such a RE system, electricity production in excess of demand is
* Corresponding Author : Phone: (819) 376-5011 # 3911; Fax: (819) 376-5164, E-mail: [email protected]; http://www.irh.uqtr.ca

WHEC 16 / 13-16 June 2006 – Lyon France
2/12
converted to H2, using an electrolyzer; electricity requirement in higher load demand is met by converting H2
to electricity through a fuel cell [3-5]. PV-Wind-hydrogen energy seems to be an interesting alternative that
makes possible to control the load demand energy and to produce not polluting fuel usable in transportation
or the buildings, and thus to diversify the energy markets [6]. However, the price of renewable energy
remains high and the energetic efficiency of the installations is relatively low. In order to be useable in a
broad reach of applications, and to satisfy the economic constraints, the conversion chain of this energy
must be robust and reliable. It must also present a better efficiency and be realized at low cost. For that, it is
necessary to extract the maximum power from renewable sources. The operating power of renewable
sources depends on the wind speed intensity and the turbine speed for wind turbine and the sun intensity,
the temperature and especially output voltage for the PV modules. If the power transfer between renewable
sources and the load is not optimal, the total efficiency of PV-wind energy system will be largely affected.
The renewable sources can be operated at the maximum power operating point for various conditions by
adjusting the turbine speed and the PV modules output voltage optimally.
This paper describes the MPPT method used to achieve the maximum power control of PV-wind system. By
acquiring the output power of PV-wind system, the control searches the maximum power point and tracks
this point in the event of change of the meteorological conditions, in order to reduce the error between the
operating power and the maximum power. The application of the MPPT method to PV-wind systems with
energy storage in the form of hydrogen shows that it is possible to increase significantly the efficiency of
storage.
II. PV-Wind-Hydrogen System Description The stand-alone RE system based on hydrogen production has been tested successfully at the Hydrogen
Research Institute (HRI). The system consists of a 10 kW wind turbine generator (WTG) and a 1 kW (peak)
solar PV array as primary energy sources. The excess energy with respect to load demand has been stored
as electrolytic hydrogen through a 5 kW electrolyzer and this hydrogen has been utilized to produce
electricity as per energy demand through a 5 kW fuel cell system. The RE system components have
substantially different voltage-current characteristics and are integrated through the developed power
conditioning devices on a 48V DC bus, which allows power to be managed between input power, energy
storage and load. The DC-DC buck and boost converters are connected for power conditioning between the
electrolyzer and the DC bus, and between the fuel cell and the DC bus, respectively. The schematic of the
RE system is shown in Figure 1 and the system components' specifications are given in Table 1. Current
from the DC bus bar keeps batteries (short-term energy storage) charged, feeds power to the load bank via
an inverter and also supplies power to electrolyzer via power-conditioning device. To simulate any type of
electrical load profile, we have used DC and AC programmable loads. Our developed RE system has also a
programmable power source at DC bus and can be used to test the system, when there is no power
available from wind and solar energy system. The programmable power source can simulate any type of
intermittent power output. The electrolyzer and the fuel cell are major components of the RE system. We
have also studied the polarization characteristics of them, which depend mainly on voltage, current and
temperature. The different sensors are used to record real time voltages and currents of WTG, PV array, DC
bus / battery, electrolyzer, fuel cell, load, H2 detectors, electrolytic H2 flow rate from the electrolyzer, H2
consumption rate in the fuel cell, oxidant consumption rate in the fuel cell, H2 and oxidant pressure in the
fuel cell, fuel cell stack temperature, electrolyzer cell temperature, DC-DC converter (boost and buck) duty
WHEC 16 / 13-16 June 2006 – Lyon France
3/12
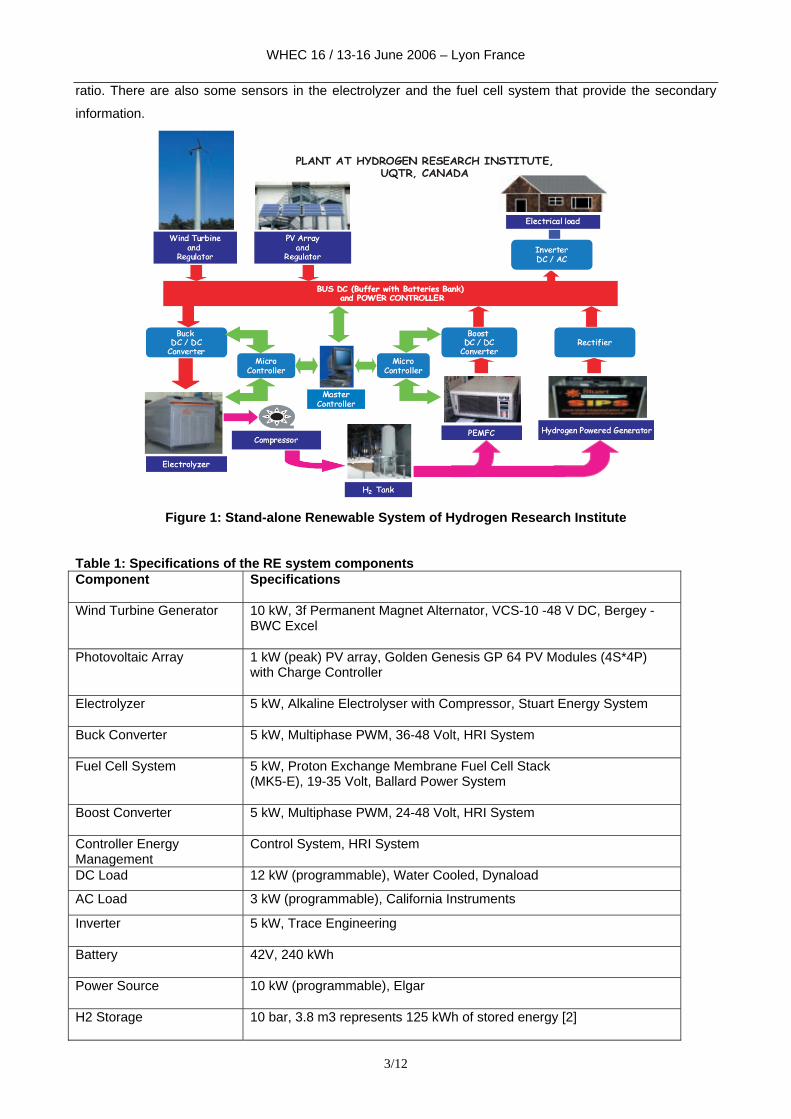
ratio. There are also some sensors in the electrolyzer and the fuel cell system that provide the secondary
information.
Figure 1: Stand-alone Renewable System of Hydrogen Research Institute
Table 1: Specifications of the RE system components Component Specifications
Wind Turbine Generator 10 kW, 3f Permanent Magnet Alternator, VCS-10 -48 V DC, Bergey -
BWC Excel
Photovoltaic Array 1 kW (peak) PV array, Golden Genesis GP 64 PV Modules (4S*4P) with Charge Controller
Electrolyzer 5 kW, Alkaline Electrolyser with Compressor, Stuart Energy System
Buck Converter 5 kW, Multiphase PWM, 36-48 Volt, HRI System
Fuel Cell System 5 kW, Proton Exchange Membrane Fuel Cell Stack (MK5-E), 19-35 Volt, Ballard Power System
Boost Converter 5 kW, Multiphase PWM, 24-48 Volt, HRI System
Controller Energy Management
Control System, HRI System
DC Load 12 kW (programmable), Water Cooled, Dynaload
AC Load 3 kW (programmable), California Instruments
Inverter 5 kW, Trace Engineering
Battery 42V, 240 kWh
Power Source 10 kW (programmable), Elgar
H2 Storage 10 bar, 3.8 m3 represents 125 kWh of stored energy [2]
WHEC 16 / 13-16 June 2006 – Lyon France
4/12
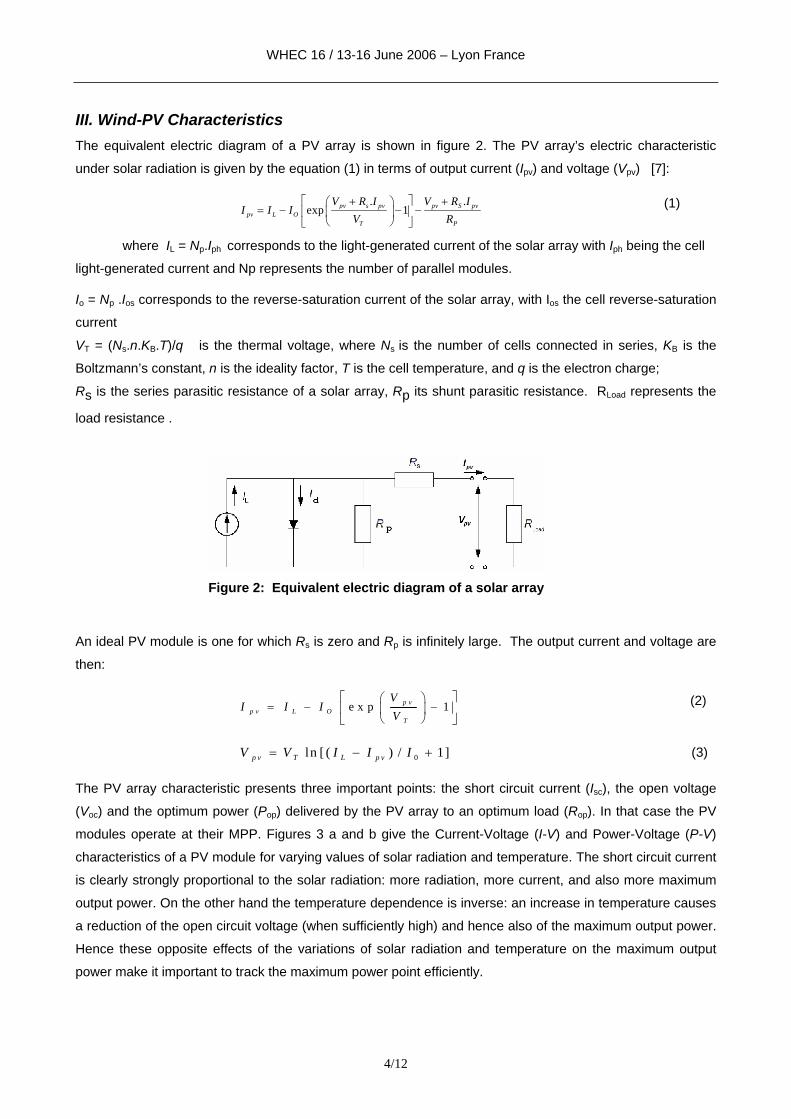
III. Wind-PV Characteristics The equivalent electric diagram of a PV array is shown in figure 2. The PV array’s electric characteristic
under solar radiation is given by the equation (1) in terms of output current (Ipv) and voltage (Vpv) [7]:
. .exp 1pv s pv pv S pv
pv L OT P
V R I V R II I I
V R⎡ ⎤+ +⎛ ⎞
= − − −⎢ ⎥⎜ ⎟⎝ ⎠⎣ ⎦
(1)
where IL = Np.Iph corresponds to the light-generated current of the solar array with Iph being the cell
light-generated current and Np represents the number of parallel modules.
Io = Np .Ios corresponds to the reverse-saturation current of the solar array, with Ios the cell reverse-saturation
current
VT = (Ns.n.KB.T)/q is the thermal voltage, where Ns is the number of cells connected in series, KB is the
Boltzmann’s constant, n is the ideality factor, T is the cell temperature, and q is the electron charge;
Rs is the series parasitic resistance of a solar array, Rp its shunt parasitic resistance. RLoad represents the
load resistance .
Figure 2: Equivalent electric diagram of a solar array
An ideal PV module is one for which Rs is zero and Rp is infinitely large. The output current and voltage are
then:
e x p 1p vp v L O
T
VI I I
V⎡ ⎤⎛ ⎞
= − −⎢ ⎥⎜ ⎟⎝ ⎠⎣ ⎦
(2)
0ln [ ( ) / 1]p v T L p vV V I I I= − + (3)
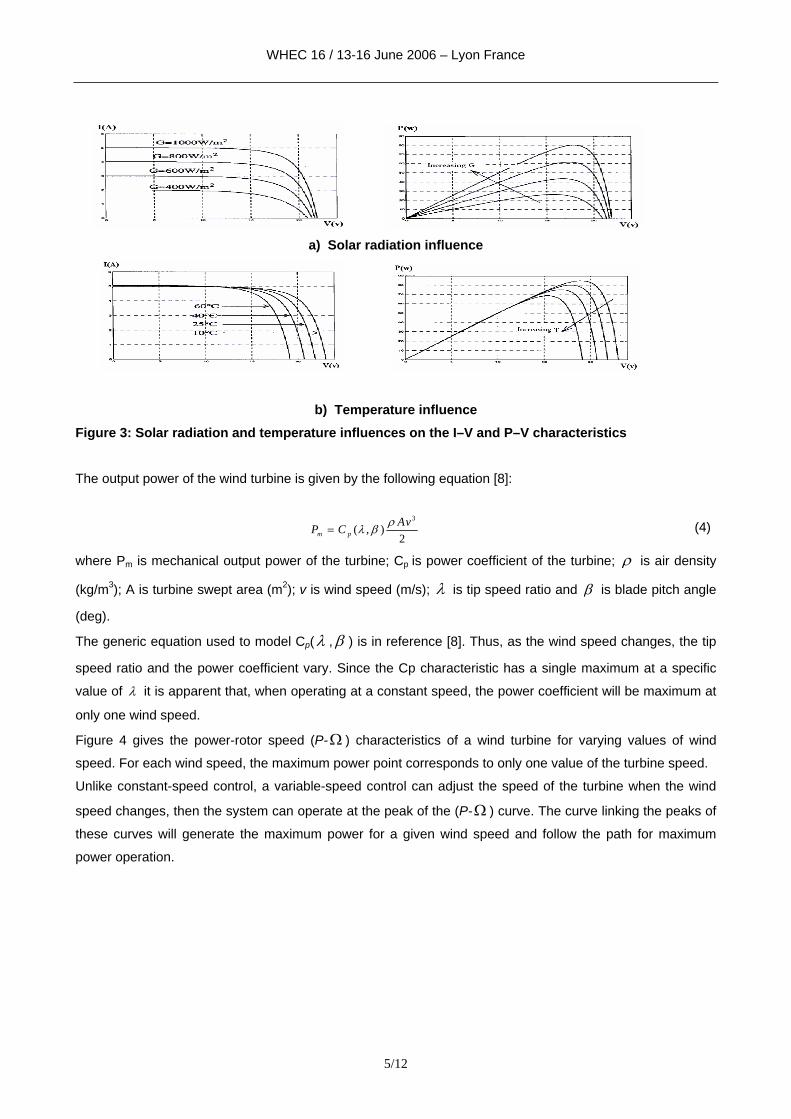
The PV array characteristic presents three important points: the short circuit current (Isc), the open voltage
(Voc) and the optimum power (Pop) delivered by the PV array to an optimum load (Rop). In that case the PV
modules operate at their MPP. Figures 3 a and b give the Current-Voltage (I-V) and Power-Voltage (P-V)
characteristics of a PV module for varying values of solar radiation and temperature. The short circuit current
is clearly strongly proportional to the solar radiation: more radiation, more current, and also more maximum
output power. On the other hand the temperature dependence is inverse: an increase in temperature causes
a reduction of the open circuit voltage (when sufficiently high) and hence also of the maximum output power.
Hence these opposite effects of the variations of solar radiation and temperature on the maximum output
power make it important to track the maximum power point efficiently.
WHEC 16 / 13-16 June 2006 – Lyon France
5/12
a) Solar radiation influence
b) Temperature influence Figure 3: Solar radiation and temperature influences on the I–V and P–V characteristics The output power of the wind turbine is given by the following equation [8]:
3
( , )2m pAvP C ρλ β= (4)
where Pm is mechanical output power of the turbine; Cp is power coefficient of the turbine; ρ is air density
(kg/m3); A is turbine swept area (m2); v is wind speed (m/s); λ is tip speed ratio and β is blade pitch angle
(deg).
The generic equation used to model Cp(λ ,β ) is in reference [8]. Thus, as the wind speed changes, the tip
speed ratio and the power coefficient vary. Since the Cp characteristic has a single maximum at a specific
value of λ it is apparent that, when operating at a constant speed, the power coefficient will be maximum at
only one wind speed.
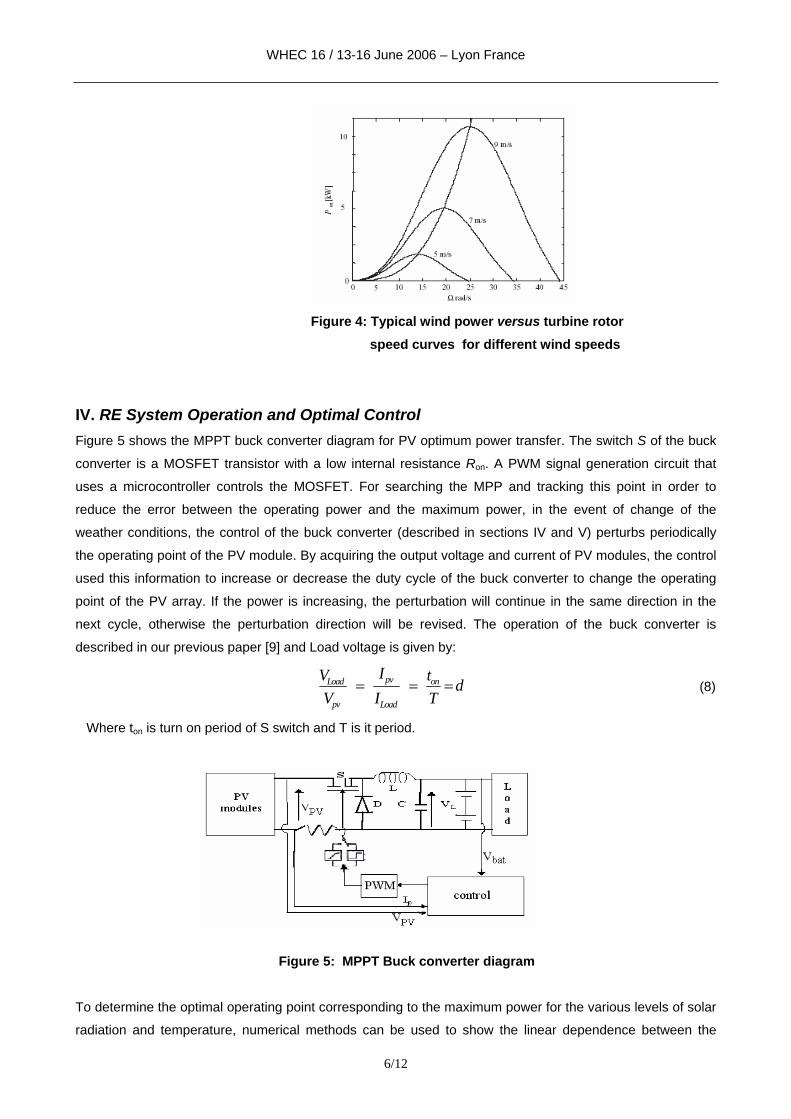
Figure 4 gives the power-rotor speed (P-Ω ) characteristics of a wind turbine for varying values of wind
speed. For each wind speed, the maximum power point corresponds to only one value of the turbine speed.
Unlike constant-speed control, a variable-speed control can adjust the speed of the turbine when the wind
speed changes, then the system can operate at the peak of the (P-Ω ) curve. The curve linking the peaks of
these curves will generate the maximum power for a given wind speed and follow the path for maximum
power operation.
WHEC 16 / 13-16 June 2006 – Lyon France
6/12
Figure 4: Typical wind power versus turbine rotor speed curves for different wind speeds
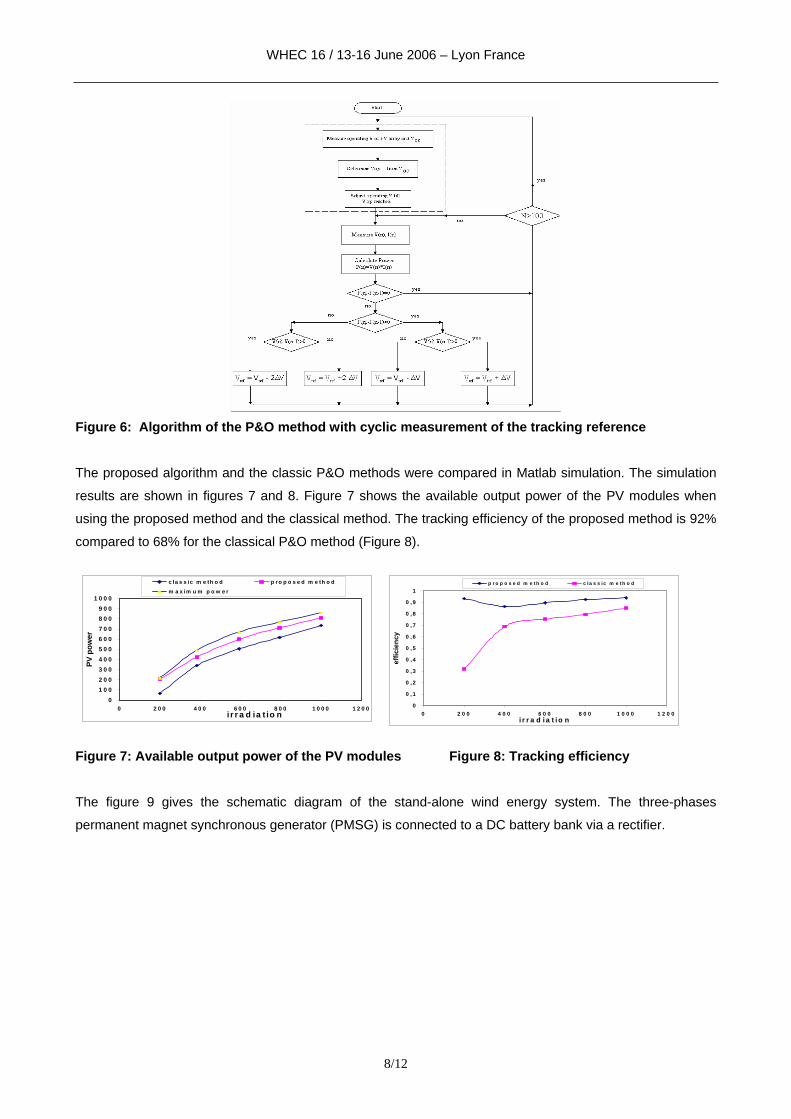
IV. RE System Operation and Optimal Control Figure 5 shows the MPPT buck converter diagram for PV optimum power transfer. The switch S of the buck
converter is a MOSFET transistor with a low internal resistance Ron. A PWM signal generation circuit that
uses a microcontroller controls the MOSFET. For searching the MPP and tracking this point in order to
reduce the error between the operating power and the maximum power, in the event of change of the
weather conditions, the control of the buck converter (described in sections IV and V) perturbs periodically
the operating point of the PV module. By acquiring the output voltage and current of PV modules, the control
used this information to increase or decrease the duty cycle of the buck converter to change the operating
point of the PV array. If the power is increasing, the perturbation will continue in the same direction in the
next cycle, otherwise the perturbation direction will be revised. The operation of the buck converter is
described in our previous paper [9] and Load voltage is given by:
pvLoad on
pv Load
IV t dV I T
= = = (8)
Where ton is turn on period of S switch and T is it period.
Figure 5: MPPT Buck converter diagram To determine the optimal operating point corresponding to the maximum power for the various levels of solar
radiation and temperature, numerical methods can be used to show the linear dependence between the

WHEC 16 / 13-16 June 2006 – Lyon France
7/12
optimal current and the short circuit current [10]. A similar approach, based on the linear approximation of
the optimal voltage relative to the open circuit voltage, can be also used to determine the MPP [11]. Both
types of MPPT methods may be used either with buck or boost converters depending on the load
characteristics. The short-circuit current depends linearly on the solar irradiation, while the open circuit
voltage depends logarithmically on the solar irradiation [12]. The studies tend to show that the linear
approximation of the current used in the CMPPT (Current-based Maximum Power Point Tracking) technique
is more accurate when compared with the linear approximation of the voltage used in the VMPPT (Voltage-
based-Maximum Power Point Tracking) technique. However, the technique of VMPPT is more effective and
has less loss (particularly for MPPT buck converters). In addition, online measurements of PV short-circuit
current and output currents make CMPPT hardware more difficult compared (same rating) with VMPPT
circuitry that requires voltage measurement only [11].
From this analysis, a nonlinear approach of the MPP value estimation is proposed. The approach is based
on the open-circuit voltage measurement and nonlinear calculation of the optimal voltage.
The optimal voltage is given by [9]:
( )( ) ( )
e x p 11 1 e x p 1
T O C To p
O C T
V V VV
K V V−⎡ ⎤⎣ ⎦=
− − (9)
To reduce energy losses during the times of open MOSFET circuit, an algorithm based on the
combination of the nonlinear approach with a P&O method was developed.
Figure 6 gives the algorithm of the P&O method with cyclic measurement of the MPP tracking reference by
the nonlinear approach. This combination makes it possible to reduce the losses from the nonlinear
approach alone and to obtain a quasi-convergence of the P&O method.
To validate the proposed MPPT algorithm, it was compared with the classic P&O algorithm. The
comparison was based on the tracking efficiency of the maximum power available at the solar panels. The
tracking efficiency is defined by equation [9]:
∑=
=n
i i
iT P
Pn 1 max,
1η (10)
where Pi represents the power absorbed by the load, Pmax,i represents the maximum power available at the
PV modules, and n is the number of samples.
WHEC 16 / 13-16 June 2006 – Lyon France
8/12
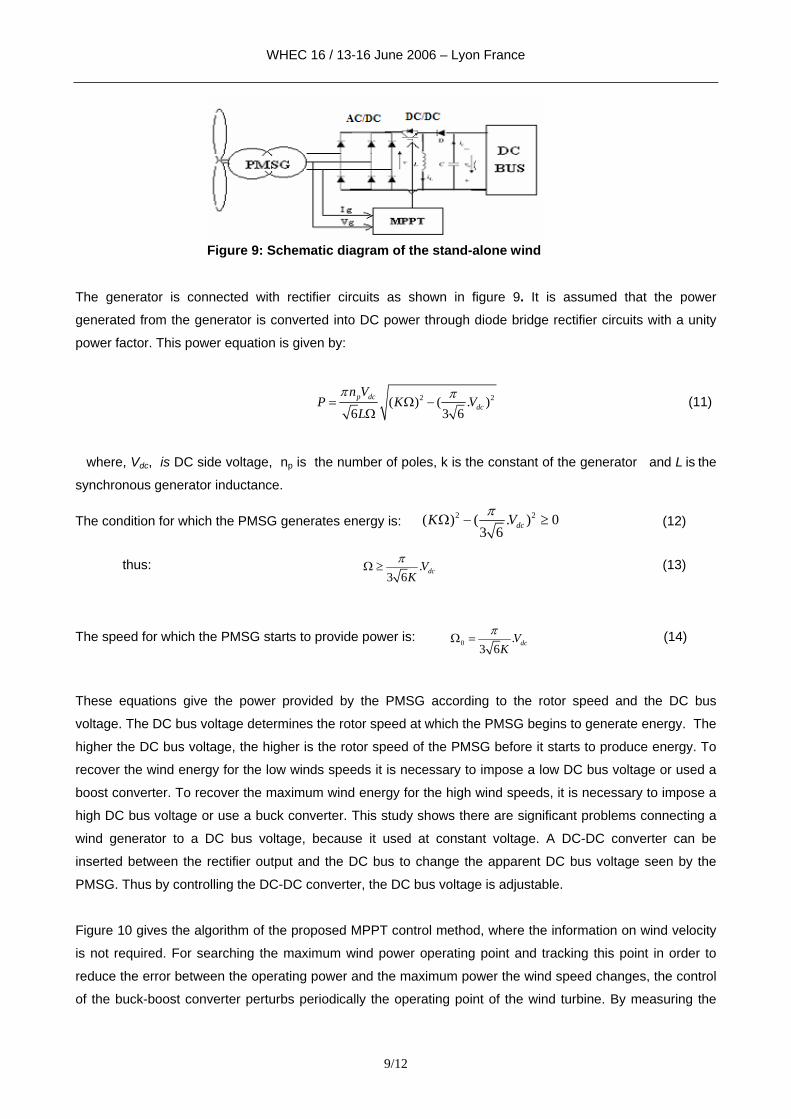
Figure 6: Algorithm of the P&O method with cyclic measurement of the tracking reference
The proposed algorithm and the classic P&O methods were compared in Matlab simulation. The simulation
results are shown in figures 7 and 8. Figure 7 shows the available output power of the PV modules when
using the proposed method and the classical method. The tracking efficiency of the proposed method is 92%
compared to 68% for the classical P&O method (Figure 8).
Figure 7: Available output power of the PV modules Figure 8: Tracking efficiency
The figure 9 gives the schematic diagram of the stand-alone wind energy system. The three-phases
permanent magnet synchronous generator (PMSG) is connected to a DC battery bank via a rectifier.
0
0 , 1
0 , 2
0 , 3
0 , 4
0 , 5
0 , 6
0 , 7
0 , 8
0 , 9
1
0 2 0 0 4 0 0 6 0 0 8 0 0 1 0 0 0 1 2 0 0i r r a d ia t io n
effic
ienc
y
p r o p o s e d m e t h o d c la s s ic m e t h o d
01 0 02 0 03 0 04 0 05 0 06 0 07 0 08 0 09 0 0
1 0 0 0
0 2 0 0 4 0 0 6 0 0 8 0 0 1 0 0 0 1 2 0 0i r r a d ia t io n
PV p
ower
c la s s ic m e th o d p r o p o s e d m e th o d
m a x im u m p o w e r
WHEC 16 / 13-16 June 2006 – Lyon France
9/12
The generator is connected with rectifier circuits as shown in figure 9. It is assumed that the power
generated from the generator is converted into DC power through diode bridge rectifier circuits with a unity
power factor. This power equation is given by:
2 2( ) ( . )6 3 6
p dcdc
n VP K V
L
π π= Ω −
Ω (11)
where, Vdc, is DC side voltage, np is the number of poles, k is the constant of the generator and L is the
synchronous generator inductance.
The condition for which the PMSG generates energy is: 2 2( ) ( . ) 03 6 dcK Vπ
Ω − ≥ (12)
thus: .3 6 dcV
Kπ
Ω ≥ (13)
The speed for which the PMSG starts to provide power is: 0 .3 6 dcV
Kπ
Ω = (14)
These equations give the power provided by the PMSG according to the rotor speed and the DC bus
voltage. The DC bus voltage determines the rotor speed at which the PMSG begins to generate energy. The
higher the DC bus voltage, the higher is the rotor speed of the PMSG before it starts to produce energy. To
recover the wind energy for the low winds speeds it is necessary to impose a low DC bus voltage or used a
boost converter. To recover the maximum wind energy for the high wind speeds, it is necessary to impose a
high DC bus voltage or use a buck converter. This study shows there are significant problems connecting a
wind generator to a DC bus voltage, because it used at constant voltage. A DC-DC converter can be
inserted between the rectifier output and the DC bus to change the apparent DC bus voltage seen by the
PMSG. Thus by controlling the DC-DC converter, the DC bus voltage is adjustable.
Figure 10 gives the algorithm of the proposed MPPT control method, where the information on wind velocity
is not required. For searching the maximum wind power operating point and tracking this point in order to
reduce the error between the operating power and the maximum power the wind speed changes, the control
of the buck-boost converter perturbs periodically the operating point of the wind turbine. By measuring the
Figure 9: Schematic diagram of the stand-alone wind
WHEC 16 / 13-16 June 2006 – Lyon France
10/12
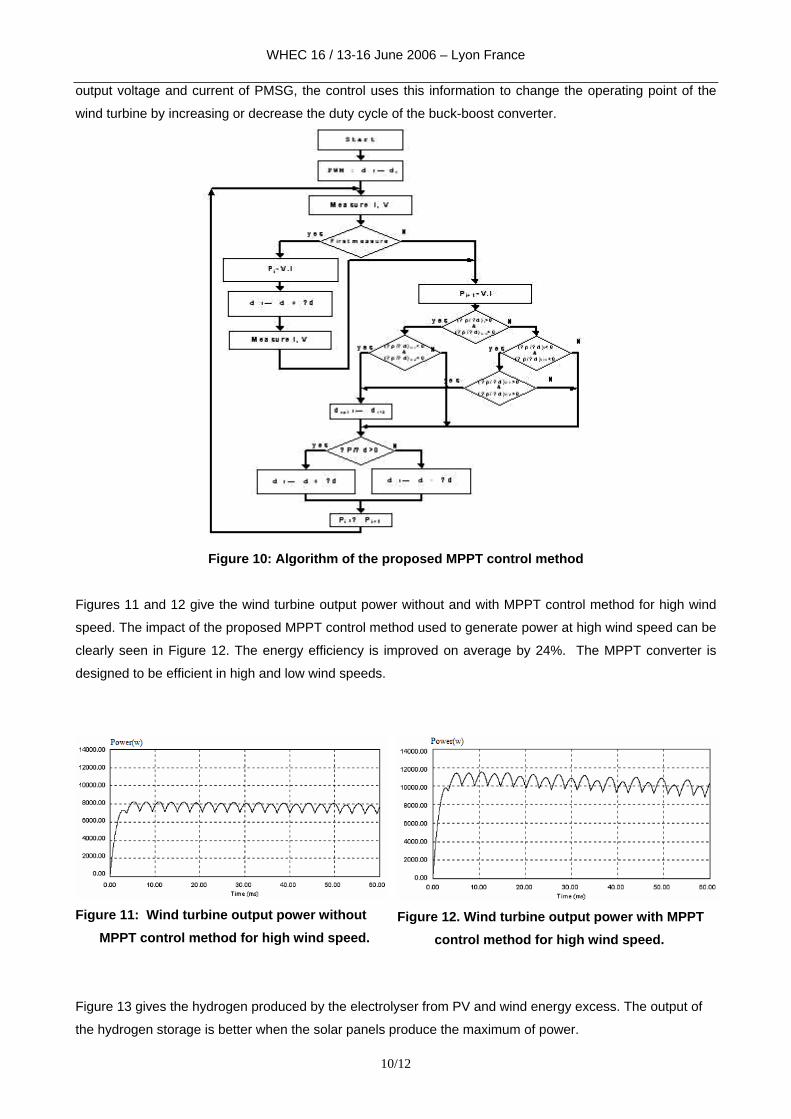
output voltage and current of PMSG, the control uses this information to change the operating point of the
wind turbine by increasing or decrease the duty cycle of the buck-boost converter.
Figure 10: Algorithm of the proposed MPPT control method
Figures 11 and 12 give the wind turbine output power without and with MPPT control method for high wind
speed. The impact of the proposed MPPT control method used to generate power at high wind speed can be
clearly seen in Figure 12. The energy efficiency is improved on average by 24%. The MPPT converter is
designed to be efficient in high and low wind speeds.
Figure 11: Wind turbine output power without MPPT control method for high wind speed.
Figure 12. Wind turbine output power with MPPT control method for high wind speed.
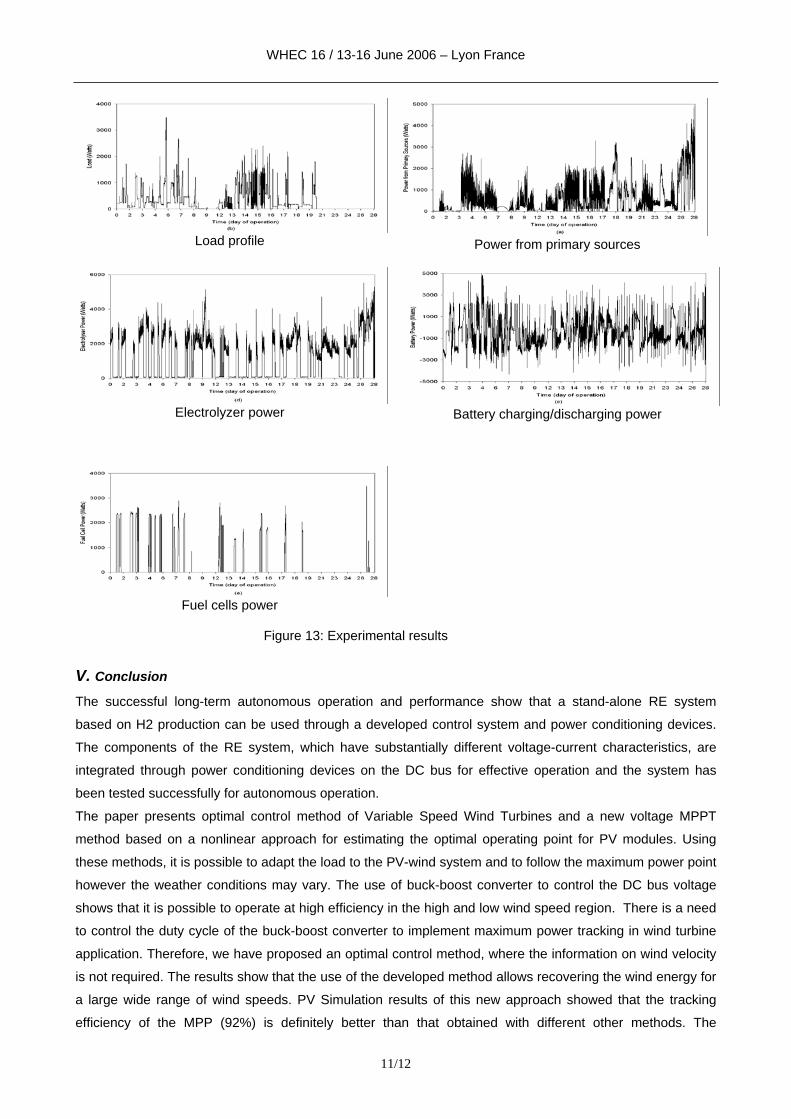
Figure 13 gives the hydrogen produced by the electrolyser from PV and wind energy excess. The output of
the hydrogen storage is better when the solar panels produce the maximum of power.
WHEC 16 / 13-16 June 2006 – Lyon France
11/12
Load profile
Power from primary sources
Electrolyzer power
Battery charging/discharging power
Fuel cells power
Figure 13: Experimental results
V. Conclusion
The successful long-term autonomous operation and performance show that a stand-alone RE system
based on H2 production can be used through a developed control system and power conditioning devices.
The components of the RE system, which have substantially different voltage-current characteristics, are
integrated through power conditioning devices on the DC bus for effective operation and the system has
been tested successfully for autonomous operation.
The paper presents optimal control method of Variable Speed Wind Turbines and a new voltage MPPT
method based on a nonlinear approach for estimating the optimal operating point for PV modules. Using
these methods, it is possible to adapt the load to the PV-wind system and to follow the maximum power point
however the weather conditions may vary. The use of buck-boost converter to control the DC bus voltage
shows that it is possible to operate at high efficiency in the high and low wind speed region. There is a need
to control the duty cycle of the buck-boost converter to implement maximum power tracking in wind turbine
application. Therefore, we have proposed an optimal control method, where the information on wind velocity
is not required. The results show that the use of the developed method allows recovering the wind energy for
a large wide range of wind speeds. PV Simulation results of this new approach showed that the tracking
efficiency of the MPP (92%) is definitely better than that obtained with different other methods. The
WHEC 16 / 13-16 June 2006 – Lyon France
12/12
simulations and experimental results showed that the approach improves clearly the tracking efficiency of the
maximum power available at the output of the PV modules. In addition, the new method reduces the
oscillations around the MPP, and the maximum power point tracking average efficiency increases to 92 %.
The application of the MPPT method to PV systems with hydrogen storage increases the energy excess
provided by PV modules to the electrolyzer.
VI. Acknowledgements
This work has been supported by the LTE Hydro-Québec, Natural Resources Canada and the Natural
Sciences and Engineering Research Council of Canada.
VII References [1]. S.R. Vosen, and al, “Hybrid energy storage for standalone electric power systems: optimization of system
performance and cost through control strategies”, Int. J. Hydrogen Energy” vol.24, pp.1139-1156, 1999.
[2]. K. Agbossou, and al, “Renewable energy system based on hydrogen for remote applications”, Journal of
Power Sources vol. 96, pp. 168-172, 2001.
[3]. M.N. Eskander, T.F. El-Shatter, and M.T. El-Hagry, “Energy flow and management of a hybrid
wind/PV/fuel cell generation system” 33rd Annual IEEE Power Electronics Specialists Conference, vol. 1, pp.
347-353, 2002.
[4]. S. Duryea, S. Islam, and W. Lawrance, ”A battery management system for stand-alone photovoltaic
energy systems”, IEEE Industry Applications Magazine, pp. 67-72, 2001.
[5]. A.G. Dutton, and al, “Experience in the design, sizing, economics, and implementation of autonomous
wind-powered hydrogen production systems”, Int. J. Hydrogen Energy, vol. 25, pp.705-722, 2000.
[6]. M. Kolhe, K. Agbossou, , and al,”Long-term performance of stand-alone renewable energy system for
hydrogen production”, 14th World Hydrogen Energy Conference, 2002.
[7]. E. Koutroulis and al, “Development of a micro-controller based photovoltaic maximum power point
tracking control system”, IEEE Trans on Power Electronics, vol. 16, pp. 46-54, Jan. 2001.
[8]. T. Thiringer and J. Linders, “Control by variable rotor speed of a fixed pitch wind turbine operating in a
wide speed range,” IEEE Trans. Energy Conv., vol. EC-8, pp. 520–526, Sept. 1993.
[9]. T. Tafticht, and K. Agbossou “MPPT method Development for photovoltaic systems”. IEEE, Canadian
Conference on Electrical and Computer Engineering, CCGEI 2004, Niagara Falls (Ontario), May 2004.
[10]. T. Noguchi, S. Togachi, and R. Nakamoto, “Short-current pulse-based maximum-power-point tracking
method for multiple photovoltaic-and-converter module system”, IEEE Trans on Industrial Electronics, vol.
49, pp. 217-223, Feb. 2002.
[11]. M. A. S. Masoum, H. Dehbonei, E. F. Fuchs, “Theoretical and experimental analyses of photovoltaic
systems with voltage and current-based maximum power-point tracking” IEEE Trans on Energy Conversion,
Vol. 17, pp. 514 - 522, Dec. 2002.
[12]. M. Akbaba, “Matching three-phase AC loads to PVG for maximum power transfer using an enhanced
version of the Akbaba model and double step-up converter”, Solar Energy, Vol. 75 (1), pp.17-25, July 2003.