Embed Size (px)
Citation preview
Archives of Cardiovascular Disease (2014) 107, 261—271
Available online at
ScienceDirectwww.sciencedirect.com
REVIEW
Imaging in pulmonary hypertension: Focuson the role of echocardiography
Imagerie dans l’hypertension pulmonaire : le rôle del’échocardiographie
Pamela Moceri ∗, Delphine Baudouy, Olivier Chiche,Pierre Cerboni, Priscille Bouvier, Claire Chaussade,Emile Ferrari
Service de cardiologie, hôpital Pasteur, CHU de Nice, 30, avenue de la Voie-Romaine, BP69, CS51069, 06001 Nice cedex 1, France
Received 12 December 2013; received in revised form 11 February 2014; accepted 13 February2014Available online 18 April 2014
KEYWORDSPulmonaryhypertension;Echocardiography;Prognosis
Summary Patients with pulmonary hypertension must be evaluated using a multimodalityapproach to ensure a correct diagnosis and basal evaluation as well as a prognostic assessment.Beyond the assessment of pulmonary pressures, the echocardiographical examination allows theevaluation of right ventricular adaptation to elevated afterload. Numbers of variables are com-monly used in the assessment of the pulmonary hypertension patient in order to detect changesin right heart geometry, right-to-left interaction and right ventricular dysfunction. Whereas anisolated change in one echocardiographical variable is not meaningful, multiple echocardio-graphical variable modifications together provide accurate information. In this review, we willlink pulmonary hypertension pathophysiological changes with echocardiographical indices and
describe the clinical implications of echocardiographical findings.© 2014 Elsevier Masson SAS. All rights reserved.Abbreviations: 2D, Two-dimensional; 3D, Three-dimensional; dPAP, Diastolic pulmonary artery pressure; IVA, Isovolumic acceleration;IVCc, Isovolumic contraction velocity; LV, Left ventricle/ventricular; LVOT, Left ventricular outflow tract; mPAP, Mean pulmonary arterypressure; MPI, Myocardial performance index; PA, Pulmonary artery; PAH, Pulmonary arterial hypertension; PAP, Pulmonary artery pressure;PR, Pulmonary regurgitation; RA, Right atrium/atrial; RAP, Right arterial pressure; RV, Right ventricle/ventricular; sPAP, Systolic pulmonaryartery pressure; TAPSE, Tricuspid annular plane systolic excursion; TR, Tricuspid regurgitation; VTI, Velocity-time integral.
∗ Corresponding author.E-mail address: [email protected] (P. Moceri).
http://dx.doi.org/10.1016/j.acvd.2014.02.0051875-2136/© 2014 Elsevier Masson SAS. All rights reserved.
262 P. Moceri et al.
MOTS CLÉSHypertensionpulmonaire ;Échocardiographie ;Pronostic
Résumé L’imagerie cardiaque multi-modalité est indispensable à l’évaluation diagnostique etpronostique des patients atteints d’hypertension pulmonaire. Bien plus que la mesure des pres-sions pulmonaires, l’échocardiographie permet l’évaluation de la fonction ventriculaire droitetraduisant l’adaptation du cœur droit à l’élévation des résistances pulmonaires. Alors que lamodification isolée d’une variable échographique n’est que peu informative, celle de plusieursparamètres échographiques est plus souvent pertinente. Dans cette revue, nous décrivonsles modifications physiopathologiques du cœur droit et du couple VD-AP dans l’hypertensionpulmonaire par l’approche échographique et soulignons l’intérêt clinique de ces différentsparamètres échocardiographiques.© 2014 Elsevier Masson SAS. Tous droits réservés.
B
Pptprpropdi
tofcasi
Raphetshw
drph
R
ackground
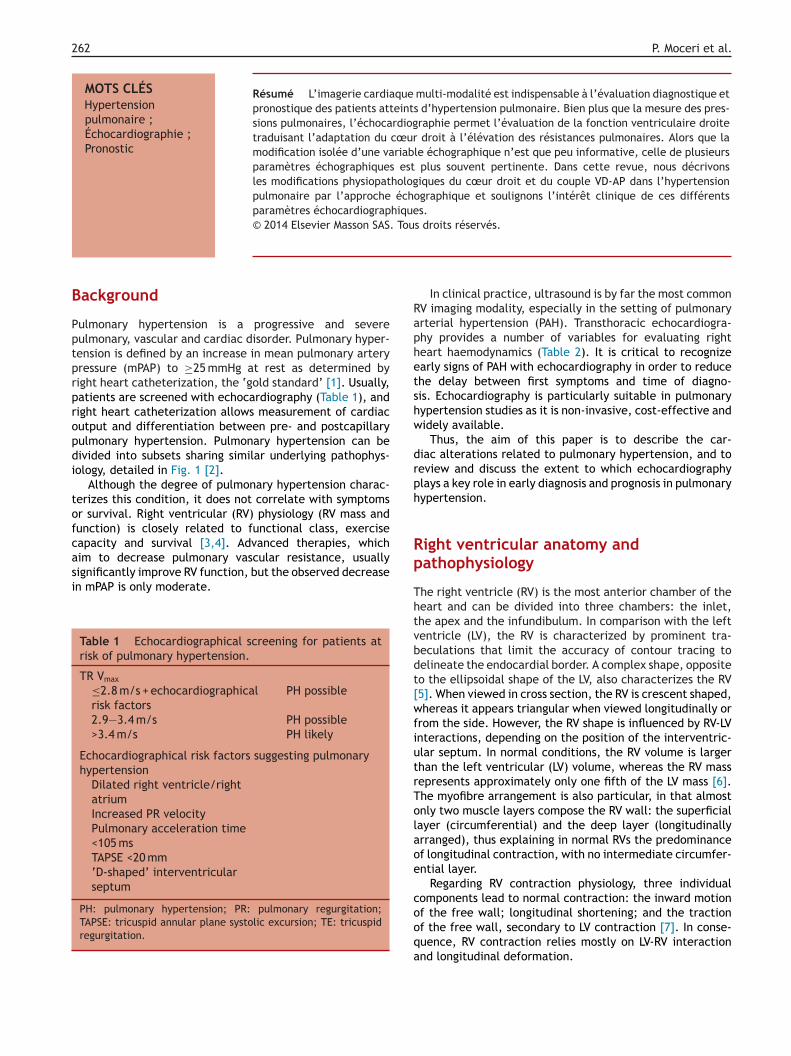
ulmonary hypertension is a progressive and severeulmonary, vascular and cardiac disorder. Pulmonary hyper-ension is defined by an increase in mean pulmonary arteryressure (mPAP) to ≥25 mmHg at rest as determined byight heart catheterization, the ‘gold standard’ [1]. Usually,atients are screened with echocardiography (Table 1), andight heart catheterization allows measurement of cardiacutput and differentiation between pre- and postcapillaryulmonary hypertension. Pulmonary hypertension can beivided into subsets sharing similar underlying pathophys-ology, detailed in Fig. 1 [2].
Although the degree of pulmonary hypertension charac-erizes this condition, it does not correlate with symptomsr survival. Right ventricular (RV) physiology (RV mass andunction) is closely related to functional class, exerciseapacity and survival [3,4]. Advanced therapies, which
im to decrease pulmonary vascular resistance, usuallyignificantly improve RV function, but the observed decreasen mPAP is only moderate.Table 1 Echocardiographical screening for patients atrisk of pulmonary hypertension.
TR Vmax
≤2.8 m/s + echocardiographicalrisk factors
PH possible
2.9—3.4 m/s PH possible>3.4 m/s PH likely
Echocardiographical risk factors suggesting pulmonaryhypertension
Dilated right ventricle/rightatriumIncreased PR velocityPulmonary acceleration time<105 msTAPSE <20 mm‘D-shaped’ interventricularseptum
PH: pulmonary hypertension; PR: pulmonary regurgitation;TAPSE: tricuspid annular plane systolic excursion; TE: tricuspidregurgitation.
p
Thtvbdt[wfiutrTolaoe
cooqa
In clinical practice, ultrasound is by far the most commonV imaging modality, especially in the setting of pulmonaryrterial hypertension (PAH). Transthoracic echocardiogra-hy provides a number of variables for evaluating righteart haemodynamics (Table 2). It is critical to recognizearly signs of PAH with echocardiography in order to reducehe delay between first symptoms and time of diagno-is. Echocardiography is particularly suitable in pulmonaryypertension studies as it is non-invasive, cost-effective andidely available.
Thus, the aim of this paper is to describe the car-iac alterations related to pulmonary hypertension, and toeview and discuss the extent to which echocardiographylays a key role in early diagnosis and prognosis in pulmonaryypertension.
ight ventricular anatomy andathophysiology
he right ventricle (RV) is the most anterior chamber of theeart and can be divided into three chambers: the inlet,he apex and the infundibulum. In comparison with the leftentricle (LV), the RV is characterized by prominent tra-eculations that limit the accuracy of contour tracing toelineate the endocardial border. A complex shape, oppositeo the ellipsoidal shape of the LV, also characterizes the RV5]. When viewed in cross section, the RV is crescent shaped,hereas it appears triangular when viewed longitudinally or
rom the side. However, the RV shape is influenced by RV-LVnteractions, depending on the position of the interventric-lar septum. In normal conditions, the RV volume is largerhan the left ventricular (LV) volume, whereas the RV massepresents approximately only one fifth of the LV mass [6].he myofibre arrangement is also particular, in that almostnly two muscle layers compose the RV wall: the superficialayer (circumferential) and the deep layer (longitudinallyrranged), thus explaining in normal RVs the predominancef longitudinal contraction, with no intermediate circumfer-ntial layer.
Regarding RV contraction physiology, three individualomponents lead to normal contraction: the inward motion
f the free wall; longitudinal shortening; and the tractionf the free wall, secondary to LV contraction [7]. In conse-uence, RV contraction relies mostly on LV-RV interactionnd longitudinal deformation.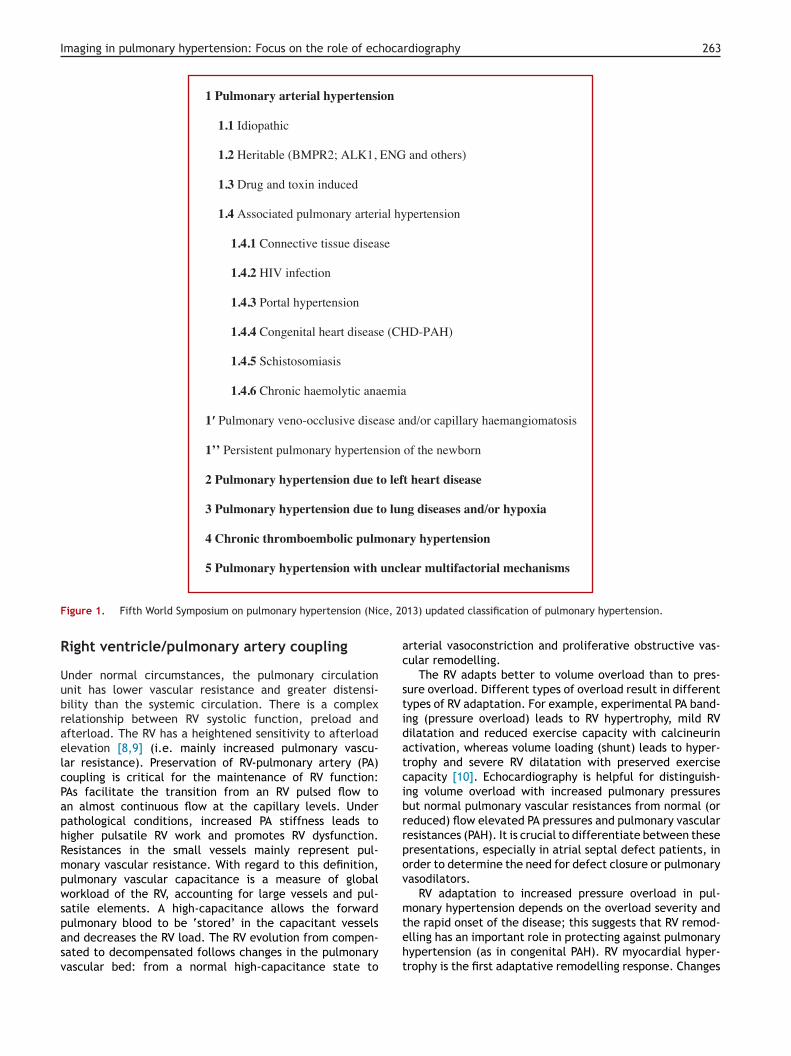
Imaging in pulmonary hypertension: Focus on the role of echocardiography 263
1 Pulmonary arterial hypertension
1.1 Idiopathic
1.2 Heritable (BMPR2; ALK1, ENG and others)
1.3 Drug and toxin induced
1.4 Associated pulmonary arterial hypertension
1.4.1 Connective tissue disease
1.4.2 HIV infection
1.4.3 Portal hypertension
1.4.4 Congenital heart disease (CHD-PAH)
1.4.5 Schistosomiasis
1.4.6 Chronic haemolytic anaemia
1 Pulmonary veno-occlusive disease and/or capillary haemangiomatosis
1’’ Persistent pulmonary hypertension of the newborn
2 Pulmonary hypertension due to left heart disease
3 Pulmonary hypertension due to lung diseases and/or hypoxia
4 Chronic thromboembolic pulmonary hypertension
5 Pulmonary hypertension with unclear multifactorial mechanisms
e, 20
ac
stidatcibrrpov
m
Figure 1. Fifth World Symposium on pulmonary hypertension (Nic
Right ventricle/pulmonary artery coupling
Under normal circumstances, the pulmonary circulationunit has lower vascular resistance and greater distensi-bility than the systemic circulation. There is a complexrelationship between RV systolic function, preload andafterload. The RV has a heightened sensitivity to afterloadelevation [8,9] (i.e. mainly increased pulmonary vascu-lar resistance). Preservation of RV-pulmonary artery (PA)coupling is critical for the maintenance of RV function:PAs facilitate the transition from an RV pulsed flow toan almost continuous flow at the capillary levels. Underpathological conditions, increased PA stiffness leads tohigher pulsatile RV work and promotes RV dysfunction.Resistances in the small vessels mainly represent pul-monary vascular resistance. With regard to this definition,pulmonary vascular capacitance is a measure of globalworkload of the RV, accounting for large vessels and pul-satile elements. A high-capacitance allows the forward
pulmonary blood to be ‘stored’ in the capacitant vesselsand decreases the RV load. The RV evolution from compen-sated to decompensated follows changes in the pulmonaryvascular bed: from a normal high-capacitance state toteht
13) updated classification of pulmonary hypertension.
rterial vasoconstriction and proliferative obstructive vas-ular remodelling.
The RV adapts better to volume overload than to pres-ure overload. Different types of overload result in differentypes of RV adaptation. For example, experimental PA band-ng (pressure overload) leads to RV hypertrophy, mild RVilatation and reduced exercise capacity with calcineurinctivation, whereas volume loading (shunt) leads to hyper-rophy and severe RV dilatation with preserved exerciseapacity [10]. Echocardiography is helpful for distinguish-ng volume overload with increased pulmonary pressuresut normal pulmonary vascular resistances from normal (oreduced) flow elevated PA pressures and pulmonary vascularesistances (PAH). It is crucial to differentiate between theseresentations, especially in atrial septal defect patients, inrder to determine the need for defect closure or pulmonaryasodilators.
RV adaptation to increased pressure overload in pul-onary hypertension depends on the overload severity and
he rapid onset of the disease; this suggests that RV remod-lling has an important role in protecting against pulmonaryypertension (as in congenital PAH). RV myocardial hyper-rophy is the first adaptative remodelling response. Changes
264 P. Moceri et al.
Table 2 Most validated and useful variables in the routine evaluation of pulmonary hypertension patients.
Clinical situation Echocardiographical variables Clinical relevance
Diagnosis TR Vmax RV-RAgradient—estimation ofsPAP (4 × Vmax
2 + RAP)
Vmax > 2.8 m/ssPAP > 35 mmHg
PR Vmax mPAP = 4 × Vmax2 + RAP mPAP ≥ 25 mmHg
Telediastolic PR velocity dPAP = 4 × velocity2 + RAP sPAP = 3 mPAP—2 dPAPPulmonary acceleration time <93 msTAPSE Systolic dysfunction <18 mmS’ Predictor of
sPAP > 40 mmHg<12 cm/s
RV diameter (D1) >40—42 mm3D RV end-diastolic volume >89 mL/m2
RV wall thickness RA pressure >5 mmRA area >18 cm2
IVC diameter and compliance >21 mm
Aetiological approach Intra- or extracardiac shunt Contrast TTE sometimesuseful (TOE if necessary)
Congenital PAH
TR Vmax/pulmonary VTI Increased pulmonaryvascular resistance
>0.2
E/E’m LV filling pressures >10 (group 2 patients)PA thrombosis Group 4 patients? (or
pulmonary hypertensioncomplicated by PAthrombosis)
Prognosis TAPSE <16 mmS’ <10 cm/sRV fractional area change <35%Peak longitudinal RV strain ≥19%IVCv <9 cm/sTei index (PW) >0.4Main PA diameter >29 mmLV eccentricity index >1.4Pericardial effusion Presence
Follow-up RV diameter Improves with advancedtherapy
RV fractional area changeTei indexMitral E/A and E/E’
IVC: inferior vena cava; IVCv: isovolumetric contraction velocity; LV: left ventricle; mPAP: mean pulmonary artery pressure; PA: pul-monary artery; PAH: pulmonary arterial hypertension; PAP: pulmonary artery pressure; PR: pulmonary regurgitation; PW: pulsed-wave;RA: right atrial; RAP: right atrial pressure; RV: right ventricle; sPAP: systolic pulmonary artery pressure; TAPSE: tricuspid annular planesystolic excursion; TOE: transoesophageal echocardiography; TTE: transthoracic echocardiography; TR; tricuspid regurgitation.
itdtttdaRfiTt
fd
A
Sm
n sarcomeric protein expression and renin-angiotensin sys-em activation promote RV myocardial ischaemia, whereasilatation occurs subsequently. The increased preload ini-ially compensates for the reduced contractility, to maintainhe stroke volume. The RV becomes more spherical due tohe increased RV volume, compressing the LV and causingiastolic dysfunction. With chronic pressure overload, righttrial (RA) contractility and distensibility increase [11] until
A pressure increases. Progressively, as the RV dilates, thelling pressures increase, leading ultimately to RV failure.he intensity of the neurohormonal activation contributeso RV adverse remodelling and failure. The presence ofTcae
unctional tricuspid regurgitation (TR), caused by RV/RAilatation, also contributes to the reduced cardiac output.
ssessment of pulmonary artery pressures
tandard Doppler echocardiography provides a reliable esti-ation of PAP: in the absence of pulmonary flow obstruction,
R peak velocity and pulmonary valve acceleration time areorrelated with systolic PAP (sPAP) and mPAP, respectively, asssessed by right heart catheterization. sPAP is consideredqual to RV systolic pressure in the absence of pulmonary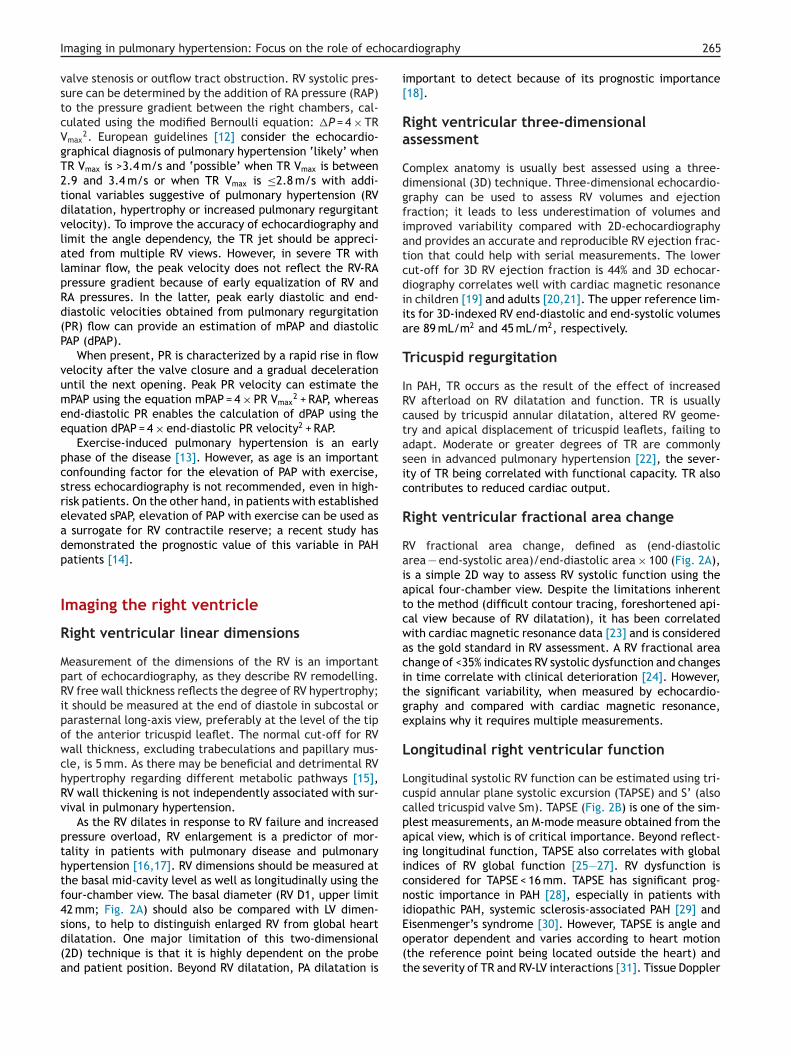
oca
i[
Ra
Cdgfiatcdiia
T
IRctasic
R
Raiatcwacitge
L
Lccpaiicni
Imaging in pulmonary hypertension: Focus on the role of ech
valve stenosis or outflow tract obstruction. RV systolic pres-sure can be determined by the addition of RA pressure (RAP)to the pressure gradient between the right chambers, cal-culated using the modified Bernoulli equation: �P = 4 × TRVmax
2. European guidelines [12] consider the echocardio-graphical diagnosis of pulmonary hypertension ‘likely’ whenTR Vmax is >3.4 m/s and ‘possible’ when TR Vmax is between2.9 and 3.4 m/s or when TR Vmax is ≤2.8 m/s with addi-tional variables suggestive of pulmonary hypertension (RVdilatation, hypertrophy or increased pulmonary regurgitantvelocity). To improve the accuracy of echocardiography andlimit the angle dependency, the TR jet should be appreci-ated from multiple RV views. However, in severe TR withlaminar flow, the peak velocity does not reflect the RV-RApressure gradient because of early equalization of RV andRA pressures. In the latter, peak early diastolic and end-diastolic velocities obtained from pulmonary regurgitation(PR) flow can provide an estimation of mPAP and diastolicPAP (dPAP).
When present, PR is characterized by a rapid rise in flowvelocity after the valve closure and a gradual decelerationuntil the next opening. Peak PR velocity can estimate themPAP using the equation mPAP = 4 × PR Vmax
2 + RAP, whereasend-diastolic PR enables the calculation of dPAP using theequation dPAP = 4 × end-diastolic PR velocity2 + RAP.
Exercise-induced pulmonary hypertension is an earlyphase of the disease [13]. However, as age is an importantconfounding factor for the elevation of PAP with exercise,stress echocardiography is not recommended, even in high-risk patients. On the other hand, in patients with establishedelevated sPAP, elevation of PAP with exercise can be used asa surrogate for RV contractile reserve; a recent study hasdemonstrated the prognostic value of this variable in PAHpatients [14].
Imaging the right ventricle
Right ventricular linear dimensions
Measurement of the dimensions of the RV is an importantpart of echocardiography, as they describe RV remodelling.RV free wall thickness reflects the degree of RV hypertrophy;it should be measured at the end of diastole in subcostal orparasternal long-axis view, preferably at the level of the tipof the anterior tricuspid leaflet. The normal cut-off for RVwall thickness, excluding trabeculations and papillary mus-cle, is 5 mm. As there may be beneficial and detrimental RVhypertrophy regarding different metabolic pathways [15],RV wall thickening is not independently associated with sur-vival in pulmonary hypertension.
As the RV dilates in response to RV failure and increasedpressure overload, RV enlargement is a predictor of mor-tality in patients with pulmonary disease and pulmonaryhypertension [16,17]. RV dimensions should be measured atthe basal mid-cavity level as well as longitudinally using thefour-chamber view. The basal diameter (RV D1, upper limit42 mm; Fig. 2A) should also be compared with LV dimen-
sions, to help to distinguish enlarged RV from global heartdilatation. One major limitation of this two-dimensional(2D) technique is that it is highly dependent on the probeand patient position. Beyond RV dilatation, PA dilatation isEo(t
rdiography 265
mportant to detect because of its prognostic importance18].
ight ventricular three-dimensionalssessment
omplex anatomy is usually best assessed using a three-imensional (3D) technique. Three-dimensional echocardio-raphy can be used to assess RV volumes and ejectionraction; it leads to less underestimation of volumes andmproved variability compared with 2D-echocardiographynd provides an accurate and reproducible RV ejection frac-ion that could help with serial measurements. The lowerut-off for 3D RV ejection fraction is 44% and 3D echocar-iography correlates well with cardiac magnetic resonancen children [19] and adults [20,21]. The upper reference lim-ts for 3D-indexed RV end-diastolic and end-systolic volumesre 89 mL/m2 and 45 mL/m2, respectively.
ricuspid regurgitation
n PAH, TR occurs as the result of the effect of increasedV afterload on RV dilatation and function. TR is usuallyaused by tricuspid annular dilatation, altered RV geome-ry and apical displacement of tricuspid leaflets, failing todapt. Moderate or greater degrees of TR are commonlyeen in advanced pulmonary hypertension [22], the sever-ty of TR being correlated with functional capacity. TR alsoontributes to reduced cardiac output.
ight ventricular fractional area change
V fractional area change, defined as (end-diastolicrea — end-systolic area)/end-diastolic area × 100 (Fig. 2A),s a simple 2D way to assess RV systolic function using thepical four-chamber view. Despite the limitations inherento the method (difficult contour tracing, foreshortened api-al view because of RV dilatation), it has been correlatedith cardiac magnetic resonance data [23] and is considereds the gold standard in RV assessment. A RV fractional areahange of <35% indicates RV systolic dysfunction and changesn time correlate with clinical deterioration [24]. However,he significant variability, when measured by echocardio-raphy and compared with cardiac magnetic resonance,xplains why it requires multiple measurements.
ongitudinal right ventricular function
ongitudinal systolic RV function can be estimated using tri-uspid annular plane systolic excursion (TAPSE) and S’ (alsoalled tricuspid valve Sm). TAPSE (Fig. 2B) is one of the sim-lest measurements, an M-mode measure obtained from thepical view, which is of critical importance. Beyond reflect-ng longitudinal function, TAPSE also correlates with globalndices of RV global function [25—27]. RV dysfunction isonsidered for TAPSE < 16 mm. TAPSE has significant prog-ostic importance in PAH [28], especially in patients withdiopathic PAH, systemic sclerosis-associated PAH [29] and
isenmenger’s syndrome [30]. However, TAPSE is angle andperator dependent and varies according to heart motionthe reference point being located outside the heart) andhe severity of TR and RV-LV interactions [31]. Tissue Doppler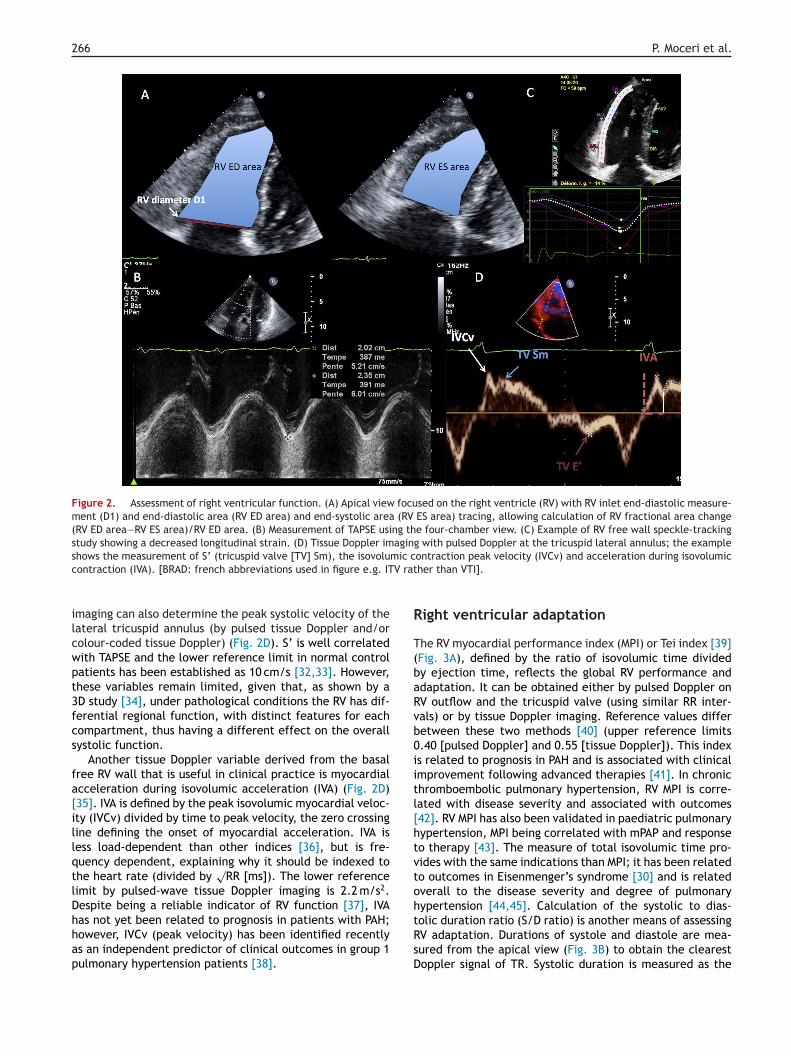
266 P. Moceri et al.
Figure 2. Assessment of right ventricular function. (A) Apical view focused on the right ventricle (RV) with RV inlet end-diastolic measure-ment (D1) and end-diastolic area (RV ED area) and end-systolic area (RV ES area) tracing, allowing calculation of RV fractional area change(RV ED area—RV ES area)/RV ED area. (B) Measurement of TAPSE using the four-chamber view. (C) Example of RV free wall speckle-trackingstudy showing a decreased longitudinal strain. (D) Tissue Doppler imaging with pulsed Doppler at the tricuspid lateral annulus; the exampleshows the measurement of S’ (tricuspid valve [TV] Sm), the isovolumic contraction peak velocity (IVCv) and acceleration during isovolumicc V rat
ilcwpt3fcs
fa[illqtlDhhap
R
T(baRvb0iitl[htvtoh
ontraction (IVA). [BRAD: french abbreviations used in figure e.g. IT
maging can also determine the peak systolic velocity of theateral tricuspid annulus (by pulsed tissue Doppler and/orolour-coded tissue Doppler) (Fig. 2D). S’ is well correlatedith TAPSE and the lower reference limit in normal controlatients has been established as 10 cm/s [32,33]. However,hese variables remain limited, given that, as shown by aD study [34], under pathological conditions the RV has dif-erential regional function, with distinct features for eachompartment, thus having a different effect on the overallystolic function.
Another tissue Doppler variable derived from the basalree RV wall that is useful in clinical practice is myocardialcceleration during isovolumic acceleration (IVA) (Fig. 2D)35]. IVA is defined by the peak isovolumic myocardial veloc-ty (IVCv) divided by time to peak velocity, the zero crossingine defining the onset of myocardial acceleration. IVA isess load-dependent than other indices [36], but is fre-uency dependent, explaining why it should be indexed tohe heart rate (divided by
√RR [ms]). The lower reference
imit by pulsed-wave tissue Doppler imaging is 2.2 m/s2.espite being a reliable indicator of RV function [37], IVA
as not yet been related to prognosis in patients with PAH;owever, IVCv (peak velocity) has been identified recentlys an independent predictor of clinical outcomes in group 1ulmonary hypertension patients [38].tRsD
her than VTI].
ight ventricular adaptation
he RV myocardial performance index (MPI) or Tei index [39]Fig. 3A), defined by the ratio of isovolumic time dividedy ejection time, reflects the global RV performance anddaptation. It can be obtained either by pulsed Doppler onV outflow and the tricuspid valve (using similar RR inter-als) or by tissue Doppler imaging. Reference values differetween these two methods [40] (upper reference limits.40 [pulsed Doppler] and 0.55 [tissue Doppler]). This indexs related to prognosis in PAH and is associated with clinicalmprovement following advanced therapies [41]. In chronichromboembolic pulmonary hypertension, RV MPI is corre-ated with disease severity and associated with outcomes42]. RV MPI has also been validated in paediatric pulmonaryypertension, MPI being correlated with mPAP and responseo therapy [43]. The measure of total isovolumic time pro-ides with the same indications than MPI; it has been relatedo outcomes in Eisenmenger’s syndrome [30] and is relatedverall to the disease severity and degree of pulmonaryypertension [44,45]. Calculation of the systolic to dias-
olic duration ratio (S/D ratio) is another means of assessingV adaptation. Durations of systole and diastole are mea-ured from the apical view (Fig. 3B) to obtain the clearestoppler signal of TR. Systolic duration is measured as the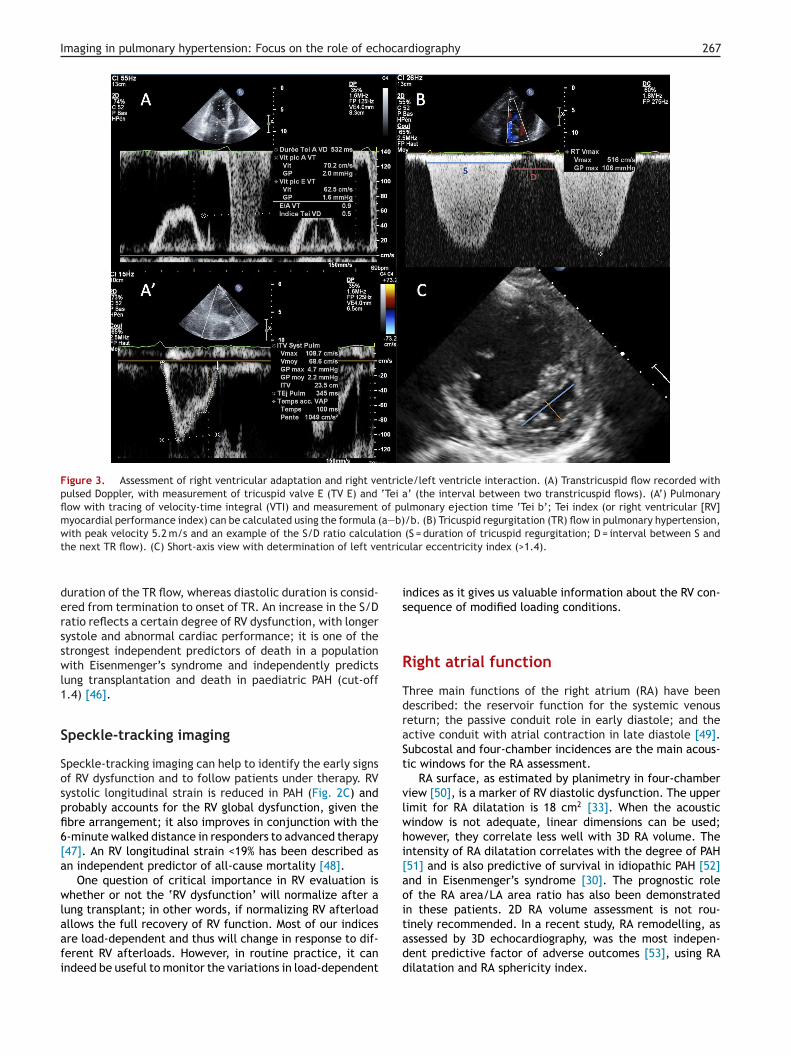
Imaging in pulmonary hypertension: Focus on the role of echocardiography 267
Figure 3. Assessment of right ventricular adaptation and right ventricle/left ventricle interaction. (A) Transtricuspid flow recorded withpulsed Doppler, with measurement of tricuspid valve E (TV E) and ‘Tei a’ (the interval between two transtricuspid flows). (A’) Pulmonaryflow with tracing of velocity-time integral (VTI) and measurement of pulmonary ejection time ‘Tei b’; Tei index (or right ventricular [RV]myocardial performance index) can be calculated using the formula (a—b)/b. (B) Tricuspid regurgitation (TR) flow in pulmonary hypertension,with peak velocity 5.2 m/s and an example of the S/D ratio calculation (S = duration of tricuspid regurgitation; D = interval between S and
ntric
is
R
TdraSt
vlwhi[aoi
the next TR flow). (C) Short-axis view with determination of left ve
duration of the TR flow, whereas diastolic duration is consid-ered from termination to onset of TR. An increase in the S/Dratio reflects a certain degree of RV dysfunction, with longersystole and abnormal cardiac performance; it is one of thestrongest independent predictors of death in a populationwith Eisenmenger’s syndrome and independently predictslung transplantation and death in paediatric PAH (cut-off1.4) [46].
Speckle-tracking imaging
Speckle-tracking imaging can help to identify the early signsof RV dysfunction and to follow patients under therapy. RVsystolic longitudinal strain is reduced in PAH (Fig. 2C) andprobably accounts for the RV global dysfunction, given thefibre arrangement; it also improves in conjunction with the6-minute walked distance in responders to advanced therapy[47]. An RV longitudinal strain <19% has been described asan independent predictor of all-cause mortality [48].
One question of critical importance in RV evaluation iswhether or not the ‘RV dysfunction’ will normalize after alung transplant; in other words, if normalizing RV afterload
allows the full recovery of RV function. Most of our indicesare load-dependent and thus will change in response to dif-ferent RV afterloads. However, in routine practice, it canindeed be useful to monitor the variations in load-dependenttadd
ular eccentricity index (>1.4).
ndices as it gives us valuable information about the RV con-equence of modified loading conditions.
ight atrial function
hree main functions of the right atrium (RA) have beenescribed: the reservoir function for the systemic venouseturn; the passive conduit role in early diastole; and thective conduit with atrial contraction in late diastole [49].ubcostal and four-chamber incidences are the main acous-ic windows for the RA assessment.
RA surface, as estimated by planimetry in four-chamberiew [50], is a marker of RV diastolic dysfunction. The upperimit for RA dilatation is 18 cm2 [33]. When the acousticindow is not adequate, linear dimensions can be used;owever, they correlate less well with 3D RA volume. Thentensity of RA dilatation correlates with the degree of PAH51] and is also predictive of survival in idiopathic PAH [52]nd in Eisenmenger’s syndrome [30]. The prognostic rolef the RA area/LA area ratio has also been demonstratedn these patients. 2D RA volume assessment is not rou-
inely recommended. In a recent study, RA remodelling, asssessed by 3D echocardiography, was the most indepen-ent predictive factor of adverse outcomes [53], using RAilatation and RA sphericity index.
2
emTRcwr1bIis
L
Dp
AuiPrptp
R
AssbltrntfTiiitAc
aogirPs
P
Po
rg(h((aftp
a(ddiacigecac
Teh
Gric‘tttrardtEhfiip
ioiim
bp
68
RAP can be estimated by echocardiography and reflectslevated RV filling pressures. RAP is most commonly esti-ated by IVC diameter and collapsibility during a sniff test.he assessment is quite easy in patients with low or elevatedA pressure. When IVC diameter is <2.1 cm with inspiratoryollapse >50%, it suggests a normal RA pressure of 3 mmHg,hereas when the IVC diameter is >2.1 cm with an inspi-
atory collapse <50%, it suggests a elevated RA pressure of5 mmHg. In intermediate cases, a value of 8 mmHg maye determined, but the use of other indices is preferable.ndices of elevated RA pressure are: restrictive tricuspid fill-ng pattern; tricuspid E/E’ ratio >6 [54]; and hepatic veinystolic filling fraction <55%.
eft ventricular assessment
ifferentiating pre- from postcapillaryulmonary hypertension
s described in multiple studies, echocardiography can besed to detect elevated LV filling pressures, distinguish-ng PAH from pulmonary venous hypertension. Typically,AH patients present a mitral inflow typical of impairedelaxation [55] and E/E’<10, suggesting normal LV fillingressures, with a compressed and underfilled LV [56]. In con-rast, group 2 pulmonary hypertension patients will usuallyresent with an elevated E/E’ ratio.
ight ventricle/left ventricle relationship
s the RV pressure overload progresses, the interventriculareptum shifts to the left, compressing the LV. The normalhort-axis view becomes distorted and the left ventricleecomes ‘D-shaped’ with a flattening ventricular septum,eading to diastolic dysfunction. This can be quantified byhe eccentricity index (Fig. 3C) (ratio of the LV anteroposte-ior and septolateral dimensions), the value of which underormal conditions is 1. The timing of the septal shift can helpo distinguish RV volume overload (end-diastolic shift only)rom pressure overload (predominant end-systolic shift).his index is a strong predictor of outcomes in PAH [52] and
mproves with advanced therapies [57]. Speckle-trackingmaging could provide further insights into LV mechanicsn PAH and recent studies have indicated that abnormal LVorsion and circumferential strain are present in PAH [58].
significant relationship between decreased LV strain andlinical outcomes has also been observed [59].
Cardiac output is also of prognostic importance. Theortic output can be measured using this formula: � × LVutflow tract (LVOT) diameter2/4 × LVOT velocity-time inte-ral (VTI) × heart rate. This estimation correlates withnvasive cardiac output, but remains relatively inaccu-ate (heart rhythm variability, abnormal shape of LVOT).ulmonary VTI < 12 cm, TAPSE < 18 mm and S’ < 10 cm/s areimple but useful predictors of low cardiac output [28].
ulmonary artery function
ulmonary vascular resistance is a strong predictor ofutcomes in pulmonary hypertension; it accounts for the
wham
P. Moceri et al.
esistance in small vessels. Estimation with echocardio-raphy remains controversial: dividing TR velocity peakm/s) by pulmonary VTI (cm) allows differentiation betweenigh PAP related to high pulmonary vascular resistanceratio ≥0.2) or to increased pulmonary blood flow (<0.2)e.g.in atrial septal defect patients) [60]. However, a reli-ble estimation of pulmonary vascular resistance using aormula that includes this ratio (pulmonary vascular resis-ance = TR Vmax/VTI × 10 + 0.16) is not valid in patients withulmonary vascular resistance >8 Wood units.
Pulmonary vascular capacitance (accounting for mediumnd large vessels), as assessed by echocardiographystroke volume divided by pulmonary pulse pressure: [LVOTiameter2 × �/4 × subaortic VTI]/[4 × ([peak TR]2—[end-iastolic PR]2)]), is an independent predictor of outcomesn a cohort of adults with PAH [61]. Estimation of PA compli-nce, to determine the pulsatile nature of the PA flow,an be obtained using colour M-mode tissue Doppler imag-ng on the right PA (to measure diameters) and peak TRradient (compliance [dyne] = [PA systolic—diastolic diam-ter]/[diastolic diameter × systolic pressure] × 104) andorrelates well with invasive measurement of compli-nce [62] in children, normal compliance being >40%hange/100 mmHg.
he future of right ventricularchocardiography in pulmonaryypertension
iven its safety and technical progress, it is likely that theole of echocardiography in the management of PAH willncrease in the future. However, in RV assessment, espe-ially in PAH, one test should never be considered as astand alone’ test. The multivariable approach should behe rule, combining different echocardiographical variableso obtain an ‘RV performance score’ or even combininghe results of different examinations (e.g. echocardiog-aphy and right heart catheterization). The multivariablepproach has its place in diagnosis, an echocardiographicalule accurately defining pulmonary hypertension haemo-ynamics [63], as well as in prognosis, a score built onhe strongest echocardiographical predictors of outcomes inisenmenger’s syndrome allowing the identification of veryigh-risk patients. Current prognosis equations would bene-t from the incorporation of echocardiographical variables;
t would improve their predictive power and help to identifyatients who would benefit from further specific therapies.
Screening patients for possible pulmonary hypertensions an important step towards early diagnosis and treatmentf PAH. Research into early markers of diagnosis is of crit-cal importance. In this setting, exercise echocardiographyn conjunction with recent echocardiographical techniquesight allow important progress.In the near future, 3D and speckle-tracking imaging will
e part of the routine assessment of PAH patients, with sim-le technology becoming more accessible; these techniques
ill allow us to gain insight into RV mechanics in pulmonaryypertension. 3D RV volumes can be obtained directly by 3Dcquisition with a specific probe or, more recently, by 3Dodelling adapted from 2D acquisition (knowledge-based
oca
[
[
[
[
[
[
[
[
[
[
[
[
[
Imaging in pulmonary hypertension: Focus on the role of ech
reconstruction) [64]. However, further larger studies areneeded if this new technique is to be included as part ofour daily clinical practice.
Efforts are being made in echocardiography laboratoriesto maintain the best quality of routine evaluation exami-nations as well as to homogenize PAH echocardiographicalexaminations according to American Society of Echocar-diography/European Association of Cardiovascular Imagingguidelines. This will allow regular and accurate follow-upof our patients and prognostic information will come, notjust from one examination, but also from the evolutionof echocardiographical variables. Several studies suggestthat RV dimensions, fractional area change [25], MPI andLV filling [57] improve over the time with advanced ther-apy. In PAH, stable or improved RV ejection fraction onserial assessment is associated with low mortality in patientsreceiving advanced therapy [65]. As such, echocardiographyis a method of choice for serial assessment of pulmonaryhypertension patients. Furthermore, the load-dependencyof our RV function indices becomes an asset, allowing usto monitor with serial examinations RV function evolutionrelated to afterload changes.
Conclusion
Echocardiography is a widely available, cost-effective, safeand reliable examination, which provides us with majordiagnostic and prognostic information. Comparison of serialassessments allows monitoring of the efficacy of advancedtherapies. More recent ultrasound techniques, such as 3Dechocardiography and speckle-tracking, are promising; theymay provide additional data regarding RV and PA mechan-ics in pulmonary hypertension and may allow the preclinicaldetection of high-risk patients.
Disclosure of interest
The authors declare that they have no conflicts of interestconcerning this article.
References
[1] Hoeper MM, Bogaard HJ, Condliffe R, et al. Definitionsand diagnosis of pulmonary hypertension. J Am Coll Cardiol2013;62:D42—50.
[2] Simonneau G, Gatzoulis MA, Adatia I, et al. Updated clinicalclassification of pulmonary hypertension. J Am Coll Cardiol2013;62:D34—41.
[3] Benza RL, Miller DP, Gomberg-Maitland M, et al. Predictingsurvival in pulmonary arterial hypertension: insights from theRegistry to Evaluate Early and Long-Term Pulmonary Arte-rial Hypertension Disease Management (REVEAL). Circulation2010;122:164—72.
[4] D’Alonzo GE, Barst RJ, Ayres SM, et al. Survival in patientswith primary pulmonary hypertension. Results from a nationalprospective registry. Ann Intern Med 1991;115:343—9.
[5] Ho SY, Nihoyannopoulos P. Anatomy, echocardiography, and
normal right ventricular dimensions. Heart 2006;92(Suppl.1):i2—13.[6] Lorenz CH, Walker ES, Morgan VL, et al. Normal humanright and left ventricular mass, systolic function, and gender
[
rdiography 269
differences by cine magnetic resonance imaging. J CardiovascMagn Reson 1999;1:7—21.
[7] Jiang L. Principle and practice of echocardiography. In: Wey-man AE, editor. Right ventricle. Baltimore: Lippincott Williams& Wilkins; 1994. p. 901—21.
[8] Chin KM, Kim NH, Rubin LJ. The right ventricle in pulmonaryhypertension. Coron Artery Dis 2005;16:13—8.
[9] MacNee W. Pathophysiology of cor pulmonale in chronicobstructive pulmonary disease. Part one. Am J Respir Crit CareMed 1994;150:833—52.
10] Bartelds B, Borgdorff MA, Smit-van Oosten A, et al. Differ-ential responses of the right ventricle to abnormal loadingconditions in mice: pressure vs volume load. Eur J Heart Fail2011;13:1275—82.
11] Gaynor SL, Maniar HS, Bloch JB, et al. Right atrial and ventric-ular adaptation to chronic right ventricular pressure overload.Circulation 2005;112:I212—1218.
12] Galie N, Hoeper MM, Humbert M, et al. Guidelines for the diag-nosis and treatment of pulmonary hypertension: the Task Forcefor the Diagnosis and Treatment of Pulmonary Hypertension ofthe European Society of Cardiology (ESC) and the EuropeanRespiratory Society (ERS), endorsed by the International Soci-ety of Heart and Lung Transplantation (ISHLT). Eur Heart J2009;30:2493—537.
13] Alkotob ML, Soltani P, Sheatt MA, et al. Reduced exercise capac-ity and stress-induced pulmonary hypertension in patients withscleroderma. Chest 2006;130:176—81.
14] Grunig E, Tiede H, Enyimayew EO, et al. Assessment andprognostic relevance of right ventricular contractile reservein patients with severe pulmonary hypertension. Circulation2013;128:2005—15.
15] Sutendra G, Dromparis P, Paulin R, et al. A metabolic remod-eling in right ventricular hypertrophy is associated withdecreased angiogenesis and a transition from a compensatedto a decompensated state in pulmonary hypertension. J MolMed (Berl) 2013;91:1315—27.
16] Burgess MI, Mogulkoc N, Bright-Thomas RJ, et al. Comparisonof echocardiographic markers of right ventricular function indetermining prognosis in chronic pulmonary disease. J Am SocEchocardiogr 2002;15:633—9.
17] van Wolferen SA, Marcus JT, Boonstra A, et al. Prognosticvalue of right ventricular mass, volume, and function in idio-pathic pulmonary arterial hypertension. Eur Heart J 2007;28:1250—7.
18] Zylkowska J, Kurzyna M, Florczyk M, et al. Pulmonary arterydilatation correlates with the risk of unexpected death inchronic arterial or thromboembolic pulmonary hypertension.Chest 2012;142:1406—16.
19] Niemann PS, Pinho L, Balbach T, et al. Anatomically ori-ented right ventricular volume measurements with dynamicthree-dimensional echocardiography validated by 3-Teslamagnetic resonance imaging. J Am Coll Cardiol 2007;50:1668—76.
20] Jenkins C, Chan J, Bricknell K, et al. Reproducibility ofright ventricular volumes and ejection fraction using real-timethree-dimensional echocardiography: comparison with cardiacMRI. Chest 2007;131:1844—51.
21] Leibundgut G, Rohner A, Grize L, et al. Dynamic assess-ment of right ventricular volumes and function by real-timethree-dimensional echocardiography: a comparison study withmagnetic resonance imaging in 100 adult patients. J Am SocEchocardiogr 2010;23:116—26.
22] Hinderliter AL, Willis PWt, Long WA, et al. Frequency andseverity of tricuspid regurgitation determined by Dopplerechocardiography in primary pulmonary hypertension. Am J
Cardiol 2003;91:1033—7 [A9].23] Lang RM, Bierig M, Devereux RB, et al. Recommendations forchamber quantification. Eur J Echocardiogr 2006;7:79—108.
2
[
[
[
[
[
[
[
[
[
[
[
[
[
[
[
[
[
[
[
[
[
[
[
[
[
[
[
[
[
[
[
[
[
[
70
24] Mauritz GJ, Kind T, Marcus JT, et al. Progressive changes inright ventricular geometric shortening and long-term survivalin pulmonary arterial hypertension. Chest 2012;141:935—43.
25] Brown SB, Raina A, Katz D, et al. Longitudinal shorteningaccounts for the majority of right ventricular contraction andimproves after pulmonary vasodilator therapy in normal sub-jects and patients with pulmonary arterial hypertension. Chest2011;140:27—33.
26] Sato T, Tsujino I, Ohira H, et al. Validation study on the accu-racy of echocardiographic measurements of right ventricularsystolic function in pulmonary hypertension. J Am Soc Echocar-diogr 2012;25:280—6.
27] Ueti OM, Camargo EE, Ueti Ade A, et al. Assessment ofright ventricular function with Doppler echocardiographicindices derived from tricuspid annular motion: comparison withradionuclide angiography. Heart 2002;88:244—8.
28] Forfia PR, Fisher MR, Mathai SC, et al. Tricuspid annular dis-placement predicts survival in pulmonary hypertension. Am JRespir Crit Care Med 2006;174:1034—41.
29] Mathai SC, Sibley CT, Forfia PR, et al. Tricuspid annularplane systolic excursion is a robust outcome measure in sys-temic sclerosis-associated pulmonary arterial hypertension. JRheumatol 2011;38:2410—8.
30] Moceri P, Dimopoulos K, Liodakis E, et al. Echocardiographicpredictors of outcome in eisenmenger syndrome. Circulation2012;126:1461—8.
31] Lopez-Candales A, Rajagopalan N, Saxena N, et al. Rightventricular systolic function is not the sole determinant oftricuspid annular motion. Am J Cardiol 2006;98:973—7.
32] Meluzin J, Spinarova L, Bakala J, et al. Pulsed Doppler tissueimaging of the velocity of tricuspid annular systolic motion; anew, rapid, and non-invasive method of evaluating right ven-tricular systolic function. Eur Heart J 2001;22:340—8.
33] Rudski LG, Lai WW, Afilalo J, et al. Guidelines for the echocar-diographic assessment of the right heart in adults: a reportfrom the American Society of Echocardiography endorsed bythe European Association of Echocardiography, a registeredbranch of the European Society of Cardiology, and the Cana-dian Society of Echocardiography. J Am Soc Echocardiogr2010;23:685—713 [quiz 86—8].
34] Calcutteea A, Chung R, Lindqvist P, et al. Differentialright ventricular regional function and the effect of pul-monary hypertension: three-dimensional echo study. Heart2011;97:1004—11.
35] Vogel M, Schmidt MR, Kristiansen SB, et al. Validation ofmyocardial acceleration during isovolumic contraction as anovel non-invasive index of right ventricular contractility: com-parison with ventricular pressure-volume relations in an animalmodel. Circulation 2002;105:1693—9.
36] Kjaergaard J, Snyder EM, Hassager C, et al. Impact of preloadand afterload on global and regional right ventricular functionand pressure: a quantitative echocardiography study. J Am SocEchocardiogr 2006;19:515—21.
37] Yang T, Liang Y, Zhang Y, et al. Echocardiographic parametersin patients with pulmonary arterial hypertension: correla-tions with right ventricular ejection fraction derived fromcardiac magnetic resonance and hemodynamics. PLoS One2013;8:e71276.
38] Ernande L, Cottin V, Leroux PY, et al. Right isovolumic contrac-tion velocity predicts survival in pulmonary hypertension. J AmSoc Echocardiogr 2013;26:297—306.
39] Tei C, Dujardin KS, Hodge DO, et al. Doppler echocardiographicindex for assessment of global right ventricular function. J AmSoc Echocardiogr 1996;9:838—47.
40] Rojo EC, Rodrigo JL, Perez de Isla L, et al. Disagreement
between tissue Doppler imaging and conventional pulsed-waveDoppler in the measurement of myocardial performance index.Eur J Echocardiogr 2006;7:356—64.[
P. Moceri et al.
41] Sebbag I, Rudski LG, Therrien J, et al. Effect of chronic infusionof epoprostenol on echocardiographic right ventricular myocar-dial performance index and its relation to clinical outcome inpatients with primary pulmonary hypertension. Am J Cardiol2001;88:1060—3.
42] Blanchard DG, Malouf PJ, Gurudevan SV, et al. Utility of rightventricular Tei index in the non-invasive evaluation of chronicthromboembolic pulmonary hypertension before and afterpulmonary thromboendarterectomy. JACC Cardiovasc Imaging2009;2:143—9.
43] Dyer KL, Pauliks LB, Das B, et al. Use of myocardial perfor-mance index in pediatric patients with idiopathic pulmonaryarterial hypertension. J Am Soc Echocardiogr 2006;19:21—7.
44] Lindqvist P, Waldenstrom A, Wikstrom G, et al. Right ven-tricular myocardial isovolumic relaxation time and pulmonarypressure. Clin Physiol Funct Imaging 2006;26:1—8.
45] Mauritz GJ, Marcus JT, Westerhof N, et al. Prolonged right ven-tricular post-systolic isovolumic period in pulmonary arterialhypertension is not a reflection of diastolic dysfunction. Heart2011;97:473—8.
46] Alkon J, Humpl T, Manlhiot C, et al. Usefulness of the rightventricular systolic to diastolic duration ratio to predict func-tional capacity and survival in children with pulmonary arterialhypertension. Am J Cardiol 2010;106:430—6.
47] Fukuda Y, Tanaka H, Sugiyama D, et al. Utility of right ventric-ular free wall speckle-tracking strain for evaluation of rightventricular performance in patients with pulmonary hyperten-sion. J Am Soc Echocardiogr 2011;24:1101—8.
48] Haeck ML, Scherptong RW, Marsan NA, et al. Prognosticvalue of right ventricular longitudinal peak systolic strain inpatients with pulmonary hypertension. Circ Cardiovasc Imaging2012;5:628—36.
49] Gaynor SL, Maniar HS, Prasad SM, et al. Reservoir and conduitfunction of right atrium: impact on right ventricular fill-ing and cardiac output. Am J Physiol Heart Circ Physiol2005;288:H2140—5.
50] Otto CM. The practice of clinical echocardiography. 4th ed.Philadelphia: Saunders; 2012.
51] Cioffi G, de Simone G, Mureddu G, et al. Right atrial sizeand function in patients with pulmonary hypertension associ-ated with disorders of respiratory system or hypoxemia. Eur JEchocardiogr 2007;8:322—31.
52] Raymond RJ, Hinderliter AL, Willis PW, et al. Echocardiographicpredictors of adverse outcomes in primary pulmonary hyper-tension. J Am Coll Cardiol 2002;39:1214—9.
53] Grapsa J, Gibbs JS, Cabrita IZ, et al. The association of clin-ical outcome with right atrial and ventricular remodellingin patients with pulmonary arterial hypertension: study withreal-time three-dimensional echocardiography. Eur Heart JCardiovasc Imaging 2012;13:666—72.
54] Nageh MF, Kopelen HA, Zoghbi WA, et al. Estimation of meanright atrial pressure using tissue Doppler imaging. Am J Cardiol1999;84:1448—51 [A8].
55] Nagueh SF, Appleton CP, Gillebert TC, et al. Recommen-dations for the evaluation of left ventricular diastolicfunction by echocardiography. J Am Soc Echocardiogr 2009;22:107—33.
56] Gurudevan SV, Malouf PJ, Auger WR, et al. Abnormal left ven-tricular diastolic filling in chronic thromboembolic pulmonaryhypertension: true diastolic dysfunction or left ventricularunderfilling? J Am Coll Cardiol 2007;49:1334—9.
57] Galie N, Hinderliter AL, Torbicki A, et al. Effects of the oralendothelin-receptor antagonist bosentan on echocardiographicand doppler measures in patients with pulmonary arterialhypertension. J Am Coll Cardiol 2003;41:1380—6.
58] Puwanant S, Park M, Popovic ZB, et al. Ventricular geometry,strain, and rotational mechanics in pulmonary hypertension.Circulation 2010;121:259—66.

oca
[
[
Imaging in pulmonary hypertension: Focus on the role of ech
[59] Hardegree EL, Sachdev A, Fenstad ER, et al. Impairedleft ventricular mechanics in pulmonary arterial hyperten-sion: identification of a cohort at high risk. Circ Heart Fail2013;6:748—55.
[60] Abbas AE, Fortuin FD, Schiller NB, et al. A simple method fornon-invasive estimation of pulmonary vascular resistance. J AmColl Cardiol 2003;41:1021—7.
[61] Mahapatra S, Nishimura RA, Oh JK, et al. The prognos-tic value of pulmonary vascular capacitance determinedby Doppler echocardiography in patients with pulmonary
arterial hypertension. J Am Soc Echocardiogr 2006;19:1045—50.[62] Dyer K, Lanning C, Das B, et al. Non-invasive Dopplertissue measurement of pulmonary artery compliance in
[
rdiography 271
children with pulmonary hypertension. J Am Soc Echocardiogr2006;19:403—12.
63] Opotowsky AR, Ojeda J, Rogers F, et al. A simple echocar-diographic prediction rule for hemodynamics in pulmonaryhypertension. Circ Cardiovasc Imaging 2012;5:765—75.
64] Bhave NM, Patel AR, Weinert L, et al. Three-dimensionalmodeling of the right ventricle from two-dimensional transtho-racic echocardiographic images: utility of knowledge-basedreconstruction in pulmonary arterial hypertension. J Am SocEchocardiogr 2013;26:860—7.
65] van de Veerdonk MC, Kind T, Marcus JT, et al. Progressiveright ventricular dysfunction in patients with pulmonary arte-rial hypertension responding to therapy. J Am Coll Cardiol2011;58:2511—9.