Embed Size (px)
Citation preview
Influence of Reducing Conditions onMetallic Elements Released fromVarious Contaminated Soil SamplesP R I S C I L L A P A R E U I L , S O N I A P E N I L L A ,N U R S E N O Z K A N , F R A N C O I S B O R D A S , *A N D J E A N - C L A U D E B O L L I N G E R
Université de Limoges, Groupement de RechercheEau-Sol-Environnement, Faculté des Sciences & Techniques,123 avenue Albert Thomas, 87 060 Limoges, France
Received April 5, 2008. Revised manuscript received July 7,2008. Accepted July 24, 2008.
The redox conditions of soil may have significant consequencesfor the mobility of metallic elements (ME), but unlike pH,very few studies have investigated this parameter. A procedurewas established to study the solubilization of ME from soilsamples in various reducing conditions using a batch methodand sodium ascorbate solutions. The change in redoxpotential from +410 to +10 mV was studied from fourcontaminated soil samples (designated A-D) of differentoriginsandcompositions.TheresultsshowedthatMEmobilizationgreatly increased with decreasing redox potential within alimited and very sensitive range. Depending on the soil samplestudied, various sensitive ranges of potentials were obtained(A, 220-345 mV; B, 280-365 mV; C, 260-360 mV; and D, 240-380mV), and the induced percentages of ME mobilization varied(i.e., maximal values for Zn: A, 45%; B, 59%; C, 53%; and D, 58%).The results could be explained by the combined effect ofpotential and pH decrease on ME-carrying phases; in particular,Fe and Mn (oxy)hydroxides.
IntroductionRedox potential in soils can be modified by natural phe-nomena (flooding, etc.) or anthropic activities (irrigations,organic amendments, etc.). Like pH, this parameter is a mainfactor governing metallic element (ME) mobilization in soilsthrough the dissolution of the ME-carrying phases (1, 2).
Several experimental studies have focused on the influ-ence of reducing conditions on ME mobility, either throughbatch experiments (3, 4), within soil columns (5, 6), or usingundisturbed blocks of topsoil (2). The main methods usedto create reducing conditions in a soil sample consisted ofaerobic/anaerobic incubation (by fluxing either O2 or N2),water-flooding incubation, or addition of reducing agents.The first two approaches are mainly based on microorganismactivity, which is hard to control. Moreover, they generallyneed a long contact time and do not allow many differentreducing conditions to be obtained. The use of reducingreactants allows fast and easy experiments with a large rangeof reducing conditions. Davranche et al. (4, 7) studied theeffect of reducing conditions on ME mobility in soils orsynthetic pure solid phases using hydroxylamine hydro-chloride or sodium ascorbate. More recently, Chatain et al.(8) evaluated the ability of sodium ascorbate or sodium
borohydride to produce different oxido-reducing conditionsin a mining soil. They emphasized the importance of thenature of the reducing agent and the pH range on the results.Larsen et al. (9), through parallel dissolution studies in HCland ascorbic acid at pH 3, highlighted the importance ofreductive dissolution in iron solubilization from a sandyaquifer.
Depending on the technique employed, contradictory datahave been reported, such as a simultaneous increase in Cd,Pb, Zn, and Fe when the redox potential E decreased usinggas bubbling in a contaminated soil suspension (3) or asimultaneous increase in Pb, Cd, Fe, and Mn mobility underreducing conditions imposed by a chemical agent (4, 7).However, in any case, the solubilization of Fe and Mn(oxy)hydroxides seems the major mechanism controlling therelease of ME under reducing conditions (3, 4, 10, 11) andis favored by acid conditions (12).
In this context, our purpose was to propose a chemicalexperimental method creating a wide range of redox condi-tions to study the effect of reducing conditions on the releaseof ME. This methodology was applied to four contaminatedsoil samples presenting various characteristics. To under-stand the mechanisms involved, the dissolution of the maincarrier phases of metals (iron and manganese (oxy)hydrox-ides) was monitored through the solubilization of Fe andMn.
Materials and MethodsAll chemicals were of analytical grade. The different solutionswere prepared in high-purity deionized water (HPW) (Milli-Qsystem: resistivity 18.2 MΩ · cm, TOC e 10 µg ·L-1). Allglassware and containers were previously decontaminatedin 10% (v/v) nitric acid for at least 24 h. Each experiment andeach analysis were carried out in triplicate; the results aregiven as mean value ( standard deviation.
Origin and Chemical Characterization of Soil Samples.Four samples of French contaminated soils, designated A-D,from different geographical origins were studied (Table S1of the Supporting Information). They were pretreated ac-cording to the ISO 11464 standard (air-drying and sieving at2 mm after deagglomeration).
The pHH2O and pHKCl (1 mol ·L-1) were determinedaccording to ISO 10390. The cation exchange capacity (CEC)was determined by the cobaltihexammine method accordingto the French standard NF 31-130. Organic carbon (OC)content was determined by sulfochromic oxidation accordingto the ISO 14135 standard. Inorganic carbon (IC) contentwas evaluated by difference between the total carbonobtained by C/S analyzer (ELTRA CS-200) and OC content.
Total ME Content in Soil Samples. ME content wasdetermined by microwave-assisted digestion (Anton PaarMultiwave 3000). Each air-dried soil sample (0.5 g) wasdigested with 3 mL of 35% HCl and 9 mL of 69% HNO3 inPTFE vessels. A power ramp was carried out for 5 min toreach 1400 W and held for 25 min. Digests were filteredthrough 0.2 µm Sartorius cellulose acetate filters into 50 mLvolumetric flasks completed with HPW. The correctness ofthis approach was monitored by comparison with HFdigestion (unpublished data).
Mineralogical Fractionation of Iron. Percentages ofamorphous, organic, and crystalline iron were distinguishedaccording to Schwertmann (13) and McKeague (14). Amor-phous and organic iron contents were determined byammonium oxalate extraction: 0.05 g of air-dried soil sampleand 20 mL of ammonium oxalate (0.2 mol ·L-1 acidified at
* Corresponding author phone: (+33) 555-457-485; fax: (+33) 555-457-203; e-mail: [email protected]
Environ. Sci. Technol. 2008, 42, 7615–7621
10.1021/es800953d CCC: $40.75 2008 American Chemical Society VOL. 42, NO. 20, 2008 / ENVIRONMENTAL SCIENCE & TECHNOLOGY 9 7615
Published on Web 09/20/2008
pH 3 with HNO3) were mixed in the dark for 2 h at 20 °C.Organic iron content was determined by sodium pyrophos-phate extraction: 0.04 g of another air-dried soil sample and20 mL of 0.1 mol ·L-1 sodium pyrophosphate were mixed for16 h at 20 °C. Crystalline iron content was determined bydifference from total iron. After each extraction, the solutionswere filtered through 0.2 µm Sartorius cellulose acetate filtersinto 50 mL volumetric flasks completed with HPW.
Fractionation of ME by Sequential Extractions. Theaccelerated BCR sequential extraction procedure proposedby the European Bureau Communautaire de Référence (BCR),and developed by Pérez-Cid et al. (15) using focusedultrasound (Bandelin HD 70) was carried out. Extracts wereseparated from solid residues by centrifugation at 1500g for15 min. Since the four fractions obtained were operationallydefined, they were specified here as F1 (exchangeable andsoluble in acidic medium), F2 (reducible), F3 (oxidizable),and F4 (residual). The complete procedure for each set ofanalyses using the same reagents was carried out in theabsence of a sample. No significant contamination due toglassware or reagents was observed.
Chromium Speciation. Cr(VI) content was determinedaccording to the MA. 200-CrHex 1.0 Canadian method (16).One gram of air-dried soil sample and 40 mL of basicextracting solution (0.5 mol ·L-1 NaOH and 0.28 mol ·L-1
Na2CO3) were mixed for 1 h at 90-95 °C. After Cr(VI)extraction, the pH was adjusted to 7-8 with HNO3, and theCr(VI) content was measured by the colorimetric reactionusing diphenylcarbazide (DPC). The absorbance of theCr(VI)-DPC complex was measured at 540 nm (Varian Cary50 Probe Spectrometer). The Cr(III) content was determinedby difference from total Cr.
ME Mobilization According to Redox Potential. Experi-ments were performed with a solid/liquid ratio of 10 g ·L-1
in HDPE amber bottles (1 L). The various reducing agentsand their concentration ranges are listed in Table S2 of theSupporting Information. The initial pH of the reducingsolutions was adjusted with HNO3 or NaOH to the soil pHH2O
values but was free to change during the experiments; thiswas taken into account in the discussion. A reference batchexperiment was carried out with HPW under the sameexperimental conditions. The soil samples were maintained
in suspension by continuous stirring on an orbital shakingtable (IKA-Labortechnik K550 Digital) at 250 rpm and roomtemperature (22 ( 2 °C).
Previously, the contact time corresponding to the stabi-lization of pH, E, and mobilization of ME was determinedfrom a kinetic study. For these tests, three batch experimentsconducted under the same experimental conditions werecarried out for each soil sample with HPW and 0.02 and 1mol ·L-1 of each reducing agent. Aliquots of the suspensionswere taken at various periods; pH and E were monitoredevery 24 or 48 h (Crison GLP22 pH meter: combined electrodeCrison 52 21 for pH and indicating platinum electrode, Ag/AgCl/KCl 3 mol ·L-1 reference electrode Crison 52 62 forpotential measurement). The measured E values weretransformed into Eh values (vs she) (the redox potentialrelative to the standard hydrogen electrode) by addition ofthe potential for the reference electrode to better compareour results with literature.
Analytical Methods. ME concentrations were determinedusing either flame atomic absorption spectrometry (VarianSpectrAA 220 equipped with a deuterium backgroundcorrection) or graphite furnace atomic absorption spec-trometry (Varian SpectrAA 880 Z equipped with a Zeemanbackground correction).
Before analysis, each soil suspension was centrifuged at25000g for 10 min. The interference due to sodium ascorbateduring the AAS analysis was limited by a microwave-assisteddigestion adapted from the EPA 3015 method: 5 mL of samplewas digested with 3 mL of 30% H2O2 and 3 mL of 69% HNO3
at 165 °C for 10 min, followed by a ramp of 10 min to reach170 °C (Anton Paar Multiwave 3000); the digests were filteredthrough 0.2 µm Sartorius cellulose acetate filters into 20 mLvolumetric flasks completed with HPW. For the higherconcentrations of sodium sulfite and sodium thiosulfate,internal standards were used because of matrix interferences.
Results and DiscussionChemical Characteristics of Soil Samples. Chemical char-acteristics and total ME contents are presented in Table 1with iron fractionation and Cr(VI) content.
(i) For sample A, the OC content was low, and the pHH2Owas slightly acid. Its Al content was twice that of the other
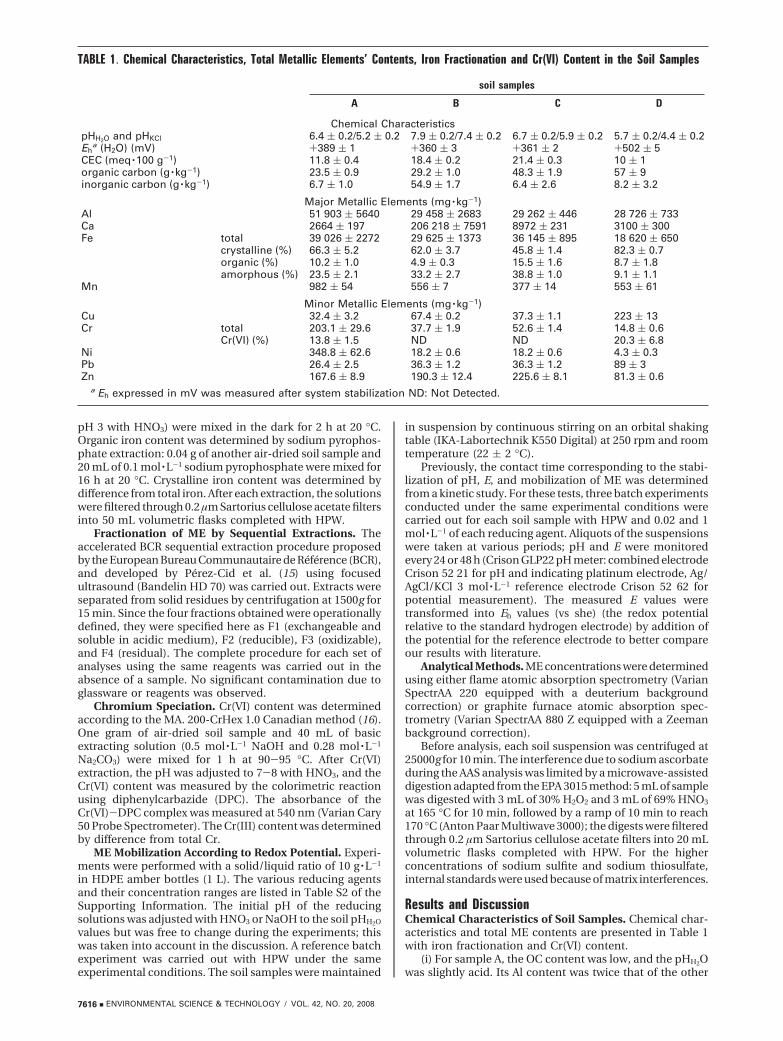
TABLE 1. Chemical Characteristics, Total Metallic Elements’ Contents, Iron Fractionation and Cr(VI) Content in the Soil Samples
soil samples
A B C D
Chemical CharacteristicspHH2O and pHKCl 6.4 ( 0.2/5.2 ( 0.2 7.9 ( 0.2/7.4 ( 0.2 6.7 ( 0.2/5.9 ( 0.2 5.7 ( 0.2/4.4 ( 0.2Eh
a (H2O) (mV) +389 ( 1 +360 ( 3 +361 ( 2 +502 ( 5CEC (meq ·100 g-1) 11.8 ( 0.4 18.4 ( 0.2 21.4 ( 0.3 10 ( 1organic carbon (g ·kg-1) 23.5 ( 0.9 29.2 ( 1.0 48.3 ( 1.9 57 ( 9inorganic carbon (g ·kg-1) 6.7 ( 1.0 54.9 ( 1.7 6.4 ( 2.6 8.2 ( 3.2
Major Metallic Elements (mg ·kg-1)Al 51 903 ( 5640 29 458 ( 2683 29 262 ( 446 28 726 ( 733Ca 2664 ( 197 206 218 ( 7591 8972 ( 231 3100 ( 300Fe total 39 026 ( 2272 29 625 ( 1373 36 145 ( 895 18 620 ( 650
crystalline (%) 66.3 ( 5.2 62.0 ( 3.7 45.8 ( 1.4 82.3 ( 0.7organic (%) 10.2 ( 1.0 4.9 ( 0.3 15.5 ( 1.6 8.7 ( 1.8amorphous (%) 23.5 ( 2.1 33.2 ( 2.7 38.8 ( 1.0 9.1 ( 1.1
Mn 982 ( 54 556 ( 7 377 ( 14 553 ( 61
Minor Metallic Elements (mg ·kg-1)Cu 32.4 ( 3.2 67.4 ( 0.2 37.3 ( 1.1 223 ( 13Cr total 203.1 ( 29.6 37.7 ( 1.9 52.6 ( 1.4 14.8 ( 0.6
Cr(VI) (%) 13.8 ( 1.5 ND ND 20.3 ( 6.8Ni 348.8 ( 62.6 18.2 ( 0.6 18.2 ( 0.6 4.3 ( 0.3Pb 26.4 ( 2.5 36.3 ( 1.2 36.3 ( 1.2 89 ( 3Zn 167.6 ( 8.9 190.3 ( 12.4 225.6 ( 8.1 81.3 ( 0.6
a Eh expressed in mV was measured after system stabilization ND: Not Detected.
7616 9 ENVIRONMENTAL SCIENCE & TECHNOLOGY / VOL. 42, NO. 20, 2008
samples; Fe and Mn content were also higher. Fe was mainlyin the crystalline form, which is less sensitive to dissolutionthan the amorphous and organic ones (18). Sample A wascontaminated mainly by Ni, Zn, and Cr, which was essentiallyin the Cr(III) form.
(ii) Sample B was an alkaline soil, Ca content was up to100 times higher than in the others. Moreover, the IC contentwas about 10 times higher than in the other samples. Itsbasic pH is due to the presence of calcium carbonate. Thepresence of calcite was confirmed by XRD analysis (FigureS1). The percentage of organic iron was very low. Sample Bwas contaminated mainly by Zn and Cu.
(iii) Sample C was a neutral soil. Its OC content and CECvalues were the greatest in the present series; nevertheless,these values could be generally considered as low. Themineralogical fractionation of iron differs from the other soilsamples: the crystalline fraction was the smallest, whereasthe amorphous one was the highest. This was confirmed bythe XRD analysis (Figure S1). Therefore, the dissolved ironproportion would be probably greater in this sample underreducing conditions. Sample C was contaminated mainly byZn and Cr.
(iv) Sample D was slightly acidic, like sample A. The Fecontent was the lowest, and its fractionation underlined thatit was mainly in crystalline form. Amorphous and organicforms represented only 20%. Sample D was contaminatedmainly by Cu, Pb and Zn.
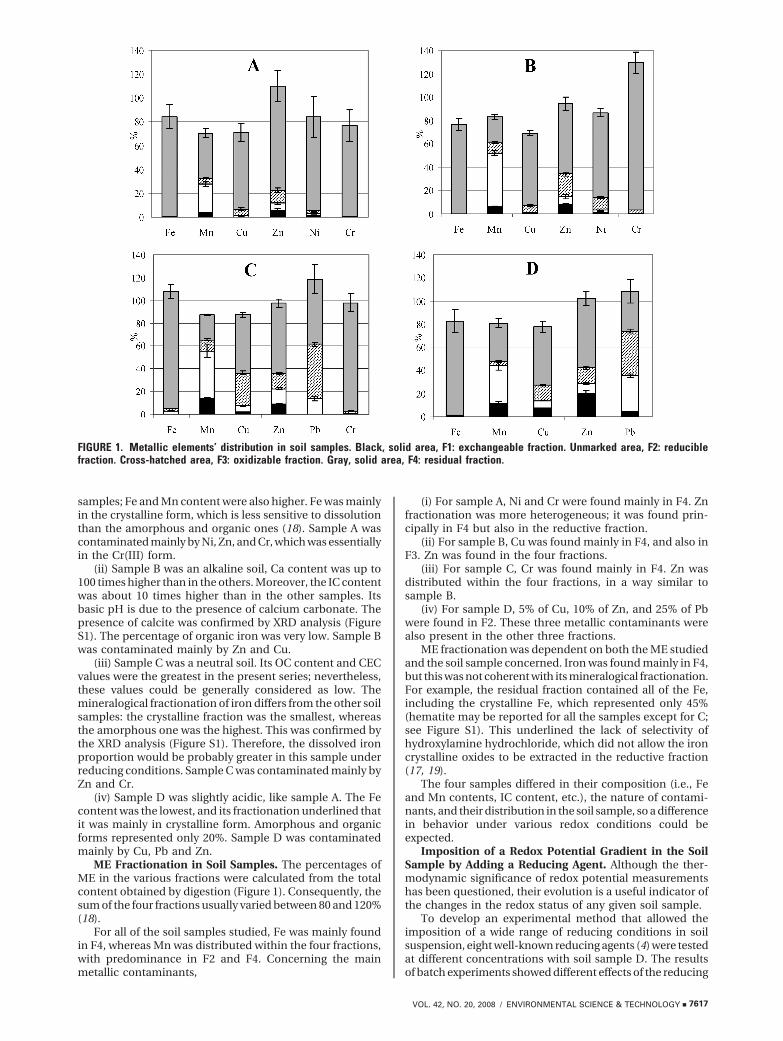
ME Fractionation in Soil Samples. The percentages ofME in the various fractions were calculated from the totalcontent obtained by digestion (Figure 1). Consequently, thesum of the four fractions usually varied between 80 and 120%(18).
For all of the soil samples studied, Fe was mainly foundin F4, whereas Mn was distributed within the four fractions,with predominance in F2 and F4. Concerning the mainmetallic contaminants,
(i) For sample A, Ni and Cr were found mainly in F4. Znfractionation was more heterogeneous; it was found prin-cipally in F4 but also in the reductive fraction.
(ii) For sample B, Cu was found mainly in F4, and also inF3. Zn was found in the four fractions.
(iii) For sample C, Cr was found mainly in F4. Zn wasdistributed within the four fractions, in a way similar tosample B.
(iv) For sample D, 5% of Cu, 10% of Zn, and 25% of Pbwere found in F2. These three metallic contaminants werealso present in the other three fractions.
ME fractionation was dependent on both the ME studiedand the soil sample concerned. Iron was found mainly in F4,but this was not coherent with its mineralogical fractionation.For example, the residual fraction contained all of the Fe,including the crystalline Fe, which represented only 45%(hematite may be reported for all the samples except for C;see Figure S1). This underlined the lack of selectivity ofhydroxylamine hydrochloride, which did not allow the ironcrystalline oxides to be extracted in the reductive fraction(17, 19).
The four samples differed in their composition (i.e., Feand Mn contents, IC content, etc.), the nature of contami-nants, and their distribution in the soil sample, so a differencein behavior under various redox conditions could beexpected.
Imposition of a Redox Potential Gradient in the SoilSample by Adding a Reducing Agent. Although the ther-modynamic significance of redox potential measurementshas been questioned, their evolution is a useful indicator ofthe changes in the redox status of any given soil sample.
To develop an experimental method that allowed theimposition of a wide range of reducing conditions in soilsuspension, eight well-known reducing agents (4) were testedat different concentrations with soil sample D. The resultsof batch experiments showed different effects of the reducing
FIGURE 1. Metallic elements’ distribution in soil samples. Black, solid area, F1: exchangeable fraction. Unmarked area, F2: reduciblefraction. Cross-hatched area, F3: oxidizable fraction. Gray, solid area, F4: residual fraction.
VOL. 42, NO. 20, 2008 / ENVIRONMENTAL SCIENCE & TECHNOLOGY 9 7617
agents on pH and Eh for the soil sample studied (Table S2).A broader Eh range was obtained with sodium ascorbate,which led to various redox potentials ranges: from “oxidized”(+430 mV) to “reduced” (+26 mV), according to the scale ofTrolard et al. (21). In the presence of sodium ascorbate, thepH of the soil sample D suspension was only slightly modified:variations of less than(0.5 pH unit were observed, dependingon the concentration.
Many studies have emphasized that both pH and Einfluence ME release from a soil (3, 4, 7-9, 22, 23). Obtaininga relatively stable pH during the experiments is, thus, crucialto assess the effect on ME solubilization of reducingconditions only. According to these results, only sodiumascorbate was later used to impose reducing conditions withthe different soil samples.
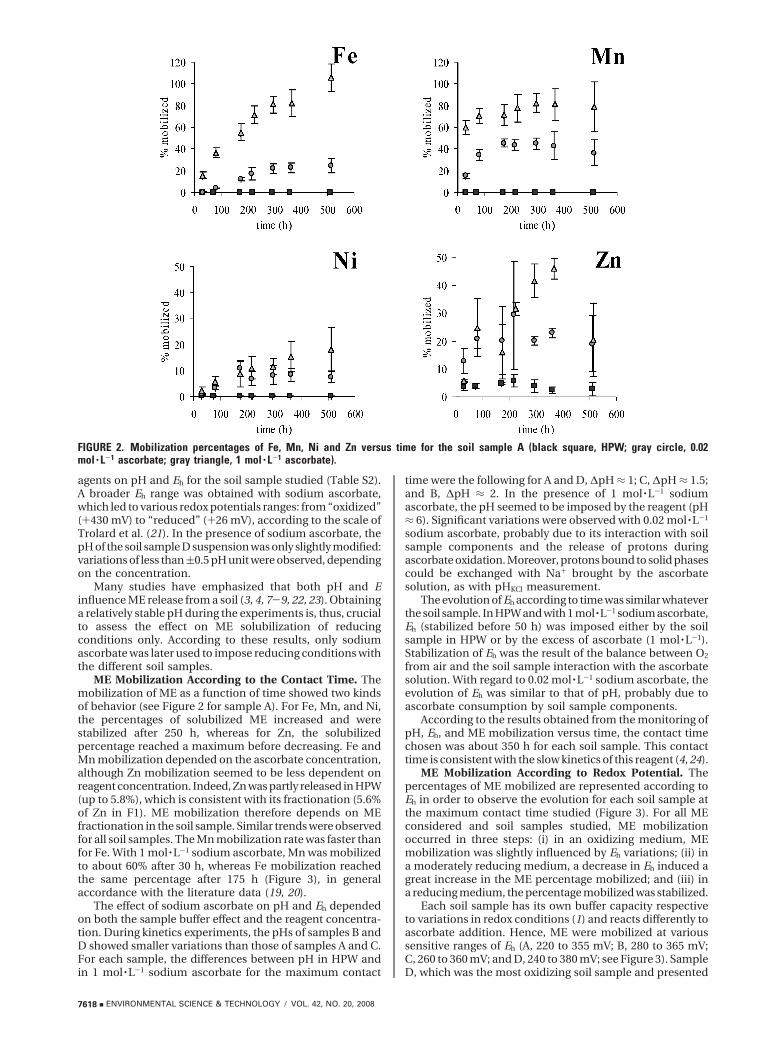
ME Mobilization According to the Contact Time. Themobilization of ME as a function of time showed two kindsof behavior (see Figure 2 for sample A). For Fe, Mn, and Ni,the percentages of solubilized ME increased and werestabilized after 250 h, whereas for Zn, the solubilizedpercentage reached a maximum before decreasing. Fe andMn mobilization depended on the ascorbate concentration,although Zn mobilization seemed to be less dependent onreagent concentration. Indeed, Zn was partly released in HPW(up to 5.8%), which is consistent with its fractionation (5.6%of Zn in F1). ME mobilization therefore depends on MEfractionation in the soil sample. Similar trends were observedfor all soil samples. The Mn mobilization rate was faster thanfor Fe. With 1 mol ·L-1 sodium ascorbate, Mn was mobilizedto about 60% after 30 h, whereas Fe mobilization reachedthe same percentage after 175 h (Figure 3), in generalaccordance with the literature data (19, 20).
The effect of sodium ascorbate on pH and Eh dependedon both the sample buffer effect and the reagent concentra-tion. During kinetics experiments, the pHs of samples B andD showed smaller variations than those of samples A and C.For each sample, the differences between pH in HPW andin 1 mol ·L-1 sodium ascorbate for the maximum contact
time were the following for A and D, ∆pH ≈ 1; C, ∆pH ≈ 1.5;and B, ∆pH ≈ 2. In the presence of 1 mol ·L-1 sodiumascorbate, the pH seemed to be imposed by the reagent (pH≈ 6). Significant variations were observed with 0.02 mol ·L-1
sodium ascorbate, probably due to its interaction with soilsample components and the release of protons duringascorbate oxidation. Moreover, protons bound to solid phasescould be exchanged with Na+ brought by the ascorbatesolution, as with pHKCl measurement.
The evolution of Eh according to time was similar whateverthe soil sample. In HPW and with 1 mol ·L-1 sodium ascorbate,Eh (stabilized before 50 h) was imposed either by the soilsample in HPW or by the excess of ascorbate (1 mol ·L-1).Stabilization of Eh was the result of the balance between O2
from air and the soil sample interaction with the ascorbatesolution. With regard to 0.02 mol ·L-1 sodium ascorbate, theevolution of Eh was similar to that of pH, probably due toascorbate consumption by soil sample components.
According to the results obtained from the monitoring ofpH, Eh, and ME mobilization versus time, the contact timechosen was about 350 h for each soil sample. This contacttime is consistent with the slow kinetics of this reagent (4, 24).
ME Mobilization According to Redox Potential. Thepercentages of ME mobilized are represented according toEh in order to observe the evolution for each soil sample atthe maximum contact time studied (Figure 3). For all MEconsidered and soil samples studied, ME mobilizationoccurred in three steps: (i) in an oxidizing medium, MEmobilization was slightly influenced by Eh variations; (ii) ina moderately reducing medium, a decrease in Eh induced agreat increase in the ME percentage mobilized; and (iii) ina reducing medium, the percentage mobilized was stabilized.
Each soil sample has its own buffer capacity respectiveto variations in redox conditions (1) and reacts differently toascorbate addition. Hence, ME were mobilized at varioussensitive ranges of Eh (A, 220 to 355 mV; B, 280 to 365 mV;C, 260 to 360 mV; and D, 240 to 380 mV; see Figure 3). SampleD, which was the most oxidizing soil sample and presented
FIGURE 2. Mobilization percentages of Fe, Mn, Ni and Zn versus time for the soil sample A (black square, HPW; gray circle, 0.02mol · L-1 ascorbate; gray triangle, 1 mol · L-1 ascorbate).
7618 9 ENVIRONMENTAL SCIENCE & TECHNOLOGY / VOL. 42, NO. 20, 2008
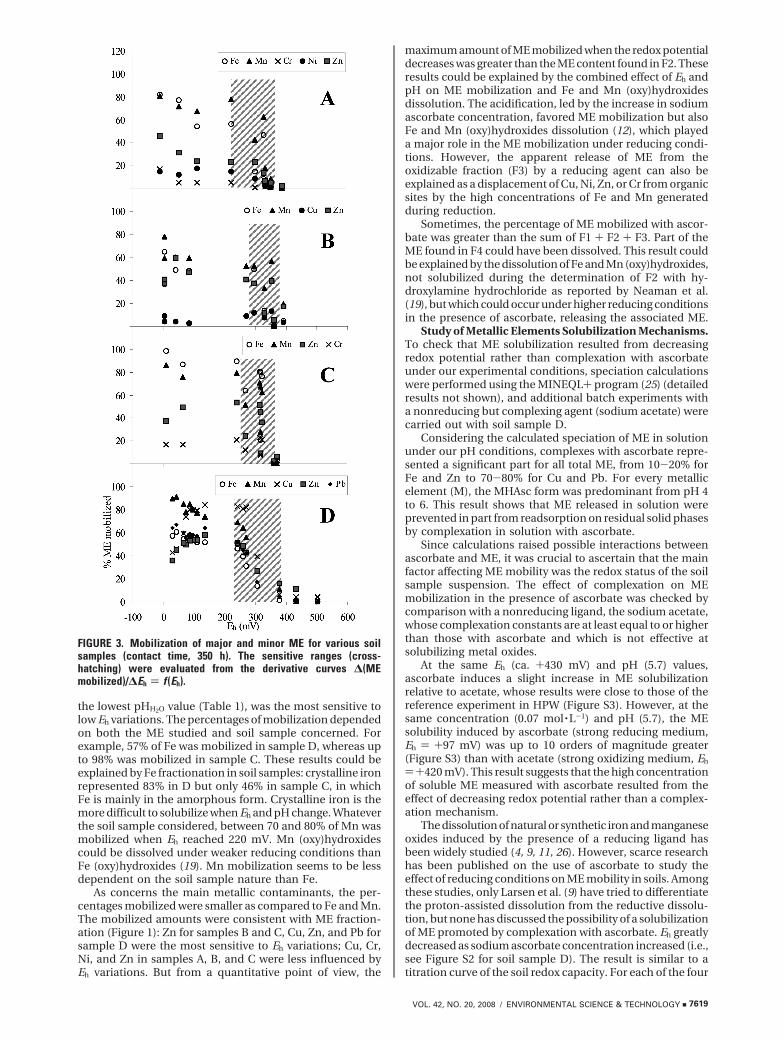
the lowest pHH2O value (Table 1), was the most sensitive tolow Eh variations. The percentages of mobilization dependedon both the ME studied and soil sample concerned. Forexample, 57% of Fe was mobilized in sample D, whereas upto 98% was mobilized in sample C. These results could beexplained by Fe fractionation in soil samples: crystalline ironrepresented 83% in D but only 46% in sample C, in whichFe is mainly in the amorphous form. Crystalline iron is themore difficult to solubilize when Eh and pH change. Whateverthe soil sample considered, between 70 and 80% of Mn wasmobilized when Eh reached 220 mV. Mn (oxy)hydroxidescould be dissolved under weaker reducing conditions thanFe (oxy)hydroxides (19). Mn mobilization seems to be lessdependent on the soil sample nature than Fe.
As concerns the main metallic contaminants, the per-centages mobilized were smaller as compared to Fe and Mn.The mobilized amounts were consistent with ME fraction-ation (Figure 1): Zn for samples B and C, Cu, Zn, and Pb forsample D were the most sensitive to Eh variations; Cu, Cr,Ni, and Zn in samples A, B, and C were less influenced byEh variations. But from a quantitative point of view, the
maximum amount of ME mobilized when the redox potentialdecreases was greater than the ME content found in F2. Theseresults could be explained by the combined effect of Eh andpH on ME mobilization and Fe and Mn (oxy)hydroxidesdissolution. The acidification, led by the increase in sodiumascorbate concentration, favored ME mobilization but alsoFe and Mn (oxy)hydroxides dissolution (12), which playeda major role in the ME mobilization under reducing condi-tions. However, the apparent release of ME from theoxidizable fraction (F3) by a reducing agent can also beexplained as a displacement of Cu, Ni, Zn, or Cr from organicsites by the high concentrations of Fe and Mn generatedduring reduction.
Sometimes, the percentage of ME mobilized with ascor-bate was greater than the sum of F1 + F2 + F3. Part of theME found in F4 could have been dissolved. This result couldbe explained by the dissolution of Fe and Mn (oxy)hydroxides,not solubilized during the determination of F2 with hy-droxylamine hydrochloride as reported by Neaman et al.(19), but which could occur under higher reducing conditionsin the presence of ascorbate, releasing the associated ME.
Study of Metallic Elements Solubilization Mechanisms.To check that ME solubilization resulted from decreasingredox potential rather than complexation with ascorbateunder our experimental conditions, speciation calculationswere performed using the MINEQL+ program (25) (detailedresults not shown), and additional batch experiments witha nonreducing but complexing agent (sodium acetate) werecarried out with soil sample D.
Considering the calculated speciation of ME in solutionunder our pH conditions, complexes with ascorbate repre-sented a significant part for all total ME, from 10-20% forFe and Zn to 70-80% for Cu and Pb. For every metallicelement (M), the MHAsc form was predominant from pH 4to 6. This result shows that ME released in solution wereprevented in part from readsorption on residual solid phasesby complexation in solution with ascorbate.
Since calculations raised possible interactions betweenascorbate and ME, it was crucial to ascertain that the mainfactor affecting ME mobility was the redox status of the soilsample suspension. The effect of complexation on MEmobilization in the presence of ascorbate was checked bycomparison with a nonreducing ligand, the sodium acetate,whose complexation constants are at least equal to or higherthan those with ascorbate and which is not effective atsolubilizing metal oxides.
At the same Eh (ca. +430 mV) and pH (5.7) values,ascorbate induces a slight increase in ME solubilizationrelative to acetate, whose results were close to those of thereference experiment in HPW (Figure S3). However, at thesame concentration (0.07 mol ·L-1) and pH (5.7), the MEsolubility induced by ascorbate (strong reducing medium,Eh ) +97 mV) was up to 10 orders of magnitude greater(Figure S3) than with acetate (strong oxidizing medium, Eh
)+420 mV). This result suggests that the high concentrationof soluble ME measured with ascorbate resulted from theeffect of decreasing redox potential rather than a complex-ation mechanism.
The dissolution of natural or synthetic iron and manganeseoxides induced by the presence of a reducing ligand hasbeen widely studied (4, 9, 11, 26). However, scarce researchhas been published on the use of ascorbate to study theeffect of reducing conditions on ME mobility in soils. Amongthese studies, only Larsen et al. (9) have tried to differentiatethe proton-assisted dissolution from the reductive dissolu-tion, but none has discussed the possibility of a solubilizationof ME promoted by complexation with ascorbate. Eh greatlydecreased as sodium ascorbate concentration increased (i.e.,see Figure S2 for soil sample D). The result is similar to atitration curve of the soil redox capacity. For each of the four
FIGURE 3. Mobilization of major and minor ME for various soilsamples (contact time, 350 h). The sensitive ranges (cross-hatching) were evaluated from the derivative curves ∆(MEmobilized)/∆Eh ) f (Eh).
VOL. 42, NO. 20, 2008 / ENVIRONMENTAL SCIENCE & TECHNOLOGY 9 7619
soils studied, two buffering steps toward redox potentialchanges appeared before the effect of reducing conditionson the soil was at maximum. The shape of the curve in FigureS2 may indicate that different mineral forms of Mn and Feare solubilized when Eh varies and are involved in thebuffering capacity of the soil (22, 23). As expressed byBarcelona and Holm (1), each soil has its own redox capacity,which represents a considerable resistance to changes inredox conditions. Each soil will, thus, react differently afteraddition of the same concentration of reducing agent, asalready observed from two contaminated soil samples(industrial and agricultural) (4).
The simultaneous release of various ME as observed inour study, seemed to indicate that their solubilization wasrelated to the reductive dissolution of the carrier phasesformed by Fe and Mn oxides. In another study of the releaseof trace ME from a contaminated soil by suspensionexperiments, the solubilized concentrations of Pb, Cd, andZn were positively correlated with Fe concentrations (3); theauthors concluded that trace ME were released from ironoxide surfaces as the solid dissolves. On the contrary, fromcolumn experiments, an inverse relationship between Pband Fe concentrations in solution was observed (6) andsuggested the importance of the reductive dissolution of Feoxides in controlling ME solubility and mobility in soils.Quantin et al. (26) compared the chemical extraction andthe bacterial dissolution of natural metal-rich soils; theyconcluded that during reducing conditions induced bytemporary water-logging, the sources of released Cr and Niare iron but mainly manganese oxides.
The Concept of a Redox Mobilization Edge. Very fewresearchers have tried to represent the solubilization of MEaccording to different E values. Gotoh and Patrick studiedthe distribution of different forms of manganese (22) andiron (23) in a waterlogged soil under various redox potentialand pH conditions. They showed the existence of a criticalredox potential range for their reduction and their induceddissolution: that is (in mV), +200 e Eh e +400 for Mn at 6e pHe 8 and +100e Ehe+300 at 6e pHe 7 or Eh ≈ -100mV at pH 8. Atta et al. (27) revealed, from rice soil, that redoxpotential and pH affect water-soluble and exchangeable ironand manganese, and threshold values were about -150 mVat pH 8 and 7 for Fe and +150 mV for Mn and +200 mV atpH 6 for Fe. Our results are consistent with those from theliterature, whose values were obtained from soil samples ofdifferent origins and composition subject to reductionthrough “natural causes”, such as aerobic/anaerobic incu-bation or water-flooding (see also refs 20 and 28). By analogywith the effect of pH on ME solubilization (29), we suggestthe introduction of the concept of a “redox mobilization-edge”, describing the influence of the decrease in the redoxpotential on ME solubilization from a given soil.
Whatever the soil sample studied or the methodologyused, the ME amount released was slightly influenced by Eh
variations. Redox potential, as well as pH, is a key factor tobe taken into consideration for risk assessment studies inthe case of metal-contaminated sites. In our case, themaximum amounts of the ME solubilized when the potentialdecreases were greater than the ME content found in fractionF2. This result shows that the sequential extraction protocolssuch as BCR (15) are not suitable for the evaluation of theirpotential mobility under these conditions.
The need for a standardized method for assessing theleachability and the mobility of metallic contaminants overreducing conditions is pointed out herein. Then an easychemical approach, using a series of sodium ascorbatesolutions, could be used to simulate a gradient of reducingconditions and to test potential mobility of ME; for example,during land use changes.
AcknowledgmentsThis work was financially supported by the Contrat de planEtat-Région Limousin and by the Conseil Régional duLimousin. S.P. and P.P. thank the ANRT for funding. Theauthors thank Dr. E. Joussein (GRESE, Universite de Limoges)for characterization of soils; the three anonymous reviewers;and the Associate Editor (Prof. L. Sigg) whose constructivecritical comments helped to improve the content of thispaper.
Supporting Information AvailableOrigin and characterization of the studied soil samples (TableS1 and Figure S1), ranges of pH and Eh obtained with differentconcentrations of various reducing agents (Table S2) andvariation of Eh according to ascorbate concentration insolution for soil sample D (Figure S2), comparison betweenmetal solubilization following the addition of sodium ascor-bate or sodium acetate solutions (Figure S3). This materialis available free of charge via the Internet at http://pubs.acs.org
Literature Cited(1) Barcelona, M.; Holm, T. R. Oxidation-reduction capacities of
aquifer solids. Environ. Sci. Technol. 1991, 25, 1565–1572.(2) Charlatchka, R.; Cambier, P. Influence of reductive conditions
on solubility of trace metals in contaminated soils. Water, Air,Soil Pollut. 2000, 118, 143–167.
(3) Chuan, M. C.; Shu, G. Y.; Liu, J. C. Solubility of heavy metals ina contaminated soil: effects of redox potential and pH. Water,Air, Soil Pollut. 1996, 90, 543–556.
(4) Davranche, M.; Bollinger, J. C. Heavy-metals desorption fromsynthetised and natural iron and manganese oxyhydroxides:effect of reductive conditions. J. Colloid Interface Sci. 2000, 227,531–539.
(5) Schlieker, M.; Schuring, J.; Hencke, J.; Schulz, H. D. The influenceof redox processes on trace element mobility in a sandy aquifer-an experimental approach. J. Geochem. Explor. 2001, 73, 167–179.
(6) Ma, L. Q.; Dong, Y. Effects of incubation on solubility andmobility of trace metals in two contaminated soils. Environ.Pollut. 2004, 130, 301–307.
(7) Davranche, M.; Bollinger, J. C.; Bril, H. Effect of reductiveconditions on metal mobility from wasteland solids: an examplefrom the Mortagne-du-Nord site (France). Appl. Geochem. 2003,18, 383–394.
(8) Chatain, V.; Sanchez, F.; Bayard, R.; Moszkowicz, P.; Gourdon,P. Effect of experimentally induced reducing conditions on themobility of arsenic from a mining soil. J. Hazard. Mater. 2005,B122, 119–128.
(9) Larsen, O.; Postma, D.; Jakobsen, R. The reactivity of iron oxidestowards reductive dissolution with ascorbic acid in a shallowsandy aquifer (Rømø, Denmark). Geochim. Cosmochim. Acta2006, 70, 4827–4835.
(10) Wang, G.; Staunton, S. Evolution of water-extractable copperin soil with time as a function of organic matter amendmentsand aeration. Eur. J. Soil Sci. 2006, 57, 372–380.
(11) Suter, D.; Banwart, S.; Stumm, W. Dissolution of hydrous iron(III)oxides by reductive mechanisms. Langmuir 1991, 7, 809–813.
(12) Deng, Y. Effect of pH on the reductive dissolution rates of iron(III) hydroxide by ascorbate. Langmuir 1997, 13, 1835–1839.
(13) Schwertmann, U. Differenzierung der Eisenoxide des Bodensdurch Extraktion mit Ammoniumoxalat-Losung. Z. Pflanzen-ernahr. Dung. Bodenk. 1964, 105, 194–202.
(14) McKeague, J. A. An evaluation of 0.1 M pyrophosphate andpyrophosphate dithionite in comparison to oxalate as extrac-tants of the accumulation products in podzols and some othersoils. Can. J. Soil Sci. 1967, 47, 95–99.
(15) Perez-Cid, B.; Lavilla, I.; Bendicho, C. Speeding up of a three-stage sequential extraction method for metal partitioning usingfocused ultrasound. Anal. Chim. Acta 1998, 360, 35–41.
(16) Centre d’Expertise en Analyse Environnementale du Quebec.Determination du chrome hexavalent: methode colorimetriqueMA 200-CrHex 1.0, rev. 4; Ministere du Developpement Durable,de l’Environnement et des Parcs du Quebec, 2006; p 12.
(17) La Force, M. J.; Fendorf, S. Solid-phase iron characterizationduring common selective sequential extractions. Soil Sci. Soc.Amer. J. 2000, 64, 1608–1615.
7620 9 ENVIRONMENTAL SCIENCE & TECHNOLOGY / VOL. 42, NO. 20, 2008
(18) Davidson, C. M.; Duncan, A. L.; Littlejohn, D.; Ure, A. M.; Garden,L. M. A critical evaluation of the three-stage BCR sequentialextraction procedure to assess the potential mobility and toxicityof heavy metals in industrially-contaminated land. Anal. Chim.Acta 1998, 363, 45–55.
(19) Neaman, A.; Waller, B.; Mouélé, F.; Trolard, F.; Bourrié, G.Improved methods for selective dissolution of manganese oxidesfrom soils and rocks. Eur. J. Soil Sci. 2004, 55, 47–54.
(20) Cornu, J. Y.; Denaix, L.; Schneider, A.; Pellerin, S. Temporalevolution of redox processes and free Cd dynamics in a metal-contaminated soil after rewetting. Chemosphere 2007, 70, 306–314.
(21) Trolard, F.; Bourrie, G.; Soulier, A.; Maitre, V.; Genin, J. M. R.;Abdelmoula, M. Dynamique de l’oxydo-reduction dans les zoneshumides. in Agriculture Intensive et Qualite des Eaux; CheverryC., Ed.; INRA Editions: Paris, 1998; pp 185-208.
(22) Gotoh, S.; Patrick, W. H. Transformation of manganese in awaterlogged soil as affected by redox potential and pH. Soil Sci.Soc. Am. Proc. 1972, 36, 738–742.
(23) Gotoh, S.; Patrick, W. H. Transformation of iron in a waterloggedsoil as influenced by redox potential and pH. Soil Sci. Soc. Am.Proc. 1974, 38, 66–71.
(24) Liang, L.; Hofmann, A.; Gu, B. Ligand-induced dissolution and
release of ferrihydrite colloids. Geochim. Cosmochim. Acta 2000,64, 2027–2037.
(25) Schecher, W. D.; McAvoy, D. C. MINEQL+, A Chemical Equi-librium Modelling System, Version 4.5 for Windows, User’sManual, 1st ed; Environmental Research Software Publisher:Hallowell, 1998.
(26) Quantin, C.; Becquer, T.; Berthelin, J. Mn-oxide: a major sourceof easily mobilisable Co and Ni under reducing conditions inNew Caledonia Ferralsols. C.R. Geosci. 2002, 334, 273–278.
(27) Atta, S. Kh.; Mohammed, S. A.; Van Cleemput, O.; Zayed, A.Transformations of iron and manganese under controlled Eh,Eh-pH conditions and addition of organic matter. Soil Technol.1996, 9, 223–237.
(28) Miao, S.; DeLaune, R. D.; Jugsujinda, A. Influence of sedimentredox conditions on release/solubility of metals and nutrientsin a Louisiana Mississippi River deltaic plain freshwater lake.Sci. Total Environ. 2006, 371, 334–343.
(29) Schindler, P. W.; Fürst, B.; Dick, R.; Wolf, P. U. Ligand propertiesof surface silanol groups. Surface complex formation with Fe3+,Cu2+, Cd2+, and Pb2+. J. Colloid Interface Sci. 1976, 55, 469–475.
ES800953D
VOL. 42, NO. 20, 2008 / ENVIRONMENTAL SCIENCE & TECHNOLOGY 9 7621


![LNCS 6385 - Designing Context-Aware Interactions for Task ... · tional services [10]. One of these services could allow making daily activities more fluent through reducing the need](https://img.pdfslide.fr/doc/110x75/5fba5682553cc558e91e1b24/lncs-6385-designing-context-aware-interactions-for-task-tional-services-10.jpg)