Embed Size (px)
Citation preview
Département fédéral de l’Environnement, des transports, de l’energie et de la communication DETEC
Office Fédéral de la Communication OFCOM Division Services de télécommunication
Juillet 2007
Le marché suisse des télécommunications en comparaison internationale Extrait du 12e rapport d’implémentation de l’Union européenne étendu à la Suisse Conformément à la méthode utilisée par la Commission européenne, tous les prix sont convertis avec un taux de change nominal
Bienne, Juillet 2007
Avant-propos Depuis plusieurs années déjà, la Commission des Communautés européennes publie annuellement une communication adressée au Conseil, au Parlement européen, au Comité économique et social européen et au Comité des régions, dont l’objectif est de faire le point sur la mise en oeuvre de la réglementation de l’Union européenne en matière de communications électroniques. La dernière mouture de ce rapport, également surnommé 12ème rapport d’implémentation de l’Union européenne, est parue en mars 20071. Mis à part un examen circonstancié de la situation réglementaire dans l’Union européenne et dans les divers pays membres qui la composent, ce rapport fournit, dans son annexe 2, une somme colossale d’informations sur la situation du marché des communications électroniques en 2006 et sur l’évolution observée entre 2005 et 2006. En plus de décrire de manière extrêmement complète le marché des télécommunications, les données statistiques livrées dans cette annexe ont le mérite de reposer sur des méthodologies unifiées et transparentes et permettent donc d’établir des comparaisons pertinentes entre les divers pays considérés. La Suisse se situant, géographiquement, économiquement et culturellement, au carrefour de l’Europe, il eût été regrettable de ne pas procéder à un même effort de comparaison et d’analyse pour notre pays. C’est la raison pour laquelle, nous nous sommes symboliquement et matériellement invités, lorsque cela s’avérait possible, dans l’annexe 2 du 12ème rapport d’implémentation. Le présent rapport a donc pour vocation essentielle de comparer la Suisse avec les pays membres de l’Union européenne et, le cas échéant, le Japon et les Etats-Unis, sur la base de l’annexe 2 du 12ème rapport d’implémentation de l’Union européenne, et de dresser un panorama chiffré aussi complet que possible de la situation qui prévalait sur le marché suisse des télécommunications en 2006. A cet effet, les diverses méthodologies élaborées par la Commission européenne ont été rigoureusement appliquées. Signalons encore que les textes qui ne sont pas en bleu sont directement tirés de l’annexe 2 du 12e rapport. Le présent rapport n’est disponible qu’en langue anglaise. La synthèse en revanche existe en français, italien, allemand et anglais.
1 Commission des Communautés européennes, Communication de la Commission au Parlement européen, au Conseil, au Comité économique et social européen et au Comité des régions, Réglementation et marchés des communications électroniques en Europe 2006, COM (2007) 155 final, Bruxelles, 29.03.2006.
Extrait du 12ème rapport d’implémentation de l’UE étendu à la Suisse - 2
Synthèse
Fournisseurs de services de télécommunication sur réseaux fixes (chapitre 1)
Au 30 juin 2006, l’on a enregistré en Suisse 130 opérateurs titulaires d’une concession, ce qui signifie qu’ils exploitent de manière indépendante une partie importante des installations de télécommunication utilisées pour la transmission. A deux opérateurs près, ce nombre ne subit aucune variation par rapport à l’année précédente. Il en va en revanche différemment pour le nombre d’opérateurs susceptibles de fournir des services de téléphonie vocale sur réseaux fixes, lequel nombre est passé de 170 en 2005 à 208 en 2006 ce qui représente une augmentation de 22.4%. En comparaison internationale, ces chiffres sont élevés, et ce d’autant plus si on les rapporte à la surface du territoire national.
Quoique positif en apparence, le nombre élevé d’opérateurs susceptibles de fournir de la téléphonie publique ne donne aucune indication sur le degré de concurrence caractérisant effectivement le marché. En effet, il ne s’agit que d’opérateurs pouvant potentiellement offrir des services. En réalité, seuls 60 opérateurs sur 208 sont réellement actifs sur ce marché, soit 29% de l’effectif. Ce phénomène montre que s’il n’y a aucune barrière administrative pour pouvoir entrer sur le marché des télécommunications, la volonté de s’y implanter et de développer durablement des activités constitue en revanche un défi autrement plus difficile. Par ailleurs, on mentionnera que ce fossé entre le nombre d’opérateurs administrativement enregistrés et le nombre d’opérateurs réellement actifs n’est pas une singularité propre à notre pays. En effet, dans l’Union européenne (UE), nombreuses sont les nations dans lesquelles on peut observer le même phénomène.
L’analyse de la situation concurrentielle qui prévaut sur le marché de la téléphonie vocale peut être utilement complétée par le calcul de la part de marché combinée, celle-ci exprimant le nombre de concurrents qui se partagent 90% et plus d’un marché donné. Pour cet indicateur, la Suisse obtient une valeur de six, ce qui la place dans le groupe de pays pouvant se targuer de bénéficier d’une intense concurrence sur le marché de la téléphonie publique sur réseaux fixes. Sur les 26 états considérés, huit obtiennent une valeur de cinq et plus – le maximum (11) étant le fait du Royaume-Uni – et cinq affichent une valeur égale à un, ce qui signifie qu’un monopole de fait y subsiste. Le solde se voit créditer de valeurs variant entre deux et quatre.
Les parts de marché conservées par les opérateurs historiques au fil du temps fournissent également des indications essentielles sur l’implantation de la concurrence et la vigueur de son développement. Naturellement, plus ces parts sont élevées, moins les opérateurs alternatifs sont parvenus à faire valoir leurs arguments sur le marché considéré. A cet égard, on notera que la part détenue par l’opérateur historique suisse sur l’ensemble du marché de la téléphonie sur réseaux fixes – exprimée en pourcentage du chiffre d’affaires – se situe clairement en dessous de la moyenne pondérée établie pour les pays de l’Union européenne. Plus de cinq points séparent en effet les deux valeurs, soit 58.5% pour la Suisse et 63.9% pour l’Union européenne. Si l’on examine de manière détaillée la situation par pays, on constate que la Suisse est bien positionnée puisque seuls les opérateurs historiques du Royaume-Uni (51.9%), de l’Autriche (54.6%) et de l’Allemagne (55.0%) affichent des parts de marché inférieures. Fait particulièrement frappant : il reste au sein de l’Union des divergences importantes entre les diverses nations qui la composent, puisque dans certains pays les parts de marché de l’opérateur historique sont supérieures à 90%. Il existe donc un potentiel certain d’accroissement de la concurrence dans l’Union, ce qui devrait se traduire dans les années futures par une baisse de la part de marché moyenne détenue par les opérateurs historiques. Une évolution positive a déjà été enregistrée entre décembre 2003 et décembre 2005, cette part étant passée de 70.3% à 63.9%. En revanche, il n’y a pas eu de changements majeurs dans notre pays au cours de la même période et aucune tendance claire ne se dessine. Ainsi, la part de marché de l’opérateur historique est passée de 59.9% à 60.6% entre décembre 2003 et décembre 2004, pour finalement redescendre à 58.5% en décembre 2005.
3 - Extrait du 12ème rapport d’implémentation de l’UE étendu à la Suisse
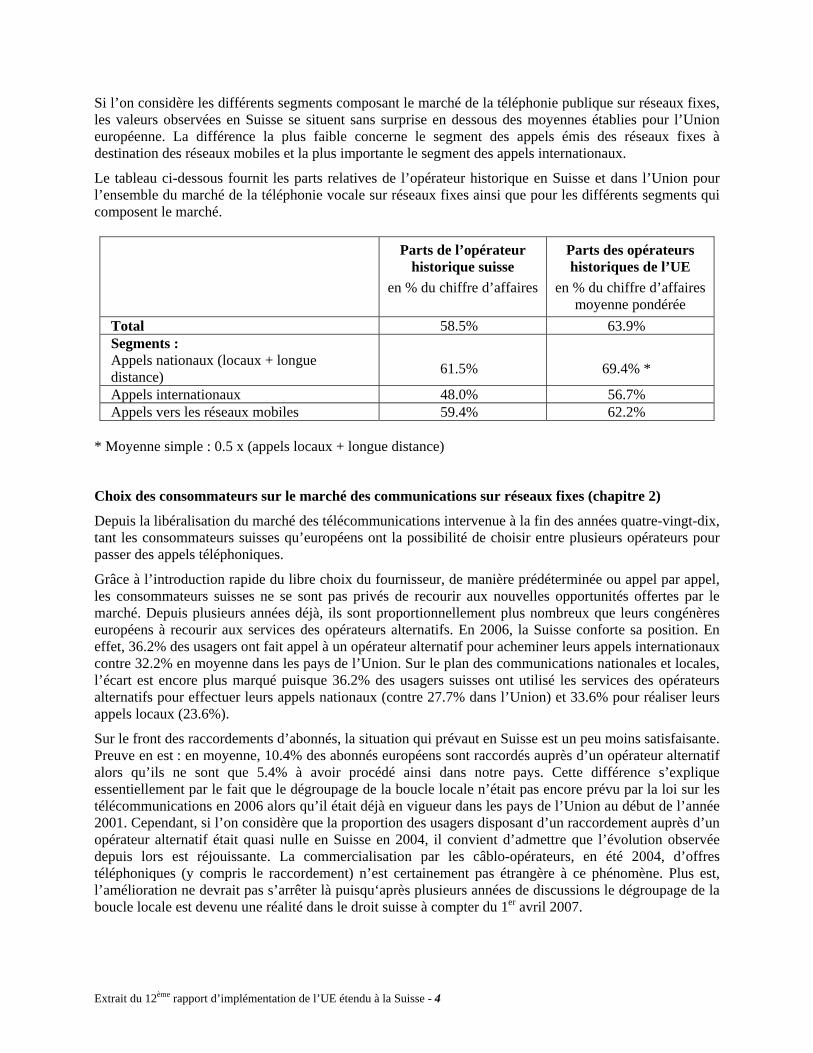
Si l’on considère les différents segments composant le marché de la téléphonie publique sur réseaux fixes, les valeurs observées en Suisse se situent sans surprise en dessous des moyennes établies pour l’Union européenne. La différence la plus faible concerne le segment des appels émis des réseaux fixes à destination des réseaux mobiles et la plus importante le segment des appels internationaux.
Le tableau ci-dessous fournit les parts relatives de l’opérateur historique en Suisse et dans l’Union pour l’ensemble du marché de la téléphonie vocale sur réseaux fixes ainsi que pour les différents segments qui composent le marché.
Parts de l’opérateur historique suisse
en % du chiffre d’affaires
Parts des opérateurs historiques de l’UE
en % du chiffre d’affairesmoyenne pondérée
Total 58.5% 63.9% Segments : Appels nationaux (locaux + longue distance)
61.5%
69.4% *
Appels internationaux 48.0% 56.7% Appels vers les réseaux mobiles 59.4% 62.2%
* Moyenne simple : 0.5 x (appels locaux + longue distance)
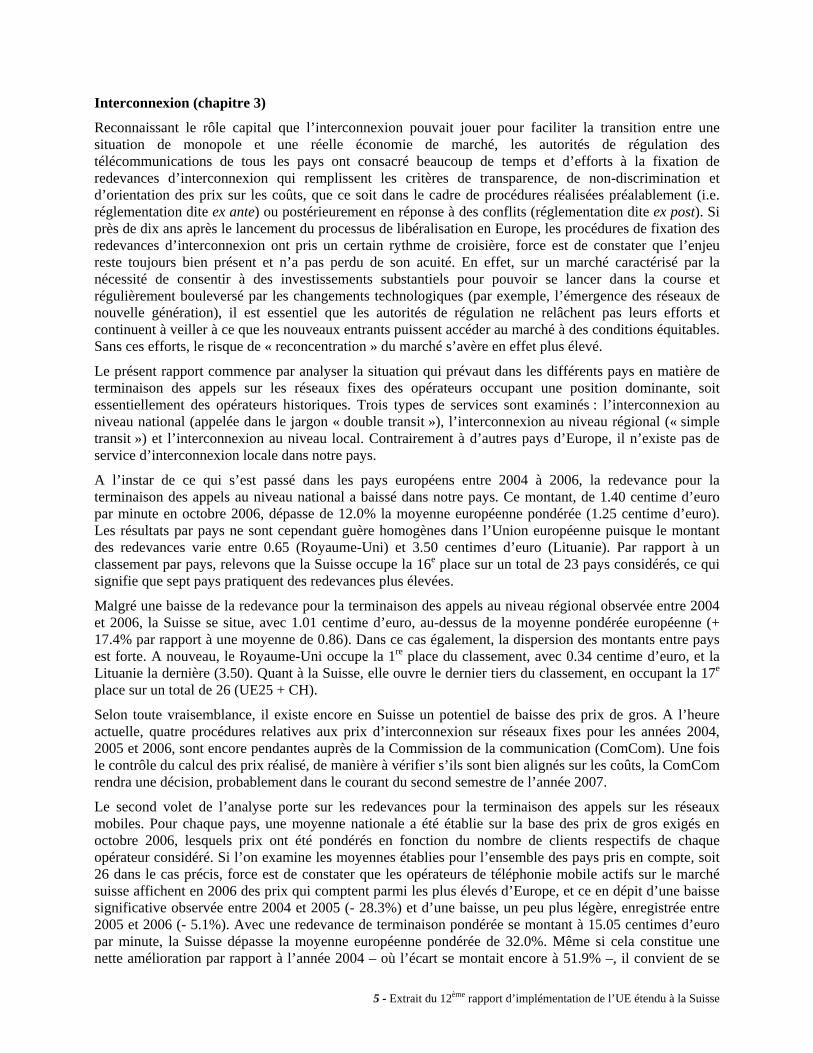
Choix des consommateurs sur le marché des communications sur réseaux fixes (chapitre 2)
Depuis la libéralisation du marché des télécommunications intervenue à la fin des années quatre-vingt-dix, tant les consommateurs suisses qu’européens ont la possibilité de choisir entre plusieurs opérateurs pour passer des appels téléphoniques.
Grâce à l’introduction rapide du libre choix du fournisseur, de manière prédéterminée ou appel par appel, les consommateurs suisses ne se sont pas privés de recourir aux nouvelles opportunités offertes par le marché. Depuis plusieurs années déjà, ils sont proportionnellement plus nombreux que leurs congénères européens à recourir aux services des opérateurs alternatifs. En 2006, la Suisse conforte sa position. En effet, 36.2% des usagers ont fait appel à un opérateur alternatif pour acheminer leurs appels internationaux contre 32.2% en moyenne dans les pays de l’Union. Sur le plan des communications nationales et locales, l’écart est encore plus marqué puisque 36.2% des usagers suisses ont utilisé les services des opérateurs alternatifs pour effectuer leurs appels nationaux (contre 27.7% dans l’Union) et 33.6% pour réaliser leurs appels locaux (23.6%).
Sur le front des raccordements d’abonnés, la situation qui prévaut en Suisse est un peu moins satisfaisante. Preuve en est : en moyenne, 10.4% des abonnés européens sont raccordés auprès d’un opérateur alternatif alors qu’ils ne sont que 5.4% à avoir procédé ainsi dans notre pays. Cette différence s’explique essentiellement par le fait que le dégroupage de la boucle locale n’était pas encore prévu par la loi sur les télécommunications en 2006 alors qu’il était déjà en vigueur dans les pays de l’Union au début de l’année 2001. Cependant, si l’on considère que la proportion des usagers disposant d’un raccordement auprès d’un opérateur alternatif était quasi nulle en Suisse en 2004, il convient d’admettre que l’évolution observée depuis lors est réjouissante. La commercialisation par les câblo-opérateurs, en été 2004, d’offres téléphoniques (y compris le raccordement) n’est certainement pas étrangère à ce phénomène. Plus est, l’amélioration ne devrait pas s’arrêter là puisqu‘après plusieurs années de discussions le dégroupage de la boucle locale est devenu une réalité dans le droit suisse à compter du 1er avril 2007.
Extrait du 12ème rapport d’implémentation de l’UE étendu à la Suisse - 4
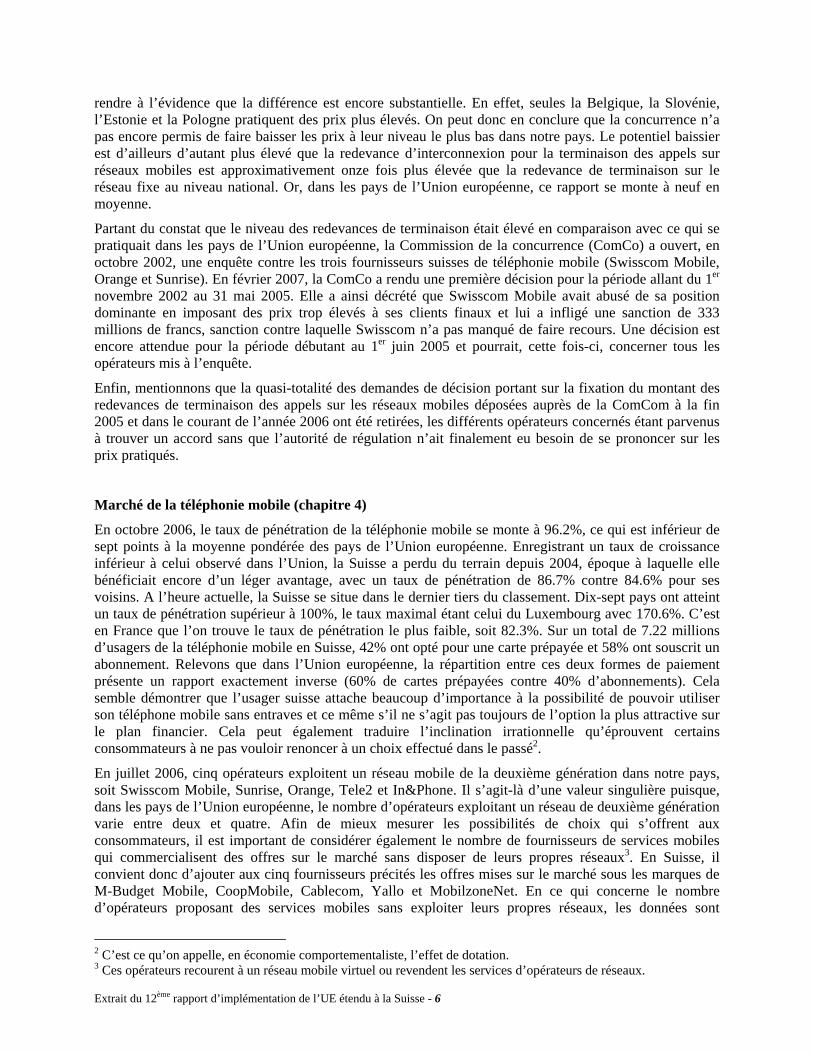
Interconnexion (chapitre 3)
Reconnaissant le rôle capital que l’interconnexion pouvait jouer pour faciliter la transition entre une situation de monopole et une réelle économie de marché, les autorités de régulation des télécommunications de tous les pays ont consacré beaucoup de temps et d’efforts à la fixation de redevances d’interconnexion qui remplissent les critères de transparence, de non-discrimination et d’orientation des prix sur les coûts, que ce soit dans le cadre de procédures réalisées préalablement (i.e. réglementation dite ex ante) ou postérieurement en réponse à des conflits (réglementation dite ex post). Si près de dix ans après le lancement du processus de libéralisation en Europe, les procédures de fixation des redevances d’interconnexion ont pris un certain rythme de croisière, force est de constater que l’enjeu reste toujours bien présent et n’a pas perdu de son acuité. En effet, sur un marché caractérisé par la nécessité de consentir à des investissements substantiels pour pouvoir se lancer dans la course et régulièrement bouleversé par les changements technologiques (par exemple, l’émergence des réseaux de nouvelle génération), il est essentiel que les autorités de régulation ne relâchent pas leurs efforts et continuent à veiller à ce que les nouveaux entrants puissent accéder au marché à des conditions équitables. Sans ces efforts, le risque de « reconcentration » du marché s’avère en effet plus élevé.
Le présent rapport commence par analyser la situation qui prévaut dans les différents pays en matière de terminaison des appels sur les réseaux fixes des opérateurs occupant une position dominante, soit essentiellement des opérateurs historiques. Trois types de services sont examinés : l’interconnexion au niveau national (appelée dans le jargon « double transit »), l’interconnexion au niveau régional (« simple transit ») et l’interconnexion au niveau local. Contrairement à d’autres pays d’Europe, il n’existe pas de service d’interconnexion locale dans notre pays.
A l’instar de ce qui s’est passé dans les pays européens entre 2004 à 2006, la redevance pour la terminaison des appels au niveau national a baissé dans notre pays. Ce montant, de 1.40 centime d’euro par minute en octobre 2006, dépasse de 12.0% la moyenne européenne pondérée (1.25 centime d’euro). Les résultats par pays ne sont cependant guère homogènes dans l’Union européenne puisque le montant des redevances varie entre 0.65 (Royaume-Uni) et 3.50 centimes d’euro (Lituanie). Par rapport à un classement par pays, relevons que la Suisse occupe la 16e place sur un total de 23 pays considérés, ce qui signifie que sept pays pratiquent des redevances plus élevées.
Malgré une baisse de la redevance pour la terminaison des appels au niveau régional observée entre 2004 et 2006, la Suisse se situe, avec 1.01 centime d’euro, au-dessus de la moyenne pondérée européenne (+ 17.4% par rapport à une moyenne de 0.86). Dans ce cas également, la dispersion des montants entre pays est forte. A nouveau, le Royaume-Uni occupe la 1re place du classement, avec 0.34 centime d’euro, et la Lituanie la dernière (3.50). Quant à la Suisse, elle ouvre le dernier tiers du classement, en occupant la 17e place sur un total de 26 (UE25 + CH).
Selon toute vraisemblance, il existe encore en Suisse un potentiel de baisse des prix de gros. A l’heure actuelle, quatre procédures relatives aux prix d’interconnexion sur réseaux fixes pour les années 2004, 2005 et 2006, sont encore pendantes auprès de la Commission de la communication (ComCom). Une fois le contrôle du calcul des prix réalisé, de manière à vérifier s’ils sont bien alignés sur les coûts, la ComCom rendra une décision, probablement dans le courant du second semestre de l’année 2007.
Le second volet de l’analyse porte sur les redevances pour la terminaison des appels sur les réseaux mobiles. Pour chaque pays, une moyenne nationale a été établie sur la base des prix de gros exigés en octobre 2006, lesquels prix ont été pondérés en fonction du nombre de clients respectifs de chaque opérateur considéré. Si l’on examine les moyennes établies pour l’ensemble des pays pris en compte, soit 26 dans le cas précis, force est de constater que les opérateurs de téléphonie mobile actifs sur le marché suisse affichent en 2006 des prix qui comptent parmi les plus élevés d’Europe, et ce en dépit d’une baisse significative observée entre 2004 et 2005 (- 28.3%) et d’une baisse, un peu plus légère, enregistrée entre 2005 et 2006 (- 5.1%). Avec une redevance de terminaison pondérée se montant à 15.05 centimes d’euro par minute, la Suisse dépasse la moyenne européenne pondérée de 32.0%. Même si cela constitue une nette amélioration par rapport à l’année 2004 – où l’écart se montait encore à 51.9% –, il convient de se
5 - Extrait du 12ème rapport d’implémentation de l’UE étendu à la Suisse
rendre à l’évidence que la différence est encore substantielle. En effet, seules la Belgique, la Slovénie, l’Estonie et la Pologne pratiquent des prix plus élevés. On peut donc en conclure que la concurrence n’a pas encore permis de faire baisser les prix à leur niveau le plus bas dans notre pays. Le potentiel baissier est d’ailleurs d’autant plus élevé que la redevance d’interconnexion pour la terminaison des appels sur réseaux mobiles est approximativement onze fois plus élevée que la redevance de terminaison sur le réseau fixe au niveau national. Or, dans les pays de l’Union européenne, ce rapport se monte à neuf en moyenne.
Partant du constat que le niveau des redevances de terminaison était élevé en comparaison avec ce qui se pratiquait dans les pays de l’Union européenne, la Commission de la concurrence (ComCo) a ouvert, en octobre 2002, une enquête contre les trois fournisseurs suisses de téléphonie mobile (Swisscom Mobile, Orange et Sunrise). En février 2007, la ComCo a rendu une première décision pour la période allant du 1er novembre 2002 au 31 mai 2005. Elle a ainsi décrété que Swisscom Mobile avait abusé de sa position dominante en imposant des prix trop élevés à ses clients finaux et lui a infligé une sanction de 333 millions de francs, sanction contre laquelle Swisscom n’a pas manqué de faire recours. Une décision est encore attendue pour la période débutant au 1er juin 2005 et pourrait, cette fois-ci, concerner tous les opérateurs mis à l’enquête.
Enfin, mentionnons que la quasi-totalité des demandes de décision portant sur la fixation du montant des redevances de terminaison des appels sur les réseaux mobiles déposées auprès de la ComCom à la fin 2005 et dans le courant de l’année 2006 ont été retirées, les différents opérateurs concernés étant parvenus à trouver un accord sans que l’autorité de régulation n’ait finalement eu besoin de se prononcer sur les prix pratiqués.
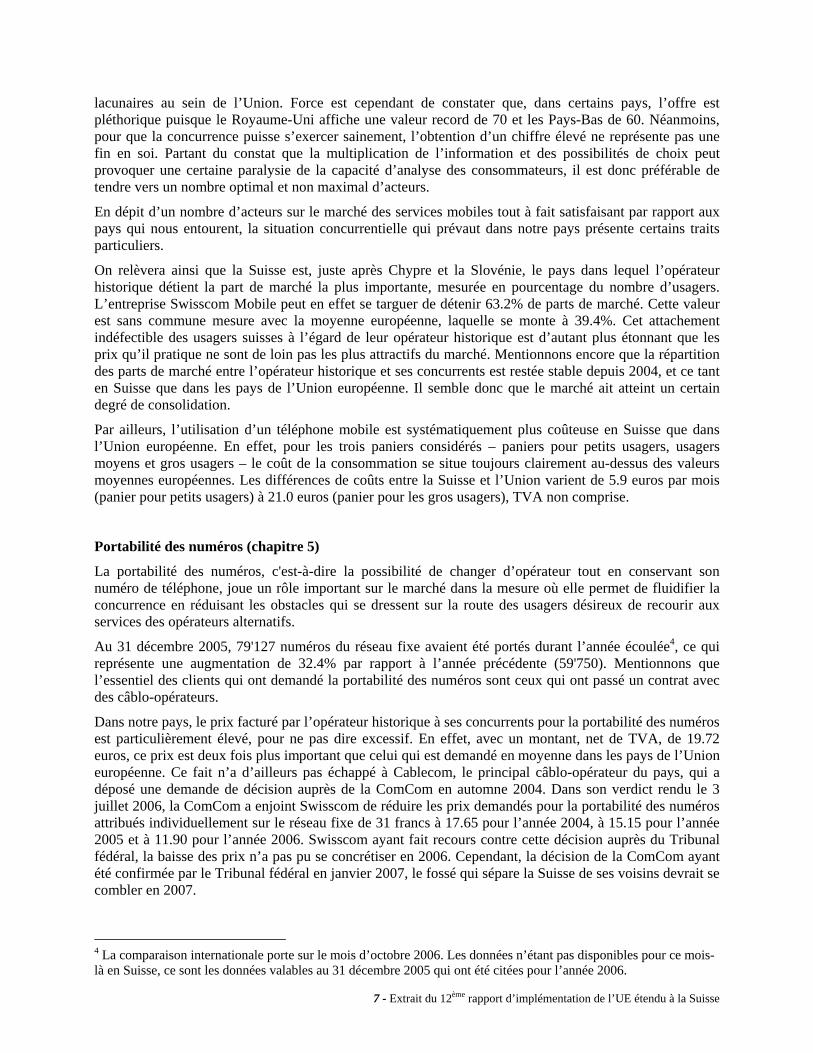
Marché de la téléphonie mobile (chapitre 4)
En octobre 2006, le taux de pénétration de la téléphonie mobile se monte à 96.2%, ce qui est inférieur de sept points à la moyenne pondérée des pays de l’Union européenne. Enregistrant un taux de croissance inférieur à celui observé dans l’Union, la Suisse a perdu du terrain depuis 2004, époque à laquelle elle bénéficiait encore d’un léger avantage, avec un taux de pénétration de 86.7% contre 84.6% pour ses voisins. A l’heure actuelle, la Suisse se situe dans le dernier tiers du classement. Dix-sept pays ont atteint un taux de pénétration supérieur à 100%, le taux maximal étant celui du Luxembourg avec 170.6%. C’est en France que l’on trouve le taux de pénétration le plus faible, soit 82.3%. Sur un total de 7.22 millions d’usagers de la téléphonie mobile en Suisse, 42% ont opté pour une carte prépayée et 58% ont souscrit un abonnement. Relevons que dans l’Union européenne, la répartition entre ces deux formes de paiement présente un rapport exactement inverse (60% de cartes prépayées contre 40% d’abonnements). Cela semble démontrer que l’usager suisse attache beaucoup d’importance à la possibilité de pouvoir utiliser son téléphone mobile sans entraves et ce même s’il ne s’agit pas toujours de l’option la plus attractive sur le plan financier. Cela peut également traduire l’inclination irrationnelle qu’éprouvent certains consommateurs à ne pas vouloir renoncer à un choix effectué dans le passé2.
En juillet 2006, cinq opérateurs exploitent un réseau mobile de la deuxième génération dans notre pays, soit Swisscom Mobile, Sunrise, Orange, Tele2 et In&Phone. Il s’agit-là d’une valeur singulière puisque, dans les pays de l’Union européenne, le nombre d’opérateurs exploitant un réseau de deuxième génération varie entre deux et quatre. Afin de mieux mesurer les possibilités de choix qui s’offrent aux consommateurs, il est important de considérer également le nombre de fournisseurs de services mobiles qui commercialisent des offres sur le marché sans disposer de leurs propres réseaux3. En Suisse, il convient donc d’ajouter aux cinq fournisseurs précités les offres mises sur le marché sous les marques de M-Budget Mobile, CoopMobile, Cablecom, Yallo et MobilzoneNet. En ce qui concerne le nombre d’opérateurs proposant des services mobiles sans exploiter leurs propres réseaux, les données sont
2 C’est ce qu’on appelle, en économie comportementaliste, l’effet de dotation. 3 Ces opérateurs recourent à un réseau mobile virtuel ou revendent les services d’opérateurs de réseaux.
Extrait du 12ème rapport d’implémentation de l’UE étendu à la Suisse - 6
lacunaires au sein de l’Union. Force est cependant de constater que, dans certains pays, l’offre est pléthorique puisque le Royaume-Uni affiche une valeur record de 70 et les Pays-Bas de 60. Néanmoins, pour que la concurrence puisse s’exercer sainement, l’obtention d’un chiffre élevé ne représente pas une fin en soi. Partant du constat que la multiplication de l’information et des possibilités de choix peut provoquer une certaine paralysie de la capacité d’analyse des consommateurs, il est donc préférable de tendre vers un nombre optimal et non maximal d’acteurs.
En dépit d’un nombre d’acteurs sur le marché des services mobiles tout à fait satisfaisant par rapport aux pays qui nous entourent, la situation concurrentielle qui prévaut dans notre pays présente certains traits particuliers.
On relèvera ainsi que la Suisse est, juste après Chypre et la Slovénie, le pays dans lequel l’opérateur historique détient la part de marché la plus importante, mesurée en pourcentage du nombre d’usagers. L’entreprise Swisscom Mobile peut en effet se targuer de détenir 63.2% de parts de marché. Cette valeur est sans commune mesure avec la moyenne européenne, laquelle se monte à 39.4%. Cet attachement indéfectible des usagers suisses à l’égard de leur opérateur historique est d’autant plus étonnant que les prix qu’il pratique ne sont de loin pas les plus attractifs du marché. Mentionnons encore que la répartition des parts de marché entre l’opérateur historique et ses concurrents est restée stable depuis 2004, et ce tant en Suisse que dans les pays de l’Union européenne. Il semble donc que le marché ait atteint un certain degré de consolidation.
Par ailleurs, l’utilisation d’un téléphone mobile est systématiquement plus coûteuse en Suisse que dans l’Union européenne. En effet, pour les trois paniers considérés – paniers pour petits usagers, usagers moyens et gros usagers – le coût de la consommation se situe toujours clairement au-dessus des valeurs moyennes européennes. Les différences de coûts entre la Suisse et l’Union varient de 5.9 euros par mois (panier pour petits usagers) à 21.0 euros (panier pour les gros usagers), TVA non comprise.
Portabilité des numéros (chapitre 5)
La portabilité des numéros, c'est-à-dire la possibilité de changer d’opérateur tout en conservant son numéro de téléphone, joue un rôle important sur le marché dans la mesure où elle permet de fluidifier la concurrence en réduisant les obstacles qui se dressent sur la route des usagers désireux de recourir aux services des opérateurs alternatifs.
Au 31 décembre 2005, 79'127 numéros du réseau fixe avaient été portés durant l’année écoulée4, ce qui représente une augmentation de 32.4% par rapport à l’année précédente (59'750). Mentionnons que l’essentiel des clients qui ont demandé la portabilité des numéros sont ceux qui ont passé un contrat avec des câblo-opérateurs.
Dans notre pays, le prix facturé par l’opérateur historique à ses concurrents pour la portabilité des numéros est particulièrement élevé, pour ne pas dire excessif. En effet, avec un montant, net de TVA, de 19.72 euros, ce prix est deux fois plus important que celui qui est demandé en moyenne dans les pays de l’Union européenne. Ce fait n’a d’ailleurs pas échappé à Cablecom, le principal câblo-opérateur du pays, qui a déposé une demande de décision auprès de la ComCom en automne 2004. Dans son verdict rendu le 3 juillet 2006, la ComCom a enjoint Swisscom de réduire les prix demandés pour la portabilité des numéros attribués individuellement sur le réseau fixe de 31 francs à 17.65 pour l’année 2004, à 15.15 pour l’année 2005 et à 11.90 pour l’année 2006. Swisscom ayant fait recours contre cette décision auprès du Tribunal fédéral, la baisse des prix n’a pas pu se concrétiser en 2006. Cependant, la décision de la ComCom ayant été confirmée par le Tribunal fédéral en janvier 2007, le fossé qui sépare la Suisse de ses voisins devrait se combler en 2007.
4 La comparaison internationale porte sur le mois d’octobre 2006. Les données n’étant pas disponibles pour ce mois-là en Suisse, ce sont les données valables au 31 décembre 2005 qui ont été citées pour l’année 2006.
7 - Extrait du 12ème rapport d’implémentation de l’UE étendu à la Suisse
En ce qui concerne les réseaux mobiles, on comptait 99'072 portages de numéros au 31 décembre 20053, ce qui représente une augmentation de 50.6% par rapport à l’année précédente (65'799). Là également, le prix demandé par l’opérateur historique suisse est relativement élevé en comparaison avec les pays de l’Union. Preuve en est, la moyenne pondérée européenne se monte à 12.3 euros contre 18.45 euros pour la Suisse, ce qui représente 50.0% de plus. Seuls deux pays affichent des prix plus élevés, soit l’Allemagne et l’Irlande.
Accès à la large bande et prix (chapitre 6)
En 2006, l’obligation, pour l’opérateur occupant une position dominante sur le marché, de fournir à ses concurrents l’accès totalement dégroupé à la boucle locale, l’accès partagé à la boucle locale et l’accès à haut débit (« bitstream access ») n’était toujours pas prévue par la loi suisse sur les télécommunications5. Dans un tel contexte, les nouveaux entrants sur le marché désireux d’offrir des services à large bande sur le marché de détails sont obligés soit de procéder à des investissements pour construire leurs propres infrastructures, soit de revendre un service en gros acheté auprès de l’opérateur historique. Le marché de gros étant réduit à sa portion congrue dans notre pays, il n’a pas été possible de procéder à des comparaisons avec les pays qui nous entourent. En conséquence, l’analyse développée dans le présent rapport ne porte que sur le marché de détail des raccordements à large bande.
Compte tenu de son exiguïté territoriale, la Suisse est un marché modeste au sein de l’Union européenne. Avec 1'950'000 accès à large bande, elle représente 2.6% du volume européen.
A l’instar de la tendance observée dans la plupart des pays européens, le marché des accès à large bande suisse enregistre un taux de croissance modéré par rapport aux années précédentes, soit une augmentation de 23% entre octobre 2005 et octobre 2006. La diminution du taux de croissance s’explique essentiellement par le fait que la diffusion du service a atteint un certain seuil et que le marché a gagné en maturité. En octobre 2006, la Suisse affiche un taux de pénétration des raccordements à large bande de 26.0% (mesuré par habitant), ce qui la place dans le peloton de tête, à égalité avec la Finlande et juste derrière les Pays-Bas (29.8%) et le Danemark (29.4%). On relèvera que ces taux sont bien plus élevés que la moyenne européenne, qui se monte quant à elle à 15.7%. Dans ces circonstances, il n’est donc pas étonnant que les pays qui connaissent un rattrapage affichent des taux de croissance plus vigoureux.
Sur les 1'950'000 accès à large bande comptabilisés en Suisse, 67% sont des raccordements ADSL et 33% des raccordements câble modem. Quant aux autres technologies d’accès6, relevons qu’elles n’ont pas été considérées dans notre pays compte tenu du rôle marginal qu’elles jouent.
En dépit d’une répartition entre les technologies d’accès plutôt plus équilibrée que la moyenne européenne – 82% d’accès DSL contre 18% d’accès via d’autres technologies dans l’Union – force est de constater que le câble perd constamment du terrain dans notre pays. Alors que les deux technologies étaient à égalité en juillet 2003, l’ADSL n’a cessé de conforter sa position depuis. Entre 2005 et 2006, cette technologie a gagné trois points, passant de 64 à 67% du total des accès à large bande. Cette évolution n’est cependant pas propre à la Suisse puisqu’on l’observe dans la majorité des pays de l’Union. Elle s’explique vraisemblablement par le fait que la technologie DSL a été pour l’essentiel déployée à partir du réseau fixe de l’opérateur historique alors que le développement de technologies alternatives est le fait d’une multitude d’opérateurs qui disposent généralement de réseaux moins vastes. Ainsi, en Suisse, la technologie ADSL est principalement contrôlée par Swisscom alors que la fourniture d’Internet à haut débit via le câble modem est assurée par une bonne cinquantaine d’opérateurs, dont le plus important est Cablecom. L’opérateur historique dispose donc d’un réseau d’envergure nationale et d’une base de clients
5 Le Parlement ayant adopté la modification de la loi sur les télécommunications, le 24 mars 2006, la situation a changé, à compter du 1er avril 2007, date d’entrée en vigueur de la dite modification. Désormais, la loi prévoit l’accès totalement dégroupé à la ligne de cuivre de l’opérateur occupant une position dominante ainsi que l’accès, pour une durée limitée à quatre ans, au haut débit. 6 Par exemple, satellite, fibre optique, PLC, lignes louées, 3G, etc.
Extrait du 12ème rapport d’implémentation de l’UE étendu à la Suisse - 8
importante via la fourniture des raccordements téléphoniques, ce qui lui confère un avantage indéniable tant du point de vue de la desserte du service que de la rentabilisation des dépenses de marketing.
Si l’on examine à présent la répartition du marché de détail entre l’opérateur historique (ou sa filiale) et les nouveaux entrants sur le marché, on observe que la situation qui prévaut dans notre pays est peu ou prou similaire à celle qui règne dans les pays de l’Union européenne. Ainsi, en 2006, 45% des accès à large bande sont directement fournis par Bluewin aux usagers finaux alors qu’en moyenne 48% des accès à haut débit sont offerts par l’opérateur historique dans les pays de l’Union. Ce rapport, qui semble équilibré, cache cependant une réalité plus nuancée. En effet, il convient de considérer qu’au fil des années l’opérateur historique suisse ne cesse de gagner des parts de marché (28% en 2003, 36% en 2004, et 41% en 2005) et que la plupart des opérateurs qui offrent des services Internet à haut débit via la technologie DSL se bornent à revendre un service acheté auprès de l’opérateur historique, ce qui limite considérablement leurs possibilités d’intervenir dans la chaîne de production de valeur. Ainsi, si l’on ajoute au nombre de raccordements à haut débit fournis directement par Bluewin aux usagers finaux le nombre de raccordements DSL commercialisés sur le marché de gros, on constate que le poids de l’opérateur historique sur le marché global du haut débit n’est plus de 45.4% mais de 66.9%. Si l’on procède de la même manière pour les pays de l’Union européenne, seuls trois d’entre eux, soit l’Allemagne, le Royaume-Uni et Malte, voient la part de marché de leur opérateur historique faire un bond de plus de 20 points.
Prix de la téléphonie fixe (chapitre 7)
En ce qui concerne le raccordement téléphonique de base (i.e. raccordement analogique), une analyse séparée a été effectuée pour le prix mensuel payé par un particulier (TVA incluse) et celui dont une entreprise doit s’acquitter (TVA non incluse). En effet, de nombreux pays pratiquent un tarif différentié contrairement à ce qui se fait chez nous. Relevons que la Suisse fut, pendant de nombreuses années, l’un des pays les plus chers d’Europe en matière de prix du raccordement. A la suite du rééquilibrage tarifaire opéré par la plupart des pays de l’Union, ce fossé est désormais comblé7. En effet, le prix d’un raccordement payé par une entreprise suisse est aujourd’hui équivalent à la moyenne pondérée établie pour l’Union européenne (14.9 euros, respectivement 14.8) et seul un euro sépare le prix payé par les particuliers (16.1 euros en Suisse contre 15.0 dans l’Union). En 2000, l’écart entre la Suisse et l’Union se montait encore à 3.1 euros dans le premier cas et à 4.4 euros dans le second.
Du point de vue du prix des communications locales, la Suisse occupe une position clairement désavantageuse en comparaison internationale. Ainsi, pour un appel d’une durée de trois minutes, seule la Belgique affiche un coût plus élevé. Pour un appel de dix minutes, notre pays se situe au 23e rang, juste avant la République tchèque, la Belgique et la Slovaquie. Relevons que cette situation est clairement imputable à l’introduction, au printemps 2002, d’un tarif national unique, indépendant de la distance.
En revanche, sur le segment du marché des communications nationales, la situation est nettement plus positive puisque le coût pour un usager suisse d’une communication nationale de trois, respectivement dix minutes, est nettement en dessous de la moyenne européenne pondérée.
Enfin, en ce qui concerne le prix des communications internationales, notre pays occupe une position exceptionnelle. En effet, si l’on considère le coût des paniers établis pour les appels internationaux (panier pour les particuliers et panier pour les entreprises), seul l’opérateur historique chypriote affiche des prix plus avantageux. De surcroît, les prix demandés en Suisse se situent très nettement en dessous de la moyenne européenne.
Malgré la baisse substantielle des prix enregistrée en Suisse depuis la libéralisation, force est de constater que la concurrence n’a pas encore eu pour effet de niveler complètement les prix des communications. Ainsi, si l’on compare l’opérateur historique à son principal concurrent, on constate que le coût d’une
7 Depuis janvier 1995, le prix mensuel du raccordement analogique, net de TVA, n’a pas varié en Suisse.
9 - Extrait du 12ème rapport d’implémentation de l’UE étendu à la Suisse
communication nationale est inférieur, chez Sunrise, de 19.4% pour une communication de trois minutes et de 9.4% pour une communication de dix minutes. Même sur le front des communications internationales, où les prix sont déjà extrêmement bas en Suisse, il est possible de réaliser des économies allant de 12.5 à 28.6% selon les destinations appelées. Si Sunrise est le principal concurrent de Swisscom, cela ne signifie cependant pas qu’il est l’opérateur le plus avantageux. Aussi, en fonction de la durée et de la destination de ses appels, l’usager suisse peut réaliser des économies encore plus substantielles s‘il le souhaite.
En 2006, notre pays affiche donc une situation tout à fait satisfaisante en matière de prix pour la téléphonie fixe. A l’exception du prix des communications locales, tous les segments de marché examinés affichent des valeurs équivalentes (cf. raccordement) ou nettement inférieures à la moyenne européenne. On signalera encore que la facturation identique d’un appel national quelle que soit la distance pénalise lourdement la Suisse lorsqu’il s’agit de calculer le coût de divers paniers de consommation. Ainsi pour les cinq paniers 2006 établis par l’OCDE8, la Suisse occupe toujours une position variant entre le 19e et le 23e rang des pays du continent européen (UE25 + CH). Ce mauvais classement s’explique en partie par le rôle important que jouent les appels locaux dans la composition des paniers9.
Tarifs des lignes louées de détails (chapitre 8)
En ce qui concerne l’offre de lignes louées sur le marché de détail, la Suisse se caractérise par une opacité presque totale. En sus de Swisscom, qui est selon toute vraisemblance le seul opérateur à bénéficier d’une couverture nationale, seule une poignée d’acteurs est présente sur le marché. La plupart du temps, le prix facturé entre l’opérateur et l’usager final est le fruit d’une négociation et peut donc varier considérablement d’un cas à l’autre. Ainsi, les rares informations que l’on parvient tout de même à glaner ne sont guère représentatives.
Faute d’informations, les comparaisons établies avec les pays membres de l’Union européenne sont l’exception dans ce rapport. Elles ne portent en effet que sur les liaisons de 64kb/s et de 2Mb/s, liaisons qui risquent de devenir de plus en plus obsolètes au fur et à mesure que le marché du haut débit se développe. Les valeurs présentées étant de surcroît peu représentatives, on a renoncé, compte tenu des circonstances, à tirer des enseignements du chapitre 8 du présent rapport.
8 Paniers pour les petits usagers résidentiels, les usagers résidentiels moyens, les gros usagers résidentiels, les petits indépendants travaillant à la maison et les petites et moyenne entreprises. 9 Selon les paniers, il y a entre 68% et 77% des appels nationaux qui sont réalisés dans un périmètre inférieur à 10 km.
Extrait du 12ème rapport d’implémentation de l’UE étendu à la Suisse - 10

ANNEX 2
MARKET OVERVIEW
11 - Extrait du 12ème rapport d’implémentation de l’UE étendu à la Suisse
SOURCES OF DATA PRESENTED IN THIS ANNEX Figures in sections 1 (fixed market), 2 (consumers’ choice of fixed operators), 3 (public network interconnection), 4 (mobile subscribers and operators), 5 (number portability) and 6 (prices for LLU) were provided by the National Regulatory Authorities (NRAs) in response to a questionnaire on regulatory market data sent by the Commission in July 2006.
Data on mobile subscribers (section 4) refer to October 2006 and come from the NRAs unless otherwise specified.
Data in section 6 on broadband access are provided by the NRAs and the national ministries through the Electronic Communications Committee (COCOM). Data have been collected since July 2002 three times a year, in January, June and October. The figures in this report refer to 1 October 2006 unless otherwise specified.
Information in sections 7and 8 (PSTN and retail leased lines prices) and partly in section 4 (mobile tariffs) is taken from a study carried out for the Commission by Teligen, Harris Interactive UK. These data are collected from primary sources (i.e. directly from the incumbent operators and new entrants) and checked by the NRAs. All NRAs, with the exception of Ireland, Italy, Latvia, Slovenia and Poland provided comments and approved these data.
A validation meeting with representatives from NRAs took place in November 2006. Furthermore, a draft version of the charts in this annex (excluding section 7, 8 and 4.4) was distributed to the NRAs before this report was finalised.
Extrait du 12ème rapport d’implémentation de l’UE étendu à la Suisse - 12
TABLE OF CONTENTS 1. FIXED MARKET .................................................................................................................................................. 15
1.1. PLAYERS IN THE FIXED MARKET ..................................................................................................................... 15 1.2. INCUMBENTS’ MARKET SHARE IN THE FIXED VOICE TELEPHONY MARKET .................................................. 20
2. CONSUMERS’ CHOICE OF FIXED OPERATORS ........................................................................................ 29 2.1. PERCENTAGE OF SUBSCRIBERS ACTUALLY USING AN ALTERNATIVE PROVIDER OTHER THAN THE INCUMBENT ............................................................................................................................................................. 29 2.2. FACILITIES USED BY NEW ENTRANTS FOR THE PROVISION OF VOICE TELEPHONY ....................................... 32
3. PUBLIC NETWORK INTERCONNECTION ................................................................................................... 35 3.1. CALL TERMINATION ON INCUMBENT'S FIXED NETWORK ............................................................................... 35 3.2. CALL TERMINATION ON ALTERNATIVE OPERATORS' FIXED NETWORKS ....................................................... 39 3.3. CALL TERMINATION ON MOBILE NETWORKS ................................................................................................. 40 3.4. LEASED LINES INTERCONNECTION CHARGES ................................................................................................. 45
4. MOBILE MARKET .............................................................................................................................................. 49 4.1. MOBILE PENETRATION .................................................................................................................................... 49 4.2. PLAYERS IN THE MOBILE MARKET .................................................................................................................. 53 4.3. MOBILE OPERATORS’ MARKET SHARES.......................................................................................................... 55 4.4. MOBILE TARIFFS ............................................................................................................................................. 58
5. NUMBER PORTABILITY ................................................................................................................................... 68 5.1. FIXED NUMBER PORTABILITY.......................................................................................................................... 68 5.2. MOBILE NUMBER PORTABILITY ...................................................................................................................... 69
6. BROADBAND ACCESS AND PRICING ........................................................................................................... 71 6.1. BROADBAND ACCESS DEFINITIONS .................................................................................................................. 71 6.2. WHOLESALE ACCESS ....................................................................................................................................... 72 6.3. RETAIL BROADBAND ACCESS........................................................................................................................... 74 6.4. PRICES FOR UNBUNDLED LOCAL LOOP............................................................................................................ 86
7. PUBLIC VOICE TELEPHONY TARIFFS......................................................................................................... 90 7.1. CHARGING SYSTEM.......................................................................................................................................... 90 7.2. MONTHLY RENTAL CHARGED BY THE INCUMBENT OPERATORS.................................................................... 93 7.3. AVERAGE MONTHLY EXPENDITURE (COMPOSITE CALL BASKET) .................................................................. 96 7.4. PRICE OF FIXED NATIONAL CALLS BY THE INCUMBENT OPERATOR ............................................................ 103 7.5. TREND OF THE BASKET FOR FIXED NATIONAL CALLS (NATIONAL BASKET) ................................................ 107 7.6. PRICE OF FIXED NATIONAL CALLS BY ALTERNATIVE OPERATORS............................................................... 108 7.7 INCUMBENT OPERATOR PRICE FOR AN AVERAGE FIXED INTERNATIONAL CALL (INTERNATIONAL CALL BASKET) ................................................................................................................................................................ 110 7.8. INCUMBENT OPERATOR PRICE OF CALLS TO EU, JAPAN, USA.................................................................... 113 7.9. ALTERNATIVE OPERATORS’ PRICE FOR FIXED INTERNATIONAL CALLS ...................................................... 116
8. LEASED LINES RETAIL TARIFFS ................................................................................................................ 119 8.1. INCUMBENTS' NATIONAL LEASED LINES ....................................................................................................... 119 8.2. NATIONAL LEASED LINES PRICE TRENDS (1 AUGUST 1998 - 1 SEPTEMBER 2006) ........................................ 126 8.3. INTERNATIONAL LEASED LINES PRICES ........................................................................................................ 129 8.4. INTERNATIONAL LEASED LINES PRICE TRENDS (1 AUGUST 1998 - 1 SEPTEMBER 2006) ............................. 134 8.5. EXCHANGE RATE USED (EXCEPT TARIFFS). .................................................................................................. 135 8.6. EXCHANGE RATE USED FOR TARIFF (ON THE MOBILE TARIFF - SECTION 4, PUBLIC VOICE TELEPHONY TARIFFS - SECTION 7 AND LEASED LINE TARIFFS - SECTION 8)............................................................................ 135 8.7. POPULATION .................................................................................................................................................. 136
13 - Extrait du 12ème rapport d’implémentation de l’UE étendu à la Suisse
9. OECD TELECOMMUNICATIONS BASKET DEFINITIONS ..................................................................... 137 9.1. NATIONAL PSTN BASKET.............................................................................................................................. 137 9.2. INTERNATIONAL PSTN BASKET .................................................................................................................... 138 9.3. COMPOSITE NATIONAL – INTERNATIONAL BASKET...................................................................................... 138 9.4. NEW OECD BASKETS FOR PSTN 2006 ......................................................................................................... 139 9.5. OECD MOBILE BASKETS 2002 ...................................................................................................................... 140 9.6. NEW OECD MOBILE BASKETS 2006 ............................................................................................................. 142
Extrait du 12ème rapport d’implémentation de l’UE étendu à la Suisse - 14
1. FIXED MARKET
This section looks at the number of fixed telecommunications operators (fixed voice telephony and network services) and at the level of competition in the fixed market. It includes data on the number of fixed network operators and public fixed voice telephony operators authorised to provide public voice telephony and to operate a public network at July 2006. The estimated number of players actually active in the fixed market and the incumbents’ market shares in the fixed voice telephony market have also been shown.
Data on the number of operators refer to July 2006, while data on the incumbents’ market shares in the fixed voice telephony market refer to the end of 2005.
Information have been provided by national regulatory authorities.
1.1. Players in the fixed market
Under the new regulatory framework for electronic communications, operators are only subject to a general authorization regime. Undertakings may be required to submit a notification but may not be required to obtain an explicit decision or any other administrative act. Granting of individual rights of use is required only for scarce resources such as radio spectrum or numbers.
Given the above, the database set up by the national authorities may be very different across the Member States and may include a variety of operators: fixed network operators, service providers, voice over IP services, cable operators as well as wireless local loop, and mobile and satellite operators for the fixed part of their networks and services.
Some Member States are now not able to provide detailed information on the number and types of services provided by the operators that may include other services in addition to public telephony and/or public network services. Therefore, the figures on the number of operators should be considered only as estimates. Furthermore, in some Member States the figure for 2006 is not comparable with the previous implementation reports given the change in the authorization regime.
The figures do not take into account operators acting as resellers or offering services based exclusively on pre-paid cards. The figures include cable TV operators that also provide voice telephony or network services.
Concerning the operators providing voice over IP services, they are excluded in Belgium, Czech Republic, Greece, Cyprus, Luxembourg, Hungary, Poland, and included in Estonia, France, Latvia, Malta, Austria, Portugal and Sweden. In Belgium, Ireland, Lithuania VoIP operators are included only if they provide a PATS10-like service. No information is available for Denmark, Spain, Italy, The Netherlands, Slovakia and Finland. In Germany and United Kingdom some VoIP operators might be included.
While it is difficult to measure the exact difference since 2005, data shows that there has been an increase in the number of operators authorised to provided fixed services, even if to a lower extent than in previous years. Around 50% of the authorised operators were actually providing services as of July 2006.
As of December 2005 the total number of major competing operators (i.e. operators that along with the incumbent operator have a combined market share of around 90% of the global telephony market) in the EU is around 94. Only in seven Member States there are five or more major competing operators. In six new Member States, competition is still at an early stage with the incumbents' retaining more than 90% of the market and a low level of competiton mainly concentrated in the international calls market.
Data on the number of operators were provided by the national regulatory authorities and refer to July 2006. Data on the number of major competing players refer to December 2005.
10 PATS = Publicly Available Telephone Service as opposed to ECS (Electronic Communication Services) operators who have less obligations (number portability, authorizations).
15 - Extrait du 12ème rapport d’implémentation de l’UE étendu à la Suisse
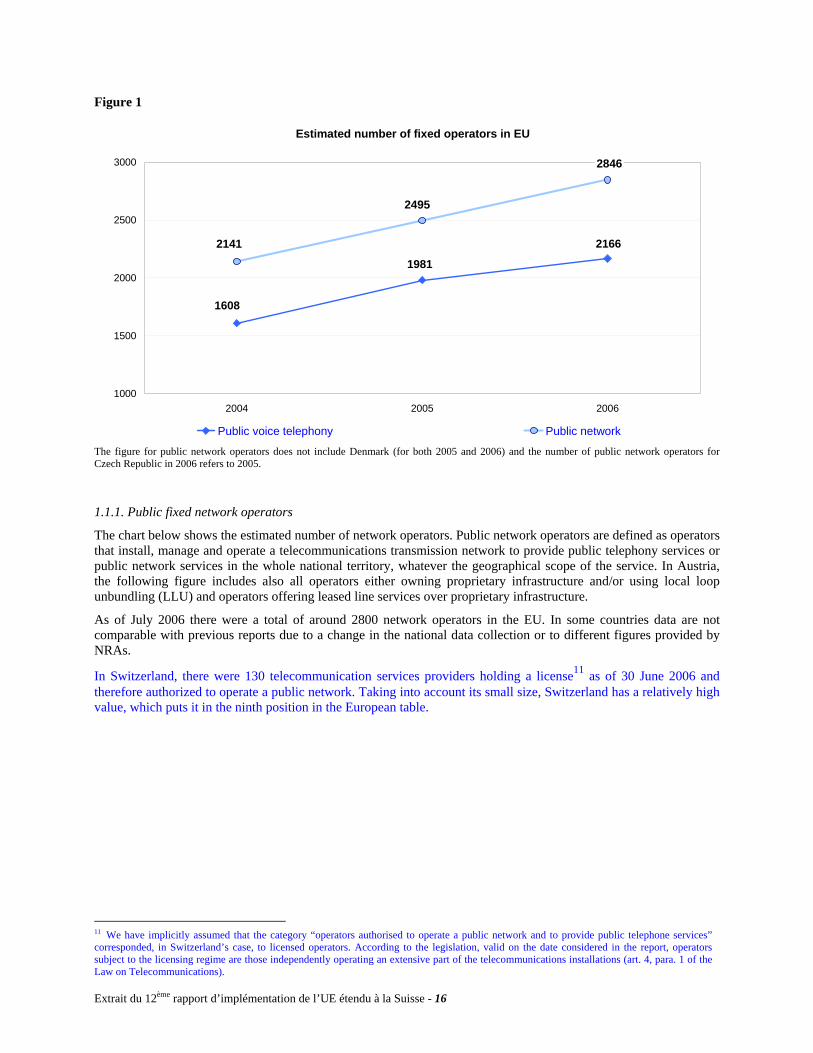
Figure 1
Estimated number of fixed operators in EU
1608
2166
1981
2495
2846
2141
1000
1500
2000
2500
3000
2004 2005 2006
Public voice telephony Public network
The figure for public network operators does not include Denmark (for both 2005 and 2006) and the number of public network operators for Czech Republic in 2006 refers to 2005. 1.1.1. Public fixed network operators
The chart below shows the estimated number of network operators. Public network operators are defined as operators that install, manage and operate a telecommunications transmission network to provide public telephony services or public network services in the whole national territory, whatever the geographical scope of the service. In Austria, the following figure includes also all operators either owning proprietary infrastructure and/or using local loop unbundling (LLU) and operators offering leased line services over proprietary infrastructure.
As of July 2006 there were a total of around 2800 network operators in the EU. In some countries data are not comparable with previous reports due to a change in the national data collection or to different figures provided by NRAs.
In Switzerland, there were 130 telecommunication services providers holding a license11 as of 30 June 2006 and therefore authorized to operate a public network. Taking into account its small size, Switzerland has a relatively high value, which puts it in the ninth position in the European table.
11 We have implicitly assumed that the category “operators authorised to operate a public network and to provide public telephone services” corresponded, in Switzerland’s case, to licensed operators. According to the legislation, valid on the date considered in the report, operators subject to the licensing regime are those independently operating an extensive part of the telecommunications installations (art. 4, para. 1 of the Law on Telecommunications).
Extrait du 12ème rapport d’implémentation de l’UE étendu à la Suisse - 16
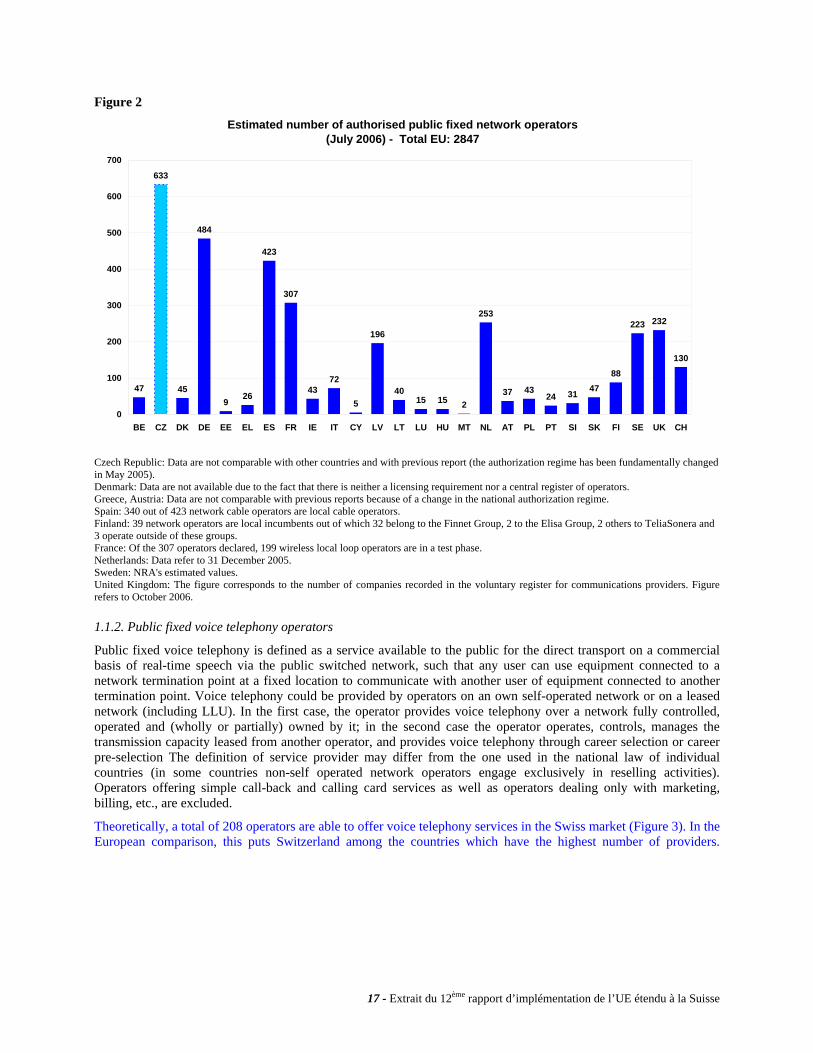
Figure 2
Estimated number of authorised public fixed network operators(July 2006) - Total EU: 2847
47
484
926
423
307
4372
5
196
4015 15 2
253
37 4324 31 47
88
223 232
130
633
45
0
100
200
300
400
500
600
700
BE CZ DK DE EE EL ES FR IE IT CY LV LT LU HU MT NL AT PL PT SI SK FI SE UK CH
Czech Republic: Data are not comparable with other countries and with previous report (the authorization regime has been fundamentally changed in May 2005). Denmark: Data are not available due to the fact that there is neither a licensing requirement nor a central register of operators. Greece, Austria: Data are not comparable with previous reports because of a change in the national authorization regime. Spain: 340 out of 423 network cable operators are local cable operators. Finland: 39 network operators are local incumbents out of which 32 belong to the Finnet Group, 2 to the Elisa Group, 2 others to TeliaSonera and 3 operate outside of these groups. France: Of the 307 operators declared, 199 wireless local loop operators are in a test phase. Netherlands: Data refer to 31 December 2005. Sweden: NRA's estimated values. United Kingdom: The figure corresponds to the number of companies recorded in the voluntary register for communications providers. Figure refers to October 2006.
1.1.2. Public fixed voice telephony operators
Public fixed voice telephony is defined as a service available to the public for the direct transport on a commercial basis of real-time speech via the public switched network, such that any user can use equipment connected to a network termination point at a fixed location to communicate with another user of equipment connected to another termination point. Voice telephony could be provided by operators on an own self-operated network or on a leased network (including LLU). In the first case, the operator provides voice telephony over a network fully controlled, operated and (wholly or partially) owned by it; in the second case the operator operates, controls, manages the transmission capacity leased from another operator, and provides voice telephony through career selection or career pre-selection The definition of service provider may differ from the one used in the national law of individual countries (in some countries non-self operated network operators engage exclusively in reselling activities). Operators offering simple call-back and calling card services as well as operators dealing only with marketing, billing, etc., are excluded.
Theoretically, a total of 208 operators are able to offer voice telephony services in the Swiss market (Figure 3). In the European comparison, this puts Switzerland among the countries which have the highest number of providers.
17 - Extrait du 12ème rapport d’implémentation de l’UE étendu à la Suisse
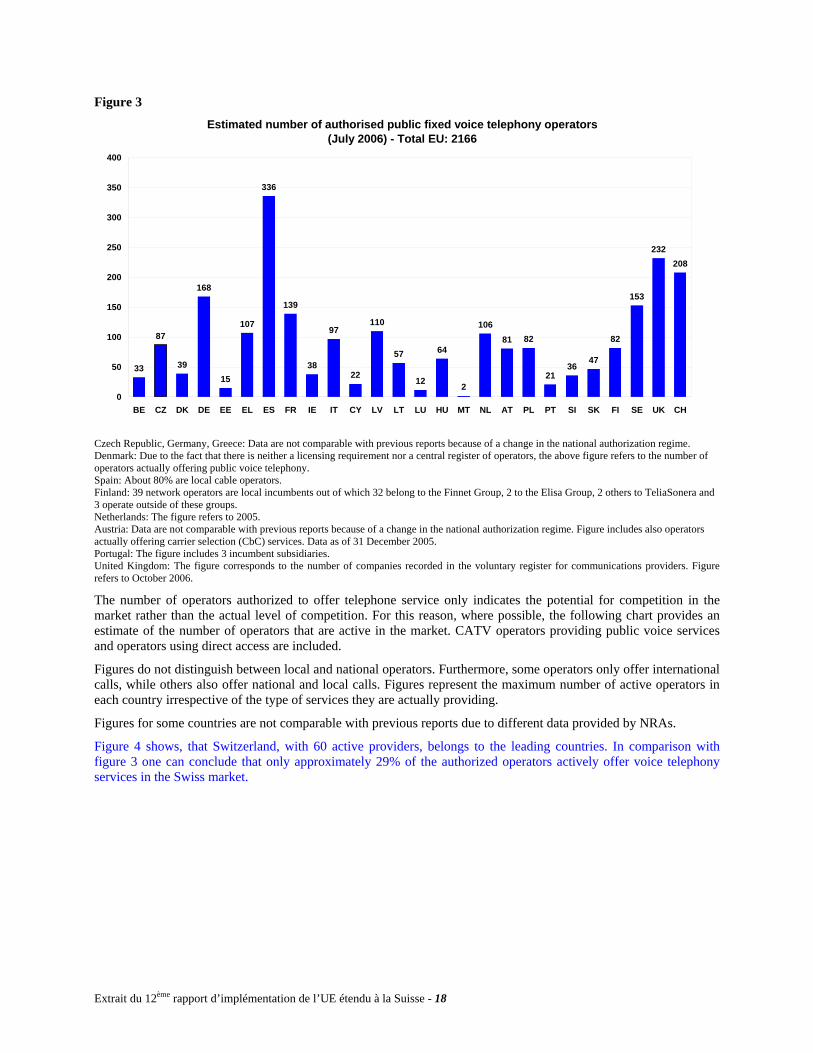
Figure 3
Estimated number of authorised public fixed voice telephony operators (July 2006) - Total EU: 2166
33
87
39
168
15
107
336
139
38
97
22
110
57
12
64
2
10681 82
2136
47
82
153
232208
0
50
100
150
200
250
300
350
400
BE CZ DK DE EE EL ES FR IE IT CY LV LT LU HU MT NL AT PL PT SI SK FI SE UK CH
Czech Republic, Germany, Greece: Data are not comparable with previous reports because of a change in the national authorization regime. Denmark: Due to the fact that there is neither a licensing requirement nor a central register of operators, the above figure refers to the number of operators actually offering public voice telephony. Spain: About 80% are local cable operators. Finland: 39 network operators are local incumbents out of which 32 belong to the Finnet Group, 2 to the Elisa Group, 2 others to TeliaSonera and 3 operate outside of these groups. Netherlands: The figure refers to 2005. Austria: Data are not comparable with previous reports because of a change in the national authorization regime. Figure includes also operators actually offering carrier selection (CbC) services. Data as of 31 December 2005. Portugal: The figure includes 3 incumbent subsidiaries. United Kingdom: The figure corresponds to the number of companies recorded in the voluntary register for communications providers. Figure refers to October 2006. The number of operators authorized to offer telephone service only indicates the potential for competition in the market rather than the actual level of competition. For this reason, where possible, the following chart provides an estimate of the number of operators that are active in the market. CATV operators providing public voice services and operators using direct access are included.
Figures do not distinguish between local and national operators. Furthermore, some operators only offer international calls, while others also offer national and local calls. Figures represent the maximum number of active operators in each country irrespective of the type of services they are actually providing.
Figures for some countries are not comparable with previous reports due to different data provided by NRAs.
Figure 4 shows, that Switzerland, with 60 active providers, belongs to the leading countries. In comparison with figure 3 one can conclude that only approximately 29% of the authorized operators actively offer voice telephony services in the Swiss market.
Extrait du 12ème rapport d’implémentation de l’UE étendu à la Suisse - 18
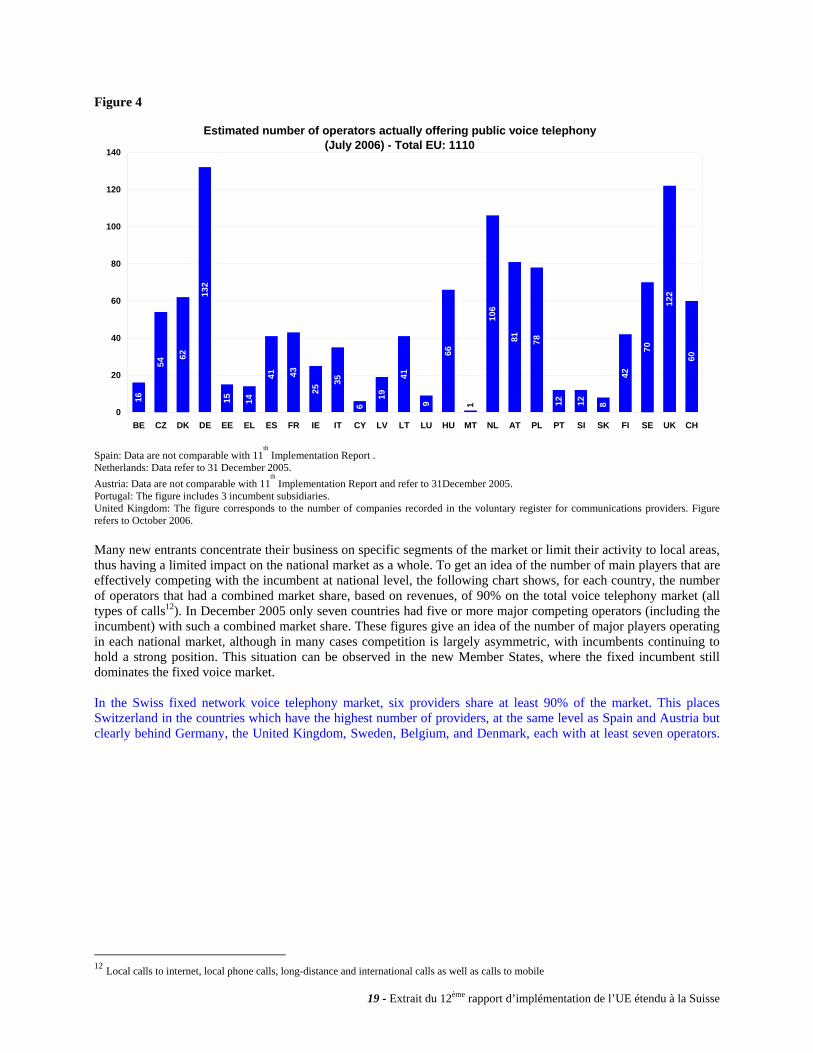
Figure 4
Estimated number of operators actually offering public voice telephony(July 2006) - Total EU: 1110
60
122
70
42
81212
7881
106
1
66
9
41
19
6
35
25
4341
1415
132
62
54
16
0
20
40
60
80
100
120
140
BE CZ DK DE EE EL ES FR IE IT CY LV LT LU HU MT NL AT PL PT SI SK FI SE UK CH
Spain: Data are not comparable with 11
th Implementation Report .
Netherlands: Data refer to 31 December 2005. Austria: Data are not comparable with 11
th Implementation Report and refer to 31December 2005.
Portugal: The figure includes 3 incumbent subsidiaries. United Kingdom: The figure corresponds to the number of companies recorded in the voluntary register for communications providers. Figure refers to October 2006. Many new entrants concentrate their business on specific segments of the market or limit their activity to local areas, thus having a limited impact on the national market as a whole. To get an idea of the number of main players that are effectively competing with the incumbent at national level, the following chart shows, for each country, the number of operators that had a combined market share, based on revenues, of 90% on the total voice telephony market (all types of calls12). In December 2005 only seven countries had five or more major competing operators (including the incumbent) with such a combined market share. These figures give an idea of the number of major players operating in each national market, although in many cases competition is largely asymmetric, with incumbents continuing to hold a strong position. This situation can be observed in the new Member States, where the fixed incumbent still dominates the fixed voice market. In the Swiss fixed network voice telephony market, six providers share at least 90% of the market. This places Switzerland in the countries which have the highest number of providers, at the same level as Spain and Austria but clearly behind Germany, the United Kingdom, Sweden, Belgium, and Denmark, each with at least seven operators.
12 Local calls to internet, local phone calls, long-distance and international calls as well as calls to mobile
19 - Extrait du 12ème rapport d’implémentation de l’UE étendu à la Suisse

Figure 5 Number of players in the
fixed telephony market in terms of retail revenues (including the incumbent, Dec. 2005 )
6
4 4
9
3
5
6
4
1 1
2
1
2
5
4 4
1 1
3
10
11
6
4
2
1
4
0
2
4
6
8
10
12
BE CZ DK DE EE EL ES FR IE IT CY LV LT LU HU MT NL AT PL PT SI SK FI SE UK CH
Operators that along with the incumbent operator have a combined market share of 90% of the voice telephony market Germany, Ireland: Figures are NRA's estimates. Denmark, Netherlands, Slovenia: Data are based on minutes of traffic. Finland: The figure includes the major operator groups only.
1.2. Incumbents’ market share in the fixed voice telephony market
This section shows the incumbents’ market share in the fixed voice telephony markets on the basis of both retail revenues and outgoing minutes of traffic. Where possible, figures for local, long-distance, international calls, calls to mobile and calls to internet are shown.
It has to be noted that in Switzerland local and long-distance calls data have no longer been collected since 2003 due to the introduction of the closed numbering plan in March 2002. Since that date, the historic operator has applied a new charging system which offers only one tariff, regardless of distance. We therefore decided to display for 2003 and the following years an aggregated indicator which combines local and long-distance calls.
Not all Member States collect separate figures for all types of data, and split between the various markets is not always available.
Figures in this section have been provided by NRAs, also for Switzerland, and refer to December 2005, except for United Kingdom (March 2006). Where available, later values have been provided in the notes. Market share based on retail revenues exclusively refers to revenues from call markets and does not include any access revenue.
Apart from Denmark, Spain, Cyprus and United Kingdom, traffic/revenues generated from calling cards are excluded from the market definition. The market definition for Greece and Austria includes calling cards for international calls based on volume of traffic (both countries) and for the international calls based on revenues (only Austria).
Traffic/revenues from public payphones are not excluded in Czech Rep., Denmark, Estonia, Spain, Greece (for international calls on volume of traffic) Latvia, Luxembourg, Austria, Portugal, Sweden (for international calls). It is excluded in all the remaining countries. No information is available for The Netherlands, Slovenia, Slovakia and Finland.
Traffic/revenues from calling shops are not excluded in Czech Rep., Greece, France, United Kingdom. It is excluded in the remaining countries, except for Germany, Sweden, Italy, The Netherlands, Slovenia, Slovakia and Finland where no information is available.
Extrait du 12ème rapport d’implémentation de l’UE étendu à la Suisse - 20
Peer-to-peer VoIP traffic/revenues is excluded in all countries. No information is available for Germany, Sweden, Italy, The Netherlands, Slovenia, Slovakia and Finland. Managed VoIP (VoIP calls over broadband) traffic/revenues are included in Belgium, Denmark, Estonia, Latvia, Lithuania, Austria and Portugal. It is excluded in the remaining countries, except Germany, Sweden, The Netherlands, Slovenia, Slovakia, Finland and United Kingdom where no information is available. 1.2.1. EU average incumbents' market share
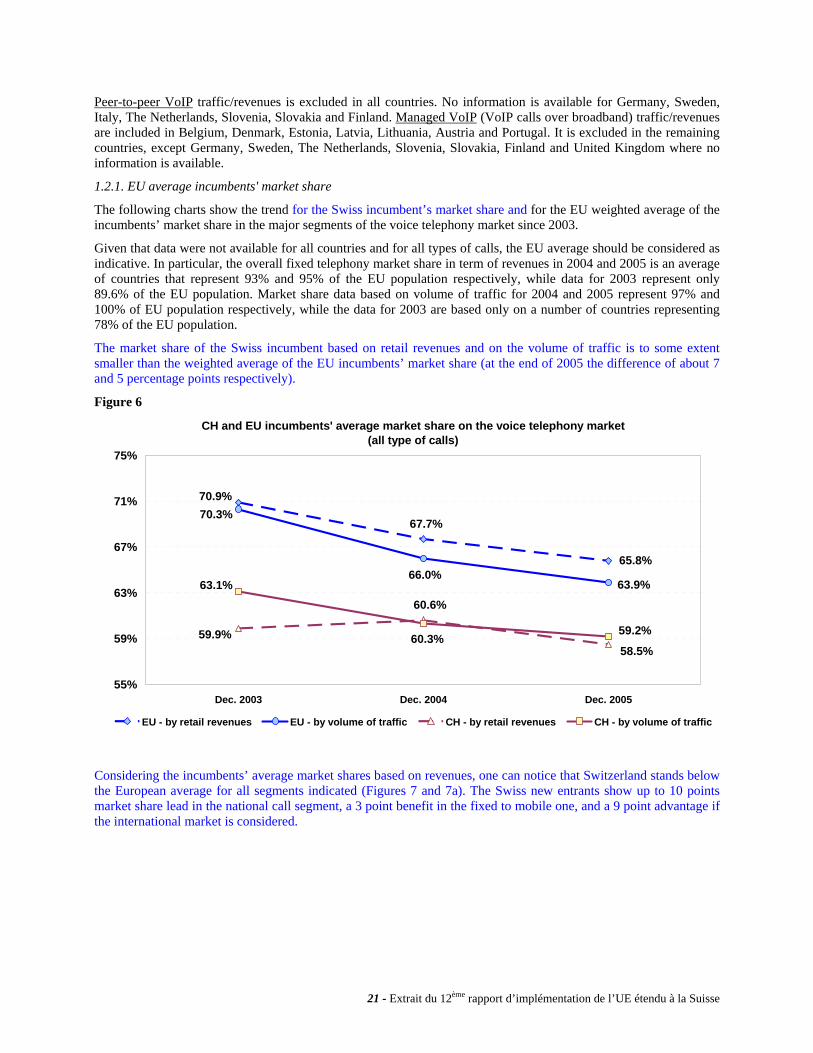
The following charts show the trend for the Swiss incumbent’s market share and for the EU weighted average of the incumbents’ market share in the major segments of the voice telephony market since 2003.
Given that data were not available for all countries and for all types of calls, the EU average should be considered as indicative. In particular, the overall fixed telephony market share in term of revenues in 2004 and 2005 is an average of countries that represent 93% and 95% of the EU population respectively, while data for 2003 represent only 89.6% of the EU population. Market share data based on volume of traffic for 2004 and 2005 represent 97% and 100% of EU population respectively, while the data for 2003 are based only on a number of countries representing 78% of the EU population.
The market share of the Swiss incumbent based on retail revenues and on the volume of traffic is to some extent smaller than the weighted average of the EU incumbents’ market share (at the end of 2005 the difference of about 7 and 5 percentage points respectively).
Figure 6
CH and EU incumbents' average market share on the voice telephony market (all type of calls)
70.9%
65.8%
67.7%
66.0%63.9%
70.3%
59.9%58.5%
60.6%63.1%
59.2%60.3%
55%
59%
63%
67%
71%
75%
Dec. 2003 Dec. 2004 Dec. 2005
EU - by retail revenues EU - by volume of traffic CH - by retail revenues CH - by volume of traffic
Considering the incumbents’ average market shares based on revenues, one can notice that Switzerland stands below the European average for all segments indicated (Figures 7 and 7a). The Swiss new entrants show up to 10 points market share lead in the national call segment, a 3 point benefit in the fixed to mobile one, and a 9 point advantage if the international market is considered.
21 - Extrait du 12ème rapport d’implémentation de l’UE étendu à la Suisse
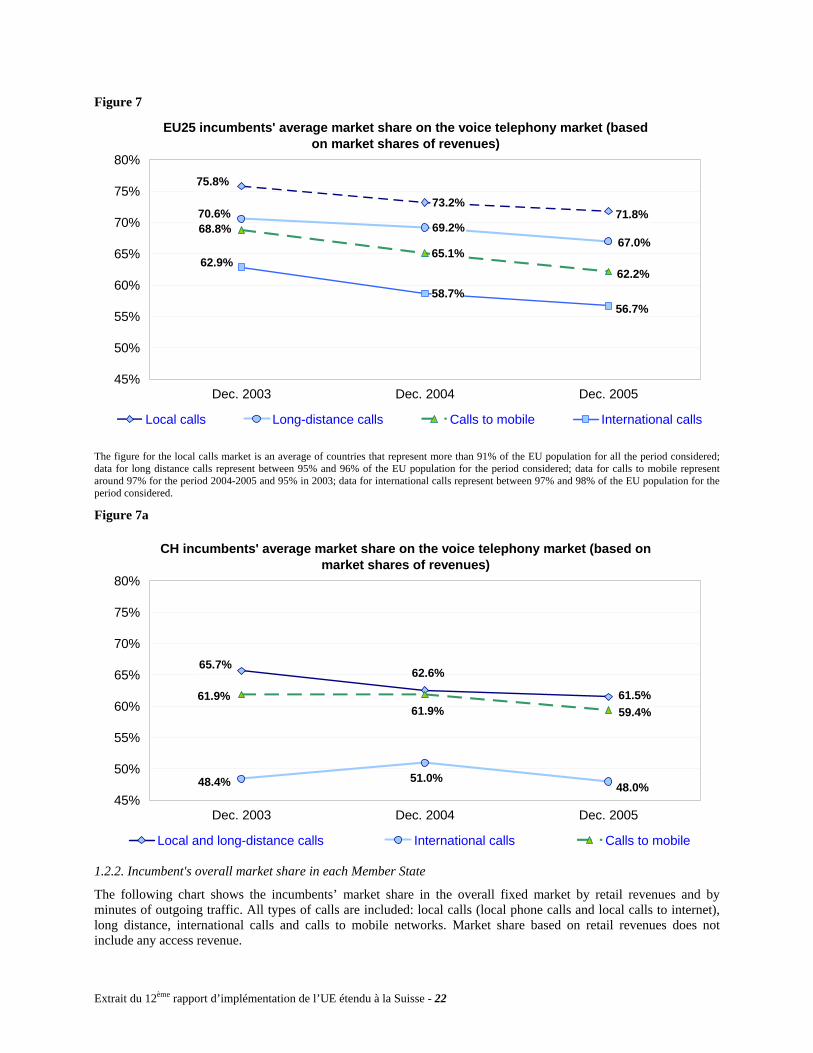
Figure 7
EU25 incumbents' average market share on the voice telephony market (based on market shares of revenues)
58.7%
73.2%71.8%
75.8%
70.6%
67.0%69.2%68.8%
65.1%
62.2%
56.7%
62.9%
45%
50%
55%
60%
65%
70%
75%
80%
Dec. 2003 Dec. 2004 Dec. 2005
Local calls Long-distance calls Calls to mobile International callsSource: Commission services based on NRA data.
The figure for the local calls market is an average of countries that represent more than 91% of the EU population for all the period considered; data for long distance calls represent between 95% and 96% of the EU population for the period considered; data for calls to mobile represent around 97% for the period 2004-2005 and 95% in 2003; data for international calls represent between 97% and 98% of the EU population for the period considered. Figure 7a
CH incumbents' average market share on the voice telephony market (based on market shares of revenues)
62.6%
61.5%
65.7%
48.4% 48.0%51.0%
61.9%61.9% 59.4%
45%
50%
55%
60%
65%
70%
75%
80%
Dec. 2003 Dec. 2004 Dec. 2005
Local and long-distance calls International calls Calls to mobileSource: Commission services based on NRA data.
1.2.2. Incumbent's overall market share in each Member State
The following chart shows the incumbents’ market share in the overall fixed market by retail revenues and by minutes of outgoing traffic. All types of calls are included: local calls (local phone calls and local calls to internet), long distance, international calls and calls to mobile networks. Market share based on retail revenues does not include any access revenue.
Extrait du 12ème rapport d’implémentation de l’UE étendu à la Suisse - 22
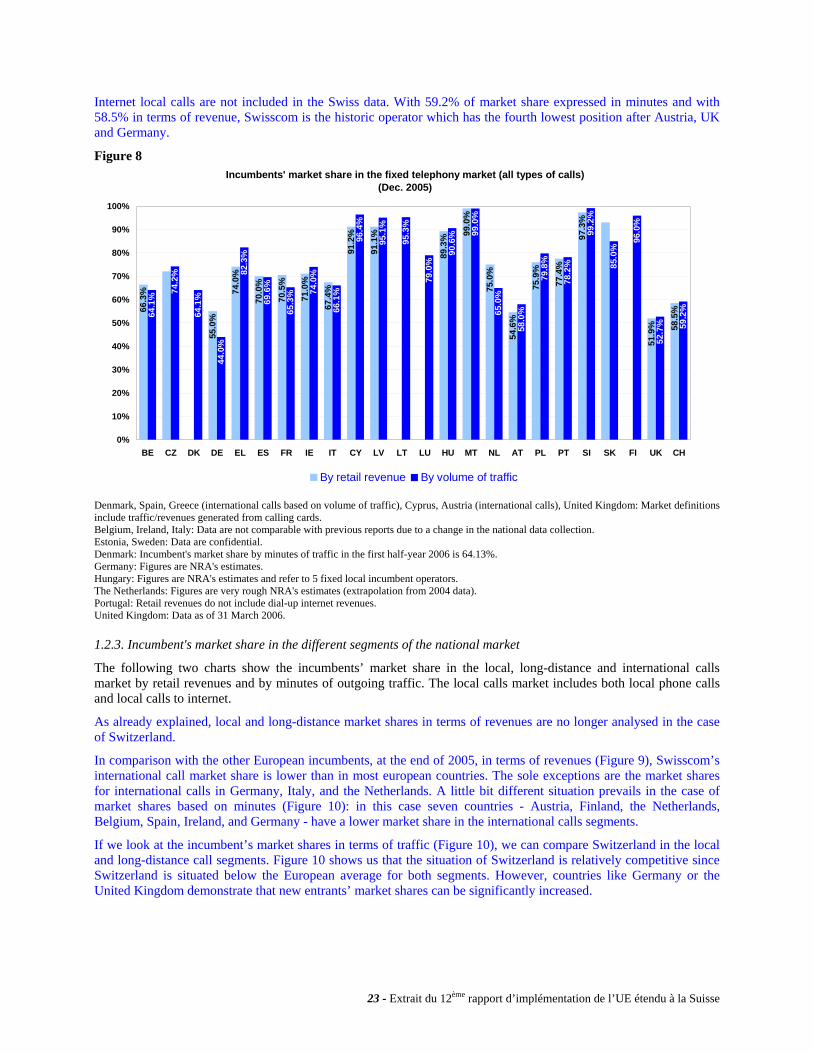
Internet local calls are not included in the Swiss data. With 59.2% of market share expressed in minutes and with 58.5% in terms of revenue, Swisscom is the historic operator which has the fourth lowest position after Austria, UK and Germany.
Figure 8 Incumbents' market share in the fixed telephony market (all types of calls)
(Dec. 2005)
66.3
%
55.0
%
74.0
%
70.0
%
70.5
%
71.0
%
67.4
%
91.2
%
75.0
%
77.4
%
97.3
%
51.9
% 58.5
%64.1
%
74.2
%
64.1
%
44.0
%
82.3
%
69.6
%
65.3
% 74.0
%
66.1
%
96.4
%
95.1
%
95.3
%
79.0
%
90.6
% 99.0
%
65.0
%
58.0
%
79.8
%
78.2
%
99.2
%
85.0
%
96.0
%
52.7
% 59.2
%
91.1
%
54.6
%
89.3
% 99.0
%
75.9
%
0%
10%
20%
30%
40%
50%
60%
70%
80%
90%
100%
BE CZ DK DE EL ES FR IE IT CY LV LT LU HU MT NL AT PL PT SI SK FI UK CH
By retail revenue By volume of traffic
Denmark, Spain, Greece (international calls based on volume of traffic), Cyprus, Austria (international calls), United Kingdom: Market definitions include traffic/revenues generated from calling cards. Belgium, Ireland, Italy: Data are not comparable with previous reports due to a change in the national data collection. Estonia, Sweden: Data are confidential. Denmark: Incumbent's market share by minutes of traffic in the first half-year 2006 is 64.13%. Germany: Figures are NRA's estimates. Hungary: Figures are NRA's estimates and refer to 5 fixed local incumbent operators. The Netherlands: Figures are very rough NRA's estimates (extrapolation from 2004 data). Portugal: Retail revenues do not include dial-up internet revenues. United Kingdom: Data as of 31 March 2006. 1.2.3. Incumbent's market share in the different segments of the national market
The following two charts show the incumbents’ market share in the local, long-distance and international calls market by retail revenues and by minutes of outgoing traffic. The local calls market includes both local phone calls and local calls to internet.
As already explained, local and long-distance market shares in terms of revenues are no longer analysed in the case of Switzerland.
In comparison with the other European incumbents, at the end of 2005, in terms of revenues (Figure 9), Swisscom’s international call market share is lower than in most european countries. The sole exceptions are the market shares for international calls in Germany, Italy, and the Netherlands. A little bit different situation prevails in the case of market shares based on minutes (Figure 10): in this case seven countries - Austria, Finland, the Netherlands, Belgium, Spain, Ireland, and Germany - have a lower market share in the international calls segments.
If we look at the incumbent’s market shares in terms of traffic (Figure 10), we can compare Switzerland in the local and long-distance call segments. Figure 10 shows us that the situation of Switzerland is relatively competitive since Switzerland is situated below the European average for both segments. However, countries like Germany or the United Kingdom demonstrate that new entrants’ market shares can be significantly increased.
23 - Extrait du 12ème rapport d’implémentation de l’UE étendu à la Suisse
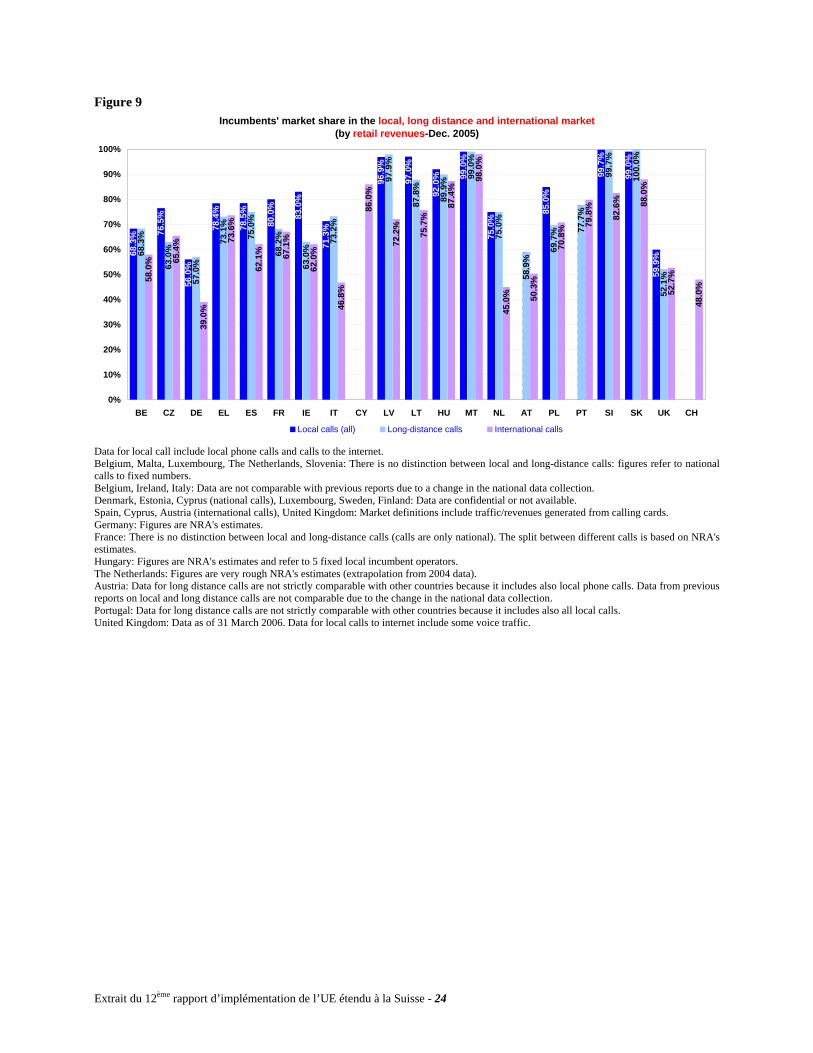
Figure 9 Incumbents' market share in the local, long distance and international market
retail revenues-(by Dec. 2005)68
.3% 76
.5%
56.0
%
78.4
%
78.5
%
80.0
%
83.0
%
71.3
%
96.9
%
97.0
%
92.0
% 99.0
%
75.0
%
85.0
%
99.7
%
99.0
%
59.9
%68.3
%
63.0
%
57.0
%
73.1
%
75.0
%
68.2
%
63.0
%
97.9
%
87.8
%
89.9
% 99.0
%
75.0
%
58.9
%
69.7
% 77.7
%
99.7
%
100.
0%
52.1
%58.0
% 65.4
%
39.0
%
73.6
%
62.1
% 67.1
%
62.0
%
46.8
%
86.0
%
72.2
%
75.7
%
87.4
%
98.0
%
45.0
%
70.8
% 79.8
%
82.6
% 88.0
%
52.7
%
48.0
%
73.2
%
50.3
%
0%
10%
20%
30%
40%
50%
60%
70%
80%
90%
100%
BE CZ DE EL ES FR IE IT CY LV LT HU MT NL AT PL PT SI SK UK CH
Local calls (all) Long-distance calls International calls
Data for local call include local phone calls and calls to the internet. Belgium, Malta, Luxembourg, The Netherlands, Slovenia: There is no distinction between local and long-distance calls: figures refer to national calls to fixed numbers. Belgium, Ireland, Italy: Data are not comparable with previous reports due to a change in the national data collection. Denmark, Estonia, Cyprus (national calls), Luxembourg, Sweden, Finland: Data are confidential or not available. Spain, Cyprus, Austria (international calls), United Kingdom: Market definitions include traffic/revenues generated from calling cards. Germany: Figures are NRA's estimates. France: There is no distinction between local and long-distance calls (calls are only national). The split between different calls is based on NRA's estimates. Hungary: Figures are NRA's estimates and refer to 5 fixed local incumbent operators. The Netherlands: Figures are very rough NRA's estimates (extrapolation from 2004 data). Austria: Data for long distance calls are not strictly comparable with other countries because it includes also local phone calls. Data from previous reports on local and long distance calls are not comparable due to the change in the national data collection. Portugal: Data for long distance calls are not strictly comparable with other countries because it includes also all local calls. United Kingdom: Data as of 31 March 2006. Data for local calls to internet include some voice traffic.
Extrait du 12ème rapport d’implémentation de l’UE étendu à la Suisse - 24
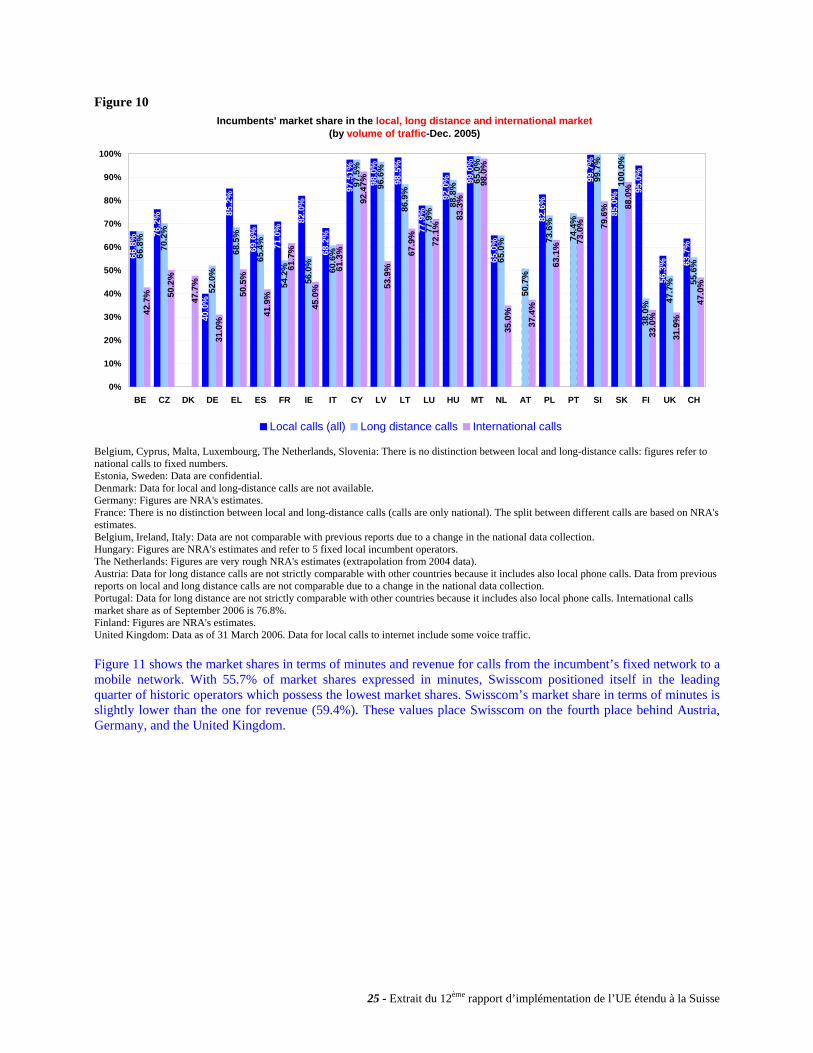
Figure 10 Incumbents' market share in the local, long distance and international market
volume of traffic-Dec(by . 2005)66
.8% 76
.2%
40.0
%
85.2
%
69.6
%
71.0
%
82.0
%
68.2
%
98.0
%
98.5
%
77.9
%
92.0
% 99.0
%
65.0
%
82.6
%
99.7
%
85.0
%
95.0
%
56.3
% 63.7
%
66.8
%
52.0
%
68.5
%
54.2
%
56.0
%
60.6
%
96.6
%
86.9
%
65.0
% 73.6
%
74.4
%
99.7
%
100.
0%
38.0
% 47.7
% 55.6
%
42.7
% 50.2
%
47.7
%
31.0
%
50.5
%
41.9
%
61.7
%
61.3
%
53.9
%
67.9
%
72.1
%
83.3
%
98.0
%
35.0
%
37.4
%
63.1
% 73.0
% 79.6
% 88.0
%
33.0
%
31.9
%
47.0
%
97.5
1%97
.5%
70.2
% 77.9
%
50.7
%
65.4
%
88.8
%
65,0
%
92.4
7%
45.0
%
0%
10%
20%
30%
40%
50%
60%
70%
80%
90%
100%
BE CZ DK DE EL ES FR IE IT CY LV LT LU HU MT NL AT PL PT SI SK FI UK CH
Local calls (all) Long distance calls International calls
Belgium, Cyprus, Malta, Luxembourg, The Netherlands, Slovenia: There is no distinction between local and long-distance calls: figures refer to national calls to fixed numbers. Estonia, Sweden: Data are confidential. Denmark: Data for local and long-distance calls are not available. Germany: Figures are NRA's estimates. France: There is no distinction between local and long-distance calls (calls are only national). The split between different calls are based on NRA's estimates. Belgium, Ireland, Italy: Data are not comparable with previous reports due to a change in the national data collection. Hungary: Figures are NRA's estimates and refer to 5 fixed local incumbent operators. The Netherlands: Figures are very rough NRA's estimates (extrapolation from 2004 data). Austria: Data for long distance calls are not strictly comparable with other countries because it includes also local phone calls. Data from previous reports on local and long distance calls are not comparable due to a change in the national data collection. Portugal: Data for long distance are not strictly comparable with other countries because it includes also local phone calls. International calls market share as of September 2006 is 76.8%. Finland: Figures are NRA's estimates. United Kingdom: Data as of 31 March 2006. Data for local calls to internet include some voice traffic. Figure 11 shows the market shares in terms of minutes and revenue for calls from the incumbent’s fixed network to a mobile network. With 55.7% of market shares expressed in minutes, Swisscom positioned itself in the leading quarter of historic operators which possess the lowest market shares. Swisscom’s market share in terms of minutes is slightly lower than the one for revenue (59.4%). These values place Swisscom on the fourth place behind Austria, Germany, and the United Kingdom.
25 - Extrait du 12ème rapport d’implémentation de l’UE étendu à la Suisse
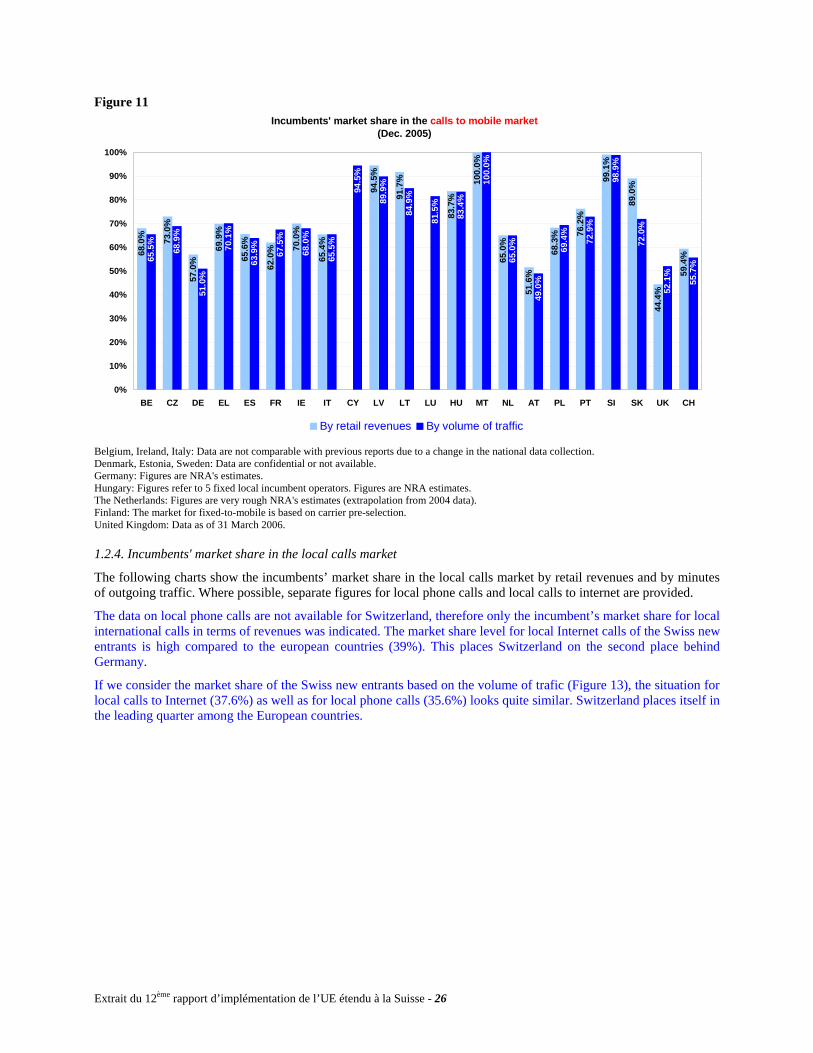
Figure 11 Incumbents' market share in the calls to mobile market
(Dec. 2005)68
.0% 73.0
%
57.0
%
69.9
%
65.6
%
62.0
% 70.0
%
65.4
%
94.5
%
91.7
%
83.7
%
100.
0%
65.0
%
51.6
%
68.3
% 76.2
%
99.1
%
89.0
%
44.4
%
59.4
%65.5
%
68.9
%
51.0
%
70.1
%
63.9
%
67.5
%
68.0
%
65.5
%
94.5
%
89.9
%
84.9
%
81.5
%
83.4
%
100.
0%
65.0
%
49.0
%
69.4
%
72.9
%
98.9
%
72.0
%
52.1
%
55.7
%
0%
10%
20%
30%
40%
50%
60%
70%
80%
90%
100%
BE CZ DE EL ES FR IE IT CY LV LT LU HU MT NL AT PL PT SI SK UK CH
By retail revenues By volume of traffic
Belgium, Ireland, Italy: Data are not comparable with previous reports due to a change in the national data collection. Denmark, Estonia, Sweden: Data are confidential or not available. Germany: Figures are NRA's estimates. Hungary: Figures refer to 5 fixed local incumbent operators. Figures are NRA estimates. The Netherlands: Figures are very rough NRA's estimates (extrapolation from 2004 data). Finland: The market for fixed-to-mobile is based on carrier pre-selection. United Kingdom: Data as of 31 March 2006. 1.2.4. Incumbents' market share in the local calls market
The following charts show the incumbents’ market share in the local calls market by retail revenues and by minutes of outgoing traffic. Where possible, separate figures for local phone calls and local calls to internet are provided. The data on local phone calls are not available for Switzerland, therefore only the incumbent’s market share for local international calls in terms of revenues was indicated. The market share level for local Internet calls of the Swiss new entrants is high compared to the european countries (39%). This places Switzerland on the second place behind Germany.
If we consider the market share of the Swiss new entrants based on the volume of trafic (Figure 13), the situation for local calls to Internet (37.6%) as well as for local phone calls (35.6%) looks quite similar. Switzerland places itself in the leading quarter among the European countries.
Extrait du 12ème rapport d’implémentation de l’UE étendu à la Suisse - 26
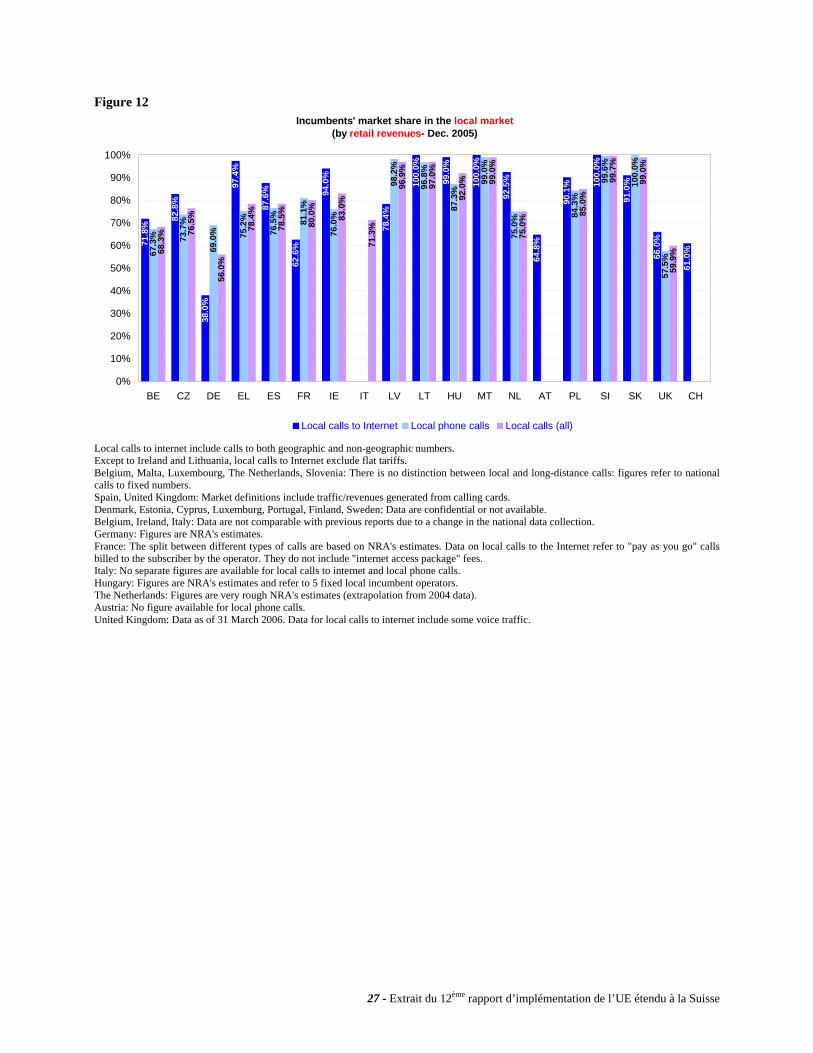
Figure 12 Incumbents' market share in the local market
retail revenues- De(by c. 2005)71
.8%
82.8
%
38.0
%
97.4
%
87.6
%
62.6
%
78.4
%
100.
0%
99.0
%
100.
0%
92.5
%
64.8
%
90.1
% 100.
0%
91.0
%
66.0
%
61.0
%67.3
% 73.7
%
69.0
% 75.2
%
76.5
%
81.1
%
98.2
%
96.8
%
87.3
%
99.0
%
84.3
%
99.6
%
100.
0%
57.5
%
68.3
% 76.5
%
56.0
%
78.4
%
78.5
%
80.0
%
83.0
%
71.3
%
96.9
%
97.0
%
92.0
% 99.0
%
85.0
%
99.7
%
99.0
%
59.9
%
94.0
%
75.0
%
76.0
%
75.0
%
0%
10%
20%
30%
40%
50%
60%
70%
80%
90%
100%
BE CZ DE EL ES FR IE IT LV LT HU MT NL AT PL SI SK UK CH
Local calls to Internet Local phone calls Local calls (all)
Local calls to internet include calls to both geographic and non-geographic numbers. Except to Ireland and Lithuania, local calls to Internet exclude flat tariffs. Belgium, Malta, Luxembourg, The Netherlands, Slovenia: There is no distinction between local and long-distance calls: figures refer to national calls to fixed numbers. Spain, United Kingdom: Market definitions include traffic/revenues generated from calling cards. Denmark, Estonia, Cyprus, Luxemburg, Portugal, Finland, Sweden: Data are confidential or not available. Belgium, Ireland, Italy: Data are not comparable with previous reports due to a change in the national data collection. Germany: Figures are NRA's estimates. France: The split between different types of calls are based on NRA's estimates. Data on local calls to the Internet refer to "pay as you go" calls billed to the subscriber by the operator. They do not include "internet access package" fees. Italy: No separate figures are available for local calls to internet and local phone calls. Hungary: Figures are NRA's estimates and refer to 5 fixed local incumbent operators. The Netherlands: Figures are very rough NRA's estimates (extrapolation from 2004 data). Austria: No figure available for local phone calls. United Kingdom: Data as of 31 March 2006. Data for local calls to internet include some voice traffic.
27 - Extrait du 12ème rapport d’implémentation de l’UE étendu à la Suisse
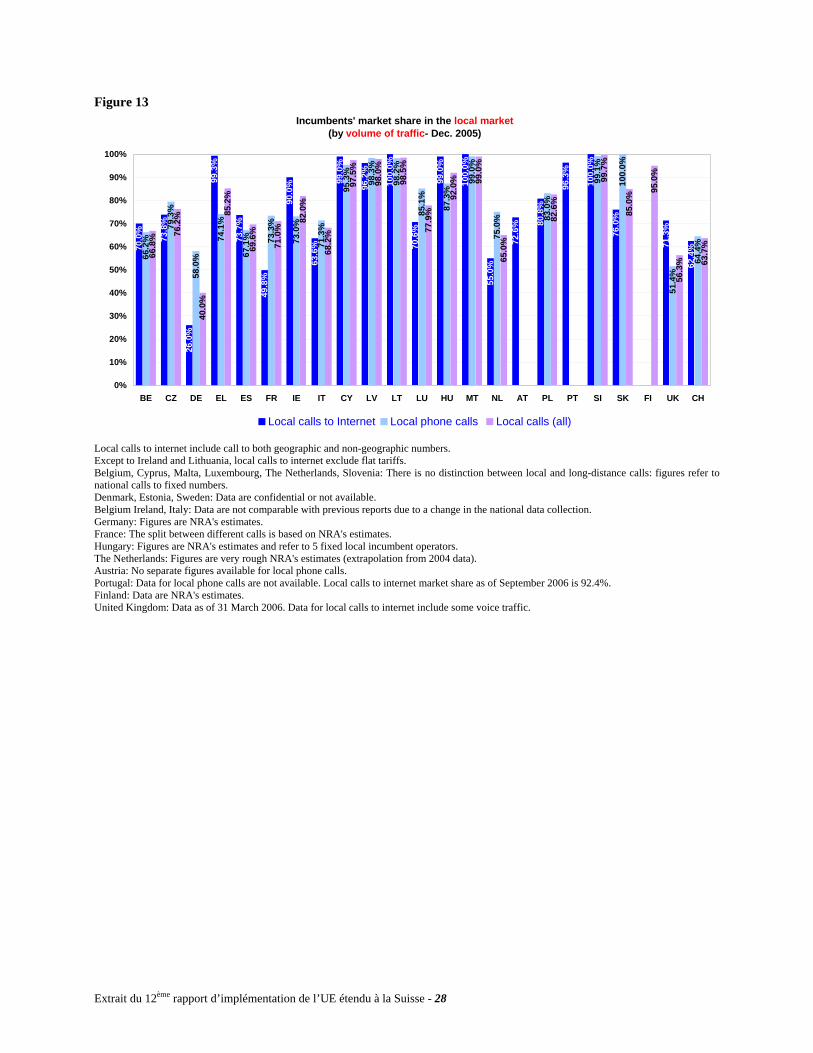
Figure 13 Incumbents' market share in the local market
volume of traffic- D(by ec. 2005)70
.0%
73.8
%
26.0
%
99.3
%
73.7
%
49.8
%
90.0
%
63.6
%
99.0
%
96.2
%
100.
0%
70.6
%
99.0
%
100.
0%
55.0
%
72.6
% 80.8
%
96.3
%
100.
0%
76.0
%
71.3
%
62.4
%
66.2
% 74.1
%
67.1
% 73.3
%
73.0
%
95.3
%
87.3
%
99.0
%
51.4
%
64.4
%
66.8
% 76.2
%
40.0
%
85.2
%
69.6
%
71.0
%
82.0
%
68.2
%
97.5
%
98.0
%
98.5
%
77.9
%
92.0
% 99.0
%
99.7
%
85.0
% 95.0
%
56.3
% 63.7
%
75.0
%
79.3
%
98.3
%
83.0
%
99.1
%
98.2
%
58.0
%
71.3
%
100.
0%
85.1
%
82.6
%
65.0
%
0%
10%
20%
30%
40%
50%
60%
70%
80%
90%
100%
BE CZ DE EL ES FR IE IT CY LV LT LU HU MT NL AT PL PT SI SK FI UK CH
Local calls to Internet Local phone calls Local calls (all)
Local calls to internet include call to both geographic and non-geographic numbers. Except to Ireland and Lithuania, local calls to internet exclude flat tariffs. Belgium, Cyprus, Malta, Luxembourg, The Netherlands, Slovenia: There is no distinction between local and long-distance calls: figures refer to national calls to fixed numbers. Denmark, Estonia, Sweden: Data are confidential or not available. Belgium Ireland, Italy: Data are not comparable with previous reports due to a change in the national data collection. Germany: Figures are NRA's estimates. France: The split between different calls is based on NRA's estimates. Hungary: Figures are NRA's estimates and refer to 5 fixed local incumbent operators. The Netherlands: Figures are very rough NRA's estimates (extrapolation from 2004 data). Austria: No separate figures available for local phone calls. Portugal: Data for local phone calls are not available. Local calls to internet market share as of September 2006 is 92.4%. Finland: Data are NRA's estimates. United Kingdom: Data as of 31 March 2006. Data for local calls to internet include some voice traffic.
Extrait du 12ème rapport d’implémentation de l’UE étendu à la Suisse - 28
2. CONSUMERS’ CHOICE OF FIXED OPERATORS
This section analyses the fixed voice telephony market from the point of view of consumers. It gives information on the percentage of subscribers using an alternative provider other than the incumbent (for phone services and direct access) and the facilities used by alternative operators for the provision of voice telephony.
The data presented below have been provided by the national regulatory authorities and, unless otherwise indicated, report the position as of July 2006. Figures for countries not included in the charts are not available and are not always comparable with those published in previous reports due to changes in the methodologies and/or in the classifications used by the Member States. Furthermore, separate data for type of calls are not available in a number of Member States. Information on consumers’ use of alternative providers is unavailable in a number of new Member States. For these reasons the figures presented in this section should be considered as indicative.
2.1. Percentage of subscribers actually using an alternative provider other than the incumbent Incumbents’ customers have the possibility of using an alternative provider, either by dialling a call-by-call prefix (carrier selection, CS) or by choosing to route all calls by default to the network of an alternative operator (carrier pre-selection, CPS). The use of an alternative operator through carrier selection/carrier pre-selection does not exclude the possibility of also using the incumbent’s services. Direct access is also available to users through alternative operators’ proprietary wireline/wireless access or through unbundled local loops leased from the incumbent. The following chart shows the percentage of EU subscribers (residential and business) using an alternative provider for local, long distance and international calls and for direct access.13
As of July 2006, more than 32% of EU subscribers used an alternative provider to route international calls, 28% for long distance calls and 24% for local calls. At the same time, direct access from alternative providers was used by 10.4% of EU subscribers. Since last year, the percentage of subscribers using an alternative provider has significantly grown for international calls and direct access. The trend of the EU average should be considered as indicative, since not all data are available for all Member States. For the last five years, about one in three consumers was making use of the services of alternative providers to make local/long-distance or international calls in Switzerland. The absolute values for Switzerland regarding international calls are a little bit higher than the European average. In regard to local/long-distance calls, Switzerland is about 10 points higher than the weighted European average. The picture is different for direct connections: due to a lack of unbundling possibilities and a still young market for alternative access structures able to transmit voice traffic, about 94.6% of connections are offered by the incumbent.
13 The methodology for the calculation of the percentage of subscribers (residential + business) actually using a provider other than the incumbent operator for local calls is the following: [X = sum of all alternative operators' subscribers (residential + business) with CPS contract + sum of all alternative operators' subscribers (residential + business) with direct access for voice telephony (ULL and proprietary infrastructure)]/[total number of residential + business subscribers of the incumbent and new entrants, with a standard/party/group telephone lines access. Direct telephone line access provided by an alternative operator can either be through proprietary infrastructure or full ULL (active lines)]. The same calculation applied for long distance and international calls, with the addition to [50% of all alternative operators' subscribers (residential and business) with CS contract] to the nominator (top number). It should be noted that in many Member States calls are only national and the methodology for long distance is the same as for local calls. The percentage of subscribers actually using a provider other than the incumbent for direct access is calculated as the total number of subscribers with direct access, fully ULL connection or with a cable access owned by an alternative operator.
29 - Extrait du 12ème rapport d’implémentation de l’UE étendu à la Suisse
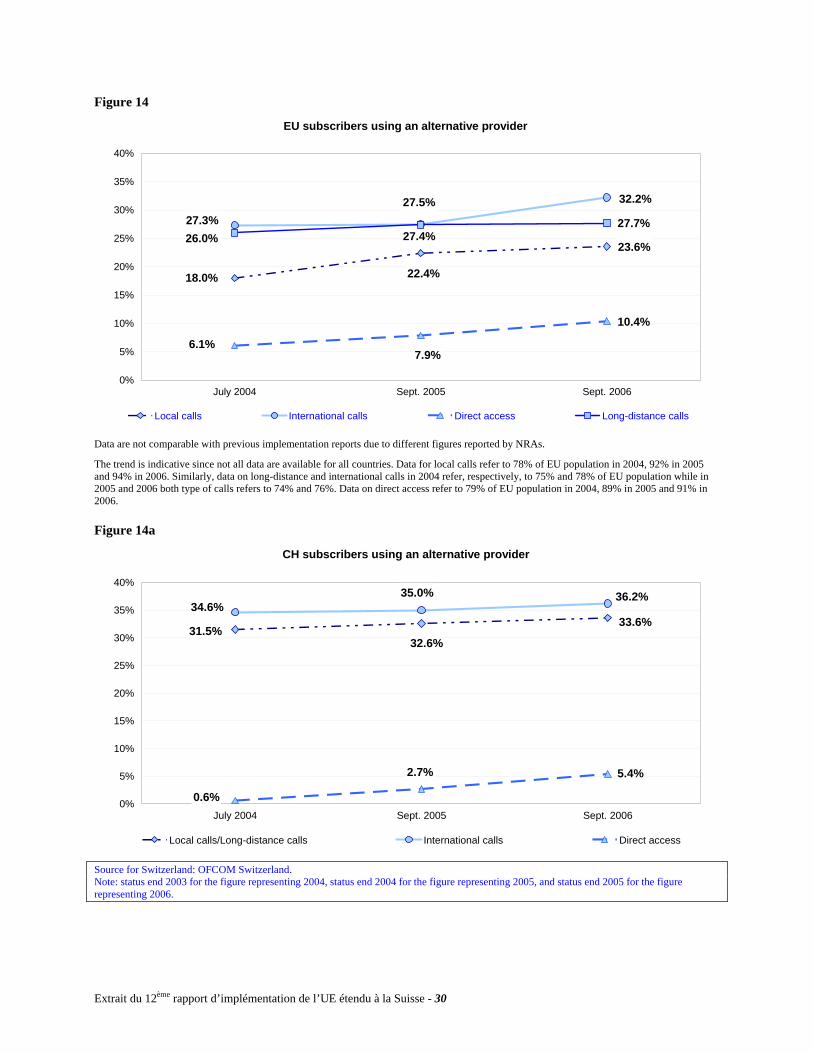
Figure 14
EU subscribers using an alternative provider
22.4%
23.6%
18.0%
27.3%
32.2%27.5%
6.1%7.9%
10.4%
27.7%27.4%26.0%
0%
5%
10%
15%
20%
25%
30%
35%
40%
July 2004 Sept. 2005 Sept. 2006
Local calls International calls Direct access Long-distance callsSource: Commission services based on NRA data.
Data are not comparable with previous implementation reports due to different figures reported by NRAs.
The trend is indicative since not all data are available for all countries. Data for local calls refer to 78% of EU population in 2004, 92% in 2005 and 94% in 2006. Similarly, data on long-distance and international calls in 2004 refer, respectively, to 75% and 78% of EU population while in 2005 and 2006 both type of calls refers to 74% and 76%. Data on direct access refer to 79% of EU population in 2004, 89% in 2005 and 91% in 2006. Figure 14a
CH subscribers using an alternative provider
32.6%
33.6%31.5%
34.6%36.2%35.0%
0.6%
2.7% 5.4%
0%
5%
10%
15%
20%
25%
30%
35%
40%
July 2004 Sept. 2005 Sept. 2006
Local calls/Long-distance calls International calls Direct accessSource: Commission services based on NRA data.
Source for Switzerland: OFCOM Switzerland. Note: status end 2003 for the figure representing 2004, status end 2004 for the figure representing 2005, and status end 2005 for the figure representing 2006.
Extrait du 12ème rapport d’implémentation de l’UE étendu à la Suisse - 30
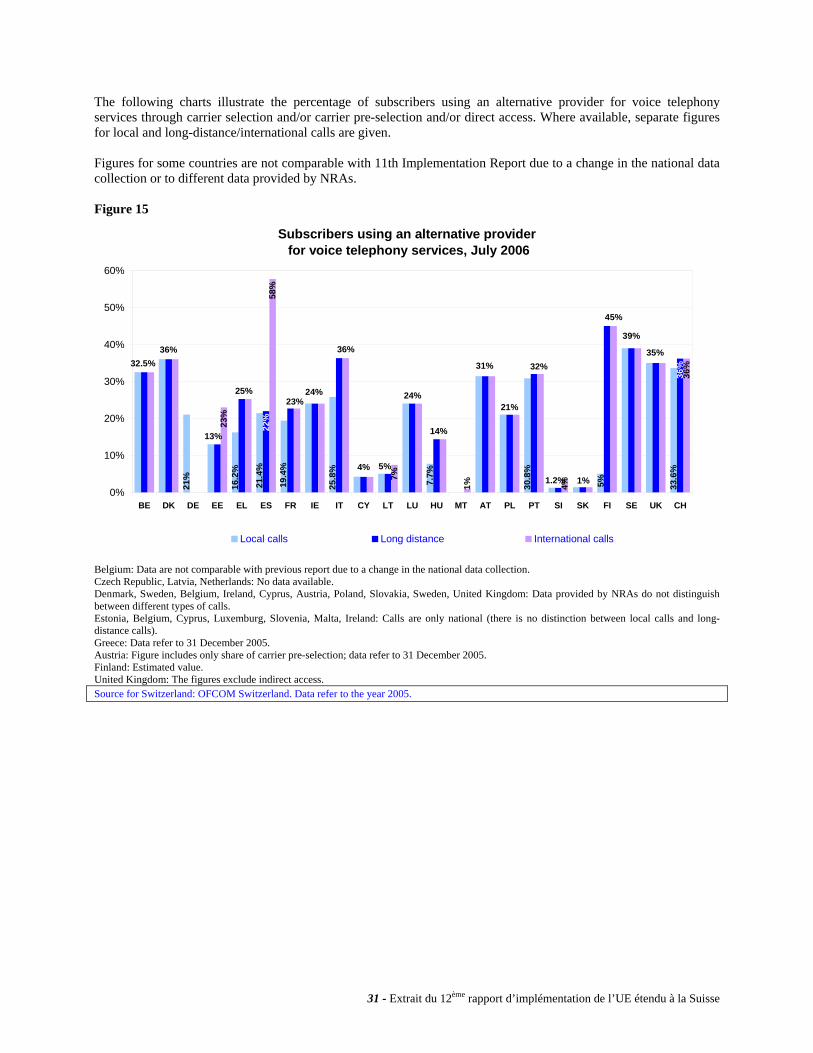
The following charts illustrate the percentage of subscribers using an alternative provider for voice telephony services through carrier selection and/or carrier pre-selection and/or direct access. Where available, separate figures for local and long-distance/international calls are given. Figures for some countries are not comparable with 11th Implementation Report due to a change in the national data collection or to different data provided by NRAs. Figure 15
Subscribers using an alternative provider for voice telephony services, July 2006
33.6
%36
%
23%
58%
7%
1% 4%
36%
5%25.8
%
16.2
%
21%
19.4
%
1.2%5%
30.8
%
24%
13%
36%32.5%
21.4
%
7.7% 1%
4%
25%
22%
45%
32%
25%23%
36%
14%
35%
39%
21%24%
31%
0%
10%
20%
30%
40%
50%
60%
BE DK DE EE EL ES FR IE IT CY LT LU HU MT AT PL PT SI SK FI SE UK CH
Local calls Long distance International calls
Belgium: Data are not comparable with previous report due to a change in the national data collection. Czech Republic, Latvia, Netherlands: No data available. Denmark, Sweden, Belgium, Ireland, Cyprus, Austria, Poland, Slovakia, Sweden, United Kingdom: Data provided by NRAs do not distinguish between different types of calls. Estonia, Belgium, Cyprus, Luxemburg, Slovenia, Malta, Ireland: Calls are only national (there is no distinction between local calls and long-distance calls). Greece: Data refer to 31 December 2005. Austria: Figure includes only share of carrier pre-selection; data refer to 31 December 2005. Finland: Estimated value. United Kingdom: The figures exclude indirect access. Source for Switzerland: OFCOM Switzerland. Data refer to the year 2005.
31 - Extrait du 12ème rapport d’implémentation de l’UE étendu à la Suisse
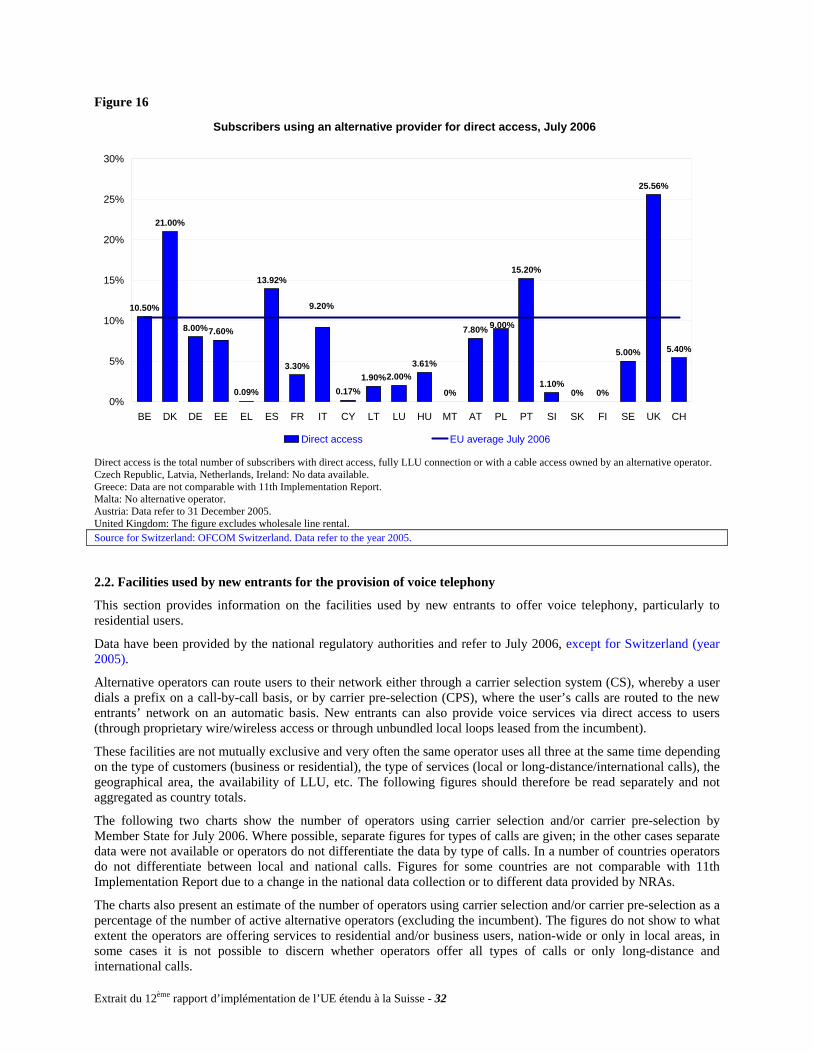
Figure 16
Subscribers using an alternative provider for direct access, July 2006
10.50%
21.00%
8.00%7.60%
0.09%
13.92%
3.30%
0.17%1.90%2.00%
3.61%
7.80%
15.20%
1.10%
5.00%
25.56%
5.40%
9.00%
0% 0%0%
9.20%
0%
5%
10%
15%
20%
25%
30%
BE DK DE EE EL ES FR IT CY LT LU HU MT AT PL PT SI SK FI SE UK CH
Direct access EU average July 2006
Direct access is the total number of subscribers with direct access, fully LLU connection or with a cable access owned by an alternative operator. Czech Republic, Latvia, Netherlands, Ireland: No data available. Greece: Data are not comparable with 11th Implementation Report. Malta: No alternative operator. Austria: Data refer to 31 December 2005. United Kingdom: The figure excludes wholesale line rental. Source for Switzerland: OFCOM Switzerland. Data refer to the year 2005.
2.2. Facilities used by new entrants for the provision of voice telephony
This section provides information on the facilities used by new entrants to offer voice telephony, particularly to residential users.
Data have been provided by the national regulatory authorities and refer to July 2006, except for Switzerland (year 2005).
Alternative operators can route users to their network either through a carrier selection system (CS), whereby a user dials a prefix on a call-by-call basis, or by carrier pre-selection (CPS), where the user’s calls are routed to the new entrants’ network on an automatic basis. New entrants can also provide voice services via direct access to users (through proprietary wire/wireless access or through unbundled local loops leased from the incumbent).
These facilities are not mutually exclusive and very often the same operator uses all three at the same time depending on the type of customers (business or residential), the type of services (local or long-distance/international calls), the geographical area, the availability of LLU, etc. The following figures should therefore be read separately and not aggregated as country totals.
The following two charts show the number of operators using carrier selection and/or carrier pre-selection by Member State for July 2006. Where possible, separate figures for types of calls are given; in the other cases separate data were not available or operators do not differentiate the data by type of calls. In a number of countries operators do not differentiate between local and national calls. Figures for some countries are not comparable with 11th Implementation Report due to a change in the national data collection or to different data provided by NRAs.
The charts also present an estimate of the number of operators using carrier selection and/or carrier pre-selection as a percentage of the number of active alternative operators (excluding the incumbent). The figures do not show to what extent the operators are offering services to residential and/or business users, nation-wide or only in local areas, in some cases it is not possible to discern whether operators offer all types of calls or only long-distance and international calls.
Extrait du 12ème rapport d’implémentation de l’UE étendu à la Suisse - 32
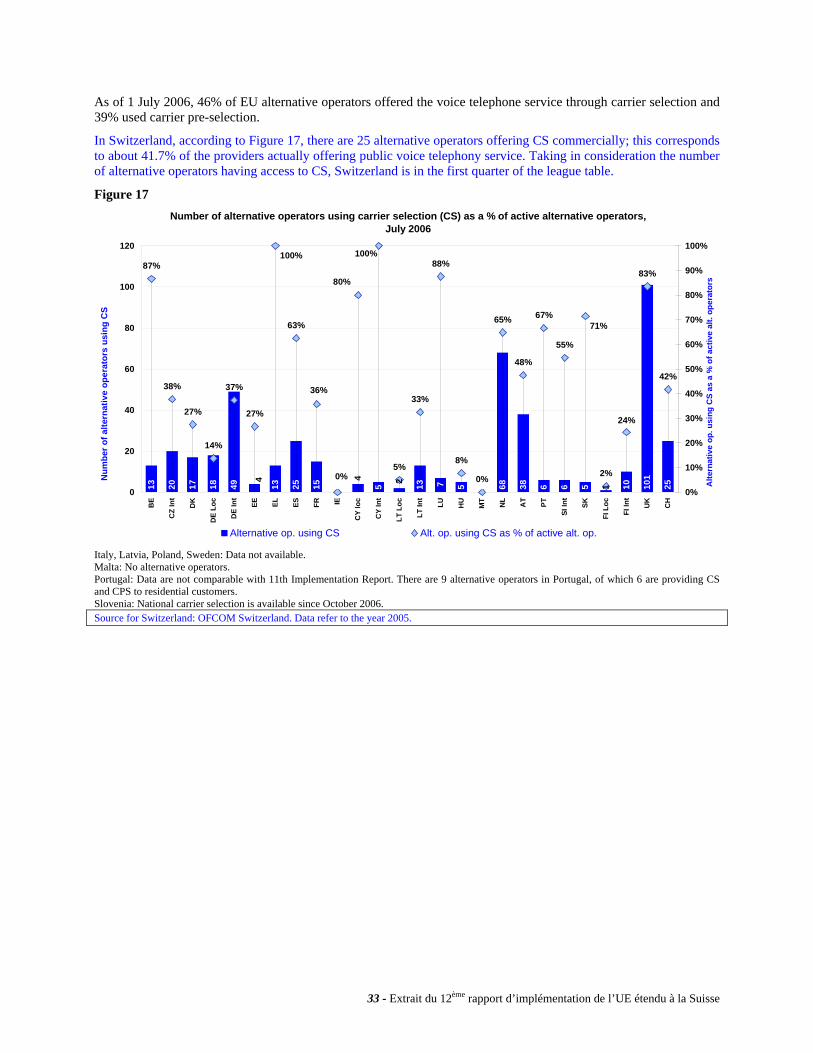
As of 1 July 2006, 46% of EU alternative operators offered the voice telephone service through carrier selection and 39% used carrier pre-selection.
In Switzerland, according to Figure 17, there are 25 alternative operators offering CS commercially; this corresponds to about 41.7% of the providers actually offering public voice telephony service. Taking in consideration the number of alternative operators having access to CS, Switzerland is in the first quarter of the league table.
Figure 17 Number of alternative operators using carrier selection (CS) as a % of active alternative operators,
July 2006
13 20 17 18 49 13 25 15 0 5 13 5 0 68 6 6 5 10 25244 7 38 101
1
87%
38%
27%
14%
37%
27%
63%
5%
33%
8%
0%
65%
48%
67%
55%
2%
83%
42%
80%
24%
71%
100%
0%
36%
100%88%
0
20
40
60
80
100
120
BE
CZ
Int
DK
DE
Loc
DE
Int
EE EL ES FR IE
CY
loc
CY
Int
LT L
oc
LT In
t
LU HU
MT NL
AT
PT
SI In
t
SK
FI L
oc
FI In
t
UK
CH
Num
ber o
f alte
rnat
ive
oper
ator
s us
ing
CS
0%
10%
20%
30%
40%
50%
60%
70%
80%
90%
100%
Alte
rnat
ive
op. u
sing
CS
as a
% o
f act
ive
alt.
oper
ator
s
Alternative op. using CS Alt. op. using CS as % of active alt. op.
Italy, Latvia, Poland, Sweden: Data not available. Malta: No alternative operators. Portugal: Data are not comparable with 11th Implementation Report. There are 9 alternative operators in Portugal, of which 6 are providing CS and CPS to residential customers. Slovenia: National carrier selection is available since October 2006. Source for Switzerland: OFCOM Switzerland. Data refer to the year 2005.
33 - Extrait du 12ème rapport d’implémentation de l’UE étendu à la Suisse
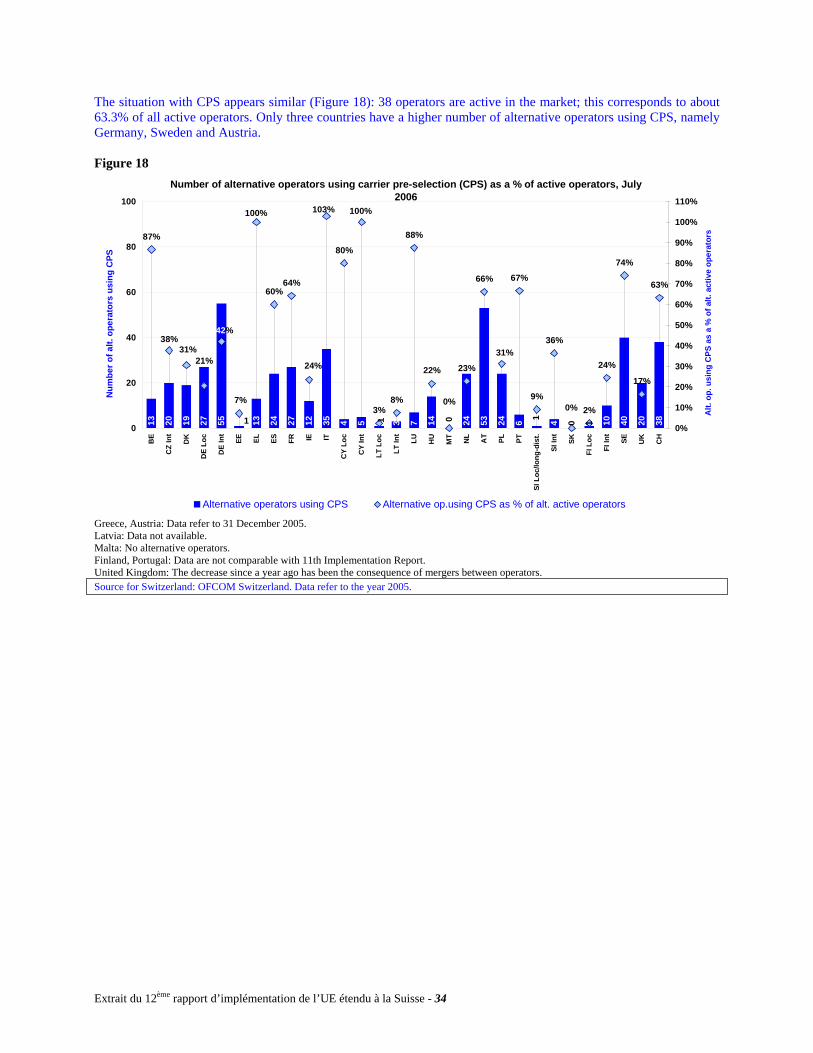
The situation with CPS appears similar (Figure 18): 38 operators are active in the market; this corresponds to about 63.3% of all active operators. Only three countries have a higher number of alternative operators using CPS, namely Germany, Sweden and Austria. Figure 18
Number of alternative operators using carrier pre-selection (CPS) as a % of active operators, July 2006
13 19 27 55 13 27 12 4 7 24 53 24 6 4 10 40 20 381141520 24 31 35 0 0 1
88%
23%
66% 67%
9%
36%
2%
24%
74%
17%
63%
7%
31%
60%
8%
87%
38%
21%
42%
100%
64%
24%
103%
80%
100%
3%
31%
22%
0% 0%
0
20
40
60
80
100
BE
CZ
Int
DK
DE
Loc
DE
Int
EE EL ES FR IE IT
CY
Loc
CY
Int
LT L
oc
LT In
t
LU HU
MT NL
AT PL PT
SI L
oc/lo
ng-d
ist.
SI In
t
SK
FI L
oc
FI In
t
SE UK
CH
Num
ber o
f alt.
ope
rato
rs u
sing
CPS
0%
10%
20%
30%
40%
50%
60%
70%
80%
90%
100%
110%
Alt.
op.
usi
ng C
PS a
s a
% o
f alt.
act
ive
oper
ator
s
Alternative operators using CPS Alternative op.using CPS as % of alt. active operators Greece, Austria: Data refer to 31 December 2005. Latvia: Data not available. Malta: No alternative operators. Finland, Portugal: Data are not comparable with 11th Implementation Report. United Kingdom: The decrease since a year ago has been the consequence of mergers between operators. Source for Switzerland: OFCOM Switzerland. Data refer to the year 2005.
Extrait du 12ème rapport d’implémentation de l’UE étendu à la Suisse - 34
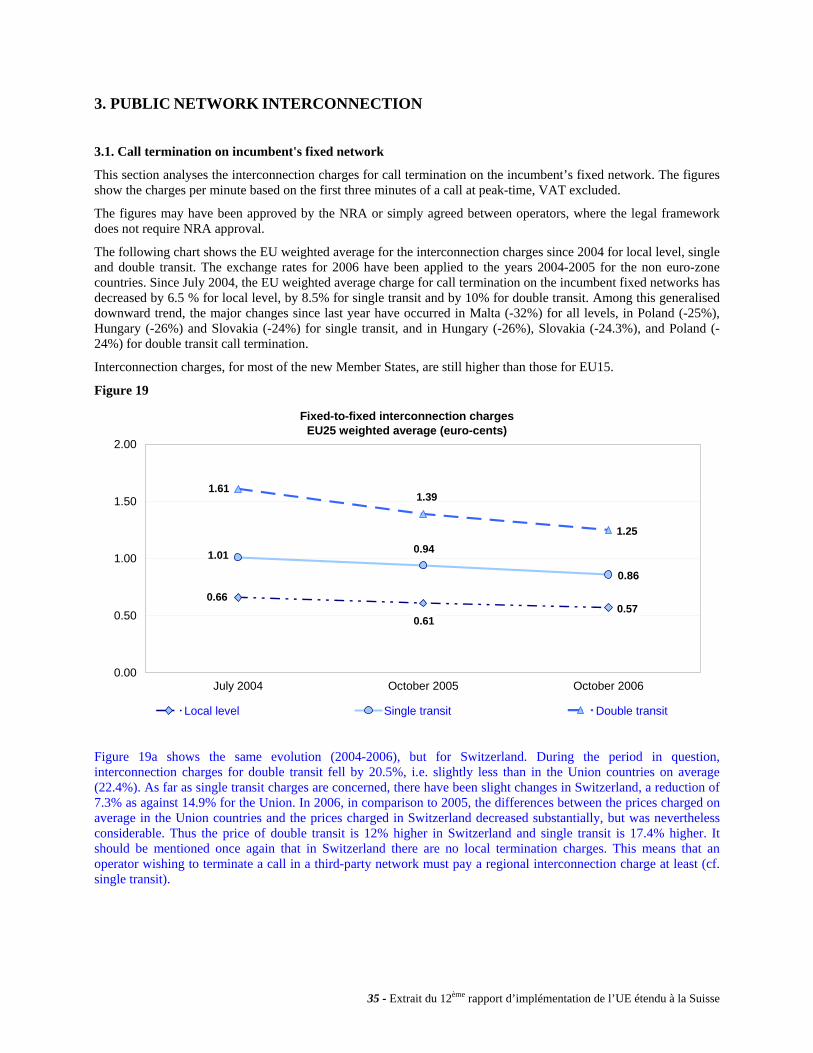
3. PUBLIC NETWORK INTERCONNECTION
3.1. Call termination on incumbent's fixed network
This section analyses the interconnection charges for call termination on the incumbent’s fixed network. The figures show the charges per minute based on the first three minutes of a call at peak-time, VAT excluded.
The figures may have been approved by the NRA or simply agreed between operators, where the legal framework does not require NRA approval.
The following chart shows the EU weighted average for the interconnection charges since 2004 for local level, single and double transit. The exchange rates for 2006 have been applied to the years 2004-2005 for the non euro-zone countries. Since July 2004, the EU weighted average charge for call termination on the incumbent fixed networks has decreased by 6.5 % for local level, by 8.5% for single transit and by 10% for double transit. Among this generalised downward trend, the major changes since last year have occurred in Malta (-32%) for all levels, in Poland (-25%), Hungary (-26%) and Slovakia (-24%) for single transit, and in Hungary (-26%), Slovakia (-24.3%), and Poland (-24%) for double transit call termination.
Interconnection charges, for most of the new Member States, are still higher than those for EU15.
Figure 19
Fixed-to-fixed interconnection chargesEU25 weighted average (euro-cents)
0.660.57
0.61
0.94
0.86
1.01
1.25
1.391.61
0.00
0.50
1.00
1.50
2.00
July 2004 October 2005 October 2006
Local level Single transit Double transitSource: Commission services based on NRA data.
Figure 19a shows the same evolution (2004-2006), but for Switzerland. During the period in question, interconnection charges for double transit fell by 20.5%, i.e. slightly less than in the Union countries on average (22.4%). As far as single transit charges are concerned, there have been slight changes in Switzerland, a reduction of 7.3% as against 14.9% for the Union. In 2006, in comparison to 2005, the differences between the prices charged on average in the Union countries and the prices charged in Switzerland decreased substantially, but was nevertheless considerable. Thus the price of double transit is 12% higher in Switzerland and single transit is 17.4% higher. It should be mentioned once again that in Switzerland there are no local termination charges. This means that an operator wishing to terminate a call in a third-party network must pay a regional interconnection charge at least (cf. single transit).
35 - Extrait du 12ème rapport d’implémentation de l’UE étendu à la Suisse
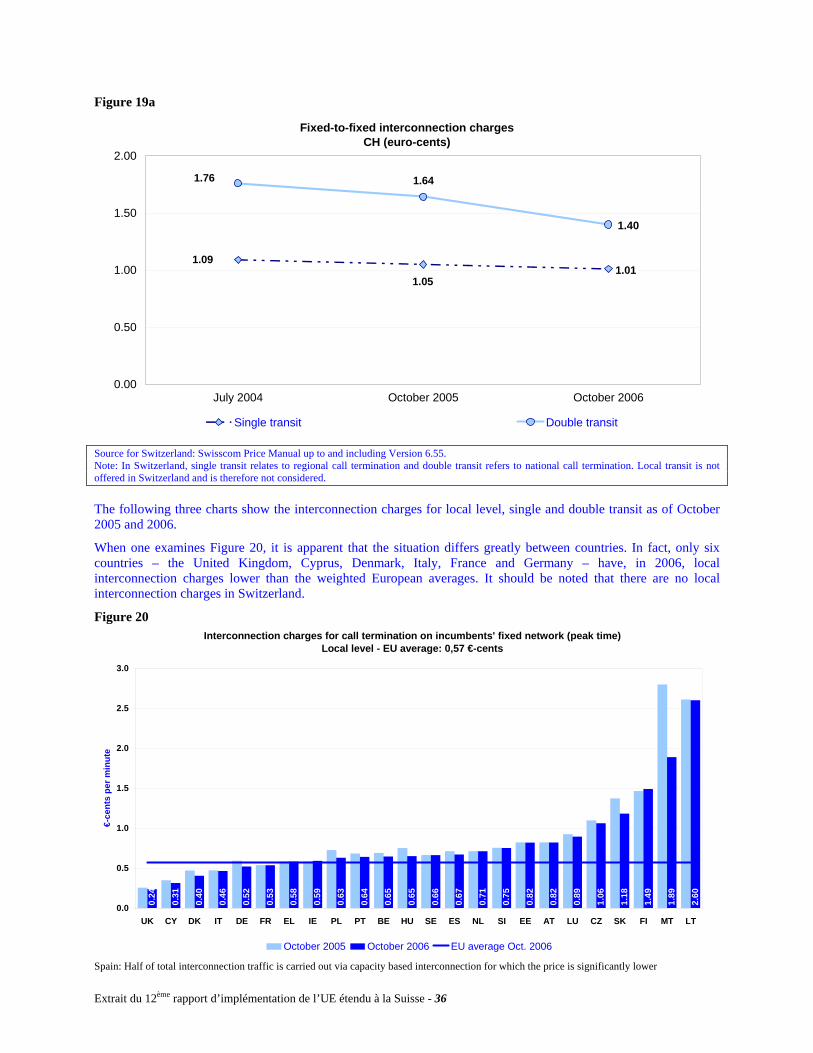
Figure 19a
Fixed-to-fixed interconnection chargesCH (euro-cents)
1.091.01
1.05
1.64
1.40
1.76
0.00
0.50
1.00
1.50
2.00
July 2004 October 2005 October 2006
Single transit Double transitSource: Commission services based on NRA data.
Source for Switzerland: Swisscom Price Manual up to and including Version 6.55. Note: In Switzerland, single transit relates to regional call termination and double transit refers to national call termination. Local transit is not offered in Switzerland and is therefore not considered. The following three charts show the interconnection charges for local level, single and double transit as of October 2005 and 2006.
When one examines Figure 20, it is apparent that the situation differs greatly between countries. In fact, only six countries – the United Kingdom, Cyprus, Denmark, Italy, France and Germany – have, in 2006, local interconnection charges lower than the weighted European averages. It should be noted that there are no local interconnection charges in Switzerland.
Figure 20 Interconnection charges for call termination on incumbents' fixed network (peak time)
Local level - EU average: 0,57 €-cents
0.24
0.31
0.40
0.46
0.52
0.53
0.58
0.59
0.64
0.65
0.65
0.66
0.67
0.71
0.75
0.82
0.82
0.89
1.06
1.18
1.49
1.89
2.60
0.63
0.0
0.5
1.0
1.5
2.0
2.5
3.0
UK CY DK IT DE FR EL IE PL PT BE HU SE ES NL SI EE AT LU CZ SK FI MT LT
€-ce
nts
per m
inut
e
October 2005 October 2006 EU average Oct. 2006 Spain: Half of total interconnection traffic is carried out via capacity based interconnection for which the price is significantly lower
Extrait du 12ème rapport d’implémentation de l’UE étendu à la Suisse - 36
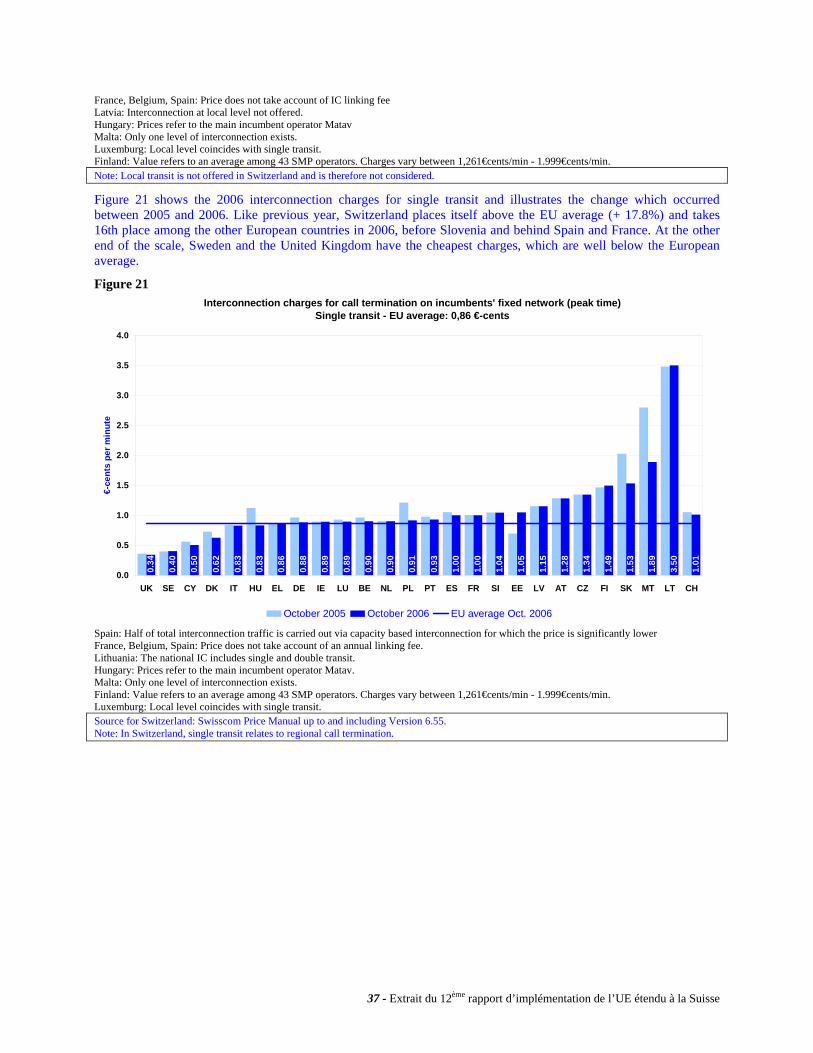
France, Belgium, Spain: Price does not take account of IC linking fee Latvia: Interconnection at local level not offered. Hungary: Prices refer to the main incumbent operator Matav Malta: Only one level of interconnection exists. Luxemburg: Local level coincides with single transit. Finland: Value refers to an average among 43 SMP operators. Charges vary between 1,261€cents/min - 1.999€cents/min. Note: Local transit is not offered in Switzerland and is therefore not considered.
Figure 21 shows the 2006 interconnection charges for single transit and illustrates the change which occurred between 2005 and 2006. Like previous year, Switzerland places itself above the EU average (+ 17.8%) and takes 16th place among the other European countries in 2006, before Slovenia and behind Spain and France. At the other end of the scale, Sweden and the United Kingdom have the cheapest charges, which are well below the European average.
Figure 21 Interconnection charges for call termination on incumbents' fixed network (peak time)
Single transit - EU average: 0,86 €-cents
0.34
0.40
0.50
0.62
0.83
0.83
0.86
0.88
0.89
0.90
0.90
0.91
0.93
1.00
1.00
1.04
1.05
1.15
1.28
1.34
1.49
1.53
1.89
3.50
1.01
0.89
0.0
0.5
1.0
1.5
2.0
2.5
3.0
3.5
4.0
UK SE CY DK IT HU EL DE IE LU BE NL PL PT ES FR SI EE LV AT CZ FI SK MT LT CH
€-ce
nts
per m
inut
e
October 2005 October 2006 EU average Oct. 2006 Spain: Half of total interconnection traffic is carried out via capacity based interconnection for which the price is significantly lower France, Belgium, Spain: Price does not take account of an annual linking fee. Lithuania: The national IC includes single and double transit. Hungary: Prices refer to the main incumbent operator Matav. Malta: Only one level of interconnection exists. Finland: Value refers to an average among 43 SMP operators. Charges vary between 1,261€cents/min - 1.999€cents/min. Luxemburg: Local level coincides with single transit. Source for Switzerland: Swisscom Price Manual up to and including Version 6.55. Note: In Switzerland, single transit relates to regional call termination.
37 - Extrait du 12ème rapport d’implémentation de l’UE étendu à la Suisse
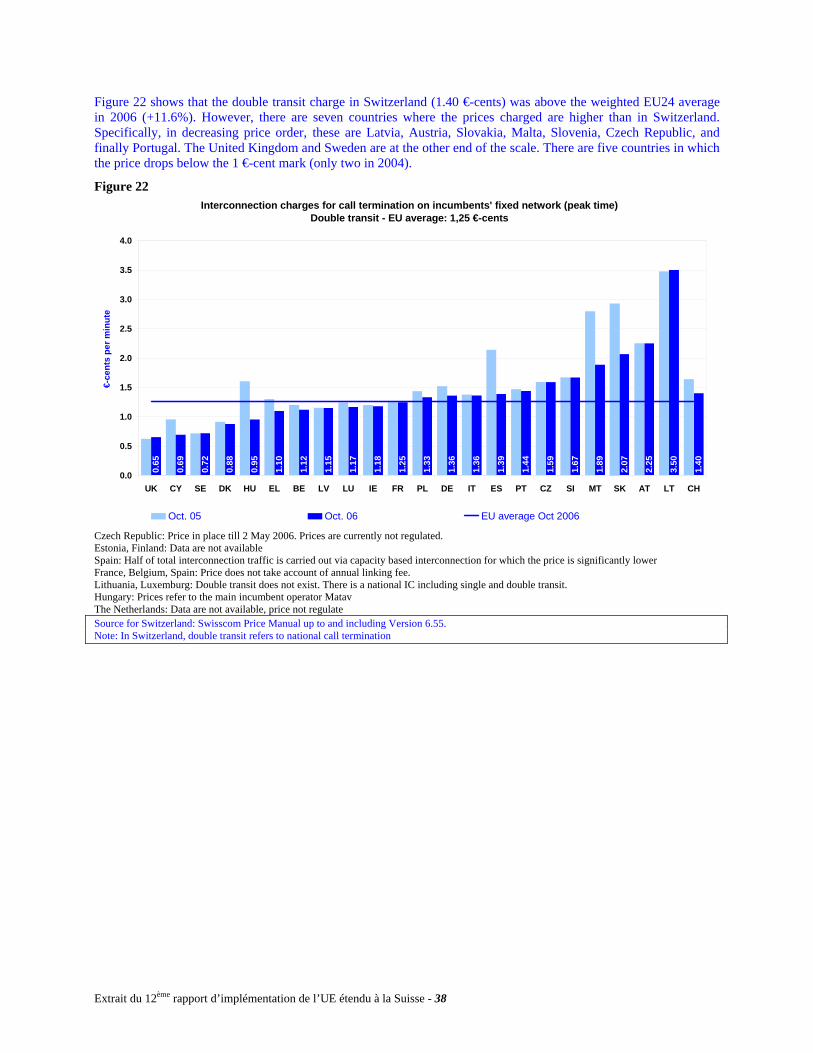
Figure 22 shows that the double transit charge in Switzerland (1.40 €-cents) was above the weighted EU24 average in 2006 (+11.6%). However, there are seven countries where the prices charged are higher than in Switzerland. Specifically, in decreasing price order, these are Latvia, Austria, Slovakia, Malta, Slovenia, Czech Republic, and finally Portugal. The United Kingdom and Sweden are at the other end of the scale. There are five countries in which the price drops below the 1 €-cent mark (only two in 2004).
Figure 22 Interconnection charges for call termination on incumbents' fixed network (peak time)
Double transit - EU average: 1,25 €-cents
0.65
0.69
0.72
0.88
0.95
1.10
1.12
1.15
1.17
1.18
1.25
1.33
1.36
1.36
1.44
1.59
1.67
1.89
2.07
2.25
3.50
1.40
1.39
0.0
0.5
1.0
1.5
2.0
2.5
3.0
3.5
4.0
UK CY SE DK HU EL BE LV LU IE FR PL DE IT ES PT CZ SI MT SK AT LT CH
€-ce
nts
per m
inut
e
Oct. 05 Oct. 06 EU average Oct 2006 Czech Republic: Price in place till 2 May 2006. Prices are currently not regulated. Estonia, Finland: Data are not available Spain: Half of total interconnection traffic is carried out via capacity based interconnection for which the price is significantly lower France, Belgium, Spain: Price does not take account of annual linking fee. Lithuania, Luxemburg: Double transit does not exist. There is a national IC including single and double transit. Hungary: Prices refer to the main incumbent operator Matav The Netherlands: Data are not available, price not regulate Source for Switzerland: Swisscom Price Manual up to and including Version 6.55. Note: In Switzerland, double transit refers to national call termination
Extrait du 12ème rapport d’implémentation de l’UE étendu à la Suisse - 38
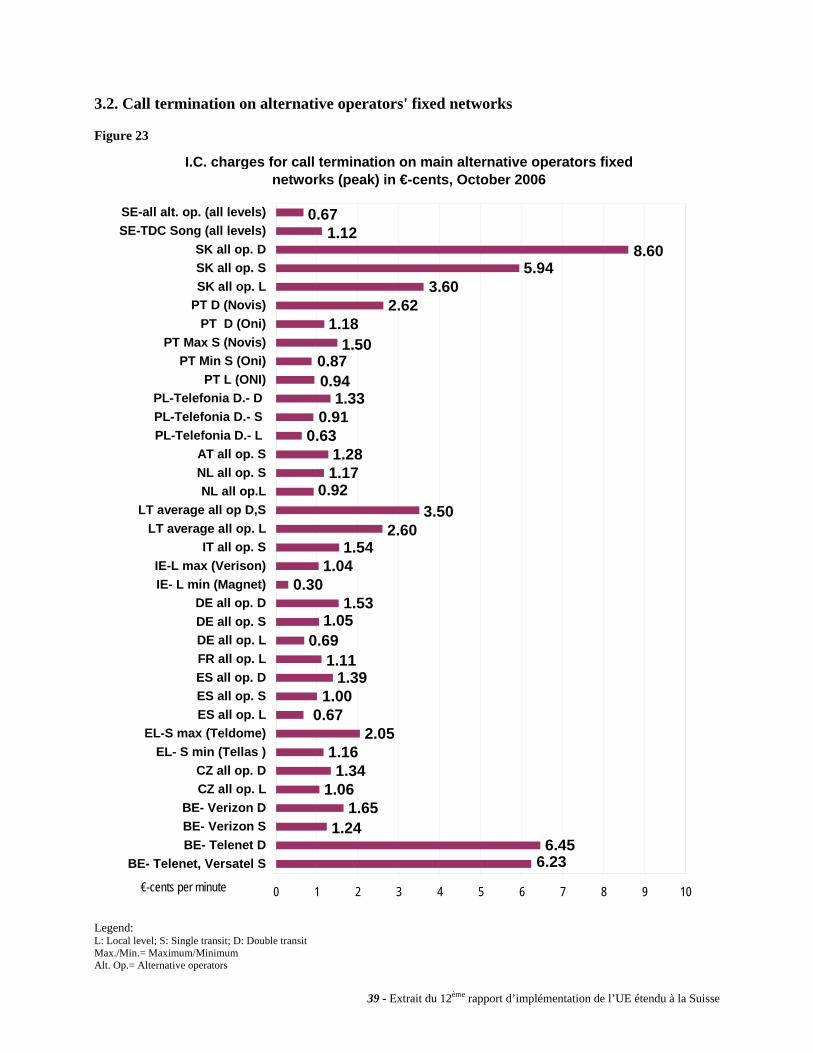
3.2. Call termination on alternative operators' fixed networks Figure 23
I.C. charges for call termination on main alternative operators fixed networks (peak) in €-cents, October 2006
0.67
1.53
1.128.60
5.943.60
2.621.18
1.500.870.94
1.330.91
0.631.281.17
0.923.50
2.601.54
1.040.30
1.050.69
1.111.39
1.000.67
2.051.161.34
1.061.65
1.246.45
6.23
0 1 2 3 4 5 6 7 8 9 10
BE- Telenet, Versatel SBE- Telenet DBE- Verizon SBE- Verizon D
CZ all op. LCZ all op. D
EL- S min (Tellas )EL-S max (Teldome)
ES all op. LES all op. SES all op. DFR all op. LDE all op. LDE all op. SDE all op. D
IE- L min (Magnet)IE-L max (Verison)
IT all op. SLT average all op. L
LT average all op D,SNL all op.L
NL all op. SAT all op. S
PL-Telefonia D.- L PL-Telefonia D.- S PL-Telefonia D.- D
PT L (ONI)PT Min S (Oni)
PT Max S (Novis)PT D (Oni)
PT D (Novis)SK all op. LSK all op. SSK all op. D
SE-TDC Song (all levels)SE-all alt. op. (all levels)
€-cents per minute
Legend: L: Local level; S: Single transit; D: Double transit Max./Min.= Maximum/Minimum Alt. Op.= Alternative operators
39 - Extrait du 12ème rapport d’implémentation de l’UE étendu à la Suisse
Cyprus, Luxemburg, Hungary, Slovenia, Finland, United Kingdom: Data are not available. Estonia, Denmark: Data are confidential. France: Price does not take account of annual linking fee. Data refer to IC charges for geographic number. Malta: No alternative fixed operators. Germany: For 32 alternative network operators a uniform tariff for termination services has been imposed on the basis of a dispute settlement. Data for Switzerland are not available.
3.3. Call termination on mobile networks This section presents the per-minute interconnection charges for fixed call termination on the networks of mobile operators based on the first three minutes of a call at peak rate. Where available charges for call termination on the networks of 3G operators and service providers (MVNO and resellers) have been included. Charges are for calls originated in the same countries
In the following charts information is shown for 88 mobile operators in the EU (representing almost 100% of the EU mobile market) and for 3 mobile operators in Switzerland.
Following the analysis of the market for mobile call termination, mobile network operators have been notified as having Significant Market Power (SMP) on their mobile network. For this reason the split between SMP and non SMP operators used in the previous report is no longer applicable. It should also be noted that not all SMP mobile operators have been imposed remedies on termination charges.
Apart from Ireland, Slovenia and Finland, termination charges are applied for both fixed and mobile calls (no information are available for Germany). Where available, information on mobile-to-mobile termination rate have been indicated in the notes.
Data have been collected by the NRAs, and refer to 1 October 2006.
3.3.1. EU and national average
The following chart shows the trend in the (weighted) average fixed-to-mobile termination charges for all mobile operators in the EU and in Switzerland since July 2004.
The national averages for all mobile operators in each Member States are weighted average charges based on the number of subscribers and the termination rate of each operator at 1 October 2006.
Where available, data for 3G operators and service providers have been taken into account. The 2006 exchange rates have been applied to the non euro-zone countries for previous years.
The trend shows that termination charges have continued to decrease and at October 2006 the EU average termination charge was 9% lower than one year before (-21.8% respect July 2004). The most significant reductions have occurred in France (-24%). Reduction of around 20% has taken place in Denmark, Austria, Portugal, and Sweden. In Germany, Greece, Spain, Luxembourg, Hungary, The Netherlands, Slovenia and Sweden there have been reductions from 11% to 17%. The average mobile termination charge has increased in the United Kingdom (+9.2%).
Despite the continuing decline, termination charges remain on average more than 9 times higher than the fixed interconnection charges (double transit). Differences between 10 and 14 times the double fixed interconnection charges are found in Belgium, Denmark, Greece, Ireland, Luxembourg, Hungary, Poland, Slovenia, Sweden, and United Kingdom.
In 2006 the average price that the Swiss operators charged for the call termination on mobile networks was about 32% higher than the European average. There was a significant decrease (28.3%) in the interconnection charges in Switzerland in the period of July 2004-October 2005, and just a little price reduction between October 2005 and October 2006.
The strong decrease between 2004 and 2005 is due to Swisscom and Sunrise. Swisscom led the way by dramatically reducing its mobile termination charge in July 2005 by 40%, Sunrise followed in August by reducing its termination charge by 19%. Orange did the same but only in January 2006 with a reduction of 11%, and then once again in July 2006 (-9%). It has to be noted that Swisscom demands the lowest termination charges (Figure 26).
Extrait du 12ème rapport d’implémentation de l’UE étendu à la Suisse - 40
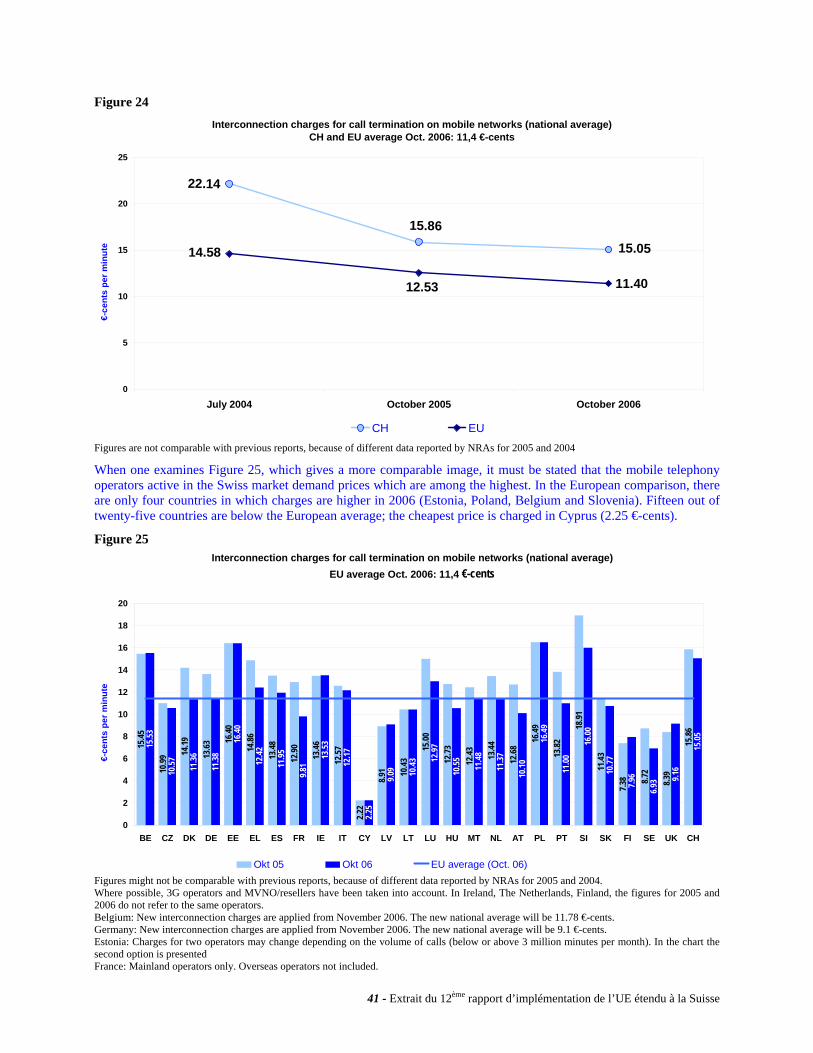
Figure 24 Interconnection charges for call termination on mobile networks (national average)
CH and EU average Oct. 2006: 11,4 €-cents
11.40
15.05
15.86
22.14
12.53
14.58
0
5
10
15
20
25
July 2004 October 2005 October 2006
€-ce
nts
per m
inut
e
CH EU Figures are not comparable with previous reports, because of different data reported by NRAs for 2005 and 2004 When one examines Figure 25, which gives a more comparable image, it must be stated that the mobile telephony operators active in the Swiss market demand prices which are among the highest. In the European comparison, there are only four countries in which charges are higher in 2006 (Estonia, Poland, Belgium and Slovenia). Fifteen out of twenty-five countries are below the European average; the cheapest price is charged in Cyprus (2.25 €-cents).
Figure 25 Interconnection charges for call termination on mobile networks (national average)
EU average Oct. 2006: 11,4 €-cents
15.45
10.99
14.19
13.63
16.40
14.86
13.48
12.90 13.46
12.57
2.22
8.91 10
.43
15.00
12.73
12.43 13
.44
12.68
16.49
13.82
18.91
11.43
7.38 8.7
2
8.39
15.86
15.53
10.57 11
.36
11.38
16.40
12.42
11.95
9.81
13.53
12.17
2.25
9.09 10.43 12
.97
10.55 11
.48
11.37
10.10
16.49
11.00
16.00
10.77
7.96
6.93 9.1
6
15.05
0
2
4
6
8
10
12
14
16
18
20
BE CZ DK DE EE EL ES FR IE IT CY LV LT LU HU MT NL AT PL PT SI SK FI SE UK CH
€-ce
nts
per m
inut
e
Okt 05 Okt 06 EU average (Oct. 06) Figures might not be comparable with previous reports, because of different data reported by NRAs for 2005 and 2004. Where possible, 3G operators and MVNO/resellers have been taken into account. In Ireland, The Netherlands, Finland, the figures for 2005 and 2006 do not refer to the same operators. Belgium: New interconnection charges are applied from November 2006. The new national average will be 11.78 €-cents. Germany: New interconnection charges are applied from November 2006. The new national average will be 9.1 €-cents. Estonia: Charges for two operators may change depending on the volume of calls (below or above 3 million minutes per month). In the chart the second option is presented France: Mainland operators only. Overseas operators not included.
41 - Extrait du 12ème rapport d’implémentation de l’UE étendu à la Suisse
Poland: New interconnection charges are applied from 15 October 2006. The new national average will be 11.78 €-cents. Finland: Fixed to mobile charges only apply when the call is made through a prefix code or carrier pre-selection. In other cases, local operators determine the local network charges and mobile operators determine the mobile call charges. Source for Switzerland: Swisscom Price Manual up to and including Version 6.55.
3.3.2. Mobile operators' termination charges
The following charts show the individual fixed-to-mobile interconnection charges for 85 mobile operators in the EU (88 with Switzerland). Apart from Cyprus which represents an exception (2.15 € cents) the lowest charge is found in Finland (6.8 € cents) whereas the highest charge is found in Belgium at 20.27 € cents (almost three times that of the cheapest).
Extrait du 12ème rapport d’implémentation de l’UE étendu à la Suisse - 42
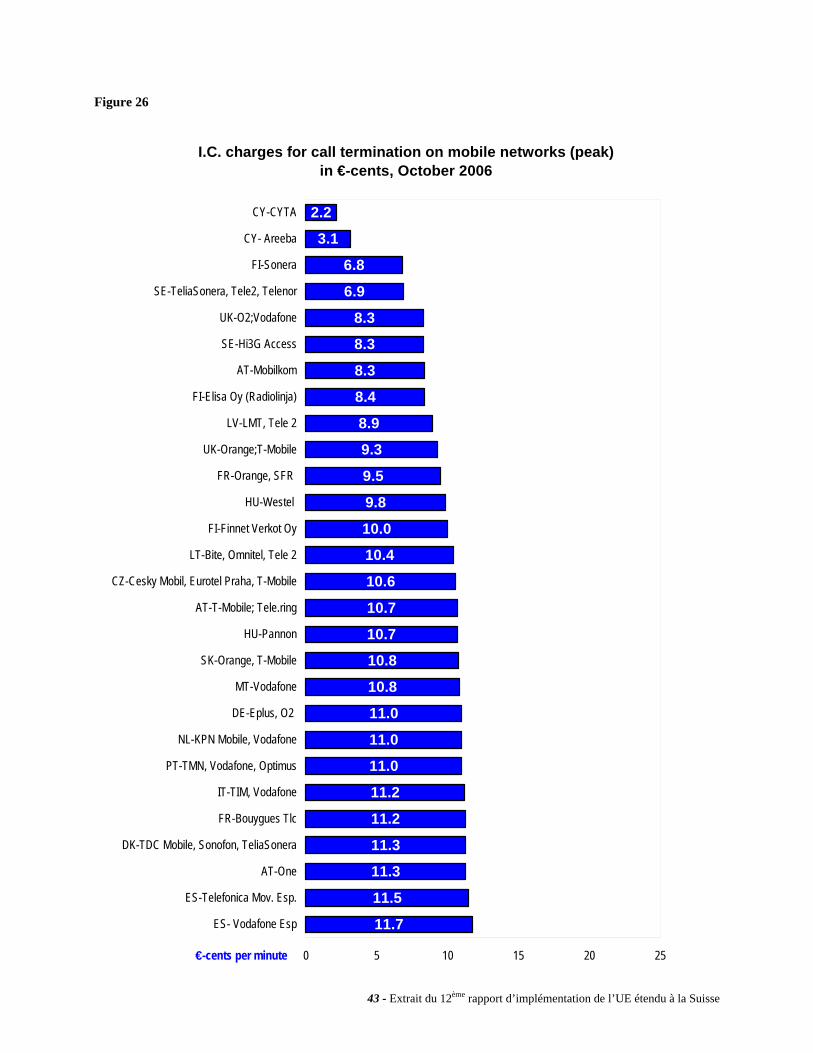
Figure 26
I.C. charges for call termination on mobile networks (peak) in €-cents, October 2006
11.2
11.0
10.8
10.7
9.3
8.3
6.9
6.8
2.2
11.7
11.5
11.3
11.2
11.0
10.6
10.4
10.0
9.8
8.9
8.4
8.3
8.3
3.1
11.3
11.0
10.8
9.5
10.7
0 5 10 15 20 25
ES- Vodafone Esp
ES-Telefonica Mov. Esp.
AT-One
DK-TDC Mobile, Sonofon, TeliaSonera
FR-Bouygues Tlc
IT-TIM, Vodafone
PT-TMN, Vodafone, Optimus
NL-KPN Mobile, Vodafone
DE-Eplus, O2
MT-Vodafone
SK-Orange, T-Mobile
HU-Pannon
AT-T-Mobile; Tele.ring
CZ-Cesky Mobil, Eurotel Praha, T-Mobile
LT-Bite, Omnitel, Tele 2
FI-Finnet Verkot Oy
HU-Westel
FR-Orange, SFR
UK-Orange;T-Mobile
LV-LMT, Tele 2
FI-Elisa Oy (Radiolinja)
AT-Mobilkom
SE-Hi3G Access
UK-O2;Vodafone
SE-TeliaSonera, Tele2, Telenor
FI-Sonera
CY- Areeba
CY-CYTA
€-cents per minute
43 - Extrait du 12ème rapport d’implémentation de l’UE étendu à la Suisse
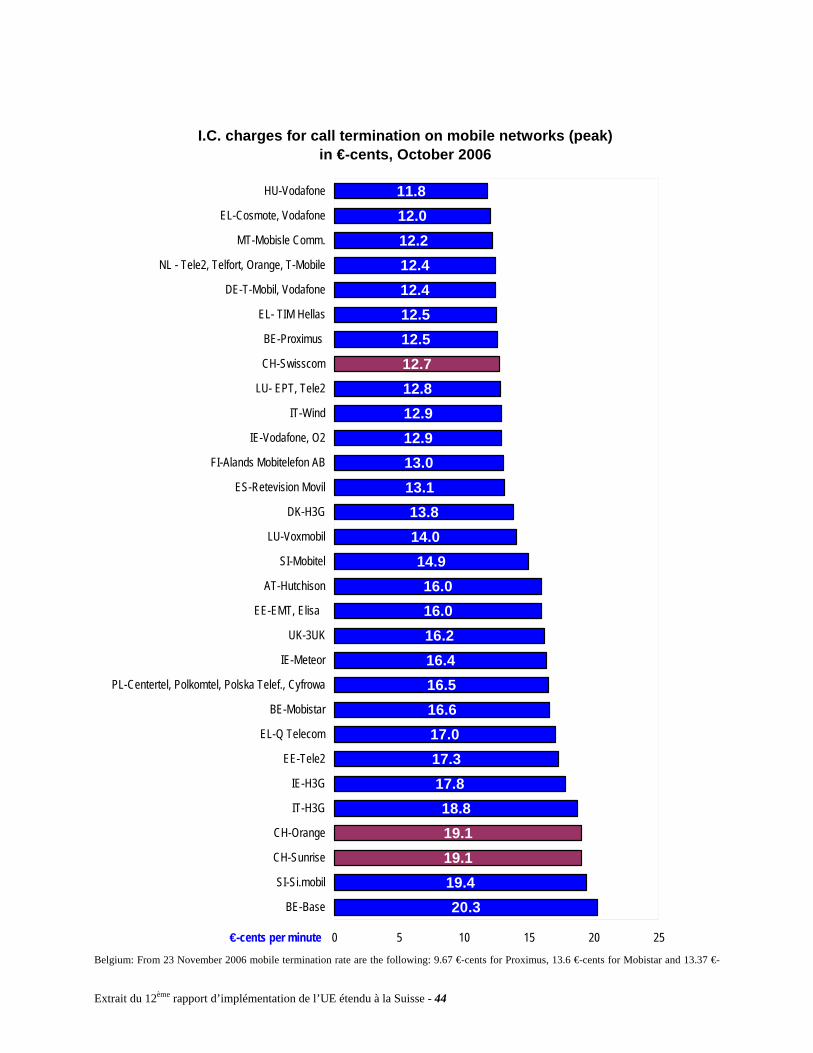
I.C. charges for call termination on mobile networks (peak) in €-cents, October 2006
17.8
16.6
16.416.2
13.0
12.8
12.512.4
12.212.011.8
20.319.4
19.118.8
17.3
16.014.9
14.013.8
12.912.9
12.712.5
12.4
19.1
17.0
16.5
13.1
16.0
0 5 10 15 20 25
BE-Base
SI-Si.mobil
CH-Sunrise
CH-Orange
IT-H3G
IE-H3G
EE-Tele2
EL-Q Telecom
BE-Mobistar
PL-Centertel, Polkomtel, Polska Telef., Cyfrowa
IE-Meteor
UK-3UK
EE-EMT, Elisa
AT-Hutchison
SI-Mobitel
LU-Voxmobil
DK-H3G
ES-Retevision Movil
FI-Alands Mobitelefon AB
IE-Vodafone, O2
IT-Wind
LU- EPT, Tele2
CH-Swisscom
BE-Proximus
EL- TIM Hellas
DE-T-Mobil, Vodafone
NL - Tele2, Telfort, Orange, T-Mobile
MT-Mobisle Comm.
EL-Cosmote, Vodafone
HU-Vodafone
€-cents per minute
Belgium: From 23 November 2006 mobile termination rate are the following: 9.67 €-cents for Proximus, 13.6 €-cents for Mobistar and 13.37 €-
Extrait du 12ème rapport d’implémentation de l’UE étendu à la Suisse - 44
cents for Base. Czech Republic: The prices are valid since 2 May 2006. Germany: Data refer to fixed-to-mobile. No information available concerning mobile to-mobile. From 23 November 2006 mobile termination rate are the following: 8.78 €-cents for T-Mobile and Vodafone, 9.94 €-cents for E-plus and O2. Estonia: Data refer to fixed-to-mobile. Termination charge from mobile network to EMTS is 12.9€cents/min for Elisa (no information available for EMT and Tele2). Charges in the chart for Elisa and EMT refer to call volume over 3 million minutes per month. Charges for smaller volumes are higher: 17.58 €-cents/min for EMT and 10.11 €-cents/min for Elisa. Spain: Prices in the chart are valid from 16 October 2006 to March 2007. Ireland: Data refer to fixed-to-mobile. Termination charges from mobile network are the following: 13.4 €-cents for O2; 13.33 €-cents for Vodafone; 16.36 €-cents for Meteor; 17.78 €-cents for H3G. Poland: Prices valid up to 15 October 2006. Mobile termination rate after 15 October 2006 will be 1.17 €-cents for all operators. Slovenia: Data refer to fixed-to-mobile. Termination charges from mobile network are the following: 0.1 €-cents for Si.mobil and 0.07 €-cents for Mobiltel. Finland: Fixed to mobile charges only apply when the call is made through a prefix code or carrier pre-selection. Source for Switzerland: Swisscom Price Manual Version 6.55.
3.4. Leased lines interconnection charges
This section shows the monthly rental and the one-off charges for short-distance leased lines (local ends, excluding VAT), up to 2 and 5 km, provided by the incumbent operator to other interconnected operators.
The distance refers to the radial distance between the customer local end leased line and the point of interconnection.
It should be noted that in some cases data include the handover costs, while in other cases these costs are excluded.
National Regulatory Authorities have provided these figures through the questionnaire for the 12th Implementation Report. Unless otherwise indicated; figures indicate the position in October 2006.
Note that in Switzerland, Swisscom negotiates prices on a case-by-case basis with its clients. In the absence of official data, it is therefore not possible to include Switzerland in Figures 27 to 32.
Compared to last year, the prices for monthly rentals (all capacities) have decreased in several countries (France, Spain), whereas the highest price is in Slovenia (231€ for 64kbit/5km distance: 3828 € for 34Mbit/5km) and the cheapest price can be found in Greece, Portugal and UK (between 34 and 37 € for 64 Kbit capacity). One-off charges for leased lines have remained stable in 6 countries (Belgium, Germany, France, Ireland, Austria and Portugal); in Greece, the increase in price compared to last year was spectacular (close to 200% for 64Kbit and more than 100% for 2Mbit lines) whereas in Denmark, the price drop was above 90% for the 2Mbit/sec circuit compared to last year. The cheapest monthly fee is to be found in Cyprus (between 32 and 77 € for 2 Mbit).
The highest one-off fee price is in Latvia for 2 Mbit (3261 €) while the lowest price in this capacity can be found in Lithuania: 291 € compared to 1196 € last year.
Looking at higher speed leased lines (34Mbit/sec), one-off fee is significantly high in Denmark.
45 - Extrait du 12ème rapport d’implémentation de l’UE étendu à la Suisse
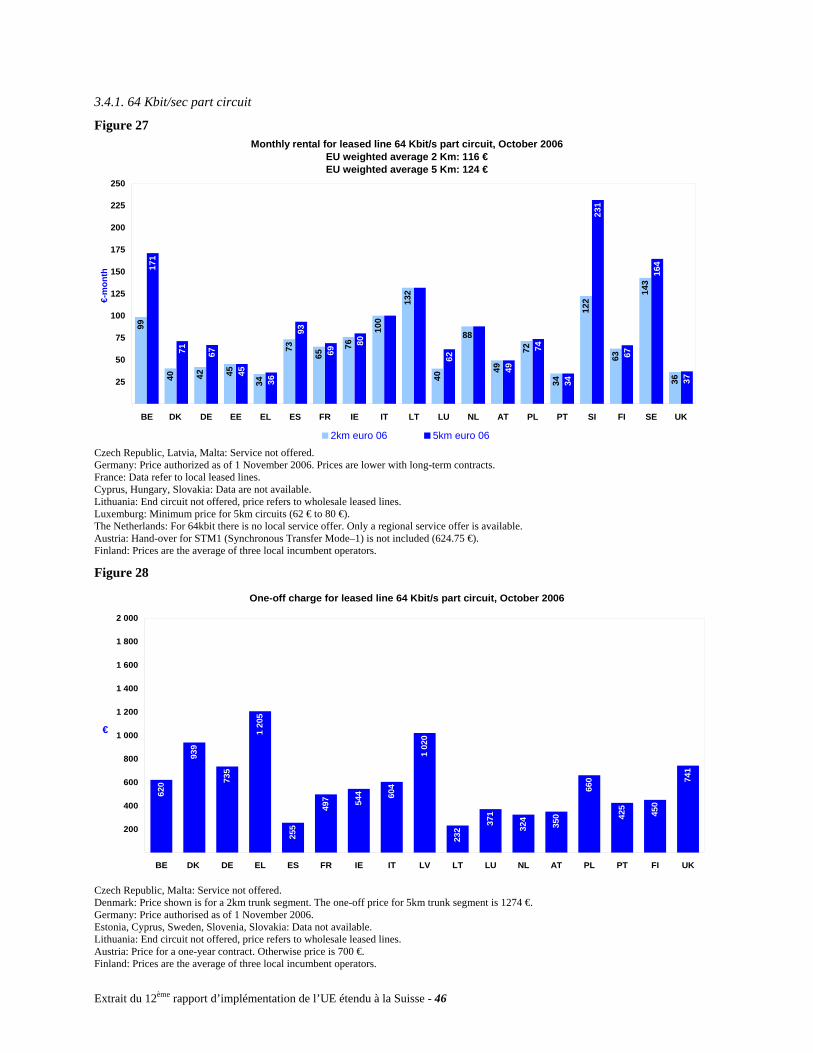
3.4.1. 64 Kbit/sec part circuit
Figure 27 Monthly rental for leased line 64 Kbit/s part circuit, October 2006
EU weighted average 2 Km: 116 €EU weighted average 5 Km: 124 €
99
45
34
73
65
49
63
143
36
171
71
45
36
93
69
49
34
231
67
164
3742
100
72
122
34
88
4040
76
132
67 7
4
62
80
25
50
75
100
125
150
175
200
225
250
BE DK DE EE EL ES FR IE IT LT LU NL AT PL PT SI FI SE UK
€-m
onth
2km euro 06 5km euro 06 Czech Republic, Latvia, Malta: Service not offered. Germany: Price authorized as of 1 November 2006. Prices are lower with long-term contracts. France: Data refer to local leased lines. Cyprus, Hungary, Slovakia: Data are not available. Lithuania: End circuit not offered, price refers to wholesale leased lines. Luxemburg: Minimum price for 5km circuits (62 € to 80 €). The Netherlands: For 64kbit there is no local service offer. Only a regional service offer is available. Austria: Hand-over for STM1 (Synchronous Transfer Mode–1) is not included (624.75 €). Finland: Prices are the average of three local incumbent operators.
Figure 28
One-off charge for leased line 64 Kbit/s part circuit, October 2006
62
0
93
9
73
5
49
7
54
4
60
4
1 0
20
23
2 37
1
35
0
66
0
42
5
74
1
32
4 45
0
25
5
1 2
05
200
400
600
800
1 000
1 200
1 400
1 600
1 800
2 000
BE DK DE EL ES FR IE IT LV LT LU NL AT PL PT FI UK
€
Czech Republic, Malta: Service not offered. Denmark: Price shown is for a 2km trunk segment. The one-off price for 5km trunk segment is 1274 €. Germany: Price authorised as of 1 November 2006. Estonia, Cyprus, Sweden, Slovenia, Slovakia: Data not available. Lithuania: End circuit not offered, price refers to wholesale leased lines. Austria: Price for a one-year contract. Otherwise price is 700 €. Finland: Prices are the average of three local incumbent operators.
Extrait du 12ème rapport d’implémentation de l’UE étendu à la Suisse - 46
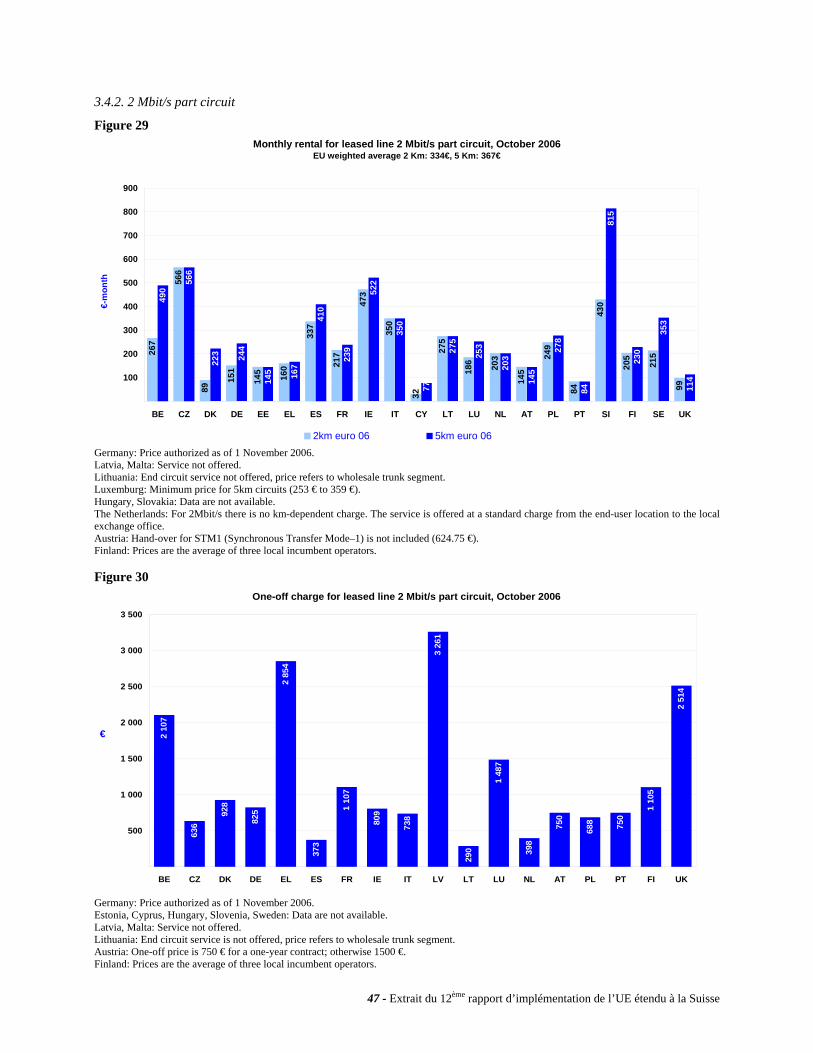
3.4.2. 2 Mbit/s part circuit
Figure 29 Monthly rental for leased line 2 Mbit/s part circuit, October 2006
EU weighted average 2 Km: 334€, 5 Km: 367€26
7
566
89
151
160
337
217
473
350
186 24
9
430
205
215
99
49
0 56
6
22
3
24
4
16
7
41
0
23
9
52
2
77
25
3
27
8
81
5
23
0
35
3
11
4
84
14520
3
275
145
32 84 1
45
203
275
145
35
0
100
200
300
400
500
600
700
800
900
BE CZ DK DE EE EL ES FR IE IT CY LT LU NL AT PL PT SI FI SE UK
€-m
onth
2km euro 06 5km euro 06 Germany: Price authorized as of 1 November 2006. Latvia, Malta: Service not offered. Lithuania: End circuit service not offered, price refers to wholesale trunk segment. Luxemburg: Minimum price for 5km circuits (253 € to 359 €). Hungary, Slovakia: Data are not available. The Netherlands: For 2Mbit/s there is no km-dependent charge. The service is offered at a standard charge from the end-user location to the local exchange office. Austria: Hand-over for STM1 (Synchronous Transfer Mode–1) is not included (624.75 €). Finland: Prices are the average of three local incumbent operators. Figure 30
One-off charge for leased line 2 Mbit/s part circuit, October 2006
2 1
07
63
6 92
8
82
5
37
3
1 1
07
80
9
73
8
1 4
87
39
8
75
0
68
8
75
0 1 1
05
2 5
14
29
0
3 2
61
2 8
54
500
1 000
1 500
2 000
2 500
3 000
3 500
BE CZ DK DE EL ES FR IE IT LV LT LU NL AT PL PT FI UK
€
Germany: Price authorized as of 1 November 2006. Estonia, Cyprus, Hungary, Slovenia, Sweden: Data are not available. Latvia, Malta: Service not offered. Lithuania: End circuit service is not offered, price refers to wholesale trunk segment. Austria: One-off price is 750 € for a one-year contract; otherwise 1500 €. Finland: Prices are the average of three local incumbent operators.
47 - Extrait du 12ème rapport d’implémentation de l’UE étendu à la Suisse
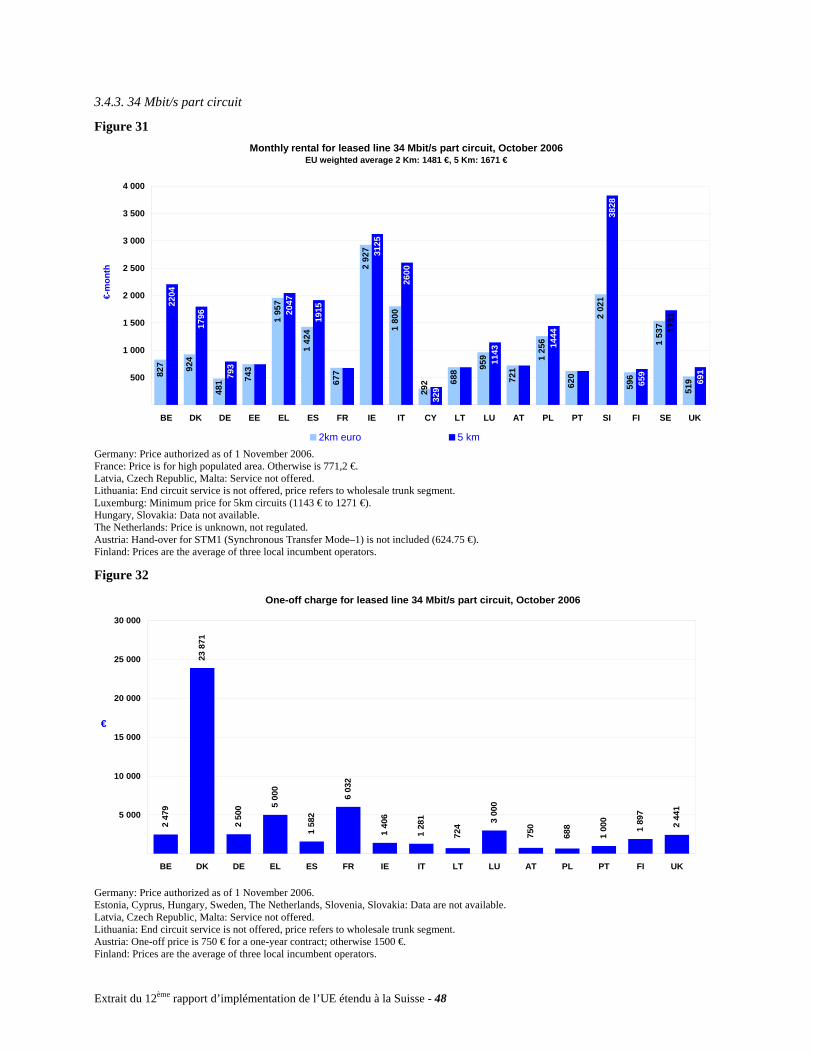
3.4.3. 34 Mbit/s part circuit
Figure 31 Monthly rental for leased line 34 Mbit/s part circuit, October 2006
EU weighted average 2 Km: 1481 €, 5 Km: 1671 €22
04
1796
793
2047
1915
3125
1143
1444
3828
691
1 5
37
2 0
21
1 2
56
95
9
1 8
00
2 9
27
1 4
24
1 9
57
82
7
92
4
48
1
51
9 74
3
68
8
72
1
62
0
596
67
7
29
232
9
2600
659
1731
500
1 000
1 500
2 000
2 500
3 000
3 500
4 000
BE DK DE EE EL ES FR IE IT CY LT LU AT PL PT SI FI SE UK
€-m
onth
2km euro 5 km Germany: Price authorized as of 1 November 2006. France: Price is for high populated area. Otherwise is 771,2 €. Latvia, Czech Republic, Malta: Service not offered. Lithuania: End circuit service is not offered, price refers to wholesale trunk segment. Luxemburg: Minimum price for 5km circuits (1143 € to 1271 €). Hungary, Slovakia: Data not available. The Netherlands: Price is unknown, not regulated. Austria: Hand-over for STM1 (Synchronous Transfer Mode–1) is not included (624.75 €). Finland: Prices are the average of three local incumbent operators.
Figure 32
One-off charge for leased line 34 Mbit/s part circuit, October 2006
2 5
00
1 5
82
6 0
32
1 4
06
2 4
79
1 8
97
2 4
41
1 0
00
75
0
1 2
81
72
4
5 0
00
68
8 3 0
00
23
871
5 000
10 000
15 000
20 000
25 000
30 000
BE DK DE EL ES FR IE IT LT LU AT PL PT FI UK
€
Germany: Price authorized as of 1 November 2006. Estonia, Cyprus, Hungary, Sweden, The Netherlands, Slovenia, Slovakia: Data are not available. Latvia, Czech Republic, Malta: Service not offered. Lithuania: End circuit service is not offered, price refers to wholesale trunk segment. Austria: One-off price is 750 € for a one-year contract; otherwise 1500 €. Finland: Prices are the average of three local incumbent operators.
Extrait du 12ème rapport d’implémentation de l’UE étendu à la Suisse - 48
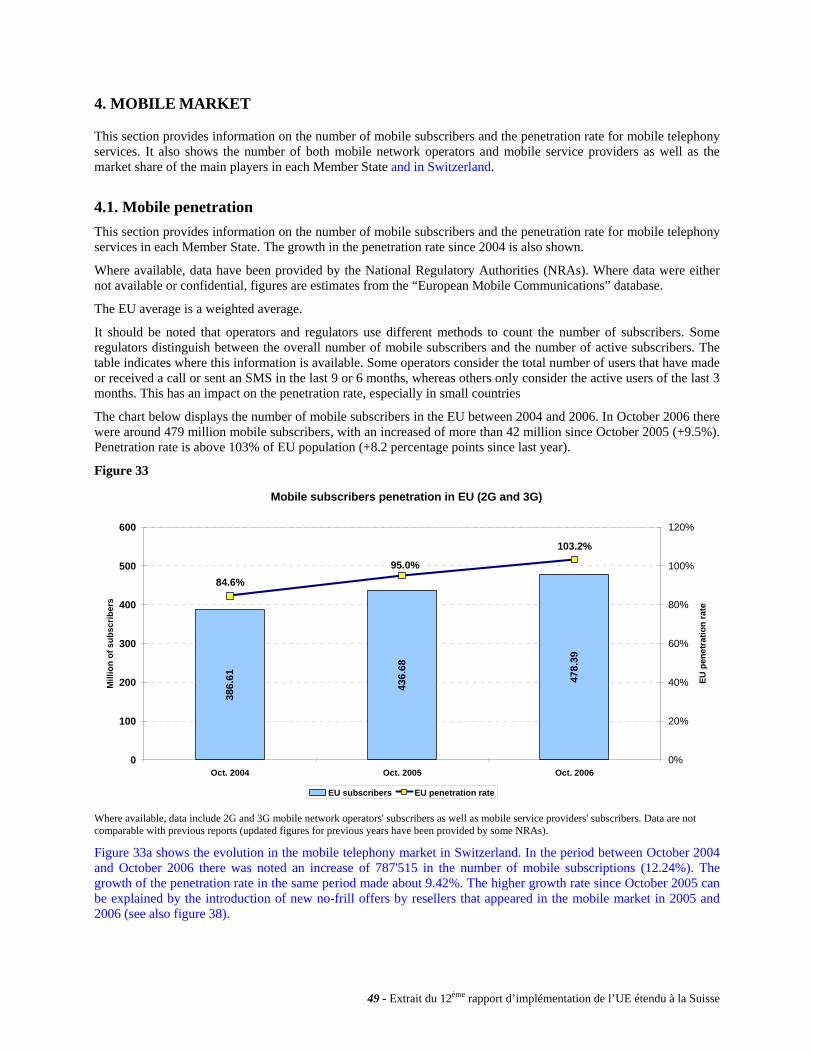
4. MOBILE MARKET
This section provides information on the number of mobile subscribers and the penetration rate for mobile telephony services. It also shows the number of both mobile network operators and mobile service providers as well as the market share of the main players in each Member State and in Switzerland.
4.1. Mobile penetration This section provides information on the number of mobile subscribers and the penetration rate for mobile telephony services in each Member State. The growth in the penetration rate since 2004 is also shown.
Where available, data have been provided by the National Regulatory Authorities (NRAs). Where data were either not available or confidential, figures are estimates from the “European Mobile Communications” database.
The EU average is a weighted average.
It should be noted that operators and regulators use different methods to count the number of subscribers. Some regulators distinguish between the overall number of mobile subscribers and the number of active subscribers. The table indicates where this information is available. Some operators consider the total number of users that have made or received a call or sent an SMS in the last 9 or 6 months, whereas others only consider the active users of the last 3 months. This has an impact on the penetration rate, especially in small countries
The chart below displays the number of mobile subscribers in the EU between 2004 and 2006. In October 2006 there were around 479 million mobile subscribers, with an increased of more than 42 million since October 2005 (+9.5%). Penetration rate is above 103% of EU population (+8.2 percentage points since last year).
Figure 33
Mobile subscribers penetration in EU (2G and 3G)
386.
61
436.
68
478.
3984.6%
103.2%
95.0%
0
100
200
300
400
500
600
Oct. 2004 Oct. 2005 Oct. 2006
Mill
ion
of s
ubsc
riber
s
0%
20%
40%
60%
80%
100%
120%
EU p
enet
ratio
n ra
te
EU subscribers EU penetration rate Where available, data include 2G and 3G mobile network operators' subscribers as well as mobile service providers' subscribers. Data are not comparable with previous reports (updated figures for previous years have been provided by some NRAs).
Figure 33a shows the evolution in the mobile telephony market in Switzerland. In the period between October 2004 and October 2006 there was noted an increase of 787'515 in the number of mobile subscriptions (12.24%). The growth of the penetration rate in the same period made about 9.42%. The higher growth rate since October 2005 can be explained by the introduction of new no-frill offers by resellers that appeared in the mobile market in 2005 and 2006 (see also figure 38).
49 - Extrait du 12ème rapport d’implémentation de l’UE étendu à la Suisse
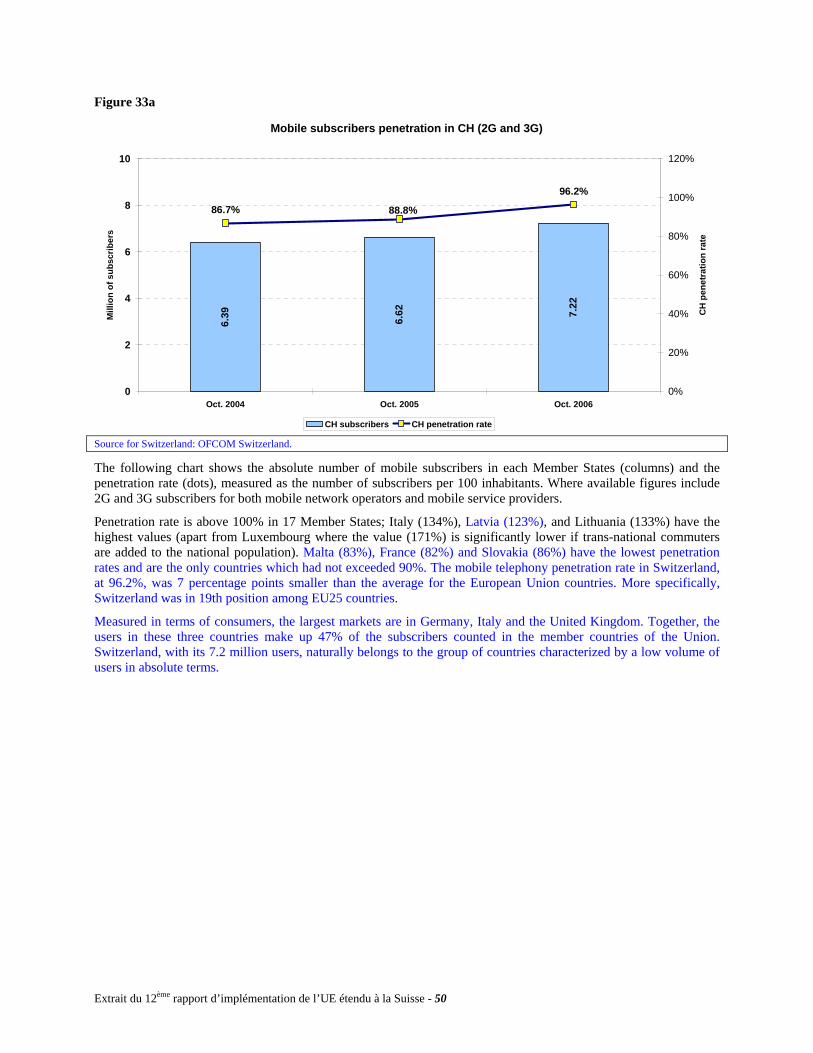
Figure 33a
Mobile subscribers penetration in CH (2G and 3G)
6.39 6.62 7.
22
86.7%
96.2%
88.8%
0
2
4
6
8
10
Oct. 2004 Oct. 2005 Oct. 2006
Mill
ion
of s
ubsc
riber
s
0%
20%
40%
60%
80%
100%
120%
CH
pen
etra
tion
rate
CH subscribers CH penetration rate
Source for Switzerland: OFCOM Switzerland.
The following chart shows the absolute number of mobile subscribers in each Member States (columns) and the penetration rate (dots), measured as the number of subscribers per 100 inhabitants. Where available figures include 2G and 3G subscribers for both mobile network operators and mobile service providers.
Penetration rate is above 100% in 17 Member States; Italy (134%), Latvia (123%), and Lithuania (133%) have the highest values (apart from Luxembourg where the value (171%) is significantly lower if trans-national commuters are added to the national population). Malta (83%), France (82%) and Slovakia (86%) have the lowest penetration rates and are the only countries which had not exceeded 90%. The mobile telephony penetration rate in Switzerland, at 96.2%, was 7 percentage points smaller than the average for the European Union countries. More specifically, Switzerland was in 19th position among EU25 countries.
Measured in terms of consumers, the largest markets are in Germany, Italy and the United Kingdom. Together, the users in these three countries make up 47% of the subscribers counted in the member countries of the Union. Switzerland, with its 7.2 million users, naturally belongs to the group of countries characterized by a low volume of users in absolute terms.
Extrait du 12ème rapport d’implémentation de l’UE étendu à la Suisse - 50
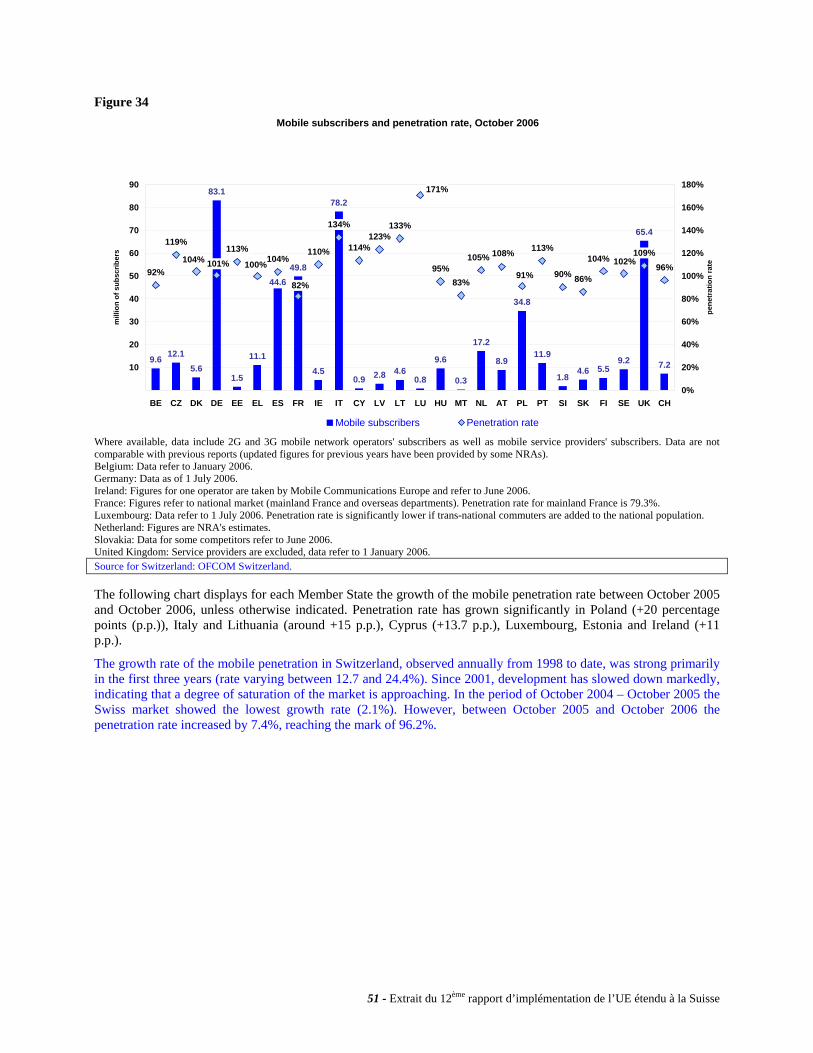
Figure 34 Mobile subscribers and penetration rate, October 2006
9.6 12.15.6
83.1
1.5
11.14.5
0.9 2.8 4.60.8
9.6
0.3
17.2
8.911.9
1.84.6 5.5
9.2 7.2
65.4
34.8
78.2
49.844.6
92%
119%113%
104%110%
134%
114%123%
133%
95%83%
113%
90% 86%
109%96%102%104%
171%
91%
108%105%100%104% 101%
82%
10
20
30
40
50
60
70
80
90
BE CZ DK DE EE EL ES FR IE IT CY LV LT LU HU MT NL AT PL PT SI SK FI SE UK CH
mill
ion
of s
ubsc
riber
s
0%
20%
40%
60%
80%
100%
120%
140%
160%
180%
pene
trat
ion
rate
Mobile subscribers Penetration rate Where available, data include 2G and 3G mobile network operators' subscribers as well as mobile service providers' subscribers. Data are not comparable with previous reports (updated figures for previous years have been provided by some NRAs). Belgium: Data refer to January 2006. Germany: Data as of 1 July 2006. Ireland: Figures for one operator are taken by Mobile Communications Europe and refer to June 2006. France: Figures refer to national market (mainland France and overseas departments). Penetration rate for mainland France is 79.3%. Luxembourg: Data refer to 1 July 2006. Penetration rate is significantly lower if trans-national commuters are added to the national population. Netherland: Figures are NRA's estimates. Slovakia: Data for some competitors refer to June 2006. United Kingdom: Service providers are excluded, data refer to 1 January 2006. Source for Switzerland: OFCOM Switzerland. The following chart displays for each Member State the growth of the mobile penetration rate between October 2005 and October 2006, unless otherwise indicated. Penetration rate has grown significantly in Poland (+20 percentage points (p.p.)), Italy and Lithuania (around +15 p.p.), Cyprus (+13.7 p.p.), Luxembourg, Estonia and Ireland (+11 p.p.).
The growth rate of the mobile penetration in Switzerland, observed annually from 1998 to date, was strong primarily in the first three years (rate varying between 12.7 and 24.4%). Since 2001, development has slowed down markedly, indicating that a degree of saturation of the market is approaching. In the period of October 2004 – October 2005 the Swiss market showed the lowest growth rate (2.1%). However, between October 2005 and October 2006 the penetration rate increased by 7.4%, reaching the mark of 96.2%.
51 - Extrait du 12ème rapport d’implémentation de l’UE étendu à la Suisse
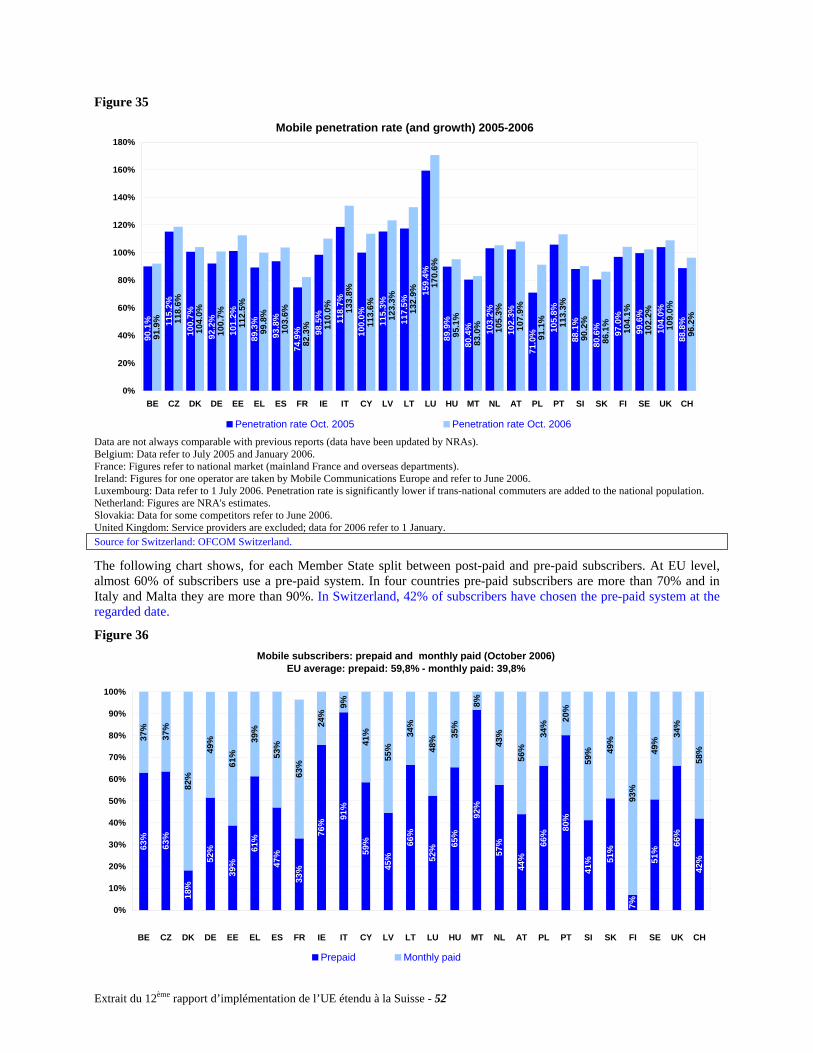
Figure 35
Mobile penetration rate (and growth) 2005-200690
.1% 11
5.2%
100.
7%
92.2
%
101.
2%
89.3
%
93.8
%
74.9
% 98.5
% 118.
7%
100.
0%
115.
3%
117.
5%
159.
4%
89.9
%
80.4
% 103.
2%
102.
3%
71.0
% 105.
8%
88.1
%
80.6
% 97.0
%
99.6
%
104.
0%
88.8
%
91.9
% 118.
6%
104.
0%
100.
7%
112.
5%
99.8
%
103.
6%
82.3
% 110.
0% 133.
8%
113.
6%
123.
3%
132.
9%
170.
6%
95.1
%
83.0
% 105.
3%
107.
9%
91.1
% 113.
3%
90.2
%
86.1
%
104.
1%
102.
2%
109.
0%
96.2
%
0%
20%
40%
60%
80%
100%
120%
140%
160%
180%
BE CZ DK DE EE EL ES FR IE IT CY LV LT LU HU MT NL AT PL PT SI SK FI SE UK CH
Penetration rate Oct. 2005 Penetration rate Oct. 2006 Data are not always comparable with previous reports (data have been updated by NRAs). Belgium: Data refer to July 2005 and January 2006. France: Figures refer to national market (mainland France and overseas departments). Ireland: Figures for one operator are taken by Mobile Communications Europe and refer to June 2006. Luxembourg: Data refer to 1 July 2006. Penetration rate is significantly lower if trans-national commuters are added to the national population. Netherland: Figures are NRA's estimates. Slovakia: Data for some competitors refer to June 2006. United Kingdom: Service providers are excluded; data for 2006 refer to 1 January. Source for Switzerland: OFCOM Switzerland.
The following chart shows, for each Member State split between post-paid and pre-paid subscribers. At EU level, almost 60% of subscribers use a pre-paid system. In four countries pre-paid subscribers are more than 70% and in Italy and Malta they are more than 90%. In Switzerland, 42% of subscribers have chosen the pre-paid system at the regarded date.
Figure 36 Mobile subscribers: prepaid and monthly paid (October 2006)
EU average: prepaid: 59,8% - monthly paid: 39,8%
42%
58%
66%
51%
7%
51%
41%
80%
66%
44%57
%
92%
65%
52%66
%
45%59
%
91%
76%
33%47
%61%
39%52
%
18%
63%
63%
49%
93%
49%
59%
20%
34%
56%43
%
63%
8%
35%
48%34
%
55%41
%
9%
24%
53%39
%
61%49
%
82%
37%
37%
34%
0%
10%
20%
30%
40%
50%
60%
70%
80%
90%
100%
BE CZ DK DE EE EL ES FR IE IT CY LV LT LU HU MT NL AT PL PT SI SK FI SE UK CH
Prepaid Monthly paid
Extrait du 12ème rapport d’implémentation de l’UE étendu à la Suisse - 52
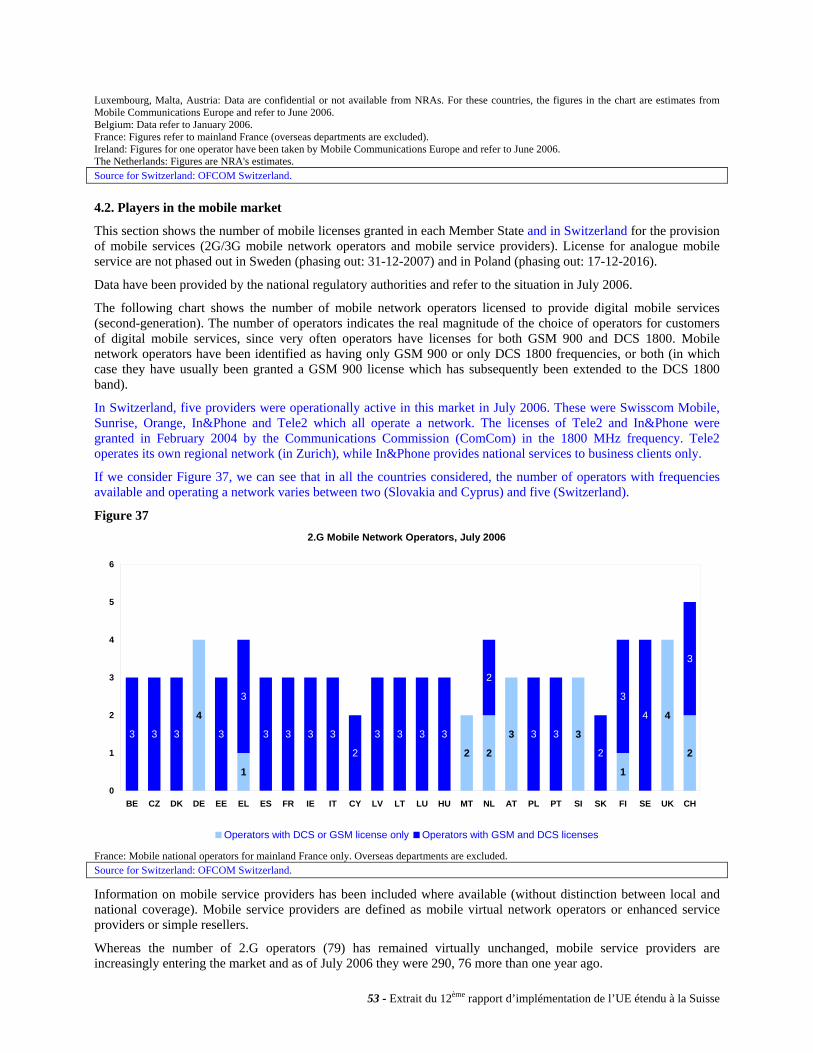
Luxembourg, Malta, Austria: Data are confidential or not available from NRAs. For these countries, the figures in the chart are estimates from Mobile Communications Europe and refer to June 2006. Belgium: Data refer to January 2006. France: Figures refer to mainland France (overseas departments are excluded). Ireland: Figures for one operator have been taken by Mobile Communications Europe and refer to June 2006. The Netherlands: Figures are NRA's estimates. Source for Switzerland: OFCOM Switzerland.
4.2. Players in the mobile market
This section shows the number of mobile licenses granted in each Member State and in Switzerland for the provision of mobile services (2G/3G mobile network operators and mobile service providers). License for analogue mobile service are not phased out in Sweden (phasing out: 31-12-2007) and in Poland (phasing out: 17-12-2016).
Data have been provided by the national regulatory authorities and refer to the situation in July 2006.
The following chart shows the number of mobile network operators licensed to provide digital mobile services (second-generation). The number of operators indicates the real magnitude of the choice of operators for customers of digital mobile services, since very often operators have licenses for both GSM 900 and DCS 1800. Mobile network operators have been identified as having only GSM 900 or only DCS 1800 frequencies, or both (in which case they have usually been granted a GSM 900 license which has subsequently been extended to the DCS 1800 band).
In Switzerland, five providers were operationally active in this market in July 2006. These were Swisscom Mobile, Sunrise, Orange, In&Phone and Tele2 which all operate a network. The licenses of Tele2 and In&Phone were granted in February 2004 by the Communications Commission (ComCom) in the 1800 MHz frequency. Tele2 operates its own regional network (in Zurich), while In&Phone provides national services to business clients only.
If we consider Figure 37, we can see that in all the countries considered, the number of operators with frequencies available and operating a network varies between two (Slovakia and Cyprus) and five (Switzerland).
Figure 37 2.G Mobile Network Operators, July 2006
4
1
2 2
3 3
1
4
2
3 3 3
4
3
3
3
2
33
2
3
2
33 3 333
3
3
0
1
2
3
4
5
6
BE CZ DK DE EE EL ES FR IE IT CY LV LT LU HU MT NL AT PL PT SI SK FI SE UK CH
Operators with DCS or GSM license only Operators with GSM and DCS licenses
France: Mobile national operators for mainland France only. Overseas departments are excluded. Source for Switzerland: OFCOM Switzerland.
Information on mobile service providers has been included where available (without distinction between local and national coverage). Mobile service providers are defined as mobile virtual network operators or enhanced service providers or simple resellers.
Whereas the number of 2.G operators (79) has remained virtually unchanged, mobile service providers are increasingly entering the market and as of July 2006 they were 290, 76 more than one year ago.
53 - Extrait du 12ème rapport d’implémentation de l’UE étendu à la Suisse
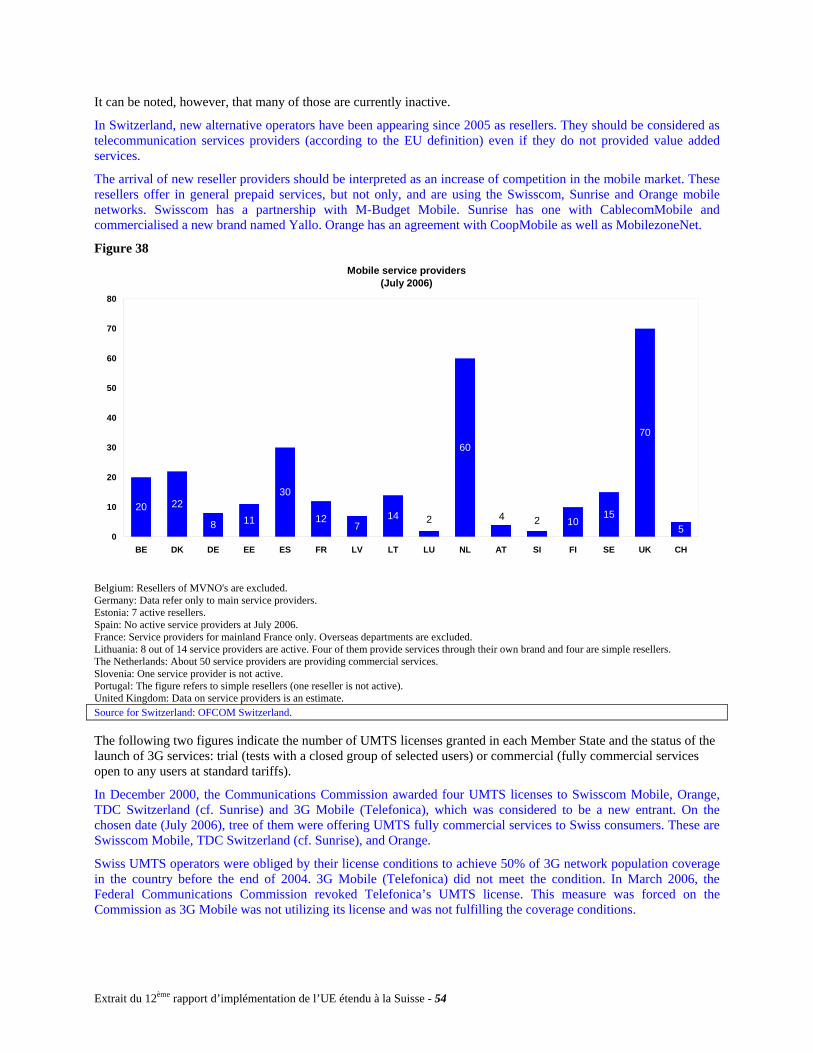
It can be noted, however, that many of those are currently inactive.
In Switzerland, new alternative operators have been appearing since 2005 as resellers. They should be considered as telecommunication services providers (according to the EU definition) even if they do not provided value added services.
The arrival of new reseller providers should be interpreted as an increase of competition in the mobile market. These resellers offer in general prepaid services, but not only, and are using the Swisscom, Sunrise and Orange mobile networks. Swisscom has a partnership with M-Budget Mobile. Sunrise has one with CablecomMobile and commercialised a new brand named Yallo. Orange has an agreement with CoopMobile as well as MobilezoneNet.
Figure 38 Mobile service providers
(July 2006)
20 22
8 11
30
127
14
60
1015
70
52 4 2
0
10
20
30
40
50
60
70
80
BE DK DE EE ES FR LV LT LU NL AT SI FI SE UK CH
Belgium: Resellers of MVNO's are excluded. Germany: Data refer only to main service providers. Estonia: 7 active resellers. Spain: No active service providers at July 2006. France: Service providers for mainland France only. Overseas departments are excluded. Lithuania: 8 out of 14 service providers are active. Four of them provide services through their own brand and four are simple resellers. The Netherlands: About 50 service providers are providing commercial services. Slovenia: One service provider is not active. Portugal: The figure refers to simple resellers (one reseller is not active). United Kingdom: Data on service providers is an estimate. Source for Switzerland: OFCOM Switzerland. The following two figures indicate the number of UMTS licenses granted in each Member State and the status of the launch of 3G services: trial (tests with a closed group of selected users) or commercial (fully commercial services open to any users at standard tariffs).
In December 2000, the Communications Commission awarded four UMTS licenses to Swisscom Mobile, Orange, TDC Switzerland (cf. Sunrise) and 3G Mobile (Telefonica), which was considered to be a new entrant. On the chosen date (July 2006), tree of them were offering UMTS fully commercial services to Swiss consumers. These are Swisscom Mobile, TDC Switzerland (cf. Sunrise), and Orange.
Swiss UMTS operators were obliged by their license conditions to achieve 50% of 3G network population coverage in the country before the end of 2004. 3G Mobile (Telefonica) did not meet the condition. In March 2006, the Federal Communications Commission revoked Telefonica’s UMTS license. This measure was forced on the Commission as 3G Mobile was not utilizing its license and was not fulfilling the coverage conditions.
Extrait du 12ème rapport d’implémentation de l’UE étendu à la Suisse - 54
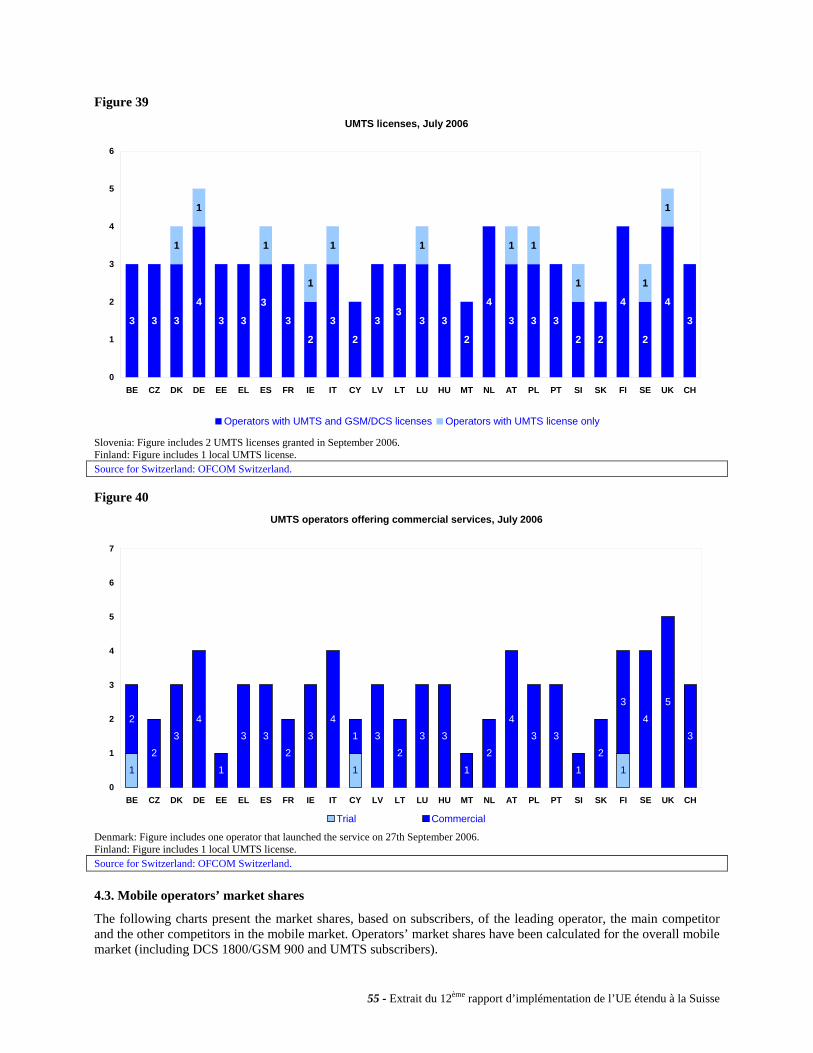
Figure 39 UMTS licenses, July 2006
3 3 3
4
3 3 3
2
3
2
3 3 3
2
4
3 3 3
2 2
4
2
4
3
1 1
1
1
1
1
33
1
1
11
1
0
1
2
3
4
5
6
BE CZ DK DE EE EL ES FR IE IT CY LV LT LU HU MT NL AT PL PT SI SK FI SE UK CH
Operators with UMTS and GSM/DCS licenses Operators with UMTS license only
Slovenia: Figure includes 2 UMTS licenses granted in September 2006. Finland: Figure includes 1 local UMTS license. Source for Switzerland: OFCOM Switzerland. Figure 40
UMTS operators offering commercial services, July 2006
1 1
2
2
3
4
1
3 3
2
3
4
1 3
2
3 3
1
2
4
3 3
1
2
3
4
5
3
0
1
2
3
4
5
6
7
BE CZ DK DE EE EL ES FR IE IT CY LV LT LU HU MT NL AT PL PT SI SK FI SE UK CH
1
Trial Commercial Denmark: Figure includes one operator that launched the service on 27th September 2006. Finland: Figure includes 1 local UMTS license. Source for Switzerland: OFCOM Switzerland.
4.3. Mobile operators’ market shares The following charts present the market shares, based on subscribers, of the leading operator, the main competitor and the other competitors in the mobile market. Operators’ market shares have been calculated for the overall mobile market (including DCS 1800/GSM 900 and UMTS subscribers).
55 - Extrait du 12ème rapport d’implémentation de l’UE étendu à la Suisse
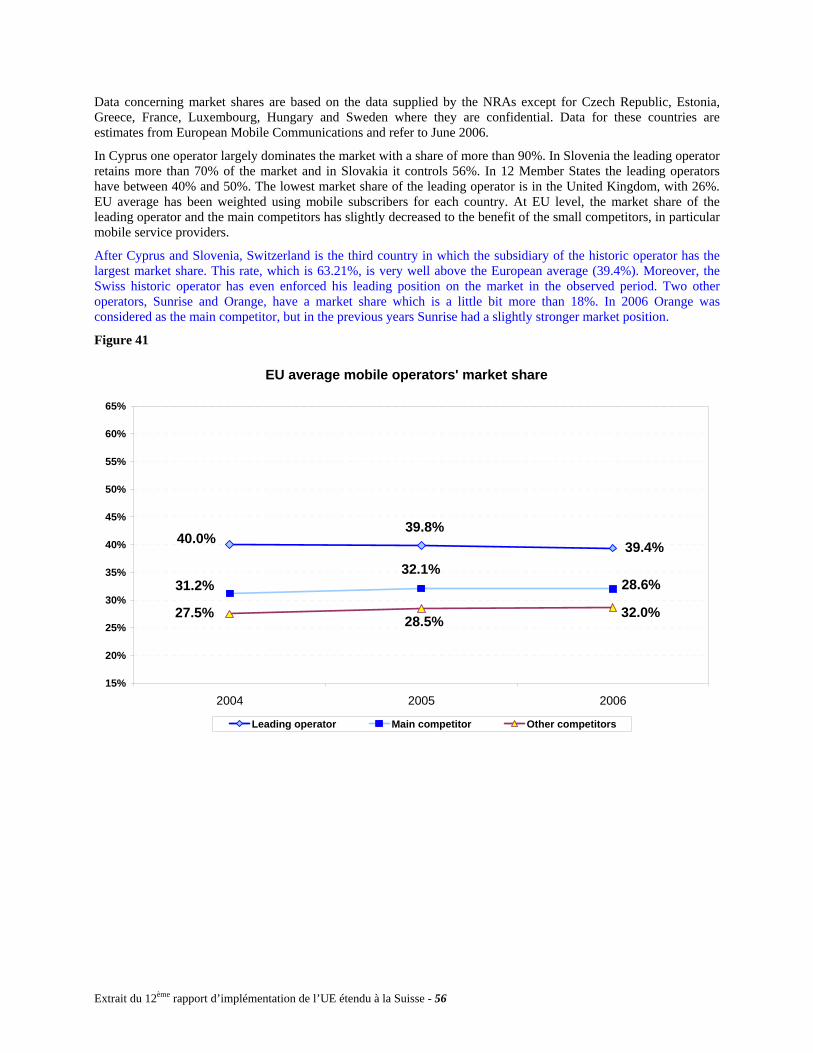
Data concerning market shares are based on the data supplied by the NRAs except for Czech Republic, Estonia, Greece, France, Luxembourg, Hungary and Sweden where they are confidential. Data for these countries are estimates from European Mobile Communications and refer to June 2006.
In Cyprus one operator largely dominates the market with a share of more than 90%. In Slovenia the leading operator retains more than 70% of the market and in Slovakia it controls 56%. In 12 Member States the leading operators have between 40% and 50%. The lowest market share of the leading operator is in the United Kingdom, with 26%. EU average has been weighted using mobile subscribers for each country. At EU level, the market share of the leading operator and the main competitors has slightly decreased to the benefit of the small competitors, in particular mobile service providers.
After Cyprus and Slovenia, Switzerland is the third country in which the subsidiary of the historic operator has the largest market share. This rate, which is 63.21%, is very well above the European average (39.4%). Moreover, the Swiss historic operator has even enforced his leading position on the market in the observed period. Two other operators, Sunrise and Orange, have a market share which is a little bit more than 18%. In 2006 Orange was considered as the main competitor, but in the previous years Sunrise had a slightly stronger market position.
Figure 41
EU average mobile operators' market share
40.0% 39.4%39.8%
31.2%32.1%
32.0%28.5%
28.6%
27.5%
15%
20%
25%
30%
35%
40%
45%
50%
55%
60%
65%
2004 2005 2006
Leading operator Main competitor Other competitors
Extrait du 12ème rapport d’implémentation de l’UE étendu à la Suisse - 56
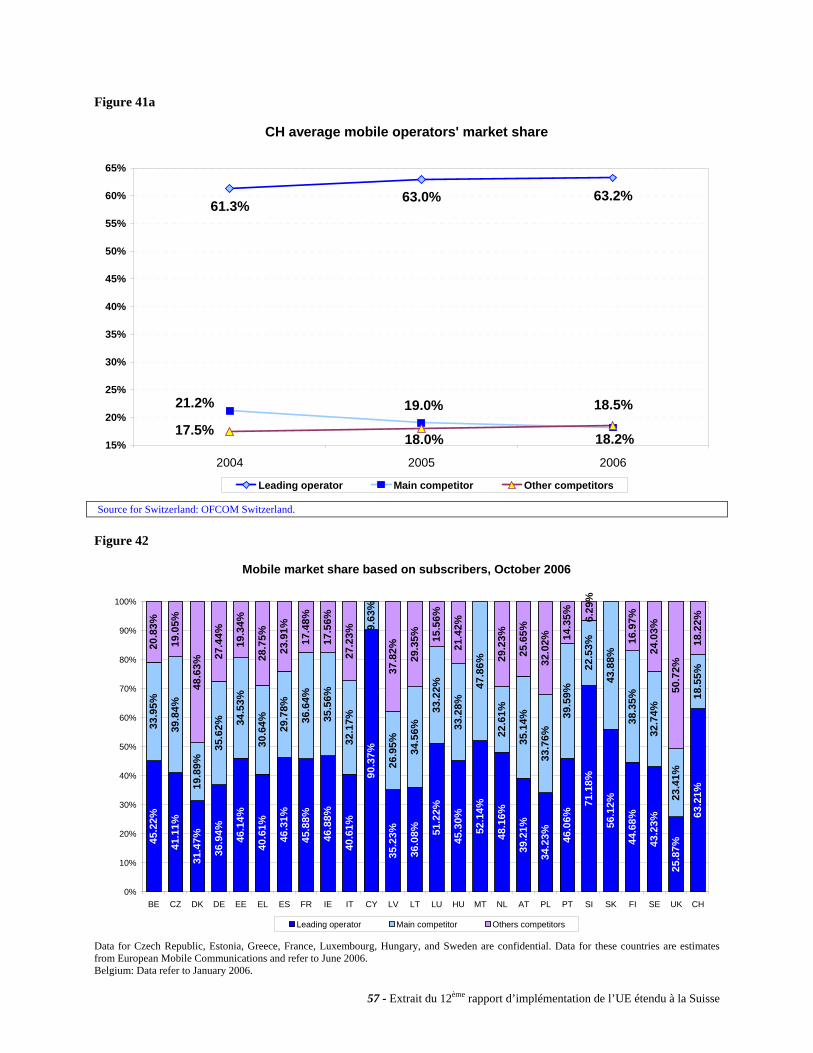
Figure 41a
CH average mobile operators' market share
61.3%63.2%63.0%
21.2% 19.0%
18.2%18.0%
18.5%
17.5%15%
20%
25%
30%
35%
40%
45%
50%
55%
60%
65%
2004 2005 2006
Leading operator Main competitor Other competitors
Source for Switzerland: OFCOM Switzerland. Figure 42
Mobile market share based on subscribers, October 2006
45.2
2%
41.1
1%
31.4
7%
36.9
4% 46.1
4%
40.6
1%
46.3
1%
45.8
8%
46.8
8%
40.6
1%
90.3
7%
35.2
3%
36.0
8% 51.2
2%
45.3
0%
52.1
4%
48.1
6%
39.2
1%
34.2
3% 46.0
6%
71.1
8%
56.1
2%
44.6
8%
43.2
3%
25.8
7%
63.2
1%
33.9
5%
39.8
4%
19.8
9%
35.6
2% 34.5
3%
30.6
4% 29.7
8%
36.6
4%
35.5
6%
32.1
7%
9.63
%
26.9
5% 34.5
6%
33.2
2%
33.2
8%
47.8
6%
22.6
1%
35.1
4%
33.7
6%
39.5
9%
22.5
3%
43.8
8%
38.3
5%
32.7
4%
23.4
1%
18.5
5%
20.8
3%
19.0
5%
48.6
3%
27.4
4%
19.3
4%
28.7
5%
23.9
1%
17.4
8%
17.5
6%
27.2
3%
37.8
2%
29.3
5% 15.5
6%
21.4
2%
29.2
3%
25.6
5%
32.0
2% 16.9
7%
24.0
3%
50.7
2%
18.2
2%6.29
%
14.3
5%
0%
10%
20%
30%
40%
50%
60%
70%
80%
90%
100%
BE CZ DK DE EE EL ES FR IE IT CY LV LT LU HU MT NL AT PL PT SI SK FI SE UK CH
Leading operator Main competitor Others competitors
Data for Czech Republic, Estonia, Greece, France, Luxembourg, Hungary, and Sweden are confidential. Data for these countries are estimates from European Mobile Communications and refer to June 2006. Belgium: Data refer to January 2006.
57 - Extrait du 12ème rapport d’implémentation de l’UE étendu à la Suisse
Germany: Data as of 1 July 2006. Ireland: Figures for one operator (included in "other competitors") are taken by Mobile Communications Europe and refer to June 2006. Luxembourg: Data refer to 1 July 2006. Netherland: Figures are NRA's estimates. Slovakia: Data for some competitors refer to June 2006. United Kingdom: Service providers are excluded, data refer to 1 January 2006. Source for Switzerland: OFCOM Switzerland.
4.4. Mobile Tariffs 1. The analysis of national (as opposed to roaming) mobile services is based on the OECD baskets for digital mobile services. Due to significant changes in usage patterns, the OECD baskets have been redefined with effect from August 2002. These baskets contain an SMS element, they include calls to several mobile networks, and they do not cover international calls.
There are 3 different baskets, based on low, medium and high usage levels. All packages analysed in this study are Post-Paid packages. Some of the main properties of the "2002 OECD" baskets are:
Low usage basket with: 25 outgoing calls per month + 30 SMS messages 42% of calls are to fixed line phones, 58% to mobile phones,
Medium usage basket with: 75 outgoing calls per month + 35 SMS messages 36% of calls are to fixed line phones, 64% to mobile phones,
High usage basket with: 150 outgoing calls per month + 42 SMS messages 40% of calls are to fixed line phones, 60% to mobile phones.
Each basket also has a unique definition of time of day distribution and call duration, and includes the monthly rental, and any registration charges distributed over 3 years.
The two most prominent operators in each country are covered (except for Switzerland – six operators), based on available subscriber numbers. All relevant packages from each operator are considered, but the final results presented here only show the cheapest package for each basket.
The asterisk (*) behind the package name means that the package name and its structure have changed between 2005 and 2006. The package chosen at any time is the cheapest package from that provider for the usage profile in question. This may give rise to significant price changes over time.
The balance of fixed and usage in the mobile baskets varies considerably between countries, as the preferred packages in some countries contain a lot of calling time included in the fixed charge.
A full description of the methodology can be found at the end of this report.
2. In order to show a price trend, the "2002 OECD" baskets have been used. Mobile services from 2002 till 2006 are used. The graphs will show the average price development for the EU countries, using a simple average across all member countries per year. The averages cover the cheapest package from the same mobile operators.
From 2004 the EU10 countries are also included.
3. OECD baskets have undergone another revision that resulted in a new set of baskets at the beginning of 2006. Similar to the PSTN baskets the mobile baskets were also updated with current traffic weights and volumes. The changes are significant enough to prohibit the use of the new baskets with old data.
The results for 2006 with using the new baskets are presented below. The principles of the new baskets are the same as before, with 3 baskets for low, medium and high usage. The main differences between the old "2002 OECD" and the new "2006 OECD" baskets are:
Low usage basket with: 30 outgoing calls per month + 33 SMS messages 22% of calls are to fixed line phones, 70% to mobile phones, 8% to voicemail,
Medium usage basket with: 65 outgoing calls per month + 50 SMS messages
Extrait du 12ème rapport d’implémentation de l’UE étendu à la Suisse - 58
21% of calls are to fixed line phones, 72% to mobile phones, 7% to voicemail,
High usage basket with: 140 outgoing calls per month + 55 SMS messages 20% of calls are to fixed line phones, 73% to mobile phones, 7% to voicemail,
and:
-Inclusion of MMS in the basket,
-Both MMS and SMS are separated for peak and off-peak times, and on-net and off-net destinations,
-Voicemail is included in the baskets,
-Off-net calls can be directed to several networks,
-The methodology for calculating the effects of allowances has been improved.
-The names of the tariff packages used in the basket analysis is found in the table below.
59 - Extrait du 12ème rapport d’implémentation de l’UE étendu à la Suisse
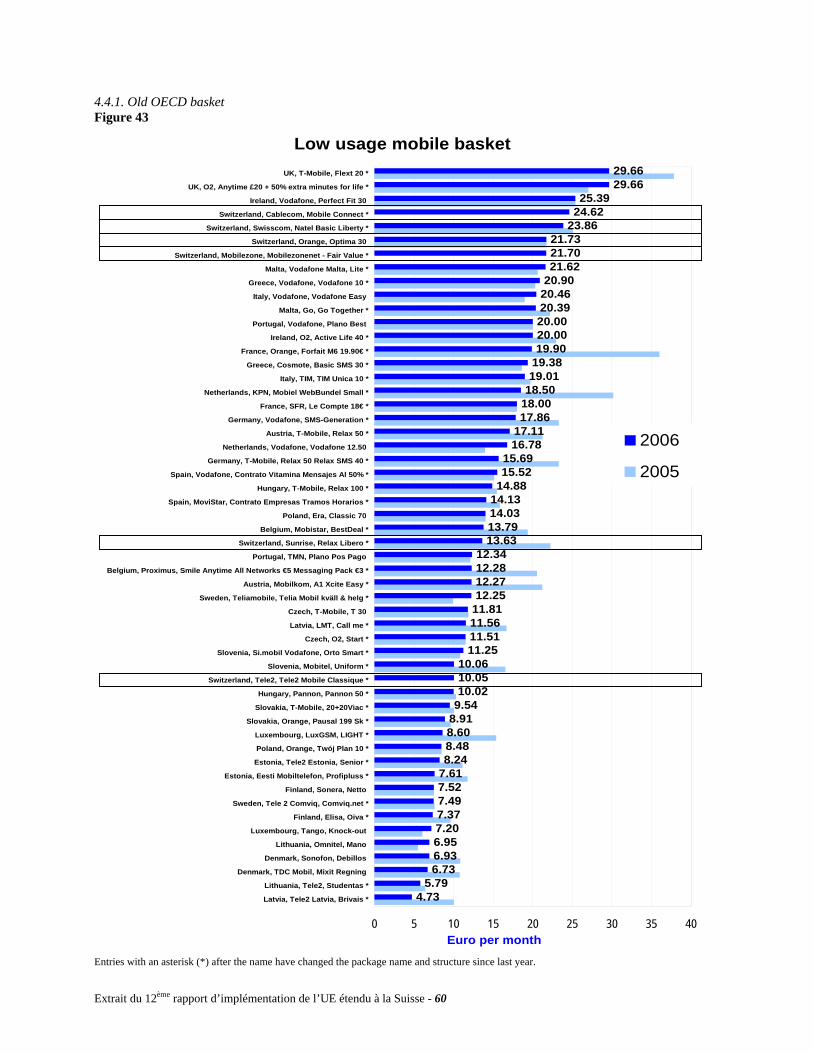
4.4.1. Old OECD basket Figure 43
Low usage mobile basket
4.735.79
6.736.936.957.207.377.497.527.618.248.488.608.919.5410.0210.0510.06
11.2511.5111.5611.8112.2512.2712.2812.34
13.6313.7914.0314.1314.8815.5215.69
16.7817.1117.8618.0018.5019.0119.3819.9020.0020.0020.3920.4620.9021.6221.7021.73
23.8624.6225.39
29.6629.66
0 5 10 15 20 25 30 35 40
Latvia, Tele2 Latvia, Brivais *
Lithuania, Tele2, Studentas *
Denmark, TDC Mobil, Mixit Regning
Denmark, Sonofon, Debillos
Lithuania, Omnitel, Mano
Luxembourg, Tango, Knock-out
Finland, Elisa, Oiva *
Sweden, Tele 2 Comviq, Comviq.net *
Finland, Sonera, Netto
Estonia, Eesti Mobiltelefon, Profipluss *
Estonia, Tele2 Estonia, Senior *
Poland, Orange, Twój Plan 10 *
Luxembourg, LuxGSM, LIGHT *
Slovakia, Orange, Pausal 199 Sk *
Slovakia, T-Mobile, 20+20Viac *
Hungary, Pannon, Pannon 50 *
Switzerland, Tele2, Tele2 Mobile Classique *
Slovenia, Mobitel, Uniform *
Slovenia, Si.mobil Vodafone, Orto Smart *
Czech, O2, Start *
Latvia, LMT, Call me *
Czech, T-Mobile, T 30
Sweden, Teliamobile, Telia Mobil kväll & helg *
Austria, Mobilkom, A1 Xcite Easy *
Belgium, Proximus, Smile Anytime All Networks €5 Messaging Pack €3 *
Portugal, TMN, Plano Pos Pago
Switzerland, Sunrise, Relax Libero *
Belgium, Mobistar, BestDeal *
Poland, Era, Classic 70
Spain, MoviStar, Contrato Empresas Tramos Horarios *
Hungary, T-Mobile, Relax 100 *
Spain, Vodafone, Contrato Vitamina Mensajes Al 50% *
Germany, T-Mobile, Relax 50 Relax SMS 40 *
Netherlands, Vodafone, Vodafone 12.50
Austria, T-Mobile, Relax 50 *
Germany, Vodafone, SMS-Generation *
France, SFR, Le Compte 18€ *
Netherlands, KPN, Mobiel WebBundel Small *
Italy, TIM, TIM Unica 10 *
Greece, Cosmote, Basic SMS 30 *
France, Orange, Forfait M6 19.90€ *
Ireland, O2, Active Life 40 *
Portugal, Vodafone, Plano Best
Malta, Go, Go Together *
Italy, Vodafone, Vodafone Easy
Greece, Vodafone, Vodafone 10 *
Malta, Vodafone Malta, Lite *
Switzerland, Mobilezone, Mobilezonenet - Fair Value *
Switzerland, Orange, Optima 30
Switzerland, Swisscom, Natel Basic Liberty *
Switzerland, Cablecom, Mobile Connect *
Ireland, Vodafone, Perfect Fit 30
UK, O2, Anytime £20 + 50% extra minutes for life *
UK, T-Mobile, Flext 20 *
Euro per month
2006
2005
Entries with an asterisk (*) after the name have changed the package name and structure since last year.
Extrait du 12ème rapport d’implémentation de l’UE étendu à la Suisse - 60
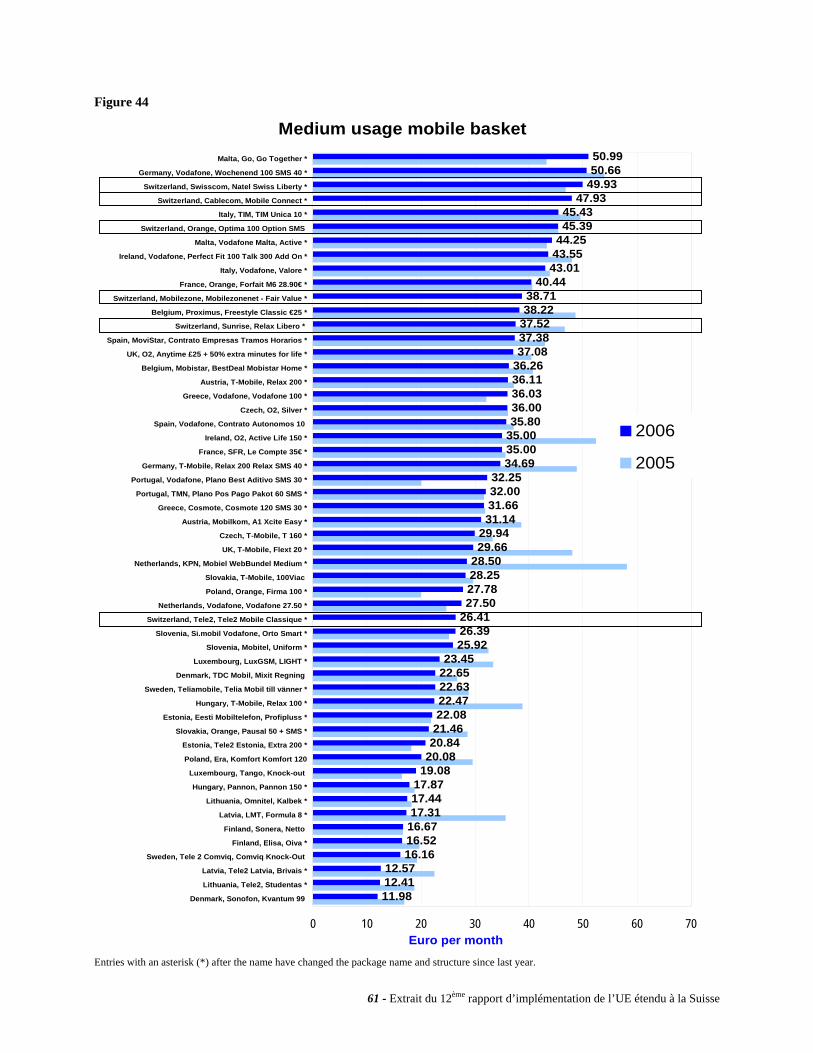
Figure 44
Medium usage mobile basket
11.9812.4112.57
16.1616.5216.6717.3117.4417.8719.0820.0820.8421.4622.0822.4722.6322.6523.45
25.9226.3926.4127.5027.7828.2528.5029.6629.9431.1431.6632.0032.25
34.6935.0035.0035.8036.0036.0336.1136.2637.0837.3837.5238.2238.71
40.4443.0143.5544.2545.3945.43
47.9349.9350.6650.99
0 10 20 30 40 50 60 7
Denmark, Sonofon, Kvantum 99
Lithuania, Tele2, Studentas *
Latvia, Tele2 Latvia, Brivais *
Sweden, Tele 2 Comviq, Comviq Knock-Out
Finland, Elisa, Oiva *
Finland, Sonera, Netto
Latvia, LMT, Formula 8 *
Lithuania, Omnitel, Kalbek *
Hungary, Pannon, Pannon 150 *
Luxembourg, Tango, Knock-out
Poland, Era, Komfort Komfort 120
Estonia, Tele2 Estonia, Extra 200 *
Slovakia, Orange, Pausal 50 + SMS *
Estonia, Eesti Mobiltelefon, Profipluss *
Hungary, T-Mobile, Relax 100 *
Sweden, Teliamobile, Telia Mobil till vänner *
Denmark, TDC Mobil, Mixit Regning
Luxembourg, LuxGSM, LIGHT *
Slovenia, Mobitel, Uniform *
Slovenia, Si.mobil Vodafone, Orto Smart *
Switzerland, Tele2, Tele2 Mobile Classique *
Netherlands, Vodafone, Vodafone 27.50 *
Poland, Orange, Firma 100 *
Slovakia, T-Mobile, 100Viac
Netherlands, KPN, Mobiel WebBundel Medium *
UK, T-Mobile, Flext 20 *
Czech, T-Mobile, T 160 *
Austria, Mobilkom, A1 Xcite Easy *
Greece, Cosmote, Cosmote 120 SMS 30 *
Portugal, TMN, Plano Pos Pago Pakot 60 SMS *
Portugal, Vodafone, Plano Best Aditivo SMS 30 *
Germany, T-Mobile, Relax 200 Relax SMS 40 *
France, SFR, Le Compte 35€ *
Ireland, O2, Active Life 150 *
Spain, Vodafone, Contrato Autonomos 10
Czech, O2, Silver *
Greece, Vodafone, Vodafone 100 *
Austria, T-Mobile, Relax 200 *
Belgium, Mobistar, BestDeal Mobistar Home *
UK, O2, Anytime £25 + 50% extra minutes for life *
Spain, MoviStar, Contrato Empresas Tramos Horarios *
Switzerland, Sunrise, Relax Libero *
Belgium, Proximus, Freestyle Classic €25 *
Switzerland, Mobilezone, Mobilezonenet - Fair Value *
France, Orange, Forfait M6 28.90€ *
Italy, Vodafone, Valore *
Ireland, Vodafone, Perfect Fit 100 Talk 300 Add On *
Malta, Vodafone Malta, Active *
Switzerland, Orange, Optima 100 Option SMS
Italy, TIM, TIM Unica 10 *
Switzerland, Cablecom, Mobile Connect *
Switzerland, Swisscom, Natel Swiss Liberty *
Germany, Vodafone, Wochenend 100 SMS 40 *
Malta, Go, Go Together *
Euro per month0
2006
2005
Entries with an asterisk (*) after the name have changed the package name and structure since last year.
61 - Extrait du 12ème rapport d’implémentation de l’UE étendu à la Suisse
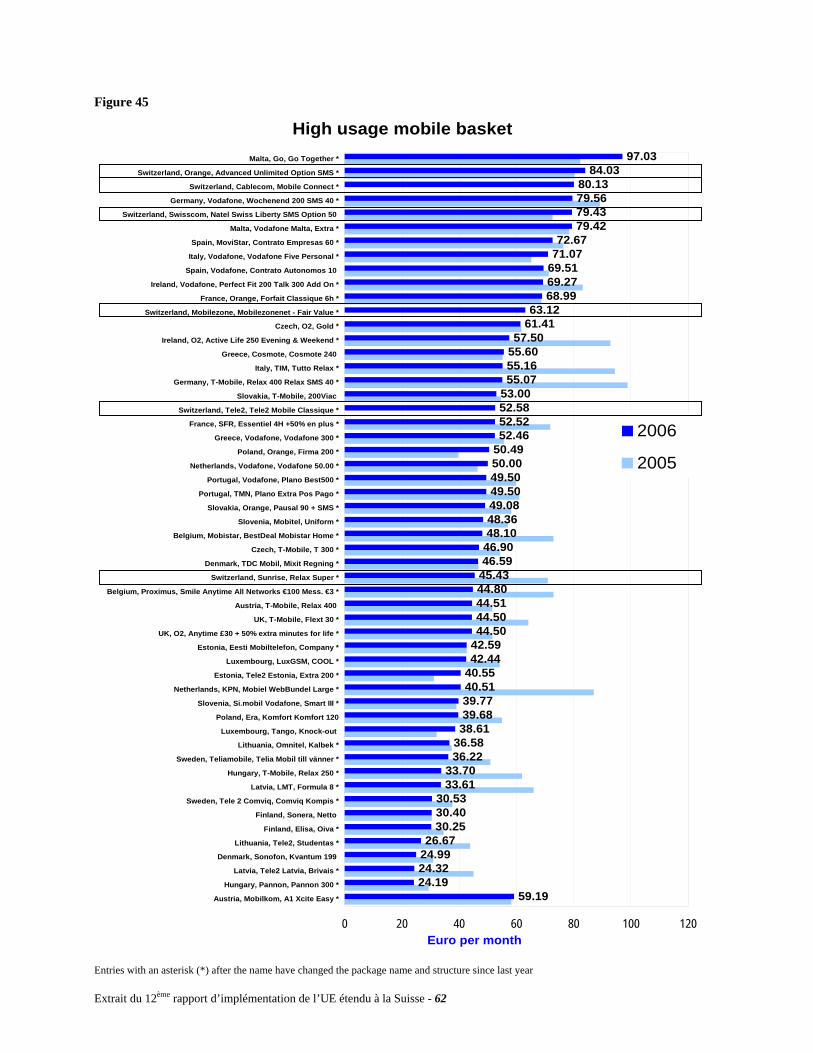
Figure 45
High usage mobile basket
59.1924.1924.3224.9926.67
30.2530.4030.53
33.6133.70
36.2236.5838.6139.6839.7740.5140.5542.4442.5944.5044.5044.5144.8045.4346.5946.9048.1048.3649.0849.5049.5050.0050.4952.4652.5252.5853.0055.0755.1655.6057.50
61.4163.12
68.9969.2769.5171.0772.67
79.4279.4379.5680.13
84.0397.03
0 20 40 60 80 100 1
Austria, Mobilkom, A1 Xcite Easy *
Hungary, Pannon, Pannon 300 *
Latvia, Tele2 Latvia, Brivais *
Denmark, Sonofon, Kvantum 199
Lithuania, Tele2, Studentas *
Finland, Elisa, Oiva *
Finland, Sonera, Netto
Sweden, Tele 2 Comviq, Comviq Kompis *
Latvia, LMT, Formula 8 *
Hungary, T-Mobile, Relax 250 *
Sweden, Teliamobile, Telia Mobil till vänner *
Lithuania, Omnitel, Kalbek *
Luxembourg, Tango, Knock-out
Poland, Era, Komfort Komfort 120
Slovenia, Si.mobil Vodafone, Smart III *
Netherlands, KPN, Mobiel WebBundel Large *
Estonia, Tele2 Estonia, Extra 200 *
Luxembourg, LuxGSM, COOL *
Estonia, Eesti Mobiltelefon, Company *
UK, O2, Anytime £30 + 50% extra minutes for life *
UK, T-Mobile, Flext 30 *
Austria, T-Mobile, Relax 400
Belgium, Proximus, Smile Anytime All Networks €100 Mess. €3 *
Switzerland, Sunrise, Relax Super *
Denmark, TDC Mobil, Mixit Regning *
Czech, T-Mobile, T 300 *
Belgium, Mobistar, BestDeal Mobistar Home *
Slovenia, Mobitel, Uniform *
Slovakia, Orange, Pausal 90 + SMS *
Portugal, TMN, Plano Extra Pos Pago *
Portugal, Vodafone, Plano Best500 *
Netherlands, Vodafone, Vodafone 50.00 *
Poland, Orange, Firma 200 *
Greece, Vodafone, Vodafone 300 *
France, SFR, Essentiel 4H +50% en plus *
Switzerland, Tele2, Tele2 Mobile Classique *
Slovakia, T-Mobile, 200Viac
Germany, T-Mobile, Relax 400 Relax SMS 40 *
Italy, TIM, Tutto Relax *
Greece, Cosmote, Cosmote 240
Ireland, O2, Active Life 250 Evening & Weekend *
Czech, O2, Gold *
Switzerland, Mobilezone, Mobilezonenet - Fair Value *
France, Orange, Forfait Classique 6h *
Ireland, Vodafone, Perfect Fit 200 Talk 300 Add On *
Spain, Vodafone, Contrato Autonomos 10
Italy, Vodafone, Vodafone Five Personal *
Spain, MoviStar, Contrato Empresas 60 *
Malta, Vodafone Malta, Extra *
Switzerland, Swisscom, Natel Swiss Liberty SMS Option 50
Germany, Vodafone, Wochenend 200 SMS 40 *
Switzerland, Cablecom, Mobile Connect *
Switzerland, Orange, Advanced Unlimited Option SMS *
Malta, Go, Go Together *
Euro per month20
2006
2005
Entries with an asterisk (*) after the name have changed the package name and structure since last year
Extrait du 12ème rapport d’implémentation de l’UE étendu à la Suisse - 62
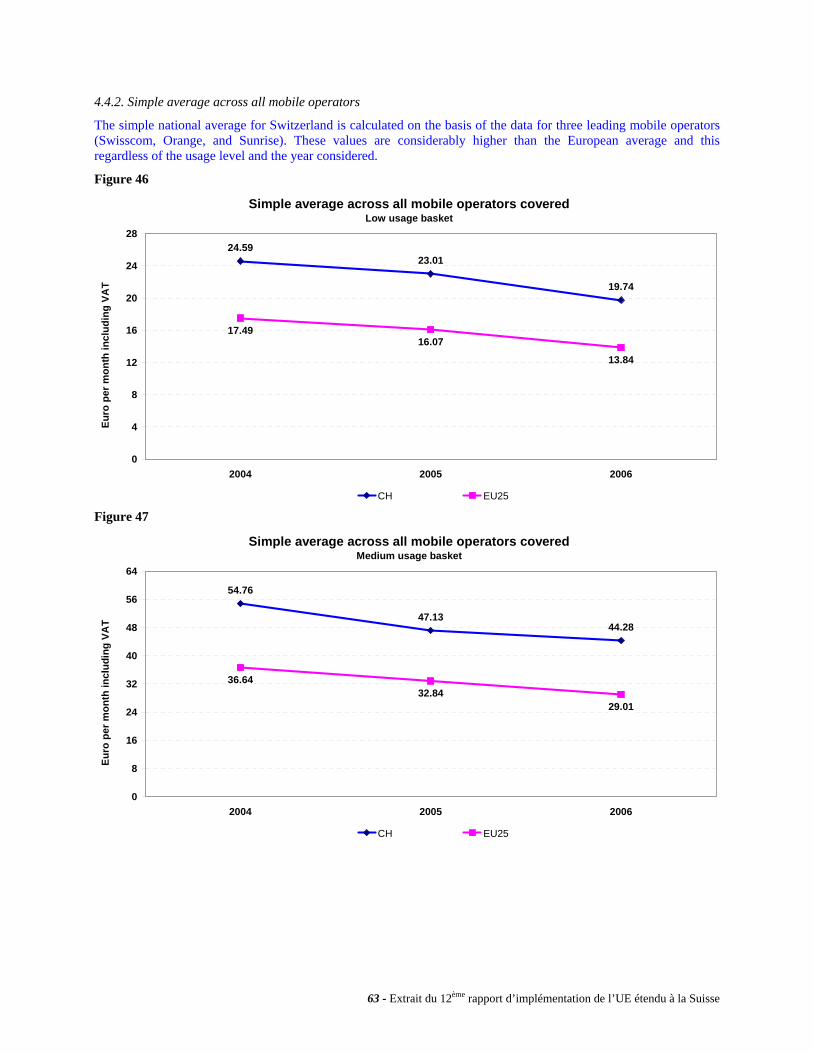
4.4.2. Simple average across all mobile operators
The simple national average for Switzerland is calculated on the basis of the data for three leading mobile operators (Swisscom, Orange, and Sunrise). These values are considerably higher than the European average and this regardless of the usage level and the year considered.
Figure 46
Simple average across all mobile operators coveredLow usage basket
24.5923.01
19.74
17.4916.07
13.84
0
4
8
12
16
20
24
28
2004 2005 2006
Euro
per
mon
th in
clud
ing
VAT
CH EU25 Figure 47
Simple average across all mobile operators coveredMedium usage basket
54.76
47.1344.28
36.6432.84
29.01
0
8
16
24
32
40
48
56
64
2004 2005 2006
Euro
per
mon
th in
clud
ing
VAT
CH EU25
63 - Extrait du 12ème rapport d’implémentation de l’UE étendu à la Suisse
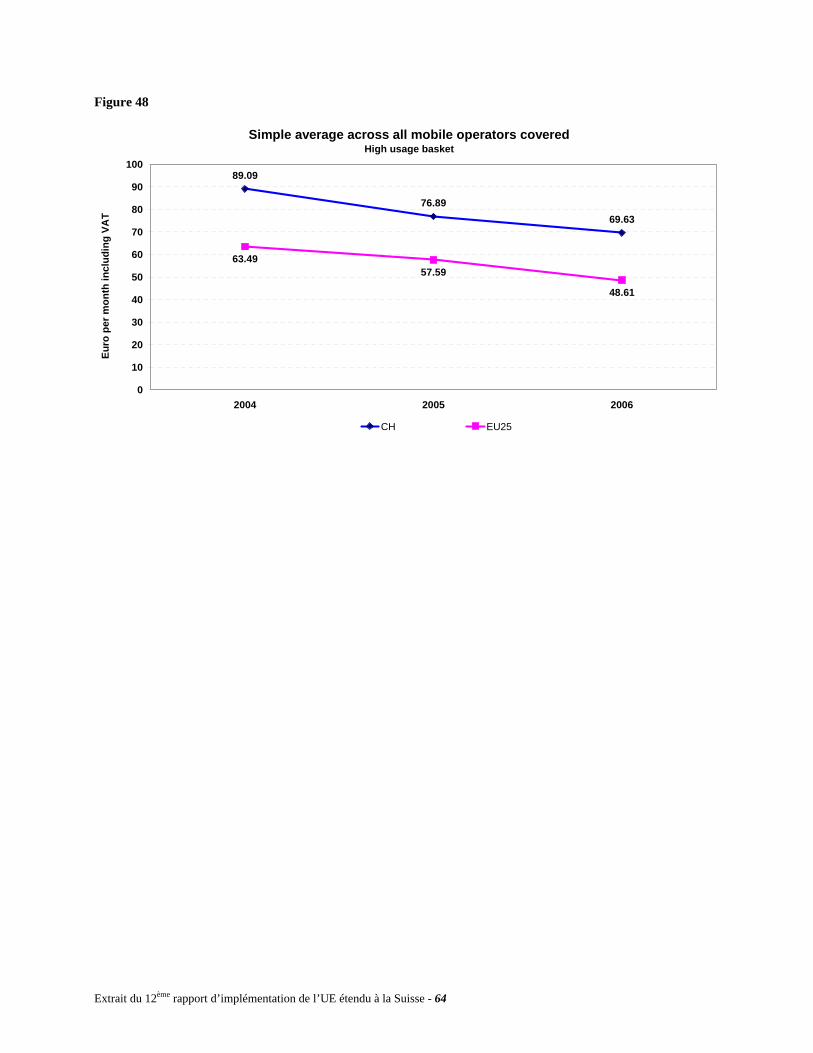
Figure 48
Simple average across all mobile operators coveredHigh usage basket
89.09
76.8969.63
63.4957.59
48.61
0
10
20
30
40
50
60
70
80
90
100
2004 2005 2006
Euro
per
mon
th in
clud
ing
VAT
CH EU25
Extrait du 12ème rapport d’implémentation de l’UE étendu à la Suisse - 64
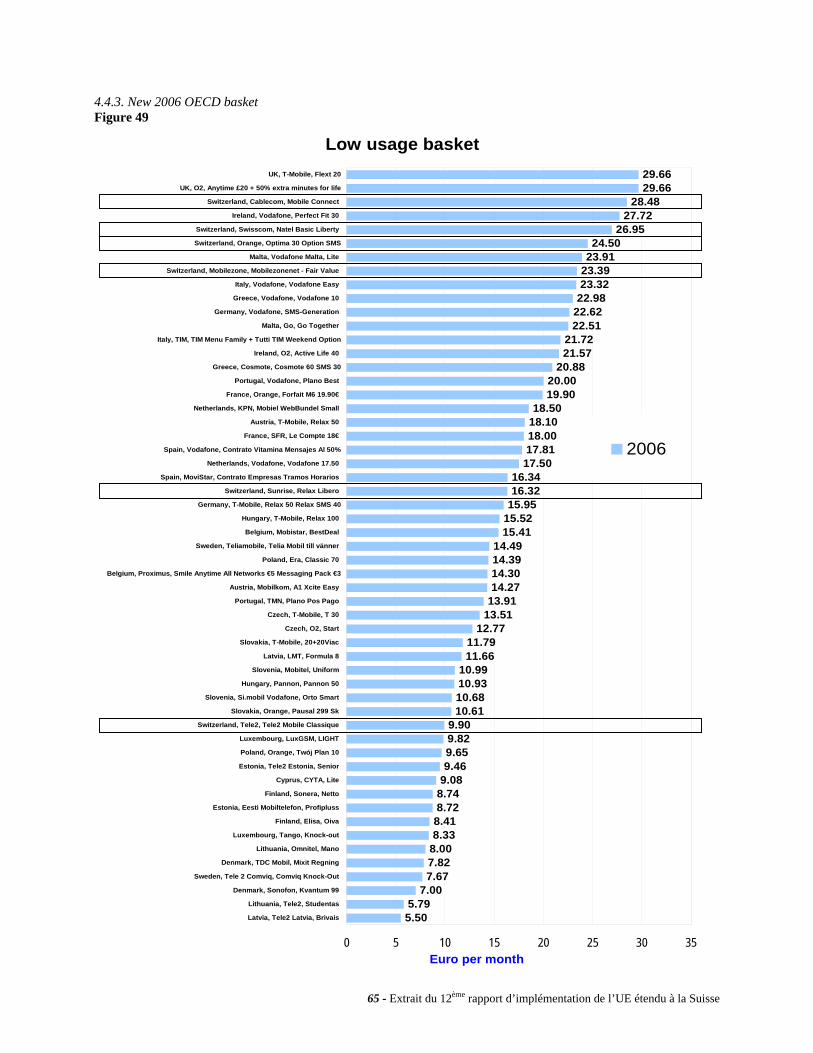
4.4.3. New 2006 OECD basket Figure 49
Low usage basket
5.505.79
7.007.677.828.008.338.418.728.749.089.469.659.829.90
10.6110.6810.9310.99
11.6611.79
12.7713.5113.9114.2714.3014.3914.49
15.4115.5215.9516.3216.34
17.5017.8118.0018.1018.50
19.9020.00
20.8821.5721.72
22.5122.6222.9823.3223.3923.9124.50
26.9527.72
28.4829.6629.66
0 5 10 15 20 25 30 35
Latvia, Tele2 Latvia, Brivais
Lithuania, Tele2, Studentas
Denmark, Sonofon, Kvantum 99
Sweden, Tele 2 Comviq, Comviq Knock-Out
Denmark, TDC Mobil, Mixit Regning
Lithuania, Omnitel, Mano
Luxembourg, Tango, Knock-out
Finland, Elisa, Oiva
Estonia, Eesti Mobiltelefon, Profipluss
Finland, Sonera, Netto
Cyprus, CYTA, Lite
Estonia, Tele2 Estonia, Senior
Poland, Orange, Twój Plan 10
Luxembourg, LuxGSM, LIGHT
Switzerland, Tele2, Tele2 Mobile Classique
Slovakia, Orange, Pausal 299 Sk
Slovenia, Si.mobil Vodafone, Orto Smart
Hungary, Pannon, Pannon 50
Slovenia, Mobitel, Uniform
Latvia, LMT, Formula 8
Slovakia, T-Mobile, 20+20Viac
Czech, O2, Start
Czech, T-Mobile, T 30
Portugal, TMN, Plano Pos Pago
Austria, Mobilkom, A1 Xcite Easy
Belgium, Proximus, Smile Anytime All Networks €5 Messaging Pack €3
Poland, Era, Classic 70
Sweden, Teliamobile, Telia Mobil till vänner
Belgium, Mobistar, BestDeal
Hungary, T-Mobile, Relax 100
Germany, T-Mobile, Relax 50 Relax SMS 40
Switzerland, Sunrise, Relax Libero
Spain, MoviStar, Contrato Empresas Tramos Horarios
Netherlands, Vodafone, Vodafone 17.50
Spain, Vodafone, Contrato Vitamina Mensajes Al 50%
France, SFR, Le Compte 18€
Austria, T-Mobile, Relax 50
Netherlands, KPN, Mobiel WebBundel Small
France, Orange, Forfait M6 19.90€
Portugal, Vodafone, Plano Best
Greece, Cosmote, Cosmote 60 SMS 30
Ireland, O2, Active Life 40
Italy, TIM, TIM Menu Family + Tutti TIM Weekend Option
Malta, Go, Go Together
Germany, Vodafone, SMS-Generation
Greece, Vodafone, Vodafone 10
Italy, Vodafone, Vodafone Easy
Switzerland, Mobilezone, Mobilezonenet - Fair Value
Malta, Vodafone Malta, Lite
Switzerland, Orange, Optima 30 Option SMS
Switzerland, Swisscom, Natel Basic Liberty
Ireland, Vodafone, Perfect Fit 30
Switzerland, Cablecom, Mobile Connect
UK, O2, Anytime £20 + 50% extra minutes for life
UK, T-Mobile, Flext 20
Euro per month
2006
65 - Extrait du 12ème rapport d’implémentation de l’UE étendu à la Suisse
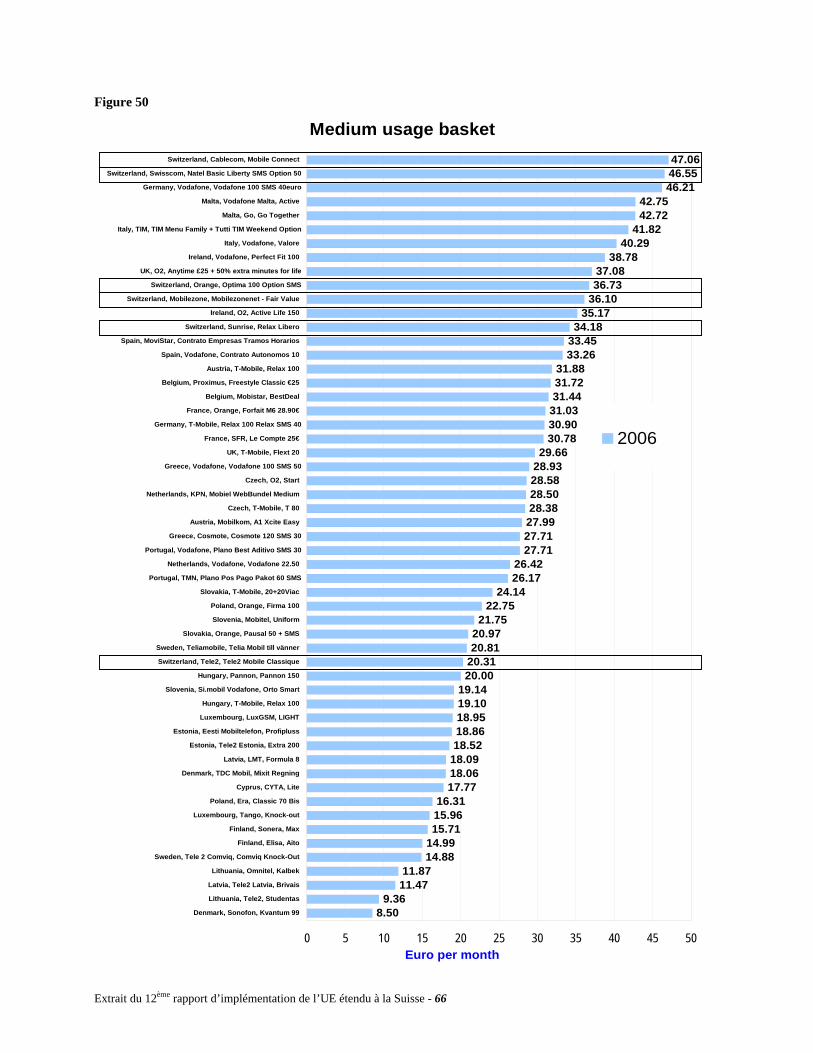
Figure 50
Medium usage basket
8.509.36
11.4711.87
14.8814.9915.7115.9616.31
17.7718.0618.0918.5218.8618.9519.1019.14
20.0020.3120.8120.9721.75
22.7524.14
26.1726.42
27.7127.7127.9928.3828.5028.5828.9329.66
30.7830.9031.0331.4431.7231.88
33.2633.4534.18
35.1736.1036.7337.08
38.7840.29
41.8242.7242.75
46.2146.5547.06
0 5 10 15 20 25 30 35 40 45 50
Denmark, Sonofon, Kvantum 99
Lithuania, Tele2, Studentas
Latvia, Tele2 Latvia, Brivais
Lithuania, Omnitel, Kalbek
Sweden, Tele 2 Comviq, Comviq Knock-Out
Finland, Elisa, Aito
Finland, Sonera, Max
Luxembourg, Tango, Knock-out
Poland, Era, Classic 70 Bis
Cyprus, CYTA, Lite
Denmark, TDC Mobil, Mixit Regning
Latvia, LMT, Formula 8
Estonia, Tele2 Estonia, Extra 200
Estonia, Eesti Mobiltelefon, Profipluss
Luxembourg, LuxGSM, LIGHT
Hungary, T-Mobile, Relax 100
Slovenia, Si.mobil Vodafone, Orto Smart
Hungary, Pannon, Pannon 150
Switzerland, Tele2, Tele2 Mobile Classique
Sweden, Teliamobile, Telia Mobil till vänner
Slovakia, Orange, Pausal 50 + SMS
Slovenia, Mobitel, Uniform
Poland, Orange, Firma 100
Slovakia, T-Mobile, 20+20Viac
Portugal, TMN, Plano Pos Pago Pakot 60 SMS
Netherlands, Vodafone, Vodafone 22.50
Portugal, Vodafone, Plano Best Aditivo SMS 30
Greece, Cosmote, Cosmote 120 SMS 30
Austria, Mobilkom, A1 Xcite Easy
Czech, T-Mobile, T 80
Netherlands, KPN, Mobiel WebBundel Medium
Czech, O2, Start
Greece, Vodafone, Vodafone 100 SMS 50
UK, T-Mobile, Flext 20
France, SFR, Le Compte 25€
Germany, T-Mobile, Relax 100 Relax SMS 40
France, Orange, Forfait M6 28.90€
Belgium, Mobistar, BestDeal
Belgium, Proximus, Freestyle Classic €25
Austria, T-Mobile, Relax 100
Spain, Vodafone, Contrato Autonomos 10
Spain, MoviStar, Contrato Empresas Tramos Horarios
Switzerland, Sunrise, Relax Libero
Ireland, O2, Active Life 150
Switzerland, Mobilezone, Mobilezonenet - Fair Value
Switzerland, Orange, Optima 100 Option SMS
UK, O2, Anytime £25 + 50% extra minutes for life
Ireland, Vodafone, Perfect Fit 100
Italy, Vodafone, Valore
Italy, TIM, TIM Menu Family + Tutti TIM Weekend Option
Malta, Go, Go Together
Malta, Vodafone Malta, Active
Germany, Vodafone, Vodafone 100 SMS 40euro
Switzerland, Swisscom, Natel Basic Liberty SMS Option 50
Switzerland, Cablecom, Mobile Connect
Euro per month
2006
Extrait du 12ème rapport d’implémentation de l’UE étendu à la Suisse - 66
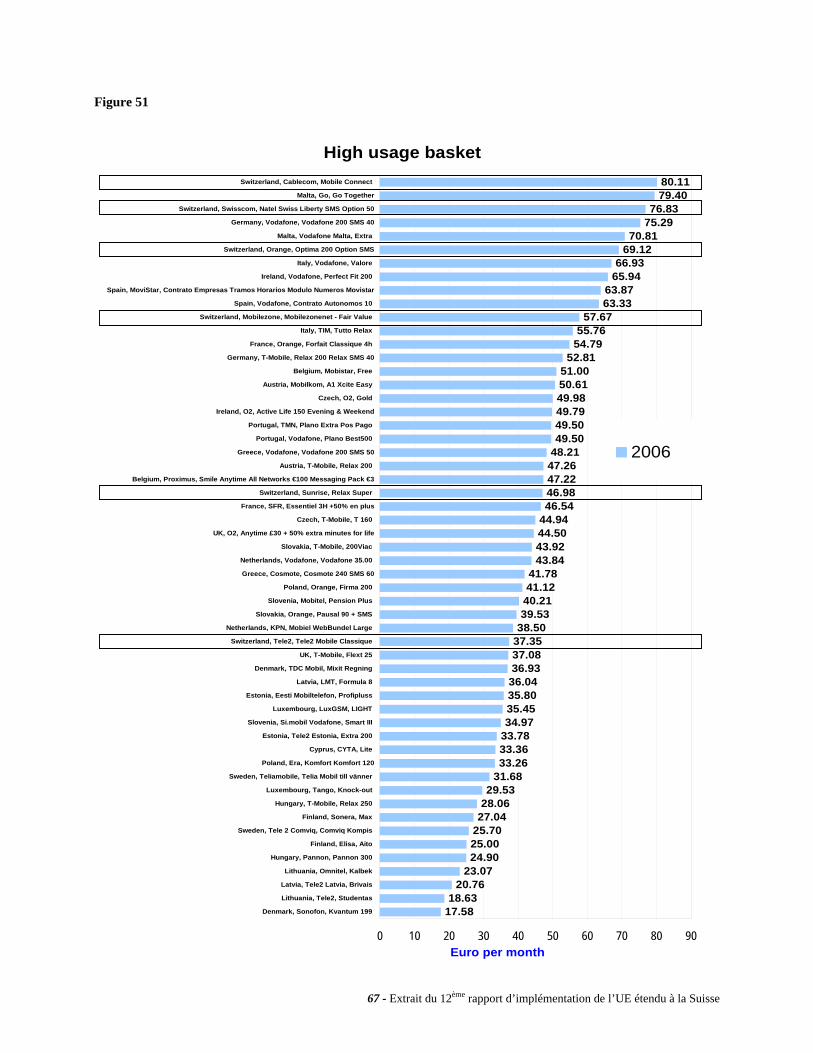
Figure 51
High usage basket
17.5818.63
20.7623.07
24.9025.0025.7027.0428.0629.53
31.6833.2633.3633.7834.9735.4535.8036.0436.9337.0837.3538.5039.5340.2141.1241.78
43.8443.9244.5044.9446.5446.9847.2247.2648.2149.5049.5049.7949.9850.6151.0052.81
54.7955.76
57.6763.3363.87
65.9466.93
69.1270.81
75.2976.83
79.4080.11
0 10 20 30 40 50 60 70 80 90
Denmark, Sonofon, Kvantum 199
Lithuania, Tele2, Studentas
Latvia, Tele2 Latvia, Brivais
Lithuania, Omnitel, Kalbek
Hungary, Pannon, Pannon 300
Finland, Elisa, Aito
Sweden, Tele 2 Comviq, Comviq Kompis
Finland, Sonera, Max
Hungary, T-Mobile, Relax 250
Luxembourg, Tango, Knock-out
Sweden, Teliamobile, Telia Mobil till vänner
Poland, Era, Komfort Komfort 120
Cyprus, CYTA, Lite
Estonia, Tele2 Estonia, Extra 200
Slovenia, Si.mobil Vodafone, Smart III
Luxembourg, LuxGSM, LIGHT
Estonia, Eesti Mobiltelefon, Profipluss
Latvia, LMT, Formula 8
Denmark, TDC Mobil, Mixit Regning
UK, T-Mobile, Flext 25
Switzerland, Tele2, Tele2 Mobile Classique
Netherlands, KPN, Mobiel WebBundel Large
Slovakia, Orange, Pausal 90 + SMS
Slovenia, Mobitel, Pension Plus
Poland, Orange, Firma 200
Greece, Cosmote, Cosmote 240 SMS 60
Netherlands, Vodafone, Vodafone 35.00
Slovakia, T-Mobile, 200Viac
UK, O2, Anytime £30 + 50% extra minutes for life
Czech, T-Mobile, T 160
France, SFR, Essentiel 3H +50% en plus
Switzerland, Sunrise, Relax Super
Belgium, Proximus, Smile Anytime All Networks €100 Messaging Pack €3
Austria, T-Mobile, Relax 200
Greece, Vodafone, Vodafone 200 SMS 50
Portugal, Vodafone, Plano Best500
Portugal, TMN, Plano Extra Pos Pago
Ireland, O2, Active Life 150 Evening & Weekend
Czech, O2, Gold
Austria, Mobilkom, A1 Xcite Easy
Belgium, Mobistar, Free
Germany, T-Mobile, Relax 200 Relax SMS 40
France, Orange, Forfait Classique 4h
Italy, TIM, Tutto Relax
Switzerland, Mobilezone, Mobilezonenet - Fair Value
Spain, Vodafone, Contrato Autonomos 10
Spain, MoviStar, Contrato Empresas Tramos Horarios Modulo Numeros Movistar
Ireland, Vodafone, Perfect Fit 200
Italy, Vodafone, Valore
Switzerland, Orange, Optima 200 Option SMS
Malta, Vodafone Malta, Extra
Germany, Vodafone, Vodafone 200 SMS 40
Switzerland, Swisscom, Natel Swiss Liberty SMS Option 50
Malta, Go, Go Together
Switzerland, Cablecom, Mobile Connect
Euro per month
2006
67 - Extrait du 12ème rapport d’implémentation de l’UE étendu à la Suisse
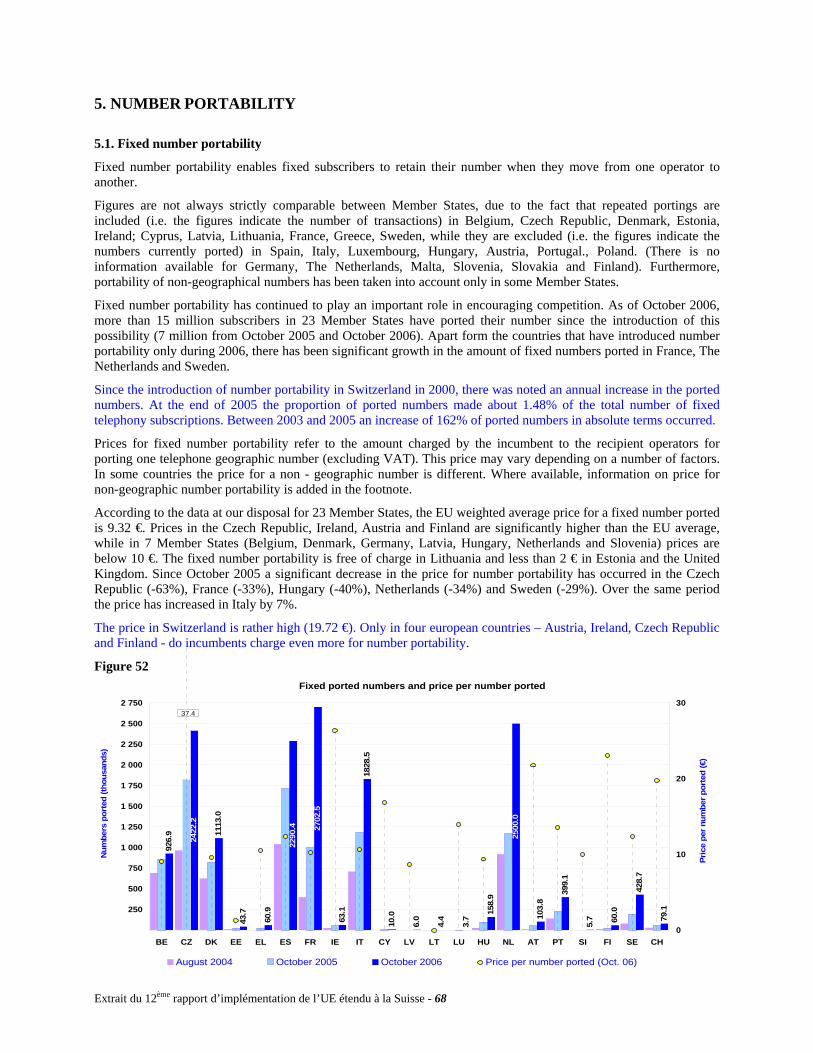
5. NUMBER PORTABILITY 5.1. Fixed number portability Fixed number portability enables fixed subscribers to retain their number when they move from one operator to another.
Figures are not always strictly comparable between Member States, due to the fact that repeated portings are included (i.e. the figures indicate the number of transactions) in Belgium, Czech Republic, Denmark, Estonia, Ireland; Cyprus, Latvia, Lithuania, France, Greece, Sweden, while they are excluded (i.e. the figures indicate the numbers currently ported) in Spain, Italy, Luxembourg, Hungary, Austria, Portugal., Poland. (There is no information available for Germany, The Netherlands, Malta, Slovenia, Slovakia and Finland). Furthermore, portability of non-geographical numbers has been taken into account only in some Member States.
Fixed number portability has continued to play an important role in encouraging competition. As of October 2006, more than 15 million subscribers in 23 Member States have ported their number since the introduction of this possibility (7 million from October 2005 and October 2006). Apart form the countries that have introduced number portability only during 2006, there has been significant growth in the amount of fixed numbers ported in France, The Netherlands and Sweden.
Since the introduction of number portability in Switzerland in 2000, there was noted an annual increase in the ported numbers. At the end of 2005 the proportion of ported numbers made about 1.48% of the total number of fixed telephony subscriptions. Between 2003 and 2005 an increase of 162% of ported numbers in absolute terms occurred.
Prices for fixed number portability refer to the amount charged by the incumbent to the recipient operators for porting one telephone geographic number (excluding VAT). This price may vary depending on a number of factors. In some countries the price for a non - geographic number is different. Where available, information on price for non-geographic number portability is added in the footnote.
According to the data at our disposal for 23 Member States, the EU weighted average price for a fixed number ported is 9.32 €. Prices in the Czech Republic, Ireland, Austria and Finland are significantly higher than the EU average, while in 7 Member States (Belgium, Denmark, Germany, Latvia, Hungary, Netherlands and Slovenia) prices are below 10 €. The fixed number portability is free of charge in Lithuania and less than 2 € in Estonia and the United Kingdom. Since October 2005 a significant decrease in the price for number portability has occurred in the Czech Republic (-63%), France (-33%), Hungary (-40%), Netherlands (-34%) and Sweden (-29%). Over the same period the price has increased in Italy by 7%.
The price in Switzerland is rather high (19.72 €). Only in four european countries – Austria, Ireland, Czech Republic and Finland - do incumbents charge even more for number portability.
Figure 52 Fixed ported numbers and price per number ported
926.
9 1113
.0
43.7
60.9
63.1
1828
.5
6.0
4.4
3.7
158.
9
103.
8
399.
1
5.7 60
.0
428.
7
79.1
2702
.5
10.0
2422
.2
2500
.0
2290
.4
250
500
750
1 000
1 250
1 500
1 750
2 000
2 250
2 500
2 750
BE CZ DK EE EL ES FR IE IT CY LV LT LU HU NL AT PT SI FI SE CH
Num
bers
por
ted
(thou
sand
s)
0
10
20
30Pr
ice
per n
umbe
r por
ted
(€)
August 2004 October 2005 October 2006 Price per number ported (Oct. 06)
37.4
Extrait du 12ème rapport d’implémentation de l’UE étendu à la Suisse - 68
The figures indicate the total fixed number ported up to each year. Belgium: Figures refer to 1 January 2006. Price refers to simple installation. Czech Republic: Fixed telephony ported numbers are represented. The price refers to one single telephone number porting. Price for comprehensive order is 99.15 €. Denmark: Figures refer to 30 June 2006. Germany: Data for geographic numbers not available. France: The price includes a fix cost of 8.72 € per request; price for more than one number is then lower. Price for non-geographic numbers varies between 90 € and 320 €. Ireland: Prices are for a single line. Price falls to 3,69 € per line for orders above 100 lines. Cyprus: Non-geographic numbers are excluded. Lithuania: Numbers are ported free of charge. Malta, Slovakia: Fixed number portability not in place. Netherlands: Price varies between 2 € and 8 €. Poland: Information not available. Finland: The price is an average of 39 SMP operators, as prices vary from 10 € to 30 €. Sweden: The price for ported non-geographic numbers is 14 €. United Kingdom. Data are not available for numbers ported. Price for porting geographic numbers varies between 0.74 € and 39.97 €. Source for Switzerland: OFCOM Switzerland, operators. The data for August 2004, October 2005 and 2006 refer respectively to the whole year 2003, 2004 and 2005.
5.2. Mobile number portability Mobile number portability enables mobile subscribers to retain their number when they move from one operator to another.
The numbers ported are not always strictly comparable between Member States, because repeated portings are included (i.e. the figures indicate the number of transactions) in Belgium, Czech Republic, Denmark, Estonia, Ireland; Cyprus, Latvia, Lithuania, France, Greece, Austria, Finland, Sweden, while they are excluded (i.e. the figures indicate the numbers currently ported) in Spain, Italy, Luxembourg, Hungary, Portugal, Poland (there is no information available for Malta, Germany, Netherlands, Slovenia, Slovakia and United Kingdom).
The mobile ported numbers have increased significantly during the past period (almost +6.3 million) and as of October 2006 31.4 million subscribers in 24 Member States have ported their number since the introduction of this possibility (data not available for United Kingdom).
Apart from the countries that have introduced number portability only during 2006, there has been significant growth in the amount of mobile numbers ported in France, Austria, Greece, Ireland and Luxembourg. The highest percentage of mobile number ported over the total mobile subscribers is found in Finland (over 64%) and Denmark (32%). Spain and Sweden have over 20%, while Belgium, Ireland, Italy and Netherlands have ported between 10% and 16% of the existing mobile numbers. Most of the new Member States show a very low level of numbers ported compared to the total of mobile subscribers due to the late introduction of number portability. The percentage of mobile number ported is also quite low in Luxembourg (3.4%) and in Germany, Greece, France, Portugal and Austria (not higher than 1.9%).
The mobile number portability was introduced in Switzerland in 2000. During the year 2002 there were 118’113 numbers ported. This represents a maximum annual value since the introduction of the service. During the period of 2002-2004 a decrease of 44% in demand occurred. This case is unique in Europe. In 2005 there was noted once again an increased interest in the use of this service. 99’072 mobile users have retained their number when they moved to another operator. The proportion of ported numbers made about 1.45% of the total number of mobile telephony subscriptions.
Prices for fixed number portability refer to the amount charged by the incumbent to the recipient operators for porting one mobile number (excluding VAT).
According to the data at our disposal for 17 Member States, the EU weighted average price for a mobile number ported is 12.3 €.
Prices in Germany, Ireland and Sweden are significantly higher than the EU average (more than 20 €), while in Spain and Lithuania it is free of charge and costs less than 2 € in Sweden. Since October 2005 a significant decrease in the price for a number ported has occurred in Sweden and in the Netherlands. The Swiss incumbent operator charges 18.45 euro per mobile number ported. This price is high in comparison with the European weighted average. Only in Germany and Ireland operators charge even more for the mobile number portability.
69 - Extrait du 12ème rapport d’implémentation de l’UE étendu à la Suisse
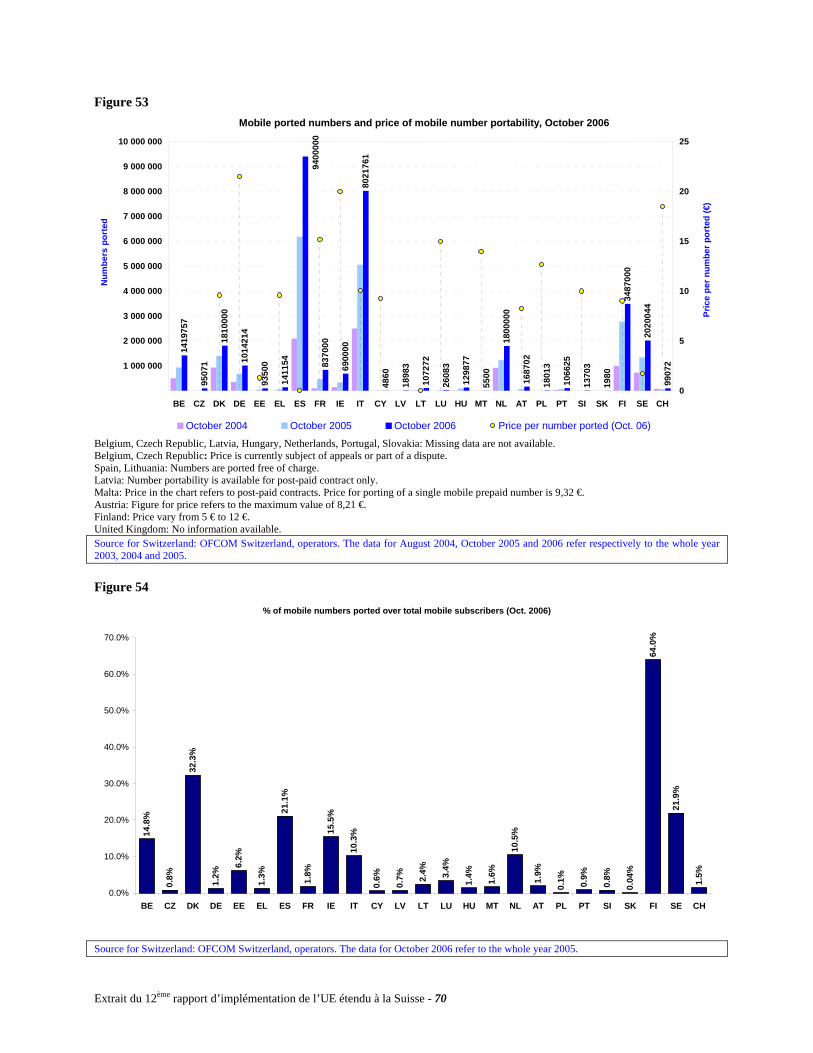
Figure 53 Mobile ported numbers and price of mobile number portability, October 2006
1419
757
9507
1
1810
000
1014
214
9350
0
1411
54 8370
00
6900
00
4860
1898
3
1072
72
2608
3
1298
77
5500
1800
000
1687
02
1801
3
1066
25
1370
3
1980
3487
000
2020
044
9907
2
9400
000
8021
761
1 000 000
2 000 000
3 000 000
4 000 000
5 000 000
6 000 000
7 000 000
8 000 000
9 000 000
10 000 000
BE CZ DK DE EE EL ES FR IE IT CY LV LT LU HU MT NL AT PL PT SI SK FI SE CH
Num
bers
por
ted
0
5
10
15
20
25
Pric
e pe
r num
ber p
orte
d (€
)
October 2004 October 2005 October 2006 Price per number ported (Oct. 06) Belgium, Czech Republic, Latvia, Hungary, Netherlands, Portugal, Slovakia: Missing data are not available. Belgium, Czech Republic: Price is currently subject of appeals or part of a dispute. Spain, Lithuania: Numbers are ported free of charge. Latvia: Number portability is available for post-paid contract only. Malta: Price in the chart refers to post-paid contracts. Price for porting of a single mobile prepaid number is 9,32 €. Austria: Figure for price refers to the maximum value of 8,21 €. Finland: Price vary from 5 € to 12 €. United Kingdom: No information available. Source for Switzerland: OFCOM Switzerland, operators. The data for August 2004, October 2005 and 2006 refer respectively to the whole year 2003, 2004 and 2005. Figure 54
% of mobile numbers ported over total mobile subscribers (Oct. 2006)
14.8
%
0.8%
32.3
%
1.2%
6.2%
1.3%
21.1
%
1.8%
15.5
%
10.3
%
0.6%
0.7% 2.
4% 3.4%
1.4%
1.6%
10.5
%
1.9%
0.1% 0.9%
0.8%
0.04
%
64.0
%
21.9
%
1.5%
0.0%
10.0%
20.0%
30.0%
40.0%
50.0%
60.0%
70.0%
BE CZ DK DE EE EL ES FR IE IT CY LV LT LU HU MT NL AT PL PT SI SK FI SE CH
Source for Switzerland: OFCOM Switzerland, operators. The data for October 2006 refer to the whole year 2005.
Extrait du 12ème rapport d’implémentation de l’UE étendu à la Suisse - 70
6. BROADBAND ACCESS AND PRICING
6.1. Broadband access definitions
This section provides data on the number and type of broadband lines supplied by both incumbent operators and new entrants in the EU and in Switzerland. It also contains information on access lines provided by means of alternative technologies such as wireless access (WLL), satellite and cable modems.
Information has been provided by the national regulatory authorities through the ONP COM02-18 questionnaire on data for local broadband access. Given the rapid developments in this sector, it has been agreed with NRAs to update the ONP questionnaire on a regular basis in January, July and October. Unless otherwise stated, the data below refer to the market situation at 1 October 2006.
The definitions used in the charts and data below are as follows:
- Fully unbundled lines: Fully unbundled lines supplied to other operators, excluding experimental lines. In the case of full unbundling, a copper pair is rented to a third party for its exclusive use. As fully unbundled lines (ULL) supplied by the incumbent operator to the new entrants could in principle be used for services other than broadband, the total number of ULL for access to internet will be lower than the total number of ULL.
- Shared access lines supplied by the incumbent to new entrants: Shared access lines supplied to other operators, excluding experimental lines. In the case of shared access, the incumbent continues to provide telephony service, while the new entrant delivers high-speed data services over that same local loop.
- Bitstream access: Supplied to new entrants. Bitstream access refers to the situation where the incumbent installs a high-speed access link to the customer premises and then makes this access link available to third parties, to enable them to provide high-speed services to customers. Bitstream depends in part on the PSTN and may include other networks such as the ATM network. Bitstream access is a wholesale product that consists of the provision of transmission capacity in such a way as to allow new entrants to offer their own, value-added services to their clients. The incumbent may also provide transmission services to its competitor, to carry traffic to a 'higher' level in the network hierarchy where new entrants may already have a broadband point of presence.
- Simple resale: In contrast to bitstream access, simple resale occurs where the new entrant receives and sells on to end users - with no possibility of value added features to the DSL part of the service - a product that is commercially similar to the DSL product provided by the incumbent to its own retail customers, irrespective of the ISP service that may be packaged with it. Resale offers are not a substitute for bitstream access because they do not allow new entrants to differentiate their services from those of the incumbent (i.e. where the new entrant simply resells the end-to-end service provided to him by the incumbent on a wholesale basis).
- Incumbent's DSL lines: Provided to end users by the incumbent, its subsidiaries or partners (for example an associated company such as a joint venture providing ISP services),
- WLL: Internet broadband connections by means of wireless local loop (sometimes referred to as fixed wireless access),
- Cable modem: Internet broadband connections by means of cable TV access,
- L.L.: Internet broadband connections by means of dedicated capacity (Leased Lines) provided over metallic copper pairs, including tail ends or partial circuits. “Incumbent's leased lines” includes only retail lines and excludes lines provided to other operators. “New entrants' leased lines” includes all retail lines provided to end users, even if based on wholesale lines supplied by the incumbent.
- Other categories: Internet broadband connections by means of 3G, satellite, fibre optic, powerline communications, other.
The figures relating to Switzerland include ADSL and cable modem connections only. The other means of accessing the internet have not been considered, due to the lack of information in our possession. However, the quantitative importance of these other types of access represents a negligible proportion of the overall broadband market.
- Retail access: Access provided to end users.
- Incumbents are defined as the organisations enjoying special and exclusive rights or de facto monopoly for provision of voice telephony services before liberalisation, regardless of the role played in the provision of access by
71 - Extrait du 12ème rapport d’implémentation de l’UE étendu à la Suisse
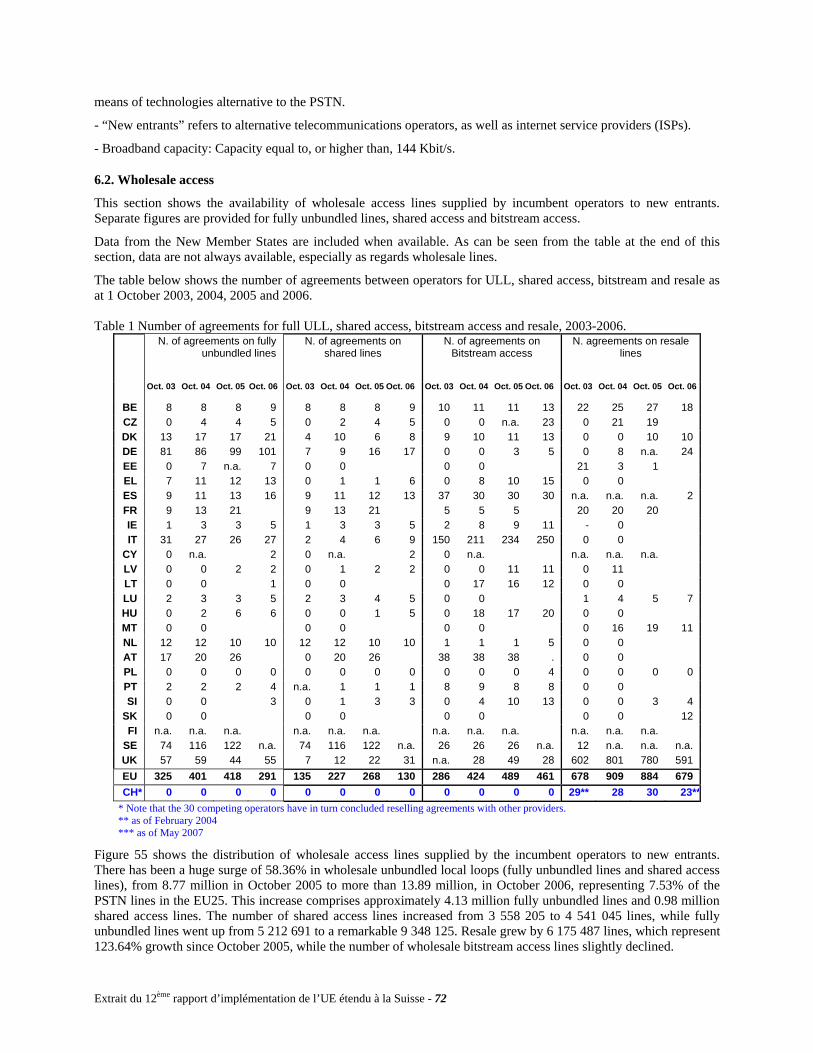
means of technologies alternative to the PSTN.
- “New entrants” refers to alternative telecommunications operators, as well as internet service providers (ISPs).
- Broadband capacity: Capacity equal to, or higher than, 144 Kbit/s.
6.2. Wholesale access This section shows the availability of wholesale access lines supplied by incumbent operators to new entrants. Separate figures are provided for fully unbundled lines, shared access and bitstream access.
Data from the New Member States are included when available. As can be seen from the table at the end of this section, data are not always available, especially as regards wholesale lines.
The table below shows the number of agreements between operators for ULL, shared access, bitstream and resale as at 1 October 2003, 2004, 2005 and 2006. Table 1 Number of agreements for full ULL, shared access, bitstream access and resale, 2003-2006.
N. of agreements on fully unbundled lines
N. of agreements on shared lines
N. of agreements on Bitstream access
N. agreements on resale lines
Oct. 03 Oct. 04 Oct. 05 Oct. 06 Oct. 03 Oct. 04 Oct. 05 Oct. 06 Oct. 03 Oct. 04 Oct. 05 Oct. 06 Oct. 03 Oct. 04 Oct. 05 Oct. 06
BE 8 8 8 9 8 8 8 9 10 11 11 13 22 25 27 18 CZ 0 4 4 5 0 2 4 5 0 0 n.a. 23 0 21 19 DK 13 17 17 21 4 10 6 8 9 10 11 13 0 0 10 10 DE 81 86 99 101 7 9 16 17 0 0 3 5 0 8 n.a. 24 EE 0 7 n.a. 7 0 0 0 0 21 3 1 EL 7 11 12 13 0 1 1 6 0 8 10 15 0 0 ES 9 11 13 16 9 11 12 13 37 30 30 30 n.a. n.a. n.a. 2 FR 9 13 21 9 13 21 5 5 5 20 20 20 IE 1 3 3 5 1 3 3 5 2 8 9 11 - 0 IT 31 27 26 27 2 4 6 9 150 211 234 250 0 0
CY 0 n.a. 2 0 n.a. 2 0 n.a. n.a. n.a. n.a. LV 0 0 2 2 0 1 2 2 0 0 11 11 0 11 LT 0 0 1 0 0 0 17 16 12 0 0 LU 2 3 3 5 2 3 4 5 0 0 1 4 5 7 HU 0 2 6 6 0 0 1 5 0 18 17 20 0 0 MT 0 0 0 0 0 0 0 16 19 11 NL 12 12 10 10 12 12 10 10 1 1 1 5 0 0 AT 17 20 26 0 20 26 38 38 38 . 0 0 PL 0 0 0 0 0 0 0 0 0 0 0 4 0 0 0 0 PT 2 2 2 4 n.a. 1 1 1 8 9 8 8 0 0 SI 0 0 3 0 1 3 3 0 4 10 13 0 0 3 4
SK 0 0 0 0 0 0 0 0 12 FI n.a. n.a. n.a. n.a. n.a. n.a. n.a. n.a. n.a. n.a. n.a. n.a.
SE 74 116 122 n.a. 74 116 122 n.a. 26 26 26 n.a. 12 n.a. n.a. n.a. UK 57 59 44 55 7 12 22 31 n.a. 28 49 28 602 801 780 591 EU 325 401 418 291 135 227 268 130 286 424 489 461 678 909 884 679 CH* 0 0 0 0 0 0 0 0 0 0 0 0 29** 28 30 23**
* Note that the 30 competing operators have in turn concluded reselling agreements with other providers. ** as of February 2004 *** as of May 2007
Figure 55 shows the distribution of wholesale access lines supplied by the incumbent operators to new entrants. There has been a huge surge of 58.36% in wholesale unbundled local loops (fully unbundled lines and shared access lines), from 8.77 million in October 2005 to more than 13.89 million, in October 2006, representing 7.53% of the PSTN lines in the EU25. This increase comprises approximately 4.13 million fully unbundled lines and 0.98 million shared access lines. The number of shared access lines increased from 3 558 205 to 4 541 045 lines, while fully unbundled lines went up from 5 212 691 to a remarkable 9 348 125. Resale grew by 6 175 487 lines, which represent 123.64% growth since October 2005, while the number of wholesale bitstream access lines slightly declined.
Extrait du 12ème rapport d’implémentation de l’UE étendu à la Suisse - 72
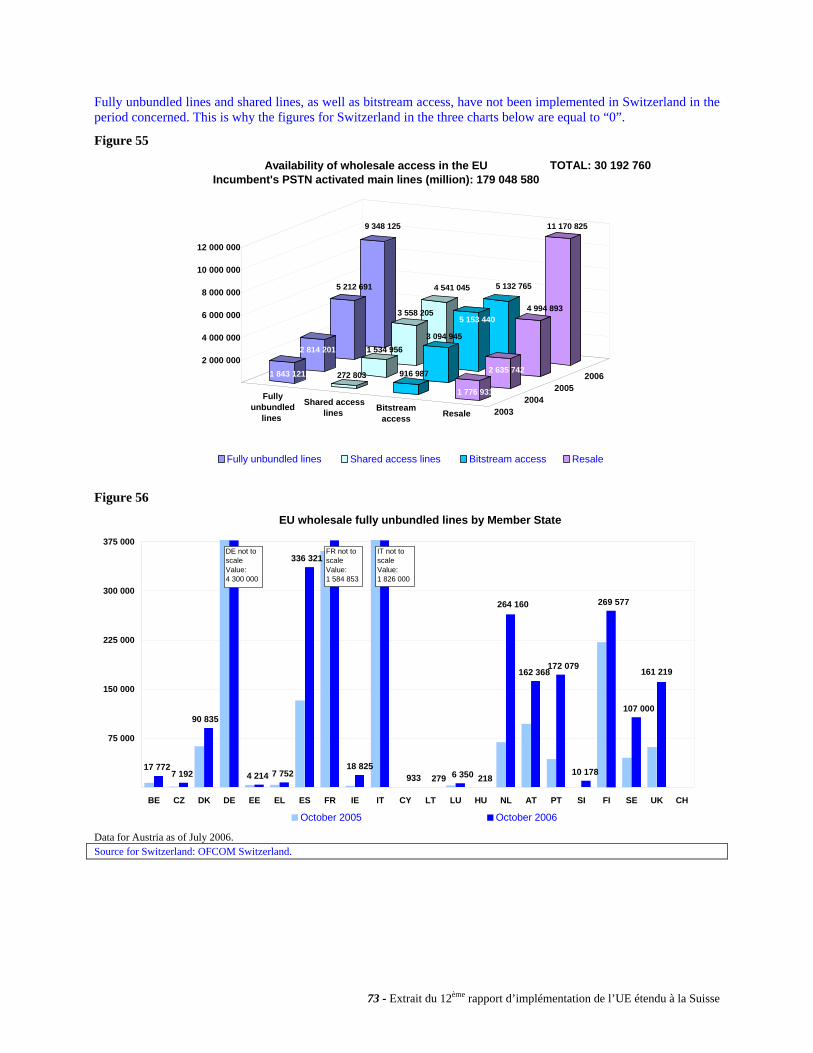
Fully unbundled lines and shared lines, as well as bitstream access, have not been implemented in Switzerland in the period concerned. This is why the figures for Switzerland in the three charts below are equal to “0”.
Figure 55
20032004
20052006
Fullyunbundled
lines
Shared accesslines Bitstream
access Resale
9 348 125
5 212 691
2 814 201
1 843 121
4 541 045
3 558 205
1 534 956
272 803
5 132 765
5 153 440
3 094 945
916 987
11 170 825
4 994 893
2 635 742
1 776 931
2 000 000
4 000 000
6 000 000
8 000 000
10 000 000
12 000 000
Availability of wholesale access in the EUIncumbent's PSTN activated main lines (million): 179 048 580
Fully unbundled lines Shared access lines Bitstream access Resale
TOTAL: 30 192 760
Figure 56
EU wholesale fully unbundled lines by Member State
933 279 6 350
172 079
269 577
107 000
17 772 7 192
90 835
4 214 7 752
336 321
18 825 218
161 219
10 178
162 368
264 160
75 000
150 000
225 000
300 000
375 000
BE CZ DK DE EE EL ES FR IE IT CY LT LU HU NL AT PT SI FI SE UK CH
October 2005 October 2006
DE not to scaleValue:4 300 000
FR not to scaleValue:1 584 853
IT not to scaleValue:1 826 000
Data for Austria as of July 2006. Source for Switzerland: OFCOM Switzerland.
73 - Extrait du 12ème rapport d’implémentation de l’UE étendu à la Suisse
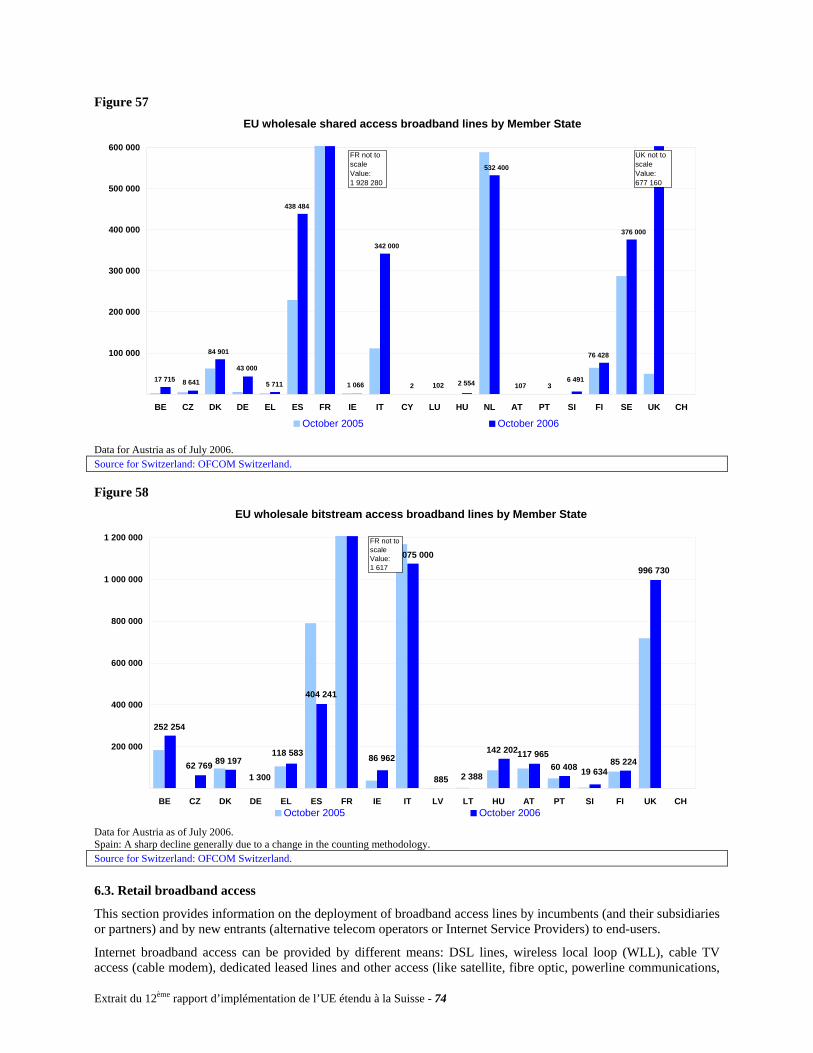
Figure 57 EU wholesale shared access broadband lines by Member State
342 000
532 400
376 000
102
76 428
438 484
2 554 8 641 17 715
84 901
43 000
5 711 1 066 2 107 3 6 491
100 000
200 000
300 000
400 000
500 000
600 000
BE CZ DK DE EL ES FR IE IT CY LU HU NL AT PT SI FI SE UK CH
October 2005 October 2006
FR not to scaleValue:1 928 280
UK not to scaleValue:677 160
Data for Austria as of July 2006. Source for Switzerland: OFCOM Switzerland. Figure 58
EU wholesale bitstream access broadband lines by Member State
1 075 000
996 730
85 224 19 634 60 408
117 965 142 202
2 388 885
404 241
1 300
89 197 62 769
252 254
86 962 118 583 200 000
400 000
600 000
800 000
1 000 000
1 200 000
BE CZ DK DE EL ES FR IE IT LV LT HU AT PT SI FI UK CHOctober 2005 October 2006
FR not to scaleValue: 1 617
Data for Austria as of July 2006. Spain: A sharp decline generally due to a change in the counting methodology. Source for Switzerland: OFCOM Switzerland.
6.3. Retail broadband access This section provides information on the deployment of broadband access lines by incumbents (and their subsidiaries or partners) and by new entrants (alternative telecom operators or Internet Service Providers) to end-users.
Internet broadband access can be provided by different means: DSL lines, wireless local loop (WLL), cable TV access (cable modem), dedicated leased lines and other access (like satellite, fibre optic, powerline communications,
Extrait du 12ème rapport d’implémentation de l’UE étendu à la Suisse - 74
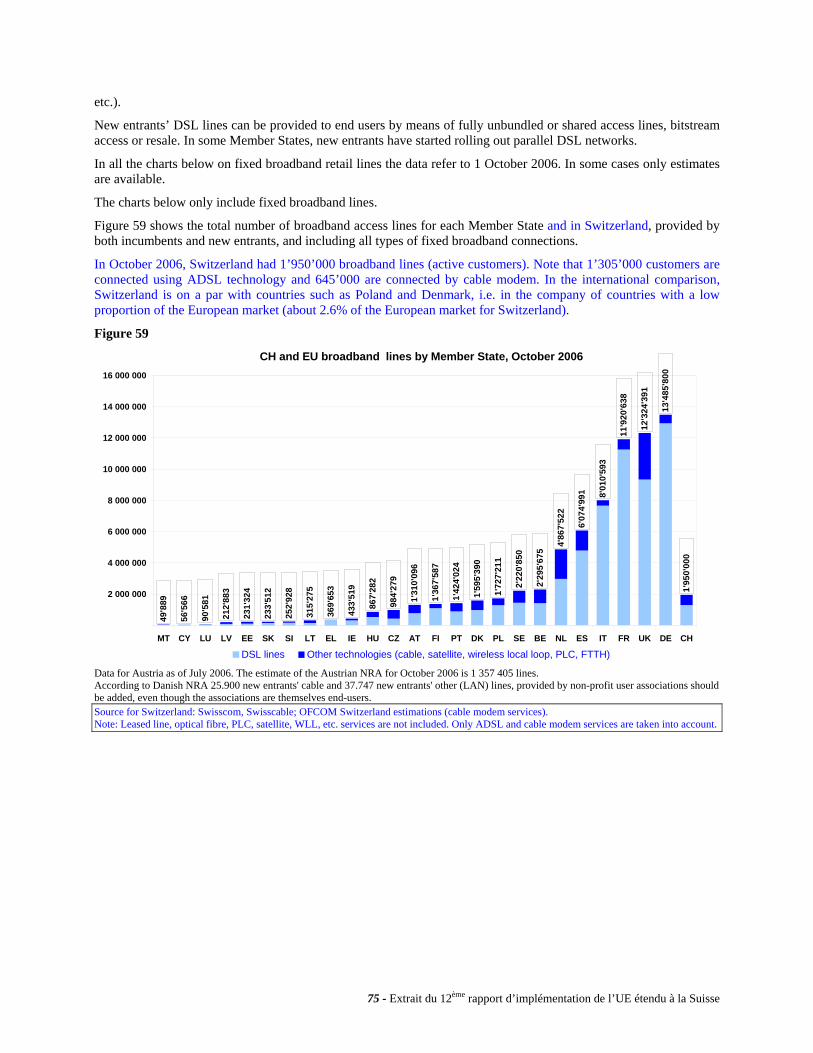
etc.).
New entrants’ DSL lines can be provided to end users by means of fully unbundled or shared access lines, bitstream access or resale. In some Member States, new entrants have started rolling out parallel DSL networks.
In all the charts below on fixed broadband retail lines the data refer to 1 October 2006. In some cases only estimates are available.
The charts below only include fixed broadband lines.
Figure 59 shows the total number of broadband access lines for each Member State and in Switzerland, provided by both incumbents and new entrants, and including all types of fixed broadband connections.
In October 2006, Switzerland had 1’950’000 broadband lines (active customers). Note that 1’305’000 customers are connected using ADSL technology and 645’000 are connected by cable modem. In the international comparison, Switzerland is on a par with countries such as Poland and Denmark, i.e. in the company of countries with a low proportion of the European market (about 2.6% of the European market for Switzerland).
Figure 59
CH and EU broadband lines by Member State, October 2006
49'8
89
56'5
66
90'5
81
212'
883
231'
324
233'
512
252'
928
315'
275
369'
653
433'
519
867'
282
984'
279
1'31
0'09
6
1'36
7'58
7
1'42
4'02
4
1'59
5'39
0
1'72
7'21
1
2'22
0'85
0
2'29
5'67
5
4'86
7'52
2
6'07
4'99
1 8'01
0'59
3
11'9
20'6
38
12'3
24'3
91
13'4
85'8
00
1'95
0'00
0
2 000 000
4 000 000
6 000 000
8 000 000
10 000 000
12 000 000
14 000 000
16 000 000
MT CY LU LV EE SK SI LT EL IE HU CZ AT FI PT DK PL SE BE NL ES IT FR UK DE CH
DSL lines Other technologies (cable, satellite, wireless local loop, PLC, FTTH) Data for Austria as of July 2006. The estimate of the Austrian NRA for October 2006 is 1 357 405 lines. According to Danish NRA 25.900 new entrants' cable and 37.747 new entrants' other (LAN) lines, provided by non-profit user associations should be added, even though the associations are themselves end-users. Source for Switzerland: Swisscom, Swisscable; OFCOM Switzerland estimations (cable modem services). Note: Leased line, optical fibre, PLC, satellite, WLL, etc. services are not included. Only ADSL and cable modem services are taken into account.
75 - Extrait du 12ème rapport d’implémentation de l’UE étendu à la Suisse
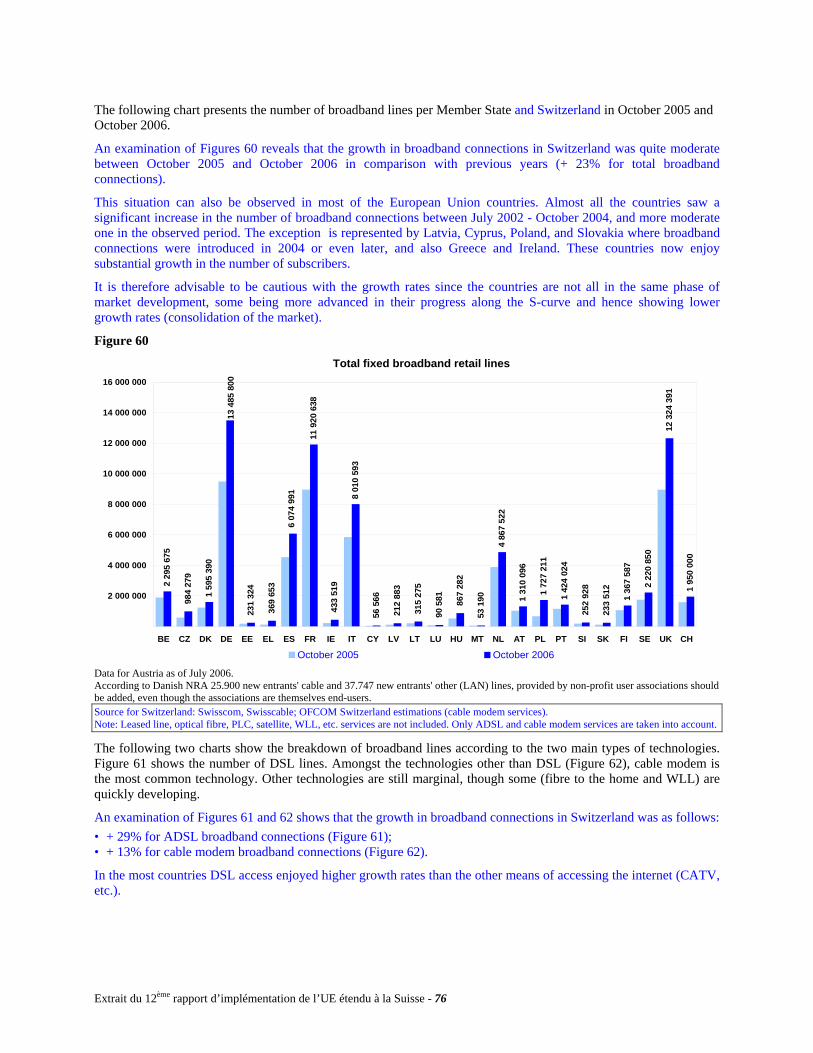
The following chart presents the number of broadband lines per Member State and Switzerland in October 2005 and October 2006. An examination of Figures 60 reveals that the growth in broadband connections in Switzerland was quite moderate between October 2005 and October 2006 in comparison with previous years (+ 23% for total broadband connections).
This situation can also be observed in most of the European Union countries. Almost all the countries saw a significant increase in the number of broadband connections between July 2002 - October 2004, and more moderate one in the observed period. The exception is represented by Latvia, Cyprus, Poland, and Slovakia where broadband connections were introduced in 2004 or even later, and also Greece and Ireland. These countries now enjoy substantial growth in the number of subscribers.
It is therefore advisable to be cautious with the growth rates since the countries are not all in the same phase of market development, some being more advanced in their progress along the S-curve and hence showing lower growth rates (consolidation of the market).
Figure 60
Total fixed broadband retail lines
2 2
95 6
75
984
279
1 5
95 3
90
231
324
369
653
433
519
56
566
212
883
315
275
90
581
867
282
53
190
1 3
10 0
96
1 7
27 2
11
1 4
24 0
24
252
928
233
512
1 3
67 5
87
2 2
20 8
50
1 9
50 0
00
11
920
638
8 0
10 5
93
13
485
800
4 8
67 5
22
12
324
391
6 0
74 9
91
2 000 000
4 000 000
6 000 000
8 000 000
10 000 000
12 000 000
14 000 000
16 000 000
BE CZ DK DE EE EL ES FR IE IT CY LV LT LU HU MT NL AT PL PT SI SK FI SE UK CH
October 2005 October 2006 Data for Austria as of July 2006. According to Danish NRA 25.900 new entrants' cable and 37.747 new entrants' other (LAN) lines, provided by non-profit user associations should be added, even though the associations are themselves end-users. Source for Switzerland: Swisscom, Swisscable; OFCOM Switzerland estimations (cable modem services). Note: Leased line, optical fibre, PLC, satellite, WLL, etc. services are not included. Only ADSL and cable modem services are taken into account.
The following two charts show the breakdown of broadband lines according to the two main types of technologies. Figure 61 shows the number of DSL lines. Amongst the technologies other than DSL (Figure 62), cable modem is the most common technology. Other technologies are still marginal, though some (fibre to the home and WLL) are quickly developing. An examination of Figures 61 and 62 shows that the growth in broadband connections in Switzerland was as follows: • + 29% for ADSL broadband connections (Figure 61); • + 13% for cable modem broadband connections (Figure 62).
In the most countries DSL access enjoyed higher growth rates than the other means of accessing the internet (CATV, etc.).
Extrait du 12ème rapport d’implémentation de l’UE étendu à la Suisse - 76
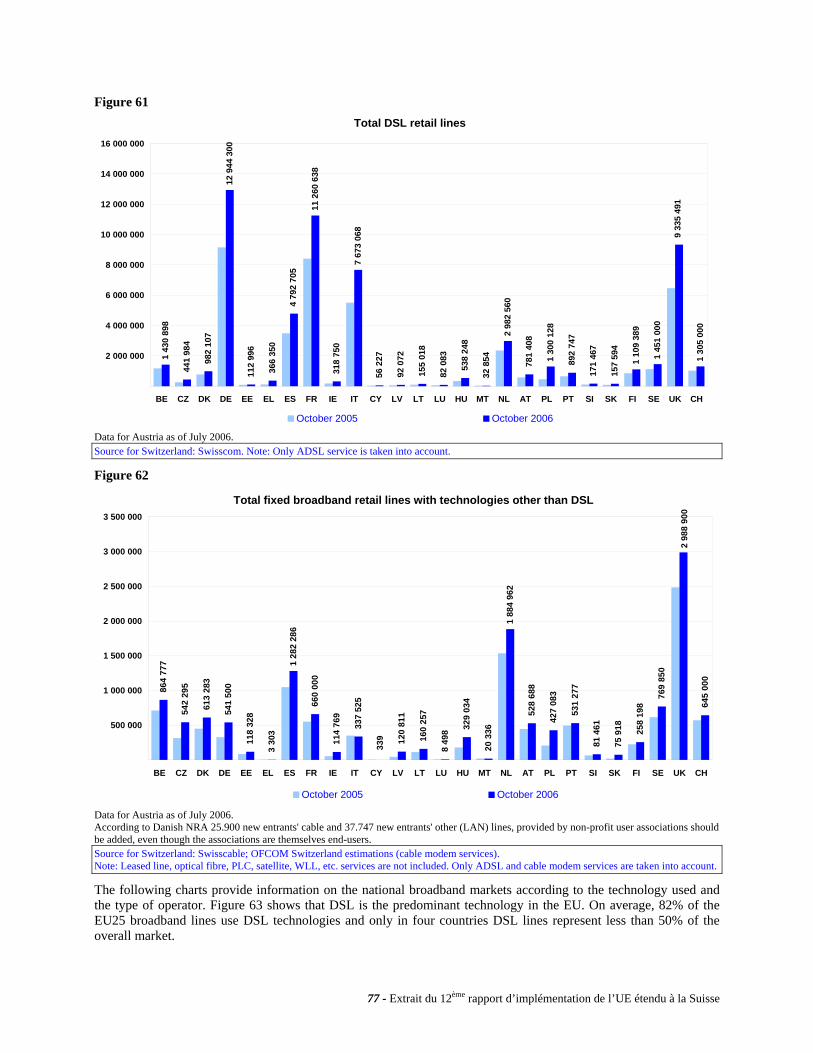
Figure 61 Total DSL retail lines
1 4
30 8
98
441
984
982
107
112
996
366
350
318
750
56
227
92
072
155
018
82
083
538
248
32
854
781
408
1 3
00 1
28
892
747
171
467
157
594
1 1
09 3
89
1 4
51 0
00
1 3
05 0
00
12
944
300
11
260
638
7 6
73 0
68 9 3
35 4
91
2 9
82 5
60 4 7
92 7
05
2 000 000
4 000 000
6 000 000
8 000 000
10 000 000
12 000 000
14 000 000
16 000 000
BE CZ DK DE EE EL ES FR IE IT CY LV LT LU HU MT NL AT PL PT SI SK FI SE UK CH
October 2005 October 2006 Data for Austria as of July 2006. Source for Switzerland: Swisscom. Note: Only ADSL service is taken into account.
Figure 62
Total fixed broadband retail lines with technologies other than DSL
864
777
542
295
613
283
541
500
118
328
3 3
03
660
000
114
769
337
525
33
9
120
811
160
257
8 4
98 329
034
20
336
528
688
427
083
531
277
81
461
75
918
258
198
769
850
645
000
2 9
88 9
00
1 2
82 2
86
1 8
84 9
62
500 000
1 000 000
1 500 000
2 000 000
2 500 000
3 000 000
3 500 000
BE CZ DK DE EE EL ES FR IE IT CY LV LT LU HU MT NL AT PL PT SI SK FI SE UK CH
October 2005 October 2006
Data for Austria as of July 2006. According to Danish NRA 25.900 new entrants' cable and 37.747 new entrants' other (LAN) lines, provided by non-profit user associations should be added, even though the associations are themselves end-users. Source for Switzerland: Swisscable; OFCOM Switzerland estimations (cable modem services). Note: Leased line, optical fibre, PLC, satellite, WLL, etc. services are not included. Only ADSL and cable modem services are taken into account.
The following charts provide information on the national broadband markets according to the technology used and the type of operator. Figure 63 shows that DSL is the predominant technology in the EU. On average, 82% of the EU25 broadband lines use DSL technologies and only in four countries DSL lines represent less than 50% of the overall market.
77 - Extrait du 12ème rapport d’implémentation de l’UE étendu à la Suisse
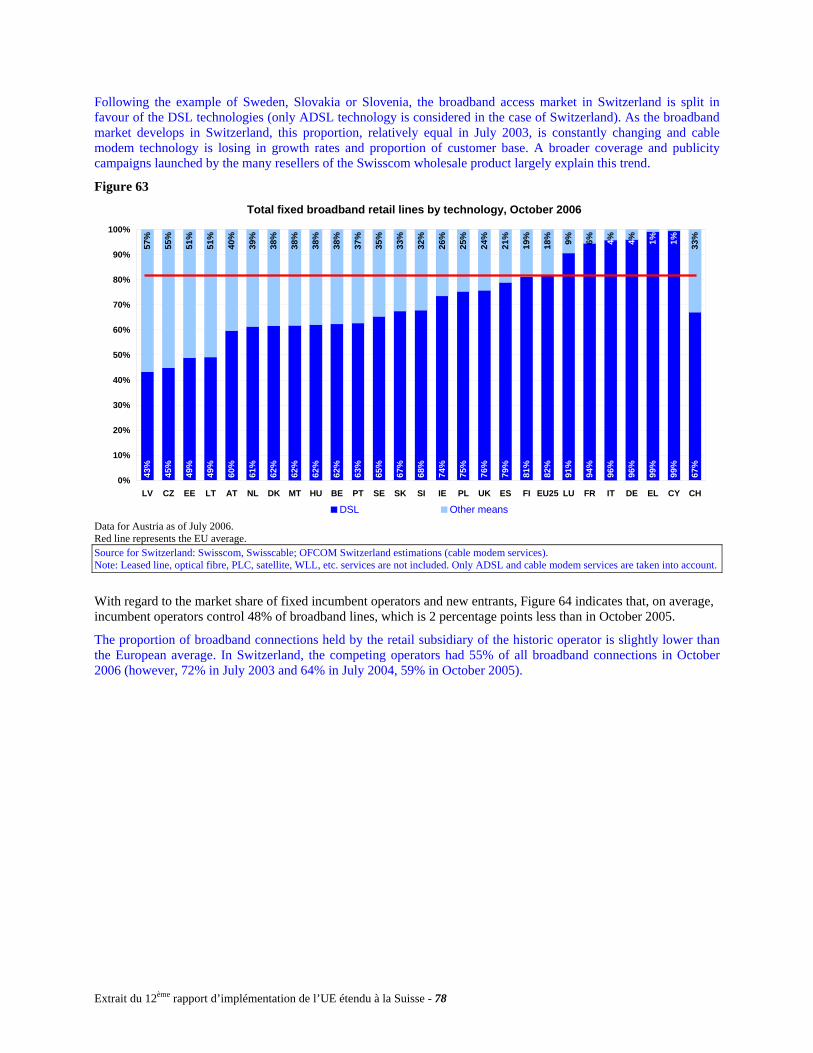
Following the example of Sweden, Slovakia or Slovenia, the broadband access market in Switzerland is split in favour of the DSL technologies (only ADSL technology is considered in the case of Switzerland). As the broadband market develops in Switzerland, this proportion, relatively equal in July 2003, is constantly changing and cable modem technology is losing in growth rates and proportion of customer base. A broader coverage and publicity campaigns launched by the many resellers of the Swisscom wholesale product largely explain this trend.
Figure 63
Total fixed broadband retail lines by technology, October 2006
43%
45%
49%
49%
60%
61%
62%
62%
62%
62%
63%
65%
67%
68%
74%
75%
76%
79%
81%
82%
91%
94%
96%
96%
99%
99%
67%
57%
55%
51%
51%
40%
39%
38%
38%
38%
38%
37%
35%
33%
32%
26%
25%
24%
21%
19%
18% 9% 6% 33%4% 4% 1%1%
0%
10%
20%
30%
40%
50%
60%
70%
80%
90%
100%
LV CZ EE LT AT NL DK MT HU BE PT SE SK SI IE PL UK ES FI EU25 LU FR IT DE EL CY CH
DSL Other means Data for Austria as of July 2006. Red line represents the EU average. Source for Switzerland: Swisscom, Swisscable; OFCOM Switzerland estimations (cable modem services). Note: Leased line, optical fibre, PLC, satellite, WLL, etc. services are not included. Only ADSL and cable modem services are taken into account.
With regard to the market share of fixed incumbent operators and new entrants, Figure 64 indicates that, on average, incumbent operators control 48% of broadband lines, which is 2 percentage points less than in October 2005. The proportion of broadband connections held by the retail subsidiary of the historic operator is slightly lower than the European average. In Switzerland, the competing operators had 55% of all broadband connections in October 2006 (however, 72% in July 2003 and 64% in July 2004, 59% in October 2005).
Extrait du 12ème rapport d’implémentation de l’UE étendu à la Suisse - 78
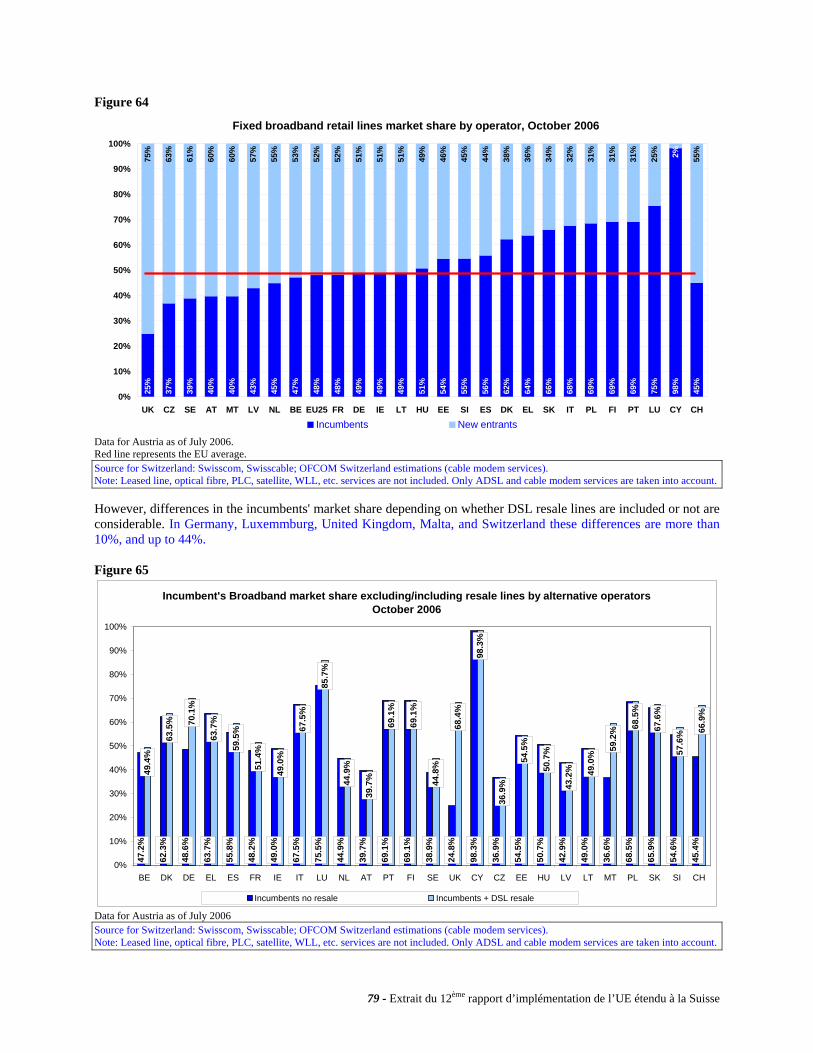
Figure 64
Fixed broadband retail lines market share by operator, October 2006
25%
37%
39%
40%
40%
43%
45%
47%
48%
48%
49%
49%
49%
51%
54%
55%
56%
62%
64%
66%
68%
69%
69%
69%
75%
98%
45%
75%
63%
61%
60%
60%
57%
55%
53%
52%
52%
51%
51%
51%
49%
46%
45%
44%
38%
36%
34%
32%
31%
31%
31%
25%
55%2%
0%
10%
20%
30%
40%
50%
60%
70%
80%
90%
100%
UK CZ SE AT MT LV NL BE EU25 FR DE IE LT HU EE SI ES DK EL SK IT PL FI PT LU CY CH
Incumbents New entrants Data for Austria as of July 2006. Red line represents the EU average. Source for Switzerland: Swisscom, Swisscable; OFCOM Switzerland estimations (cable modem services). Note: Leased line, optical fibre, PLC, satellite, WLL, etc. services are not included. Only ADSL and cable modem services are taken into account. However, differences in the incumbents' market share depending on whether DSL resale lines are included or not are considerable. In Germany, Luxemmburg, United Kingdom, Malta, and Switzerland these differences are more than 10%, and up to 44%. Figure 65
Incumbent's Broadband market share excluding/including resale lines by alternative operatorsOctober 2006
47.2
%
48.6
%
63.7
%
55.8
%
49.0
%
67.5
%
75.5
%
69.1
%
24.8
%
98.3
%
36.9
%
54.5
%
50.7
%
42.9
%
49.0
%
36.6
%
68.5
%
65.9
%
54.6
%
45.4
%
49.4
%
63.5
% 70.1
%
63.7
%
59.5
%
51.4
%
49.0
%
67.5
%
85.7
%
44.9
%
39.7
%
69.1
%
69.1
%
44.8
%
68.4
%
98.3
%
36.9
%
54.5
%
50.7
%
43.2
% 49.0
%
59.2
% 68.5
%
67.6
%
57.6
% 66.9
%
38.9
%
69.1
%
39.7
%
44.9
%
62.3
%
48.2
%
0%
10%
20%
30%
40%
50%
60%
70%
80%
90%
100%
BE DK DE EL ES FR IE IT LU NL AT PT FI SE UK CY CZ EE HU LV LT MT PL SK SI CH
Incumbents no resale Incumbents + DSL resale Data for Austria as of July 2006 Source for Switzerland: Swisscom, Swisscable; OFCOM Switzerland estimations (cable modem services). Note: Leased line, optical fibre, PLC, satellite, WLL, etc. services are not included. Only ADSL and cable modem services are taken into account.
79 - Extrait du 12ème rapport d’implémentation de l’UE étendu à la Suisse
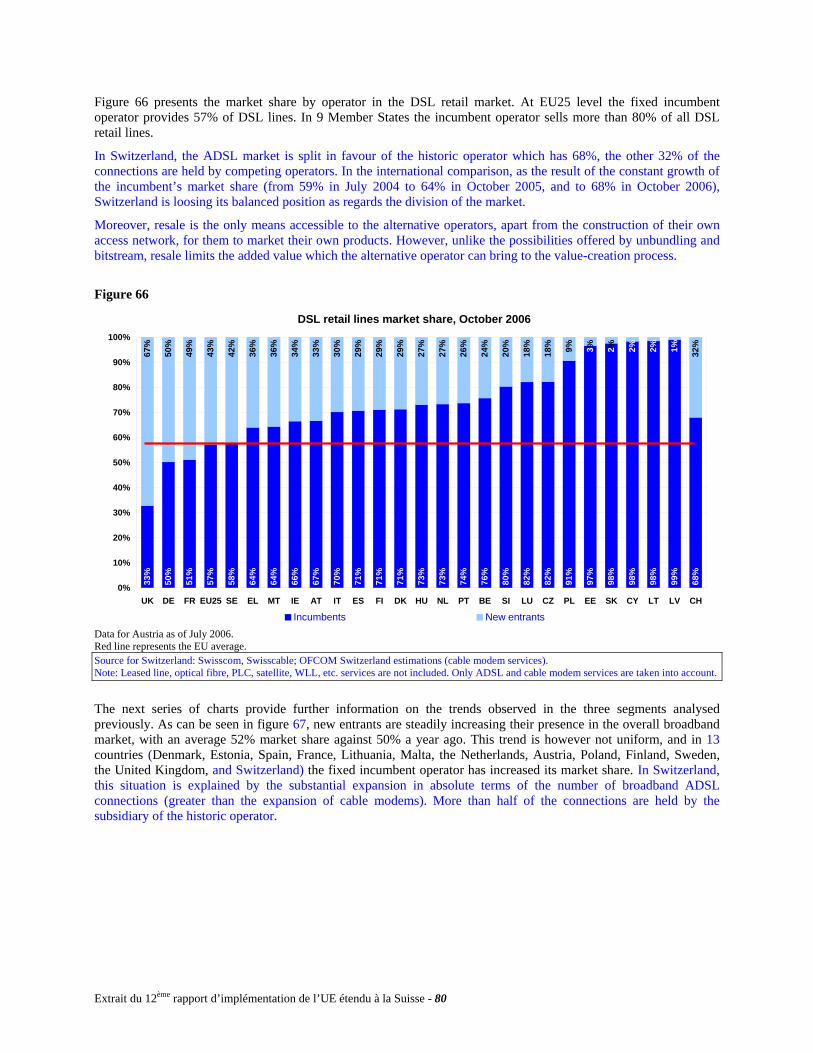
Figure 66 presents the market share by operator in the DSL retail market. At EU25 level the fixed incumbent operator provides 57% of DSL lines. In 9 Member States the incumbent operator sells more than 80% of all DSL retail lines.
In Switzerland, the ADSL market is split in favour of the historic operator which has 68%, the other 32% of the connections are held by competing operators. In the international comparison, as the result of the constant growth of the incumbent’s market share (from 59% in July 2004 to 64% in October 2005, and to 68% in October 2006), Switzerland is loosing its balanced position as regards the division of the market.
Moreover, resale is the only means accessible to the alternative operators, apart from the construction of their own access network, for them to market their own products. However, unlike the possibilities offered by unbundling and bitstream, resale limits the added value which the alternative operator can bring to the value-creation process.
Figure 66
DSL retail lines market share, October 2006
33%
50%
51%
57%
58%
64%
64%
66%
67%
70%
71%
71%
71%
73%
73%
74%
76%
80%
82%
82%
91%
97%
98%
98%
98%
99%
68%
2% 1% 32%2% 2%3%9%18%
18%
20%
24%
26%
27%
27%
29%
29%
29%
30%
33%
34%
36%
36%
42%
43%
49%
50%
67%
0%
10%
20%
30%
40%
50%
60%
70%
80%
90%
100%
UK DE FR EU25 SE EL MT IE AT IT ES FI DK HU NL PT BE SI LU CZ PL EE SK CY LT LV CH
Incumbents New entrants Data for Austria as of July 2006. Red line represents the EU average. Source for Switzerland: Swisscom, Swisscable; OFCOM Switzerland estimations (cable modem services). Note: Leased line, optical fibre, PLC, satellite, WLL, etc. services are not included. Only ADSL and cable modem services are taken into account.
The next series of charts provide further information on the trends observed in the three segments analysed previously. As can be seen in figure 67, new entrants are steadily increasing their presence in the overall broadband market, with an average 52% market share against 50% a year ago. This trend is however not uniform, and in 13 countries (Denmark, Estonia, Spain, France, Lithuania, Malta, the Netherlands, Austria, Poland, Finland, Sweden, the United Kingdom, and Switzerland) the fixed incumbent operator has increased its market share. In Switzerland, this situation is explained by the substantial expansion in absolute terms of the number of broadband ADSL connections (greater than the expansion of cable modems). More than half of the connections are held by the subsidiary of the historic operator.
Extrait du 12ème rapport d’implémentation de l’UE étendu à la Suisse - 80
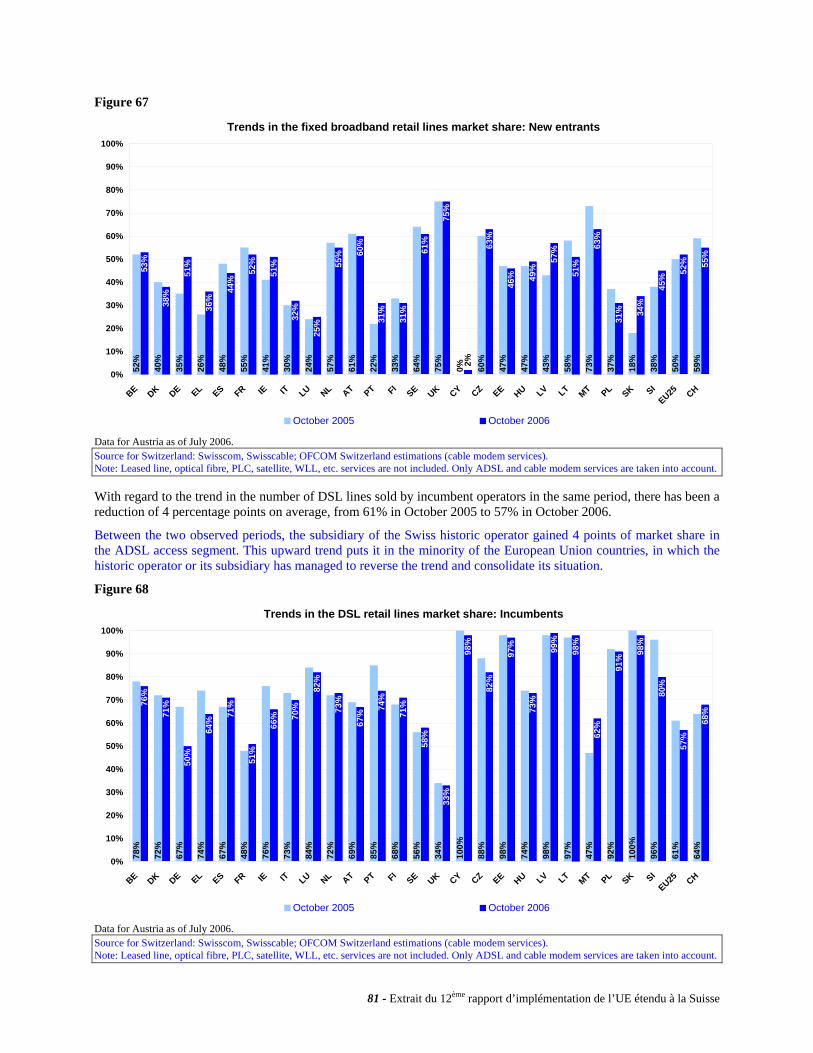
Figure 67
Trends in the fixed broadband retail lines market share: New entrants52
%
40%
35%
26%
48%
55%
41%
30%
24%
57%
61%
22%
33%
64%
75%
0% 60%
47%
47%
43%
58%
73%
37%
18%
38%
50%
59%
53%
38%
51%
36%
44%
52%
32%
25%
55% 60
%
31%
31%
61%
75%
46% 49
%
57%
51%
63%
31% 34
%
52% 55
%
2%
45%51
%
63%
0%
10%
20%
30%
40%
50%
60%
70%
80%
90%
100%
BE DK DE EL ES FR IE IT LU NL AT PT FISE UK CY CZ EE HU LV LT MT PL SK SI
EU25 CH
October 2005 October 2006
Data for Austria as of July 2006. Source for Switzerland: Swisscom, Swisscable; OFCOM Switzerland estimations (cable modem services). Note: Leased line, optical fibre, PLC, satellite, WLL, etc. services are not included. Only ADSL and cable modem services are taken into account. With regard to the trend in the number of DSL lines sold by incumbent operators in the same period, there has been a reduction of 4 percentage points on average, from 61% in October 2005 to 57% in October 2006. Between the two observed periods, the subsidiary of the Swiss historic operator gained 4 points of market share in the ADSL access segment. This upward trend puts it in the minority of the European Union countries, in which the historic operator or its subsidiary has managed to reverse the trend and consolidate its situation.
Figure 68
Trends in the DSL retail lines market share: Incumbents
78%
72%
67%
74%
67%
48%
76%
73%
84%
72%
69%
85%
68%
56%
34%
100%
88%
98%
74%
98%
97%
47%
92%
100%
96%
61%
64%
76%
71%
50%
64%
71%
51%
70%
82%
73%
67%
74%
71%
58%
33%
97%
73%
99%
98%
62%
91%
98%
57%
68%
82%
66%
80%
98%
0%
10%
20%
30%
40%
50%
60%
70%
80%
90%
100%
BE DK DE EL ES FR IE IT LU NL AT PT FISE UK CY CZ EE HU LV LT MT PL SK SI
EU25 CH
October 2005 October 2006
Data for Austria as of July 2006. Source for Switzerland: Swisscom, Swisscable; OFCOM Switzerland estimations (cable modem services). Note: Leased line, optical fibre, PLC, satellite, WLL, etc. services are not included. Only ADSL and cable modem services are taken into account.
81 - Extrait du 12ème rapport d’implémentation de l’UE étendu à la Suisse
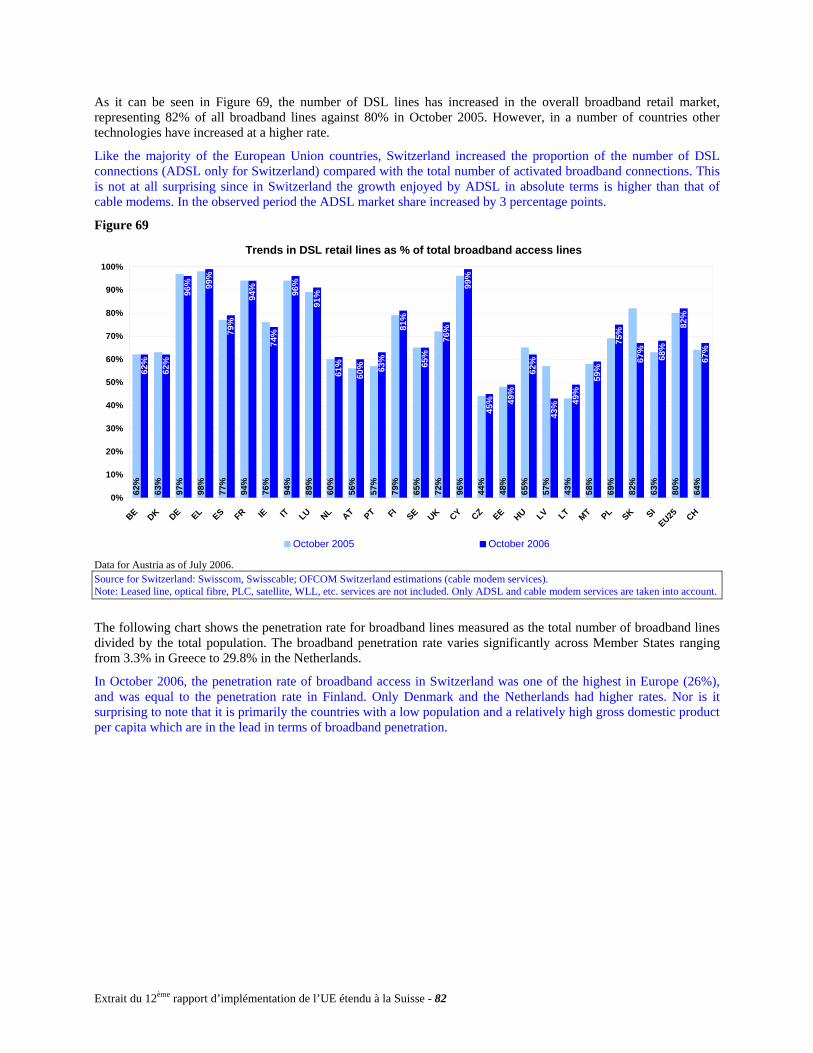
As it can be seen in Figure 69, the number of DSL lines has increased in the overall broadband retail market, representing 82% of all broadband lines against 80% in October 2005. However, in a number of countries other technologies have increased at a higher rate. Like the majority of the European Union countries, Switzerland increased the proportion of the number of DSL connections (ADSL only for Switzerland) compared with the total number of activated broadband connections. This is not at all surprising since in Switzerland the growth enjoyed by ADSL in absolute terms is higher than that of cable modems. In the observed period the ADSL market share increased by 3 percentage points.
Figure 69
Trends in DSL retail lines as % of total broadband access lines
62%
63%
97%
98%
77%
94%
76%
94%
89%
60%
56%
57%
79%
65%
72%
96%
44%
48%
65%
57%
43%
58%
69%
82%
63%
80%
64%
62%
62%
96% 99
%
79%
94% 96%
91%
61%
60% 63
%
81%
65%
76%
49%
62%
43% 49
%
59%
75%
67%
82%
67%
99%
68%74
%
45%
0%
10%
20%
30%
40%
50%
60%
70%
80%
90%
100%
BE DK DE EL ES FR IE IT LU NL AT PT FISE UK CY CZ EE HU LV LT MT PL SK SI
EU25 CH
October 2005 October 2006
Data for Austria as of July 2006. Source for Switzerland: Swisscom, Swisscable; OFCOM Switzerland estimations (cable modem services). Note: Leased line, optical fibre, PLC, satellite, WLL, etc. services are not included. Only ADSL and cable modem services are taken into account.
The following chart shows the penetration rate for broadband lines measured as the total number of broadband lines divided by the total population. The broadband penetration rate varies significantly across Member States ranging from 3.3% in Greece to 29.8% in the Netherlands. In October 2006, the penetration rate of broadband access in Switzerland was one of the highest in Europe (26%), and was equal to the penetration rate in Finland. Only Denmark and the Netherlands had higher rates. Nor is it surprising to note that it is primarily the countries with a low population and a relatively high gross domestic product per capita which are in the lead in terms of broadband penetration.
Extrait du 12ème rapport d’implémentation de l’UE étendu à la Suisse - 82
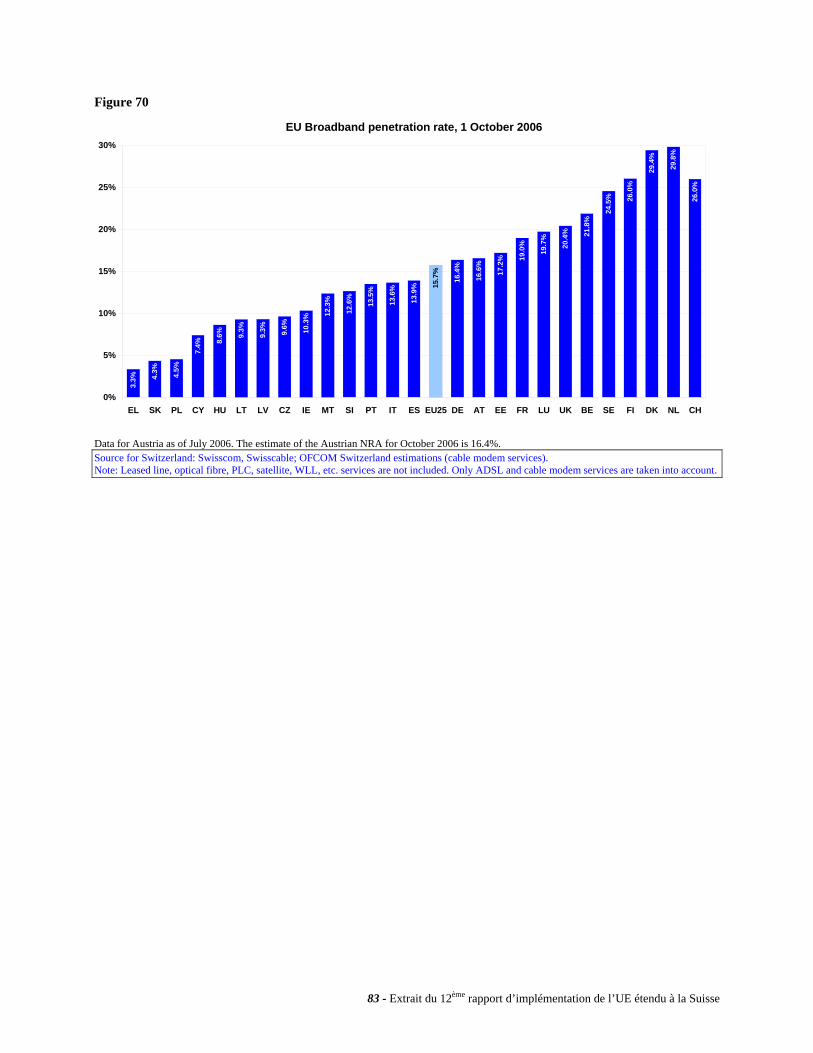
Figure 70
EU Broadband penetration rate, 1 October 20063.
3% 4.3% 4.5%
7.4% 8.
6% 9.3%
9.3% 9.6% 10.3
% 12.3
%
12.6
%
13.5
%
13.6
%
13.9
%
16.4
%
16.6
%
17.2
% 19.0
%
19.7
%
20.4
% 21.8
%
24.5
% 26.0
%
29.4
%
29.8
%
26.0
%
15.7
%
0%
5%
10%
15%
20%
25%
30%
EL SK PL CY HU LT LV CZ IE MT SI PT IT ES EU25 DE AT EE FR LU UK BE SE FI DK NL CH
Data for Austria as of July 2006. The estimate of the Austrian NRA for October 2006 is 16.4%. Source for Switzerland: Swisscom, Swisscable; OFCOM Switzerland estimations (cable modem services). Note: Leased line, optical fibre, PLC, satellite, WLL, etc. services are not included. Only ADSL and cable modem services are taken into account.
83 - Extrait du 12ème rapport d’implémentation de l’UE étendu à la Suisse
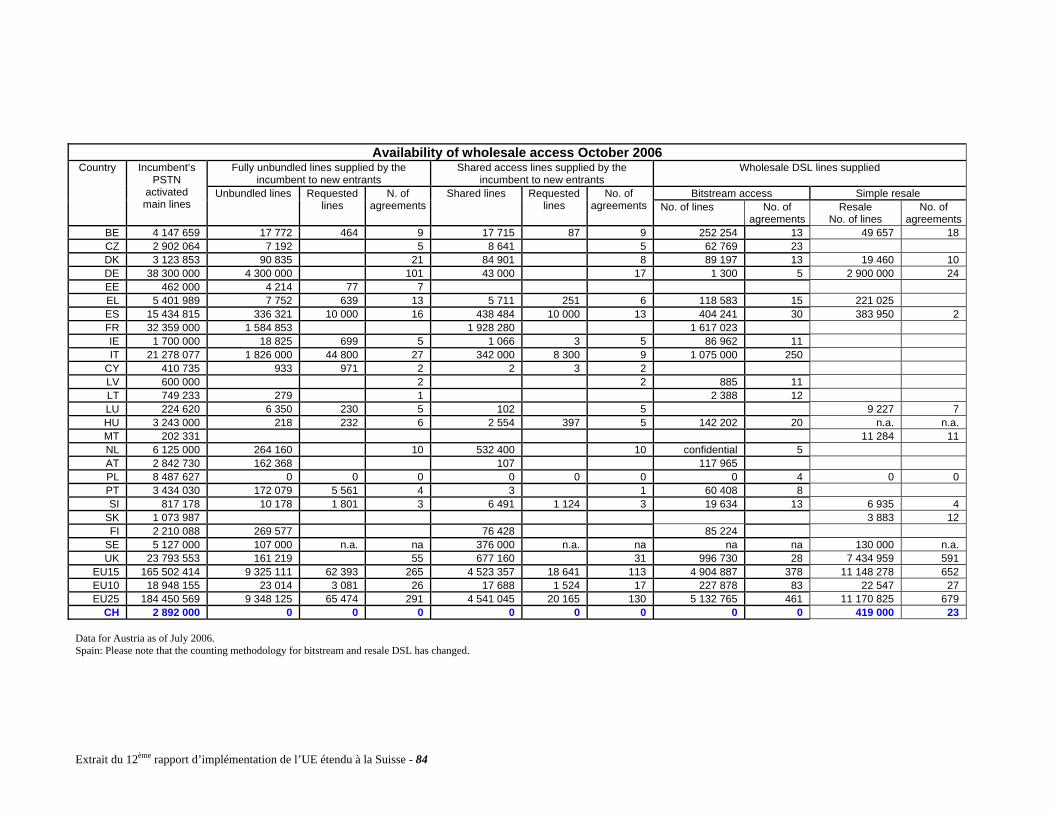
it du 12ème rapport d’implémentation de l’UE étendu à la Suisse - 84
Availability of wholesale access October 2006 Fully unbundled lines supplied by the
incumbent to new entrants Shared access lines supplied by the
incumbent to new entrants Wholesale DSL lines supplied
Bitstream access Simple resale
Country Incumbent’s PSTN
activated main lines
Unbundled lines Requested lines
N. of agreements
Shared lines Requested lines
No. of agreements No. of lines No. of
agreementsResale
No. of lines No. of
agreementsBE 4 147 659 17 772 464 9 17 715 87 9 252 254 13 49 657 18 CZ 2 902 064 7 192 5 8 641 5 62 769 23 DK 3 123 853 90 835 21 84 901 8 89 197 13 19 460 10 DE 38 300 000 4 300 000 101 43 000 17 1 300 5 2 900 000 24 EE 462 000 4 214 77 7 EL 5 401 989 7 752 639 13 5 711 251 6 118 583 15 221 025 ES 15 434 815 336 321 10 000 16 438 484 10 000 13 404 241 30 383 950 2 FR 32 359 000 1 584 853 1 928 280 1 617 023 IE 1 700 000 18 825 699 5 1 066 3 5 86 962 11 IT 21 278 077 1 826 000 44 800 27 342 000 8 300 9 1 075 000 250
CY 410 735 933 971 2 2 3 2 LV 600 000 2 2 885 11 LT 749 233 279 1 2 388 12 LU 224 620 6 350 230 5 102 5 9 227 7 HU 3 243 000 218 232 6 2 554 397 5 142 202 20 n.a. n.a. MT 202 331 11 284 11 NL 6 125 000 264 160 10 532 400 10 confidential 5 AT 2 842 730 162 368 107 117 965 PL 8 487 627 0 0 0 0 0 0 0 4 0 0 PT 3 434 030 172 079 5 561 4 3 1 60 408 8 SI 817 178 10 178 1 801 3 6 491 1 124 3 19 634 13 6 935 4
SK 1 073 987 3 883 12 FI 2 210 088 269 577 76 428 85 224
SE 5 127 000 107 000 n.a. na 376 000 n.a. na na na 130 000 n.a. UK 23 793 553 161 219 55 677 160 31 996 730 28 7 434 959 591
EU15 165 502 414 9 325 111 62 393 265 4 523 357 18 641 113 4 904 887 378 11 148 278 652 EU10 18 948 155 23 014 3 081 26 17 688 1 524 17 227 878 83 22 547 27 EU25 184 450 569 9 348 125 65 474 291 4 541 045 20 165 130 5 132 765 461 11 170 825 679
CH 2 892 000 0 0 0 0 0 0 0 0 419 000 23 Data for Austria as of July 2006. Spain: Please note that the counting methodology for bitstream and resale DSL has changed.
Extra
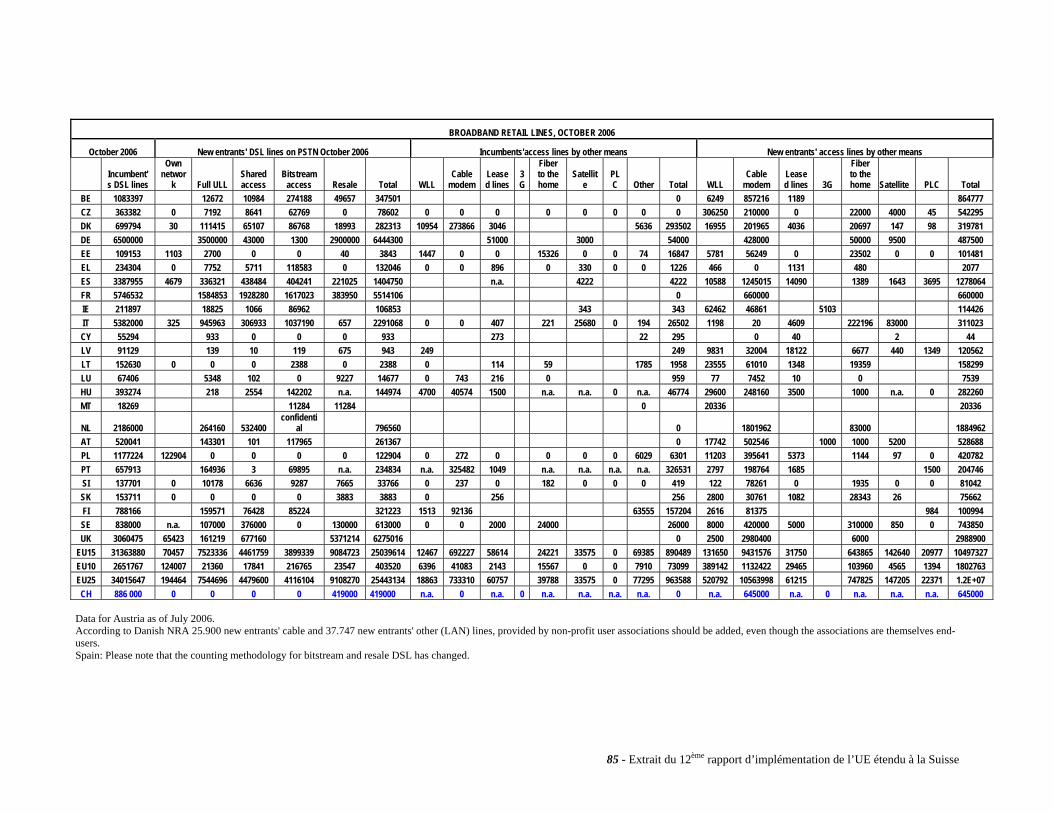
85 - Extrait du 12ème rapport d’implémentation de l’UE étendu à la Suisse
BROADBAND RETAIL LINES, OCTOBER 2006
October 2006 New entrants' DSL lines on PSTN October 2006 Incumbents'access lines by other means New entrants' access lines by other means
Incumbent's DSL lines
Own networ
k Full ULL Shared access
Bitstream access Resale Total WLL
Cable modem
Leased lines
3G
Fiber to the home
Satellite
PLC Other Total WLL
Cable modem
Leased lines 3G
Fiber to the home Satellite PLC Total
BE 1083397 12672 10984 274188 49657 347501 0 6249 857216 1189 864777CZ 363382 0 7192 8641 62769 0 78602 0 0 0 0 0 0 0 0 306250 210000 0 22000 4000 45 542295DK 699794 30 111415 65107 86768 18993 282313 10954 273866 3046 5636 293502 16955 201965 4036 20697 147 98 319781DE 6500000 3500000 43000 1300 2900000 6444300 51000 3000 54000 428000 50000 9500 487500EE 109153 1103 2700 0 0 40 3843 1447 0 0 15326 0 0 74 16847 5781 56249 0 23502 0 0 101481EL 234304 0 7752 5711 118583 0 132046 0 0 896 0 330 0 0 1226 466 0 1131 480 2077ES 3387955 4679 336321 438484 404241 221025 1404750 n.a. 4222 4222 10588 1245015 14090 1389 1643 3695 1278064FR 5746532 1584853 1928280 1617023 383950 5514106 0 660000 660000IE 211897 18825 1066 86962 106853 343 343 62462 46861 5103 114426IT 5382000 325 945963 306933 1037190 657 2291068 0 0 407 221 25680 0 194 26502 1198 20 4609 222196 83000 311023CY 933 0 55294 0 0 933 273 22 295 0 40 2 44LV 91129 139 10 119 675 943 249 249 9831 32004 18122 6677 440 1349 120562LT 152630 0 0 0 2388 0 2388 0 114 59 1785 1958 23555 61010 1348 19359 158299LU 67406 5348 102 0 9227 14677 0 743 216 0 959 77 7452 10 0 7539HU 393274 218 2554 142202 n.a. 144974 4700 40574 1500 n.a. n.a. 0 n.a. 46774 29600 248160 3500 1000 n.a. 0 282260MT 18269 11284 11284 0 20336 20336
NL 2186000 264160 532400confidenti
al 796560 0 1801962 83000 1884962AT 520041 143301 101 117965 261367 0 17742 502546 1000 1000 5200 528688PL 1177224 122904 0 0 0 0 122904 0 272 0 0 0 0 6029 6301 11203 395641 5373 1144 97 0 420782PT 657913 164936 3 69895 n.a. 234834 n.a. 325482 1049 n.a. n.a. n.a. n.a. 326531 2797 198764 1685 1500 204746SI 137701 0 10178 6636 9287 7665 33766 0 237 0 182 0 0 0 419 122 78261 0 1935 0 0 81042SK 153711 0 0 0 0 3883 3883 0 256 256 2800 30761 1082 28343 26 75662FI 788166 159571 76428 85224 321223 1513 92136 63555 157204 2616 81375 984 100994SE 838000 n.a. 107000 376000 0 130000 613000 0 0 2000 24000 26000 8000 420000 5000 310000 850 0 743850UK 3060475 65423 161219 677160 5371214 6275016 0 2500 2980400 6000 2988900
EU15 31363880 70457 7523336 4461759 3899339 9084723 25039614 12467 692227 58614 24221 33575 0 69385 890489 131650 9431576 31750 643865 142640 20977 10497327EU10 2651767 124007 21360 17841 216765 23547 403520 6396 41083 2143 15567 0 0 7910 73099 389142 1132422 29465 103960 4565 1394 1802763EU25 34015647 194464 7544696 4479600 4116104 9108270 25443134 18863 733310 60757 39788 33575 0 77295 963588 520792 10563998 61215 747825 147205 22371 1.2E+07CH 886 000 0 0 0 0 419000 419000 n.a. 0 n.a. 0 n.a. n.a. n.a. n.a. 0 n.a. 645000 n.a. 0 n.a. n.a. n.a. 645000
Data for Austria as of July 2006. According to Danish NRA 25.900 new entrants' cable and 37.747 new entrants' other (LAN) lines, provided by non-profit user associations should be added, even though the associations are themselves end-users. Spain: Please note that the counting methodology for bitstream and resale DSL has changed.
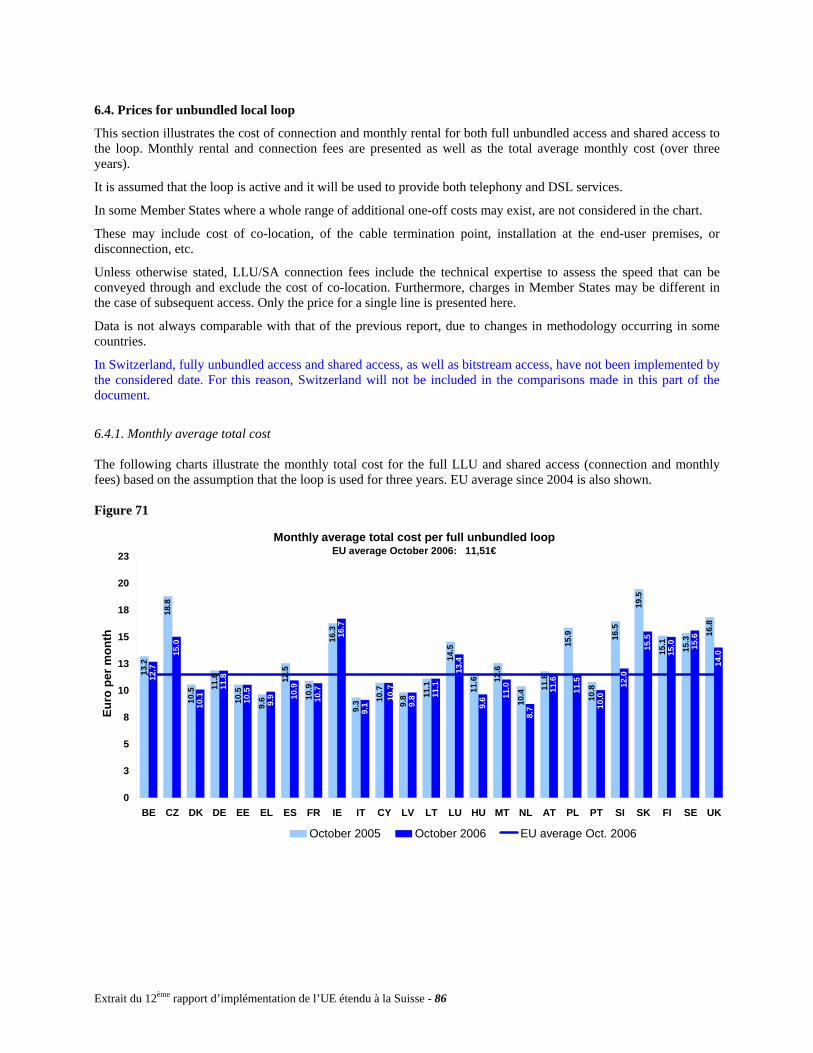
6.4. Prices for unbundled local loop
This section illustrates the cost of connection and monthly rental for both full unbundled access and shared access to the loop. Monthly rental and connection fees are presented as well as the total average monthly cost (over three years).
It is assumed that the loop is active and it will be used to provide both telephony and DSL services.
In some Member States where a whole range of additional one-off costs may exist, are not considered in the chart.
These may include cost of co-location, of the cable termination point, installation at the end-user premises, or disconnection, etc.
Unless otherwise stated, LLU/SA connection fees include the technical expertise to assess the speed that can be conveyed through and exclude the cost of co-location. Furthermore, charges in Member States may be different in the case of subsequent access. Only the price for a single line is presented here.
Data is not always comparable with that of the previous report, due to changes in methodology occurring in some countries.
In Switzerland, fully unbundled access and shared access, as well as bitstream access, have not been implemented by the considered date. For this reason, Switzerland will not be included in the comparisons made in this part of the document.
6.4.1. Monthly average total cost The following charts illustrate the monthly total cost for the full LLU and shared access (connection and monthly fees) based on the assumption that the loop is used for three years. EU average since 2004 is also shown. Figure 71
Monthly average total cost per full unbundled loopEU average October 2006: 11,51€
13.2
18.8
10.5 11
.8
10.5
9.6
12.5
10.9
16.3
9.3 10
.7
9.8 11
.1
14.5
11.6 12
.6
10.4 11
.8
15.9
10.8
16.5
19.5
15.1
15.3
16.8
12.7
15.0
10.1
11.8
10.5
9.9 10
.9
10.7
16.7
9.1 9.
8 11.1
13.4
9.6 11
.0
8.7
11.6
11.5
10.0
12.0
15.5
15.0 15
.6
14.0
10.7
0
3
5
8
10
13
15
18
20
23
BE CZ DK DE EE EL ES FR IE IT CY LV LT LU HU MT NL AT PL PT SI SK FI SE UK
Euro
per
mon
th
October 2005 October 2006 EU average Oct. 2006
Extrait du 12ème rapport d’implémentation de l’UE étendu à la Suisse - 86
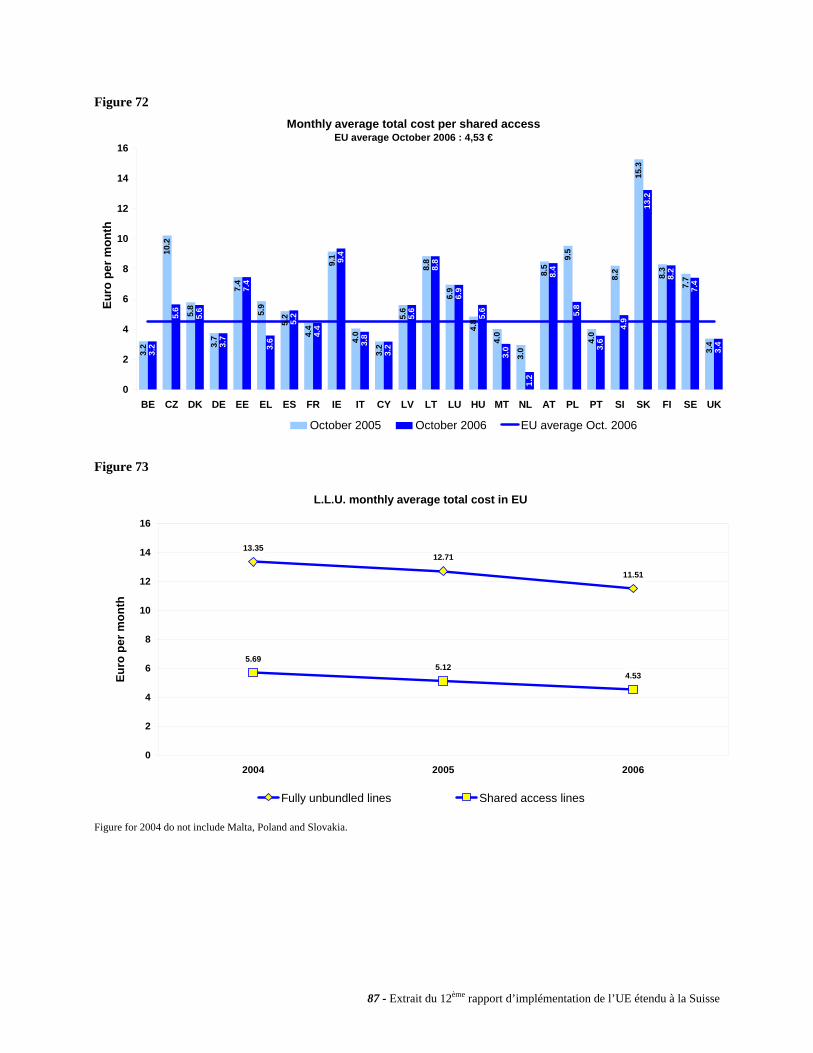
Figure 72 Monthly average total cost per shared access
EU average October 2006 : 4,53 €3.
2
10.2
5.8
3.7
7.4
5.9
5.2
4.4
9.1
4.0
3.2
5.6
8.8
6.9
4.8
4.0
8.5
9.5
4.0
8.2
15.3
7.7
3.4
3.2
5.6
5.6
3.7
7.4
3.6
5.2
4.4
9.4
3.8
3.2
5.6
8.8
6.9
5.6
3.0
1.2
8.4
5.8
3.6
4.9
13.2
8.2
7.4
3.4
3.0
8.3
0
2
4
6
8
10
12
14
16
BE CZ DK DE EE EL ES FR IE IT CY LV LT LU HU MT NL AT PL PT SI SK FI SE UK
Euro
per
mon
th
October 2005 October 2006 EU average Oct. 2006
Figure 73
L.L.U. monthly average total cost in EU
13.3512.71
11.51
5.695.12
4.53
0
2
4
6
8
10
12
14
16
2004 2005 2006
Euro
per
mon
th
Fully unbundled lines Shared access lines
Figure for 2004 do not include Malta, Poland and Slovakia.
87 - Extrait du 12ème rapport d’implémentation de l’UE étendu à la Suisse
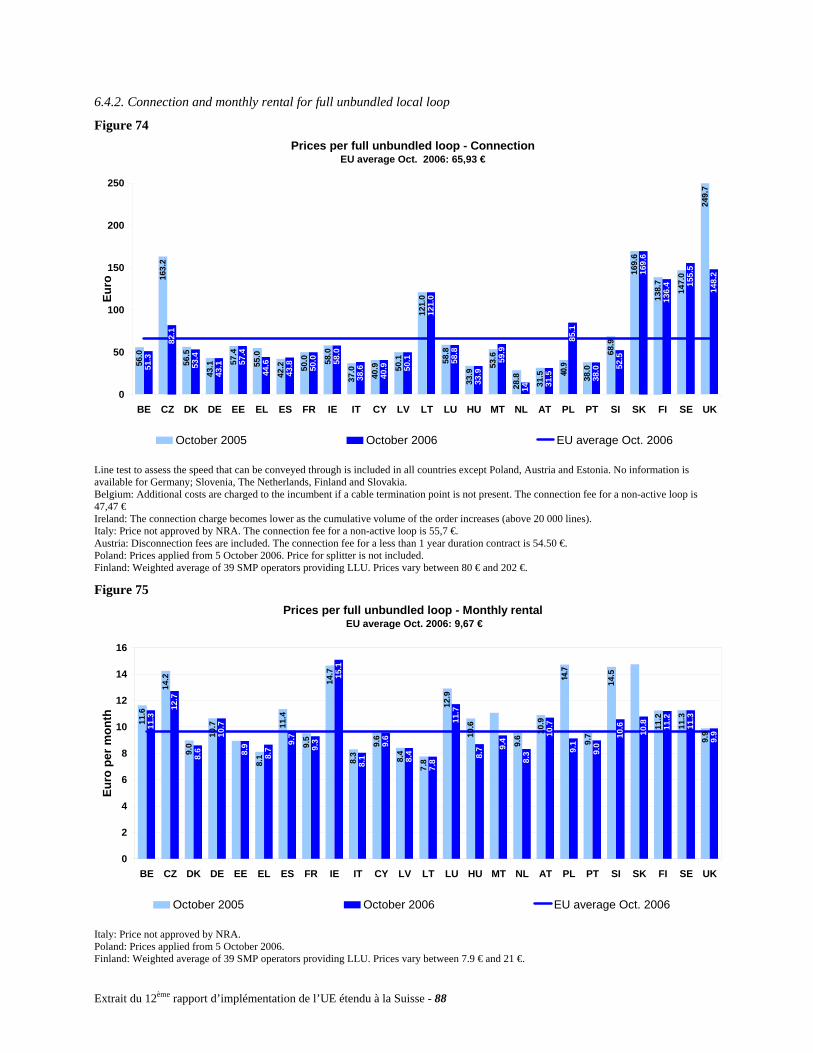
6.4.2. Connection and monthly rental for full unbundled local loop
Figure 74 Prices per full unbundled loop - Connection
EU average Oct. 2006: 65,93 €
56.0
163.
2
56.5
43.1 55
.0
42.2 50
.0 58.0
37.0
40.9 50
.1
121.
0
58.8
33.9
28.8
31.5 38
.0
68.9
138.
7
147.
0
249.
7
82.1
53.4
43.1 57
.4
44.6
43.8 50
.0
38.6
40.9 50
.1
121.
0
58.8
59.9
14.3 31
.5
85.1
38.0 52
.5
169.
6
136.
4 155.
5
148.
2
57.4
53.6
40.9
169.
6
58.0
51.3
33.9
0
50
100
150
200
250
BE CZ DK DE EE EL ES FR IE IT CY LV LT LU HU MT NL AT PL PT SI SK FI SE UK
Euro
October 2005 October 2006 EU average Oct. 2006
Line test to assess the speed that can be conveyed through is included in all countries except Poland, Austria and Estonia. No information is available for Germany; Slovenia, The Netherlands, Finland and Slovakia. Belgium: Additional costs are charged to the incumbent if a cable termination point is not present. The connection fee for a non-active loop is 47,47 € Ireland: The connection charge becomes lower as the cumulative volume of the order increases (above 20 000 lines). Italy: Price not approved by NRA. The connection fee for a non-active loop is 55,7 €. Austria: Disconnection fees are included. The connection fee for a less than 1 year duration contract is 54.50 €. Poland: Prices applied from 5 October 2006. Price for splitter is not included. Finland: Weighted average of 39 SMP operators providing LLU. Prices vary between 80 € and 202 €.
Figure 75 Prices per full unbundled loop - Monthly rental
EU average Oct. 2006: 9,67 €
11.6
14.2
9.0
10.7
8.1
11.4
9.5
14.7
8.3
9.6
8.4
7.8
12.9
10.6
9.6 10
.9
9.7
14.5
11.2
11.3
9.9
12.7
8.6
10.7
8.9
8.7
9.7
9.3
8.1
9.6
8.4
7.8
11.7
9.4
8.3
10.7
9.1
9.0
10.6
10.8 11
.2
11.3
9.9
14.7
8.7
11.3
15.1
0
2
4
6
8
10
12
14
16
BE CZ DK DE EE EL ES FR IE IT CY LV LT LU HU MT NL AT PL PT SI SK FI SE UK
Euro
per
mon
th
October 2005 October 2006 EU average Oct. 2006
Italy: Price not approved by NRA. Poland: Prices applied from 5 October 2006. Finland: Weighted average of 39 SMP operators providing LLU. Prices vary between 7.9 € and 21 €.
Extrait du 12ème rapport d’implémentation de l’UE étendu à la Suisse - 88
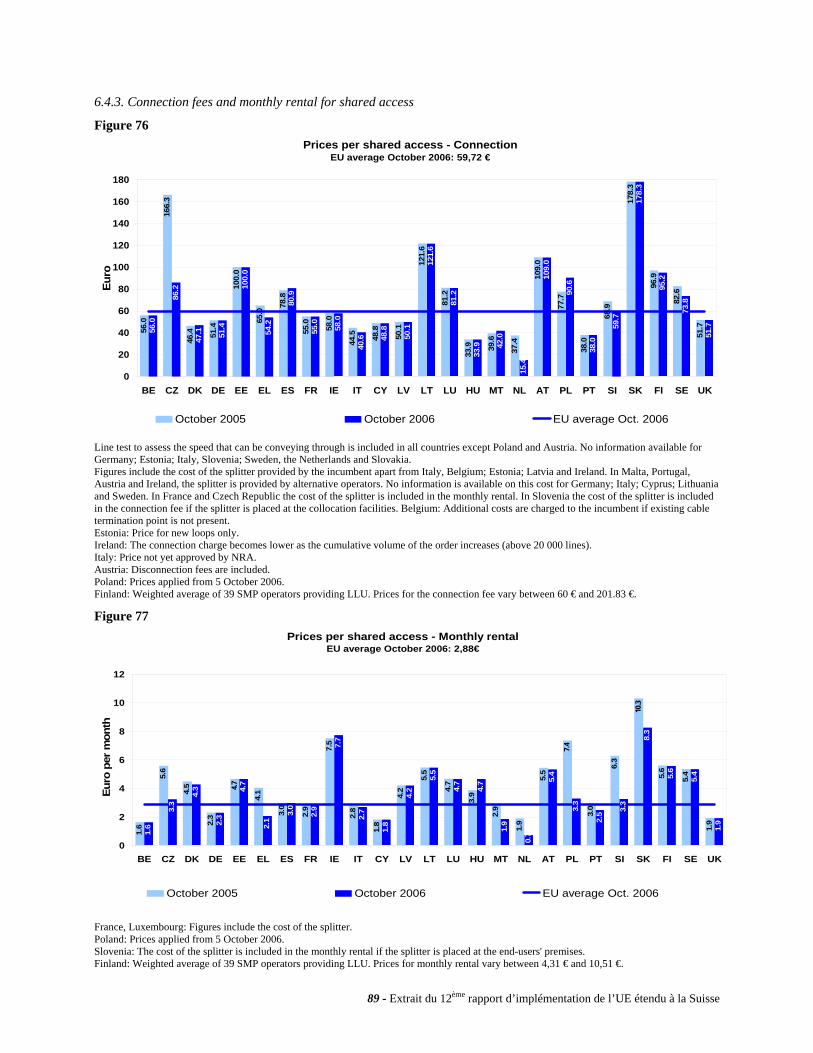
6.4.3. Connection fees and monthly rental for shared access
Figure 76 Prices per shared access - Connection
EU average October 2006: 59,72 €56
.0
166.
3
46.4 51
.4
65.0
78.8
55.0 58.0
44.5 48
.8
50.1
121.
6
81.2
33.9 37.4
109.
0
38.0
68.9
96.9
82.6
51.7
86.2
47.1 51
.4
100.
0
54.2
80.9
55.0
40.6 48
.8
50.1
121.
6
81.2
42.0
15.4
109.
0
90.6
38.0
59.7
178.
3
95.2
73.8
51.7
178.
3
77.7
39.6
100.
0
33.9
56.0
58.0
0
20
40
60
80
100
120
140
160
180
BE CZ DK DE EE EL ES FR IE IT CY LV LT LU HU MT NL AT PL PT SI SK FI SE UK
Euro
October 2005 October 2006 EU average Oct. 2006
Line test to assess the speed that can be conveying through is included in all countries except Poland and Austria. No information available for Germany; Estonia; Italy, Slovenia; Sweden, the Netherlands and Slovakia. Figures include the cost of the splitter provided by the incumbent apart from Italy, Belgium; Estonia; Latvia and Ireland. In Malta, Portugal, Austria and Ireland, the splitter is provided by alternative operators. No information is available on this cost for Germany; Italy; Cyprus; Lithuania and Sweden. In France and Czech Republic the cost of the splitter is included in the monthly rental. In Slovenia the cost of the splitter is included in the connection fee if the splitter is placed at the collocation facilities. Belgium: Additional costs are charged to the incumbent if existing cable termination point is not present. Estonia: Price for new loops only. Ireland: The connection charge becomes lower as the cumulative volume of the order increases (above 20 000 lines). Italy: Price not yet approved by NRA. Austria: Disconnection fees are included. Poland: Prices applied from 5 October 2006. Finland: Weighted average of 39 SMP operators providing LLU. Prices for the connection fee vary between 60 € and 201.83 €.
Figure 77 Prices per shared access - Monthly rental
EU average October 2006: 2,88€
1.6
5.6
4.5
2.3
4.1
3.0
2.9
7.5
2.8
1.8
4.2
5.5
4.7
3.9
1.9
5.5
3.0
6.3
5.6
5.4
1.9
1.6
3.3
4.3
2.3
4.7
2.1
3.0
2.9
2.7
1.8
4.2
5.5
4.7
4.7
1.9
0.7
5.4
3.3
2.5 3.
3
8.3
5.6
5.4
1.9
10.3
7.4
2.9
4.7
7.7
0
2
4
6
8
10
12
BE CZ DK DE EE EL ES FR IE IT CY LV LT LU HU MT NL AT PL PT SI SK FI SE UK
Euro
per
mon
th
October 2005 October 2006 EU average Oct. 2006
France, Luxembourg: Figures include the cost of the splitter. Poland: Prices applied from 5 October 2006. Slovenia: The cost of the splitter is included in the monthly rental if the splitter is placed at the end-users' premises. Finland: Weighted average of 39 SMP operators providing LLU. Prices for monthly rental vary between 4,31 € and 10,51 €.
89 - Extrait du 12ème rapport d’implémentation de l’UE étendu à la Suisse
Extrait du 12ème rapport d’implémentation de l’UE étendu à la Suisse - 90
7. PUBLIC VOICE TELEPHONY TARIFFS
This section examines the charging system, the line rental charges and the main tariffs for public fixed voice telephony charged by the incumbent operators in each Member State in September 2006. The price trend over the past nine years is also analysed.
The incumbent operators are: Belgacom for Belgium, Telefonica O2 for Czech Republic, TDC for Denmark, Deutsche Telekom for Germany, Elion for Estonia, OTE for Greece, Telefonica for Spain, France Telecom for France, Eircom for Ireland, Telecom Italia for Italy, CYTA for Cyprus, Lattelekom for Latvia, Lietuvos Telekomas for Lithuania, P&T Luxembourg for Luxembourg, T-Com for Hungary, Maltacom for Malta, KPN for the Netherlands, Telekom Austria for Austria, Polish Telecom for Poland, Portugal Telecom for Portugal, Telekom Slovenije for Slovenia, Slovak Telecom for Slovakia, TeliaSonera for Finland (formerly Sonera), TeliaSonera for Sweden (formerly Telia), and British Telecom for the United Kingdom. In Switzerland, the historic telecommunications operator is Swisscom.
The incumbent operators still retain a large market share, but new entrants are increasingly gaining market share by offering cheaper prices for certain types of calls (usually long-distance (national) or international) or destination. The prices charged by incumbents do not necessarily, therefore, represent the lowest prices available. A comparison between the rates charged by incumbents and alternative operators for a sample of countries is also shown.
The figures and information are taken from a study carried out for the Commission by Teligen, Harris Interactive UK. The data are collected from primary sources (i.e. directly from the incumbent operators).
NRAs were given the possibility to check these data before finalizing this report. All NRAs, with the exception of Ireland, Italy, Latvia, Slovenia and Poland provided comments and approved these data.
Different sets of charges for fixed national voice telephony services are shown in the following sections:
- the minimum costs for different types of calls (local, long-distance (national), international calls and calls towards mobile networks), depending on the charging system adopted;
- the monthly rental charged by incumbent operators;
- the charges for a composite basket of calls (local, long-distance (national), international fixed calls and calls to mobile), that gives an estimate of the average monthly spending by a typical “European business/residential user” for the whole range (national and international) of calls;
- the charges for a basket of national calls, that gives an estimate of the average monthly spending by a typical “European business/residential user” for fixed national calls;
- the basket of international calls for each country that indicates the average price of a single call from the originating country to all other OECD destinations. In addition, the price of individual calls to specific destinations is also shown.
- the price of some individual calls (3- and 10-minute local, long-distance (national) and international calls) at peak time, inclusive of any initial charge. For those countries where unit-based charging is used, the price of a whole unit is calculated.
For the various types of calls, a benchmark based on a comparison with US and Japan is also included. For the USA, the prices for national calls are those charged by Verizon (in New York City) and the prices for international calls are those charged by AT&T. For Japan, the national call prices are those charged by NTT and the international call prices are those charged by KDD.
The EU average tariffs shown in the charts are weighted average (by population of the Member States).
7.1. Charging system
The billing system for public voice telephony services usually comprises two components: an initial charge applied at the beginning of a call and a charge for the remainder of the call (that may not depend on the type of initial charge used).
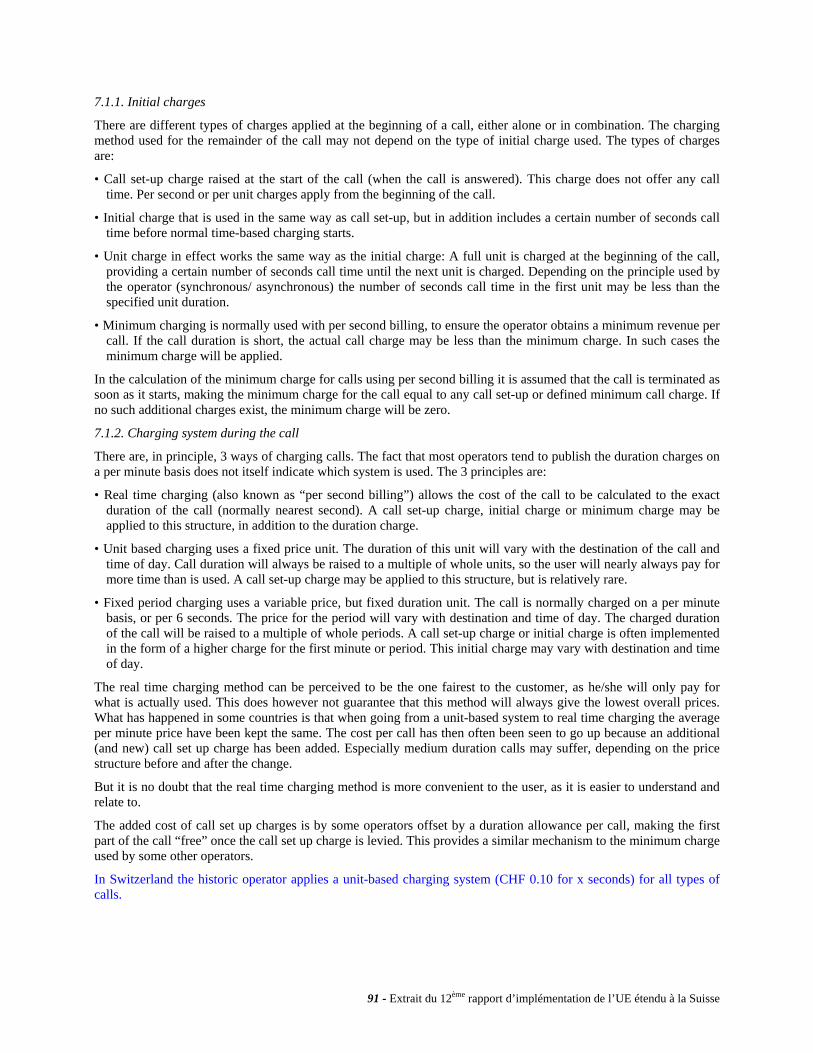
7.1.1. Initial charges
There are different types of charges applied at the beginning of a call, either alone or in combination. The charging method used for the remainder of the call may not depend on the type of initial charge used. The types of charges are:
• Call set-up charge raised at the start of the call (when the call is answered). This charge does not offer any call time. Per second or per unit charges apply from the beginning of the call.
• Initial charge that is used in the same way as call set-up, but in addition includes a certain number of seconds call time before normal time-based charging starts.
• Unit charge in effect works the same way as the initial charge: A full unit is charged at the beginning of the call, providing a certain number of seconds call time until the next unit is charged. Depending on the principle used by the operator (synchronous/ asynchronous) the number of seconds call time in the first unit may be less than the specified unit duration.
• Minimum charging is normally used with per second billing, to ensure the operator obtains a minimum revenue per call. If the call duration is short, the actual call charge may be less than the minimum charge. In such cases the minimum charge will be applied.
In the calculation of the minimum charge for calls using per second billing it is assumed that the call is terminated as soon as it starts, making the minimum charge for the call equal to any call set-up or defined minimum call charge. If no such additional charges exist, the minimum charge will be zero.
7.1.2. Charging system during the call
There are, in principle, 3 ways of charging calls. The fact that most operators tend to publish the duration charges on a per minute basis does not itself indicate which system is used. The 3 principles are:
• Real time charging (also known as “per second billing”) allows the cost of the call to be calculated to the exact duration of the call (normally nearest second). A call set-up charge, initial charge or minimum charge may be applied to this structure, in addition to the duration charge.
• Unit based charging uses a fixed price unit. The duration of this unit will vary with the destination of the call and time of day. Call duration will always be raised to a multiple of whole units, so the user will nearly always pay for more time than is used. A call set-up charge may be applied to this structure, but is relatively rare.
• Fixed period charging uses a variable price, but fixed duration unit. The call is normally charged on a per minute basis, or per 6 seconds. The price for the period will vary with destination and time of day. The charged duration of the call will be raised to a multiple of whole periods. A call set-up charge or initial charge is often implemented in the form of a higher charge for the first minute or period. This initial charge may vary with destination and time of day.
The real time charging method can be perceived to be the one fairest to the customer, as he/she will only pay for what is actually used. This does however not guarantee that this method will always give the lowest overall prices. What has happened in some countries is that when going from a unit-based system to real time charging the average per minute price have been kept the same. The cost per call has then often been seen to go up because an additional (and new) call set up charge has been added. Especially medium duration calls may suffer, depending on the price structure before and after the change.
But it is no doubt that the real time charging method is more convenient to the user, as it is easier to understand and relate to.
The added cost of call set up charges is by some operators offset by a duration allowance per call, making the first part of the call “free” once the call set up charge is levied. This provides a similar mechanism to the minimum charge used by some other operators.
In Switzerland the historic operator applies a unit-based charging system (CHF 0.10 for x seconds) for all types of calls.
91 - Extrait du 12ème rapport d’implémentation de l’UE étendu à la Suisse
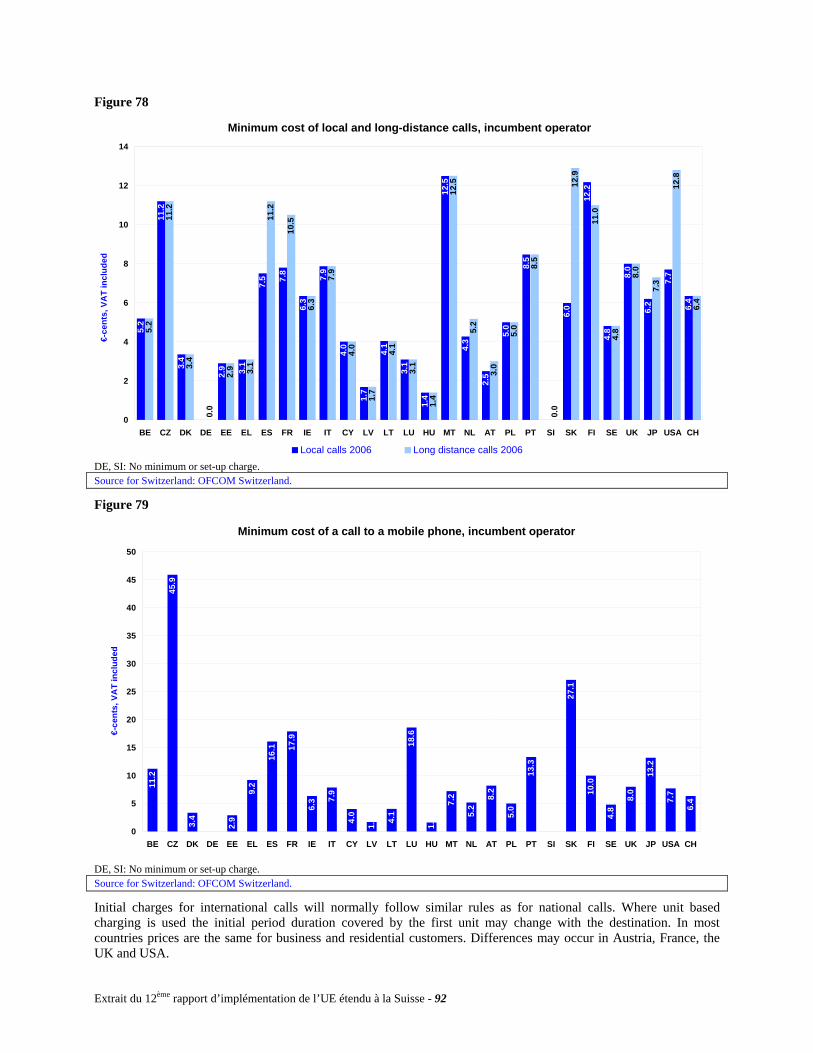
Figure 78
Minimum cost of local and long-distance calls, incumbent operator5.
2
11.2
3.4
2.9 3.1
7.5 7.
8
6.3
7.9
1.7
4.1
3.1
1.4
12.5
4.3
2.5
5.0
8.5
0.0
12.2
4.8
8.0
6.2
7.7
5.2
3.4
0.0
2.9 3.1
11.2
10.5
6.3
7.9
4.0
1.7
4.1
3.1
1.4
12.5
5.2
3.0
5.0
8.5
0.0
11.0
4.8
8.0
7.3
12.8
6.4
6.4
4.0
6.0
11.2
12.9
0
2
4
6
8
10
12
14
BE CZ DK DE EE EL ES FR IE IT CY LV LT LU HU MT NL AT PL PT SI SK FI SE UK JP USA CH
€-ce
nts,
VA
T in
clud
ed
Local calls 2006 Long distance calls 2006
(60)
(60)
DE, SI: No minimum or set-up charge. Source for Switzerland: OFCOM Switzerland.
Figure 79
Minimum cost of a call to a mobile phone, incumbent operator
11.2
9.2
17.9
6.3 7.
9
4.0
4.1
7.2
5.2
8.2
5.0
13.3
10.0
4.8
8.0
13.2
7.7
6.4
18.6
45.9
1.7
16.1
2.93.4
27.1
1.6
0
5
10
15
20
25
30
35
40
45
50
BE CZ DK DE EE EL ES FR IE IT CY LV LT LU HU MT NL AT PL PT SI SK FI SE UK JP USA CH
€-ce
nts,
VA
T in
clud
ed
(60)
(60)
(60)
(60)
(60)
(60)
DE, SI: No minimum or set-up charge. Source for Switzerland: OFCOM Switzerland.
Initial charges for international calls will normally follow similar rules as for national calls. Where unit based charging is used the initial period duration covered by the first unit may change with the destination. In most countries prices are the same for business and residential customers. Differences may occur in Austria, France, the UK and USA.
Extrait du 12ème rapport d’implémentation de l’UE étendu à la Suisse - 92
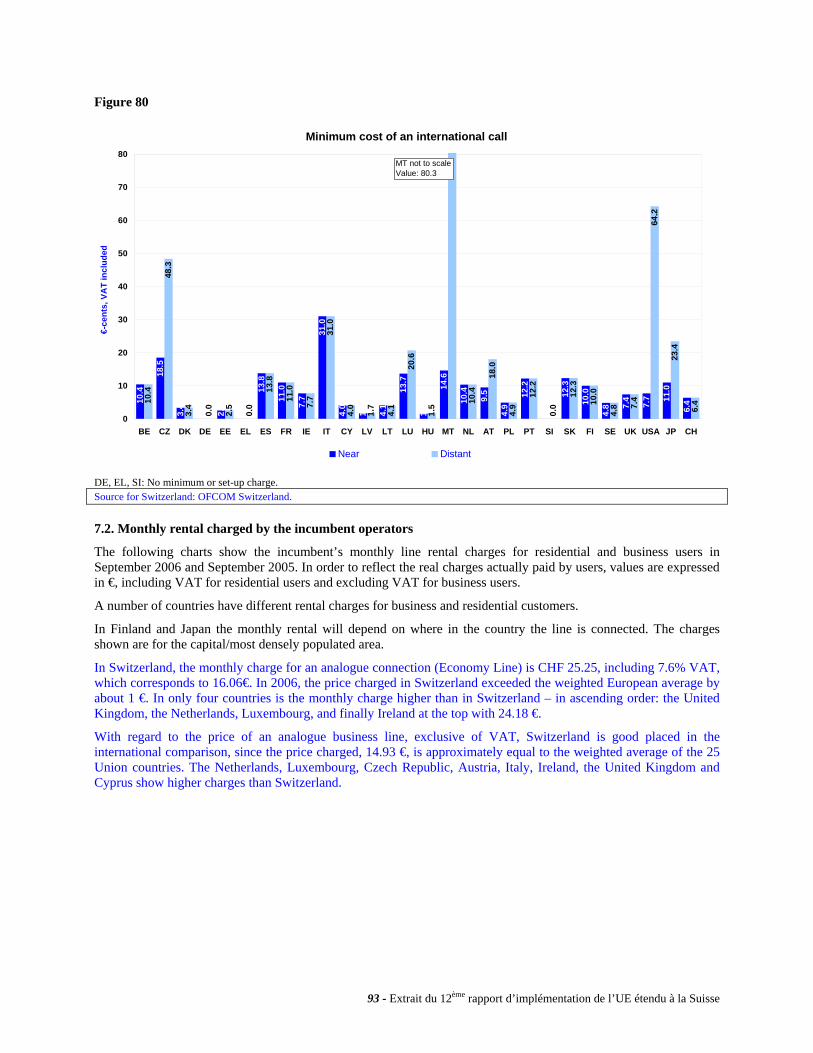
Figure 80
Minimum cost of an international call
14.6
9.5
4.9
12.2
7.7 11
.0
6.410
.4
2.5
0.0
13.8
11.0
7.7
4.0
1.7
4.1
20.6
1.5 10
.4
18.0
4.9
12.2
0.0 10
.0
4.8 7.
4
64.2
23.4
6.4
12.3
7.4
4.810
.0
10.4
11.0
3.4
2.5
13.8
1.710
.4
18.5
31.0
4.0
4.1
13.7
1.57.
7
31.0
0.0
48.3
3.4
12.3
0
10
20
30
40
50
60
70
80
BE CZ DK DE EE EL ES FR IE IT CY LV LT LU HU MT NL AT PL PT SI SK FI SE UK USA JP CH
€-ce
nts,
VA
T in
clud
ed
Near Distant
MT not to scaleValue: 80.3
DE, EL, SI: No minimum or set-up charge. Source for Switzerland: OFCOM Switzerland.
7.2. Monthly rental charged by the incumbent operators
The following charts show the incumbent’s monthly line rental charges for residential and business users in September 2006 and September 2005. In order to reflect the real charges actually paid by users, values are expressed in €, including VAT for residential users and excluding VAT for business users.
A number of countries have different rental charges for business and residential customers.
In Finland and Japan the monthly rental will depend on where in the country the line is connected. The charges shown are for the capital/most densely populated area.
In Switzerland, the monthly charge for an analogue connection (Economy Line) is CHF 25.25, including 7.6% VAT, which corresponds to 16.06€. In 2006, the price charged in Switzerland exceeded the weighted European average by about 1 €. In only four countries is the monthly charge higher than in Switzerland – in ascending order: the United Kingdom, the Netherlands, Luxembourg, and finally Ireland at the top with 24.18 €.
With regard to the price of an analogue business line, exclusive of VAT, Switzerland is good placed in the international comparison, since the price charged, 14.93 €, is approximately equal to the weighted average of the 25 Union countries. The Netherlands, Luxembourg, Czech Republic, Austria, Italy, Ireland, the United Kingdom and Cyprus show higher charges than Switzerland.
93 - Extrait du 12ème rapport d’implémentation de l’UE étendu à la Suisse

Figure 81
Residential monthly rental17
.15
11.6
2
15.9
5
15.9
5
5.89
14.1
6
15.2
8
12.9
5
5.07
6.66
18.4
0
12.1
3
5.96
18.1
6
15.9
8
12.5
3
15.3
2
10.7
0
7.84
11.7
7
13.3
7
15.5
7
6.81
12.4
4
16.0
6
17.1
5
14.2
5 15.9
5
14.7
6
13.9
5
6.66
18.4
0
12.1
3
5.96
18.1
6
15.9
8
12.5
3
15.3
2
10.7
0
7.84
11.7
7 13.3
7
16.3
1
8.44
12.4
4
16.0
6
13.9
9
24.1
8
14.5
7
15.9
5
5.89
15.5
8
5.07
15.0
0
24.1
8
14.5
7
0
5
10
15
20
25
30
BE CZ DK DE EE EL ES FR IE IT CY LV LT LU HU MT NL AT PL PT SI SK FI SE UK USA JP CH
€, V
AT
incl
uded
Sep 2005 Sep 2006 EU 25 Sep 2006
Source for Switzerland: OFCOM Switzerland.
Figure 82
Business monthly rental
14.1
7
17.4
9
12.7
6
13.7
5
6.11
11.9
0
13.1
7
12.1
3
8.60
6.87
16.0
0
12.5
2
13.1
5
15.2
6
18.9
0
10.0
2
12.9
8
8.92
9.24
10.1
0
12.4
1
20.3
5
13.1
1
16.6
3
14.9
3
14.1
7 17.4
9
13.7
5
12.4
0
34.9
2
6.87
16.0
0
10.5
8 13.1
5 15.2
6
18.9
0
10.0
2 13.3
5
8.92 9.24
10.1
0 12.4
1
20.3
5
12.4
7
16.6
3
14.9
3
13.1
0
19.9
8
15.2
5
12.7
6
6.11
13.4
3
8.60
12.5
4
19.9
8
19.2
0
0
5
10
15
20
25
30
35
40
BE CZ DK DE EE EL ES FR IE IT CY LV LT LU HU MT NL AT PL PT SI SK FI SE UK USA JP CH
€, V
AT
excl
uded
Sep 2005 Sep 2006 EU 25 Sep 2006 Source for Switzerland: OFCOM Switzerland.
The following charts show the EU weighted average variation in nominal terms of the residential and business monthly line rental charge. Averages for EU25 and EU15 are presented.
The same charts have been produced for Switzerland. Since the liberalisation of the telecommunications market, which generally took place in 1998, line prices have gradually increased in the European Union countries. This phenomenon is known as tariff re-adjustment. Its origin lies in the fact that lines were subsidised most of the time by revenue from calls. However, what was possible, or even desirable, in a monopoly is no longer so in a market which
Extrait du 12ème rapport d’implémentation de l’UE étendu à la Suisse - 94
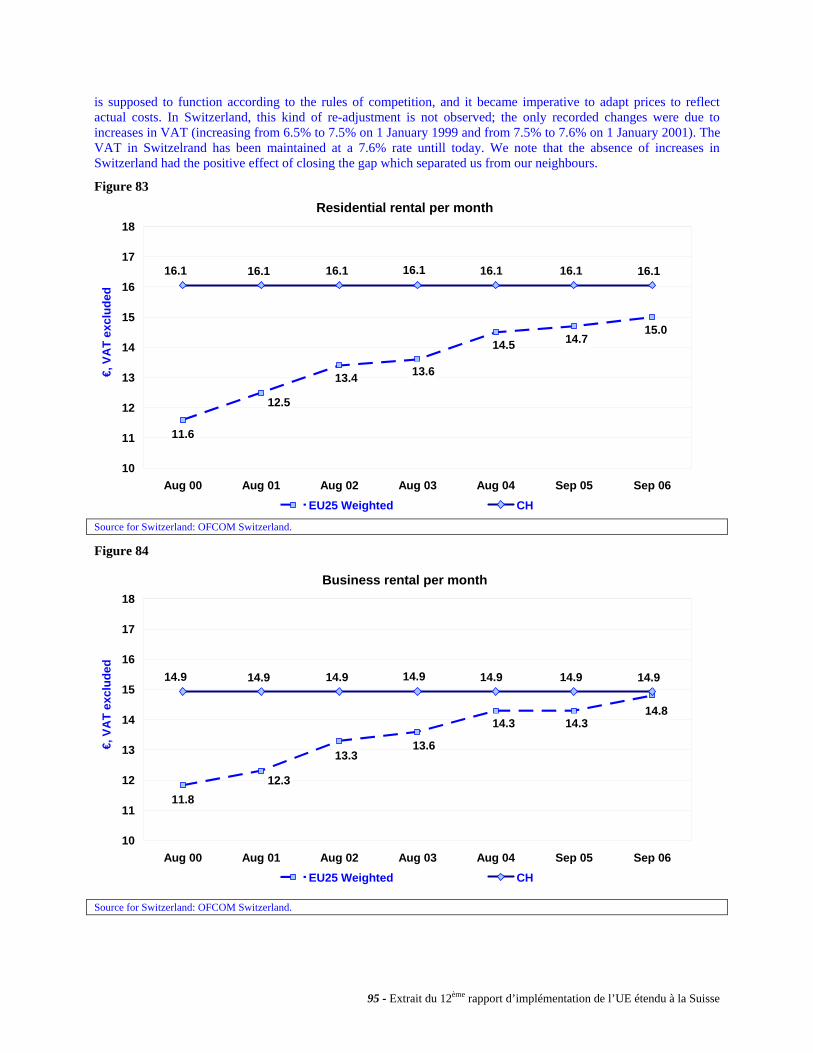
is supposed to function according to the rules of competition, and it became imperative to adapt prices to reflect actual costs. In Switzerland, this kind of re-adjustment is not observed; the only recorded changes were due to increases in VAT (increasing from 6.5% to 7.5% on 1 January 1999 and from 7.5% to 7.6% on 1 January 2001). The VAT in Switzelrand has been maintained at a 7.6% rate untill today. We note that the absence of increases in Switzerland had the positive effect of closing the gap which separated us from our neighbours.
Figure 83 Residential rental per month
15.014.714.5
11.6
13.613.4
12.5
16.116.116.1 16.1 16.1 16.116.1
10
11
12
13
14
15
16
17
18
Aug 00 Aug 01 Aug 02 Aug 03 Aug 04 Sep 05 Sep 06
€, V
AT
excl
uded
EU25 Weighted CH Source for Switzerland: OFCOM Switzerland.
Figure 84
Business rental per month
14.814.314.3
11.8
13.613.3
12.3
14.914.914.9 14.9 14.9 14.914.9
10
11
12
13
14
15
16
17
18
Aug 00 Aug 01 Aug 02 Aug 03 Aug 04 Sep 05 Sep 06
€, V
AT
excl
uded
EU25 Weighted CH Source for Switzerland: OFCOM Switzerland.
95 - Extrait du 12ème rapport d’implémentation de l’UE étendu à la Suisse
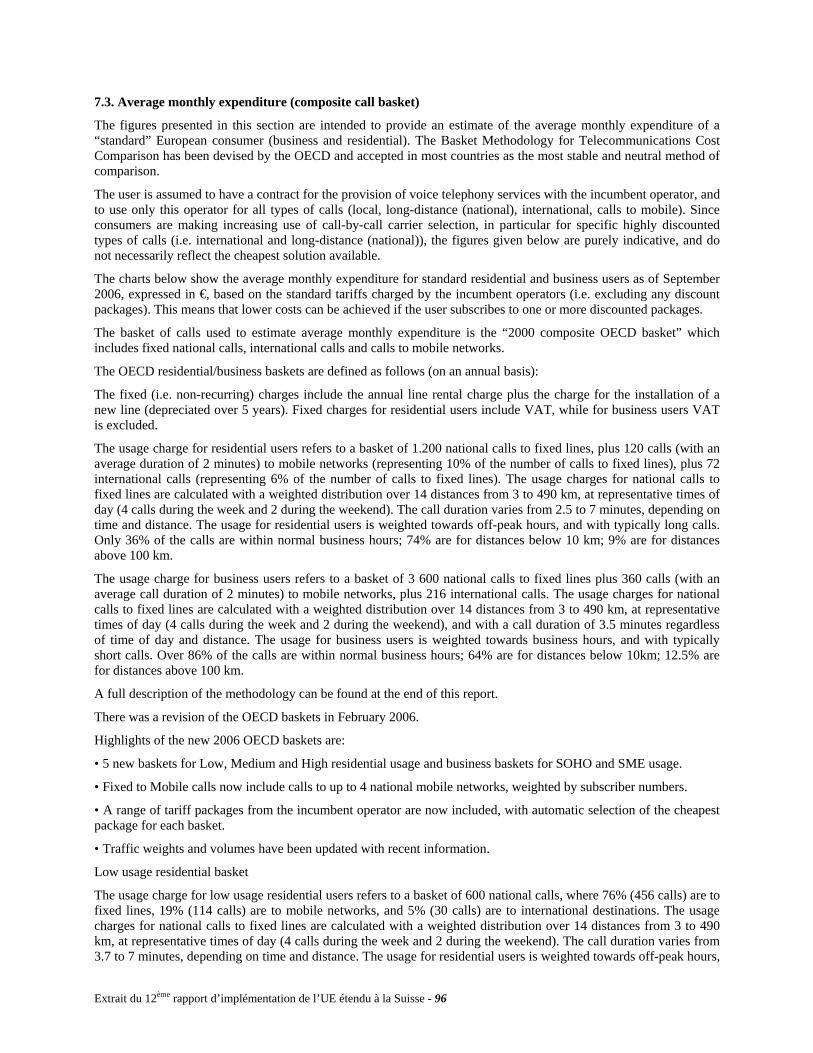
7.3. Average monthly expenditure (composite call basket) The figures presented in this section are intended to provide an estimate of the average monthly expenditure of a “standard” European consumer (business and residential). The Basket Methodology for Telecommunications Cost Comparison has been devised by the OECD and accepted in most countries as the most stable and neutral method of comparison.
The user is assumed to have a contract for the provision of voice telephony services with the incumbent operator, and to use only this operator for all types of calls (local, long-distance (national), international, calls to mobile). Since consumers are making increasing use of call-by-call carrier selection, in particular for specific highly discounted types of calls (i.e. international and long-distance (national)), the figures given below are purely indicative, and do not necessarily reflect the cheapest solution available.
The charts below show the average monthly expenditure for standard residential and business users as of September 2006, expressed in €, based on the standard tariffs charged by the incumbent operators (i.e. excluding any discount packages). This means that lower costs can be achieved if the user subscribes to one or more discounted packages.
The basket of calls used to estimate average monthly expenditure is the “2000 composite OECD basket” which includes fixed national calls, international calls and calls to mobile networks.
The OECD residential/business baskets are defined as follows (on an annual basis):
The fixed (i.e. non-recurring) charges include the annual line rental charge plus the charge for the installation of a new line (depreciated over 5 years). Fixed charges for residential users include VAT, while for business users VAT is excluded.
The usage charge for residential users refers to a basket of 1.200 national calls to fixed lines, plus 120 calls (with an average duration of 2 minutes) to mobile networks (representing 10% of the number of calls to fixed lines), plus 72 international calls (representing 6% of the number of calls to fixed lines). The usage charges for national calls to fixed lines are calculated with a weighted distribution over 14 distances from 3 to 490 km, at representative times of day (4 calls during the week and 2 during the weekend). The call duration varies from 2.5 to 7 minutes, depending on time and distance. The usage for residential users is weighted towards off-peak hours, and with typically long calls. Only 36% of the calls are within normal business hours; 74% are for distances below 10 km; 9% are for distances above 100 km.
The usage charge for business users refers to a basket of 3 600 national calls to fixed lines plus 360 calls (with an average call duration of 2 minutes) to mobile networks, plus 216 international calls. The usage charges for national calls to fixed lines are calculated with a weighted distribution over 14 distances from 3 to 490 km, at representative times of day (4 calls during the week and 2 during the weekend), and with a call duration of 3.5 minutes regardless of time of day and distance. The usage for business users is weighted towards business hours, and with typically short calls. Over 86% of the calls are within normal business hours; 64% are for distances below 10km; 12.5% are for distances above 100 km.
A full description of the methodology can be found at the end of this report.
There was a revision of the OECD baskets in February 2006.
Highlights of the new 2006 OECD baskets are:
• 5 new baskets for Low, Medium and High residential usage and business baskets for SOHO and SME usage.
• Fixed to Mobile calls now include calls to up to 4 national mobile networks, weighted by subscriber numbers.
• A range of tariff packages from the incumbent operator are now included, with automatic selection of the cheapest package for each basket.
• Traffic weights and volumes have been updated with recent information.
Low usage residential basket
The usage charge for low usage residential users refers to a basket of 600 national calls, where 76% (456 calls) are to fixed lines, 19% (114 calls) are to mobile networks, and 5% (30 calls) are to international destinations. The usage charges for national calls to fixed lines are calculated with a weighted distribution over 14 distances from 3 to 490 km, at representative times of day (4 calls during the week and 2 during the weekend). The call duration varies from 3.7 to 7 minutes, depending on time and distance. The usage for residential users is weighted towards off-peak hours,
Extrait du 12ème rapport d’implémentation de l’UE étendu à la Suisse - 96
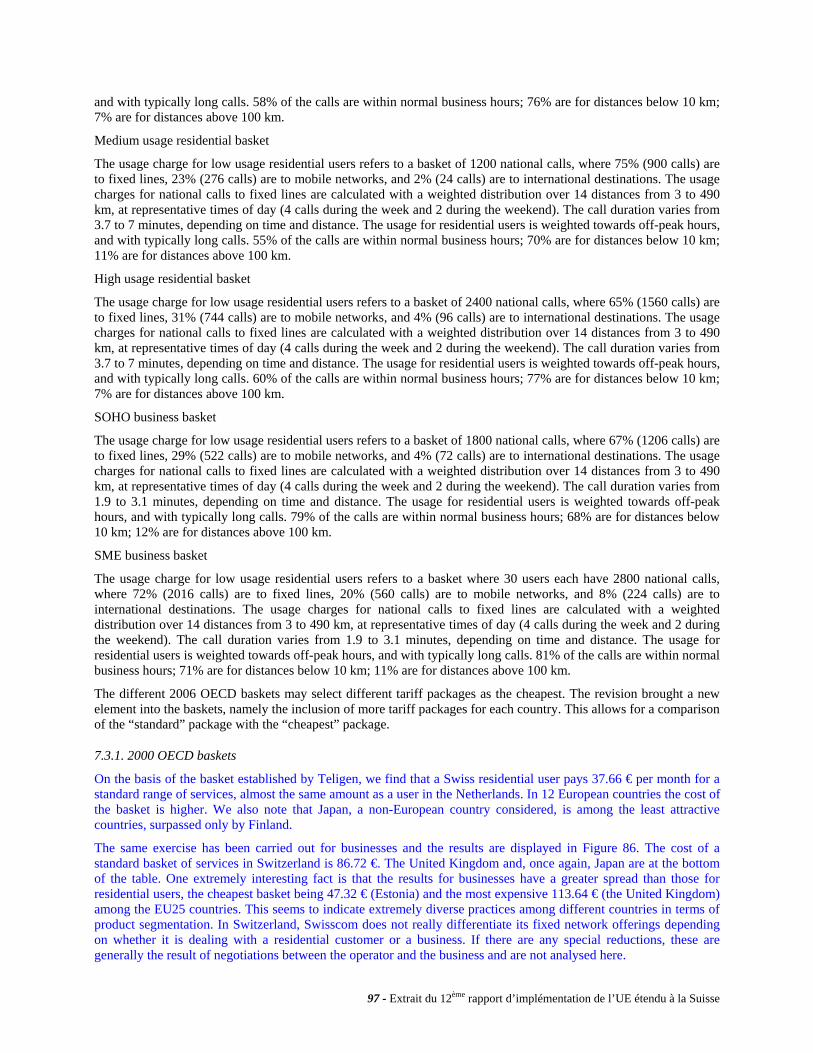
and with typically long calls. 58% of the calls are within normal business hours; 76% are for distances below 10 km; 7% are for distances above 100 km.
Medium usage residential basket
The usage charge for low usage residential users refers to a basket of 1200 national calls, where 75% (900 calls) are to fixed lines, 23% (276 calls) are to mobile networks, and 2% (24 calls) are to international destinations. The usage charges for national calls to fixed lines are calculated with a weighted distribution over 14 distances from 3 to 490 km, at representative times of day (4 calls during the week and 2 during the weekend). The call duration varies from 3.7 to 7 minutes, depending on time and distance. The usage for residential users is weighted towards off-peak hours, and with typically long calls. 55% of the calls are within normal business hours; 70% are for distances below 10 km; 11% are for distances above 100 km.
High usage residential basket
The usage charge for low usage residential users refers to a basket of 2400 national calls, where 65% (1560 calls) are to fixed lines, 31% (744 calls) are to mobile networks, and 4% (96 calls) are to international destinations. The usage charges for national calls to fixed lines are calculated with a weighted distribution over 14 distances from 3 to 490 km, at representative times of day (4 calls during the week and 2 during the weekend). The call duration varies from 3.7 to 7 minutes, depending on time and distance. The usage for residential users is weighted towards off-peak hours, and with typically long calls. 60% of the calls are within normal business hours; 77% are for distances below 10 km; 7% are for distances above 100 km.
SOHO business basket
The usage charge for low usage residential users refers to a basket of 1800 national calls, where 67% (1206 calls) are to fixed lines, 29% (522 calls) are to mobile networks, and 4% (72 calls) are to international destinations. The usage charges for national calls to fixed lines are calculated with a weighted distribution over 14 distances from 3 to 490 km, at representative times of day (4 calls during the week and 2 during the weekend). The call duration varies from 1.9 to 3.1 minutes, depending on time and distance. The usage for residential users is weighted towards off-peak hours, and with typically long calls. 79% of the calls are within normal business hours; 68% are for distances below 10 km; 12% are for distances above 100 km.
SME business basket
The usage charge for low usage residential users refers to a basket where 30 users each have 2800 national calls, where 72% (2016 calls) are to fixed lines, 20% (560 calls) are to mobile networks, and 8% (224 calls) are to international destinations. The usage charges for national calls to fixed lines are calculated with a weighted distribution over 14 distances from 3 to 490 km, at representative times of day (4 calls during the week and 2 during the weekend). The call duration varies from 1.9 to 3.1 minutes, depending on time and distance. The usage for residential users is weighted towards off-peak hours, and with typically long calls. 81% of the calls are within normal business hours; 71% are for distances below 10 km; 11% are for distances above 100 km.
The different 2006 OECD baskets may select different tariff packages as the cheapest. The revision brought a new element into the baskets, namely the inclusion of more tariff packages for each country. This allows for a comparison of the “standard” package with the “cheapest” package.
7.3.1. 2000 OECD baskets
On the basis of the basket established by Teligen, we find that a Swiss residential user pays 37.66 € per month for a standard range of services, almost the same amount as a user in the Netherlands. In 12 European countries the cost of the basket is higher. We also note that Japan, a non-European country considered, is among the least attractive countries, surpassed only by Finland.
The same exercise has been carried out for businesses and the results are displayed in Figure 86. The cost of a standard basket of services in Switzerland is 86.72 €. The United Kingdom and, once again, Japan are at the bottom of the table. One extremely interesting fact is that the results for businesses have a greater spread than those for residential users, the cheapest basket being 47.32 € (Estonia) and the most expensive 113.64 € (the United Kingdom) among the EU25 countries. This seems to indicate extremely diverse practices among different countries in terms of product segmentation. In Switzerland, Swisscom does not really differentiate its fixed network offerings depending on whether it is dealing with a residential customer or a business. If there are any special reductions, these are generally the result of negotiations between the operator and the business and are not analysed here.
97 - Extrait du 12ème rapport d’implémentation de l’UE étendu à la Suisse
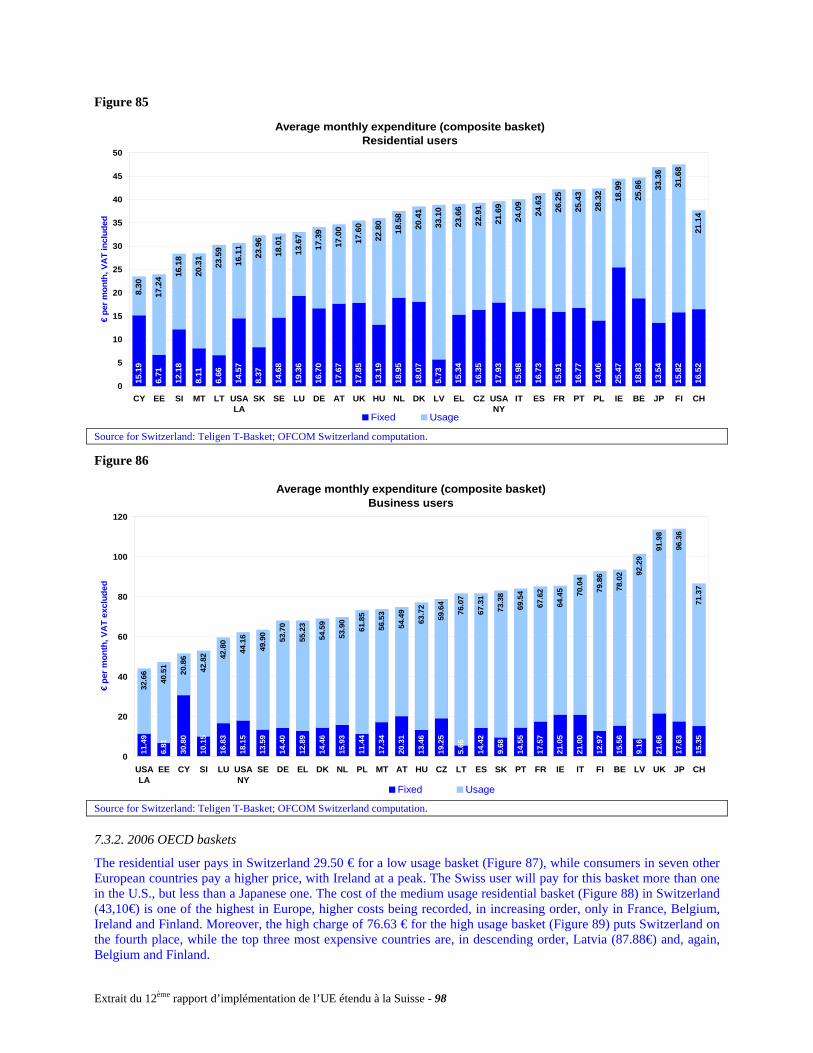
Figure 85
Average monthly expenditure (composite basket)Residential users
15.1
9
6.71
12.1
8
8.11
6.66
14.5
7
8.37
14.6
8
19.3
6
16.7
0
17.6
7
17.8
5
13.1
9
18.9
5
18.0
7
5.73
15.3
4
16.3
5
17.9
3
15.9
8
16.7
3
15.9
1
16.7
7
14.0
6
25.4
7
18.8
3
13.5
4
15.8
2
16.5
2
8.30
17.2
4 16.1
8
20.3
1
23.5
9
16.1
1
23.9
6
18.0
1
13.6
7
17.3
9
17.0
0
17.6
0
22.8
0
18.5
8
20.4
1
33.1
0
23.6
6
22.9
1
21.6
9
24.0
9
24.6
3
26.2
5
25.4
3
28.3
2
18.9
9
25.8
6 33.3
6
31.6
8
21.1
4
0
5
10
15
20
25
30
35
40
45
50
CY EE SI MT LT USALA
SK SE LU DE AT UK HU NL DK LV EL CZ USANY
IT ES FR PT PL IE BE JP FI CH
€ pe
r mon
th, V
AT
incl
uded
Fixed Usage Source for Switzerland: Teligen T-Basket; OFCOM Switzerland computation.
Figure 86
Average monthly expenditure (composite basket)Business users
11.4
9
30.8
0
10.1
5
16.8
3
18.1
5
13.5
9
14.4
0
12.8
9
14.4
6
15.9
3
11.4
4
17.3
4
20.3
1
13.4
6
19.2
5
5.66
14.4
2
9.68
14.5
5
17.5
7
21.0
5
21.0
0
12.9
7
15.5
6
9.16
21.6
6
17.6
3
15.3
5
20.8
6
42.8
2 42.8
0
44.1
6
49.9
0
53.7
0
55.2
3
54.5
9
53.9
0
61.8
5
56.5
3
54.4
9
63.7
2
59.6
4
76.0
7
67.3
1
73.3
8
69.5
4
67.6
2
64.4
5 70.0
4
79.8
6
78.0
2 92.2
9
91.9
8
96.3
6
71.3
7
6.81
40.5
1
32.6
6
0
20
40
60
80
100
120
USALA
EE CY SI LU USANY
SE DE EL DK NL PL MT AT HU CZ LT ES SK PT FR IE IT FI BE LV UK JP CH
€ pe
r mon
th, V
AT
excl
uded
Fixed Usage Source for Switzerland: Teligen T-Basket; OFCOM Switzerland computation. 7.3.2. 2006 OECD baskets
The residential user pays in Switzerland 29.50 € for a low usage basket (Figure 87), while consumers in seven other European countries pay a higher price, with Ireland at a peak. The Swiss user will pay for this basket more than one in the U.S., but less than a Japanese one. The cost of the medium usage residential basket (Figure 88) in Switzerland (43,10€) is one of the highest in Europe, higher costs being recorded, in increasing order, only in France, Belgium, Ireland and Finland. Moreover, the high charge of 76.63 € for the high usage basket (Figure 89) puts Switzerland on the fourth place, while the top three most expensive countries are, in descending order, Latvia (87.88€) and, again, Belgium and Finland.
Extrait du 12ème rapport d’implémentation de l’UE étendu à la Suisse - 98
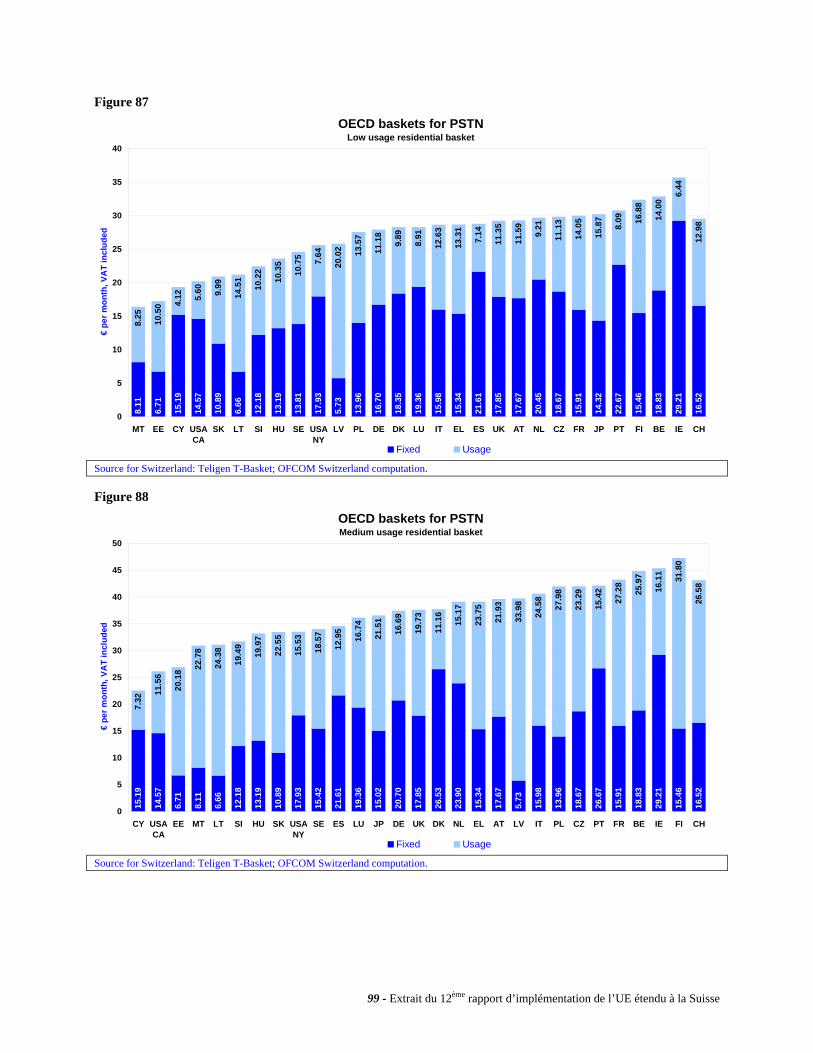
Figure 87 OECD baskets for PSTN
Low usage residential basket8.
11
15.1
9
14.5
7
10.8
9
6.66
12.1
8
13.1
9
13.8
1
17.9
3
5.73
13.9
6
16.7
0
18.3
5
19.3
6
15.9
8
15.3
4
21.6
1
17.8
5
17.6
7
20.4
5
18.6
7
15.9
1
14.3
2
22.6
7
15.4
6
18.8
3
29.2
1
16.5
2
4.12 5.
60 9.99
14.5
1
10.2
2
10.3
5
10.7
5 7.64
20.0
2 13.5
7
11.1
8
9.89
8.91
12.6
3
13.3
1
7.14
11.3
5
11.5
9
9.21
11.1
3
14.0
5
15.8
7
8.09 16
.88
14.0
0
6.44
12.9
8
6.71
8.25
10.5
0
0
5
10
15
20
25
30
35
40
MT EE CY USACA
SK LT SI HU SE USANY
LV PL DE DK LU IT EL ES UK AT NL CZ FR JP PT FI BE IE CH
€ pe
r mon
th, V
AT
incl
uded
Fixed Usage Source for Switzerland: Teligen T-Basket; OFCOM Switzerland computation. Figure 88
OECD baskets for PSTNMedium usage residential basket
15.1
9
6.71
8.11
6.66
12.1
8
13.1
9
10.8
9
17.9
3
15.4
2
21.6
1
19.3
6
15.0
2
20.7
0
17.8
5
26.5
3
23.9
0
15.3
4
17.6
7
5.73
15.9
8
13.9
6
18.6
7
26.6
7
15.9
1
18.8
3
29.2
1
15.4
6
16.5
2
20.1
8 22.7
8
24.3
8
19.4
9
19.9
7
22.5
5
15.5
3
18.5
7
12.9
5
16.7
4
21.5
1
16.6
9
19.7
3
11.1
6
15.1
7
23.7
5
21.9
3
33.9
8
24.5
8
27.9
8
23.2
9
15.4
2
27.2
8
25.9
7
16.1
1
31.8
0
26.5
8
14.5
7
7.32
11.5
6
0
5
10
15
20
25
30
35
40
45
50
CY USACA
EE MT LT SI HU SK USANY
SE ES LU JP DE UK DK NL EL AT LV IT PL CZ PT FR BE IE FI CH
€ pe
r mon
th, V
AT
incl
uded
Fixed Usage Source for Switzerland: Teligen T-Basket; OFCOM Switzerland computation.
99 - Extrait du 12ème rapport d’implémentation de l’UE étendu à la Suisse
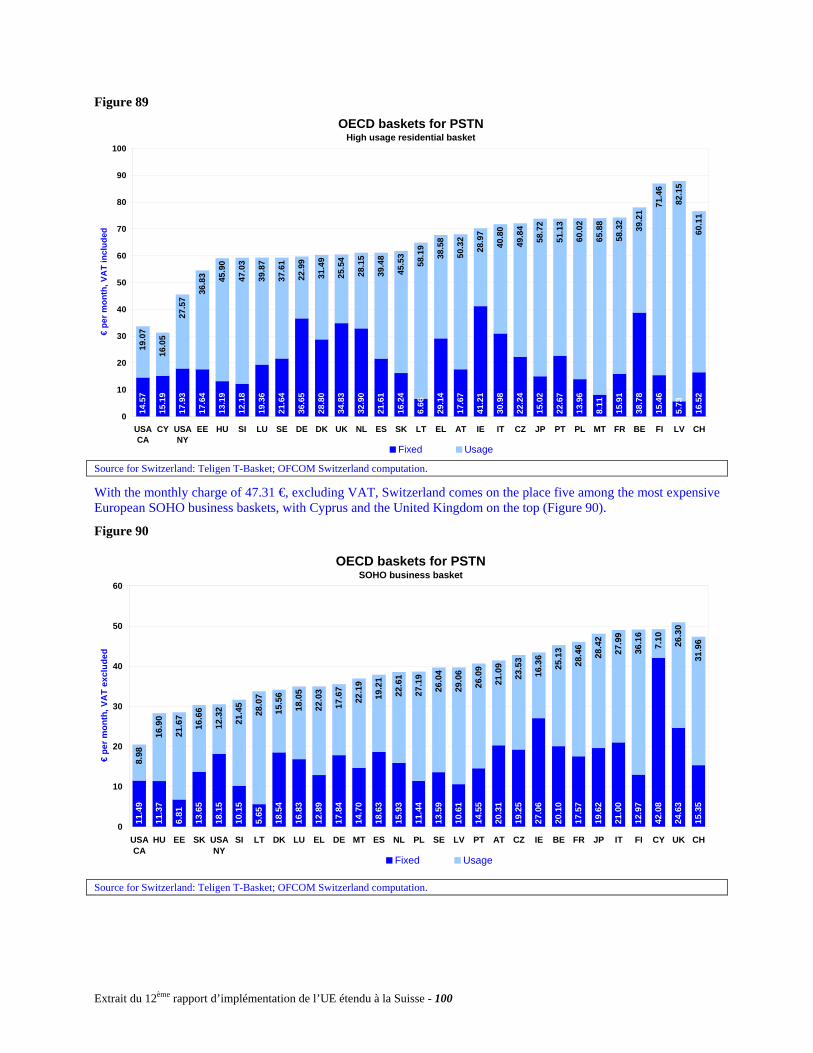
Figure 89 OECD baskets for PSTN
High usage residential basket14
.57
17.9
3
17.6
4
13.1
9
12.1
8
19.3
6
21.6
4
36.6
5
28.8
0
34.8
3
32.9
0
21.6
1
16.2
4
6.66
29.1
4
17.6
7
41.2
1
30.9
8
22.2
4
15.0
2
22.6
7
13.9
6
8.11
15.9
1
38.7
8
15.4
6
5.73
16.5
2
27.5
7
36.8
3 45.9
0
47.0
3
39.8
7
37.6
1
22.9
9
31.4
9
25.5
4
28.1
5
39.4
8
45.5
3
58.1
9
38.5
8
50.3
2
28.9
7
40.8
0
49.8
4
58.7
2
51.1
3
60.0
2
65.8
8
58.3
2
39.2
1
71.4
6
82.1
5
60.1
1
15.1
9
19.0
7
16.0
5
0
10
20
30
40
50
60
70
80
90
100
USACA
CY USANY
EE HU SI LU SE DE DK UK NL ES SK LT EL AT IE IT CZ JP PT PL MT FR BE FI LV CH
€ pe
r mon
th, V
AT
incl
uded
Fixed Usage Source for Switzerland: Teligen T-Basket; OFCOM Switzerland computation.
With the monthly charge of 47.31 €, excluding VAT, Switzerland comes on the place five among the most expensive European SOHO business baskets, with Cyprus and the United Kingdom on the top (Figure 90).
Figure 90
OECD baskets for PSTNSOHO business basket
11.4
9
6.81
13.6
5
18.1
5
10.1
5
5.65
18.5
4
16.8
3
12.8
9
17.8
4
14.7
0
18.6
3
15.9
3
11.4
4
13.5
9
10.6
1
14.5
5
20.3
1
19.2
5
27.0
6
20.1
0
17.5
7
19.6
2
21.0
0
12.9
7
42.0
8
24.6
3
15.3
5
21.6
7
16.6
6
12.3
2
21.4
5
28.0
7
15.5
6
18.0
5
22.0
3
17.6
7
22.1
9
19.2
1
22.6
1
27.1
9
26.0
4
29.0
6
26.0
9
21.0
9
23.5
3
16.3
6
25.1
3
28.4
6
28.4
2
27.9
9
36.1
6
7.10 26.3
0
31.9
6
11.3
716
.90
8.98
0
10
20
30
40
50
60
USACA
HU EE SK USANY
SI LT DK LU EL DE MT ES NL PL SE LV PT AT CZ IE BE FR JP IT FI CY UK CH
€ pe
r mon
th, V
AT
excl
uded
Fixed Usage Source for Switzerland: Teligen T-Basket; OFCOM Switzerland computation.
Extrait du 12ème rapport d’implémentation de l’UE étendu à la Suisse - 100
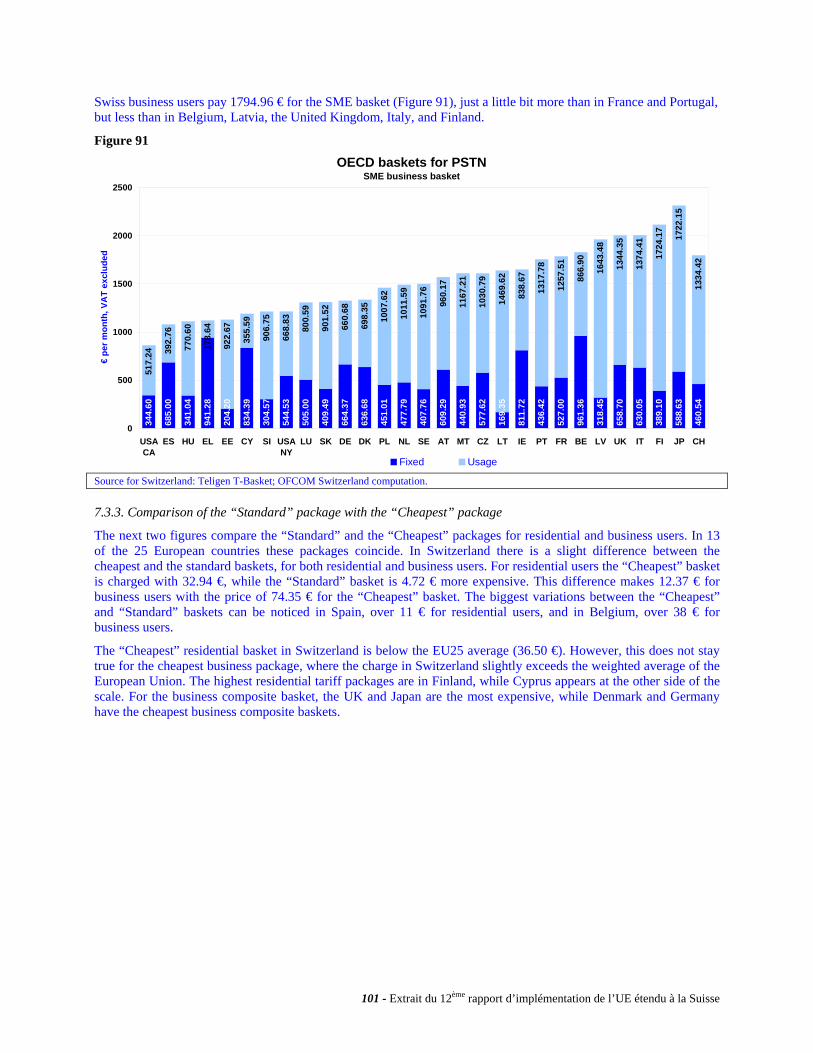
Swiss business users pay 1794.96 € for the SME basket (Figure 91), just a little bit more than in France and Portugal, but less than in Belgium, Latvia, the United Kingdom, Italy, and Finland.
Figure 91
OECD baskets for PSTNSME business basket
344.
60
341.
04
941.
28
204.
20
834.
39
304.
57
544.
53
505.
00
409.
49
664.
37
636.
68
451.
01
477.
79
407.
76
609.
29
440.
93
577.
62
169.
35
811.
72
436.
42
527.
00
961.
36
318.
45
658.
70
630.
05
389.
10
588.
63
460.
54
770.
60
178.
64
922.
67
355.
59
906.
75
668.
83
800.
59
901.
52
660.
68
698.
35
1007
.62
1011
.59
1091
.76
960.
17
1167
.21
1030
.79
1469
.62
838.
67
1317
.78
1257
.51
866.
90
1643
.48
1344
.35
1374
.41
1724
.17
1722
.15
1334
.42
685.
00
517.
24 392.
76
0
500
1000
1500
2000
2500
USACA
ES HU EL EE CY SI USANY
LU SK DE DK PL NL SE AT MT CZ LT IE PT FR BE LV UK IT FI JP CH
€ pe
r mon
th, V
AT
excl
uded
Fixed Usage Source for Switzerland: Teligen T-Basket; OFCOM Switzerland computation. 7.3.3. Comparison of the “Standard” package with the “Cheapest” package
The next two figures compare the “Standard” and the “Cheapest” packages for residential and business users. In 13 of the 25 European countries these packages coincide. In Switzerland there is a slight difference between the cheapest and the standard baskets, for both residential and business users. For residential users the “Cheapest” basket is charged with 32.94 €, while the “Standard” basket is 4.72 € more expensive. This difference makes 12.37 € for business users with the price of 74.35 € for the “Cheapest” basket. The biggest variations between the “Cheapest” and “Standard” baskets can be noticed in Spain, over 11 € for residential users, and in Belgium, over 38 € for business users.
The “Cheapest” residential basket in Switzerland is below the EU25 average (36.50 €). However, this does not stay true for the cheapest business package, where the charge in Switzerland slightly exceeds the weighted average of the European Union. The highest residential tariff packages are in Finland, while Cyprus appears at the other side of the scale. For the business composite basket, the UK and Japan are the most expensive, while Denmark and Germany have the cheapest business composite baskets.
101 - Extrait du 12ème rapport d’implémentation de l’UE étendu à la Suisse
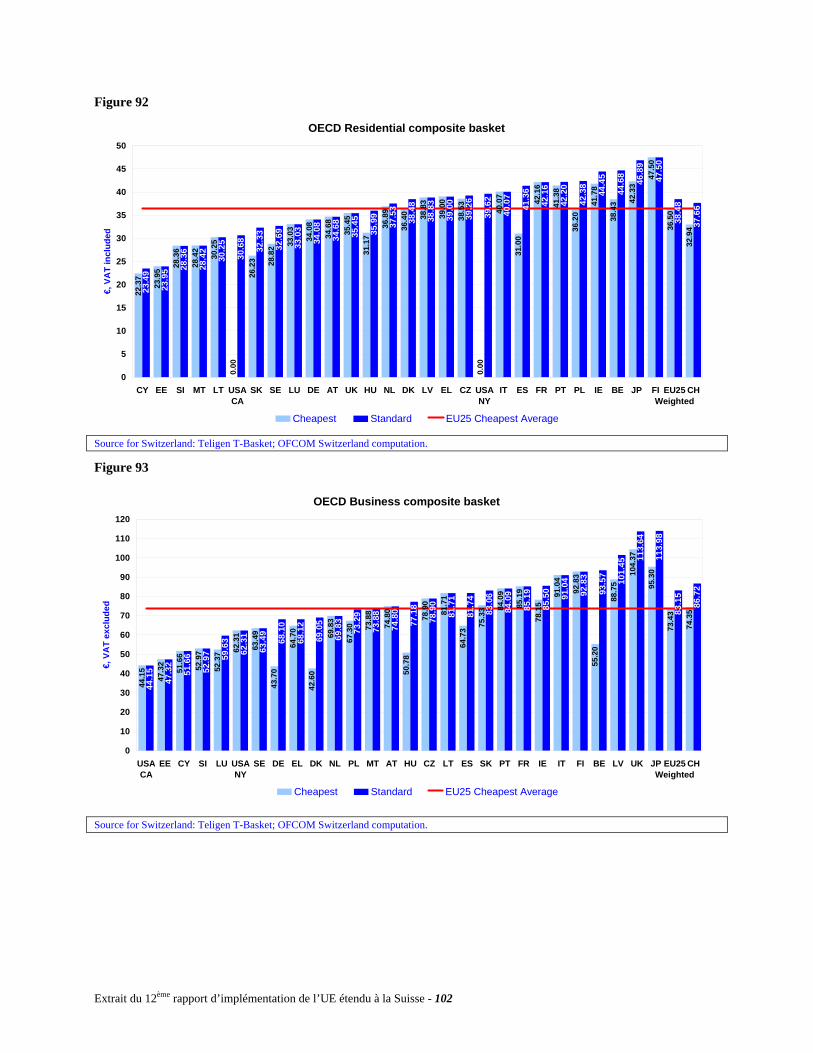
Figure 92
OECD Residential composite basket22
.37
23.9
5 28.3
6
28.4
2
30.2
5
0.00
26.2
3
34.6
8
35.4
5
31.1
7
36.8
9
36.4
0 38.8
3
39.0
0
38.5
3
0.00
40.0
7
31.0
0
42.1
6
41.3
8
36.2
0
41.7
8
38.4
3 42.3
3
47.5
0
36.5
0
32.9
4
23.4
9
23.9
5 28.4
2
30.6
8 34.6
8
35.9
9
37.5
3
38.4
8
38.8
3
39.0
0
39.2
6
39.6
2
40.0
7
41.3
6
42.1
6
42.2
0
42.3
8
44.4
5
44.6
8
46.8
9
47.5
0
38.4
8
37.6
6
34.0
8
33.0
3
28.8
2
34.0
8
33.0
3
32.6
9 35.4
5
32.3
3
30.2
5
28.3
6
0
5
10
15
20
25
30
35
40
45
50
CY EE SI MT LT USACA
SK SE LU DE AT UK HU NL DK LV EL CZ USANY
IT ES FR PT PL IE BE JP FI EU25Weighted
CH
€, V
AT
incl
uded
Cheapest Standard EU25 Cheapest Average
Source for Switzerland: Teligen T-Basket; OFCOM Switzerland computation.
Figure 93
OECD Business composite basket
44.1
5
47.3
2
51.6
6
52.9
7
52.3
7 62.3
1
63.4
9 69.8
3
67.3
0 73.8
8
74.8
0
50.7
8
78.9
0
81.7
1
64.7
3 75.3
3 84.0
9
85.1
9
78.1
5
91.0
4
92.8
3
55.2
0
88.7
5
104.
37
95.3
0
73.4
3
74.3
5
44.1
5
47.3
2
52.9
7 62.3
1 69.8
3
73.8
8
74.8
0
77.1
8
78.9
0
81.7
1
81.7
4
83.0
6
84.0
9
85.1
9
85.5
0
91.0
4
92.8
3
93.5
7
101.
45
113.
64
113.
98
83.1
5
86.7
2
43.7
0
64.7
0
42.6
051.6
6 59.6
3
63.4
9 73.2
9
68.1
0
68.1
2
69.0
5
0
10
20
30
40
50
60
70
80
90
100
110
120
USACA
EE CY SI LU USANY
SE DE EL DK NL PL MT AT HU CZ LT ES SK PT FR IE IT FI BE LV UK JP EU25Weighted
CH
€, V
AT
excl
uded
Cheapest Standard EU25 Cheapest Average
Source for Switzerland: Teligen T-Basket; OFCOM Switzerland computation.
Extrait du 12ème rapport d’implémentation de l’UE étendu à la Suisse - 102
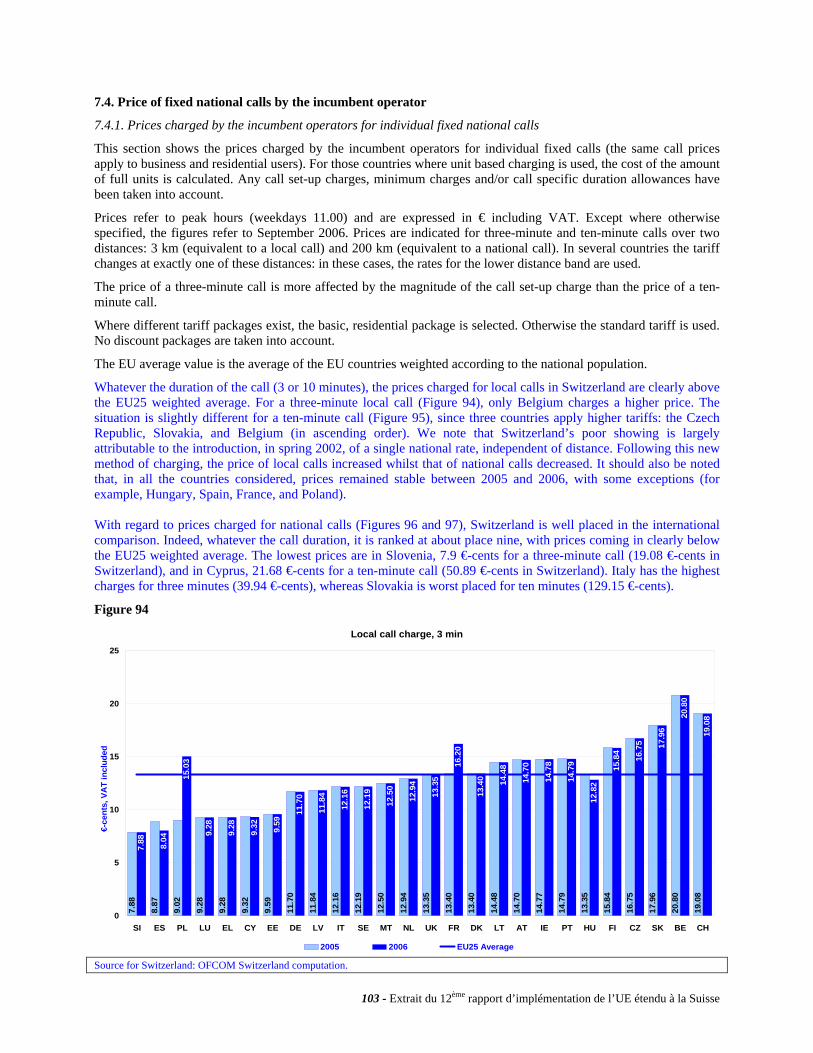
7.4. Price of fixed national calls by the incumbent operator 7.4.1. Prices charged by the incumbent operators for individual fixed national calls
This section shows the prices charged by the incumbent operators for individual fixed calls (the same call prices apply to business and residential users). For those countries where unit based charging is used, the cost of the amount of full units is calculated. Any call set-up charges, minimum charges and/or call specific duration allowances have been taken into account.
Prices refer to peak hours (weekdays 11.00) and are expressed in € including VAT. Except where otherwise specified, the figures refer to September 2006. Prices are indicated for three-minute and ten-minute calls over two distances: 3 km (equivalent to a local call) and 200 km (equivalent to a national call). In several countries the tariff changes at exactly one of these distances: in these cases, the rates for the lower distance band are used.
The price of a three-minute call is more affected by the magnitude of the call set-up charge than the price of a ten-minute call.
Where different tariff packages exist, the basic, residential package is selected. Otherwise the standard tariff is used. No discount packages are taken into account.
The EU average value is the average of the EU countries weighted according to the national population.
Whatever the duration of the call (3 or 10 minutes), the prices charged for local calls in Switzerland are clearly above the EU25 weighted average. For a three-minute local call (Figure 94), only Belgium charges a higher price. The situation is slightly different for a ten-minute call (Figure 95), since three countries apply higher tariffs: the Czech Republic, Slovakia, and Belgium (in ascending order). We note that Switzerland’s poor showing is largely attributable to the introduction, in spring 2002, of a single national rate, independent of distance. Following this new method of charging, the price of local calls increased whilst that of national calls decreased. It should also be noted that, in all the countries considered, prices remained stable between 2005 and 2006, with some exceptions (for example, Hungary, Spain, France, and Poland). With regard to prices charged for national calls (Figures 96 and 97), Switzerland is well placed in the international comparison. Indeed, whatever the call duration, it is ranked at about place nine, with prices coming in clearly below the EU25 weighted average. The lowest prices are in Slovenia, 7.9 €-cents for a three-minute call (19.08 €-cents in Switzerland), and in Cyprus, 21.68 €-cents for a ten-minute call (50.89 €-cents in Switzerland). Italy has the highest charges for three minutes (39.94 €-cents), whereas Slovakia is worst placed for ten minutes (129.15 €-cents).
Figure 94
Local call charge, 3 min
9.02
9.28
9.32
9.59
12.5
0
13.4
0
14.4
8
14.7
0
14.7
7
14.7
9
13.3
5
15.8
4
16.7
5
17.9
6
20.8
0
19.0
8
7.88 8.04
9.28
9.32
11.7
0 12.9
4
13.3
5
16.2
0
13.4
0 14.4
8
14.7
0
14.7
8
14.7
9
12.8
2
15.8
4
16.7
5 17.9
6
20.8
0
19.0
8
7.88
8.87
9.28
11.7
0
11.8
4
12.1
6
12.1
9
12.9
4
13.3
5
13.4
0
15.0
3
9.28 9.59
12.5
0
11.8
4
12.1
6
12.1
9
0
5
10
15
20
25
SI ES PL LU EL CY EE DE LV IT SE MT NL UK FR DK LT AT IE PT HU FI CZ SK BE CH
€-ce
nts,
VA
T in
clud
ed
2005 2006 EU25 Average Source for Switzerland: OFCOM Switzerland computation.
103 - Extrait du 12ème rapport d’implémentation de l’UE étendu à la Suisse
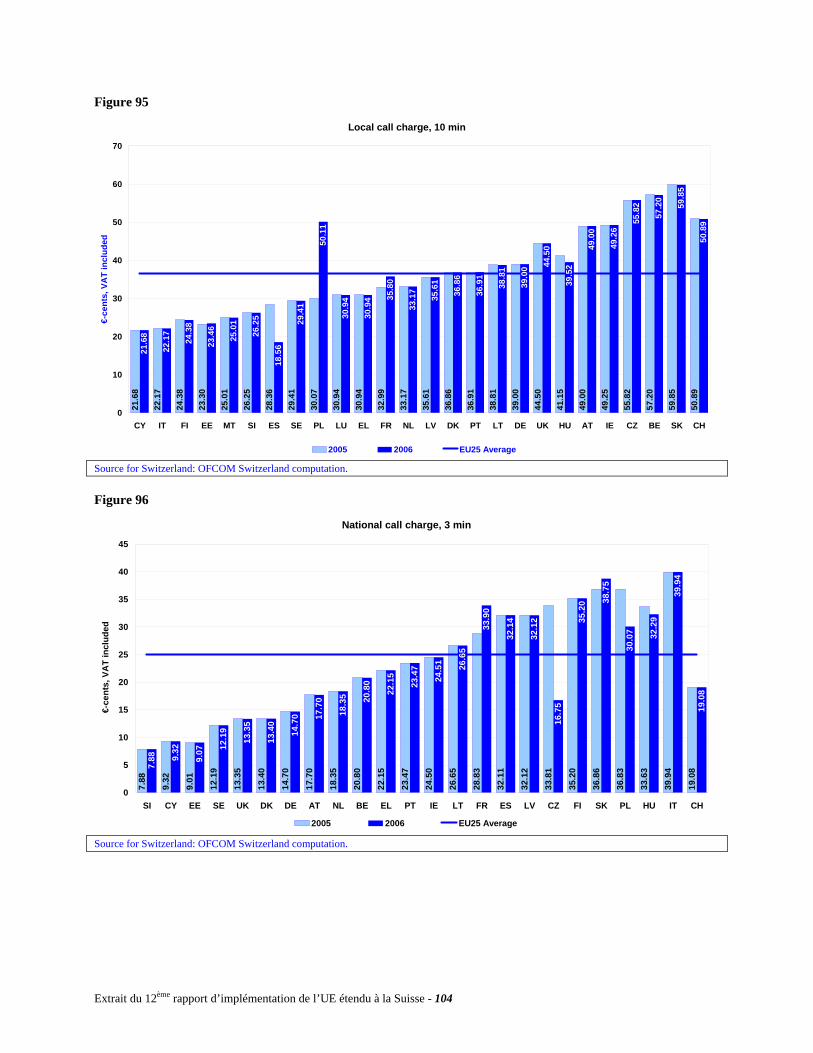
Figure 95
Local call charge, 10 min21
.68
22.1
7
23.3
0
26.2
5
29.4
1
30.0
7
30.9
4
30.9
4
33.1
7
35.6
1
36.8
6
36.9
1
38.8
1
39.0
0
44.5
0
41.1
5
49.0
0
49.2
5
55.8
2
57.2
0
59.8
5
50.8
9
24.3
8
25.0
1
26.2
5
18.5
6
35.8
0
36.9
1
38.8
1
39.0
0 44.5
0
39.5
2
49.0
0
49.2
6
55.8
2
57.2
0
59.8
5
50.8
9
24.3
8
25.0
1
28.3
6
32.9
9
21.6
8
22.1
7
23.4
6
29.4
1
50.1
1
30.9
4
30.9
4
33.1
7
35.6
1
36.8
6
0
10
20
30
40
50
60
70
CY IT FI EE MT SI ES SE PL LU EL FR NL LV DK PT LT DE UK HU AT IE CZ BE SK CH
€-ce
nts,
VA
T in
clud
ed
2005 2006 EU25 Average Source for Switzerland: OFCOM Switzerland computation. Figure 96
National call charge, 3 min
7.88
9.32
12.1
9
13.4
0
17.7
0
18.3
5
20.8
0
22.1
5
28.8
3
32.1
1
32.1
2
33.8
1
35.2
0
36.8
6
36.8
3
33.6
3
39.9
4
19.0
8
9.07
13.3
5
13.4
0
14.7
0
32.1
4
32.1
2
16.7
5
35.2
0 38.7
5
30.0
7 32.2
9
39.9
4
19.0
8
23.4
7
14.7
0
13.3
5
9.01
24.5
0
26.6
5
33.9
0
26.6
5
24.5
1
22.1
5
20.8
0
18.3
5
17.7
0
12.1
9
9.32
7.88
23.4
7
0
5
10
15
20
25
30
35
40
45
SI CY EE SE UK DK DE AT NL BE EL PT IE LT FR ES LV CZ FI SK PL HU IT CH
€-ce
nts,
VA
T in
clud
ed
2005 2006 EU25 Average Source for Switzerland: OFCOM Switzerland computation.
Extrait du 12ème rapport d’implémentation de l’UE étendu à la Suisse - 104
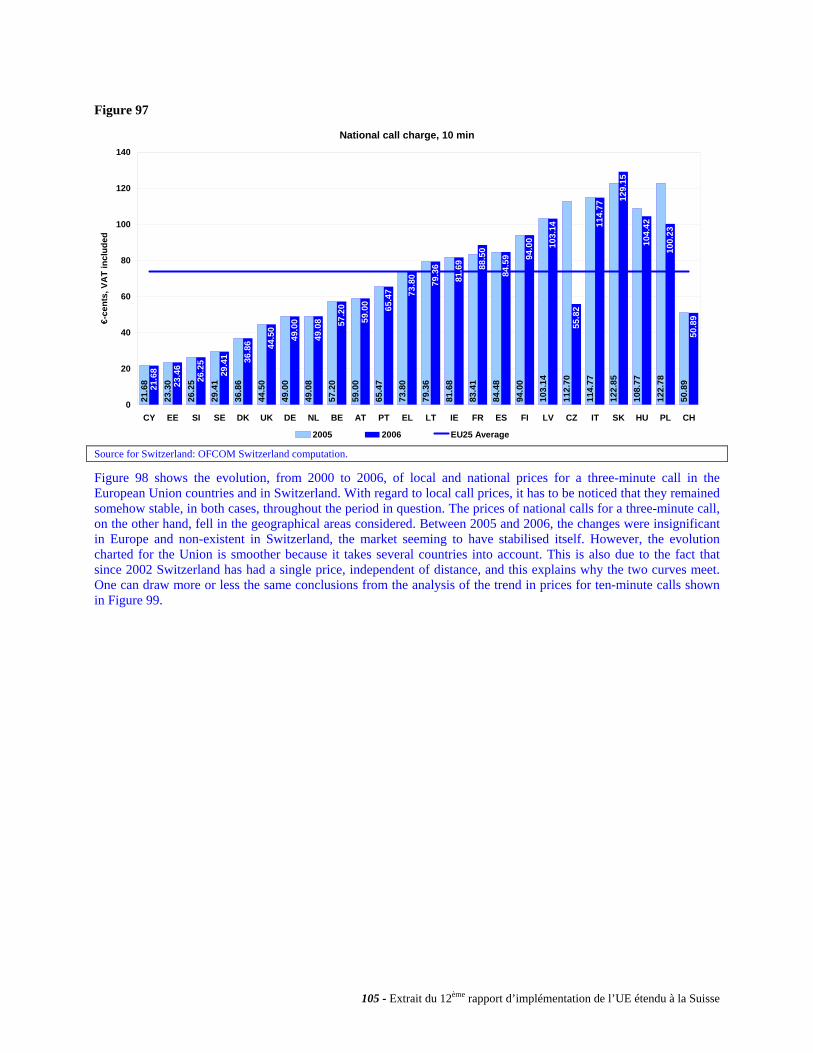
Figure 97
National call charge, 10 min21
.68
23.3
0
29.4
1
44.5
0
49.0
8
57.2
0
59.0
0
65.4
7
83.4
1
84.4
8
94.0
0
103.
14
112.
70
114.
77
122.
85
108.
77
122.
78
50.8
926.2
5 36.8
6 44.5
0
49.0
0
84.5
9 94.0
0 103.
14
55.8
2
114.
77
129.
15
104.
42
100.
23
50.8
9
81.6
8
79.3
6
26.2
5
36.8
6
49.0
0
73.8
073
.80
21.6
8
23.4
6
29.4
1
49.0
8 57.2
0
59.0
0 65.4
7
79.3
6
81.6
9 88.5
0
0
20
40
60
80
100
120
140
CY EE SI SE DK UK DE NL BE AT PT EL LT IE FR ES FI LV CZ IT SK HU PL CH
€-ce
nts,
VA
T in
clud
ed
2005 2006 EU25 Average Source for Switzerland: OFCOM Switzerland computation.
Figure 98 shows the evolution, from 2000 to 2006, of local and national prices for a three-minute call in the European Union countries and in Switzerland. With regard to local call prices, it has to be noticed that they remained somehow stable, in both cases, throughout the period in question. The prices of national calls for a three-minute call, on the other hand, fell in the geographical areas considered. Between 2005 and 2006, the changes were insignificant in Europe and non-existent in Switzerland, the market seeming to have stabilised itself. However, the evolution charted for the Union is smoother because it takes several countries into account. This is also due to the fact that since 2002 Switzerland has had a single price, independent of distance, and this explains why the two curves meet. One can draw more or less the same conclusions from the analysis of the trend in prices for ten-minute calls shown in Figure 99.
105 - Extrait du 12ème rapport d’implémentation de l’UE étendu à la Suisse
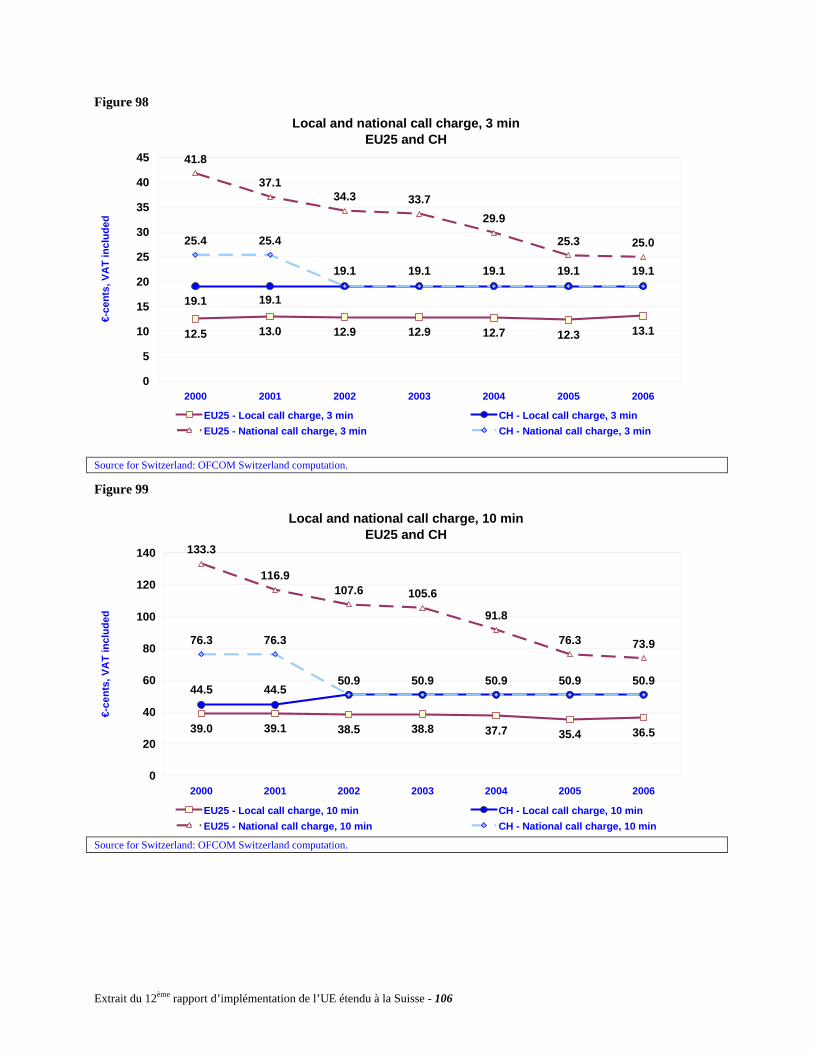
Figure 98 Local and national call charge, 3 min
EU25 and CH 41.8
37.134.3 33.7
29.9
25.3 25.025.4 25.4
12.5 13.0 12.9 12.712.9 12.3 13.1
19.1 19.1
19.1 19.1 19.1 19.1 19.1
0
5
10
15
20
25
30
35
40
45
2000 2001 2002 2003 2004 2005 2006
€-ce
nts,
VA
T in
clud
ed
EU25 - Local call charge, 3 min CH - Local call charge, 3 minEU25 - National call charge, 3 min CH - National call charge, 3 min
Source for Switzerland: OFCOM Switzerland computation.
Figure 99
Local and national call charge, 10 minEU25 and CH
133.3
116.9107.6 105.6
91.8
76.3 73.976.3 76.3
50.9 50.9 50.9 50.9 50.9
39.0 39.1 38.5 37.738.8 35.4 36.5
44.5 44.5
0
20
40
60
80
100
120
140
2000 2001 2002 2003 2004 2005 2006
€-ce
nts,
VA
T in
clud
ed
EU25 - Local call charge, 10 min CH - Local call charge, 10 minEU25 - National call charge, 10 min CH - National call charge, 10 min
Source for Switzerland: OFCOM Switzerland computation.
Extrait du 12ème rapport d’implémentation de l’UE étendu à la Suisse - 106
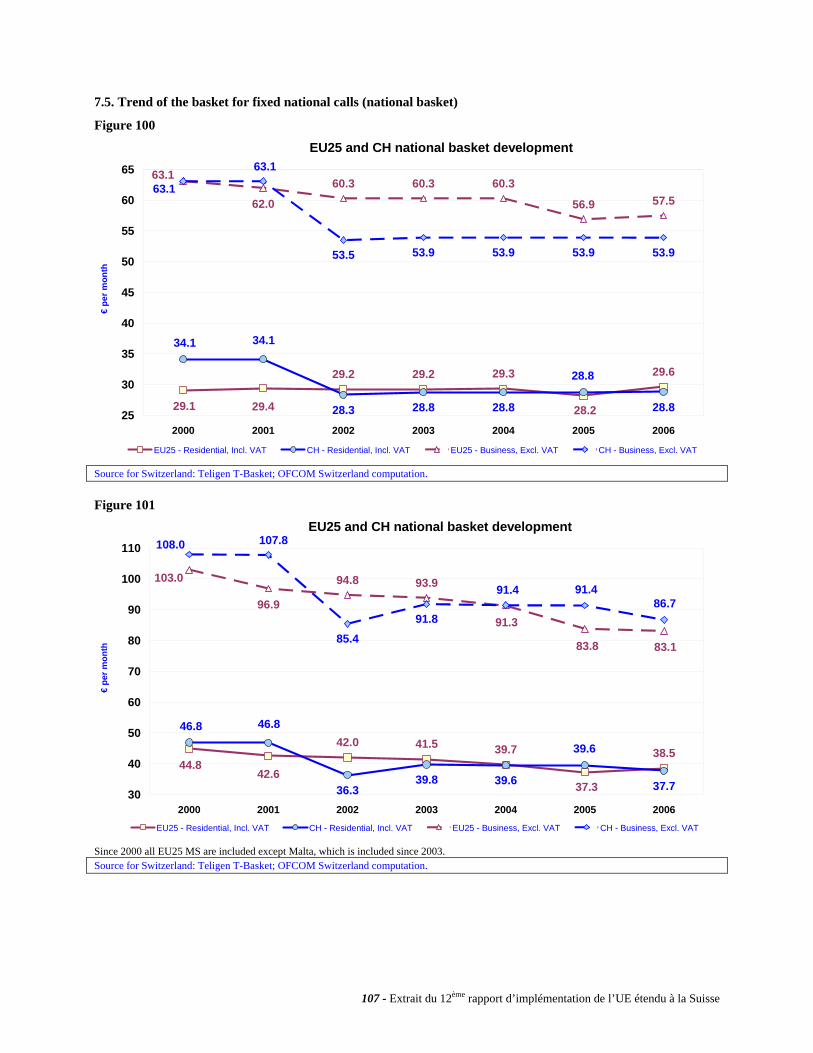
7.5. Trend of the basket for fixed national calls (national basket) Figure 100
EU25 and CH national basket development
29.6
28.8
60.3 60.3 60.3
56.9 57.5
53.5 53.9 53.9 53.9 53.9
29.1 29.4
29.2 29.2 29.3
28.228.828.3
34.1
28.8
34.1
28.8
62.0
63.163.1
63.1
25
30
35
40
45
50
55
60
65
2000 2001 2002 2003 2004 2005 2006
€ pe
r mon
th
EU25 - Residential, Incl. VAT CH - Residential, Incl. VAT EU25 - Business, Excl. VAT CH - Business, Excl. VAT
Source for Switzerland: Teligen T-Basket; OFCOM Switzerland computation. Figure 101
EU25 and CH national basket development
38.5
37.7
94.8 93.9
85.491.8
44.842.6
42.0 41.5 39.7
37.339.836.3
46.8
39.6
46.8
39.6
83.183.8
91.396.9
103.0
86.791.491.4
107.8108.0
30
40
50
60
70
80
90
100
110
2000 2001 2002 2003 2004 2005 2006
€ pe
r mon
th
EU25 - Residential, Incl. VAT CH - Residential, Incl. VAT EU25 - Business, Excl. VAT CH - Business, Excl. VAT
Since 2000 all EU25 MS are included except Malta, which is included since 2003. Source for Switzerland: Teligen T-Basket; OFCOM Switzerland computation.
107 - Extrait du 12ème rapport d’implémentation de l’UE étendu à la Suisse
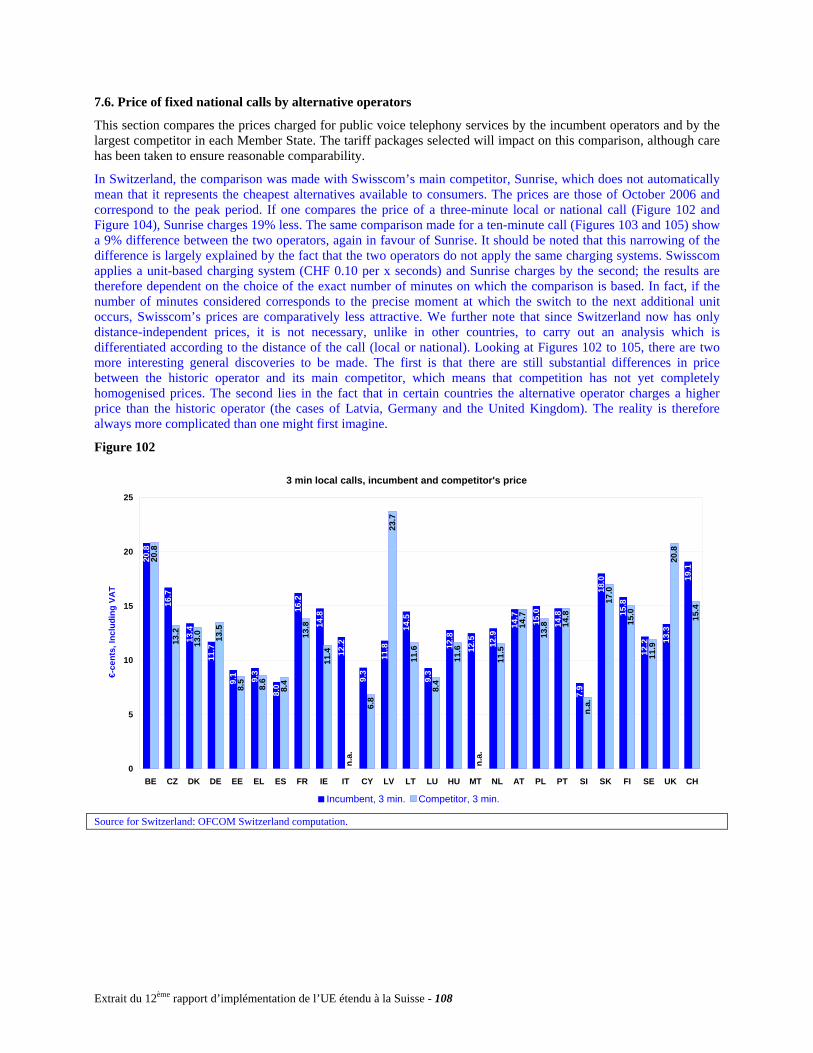
7.6. Price of fixed national calls by alternative operators This section compares the prices charged for public voice telephony services by the incumbent operators and by the largest competitor in each Member State. The tariff packages selected will impact on this comparison, although care has been taken to ensure reasonable comparability.
In Switzerland, the comparison was made with Swisscom’s main competitor, Sunrise, which does not automatically mean that it represents the cheapest alternatives available to consumers. The prices are those of October 2006 and correspond to the peak period. If one compares the price of a three-minute local or national call (Figure 102 and Figure 104), Sunrise charges 19% less. The same comparison made for a ten-minute call (Figures 103 and 105) show a 9% difference between the two operators, again in favour of Sunrise. It should be noted that this narrowing of the difference is largely explained by the fact that the two operators do not apply the same charging systems. Swisscom applies a unit-based charging system (CHF 0.10 per x seconds) and Sunrise charges by the second; the results are therefore dependent on the choice of the exact number of minutes on which the comparison is based. In fact, if the number of minutes considered corresponds to the precise moment at which the switch to the next additional unit occurs, Swisscom’s prices are comparatively less attractive. We further note that since Switzerland now has only distance-independent prices, it is not necessary, unlike in other countries, to carry out an analysis which is differentiated according to the distance of the call (local or national). Looking at Figures 102 to 105, there are two more interesting general discoveries to be made. The first is that there are still substantial differences in price between the historic operator and its main competitor, which means that competition has not yet completely homogenised prices. The second lies in the fact that in certain countries the alternative operator charges a higher price than the historic operator (the cases of Latvia, Germany and the United Kingdom). The reality is therefore always more complicated than one might first imagine.
Figure 102
3 min local calls, incumbent and competitor's price
20.8
16.7
13.4
11.7
9.1 9.3
8.0
16.2
14.8
12.2
9.3
11.8
14.5
9.3
12.8
12.5 12
.9
14.7
15.0
14.8
7.9
18.0
15.8
12.2 13
.3
19.1
20.8
13.2
13.0 13
.5
8.5
8.6
8.4
13.8
11.4
6.8
23.7
11.6
8.4
11.6
11.5
14.7
13.8 14
.8
15.0
11.9
20.8
15.4
17.0
n.a.
n.a.
n.a.
0
5
10
15
20
25
BE CZ DK DE EE EL ES FR IE IT CY LV LT LU HU MT NL AT PL PT SI SK FI SE UK CH
€-ce
nts,
Incl
udin
g VA
T
Incumbent, 3 min. Competitor, 3 min.
Source for Switzerland: OFCOM Switzerland computation.
Extrait du 12ème rapport d’implémentation de l’UE étendu à la Suisse - 108
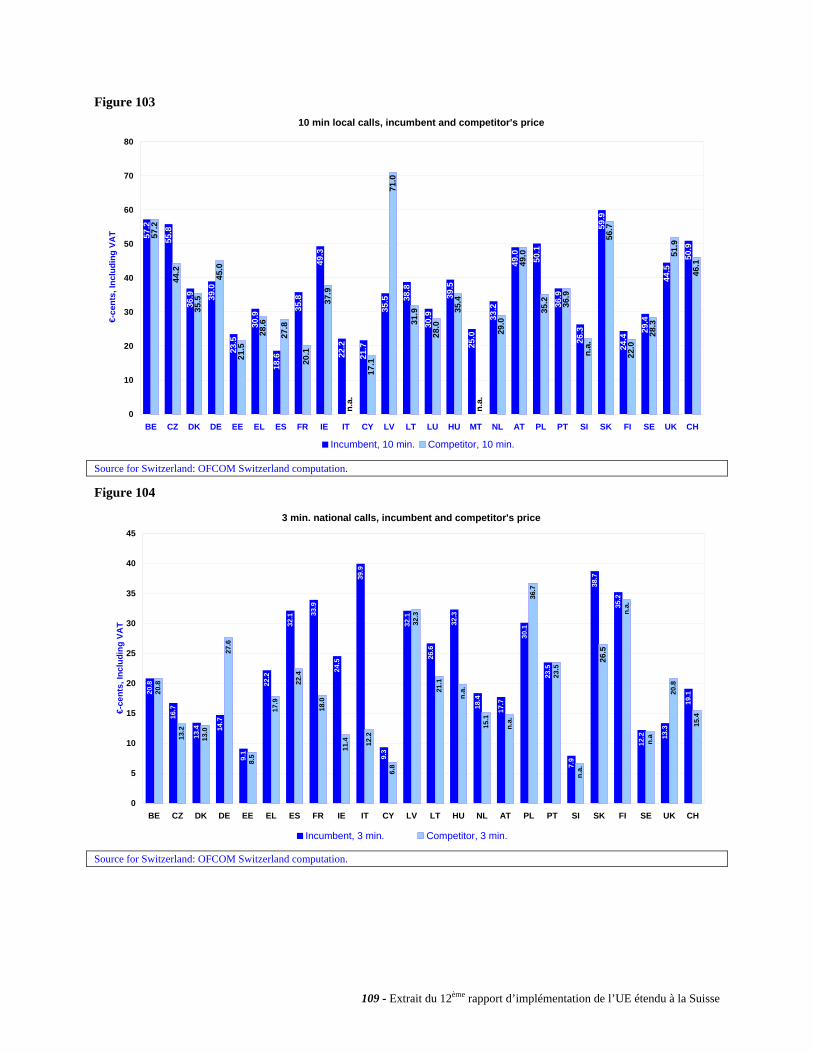
Figure 103 10 min local calls, incumbent and competitor's price
55.8
36.9 39
.0
23.5
30.9
18.6
35.8
49.3
22.2
21.7
35.5 38
.8
30.9
39.5
25.0
33.2
49.0 50.1
36.9
26.3
59.9
24.4
29.4
44.5
50.9
57.2
44.2
35.5
45.0
21.5
28.6
27.8
20.1
37.9
17.1
71.0
31.9
28.0
35.4
29.0
49.0
35.2 36
.9
22.0
28.3
51.9
46.1
57.2
n.a.
n.a.
n.a.
56.7
0
10
20
30
40
50
60
70
80
BE CZ DK DE EE EL ES FR IE IT CY LV LT LU HU MT NL AT PL PT SI SK FI SE UK CH
€-ce
nts,
Incl
udin
g VA
T
Incumbent, 10 min. Competitor, 10 min.
Source for Switzerland: OFCOM Switzerland computation.
Figure 104
3 min. national calls, incumbent and competitor's price
20.8
16.7
13.4 14
.7
9.1
22.2
32.1 33
.9
24.5
39.9
9.3
32.1
26.6
32.3
18.4
17.7
30.1
23.5
7.9
38.7
35.2
12.2 13
.3
19.120
.8
13.2
13.0
27.6
8.5
17.9
22.4
18.0
11.4 12
.2
6.8
32.3
21.1
15.1
36.7
23.5
20.8
15.4
26.5
n.a.
n.a
n.a.
n.a.
n.a.
0
5
10
15
20
25
30
35
40
45
BE CZ DK DE EE EL ES FR IE IT CY LV LT HU NL AT PL PT SI SK FI SE UK CH
€-ce
nts,
Incl
udin
g VA
T
Incumbent, 3 min. Competitor, 3 min.
Source for Switzerland: OFCOM Switzerland computation.
109 - Extrait du 12ème rapport d’implémentation de l’UE étendu à la Suisse
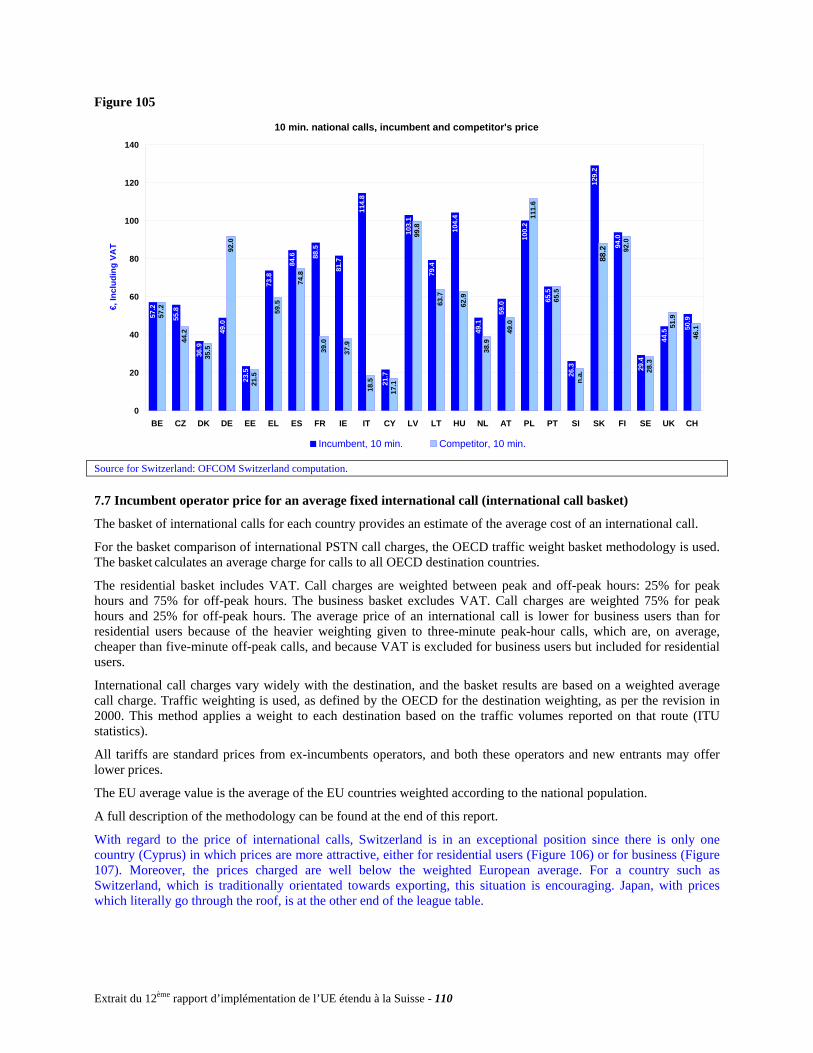
Figure 105
10 min. national calls, incumbent and competitor's price
55.8
36.9
49.0
23.5
73.8
84.6 88
.5
81.7
114.
8
21.7
103.
1
79.4
104.
4
49.1
59.0
100.
2
65.5
26.3
129.
2
94.0
29.4
44.5 50
.957.2
44.2
35.5
92.0
21.5
59.5
74.8
39.0
37.9
18.5
17.1
99.8
63.7
62.9
38.9
49.0
111.
6
65.5
92.0
28.3
51.9
46.1
57.2
88.2
n.a.
0
20
40
60
80
100
120
140
BE CZ DK DE EE EL ES FR IE IT CY LV LT HU NL AT PL PT SI SK FI SE UK CH
€, In
clud
ing
VAT
Incumbent, 10 min. Competitor, 10 min.
Source for Switzerland: OFCOM Switzerland computation.
7.7 Incumbent operator price for an average fixed international call (international call basket)
The basket of international calls for each country provides an estimate of the average cost of an international call.
For the basket comparison of international PSTN call charges, the OECD traffic weight basket methodology is used. The basket
calculates an average charge for calls to all OECD destination countries.
The residential basket includes VAT. Call charges are weighted between peak and off-peak hours: 25% for peak hours and 75% for off-peak hours. The business basket excludes VAT. Call charges are weighted 75% for peak hours and 25% for off-peak hours. The average price of an international call is lower for business users than for residential users because of the heavier weighting given to three-minute peak-hour calls, which are, on average, cheaper than five-minute off-peak calls, and because VAT is excluded for business users but included for residential users.
International call charges vary widely with the destination, and the basket results are based on a weighted average call charge. Traffic weighting is used, as defined by the OECD for the destination weighting, as per the revision in 2000. This method applies a weight to each destination based on the traffic volumes reported on that route (ITU statistics).
All tariffs are standard prices from ex-incumbents operators, and both these operators and new entrants may offer lower prices.
The EU average value is the average of the EU countries weighted according to the national population.
A full description of the methodology can be found at the end of this report.
With regard to the price of international calls, Switzerland is in an exceptional position since there is only one country (Cyprus) in which prices are more attractive, either for residential users (Figure 106) or for business (Figure 107). Moreover, the prices charged are well below the weighted European average. For a country such as Switzerland, which is traditionally orientated towards exporting, this situation is encouraging. Japan, with prices which literally go through the roof, is at the other end of the league table.
Extrait du 12ème rapport d’implémentation de l’UE étendu à la Suisse - 110
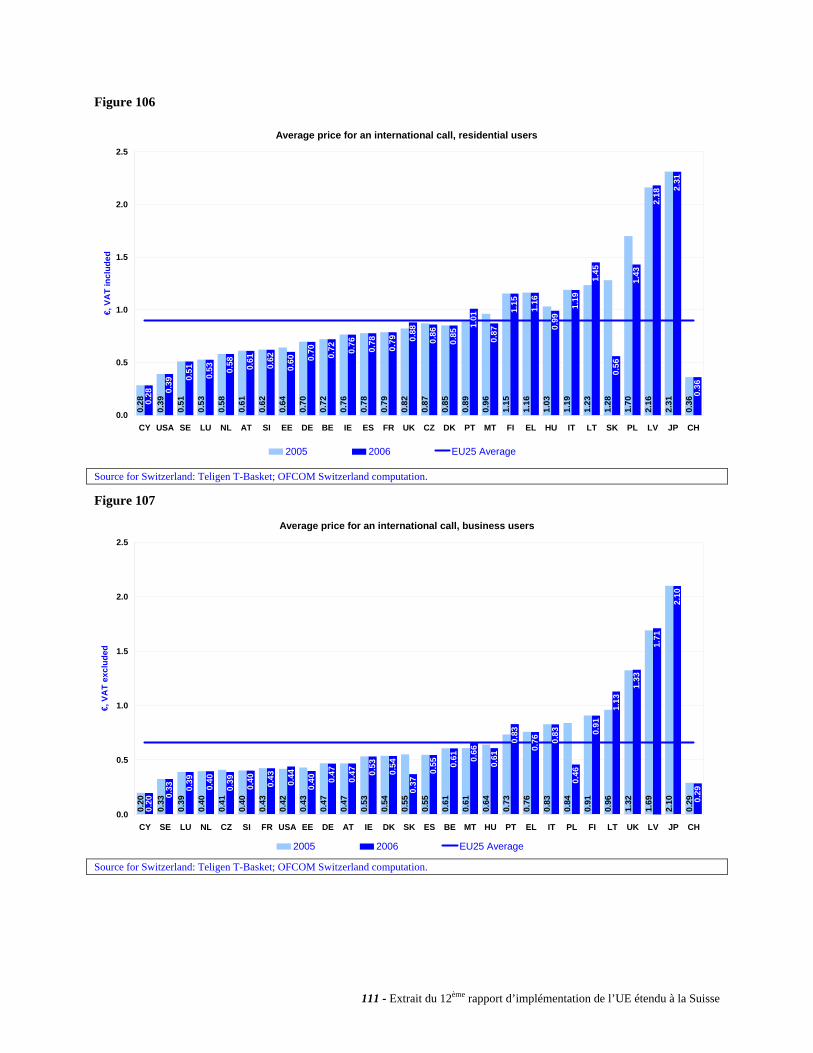
Figure 106
Average price for an international call, residential users0.
28
0.39
0.51
0.53
0.58
0.61
0.62
0.76
0.78
0.79
0.82
0.87
0.85
0.89
0.96
1.15
1.16
1.03
1.19
1.23
1.28
1.70
2.16
2.31
0.360.
28 0.39
0.53 0.
61
0.76 0.79 0.
88
0.86
0.85
1.01
0.87
1.15
1.16
0.99
1.19
1.45
0.56
1.43
2.18
2.31
0.36
0.64
0.70
0.72
0.51 0.
58 0.62
0.78
0.60 0.
70 0.72
0.0
0.5
1.0
1.5
2.0
2.5
CY USA SE LU NL AT SI EE DE BE IE ES FR UK CZ DK PT MT FI EL HU IT LT SK PL LV JP CH
€, V
AT
incl
uded
2005 2006 EU25 Average
Source for Switzerland: Teligen T-Basket; OFCOM Switzerland computation.
Figure 107
Average price for an international call, business users
0.20
0.33
0.39
0.40
0.41
0.40
0.43
0.47
0.53
0.54
0.55
0.55
0.61
0.61
0.64
0.73
0.76
0.83
0.84
0.91
0.96
1.32
1.69
2.10
0.29
0.20
0.33 0.
40
0.40 0.
47 0.54
0.37
0.55 0.
61 0.66
0.61
0.83
0.76 0.
83
0.46
0.91
1.13
1.33
1.71
2.10
0.29
0.42
0.43
0.47
0.39
0.39 0.43 0.
53
0.44
0.40 0.
47
0.0
0.5
1.0
1.5
2.0
2.5
CY SE LU NL CZ SI FR USA EE DE AT IE DK SK ES BE MT HU PT EL IT PL FI LT UK LV JP CH
€, V
AT
excl
uded
2005 2006 EU25 Average Source for Switzerland: Teligen T-Basket; OFCOM Switzerland computation.
111 - Extrait du 12ème rapport d’implémentation de l’UE étendu à la Suisse
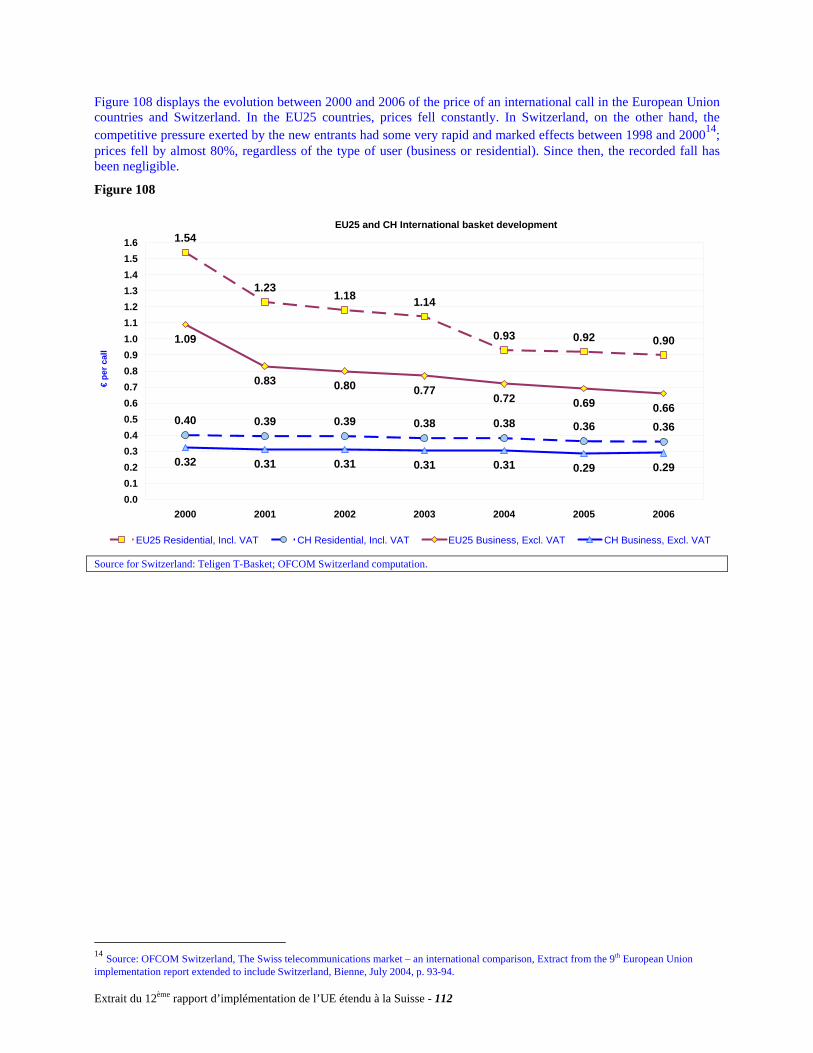
Figure 108 displays the evolution between 2000 and 2006 of the price of an international call in the European Union countries and Switzerland. In the EU25 countries, prices fell constantly. In Switzerland, on the other hand, the competitive pressure exerted by the new entrants had some very rapid and marked effects between 1998 and 200014; prices fell by almost 80%, regardless of the type of user (business or residential). Since then, the recorded fall has been negligible.
Figure 108
EU25 and CH International basket development
0.90
0.36
1.09
0.83 0.80 0.770.72 0.69 0.66
0.32 0.31 0.31 0.31 0.31 0.29 0.29
1.54
1.231.18 1.14
0.93 0.92
0.380.390.39 0.380.40 0.36
0.00.10.20.30.40.50.60.70.80.91.01.11.21.31.41.51.6
2000 2001 2002 2003 2004 2005 2006
€ pe
r cal
l
EU25 Residential, Incl. VAT CH Residential, Incl. VAT EU25 Business, Excl. VAT CH Business, Excl. VAT
Source for Switzerland: Teligen T-Basket; OFCOM Switzerland computation.
14 Source: OFCOM Switzerland, The Swiss telecommunications market – an international comparison, Extract from the 9th European Union implementation report extended to include Switzerland, Bienne, July 2004, p. 93-94.
Extrait du 12ème rapport d’implémentation de l’UE étendu à la Suisse - 112
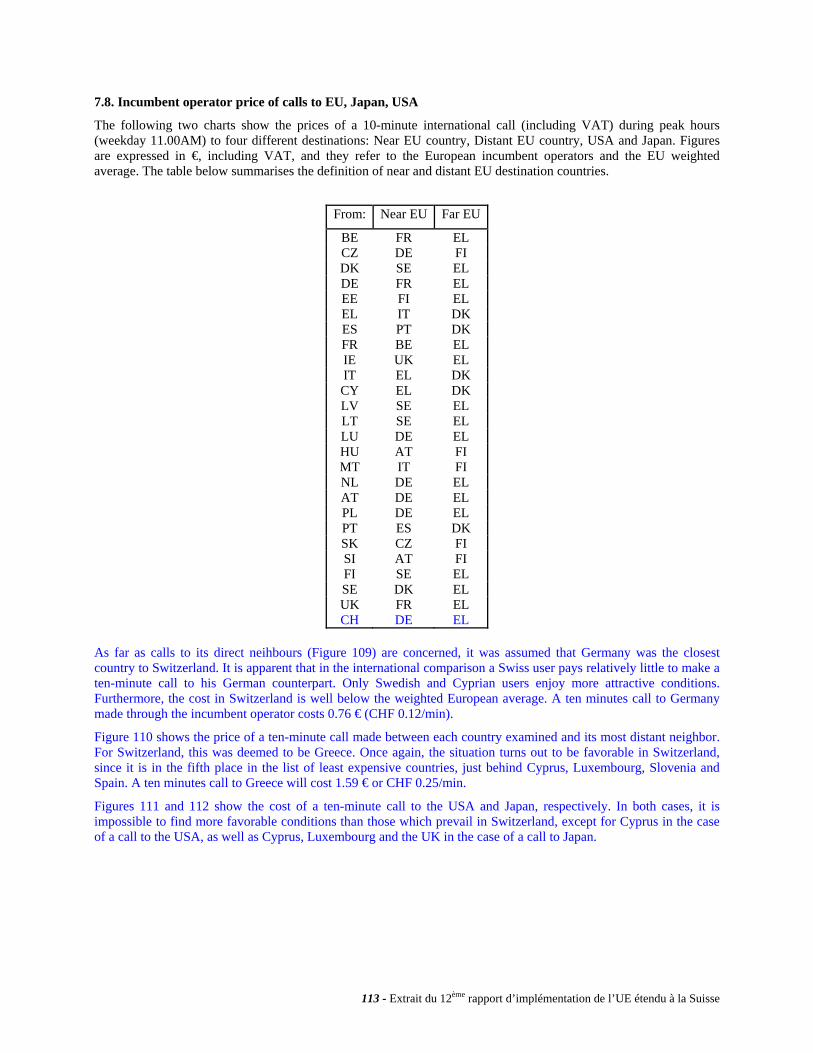
7.8. Incumbent operator price of calls to EU, Japan, USA The following two charts show the prices of a 10-minute international call (including VAT) during peak hours (weekday 11.00AM) to four different destinations: Near EU country, Distant EU country, USA and Japan. Figures are expressed in €, including VAT, and they refer to the European incumbent operators and the EU weighted average. The table below summarises the definition of near and distant EU destination countries.
From: Near EU Far EU
BE FR EL CZ DE FI DK SE EL DE FR EL EE FI EL EL IT DK ES PT DK FR BE EL IE UK EL IT EL DK CY EL DK LV SE EL LT SE EL LU DE EL HU AT FI MT IT FI NL DE EL AT DE EL PL DE EL PT ES DK SK CZ FI SI AT FI FI SE EL SE DK EL UK FR EL CH DE EL
As far as calls to its direct neihbours (Figure 109) are concerned, it was assumed that Germany was the closest country to Switzerland. It is apparent that in the international comparison a Swiss user pays relatively little to make a ten-minute call to his German counterpart. Only Swedish and Cyprian users enjoy more attractive conditions. Furthermore, the cost in Switzerland is well below the weighted European average. A ten minutes call to Germany made through the incumbent operator costs 0.76 € (CHF 0.12/min).
Figure 110 shows the price of a ten-minute call made between each country examined and its most distant neighbor. For Switzerland, this was deemed to be Greece. Once again, the situation turns out to be favorable in Switzerland, since it is in the fifth place in the list of least expensive countries, just behind Cyprus, Luxembourg, Slovenia and Spain. A ten minutes call to Greece will cost 1.59 € or CHF 0.25/min.
Figures 111 and 112 show the cost of a ten-minute call to the USA and Japan, respectively. In both cases, it is impossible to find more favorable conditions than those which prevail in Switzerland, except for Cyprus in the case of a call to the USA, as well as Cyprus, Luxembourg and the UK in the case of a call to Japan.
113 - Extrait du 12ème rapport d’implémentation de l’UE étendu à la Suisse
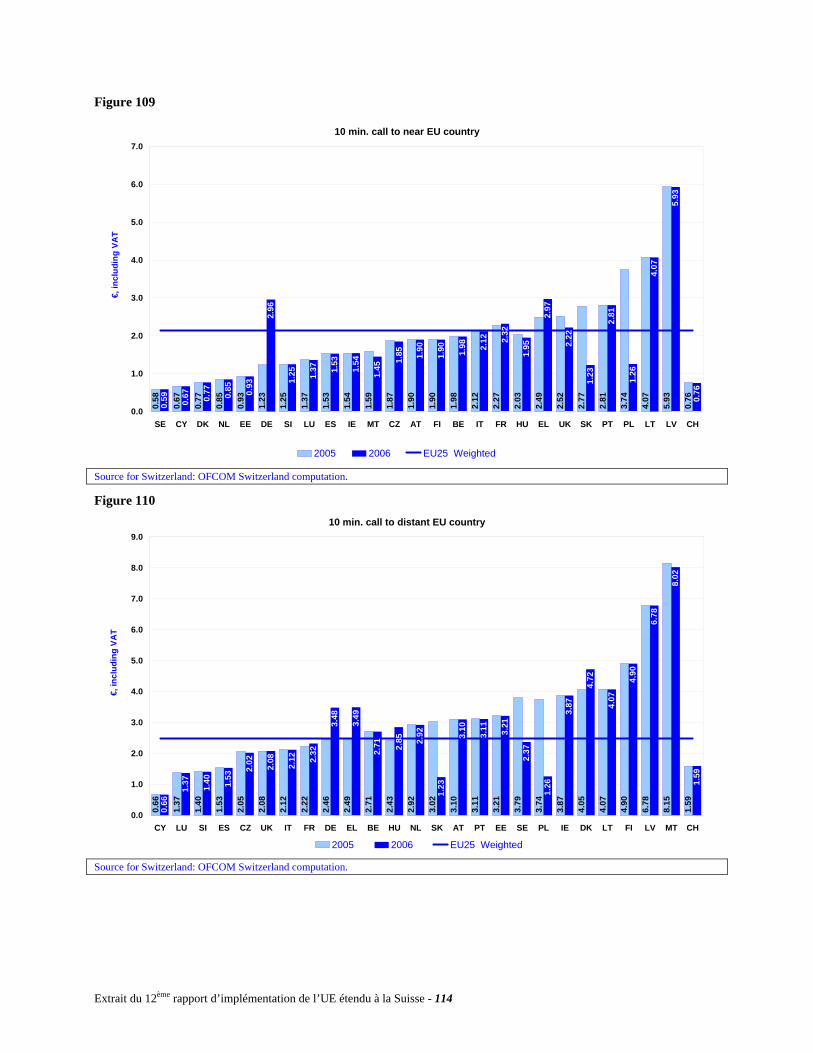
Figure 109
10 min. call to near EU country
0.77
0.93
1.25
2.12
2.27
2.03
2.49
2.52
2.77
2.81
3.74
4.07
5.93
0.76
0.59 0.67 0.
85
2.96
1.37 1.
53
1.54
1.90
1.90 1.98 2.
12 2.32
1.95
2.97
2.22
1.23
2.81
1.26
4.07
5.93
0.76
1.87
1.23
0.58
0.67
0.85
1.37
1.53
1.54
1.59
1.90
1.90
1.98
1.45
0.77 0.
93 1.25
1.85
0.0
1.0
2.0
3.0
4.0
5.0
6.0
7.0
SE CY DK NL EE DE SI LU ES IE MT CZ AT FI BE IT FR HU EL UK SK PT PL LT LV CH
€, in
clud
ing
VAT
2005 2006 EU25 Weighted
Source for Switzerland: OFCOM Switzerland computation.
Figure 110 10 min. call to distant EU country
1.40
2.05
2.12
3.11
3.21
3.79
3.74
3.87
4.05
4.07
4.90
6.78
8.15
1.59
0.66
1.37 1.
53
2.08 2.
32
3.48
3.49
2.92
1.23
3.10
3.11 3.21
2.37
1.26
3.87
4.72
4.07
4.90
6.78
8.02
1.59
2.43
2.08
0.66
1.37
1.53
2.22
2.46
2.49
2.71
2.92
3.02
3.10
2.71
1.40
2.02 2.12
2.85
0.0
1.0
2.0
3.0
4.0
5.0
6.0
7.0
8.0
9.0
CY LU SI ES CZ UK IT FR DE EL BE HU NL SK AT PT EE SE PL IE DK LT FI LV MT CH
€, in
clud
ing
VAT
2005 2006 EU25 Weighted
Source for Switzerland: OFCOM Switzerland computation.
Extrait du 12ème rapport d’implémentation de l’UE étendu à la Suisse - 114
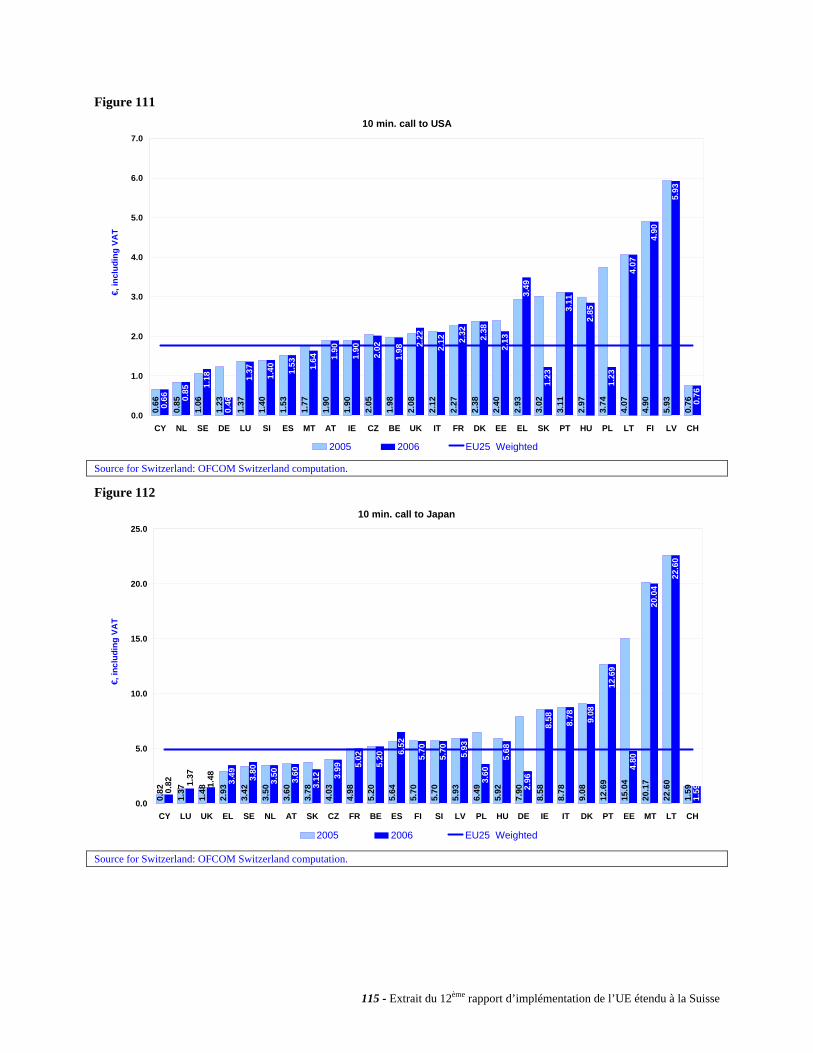
Figure 111 10 min. call to USA
1.06
1.37
1.53
2.38
2.40
2.93
3.02
3.11
2.97
3.74
4.90
5.93
0.760.66 0.
85
0.46
1.40 1.
64 1.90
1.90 2.
22
2.12 2.
32 2.38
2.13
3.49
1.23
3.11
2.85
1.23
4.07
4.90
5.93
0.76
2.27
2.12
2.08
2.05
1.90
1.90
1.77
1.23
0.85
0.66
1.40
1.98
4.07
1.98
1.53
1.37
1.18
2.02
0.0
1.0
2.0
3.0
4.0
5.0
6.0
7.0
CY NL SE DE LU SI ES MT AT IE CZ BE UK IT FR DK EE EL SK PT HU PL LT FI LV CH
€, in
clud
ing
VAT
2005 2006 EU25 Weighted Source for Switzerland: OFCOM Switzerland computation.
Figure 112 10 min. call to Japan
1.48
3.42
3.60
6.49
5.92
7.90
8.58
8.78
9.08
12.6
9
15.0
4
22.6
0
1.59
3.49
3.50
3.12 3.
99 5.02 5.
70
5.70 5.93
3.60
5.68
2.96
8.58 8.78 9.08
12.6
9
4.80
20.0
4
22.6
0
1.59
5.93
5.70
5.70
5.20
4.98
4.03
3.78
2.93
1.37
0.82
3.50
5.64
20.1
71.37
0.82
6.52
3.603.80
1.48
5.20
0.0
5.0
10.0
15.0
20.0
25.0
CY LU UK EL SE NL AT SK CZ FR BE ES FI SI LV PL HU DE IE IT DK PT EE MT LT CH
€, in
clud
ing
VAT
2005 2006 EU25 Weighted
Source for Switzerland: OFCOM Switzerland computation.
115 - Extrait du 12ème rapport d’implémentation de l’UE étendu à la Suisse
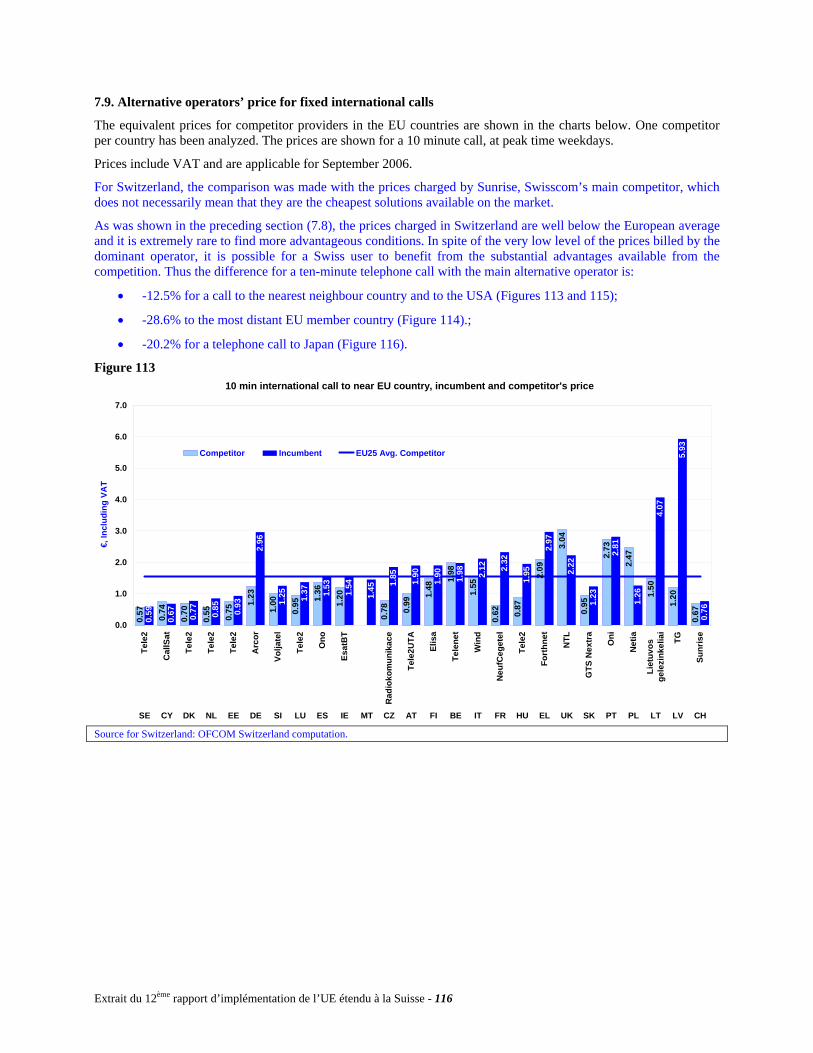
7.9. Alternative operators’ price for fixed international calls The equivalent prices for competitor providers in the EU countries are shown in the charts below. One competitor per country has been analyzed. The prices are shown for a 10 minute call, at peak time weekdays.
Prices include VAT and are applicable for September 2006.
For Switzerland, the comparison was made with the prices charged by Sunrise, Swisscom’s main competitor, which does not necessarily mean that they are the cheapest solutions available on the market.
As was shown in the preceding section (7.8), the prices charged in Switzerland are well below the European average and it is extremely rare to find more advantageous conditions. In spite of the very low level of the prices billed by the dominant operator, it is possible for a Swiss user to benefit from the substantial advantages available from the competition. Thus the difference for a ten-minute telephone call with the main alternative operator is:
• -12.5% for a call to the nearest neighbour country and to the USA (Figures 113 and 115);
• -28.6% to the most distant EU member country (Figure 114).;
• -20.2% for a telephone call to Japan (Figure 116).
Figure 113 10 min international call to near EU country, incumbent and competitor's price
0.70 0.75
1.23
1.00
0.78
1.55
0.62 0.
87
2.09
3.04
0.95
2.73
2.47
1.50
1.20
0.67
0.59
0.67 0.77 0.85 0.93
2.96
1.25 1.37 1.
53
1.54
1.45 1.
85 1.90
1.90 1.98 2.12 2.
32
1.95
2.97
2.22
1.23
2.81
1.26
4.07
5.93
0.76
1.98
1.48
0.991.
201.36
0.95
0.550.74
0.57
0.0
1.0
2.0
3.0
4.0
5.0
6.0
7.0
Tele
2
Cal
lSat
Tele
2
Tele
2
Tele
2
Arc
or
Volja
tel
Tele
2
Ono
Esat
BT
Rad
ioko
mun
ikac
e
Tele
2UTA
Elis
a
Tele
net
Win
d
Neu
fCeg
etel
Tele
2
Fort
hnet
NTL
GTS
Nex
tra
Oni
Net
ia
Liet
uvos
gele
zink
elia
i
TG
Sunr
ise
SE CY DK NL EE DE SI LU ES IE MT CZ AT FI BE IT FR HU EL UK SK PT PL LT LV CH
€, In
clud
ing
VAT
Competitor Incumbent EU25 Avg. Competitor
Source for Switzerland: OFCOM Switzerland computation.
Extrait du 12ème rapport d’implémentation de l’UE étendu à la Suisse - 116
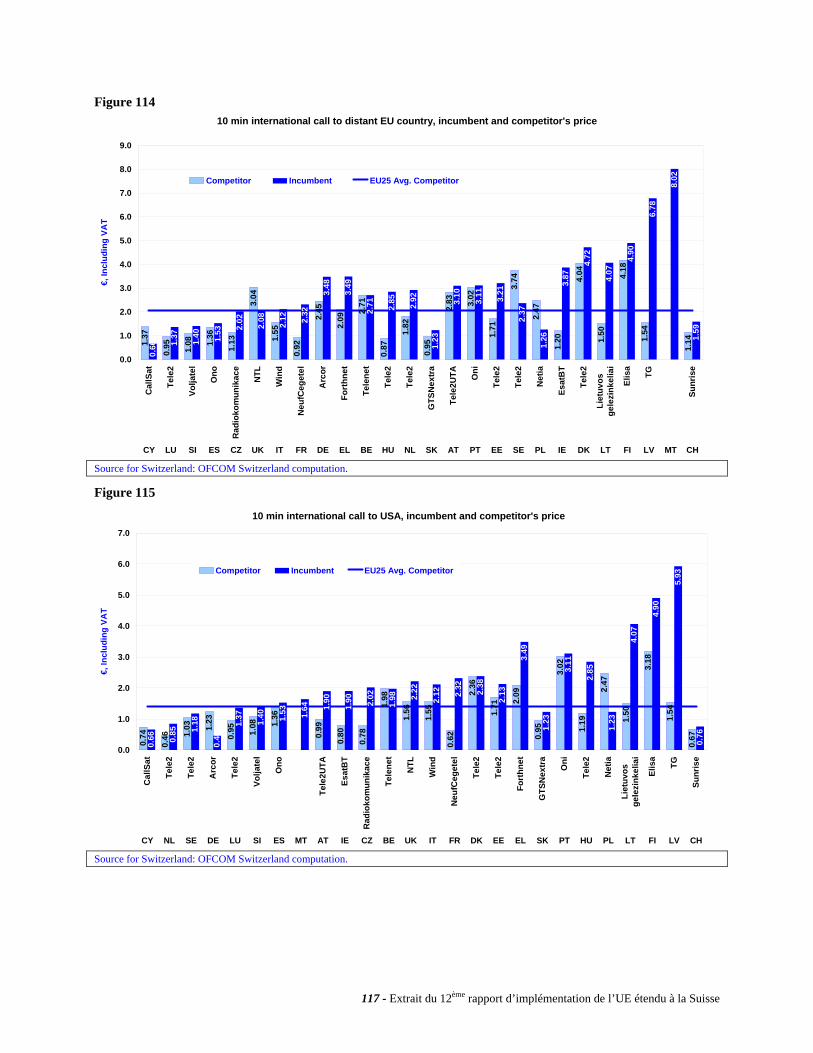
Figure 114 10 min international call to distant EU country, incumbent and competitor's price
1.08
1.13
3.04
1.55
0.87
3.02
1.71
3.74
2.47
1.20
4.04
1.50
4.18
1.54
1.14
0.66 1.
37
1.40 1.53 2.
02 2.08
2.12 2.
32
3.48
3.49
2.71 2.85 2.92
1.23
3.10
3.11 3.21
2.37
1.26
3.87
4.72
4.07
4.90
6.78
8.02
1.59
2.83
0.95
1.82
2.71
2.092.
45
0.921.
36
0.951.
37
0.0
1.0
2.0
3.0
4.0
5.0
6.0
7.0
8.0
9.0C
allS
at
Tele
2
Volja
tel
Ono
Rad
ioko
mun
ikac
e
NTL
Win
d
Neu
fCeg
etel
Arc
or
Fort
hnet
Tele
net
Tele
2
Tele
2
GTS
Nex
tra
Tele
2UTA Oni
Tele
2
Tele
2
Net
ia
Esat
BT
Tele
2
Liet
uvos
gele
zink
elia
i
Elis
a
TG
Sunr
ise
CY LU SI ES CZ UK IT FR DE EL BE HU NL SK AT PT EE SE PL IE DK LT FI LV MT CH
€, In
clud
ing
VAT
Competitor Incumbent EU25 Avg. Competitor
Source for Switzerland: OFCOM Switzerland computation.
Figure 115
10 min international call to USA, incumbent and competitor's price
1.03
0.95 1.08 1.
36
1.98 2.
36
1.71 2.
09
0.95
3.02
1.19
2.47
1.50
3.18
1.54
0.67
0.66 0.
85 1.18
0.46
1.37 1.40 1.53 1.64 1.
90
1.90 2.02
1.98 2.
22
2.12 2.
32 2.38
2.13
3.49
3.11
2.85
1.23
4.07
4.90
5.93
0.76
0.74
0.46
1.23
0.99
0.80
0.78
1.56
1.55
0.62
1.23
0.0
1.0
2.0
3.0
4.0
5.0
6.0
7.0
Cal
lSat
Tele
2
Tele
2
Arc
or
Tele
2
Volja
tel
Ono
Tele
2UTA
Esat
BT
Rad
ioko
mun
ikac
e
Tele
net
NTL
Win
d
Neu
fCeg
etel
Tele
2
Tele
2
Fort
hnet
GTS
Nex
tra
Oni
Tele
2
Net
ia
Liet
uvos
gele
zink
elia
i
Elis
a
TG
Sunr
ise
CY NL SE DE LU SI ES MT AT IE CZ BE UK IT FR DK EE EL SK PT HU PL LT FI LV CH
€, In
clud
ing
VAT
Competitor Incumbent EU25 Avg. Competitor
Source for Switzerland: OFCOM Switzerland computation.
117 - Extrait du 12ème rapport d’implémentation de l’UE étendu à la Suisse
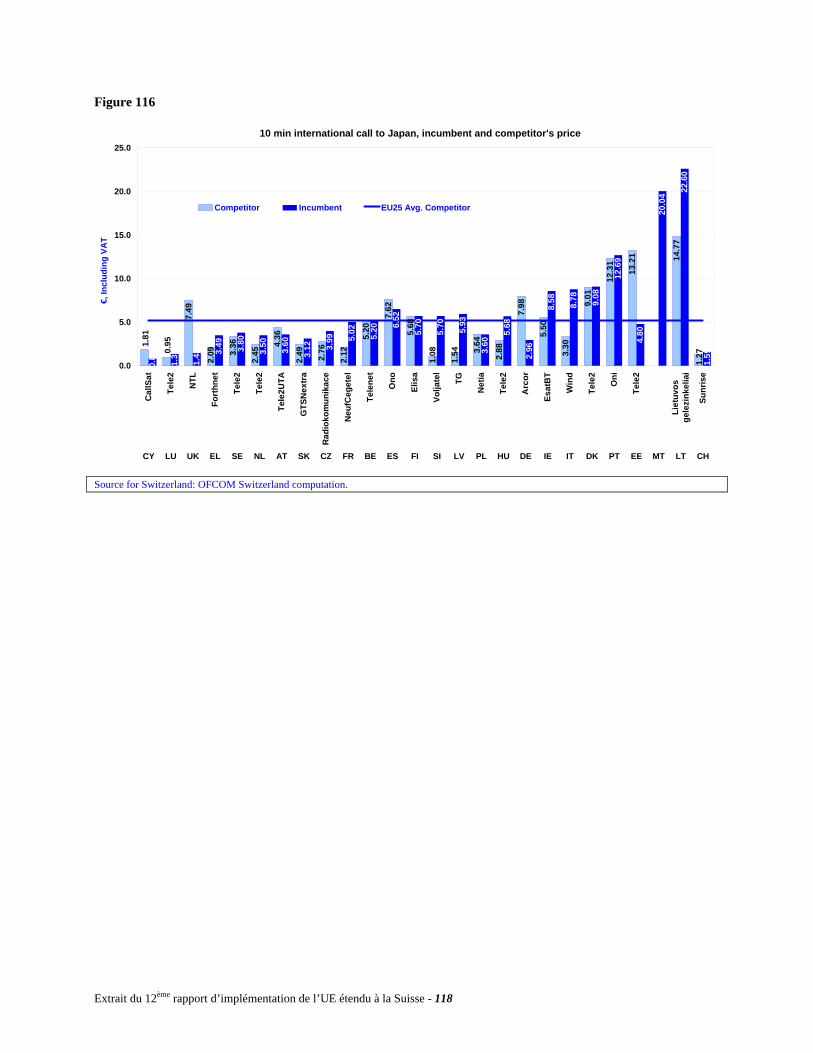
Figure 116
10 min international call to Japan, incumbent and competitor's price
7.49
3.36
2.45
4.36
7.62
3.64
2.88
7.98
5.50
3.30
9.01
12.3
1
13.2
1 14.7
7
3.49 3.80
3.50
3.60
3.12 3.
99 5.02 5.20 6.
52
5.70
5.70 5.93
3.60
5.68
2.96
8.58 8.78 9.08
12.6
9
4.80
20.0
4 22.6
0
1.27
1.81
0.95
2.09
2.49 2.76
2.12
5.20 5.68
1.08
1.54
1.37
1.48
0.82 1.59
0.0
5.0
10.0
15.0
20.0
25.0C
allS
at
Tele
2
NTL
Fort
hnet
Tele
2
Tele
2
Tele
2UTA
GTS
Nex
tra
Rad
ioko
mun
ikac
e
Neu
fCeg
etel
Tele
net
Ono
Elis
a
Volja
tel
TG
Net
ia
Tele
2
Arc
or
Esat
BT
Win
d
Tele
2
Oni
Tele
2
Liet
uvos
gele
zink
elia
i
Sunr
ise
CY LU UK EL SE NL AT SK CZ FR BE ES FI SI LV PL HU DE IE IT DK PT EE MT LT CH
€, In
clud
ing
VAT
Competitor Incumbent EU25 Avg. Competitor
Source for Switzerland: OFCOM Switzerland computation.
Extrait du 12ème rapport d’implémentation de l’UE étendu à la Suisse - 118
8. LEASED LINES RETAIL TARIFFS
This section contains an overview of prices charged by incumbent operators to end users in each Member State (and in some cases in Switzerland) for national and international leased line services as at 1 September 2006. Figures do not cover wholesale prices. Price developments are also analyzed over the period August 2000 - September 2006.
The figures and the information are taken from a study carried out by Teligen-HI, United Kingdom for the Commission. Data on standard retail prices charged by incumbent operators have been collected in each country.
In Switzerland, the retail leased lines market is characterized by opacity with its origin in the small number of players and the competition in which they engage. Charges do not fall with usage. The sole source of information at our disposal is the Teligen T-Basket product. This product, unfortunately, does not include an analysis as detailed as the one presented in this report, which is why certain markets could not be examined (34Mb/s and 155Mb/s, as well as international leased lines). Teligen obtains information from Swisscom and calls the reader’s attention to the fact that the prices charged by the historic operator are negotiated on a case by case basis. Thus Teligen assumes that the notified prices are an objective reflection of the negotiated prices. One final point: Since February 2004, data that were provided by Swisscom to Teligen are no more delivered. This explains why no data are displayed in 2004 for Switzerland.
The only figures that include Switzerland are figures 125a and 126a.
8.1. Incumbents' national leased lines
National leased line data is provided for 2005 and 2006. Two distances are covered: 2 km (local circuits), and 200 km. Tariffs are taken from the incumbent operator in each country. Other operators may offer other prices. In order to properly reflect the tariff structures used in some countries, the circuits may be considered in one of two different ways, depending on tariff structure. The one to apply will differ from carrier to carrier. The principles used in this report for calculating the price of a full circuit are:
1: When tariff specifies local tail prices separately, in addition to main circuit.
2: When tariff specifies a single price for the circuit, end to end, including local tails.
Local tail length Main circuit length Local tail length Main circuit length 2 km circuit 1 km 0 0 2 km 200 km circuit 2 km 196 km 0 200 km Note: The local tail length is per tail, i.e. there will be 2 such tails with each circuit.
Where several tariff options exist depending on type of location, the criteria for choice is as follows:
• 2 km circuits are always within a major city (usually the Capital)
• 200 km circuits are between a major city and a “minor” city
As the definitions vary between countries, the type of tariff option chosen will also vary (see details below). The countries where the price may vary with location or other non-distance related definitions are: Belgium, France, Austria, Finland, Sweden and the United Kingdom.
Some operators apply termination charges per local end, without necessarily covering the local tail circuit within that charge.
4 types of circuits are covered: 64 kb/s, 2 Mb/s, 34 Mb/s and 155 Mbit/s. As not all carriers publish tariffs for all these bitrates and all years, there may be some gaps in the information, especially for higher bitrates.
Some carriers offer 2 Mb/s circuits as both structured and unstructured. In this analysis only unstructured circuits are included.
Also, some carriers offer different types of leased lines, often in the form of “basic circuits” and circuits in a managed network. Only “basic circuits” are included in this analysis, as the managed network services are not comparable between carriers.
Lately a few carriers have decided not to publish their prices for some or all types of leased lines. This makes it increasingly difficult to present a full overview of the prices in all 25 EU countries.
119 - Extrait du 12ème rapport d’implémentation de l’UE étendu à la Suisse
For the USA the prices of Verizon intra-LATA circuits for New York State have been used. The bitrates of leased lines offered in some countries may be different from the ones found in most EU Member States. Some operators may offer 56 kb/s instead of 64 kb/s, 1.5 Mb/s instead of 2 Mb/s, 45 or 50 Mb/s instead of 34 Mb/s, and 140 or 150 Mb/s instead of 155 Mb/s. Prices shown in the tables and graphs in this section of the report have been adjusted according to the difference in capacity.
All prices are presented in EURO per year, excluding VAT. National leased lines prices as at 1 September 2006
The validity dates of the tariffs used in this section are:
Valid date Valid date Valid date Belgium 01/06/04 Cyprus 01/01/06 Slovenia 01/12/02Czech Republic 01/07/06 Latvia 01/06/99 Slovakia 01/09/06Denmark 01/06/06 Lithuania 27/06/03 Finland Germany 01/07/06 Luxembourg 01/05/06 Sweden Estonia 15/06/06 Hungary 01/01/02 United Kingdom 01/01/04Greece 03/04/06 Malta 01/12/04 Japan 01/01/05Spain 15/05/06 Netherlands 01/04/06 USA, Verizon 21/05/05France 01/08/06 Austria 01/09/01 USA, Pacbell 12/03/03Ireland 18/06/03 Poland 01/01/00 Italy 01/11/03 Portugal 01/09/06
Belgium: Belgacom has divided its network into 4 levels based on “economic concentration”. The tariffs shown are for circuits within or between level 1 areas, “Very high economic concentration”. Prices for 155 Mb/s shown here are adjusted from prices for 140 Mb/s circuits. Local circuits within an exchange area are priced as a regular circuit of the given distance.
Czech Republic: Telefonica O2 defines prices for all bitrates based on the price of a 64 kb/s circuit. Coefficients are given for each bitrate available (up to 2 Mb/s), and the price is the product of the 64 kb/s price and the coefficient.Local circuits are defined as a 0 km circuit. 10 distance zones are defined for circuits with more than 0 km between serving exchanges. There are no incremental charges (i.e. per km).
Denmark: TDC divides the leased lines into two categories: Local circuits based on distance bands and whether the two ends are connected to the same exchange or neighboring exchanges. Long distance circuits connected to different exchanges, divided into 4 distance bands. There are no incremental charges (e.g. per km). Prices for 155 Mb/s shown here are adjusted from prices for 140 Mb/s circuits.
Germany: Deutsche Telekom offers different types of circuits. In this analysis the “Standard Festverbindungen” is used. Tariffs are divided into: a) Local 1 (same exchange); b) Local 2, up to or above 15 km; c) Long Distance, < 15km, 15 – 50 km, 50 – 150 km, > 150 km. Local 2 and Long distance use incremental (per km) charges. At 34Mb/s and 155 Mb/s access circuit charges apply, with a distance (per km) element.
Estonia: Elion divides the leased lines into distance bands of 0 – 6 km, 6 – 10 km, 10 – 20 km, >20 km. Trunk circuits above 20 km use incremental (per km) charges. Local circuits are priced as a regular circuit of the given length.
Greece: OTE divides the leased lines into: a) Local circuits, b) Trunk circuits (< 35 km, 35 – 70 km, 70 – 150 km, > 150 km). Trunk circuits use incremental (per km) charges. 64 kb/s charges are for Hellascom service from 2003. Prices for 2004 are those OTE should apply according to the EETT decision of December 2003. Prices have since changed again.
Spain: Telefonica strictly divides leased lines according to distance: a) Distance bands: 0 – 4 km, 4 – 20 km, 20 – 70 km, 70 – 300 km, 300 – 500 km, > 500 km. All bands use incremental (per km) charges. Telefonica does not publish prices for 155 Mb/s circuits. Local circuits within an exchange area are priced as a regular circuit of the given distance.
France: France Telecom offers leased lines in the products Transfix and Transfix 2.0. Transfix is the basic service, and the one used in this analysis. The tariff is divided into distance bands: 0 – 10 km, 10 – 50 km, 50 – 300 km, > 300 km. 34 and 155 Mb/s divide at 30 km and 100 km instead of 50 km. Prices for 2 Mb/s relate to 2,048 kb/s bit rate. 1,920 and 1,984 have different prices. Prices for 34 and 155 Mb/s circuits relate to circuits with one end in a
Extrait du 12ème rapport d’implémentation de l’UE étendu à la Suisse - 120
major city (zone A), as defined by France Telecom. Local circuits within an exchange area are priced as a circuit of the given distance. Additional definitions apply for higher speed circuits.
Ireland: EirCom defins the tariff for leased lines with a local end charge, and main link charges for circuits 0 – 30 km and > 30 km. Local circuits may be made up by 2 local ends, and no main link. Circuits equal to or above 1 Mb/s have a distance incremental charge for local ends over 1.5 km.
Italy: All circuits have an access charge per end, and a main link distance related charge per km. Distance bands are 0 – 60 km, 60 – 300 km, and > 300 km. Circuits from 2 Mb/s and above are available with various levels of reduced charges depending on contract period and overall spend. The most basic level is used in this analysis. Local circuits within an exchange area are priced as two access circuits only.
Cyprus: CYTA divides the leased lines into: a) Subscriber segment, for access. b) Network segment, between exchanges, at distance bands of 0 – 20 km, 20 – 80 km, > 80 km. Local circuits within an exchange area are priced as two subscriber segments.
Latvia: Lattelekom circuits have the same price regardless of distance. Prices are only provided for circuits up to 2 Mb/s.
Lithuania: Lietuvos Telekomas distinguish between circuits inside the local exchange area, and those beyond the local exchange area.
Luxembourg: P&T Luxembourg divide the leased lines tariff into 4 types of circuits: Same local network, contiguous local network of same nodal sector, same nodal sector or contiguous local networks of different nodal sectors, and non-contiguous local networks of different nodal sectors. This definition relates to the network hierarchy, and not to distance. Distances at 200 km are not possible. Local circuits within an exchange area are priced as a circuit in the same local network.
Hungary: Matav applies an access circuit charge for each end of the circuit, and a fixed basic charge and a per km charge for the trunk part. Matav does not publish prices for national circuits, so data have not been updated.
Malta: Maltacom has a flat charge regardless of distance, only dependent of bitrate.
Netherlands: KPN Telecom offer leased lines as Digital Standard and DigiStream services. Digital Standard is the basic service, and the one used in this analysis. Tariffs are divided into a charge per connecting point and a main link charge. The main link charge is divided into two zones: Up to 50 km with a fixed basic charge and an incremental per km charge, and over 50 km with a fixed basic charge. Prices are in effect capped above 50 km. Local circuits within an exchange area are priced as two access connections plus a short main link of the given distance. OPTA has found that the market for 2 Mb/s circuits is competitive, meaning that prices indicated by KPN are maximum prices, and will normally be used as a basis for negotiating a (lower) price.
Austria: Telecom Austria divides the “Digitaler Stromweg” circuits into 2 categories: City-tarif when both ends of the circuit are in category A cities (a defined list of 68 towns and cities), and Normal-tarif when the above does not apply. This analysis used the City-Tarif. The Normal-tarif would in most cases come out more expensive. For the years up to 2000 a different tariff scheme applied, with a different list of towns, and 3 instead of 2 categories. The tariff is based on a charge per local end, and a distance related charge per km. The distance bands vary with bit rate. Local circuits within an exchange area are priced as two access circuits only.
Poland: Polish Telecom has no recurring charges related to the access. A basic charge plus a per km charge is applied for the full length of the circuit. Distance bands are divided into 0 – 3 km, 3 – 20 km, 20 – 30 km, 30 – 50 km, 50 – 100 km, 100 – 200 km, over 200 km.
Portugal: Portugal Telecom divides the leased line tariff into local access circuit charge, and a main link with a fixed and an incremental charge per km. Distance bands are 0 – 10 km, 10 – 30 km, 30 – 50 km, 50 – 100 km, over 100 km. Local circuits connected to the same exchange will not incur main link charges. Local circuits within an exchange area are priced as two access circuits only.
Slovenia: Telekom Slovenije divides the leased line tariffs into 3 distance bands: 0 – 5 km, 5 – 50 km and over 50 km. Each of these bands have a basic price and a per km price. Distance is calculated between serving exchanges.
Slovakia: Slovak Telecom defines the leased line tariff in two parts: Local Access and Intercity. The Intercity part is divided into 3 distance bands: 0 – 50 km, 50 – 100 km and over 100 km. Prices are given for the 64 kb/s bitrate. Other bitrates between 9.6 kb/s and 2048 kb/s are calculated based on the 64 kb/s price using a multiplication factor.
121 - Extrait du 12ème rapport d’implémentation de l’UE étendu à la Suisse
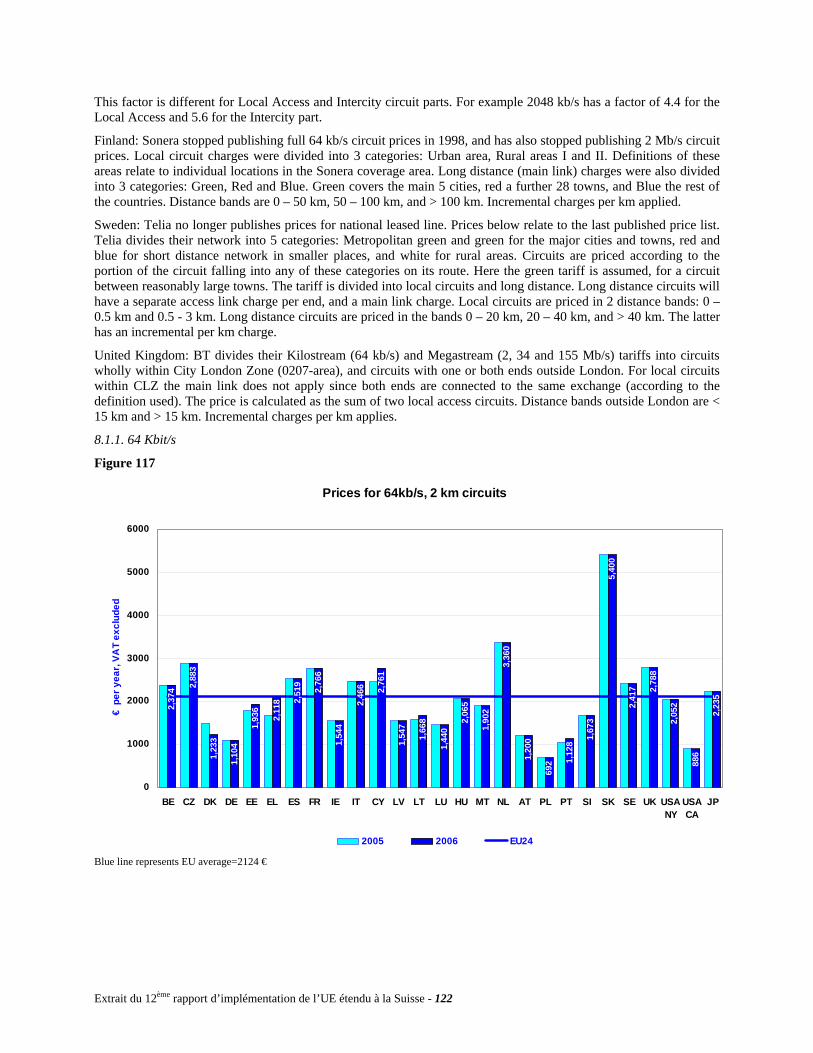
This factor is different for Local Access and Intercity circuit parts. For example 2048 kb/s has a factor of 4.4 for the Local Access and 5.6 for the Intercity part.
Finland: Sonera stopped publishing full 64 kb/s circuit prices in 1998, and has also stopped publishing 2 Mb/s circuit prices. Local circuit charges were divided into 3 categories: Urban area, Rural areas I and II. Definitions of these areas relate to individual locations in the Sonera coverage area. Long distance (main link) charges were also divided into 3 categories: Green, Red and Blue. Green covers the main 5 cities, red a further 28 towns, and Blue the rest of the countries. Distance bands are 0 – 50 km, 50 – 100 km, and > 100 km. Incremental charges per km applied.
Sweden: Telia no longer publishes prices for national leased line. Prices below relate to the last published price list. Telia divides their network into 5 categories: Metropolitan green and green for the major cities and towns, red and blue for short distance network in smaller places, and white for rural areas. Circuits are priced according to the portion of the circuit falling into any of these categories on its route. Here the green tariff is assumed, for a circuit between reasonably large towns. The tariff is divided into local circuits and long distance. Long distance circuits will have a separate access link charge per end, and a main link charge. Local circuits are priced in 2 distance bands: 0 – 0.5 km and 0.5 - 3 km. Long distance circuits are priced in the bands 0 – 20 km, 20 – 40 km, and > 40 km. The latter has an incremental per km charge.
United Kingdom: BT divides their Kilostream (64 kb/s) and Megastream (2, 34 and 155 Mb/s) tariffs into circuits wholly within City London Zone (0207-area), and circuits with one or both ends outside London. For local circuits within CLZ the main link does not apply since both ends are connected to the same exchange (according to the definition used). The price is calculated as the sum of two local access circuits. Distance bands outside London are < 15 km and > 15 km. Incremental charges per km applies.
8.1.1. 64 Kbit/s
Figure 117
Prices for 64kb/s, 2 km circuits
2,37
4 2,88
3
1,23
3
1,10
4
1,93
6
2,11
8 2,51
9
2,76
6
1,54
4
2,46
6 2,76
1
1,54
7
1,66
8
1,44
0
2,06
5
1,90
2
3,36
0
1,20
0
692 1,
128
1,67
3
5,40
0
2,41
7 2,78
8
2,05
2
886
2,23
5
0
1000
2000
3000
4000
5000
6000
BE CZ DK DE EE EL ES FR IE IT CY LV LT LU HU MT NL AT PL PT SI SK SE UK USANY
USACA
JP
€ p
er y
ear,
VAT
excl
uded
2005 2006 EU24
Blue line represents EU average=2124 €
Extrait du 12ème rapport d’implémentation de l’UE étendu à la Suisse - 122
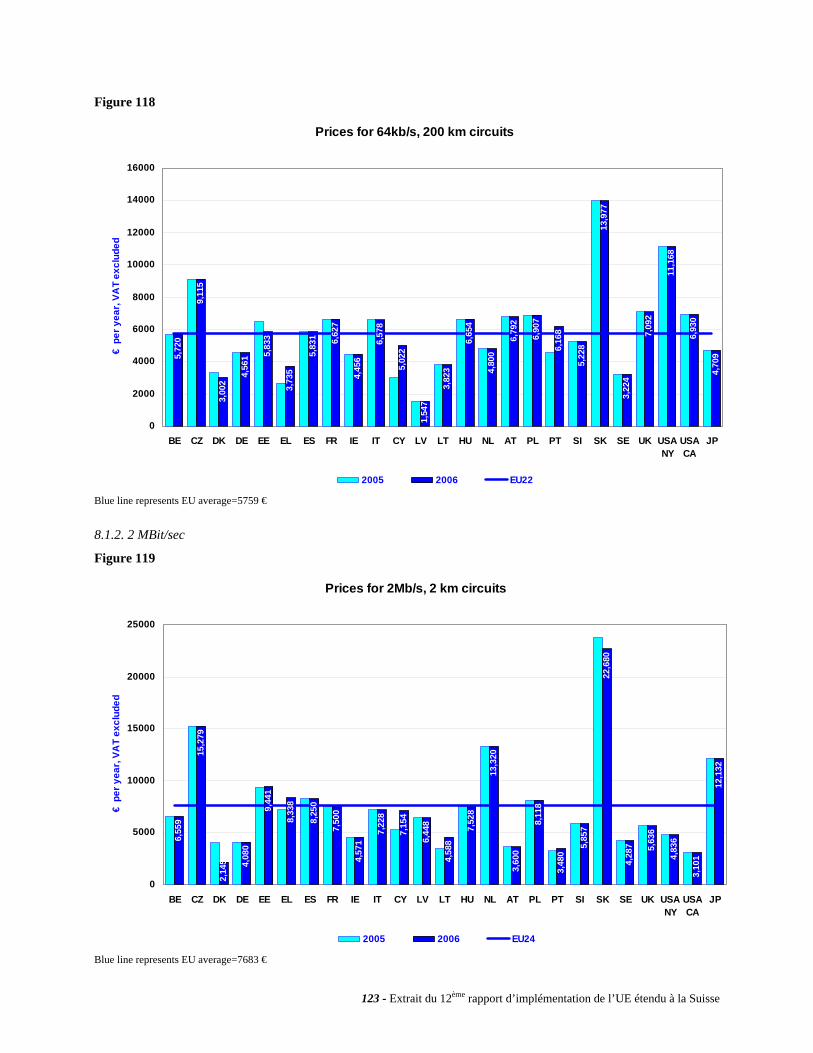
Figure 118
Prices for 64kb/s, 200 km circuits
5,72
0
9,11
5
3,00
2
4,56
1 5,83
3
3,73
5
5,83
1 6,62
7
4,45
6
6,57
8
5,02
2
1,54
7
3,82
3
6,65
4
4,80
0
6,79
2
6,90
7
6,16
8
5,22
8
13,9
77
3,22
4
7,09
2
11,1
68
6,93
0
4,70
9
0
2000
4000
6000
8000
10000
12000
14000
16000
BE CZ DK DE EE EL ES FR IE IT CY LV LT HU NL AT PL PT SI SK SE UK USANY
USACA
JP
€ p
er y
ear,
VAT
excl
uded
2005 2006 EU22
Blue line represents EU average=5759 €
8.1.2. 2 MBit/sec
Figure 119
Prices for 2Mb/s, 2 km circuits
6,55
9
15,2
79
2,14
5 4,08
0
9,44
1
8,33
8
8,25
0
7,50
0
4,57
1
7,22
8
7,15
4
6,44
8
4,58
8
7,52
8
13,3
20
3,60
0
8,11
8
3,48
0
5,85
7
22,6
80
4,28
7 5,63
6
4,83
6
3,10
1
12,1
32
0
5000
10000
15000
20000
25000
BE CZ DK DE EE EL ES FR IE IT CY LV LT HU NL AT PL PT SI SK SE UK USANY
USACA
JP
€ p
er y
ear,
VAT
excl
uded
2005 2006 EU24
Blue line represents EU average=7683 €
123 - Extrait du 12ème rapport d’implémentation de l’UE étendu à la Suisse
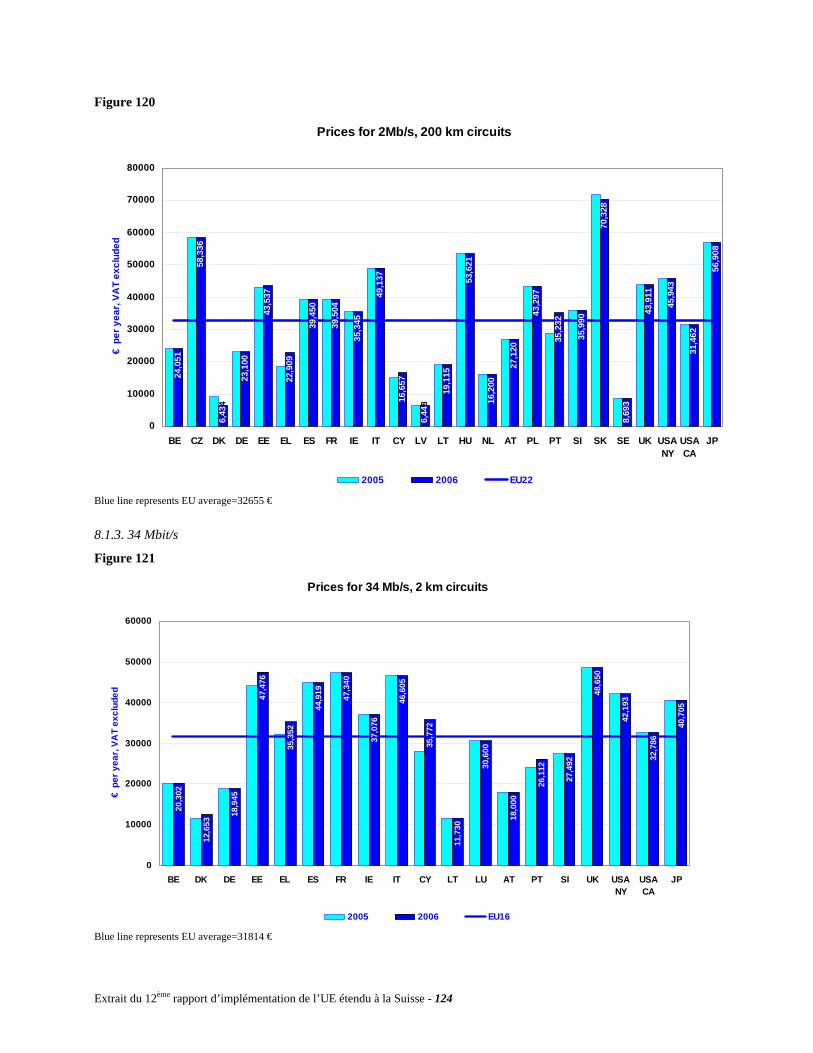
Figure 120
Prices for 2Mb/s, 200 km circuits
24,0
51
58,3
36
23,1
00
43,5
37
22,9
09
39,4
50
39,5
04
35,3
45
49,1
37
16,6
57
19,1
15
53,6
21
16,2
00
27,1
20
43,2
97
35,2
32
35,9
90
70,3
28
8,69
3
43,9
11
45,9
43
31,4
62
56,9
08
6,44
8
6,43
4
0
10000
20000
30000
40000
50000
60000
70000
80000
BE CZ DK DE EE EL ES FR IE IT CY LV LT HU NL AT PL PT SI SK SE UK USANY
USACA
JP
€ p
er y
ear,
VAT
excl
uded
2005 2006 EU22
Blue line represents EU average=32655 €
8.1.3. 34 Mbit/s
Figure 121
Prices for 34 Mb/s, 2 km circuits
20,3
02
12,6
53
18,9
45
47,4
76
35,3
52
44,9
19
47,3
40
37,0
76
46,6
05
35,7
72
11,7
30
30,6
00
18,0
00
26,1
12
27,4
92
48,6
50
42,1
93
32,7
86
40,7
05
0
10000
20000
30000
40000
50000
60000
BE DK DE EE EL ES FR IE IT CY LT LU AT PT SI UK USANY
USACA
JP
€ p
er y
ear,
VAT
excl
uded
2005 2006 EU16
Blue line represents EU average=31814 €
Extrait du 12ème rapport d’implémentation de l’UE étendu à la Suisse - 124
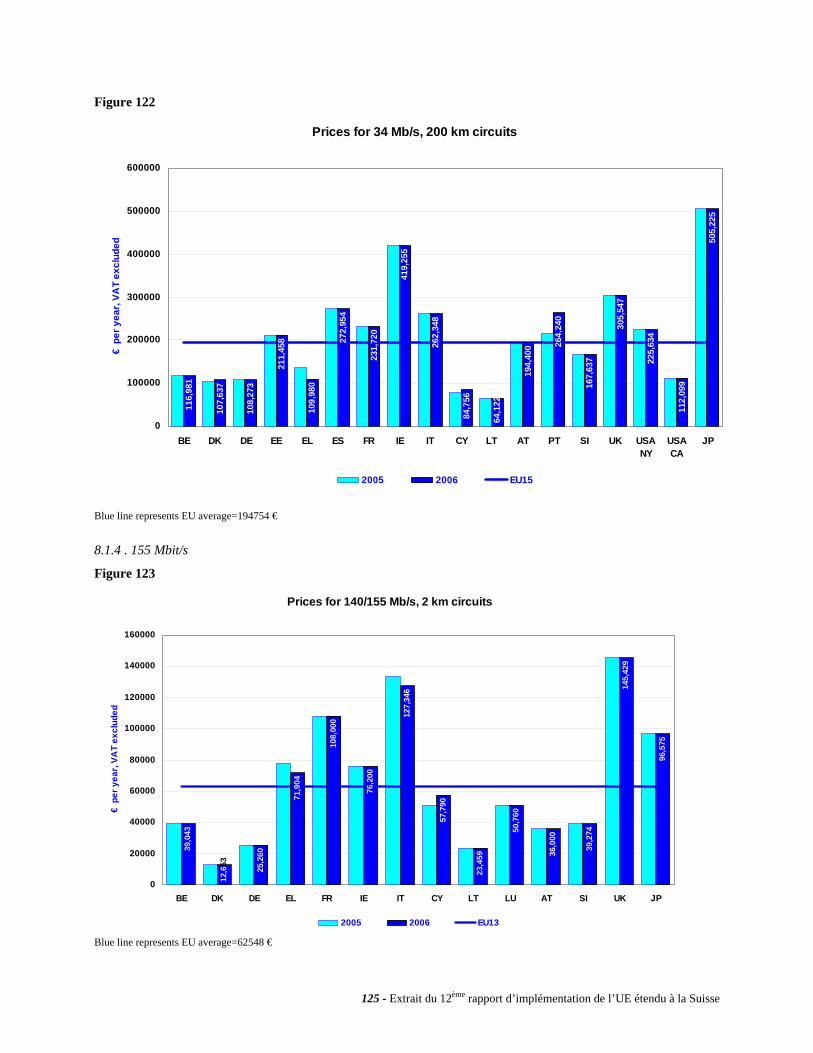
Figure 122
Prices for 34 Mb/s, 200 km circuits
116,
981
107,
637
108,
273
211,
458
109,
980
272,
954
231,
720
419,
255
262,
348
84,7
56
64,1
22
194,
400 26
4,24
0
167,
637
305,
547
225,
634
112,
099
505,
225
0
100000
200000
300000
400000
500000
600000
BE DK DE EE EL ES FR IE IT CY LT AT PT SI UK USANY
USACA
JP
€ p
er y
ear,
VAT
excl
uded
2005 2006 EU15
Blue line represents EU average=194754 €
8.1.4 . 155 Mbit/s
Figure 123
Prices for 140/155 Mb/s, 2 km circuits
39,0
43
25,2
60
71,9
04
108,
000
76,2
00
127,
346
57,7
90
23,4
59
50,7
60
36,0
00
39,2
74
145,
429
96,5
75
12,6
53
0
20000
40000
60000
80000
100000
120000
140000
160000
BE DK DE EL FR IE IT CY LT LU AT SI UK JP
€ p
er y
ear,
VAT
excl
uded
2005 2006 EU13
Blue line represents EU average=62548 €
125 - Extrait du 12ème rapport d’implémentation de l’UE étendu à la Suisse
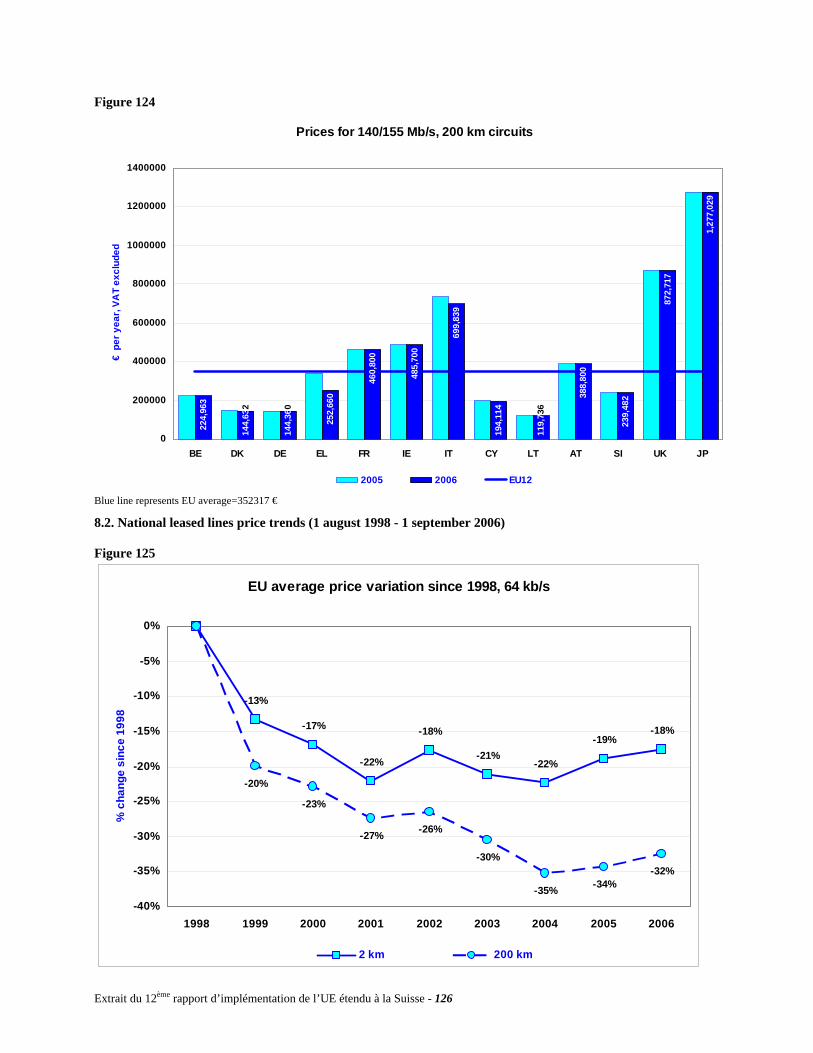
Figure 124
Prices for 140/155 Mb/s, 200 km circuits
224,
963
252,
660
460,
800
485,
700
699,
839
194,
114
388,
800
239,
482
872,
717
1,27
7,02
9
119,
736
144,
360
144,
632
0
200000
400000
600000
800000
1000000
1200000
1400000
BE DK DE EL FR IE IT CY LT AT SI UK JP
€ p
er y
ear,
VAT
excl
uded
2005 2006 EU12
Blue line represents EU average=352317 €
8.2. National leased lines price trends (1 august 1998 - 1 september 2006) Figure 125
EU average price variation since 1998, 64 kb/s
-13%
-17%
-22%
-18%
-21%-22%
-19%-18%
-20%
-23%
-27% -26%
-30%
-35% -34%-32%
-40%
-35%
-30%
-25%
-20%
-15%
-10%
-5%
0%
1998 1999 2000 2001 2002 2003 2004 2005 2006
% c
hang
e si
nce
1998
2 km 200 km
Extrait du 12ème rapport d’implémentation de l’UE étendu à la Suisse - 126
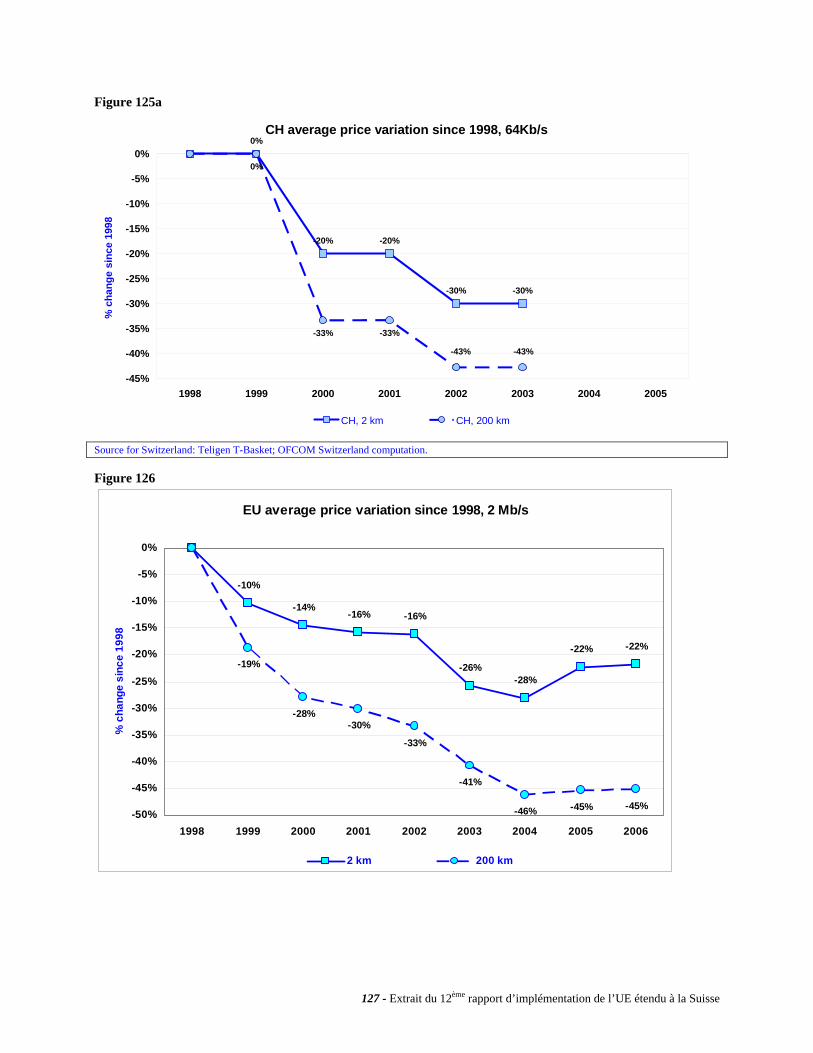
Figure 125a
CH average price variation since 1998, 64Kb/s
-30%
0%
-30%
-20%-20%
-43%
0%
-33% -33%
-43%
-45%
-40%
-35%
-30%
-25%
-20%
-15%
-10%
-5%
0%
1998 1999 2000 2001 2002 2003 2004 2005
% c
hang
e si
nce
1998
CH, 2 km CH, 200 km
Source for Switzerland: Teligen T-Basket; OFCOM Switzerland computation. Figure 126
EU average price variation since 1998, 2 Mb/s
-10%
-14%-16% -16%
-26%-28%
-22% -22%
-19%
-28%-30%
-33%
-41%
-46% -45% -45%-50%
-45%
-40%
-35%
-30%
-25%
-20%
-15%
-10%
-5%
0%
1998 1999 2000 2001 2002 2003 2004 2005 2006
% c
hang
e si
nce
1998
2 km 200 km
127 - Extrait du 12ème rapport d’implémentation de l’UE étendu à la Suisse
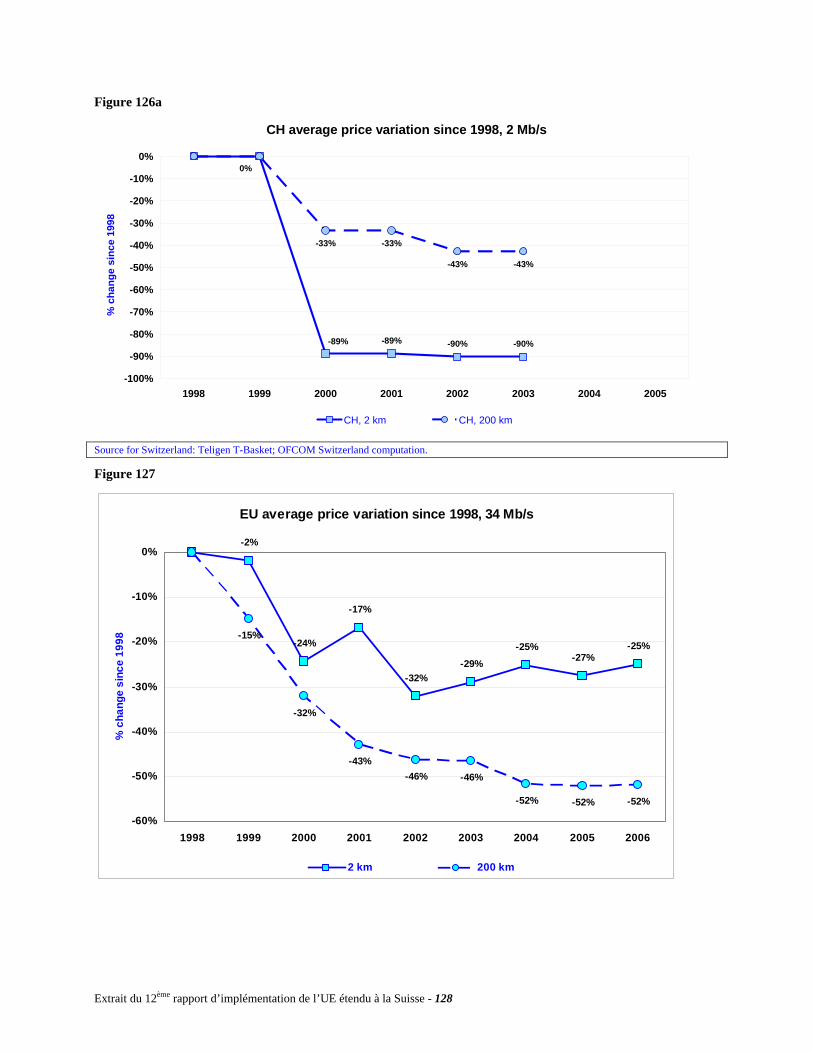
Figure 126a
CH average price variation since 1998, 2 Mb/s
-90%-89% -89% -90%
0%
-43%
-33%-33%
-43%
-100%
-90%
-80%
-70%
-60%
-50%
-40%
-30%
-20%
-10%
0%
1998 1999 2000 2001 2002 2003 2004 2005
% c
hang
e si
nce
1998
CH, 2 km CH, 200 km
Source for Switzerland: Teligen T-Basket; OFCOM Switzerland computation.
Figure 127
EU average price variation since 1998, 34 Mb/s
-2%
-24%
-17%
-32%-29%
-25%-27%
-25%-15%
-32%
-43%-46% -46%
-52% -52% -52%
-60%
-50%
-40%
-30%
-20%
-10%
0%
1998 1999 2000 2001 2002 2003 2004 2005 2006
% c
hang
e si
nce
1998
2 km 200 km
Extrait du 12ème rapport d’implémentation de l’UE étendu à la Suisse - 128
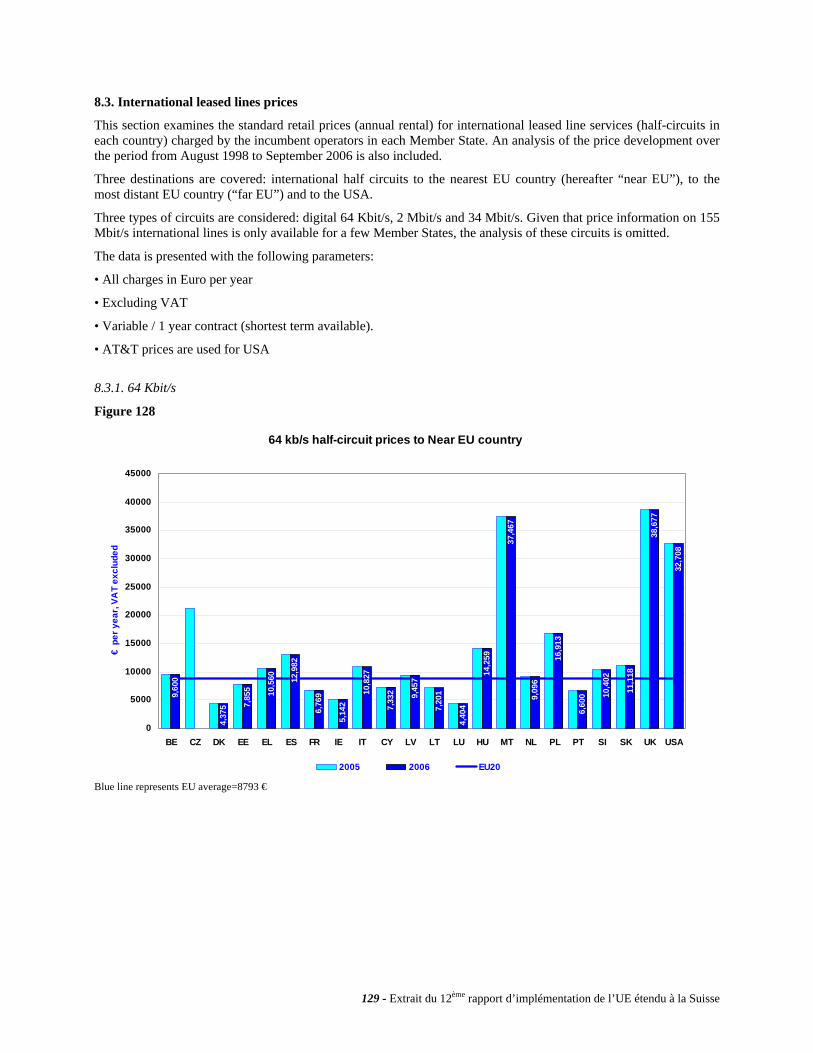
8.3. International leased lines prices
This section examines the standard retail prices (annual rental) for international leased line services (half-circuits in each country) charged by the incumbent operators in each Member State. An analysis of the price development over the period from August 1998 to September 2006 is also included.
Three destinations are covered: international half circuits to the nearest EU country (hereafter “near EU”), to the most distant EU country (“far EU”) and to the USA.
Three types of circuits are considered: digital 64 Kbit/s, 2 Mbit/s and 34 Mbit/s. Given that price information on 155 Mbit/s international lines is only available for a few Member States, the analysis of these circuits is omitted.
The data is presented with the following parameters:
• All charges in Euro per year
• Excluding VAT
• Variable / 1 year contract (shortest term available).
• AT&T prices are used for USA
8.3.1. 64 Kbit/s
Figure 128
64 kb/s half-circuit prices to Near EU country
9,60
0
0 4,37
5 7,85
5 10,5
60 12,9
82
6,76
9
5,14
2
10,8
27
7,33
2 9,45
7
7,20
1
4,40
4
14,2
59
37,4
67
9,09
6
16,9
13
6,60
0 10,4
02
11,1
18
38,6
77
32,7
08
0
5000
10000
15000
20000
25000
30000
35000
40000
45000
BE CZ DK EE EL ES FR IE IT CY LV LT LU HU MT NL PL PT SI SK UK USA
€ p
er y
ear,
VAT
excl
uded
2005 2006 EU20
Blue line represents EU average=8793 €
129 - Extrait du 12ème rapport d’implémentation de l’UE étendu à la Suisse
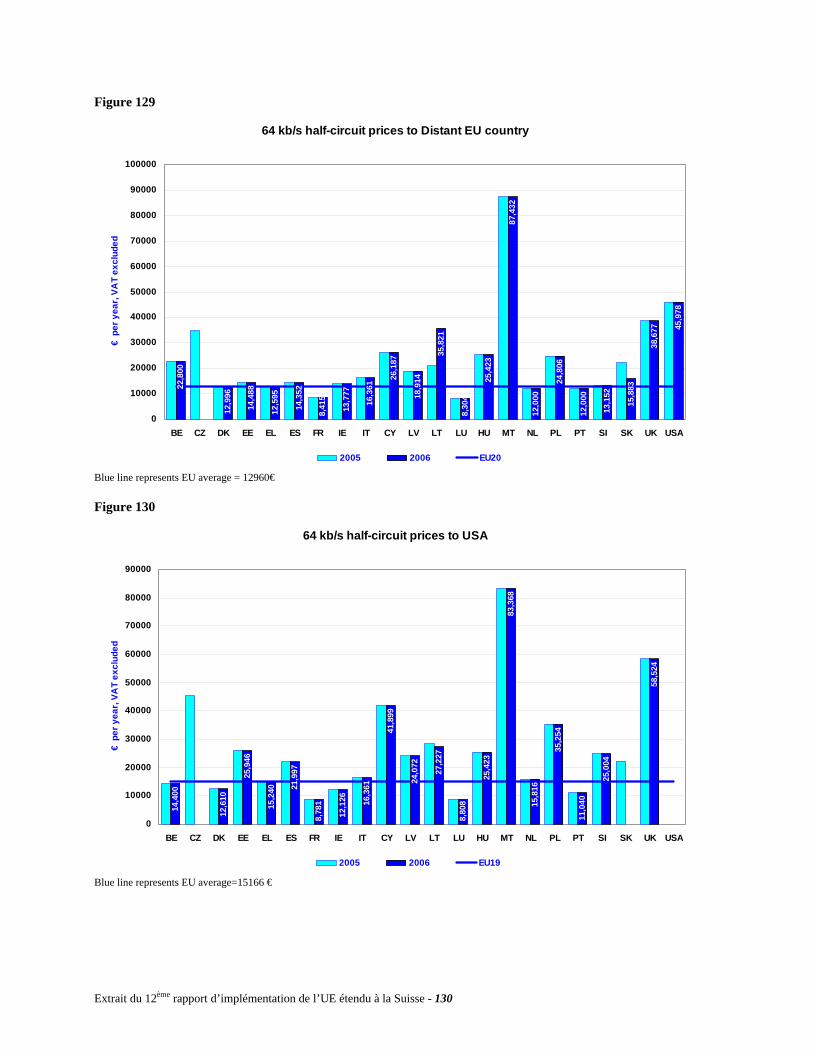
Figure 129
64 kb/s half-circuit prices to Distant EU country
22,8
00
0 12,9
96
14,4
88
12,5
95
14,3
52
8,41
5
13,7
77
16,3
61
26,1
87
18,9
14
35,8
21
8,30
4
25,4
23
87,4
32
12,0
00
24,8
06
12,0
00
13,1
52
15,8
83
38,6
77 45,9
78
0
10000
20000
30000
40000
50000
60000
70000
80000
90000
100000
BE CZ DK EE EL ES FR IE IT CY LV LT LU HU MT NL PL PT SI SK UK USA
€ p
er y
ear,
VAT
excl
uded
2005 2006 EU20
Blue line represents EU average = 12960€ Figure 130
64 kb/s half-circuit prices to USA
14,4
00
0 12,6
10
25,9
46
15,2
40 21,9
97
8,78
1
12,1
26 16,3
61
41,8
99
24,0
72
27,2
27
8,80
8
25,4
23
83,3
68
15,8
16
35,2
54
11,0
40
25,0
04
0
58,5
24
00
10000
20000
30000
40000
50000
60000
70000
80000
90000
BE CZ DK EE EL ES FR IE IT CY LV LT LU HU MT NL PL PT SI SK UK USA
€ p
er y
ear,
VAT
excl
uded
2005 2006 EU19
Blue line represents EU average=15166 €
Extrait du 12ème rapport d’implémentation de l’UE étendu à la Suisse - 130
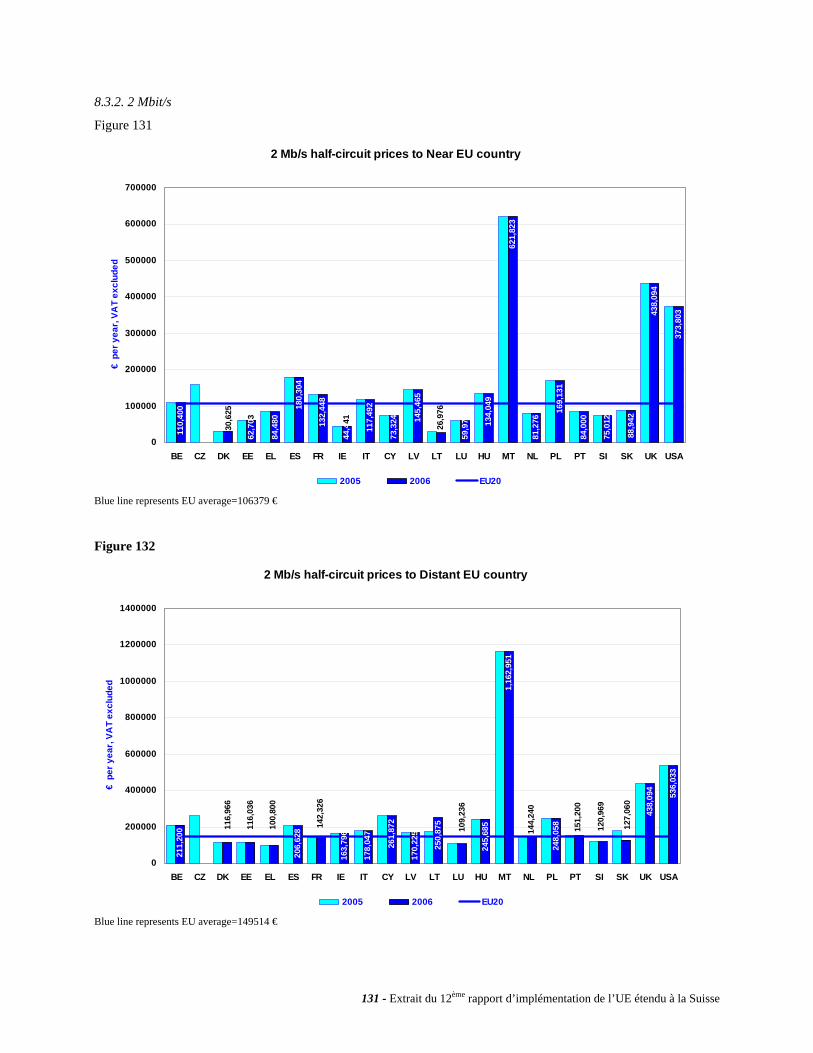
8.3.2. 2 Mbit/s
Figure 131
2 Mb/s half-circuit prices to Near EU country
110,
400
0 84,4
80
180,
304
132,
448
117,
492
73,3
24 145,
465
59,9
76 134,
049
621,
823
81,2
76
169,
131
84,0
00
75,0
12
88,9
42
438,
094
373,
803
26,9
76
44,4
41
62,7
03
30,6
25
0
100000
200000
300000
400000
500000
600000
700000
BE CZ DK EE EL ES FR IE IT CY LV LT LU HU MT NL PL PT SI SK UK USA
€ p
er y
ear,
VAT
excl
uded
2005 2006 EU20
Blue line represents EU average=106379 €
Figure 132
2 Mb/s half-circuit prices to Distant EU country
211,
200
0 206,
628
178,
047
261,
872
170,
225
250,
875
245,
685
1,16
2,95
1
248,
058
438,
094
536,
033
127,
060
120,
969
151,
200
144,
240
109,
236
163,
796
142,
326
100,
800
116,
036
116,
966
0
200000
400000
600000
800000
1000000
1200000
1400000
BE CZ DK EE EL ES FR IE IT CY LV LT LU HU MT NL PL PT SI SK UK USA
€ p
er y
ear,
VAT
excl
uded
2005 2006 EU20
Blue line represents EU average=149514 €
131 - Extrait du 12ème rapport d’implémentation de l’UE étendu à la Suisse
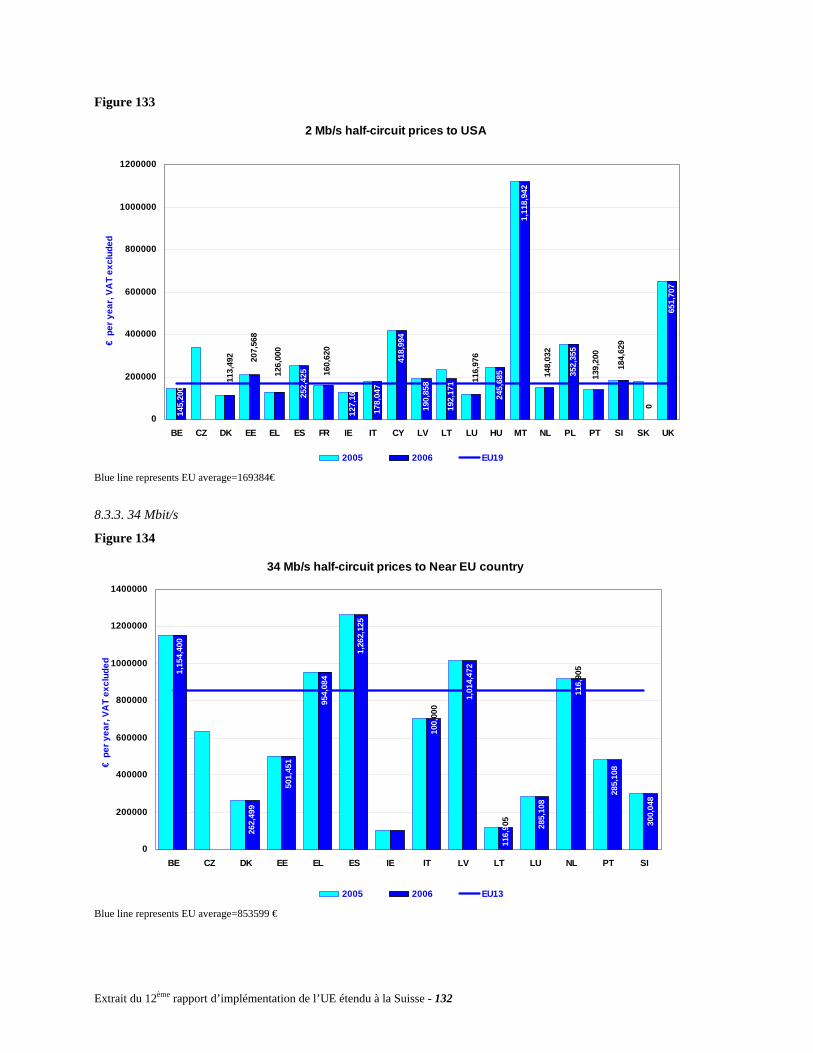
Figure 133
2 Mb/s half-circuit prices to USA
145,
200
0
252,
425
178,
047
418,
994
190,
858
192,
171
245,
685
1,11
8,94
2
352,
355
651,
707
0
184,
629
139,
200
148,
032
116,
976
127,
164
160,
620
126,
000
207,
568
113,
492
0
200000
400000
600000
800000
1000000
1200000
BE CZ DK EE EL ES FR IE IT CY LV LT LU HU MT NL PL PT SI SK UK
€ p
er y
ear,
VAT
excl
uded
2005 2006 EU19
Blue line represents EU average=169384€
8.3.3. 34 Mbit/s
Figure 134
34 Mb/s half-circuit prices to Near EU country
1,15
4,40
0
0
1,26
2,12
5
1,01
4,47
2
285,
108
300,
048
116,
905
116,
905
285,
108
100,
00095
4,08
4
501,
451
262,
499
0
200000
400000
600000
800000
1000000
1200000
1400000
BE CZ DK EE EL ES IE IT LV LT LU NL PT SI
€ p
er y
ear,
VAT
excl
uded
2005 2006 EU13
Blue line represents EU average=853599 €
Extrait du 12ème rapport d’implémentation de l’UE étendu à la Suisse - 132
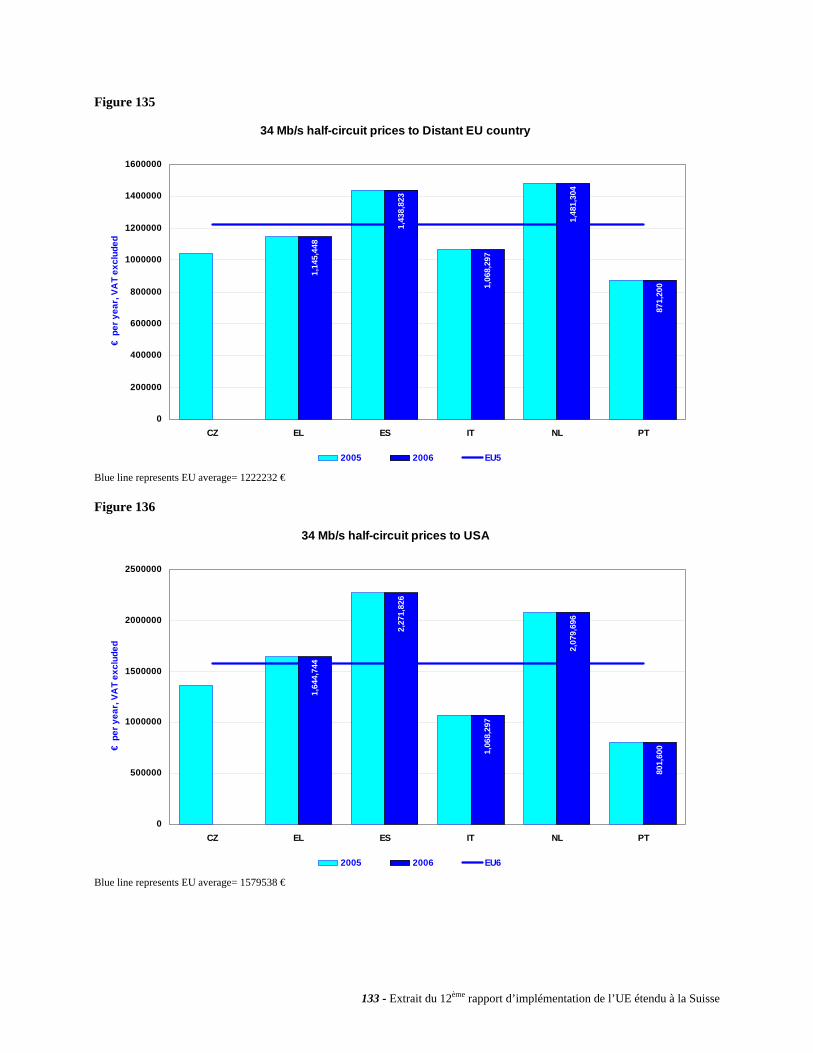
Figure 135
34 Mb/s half-circuit prices to Distant EU country
0
1,14
5,44
8
1,43
8,82
3
1,06
8,29
7
1,48
1,30
4
871,
200
0
200000
400000
600000
800000
1000000
1200000
1400000
1600000
CZ EL ES IT NL PT
€ p
er y
ear,
VAT
excl
uded
2005 2006 EU5
Blue line represents EU average= 1222232 € Figure 136
34 Mb/s half-circuit prices to USA
0
1,64
4,74
4
2,27
1,82
6
1,06
8,29
7
2,07
9,69
6
801,
600
0
500000
1000000
1500000
2000000
2500000
CZ EL ES IT NL PT
€ p
er y
ear,
VAT
excl
uded
2005 2006 EU6
Blue line represents EU average= 1579538 €
133 - Extrait du 12ème rapport d’implémentation de l’UE étendu à la Suisse
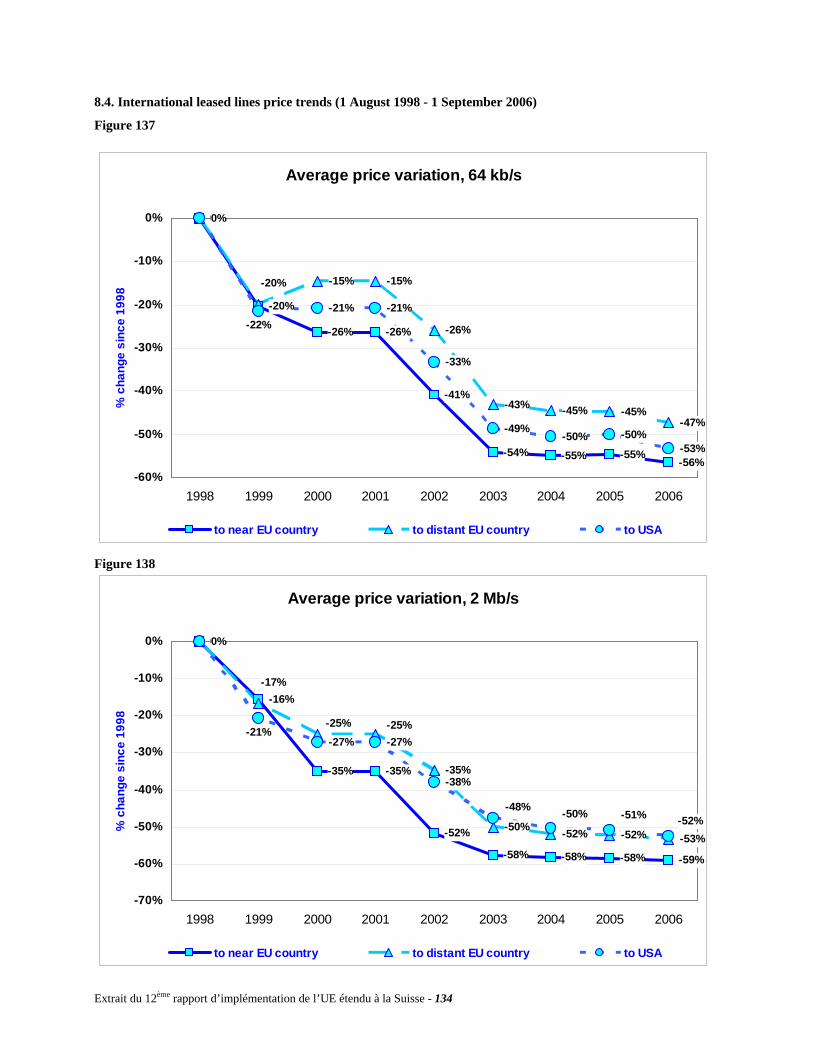
8.4. International leased lines price trends (1 August 1998 - 1 September 2006)
Figure 137
Average price variation, 64 kb/s
0%
-20%
-26% -26%
-41%
-54% -55% -55%-56%
0%
-15% -15%
-26%
-43% -45% -45%-47%
0%
-21% -21%
-33%
-49%-50% -50%
-53%
-20%
-22%
-60%
-50%
-40%
-30%
-20%
-10%
0%
1998 1999 2000 2001 2002 2003 2004 2005 2006
% c
hang
e si
nce
1998
to near EU country to distant EU country to USA
Figure 138
Average price variation, 2 Mb/s
0%
-16%
-35% -35%
-52%
-58% -58% -58% -59%
0%
-35%
-50% -52% -52% -53%
0%
-27% -27%
-38%
-25%-25%
-17%
-52%-51%-48% -50%
-21%
-70%
-60%
-50%
-40%
-30%
-20%
-10%
0%
1998 1999 2000 2001 2002 2003 2004 2005 2006
% c
hang
e si
nce
1998
to near EU country to distant EU country to USA
Extrait du 12ème rapport d’implémentation de l’UE étendu à la Suisse - 134
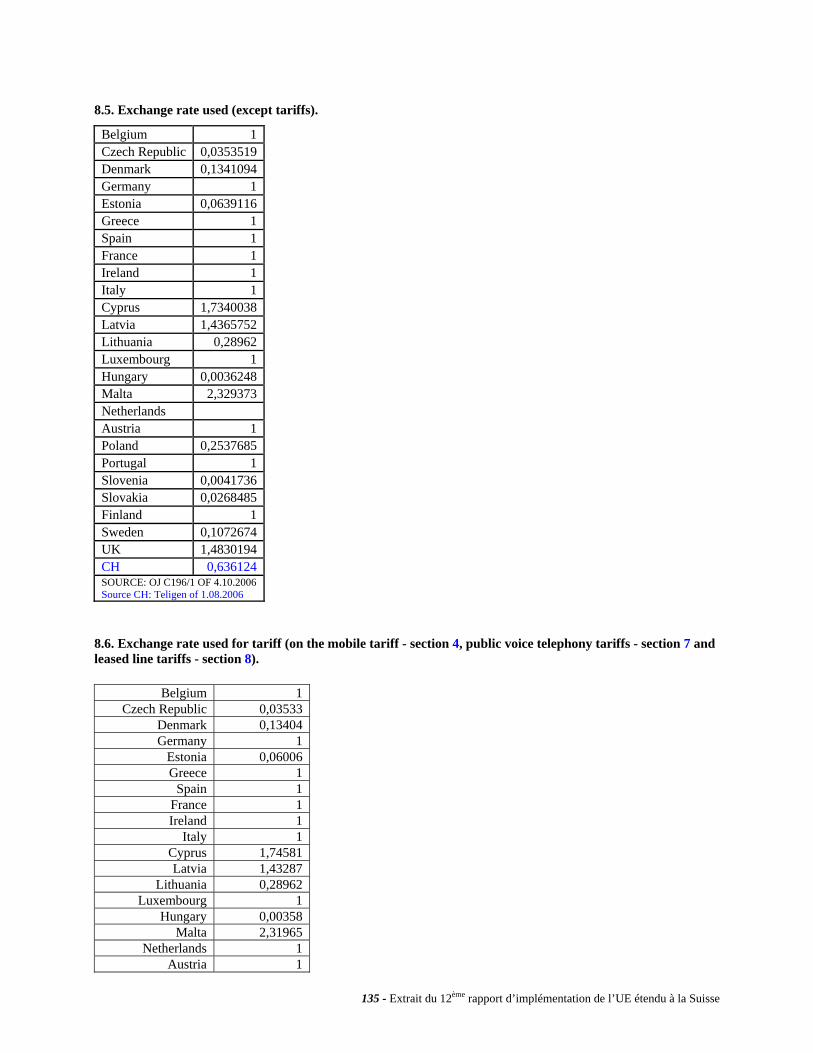
8.5. Exchange rate used (except tariffs). Belgium 1 Czech Republic 0,0353519 Denmark 0,1341094 Germany 1 Estonia 0,0639116 Greece 1 Spain 1 France 1 Ireland 1 Italy 1 Cyprus 1,7340038 Latvia 1,4365752 Lithuania 0,28962 Luxembourg 1 Hungary 0,0036248 Malta 2,329373 Netherlands Austria 1 Poland 0,2537685 Portugal 1 Slovenia 0,0041736 Slovakia 0,0268485 Finland 1 Sweden 0,1072674 UK 1,4830194 CH 0,636124 SOURCE: OJ C196/1 OF 4.10.2006 Source CH: Teligen of 1.08.2006
8.6. Exchange rate used for tariff (on the mobile tariff - section 4, public voice telephony tariffs - section 7 and leased line tariffs - section 8).
Belgium 1
Czech Republic 0,03533 Denmark 0,13404 Germany 1
Estonia 0,06006 Greece 1
Spain 1 France 1 Ireland 1
Italy 1 Cyprus 1,74581 Latvia 1,43287
Lithuania 0,28962 Luxembourg 1
Hungary 0,00358 Malta 2,31965
Netherlands 1 Austria 1
135 - Extrait du 12ème rapport d’implémentation de l’UE étendu à la Suisse
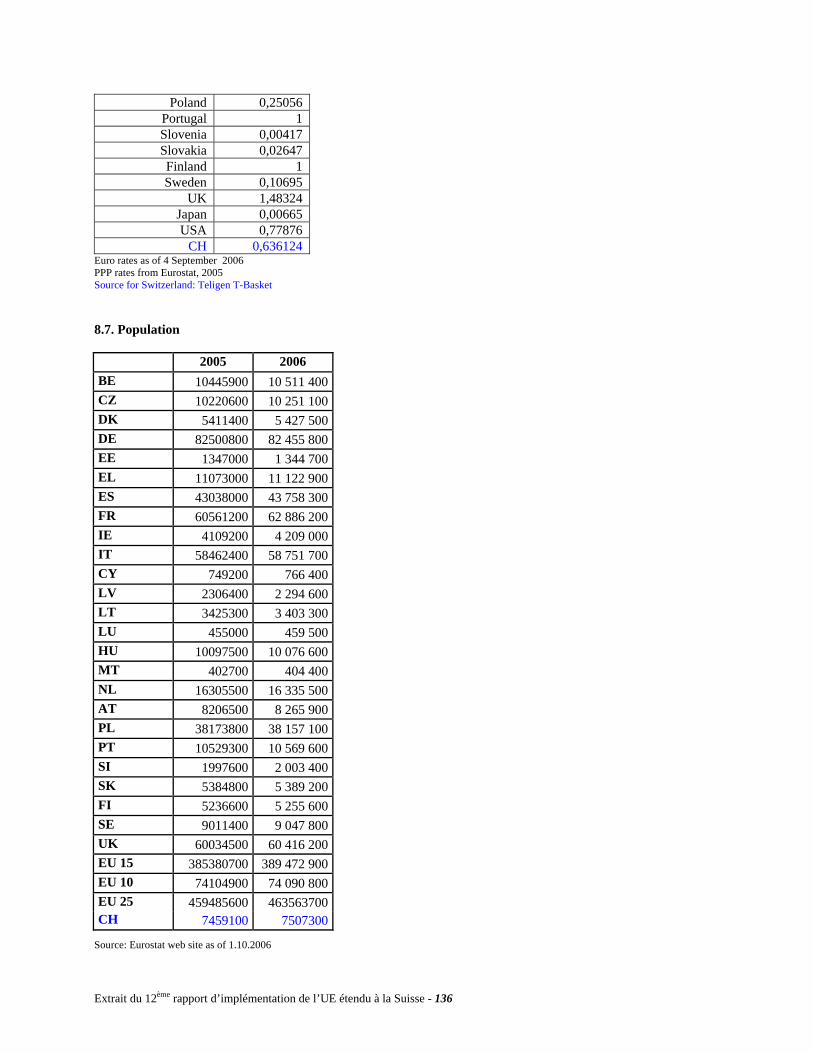
Poland 0,25056 Portugal 1 Slovenia 0,00417 Slovakia 0,02647 Finland 1 Sweden 0,10695
UK 1,48324 Japan 0,00665 USA 0,77876
CH 0,636124 Euro rates as of 4 September 2006 PPP rates from Eurostat, 2005 Source for Switzerland: Teligen T-Basket 8.7. Population 2005 2006 BE 10445900 10 511 400 CZ 10220600 10 251 100 DK 5411400 5 427 500 DE 82500800 82 455 800 EE 1347000 1 344 700 EL 11073000 11 122 900 ES 43038000 43 758 300 FR 60561200 62 886 200 IE 4109200 4 209 000 IT 58462400 58 751 700 CY 749200 766 400 LV 2306400 2 294 600 LT 3425300 3 403 300 LU 455000 459 500 HU 10097500 10 076 600 MT 402700 404 400 NL 16305500 16 335 500 AT 8206500 8 265 900 PL 38173800 38 157 100 PT 10529300 10 569 600 SI 1997600 2 003 400 SK 5384800 5 389 200 FI 5236600 5 255 600 SE 9011400 9 047 800 UK 60034500 60 416 200EU 15 385380700 389 472 900 EU 10 74104900 74 090 800 EU 25 459485600 463563700CH 7459100 7507300
Source: Eurostat web site as of 1.10.2006
Extrait du 12ème rapport d’implémentation de l’UE étendu à la Suisse - 136
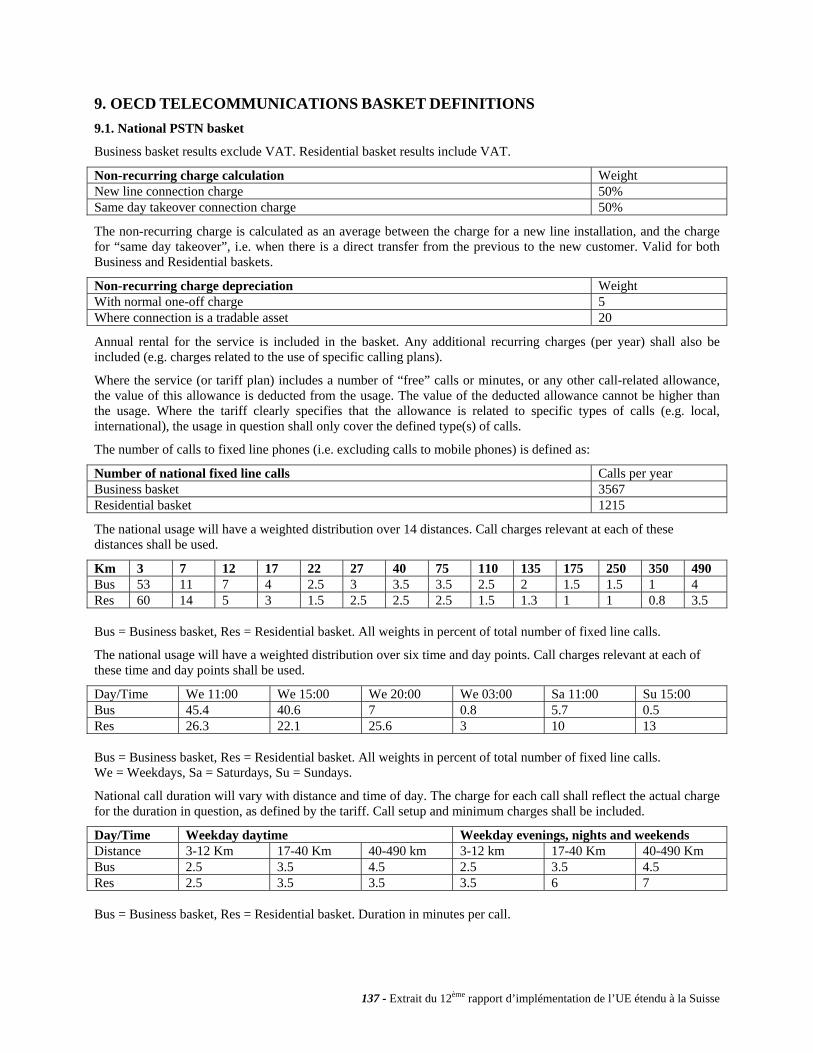
9. OECD TELECOMMUNICATIONS BASKET DEFINITIONS 9.1. National PSTN basket
Business basket results exclude VAT. Residential basket results include VAT.
Non-recurring charge calculation Weight New line connection charge 50% Same day takeover connection charge 50%
The non-recurring charge is calculated as an average between the charge for a new line installation, and the charge for “same day takeover”, i.e. when there is a direct transfer from the previous to the new customer. Valid for both Business and Residential baskets.
Non-recurring charge depreciation Weight With normal one-off charge 5 Where connection is a tradable asset 20
Annual rental for the service is included in the basket. Any additional recurring charges (per year) shall also be included (e.g. charges related to the use of specific calling plans).
Where the service (or tariff plan) includes a number of “free” calls or minutes, or any other call-related allowance, the value of this allowance is deducted from the usage. The value of the deducted allowance cannot be higher than the usage. Where the tariff clearly specifies that the allowance is related to specific types of calls (e.g. local, international), the usage in question shall only cover the defined type(s) of calls.
The number of calls to fixed line phones (i.e. excluding calls to mobile phones) is defined as:
Number of national fixed line calls Calls per year Business basket 3567 Residential basket 1215
The national usage will have a weighted distribution over 14 distances. Call charges relevant at each of these distances shall be used.
Km 3 7 12 17 22 27 40 75 110 135 175 250 350 490 Bus 53 11 7 4 2.5 3 3.5 3.5 2.5 2 1.5 1.5 1 4 Res 60 14 5 3 1.5 2.5 2.5 2.5 1.5 1.3 1 1 0.8 3.5 Bus = Business basket, Res = Residential basket. All weights in percent of total number of fixed line calls.
The national usage will have a weighted distribution over six time and day points. Call charges relevant at each of these time and day points shall be used.
Day/Time We 11:00 We 15:00 We 20:00 We 03:00 Sa 11:00 Su 15:00 Bus 45.4 40.6 7 0.8 5.7 0.5 Res 26.3 22.1 25.6 3 10 13 Bus = Business basket, Res = Residential basket. All weights in percent of total number of fixed line calls. We = Weekdays, Sa = Saturdays, Su = Sundays.
National call duration will vary with distance and time of day. The charge for each call shall reflect the actual charge for the duration in question, as defined by the tariff. Call setup and minimum charges shall be included.
Day/Time Weekday daytime Weekday evenings, nights and weekends Distance 3-12 Km 17-40 Km 40-490 km 3-12 km 17-40 Km 40-490 Km Bus 2.5 3.5 4.5 2.5 3.5 4.5 Res 2.5 3.5 3.5 3.5 6 7 Bus = Business basket, Res = Residential basket. Duration in minutes per call.
137 - Extrait du 12ème rapport d’implémentation de l’UE étendu à la Suisse
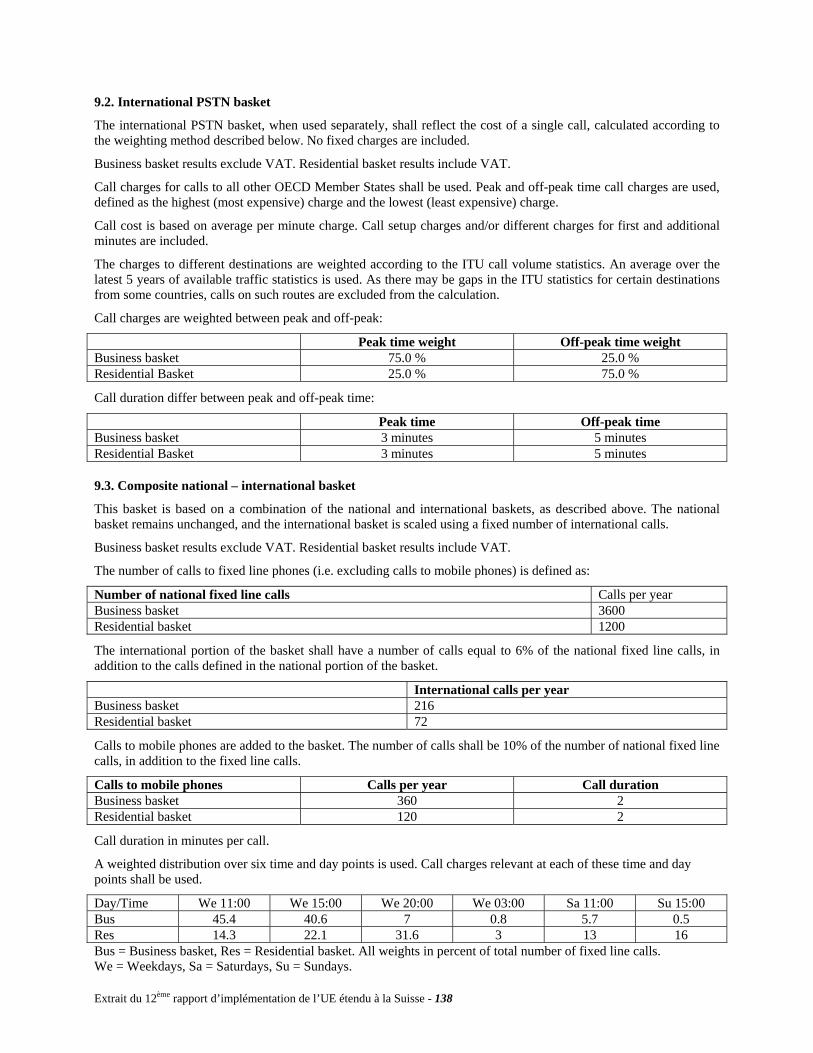
9.2. International PSTN basket
The international PSTN basket, when used separately, shall reflect the cost of a single call, calculated according to the weighting method described below. No fixed charges are included.
Business basket results exclude VAT. Residential basket results include VAT.
Call charges for calls to all other OECD Member States shall be used. Peak and off-peak time call charges are used, defined as the highest (most expensive) charge and the lowest (least expensive) charge.
Call cost is based on average per minute charge. Call setup charges and/or different charges for first and additional minutes are included.
The charges to different destinations are weighted according to the ITU call volume statistics. An average over the latest 5 years of available traffic statistics is used. As there may be gaps in the ITU statistics for certain destinations from some countries, calls on such routes are excluded from the calculation.
Call charges are weighted between peak and off-peak:
Peak time weight Off-peak time weight Business basket 75.0 % 25.0 % Residential Basket 25.0 % 75.0 %
Call duration differ between peak and off-peak time:
Peak time Off-peak time Business basket 3 minutes 5 minutes Residential Basket 3 minutes 5 minutes
9.3. Composite national – international basket
This basket is based on a combination of the national and international baskets, as described above. The national basket remains unchanged, and the international basket is scaled using a fixed number of international calls.
Business basket results exclude VAT. Residential basket results include VAT.
The number of calls to fixed line phones (i.e. excluding calls to mobile phones) is defined as:
Number of national fixed line calls Calls per year Business basket 3600 Residential basket 1200
The international portion of the basket shall have a number of calls equal to 6% of the national fixed line calls, in addition to the calls defined in the national portion of the basket.
International calls per year Business basket 216 Residential basket 72
Calls to mobile phones are added to the basket. The number of calls shall be 10% of the number of national fixed line calls, in addition to the fixed line calls.
Calls to mobile phones Calls per year Call duration Business basket 360 2 Residential basket 120 2
Call duration in minutes per call.
A weighted distribution over six time and day points is used. Call charges relevant at each of these time and day points shall be used.
Day/Time We 11:00 We 15:00 We 20:00 We 03:00 Sa 11:00 Su 15:00 Bus 45.4 40.6 7 0.8 5.7 0.5 Res 14.3 22.1 31.6 3 13 16 Bus = Business basket, Res = Residential basket. All weights in percent of total number of fixed line calls. We = Weekdays, Sa = Saturdays, Su = Sundays.
Extrait du 12ème rapport d’implémentation de l’UE étendu à la Suisse - 138
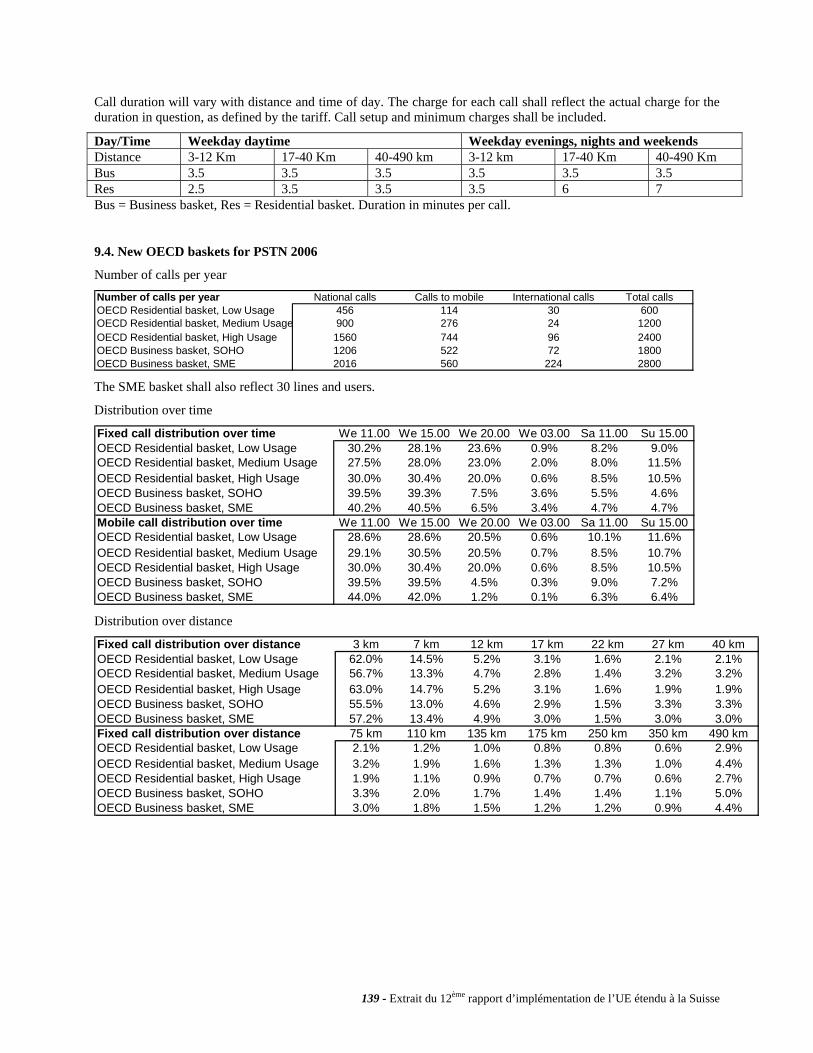
Call duration will vary with distance and time of day. The charge for each call shall reflect the actual charge for the duration in question, as defined by the tariff. Call setup and minimum charges shall be included.
Day/Time Weekday daytime Weekday evenings, nights and weekends Distance 3-12 Km 17-40 Km 40-490 km 3-12 km 17-40 Km 40-490 Km Bus 3.5 3.5 3.5 3.5 3.5 3.5 Res 2.5 3.5 3.5 3.5 6 7 Bus = Business basket, Res = Residential basket. Duration in minutes per call.
9.4. New OECD baskets for PSTN 2006
Number of calls per year Number of calls per year National calls Calls to mobile International calls Total callsOECD Residential basket, Low Usage 456 114 30 600OECD Residential basket, Medium Usage 900 276 24 1200OECD Residential basket, High Usage 1560 744 96 2400OECD Business basket, SOHO 1206 522 72 1800OECD Business basket, SME 2016 560 224 2800 The SME basket shall also reflect 30 lines and users.
Distribution over time
Fixed call distribution over time We 11.00 We 15.00 We 20.00 We 03.00 Sa 11.00 Su 15.00OECD Residential basket, Low Usage 30.2% 28.1% 23.6% 0.9% 8.2% 9.0%OECD Residential basket, Medium Usage 27.5% 28.0% 23.0% 2.0% 8.0% 11.5%OECD Residential basket, High Usage 30.0% 30.4% 20.0% 0.6% 8.5% 10.5%OECD Business basket, SOHO 39.5% 39.3% 7.5% 3.6% 5.5% 4.6%OECD Business basket, SME 40.2% 40.5% 6.5% 3.4% 4.7% 4.7%Mobile call distribution over time We 11.00 We 15.00 We 20.00 We 03.00 Sa 11.00 Su 15.00OECD Residential basket, Low Usage 28.6% 28.6% 20.5% 0.6% 10.1% 11.6%OECD Residential basket, Medium Usage 29.1% 30.5% 20.5% 0.7% 8.5% 10.7%OECD Residential basket, High Usage 30.0% 30.4% 20.0% 0.6% 8.5% 10.5%OECD Business basket, SOHO 39.5% 39.5% 4.5% 0.3% 9.0% 7.2%OECD Business basket, SME 44.0% 42.0% 1.2% 0.1% 6.3% 6.4% Distribution over distance
Fixed call distribution over distance 3 km 7 km 12 km 17 km 22 km 27 km 40 kmOECD Residential basket, Low Usage 62.0% 14.5% 5.2% 3.1% 1.6% 2.1% 2.1%OECD Residential basket, Medium Usage 56.7% 13.3% 4.7% 2.8% 1.4% 3.2% 3.2%OECD Residential basket, High Usage 63.0% 14.7% 5.2% 3.1% 1.6% 1.9% 1.9%OECD Business basket, SOHO 55.5% 13.0% 4.6% 2.9% 1.5% 3.3% 3.3%OECD Business basket, SME 57.2% 13.4% 4.9% 3.0% 1.5% 3.0% 3.0%Fixed call distribution over distance 75 km 110 km 135 km 175 km 250 km 350 km 490 kmOECD Residential basket, Low Usage 2.1% 1.2% 1.0% 0.8% 0.8% 0.6% 2.9%OECD Residential basket, Medium Usage 3.2% 1.9% 1.6% 1.3% 1.3% 1.0% 4.4%OECD Residential basket, High Usage 1.9% 1.1% 0.9% 0.7% 0.7% 0.6% 2.7%OECD Business basket, SOHO 3.3% 2.0% 1.7% 1.4% 1.4% 1.1% 5.0%OECD Business basket, SME 3.0% 1.8% 1.5% 1.2% 1.2% 0.9% 4.4%
139 - Extrait du 12ème rapport d’implémentation de l’UE étendu à la Suisse
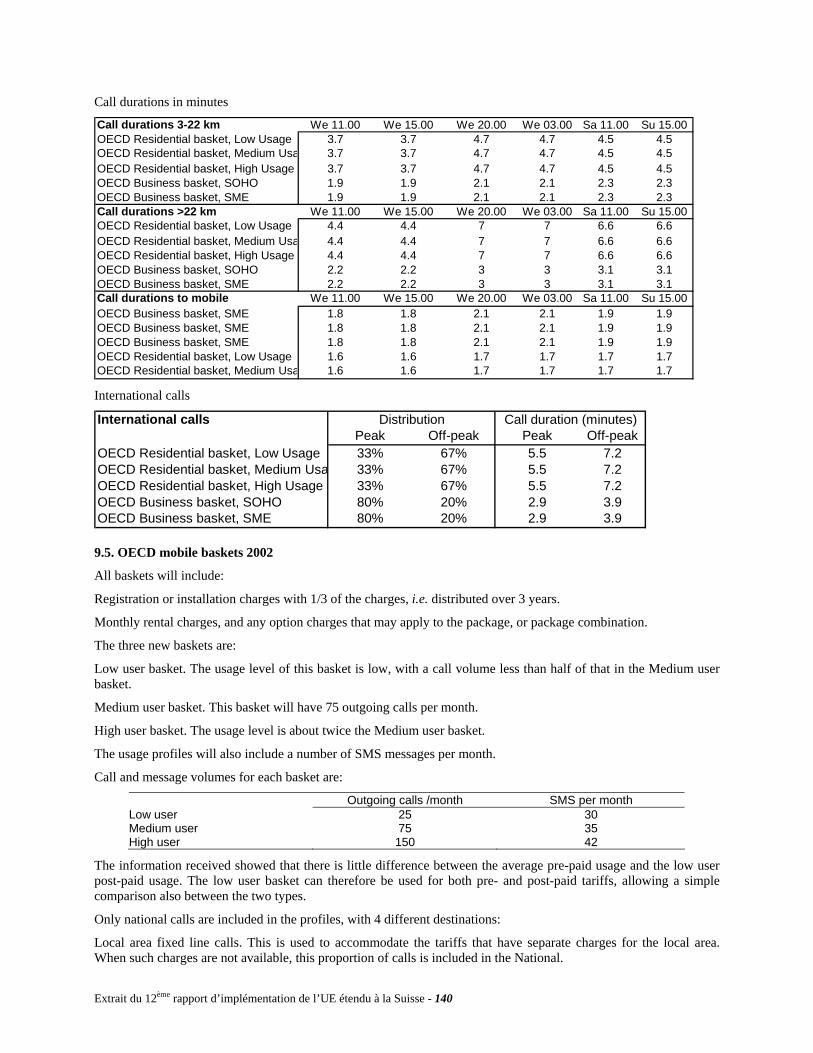
Call durations in minutes
Call durations 3-22 km We 11.00 We 15.00 We 20.00 We 03.00 Sa 11.00 Su 15.00OECD Residential basket, Low Usage 3.7 3.7 4.7 4.7 4.5 4.5OECD Residential basket, Medium Usa 3.7 3.7 4.7 4.7 4.5 4.5OECD Residential basket, High Usage 3.7 3.7 4.7 4.7 4.5 4.5OECD Business basket, SOHO 1.9 1.9 2.1 2.1 2.3 2.3OECD Business basket, SME 1.9 1.9 2.1 2.1 2.3 2.3Call durations >22 km We 11.00 We 15.00 We 20.00 We 03.00 Sa 11.00 Su 15.00OECD Residential basket, Low Usage 4.4 4.4 7 7 6.6 6.6OECD Residential basket, Medium Usa 4.4 4.4 7 7 6.6 6.6OECD Residential basket, High Usage 4.4 4.4 7 7 6.6 6.6OECD Business basket, SOHO 2.2 2.2 3 3 3.1 3.1OECD Business basket, SME 2.2 2.2 3 3 3.1 3.1Call durations to mobile We 11.00 We 15.00 We 20.00 We 03.00 Sa 11.00 Su 15.00OECD Business basket, SME 1.8 1.8 2.1 2.1 1.9 1.9OECD Business basket, SME 1.8 1.8 2.1 2.1 1.9 1.9OECD Business basket, SME 1.8 1.8 2.1 2.1 1.9 1.9OECD Residential basket, Low Usage 1.6 1.6 1.7 1.7 1.7 1.7OECD Residential basket, Medium Usa 1.6 1.6 1.7 1.7 1.7 1.7 International calls
International callsPeak Off-peak Peak Off-peak
OECD Residential basket, Low Usage 33% 67% 5.5 7.2OECD Residential basket, Medium Usa 33% 67% 5.5 7.2OECD Residential basket, High Usage 33% 67% 5.5 7.2OECD Business basket, SOHO 80% 20% 2.9 3.9OECD Business basket, SME 80% 20% 2.9 3.9
Distribution Call duration (minutes)
9.5. OECD mobile baskets 2002
All baskets will include:
Registration or installation charges with 1/3 of the charges, i.e. distributed over 3 years.
Monthly rental charges, and any option charges that may apply to the package, or package combination.
The three new baskets are:
Low user basket. The usage level of this basket is low, with a call volume less than half of that in the Medium user basket.
Medium user basket. This basket will have 75 outgoing calls per month.
High user basket. The usage level is about twice the Medium user basket.
The usage profiles will also include a number of SMS messages per month.
Call and message volumes for each basket are:
Outgoing calls /month SMS per month Low user 25 30 Medium user 75 35 High user 150 42
The information received showed that there is little difference between the average pre-paid usage and the low user post-paid usage. The low user basket can therefore be used for both pre- and post-paid tariffs, allowing a simple comparison also between the two types.
Only national calls are included in the profiles, with 4 different destinations:
Local area fixed line calls. This is used to accommodate the tariffs that have separate charges for the local area. When such charges are not available, this proportion of calls is included in the National.
Extrait du 12ème rapport d’implémentation de l’UE étendu à la Suisse - 140
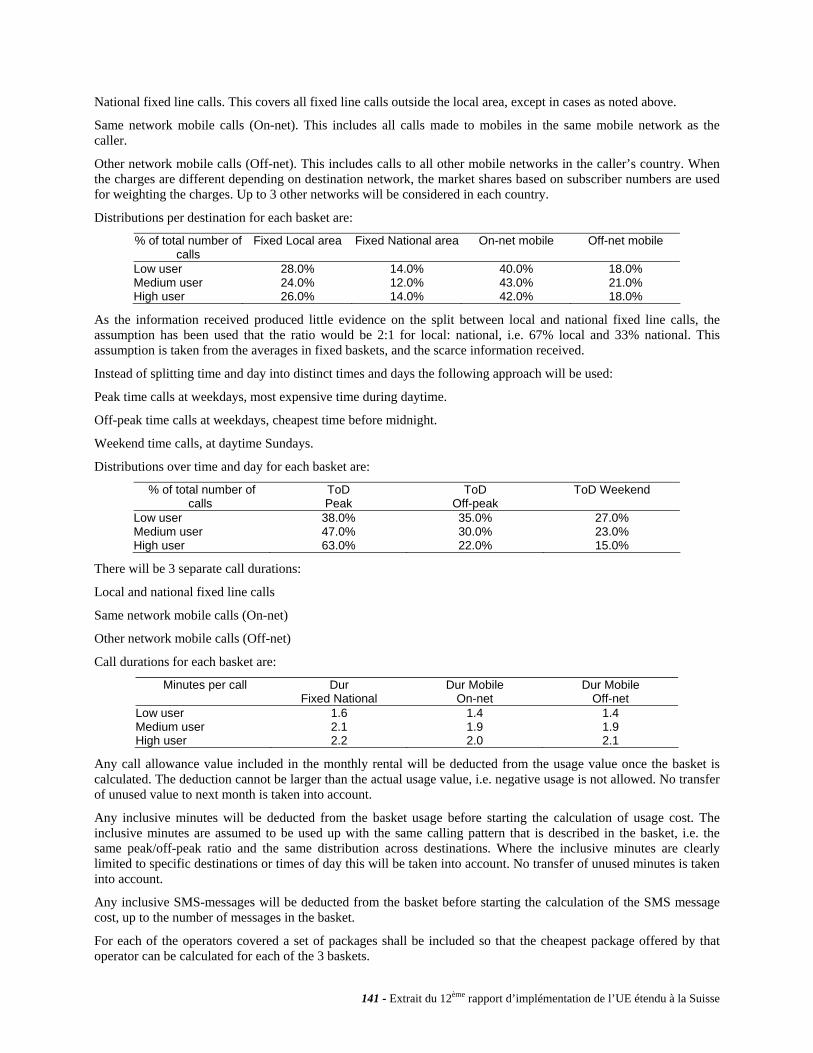
National fixed line calls. This covers all fixed line calls outside the local area, except in cases as noted above.
Same network mobile calls (On-net). This includes all calls made to mobiles in the same mobile network as the caller.
Other network mobile calls (Off-net). This includes calls to all other mobile networks in the caller’s country. When the charges are different depending on destination network, the market shares based on subscriber numbers are used for weighting the charges. Up to 3 other networks will be considered in each country.
Distributions per destination for each basket are:
% of total number of calls
Fixed Local area Fixed National area On-net mobile Off-net mobile
Low user 28.0% 14.0% 40.0% 18.0% Medium user 24.0% 12.0% 43.0% 21.0% High user 26.0% 14.0% 42.0% 18.0%
As the information received produced little evidence on the split between local and national fixed line calls, the assumption has been used that the ratio would be 2:1 for local: national, i.e. 67% local and 33% national. This assumption is taken from the averages in fixed baskets, and the scarce information received.
Instead of splitting time and day into distinct times and days the following approach will be used:
Peak time calls at weekdays, most expensive time during daytime.
Off-peak time calls at weekdays, cheapest time before midnight.
Weekend time calls, at daytime Sundays.
Distributions over time and day for each basket are:
% of total number of calls
ToD Peak
ToD Off-peak
ToD Weekend
Low user 38.0% 35.0% 27.0% Medium user 47.0% 30.0% 23.0% High user 63.0% 22.0% 15.0%
There will be 3 separate call durations:
Local and national fixed line calls
Same network mobile calls (On-net)
Other network mobile calls (Off-net)
Call durations for each basket are:
Minutes per call Dur Fixed National
Dur Mobile On-net
Dur Mobile Off-net
Low user 1.6 1.4 1.4 Medium user 2.1 1.9 1.9 High user 2.2 2.0 2.1
Any call allowance value included in the monthly rental will be deducted from the usage value once the basket is calculated. The deduction cannot be larger than the actual usage value, i.e. negative usage is not allowed. No transfer of unused value to next month is taken into account.
Any inclusive minutes will be deducted from the basket usage before starting the calculation of usage cost. The inclusive minutes are assumed to be used up with the same calling pattern that is described in the basket, i.e. the same peak/off-peak ratio and the same distribution across destinations. Where the inclusive minutes are clearly limited to specific destinations or times of day this will be taken into account. No transfer of unused minutes is taken into account.
Any inclusive SMS-messages will be deducted from the basket before starting the calculation of the SMS message cost, up to the number of messages in the basket.
For each of the operators covered a set of packages shall be included so that the cheapest package offered by that operator can be calculated for each of the 3 baskets.
141 - Extrait du 12ème rapport d’implémentation de l’UE étendu à la Suisse
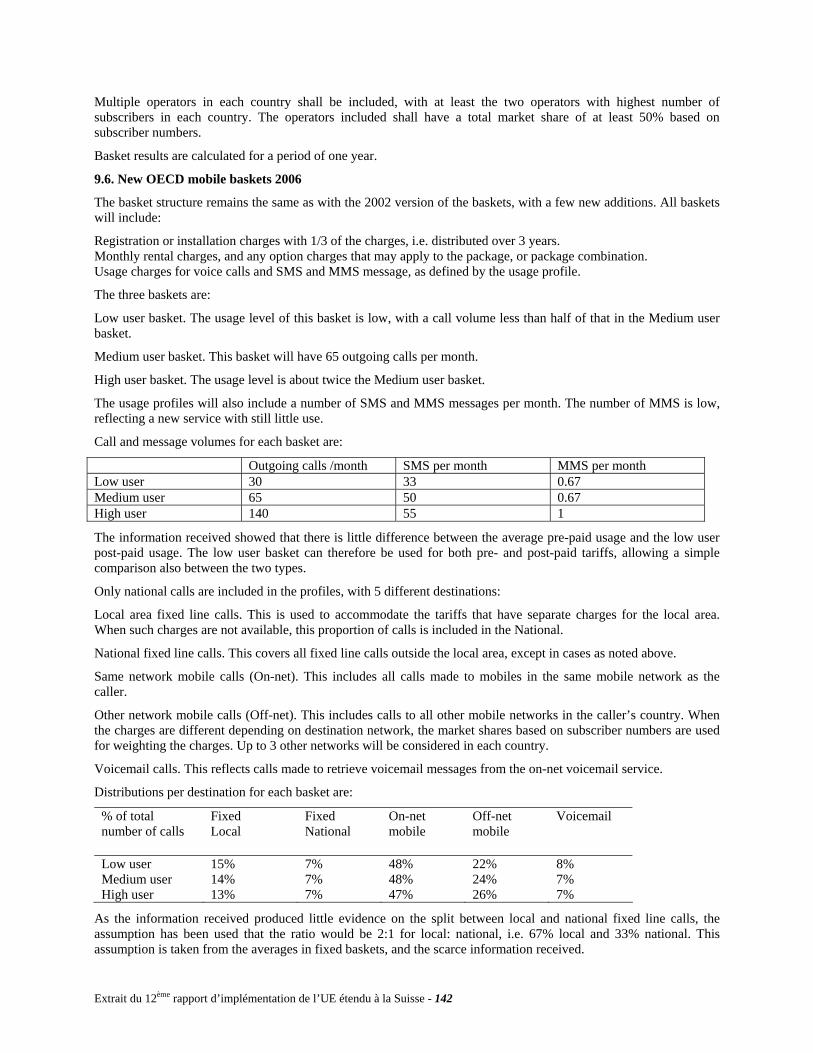
Multiple operators in each country shall be included, with at least the two operators with highest number of subscribers in each country. The operators included shall have a total market share of at least 50% based on subscriber numbers.
Basket results are calculated for a period of one year.
9.6. New OECD mobile baskets 2006
The basket structure remains the same as with the 2002 version of the baskets, with a few new additions. All baskets will include:
Registration or installation charges with 1/3 of the charges, i.e. distributed over 3 years. Monthly rental charges, and any option charges that may apply to the package, or package combination. Usage charges for voice calls and SMS and MMS message, as defined by the usage profile.
The three baskets are:
Low user basket. The usage level of this basket is low, with a call volume less than half of that in the Medium user basket.
Medium user basket. This basket will have 65 outgoing calls per month.
High user basket. The usage level is about twice the Medium user basket.
The usage profiles will also include a number of SMS and MMS messages per month. The number of MMS is low, reflecting a new service with still little use.
Call and message volumes for each basket are:
Outgoing calls /month SMS per month MMS per month Low user 30 33 0.67 Medium user 65 50 0.67 High user 140 55 1
The information received showed that there is little difference between the average pre-paid usage and the low user post-paid usage. The low user basket can therefore be used for both pre- and post-paid tariffs, allowing a simple comparison also between the two types.
Only national calls are included in the profiles, with 5 different destinations:
Local area fixed line calls. This is used to accommodate the tariffs that have separate charges for the local area. When such charges are not available, this proportion of calls is included in the National.
National fixed line calls. This covers all fixed line calls outside the local area, except in cases as noted above.
Same network mobile calls (On-net). This includes all calls made to mobiles in the same mobile network as the caller.
Other network mobile calls (Off-net). This includes calls to all other mobile networks in the caller’s country. When the charges are different depending on destination network, the market shares based on subscriber numbers are used for weighting the charges. Up to 3 other networks will be considered in each country.
Voicemail calls. This reflects calls made to retrieve voicemail messages from the on-net voicemail service.
Distributions per destination for each basket are:
% of total number of calls
Fixed Local
Fixed National
On-net mobile
Off-net mobile
Voicemail
Low user 15% 7% 48% 22% 8% Medium user 14% 7% 48% 24% 7% High user 13% 7% 47% 26% 7%
As the information received produced little evidence on the split between local and national fixed line calls, the assumption has been used that the ratio would be 2:1 for local: national, i.e. 67% local and 33% national. This assumption is taken from the averages in fixed baskets, and the scarce information received.
Extrait du 12ème rapport d’implémentation de l’UE étendu à la Suisse - 142
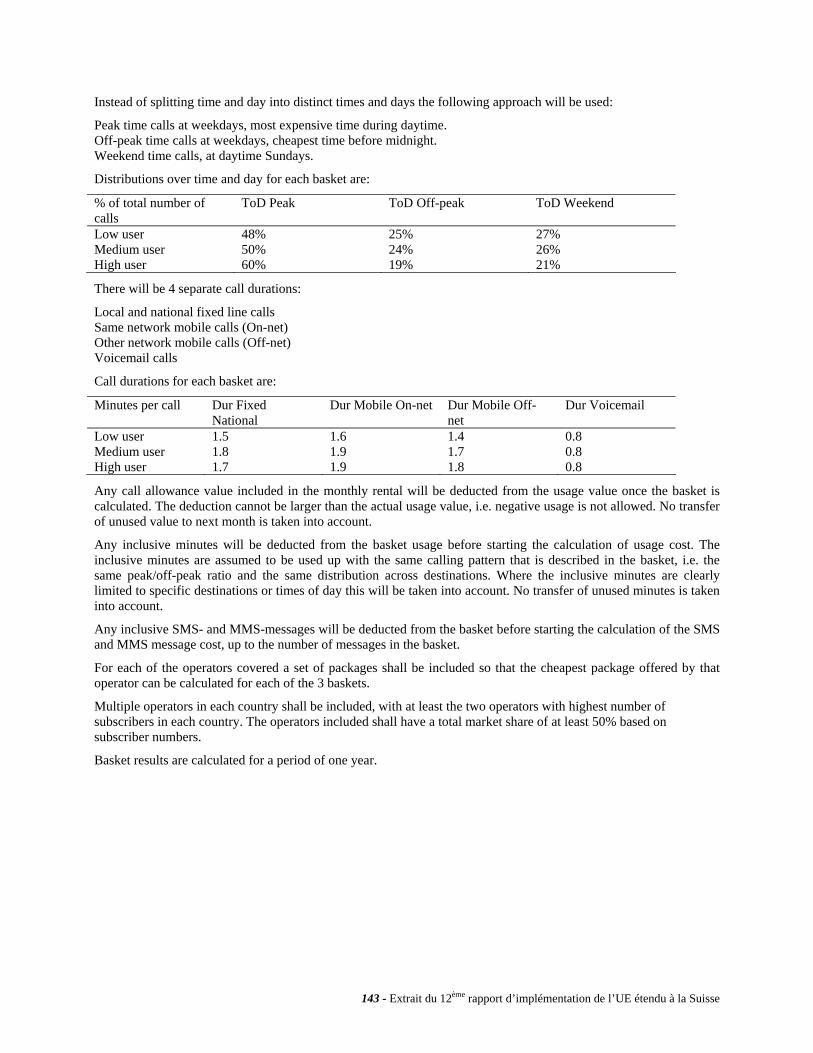
Instead of splitting time and day into distinct times and days the following approach will be used:
Peak time calls at weekdays, most expensive time during daytime. Off-peak time calls at weekdays, cheapest time before midnight. Weekend time calls, at daytime Sundays.
Distributions over time and day for each basket are:
% of total number of calls
ToD Peak ToD Off-peak ToD Weekend
Low user 48% 25% 27% Medium user 50% 24% 26% High user 60% 19% 21% There will be 4 separate call durations:
Local and national fixed line calls Same network mobile calls (On-net) Other network mobile calls (Off-net) Voicemail calls
Call durations for each basket are:
Minutes per call Dur Fixed National
Dur Mobile On-net Dur Mobile Off-net
Dur Voicemail
Low user 1.5 1.6 1.4 0.8 Medium user 1.8 1.9 1.7 0.8 High user 1.7 1.9 1.8 0.8 Any call allowance value included in the monthly rental will be deducted from the usage value once the basket is calculated. The deduction cannot be larger than the actual usage value, i.e. negative usage is not allowed. No transfer of unused value to next month is taken into account.
Any inclusive minutes will be deducted from the basket usage before starting the calculation of usage cost. The inclusive minutes are assumed to be used up with the same calling pattern that is described in the basket, i.e. the same peak/off-peak ratio and the same distribution across destinations. Where the inclusive minutes are clearly limited to specific destinations or times of day this will be taken into account. No transfer of unused minutes is taken into account.
Any inclusive SMS- and MMS-messages will be deducted from the basket before starting the calculation of the SMS and MMS message cost, up to the number of messages in the basket.
For each of the operators covered a set of packages shall be included so that the cheapest package offered by that operator can be calculated for each of the 3 baskets.
Multiple operators in each country shall be included, with at least the two operators with highest number of subscribers in each country. The operators included shall have a total market share of at least 50% based on subscriber numbers.
Basket results are calculated for a period of one year.
143 - Extrait du 12ème rapport d’implémentation de l’UE étendu à la Suisse