Embed Size (px)
Citation preview
Management by exception in a team:an illustrative analysis�
Marco AlderighiUniversità della Valle d�Aosta - Strada dei Cappuccini 2A, 11100 Aosta, Italy
Bocconi University - Via Sarfatti 12, 20120 Milano, ItalyE-mail: [email protected]; [email protected]
Abstract
We analyse two team coordination procedures, usually referred to as �managementby exception� that allow a �rm to exploit most of the coordination advantages inteam decision making, while simultaneously limit the costs borne from informationacquisition and processing. The results of the model are also discussed in relation tothe recent development of information and communication technologies.JEL classi�cation: L22, L23.keywords: Management by exception, Teams, Endogenous information acquisi-
tion and processing, Procedures..
�Part of this paper was written during my visit to the University of Toulouse 1, IDEI in 2002. Iam indebted to Prof. Jean Jacques Crèmer for his help and his valuable comments. I also thank twoanonymous referees for their suggestions that considerably improved the paper.
1
1 Introduction
The design of the information system has become a critical factor for the success of many�rms. There are many examples of �rms�poor performance due to lack of data, backgroundinformation and communication, as well as due to an excess of these. In the former, �rmsare unable to react swiftly to changing markets, while, in the latter, they su¤er high costsof implementation and maintenance. With respect to this aspect, a �rm�s organizationdesign consists of deciding how much information to collect and how to process it.
In this paper, we model a situation where a production-led �rm (Carter, 1995) is ateam composed of di¤erent sale units or shops, and of one production unit, all coordinatedby managers whose goals are aligned to the objectives of the �rm. Each shop operatesin an independent market where demand is uncertain. Sales managers can improve theirknowledge about their market conditions by gathering information, which will be usedby the production manager to arrange and coordinate the production. Shop informationconsists of a signal correlated to the market demand, whose precision is determined by theinformation acquisition expenditure.
Before the realization of market demands, the production manager makes a decisionconcerning whether or not to modify the level of a production-related variable (e.g. aninput of the production process, the capital), which a¤ects the optimal production scaleof the �rm, and therefore the pro�ts. In fact, the higher (lower) the demand, the higher(lower) the quantity that is optimal to produce, and the larger (smaller) the optimal scale.
The decision-making problem of the production manager rests on the fact that the �rmsu¤ers a loss in rearranging the production (i.e. there is a cost in processing the informationto choose the optimal scale), as well as in choosing the wrong scale. To minimize the overallcosts, the �rm can limit the re-scaling of the production to those situations where it ismore needed (exceptional situations), and to maintain a predetermined scale when it isless required (ordinary situations).
This team coordination practice is usually referred to as �management by exception�(Marschak and Radner, 1972: Chapter 6, Sections 11 and 12, hereafter denoted by MR).In short, the team can be organized to follow a procedure which prescribes: how muchinformation shops have to collect; how to identify ordinary/exceptional situations; andhow to compute the new scale, if necessary.
Depending on the type of situation, we distinguish two di¤erent regimes: a coordi-nation regime (in exceptional situations) and a routine regime (in ordinary situations).We propose two di¤erent procedures in order to provide an optimal level of informationacquisition and team coordination based on a di¤erent de�nition of exceptional situations.In the �rst procedure (Proc I), situations are exceptional if at least one sales managerreports an alert message (i.e. she receives a signal that she classi�es as exceptional); whilein the second procedure (Proc II), since all shops� signals are collected together by theproduction unit, situations are exceptional if the combination of the signals produces analert message, i.e. the evaluation of exceptionality is based on the composed signal.1 The
1 In the two-shop case, the di¤erence between the two procedures occurs when one shop receives apositive signal from the market and the other receives a negative signal. In this occurrence, under ProcI, the team is in an exceptional situation, while under Proc II, the team is in an ordinary situation (since
2
likelihood that the coordination regime occurs provides a measure of team coordination.The model also includes a production phase, which takes place after the scale choice
and the demand realization. In this phase, each shop charges a price which optimallyaccounts for the scale choice. Therefore, when the situation is exceptional, there is teamcoordination for two reasons: �rst, the production unit chooses the scale based on theinformation of the shops; second, shops choose their prices (determining the total demand)based on the decision of the production unit.2
Since it has been recognized that new information and communication technologies(ICTs) are general purpose technologies, researchers have noted that the drastic fall re-cently registered in ICT costs has had an important impact on the design of a �rm�sinformation system, and, more generally, on the organization of the production (Bresna-han and Trajtenberg, 1995). In fact, ICTs have speeded up and favoured informationacquisition and processing, and have proved to be useful to support decision-making im-plementation (Lauría and Duchessi, 2007). In modern manufacturing �rms, for example,the use of ICTs makes it possible to rearrange production more simply, and productiveprocesses more �exibly (Golden and Powell, 2000; Gong and Hu, 2007). To account forthis, the results of this model will also be discussed in relation to the development of ICTs.
As expected, we �nd that the level of information acquisition and processing increaseswhen acquisition costs and processing costs decrease and when environmental variabilityrises. Even if, in a strict sense, information acquisition and processing are not inputsof production, the rules governing their demand follow those of production factors: thelower costs or the larger (expected) returns imply a higher input demand. An empiricalcon�rmation of this result can be found in Mendelson and Pillai (1998).
More interestingly, information acquisition and the level of team coordination turn outto be complementary, in the sense that increasing one makes the other more e¤ective.Indeed, more precise signals make the team coordination more e¤ective; furthermore, ahigher level of team coordination increases the likelihood that a signal is processed, andhence the marginal return of gathering information increases, inducing more informationacquisition. This result is in line with the Milgrom and Roberts (1990) hypothesis, andwith the following empirical literature which has analyzed the link between ICT adoption(and usage) and the emergence of forms of horizontal coordination between �rms, such asteams (Hitt and Brynjolfsson, 1997; Bresnahan et al., 2002).
Concerning this point and the observed trend involving increasing uncertainty anddecreasing information and communication costs, we identify three phases of a �rm�steamwork adoption: (1) permanent routine (no team); (2) team under Proc I; and, �nally,(3) team under Proc II. This result emerges as Proc II performs better when informationmanagement costs are small, while Proc I becomes feasible for larger acquisition andprocessing costs. Therefore, an integrated information system (Proc II) may be pro�table
the positive and the negative signals cancel each other out).2Our model may have an alternative formulation, where the team is composed of many shops and one
production unit, at their service. In this case, the scale decision is made up collectively by all the marketingmanagers, while the production unit plays no role. In the coordination regime, agents have to coordinatetheir actions in the sense that they have to share (combine) and process their information in order to makea decision.
3
only when the costs of processing information are su¢ ciently small. We also discuss somecircular e¤ects between ICT adoption and environmental variability.
Finally, we �nd that team size may a¤ect the performance of the two procedures.The �rst one performs better when teams are small, while the second one is neutral toteam size. That is, we expect that large teams are likely to be coordinated only for lowinformation costs or when an e¢ cient integrated information system is available.
Previous results are derived under the assumption that demand shocks are uncorre-lated. A brief analysis of a more general set-up considering interdependent markets sug-gests that, because of complementarity, team coordination increases with signal correla-tion since �rms have lower acquisition costs for obtaining the same amount of information.Moreover, we guess that, under high correlation and economies of scale in information ac-quisition and processing, a specialization of some shops in information acquisition tasks(test markets) may emerge.
The remainder of this paper is organized as follows. Section 2 introduces the mainassumptions and develops a simple model that illustrates Proc I. In Section 3, we presentProc II as an alternative procedure. In Section 4, we compare the two procedures; weinformally discuss the case of correlated signals, and we provide a brief discussion of theimpact of ICTs on team coordination. Section 5 concludes.
1.1 Related literature
Our work combines the Bayesian approach to information acquisition with the theory ofteams. The Bayesian approach to decision theory (Shavell, 1989; Bernardo and Smith,1994) analyzes situations where agents have some prior beliefs on the states of natureand, after a costly experiment in light of this new information, update their beliefs. Ingeneral, the optimal level of information acquisition is determined by the maximizationof the expected pay-o¤ function. Agents would equate the marginal bene�ts of acquiringinformation to the additional costs of information. The recent literature has devotednew attention to information acquisition in di¤erent research �elds. Persico (2000) hasexplored the consequences of the endogenous acquisition of information in auctions. Kim(1995) has studied the impact of information on the production and exchange of goods.Holmström (1979), Radner and Stiglitz (1984), and Maggi (1999) have clari�ed the role ofinformation acquisition in the principal-agent relationship, in competitive environments,and under commitment.
The theory of teams (Marschak and Radner, 1972) starts from the observation thatagents have limited computability skills, or limited time, and therefore they are �boundedlyrational�(Simon, 1955; Radner, 1996). The problem of con�icting objectives among agentsis ignored, and the focus is instead on the problem of coordinating the decisions of severalimperfectly informed actors and its e¤ects on the performance of the �rms.
In an MR version of �management by exception�called �report of exceptions�(MR, p.206), each agent can directly make a decision about her action variable or choose to passthe buck to a central agency. It is supposed that, when observation is ordinary, the agentmakes a decision just based on her observation, while in the case in which the observationis exceptional she reports to the central agency, which then decides in her place, taking
4
into account her report of exceptions and those of other agents incurred in exceptionalobservations. In a second version, called �emergency call�(MR, p. 217), the coordinateddecision is obtained by all managers on the stimulus of at least one agent who has receivedan exceptional signal. Our set-up lies in between, since the production unit acts as acentral agency, but the coordination decision is based on all pieces of information and notonly on those that are exceptional.
Our paper di¤ers from the MR set-up in many respects and is much closer to theCarter (1995) model.3 Nevertheless, a comparison between their �ndings and ours is notwithout interest. First, MR show that the pay-o¤ (gross of information management costs)increases with the coordination level, although at a decreasing rate. Second, provided thatprocessing costs are a positive function of the frequency of exceptions, it follows that theoptimal level of coordination negatively depends on processing costs. Both results arecon�rmed in our set-up. Finally, MR show that the gross pay-o¤ increases more thanproportionally with the size of the team. This result coincides with ours under Proc I, butnot under Proc II where the average gross pay-o¤ is size-free.
Carter (1995) models a situation where two agents (i.e. the marketing departmentand the production department) observing noisy signals are involved in the choice of acommon variable. Agents use �xed acquisition devices and have noisy communicationchannels. In Carter�s paper, the steps necessary to reach a decision vary according to thechoice of the organizational structure. For example, in the �production-led �rm�, Carterassumes that the marketing department condenses its information in a report that it sendsto the production department which receives it with some added noise. The productiondepartment combines the two pieces of information and makes a decision. In the �routine�rm�, no information at all is communicated and the decision is predetermined. Our modelswings between these two extreme cases: in the routine regime, agents behave as a �routine�rm�, and in the coordination regime they behave as a �production-led �rm�.
Crémer (1980) shows that, when organizations are too complex to be managed unitar-ily, the design of an organization consists of choosing that con�guration that minimizesmarket uncertainty. Sah and Stiglitz (1986) and Aoki (1986) discuss the level of central-ization in an organization. Geanakoplos and Milgrom (1991) analyze the case in whichmanagers can have heterogeneous abilities for information gathering and show that ablermanagers should be assigned to higher levels.
Radner (1993) proposes a model of parallel processing in which information is spreadaround the organization and takes time to be elaborated. His work, and the followingcontributions, all focus on �nding the hierarchical structures within which informationis processed to reach the maximum pay-o¤. Radner (1993) describes those hierarchicalstructures within which information is processed at maximum speed. In Van Zandt andRadner (2001), the optimal hierarchical structure takes into account speed and qualityof decision. Schulte and Grüner (2007) analyze a similar set-up where agents may makemistakes. Van Zandt (1998) investigates the properties of the organization when theyare not necessarily hierarchical. In his set-up, processing costs depend on the number of
3The main di¤erences with the MR assumptions are as follows: (i) we have assumed a common decisionvariable; (ii) agents acquire noisy signals so that in the pooling case there is not complete information; (iii)information acquisition is endogenous; and (iv) we explicitly account for information and processing costs.
5
managers necessary to process the information and on the cost of delay.Previous contributions also relate the size of the organizations to the processing costs.
Radner (1993) provides the conditions under which there are scale economies in processinginformation. Van Zandt and Radner (2001) analyze the case where there are diseconomiesof scale. In our model, processing costs are proportional to the size of the team foreach coordination level. This means that we �nd (dis)economies of scale in processinginformation when coordination reduces (increases) with the size of the team.
2 The model
Notation. The notation used in this paper is standard. Scalar quantities are in normalletters (e.g. X1, X2, ..), and vectors are in bold (e.g. X, Y, 1, ..). XY := hX;Yi indicatesthe scalar product. 1 is an array in which each entry is a 1. � is the Cartesian product oftwo sets. We denote gX the density distribution of the random variable X; and E and V arare the expected value and the variance operators, respectively. EX2W (�) = E (�jX 2W ),and V arX2W (�) = V ar (�jX 2W ) are the expected value and variance conditional onX 2W .
The team. There are n + 1 � 2 agents, called a0, a1, .., an, who compose a team(�rm). Agent a0 is the production manager, and agent ai, i 2 f1; ::; ng, is the salesmanager for market i. All the agents work for the interest of the �rm, so that the problemof con�icting objectives among agents is ignored.
The demand. The demand in market i is uncertain, and it is given by:
yi = 4bVip�2i , (1)
where b > 0 is a parameter; yi is the quantity demanded; pi is the price charged inthe market; and Vi is a random variable describing the states of nature. Vi is normallydistributed with mean �vi and variance �i. We call gVi the prior density distribution of Vi,and we assume that Vi and Vj , with i 6= j, are independent.
Production. Production technology is summarized by the following cost function:
C(q; y) =1
2aq2 + y=q + d, (2)
where a; d > 0 are constants; y =Pni=1 yi is the production level; and q is a technology
parameter positively a¤ecting the optimal scale (hereafter, scale). The marginal cost ofproduction, 1=q, reduces with the increase of q, a quasi-�xed input of the productionprocess (capital), which costs: aq2=2 (see, for example, Mialon, 2008).
Before putting goods up for sale and before knowing the demand level, the productionunit has to decide on the production scale q. Afterwards, when demand realizes, theoptimal quantity (i.e. the quantity that maximizes the pay-o¤) is produced and sold bythe shops. Hence, there is output �exibility in the production phase, but production costsare a¤ected by the decision on scale, that in turn is a¤ected by the choice of a quasi-�xedinput.
6
Gross pay-o¤s. Using equations (1) and (2), and assuming pro�t maximizing be-haviour of �rm, we obtain the following (reduced form) gross pay-o¤ function, that isquadratic in the scale choice and linear in the unknown (Carter, 1995):4
U (q;V; n) = �12aq2 + b (
Pni=1 Vi) q � d. (3)
From now on, we do not explicitly model the production phase, and we focus on thedecision process concerning the choice of q.
Information management. Agents can manage information at a cost: sales man-agers can acquire information on the market conditions, and the production manager hasthe ability to process this information. Since demand is uncertain, shops can not ob-serve the true state of nature v = (v1; v2; ::; vn), but they can acquire a signal X� =�X�11 ; X
�22 ; ::; ; X
�nn
�, correlated with the demand. In particular, we assume that agent
ai can collect a noisy signal X�ii that is normally distributed with mean �vi and variance
�i=�i, where �i 2 [0; 1] is a measure of the (relative) precision of the signal. Each signalis correlated to the corresponding state of nature but they are pairwise independent. Theconditional distribution of the signal X�i
i jVi = vi is normally distributed with mean viand variance �i (1� �i) =�i. Shops update their information using the Bayesian rule, andtherefore the posterior distribution is given by the random variable VijX�i
i = xi that isnormally distributed with mean �ixi+(1� �i) �vi and variance �i (1� �i). We assume thatthe cost of the signal acquisition for each shop is: K (�) = k �K (�), where k is a measureof the information acquisition costs, and �K : [0; 1] ! <+ is a function of the (relative)precision of the signal, with �K (0) = 0, �K 0; �K 00 > 0, and �K 0 (1) = 1.5 The productionunit can combine di¤erent pieces of information collected by shops and analyze them tomake a decision. Let c be the cost of processing the information coming from one shop.In Proc II (see Section 3), we split the information processing into two separate phases:in the �rst phase, each piece of information is combined at a cost, 'c, with ' 2 [0; 1], and,in the second phase, it is analyzed at costs (1� ') c.
Finally, we assume that shops can make an individual assessment (i.e. they are ableto say whether their market condition is exceptional or ordinary) as a by-product ofinformation acquisition, and that the production unit can make an assessment on thejoint information after combining previous information.
4Equating marginal revenues and marginal costs in each market i, we obtain: MRi = (4bVi=yi)1=2 =
q�1 = MCi; therefore the optimal prices and quantities are, respectively: pi = 2=q and yi = bViq2. Afterreplacing yi in the pro�t function, the overall pro�ts are given in (3).
5For example, consider the case where X�ii is a random variable describing the sample average of h
independent and identically distributed experiments analysing Vi, each giving as the result Xi;l = Vi+ei;l,where ei;l is a normal random variable with mean 0 and variance �". Hence, X�i(h)
i = 1h
PlXi;l =
Vi + ehi , where e
hi is a normal random variable with mean 0 and variance �i"=
ph , and �i = Li (h) =
1=�1 + V ar("hi )
�= 1=
�1 + "=
ph�=
ph
"+ph. If k is the cost of each experiment, then the cost of obtaining
a signal with precision �i is: K (�i) = kL�1i (�i) = k�2i "
(1��i)2. On the other hand, if there are economies
of scale in collecting data, so that acquisition costs increase with the square root of h, then: K (�i) =
kqL�1i (�i) = k
�ip"
1��i.
7
Procedures. The teamwork is governed by a procedure that is a sequence of (simple)instructions and choice rules (contingent instructions) that organize and coordinate theagents�tasks. In this paper we analyze a simple procedure that is usually referred to as�management by exception�. This procedure distinguishes two di¤erent regimes, dependingon the signals received by the agents: a routine regime, when each signal xi is in aroutine interval Ri, i.e. xi 2 Ri � < for i = 1; ::; n or x 2 R, where x =(x1; ::; xn) andR = �i=1::nRi; and a coordination regime, when at least one signal is out of the routineinterval, i.e. x 2 �R = <nnR. We de�ne the coordination level O as the probability thatthe coordination regime occurs, i.e. O = 1� PR = P�R = Pr
�X 2 �R
�.
The procedure includes the following tasks involving the sales agents and the produc-tion agent. Each sales agent acquires a signal X�i
i correlated with the demand in hermarket and returns an alert message to the production unit if the event is exceptional,i.e. xi =2 Ri. The production manager, if he observes, at least, one alert message, informsthe sales managers that they are in the coordination regime and asks them to send himthe information they have collected. He combines together di¤erent pieces of informationcollected by shops, analyzes them and makes a decision on the production scale. Other-wise, i.e. in the routine regime, he chooses a predetermined scale without asking the salesmanagers for any piece of information.
Net pay-o¤s. We denote u as the net pay-o¤ that is obtained from (3) by subtractingthe costs of acquiring and processing the information:
u (q;V;�; n) = U (q;V; n)�Pni=1K (�i)� ncI, (4)
where I = 0 when the team enters the routine regime, and I = 1 when the team entersthe coordination regime. Since V is unknown, collecting and processing information isuseful in order to choose an adequate scale q. However, since managing information iscostly, shops must acquire too detailed information, and, in some occurrences (ordinarysituations), the production manager must decide not to process it.
Finding an optimal procedure implies identifying the optimal quality of the signalacquisition �, the optimal routine region R, and the optimal scale q.
Before characterizing the optimal procedure Proc I, we show that the optimal routinearea is rectangular and is centred around the average value of the signal.
Proposition 1 The (almost everywhere) unique optimal routine area is given by R =�iRi, where Ri = [�vi � ri; �vi + ri] , and the optimal routine scale is given by: qR = a
b1�v.
Proof The proof is done by choosing an arbitrary level of coordination O, and ofsignal quality �. Without loss of generality, we assume that a = b = 1, �vi = d = 0, sincethe general result can be obtained by an appropriate change of unit of q and V. Afterprevious simpli�cations, (3) becomes U (q;V; n) = �1
2q2 + q (1V). We allow R to be any
possible set generated by the Cartesian product of Borelian sets, i.e. R = �i=1::nRi, whereRi = [1h Sh, and where Sh = [rh; sh] with rh; sh 2 <, such that Pr (X 2 R) = 1�O.
From the �rst-order condition, the optimal routine scale for the routine region R is:qR = EX2R (1V) = EX2R (�X), and the optimal coordination scale receiving signal X is
8
q� (X) = EVjX (1V) = �X. Let LR be the expected loss by choosing qR and not q� (X):
LR = EX2REVjXU (q� (X))� EX2REVjXU (qR)
= EX2R�� (�X)2 =2 + EVjX (1V) (�X)
�� EX2R
��q2R=2 + (�X)EVjX (qR)
�= EX2R (�X)
2 =2� E2X2R (�X) =2= V arX2R (�X) =2 (5)
Hence, the problem is choosing R so that the loss is minimized, while simultaneouslyproviding the level of coordination O:
minRLR = V arX2R (�X) =2, subject to Pr (X 2 R) = 1�O: (6)
Note that V arX2R (�X) =Pni=1 �
2iV arXi2Ri (Xi) and, from independence, Pr (X 2 R) =Qn
i=1 Pr (Xi 2 Ri). This means that once R�i = R1 � :: � Ri�1 � Ri+1 � :: � Rn ischosen optimally, the choice of Ri is given by the solution of this unidimensional problem:minRi LRi =
RRi
�xi � �Ri
�2��i=�i (xi) dxi, where �Ri =
RRixi��=� (xi) dxi, subject toR
Ri��i=�i (xi) dxi = Pr (X 2 R) =Pr (X�i 2 R�i), where ��i=�i is the density of a normal
distribution with mean 0 and variance �i=�i, and X�i = X1 � ::�Xi�1 �Xi+1 � ::�Xn.First note that, for any given �Ri , the minimum is reached when Ri is almost everywherea closed interval. In fact, for all the possible Ri, moving mass from the tails of thedistribution towards the centre consists in a variance reduction. Now, since Xi has acentred normal distribution, of all the closed intervals, the one with minimum variance isthat centred in 0.
Intuitively, since choosing a pre-determined scale qR generates a reduction in the grosspay-o¤ with respect to choosing the optimal scale based on the signal, q� (X), and the lossincreases quadratically with the distance between qR and q�, then, in order to minimizethe average loss, the optimal routine scale must be the more likely value, and the optimalregion must be the closest area to the optimal routine scale.
For a given routine region R and signals precision �, the net expected pay-o¤ is:
uI (�;R; n) = EU (q� (X) ;V; n)� PR � LR � d�Pni=1K (�i)� nc (1� PR)
=b2
2a[V ar (�X) + (1�v)n � PRV arX2R (�X)]� d
�Pni=1K (�i)� nc (1� PR) .
The term in square brackets is the di¤erence between the gross expected pay-o¤ thatthe team receives if the scale is optimally adjusted in both regimes and the loss of choosinga predetermined scale in the routine regime given in (5) times the probability it occurs.The last two terms are the information management costs.
We will rewrite the pay-o¤ function in a suitable way considering the di¤erent terms.First, V ar (�X) =
Pi �i�i. Second,
PRi = Pr�X�ii � �vi 2 [�ri; ri]
�=
Z �vi+ri
�vi�rigX�ii
(x) dx =
Z Ai
�Ai� (z) dz, (7)
9
where � (�) is the normal standard density. The last equivalence of (7) follows by thechanges of variable z = (xi � �vi)
p�i=�i andAi = ri
p�i=�i. Let F (Ai) :=
R Ai�Ai � (z) dz =
PRi .Finally,
PRV arX2R (�X) =
Z �v1+r1
�v1�r1::
Z �vn+rn
�vn�rn[Pi �i (xi � �vi)]
2 gX� (x) dx
=PiR�i
Z �vi+ri
�vi�ri[�i (xi � �vi)]2 gX�i
i
(xi) dxi
=Pi PR�i�i�i
Z Ai
�Aiz2i � (zi) dzi
=Pi �i�i
hQj 6=i F (Aj)
i �F (Ai)�AiF 0 (Ai)
�,
where the second line follows by independence, the third line by a change of variable, andthe last line by integration by parts.
Summing up these results yields:
uI (�;A; n) =b2
2a
Pi �i�i
n1�
hQj 6=i F (Aj)
i �F (Ai)�AiF 0 (Ai)
�+ (1�v)2
o(8)
�PiK (�i)� nc (1�
Qi F (Ai)) .
We now focus on the symmetric case and we introduce some normalizations: �i = �,�i = �, �vi = �v, Ai = A, ri = r with i = 1; ::; n, and b2
2a = 1,(1�v)2 = d. Previousconsiderations simplify equation (8) in the following way:
uI (�;A; n) = n��n1� F (A)n�1
�F (A)�AF 0 (A)
�o(9)
�nK (�)� nc (1� F (A)n) ,
where A = rp�=�.
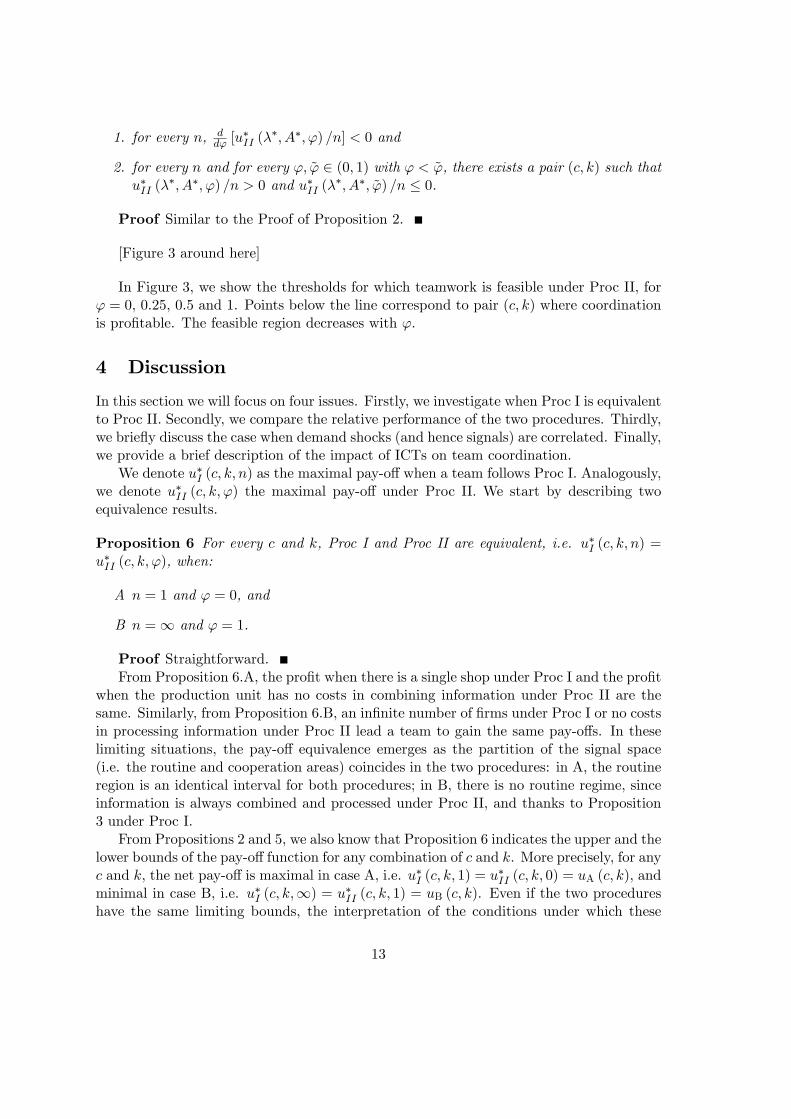
Figure 1 depicts the level of organization O = 1 � PR = 1 � F (A)n and the qualityof signal acquisition � that maximize the net pay-o¤ under Proc I for di¤erent valuesof c, k and �, when K (�) = k�= (1� �). As we expected, changes in acquisition costsprincipally a¤ect information acquisition, while changes in processing costs modify thelevel of coordination. An increase in the environmental variability a¤ects both dimensionssigni�cantly.
[Figure 1 around here]
We focus on the quantity uI (�;A; n) =n, that is the expected pay-o¤ per shop. Thefollowing proposition proves that uI=n is decreasing in n, and that there are situationswhere small teams are pro�table but not large teams.
Proposition 2 Assume that n is a continuous variable in the domain [1;1). Denoteu�I (�
�; A�; n) =n as the expected pay-o¤ per agents choosing �� (n) and A� (n) optimally.Then:
10
1. ddn [u
�I (�
�; A�; n) =n] < 0, and
2. for every n, n0, with n < n0, there exists a pair (c; k) such that u�I (��; A�; n)
=n > 0 and u�I (��; A�; n0) =n0 � 0.
Proof 1.) By the envelope theorem, ddn [u
�I=n] =
@@n [u
�I=n] = ���Fn�1 lnF (F �AF 0)
+ cFn lnF . Since F < 1, then lnF < 0. The sign of the derivative is the sign of
the following expression ���1�AF 0F
�� c. From the �rst-order condition for equation
(8), we have ���n�1n
�1�AF 0F
�+ A2
n
�� c = 0, and hence d
dn [u�I=n] � 0 if and only if�
n�1n
�1�AF 0F
�+ A2
n
���1�AF 0F
�or 1
n
�1�AF 0F �A
2�� 0, which is impossible.
2.) From point 1 and by continuity of the pay-o¤ function with respect to c and k, wereach the thesis.
[Figure 2 around here]
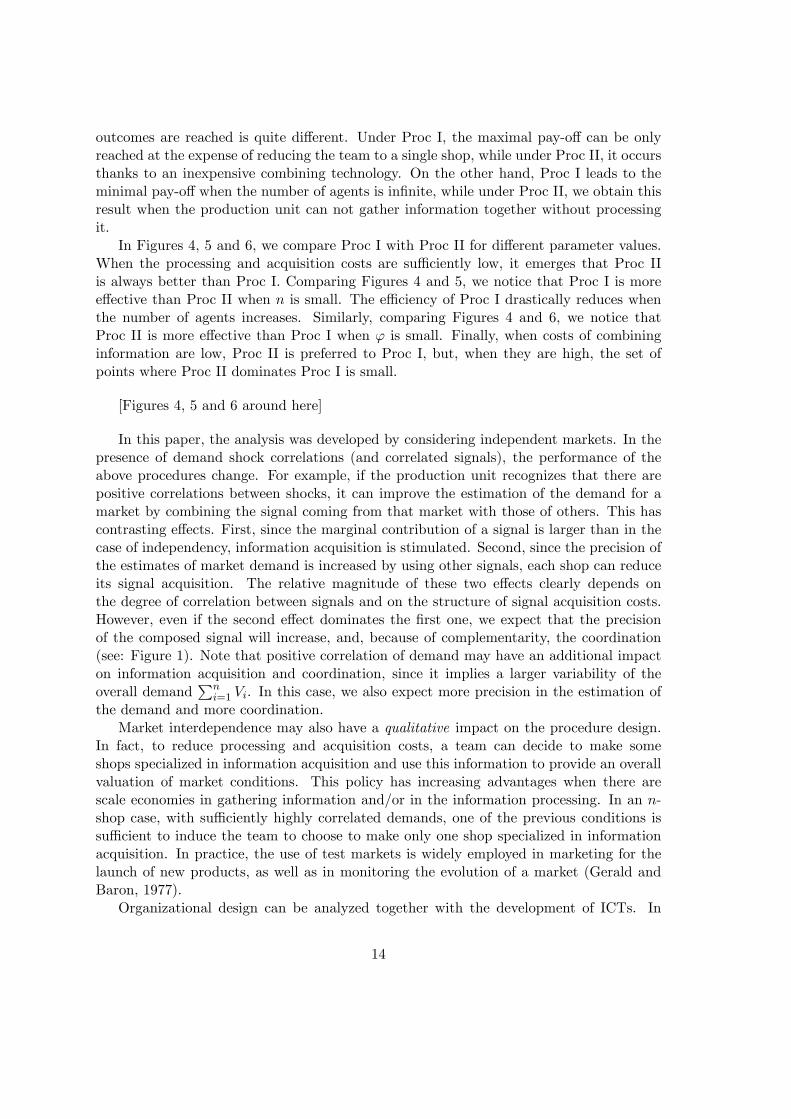
In Figure 2 we show the maximum number of agents for di¤erent values of the commu-nication costs and processing costs for n = 1; 2; 3 and1. Points below the line correspondto pair (c; k) where teamwork is pro�table. The feasible region decreases with n.
In addition, taking the limit with n ! 1, we note that F (A)n ! 0 if A < 1, andF (A)n ! 1 when A = 1. Hence, with an in�nity of agents, there are only two extremeregimes: routine or full coordination. Since [F (A)�AF 0 (A)] is bounded, it emerges that:
limn!1
uIn=
����K (�)� c if A� <1
0 if A� =1 .
Hence, there is full coordination with K 0 (��) = � if ��� � K (��) + c and routine if��� < K (��) + c. The following proposition resumes the result.
Proposition 3 Assume that n ! 1. Then there are only two possible cases: no coor-diantion or full coordination.
Proof In the text.Intuitively, when the number of agents increases, the likelihood that at least one ob-
serves an exceptional signal becomes very high, unless alert threshold A� is expanded.When n!1 the only way not to have an exceptional situation is to choose A� =1, i.e.asking shops never to signal an alert message. Proposition 3 suggests that this procedureis not particularly suitable when n is large.
3 An alternative procedure
In this section, we present Proc II, an alternative procedure which di¤ers from the pre-vious one in the computation of exceptional situations. This implies a di¤erent partitionof the signal space in routine and cooperative regimes, and di¤erent costs for informa-tion processing. Proc II includes the following tasks involving the sales agents and the
11
production agent. Each sales agent acquires a signal X�ii correlated with the demand in
her market whose cost is K (�), and afterwards she transfers her information (whateverit is) to the production unit, which combines it with all the shops�signals thus obtaininga joint signal XC = 1X� at the cost n'c. After this phase, the production unit is ableto make an assessment of the overall demand (i.e. whether the situation is exceptional orordinary). When the production manager recognizes an exceptional situation he informsthe sales managers that the team is in the coordination regime and he makes a decisionon the production scale at the cost n (1� ') c. Otherwise, i.e. in the routine regime, hechooses a predetermined scale.6
The gross pay-o¤ of the team is provided by (3), and the net pay-o¤, previouslyprovided by (4) modi�es in the following way:
u (q;V;�; n) = U (q;V; n)�PiK (�i)� n'c� n (1� ') cI, (10)
where I = 0 when the team enters the routine regime, and I = 1 when the team entersthe coordination regime.
The following proposition is the analogue of Proposition 1, when the production man-ager has put together the shops�signals before deciding on the regime.
Proposition 4 The (almost everywhere) unique optimal routine area for the joint signalXC = 1X� is given by R, where R = [1�v � r;1�v + r] , where r > 0, and the optimalroutine scale is given by: qR = a
b1�v.
Proof The proof is similar to that of Proposition 1 assuming n = 1, X1 = XC , andV1 = 1V.
Comparing Propositions (1) and (4), it emerges that the signal space is partitioned dif-ferently in the two procedures. In the two-shop case, under Proc I, the routine region is asquare (RI= fxj jx1j � r; jx2j � rg); while under Proc II, it is a strip centred on the bisec-trix of the second and fourth quadrant (RII= fxj jx1 + x2j � rg). Similar computationsapply to obtain the net pay-o¤ function of Proc II:
uII (�;A; n; ') = n���1� F (A) +AF 0 (A)
�(11)
�nK (�)� n'c� n (1� ') c (1� F (A)) ,
where A = rp�=�.
Equation (11) shows that the expected pay-o¤ per agent uII (�;A; n; ') =n is nota¤ected by the size of the team. Hence, provided that there is a pro�table technology forcollecting information together in a team composed of two agents, then it also permitsteams composed of n > 2 agents. Simulations con�rm the results obtained under Proc I.
The following proposition is the analogue of Proposition 2.
Proposition 5 Denote u�II (��; A�; n) =n as the expected pay-o¤ per agents choosing ��
and A� optimally, then:6Without explicitly considering the production phase, the role of the sale managers is limited to gath-
ering a signal, so that this procedures seem quite centralized. The need to inform the sales managers isbecause they have to modify their shop prices since q will be changed.
12
1. for every n, dd' [u
�II (�
�; A�; ') =n] < 0 and
2. for every n and for every '; ~' 2 (0; 1) with ' < ~', there exists a pair (c; k) such thatu�II (�
�; A�; ') =n > 0 and u�II (��; A�; ~') =n � 0.
Proof Similar to the Proof of Proposition 2.
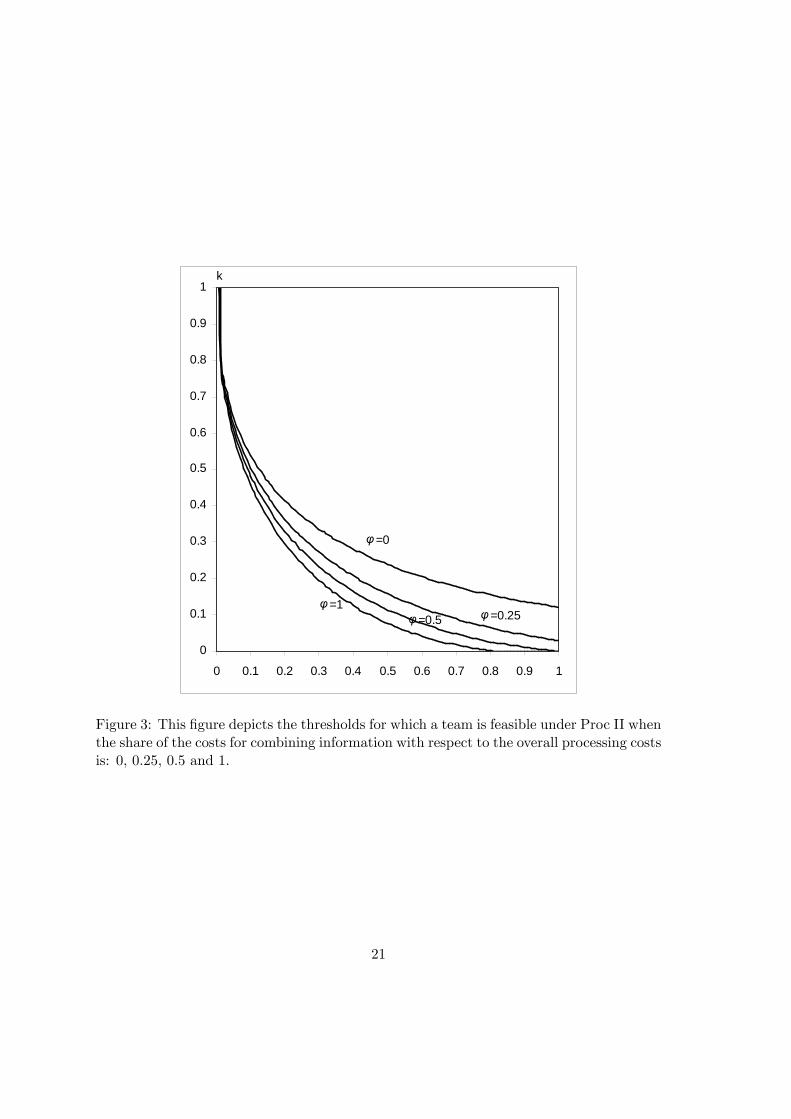
[Figure 3 around here]
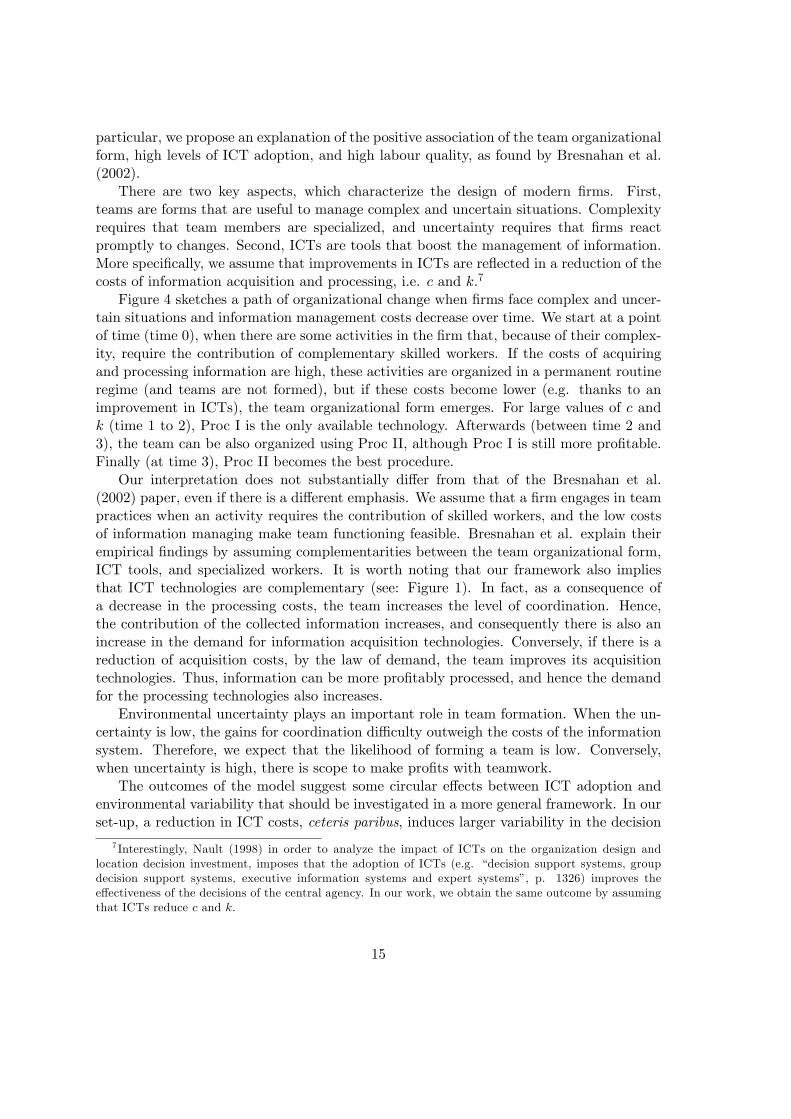
In Figure 3, we show the thresholds for which teamwork is feasible under Proc II, for' = 0, 0:25, 0:5 and 1. Points below the line correspond to pair (c; k) where coordinationis pro�table. The feasible region decreases with '.
4 Discussion
In this section we will focus on four issues. Firstly, we investigate when Proc I is equivalentto Proc II. Secondly, we compare the relative performance of the two procedures. Thirdly,we brie�y discuss the case when demand shocks (and hence signals) are correlated. Finally,we provide a brief description of the impact of ICTs on team coordination.
We denote u�I (c; k; n) as the maximal pay-o¤when a team follows Proc I. Analogously,we denote u�II (c; k; ') the maximal pay-o¤ under Proc II. We start by describing twoequivalence results.
Proposition 6 For every c and k, Proc I and Proc II are equivalent, i.e. u�I (c; k; n) =u�II (c; k; '), when:
A n = 1 and ' = 0, and
B n =1 and ' = 1.
Proof Straightforward.From Proposition 6.A, the pro�t when there is a single shop under Proc I and the pro�t
when the production unit has no costs in combining information under Proc II are thesame. Similarly, from Proposition 6.B, an in�nite number of �rms under Proc I or no costsin processing information under Proc II lead a team to gain the same pay-o¤s. In theselimiting situations, the pay-o¤ equivalence emerges as the partition of the signal space(i.e. the routine and cooperation areas) coincides in the two procedures: in A, the routineregion is an identical interval for both procedures; in B, there is no routine regime, sinceinformation is always combined and processed under Proc II, and thanks to Proposition3 under Proc I.
From Propositions 2 and 5, we also know that Proposition 6 indicates the upper and thelower bounds of the pay-o¤ function for any combination of c and k. More precisely, for anyc and k, the net pay-o¤ is maximal in case A, i.e. u�I (c; k; 1) = u
�II (c; k; 0) = uA (c; k), and
minimal in case B, i.e. u�I (c; k;1) = u�II (c; k; 1) = uB (c; k). Even if the two procedureshave the same limiting bounds, the interpretation of the conditions under which these
13
outcomes are reached is quite di¤erent. Under Proc I, the maximal pay-o¤ can be onlyreached at the expense of reducing the team to a single shop, while under Proc II, it occursthanks to an inexpensive combining technology. On the other hand, Proc I leads to theminimal pay-o¤ when the number of agents is in�nite, while under Proc II, we obtain thisresult when the production unit can not gather information together without processingit.
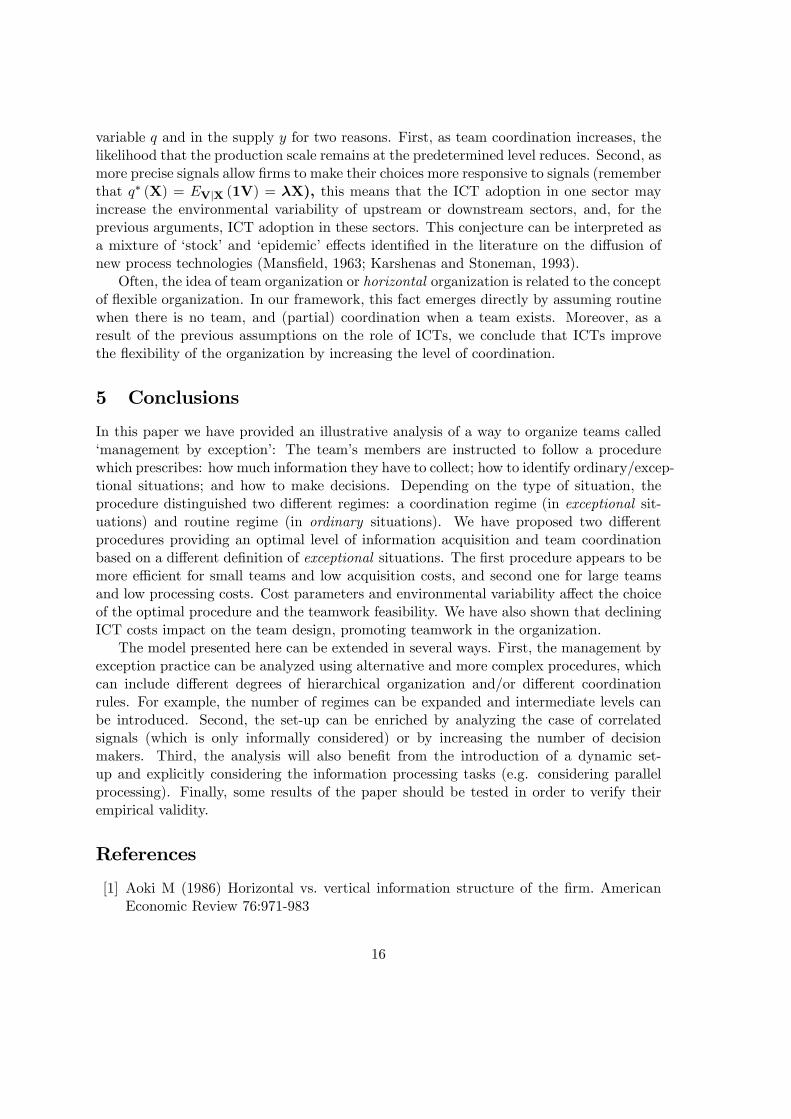
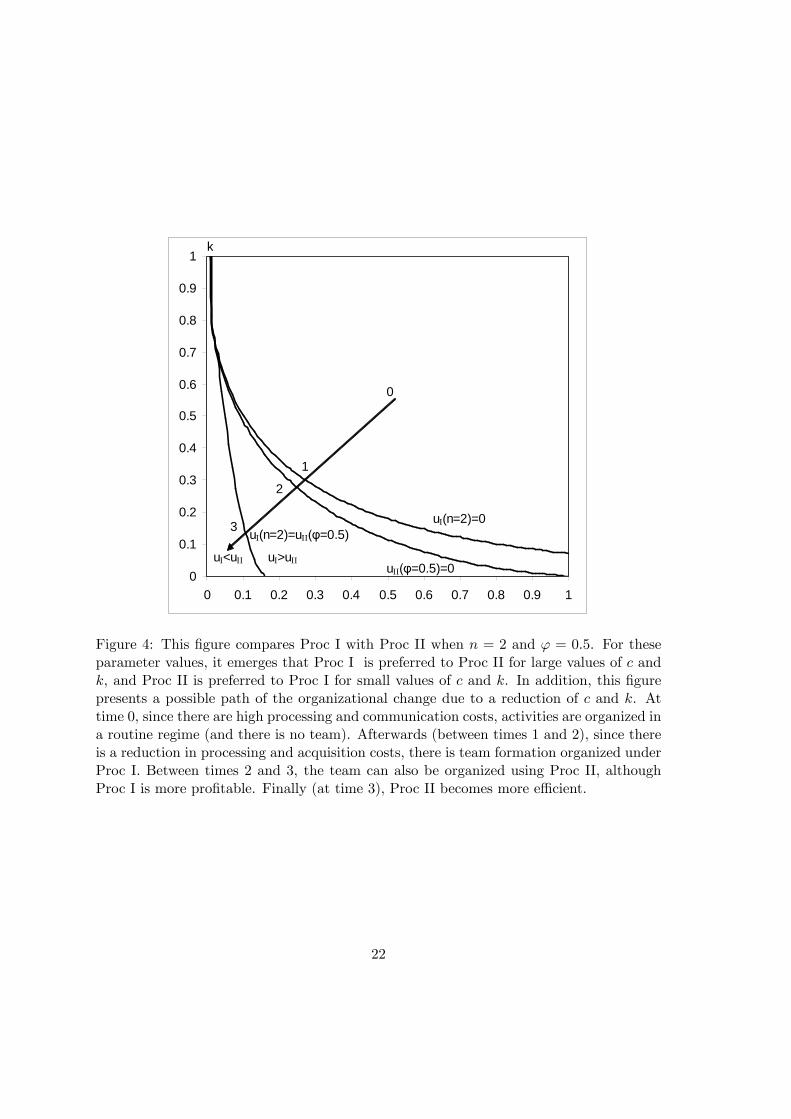
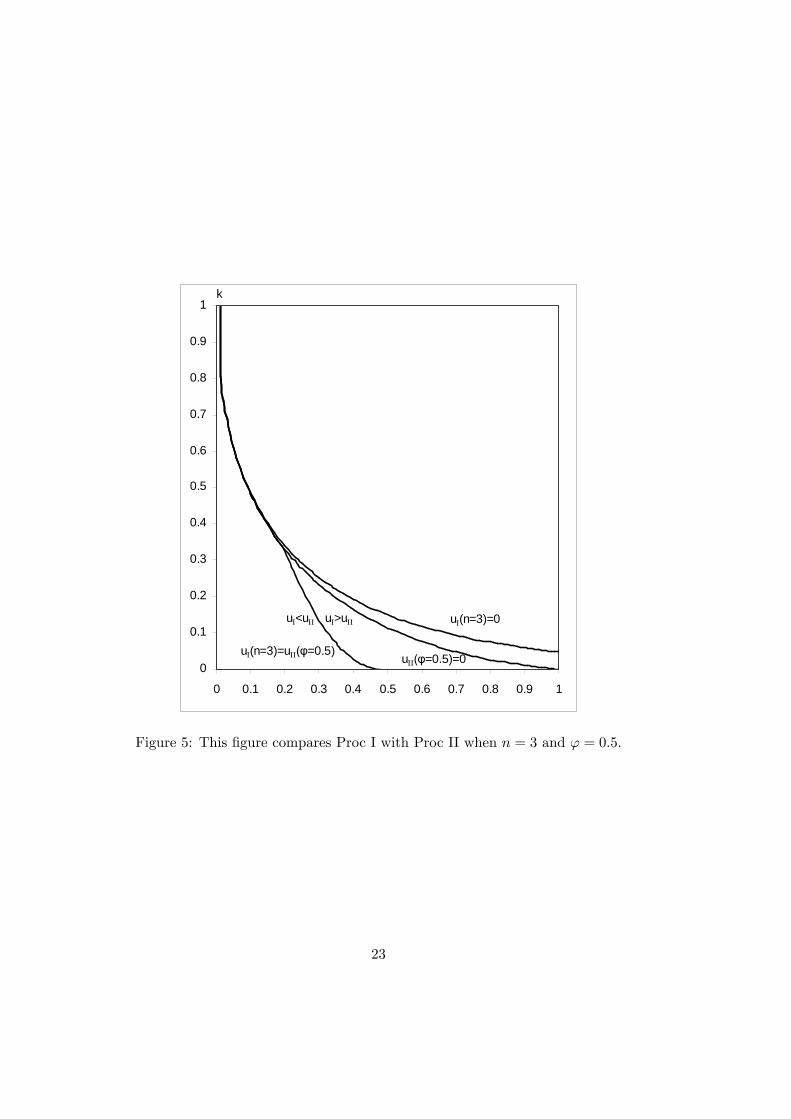
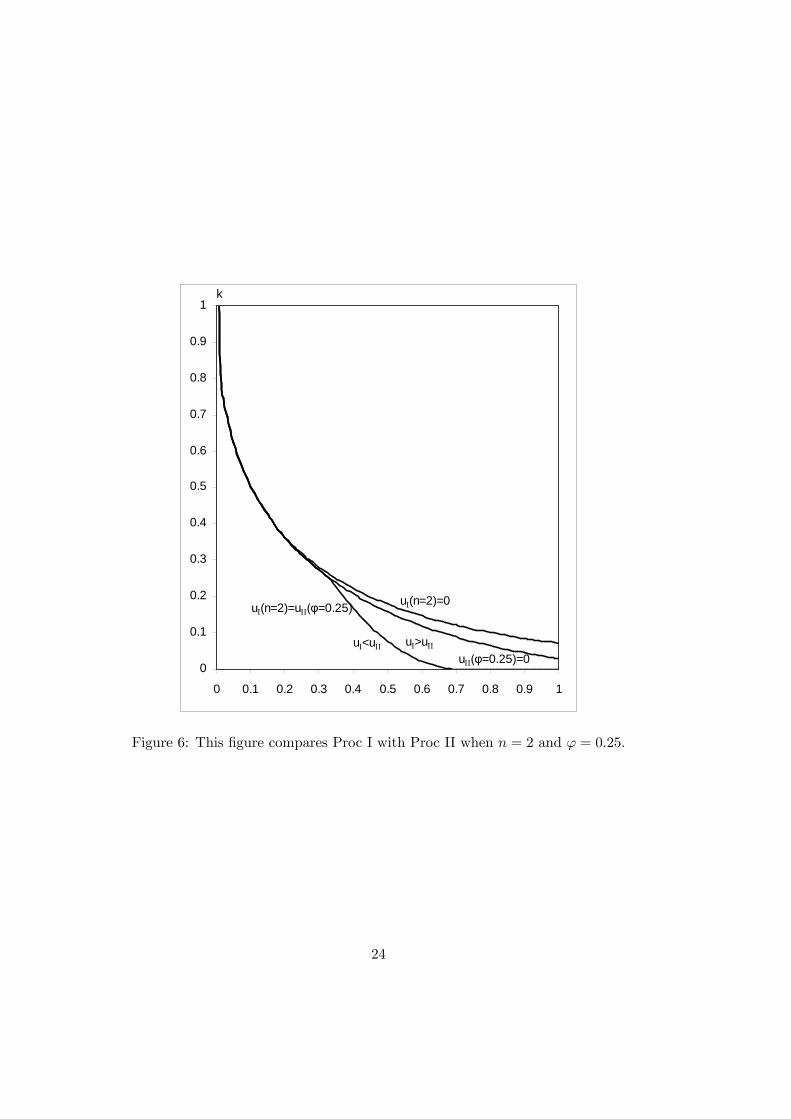
In Figures 4, 5 and 6, we compare Proc I with Proc II for di¤erent parameter values.When the processing and acquisition costs are su¢ ciently low, it emerges that Proc IIis always better than Proc I. Comparing Figures 4 and 5, we notice that Proc I is moree¤ective than Proc II when n is small. The e¢ ciency of Proc I drastically reduces whenthe number of agents increases. Similarly, comparing Figures 4 and 6, we notice thatProc II is more e¤ective than Proc I when ' is small. Finally, when costs of combininginformation are low, Proc II is preferred to Proc I, but, when they are high, the set ofpoints where Proc II dominates Proc I is small.
[Figures 4, 5 and 6 around here]
In this paper, the analysis was developed by considering independent markets. In thepresence of demand shock correlations (and correlated signals), the performance of theabove procedures change. For example, if the production unit recognizes that there arepositive correlations between shocks, it can improve the estimation of the demand for amarket by combining the signal coming from that market with those of others. This hascontrasting e¤ects. First, since the marginal contribution of a signal is larger than in thecase of independency, information acquisition is stimulated. Second, since the precision ofthe estimates of market demand is increased by using other signals, each shop can reduceits signal acquisition. The relative magnitude of these two e¤ects clearly depends onthe degree of correlation between signals and on the structure of signal acquisition costs.However, even if the second e¤ect dominates the �rst one, we expect that the precisionof the composed signal will increase, and, because of complementarity, the coordination(see: Figure 1). Note that positive correlation of demand may have an additional impacton information acquisition and coordination, since it implies a larger variability of theoverall demand
Pni=1 Vi. In this case, we also expect more precision in the estimation of
the demand and more coordination.Market interdependence may also have a qualitative impact on the procedure design.
In fact, to reduce processing and acquisition costs, a team can decide to make someshops specialized in information acquisition and use this information to provide an overallvaluation of market conditions. This policy has increasing advantages when there arescale economies in gathering information and/or in the information processing. In an n-shop case, with su¢ ciently highly correlated demands, one of the previous conditions issu¢ cient to induce the team to choose to make only one shop specialized in informationacquisition. In practice, the use of test markets is widely employed in marketing for thelaunch of new products, as well as in monitoring the evolution of a market (Gerald andBaron, 1977).
Organizational design can be analyzed together with the development of ICTs. In
14
particular, we propose an explanation of the positive association of the team organizationalform, high levels of ICT adoption, and high labour quality, as found by Bresnahan et al.(2002).
There are two key aspects, which characterize the design of modern �rms. First,teams are forms that are useful to manage complex and uncertain situations. Complexityrequires that team members are specialized, and uncertainty requires that �rms reactpromptly to changes. Second, ICTs are tools that boost the management of information.More speci�cally, we assume that improvements in ICTs are re�ected in a reduction of thecosts of information acquisition and processing, i.e. c and k.7
Figure 4 sketches a path of organizational change when �rms face complex and uncer-tain situations and information management costs decrease over time. We start at a pointof time (time 0), when there are some activities in the �rm that, because of their complex-ity, require the contribution of complementary skilled workers. If the costs of acquiringand processing information are high, these activities are organized in a permanent routineregime (and teams are not formed), but if these costs become lower (e.g. thanks to animprovement in ICTs), the team organizational form emerges. For large values of c andk (time 1 to 2), Proc I is the only available technology. Afterwards (between time 2 and3), the team can be also organized using Proc II, although Proc I is still more pro�table.Finally (at time 3), Proc II becomes the best procedure.
Our interpretation does not substantially di¤er from that of the Bresnahan et al.(2002) paper, even if there is a di¤erent emphasis. We assume that a �rm engages in teampractices when an activity requires the contribution of skilled workers, and the low costsof information managing make team functioning feasible. Bresnahan et al. explain theirempirical �ndings by assuming complementarities between the team organizational form,ICT tools, and specialized workers. It is worth noting that our framework also impliesthat ICT technologies are complementary (see: Figure 1). In fact, as a consequence ofa decrease in the processing costs, the team increases the level of coordination. Hence,the contribution of the collected information increases, and consequently there is also anincrease in the demand for information acquisition technologies. Conversely, if there is areduction of acquisition costs, by the law of demand, the team improves its acquisitiontechnologies. Thus, information can be more pro�tably processed, and hence the demandfor the processing technologies also increases.
Environmental uncertainty plays an important role in team formation. When the un-certainty is low, the gains for coordination di¢ culty outweigh the costs of the informationsystem. Therefore, we expect that the likelihood of forming a team is low. Conversely,when uncertainty is high, there is scope to make pro�ts with teamwork.
The outcomes of the model suggest some circular e¤ects between ICT adoption andenvironmental variability that should be investigated in a more general framework. In ourset-up, a reduction in ICT costs, ceteris paribus, induces larger variability in the decision
7 Interestingly, Nault (1998) in order to analyze the impact of ICTs on the organization design andlocation decision investment, imposes that the adoption of ICTs (e.g. �decision support systems, groupdecision support systems, executive information systems and expert systems�, p. 1326) improves thee¤ectiveness of the decisions of the central agency. In our work, we obtain the same outcome by assumingthat ICTs reduce c and k.
15
variable q and in the supply y for two reasons. First, as team coordination increases, thelikelihood that the production scale remains at the predetermined level reduces. Second, asmore precise signals allow �rms to make their choices more responsive to signals (rememberthat q� (X) = EVjX (1V) = �X), this means that the ICT adoption in one sector mayincrease the environmental variability of upstream or downstream sectors, and, for theprevious arguments, ICT adoption in these sectors. This conjecture can be interpreted asa mixture of �stock�and �epidemic�e¤ects identi�ed in the literature on the di¤usion ofnew process technologies (Mans�eld, 1963; Karshenas and Stoneman, 1993).
Often, the idea of team organization or horizontal organization is related to the conceptof �exible organization. In our framework, this fact emerges directly by assuming routinewhen there is no team, and (partial) coordination when a team exists. Moreover, as aresult of the previous assumptions on the role of ICTs, we conclude that ICTs improvethe �exibility of the organization by increasing the level of coordination.
5 Conclusions
In this paper we have provided an illustrative analysis of a way to organize teams called�management by exception�: The team�s members are instructed to follow a procedurewhich prescribes: how much information they have to collect; how to identify ordinary/excep-tional situations; and how to make decisions. Depending on the type of situation, theprocedure distinguished two di¤erent regimes: a coordination regime (in exceptional sit-uations) and routine regime (in ordinary situations). We have proposed two di¤erentprocedures providing an optimal level of information acquisition and team coordinationbased on a di¤erent de�nition of exceptional situations. The �rst procedure appears to bemore e¢ cient for small teams and low acquisition costs, and second one for large teamsand low processing costs. Cost parameters and environmental variability a¤ect the choiceof the optimal procedure and the teamwork feasibility. We have also shown that decliningICT costs impact on the team design, promoting teamwork in the organization.
The model presented here can be extended in several ways. First, the management byexception practice can be analyzed using alternative and more complex procedures, whichcan include di¤erent degrees of hierarchical organization and/or di¤erent coordinationrules. For example, the number of regimes can be expanded and intermediate levels canbe introduced. Second, the set-up can be enriched by analyzing the case of correlatedsignals (which is only informally considered) or by increasing the number of decisionmakers. Third, the analysis will also bene�t from the introduction of a dynamic set-up and explicitly considering the information processing tasks (e.g. considering parallelprocessing). Finally, some results of the paper should be tested in order to verify theirempirical validity.
References
[1] Aoki M (1986) Horizontal vs. vertical information structure of the �rm. AmericanEconomic Review 76:971-983
16
[2] Bernardo J, Smith A (1994) Bayesian Theory. John Wiley and Sons, New York
[3] Bresnahan T, Trajtenberg E (1995) General purpose technologies: Engines of growth.Journal of Econometrics 65:83-108
[4] Bresnahan T, Brynjolfsson E, Hitt L (2002) Information technology, workplace orga-nization, and the demand for skilled labor: �rm-level evidence. Quarterly Journal ofEconomics 117: 339-76
[5] Carter MJ (1995) Information and the division of labour. Implications for the �rm�schoice of organisation. Economic Journal 105:385-397
[6] Crémer J (1980) A partial theory of the optimal organization of a bureaucracy. BellJournal of Economics 11:683-693
[7] Geanakoplos J, Milgrom P (1991) A theory of hierarchies based on limited managerialattention. Journal of Japanese and International Economies 5:205-225
[8] Gerald EJ, Baron PH (1977) E¤ects of price and advertising in test-market experi-ments. Journal of Marketing Research 14:499-508
[9] Golden W, Powell P (2000) Towards a de�nition of �exibility: in search of the HolyGrail. Omega 28:373�84
[10] Gong Z, Hu S (2007) An economic evaluation model of product mix �exibility. Omega36:852-864
[11] Hitt LM, Brynjolfsson E (1997) Information technology and internal �rm organiza-tion: An exploratory analysis. Journal of Management Information Systems 14:81-101
[12] Holmström B (1979) Moral hazard and observability. Bell Journal of Economics 10:74-91
[13] Karshenas M, Stoneman P (1993). Rank, stock, order and epidemic e¤ects in the dif-fusion of new process technologies: an empirical model. RAND Journal of Economics24:503-528.
[14] Kim SK (1995) E¢ ciency of an information system in an agency model. Econometrica63:89-102
[15] Lauría E, Duchessi P (2007) A methodology for developing Bayesian networks: Anapplication to information technology (IT) implementation. European Journal of Op-erational Research 179:234-252
[16] Maggi G (1999) The value of commitment with imperfect observability and privateinformation. RAND Journal of Economics, 30:555-574
[17] Mans�eld E (1963). The speed of response of �rms to new techniques. QuarterlyJournal of Economics 77:290-309.
17
[18] Marshak J, Radner R (1972) Economic theory of teams. New Haven: Yale UniversityPress
[19] Mendelson H, Pillai R (1998) Clockspeed and informational response: Evidence fromthe information technology industry. Information Systems Research 9:415-433
[20] Mialon SH (2008) E¢ cient horizontal mergers: The e¤ects of internal capital real-location and organizational form. International Journal of Industrial Organization26:861-877
[21] Milgrom P, Roberts J (1990) The economics of modern manufacturing: technology,strategy, and organization. American Economic Review 80:511-28
[22] Nault BR (1998) Information technology and organization design: Locating decisionsand information. Management Science 44:1321-1335
[23] Persico N (2000) Information acquisition in auctions. Econometrica, 68:135-148
[24] Radner, R (1993) The organization of decentralized information processing. Econo-metrica 61:1109-1146
[25] Radner, R (1996) Bounded rationality, indeterminacy, and the theory of the �rm.Economic Journal 106:1360-1373
[26] Radner R, Stiglitz J (1984), in Bayesian models in economic theory, M Boyer and RKhilstrom (eds.), Elsevier, Amsterdam, pp. 33-52
[27] Sah RK, Stiglitz J (1986) The architecture of economic systems: Hierarchies andpolyarchies. American Economic Review 76:716-727
[28] Schulte E, Grüner HP (2007) Speed and quality of collective decision making: Imper-fect information processing. Journal of Economic Theory 134:138-154
[29] Shavell SM (1989) Sharing of information prior to settlement or litigation. RANDJournal of Economics 20:183-195
[30] Simon H (1955) A behavioral model of rational choice. Quarterly Journal of Eco-nomics 69:99-118
[31] Van Zandt T (1998) The scheduling and organization of periodic associative compu-tation: E¢ cient networks. Review of Economic Design 3:93-127
[32] Van Zandt T, Radner R (2001) Real-time decentralized information processing andreturns to scale. Economic Theory 17:545�575
18
6 Figures
0.65
0.7
0.75
0.8
0.85
0.5 0.55 0.6 0.65 0.7
reduction in communication costsreduction in processing costsincrease in variability
β=2
c =0.1
k =0.1
O = level of coordination
λ =signalprecision
Figure 1: The picture presents the optimal level of coordination O�, and of informationacquisition ��, for procedure Proc I. Three paths with the same starting values (c = k = 0:2and � = 1) are presented. The �rst path, describes the changes in O� and �� when c movesfrom 0:2 to 0:1. The second path looks at a change in � from 1 to 2, and the third oneshows a reduction in k from 0:2 to 0:1.
19
0
0.1
0.2
0.3
0.4
0.5
0.6
0.7
0.8
0.9
1
0 0.1 0.2 0.3 0.4 0.5 0.6 0.7 0.8 0.9 1
k
c
n=1
n=2
n=inf. n=3
Figure 2: This �gure depicts the thresholds for which a team of 1, 2, 3 or an in�nity ofagents is feasible under Proc I.
20
0
0.1
0.2
0.3
0.4
0.5
0.6
0.7
0.8
0.9
1
0 0.1 0.2 0.3 0.4 0.5 0.6 0.7 0.8 0.9 1
k
φ=0
φ=1φ=0.5 φ=0.25
Figure 3: This �gure depicts the thresholds for which a team is feasible under Proc II whenthe share of the costs for combining information with respect to the overall processing costsis: 0, 0:25, 0:5 and 1.
21
0
0.1
0.2
0.3
0.4
0.5
0.6
0.7
0.8
0.9
1
0 0.1 0.2 0.3 0.4 0.5 0.6 0.7 0.8 0.9 1
k
uI(n=2)=0
uII(φ=0.5)=0
uI(n=2)=uII(φ=0.5)
uI>uIIuI<uII
2
1
0
3
Figure 4: This �gure compares Proc I with Proc II when n = 2 and ' = 0:5. For theseparameter values, it emerges that Proc I is preferred to Proc II for large values of c andk, and Proc II is preferred to Proc I for small values of c and k. In addition, this �gurepresents a possible path of the organizational change due to a reduction of c and k. Attime 0, since there are high processing and communication costs, activities are organized ina routine regime (and there is no team). Afterwards (between times 1 and 2), since thereis a reduction in processing and acquisition costs, there is team formation organized underProc I. Between times 2 and 3, the team can also be organized using Proc II, althoughProc I is more pro�table. Finally (at time 3), Proc II becomes more e¢ cient.
22
0
0.1
0.2
0.3
0.4
0.5
0.6
0.7
0.8
0.9
1
0 0.1 0.2 0.3 0.4 0.5 0.6 0.7 0.8 0.9 1
k
uI(n=3)=0
uII(φ=0.5)=0uI(n=3)=uII(φ=0.5)
uI>uIIuI<uII
Figure 5: This �gure compares Proc I with Proc II when n = 3 and ' = 0:5.
23
0
0.1
0.2
0.3
0.4
0.5
0.6
0.7
0.8
0.9
1
0 0.1 0.2 0.3 0.4 0.5 0.6 0.7 0.8 0.9 1
k
uI(n=2)=0
uII(φ=0.25)=0
uI(n=2)=uII(φ=0.25)
uI>uIIuI<uII
Figure 6: This �gure compares Proc I with Proc II when n = 2 and ' = 0:25.
24