Embed Size (px)
Citation preview
UNIVERSITE DE STRASBOURG
Ecole Doctorale Mathématiques, Sciences de l’Information et de l’Ingénieur
Institut de Mécanique des Fluides et des Solides
THESE
Présentée pour obtenir le grade de:
Docteur de l’Université de Strasbourg
Spécialité: Mécanique des matériaux
Par
MOSSI IDRISSA Abdoul Kader
Modeling and simulation of the mechanical behavior under finite strains of
filled elastomers as function of their microstructure
Soutenue le 20 Juin 2011
Membres du jury:
Rapporteur: Pr Moussa NAÏT-ABDELAZIZ Polytech Lille
Rapporteur: Dr Laurent GORNET Ecole centrale de Nantes
Examinateur: Pr Jean Louis HALARY ESPCI ParisTech
Examinateur: Dr David RUCH CRP Henri Tudor, Luxembourg
Examinateur: Pr Stanislav PATLAZHAN SICP, Moscou, Russie
Co-directeur de thèse: Pr Yves REMOND Université de Strasbourg
Directeur de thèse: Pr Saïd AHZI Université de Strasbourg
For a wonderful woman, my grandmother
Zeinabou Issa.
MOSSI IDRISSA Abdoul Kader, University of Strasbourg - 3 -
Remerciements
Cette thèse de doctorat a été réalisée à l’Institut de Mécanique des Fluides et des Solides
(IMFS) de l’université de Strasbourg avec un financement du Ministère de l'Education
Nationale, de l'Enseignement Supérieur et de la Recherche. Je tiens alors à remercier son
directeur, professeur Yves REMOND pour son accueille chaleureux au sein du laboratoire.
Je tiens à exprimer ma profonde gratitude à mes directeurs de thèse les professeurs Saïd AHZI
et Yves REMOND pour leur disponibilité et leurs nombreux précieux conseils tout au long de
cette thèse, qui ont permit la concrétisation de ce travail.
J’adresse un grand merci au professeur Stanislav PATLAZHAN de Semenov Institute of
Chemical Physics de Moscou pour sa disponibilité et ses conseils scientifiques.
J’adresse toute ma reconnaissance aux professeurs Laurent GORNET, Moussa NAÏT-
ABDELAZIZ pour avoir accepté de rapporter ce travail, ainsi qu’aux examinateurs,
professeur Jean Louis HALARY, professeur Stanislav PATLAZHAN et au docteur David
RUCH.
Je remercie l’ensemble des membres de l’équipe lois de comportement et microstructure:
Siham M’GUIL, Nadia BAHLOULI, Joao Pedro CORREIA DE MAGALHAES, Ahmed
MAKRADI, Rodrigue MATADI BOUMBIMBA, Amin MIKDAM, Ly azib BOUHALA,
Muhammad Ali SIDDIQUI, Kamel HIZOUM, Olivier GUEGEN, Zhor NIBENNAOUNE,
Kui WANG, Wei WEN, Rania ABDEL RAHMAN MAHMOUD, Safa LHADI, Nicolas
BHART, Mathieu NIERENBERGER; ainsi que le personnel administratif et technique de
l’IMFS, Catherine HELMERINGER, Sylvie VILAIN, Daniel BITINGER, ESSA Michael,
Abdelkrim AZIZI, et Johary RASAMMANANA.
Enfin, à ma famille, mes amis et à l’ensemble de la communauté nigérienne à Strasbourg pour
leur soutien moral et tout ceux qui ont participé de près ou de loin à la réalisation de ce
travail; qu’ils trouvent ici ma gratitude.

Contents
MOSSI IDRISSA Abdoul Kader, University of Strasbourg - 4 -
Remerciements………………………………………………………………………….…….3
Contents……………………………………………………………………………………….4
Résumé…………………………………………………………………………………….......9
INTRODUCTION ……………………………………………………………….…...13
CHAPTER I ………………………………………………………………………….…16
WHAT IS AN ELASTOMER?
I.1. MOLECULAR STRUCTURE …..........................................................................17
I.2. VULCANIZITION ……………………………………………………....................18
I.3. HYPERELASTICITY AND VISCOELASTICITY ……………...……...…20
I.4. CARBON BLACK ……………………………………………………...…………..20
I.4.1. FILLERS………………………………………………………………………20
I.4.2. CARBON BLACK…………………………………………………………….21
I.5. UNFILLED ELASTOMERS’ MECHANICAL BEHAVIOR AND
OPTICAL ANISOTROPY …………………………………………………….………24
I.5.1. PHYSICAL THEORY………………………………………………………..24
I.5.1.1. SINGLE LONG-CHAIN TO ELASTOMER NETWORK BY
GAUSSIAN THEORY…………………………………………………..……24
Contents
MOSSI IDRISSA Abdoul Kader, University of Strasbourg - 5 -
I.5.1.2. SINGLE LONG-CHAIN TO ELASTOMER NETWORK BY NON-
GAUSSIAN THEORY………………………………………………………..26
I.5.1.2.1. Three-chain model…………………………………..………28
I.5.1.2.2. Four-chain model…………………………………………...29
I.5.1.2.3. Eight-chain model…………………………………………..29
I.5.1.2.4. Full Network Model………………………………………...30
I.5.2. PHENOMENOLOGICAL THEORY……………………………………….31
I.5.2.1. Mooney’s model (1940)………………………………………32
I.5.2.2. Mooney-Rivlin’s model (1948)……………………………….32
I.5.2.3. Rivlin and Saunders’s model (1951)………………………….32
I.5.2.4. Gent and Thomas model (1958)………………………………33
I.5.2.5. Ogden’s model (1972)………………………………………...33
I.5.2.6. Gent’s model (1996)…………………………………………..33
I.5.3. ELASTOMERS OPTICAL ANISOTROPY…………………………… …...34
I.6. FILLED ELASTOMERS MECHANICAL BEHAVIOR ………………...35
I.6.1. Voigt and Reuss models or upper and lower bounds…………...36
I.6.2. Guth-Gold model (1938) ……………………………………….36
I.6.3. Smallwood’s model (1944)……………………………………..36
I.6.4. Guth model (1945)……………………………………………...37
I.6.5. Mori-Tanaka model (1973)……………………………………..37
Contents
MOSSI IDRISSA Abdoul Kader, University of Strasbourg - 6 -
I.7. CONCLUSION ...........................................................................................................38
CHAPTER II ………………………………………………………………………...…39
MODELING OF THE STRESS-BIREFRINGENCE-STRETCH
BEHAVIOR IN RUBBERS USING THE GENT MODEL
II.1. STRESS-OPTICAL LAW …………………………………………………….…41
II.1.1. GAUSSIAN MODEL………………………………………………………...41
II.1.1.1. GAUSSIAN STRESS-STRETCH…………………………………...41
II.1.1.2. GAUSSIAN BIREFRINGENCE…………………………………….41
II.1.2. EIGHT-CHAIN MODEL……………………………………………… ……44
II.2. GENT MODEL AND OPTICAL ANISOTROPY ……………………...…45
II.2.1. GENT MODEL……………………………………………………………… 45
II.2.2. RESULTS…………………………………………………………………..…49
II.3. CONCLUSION………………………………………………………………… 59
Contents
MOSSI IDRISSA Abdoul Kader, University of Strasbourg - 7 -
CHAPTER III …………………………………………………………………………61
A CONSTITUTIVE MODEL FOR STRESS-STRAIN RESPONSE WIT H
MULLINS EFFECT IN FILLED ELASTOMERS
III.1. MICROSTRUCTURE BEHAVIOR ………………………………………...67
III.2. MECHANICAL BEHAVIOR …………………………………………………70
III.3. RESULTS ……........................................………………………………………….72
III.4. CONCLUSION ……………………………………………………………………81
CHAPTER IV …………………………………………………………………….……82
THERMOPLASTIC ELASTOMERS
IV.1. THERMOPLASTIC POLYURETHANES ………………………………...83
IV.2. THREE-DIMENSIONAL CONSTITUTIVE MODEL …………………86
IV.2.1. KINEMATICS OF FINITE STRAIN………….……………………….. …86
IV.2.2. CONSTITUTIVE MODEL………………………………………………… 88
IV.2.2.1. ELASTIC-VISCOPLASTIC OF THE GLASSY NETWORK
BEHAVIOR………………………………………………………………......90
Contents
MOSSI IDRISSA Abdoul Kader, University of Strasbourg - 8 -
IV.2.2.2. HYPERELASTIC OF THE RUBBERY NETWORK
BEHAVIOR…………………………………………………………………..92
IV.2.2.3. NUMERICAL IMPLEMENTATION…………………………...…92
IV.3. RESULTS…………...……………………………………………………………...95
IV.4. CONCLUSION .……………………………………………..…………………...100
V. CONCLUSIONS AND FUTURE WORK …………………………….101
REFERENCES……………………………………………………………………….....104
Résumé
MOSSI IDRISSA Abdoul Kader, University of Strasbourg - 9 -
Résumé
Aujourd’hui, notre quotidien fait intervenir l’usage d’innombrables matériaux
performants et adaptés à nos besoins, comme les alliages de fer, les céramiques, les
polymères. Les élastomères qui sont des matériaux caoutchouteux synthétiques ou naturels
appartiennent à cette dernière famille. Au fil des temps, le caoutchouc a connu plusieurs
révolutions dans sa fabrication, dont la principale est celle de 1839 avec Charles Goodyear. Il
a mit au point le procédé de vulcanisation qui consiste en un branchement des chaînes par des
liaisons covalentes.
La mise sous contrainte d’un élastomère provoque des changements mécaniques et
optiques. Les changements mécaniques sont en général formulés par une relation entre la
contrainte et la déformation. Ceux optiques sont dus à l’anisotropie, ils se caractérisent par la
différence de propagation de la lumière dans les différentes directions du matériau. Cette
anisotropie peut être mesurée par la biréfringence qui est la différence entre deux indices de
réfraction de deux directions principales.
Plusieurs travaux ont été effectués en se basant généralement sur des méthodes
Gaussiennes et non Gaussiennes pour déterminer les variations de la contrainte et de la
biréfringence dans les polymères en fonction de la déformation. Elles permettent aussi
d’obtenir une relation entre la contrainte et la biréfringence comme formulé par Treloar
(1947) pour le cas Gaussien et Arruda et Przybylo (1995) pour le modèle non Gaussien à
huit-chaînes. Le second est mieux adapté aux cas expérimentaux car il prend en compte l’effet
de la non linéarité pour les grandes déformations. Quant au premier, il n’est valable que dans
les cas de déformation modérée (1ε< ).
Résumé
MOSSI IDRISSA Abdoul Kader, University of Strasbourg - 10 -
Actuellement, deux modèles sont très utilisés pour prédire le comportement
mécanique des élastomères en fonction de la déformation: le modèle de Gent et celui de huit-
chaînes d’Arruda et Boyce. Par contre, seul le second a été étendu à la biréfringence pour
avoir une relation entre la biréfringence et la contrainte tout au long de la déformation dans
les élastomères. Raison pour laquelle dans cette étude, nous avons formulé une relation entre
la différence de deux contraintes principales quelconques du modèle de Gent en trois
dimensions avec la biréfringence sous la forme Gaussienne. Ensuite, les résultats numériques
de cette relation sont comparés avec ceux expérimentaux et du modèle non Gaussien à huit-
chaînes. Les résultats montrent que les prédictions de ce modèle concordent avec les résultats
expérimentaux en grande déformation comme celui basé sur le modèle de huit-chaînes.
Plusieurs autres phénomènes physiques caractérisent les élastomères dont l’élasticité
non linéaire, la viscoélasticité, l’hyperélasticité, et principalement une température de
transition vitreuse inférieure à la température ambiante, ceci implique un état caoutchouteux
des élastomères à la température ambiante. L’effet Mullins est un phénomène
d’adoucissement qui se produit particulièrement dans les élastomères chargés. En effet, pour
améliorer leurs propriétés chimiques ou mécaniques, les élastomères sont renforcés par des
nodules de noir de carbone ou d’autres particules. Mullins et Tobin (1957,1965) considèrent
un élastomère renforcé comme un matériau composite à deux domaines, dont un domaine
mou et un domaine dur. D’après leur concept, l’effet Mullins n’est autre que la transformation
d’une partie du domaine dur en domaine mou lorsque le composite est sollicité en contrainte.
Dans nos travaux, pour modéliser le comportement mécanique d’élastomères chargés
en fonction de leur microstructure, on a considéré un matériau composite à base d’élastomère
constitué par une matrice en élastomère, une partie de matrice occluse par les renforts et les
Résumé
MOSSI IDRISSA Abdoul Kader, University of Strasbourg - 11 -
renforts qui sont des nodules de noir de carbone comme dans l’industrie pneumatique. Ainsi,
la matrice constitue le domaine mou considéré par Mullins et Tobin tandis que les deux autres
constituent le domaine dur c'est-à-dire la fraction volumique effective des renforts (incluant la
matrice occluse). L’estimation du domaine dur en fonction du type de nodule de noir de
carbone et de sa fraction volumique est obtenue à partir des mesures de microscopie
électronique de Medalia (1970). D’où on peut quantifier le domaine dur de notre composite.
En se basant sur les équations de la mécanique des milieux continus, on établit la
relation entre la contrainte et la déformation tout au long du chargement du composite, en
tenant compte de l’évolution de sa microstructure. Cette évolution de la microstructure se
caractérise principalement par la libération des portions inactives de la matrice qui se trouvent
emprisonnées entre les particules, provoquant ainsi une augmentation de la fraction
volumique du domaine mou dans le composite. Cette transformation est modélisée par la
théorie proposée par Oshmyan et al (2006). Ensuite, l’énergie de déformation de Gent
(1996) pour les matériaux caoutchouteux non chargés a été reformulée pour tenir compte de
l’effet des particules de renforts dans le composite. Le principal fondement de cette
reformulation est d’admettre que la déformation du composite se produit uniquement au sein
du domaine mou. Ainsi, l’énergie de déformation se réduit à celle du domaine mou,
impliquant la connaissance de l’évolution de sa fraction volumique durant la déformation. La
modélisation du comportement mécanique avec l’effet Mullins spécifique à chaque type de
nodules de noir de carbone est ainsi établie avec la mise en relation de l’évolution de la
microstructure et la loi de comportement reformulée utilisant la théorie de Gent.
Le modèle obtenu donne des résultats numériques du comportement mécanique des
élastomères chargés avec l’effet Mullins en tenant compte du type de nodules de carbone, la
Résumé
MOSSI IDRISSA Abdoul Kader, University of Strasbourg - 12 -
fraction volumique des renforts et les modes de déformation (uni-axial, bi-axial ou en
déformation plane). Ces résultats concordent aussi avec des résultats expérimentaux trouvés
dans la littérature. Ce modèle est ensuite étendu au cas de l’élastomère thermoplastique
polyuréthane dont le comportement mécanique introduit de la viscoplasticité.
Introduction
MOSSI IDRISSA Abdoul Kader, University of Strasbourg - 13 -
INTRODUCTION
For their properties, elastomers are very useful materials for many applications like
pneumatic, cable jacketing for electrical or electronic industries, shaft seals, shock absorbers
and power-transmission flexible joints used for automotive, rail, aerospace and other
engineering industries. These examples show how elastomeric materials become more and
more important for industries which aim to improve our life conditions. The current advances
made on elastomeric materials properties knowledge explain the increase in their performance
and process for different industries applications. However, a deeper understanding of these
materials behavior could provide a useful tool for higher performance elastomers production.
Elastomeric materials are usually classified as function of their origin, their ability to
vulcanization or their composition. Hence, we have natural or synthetic elastomers,
vulcanizable or thermoplastic elastomers and filled or unfilled elastomers.
Filled or unfilled elastomers mechanical behaviors are predicted by physical or
phenomenological models but their optical anisotropy behavior is given by a physical
Gaussian or non-Gaussian model. In physical models, the behavior involves two essential
scales which are the treatment for a single macromolecule long-chain structure and the
application of this treatment to the material network. Thus, the contribution of all chains in the
network corresponds to the material behavior. Some model applications may present
limitations like for the well known Gaussian model which is adapted for moderate strains.
However, for high strains, a Gaussian model may become inadequate. In this case, one can
use a more elaborate non-Gaussian model developed by Kuhn and Grun (1942) and James
and Guth (1943) for small strain to full extended length. A phenomenological model is a
Introduction
MOSSI IDRISSA Abdoul Kader, University of Strasbourg - 14 -
purely mathematical approach. The aim of such method is essentially to find the most general
way to describe material properties.
Here, we investigate modeling optical anisotropy behavior for unfilled elastomers under stress
and also Mullins effect or softening produced in filled elastomers during cyclic loading-
unloading-reloading. Modeling of thermoplastic elastomers behavior is also investigated. This
work will be subdivided into four chapters. In the first chapter, we introduce a general
presentation of elastomeric materials. It presents a summary of the origin of elastomers and a
short history on the material evolution. We also discuss, in this chapter, the elastomeric
materials chemical and mechanical properties like the macromolecule structure obtained from
the monomers, vulcanization process, viscoelasticity or hyperelasticity behavior. Different
physical and phenomenological models are presented for unfilled and filled elastomers. The
second chapter is on the modeling and prediction of the mechanical and optical property of
unfilled elastomers where the Gaussian theory for optical anisotropy and the corresponding
stress-optical law is utilized. We show how Gent (1996) model can be extended to optical
anisotropy prediction during stretching. The proposed approach is compared to Arruda and
Przybylo (1995) model and to experimental data from literature. In the third chapter, a
constitutive model is built to predict mechanical behavior of filled elastomers based on the
consideration of microstructure evolution using hard-to-soft domains transformations. In the
last chapter, the elastic-viscoplastic behavior is introduced in the constitutive model in order
to predict thermoplastic elastomers behavior (stress-strain response), with particular
application to thermoplastic polyurethane. The obtained model is validated by experimental
data from literature.
Introduction
MOSSI IDRISSA Abdoul Kader, University of Strasbourg - 15 -
Finally, this thesis is concluded by a general conclusion and remarks. Some suggestions on
future research are also exposed.
Chapter I: WHAT IS AN ELASTOMER?
MOSSI IDRISSA Abdoul Kader, University of Strasbourg - 16 -
CHAPTER I
WHAT IS AN ELASTOMER?
The term elastomer is often used interchangeably with the term rubber. Elastomers are
amorphous polymer materials which have the ability to recover their shape after a large
deformation. They are normally used at temperatures above their glass transition temperature
so that considerable molecular segmental motion is possible. Thus, elastomers are soft and
deformable. However, hard plastics normally exist either below their glass transition
temperature, they are called thermoplastics at room temperature. They are different from other
polymers because of their special properties such as flexibility, extensibility, resilience and
durability. Elastomers are used in a wide range of applications because of their unusual
physical properties.
The first known elastomer was natural rubber. It was originally derived from milky colloidal
suspension, or latex found in the sap of some plants such as Para rubber tree which present the
major commercial source of natural latex. The purified natural rubber corresponds to the
chemical polyisoprene which can also be produced synthetically. Mentioned by Spanish and
Portuguese writers in the 16th century, pre-Columbian people of South and Central America
like Maya used non-vulcanized natural rubber to make balls, containers, shoes and
waterproofing fabrics. Charles Marie de la Condamine is credited of introducing samples of
rubber in 1736 to the French Academy of Sciences. He called this material by the name used
by natives, caoutchouc. In 1751, it was presented a paper on rubber by François Fresneau at
Chapter I: WHAT IS AN ELASTOMER?
MOSSI IDRISSA Abdoul Kader, University of Strasbourg - 17 -
the same Academy. He described many properties of rubber in a paper which was published
in 1755. This paper has been referred as the first scientific paper on rubber. Before 1800,
natural rubber was used only for elastic bands and erasers. Joseph Priestley is credited the
discovery of its use as an eraser and also the name rubber for this material. In 1823, Charles
Macintosh found a process using rubber to make waterproof. In 1839, the industry of rubber
was revolutionized with the discovery of vulcanization process by Charles Goodyear. His
process consists to heat natural rubber with sulfur. It was first used in Springfield,
Massachusetts, in 1841. During the latter half of the 19th century, rubber was demanded for its
insulating property by the electrical industry. After, the pneumatic tire increased this demand.
I.1. MOLECULAR STRUCTURE
Elastomers like other polymers are obtained by polymerization process which can be
illustrated by monomers conversion to macromolecular structures. Example, ethylene
molecules are converted into polyethylene which is the most widely produced thermoplastic
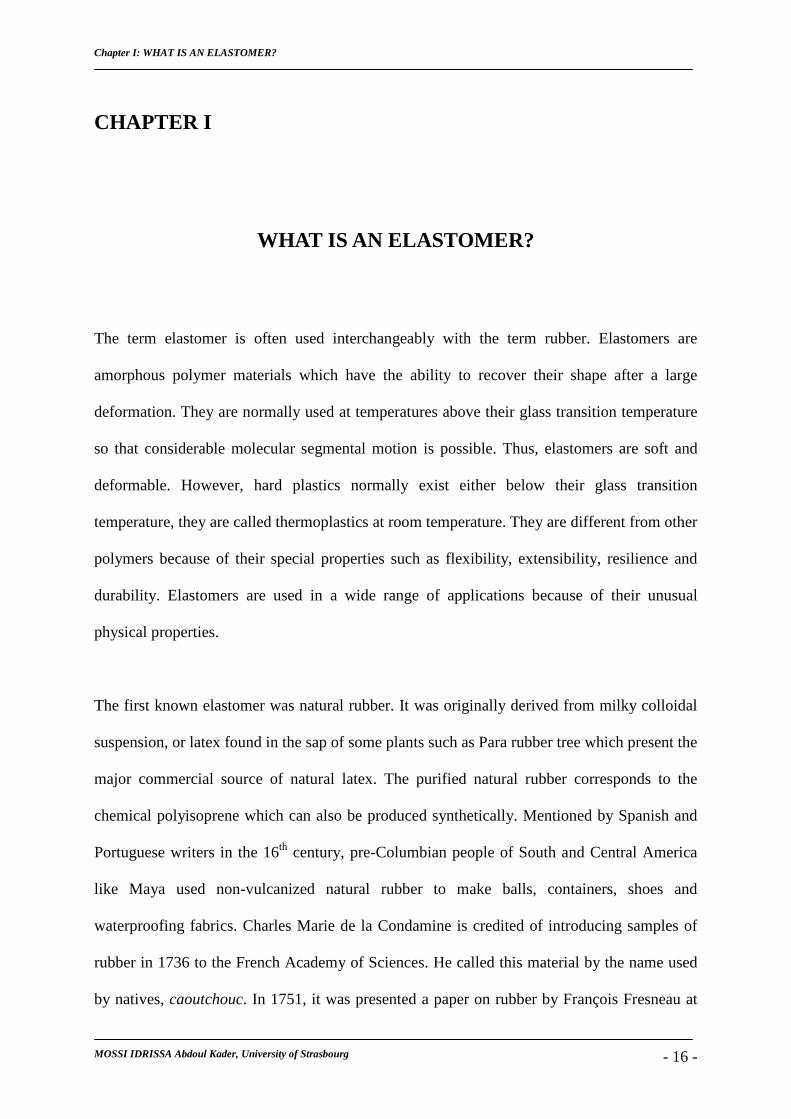
in the word. The ethylene molecule (In Figure I.1) which is unsaturated must be transformed
under appropriate conditions of heating and pressure with the presence of catalyst. Then, the
double bond between the two carbon atoms can be broken and replaced by a single saturated
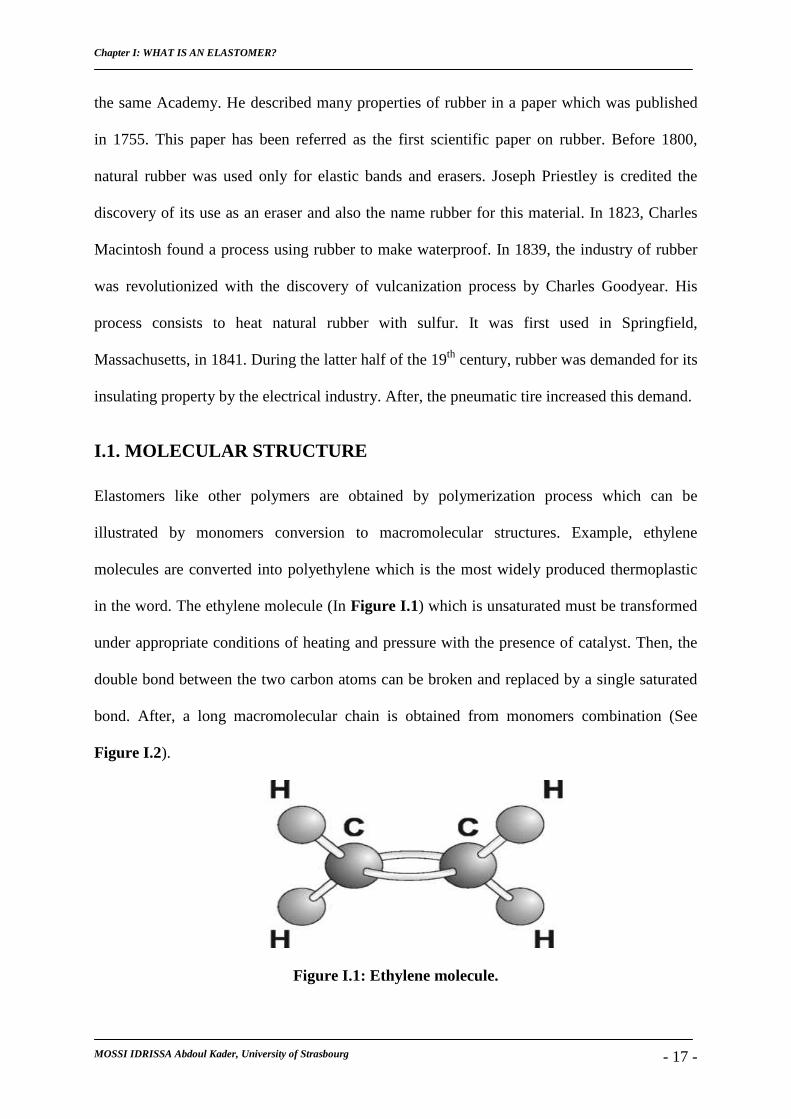
bond. After, a long macromolecular chain is obtained from monomers combination (See
Figure I.2).
Figure I.1: Ethylene molecule.
Chapter I: WHAT IS AN ELASTOMER?
MOSSI IDRISSA Abdoul Kader, University of Strasbourg - 18 -
Figure I.2: Polyethylene macromolecule.
I.2. VULCANIZITION
Vulcanization is a process applied to some elastomeric materials in order to improve their
retraction to approximately original shape after large mechanical imposed deformation.
Vulcanization can be defined as a process that increases the retractile forces and decreases the
permanent deformation remaining after unloading. Hence, vulcanization increases elasticity in
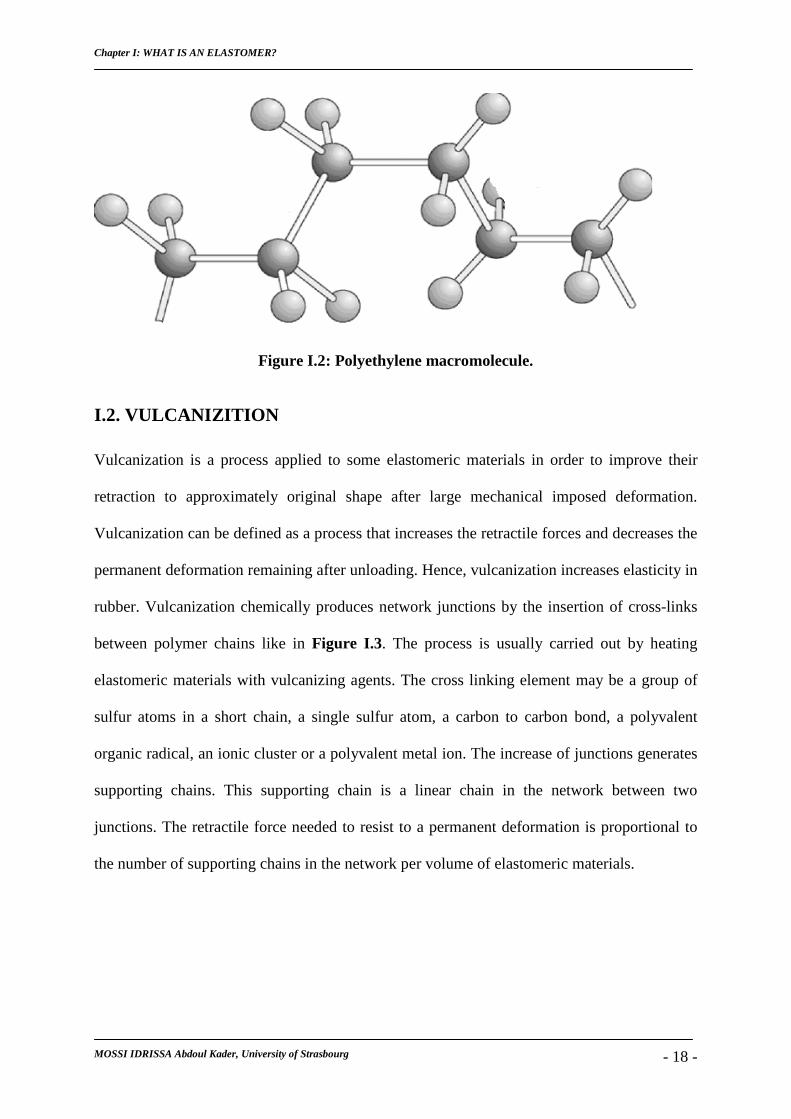
rubber. Vulcanization chemically produces network junctions by the insertion of cross-links
between polymer chains like in Figure I.3. The process is usually carried out by heating
elastomeric materials with vulcanizing agents. The cross linking element may be a group of
sulfur atoms in a short chain, a single sulfur atom, a carbon to carbon bond, a polyvalent
organic radical, an ionic cluster or a polyvalent metal ion. The increase of junctions generates
supporting chains. This supporting chain is a linear chain in the network between two
junctions. The retractile force needed to resist to a permanent deformation is proportional to
the number of supporting chains in the network per volume of elastomeric materials.
Chapter I: WHAT IS AN ELASTOMER?
MOSSI IDRISSA Abdoul Kader, University of Strasbourg - 19 -
Figure I.3: Vulcanized network formation.
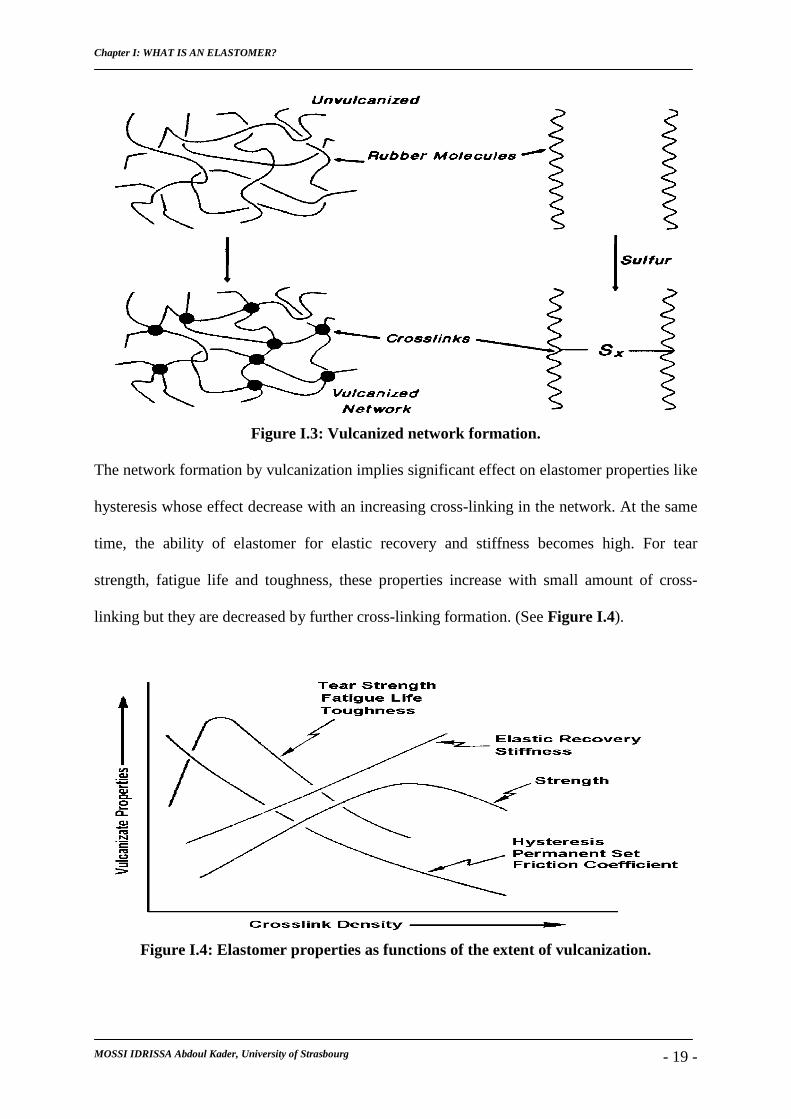
The network formation by vulcanization implies significant effect on elastomer properties like
hysteresis whose effect decrease with an increasing cross-linking in the network. At the same
time, the ability of elastomer for elastic recovery and stiffness becomes high. For tear
strength, fatigue life and toughness, these properties increase with small amount of cross-
linking but they are decreased by further cross-linking formation. (See Figure I.4).
Figure I.4: Elastomer properties as functions of the extent of vulcanization.
Chapter I: WHAT IS AN ELASTOMER?
MOSSI IDRISSA Abdoul Kader, University of Strasbourg - 20 -
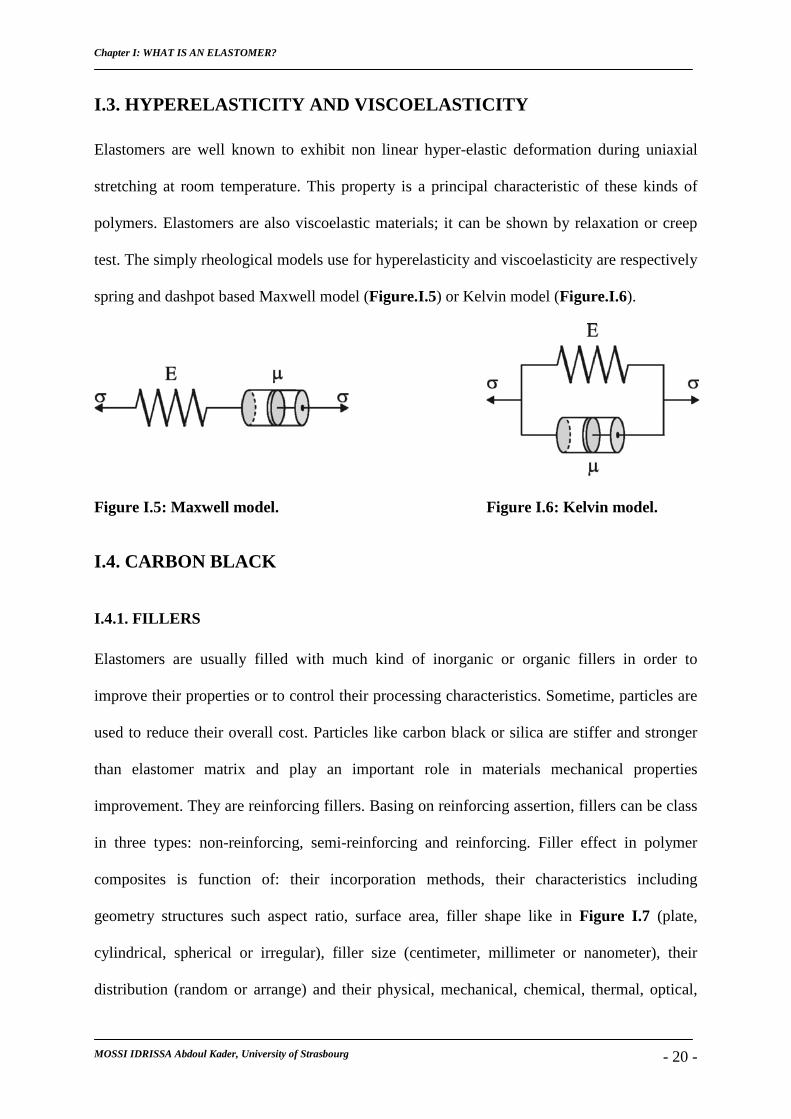
I.3. HYPERELASTICITY AND VISCOELASTICITY
Elastomers are well known to exhibit non linear hyper-elastic deformation during uniaxial
stretching at room temperature. This property is a principal characteristic of these kinds of
polymers. Elastomers are also viscoelastic materials; it can be shown by relaxation or creep
test. The simply rheological models use for hyperelasticity and viscoelasticity are respectively
spring and dashpot based Maxwell model (Figure.I.5) or Kelvin model (Figure.I.6).
Figure I.5: Maxwell model. Figure I.6: Kelvin model.
I.4. CARBON BLACK
I.4.1. FILLERS
Elastomers are usually filled with much kind of inorganic or organic fillers in order to
improve their properties or to control their processing characteristics. Sometime, particles are
used to reduce their overall cost. Particles like carbon black or silica are stiffer and stronger
than elastomer matrix and play an important role in materials mechanical properties
improvement. They are reinforcing fillers. Basing on reinforcing assertion, fillers can be class
in three types: non-reinforcing, semi-reinforcing and reinforcing. Filler effect in polymer
composites is function of: their incorporation methods, their characteristics including
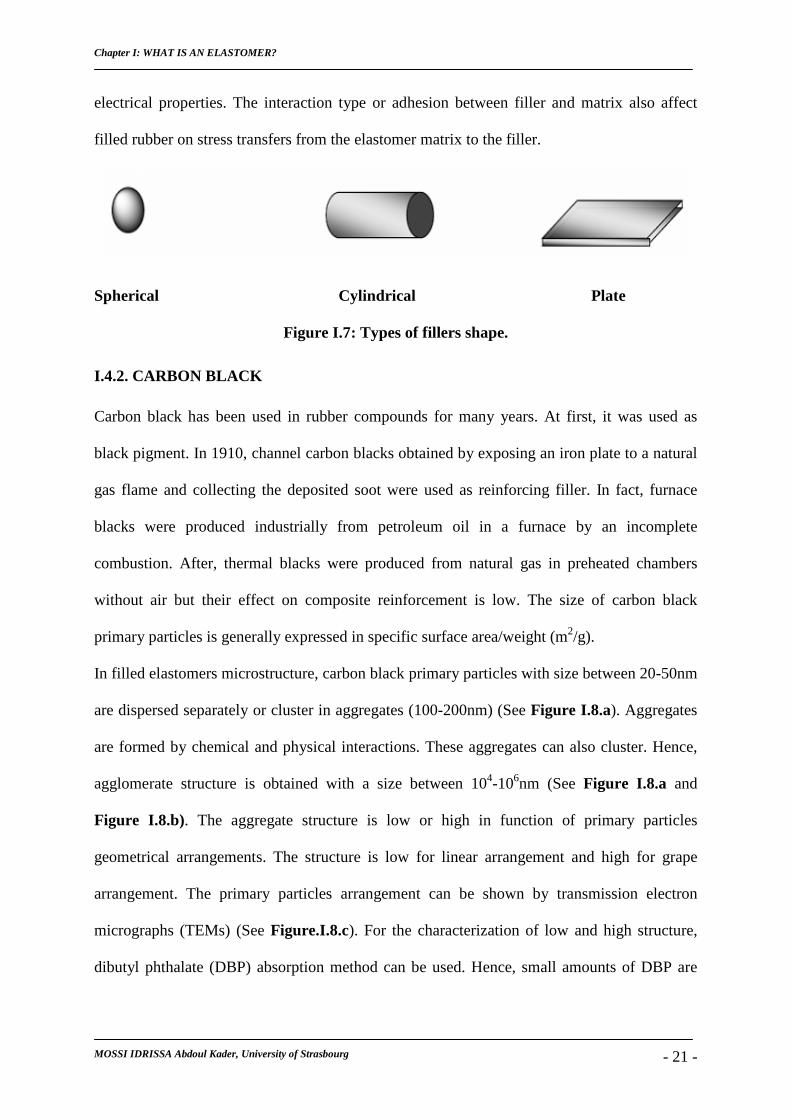
geometry structures such aspect ratio, surface area, filler shape like in Figure I.7 (plate,
cylindrical, spherical or irregular), filler size (centimeter, millimeter or nanometer), their
distribution (random or arrange) and their physical, mechanical, chemical, thermal, optical,
Chapter I: WHAT IS AN ELASTOMER?
MOSSI IDRISSA Abdoul Kader, University of Strasbourg - 21 -
electrical properties. The interaction type or adhesion between filler and matrix also affect
filled rubber on stress transfers from the elastomer matrix to the filler.
Spherical Cylindrical Plate
Figure I.7: Types of fillers shape.
I.4.2. CARBON BLACK
Carbon black has been used in rubber compounds for many years. At first, it was used as
black pigment. In 1910, channel carbon blacks obtained by exposing an iron plate to a natural
gas flame and collecting the deposited soot were used as reinforcing filler. In fact, furnace
blacks were produced industrially from petroleum oil in a furnace by an incomplete
combustion. After, thermal blacks were produced from natural gas in preheated chambers
without air but their effect on composite reinforcement is low. The size of carbon black
primary particles is generally expressed in specific surface area/weight (m2/g).
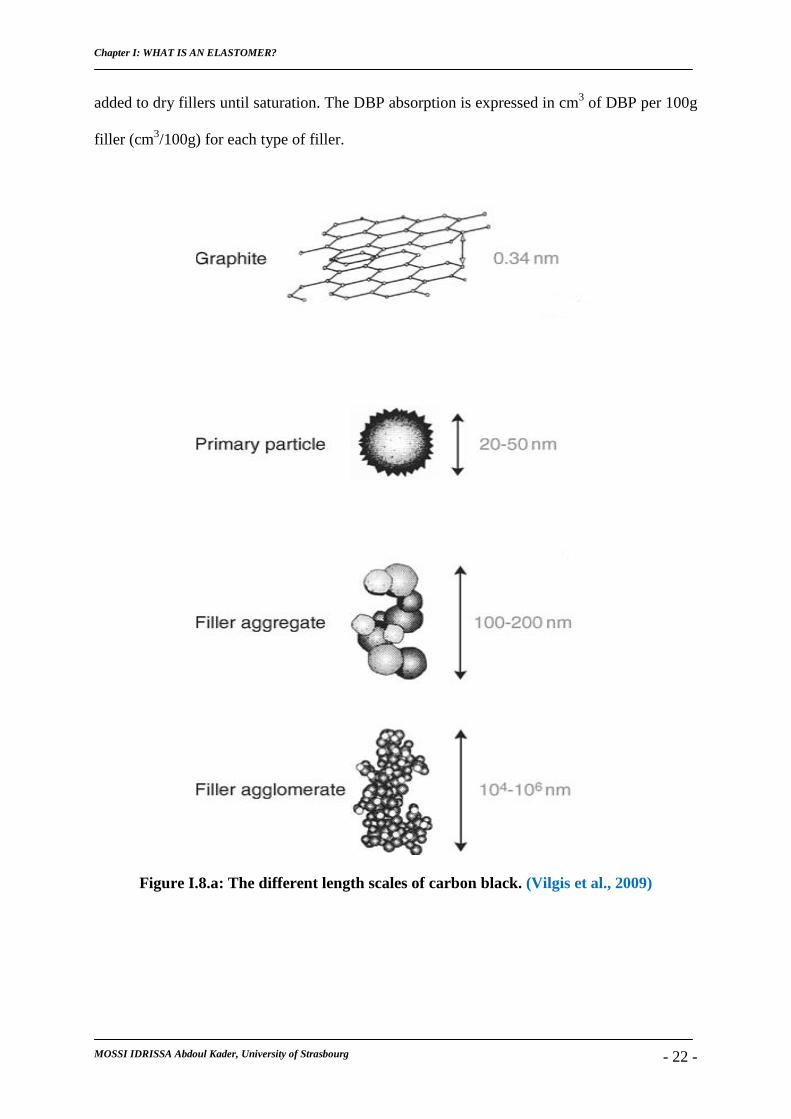
In filled elastomers microstructure, carbon black primary particles with size between 20-50nm
are dispersed separately or cluster in aggregates (100-200nm) (See Figure I.8.a). Aggregates
are formed by chemical and physical interactions. These aggregates can also cluster. Hence,
agglomerate structure is obtained with a size between 104-106nm (See Figure I.8.a and
Figure I.8.b). The aggregate structure is low or high in function of primary particles
geometrical arrangements. The structure is low for linear arrangement and high for grape
arrangement. The primary particles arrangement can be shown by transmission electron
micrographs (TEMs) (See Figure.I.8.c). For the characterization of low and high structure,
dibutyl phthalate (DBP) absorption method can be used. Hence, small amounts of DBP are
Chapter I: WHAT IS AN ELASTOMER?
MOSSI IDRISSA Abdoul Kader, University of Strasbourg - 22 -
added to dry fillers until saturation. The DBP absorption is expressed in cm3 of DBP per 100g
filler (cm3/100g) for each type of filler.
Figure I.8.a: The different length scales of carbon black. (Vilgis et al., 2009)
Chapter I: WHAT IS AN ELASTOMER?
MOSSI IDRISSA Abdoul Kader, University of Strasbourg - 23 -
Figure I.8.b: Filler agglomerate structure.
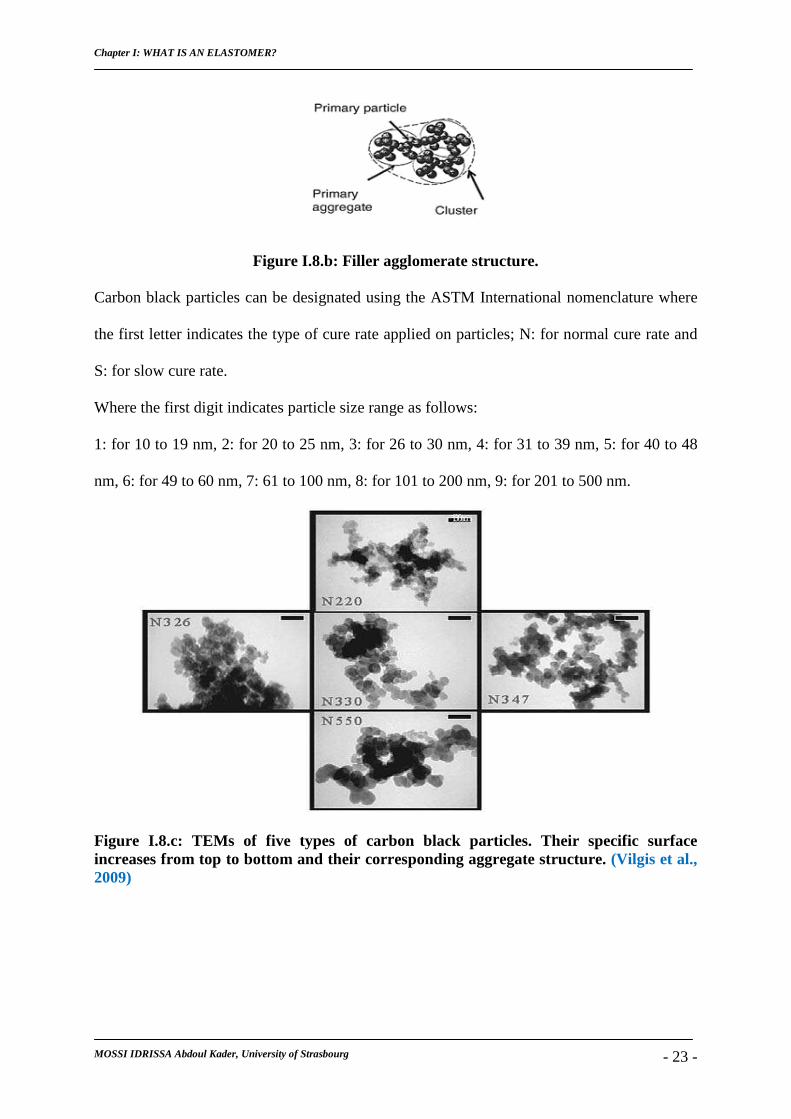
Carbon black particles can be designated using the ASTM International nomenclature where
the first letter indicates the type of cure rate applied on particles; N: for normal cure rate and
S: for slow cure rate.
Where the first digit indicates particle size range as follows:
1: for 10 to 19 nm, 2: for 20 to 25 nm, 3: for 26 to 30 nm, 4: for 31 to 39 nm, 5: for 40 to 48
nm, 6: for 49 to 60 nm, 7: 61 to 100 nm, 8: for 101 to 200 nm, 9: for 201 to 500 nm.
Figure I.8.c: TEMs of five types of carbon black particles. Their specific surface increases from top to bottom and their corresponding aggregate structure. (Vilgis et al., 2009)
Chapter I: WHAT IS AN ELASTOMER?
MOSSI IDRISSA Abdoul Kader, University of Strasbourg - 24 -
I.5. UNFILLED ELASTOMERS MECHANICAL BEHAVIOR AND
OPTICAL ANISOTROPY
I.5.1. PHYSICAL THEORY
I.5.1.1. SINGLE LONG-CHAIN TO ELASTOMER NETWORK BY GAUSSIAN THEORY
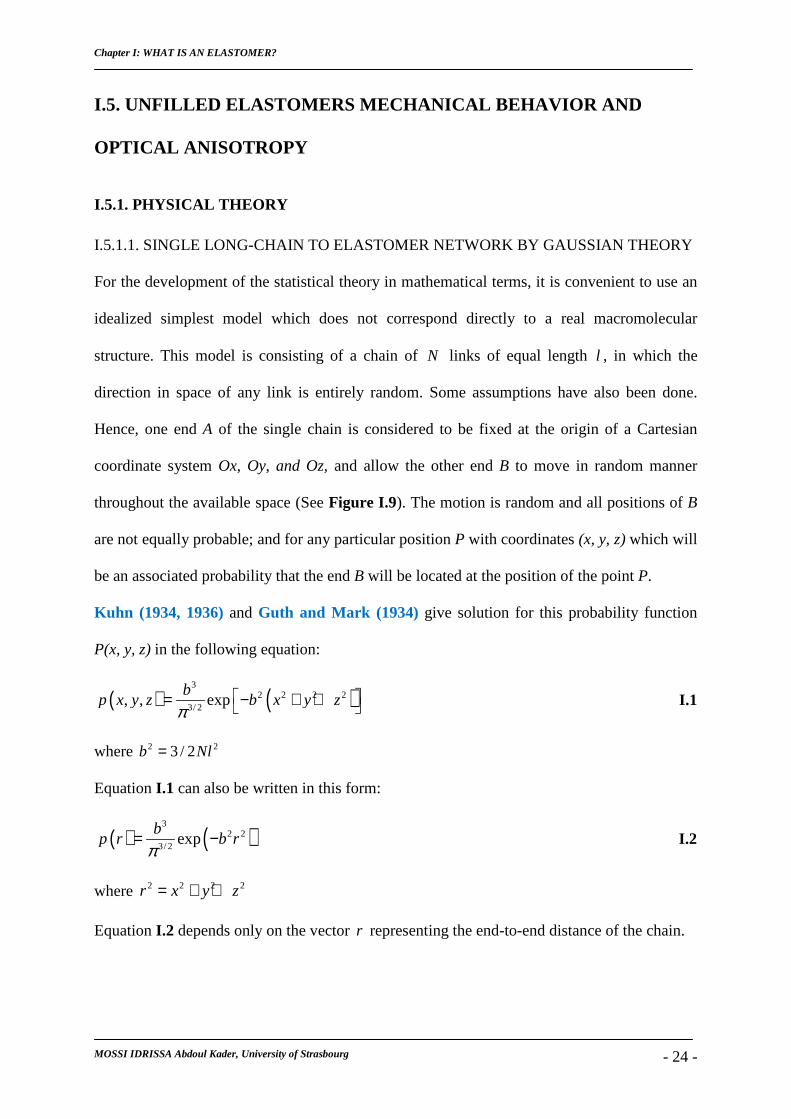
For the development of the statistical theory in mathematical terms, it is convenient to use an
idealized simplest model which does not correspond directly to a real macromolecular
structure. This model is consisting of a chain of N links of equal length l , in which the
direction in space of any link is entirely random. Some assumptions have also been done.
Hence, one end A of the single chain is considered to be fixed at the origin of a Cartesian
coordinate system Ox, Oy, and Oz, and allow the other end B to move in random manner
throughout the available space (See Figure I.9). The motion is random and all positions of B
are not equally probable; and for any particular position P with coordinates (x, y, z) which will
be an associated probability that the end B will be located at the position of the point P.
Kuhn (1934, 1936) and Guth and Mark (1934) give solution for this probability function
P(x, y, z) in the following equation:
( ) ( )3
2 2 2 23/ 2
, , expb
p x y z b x y zπ
= − + + I.1
where 2 23 / 2b Nl=
Equation I.1 can also be written in this form:
( ) ( )3
2 23/ 2
expb
p r b rπ
= − I.2
where 2 2 2 2r x y z= + +
Equation I.2 depends only on the vector r representing the end-to-end distance of the chain.
Chapter I: WHAT IS AN ELASTOMER?
MOSSI IDRISSA Abdoul Kader, University of Strasbourg - 25 -
Figure I.9: The chain end-to-end distance vector.
All conformations of the chain described in this theory are purely entropic and the shape of
the chain is driven purely by entropy. The entropy of the chain is given by Boltzmann formula
as follows:
lnBS k= Ω I.3
Bk is the Boltzmann constant and Ω is the number of conformations.
This fundamental equation can be rewritten in this form:
( ) ( )3
2 23/ 2
ln lnB B
bS r k p r k b r
π
= = − +
I.4
It is convenient to use Helmholtz free energy
A U TS= − I.5
where U is the internal energy.
For change taking place at constant absolute temperature T , we have:
dA dU TdS= − I.6
Combining equation I.6 with internal energy ( )dU dQ dw= + and entropy ( )TdS dQ=
evolution which are respectively introduce by thermodynamic first and second laws. The
following equivalence was obtained:
Chapter I: WHAT IS AN ELASTOMER?
MOSSI IDRISSA Abdoul Kader, University of Strasbourg - 26 -
( ) ( )dA dQ dw TdS TdS dw TdS dw= + − = + − = I.7
Here, w is the work required to move one end of the chain. The internal energy U effect on
the end-to-end distance is neglected. It obtained the tension f in single long-chain by using
the relationship of work required to move one end of the chain from distance r to a distance
r dr+ , S is given in equation I.4, therefore:
22
2 3B B
dw dA dS rf T k Tb r k T
dr dr dr Nl= = = − = = I.8
Based on some fundamental assumptions generally originating from Kuhn (1934, 1936),
Gaussian theory can be extended to elastomeric materials and the network strain energy W
equation is obtained as a function of 1I , the first invariant of the left Cauchy-Green stretch
tensor B .
1
12
3
det
det
I trB
I trB B
I B
−
= = =
I.9
2I and 3I are respectively the second and the third invariant of the left Cauchy-Green stretch
tensor B .
( )1
13
2 BW k nT I= − I.10
where n is the number of chains per unit volume.
I.5.1.2 SINGLE LONG-CHAIN TO ELASTOMER NETWORK BY NON-GAUSSIAN
THEORY
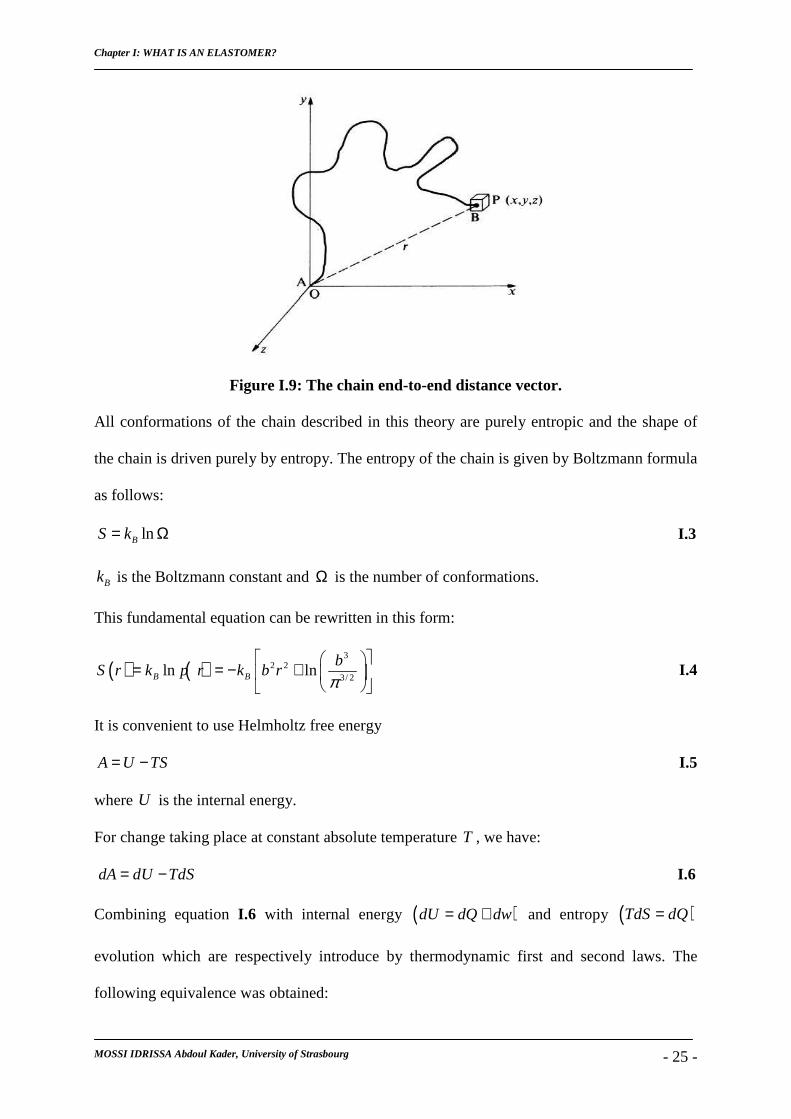
The aim of the non-Gaussian statistical treatment of the single chain is to take into account all
finite extensibility in the chain. Thus, it leads a more realistic distribution function which has
the ability to be valid for all range of extension until full extension. Then, the total chain
length will be the sum of the x-components of each link, like show in Figure I.10. It is
Chapter I: WHAT IS AN ELASTOMER?
MOSSI IDRISSA Abdoul Kader, University of Strasbourg - 27 -
important to known the x-components for all links in this case. Since a link inclined at an
angle iθ to the x-axis, it has a component of length cosi ix l θ= .
Figure I.10: Chain length by non-Gaussian theory.
Kuhn and Grün (1942) gave a method of solution for this problem by deriving the most
probable distribution of link angles with respect to the vector length. The probability of a
given vector length was taken to be the probability of this particular distribution of links
angles. In this way, Kuhn and Grün (1942) obtained this probability in the logarithmic form:
( )( )ln lnsinh
rp r C N
Nl
βββ
= − +
I.11
where 1 rL
Nlβ − =
and ( ) ( ) 1
cothL x xx
= −
C and L are respectively a constant and Langevin function.
Entropy and tension for single chain in non-Gaussian theory were deduced like for Gaussian
theory. Hence, we have the following equations respectively for entropy and tension:
( )sinhB
rS r C k N
Nl
βββ
= − +
I.12
1Bk TS rf T L
r l Nl−∂ = − = ∂
I.13
Chapter I: WHAT IS AN ELASTOMER?
MOSSI IDRISSA Abdoul Kader, University of Strasbourg - 28 -
The function Langevin 1 rL
Nl−
written in form of series gives equation I.13 in this form
3 5 79 297 1539
35 175 875
Bk T r r r rf
l Nl Nl Nl Nl
= + + + + ⋅⋅⋅
I.14
It is easy to observe that non-Gaussian tension expression’s first term in the series
corresponds to Gaussian expression given by equation I.8. For the network scale, models are
generally presented in three-chain, four-chain, eight-chain or full network model by several
authors.
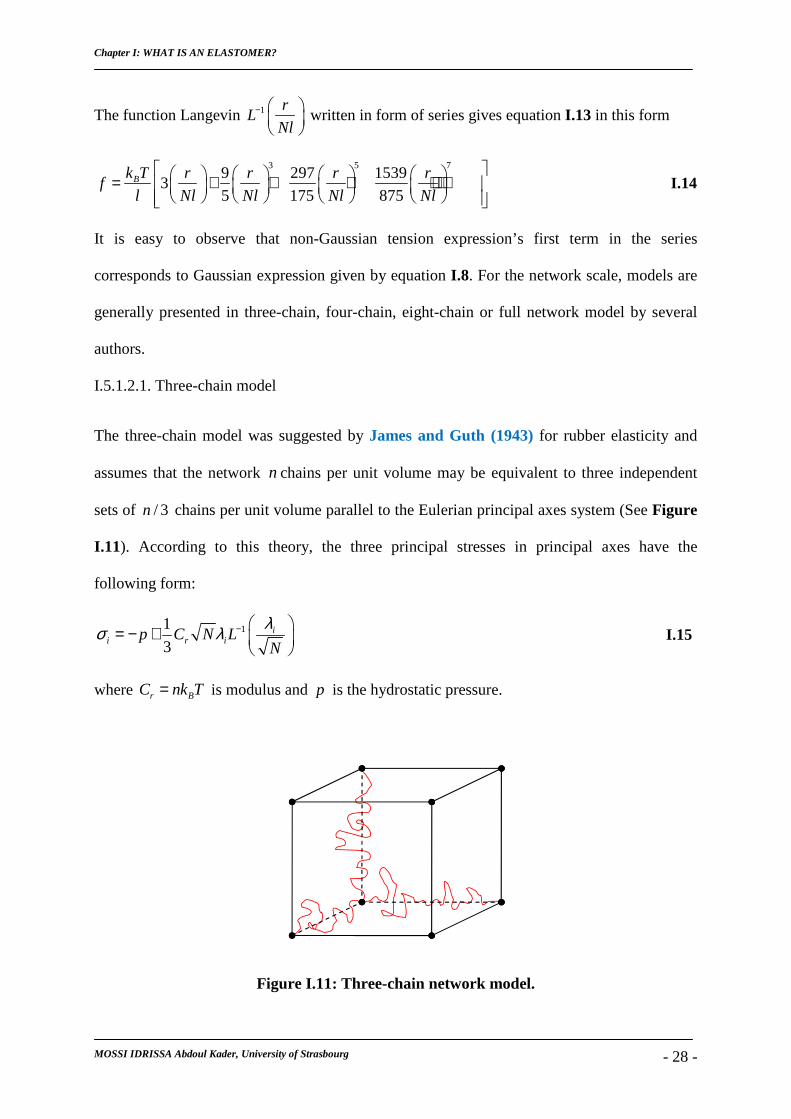
I.5.1.2.1. Three-chain model
The three-chain model was suggested by James and Guth (1943) for rubber elasticity and
assumes that the network n chains per unit volume may be equivalent to three independent
sets of / 3n chains per unit volume parallel to the Eulerian principal axes system (See Figure
I.11). According to this theory, the three principal stresses in principal axes have the
following form:
11
3i
i r ip C N LN
λσ λ − = − +
I.15
where r BC nk T= is modulus and p is the hydrostatic pressure.
Figure I.11: Three-chain network model.
Chapter I: WHAT IS AN ELASTOMER?
MOSSI IDRISSA Abdoul Kader, University of Strasbourg - 29 -
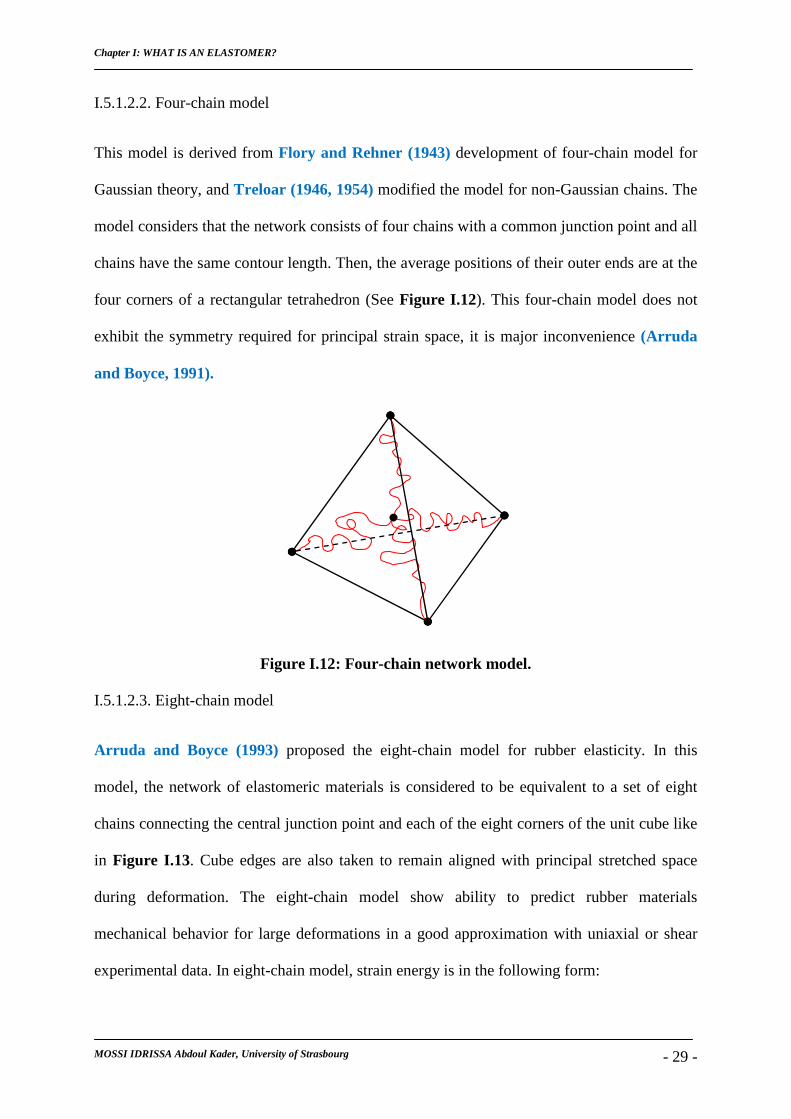
I.5.1.2.2. Four-chain model
This model is derived from Flory and Rehner (1943) development of four-chain model for
Gaussian theory, and Treloar (1946, 1954) modified the model for non-Gaussian chains. The
model considers that the network consists of four chains with a common junction point and all
chains have the same contour length. Then, the average positions of their outer ends are at the
four corners of a rectangular tetrahedron (See Figure I.12). This four-chain model does not
exhibit the symmetry required for principal strain space, it is major inconvenience (Arruda
and Boyce, 1991).
Figure I.12: Four-chain network model.
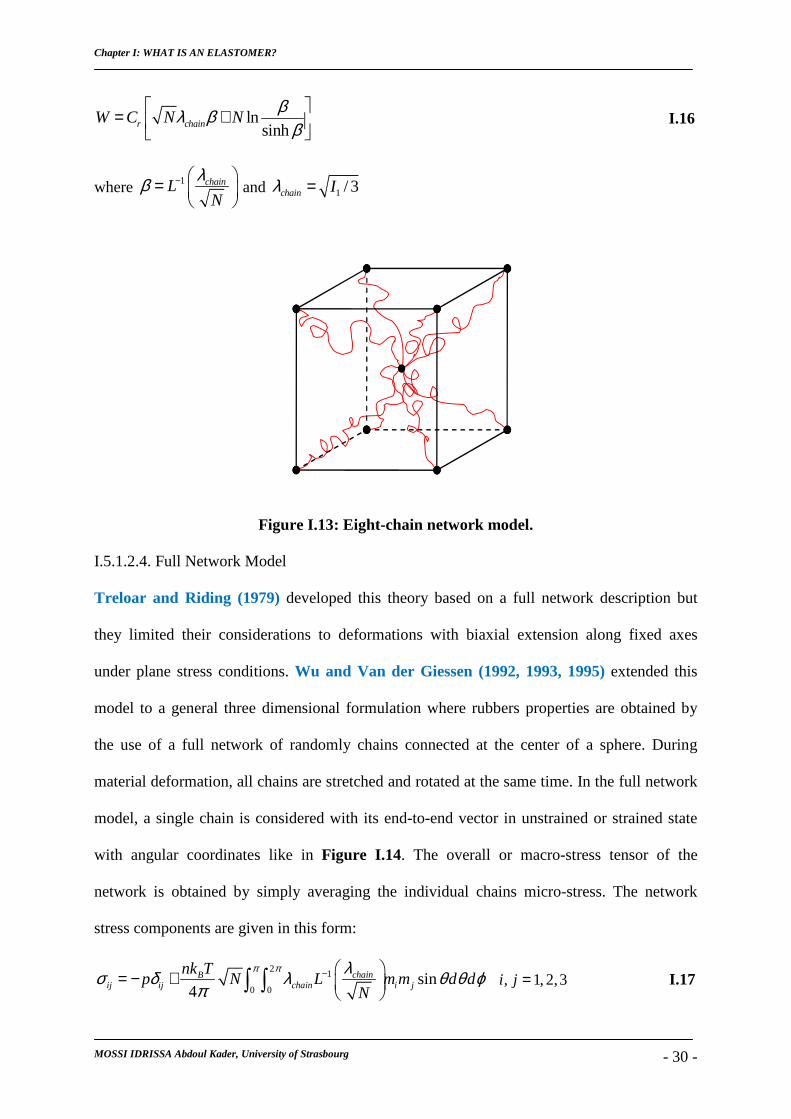
I.5.1.2.3. Eight-chain model
Arruda and Boyce (1993) proposed the eight-chain model for rubber elasticity. In this
model, the network of elastomeric materials is considered to be equivalent to a set of eight
chains connecting the central junction point and each of the eight corners of the unit cube like
in Figure I.13. Cube edges are also taken to remain aligned with principal stretched space
during deformation. The eight-chain model show ability to predict rubber materials
mechanical behavior for large deformations in a good approximation with uniaxial or shear
experimental data. In eight-chain model, strain energy is in the following form:
Chapter I: WHAT IS AN ELASTOMER?
MOSSI IDRISSA Abdoul Kader, University of Strasbourg - 30 -
lnsinhr chainW C N N
βλ ββ
= +
I.16
where 1 chainLN
λβ − =
and 1 / 3chain Iλ =
Figure I.13: Eight-chain network model.
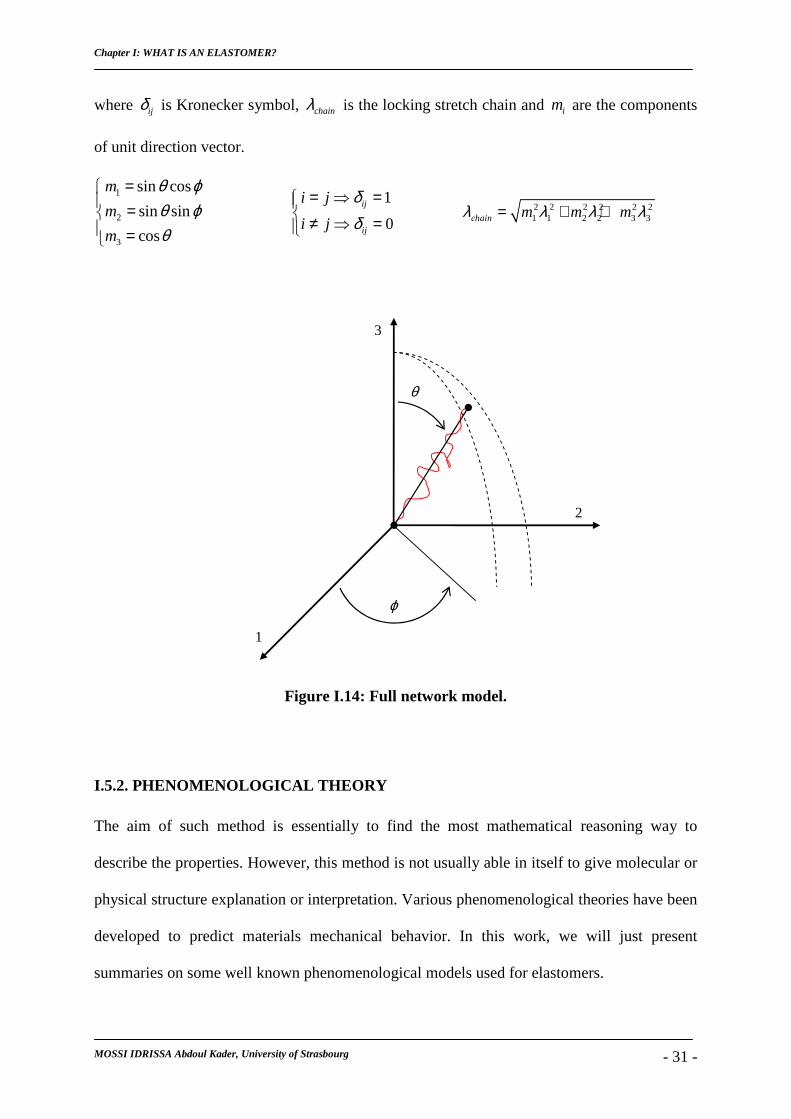
I.5.1.2.4. Full Network Model
Treloar and Riding (1979) developed this theory based on a full network description but
they limited their considerations to deformations with biaxial extension along fixed axes
under plane stress conditions. Wu and Van der Giessen (1992, 1993, 1995) extended this
model to a general three dimensional formulation where rubbers properties are obtained by
the use of a full network of randomly chains connected at the center of a sphere. During
material deformation, all chains are stretched and rotated at the same time. In the full network
model, a single chain is considered with its end-to-end vector in unstrained or strained state
with angular coordinates like in Figure I.14. The overall or macro-stress tensor of the
network is obtained by simply averaging the individual chains micro-stress. The network
stress components are given in this form:
2 1
0 0sin
4chainB
ij ij chain i j
nk Tp N L m m d d
N
π π λσ δ λ θ θ ϕπ
− = − +
∫ ∫ , 1,2,3i j = I.17
Chapter I: WHAT IS AN ELASTOMER?
MOSSI IDRISSA Abdoul Kader, University of Strasbourg - 31 -
where ijδ is Kronecker symbol, chainλ is the locking stretch chain and im are the components
of unit direction vector.
1
2
3
sin cos
sin sin
cos
m
m
m
θ ϕθ ϕθ
= = =
1
0ij
ij
i j
i j
δδ
= ⇒ = ≠ ⇒ =
2 2 2 2 2 21 1 2 2 3 3chain m m mλ λ λ λ= + +
θ
ϕ
1
2
3
Figure I.14: Full network model.
I.5.2. PHENOMENOLOGICAL THEORY
The aim of such method is essentially to find the most mathematical reasoning way to
describe the properties. However, this method is not usually able in itself to give molecular or
physical structure explanation or interpretation. Various phenomenological theories have been
developed to predict materials mechanical behavior. In this work, we will just present
summaries on some well known phenomenological models used for elastomers.
Chapter I: WHAT IS AN ELASTOMER?
MOSSI IDRISSA Abdoul Kader, University of Strasbourg - 32 -
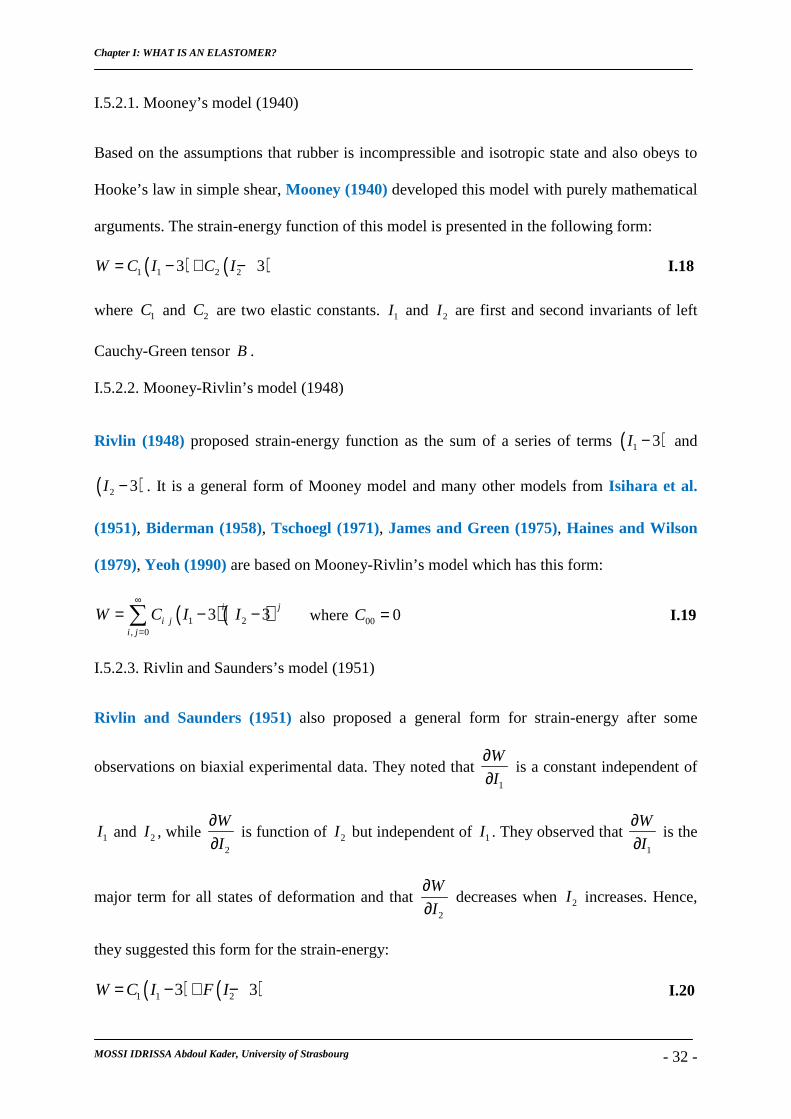
I.5.2.1. Mooney’s model (1940)
Based on the assumptions that rubber is incompressible and isotropic state and also obeys to
Hooke’s law in simple shear, Mooney (1940) developed this model with purely mathematical
arguments. The strain-energy function of this model is presented in the following form:
( ) ( )1 1 2 23 3W C I C I= − + − I.18
where 1C and 2C are two elastic constants. 1I and 2I are first and second invariants of left
Cauchy-Green tensor B .
I.5.2.2. Mooney-Rivlin’s model (1948)
Rivlin (1948) proposed strain-energy function as the sum of a series of terms ( )1 3I − and
( )2 3I − . It is a general form of Mooney model and many other models from Isihara et al.
(1951), Biderman (1958), Tschoegl (1971), James and Green (1975), Haines and Wilson
(1979), Yeoh (1990) are based on Mooney-Rivlin’s model which has this form:
( ) ( )1 2, 0
3 3i j
i ji j
W C I I∞
=
= − −∑ where 00 0C = I.19
I.5.2.3. Rivlin and Saunders’s model (1951)
Rivlin and Saunders (1951) also proposed a general form for strain-energy after some
observations on biaxial experimental data. They noted that 1
W
I
∂∂
is a constant independent of
1I and 2I , while 2
W
I
∂∂
is function of 2I but independent of 1I . They observed that 1
W
I
∂∂
is the
major term for all states of deformation and that 2
W
I
∂∂
decreases when 2I increases. Hence,
they suggested this form for the strain-energy:
( ) ( )1 1 23 3W C I F I= − + − I.20
Chapter I: WHAT IS AN ELASTOMER?
MOSSI IDRISSA Abdoul Kader, University of Strasbourg - 33 -
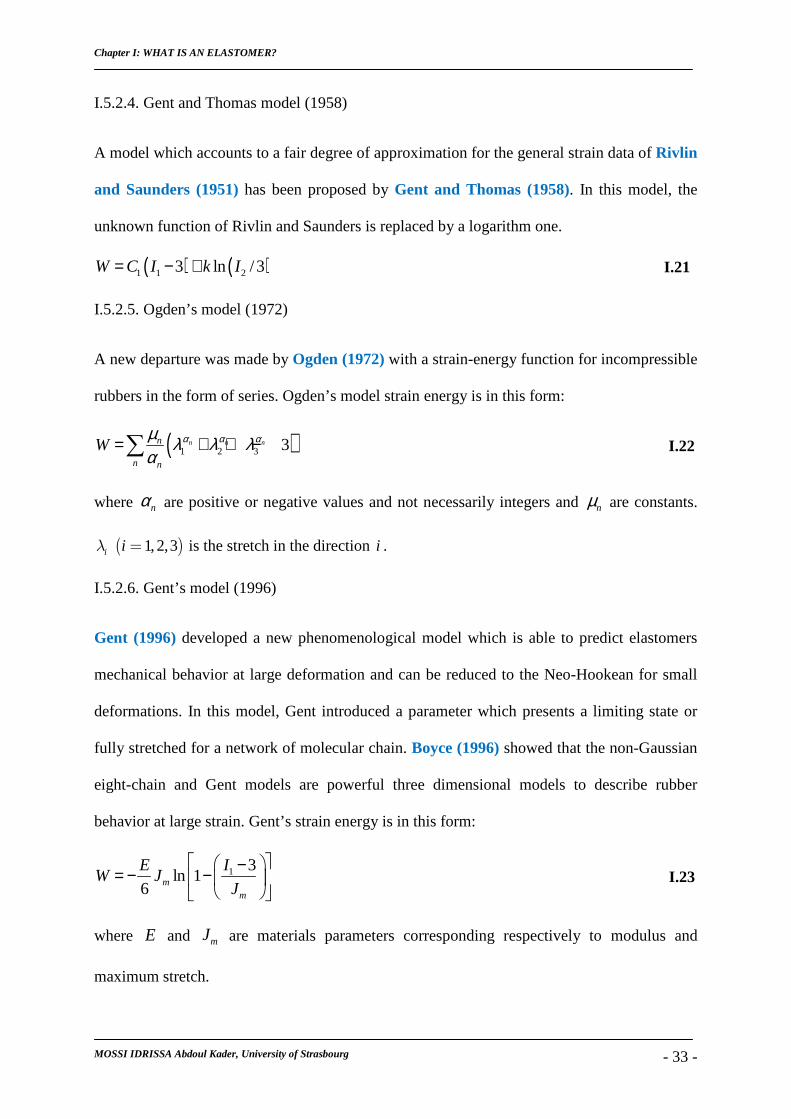
I.5.2.4. Gent and Thomas model (1958)
A model which accounts to a fair degree of approximation for the general strain data of Rivlin
and Saunders (1951) has been proposed by Gent and Thomas (1958). In this model, the
unknown function of Rivlin and Saunders is replaced by a logarithm one.
( ) ( )1 1 23 ln /3W C I k I= − + I.21
I.5.2.5. Ogden’s model (1972)
A new departure was made by Ogden (1972) with a strain-energy function for incompressible
rubbers in the form of series. Ogden’s model strain energy is in this form:
( )1 2 3 3n n nn
n n
W α α αµ λ λ λα
= + + −∑ I.22
where nα are positive or negative values and not necessarily integers and nµ are constants.
iλ ( )1,2,3i = is the stretch in the direction i .
I.5.2.6. Gent’s model (1996)
Gent (1996) developed a new phenomenological model which is able to predict elastomers
mechanical behavior at large deformation and can be reduced to the Neo-Hookean for small
deformations. In this model, Gent introduced a parameter which presents a limiting state or
fully stretched for a network of molecular chain. Boyce (1996) showed that the non-Gaussian
eight-chain and Gent models are powerful three dimensional models to describe rubber
behavior at large strain. Gent’s strain energy is in this form:
1 3ln 1
6 mm
IEW J
J
−= − −
I.23
where E and mJ are materials parameters corresponding respectively to modulus and
maximum stretch.
Chapter I: WHAT IS AN ELASTOMER?
MOSSI IDRISSA Abdoul Kader, University of Strasbourg - 34 -
I.5.3. ELASTOMERS OPTICAL ANISOTROPY
Optical anisotropy is characterized by different values of refractive index for different
directions of light propagation through the material or precisely for different directions of
polarization of the transmitted light. Based on the work of some authors like Kuhn and Grün
(1942), a close connection exists between the optical anisotropy and the mechanical behavior.
Materials such as glasses and elastomers, whose structure is essentially irregular or
amorphous, are normally isotropic in the unstrained state. But, during their deformation under
loading, the amorphous network can have an arrangement distribution in some directions.
Hence, the arrangement and amorphous distribution in the same network implies double
refraction, it is a birefringence. This is an indicator of the structural anisotropy due to strain
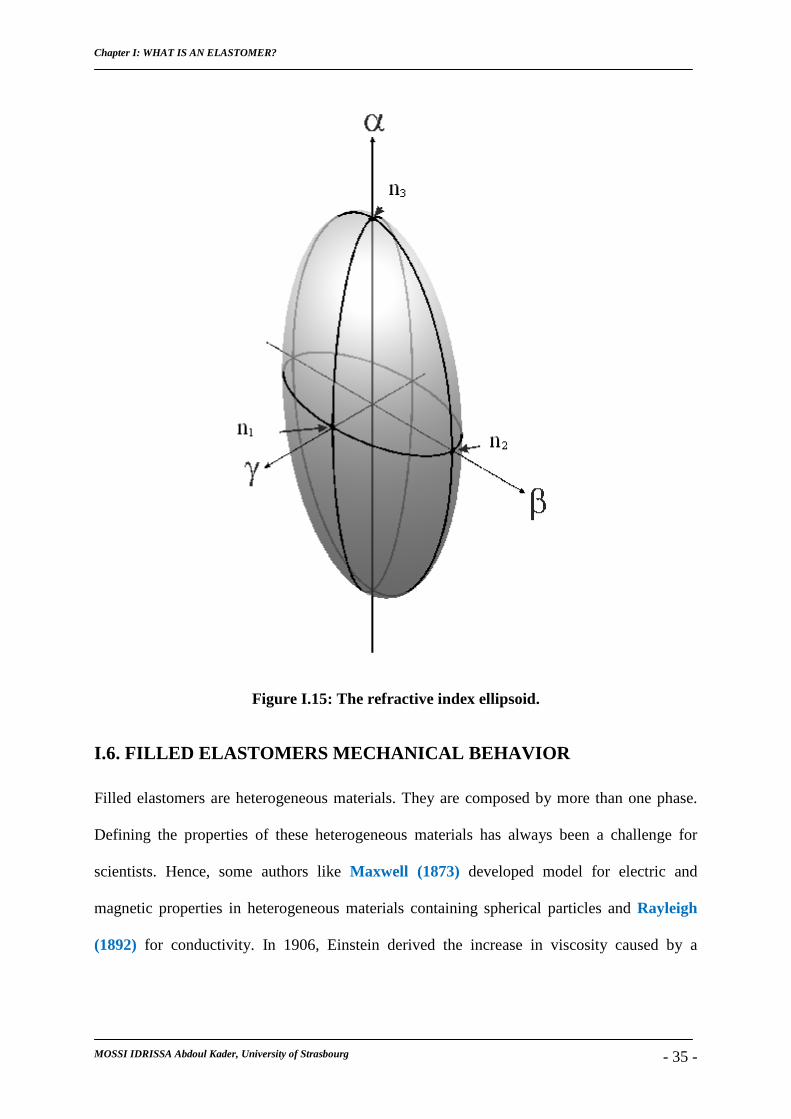
induced by stress. Optical anisotropic properties are represented by ellipsoid, whose axes,
perpendicular one to them, represent the three principal refractive indices 1n , 2n and 3n (See
Figure I.15). For optical anisotropy, we also have Gaussian and non-Gaussian conceptions,
which are applied in material optical behavior. For the two concepts, mechanical and
birefringence relationships have been introduced by some authors like Treloar (1947a,
1947b) for Gaussian network or Arruda and Przybylo (1995) for non-Gaussian. In an
optically isotropic medium the relation between the polarizability β and the refractive n
index is obtained by Lorentz-Lorenz formula in following form:
2
2
1 4
32
n
n
πβ
−=
+ I.24
Chapter I: WHAT IS AN ELASTOMER?
MOSSI IDRISSA Abdoul Kader, University of Strasbourg - 35 -
Figure I.15: The refractive index ellipsoid.
I.6. FILLED ELASTOMERS MECHANICAL BEHAVIOR
Filled elastomers are heterogeneous materials. They are composed by more than one phase.
Defining the properties of these heterogeneous materials has always been a challenge for
scientists. Hence, some authors like Maxwell (1873) developed model for electric and
magnetic properties in heterogeneous materials containing spherical particles and Rayleigh
(1892) for conductivity. In 1906, Einstein derived the increase in viscosity caused by a
Chapter I: WHAT IS AN ELASTOMER?
MOSSI IDRISSA Abdoul Kader, University of Strasbourg - 36 -
suspension of spherical particles in a viscous fluid. After, several authors suggested many
models to predict heterogeneous materials properties.
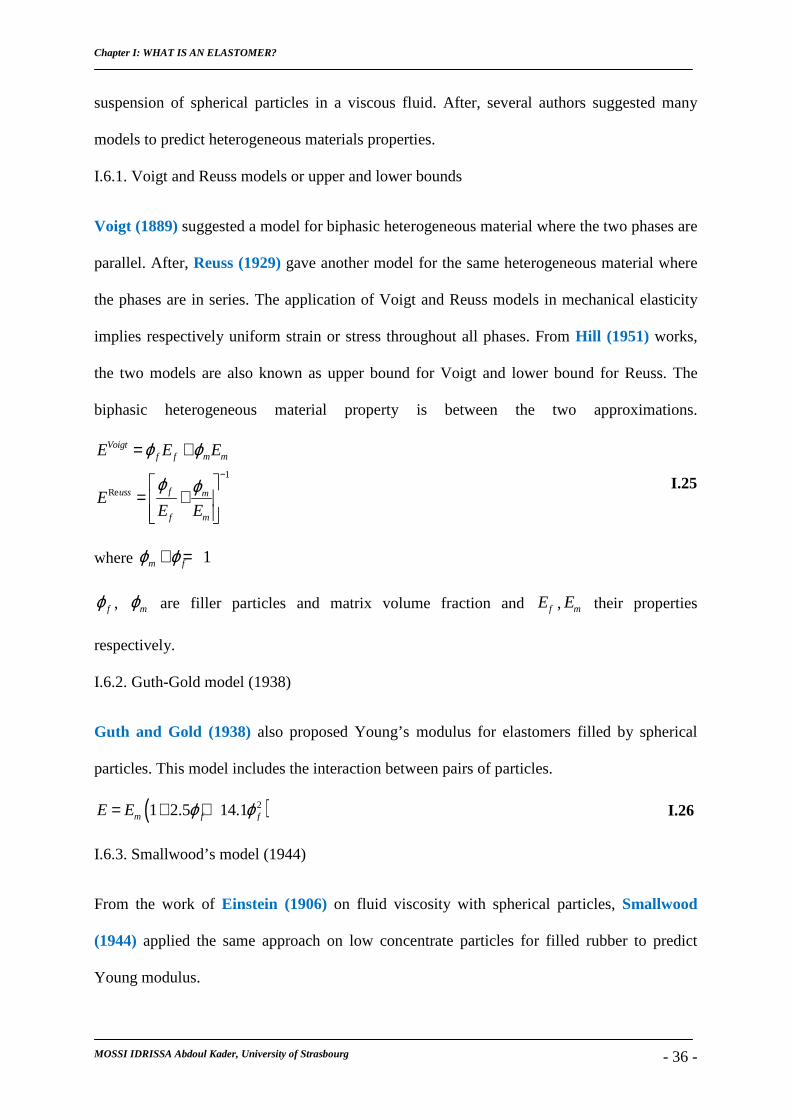
I.6.1. Voigt and Reuss models or upper and lower bounds
Voigt (1889) suggested a model for biphasic heterogeneous material where the two phases are
parallel. After, Reuss (1929) gave another model for the same heterogeneous material where
the phases are in series. The application of Voigt and Reuss models in mechanical elasticity
implies respectively uniform strain or stress throughout all phases. From Hill (1951) works,
the two models are also known as upper bound for Voigt and lower bound for Reuss. The
biphasic heterogeneous material property is between the two approximations.
1
Re
Voigtf f m m
fuss m
f m
E E E
EE E
ϕ ϕ
ϕ ϕ−
= +
= +
I.25
where 1m fϕ ϕ+ =
fϕ , mϕ are filler particles and matrix volume fraction and fE , mE their properties
respectively.
I.6.2. Guth-Gold model (1938)
Guth and Gold (1938) also proposed Young’s modulus for elastomers filled by spherical
particles. This model includes the interaction between pairs of particles.
( )21 2.5 14.1m f fE E ϕ ϕ= + + I.26
I.6.3. Smallwood’s model (1944)
From the work of Einstein (1906) on fluid viscosity with spherical particles, Smallwood
(1944) applied the same approach on low concentrate particles for filled rubber to predict
Young modulus.
Chapter I: WHAT IS AN ELASTOMER?
MOSSI IDRISSA Abdoul Kader, University of Strasbourg - 37 -
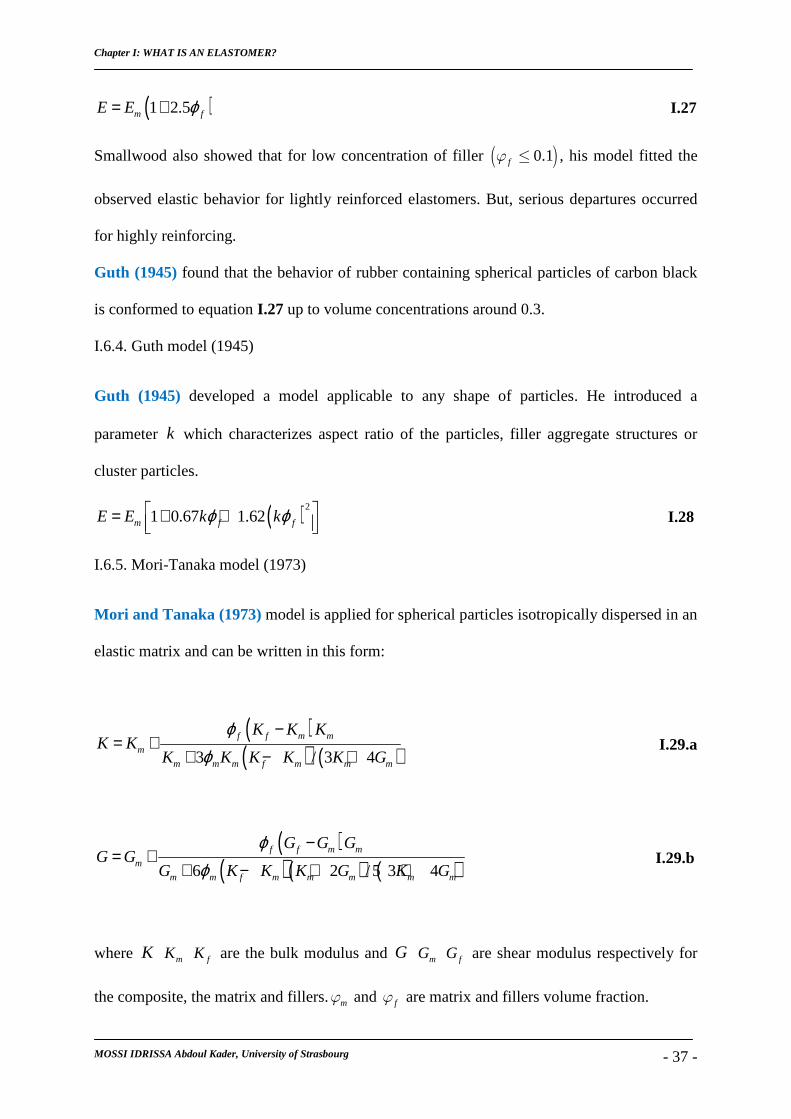
( )1 2.5m fE E ϕ= + I.27
Smallwood also showed that for low concentration of filler ( )0.1fϕ ≤ , his model fitted the
observed elastic behavior for lightly reinforced elastomers. But, serious departures occurred
for highly reinforcing.
Guth (1945) found that the behavior of rubber containing spherical particles of carbon black
is conformed to equation I.27 up to volume concentrations around 0.3.
I.6.4. Guth model (1945)
Guth (1945) developed a model applicable to any shape of particles. He introduced a
parameter k which characterizes aspect ratio of the particles, filler aggregate structures or
cluster particles.
( )21 0.67 1.62m f fE E k kϕ ϕ = + +
I.28
I.6.5. Mori-Tanaka model (1973)
Mori and Tanaka (1973) model is applied for spherical particles isotropically dispersed in an
elastic matrix and can be written in this form:
( )( ) ( )3 / 3 4
f f m m
m
m m m f m m m
K K KK K
K K K K K G
ϕϕ
−= +
+ − + I.29.a
( )( )( ) ( )6 2 /5 3 4
f f m m
m
m m f m m m m m
G G GG G
G K K K G K G
ϕϕ
−= +
+ − + + I.29.b
where K mK fK are the bulk modulus and G mG fG are shear modulus respectively for
the composite, the matrix and fillers.mϕ and fϕ are matrix and fillers volume fraction.
Chapter I: WHAT IS AN ELASTOMER?
MOSSI IDRISSA Abdoul Kader, University of Strasbourg - 38 -
I.7. CONCLUSION
In this chapter, a general presentation is due on elastomers material. It includes their origin or
their applications in many industries. Their macromolecule structure is introduced and also
their well known mechanical behavior. Some physical and phenomenological models which
have the ability to predict unfilled and filled elastomers mechanical behavior are presented.
The fillers use for reinforced elastomers are also present, particularly carbon black. It is the
most used in reinforced elastomers.
Chapter II: MODELING OF THE STRESS-BIREFRINGENCE-STRETCH BEHAVIOR IN RUBBERS USING THE GENT MODEL
MOSSI IDRISSA Abdoul Kader, University of Strasbourg - 39 -
CHAPTER II
MODELING OF THE STRESS-BIREFRINGENCE-STRETCH
BEHAVIOR IN RUBBERS USING THE GENT MODEL
Deformation of rubbers produces mechanical and optical changes of the polymer network.
This mechanical behavior of the elastomeric materials is often given by a stress–strain
relationship which can be obtained from assumed physical or phenomenological models. In
the familiar works, the theory of rubber elasticity for single chain is treated by Gaussian
statistics before to be applied on network. Hence, rubber properties are obtained from the
contributions of the whole chains in network. Kuhn and Grün (1942) and James and Guth
(1943) developed a non-Gaussian treatment for single chain which is extended to network.
Based on these Gaussian and non-Gaussian theories, network stress-strain constitutive models
were developed for rubber elasticity. These include: the four-chain Gaussian theory from
Flory and Rehner (1943), the four-chain non-Gaussian theory from Treloar (1975), the
three-chain non-Gaussian theory from Wang and Guth (1952), the eight-chain non-Gaussian
network theory from Arruda and Boyce (1993) and the full network non-Gaussian theory
from Wu and Van Der Geissen (1993, 1995). Phenomenological models have also been
developed and used. These include models of Mooney (1940), Rivlin (1948), Valanis and
Landel (1976), Ogden (1972) and recently Gent (1996), among many others.
The optical property like birefringence is characterized by the material anisotropy which is
measured by the difference in the refractive indices in two orthogonal directions of the
anisotropic medium. Optical anisotropy evolves with molecular orientation during
Chapter II: MODELING OF THE STRESS-BIREFRINGENCE-STRETCH BEHAVIOR IN RUBBERS USING THE GENT MODEL
MOSSI IDRISSA Abdoul Kader, University of Strasbourg - 40 -
deformation. This implies, like for the stress, a relationship between birefringence and strain
or stretch. This constitutive relation can also be expressed in terms of a birefringence-stress
relationship. A statistical long-chain molecule optical property composed with anisotropic
links has its foundation in the optical theory of Kuhn and Grün (1942), Treloar (1947a,
1947b). They also investigated the photo-elastic properties of rubbers.
Based on these works, several authors proposed models to simulate optical anisotropy and
validated their modeling by comparison of the predicted birefringence-stretch and stress-
stretch results to the experimental ones. For instance, Wu and Van Der Giessen (1995)
simulated the birefringence evolution using the non-Gaussian full network model for rubbers.
Arruda and Przybylo (1995) extended the non-Gaussian eight-chain model to the
birefringence; they also compared their model to natural rubber and polydimethylsiloxane
elastomers (PDMS) experimental results. Von Lockette and Arruda (1999) extended the
eight-chain network model for stress-birefringence to derive Raman spectra evolution for
elastomers.
Here, we propose to build birefringence-stress relationship with the Gent model in order to
simulate the birefringence or optical refractive indices evolution in deformed rubbers under
large strains. In this way, we combine Gent model with the Gaussian optic law. The results
from our derived stress-optic model are compared to those from the non-Gaussian eight-chain
stress-optic model and experimental data from the literature.
Chapter II: MODELING OF THE STRESS-BIREFRINGENCE-STRETCH BEHAVIOR IN RUBBERS USING THE GENT MODEL
MOSSI IDRISSA Abdoul Kader, University of Strasbourg - 41 -
II.1. STRESS-OPTICAL LAW
II.1.1. GAUSSIAN MODEL
II.1.1.1. GAUSSIAN STRESS-STRETCH
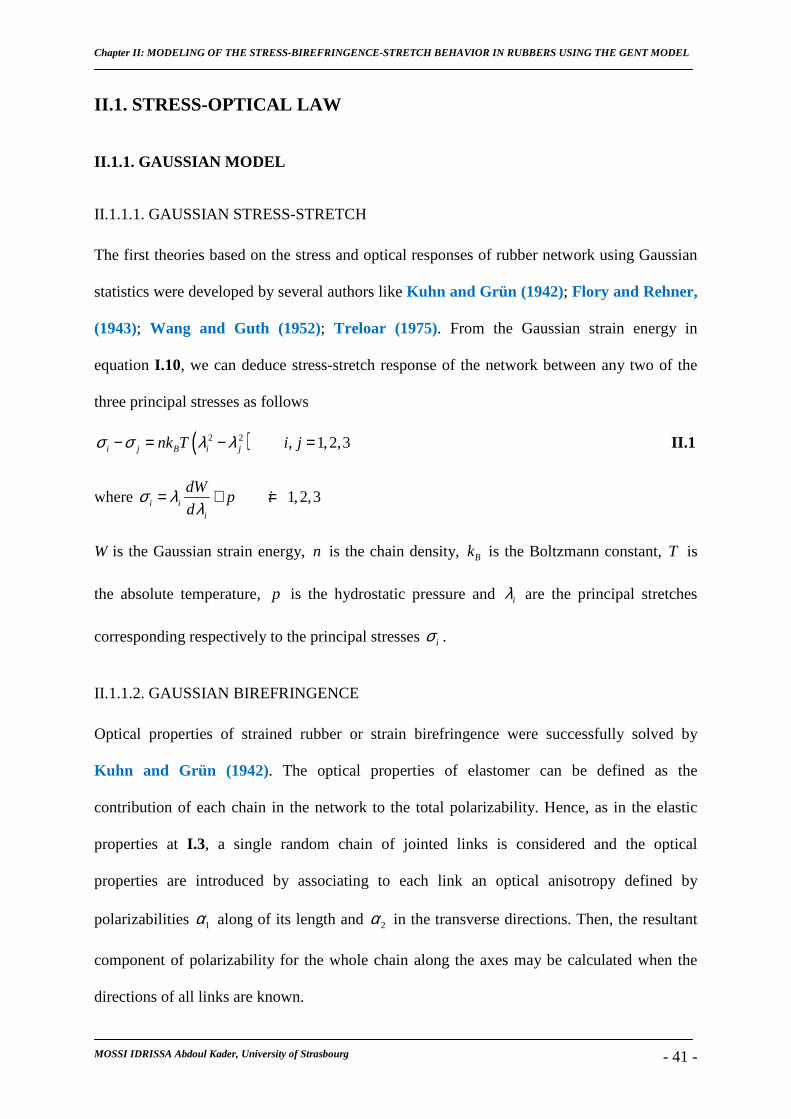
The first theories based on the stress and optical responses of rubber network using Gaussian
statistics were developed by several authors like Kuhn and Grün (1942); Flory and Rehner,
(1943); Wang and Guth (1952); Treloar (1975). From the Gaussian strain energy in
equation I.10, we can deduce stress-stretch response of the network between any two of the
three principal stresses as follows
( )2 2 , 1,2,3i j B i jnk T i jσ σ λ λ− = − = II.1
where 1,2,3i ii
dWp i
dσ λ
λ= + =
W is the Gaussian strain energy, n is the chain density, Bk is the Boltzmann constant, T is
the absolute temperature, p is the hydrostatic pressure and iλ are the principal stretches
corresponding respectively to the principal stresses iσ .
II.1.1.2. GAUSSIAN BIREFRINGENCE
Optical properties of strained rubber or strain birefringence were successfully solved by
Kuhn and Grün (1942). The optical properties of elastomer can be defined as the
contribution of each chain in the network to the total polarizability. Hence, as in the elastic
properties at I.3, a single random chain of jointed links is considered and the optical
properties are introduced by associating to each link an optical anisotropy defined by
polarizabilities 1α along of its length and 2α in the transverse directions. Then, the resultant
component of polarizability for the whole chain along the axes may be calculated when the
directions of all links are known.
Chapter II: MODELING OF THE STRESS-BIREFRINGENCE-STRETCH BEHAVIOR IN RUBBERS USING THE GENT MODEL
MOSSI IDRISSA Abdoul Kader, University of Strasbourg - 42 -
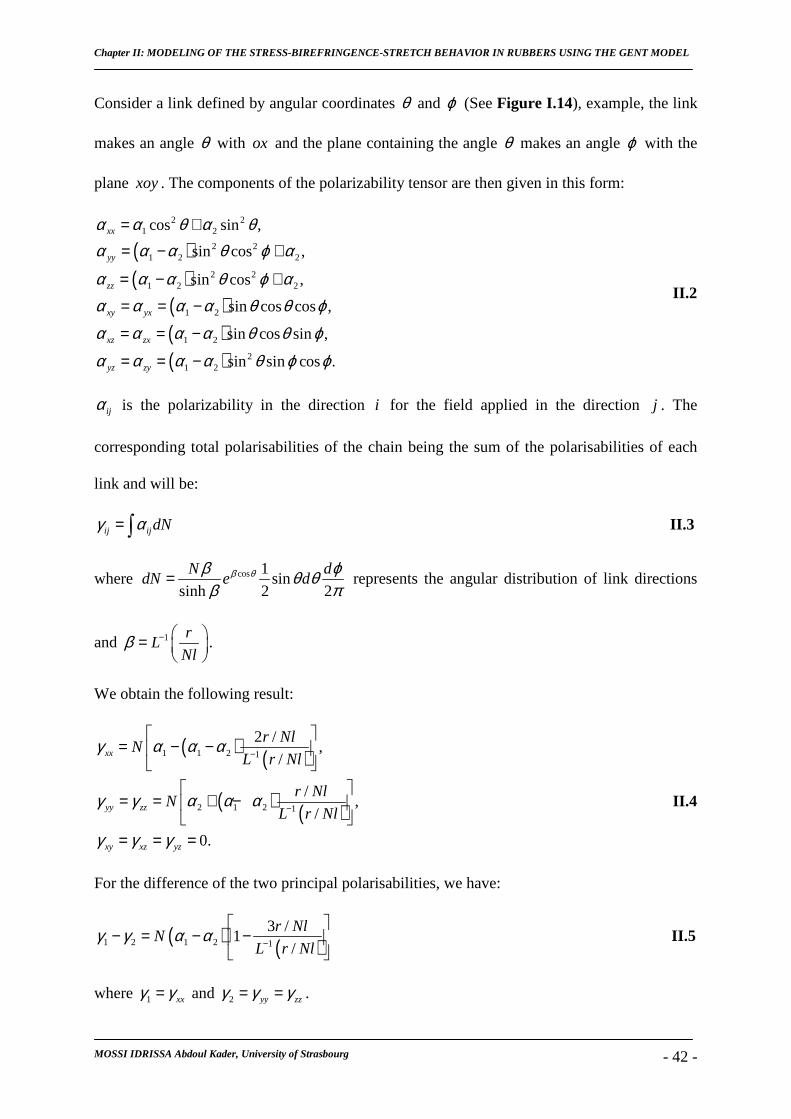
Consider a link defined by angular coordinates θ and ϕ (See Figure I.14), example, the link
makes an angle θ with ox and the plane containing the angle θ makes an angle ϕ with the
plane xoy . The components of the polarizability tensor are then given in this form:
( )( )
( )( )( )
2 21 2
2 21 2 2
2 21 2 2
1 2
1 2
21 2
cos sin ,
sin cos ,
sin cos ,
sin cos cos ,
sin cos sin ,
sin sin cos .
xx
yy
zz
xy yx
xz zx
yz zy
α α θ α θα α α θ ϕ α
α α α θ ϕ αα α α α θ θ ϕα α α α θ θ ϕ
α α α α θ ϕ ϕ
= +
= − +
= − +
= = −
= = −
= = −
II.2
ijα is the polarizability in the direction i for the field applied in the direction j . The
corresponding total polarisabilities of the chain being the sum of the polarisabilities of each
link and will be:
ij ijdNγ α= ∫ II.3
where cos 1sin
sinh 2 2
N ddN e dβ θβ ϕθ θ
β π= represents the angular distribution of link directions
and 1 rL
Nlβ − =
.
We obtain the following result:
( ) ( )
( ) ( )
1 1 2 1
2 1 2 1
2 /,
/
/,
/
0.
xx
yy zz
xy xz yz
r NlN
L r Nl
r NlN
L r Nl
γ α α α
γ γ α α α
γ γ γ
−
−
= − −
= = + −
= = =
II.4
For the difference of the two principal polarisabilities, we have:
( ) ( )1 2 1 2 1
3 /1
/
r NlN
L r Nlγ γ α α −
− = − −
II.5
where 1 xxγ γ= and 2 yy zzγ γ γ= = .
Chapter II: MODELING OF THE STRESS-BIREFRINGENCE-STRETCH BEHAVIOR IN RUBBERS USING THE GENT MODEL
MOSSI IDRISSA Abdoul Kader, University of Strasbourg - 43 -
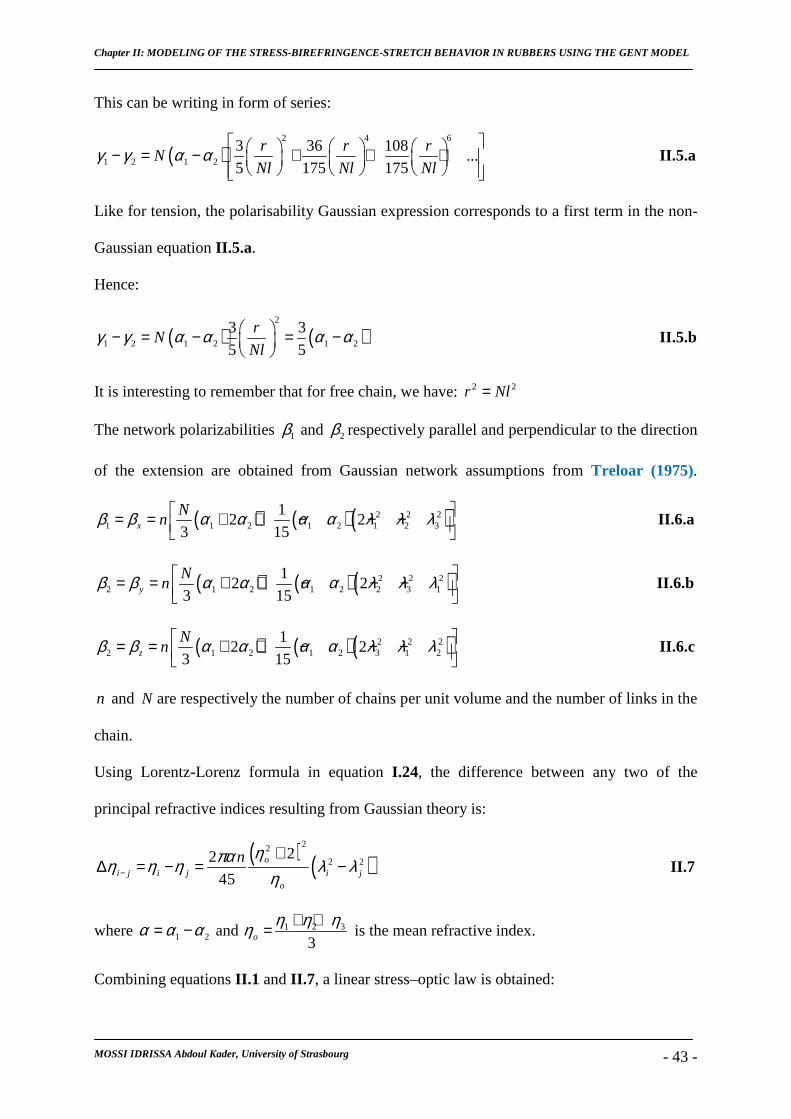
This can be writing in form of series:
( )2 4 6
1 2 1 2
3 36 108...
5 175 175
r r rN
Nl Nl Nlγ γ α α
− = − + + +
II.5.a
Like for tension, the polarisability Gaussian expression corresponds to a first term in the non-
Gaussian equation II.5.a.
Hence:
( ) ( )2
1 2 1 2 1 2
3 3
5 5
rN
Nlγ γ α α α α − = − = −
II.5.b
It is interesting to remember that for free chain, we have: 2 2r Nl=
The network polarizabilities 1β and 2β respectively parallel and perpendicular to the direction
of the extension are obtained from Gaussian network assumptions from Treloar (1975).
( ) ( ) ( )2 2 21 1 2 1 2 1 2 3
12 2
3 15x
Nnβ β α α α α λ λ λ = = + + − − −
II.6.a
( ) ( ) ( )2 2 22 1 2 1 2 2 3 1
12 2
3 15y
Nnβ β α α α α λ λ λ = = + + − − −
II.6.b
( ) ( )( )2 2 22 1 2 1 2 3 1 2
12 2
3 15z
Nnβ β α α α α λ λ λ = = + + − − −
II.6.c
n and N are respectively the number of chains per unit volume and the number of links in the
chain.
Using Lorentz-Lorenz formula in equation I.24, the difference between any two of the
principal refractive indices resulting from Gaussian theory is:
( ) ( )22
2 222
45o
i j i j i jo
n ηπαη η η λ λη−
+∆ = − = − II.7
where 1 2α α α= − and 1 2 3
3o
η η ηη + += is the mean refractive index.
Combining equations II.1 and II.7 , a linear stress–optic law is obtained:
Chapter II: MODELING OF THE STRESS-BIREFRINGENCE-STRETCH BEHAVIOR IN RUBBERS USING THE GENT MODEL
MOSSI IDRISSA Abdoul Kader, University of Strasbourg - 44 -
( ) ( )22 22
45o
i j i jokT
ηπαη σ ση−
+∆ = − II.8
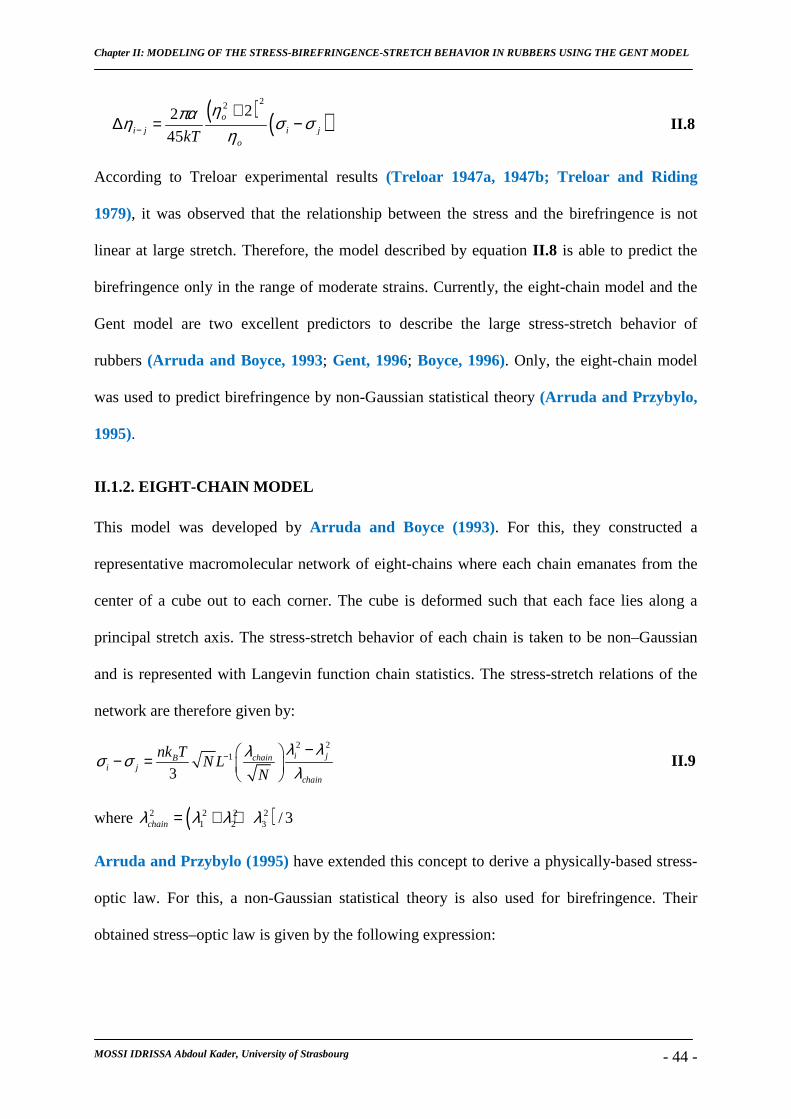
According to Treloar experimental results (Treloar 1947a, 1947b; Treloar and Riding
1979), it was observed that the relationship between the stress and the birefringence is not
linear at large stretch. Therefore, the model described by equation II.8 is able to predict the
birefringence only in the range of moderate strains. Currently, the eight-chain model and the
Gent model are two excellent predictors to describe the large stress-stretch behavior of
rubbers (Arruda and Boyce, 1993; Gent, 1996; Boyce, 1996). Only, the eight-chain model
was used to predict birefringence by non-Gaussian statistical theory (Arruda and Przybylo,
1995).
II.1.2. EIGHT-CHAIN MODEL
This model was developed by Arruda and Boyce (1993). For this, they constructed a
representative macromolecular network of eight-chains where each chain emanates from the
center of a cube out to each corner. The cube is deformed such that each face lies along a
principal stretch axis. The stress-stretch behavior of each chain is taken to be non–Gaussian
and is represented with Langevin function chain statistics. The stress-stretch relations of the
network are therefore given by:
2 21
3i jchainB
i jchain
nk TN L
N
λ λλσ σλ
− − − =
II.9
where ( )2 2 2 21 2 3 / 3chainλ λ λ λ= + +
Arruda and Przybylo (1995) have extended this concept to derive a physically-based stress-
optic law. For this, a non-Gaussian statistical theory is also used for birefringence. Their
obtained stress–optic law is given by the following expression:
Chapter II: MODELING OF THE STRESS-BIREFRINGENCE-STRETCH BEHAVIOR IN RUBBERS USING THE GENT MODEL
MOSSI IDRISSA Abdoul Kader, University of Strasbourg - 45 -
( ) ( )1
22
8
1
3
1
22 1
9
chain
chain
ochaini j i j
chainB o chain
N
LN N
k TL
N
λ
ληπ αη σ σ
λη λ
−
−−
−
+ ∆ = −
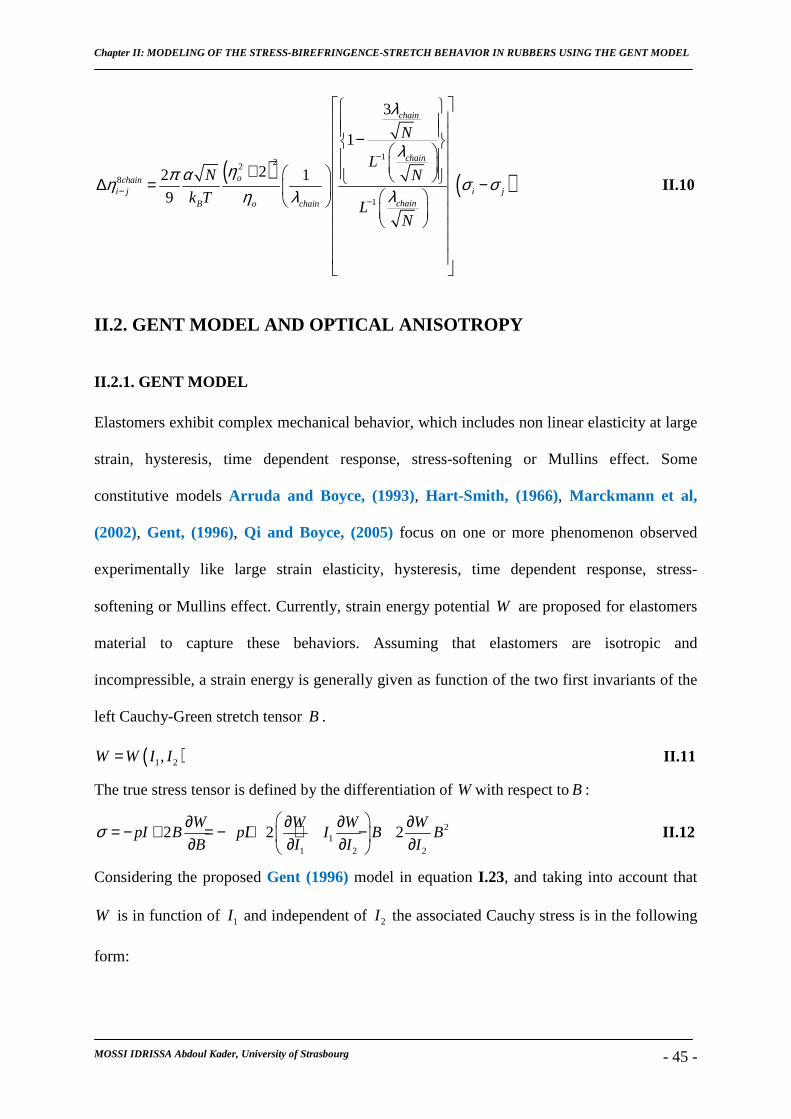
II.10
II.2. GENT MODEL AND OPTICAL ANISOTROPY
II.2.1. GENT MODEL
Elastomers exhibit complex mechanical behavior, which includes non linear elasticity at large
strain, hysteresis, time dependent response, stress-softening or Mullins effect. Some
constitutive models Arruda and Boyce, (1993), Hart-Smith, (1966), Marckmann et al,
(2002), Gent, (1996), Qi and Boyce, (2005) focus on one or more phenomenon observed
experimentally like large strain elasticity, hysteresis, time dependent response, stress-
softening or Mullins effect. Currently, strain energy potential W are proposed for elastomers
material to capture these behaviors. Assuming that elastomers are isotropic and
incompressible, a strain energy is generally given as function of the two first invariants of the
left Cauchy-Green stretch tensor B .
( )1 2,W W I I= II.11
The true stress tensor is defined by the differentiation of W with respect toB :
21
1 2 2
2 2 2W W W W
pI B pI I B BB I I I
σ ∂ ∂ ∂ ∂= − + = − + + − ∂ ∂ ∂ ∂
II.12
Considering the proposed Gent (1996) model in equation I.23, and taking into account that
W is in function of 1I and independent of 2I the associated Cauchy stress is in the following
form:
Chapter II: MODELING OF THE STRESS-BIREFRINGENCE-STRETCH BEHAVIOR IN RUBBERS USING THE GENT MODEL
MOSSI IDRISSA Abdoul Kader, University of Strasbourg - 46 -
BJJ
JEpI
m
m
13 −
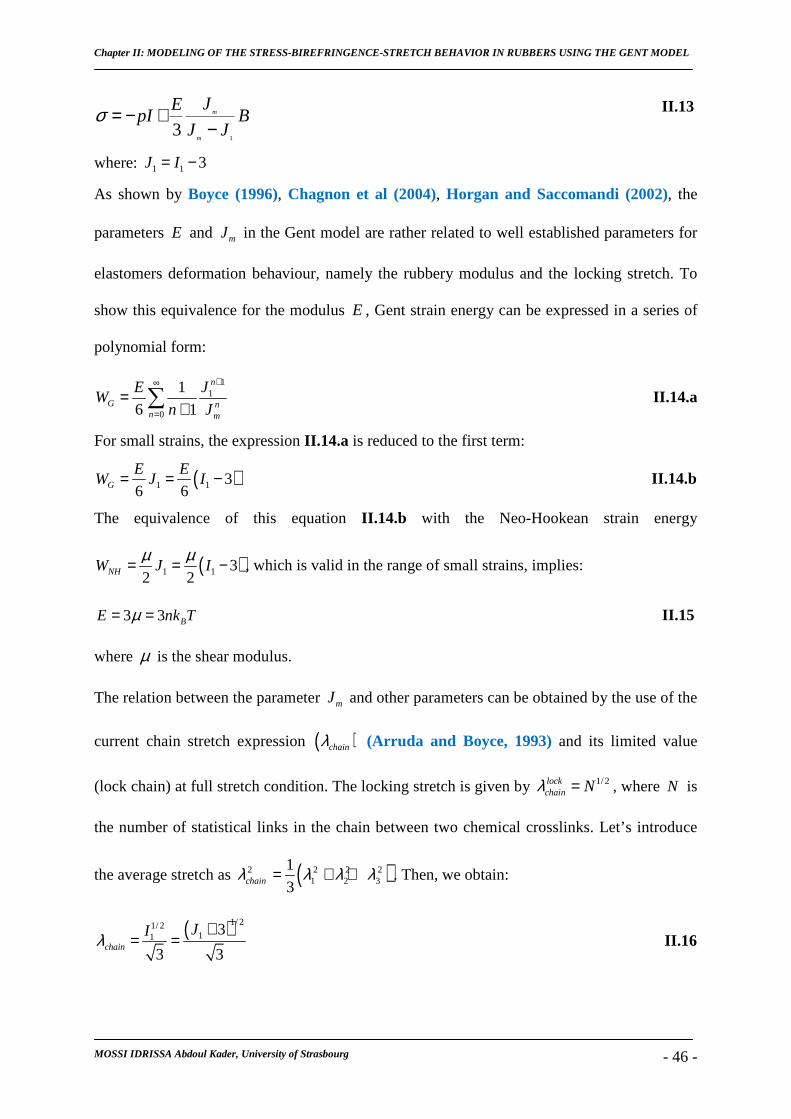
+−=σ II.13
where: 1 1 3J I= −
As shown by Boyce (1996), Chagnon et al (2004), Horgan and Saccomandi (2002), the
parameters E and mJ in the Gent model are rather related to well established parameters for
elastomers deformation behaviour, namely the rubbery modulus and the locking stretch. To
show this equivalence for the modulus E , Gent strain energy can be expressed in a series of
polynomial form:
11
0
1
6 1
n
G nn m
JEW
n J
+∞
=
=+∑ II.14.a
For small strains, the expression II.14.a is reduced to the first term:
( )1 1 36 6G
E EW J I= = − II.14.b
The equivalence of this equation II.14.b with the Neo-Hookean strain energy
( )1 1 32 2NHW J Iµ µ= = − , which is valid in the range of small strains, implies:
3 3 BE nk Tµ= = II.15
where µ is the shear modulus.
The relation between the parameter mJ and other parameters can be obtained by the use of the
current chain stretch expression ( )chainλ (Arruda and Boyce, 1993) and its limited value
(lock chain) at full stretch condition. The locking stretch is given by 1/2lockchain Nλ = , where N is
the number of statistical links in the chain between two chemical crosslinks. Let’s introduce
the average stretch as ( )2 2 2 21 2 3
1
3chainλ λ λ λ= + + . Then, we obtain:
( )1/ 21/ 211
3
3 3chain
JIλ+
= = II.16
Chapter II: MODELING OF THE STRESS-BIREFRINGENCE-STRETCH BEHAVIOR IN RUBBERS USING THE GENT MODEL
MOSSI IDRISSA Abdoul Kader, University of Strasbourg - 47 -
At full stretch condition the parameter 1J tends to its limiting value mJ and equivalently the
chain stretch tends to the locking one:
1/ 21
lockm chain chainJ J Nλ λ→ ⇒ → = II.17
From II.16 and II.17, we can therefore get:
( ) ( )1/ 2
1/ 233 1
3m
m
JN J N
+= ⇒ = − II.18
Horgan and Saccomandi (2002) showed that Gent model for incompressible rubber is a very
good qualitative and quantitative alternative for the prediction of the stress-strain response of
elastomers. They also concluded that the Gent model is a very good approximation for
molecular arguments using Kuhn and Grün (1942) non–Gaussian probability distribution
function.
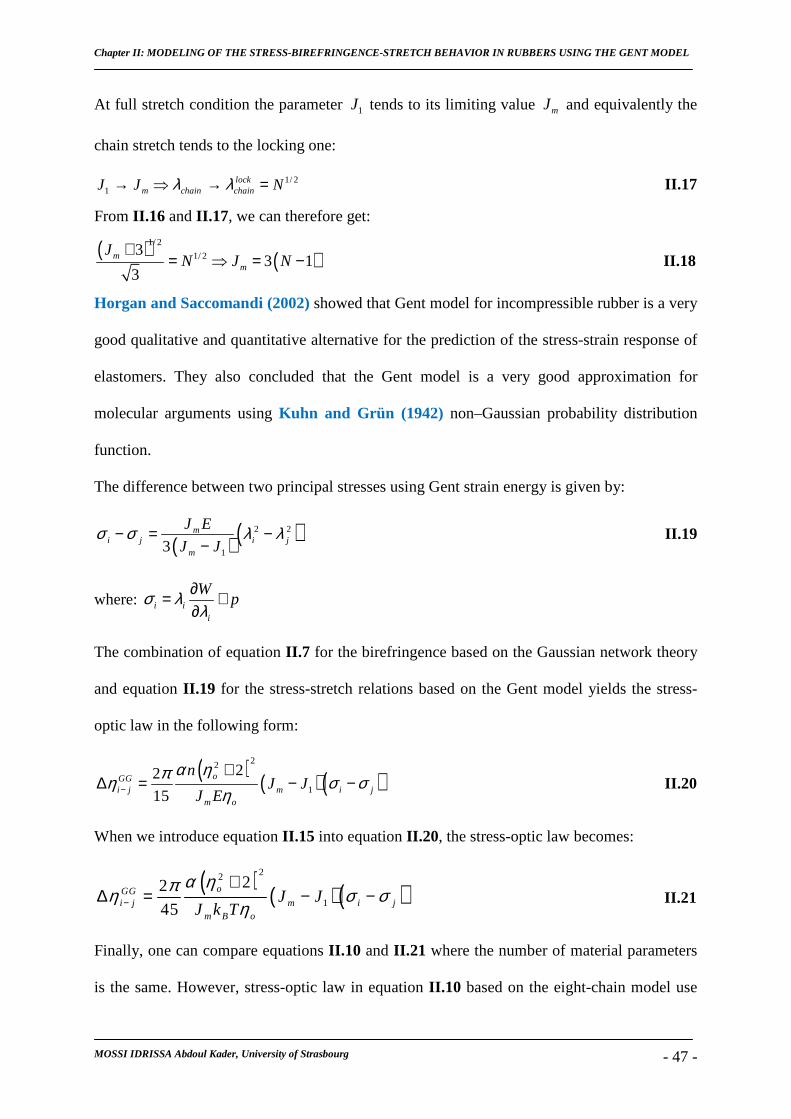
The difference between two principal stresses using Gent strain energy is given by:
( ) ( )2 2
13m
i j i jm
J E
J Jσ σ λ λ− = −
− II.19
where: i ii
Wpσ λ
λ∂= +∂
The combination of equation II.7 for the birefringence based on the Gaussian network theory
and equation II.19 for the stress-stretch relations based on the Gent model yields the stress-
optic law in the following form:
( ) ( )( )22
1
22
15oGG
i j m i jm o
nJ J
J E
α ηπη σ ση−
+∆ = − − II.20
When we introduce equation II.15 into equation II.20, the stress-optic law becomes:
( ) ( )( )22
1
22
45oGG
i j m i jm B o
J JJ k T
α ηπη σ ση−
+∆ = − − II.21
Finally, one can compare equations II.10 and II.21 where the number of material parameters
is the same. However, stress-optic law in equation II.10 based on the eight-chain model use
Chapter II: MODELING OF THE STRESS-BIREFRINGENCE-STRETCH BEHAVIOR IN RUBBERS USING THE GENT MODEL
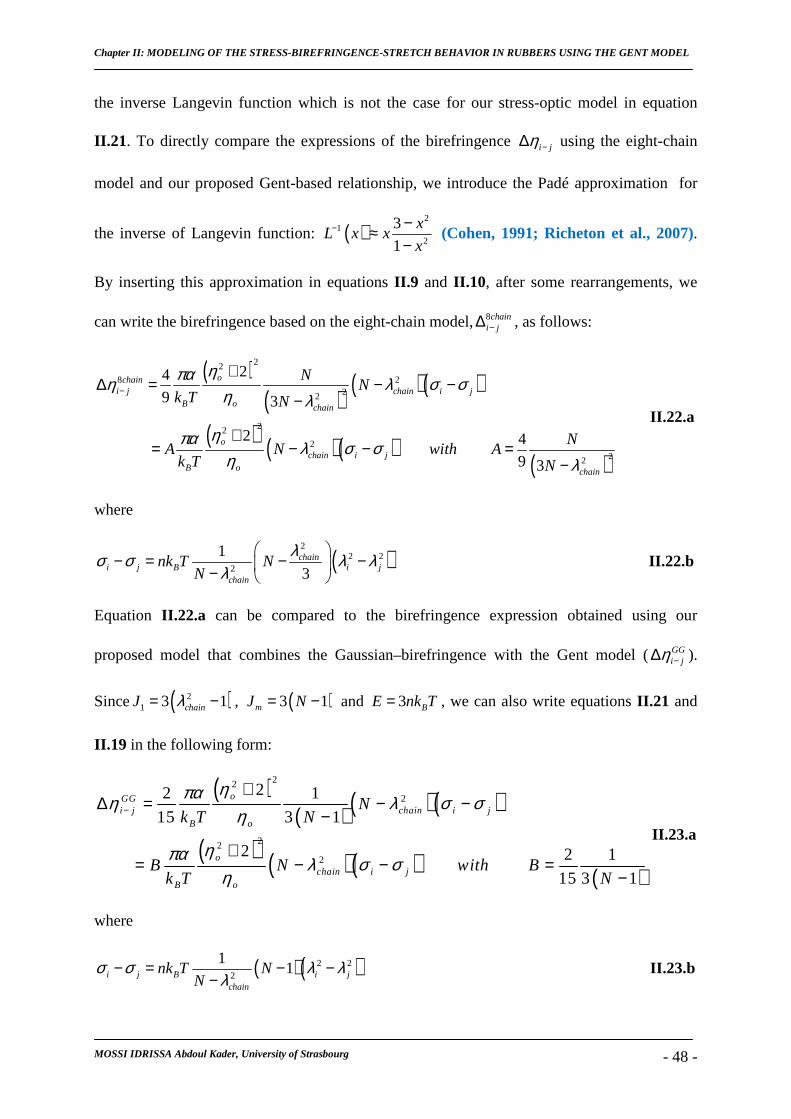
MOSSI IDRISSA Abdoul Kader, University of Strasbourg - 48 -
the inverse Langevin function which is not the case for our stress-optic model in equation
II.21. To directly compare the expressions of the birefringence i jη −∆ using the eight-chain
model and our proposed Gent-based relationship, we introduce the Padé approximation for
the inverse of Langevin function: ( )2
12
3
1
xL x x
x− −≈
− (Cohen, 1991; Richeton et al., 2007).
By inserting this approximation in equations II.9 and II.10, after some rearrangements, we
can write the birefringence based on the eight-chain model, 8chaini j−∆ , as follows:
( )( )
( )( )
( ) ( )( )( )
22
8 222
22
222
24
9 3
2 4
9 3
ochaini j chain i j
B o chain
o
chain i jB o chain
NN
k T N
NA N with A
k T N
ηπαη λ σ ση λ
ηπα λ σ ση λ
−
+∆ = − −
−
+= − − =
−
II.22.a
where
( )2
2 22
1
3chain
i j B i jchain
nk T NN
λσ σ λ λλ
− = − − −
II.22.b
Equation II.22.a can be compared to the birefringence expression obtained using our
proposed model that combines the Gaussian–birefringence with the Gent model ( GGi jη −∆ ).
Since ( )21 3 1chainJ λ= − , ( )3 1mJ N= − and 3 BE nk T= , we can also write equations II.21 and
II.19 in the following form:
( )( ) ( )( )
( ) ( )( ) ( )
22
2
22
2
22 1
15 3 1
2 2 1
15 3 1
oGGi j chain i j
B o
o
chain i jB o
Nk T N
B N with Bk T N
ηπαη λ σ ση
ηπα λ σ ση
−
+∆ = − −
−
+= − − =
−
II.23.a
where
( )( )2 22
11i j B i j
chain
nk T NN
σ σ λ λλ
− = − −−
II.23.b
Chapter II: MODELING OF THE STRESS-BIREFRINGENCE-STRETCH BEHAVIOR IN RUBBERS USING THE GENT MODEL
MOSSI IDRISSA Abdoul Kader, University of Strasbourg - 49 -
As we can obtain, both equations II.22.a and II.23.a for stress-optic relationship and the two
expressions have some similarities. However, we should note that the Arruda-Przyblyo model
is based on non-Gaussian eight-chain. However, the Gent model is based on using the stress
induced principal stretch differences in the Gent stress stretch formulation to scale the stretch
induced principal birefringence in the Gaussian network model.
In what follows, the results from equations II.22.a. and II.22.b. will be referred to as the AP
(Arruda-Przyblyo) model and the AB (Arruda-Boyce) model, respectively. Results from
equations II.23a. and II.23.b. will be referred to as the proposed model and the Gent model,
respectively.
II.2.2. RESULTS
We implemented the Gent model to predict the stress-stretch response and birefringence
evolution as a function of the stretch for both uniaxial tension and compression. The results
from the proposed Gent model are compared to those of the non-Gaussian eight-chain model
and also to experimental data from the literature. The selected rubbers are those used by
Arruda and Przybylo (1995) where they compared the eight-chain model to experimental
data.
The experimental data are those from Flory and Erman (1982) and Erman and Flory (1982,
1983a, 1983b) for two Polydimethylsiloxanes (Name here: PDMS(A) and PDMS(B)), as well
as those from Von Lockette and Arruda (1999) for two other polydimethylsiloxanes (Name
here: PDMS(C), PDMS(D)) and also on natural rubber. The molecular weights for PDMS(C)
PDMS(D) are 2600g/mol and 21500g/mol respectively. The molecular weights for PDMS(A)
and PDMS(B) were not given but they were reported to differ in their mechanical and optical
properties (Arruda and Przybylo, 1995) since they were synthesized under different
conditions. The material parameters for both models are those used by Arruda and Przybylo
(1995) and Von Lockette and Arruda (1999) and are shown in Table II.1.
Chapter II: MODELING OF THE STRESS-BIREFRINGENCE-STRETCH BEHAVIOR IN RUBBERS USING THE GENT MODEL
MOSSI IDRISSA Abdoul Kader, University of Strasbourg - 50 -
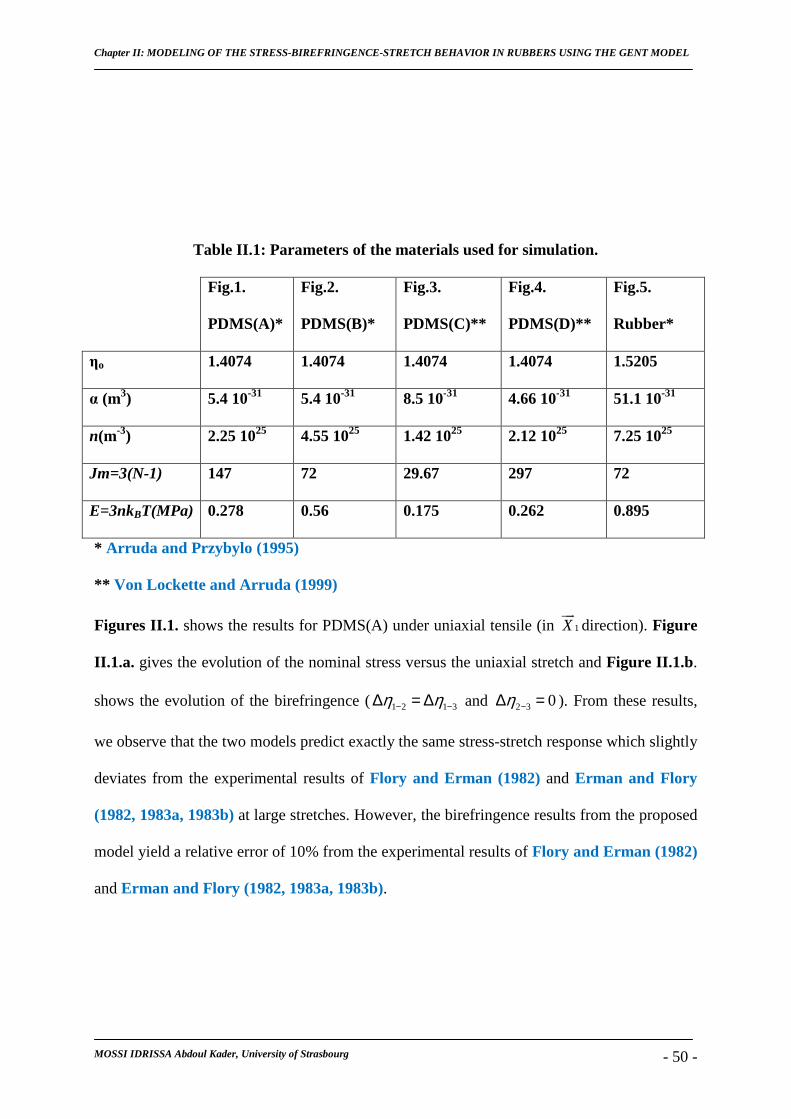
Table II.1: Parameters of the materials used for simulation.
Fig.1.
PDMS(A)*
Fig.2.
PDMS(B)*
Fig.3.
PDMS(C)**
Fig.4.
PDMS(D)**
Fig.5.
Rubber*
ηo 1.4074 1.4074 1.4074 1.4074 1.5205
α (m3) 5.4 10-31 5.4 10-31 8.5 10-31 4.66 10-31 51.1 10-31
n(m-3) 2.25 1025 4.55 1025 1.42 1025 2.12 1025 7.25 1025
Jm=3(N-1) 147 72 29.67 297 72
E=3nkBT(MPa) 0.278 0.56 0.175 0.262 0.895
* Arruda and Przybylo (1995)
** Von Lockette and Arruda (1999)
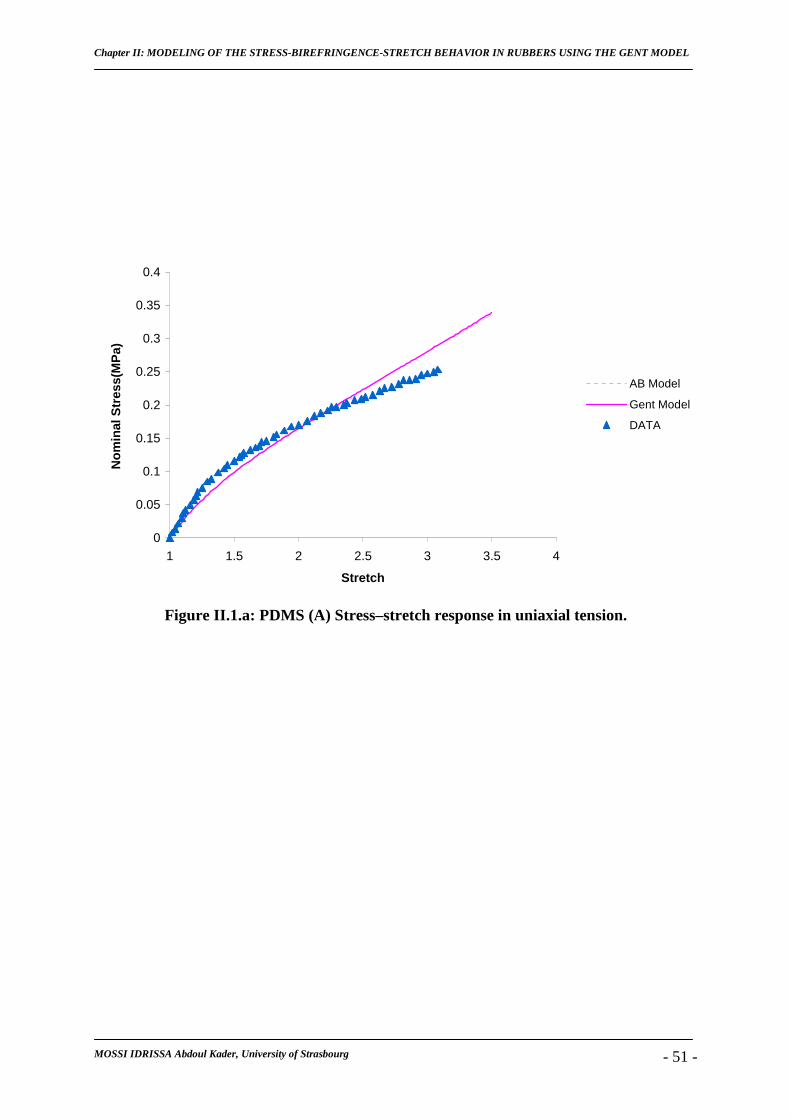
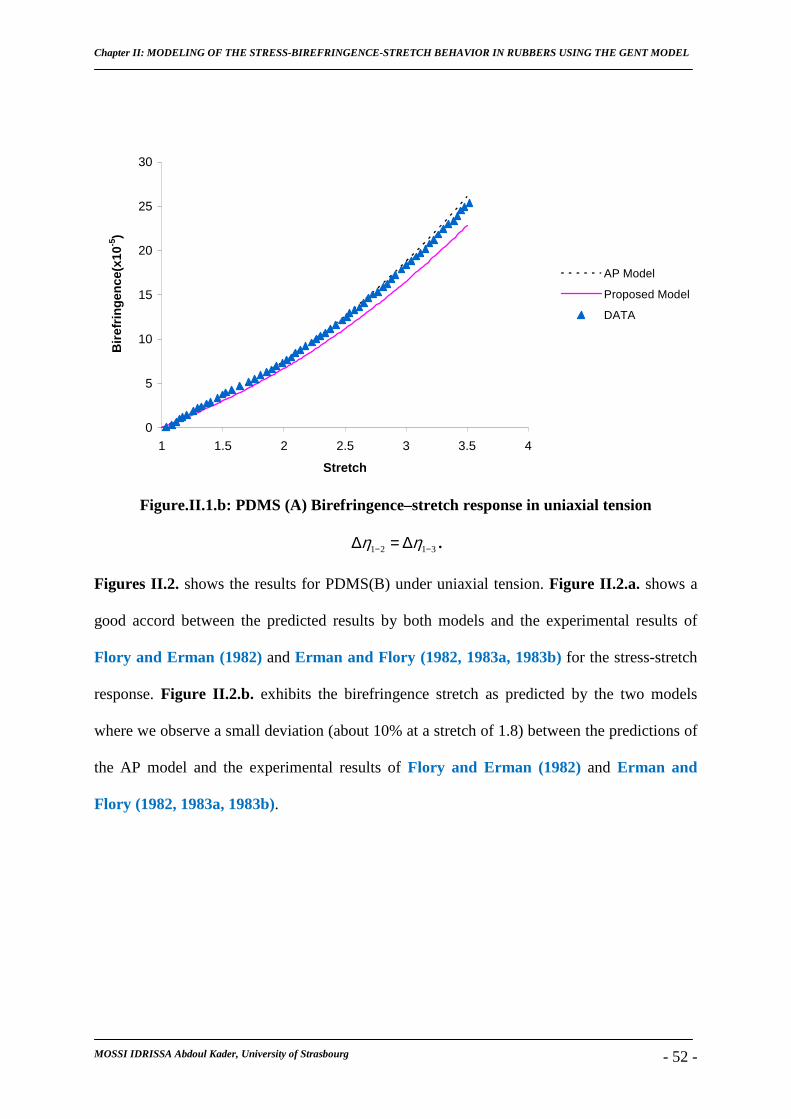
Figures II.1. shows the results for PDMS(A) under uniaxial tensile (in 1X
direction). Figure
II.1.a. gives the evolution of the nominal stress versus the uniaxial stretch and Figure II.1.b .
shows the evolution of the birefringence (1 2 1 3η η− −∆ = ∆ and 2 3 0η −∆ = ). From these results,
we observe that the two models predict exactly the same stress-stretch response which slightly
deviates from the experimental results of Flory and Erman (1982) and Erman and Flory
(1982, 1983a, 1983b) at large stretches. However, the birefringence results from the proposed
model yield a relative error of 10% from the experimental results of Flory and Erman (1982)
and Erman and Flory (1982, 1983a, 1983b).
Chapter II: MODELING OF THE STRESS-BIREFRINGENCE-STRETCH BEHAVIOR IN RUBBERS USING THE GENT MODEL
MOSSI IDRISSA Abdoul Kader, University of Strasbourg - 51 -
0
0.05
0.1
0.15
0.2
0.25
0.3
0.35
0.4
1 1.5 2 2.5 3 3.5 4
Stretch
No
min
al S
tres
s(M
Pa)
AB Model
Gent Model
DATA
Figure II.1.a: PDMS (A) Stress–stretch response in uniaxial tension.
Chapter II: MODELING OF THE STRESS-BIREFRINGENCE-STRETCH BEHAVIOR IN RUBBERS USING THE GENT MODEL
MOSSI IDRISSA Abdoul Kader, University of Strasbourg - 52 -
0
5
10
15
20
25
30
1 1.5 2 2.5 3 3.5 4
Stretch
Bir
efri
ng
ence
(x10
-5)
AP Model
Proposed Model
DATA
Figure.II.1.b: PDMS (A) Birefringence–stretch response in uniaxial tension
1 2 1 3η η− −∆ = ∆ .
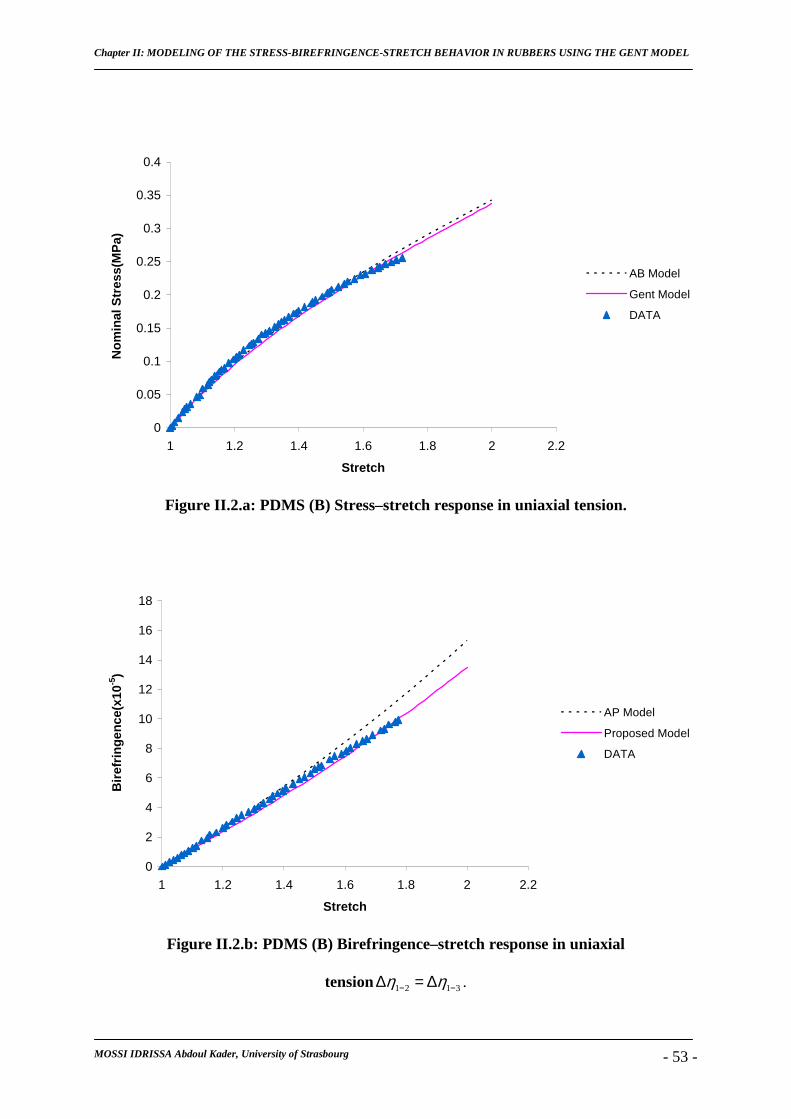
Figures II.2. shows the results for PDMS(B) under uniaxial tension. Figure II.2.a. shows a
good accord between the predicted results by both models and the experimental results of
Flory and Erman (1982) and Erman and Flory (1982, 1983a, 1983b) for the stress-stretch
response. Figure II.2.b. exhibits the birefringence stretch as predicted by the two models
where we observe a small deviation (about 10% at a stretch of 1.8) between the predictions of
the AP model and the experimental results of Flory and Erman (1982) and Erman and
Flory (1982, 1983a, 1983b).
Chapter II: MODELING OF THE STRESS-BIREFRINGENCE-STRETCH BEHAVIOR IN RUBBERS USING THE GENT MODEL
MOSSI IDRISSA Abdoul Kader, University of Strasbourg - 53 -
0
0.05
0.1
0.15
0.2
0.25
0.3
0.35
0.4
1 1.2 1.4 1.6 1.8 2 2.2
Stretch
No
min
al S
tres
s(M
Pa)
AB Model
Gent Model
DATA
Figure II.2.a: PDMS (B) Stress–stretch response in uniaxial tension.
0
2
4
6
8
10
12
14
16
18
1 1.2 1.4 1.6 1.8 2 2.2
Stretch
Bir
efri
ng
ence
(x10
-5)
AP Model
Proposed Model
DATA
Figure II.2.b: PDMS (B) Birefringence–stretch response in uniaxial
tension 1 2 1 3η η− −∆ = ∆ .
Chapter II: MODELING OF THE STRESS-BIREFRINGENCE-STRETCH BEHAVIOR IN RUBBERS USING THE GENT MODEL
MOSSI IDRISSA Abdoul Kader, University of Strasbourg - 54 -
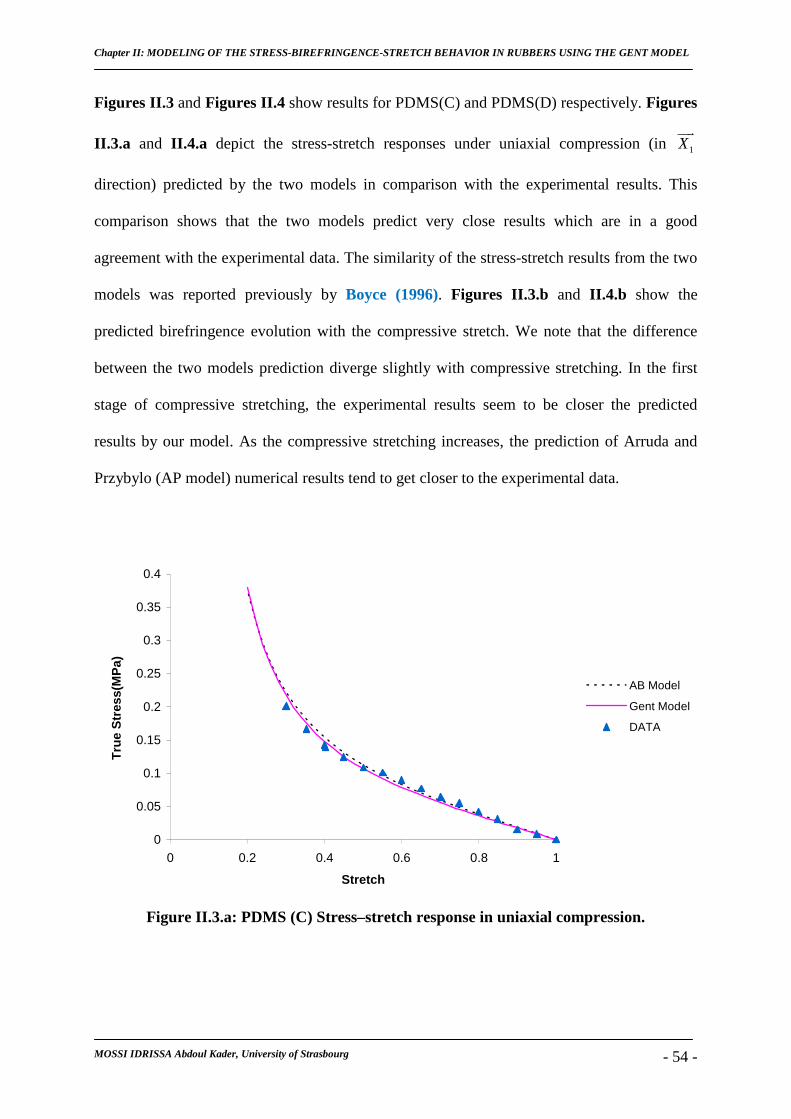
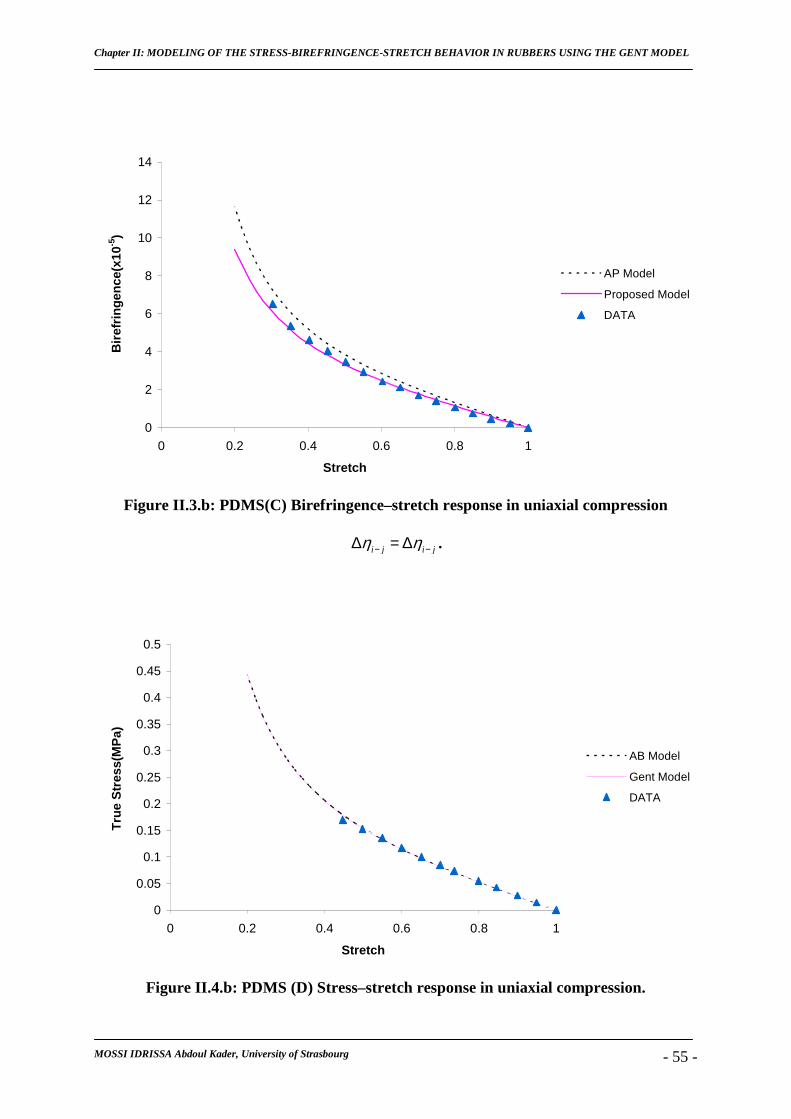
Figures II.3 and Figures II.4 show results for PDMS(C) and PDMS(D) respectively. Figures
II.3.a and II.4.a depict the stress-stretch responses under uniaxial compression (in 1X
direction) predicted by the two models in comparison with the experimental results. This
comparison shows that the two models predict very close results which are in a good
agreement with the experimental data. The similarity of the stress-stretch results from the two
models was reported previously by Boyce (1996). Figures II.3.b and II.4.b show the
predicted birefringence evolution with the compressive stretch. We note that the difference
between the two models prediction diverge slightly with compressive stretching. In the first
stage of compressive stretching, the experimental results seem to be closer the predicted
results by our model. As the compressive stretching increases, the prediction of Arruda and
Przybylo (AP model) numerical results tend to get closer to the experimental data.
0
0.05
0.1
0.15
0.2
0.25
0.3
0.35
0.4
0 0.2 0.4 0.6 0.8 1
Stretch
Tru
e S
tres
s(M
Pa)
AB Model
Gent Model
DATA
Figure II.3.a: PDMS (C) Stress–stretch response in uniaxial compression.
Chapter II: MODELING OF THE STRESS-BIREFRINGENCE-STRETCH BEHAVIOR IN RUBBERS USING THE GENT MODEL
MOSSI IDRISSA Abdoul Kader, University of Strasbourg - 55 -
0
2
4
6
8
10
12
14
0 0.2 0.4 0.6 0.8 1
Stretch
Bir
efri
ng
ence
(x10
-5)
AP Model
Proposed Model
DATA
Figure II.3.b: PDMS(C) Birefringence–stretch response in uniaxial compression
i j i jη η− −∆ = ∆ .
0
0.05
0.1
0.15
0.2
0.25
0.3
0.35
0.4
0.45
0.5
0 0.2 0.4 0.6 0.8 1
Stretch
Tru
e S
tres
s(M
Pa)
AB Model
Gent Model
DATA
Figure II.4.b: PDMS (D) Stress–stretch response in uniaxial compression.
Chapter II: MODELING OF THE STRESS-BIREFRINGENCE-STRETCH BEHAVIOR IN RUBBERS USING THE GENT MODEL
MOSSI IDRISSA Abdoul Kader, University of Strasbourg - 56 -
0
1
2
3
4
5
6
7
8
9
10
0 0.2 0.4 0.6 0.8 1
Bir
efri
ng
ence
(x10
-5)
Stretch
AP Model
Proposed Model
DATA
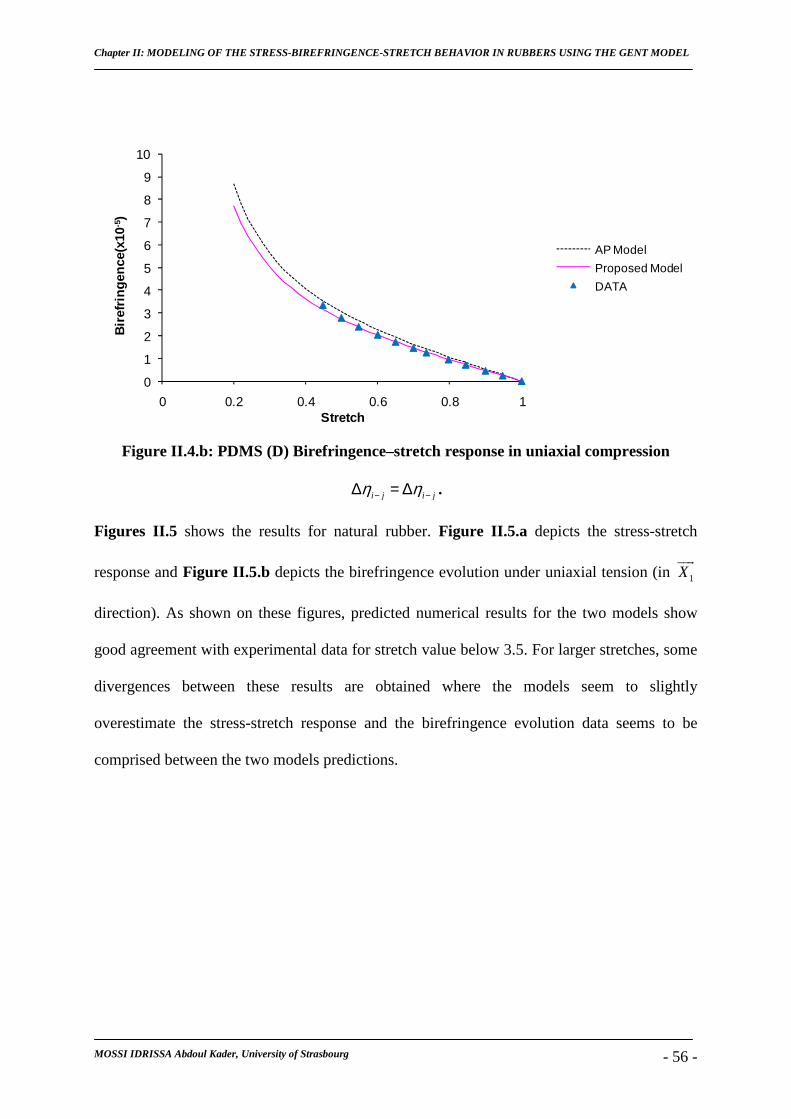
Figure II.4.b: PDMS (D) Birefringence–stretch response in uniaxial compression
i j i jη η− −∆ = ∆ .
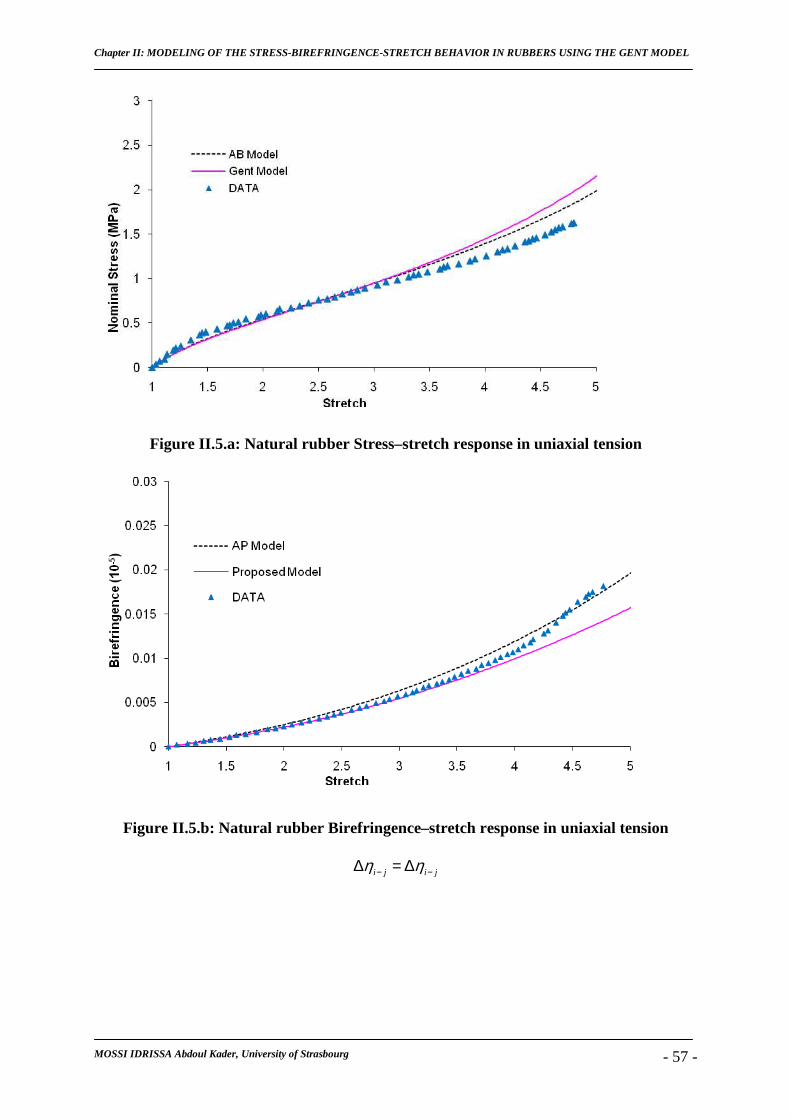
Figures II.5 shows the results for natural rubber. Figure II.5.a depicts the stress-stretch
response and Figure II.5.b depicts the birefringence evolution under uniaxial tension (in 1X
direction). As shown on these figures, predicted numerical results for the two models show
good agreement with experimental data for stretch value below 3.5. For larger stretches, some
divergences between these results are obtained where the models seem to slightly
overestimate the stress-stretch response and the birefringence evolution data seems to be
comprised between the two models predictions.
Chapter II: MODELING OF THE STRESS-BIREFRINGENCE-STRETCH BEHAVIOR IN RUBBERS USING THE GENT MODEL
MOSSI IDRISSA Abdoul Kader, University of Strasbourg - 57 -
Figure II.5.a: Natural rubber Stress–stretch response in uniaxial tension
Figure II.5.b: Natural rubber Birefringence–stretch response in uniaxial tension
i j i jη η− −∆ = ∆
Chapter II: MODELING OF THE STRESS-BIREFRINGENCE-STRETCH BEHAVIOR IN RUBBERS USING THE GENT MODEL
MOSSI IDRISSA Abdoul Kader, University of Strasbourg - 58 -
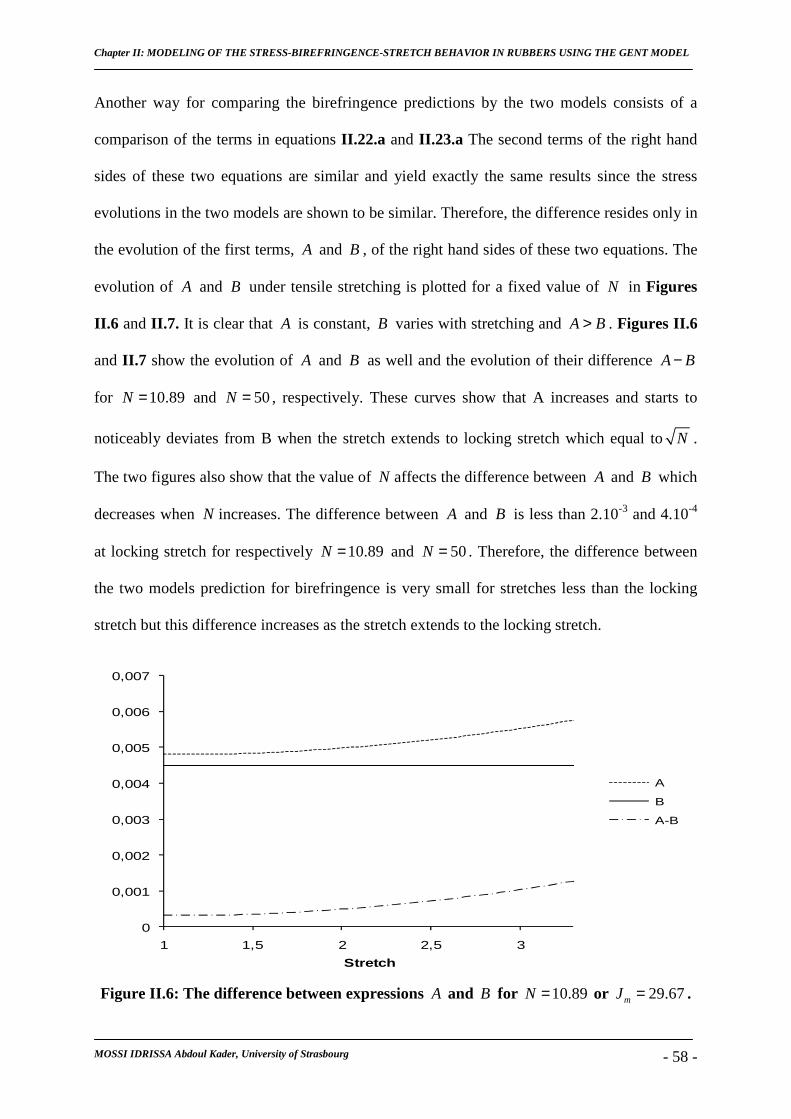
Another way for comparing the birefringence predictions by the two models consists of a
comparison of the terms in equations II.22.a and II.23.a The second terms of the right hand
sides of these two equations are similar and yield exactly the same results since the stress
evolutions in the two models are shown to be similar. Therefore, the difference resides only in
the evolution of the first terms, A and B , of the right hand sides of these two equations. The
evolution of A and B under tensile stretching is plotted for a fixed value of N in Figures
II.6 and II.7. It is clear that A is constant, B varies with stretching and A B> . Figures II.6
and II.7 show the evolution of A and B as well and the evolution of their difference A B−
for 10.89N = and 50N = , respectively. These curves show that A increases and starts to
noticeably deviates from B when the stretch extends to locking stretch which equal toN .
The two figures also show that the value of N affects the difference between A and B which
decreases when N increases. The difference between A and B is less than 2.10-3 and 4.10-4
at locking stretch for respectively 10.89N = and 50N = . Therefore, the difference between
the two models prediction for birefringence is very small for stretches less than the locking
stretch but this difference increases as the stretch extends to the locking stretch.
Figure II.6: The difference between expressions A and B for 10.89N = or 29.67mJ = .
0
0,001
0,002
0,003
0,004
0,005
0,006
0,007
1 1,5 2 2,5 3
Stretch
A
B
A-B
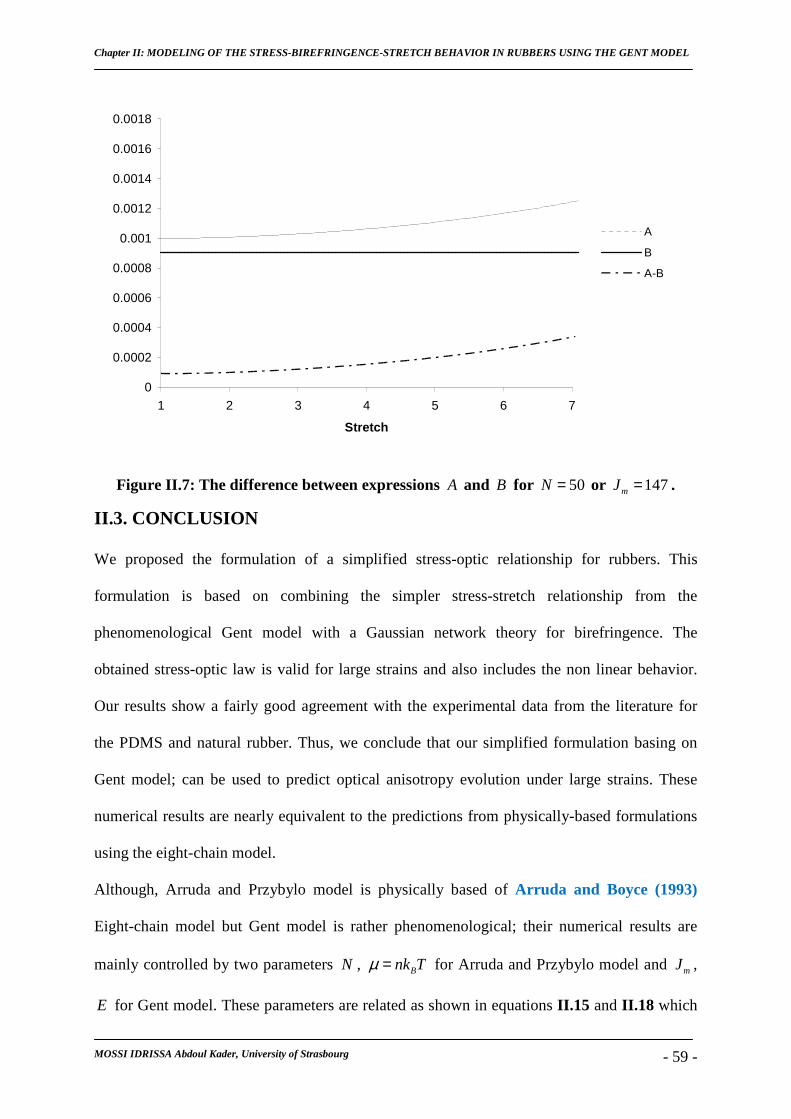
Chapter II: MODELING OF THE STRESS-BIREFRINGENCE-STRETCH BEHAVIOR IN RUBBERS USING THE GENT MODEL
MOSSI IDRISSA Abdoul Kader, University of Strasbourg - 59 -
0
0.0002
0.0004
0.0006
0.0008
0.001
0.0012
0.0014
0.0016
0.0018
1 2 3 4 5 6 7
Stretch
A
B
A-B
Figure II.7: The difference between expressions A and B for 50N = or 147mJ = .
II.3. CONCLUSION
We proposed the formulation of a simplified stress-optic relationship for rubbers. This
formulation is based on combining the simpler stress-stretch relationship from the
phenomenological Gent model with a Gaussian network theory for birefringence. The
obtained stress-optic law is valid for large strains and also includes the non linear behavior.
Our results show a fairly good agreement with the experimental data from the literature for
the PDMS and natural rubber. Thus, we conclude that our simplified formulation basing on
Gent model; can be used to predict optical anisotropy evolution under large strains. These
numerical results are nearly equivalent to the predictions from physically-based formulations
using the eight-chain model.
Although, Arruda and Przybylo model is physically based of Arruda and Boyce (1993)
Eight-chain model but Gent model is rather phenomenological; their numerical results are
mainly controlled by two parameters N , Bnk Tµ = for Arruda and Przybylo model and mJ ,
E for Gent model. These parameters are related as shown in equations II.15 and II.18 which

Chapter II: MODELING OF THE STRESS-BIREFRINGENCE-STRETCH BEHAVIOR IN RUBBERS USING THE GENT MODEL
MOSSI IDRISSA Abdoul Kader, University of Strasbourg - 60 -
leads to similarities in the physics represented by these parameters in the two models and to
similar stress-strain response as well as to the closeness of the birefringence results from both
models.
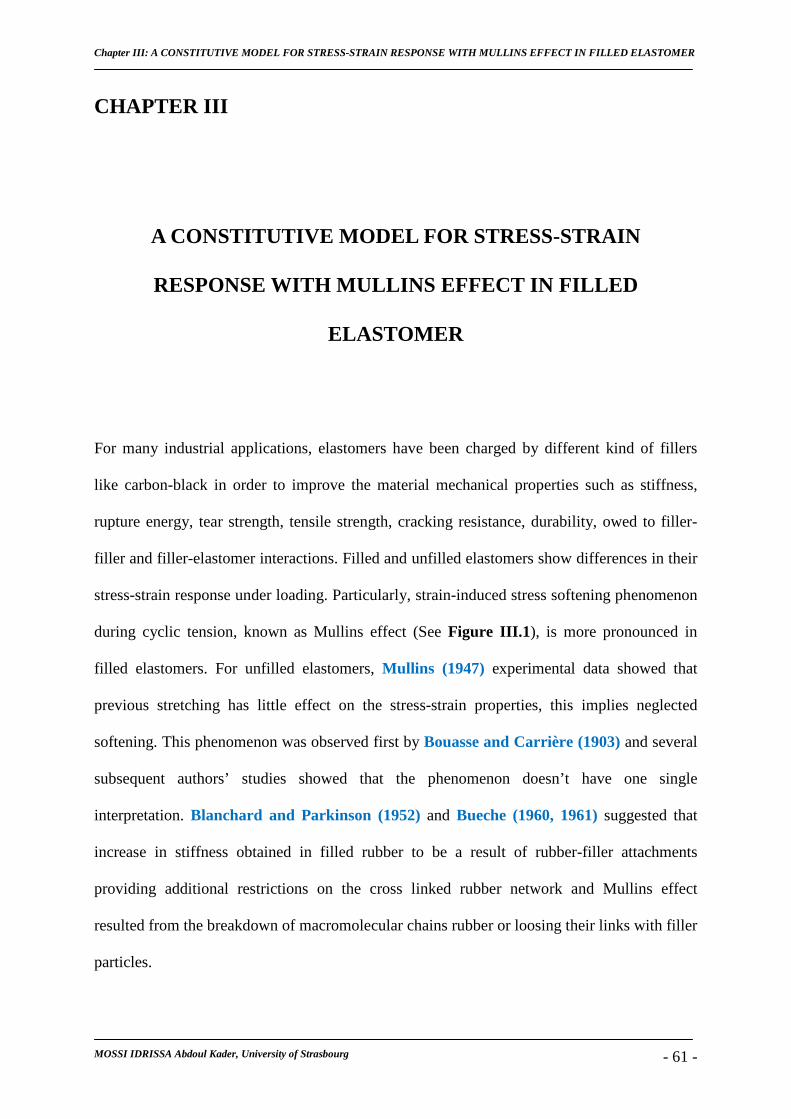
Chapter III: A CONSTITUTIVE MODEL FOR STRESS-STRAIN RESPONSE WITH MULLINS EFFECT IN FILLED ELASTOMER
MOSSI IDRISSA Abdoul Kader, University of Strasbourg - 61 -
CHAPTER III
A CONSTITUTIVE MODEL FOR STRESS-STRAIN
RESPONSE WITH MULLINS EFFECT IN FILLED
ELASTOMER
For many industrial applications, elastomers have been charged by different kind of fillers
like carbon-black in order to improve the material mechanical properties such as stiffness,
rupture energy, tear strength, tensile strength, cracking resistance, durability, owed to filler-
filler and filler-elastomer interactions. Filled and unfilled elastomers show differences in their
stress-strain response under loading. Particularly, strain-induced stress softening phenomenon
during cyclic tension, known as Mullins effect (See Figure III.1 ), is more pronounced in
filled elastomers. For unfilled elastomers, Mullins (1947) experimental data showed that
previous stretching has little effect on the stress-strain properties, this implies neglected
softening. This phenomenon was observed first by Bouasse and Carrière (1903) and several
subsequent authors’ studies showed that the phenomenon doesn’t have one single
interpretation. Blanchard and Parkinson (1952) and Bueche (1960, 1961) suggested that
increase in stiffness obtained in filled rubber to be a result of rubber-filler attachments
providing additional restrictions on the cross linked rubber network and Mullins effect
resulted from the breakdown of macromolecular chains rubber or loosing their links with filler
particles.
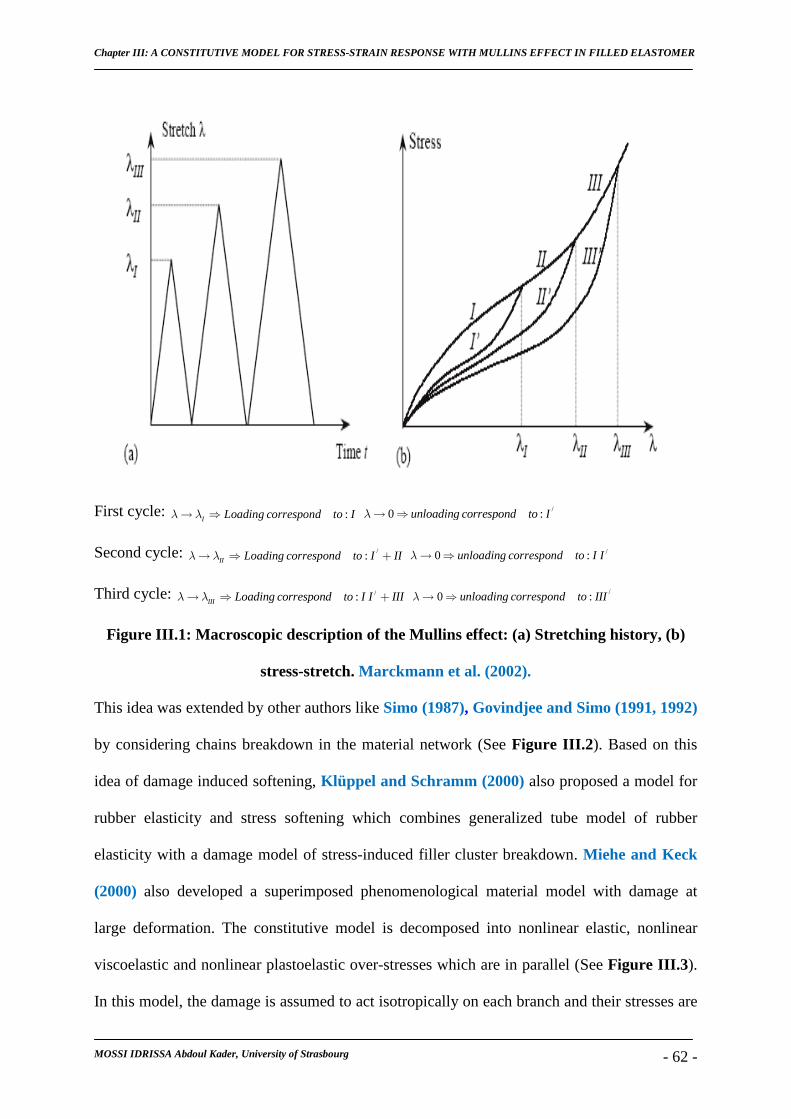
Chapter III: A CONSTITUTIVE MODEL FOR STRESS-STRAIN RESPONSE WITH MULLINS EFFECT IN FILLED ELASTOMER
MOSSI IDRISSA Abdoul Kader, University of Strasbourg - 62 -
First cycle: :I Loading correspond to Iλ λ→ ⇒ /0 :unloading correspond to Iλ→ ⇒
Second cycle: /:II Loading correspond to I IIλ λ→ ⇒ + /0 :unloading correspond to I Iλ→ ⇒
Third cycle: /:III Loading correspond to I I IIIλ λ→ ⇒ + /0 :unloading correspond to IIIλ→ ⇒
Figure III.1: Macroscopic description of the Mullins effect: (a) Stretching history, (b)
stress-stretch. Marckmann et al. (2002).
This idea was extended by other authors like Simo (1987), Govindjee and Simo (1991, 1992)
by considering chains breakdown in the material network (See Figure III.2 ). Based on this
idea of damage induced softening, Klüppel and Schramm (2000) also proposed a model for
rubber elasticity and stress softening which combines generalized tube model of rubber
elasticity with a damage model of stress-induced filler cluster breakdown. Miehe and Keck
(2000) also developed a superimposed phenomenological material model with damage at
large deformation. The constitutive model is decomposed into nonlinear elastic, nonlinear
viscoelastic and nonlinear plastoelastic over-stresses which are in parallel (See Figure III.3 ).
In this model, the damage is assumed to act isotropically on each branch and their stresses are
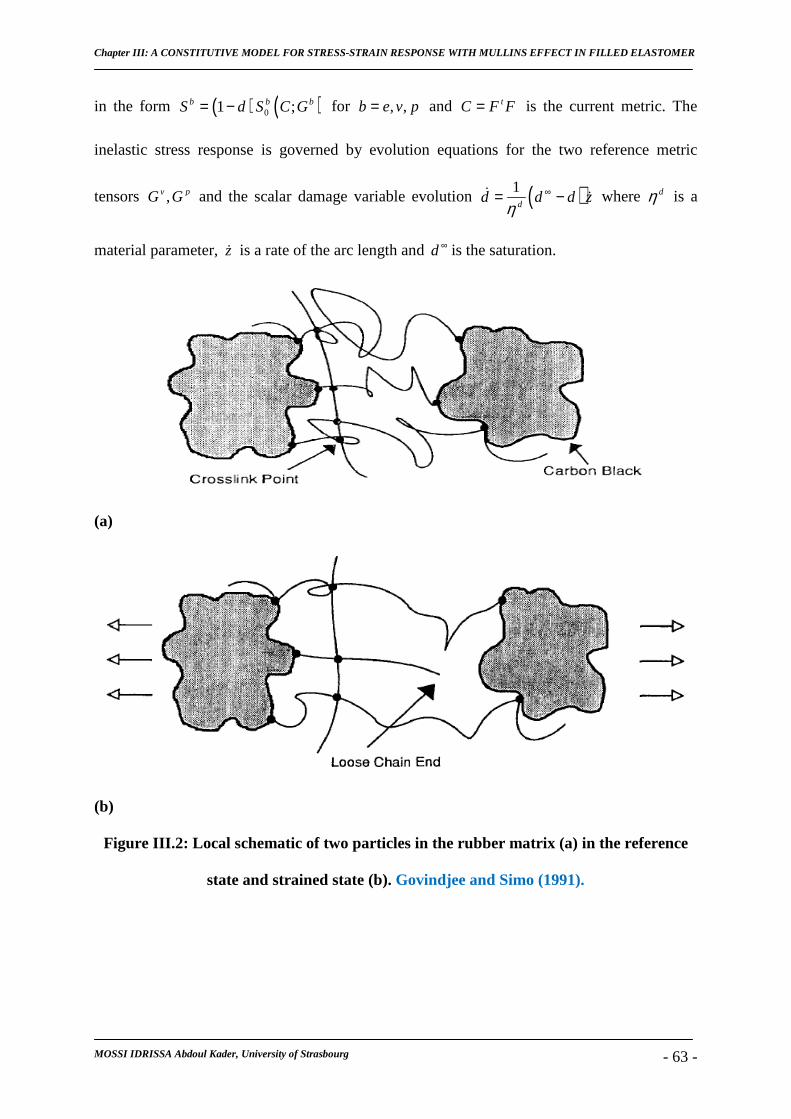
Chapter III: A CONSTITUTIVE MODEL FOR STRESS-STRAIN RESPONSE WITH MULLINS EFFECT IN FILLED ELASTOMER
MOSSI IDRISSA Abdoul Kader, University of Strasbourg - 63 -
in the form ( ) ( )01 ;b b bS d S C G= − for , ,b e v p= and tC F F= is the current metric. The
inelastic stress response is governed by evolution equations for the two reference metric
tensors ,v pG G and the scalar damage variable evolution ( )1d
d d d zη
∞= −ɺ ɺ where dη is a
material parameter, zɺ is a rate of the arc length and d ∞ is the saturation.
(a)
(b)
Figure III.2: Local schematic of two particles in the rubber matrix (a) in the reference
state and strained state (b). Govindjee and Simo (1991).
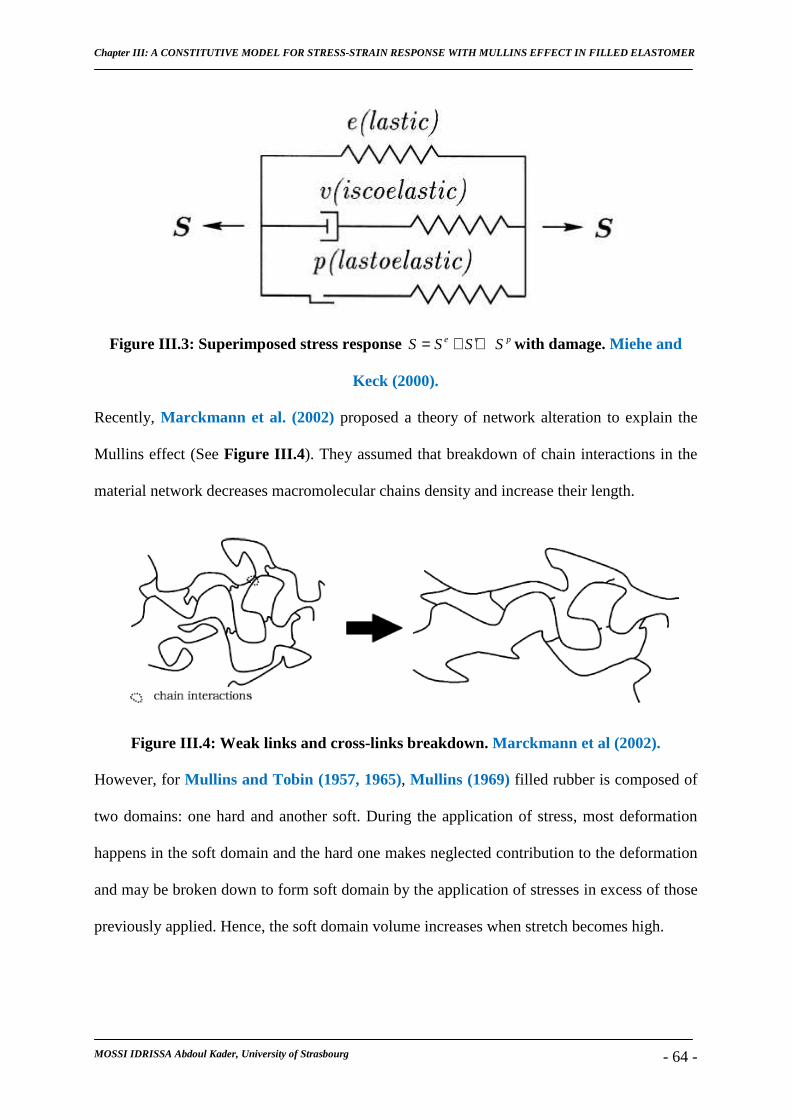
Chapter III: A CONSTITUTIVE MODEL FOR STRESS-STRAIN RESPONSE WITH MULLINS EFFECT IN FILLED ELASTOMER
MOSSI IDRISSA Abdoul Kader, University of Strasbourg - 64 -
Figure III.3: Superimposed stress response e v pS S S S= + + with damage. Miehe and
Keck (2000).
Recently, Marckmann et al. (2002) proposed a theory of network alteration to explain the
Mullins effect (See Figure III.4 ). They assumed that breakdown of chain interactions in the
material network decreases macromolecular chains density and increase their length.
Figure III.4: Weak links and cross-links breakdown. Marckmann et al (2002).
However, for Mullins and Tobin (1957, 1965), Mullins (1969) filled rubber is composed of
two domains: one hard and another soft. During the application of stress, most deformation
happens in the soft domain and the hard one makes neglected contribution to the deformation
and may be broken down to form soft domain by the application of stresses in excess of those
previously applied. Hence, the soft domain volume increases when stretch becomes high.
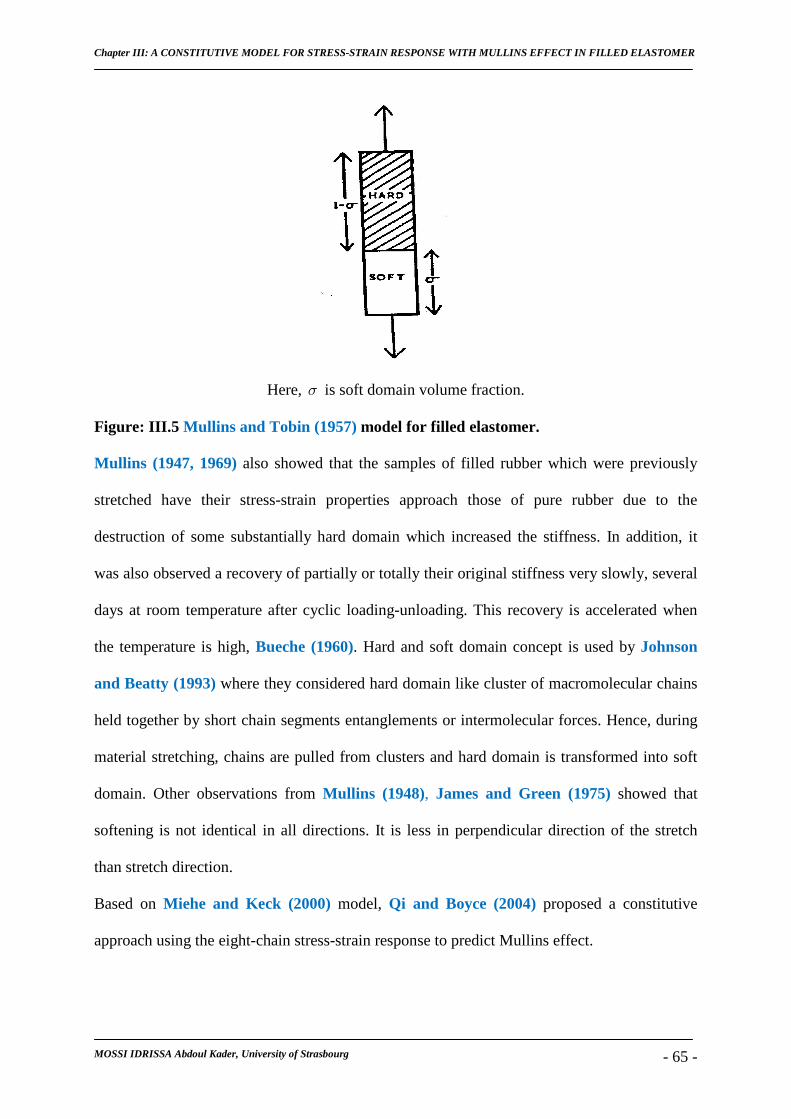
Chapter III: A CONSTITUTIVE MODEL FOR STRESS-STRAIN RESPONSE WITH MULLINS EFFECT IN FILLED ELASTOMER
MOSSI IDRISSA Abdoul Kader, University of Strasbourg - 65 -
Here, σ is soft domain volume fraction.
Figure: III.5 Mullins and Tobin (1957) model for filled elastomer.
Mullins (1947, 1969) also showed that the samples of filled rubber which were previously
stretched have their stress-strain properties approach those of pure rubber due to the
destruction of some substantially hard domain which increased the stiffness. In addition, it
was also observed a recovery of partially or totally their original stiffness very slowly, several
days at room temperature after cyclic loading-unloading. This recovery is accelerated when
the temperature is high, Bueche (1960). Hard and soft domain concept is used by Johnson
and Beatty (1993) where they considered hard domain like cluster of macromolecular chains
held together by short chain segments entanglements or intermolecular forces. Hence, during
material stretching, chains are pulled from clusters and hard domain is transformed into soft
domain. Other observations from Mullins (1948), James and Green (1975) showed that
softening is not identical in all directions. It is less in perpendicular direction of the stretch
than stretch direction.
Based on Miehe and Keck (2000) model, Qi and Boyce (2004) proposed a constitutive
approach using the eight-chain stress-strain response to predict Mullins effect.
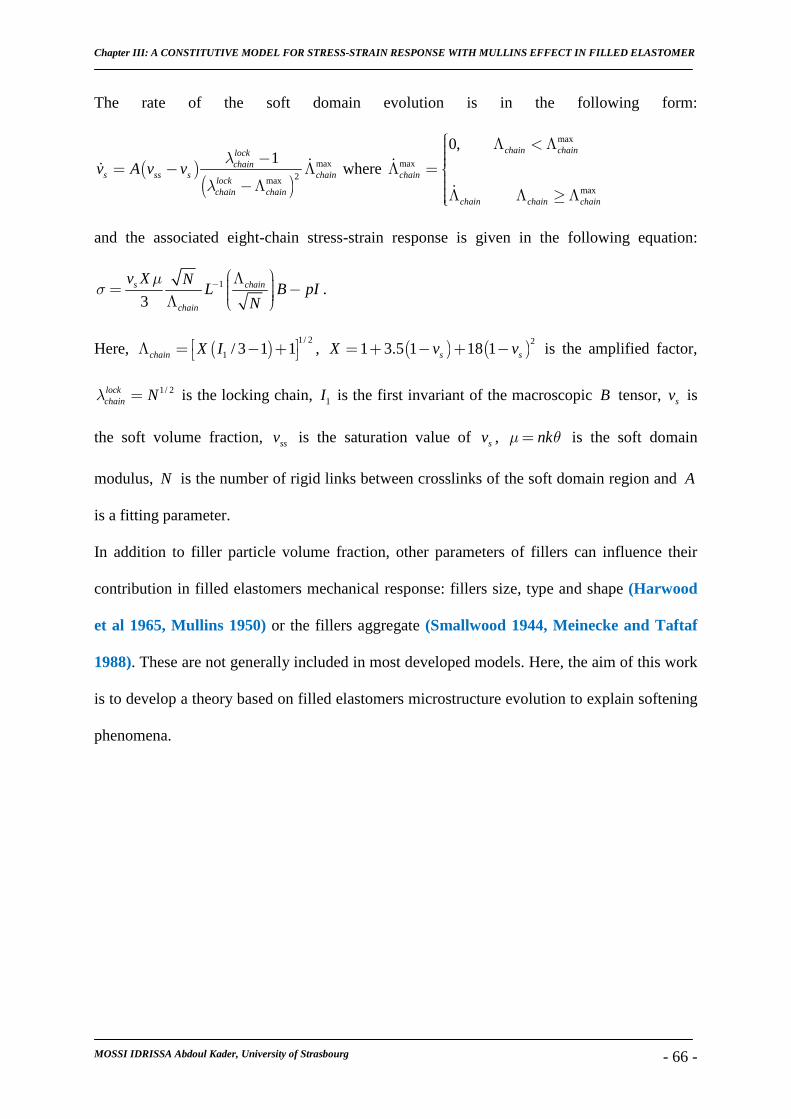
Chapter III: A CONSTITUTIVE MODEL FOR STRESS-STRAIN RESPONSE WITH MULLINS EFFECT IN FILLED ELASTOMER
MOSSI IDRISSA Abdoul Kader, University of Strasbourg - 66 -
The rate of the soft domain evolution is in the following form:
( )( )
max2max
1lockchain
s ss s chainlockchain chain
v A v vλ
λ
−= − Λ
−Λ
ɺɺ where
max
max
max
0, chain chain
chain
chain chain chain
Λ < ΛΛ = Λ Λ ≥ Λ
ɺ
ɺ
and the associated eight-chain stress-strain response is given in the following equation:
1
3s chain
chain
v X NL B pI
N
µσ −
Λ = − Λ .
Here, ( )1/ 2
1 / 3 1 1chain X I Λ = − + , ( ) ( )2
1 3.5 1 18 1s sX v v= + − + − is the amplified factor,
1/ 2lockchain Nλ = is the locking chain, 1I is the first invariant of the macroscopic B tensor, sv is
the soft volume fraction, ssv is the saturation value of sv , nkµ θ= is the soft domain
modulus, N is the number of rigid links between crosslinks of the soft domain region and A
is a fitting parameter.
In addition to filler particle volume fraction, other parameters of fillers can influence their
contribution in filled elastomers mechanical response: fillers size, type and shape (Harwood
et al 1965, Mullins 1950) or the fillers aggregate (Smallwood 1944, Meinecke and Taftaf
1988). These are not generally included in most developed models. Here, the aim of this work
is to develop a theory based on filled elastomers microstructure evolution to explain softening
phenomena.
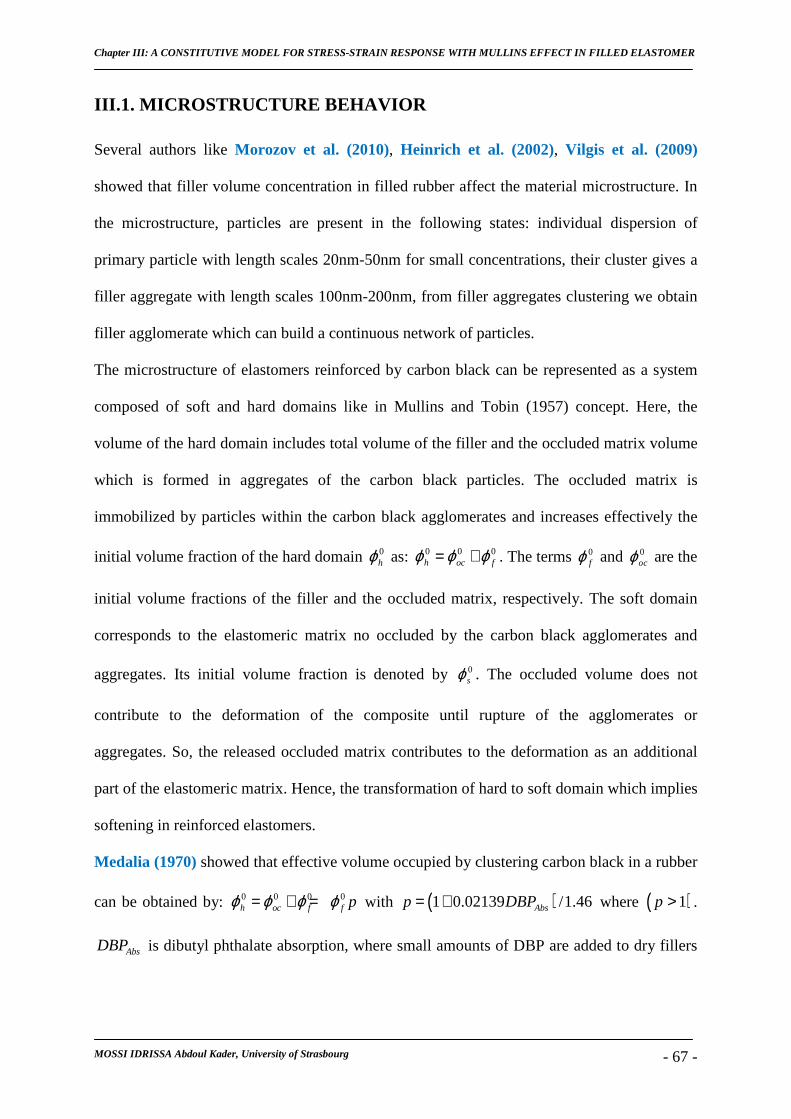
Chapter III: A CONSTITUTIVE MODEL FOR STRESS-STRAIN RESPONSE WITH MULLINS EFFECT IN FILLED ELASTOMER
MOSSI IDRISSA Abdoul Kader, University of Strasbourg - 67 -
III.1. MICROSTRUCTURE BEHAVIOR
Several authors like Morozov et al. (2010), Heinrich et al. (2002), Vilgis et al. (2009)
showed that filler volume concentration in filled rubber affect the material microstructure. In
the microstructure, particles are present in the following states: individual dispersion of
primary particle with length scales 20nm-50nm for small concentrations, their cluster gives a
filler aggregate with length scales 100nm-200nm, from filler aggregates clustering we obtain
filler agglomerate which can build a continuous network of particles.
The microstructure of elastomers reinforced by carbon black can be represented as a system
composed of soft and hard domains like in Mullins and Tobin (1957) concept. Here, the
volume of the hard domain includes total volume of the filler and the occluded matrix volume
which is formed in aggregates of the carbon black particles. The occluded matrix is
immobilized by particles within the carbon black agglomerates and increases effectively the
initial volume fraction of the hard domain 0hϕ as: 0 0 0h oc fϕ ϕ ϕ= + . The terms 0
fϕ and 0ocϕ are the
initial volume fractions of the filler and the occluded matrix, respectively. The soft domain
corresponds to the elastomeric matrix no occluded by the carbon black agglomerates and
aggregates. Its initial volume fraction is denoted by 0sϕ . The occluded volume does not
contribute to the deformation of the composite until rupture of the agglomerates or
aggregates. So, the released occluded matrix contributes to the deformation as an additional
part of the elastomeric matrix. Hence, the transformation of hard to soft domain which implies
softening in reinforced elastomers.
Medalia (1970) showed that effective volume occupied by clustering carbon black in a rubber
can be obtained by: 0 0 0 0h oc f f pϕ ϕ ϕ ϕ= + =
with
( )1 0.02139 /1.46Absp DBP= + where ( )1p > .
AbsDBP is dibutyl phthalate absorption, where small amounts of DBP are added to dry fillers
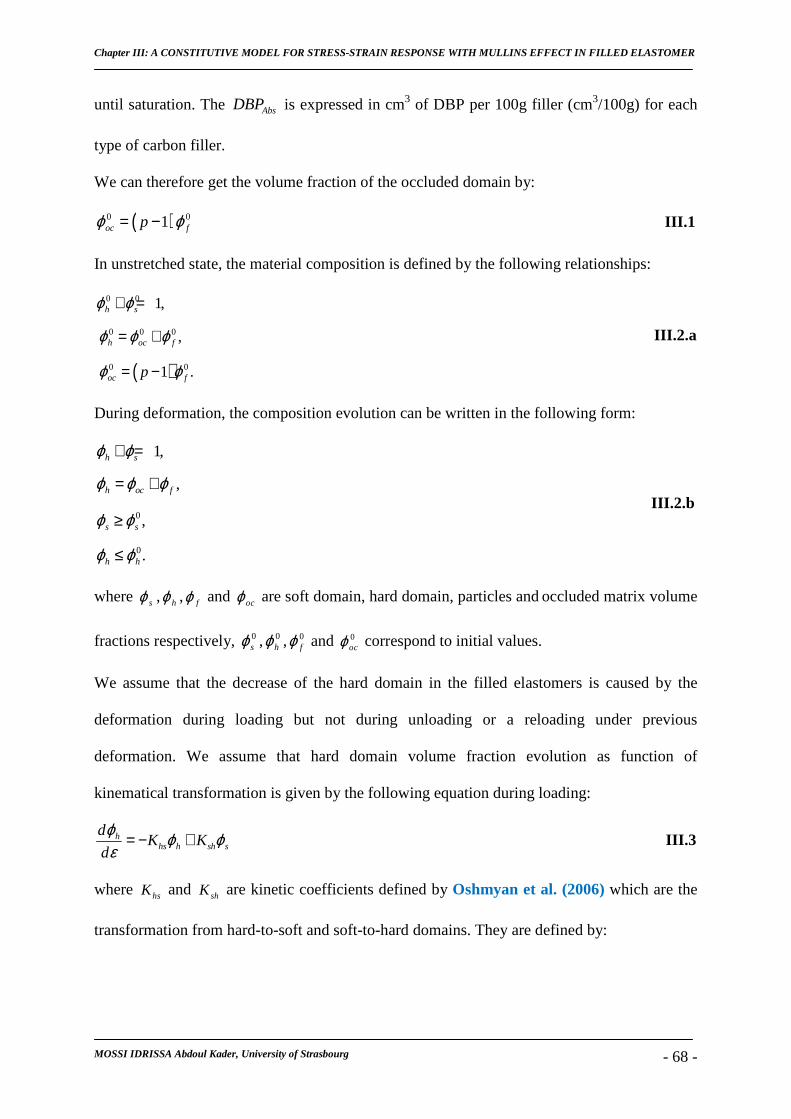
Chapter III: A CONSTITUTIVE MODEL FOR STRESS-STRAIN RESPONSE WITH MULLINS EFFECT IN FILLED ELASTOMER
MOSSI IDRISSA Abdoul Kader, University of Strasbourg - 68 -
until saturation. The AbsDBP is expressed in cm3 of DBP per 100g filler (cm3/100g) for each
type of carbon filler.
We can therefore get the volume fraction of the occluded domain by:
( )0 01oc fpϕ ϕ= − III.1
In unstretched state, the material composition is defined by the following relationships:
( )
0 0
0 0 0
0 0
1,
,
1 .
h s
h oc f
oc fp
ϕ ϕ
ϕ ϕ ϕ
ϕ ϕ
+ =
= +
= −
III.2.a
During deformation, the composition evolution can be written in the following form:
0
0
1,
,
,
.
h s
h oc f
s s
h h
ϕ ϕ
ϕ ϕ ϕ
ϕ ϕ
ϕ ϕ
+ =
= +
≥
≤
III.2.b
where sϕ , hϕ , fϕ and ocϕ are soft domain, hard domain, particles and occluded matrix volume
fractions respectively, 0sϕ , 0hϕ , 0
fϕ and 0ocϕ correspond to initial values.
We assume that the decrease of the hard domain in the filled elastomers is caused by the
deformation during loading but not during unloading or a reloading under previous
deformation. We assume that hard domain volume fraction evolution as function of
kinematical transformation is given by the following equation during loading:
hhs h sh s
dK K
d
ϕ ϕ ϕε
= − + III.3
where hsK and shK are kinetic coefficients defined by Oshmyan et al. (2006) which are the
transformation from hard-to-soft and soft-to-hard domains. They are defined by:
Chapter III: A CONSTITUTIVE MODEL FOR STRESS-STRAIN RESPONSE WITH MULLINS EFFECT IN FILLED ELASTOMER
MOSSI IDRISSA Abdoul Kader, University of Strasbourg - 69 -
( )
( )
0
0
exp exp
exp exp
hs hhs hs hs h
B
Bsh ssh sh sh s
B
UK k b
k Twith
k TUK k b
k T
γσ βσγβ
γσ βσ
−= − =
= + = − = −
III.4
where, hσ , sσ are stress in the hard and soft domain, hsU , shU are activation energies, 0hsk ,
0shk are pre-exponential coefficients and γ an activation volume. In fact, Mullins (1969)
observed that several days are needed to recover very slowly the stiffness which is decreased
by the softening.
Using the condition of 0shb = , because the recovery time constant is far greater than the time
period of interest here. We obtain a simplification of equation III.3 in as follows :
hhs h
dK
d
ϕ ϕε
= − III.5.a
After integration of equation III.5.a we get:
( )0 exph oc f h hsKϕ ϕ ϕ ϕ ε= + = − III.5.b
The following expressions are also deduced:
00 h hε ϕ ϕ→ ⇒ → III.5.c
0hε ϕ→ ∞ ⇒ → III.5.d
The last two equations III.5.c and III.5.d show that hard domain volume fraction is bounded
by upper and lower bound estimates. However, experimental conditions do not permit the
transformation of entire hard domains, particularly in the case of non-deformable particles
like carbon black for the applied stress. In this case, 0f fϕ ϕ= , and only the occluded matrix
becomes soft. Then:
h fε ϕ ϕ→ ∞ ⇒ → III.5.e
Using equations III.2.b and III.5.b , we obtain the soft domain evolution in the following
form:
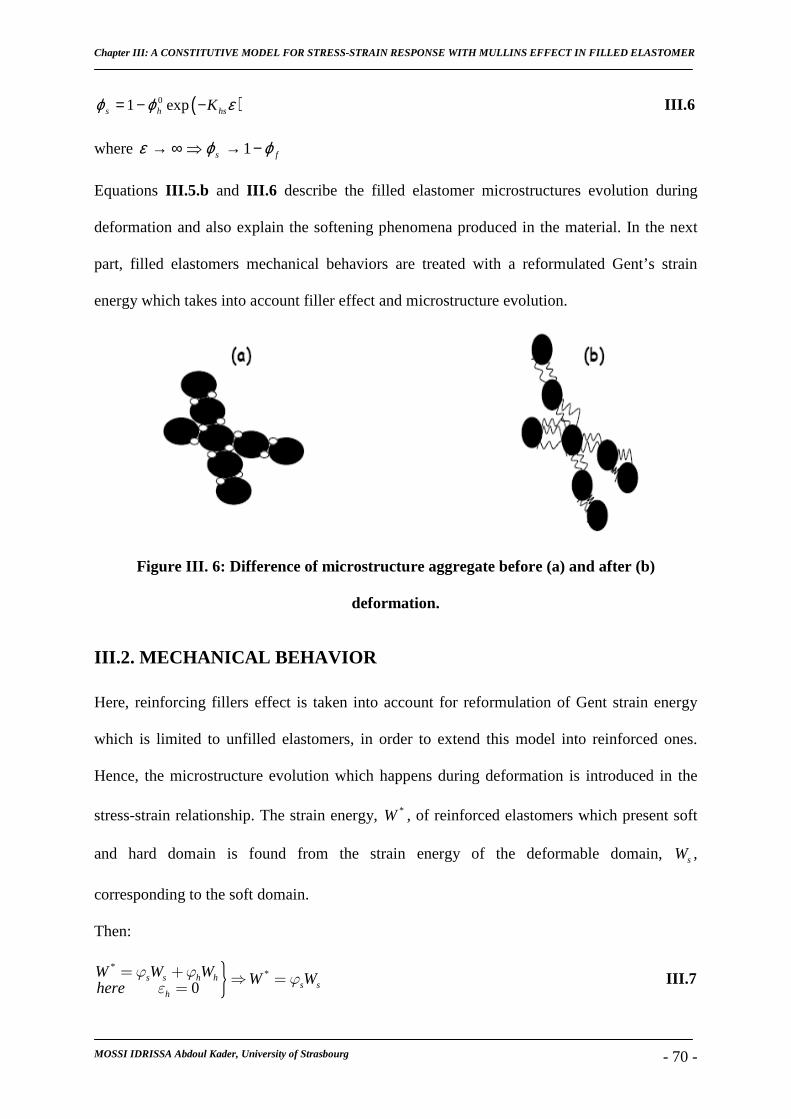
Chapter III: A CONSTITUTIVE MODEL FOR STRESS-STRAIN RESPONSE WITH MULLINS EFFECT IN FILLED ELASTOMER
MOSSI IDRISSA Abdoul Kader, University of Strasbourg - 70 -
( )01 exps h hsKϕ ϕ ε= − − III.6
where 1s fε ϕ ϕ→ ∞ ⇒ → −
Equations III.5.b and III.6 describe the filled elastomer microstructures evolution during
deformation and also explain the softening phenomena produced in the material. In the next
part, filled elastomers mechanical behaviors are treated with a reformulated Gent’s strain
energy which takes into account filler effect and microstructure evolution.
Figure III. 6: Difference of microstructure aggregate before (a) and after (b)
deformation.
III.2. MECHANICAL BEHAVIOR
Here, reinforcing fillers effect is taken into account for reformulation of Gent strain energy
which is limited to unfilled elastomers, in order to extend this model into reinforced ones.
Hence, the microstructure evolution which happens during deformation is introduced in the
stress-strain relationship. The strain energy, *W , of reinforced elastomers which present soft
and hard domain is found from the strain energy of the deformable domain, sW ,
corresponding to the soft domain.
Then:
*
*
0s s h h
s sh
W W W W Where
ϕ ϕ ϕε
= + ⇒ ==
III.7
Chapter III: A CONSTITUTIVE MODEL FOR STRESS-STRAIN RESPONSE WITH MULLINS EFFECT IN FILLED ELASTOMER
MOSSI IDRISSA Abdoul Kader, University of Strasbourg - 71 -
Using Gent model for the soft domain which is elastomeric material, we obtain the following
equation:
* 1 3ln 1
6m m
G s GS s mm
E IW W J
Jϕ ϕ
−= = − −
III.8
where GSW is the Gent strain energy for the soft domain and 1mI is the average first invariant
stretch of this domain.
In filled elastomers, the matrix is prevented from deforming uniformly by adhesion of the
rubber to the surface of the particles. Thus, macromolecule deformation is more complex than
in unfilled elastomers.
Mullins and Tobin (1965) introduced the notion of strain amplification strain to estimate the
uniaxial strain in the matrix for filled elastomers. This relation can be shown when the stress-
strain relationship for filled elastomers, ( ) ( )1 1mE E E Xσ ε λ λ= = − = − , and unfilled
elastomers, ( )1mEσ = Λ − , is considered for the same average stress. Where E and mE are
respectively filled and unfilled elastomer modulus. The amplified stretch expression is
therefore deduced as: ( )1 1X λΛ = − + , where λ is the apparent macroscopic axial stretch in
filled rubber and X the amplification factor.
Whereas, Govindjee and Simo (1991) proposed amplifying the total deformation gradient in
order to obtain the relation between the average volume strain quantities and the matrix
quantities. This can be written in the following form: ( ) ( )/ 1m f fF F Rϕ ϕ= − − where
F RU= , F and mF are respectively the average volume deformation gradients in the
material and in the matrix, R the rotation tensor and U the right stretching tensor.
As in the work of Bergstrom and Boyce (1999) or Qi and Boyce (2004), we propose to use
the amplification of the first invariant stretch 1I which corresponds to Mullins and Tobin
stretch amplification with an extension to a general three-dimensional deformation state:
Chapter III: A CONSTITUTIVE MODEL FOR STRESS-STRAIN RESPONSE WITH MULLINS EFFECT IN FILLED ELASTOMER
MOSSI IDRISSA Abdoul Kader, University of Strasbourg - 72 -
( )1 1 3 3mI X I= − + III.9
where 1I is the average first invariant stretch in the overall macroscopic of the composite
material. Using equation III.9 in the reinforced elastomers strain energy of equation III.8 , we
can deduce our proposed extension of the Gent strain energy for filled elastomers in this form:
( )1* 3ln 1
6m
G s mm
X IEW J
Jϕ
− = − −
III.10
where, ( ) ( )21 3.5 1 18 1s sX ϕ ϕ= + − + − is amplification factor used by Qi and Boyce (2004)
for filled elastomers. From the proposed strain energy for filled elastomers in equation III.10 ,
we get the corresponding Cauchy stress tensor:
( )*
13 3m m
G sm
E X JpI B
J X Iσ ϕ= − +
− − III.11
Where I and B are the unit tensor and the left Cauchy-Green stretch tensor ( )tB FF= .
In summary, the proposed constitutive model for stress-strain behavior of filled elastomers
can be summarized by the following constitutive relations:
( )( ) ( )
( )
*
1
2
0
0 0
3 3
1 3.5 1 18 1
1 exp
m mG s
m
s s
s h hs
h f
E X JpI B
J X I
X
K
p
σ ϕ
ϕ ϕϕ ϕ ε
ϕ ϕ
= − +− −
= + − + −
= − −
=
III.12
p was defined at page 67.
III.3. RESULTS
Equations III.12 which represent the constitutive model are used to predict numerical results
for stress-strain response of filled elastomers including soft domain evolution. In the first
application, we simulated loading-unloading in cyclic tension. The predicted stress-strain
response is shown in Figure III.7.a , the corresponding soft domain volume fraction evolution
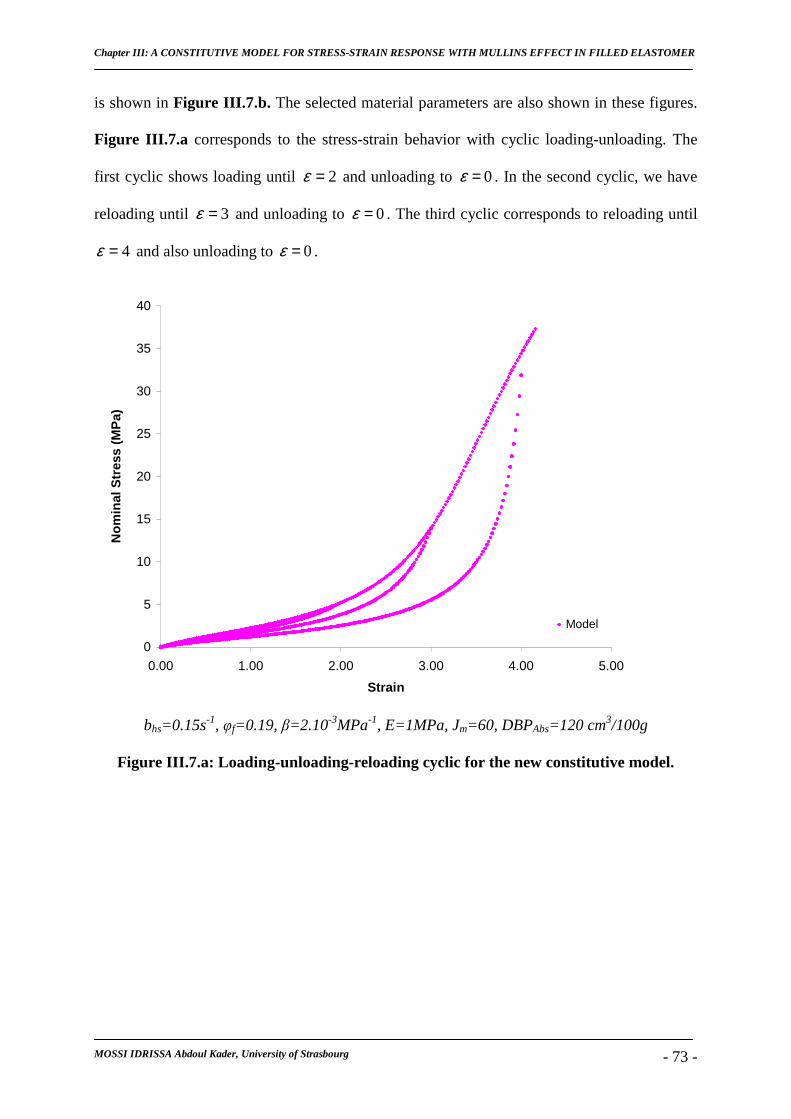
Chapter III: A CONSTITUTIVE MODEL FOR STRESS-STRAIN RESPONSE WITH MULLINS EFFECT IN FILLED ELASTOMER
MOSSI IDRISSA Abdoul Kader, University of Strasbourg - 73 -
is shown in Figure III.7.b. The selected material parameters are also shown in these figures.
Figure III.7.a corresponds to the stress-strain behavior with cyclic loading-unloading. The
first cyclic shows loading until 2ε = and unloading to 0ε = . In the second cyclic, we have
reloading until 3ε = and unloading to 0ε = . The third cyclic corresponds to reloading until
4ε = and also unloading to 0ε = .
0
5
10
15
20
25
30
35
40
0.00 1.00 2.00 3.00 4.00 5.00
Strain
No
min
al S
tres
s (M
Pa)
Model
bhs=0.15s-1, φf=0.19, β=2.10-3MPa-1, E=1MPa, Jm=60, DBPAbs=120 cm3/100g
Figure III.7.a: Loading-unloading-reloading cyclic for the new constitutive model.
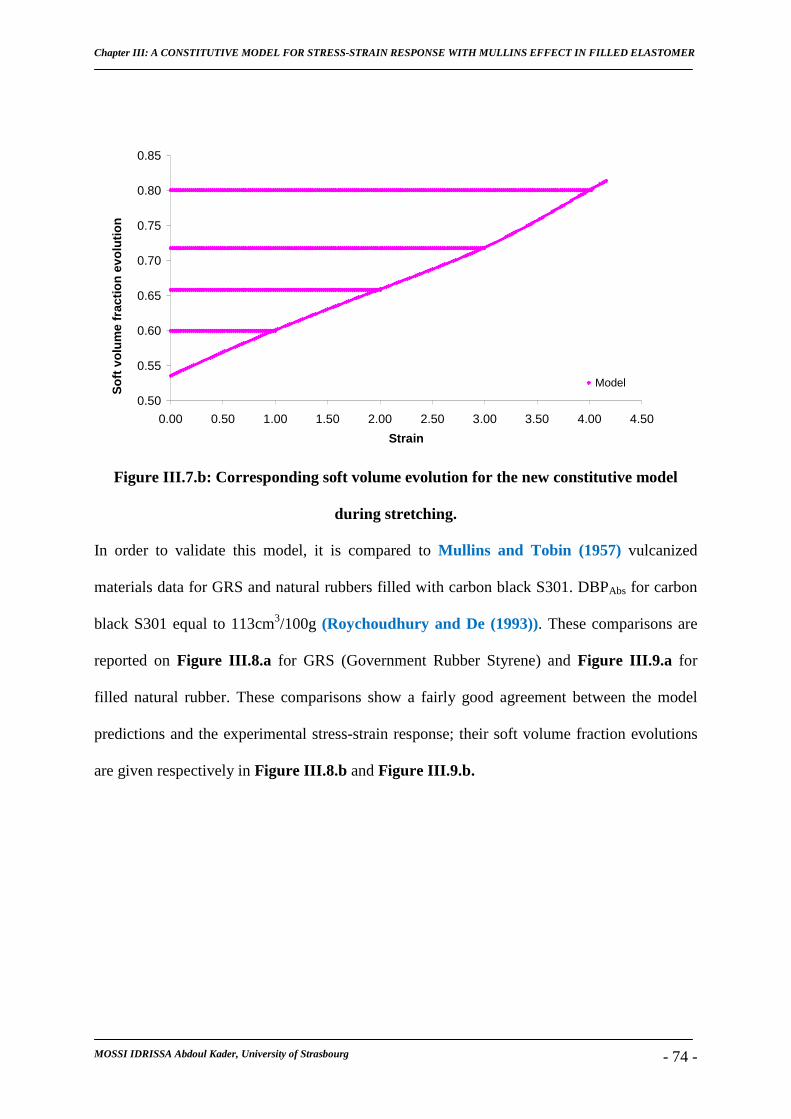
Chapter III: A CONSTITUTIVE MODEL FOR STRESS-STRAIN RESPONSE WITH MULLINS EFFECT IN FILLED ELASTOMER
MOSSI IDRISSA Abdoul Kader, University of Strasbourg - 74 -
0.50
0.55
0.60
0.65
0.70
0.75
0.80
0.85
0.00 0.50 1.00 1.50 2.00 2.50 3.00 3.50 4.00 4.50
Strain
So
ft v
olu
me
frac
tio
n e
volu
tio
n
Model
Figure III.7.b: Corresponding soft volume evolution for the new constitutive model
during stretching.
In order to validate this model, it is compared to Mullins and Tobin (1957) vulcanized
materials data for GRS and natural rubbers filled with carbon black S301. DBPAbs for carbon
black S301 equal to 113cm3/100g (Roychoudhury and De (1993)). These comparisons are
reported on Figure III.8.a for GRS (Government Rubber Styrene) and Figure III.9.a for
filled natural rubber. These comparisons show a fairly good agreement between the model
predictions and the experimental stress-strain response; their soft volume fraction evolutions
are given respectively in Figure III.8.b and Figure III.9.b.
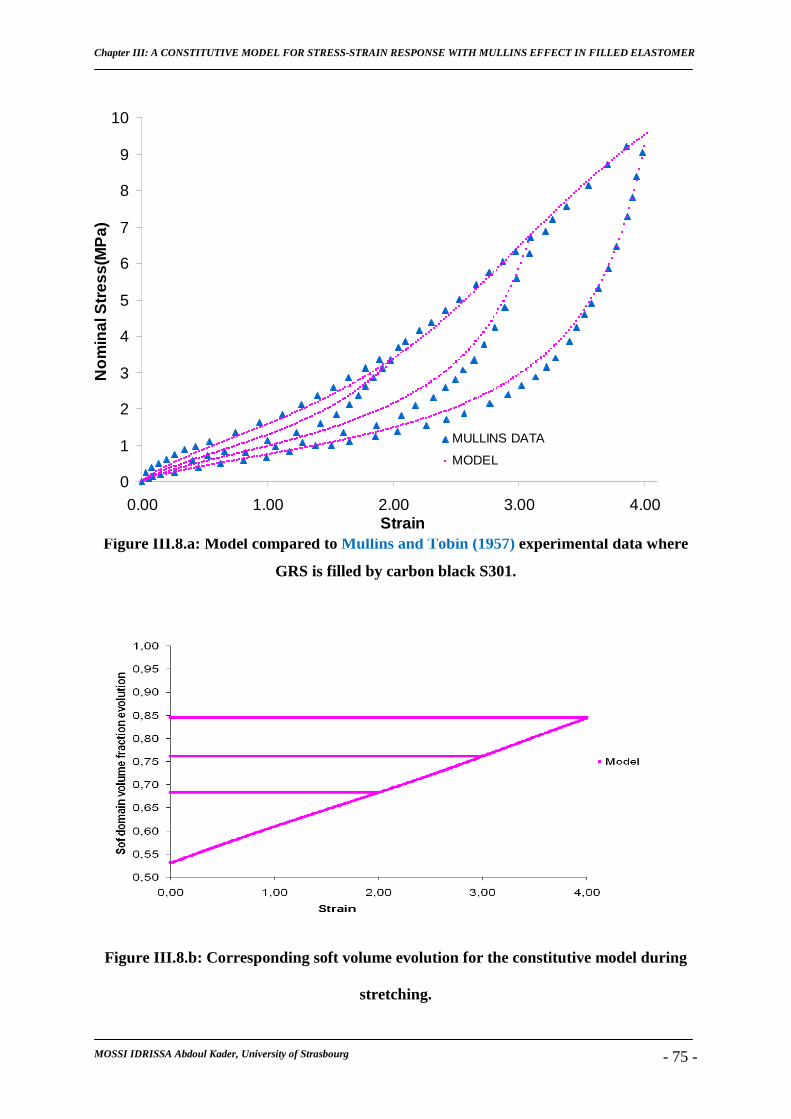
Chapter III: A CONSTITUTIVE MODEL FOR STRESS-STRAIN RESPONSE WITH MULLINS EFFECT IN FILLED ELASTOMER
MOSSI IDRISSA Abdoul Kader, University of Strasbourg - 75 -
bhs=0.18 s-1, φf=0.2, β=9.10-3 MPa-1, E=0,7MPa, Jm=56, DBPAbs=113 cm3/100g
Figure III.8.a: Model compared to Mullins and Tobin (1957) experimental data where
GRS is filled by carbon black S301.
Figure III.8.b: Corresponding soft volume evolution for the constitutive model during
stretching.
0
1
2
3
4
5
6
7
8
9
10
0.00 1.00 2.00 3.00 4.00Strain
No
min
al S
tres
s(M
Pa)
MULLINS DATA
MODEL

Chapter III: A CONSTITUTIVE MODEL FOR STRESS-STRAIN RESPONSE WITH MULLINS EFFECT IN FILLED ELASTOMER
MOSSI IDRISSA Abdoul Kader, University of Strasbourg - 76 -
0
1
2
3
4
5
6
7
0.00 0.50 1.00 1.50 2.00 2.50Strain
No
min
al S
tres
s(M
Pa)
MULLINS DATA
MODEL
bhs=0.18s-1, φf=0.19, β=4.10-2MPa-1, E=0.9MPa, Jm=28, DBPAbs=113 cm3/100g
Figure III.9.a: Model compared to Mullins and Tobin (1957) experimental data where
natural rubber is filled by carbon black S301.
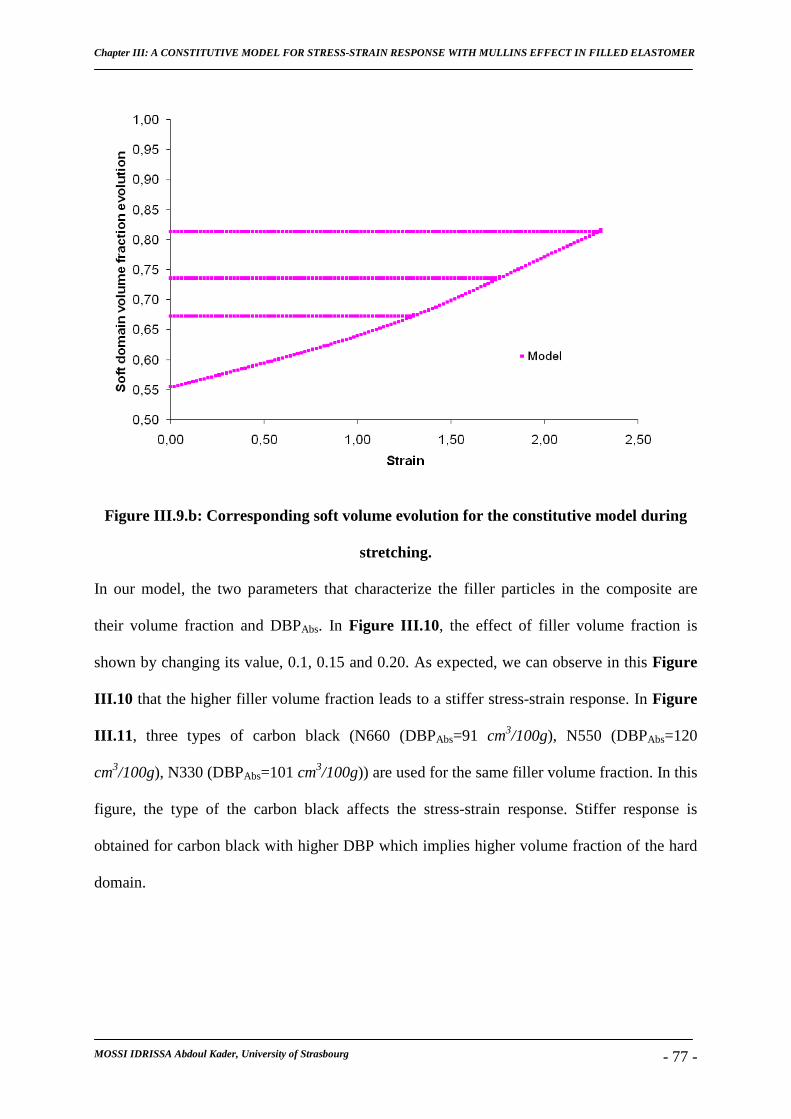
Chapter III: A CONSTITUTIVE MODEL FOR STRESS-STRAIN RESPONSE WITH MULLINS EFFECT IN FILLED ELASTOMER
MOSSI IDRISSA Abdoul Kader, University of Strasbourg - 77 -
Figure III.9.b: Corresponding soft volume evolution for the constitutive model during
stretching.
In our model, the two parameters that characterize the filler particles in the composite are
their volume fraction and DBPAbs. In Figure III.10 , the effect of filler volume fraction is
shown by changing its value, 0.1, 0.15 and 0.20. As expected, we can observe in this Figure
III.10 that the higher filler volume fraction leads to a stiffer stress-strain response. In Figure
III.11 , three types of carbon black (N660 (DBPAbs=91 cm3/100g), N550 (DBPAbs=120
cm3/100g), N330 (DBPAbs=101 cm3/100g)) are used for the same filler volume fraction. In this
figure, the type of the carbon black affects the stress-strain response. Stiffer response is
obtained for carbon black with higher DBP which implies higher volume fraction of the hard
domain.
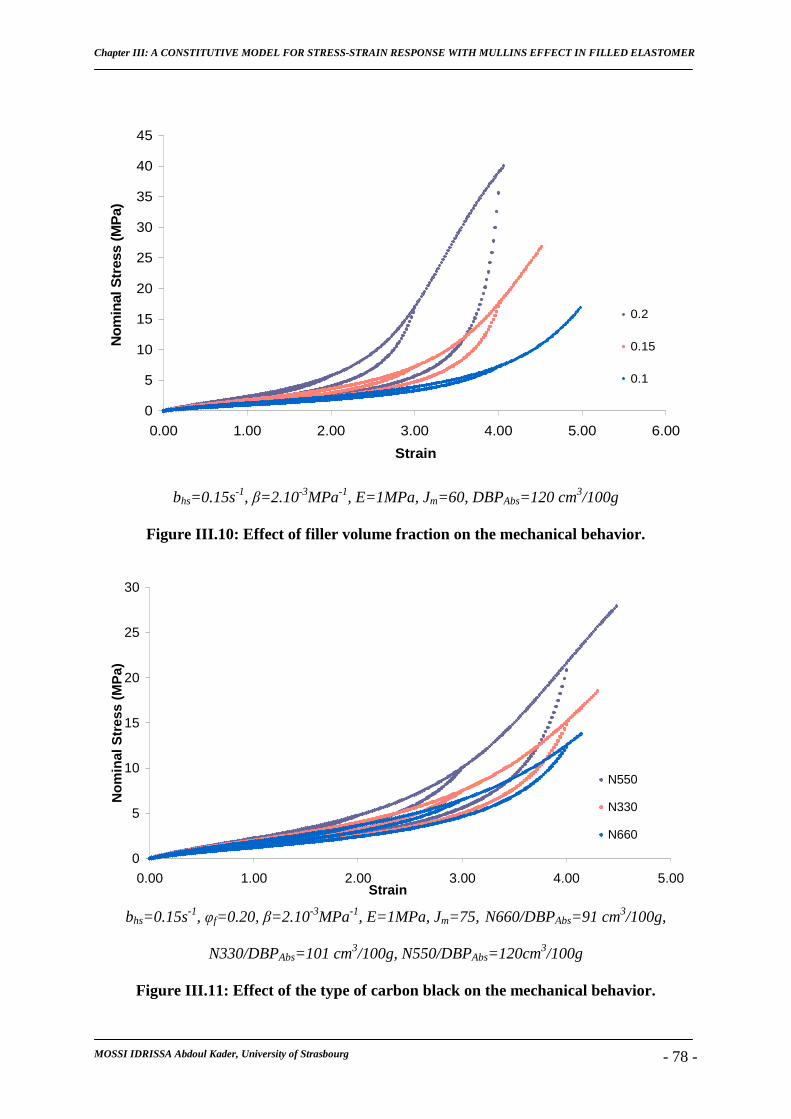
Chapter III: A CONSTITUTIVE MODEL FOR STRESS-STRAIN RESPONSE WITH MULLINS EFFECT IN FILLED ELASTOMER
MOSSI IDRISSA Abdoul Kader, University of Strasbourg - 78 -
0
5
10
15
20
25
30
35
40
45
0.00 1.00 2.00 3.00 4.00 5.00 6.00
Strain
No
min
al S
tres
s (M
Pa)
0.2
0.15
0.1
bhs=0.15s-1, β=2.10-3MPa-1, E=1MPa, Jm=60, DBPAbs=120 cm3/100g
Figure III.10: Effect of filler volume fraction on the mechanical behavior.
0
5
10
15
20
25
30
0.00 1.00 2.00 3.00 4.00 5.00Strain
No
min
al S
tres
s (M
Pa)
N550
N330
N660
bhs=0.15s-1, φf=0.20, β=2.10-3MPa-1, E=1MPa, Jm=75, N660/DBPAbs=91 cm3/100g,
N330/DBPAbs=101 cm3/100g, N550/DBPAbs=120cm3/100g
Figure III.11: Effect of the type of carbon black on the mechanical behavior.
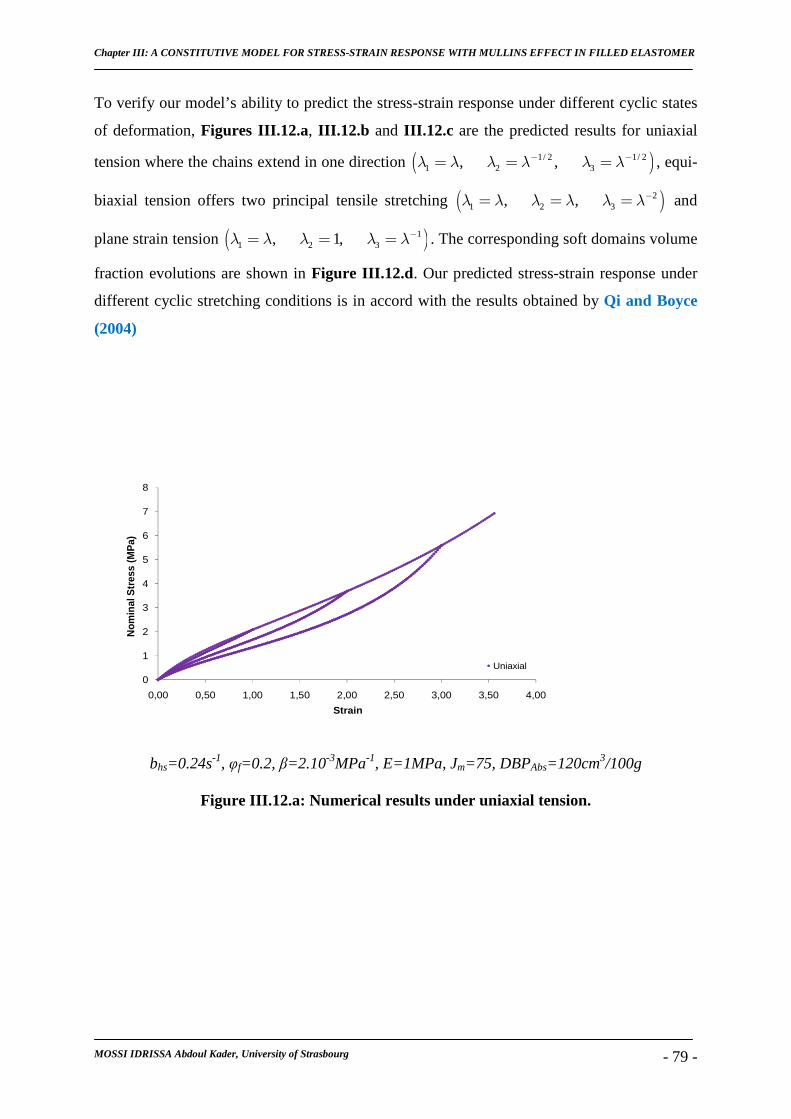
Chapter III: A CONSTITUTIVE MODEL FOR STRESS-STRAIN RESPONSE WITH MULLINS EFFECT IN FILLED ELASTOMER
MOSSI IDRISSA Abdoul Kader, University of Strasbourg - 79 -
To verify our model’s ability to predict the stress-strain response under different cyclic states
of deformation, Figures III.12.a, III.12.b and III.12.c are the predicted results for uniaxial
tension where the chains extend in one direction ( )1/ 2 1/ 21 2 3, ,λ λ λ λ λ λ− −= = = , equi-
biaxial tension offers two principal tensile stretching ( )21 2 3, ,λ λ λ λ λ λ−= = = and
plane strain tension ( )11 2 3, 1,λ λ λ λ λ−= = = . The corresponding soft domains volume
fraction evolutions are shown in Figure III.12.d . Our predicted stress-strain response under
different cyclic stretching conditions is in accord with the results obtained by Qi and Boyce
(2004)
0
1
2
3
4
5
6
7
8
0,00 0,50 1,00 1,50 2,00 2,50 3,00 3,50 4,00
Nom
inal
Str
ess
(MP
a)
Strain
Uniaxial
bhs=0.24s-1, φf=0.2, β=2.10-3MPa-1, E=1MPa, Jm=75, DBPAbs=120cm3/100g
Figure III.12.a: Numerical results under uniaxial tension.
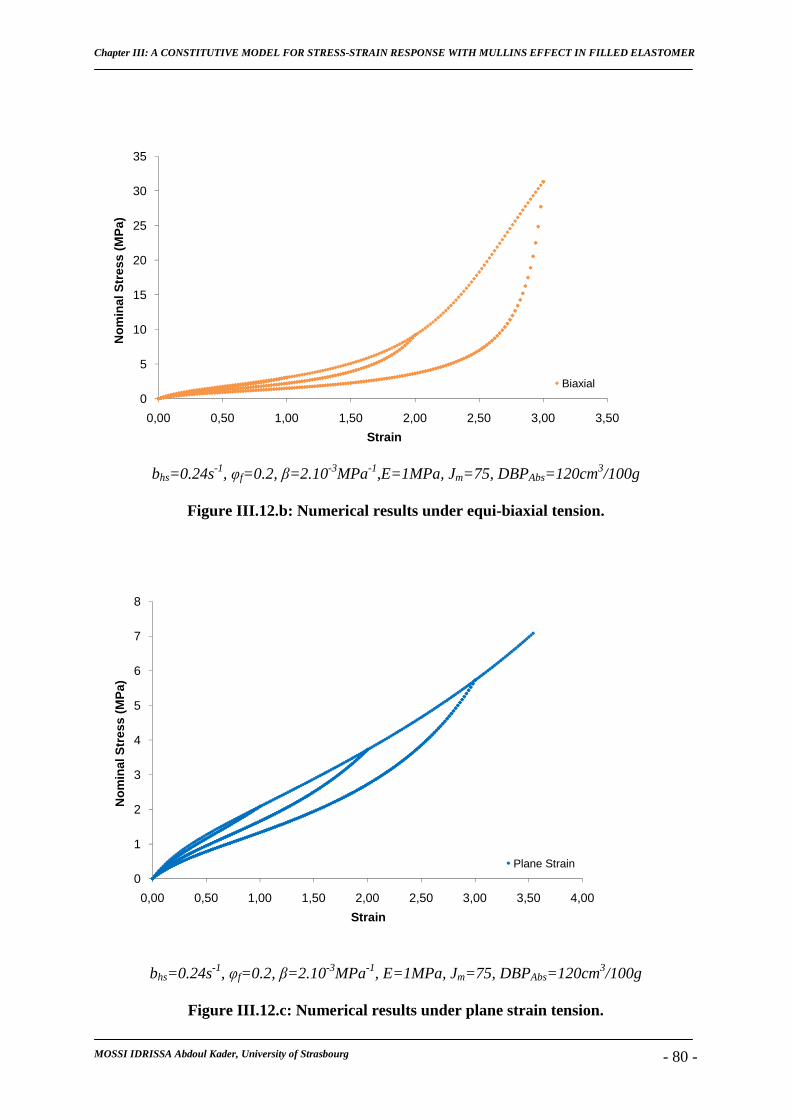
Chapter III: A CONSTITUTIVE MODEL FOR STRESS-STRAIN RESPONSE WITH MULLINS EFFECT IN FILLED ELASTOMER
MOSSI IDRISSA Abdoul Kader, University of Strasbourg - 80 -
0
5
10
15
20
25
30
35
0,00 0,50 1,00 1,50 2,00 2,50 3,00 3,50
No
min
al S
tres
s (M
Pa)
Strain
Biaxial
bhs=0.24s-1, φf=0.2, β=2.10-3MPa-1,E=1MPa, Jm=75, DBPAbs=120cm3/100g
Figure III.12.b: Numerical results under equi-biaxial tension.
0
1
2
3
4
5
6
7
8
0,00 0,50 1,00 1,50 2,00 2,50 3,00 3,50 4,00
No
min
al S
tres
s (M
Pa)
Strain
Plane Strain
bhs=0.24s-1, φf=0.2, β=2.10-3MPa-1, E=1MPa, Jm=75, DBPAbs=120cm3/100g
Figure III.12.c: Numerical results under plane strain tension.
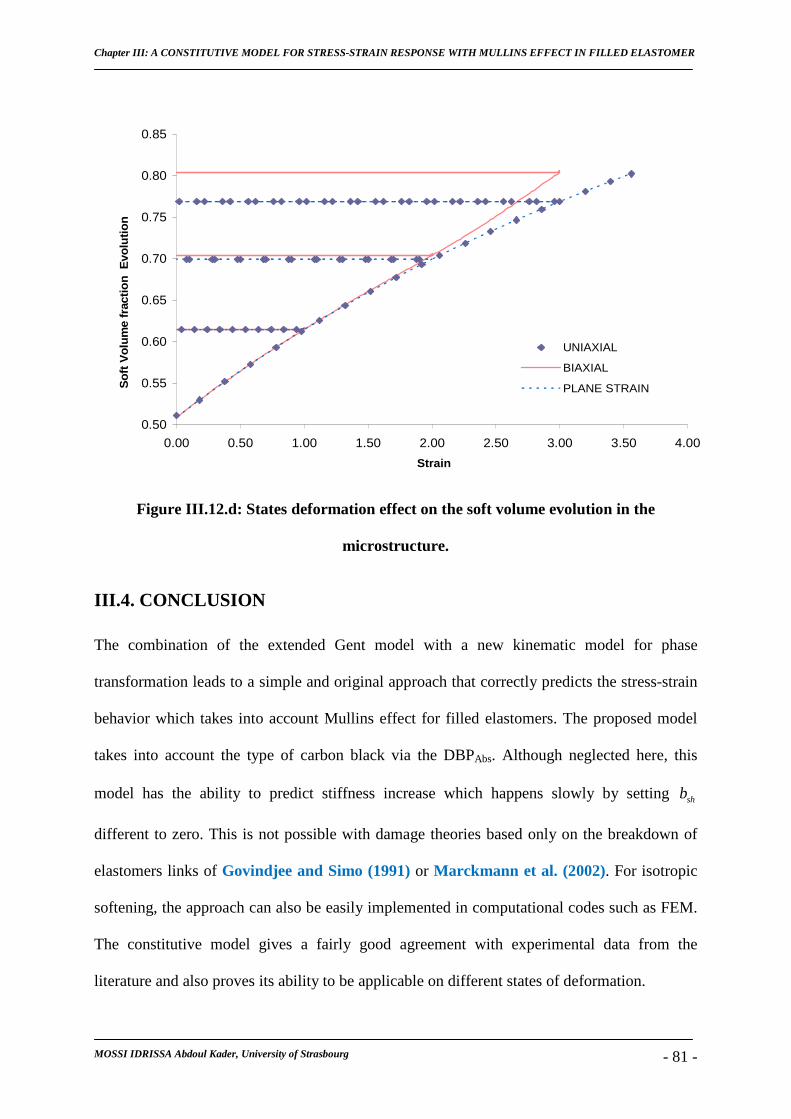
Chapter III: A CONSTITUTIVE MODEL FOR STRESS-STRAIN RESPONSE WITH MULLINS EFFECT IN FILLED ELASTOMER
MOSSI IDRISSA Abdoul Kader, University of Strasbourg - 81 -
0.50
0.55
0.60
0.65
0.70
0.75
0.80
0.85
0.00 0.50 1.00 1.50 2.00 2.50 3.00 3.50 4.00
Strain
So
ft V
olu
me
frac
tio
n E
volu
tio
n
UNIAXIAL
BIAXIAL
PLANE STRAIN
Figure III.12.d: States deformation effect on the soft volume evolution in the
microstructure.
III.4. CONCLUSION
The combination of the extended Gent model with a new kinematic model for phase
transformation leads to a simple and original approach that correctly predicts the stress-strain
behavior which takes into account Mullins effect for filled elastomers. The proposed model
takes into account the type of carbon black via the DBPAbs. Although neglected here, this
model has the ability to predict stiffness increase which happens slowly by setting shb
different to zero. This is not possible with damage theories based only on the breakdown of
elastomers links of Govindjee and Simo (1991) or Marckmann et al. (2002). For isotropic
softening, the approach can also be easily implemented in computational codes such as FEM.
The constitutive model gives a fairly good agreement with experimental data from the
literature and also proves its ability to be applicable on different states of deformation.
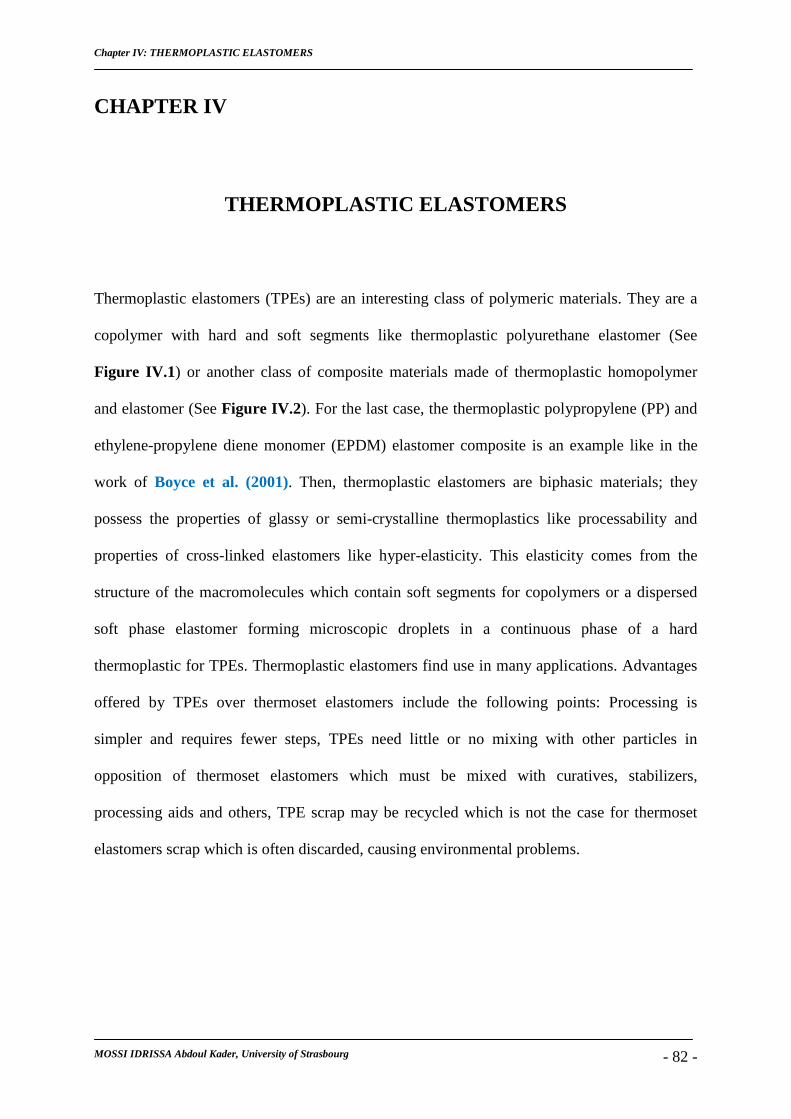
Chapter IV: THERMOPLASTIC ELASTOMERS
MOSSI IDRISSA Abdoul Kader, University of Strasbourg - 82 -
CHAPTER IV
THERMOPLASTIC ELASTOMERS
Thermoplastic elastomers (TPEs) are an interesting class of polymeric materials. They are a
copolymer with hard and soft segments like thermoplastic polyurethane elastomer (See
Figure IV.1) or another class of composite materials made of thermoplastic homopolymer
and elastomer (See Figure IV.2). For the last case, the thermoplastic polypropylene (PP) and
ethylene-propylene diene monomer (EPDM) elastomer composite is an example like in the
work of Boyce et al. (2001). Then, thermoplastic elastomers are biphasic materials; they
possess the properties of glassy or semi-crystalline thermoplastics like processability and
properties of cross-linked elastomers like hyper-elasticity. This elasticity comes from the
structure of the macromolecules which contain soft segments for copolymers or a dispersed
soft phase elastomer forming microscopic droplets in a continuous phase of a hard
thermoplastic for TPEs. Thermoplastic elastomers find use in many applications. Advantages
offered by TPEs over thermoset elastomers include the following points: Processing is
simpler and requires fewer steps, TPEs need little or no mixing with other particles in
opposition of thermoset elastomers which must be mixed with curatives, stabilizers,
processing aids and others, TPE scrap may be recycled which is not the case for thermoset
elastomers scrap which is often discarded, causing environmental problems.
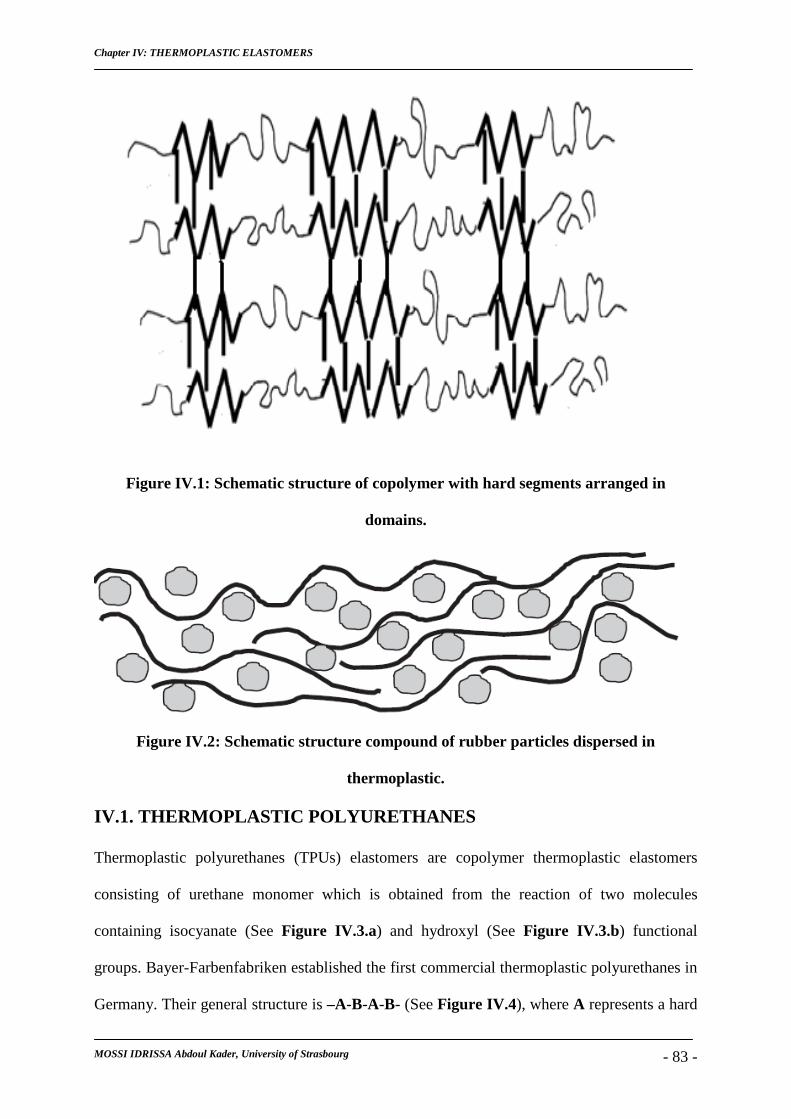
Chapter IV: THERMOPLASTIC ELASTOMERS
MOSSI IDRISSA Abdoul Kader, University of Strasbourg - 83 -
Figure IV.1: Schematic structure of copolymer with hard segments arranged in
domains.
Figure IV.2: Schematic structure compound of rubber particles dispersed in
thermoplastic.
IV.1. THERMOPLASTIC POLYURETHANES
Thermoplastic polyurethanes (TPUs) elastomers are copolymer thermoplastic elastomers
consisting of urethane monomer which is obtained from the reaction of two molecules
containing isocyanate (See Figure IV.3.a) and hydroxyl (See Figure IV.3.b) functional
groups. Bayer-Farbenfabriken established the first commercial thermoplastic polyurethanes in
Germany. Their general structure is –A-B-A-B- (See Figure IV.4), where A represents a hard
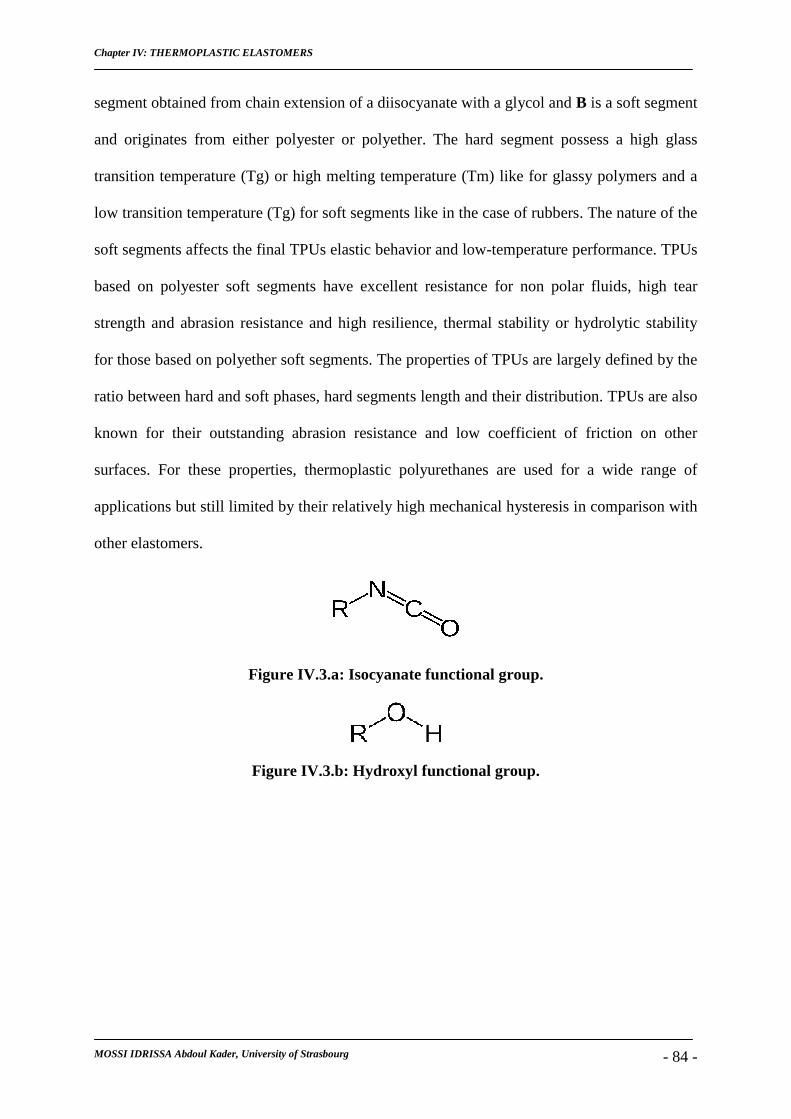
Chapter IV: THERMOPLASTIC ELASTOMERS
MOSSI IDRISSA Abdoul Kader, University of Strasbourg - 84 -
segment obtained from chain extension of a diisocyanate with a glycol and B is a soft segment
and originates from either polyester or polyether. The hard segment possess a high glass
transition temperature (Tg) or high melting temperature (Tm) like for glassy polymers and a
low transition temperature (Tg) for soft segments like in the case of rubbers. The nature of the
soft segments affects the final TPUs elastic behavior and low-temperature performance. TPUs
based on polyester soft segments have excellent resistance for non polar fluids, high tear
strength and abrasion resistance and high resilience, thermal stability or hydrolytic stability
for those based on polyether soft segments. The properties of TPUs are largely defined by the
ratio between hard and soft phases, hard segments length and their distribution. TPUs are also
known for their outstanding abrasion resistance and low coefficient of friction on other
surfaces. For these properties, thermoplastic polyurethanes are used for a wide range of
applications but still limited by their relatively high mechanical hysteresis in comparison with
other elastomers.
Figure IV.3.a: Isocyanate functional group.
Figure IV.3.b: Hydroxyl functional group.
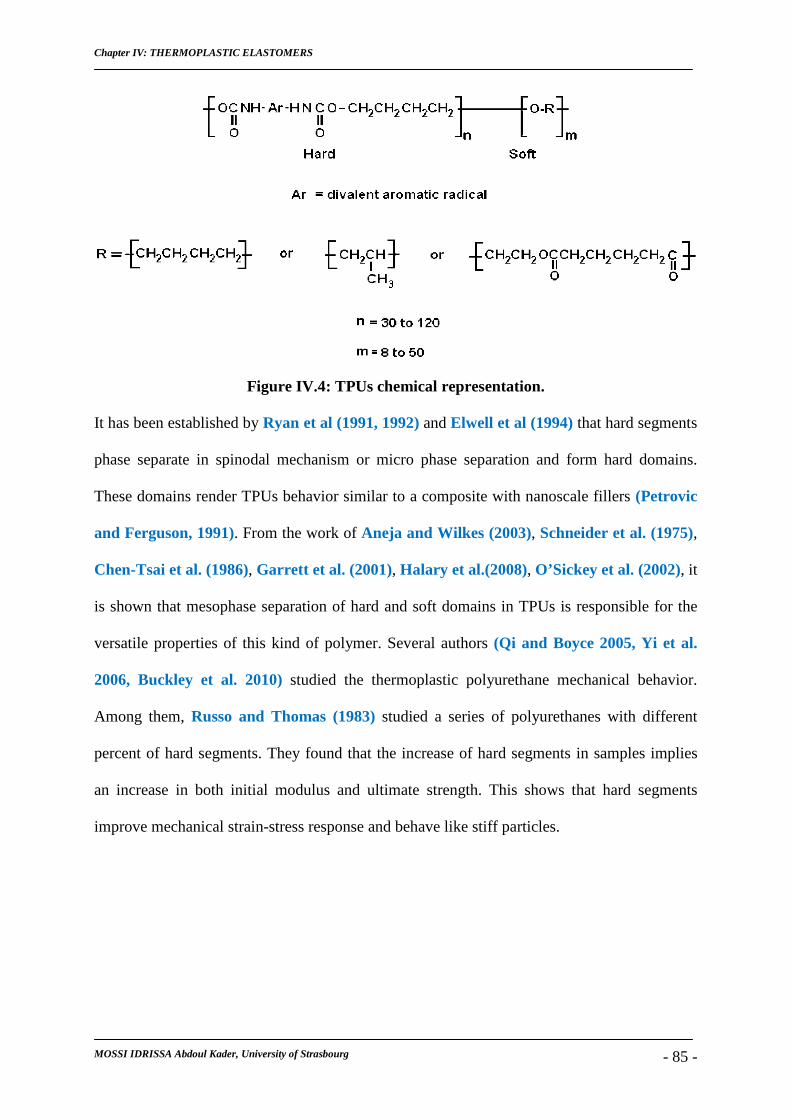
Chapter IV: THERMOPLASTIC ELASTOMERS
MOSSI IDRISSA Abdoul Kader, University of Strasbourg - 85 -
Figure IV.4: TPUs chemical representation.
It has been established by Ryan et al (1991, 1992) and Elwell et al (1994) that hard segments
phase separate in spinodal mechanism or micro phase separation and form hard domains.
These domains render TPUs behavior similar to a composite with nanoscale fillers (Petrovic
and Ferguson, 1991). From the work of Aneja and Wilkes (2003), Schneider et al. (1975),
Chen-Tsai et al. (1986), Garrett et al. (2001), Halary et al.(2008), O’Sickey et al. (2002), it
is shown that mesophase separation of hard and soft domains in TPUs is responsible for the
versatile properties of this kind of polymer. Several authors (Qi and Boyce 2005, Yi et al.
2006, Buckley et al. 2010) studied the thermoplastic polyurethane mechanical behavior.
Among them, Russo and Thomas (1983) studied a series of polyurethanes with different
percent of hard segments. They found that the increase of hard segments in samples implies
an increase in both initial modulus and ultimate strength. This shows that hard segments
improve mechanical strain-stress response and behave like stiff particles.
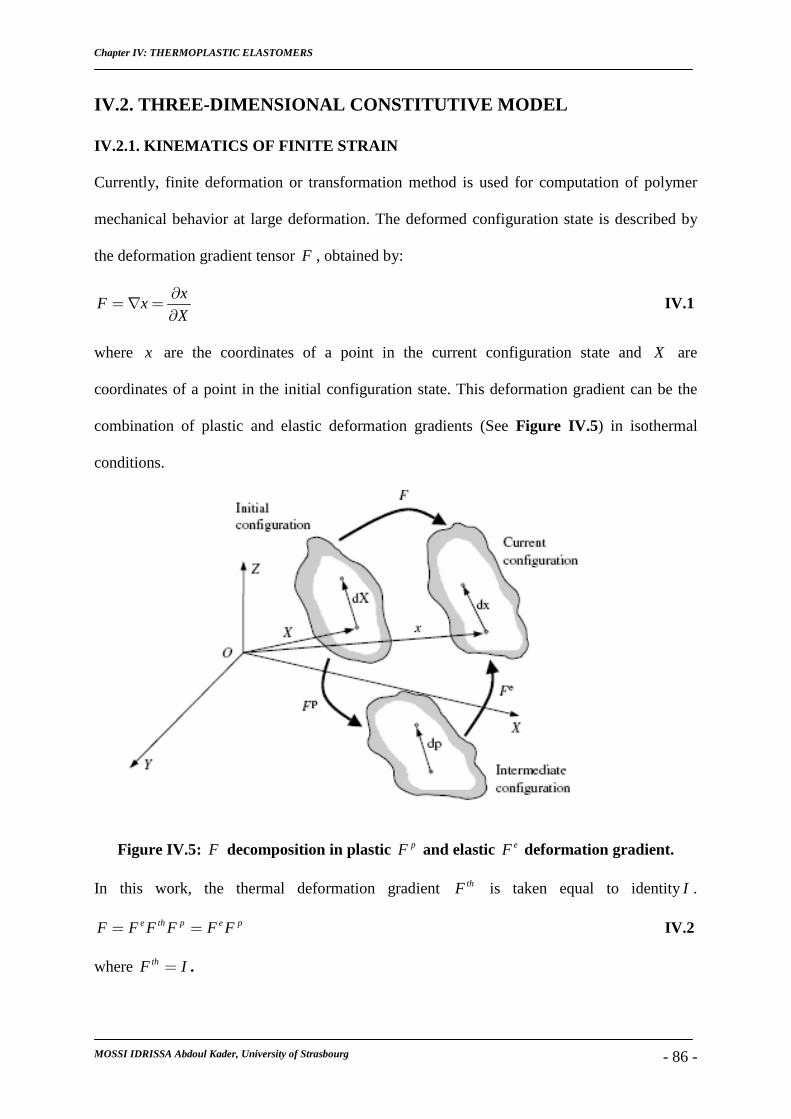
Chapter IV: THERMOPLASTIC ELASTOMERS
MOSSI IDRISSA Abdoul Kader, University of Strasbourg - 86 -
IV.2. THREE-DIMENSIONAL CONSTITUTIVE MODEL
IV.2.1. KINEMATICS OF FINITE STRAIN
Currently, finite deformation or transformation method is used for computation of polymer
mechanical behavior at large deformation. The deformed configuration state is described by
the deformation gradient tensor F , obtained by:
xF x
X
∂= ∇ =
∂ IV.1
where x are the coordinates of a point in the current configuration state and X are
coordinates of a point in the initial configuration state. This deformation gradient can be the
combination of plastic and elastic deformation gradients (See Figure IV.5) in isothermal
conditions.
Figure IV.5: F decomposition in plastic pF and elastic eF deformation gradient.
In this work, the thermal deformation gradient thF is taken equal to identityI .
e th p e pF F F F F F= = IV.2
where thF I= .
Chapter IV: THERMOPLASTIC ELASTOMERS
MOSSI IDRISSA Abdoul Kader, University of Strasbourg - 87 -
The deformation gradient tensor can also be given in polar decomposition which implies that
any non-singular second-order tensor can be decomposed uniquely into the product of an
orthogonal tensor (rotation) and a symmetric tensor (stretch). Hence, the elastic deformation
gradient eF is decomposed in terms of the elastic stretch tensors eV or eU respectively left or
right and the elastic rotation tensor eR in order to separate out stretch and rotation.
e e e e eF V R R U= = IV.3
The velocity field of the material varies spatially. The increment in velocity dv , occurring
over an incremental change in position dx and can be written in the deformed configuration
as:
vdv dx
x
∂=
∂ IV.4
The velocity gradient tensor describes the spatial rate of change of the velocity and is given in
the following form:
vL
x
∂=
∂ IV.5
The velocity gradient can be also written in function of the time rate and the inverse of the
deformation gradient:
x v v xF LF
t X X x X
• ∂ ∂ ∂ ∂ ∂= = = = ∂ ∂ ∂ ∂ ∂ IV.6
Hence:
1L F F•
−= IV.7
The velocity gradient can be decomposed into symmetric and anti-symmetric part:
L D W= + IV.8
The symmetric part is called the rate deformation D and the anti-symmetric part the
continuum spin W . These tensors are written in function of velocity gradient in the following
form:
Chapter IV: THERMOPLASTIC ELASTOMERS
MOSSI IDRISSA Abdoul Kader, University of Strasbourg - 88 -
( )1
2TD L L= + IV.9
( )1
2TW L L= − IV.10
IV.2.2. CONSTITUTIVE MODEL
In TPEs or TPUs network structure, we have a rubbery and glassy phase in the same material.
The glassy phase, which is hard, is also acting like reinforcing fillers where the increase of
hard segments produces modulus rise (Petrovic and Ferguson, 1991). Then, a constitutive
model for these materials must take into account behavior of the two phases and also the
relationship between them. Hence, we propose a constitutive model with parallel branches
corresponding to hyperelastic and elastic-viscoplastic behaviors. A one dimensional model
which is constituted by a linear elastic spring ( )2E for the hyperelasticity behavior part and
spring ( )0E in series with Kelvin model (See Figure I.6) for the elastic-viscoplastic part. In
this Kelvin model, a nonlinear viscoplastic dashpot ( )1µ capturing the rate and temperature is
in parallel with a spring ( )1E . The stresses across the two branches are 1σ for the hyperelastic
and 2σ for elastic-viscoplastic branch and the overall stress in the rheological model is σ
(See Figure IV.6).
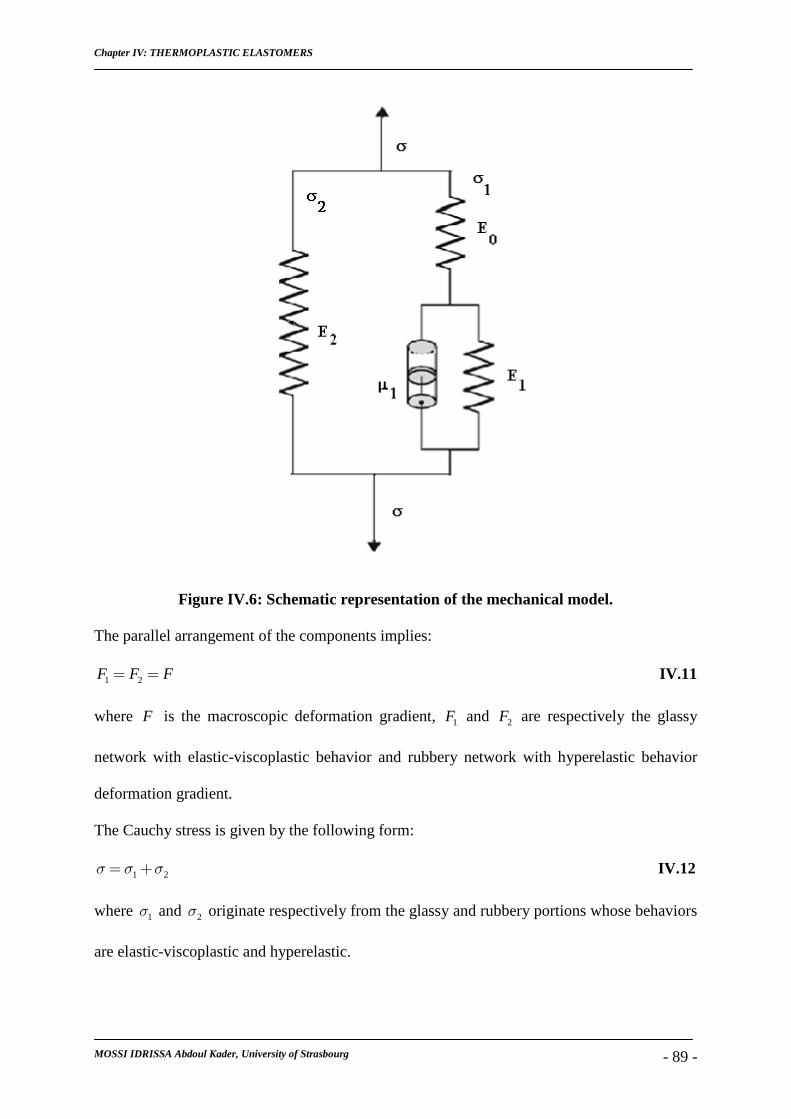
Chapter IV: THERMOPLASTIC ELASTOMERS
MOSSI IDRISSA Abdoul Kader, University of Strasbourg - 89 -
Figure IV.6: Schematic representation of the mechanical model.
The parallel arrangement of the components implies:
1 2F F F= = IV.11
where F is the macroscopic deformation gradient, 1F and 2F are respectively the glassy
network with elastic-viscoplastic behavior and rubbery network with hyperelastic behavior
deformation gradient.
The Cauchy stress is given by the following form:
1 2σ σ σ= + IV.12
where 1σ and 2σ originate respectively from the glassy and rubbery portions whose behaviors
are elastic-viscoplastic and hyperelastic.
Chapter IV: THERMOPLASTIC ELASTOMERS
MOSSI IDRISSA Abdoul Kader, University of Strasbourg - 90 -
IV.2.2.1. ELASTIC-VISCOPLASTIC OF THE GLASSY NETWORK BEHAVIOR
Cauchy stress 1σ in the hard domain is obtained in the following form:
1 11
lndet
e ehe
L VV
ϕσ = IV.13
where eL is the fourth-order tensor modulus of elastic constants. 1eV is the left stretch tensor
of the elastic deformation gradient tensor 1eF and hϕ the current hard domain volume fraction
in the thermoplastic polyurethane. It decreases during stress and is given by equation III.5.b
( )( )0 exph h hsKϕ ϕ ε= − .
The elastic-viscoplastic deformation gradient 1F can be decomposed into contribution of
elastic 1eF and viscoplastic 1
pF deformation gradient.
Then:
1 1 1e pF F F= IV.14
The corresponding decomposition of the velocity gradient is:
1 1 1 11 1 1 1 1 1 1 1 1
e e e p p eL F F F F F F F F• ••
− − − −= = + IV.15
The velocity of the viscoplastic element is obtained in this form:
11 1 1 1 1p p p p pL F F D W
•−= = + IV.16
Here, we take 1 0pW = with no loss in generality as shown by Boyce et al (1988). The rate of
deformation pD is given in the following form:
1p pD Nγ= ɺ IV.17
N is a normalized tensor aligned with the deviatoric driving stress state and pγɺ denotes the
viscoplastic shear strain rate of the viscoplastic element ( )1µ . These are given in the
following equations:
Chapter IV: THERMOPLASTIC ELASTOMERS
MOSSI IDRISSA Abdoul Kader, University of Strasbourg - 91 -
*1
2N σ
τ
′= IV.18
where τ is the equivalent shear stress and *σ′ is the deviatoric form of the driving stress.
Argon and cooperative model are used separately for the viscoplastic shear strain rate
evolution to show our model ability for the two:
0 exp 1p p
B
G
k T S
τγ γ
∆ = − − ɺ ɺ (Argon’s model) Argon, (1973a, 1973b) IV.19.a
( )0 exp sinh
2p p n
B B
S VH
k T k T
τγ γ
−∆ = − ɺ ɺ (Cooperative model) Richeton et al (2005) IV.19.b
where 0γɺ is the pre-exponential shear rate factor, G∆ is the zero stress level activation
energy, τ is the effective equivalent shear stress, H∆ is the activation energy of the
secondary relaxation of mechanical significance, V is the shear activation volume and S is
the internal stress which evolves in the following form:
1 p
ss
SS h
Sγ
= − ɺ ɺ IV.20
The effective equivalent shear stress τ is obtained from the tensorial difference between the
Cauchy stress 1σ and the network stress Nσ from the spring ( )1E .
1/ 2* *1
2τ σ σ
′ ′ = ⋅
IV.21
where:
*1 1 1
1eT e N eT eR F F RJ
σ σ σ = −
IV.22
where *σ is the driving stress state. This portion of the Cauchy stress 1σ continues to activate
the plastic flow and *σ ′ corresponds to its deviatoric part. Nσ is the network stress. This
portion of the Cauchy stress 1σ captures the effect of orientation-induced strain hardening:
Chapter IV: THERMOPLASTIC ELASTOMERS
MOSSI IDRISSA Abdoul Kader, University of Strasbourg - 92 -
( )11
1 13 3N m
m
JEB
J Iσ =
− − IV.23
where 1
3p pT I
B F F I= −
IV.2.2.2. HYPERELASTIC OF THE RUBBERY NETWORK BEHAVIOR
For the hyperelastic network mechanical behavior, we use Gent model for filled elastomers
which is developed in chapter III. Because the hard segments act as stiff filler, the material
can be considered as composite (Petrovic and Ferguson, 1991, Qi and Boyce, 2005). Then,
TPU can be modeled as elastomer reinforced by stiff particles. This implies the introduction
of amplified stretch and softening effect in the TPU network behavior. Hence, we have the
following expression for the stress in rubbery network:
( ) ( )22
22 1
13 3
mh
m
JE XB pI
J X Iσ ϕ= − −
− − IV.24
where TB FF=
IV.2.2.3. NUMERICAL IMPLEMENTATION
At time zero, the deformation gradient tensors are all unit tensor I and the velocity gradient
L is given as a deformation constraint. The stress and strain of the material are equal to zero.
The update of the model between the time t and t t+ ∆ is presented in Figure IV.7.
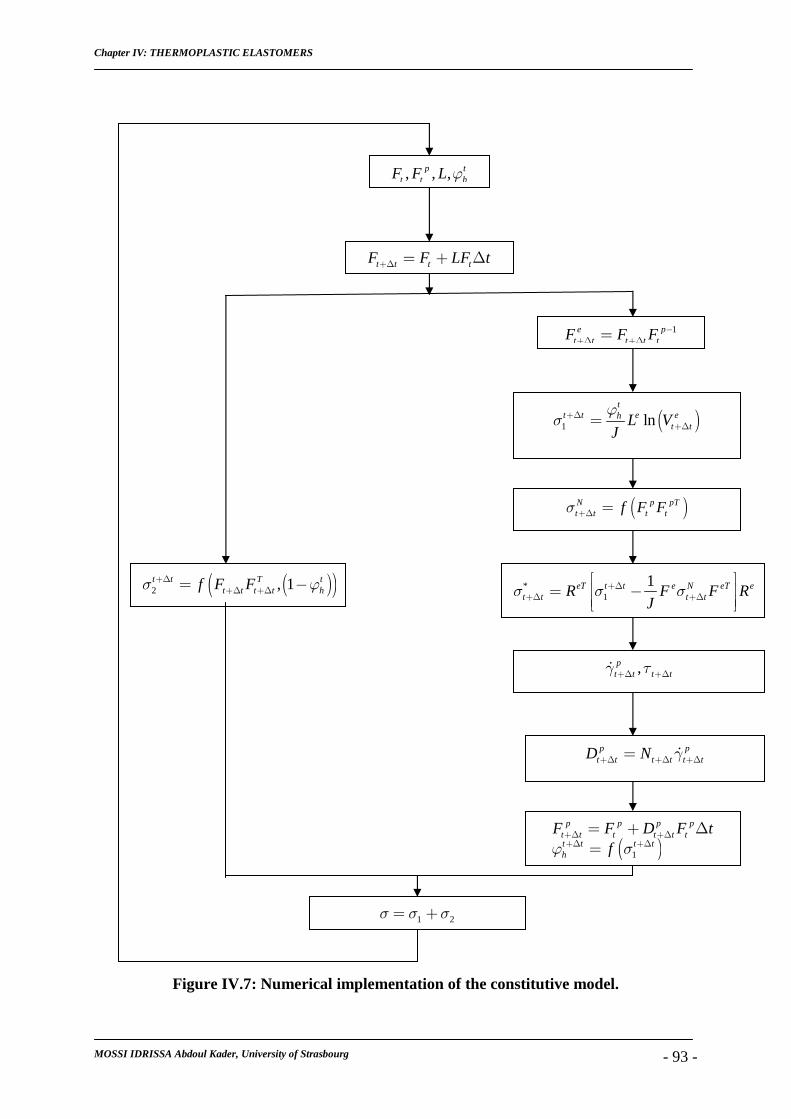
Chapter IV: THERMOPLASTIC ELASTOMERS
MOSSI IDRISSA Abdoul Kader, University of Strasbourg - 93 -
Figure IV.7: Numerical implementation of the constitutive model.
, , ,p tt t hF F L ϕ
( )( )2 , 1t t T tt t t t hf F Fσ ϕ+∆+∆ +∆= −
t t t tF F LF t+∆ = + ∆
*1
1eT t t e N eT et t t tR F F R
Jσ σ σ+∆
+∆ +∆
= −
1e pt t t t tF F F −+∆ +∆=
( )1 lnt
t t e eht tL V
J
ϕσ +∆
+∆=
( )N p pTt t t tf F Fσ +∆ =
,pt t t tγ τ+∆ +∆ɺ
p pt t t t t tD N γ+∆ +∆ +∆= ɺ
( )1
p p p pt t t t t tt t t th
F F D F tfϕ σ
+∆ +∆+∆ +∆
= + ∆
=
1 2σ σ σ= +
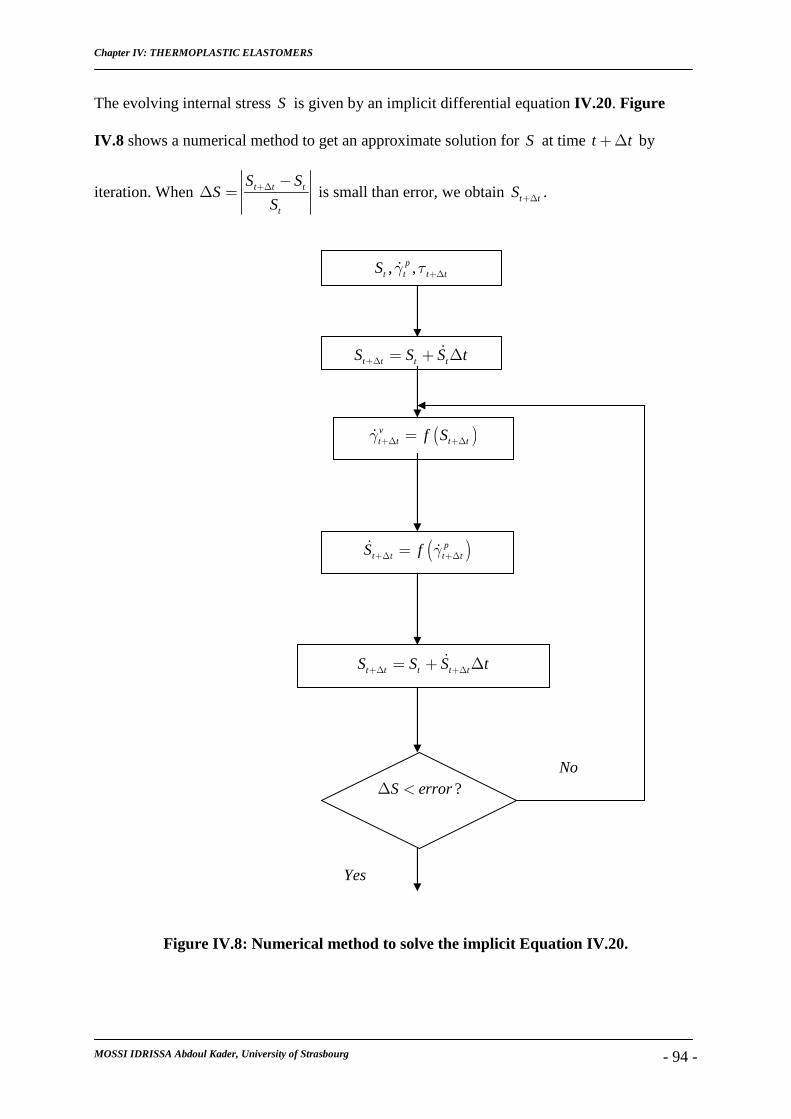
Chapter IV: THERMOPLASTIC ELASTOMERS
MOSSI IDRISSA Abdoul Kader, University of Strasbourg - 94 -
The evolving internal stress S is given by an implicit differential equation IV.20. Figure
IV.8 shows a numerical method to get an approximate solution for S at time t t+ ∆ by
iteration. When t t t
t
S SS
S+∆ −
∆ = is small than error, we obtain t tS +∆ .
Figure IV.8: Numerical method to solve the implicit Equation IV.20.
, ,pt t t tS γ τ +∆ɺ
t t t tS S S t+∆ = + ∆ɺ
( )vt t t tf Sγ +∆ +∆=ɺ
( )pt t t tS f γ+∆ +∆=ɺ ɺ
t t t t tS S S t+∆ +∆= + ∆ɺ
?S error∆ <
No
Yes
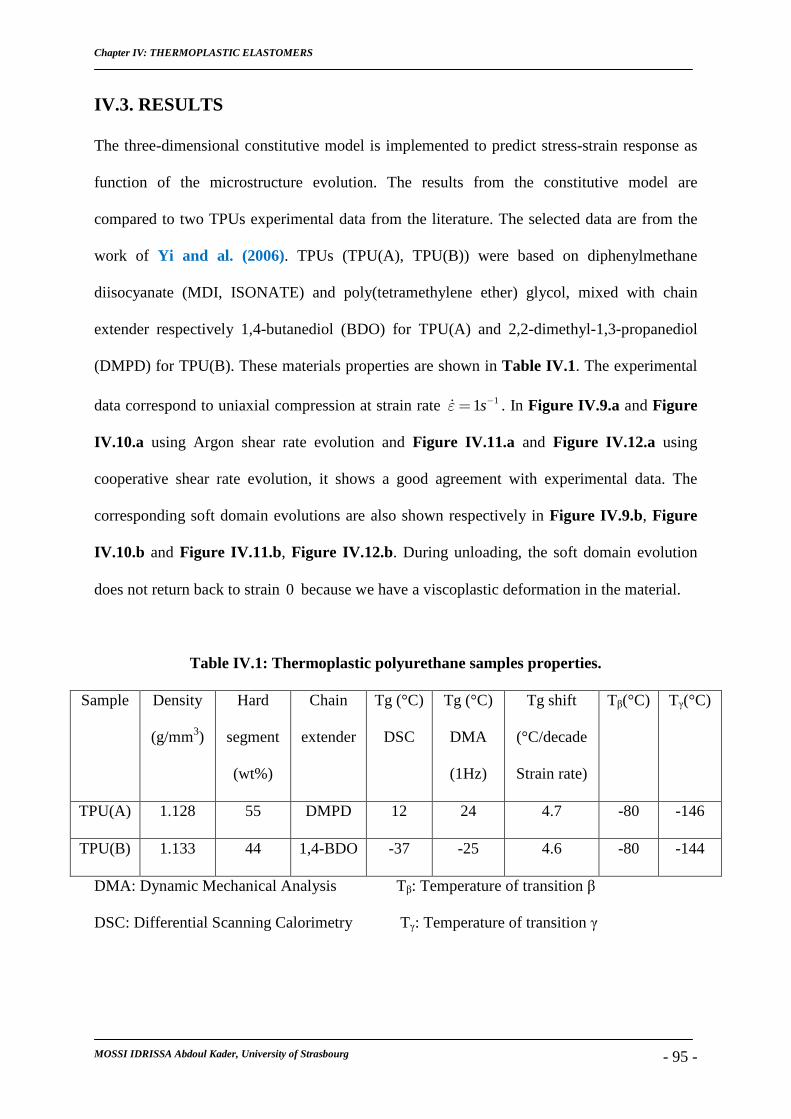
Chapter IV: THERMOPLASTIC ELASTOMERS
MOSSI IDRISSA Abdoul Kader, University of Strasbourg - 95 -
IV.3. RESULTS
The three-dimensional constitutive model is implemented to predict stress-strain response as
function of the microstructure evolution. The results from the constitutive model are
compared to two TPUs experimental data from the literature. The selected data are from the
work of Yi and al. (2006). TPUs (TPU(A), TPU(B)) were based on diphenylmethane
diisocyanate (MDI, ISONATE) and poly(tetramethylene ether) glycol, mixed with chain
extender respectively 1,4-butanediol (BDO) for TPU(A) and 2,2-dimethyl-1,3-propanediol
(DMPD) for TPU(B). These materials properties are shown in Table IV.1. The experimental
data correspond to uniaxial compression at strain rate 11sε −=ɺ . In Figure IV.9.a and Figure
IV.10.a using Argon shear rate evolution and Figure IV.11.a and Figure IV.12.a using
cooperative shear rate evolution, it shows a good agreement with experimental data. The
corresponding soft domain evolutions are also shown respectively in Figure IV.9.b, Figure
IV.10.b and Figure IV.11.b, Figure IV.12.b. During unloading, the soft domain evolution
does not return back to strain 0 because we have a viscoplastic deformation in the material.
Table IV.1: Thermoplastic polyurethane samples properties.
Sample Density
(g/mm3)
Hard
segment
(wt%)
Chain
extender
Tg (°C)
DSC
Tg (°C)
DMA
(1Hz)
Tg shift
(°C/decade
Strain rate)
Tβ(°C) Tγ(°C)
TPU(A) 1.128 55 DMPD 12 24 4.7 -80 -146
TPU(B) 1.133 44 1,4-BDO -37 -25 4.6 -80 -144
DMA: Dynamic Mechanical Analysis Tβ: Temperature of transition β
DSC: Differential Scanning Calorimetry Tγ: Temperature of transition γ
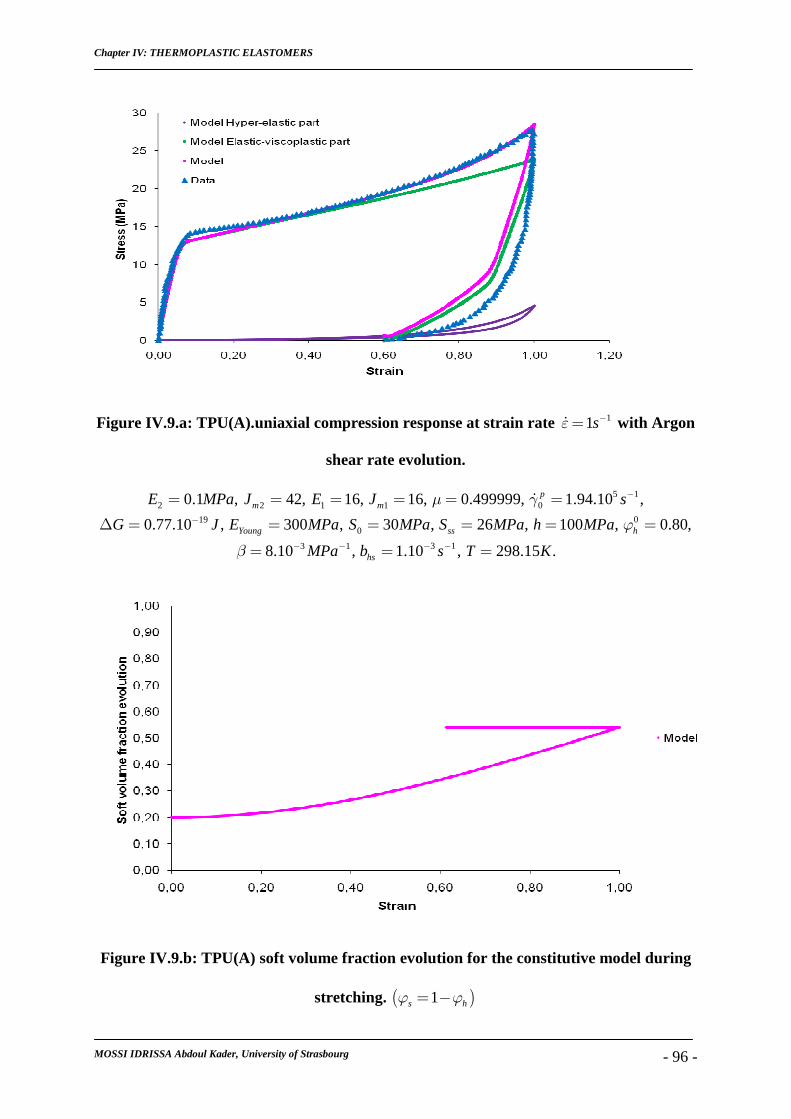
Chapter IV: THERMOPLASTIC ELASTOMERS
MOSSI IDRISSA Abdoul Kader, University of Strasbourg - 96 -
Figure IV.9.a: TPU(A).uniaxial compression response at strain rate 11sε −=ɺ with Argon
shear rate evolution.
2 0.1 ,E MPa= 2 42,mJ = 1 16,E = 1 16,mJ = 0.499999,µ= 5 10 1.94.10 ,p sγ −=ɺ
190.77.10 ,G J−∆ = 300 ,YoungE MPa= 0 30 ,S MPa= 26 ,ssS MPa= 100 ,h MPa= 0 0.80,hϕ =3 18.10 ,MPaβ − −= 3 11.10 ,hsb s− −= 298.15 .T K=
Figure IV.9.b: TPU(A) soft volume fraction evolution for the constitutive model during
stretching. ( )1s hϕ ϕ= −
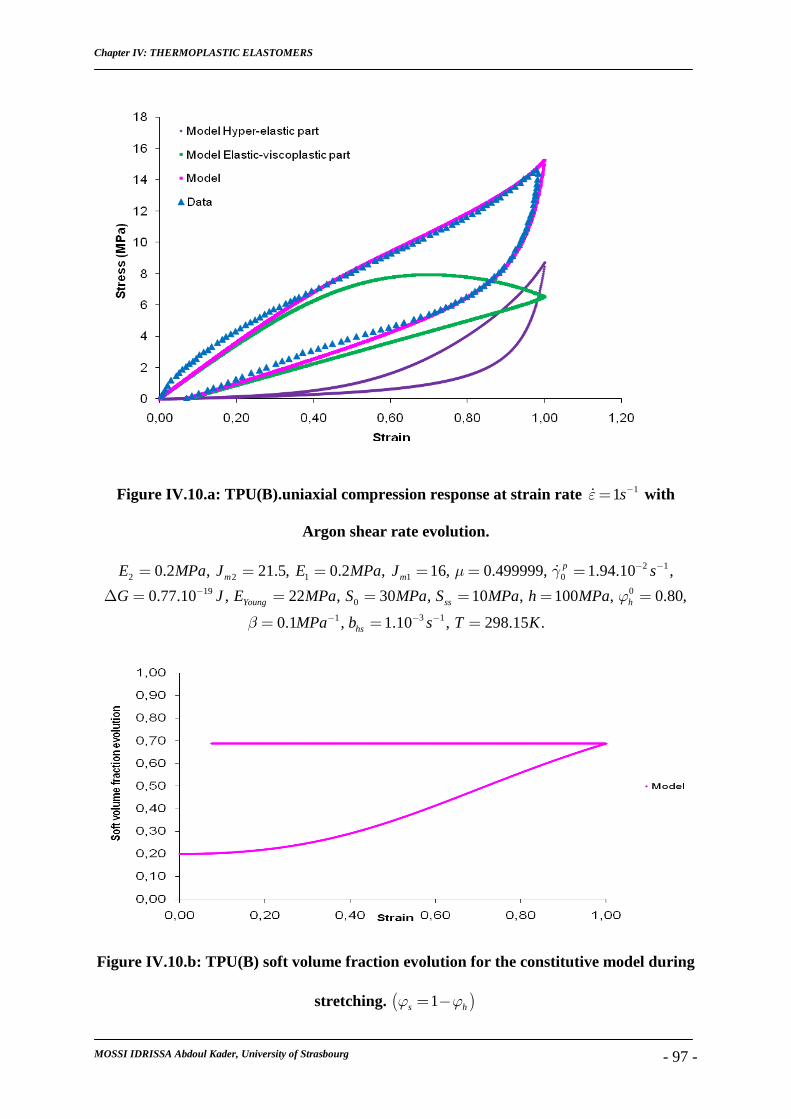
Chapter IV: THERMOPLASTIC ELASTOMERS
MOSSI IDRISSA Abdoul Kader, University of Strasbourg - 97 -
Figure IV.10.a: TPU(B).uniaxial compression response at strain rate 11sε −=ɺ with
Argon shear rate evolution.
2 0.2 ,E MPa= 2 21.5,mJ = 1 0.2 ,E MPa= 1 16,mJ = 0.499999,µ= 2 10 1.94.10 ,p sγ − −=ɺ
190.77.10 ,G J−∆ = 22 ,YoungE MPa= 0 30 ,S MPa= 10 ,ssS MPa= 100 ,h MPa= 0 0.80,hϕ =10.1 ,MPaβ −= 3 11.10 ,hsb s− −= 298.15 .T K=
Figure IV.10.b: TPU(B) soft volume fraction evolution for the constitutive model during
stretching. ( )1s hϕ ϕ= −
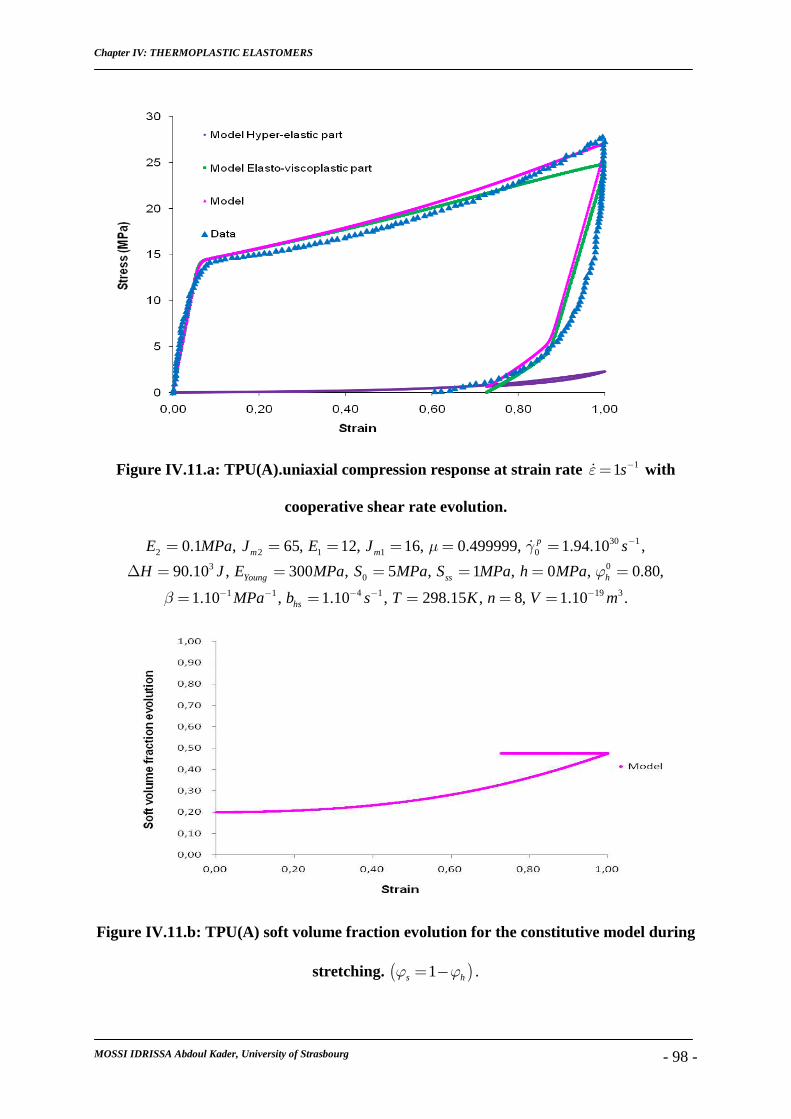
Chapter IV: THERMOPLASTIC ELASTOMERS
MOSSI IDRISSA Abdoul Kader, University of Strasbourg - 98 -
Figure IV.11.a: TPU(A).uniaxial compression response at strain rate 11sε −=ɺ with
cooperative shear rate evolution.
2 0.1 ,E MPa= 2 65,mJ = 1 12,E = 1 16,mJ = 0.499999,µ= 30 10 1.94.10 ,p sγ −=ɺ
390.10 ,H J∆ = 300 ,YoungE MPa= 0 5 ,S MPa= 1 ,ssS MPa= 0 ,h MPa= 0 0.80,hϕ =1 11.10 ,MPaβ − −= 4 11.10 ,hsb s− −= 298.15 ,T K= 8,n = 19 31.10 .V m−=
Figure IV.11.b: TPU(A) soft volume fraction evolution for the constitutive model during
stretching. ( )1s hϕ ϕ= − .
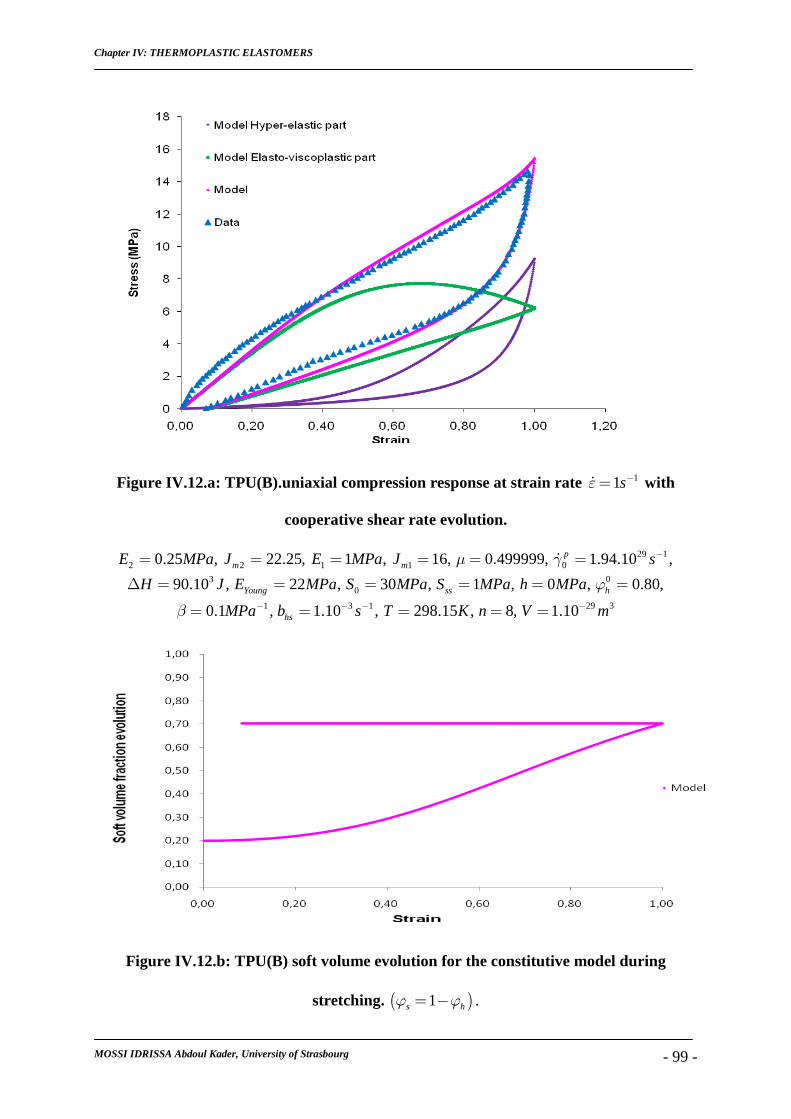
Chapter IV: THERMOPLASTIC ELASTOMERS
MOSSI IDRISSA Abdoul Kader, University of Strasbourg - 99 -
Figure IV.12.a: TPU(B).uniaxial compression response at strain rate 11sε −=ɺ with
cooperative shear rate evolution.
2 0.25 ,E MPa= 2 22.25,mJ = 1 1 ,E MPa= 1 16,mJ = 0.499999,µ= 29 10 1.94.10 ,p sγ −=ɺ
390.10 ,H J∆ = 22 ,YoungE MPa= 0 30 ,S MPa= 1 ,ssS MPa= 0 ,h MPa= 0 0.80,hϕ =10.1 ,MPaβ −= 3 11.10 ,hsb s− −= 298.15 ,T K= 8,n = 29 31.10V m−=
Figure IV.12.b: TPU(B) soft volume evolution for the constitutive model during
stretching. ( )1s hϕ ϕ= − .

Chapter IV: THERMOPLASTIC ELASTOMERS
MOSSI IDRISSA Abdoul Kader, University of Strasbourg - 100 -
IV.4. CONCLUSION
This constitutive model for thermoplastic elastomers is based on microstructure evolution and
mechanical behavior. The thermoplastic polyurethane chains are consisted by hard segments
which are separated in spinodal mechanism and form nanoscale hard domains acting like
fillers. It also implies nanoscale soft domains. However, the hard segments are considered to
be deformable and present an elastic-viscoplastic behavior. Hence, the rheological model
proposed in Figure IV.6 takes into account the two domains behavior during mechanical
deformation. The numerical results are obtained for two viscoplastic shear strain rate
evolutions which are Argon and cooperative model. These numerical results are also in good
agreement with different thermoplastic polyurethane experimental data. The model also
shows its ability to predict thermoplastic polyurethanes whose behavior is more elastomeric
or more thermoplastic.
V. Conclusion and future work
MOSSI IDRISSA Abdoul Kader, University of Strasbourg - 101 -
V. CONCLUSIONS AND FUTURE WORK
In this thesis, we propose three constitutive models for elastomeric materials under stress. The
first is on stress-birefringence-stretch and the two others are on biphasic elastomers stress-
strain behavior in relationship with microstructure evolution. Here, the biphasic elastomers
are elastomers filled by carbon black or thermoplastic elastomers with hard segments and soft
segments. The second constitutive model has the ability to predict only filled elastomers
behavior because it does not include plasticity. However, the third is extended to include the
plasticity behavior which happens in thermoplastic elastomers.
For stress-birefringence-stretch, the constitutive model is based on the well know Gaussian
model for birefringence-stretch response and Gent model for stress-stretch response. The
stress-optical law obtained from these models predicts results in good agreement with
experimental data from the literature for the PDMS and natural rubber. Our stress-optical law
is also compared with the non-Gaussian birefringence-stretch coupled with the eight-chain
model in order to show the difference between the two approaches. The results are controlled
by the two parameters in these approaches, N and Bnk Tµ = for the non-Gaussian model and
mJ and E for the Gent model. These parameters also show some similarities in their
representation for the two models. Similar Stress-strain response as well as to the closeness of
the birefringence results from both models confirm the relation between models parameters.
The constitutive model for filled elastomers includes microstructure evolution and mechanical
behavior. The microstructure of the filled elastomers is considered to be composed of soft and
hard domains where the hard domain includes fillers and occlude matrix. Under stress, the
V. Conclusion and future work
MOSSI IDRISSA Abdoul Kader, University of Strasbourg - 102 -
filler aggregates break down leads to the transformation of the immobilized occlude matrix to
deformable matrix (hard-to-soft domain transformation). Hence, the soft domain volume
fraction increases during loading and the hard one decreases. This is what induces the
softening or Mullins effect. The soft domain evolution controls the relationship between
microstructure and mechanical behavior because the applied stress generates deformation
only in filled elastomers soft part (the fillers are assumed non-deformable). The model takes
into account the carbon black volume fraction and its type via the DBPAbs. It also gives
explanation to stiffness increase by soft-to-hard domains transformation which happens
slowly after experimental test, this is not the case in other models based on damage theories.
For isotropic softening, the approach can also be easily implemented in computational codes.
The constitutive model gives good agreement with experimental data from the literature and
also proves its ability to be applicable on different states of deformation.
The third constitutive model for thermoplastic elastomers is also based on microstructure
evolution and mechanical behavior. The thermoplastic polyurethane chains are consisted by
hard segments and soft segments. The hard segments phase separate in spinodal mechanism
and form nanoscale hard domains acting like fillers However, the hard segments are
considered to be deformable and present an elastic-viscoplastic behavior. Hence, unlike the
case of filled elastomers, here the stress generates deformation in the two domains of the
materials. Hence, the rheological model proposes taking into account the two domains
behavior during mechanical deformation. The numerical results are obtained for two
viscoplastic shear strain rate evolutions which are Argon and cooperative model. These
numerical results are also in good agreement with different thermoplastic polyurethane
experimental data. Then, our model shows is ability to predict thermoplastic polyurethanes
whose behavior is more elastomeric or more thermoplastic.
V. Conclusion and future work
MOSSI IDRISSA Abdoul Kader, University of Strasbourg - 103 -
For future work, Mullins effect model should be compared to experimental data for different
states of deformation. The TPU model should be applied for high strain rate tests, cyclic
loading-unloading tests or on other type of thermoplastic elastomers tests.
References
MOSSI IDRISSA Abdoul Kader, University of Strasbourg - 104 -
REFERENCES
Aneja A, Wilkes G. L., 2003.
A systematic series of ‘model’ PTMO based segmented polyurethanes reinvestigated using
atomic force microscopy, Polymer, 44, 7221-7228, 2003.
Argon A.S., 1973a
Physical basis of distortional and dilatational plastic flow in glassy polymers, Journal of
Macromolecular Science-Physics, B8, 573-596, 1973.
Argon A.S., 1973b
A theory for the low-temperature plastic deformation of glassy polymers, Philosophical
Magazine, 28, 839-865, 1973.
Arruda E.M., Boyce M.C., 1993.
A three–dimensional constitutive model for the large stretch behavior of rubber elastic
materials, J. Mech. Phys. Solids, 41, 389–412, 1993.
Arruda E.M., Boyce M.C., 1991.
Anisotropy and localization of plastic deformation, p.483, Elsevier/New York, 1991.
Arruda E.M., Przybylo P.A., 1995.
An investigation into the three–dimensional stress–birefringence–strain relation in elastomers,
Polymer. Eng. Sci., 35, 395–402, 1995.
References
MOSSI IDRISSA Abdoul Kader, University of Strasbourg - 105 -
Biderman V.L., 1958.
Problems of Analysing Rubbery-like Materials, Raschety na Prochnost'. Mashgiz, Moscow, 3,
1958.
Blanchard A.F., Parkinson D., 1952.
Breakage of carbon–rubber networks by applied stress, Ind. Eng. Chem., 44, 799–812, 1952.
Bergstrom J., Boyce M.C., 1999.
Mechanical behavior of particle filled elastomers, Rubber Chem. Tech., 72, 633–656, 1999.
Bouasse H., Carrière Z., 1903.
Courbes de traction du caoutchouc vulcanisé, Ann. Fac. Sciences de Toulouse, 5, 257-283,
1903.
Boyce M. C., 1996.
Direct comparison of the Gent and Arruda–Boyce constitutive models of rubber elasticity,
Rubber Chem. Technol., 69, 781–785, 1996.
Boyce M. C., Kear K., Socrate S., Shaw K., 2001.
Deformation of thermoplastic vulcanizates, J. Mech. Phys. Solids, 49, 1073-1098, 2001.
Boyce M. C., Parks D. M., Argon A. S., 1988.
Large inelastic deformation of glassy polymers Part I Rate-dependent constitutive model,
Mech. Mater., 7, 15-33, 1988.
References
MOSSI IDRISSA Abdoul Kader, University of Strasbourg - 106 -
Buckley C. P., Prisacariu C., Martin C., 2010.
Elasticity and inelasticity of thermoplastic polyurethane elastomers: Sensitivity to chemical
and physical structure, Polymer, 51, 3213-3224, 2010.
Budiansky B., 1965.
On the elastic modulus of some heterogeneous materials, J. Mech. Phys. Solids, 13, 223–227,
1965.
Bueche F., 1960.
Molecular basis for the Mullins effect, J. Appl. Polym. Sci, 4, 107–114, 1960.
Bueche F., 1961.
Mullins effect and rubber–filler interaction, J. Appl. Polym. Sci, 5, 271–281, 1961.
Chagnon G., Verron E., Marckmann G., Gornet L., 2006.
Development of new constitutive equations for the Mullins effect in rubber using the network
alteration theory, Int. J. Solids Struct., 43, 6817-6831, 2006.
Chagnon G., Marckmann G., Verron E., 2004.
A comparison of the Hart–Smith model with Arruda–Boyce and Gent formulations for rubber
elasticity, Rubber Chem. Technol., 77, 724–735, 2004.
References
MOSSI IDRISSA Abdoul Kader, University of Strasbourg - 107 -
Chen-Tsai C. H Y., Thomas E. L., Macknight W. J., Schneider N. S., 1986.
Structure and morphology of segmented polyurethanes. 3. Electron microscopy and small
angle X-ray scattering studies of amorphous random segmented polyurethanes, Polymer, 27,
659-666, 1986.
Cohen A., 1991.
A Padé approximant to the inverse Langevin function, Rheologica Acta 30, 270–273, 1991.
Einstein A., 1906.
Ann. Physik. (Leipzig) 19, 289, 1906.
Einstein A., 1911.
Ann. Physik. (Leipzig) 34, 591, 1911.
Elwell M. J., Mortimer S., Ryan A. J., 1994.
A synchrotron SAXS study of structure development kinetics during the reactive processing
of flexible polyurethane foam, Macromolecules, 27, 5428-5439,1991.
Erman B., Flory P.J., 1983a.
Theory of strain birefringence of amorphous polymer networks, Macromolecules, 16, 1601–
1606, 1983.
Erman B., Flory P.J., 1983b.
Experimental results relating stress and birefringence to strain in poly(dimethylsiloxane)
networks. Comparisons with theory, Macromolecules, 16, 1607–1613, 1983.
References
MOSSI IDRISSA Abdoul Kader, University of Strasbourg - 108 -
Erman B., Flory P.J., 1982.
Relationships between stress, strain and molecular constitution of polymer networks.
Comparison of theory with experiments, Macromolecules, 15, 806–811, 1982.
Flory P.J., B. Erman B., 1982.
Theory of elasticity of polymer networks.3, Macromolecules, 15, 800–806, 1982.
Flory P.J., Rehner Jr.J., 1943.
Statistical mechanics of cross-linked polymer networks I. Rubberlike elasticity, J. Chem.
Phys, 11, 512-520, 1943.
Garrett J. T., Siedlecki C. A., Runt J., 2001.
Microdomain morphology of poly(urethane urea) multiblock copolymers, Macromolecules,
34, 7066-7070, 2001.
Gent A.N., 1996.
A new constitutive relation for rubber, Rubber Chem. Technol., 69, 59–61, 1996.
Gent A. N., Thomas A. G., 1958.
Forms of the stored (strain) energy function for vulcanized rubber. J. Polym. Sci., 28, 625–
637, 1958.
Goindjee S., Simo J., 1991.
A micro-mechanically continuum damage model for carbon black filled rubbers incorporating
Mullins’s effect, J. Mech. Phys. Solids, 39, 87-112, 1991.
References
MOSSI IDRISSA Abdoul Kader, University of Strasbourg - 109 -
Goindjee S., Simo J., 1992.
Transition from micro-mechanics to computationally efficient phenomenology: carbon black
filled rubbers incorporating Mullins’ effect, J. Mech. Phys. Solids, 40, 213-233, 1992.
Guth E., 1945.
Theory of filler reinforcement, J. Appl. Phys. 16, 20–25, 1945.
Guth, E., Mark, H. 1934.
Internal molecular statistics, especially in chain molecules. I. Mh.Chem. 65, 93, 1934.
Guth E., Gold O., 1938.
On the hydrodynamical theory of the viscosity of suspensions, Phys. Rev. 53, 322, 1938.
Haines D.W., Wilson W.D., 1979.
Strain-energy density function for rubber like materials, J. Mech. Phys of Solids, 27,345-360,
1979.
Halary J.L.,Lauprêtre F., Monnerie L. 2008.
Mécanique des matériaux polymères, Collection Echelles, Belin, (2008)
Harwood J.A.C., Mullins L., Payne A.R., 1965.
Stress softening in natural rubber vulcanizates, Part II, J. Appl. Polym. Sci. 9, 3011–3021,
1965.
Harwood J.A.C., Payne A.R., 1966.
Stress softeningin natural rubber vulcanizates Part III., J. Appl. Polym. Sci., 10, 315, 1966.
References
MOSSI IDRISSA Abdoul Kader, University of Strasbourg - 110 -
Hart-Smith L. J., 1966.
Elasticity parameters for finite deformations of rubber-like materials, J. App. Phys., 17, 608–
625, 1966.
Hashin, Z., Shtrikman, S., 1963.
A variational approach to the elastic behaviour of multiphase materials: J. Mech. Phys. Solids,
11, 127-140, 1963.
Heinrich G., Klüppel M., Vilgis T. A., 2002.
Reinforcement of elastomers, Current Opinion in Solid State and Materials Science, 6, 195-
203, 2002.
Hill R., 1951.
On the state of stress in a plastic-rigid body at the yield point, Philosophical Magazine, 42,
868-875, 1951.
Horgan C.O., Saccomandi G., 2002.
A molecular–statistical basis for Gent constitutive model of rubber elasticity, J. Elasticity, 68,
167–176, 2002.
Isihara A., Hashitsume N., Tatibana M., 1951.
Statistical theory of rubber-like elasticity.IV. (Two-dimensional stretching) J. Chem. Phys.,
19, 1508, 1951.
References
MOSSI IDRISSA Abdoul Kader, University of Strasbourg - 111 -
James A.G., Green A., 1975.
Strain energy functions of rubber. II. Characterization of filled vulcanizates, J. Appl. Polym.
Sci.19, 2319-2330, 1975.
James H.M., Guth E., 1943.
Theory of the elastic properties of rubber, J. Chem. Phys., 11, 455–481, 1943.
Johnson M. A., Beatty M.F., 1993.
A constitutive equation for the Mullins effect in stress controlled uniaxial extension
experiments, Continuum Mech. Thermodyn., 5, 301-318, 1993.
Klüppel and Schramm, 2000
A generalized tube model of rubber elasticity and stress softening of filler reinforced
elastomer systems, Macromolecular Theory and Simulations, 2000, 9, 742-754
Kuhn W., 1936.
Kolloid-Z, 76, 258, 1936.
Kuhn W., 1934.
Kolloid-Z, 68, 2, 1934.
Kuhn W., Grün F., 1942.
Beziehungen zwischen elastischen Konstanten und Dehnungsdoppelbrechung hochelastischer
Stoffe. Kolloid Z. 101, 248–271, 1942.
References
MOSSI IDRISSA Abdoul Kader, University of Strasbourg - 112 -
Makradi A., Ahzi S., Gregory R. V., 2000.
Modeling of the mechanical response and evolution of optical anisotropy in deformed
polyaniline, Poly. Eng. Sc, 40, 1716–1723, 2000.
Marckmann G., Verron E., Gornet L., Chagnon G., Charrier P., Fort P., 2002.
A theory of network alteration for the Mullins effect, J. Mech. Phys. Solids, 50, 2011-2028,
2002.
Maxwell J.C., 1873.
Treatise on electricity and magnetism, Clarendon Press, Oxford, 1873.
Medalia A.I., 1970.
Morphology of aggregates VI. Effective volume of aggregates of carbon black from electron
microscopy; application to vehicle absorption and to die swell of filled rubber, Journal of
Colloid and Interface Science, 32, 115–131, 1970.
Meinecke E. A., Taftaf M.I., 1988.
Effect of Carbon Black on the Mechanical Properties of Elastomers, Rubber Chem. Technol.,
61, 534, 1988.
Miehe C., Keck J., 2000.
Superimposed finite elastic-viscoelastic-plastoelastic response with damage in filled rubbery
polymers. Experiments, modeling and algorithmic implementation, J. Mech. Phys. Solids, 48,
323-365, 2000.
References
MOSSI IDRISSA Abdoul Kader, University of Strasbourg - 113 -
Mooney M.J., 1940.
A theory of large elastic deformation, J. Appl. Phys., 11, 582–592, 1940.
Mori T., Tanaka K., 1973.
Average stress in matrix and average elastic energy of materials with misfitting inclusions,
Acta Metall, 21, 571–574, 1973.
Morozov I., Lauke B., Heinrich G., 2010.
A new structural model of carbon black framework in rubbers, Computational Materials
Science, 47, Issue 3, 817–825, 2010.
Mullins L., 1947.
Effect of stretching on the properties of rubber, J. Rubber Res., 16, 275–289, 1947.
Mullins L., 1948.
Effect of stretching on the properties of rubber, Rubber Chem. Technol., 21, 281-300, 1948.
Mullins L., 1950.
Thixotropic behavior of carbon black in rubber, Rubber Chem. Technol., 23,733, 1950.
Mullins L., 1969.
Softening of rubber by deformation, Rubber Chem. Technol., 42, 339-362, 1969.
References
MOSSI IDRISSA Abdoul Kader, University of Strasbourg - 114 -
Mullins L., Tobin N.R., 1957.
Theoretical model for the elastic behavior of filler–reinforced vulcanized rubber, Rubber
Chem. Technol., 30, 555–571, 1957.
Mullins L., Tobin N.R., 1965.
Stress softening in natural rubber vulcanizates, Part I. J. Appl. Sci., 9, 2993–3010, 1965.
Ogden R.W., 1972.
Large deformation isotropic elasticity–On the correlation of theory and experiment for
incompressible rubbelike solids, Proc. R. Soc. London. A 326, 565–584, 1972.
Oshmyan V. G., Patlazhan S. A., Remond Y., 2006.
Principles of structural-mechanical modeling of polymers and composites, Polymer Science,
Series A, 48 (9), 1004–1013, 2006.
O’Sickey M. J., Lawrey B. D., Wilkes G. L., 2002.
Structure-property relationships of poly(urethane urea)s with ultra-low monol content
poly(propylene glycol) soft segments: I. Influence of soft segment molecular weight and hard
segment content, Journal of Applied Polymer Science, 84, 229-243, 2002.
Petrovic Z., Ferguson J., 1991
Polyurethane elastomers, Progress in Polymer Science, 16, 695-836, 1991.
References
MOSSI IDRISSA Abdoul Kader, University of Strasbourg - 115 -
Ponte Castaňeda P., 1989.
The overall constitutive behaviour of nolinear elastic composite, Proc. R. Soc. London, Ser. A
A422, 147-171, 1989.
Qi H. J., Boyce M. C., 2005.
Stress-strain behavior of thermoplastic polyurethanes, Mechanics of Materials, 37, 817–839,
2005.
Qi H.J., Boyce M.C., 2004.
Constitutive model for stretch–induced softening of the stress–stretch behavior of elastomeric
materials, J. Mech. Phys. Solids, 52, 2187–2205, 2004.
Rayleigh L., 1892.
On the influence of obstacles arranged in a rectangular order upon the properties of medium.
Philosophical Magazine 34,481-502, 1892.
Reuss A., 1929.
Berechnung der fliessgrenze von mischkristallen auf grund der plastizitatsbedingung fur
einkristalle, Zeitung Angewandte Mathematik und Mechanik 9, 49-58, 1929.
Richeton J., Ahzi S., Vecchio K.S., Jiang F.C., Makradi A., 2007.
Modeling and validation of the large deformation inelastic response of amorphous polymers
over a wide range of temperatures and strain rates, International Journal of Solids and
Structures, 44, 7938–7954, 2007.
References
MOSSI IDRISSA Abdoul Kader, University of Strasbourg - 116 -
Richeton J., Ahzi S., Daridon L., Rémond Y., 2005.
A formulation of the cooperative model for the yield stress of amorphous polymers for a wide
range of strain rates and temperatures, Polymer, 46, 6035-6043, 2005.
Rivlin R. S., 1948.
Large elastic deformation of isotropic materials-IV. Further developments of the general
theory, Phil. Trans. Roy. Soc. London. A. 241, 379, 1948.
Rivlin R.S., Saunders D.W., 1951.
Large elastic deformations of isotropic materials-VII. Experiments on the deformation of
rubber, Phil. Trans. Roy. Soc. A243, 251, 1951.
Roychoudhury A., De P.P., 1993.
Reinforcement of epoxidized natural rubber by carbon black: Effect of surface oxidation of
carbon black particles, J. Applied Polymer Science, 50,181–186, 1993.
Russo R., Thomas E., 1983.
Phase separation in linear and cross-linked polyurethanes, Journal of Macromolecular
Science-Physics, B22, 553-575, 1983.
Ryan A. J., Macosko C. W., Bras W., 1992.
Order-disorder transition in a block copolyurethane, Macromolecules, 25, 6277-6283, 1992.
References
MOSSI IDRISSA Abdoul Kader, University of Strasbourg - 117 -
Ryan A. J., Stanford J. L., Still R. H., 1991.
Thermal, mechanical and fracture properties of reaction injection-moulded poly(urethane-
urea)s, Polymer, 32, 1426-1439, 1991.
Schneider N. S., Desper C. R., Illinger J. L., King A. O., Barr D., 1975.
Structural studies of crystalline MDI-based polyurethanes, J. Macromol. Sci. Phys, B11, 527-
552, 1975.
Simha R., 1940.
The influence of Brownian movement of the viscosity of solutions, J. Phys. Chem., 44, 25–
34, 1940.
Simo J., 1987.
On a fully three-dimensional finite-strain viscoelastic damage model: formulation and
computational aspects, Comput. Methods Appl. Mech. Eng., 60, 153-173, 1987.
Smallwood H.M., 1944.
Limiting law of the reinforcement of rubber, J. Appl. Phys., 15, 758–766, 1944.
Stepto R.F.T., 1986.
In advances in Elastomers and Rubber Elasticity, J. Lal and J.E. Mark, eds., Plenum Press,
New York, 1986.
References
MOSSI IDRISSA Abdoul Kader, University of Strasbourg - 118 -
Suquet P., 1997.
Effective properties of nonlinear composites, In: Suquet P., (Ed.), Continuum
Micromechanics, Springer–Wien, New York, 1997.
Treloar L.G.R., 1975.
The physics of rubber elasticity. Oxford University Press, Oxford 1975.
Treloar. L. R. G., 1954.
The photoelastic properties of short-chain molecular networks, Trans. Faraday Soc., 50, 881,
1954.
Treloar L.G.R., 1947a.
The photo–elastic properties of rubber. Part I: Theory of the optical properties of strained
rubber, Trans. Faraday. Soc., 43, 277–284, 1947.
Treloar L.G.R., 1947b.
The photo–elastic properties of rubber. Part II: Double refraction and crystallization in
stretched vulcanized rubber, Trans. Faraday Soc., 43, 284–293, 1947.
Treloar L. R. G., 1946.
The statistical length of long chain molecules, Trans. Faraday Soc., 42:77–83, 1946.
Treloar L.G.R., Riding G., 1979.
A non–Gaussian theory for rubber in biaxial strain. I. Mechanical properties, Proc. Roy. Soc.
London. A 369, 261–280, 1979.
References
MOSSI IDRISSA Abdoul Kader, University of Strasbourg - 119 -
Tschoegl N. W., 1971.
Constitutive equation for elastomers, J. Polymer Sci., A1, 9, 1959, 1971.
Ullman, 1986.
Advances in Elastomers and Rubber Elasticity, J. Lal and J.E. Mark, eds., Plenum Press, New
York (1986).
Valanis K.C., Landel R.F., 1967.
The strain–energy function of a hyperelastic material in terms of the extension ratios, J. Appl.
Phys., 38, 2997-3002, 1967.
Vand V., 1948.
Viscosity of solutions and suspensions. I. Theory, J. Phys. Colloid Chem., 52, 277-299, 1948.
Vilgis T. A., Heinrich G., Klüppel, 2009.
Reinforcement of polymer nano-composites, Cambridge University Press, Cambridge, U.K.
(2009).
Von Lockette P.R., Arruda E.M., 1999.
A network description of the non–Gaussian stress–optic and Raman scattering responses of
elastomer networks, Acta Mechanica, 134, 81–107, 1999.
Voigt W., 1889.
Uber die Beziehung zwischen den beiden Elastizitatskonstanten isotroper Korper, Wiedemann
Annalen, 38, 573, 1889.
References
MOSSI IDRISSA Abdoul Kader, University of Strasbourg - 120 -
Wang M.C., Guth E.J., 1952.
Satistical theory of networks of non-Gaussian flexible chains. J. Chem. Phys. 20, 1144-1157,
1952.
Wu P.D., Van Der Giessen E., 1995.
On network descriptions of mechanical and optical properties of rubbers, Philosophical
Magazine A, 71, 1191–1206, 1995.
Wu P.D., Van der Giessen E., 1993.
On improved network models for rubber elasticity and their applications to orientation
hardening in glassy polymers, J. Mech. Phys. Solids, 41, 427-456, 1993.
Wu P.D., Van der Giessen E., 1992.
On improved 3-D non-Gaussian network models for rubber elasticity, Mechanics Research
Communications, 19, Issue 5, 427-433, 1992.
Yeoh O. H., 1990.
Characterization of elastic properties of carbon-black-filled rubber vulcanizates. Rubber.
Chem. Technol., 63(5):792–805, 1990.
Yi J., Boyce M. C., Lee G. F., Balizer E., 2006.
Large deformation rate-dependent stress-strain behaviour of polyurea and polyurethanes,
Polymer, 47, 319-329, 2006.