Embed Size (px)
DESCRIPTION
ark Lombardi’s Relational Dia
Citation preview
66
Networks of Corruption: The Aesthetics of Mark Lombardi’s Relational Diagrams
Jakub Zdebik, University of Ottawa
Résumé Les œuvres de Mark Lombardi représentent des réseaux clandestins de pouvoir sous la forme de diagrammes. Ses dessins sont en quelque sorte des cartes qui retracent, avec l’aide de courbes, de traits et de cercles, la façon dont les corporations réussissent à soustraire à la vue du public d’importantes sommes d’argent et, par la même opération, contribuent à consolider le pouvoir des chefs d’entreprise aussi bien que des politi-ciens. Lombardi est ici comparé à Hans Haacke, Josh On et Bureau d’études, trois artistes dont l’œuvre consiste aussi à construire des diagram-mes dans le but de mettre à jour la corruption par ce type de représentation visuelle. S’inspirant des théories de Susan Buck-Morss, qui retrace la genèse de la visualisation des rapports économiques au dix-huitième siècle, cet article se penche sur les stratégies adoptées pour rendre visibles les rapports incorporels que tissent les diagrammes et les schémas économiques. De plus, en rapprochant le concept de rhizome—que Gilles Deleuze et Félix Guattari associent à la décalcomanie et à la cartographie—du concept de diagramme, tel qu’expliqué dans Foucault, l’article accorde une attention à l’aspect esthétique de l’organisation de données. C’est cette double analyse de Buck-Morss et de Deleuze et Guattari qui va effectivement permettre de démontrer l’aspect dynamique et virtuel des trajectoires que Lombardi trace sur la feuille pour dévoiler les réseaux de pouvoirs corrompus.
Mark Lombardi’s artistic oeuvre consists of large-scale dia-grams composed of curved and straight lines precisely drawn in pencil on paper in frenetic spirographic patterns that expose global “networks of transactions, spheres of influence” and trails of financial corruption.1 These diagrams are intricate in their constellation-like configurations that reveal the interactions of governments, politicians, banks, and corporations; for ex-ample, the Vatican, Oliver North, Presidents George Bush Sr. and George W. Bush, and the Mafia figure prominently in his work. With their minimal diagrammatic aesthetic, Lombardi’s artworks represent what he sees as nebulous, clandestine, and often invisible corruption.
The diagram is a peculiar type of representation. The word diagram comes from the Greek diagramma, which means to mark out by lines. It is a mode of expression that consists of both visual and textual elements. It conveys information not easily expressible through visual representation or text alone. For the purpose of investigating networks of corruption that thrive on secrecy and opaqueness and eschew visibility and detection—to reveal that which flies under the radar—the diagram is a revelatory device.
Robert Hobbs’s comprehensive study Mark Lombardi: Global Networks shows the important role information gather-ing plays in Lombardi’s artistic work.2 Hobbs has demonstrated how Lombardi thoroughly researches intricate plots involving corrupt financial practices, which he then displays in the form of diagrammatic drawings. I will compare Lombardi to other artists, such as Hans Haacke, whose works consist of the visual display of intricate networks of corporate power. I focus pri-marily on Josh On, whose work is Internet based, and Bureau d’études, whose informational graphs are linked to political pro-test. The comparison between Lombardi and artists whose art exhibits complex economic relational networks will highlight the visual subject of relationality. I contend that there is a dia-
grammatic imperative in the visualization of relational thinking and that Lombardi’s drawings contribute in an engaging fashion to aesthetic philosophy by illustrating how the concept of the diagram functions. To support this argument, I will look at how the diagram was intricately linked with the development of the discipline of economy in the eighteenth century, using Susan Buck-Morss’s history of the visualization of capitalism. Buck-Morss establishes that visual diagrams are necessary to make incorporeal, yet real phenomena apparent. I also rely on Gilles Deleuze’s theory concerning the rhizomatic schematization of power to explain how Lombardi’s representations of real but invisible networks function politically and aesthetically. Hobbs mentions Gilles Deleuze and Félix Guattari’s theory in relation to Lombardi’s drawings of networks, but he does not develop this link fully nor does he connect it, in my opinion, to the equally pertinent Deleuzean concept of the diagram.3 In the fol-lowing paper, I will analyze Lombardi’s drawings according to the philosopher’s diagrammatic concept. I intend to show that Lombardi, by marking up surfaces with lines, deploys aesthetic strategies of relationality.
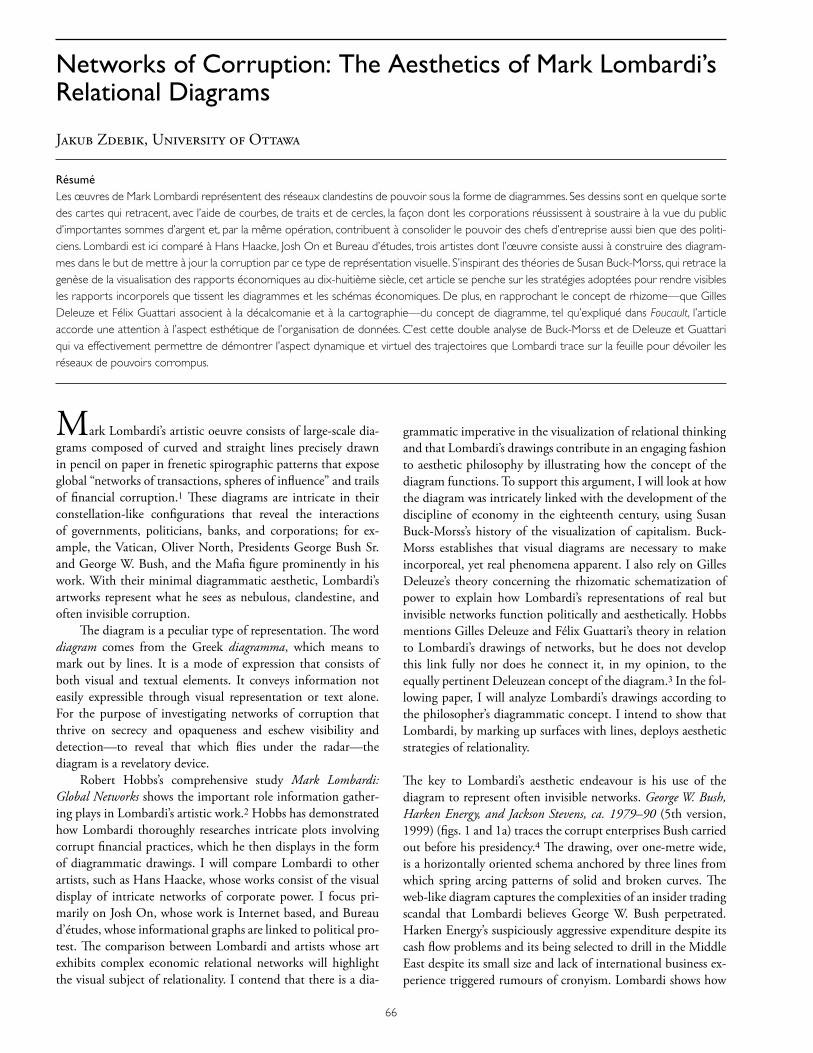
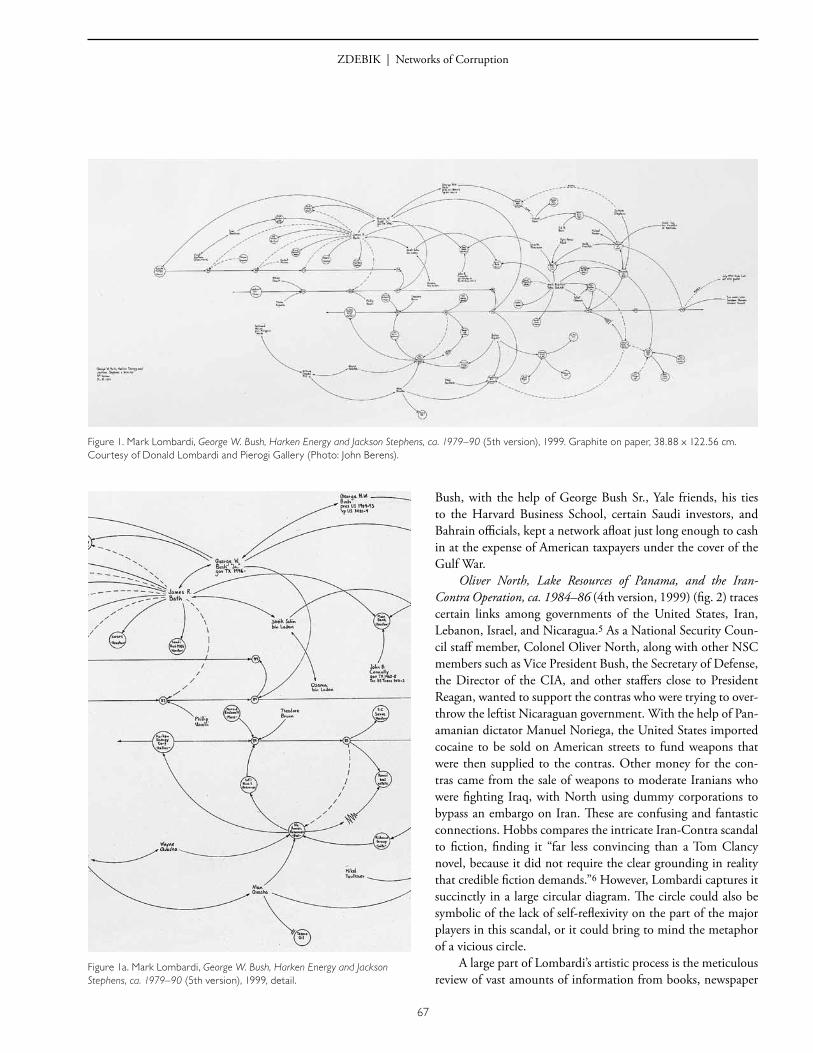
The key to Lombardi’s aesthetic endeavour is his use of the diagram to represent often invisible networks. George W. Bush, Harken Energy, and Jackson Stevens, ca. 1979–90 (5th version, 1999) (figs. 1 and 1a) traces the corrupt enterprises Bush carried out before his presidency.4 The drawing, over one-metre wide, is a horizontally oriented schema anchored by three lines from which spring arcing patterns of solid and broken curves. The web-like diagram captures the complexities of an insider trading scandal that Lombardi believes George W. Bush perpetrated. Harken Energy’s suspiciously aggressive expenditure despite its cash flow problems and its being selected to drill in the Middle East despite its small size and lack of international business ex-perience triggered rumours of cronyism. Lombardi shows how
67
ZDEBIK | Networks of Corruption
Bush, with the help of George Bush Sr., Yale friends, his ties to the Harvard Business School, certain Saudi investors, and Bahrain officials, kept a network afloat just long enough to cash in at the expense of American taxpayers under the cover of the Gulf War.
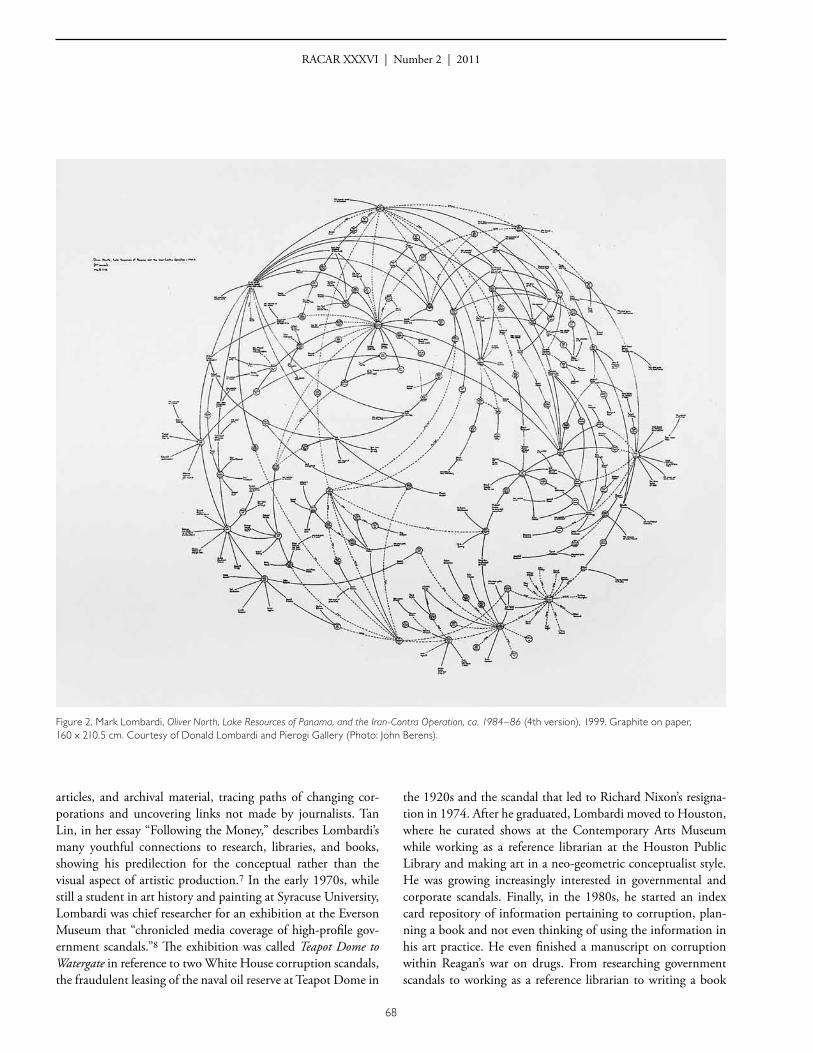
Oliver North, Lake Resources of Panama, and the Iran- Contra Operation, ca. 1984–86 (4th version, 1999) (fig. 2) traces certain links among governments of the United States, Iran, Lebanon, Israel, and Nicaragua.5 As a National Security Coun-cil staff member, Colonel Oliver North, along with other NSC members such as Vice President Bush, the Secretary of Defense, the Director of the CIA, and other staffers close to President Reagan, wanted to support the contras who were trying to over-throw the leftist Nicaraguan government. With the help of Pan-amanian dictator Manuel Noriega, the United States imported cocaine to be sold on American streets to fund weapons that were then supplied to the contras. Other money for the con-tras came from the sale of weapons to moderate Iranians who were fighting Iraq, with North using dummy corporations to bypass an embargo on Iran. These are confusing and fantastic connections. Hobbs compares the intricate Iran-Contra scandal to fiction, finding it “far less convincing than a Tom Clancy novel, because it did not require the clear grounding in reality that credible fiction demands.”6 However, Lombardi captures it succinctly in a large circular diagram. The circle could also be symbolic of the lack of self-reflexivity on the part of the major players in this scandal, or it could bring to mind the metaphor of a vicious circle.
A large part of Lombardi’s artistic process is the meticulous review of vast amounts of information from books, newspaper
Figure 1. Mark Lombardi, George W. Bush, Harken Energy and Jackson Stephens, ca. 1979–90 (5th version), 1999. Graphite on paper, 38.88 x 122.56 cm. Courtesy of Donald Lombardi and Pierogi Gallery (Photo: John Berens).
Figure 1a. Mark Lombardi, George W. Bush, Harken Energy and Jackson Stephens, ca. 1979–90 (5th version), 1999, detail.
68
RACAR XXXVI | Number 2 | 2011
articles, and archival material, tracing paths of changing cor-porations and uncovering links not made by journalists. Tan Lin, in her essay “Following the Money,” describes Lombardi’s many youthful connections to research, libraries, and books, showing his predilection for the conceptual rather than the visual aspect of artistic production.7 In the early 1970s, while still a student in art history and painting at Syracuse University, Lombardi was chief researcher for an exhibition at the Everson Museum that “chronicled media coverage of high-profile gov-ernment scandals.”8 The exhibition was called Teapot Dome to Watergate in reference to two White House corruption scandals, the fraudulent leasing of the naval oil reserve at Teapot Dome in
the 1920s and the scandal that led to Richard Nixon’s resigna-tion in 1974. After he graduated, Lombardi moved to Houston, where he curated shows at the Contemporary Arts Museum while working as a reference librarian at the Houston Public Library and making art in a neo-geometric conceptualist style. He was growing increasingly interested in governmental and corporate scandals. Finally, in the 1980s, he started an index card repository of information pertaining to corruption, plan-ning a book and not even thinking of using the information in his art practice. He even finished a manuscript on corruption within Reagan’s war on drugs. From researching government scandals to working as a reference librarian to writing a book
Figure 2. Mark Lombardi, Oliver North, Lake Resources of Panama, and the Iran-Contra Operation, ca. 1984–86 (4th version), 1999. Graphite on paper, 160 x 210.5 cm. Courtesy of Donald Lombardi and Pierogi Gallery (Photo: John Berens).
69
ZDEBIK | Networks of Corruption
manuscript, Lombardi’s career path followed an information heavy, word-based approach.
In the period deemed to be his most successful and pro-ductive, the years just before his suicide in 2000 in his Brooklyn studio, Lombardi collected a large amount of data that he “jot-ted down on 14,500 index cards.”9 Although he had begun this practice earlier, the number of index cards certainly grew ex-ponentially in the 1990s. Lombardi himself said that the sheer amount of information posed an organizational challenge:
I was getting into information from a number of sources which I was beginning to get confused by, I couldn’t real-ly keep the stories straight, … and simply out of … sheer
necessity began doing sketches of corporate organizations, hierarchies and various political structures to keep the infor-mation at hand.10
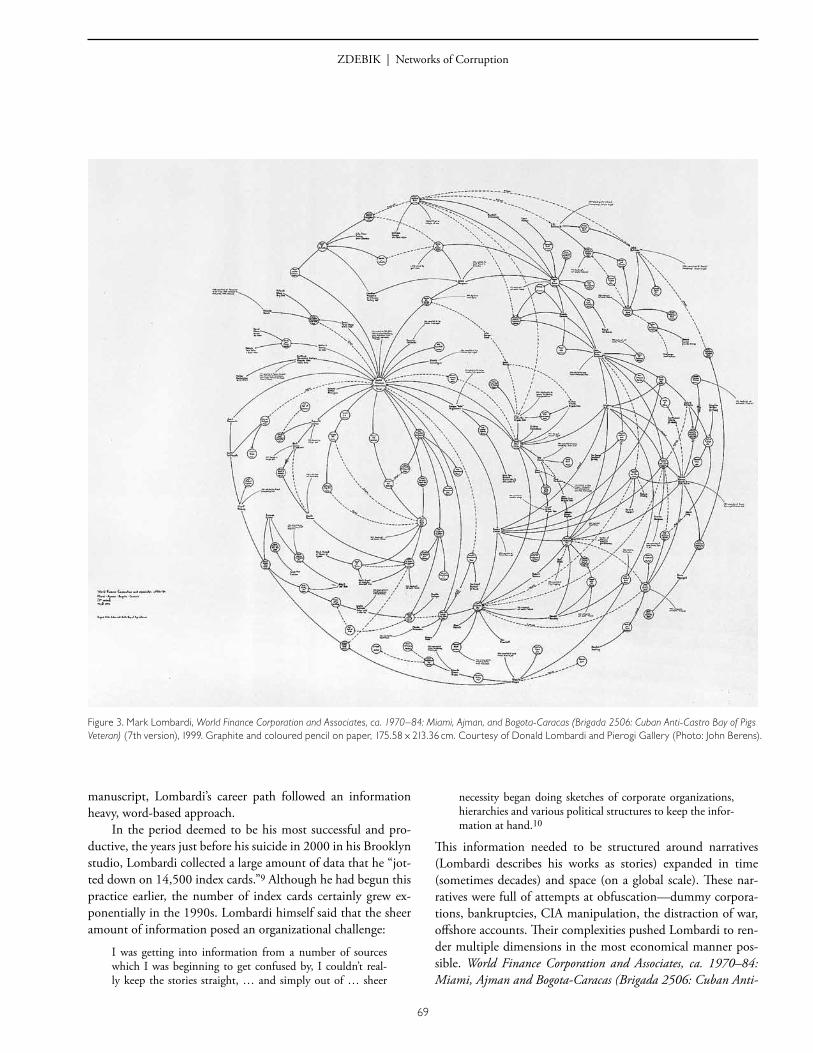
This information needed to be structured around narratives (Lombardi describes his works as stories) expanded in time (sometimes decades) and space (on a global scale). These nar-ratives were full of attempts at obfuscation—dummy corpora-tions, bankruptcies, CIA manipulation, the distraction of war, offshore accounts. Their complexities pushed Lombardi to ren-der multiple dimensions in the most economical manner pos-sible. World Finance Corporation and Associates, ca. 1970–84: Miami, Ajman and Bogota-Caracas (Brigada 2506: Cuban Anti-
Figure 3. Mark Lombardi, World Finance Corporation and Associates, ca. 1970–84: Miami, Ajman, and Bogota-Caracas (Brigada 2506: Cuban Anti-Castro Bay of Pigs Veteran) (7th version), 1999. Graphite and coloured pencil on paper, 175.58 x 213.36 cm. Courtesy of Donald Lombardi and Pierogi Gallery (Photo: John Berens).
70
RACAR XXXVI | Number 2 | 2011
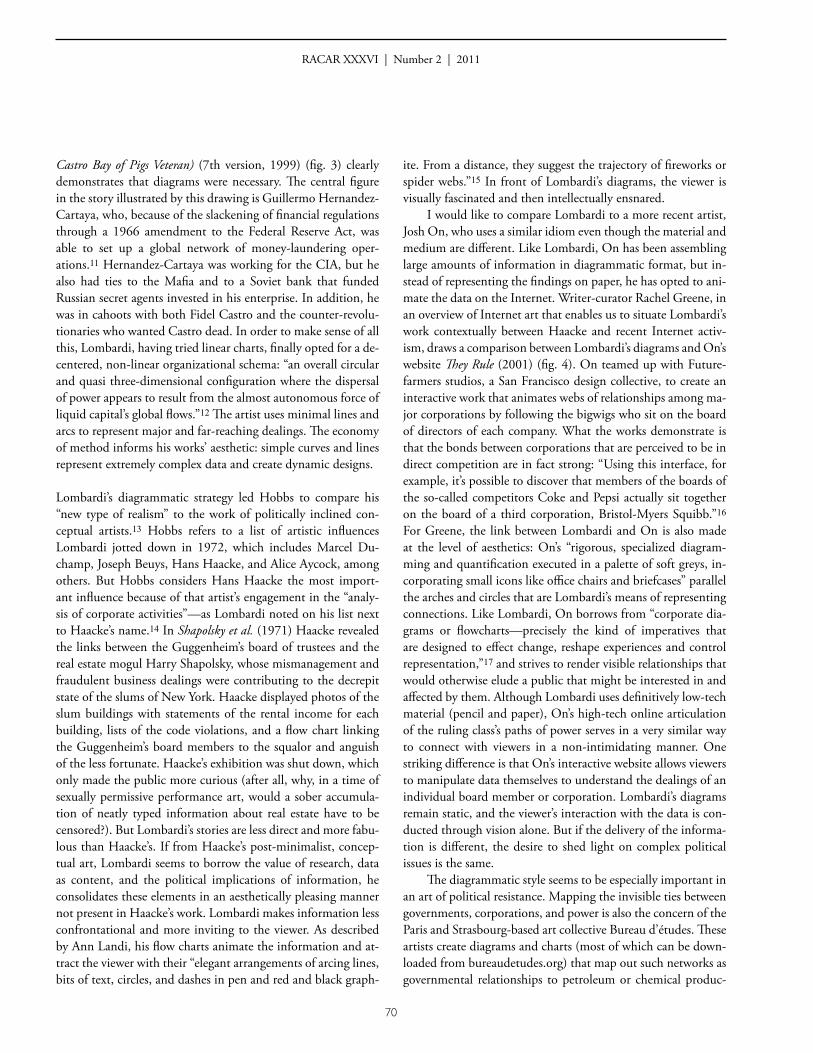
ite. From a distance, they suggest the trajectory of fireworks or spider webs.”15 In front of Lombardi’s diagrams, the viewer is visually fascinated and then intellectually ensnared.
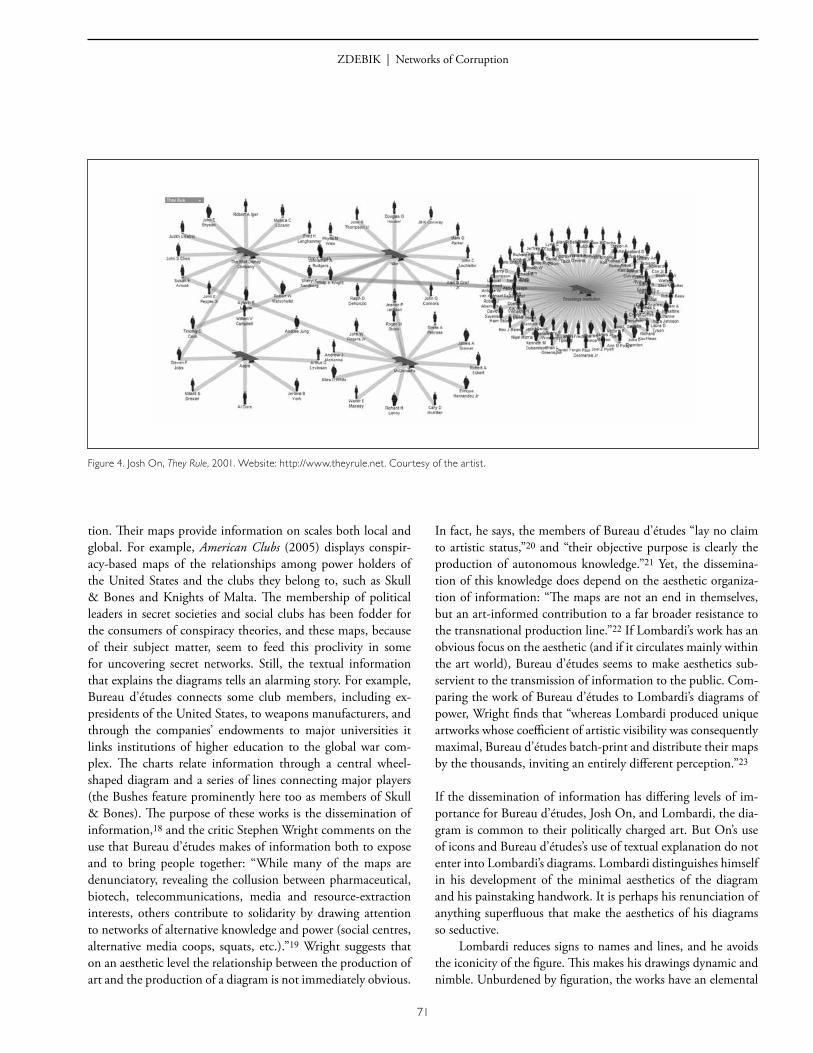
I would like to compare Lombardi to a more recent artist, Josh On, who uses a similar idiom even though the material and medium are different. Like Lombardi, On has been assembling large amounts of information in diagrammatic format, but in-stead of representing the findings on paper, he has opted to ani-mate the data on the Internet. Writer-curator Rachel Greene, in an overview of Internet art that enables us to situate Lombardi’s work contextually between Haacke and recent Internet activ-ism, draws a comparison between Lombardi’s diagrams and On’s website They Rule (2001) (fig. 4). On teamed up with Future-farmers studios, a San Francisco design collective, to create an interactive work that animates webs of relationships among ma-jor corporations by following the bigwigs who sit on the board of directors of each company. What the works demonstrate is that the bonds between corporations that are perceived to be in direct competition are in fact strong: “Using this interface, for example, it’s possible to discover that members of the boards of the so-called competitors Coke and Pepsi actually sit together on the board of a third corporation, Bristol-Myers Squibb.”16 For Greene, the link between Lombardi and On is also made at the level of aesthetics: On’s “rigorous, specialized diagram-ming and quantification executed in a palette of soft greys, in-corporating small icons like office chairs and briefcases” parallel the arches and circles that are Lombardi’s means of representing connections. Like Lombardi, On borrows from “corporate dia-grams or flowcharts—precisely the kind of imperatives that are designed to effect change, reshape experiences and control representation,”17 and strives to render visible relationships that would otherwise elude a public that might be interested in and affected by them. Although Lombardi uses definitively low-tech material (pencil and paper), On’s high-tech online articulation of the ruling class’s paths of power serves in a very similar way to connect with viewers in a non-intimidating manner. One striking difference is that On’s interactive website allows viewers to manipulate data themselves to understand the dealings of an individual board member or corporation. Lombardi’s diagrams remain static, and the viewer’s interaction with the data is con-ducted through vision alone. But if the delivery of the informa-tion is different, the desire to shed light on complex political issues is the same.
The diagrammatic style seems to be especially important in an art of political resistance. Mapping the invisible ties between governments, corporations, and power is also the concern of the Paris and Strasbourg-based art collective Bureau d’études. These artists create diagrams and charts (most of which can be down-loaded from bureaudetudes.org) that map out such networks as governmental relationships to petroleum or chemical produc-
Castro Bay of Pigs Veteran) (7th version, 1999) (fig. 3) clearly demonstrates that diagrams were necessary. The central figure in the story illustrated by this drawing is Guillermo Hernandez-Cartaya, who, because of the slackening of financial regulations through a 1966 amendment to the Federal Reserve Act, was able to set up a global network of money-laundering oper-ations.11 Hernandez-Cartaya was working for the CIA, but he also had ties to the Mafia and to a Soviet bank that funded Russian secret agents invested in his enterprise. In addition, he was in cahoots with both Fidel Castro and the counter-revolu-tionaries who wanted Castro dead. In order to make sense of all this, Lombardi, having tried linear charts, finally opted for a de-centered, non-linear organizational schema: “an overall circular and quasi three-dimensional configuration where the dispersal of power appears to result from the almost autonomous force of liquid capital’s global flows.”12 The artist uses minimal lines and arcs to represent major and far-reaching dealings. The economy of method informs his works’ aesthetic: simple curves and lines represent extremely complex data and create dynamic designs.
Lombardi’s diagrammatic strategy led Hobbs to compare his “new type of realism” to the work of politically inclined con-ceptual artists.13 Hobbs refers to a list of artistic influences Lombardi jotted down in 1972, which includes Marcel Du-champ, Joseph Beuys, Hans Haacke, and Alice Aycock, among others. But Hobbs considers Hans Haacke the most import-ant influence because of that artist’s engagement in the “analy-sis of corporate activities”—as Lombardi noted on his list next to Haacke’s name.14 In Shapolsky et al. (1971) Haacke revealed the links between the Guggenheim’s board of trustees and the real estate mogul Harry Shapolsky, whose mismanagement and fraudulent business dealings were contributing to the decrepit state of the slums of New York. Haacke displayed photos of the slum buildings with statements of the rental income for each building, lists of the code violations, and a flow chart linking the Guggenheim’s board members to the squalor and anguish of the less fortunate. Haacke’s exhibition was shut down, which only made the public more curious (after all, why, in a time of sexually permissive performance art, would a sober accumula-tion of neatly typed information about real estate have to be censored?). But Lombardi’s stories are less direct and more fabu-lous than Haacke’s. If from Haacke’s post-minimalist, concep-tual art, Lombardi seems to borrow the value of research, data as content, and the political implications of information, he consolidates these elements in an aesthetically pleasing manner not present in Haacke’s work. Lombardi makes information less confrontational and more inviting to the viewer. As described by Ann Landi, his flow charts animate the information and at-tract the viewer with their “elegant arrangements of arcing lines, bits of text, circles, and dashes in pen and red and black graph-
71
ZDEBIK | Networks of Corruption
tion. Their maps provide information on scales both local and global. For example, American Clubs (2005) displays conspir-acy-based maps of the relationships among power holders of the United States and the clubs they belong to, such as Skull & Bones and Knights of Malta. The membership of political leaders in secret societies and social clubs has been fodder for the consumers of conspiracy theories, and these maps, because of their subject matter, seem to feed this proclivity in some for uncovering secret networks. Still, the textual information that explains the diagrams tells an alarming story. For example, Bureau d’études connects some club members, including ex-presidents of the United States, to weapons manufacturers, and through the companies’ endowments to major universities it links institutions of higher education to the global war com-plex. The charts relate information through a central wheel-shaped diagram and a series of lines connecting major players (the Bushes feature prominently here too as members of Skull & Bones). The purpose of these works is the dissemination of information,18 and the critic Stephen Wright comments on the use that Bureau d’études makes of information both to expose and to bring people together: “While many of the maps are denunciatory, revealing the collusion between pharmaceutical, biotech, telecommunications, media and resource-extraction interests, others contribute to solidarity by drawing attention to networks of alternative knowledge and power (social centres, alternative media coops, squats, etc.).”19 Wright suggests that on an aesthetic level the relationship between the production of art and the production of a diagram is not immediately obvious.
In fact, he says, the members of Bureau d’études “lay no claim to artistic status,”20 and “their objective purpose is clearly the production of autonomous knowledge.”21 Yet, the dissemina-tion of this knowledge does depend on the aesthetic organiza-tion of information: “The maps are not an end in themselves, but an art-informed contribution to a far broader resistance to the transnational production line.”22 If Lombardi’s work has an obvious focus on the aesthetic (and if it circulates mainly within the art world), Bureau d’études seems to make aesthetics sub-servient to the transmission of information to the public. Com-paring the work of Bureau d’études to Lombardi’s diagrams of power, Wright finds that “whereas Lombardi produced unique artworks whose coefficient of artistic visibility was consequently maximal, Bureau d’études batch-print and distribute their maps by the thousands, inviting an entirely different perception.”23
If the dissemination of information has differing levels of im-portance for Bureau d’études, Josh On, and Lombardi, the dia-gram is common to their politically charged art. But On’s use of icons and Bureau d’études’s use of textual explanation do not enter into Lombardi’s diagrams. Lombardi distinguishes himself in his development of the minimal aesthetics of the diagram and his painstaking handwork. It is perhaps his renunciation of anything superfluous that make the aesthetics of his diagrams so seductive.
Lombardi reduces signs to names and lines, and he avoids the iconicity of the figure. This makes his drawings dynamic and nimble. Unburdened by figuration, the works have an elemental
Figure 4. Josh On, They Rule, 2001. Website: http://www.theyrule.net. Courtesy of the artist.

72
RACAR XXXVI | Number 2 | 2011
thriftiness. But they are highly complex at the same time and reveal their subjects progressively as the viewer uncovers the nar-rative of relationships. The role of the viewer is crucial since the interconnected patterns of Lombardi’s networks eschew “any cen-tral hierarchy” and must be animated by a process of thought.24 This productive and active viewing is explained by Gary Genosko as originating in the ontological depths of the diagram:
[D]iagrams are irreducible to icons because icons remain encysted in pre-established coordinates, beholden to a given meaning they can do without. Diagrams are non-representa-tional and upload what they map as they map it—they give meaning. It is via diagrams that the passage from model-ing to meta-modeling takes place; this passage is none other than that of expression plane to content plane. The diagram’s productivity entails that meta-modeling is productive of new references; it functions; forces things together; doesn’t need meaning, just the manufacture of it.25
The superiority of the diagram over the icon comes from the hy-brid, multidimensional terrain it covers and from the inclusion of viewers and their cognitive experiences. On a purely graphic level the nimbleness of the diagram derives from the way lines and curves strike a balance between a large amount of informa-tion and an economy of design.
Their very economy, their constraint, brings yet another level of understanding of the covert nature of these networks. It shows clearly that something is missing: “The sweeping arcs in his drawings… are abstract synecdoches for the missing events they signify but cannot adequately represent.”26 The spare-ness of Lombardi’s work also communicates larger economic themes. For example, as Hobbs points out, one of the artist’s goals is to lay bare the hypocrisy of the trickle-down economic theory embraced by the conservative Right.27 The trickle-down theory does not work because tax cuts get eaten up by greed and never do trickle down. Works that represent this are Charles Keating, ACC, and Lincoln Savings, ca. 1978–90 (5th version, 1995) and Charles Keating, ACC, and Lincoln Savings & Loan, Phoenix AZ–Irvine CA, ca. 1979–90 (6th version, 1998). In these works, we see Charles H. Keating of American Contin-ental Corporation purchase Lincoln Saving and Loans, which becomes ACC’s subsidiary and is used unabashedly to fund the parent company, to distribute more than $34 million in salaries to Keating’s family, and to make campaign contributions in sup-port of Ronald Reagan and George Bush Sr. When regulators come sniffing around, Keating recruits five senators—including John Glenn and John McCain—to stall the investigation. This results in the loss of $2 billion in taxpayer’s money and a brief stint in prison on the part of Keating.28 Lombardi’s work thus demonstrates the complicity of politicians in the failure of the economic theory they support.
In his critique of the Right, Lombardi makes another aes-thetic choice by selecting a diagrammatic style featuring not information display or the production of meaning but rather a classic subversion of discourse:
I’m…borrowing or pillaging part of the corporate vocabu-lary; diagrams and charts are very common in business law, whatnot. People use them to visualize deals, information, and this seemed to be an appropriate and effective way for me to convey the information.29
This strategy, adopted later by Josh On and Bureau d’études, is interesting because, as we shall now see, the development of the science of economics relied on diagrams and charts, this cloak and shadow game between abstraction and materiality, between invisible mechanisms and visualization. We can now turn to Susan Buck-Morss’s history of the graphic representa-tion of capitalism, which, from its eighteenth-century begin-nings, was already understood as “a clandestine form of wealth which knows neither king nor country.”30
Buck-Morss, a writer prolific on the subject of visual theory and visual culture, traces the genealogy of the visualization of economy during its emergence in Europe as a science. In her essay “Envisioning Capital: Political Economy on Display,” she explores eighteenth-century understandings of capitalism through the writings of Jean-Baptiste Colbert, François Ques-nay, and Adam Smith. For Colbert, economy is a zero-sum game: a king accumulates wealth by taking it from another nation that is left poor.31 Colbert’s mercantilism is a “patriotic act or even a system of power,” according to the historian Inès Murat.32 A state stands against a rival and because the market constantly demands production, the mercantile system em-powers the stronger: “The more one nation produces, the less others have the possibility to produce.”33 This doctrine made colonialist expansion seem an untapped reserve of wealth, al-lowing Europe to stuff coffers in order to fund wars and consolidate power.
Quesnay counters the mercantile model of Colbert with his concept of surplus value: a country is able to create its own wealth not by taking it from someone else but by generating it with the force of its people. Quesnay shows how “together, matter and labor contributed with every new year a visible sur-plus or net product (produit net) in excess of what had existed before.”34 Quesnay was pushed toward brevity and clarity of communication by his experience of writing for Diderot and d’Alembert’s Encyclopédie, and this led to his creation of the Tableau économique, in which columns of data were linked through a series of zigzagging lines to communicate relations in a clear and concise way.35 Quesnay explains in his correspond-ence that he developed the zigzag for “the purpose of displaying
73
ZDEBIK | Networks of Corruption
expenditure and products in a way which is easy to grasp.”36 Thus, economic data is not simply compiled but also visualized. The insistence on the visual is crucial to Buck-Morss’s theory, since the economy was never conceptualized as something that can be seen, captured, or made manifest.
Adam Smith effectively articulated the mechanism behind Quesnay’s surplus value by locating economic growth in the division of labour, which produces commodities at an astonish-ing rate. For Buck-Morss the issue is again one of visibility:
Smith will provide us with no perspective—that of God or King or Reason—from which the whole productive social body can be viewed. Nor will we ever see an object (such as land) that causes wealth to grow. We see only the material evidence of the fertile process of the division of labor: the astounding multiplication of objects produced for sale.37
The visual aspect of Smith’s theory is rooted in language, and it is through the metaphorical image of the invisible hand that he articulates his idea of the capitalist process. Smith’s model hides the multitudes of workers through whose effort wealth is produced: he does not locate production in the worker but in the division of labour, and the process is effectively invisible.
The invisibility of the mechanisms of the capitalist econ-omy and the strategies involved in its representation are to Buck-Morss the magic tricks behind Smith’s notion of the “invisible hand” of the market.38 This is especially interesting in light of the aesthetic strategies adopted by Lombardi to repre-sent clandestine networks functioning within a system already invested in camouflage.
The emergence of capitalist economic models needed vis-ual representation in order to legitimize their invisibility: “Con-temporaneous with Smith’s work was a crucial innovation in the field of visual representation that made it possible to chart the effects of the invisible hand.”39 Here Buck-Morss turns to the eighteenth-century political economist William Playfair, whose charts of imports and exports have no “direct analogy” with “the physical world.”40 The relational diagrams that Playfair uses to illustrate his Commercial and Political Atlas give visual embodi-ment to the effects of growth and decline, obscuring real-world variation: “In arguing causes on the basis of effects, in showing correlations leading to decline or growth over time, data graph-ics show patterns of market behaviour that emerge unintention-ally from the aggregate of individual decisions, the seeming chaos of private persons and their self-interested desires.”41 The chart’s success in visually communicating data is central to this subterfuge. Although charts had been used since Pliny’s time, William Playfair’s diagrams introduced a new kind of visual lan-guage for quantifiable data. According to the statistician How-ard Wainer: “Nothing that had been produced before was even close. Even today, after more than two centuries of graphical ex-
perience, Playfair’s graphs remain exemplary standards for clear communication of quantitative phenomena.”42 The reason is the creativeness with which these charts illustrate information. They consolidate disparate abstract effects and embody them in the aesthetics of scientific display. At the same time, they legit-imize the depersonalization of the work force.
Buck-Morss further highlights the impact of these develop-ments in the visual representation of economy:
The great marvel is that once a scientific object is discovered (invented), it takes on agency. The economy is now seen to act in the world; it causes events, creates effects. Because the economy is not found as an empirical object among other worldly things, in order for it to be “seen” by the human perceptual apparatus it has to undergo a process, crucial for science, of representational mapping.43
And so, from Quesnay’s zigzags to Playfair’s charts suggesting something as intangible as the willingness to buy or sell, charts take on a life of their own44 and produce real-world effects on behaviour, since traders decide to sell or buy based on these representations. According to Buck-Morss, diagrammatic rep-resentations of the economy grew out of geographical mappings designed to shift the perspectives of viewers and to allow them to find their bearings, but economical mappings, on the con-trary, dim overall vision.
Lombardi in his typically mercurial way suggests that his own diagrams are “rather graceful maps [that] turn out, upon closer examination, to represent a vast and sometimes disturb-ing web of international political business associations.”45 His “maps” are thus a subversion of the subversion of the original maps to which Buck-Morss refers. The aesthetics of this sub-versive process are better understood through the writings of Gilles Deleuze and Félix Guattari. If with Buck-Morss we have seen that the economy needs some kind of embodiment in the form of charts and graphs, with Deleuze and Guattari we are going to focus on the philosophical perspective of the concept of the diagram. They argue that the diagram has a positive aspect that does not necessarily reside in its content— as we observed, that can be quite alarming—but rather in its revelatory function.
The diagram is both visual and textual. The diagram pro-vides directions or instructions in potentia and is analogous with the process of thought. For example, in the eighteenth-century, knowledge in the Encyclopédie was disseminated through a sys-tematic organization of terms and of black lines on white sur-faces in the form of schematic illustrations. These illustrations, the planches of the Encyclopédie, give insight into the relation-ship between knowing and the visible, and attempt to make knowledge visible. Most fittingly, the Encyclopédie’s diagram charting the multiple categories that make up understanding
74
RACAR XXXVI | Number 2 | 2011
(entendement), entitled Système figuré des connaissances humaines, resembles the more linear drawings of Lombardi. There, under-standing is divided into three columns (memory, reason, and imagination), and the various disciplines, sciences, and categor-ies of expression are linked through an intricate, if horizontal and linear, network of brackets and dividing lines. The chart has the form of the classical tree formation with its many branches of understanding, and it is another effort to give visual represen-tation to intellectual, or incorporeal, items.
But if the work of Lombardi (and On and Bureau d’études) is encyclopedic in the sheer amount of information consolidated within diagrams, Lombardi’s relational models are not so much hierarchical as they are fluid and dynamic. That is why the aes-thetic element of Lombardi’s designs can be linked to another organizational model, one particularly associated with Deleuze and Guattari: the rhizome. Deleuze and Guattari introduce the concept of the rhizome at the beginning of their well-known book A Thousand Plateaus. They oppose it to the classical tree model of classifying understanding, which works with dualities, bifurcating knowledge hierarchically from a central, dominant trunk. The rhizome makes connections that are unexpected and experimental, and it can stem from and split into a multi-plicity of threads at any point. These connections can even be interactive.
One of the “approximate characteristics” of the rhizome as laid out by Deleuze and Guattari—one particularly interesting to a study of Lombardi—is that it invokes both cartography and decalcomania (the technique of using pressure to transfer pictures or designs from paper to another surface).46 Deleuze and Guattari establish a link between the tree model and de-calcomania: both function through “tracing,” showing us what is already there. Then they explain that the rhizome operates rather like a map, and a map is more dynamic than a tracing: “It is entirely oriented towards an experimentation in contact with the real. The map does not reproduce an unconscious. It fosters connections between fields.”47 To avoid establishing a duality between tracing and mapping—they are trying at all costs to avoid dualities in the rhizome model—they fold the rhizome onto the tracing: “It is a question of method: the tracing should always be put back in the map.”48 Deleuze and Guattari see the diagram as having two successive states. In one state it still re-lates to movements of deterritorialization, and the content and expression can still be distinguished—this would be akin to the tracing. In the other state, “an absolute threshold of deterri-torialization has been reached” and content and expression are indistinguishable.49 In neither state is a diagrammatic drawing wholly representational (some details are omitted so not as to overburden the design), but it cannot be absolutely abstract (or the viewer would not be able to receive actual information). If the tracing functions like a photograph, as Deleuze and
Guattari contend,50 and the map represents pure potentiality, the diagram takes a snapshot of a multiplicity in a constant state of flux. In this sense, tracing and mapping together constitute a diagram—a reified potentiality.
Deleuze finds in the writings of Michel Foucault a way to understand the multidimensional linking of diagrams to power and visibility. In the book bearing his friend’s name, Deleuze writes, “What can we call such a new informal dimension? On one occasion Foucault gave it its most precise name: it is a ‘dia-gram’, that is to say a ‘functioning … [which] must be detached from any specific use.’”51 For example, Bentham’s Panopticon—a prison where the prisoners’ cells are stacked around a central tower so that a single guard can see every one without being seen—embodies the diagram of surveillance. This abstracted diagram of a prison can be applied to schools, barracks, or hos-pitals—different institutions that operate on a similar model of surveillance. The diagram, before it is incarnated into a specific situation, contains abstract forces and strategies of power (in this case surveillance) but in an unformed state. These relations of forces are invisible in themselves—they are incorporeal— but their consequences are very real, just like a fraud through a network of dummy corporations is invisible but at some point becomes very real in its effects.
A diagrammatic drawing is a map of thought on paper and in the social field (it is abstract and representational), and the diagram’s interlinking of these dimensions makes it an abstract machine, an assemblage or arrangement of virtual and actual information connected to the totality of our experiences.
The characteristics of the diagram as enumerated by Deleuze are also present in Lombardi’s work. First, it is de-fined by informal, abstracted functions and unformed matter. Lombardi’s diagrams cannot be definitive because information is missing. Second, it makes no distinction between content and expression; the vagueness of the curves signifying “influ-ence” play out on a material level—exchange of money, and an aesthetic one—representation of the flow of power. Third, it is both discursive and non-discursive, textually declarative and visually abstract. Deleuze concludes that the diagram functions like a peculiar machine: “It is a machine that is blind and mute but makes others see and speak.”52 In Lombardi’s drawings, viewers must create their own paths.
That the diagram is necessary to capture power and/or cor-ruption is clear when we see how Deleuze, via Foucault, explains the nature of power. Foucault shows that power is a strategy whose effects are attributed to “dispositions, maneuvers, tactics, techniques, functioning”; “it is exercised rather than possessed; it is not the ‘privilege’, acquired or preserved, of the dominant class, but the overall effect of its strategic positions.”53 Deleuze adds that “power is not homogeneous but can be defined only by the particular points through which it passes.”54 Lombardi’s
75
ZDEBIK | Networks of Corruption
work practically illustrates this definition. The reason why dia-grams portray power so well is because power is fluid; it has no substance, only effects: “Power has no essence; it is simply oper-ational. It is not an attribute but a relation.”55 Diagrams, with their lines and curves, aesthetically illustrate the assemblages of effects that power and corruption engender.
For Deleuze, Foucault’s writing offers a superb means to study the aesthetic aspect of the diagram, and at one point, he even likens his writing to graphs.56 According to Deleuze, Foucault’s Discipline and Punish is a negotiation between a highly aesthetic style and a political content, and the more ab-stract (“microphysical”) Foucault’s subject matter becomes, the more visually expressive the writing is: “Here analysis becomes increasingly microphysical and the illustrations increasingly physical, expressing the ‘effects’ of analysis, not in a causal way but through the use of optics and colour: the red on red of the tortured inmates contrast with the grey on grey of prisons.”57 It is as if the red bodies on the grey backgrounds of prison walls described in Foucault’s texts are graphic dots operating in a graph or a schematic drawing. The idea is that on a micro-physical level of analysis, when we are dealing with functions and effects instead of facts and objects, this graphic, illustra-tive style of analysis gives shape to previously invisible phenom-ena. We can draw parallels between the visuality of Foucault’s method as seen by Deleuze and the artistic style of Lombardi, who renders visible through diagrams what was previously discursively inexpressible. To capture an incorporeal subject that wants to remain clandestine, visual representation or text alone will be insufficient. But something between the visual and the textual, a representational device that straddles both, will work.
Non-discursive signs are of the utmost importance in the economy of Lombardi’s diagrams. They articulate the passage of monetary power from one abstract space to another. Lines made up of dashes or corkscrew patterns show the invisible flow of money. But a particular element in Lombardi’s work that cap-tures the non-corporeal phenomena of “relation” is the arrow. Tan Lin explains the significance of the arrow by quoting from the key Lombardi provided for deciphering the non-discursive elements of his drawings:
Like maps, Lombardi’s drawings use a graphic shorthand that viewers need to learn in order to navigate the material. A curved line with an arrow on one end, far instance, indi-cates “some kind of influence or control.” A line with arrows at both ends describes “some type of mutual relationship or association.”58
The arrow has representational force. It is succinct, easily under-stood, and spatial, and it exists only at the graphic level. It is somewhere between the visual and the textual. Foucault, in This
is Not a Pipe, famously describes the collapse of the boundaries between the visual and the textual in the work of Paul Klee. Ac-cording to Foucault, when Klee introduced typographic signs within painted landscapes he brought the representational (or visual) and the discursive (or textual) to the same plane. For Foucault, this is a very important development in art since it inaugurates a new dimension of expression. A key element of this dimension is the arrow:
And at the nexus of these figures and signs, the arrow that crops up so often (the arrow, sign bearing a primal resem-blance, like a graphic onomatopoeia, and shape that formu-lates an order)—the arrow…prescribes the direction that the gaze must follow, or rather the line along which it must imaginatively shift the figure provisionally and a bit arbitrar-ily placed here.59
At the nexus of the visual and textual, Lombardi’s arrows also communicate and make obvious the vectors that the viewer must follow to understand his narratives.
Lombardi’s work organizes certain kinds of information and pushes towards new knowledge without really getting there because of the essentially secretive nature of the subject. But the visual display of the data provides an expression of this shortcoming and gives it a form: the aesthetics of the diagram point to the lack encountered in research. Deleuze writes, “We wonder if there are not thresholds, for example aesthetic ones, which mobilize knowledge in a direction that is different to that of science, allowing us to offer a definition of a pictorial work, while remaining with the discursive practices to which they be-long.”60 This leads Deleuze to deduce that “science and poetry are equal forms of knowledge.”61 In the diagram, he concludes, science, or research or the tracing of information, is coupled with poesis—creation—and mapping, and this describes Lombardi’s drawings perfectly.
Lombardi’s relational charts of global networks of corruption function essentially as displays of information. They show vast amounts of it in an effective and economical way and articulate systems of relations not understood otherwise. This revelatory aspect of Lombardi’s work is present also in the political art of Hans Haacke, Josh On, and Bureau d’études, all of whom put a premium on research and information display. Whereas Lombardi is close to Haacke in his inhabiting of the gallery and museum context, On and Bureau d’études find differ-ent strategies of dissemination, On through the Internet and Bureau d’études at grassroots political demonstrations. But all are close to Lombardi in their subject matter—corporations and the connections they make on the global level— and in their reliance on diagrams. I have offered here a new way of theorizing the work of Lombardi, and by extension, the work
76
RACAR XXXVI | Number 2 | 2011
16 Joline Blais and Jon Ippolito, At the Edge of Art (London, 2006).17 Rachel Greene, Internet Art (London, 2004), 137. 18 Tom Holert, “Best of 2002: A Special Issue,” Artforum 41, 4
(2002): 124.19 Stephen Wright, “The Future of the Reciprocal Readymade: An
Essay on Use Value and Art-Related Practice / L’Avenir du ready-made réciproque: valeur d’usage et pratiques para-artistiques,” Parachute 117 (2005): 129.
20 Wright, “The Future of the Reciprocal Readymade,” 130.21 Wright, “The Future of the Reciprocal Readymade,” 130.22 Wright, “The Future of the Reciprocal Readymade,” 130.23 Wright, “The Future of the Reciprocal Readymade,” 130.24 Hobbs, Mark Lombardi, 32. 25 Gary Genosko, Félix Guattari: A Critical Introduction (London,
2009), 11. 26 Hobbs, Mark Lombardi, 47. 27 Hobbs, Mark Lombardi, 41.28 Hobbs, Mark Lombardi, 92–94.29 Lombardi quoted in Hobbs, Mark Lombardi, 106.30 Quesnay quoted in Susan Buck-Morss, “Envisioning Capital: Pol-
itical Economy on Display,” Visual Display: Culture Beyond Appear-ance, ed. Lynne Cooke and Peter Wollen (Seattle, 1995), 120.
31 Buck-Morss, “Envisioning Capital,” 18.32 Inès Murat, Colbert (Paris, 1980), 200.33 Murat, Colbert, 202.34 Buck-Morss, “Envisioning Capital,” 118. 35 Gianni Vaggi, The Economics of François Quesnay (Durham, 1987),
23.36 Quesnay quoted in Vaggi, The Economics of François Quesnay, 26.37 Buck-Morss, “Envisioning Capital,” 121. 38 Buck-Morss, “Envisioning Capital,” 128.39 Buck-Morss, “Envisioning Capital,” 128. 40 Buck-Morss, “Envisioning Capital,” 129. 41 Buck-Morss, “Envisioning Capital,” 129. 42 Howard Wainer, Graphic Discovery: A Trout in the Milk and Other
Visual Adventures (Princeton, 2006), 16.43 Buck-Morss, “Envisioning Capital,” 116. 44 Quesnay quoted in Buck-Morss, “Envisioning Capital,” 116. 45 Lombardi quoted in Hobbs, Mark Lombardi, 39. 46 Gilles Deleuze and Félix Guattari, A Thousand Plateaus: Capitalism
and Schizophrenia, trans. Brian Massumi (Minneapolis, 2005), 12.47 Deleuze and Guattari, A Thousand Plateaus, 12.48 Deleuze and Guattari, A Thousand Plateaus, 13.49 Deleuze and Guattari, A Thousand Plateaus, 91.50 Deleuze and Guattari, A Thousand Plateaus, 13.51 Gilles Deleuze, Foucault, trans. Seán Hand (Minneapolis, 1995),
34. 52 Deleuze, Foucault, 34. 53 Deleuze, quoting Foucault, in Foucault, 25.54 Deleuze, Foucault, 25.
of other recent artists using the diagram, showing first how Buck-Morss argues that diagrammatic display is, and has always been, essential to the construction and dissemination of theor-ies of capitalist economics. The artists’ use of charts, maps, and schemas to reveal networks of corruptions is then an apt tech-nique to represent the clandestine underbelly of global capital-ism. I then introduced Deleuze and Guattari to show how the philosophical concept of the diagram is at its basis visual and organizational, having an informal, pre-discursive dimension that makes it a fitting way of representing subjects that are by nature invisible. The diagram articulates relations. And, in an aesthetic way, this function can be symbolized by the arrow, which is itself a crucial element in Lombardi’s charts. In effect, Lombar-di displays narratives of relations among capitalist players and organizations in a minimal aesthetic technique, and using this approach, he is able to bring expansive, elusive networks before our eyes.
Whereas past writers have demonstrated the suitability of the diagrammatic form of drawing for the purpose of rendering visible the elusive subject matter of the economically clandes-tine, I set out to highlight the importance for the visual arts of the diagrammatic form in itself. By considering that the diagram is necessary for the display of incorporeal economic phenomena and that the diagram gives shape to the unformed matter of thought, I wanted to show that Lombardi’s work not only brings to light networks of corruption but also articulates an essential relationship between vision and thought.
Notes
1 Judith Olch Richards, “Forward and Acknowledgements,” Mark Lombardi: Global Networks (New York, 2003), 7.
2 Robert Hobbs, Mark Lombardi: Global Networks (New York, 2003).
3 Hobbs, Mark Lombardi, 15, 32. 4 Hobbs, Mark Lombardi, 97–99. 5 Hobbs, Mark Lombardi, 79–82. 6 Hobbs, Mark Lombardi, 79. 7 Tan Lin, “Following the Money,” Art in America 91, 11 (2003):
142–47, 177. 8 Lin, “Following the Money,” 147. 9 Ann Landi, “Mark Lombardi: Global Networks,” ARTnews 10, 4
(2004): 122. 10 Andy Mann, “Interview with Mark Lombardi,” New York States of
Mind: Art in the City, ed. Shahee Merali (London, 2008), 106. 11 Hobbs, Mark Lombardi, 67.12 Hobbs, Mark Lombardi, 66.13 Hobbs, Mark Lombardi, 34. 14 Hobbs, Mark Lombardi, 37.15 Landi, “Mark Lombardi: Global Networks,” 122.
77
ZDEBIK | Networks of Corruption
55 Deleuze, Foucault, 27.56 Gilles Deleuze, Two Regimes of Madness: Texts and Interviews
1975–1995, ed. David Lapoujade, trans. Amy Hodges and Mike Taormina (New York, 2006), 251.
57 Deleuze, Foucault, 24.58 Lin, “Following the Money,” 147.59 Michel Foucault, This is Not a Pipe, trans. James Harkness, (Berke-
ley, 1983), 33.60 Deleuze, Foucault, 20. 61 Deleuze, Foucault, 20.