Embed Size (px)
Citation preview
Nordisk kernesikkerhedsforskningNorrænar kjarnöryggisrannsóknir
Pohjoismainen ydinturvallisuustutkimusNordisk kjernesikkerhetsforskning
Nordisk kärnsäkerhetsforskningNordic nuclear safety research
NKS-202 ISBN 978-87-7893-271-6
Stratification issues in the primary system. Review of available validation experiments and State-of-the-Art in modelling capabilities (StratRev)
Johan Westin, Vattenfall Research and Development AB Mats Henriksson,Vattenfall Research and Development AB
Timo Pättikangas, VTT Timo Toppila, Fortum Nuclear Services Ltd Tommi Rämä, Fortum Nuclear Services Ltd Pavel Kudinov, KTH Nuclear Power Safety
Henryk Anglart, KTH Nuclear Reactor Technology
August 2009
Abstract The objective of the present report is to review available validation experiments and State-of-the-Art in modelling of stratification and mixing in the primary system of Light Water Reactors. A topical workshop was arranged in Älvkarleby in June 2008 within the framework of BWR-OG, and the presentations from various utilities showed that stratification issues are not unusual and can cause costly stops in the production. It is desirable to take actions in order to reduce the probability for stratification to occur, and to develop well-validated and accepted tools and procedures for analyzing upcoming stratification events. A research plan covering the main questions is outlined, and a few suggestions regarding more limited research activities are given. Since many of the stratification events results in thermal loads that are localized in time and space, CFD is a suitable tool. However, the often very large and complex geometry posses a great challenge to CFD, and it is important to perform a step-by-step increase in complexity with intermediate validation versus relevant experimental data. The ultimate goal is to establish Best Practice Guidelines that can be followed both by utilities and authorities in case of an event including stratification and thermal loads. An extension of the existing Best Practice Guidelines for CFD in nuclear safety applications developed by OECD/NEA is thus suggested as a relevant target for a continuation project.
Key words Nuclear power, stratification, primary system, reactor pressure vessel, validation, CFD NKS-202 ISBN 978-87-7893-271-6 Electronic report, August 2009 NKS Secretariat NKS-776 P.O. Box 49 DK - 4000 Roskilde, Denmark Phone +45 4677 4045 Fax +45 4677 4046 www.nks.org e-mail [email protected]

STRATIFICATION ISSUES IN THE PRIMARY SYSTEM. REVIEW OF AVAILABLE VALIDATION EXPERIMENTS AND STATE-OF-THE-ART IN MODELLING CAPABILITIES (StratRev)
Johan Westin, Mats Henriksson Vattenfall Research and Development AB Timo Pättikangas VTT Timo Toppila, Tommi Rämä Fortum Nuclear Services Ltd Pavel Kudinov, KTH Nuclear Power Safety Henryk Anglart KTH Nuclear Reactor Technology
Repor t Number U 09:87
2009-06-25
Stratification issues in the primary system. Review of available validation experiments and State-of-the-Art in modelling capabilities (StratRev)
From Date Serial No.
Project: StratRev 2009-06-25 U 09:87
Author/s Access Project No.
Johan Westin, Mats Henriksson, VRD Timo Pättikangas, VTT Timo Toppila, Tommi Rämä, Fortum Pavel Kudinov, KTH-NRT Henryk Anglart, KTH-NPS
Full Access PR.66.6
Customer Reviewed by
StratRev reference group
OKG AB NKS
Att. Lilly Burel-Nilsson Att. Patrick Isaksson
Vattenfall Power Consultant
SE-57283 Oskarshamn SE-16216 Stockholm
Key Word No. of pages Appending pages
Nuclear power, stratification, primary system, reactor pressure vessel, validation, CFD
62 2
Summary The objective of the present report is to review available validation experiments and State-of-the-Art in modelling of stratification and mixing in the primary system of Light Water Reactors. A topical workshop was arranged in Älvkarleby in June 2008 within the framework of BWR-OG, and the presentations from various utilities showed that stratification issues are not unusual and can cause costly stops in the production. It is desirable to take actions in order to reduce the probability for stratification to occur, and to develop well-validated and accepted tools and procedures for analyzing upcoming stratification events.
A research plan covering the main questions is outlined, and a few suggestions regarding more limited research activities are given. Since many of the stratification events results in thermal loads that are localized in time and space, CFD is a suitable tool. However, the often very large and complex geometry posses a great challenge to CFD, and it is important to perform a step-by-step increase in complexity with intermediate validation versus relevant experimental data.
The ultimate goal is to establish Best Practice Guidelines that can be followed both by utilities and authorities in case of an event including stratification and thermal loads. An extension of the existing Best Practice Guidelines for CFD in nuclear safety applications developed by OECD/NEA is thus suggested as a relevant target for a continuation project.
Distribution list Company Department Name Number of NKS Patrick Isaksson
OKG AB Lilly Burel-Nilsson
OKG AB Thomas Probert
Forsmarks Kraftgrupp AB Farid Alavyoon
Forsmarks Kraftgrupp AB Göran Hultqvist
Ringhals AB Christian Lindbäck
Ringhals AB Hans Nilsson
Westinghouse Electric Sweden Anders Andrén
SSM Oddbjörn Sandervåg
SSM Wiktor Frid
Vattenfall Research and Development Johan Westin
Vattenfall Research and Development Mats Henriksson
VTT Timo Pättikangas
VTT Timo Vanttola
Fortum Nuclear Services Timo Toppila
Fortum Nuclear Services Tommi Rämä
TVO Juha Poikolainen
STUK Eero Virtanen
KTH Nuclear Power Safety Pavel Kudinov
KTH Nuclear Reactor Technology Henryk Anglart
Table of Contents Page
1 INTRODUCTION 1
1.1 Background and objectives 1 1.2 Issues related to stratification and mixing 2
1.2.1 The HTG-event 3 1.2.2 Stratification in T-junctions (dead legs) 5 1.2.3 Stratification in horizontal surge lines 7
1.3 Important physical phenomena 8
2 EXPERIMENTS ON STRATIFICATION IN PIPING 10
2.1 HDR-experiments on stratification in piping 10 2.2 ROSA Project: Test on ECCS water injection 11 2.3 Plant data on stratification in surge lines 12 2.4 Discussion 12
3 EXPERIMENTS RELATED TO STRATIFICATION IN THE RPV 13
3.1 Integral large scale experiments 13 3.2 Separate effect studies 18 3.3 Discussion 24
4 CURRENT MODELLING CAPABILITIES 26
4.1 Use of Computational Fluid Dynamics (CFD): Examples, limitations and suggestions 26 4.1.1 Pressurizer surge line 26 4.1.2 Stratification in T-junctions 27 4.1.3 Stratification in the RPV 29
4.2 Non-CFD prediction tools 31 4.3 On the influence of the core power distribution and geometry simplifications 33
5 BWR-OG WORKSHOP ON THERMAL STRATIFICATION 35
5.1 Day 1 – June 3 35 5.1.1 BWR-OG Thermal Stratification Committee Update 35 5.1.2 The HTG-event at Oskarshamn 3 35 5.1.3 The HTG-event at Oskarshamn 3 – Consequences for other Nordic
BWRs 36 5.1.4 Cold water injection transient at NPP Krümmel 36 5.1.5 Stratification phenomena at NPP Gundremmingen II 37 5.1.6 Events and evaluation of thermal stratification at Leibstadt NPP 38
5.1.7 Reliance on RPV bottom head drain line flow for temperature indication 38
5.1.8 BWR-OG current issues 39 5.2 Day 2 – June 4 40
5.2.1 Safety importance of stratification phenomena – Regulatory aspects 40 5.2.2 Industrial buoyant flows: Features and advanced modelling 40 5.2.3 Experiments on mixing and stratification 41 5.2.4 Simulation of thermal stratification in T-junctions using scale resolving
turbulence models in ANSYS CFD 42 5.2.5 CFD modelling of mixing and stratification 42 5.2.6 CFD simulation of the thermal mixing in the upper plenum and hot leg
in a PWR 43 5.2.7 Brittle fracture safety analysis of German RPVs based on advanced
thermal hydraulic analysis 44 5.2.8 The language of BWR design basis 44 5.2.9 Stratification issues in the primary system. Status report from an
ongoing State-of-the-Art review. 44 5.3 Final discussion 45
6 POSSIBLE CONTINUATION PROJECTS 48
6.1 Goals and motivation 48 6.2 Outline of a research program for the development of BPG for stratification
events 49 6.2.1 Comments 51
6.3 Possible initial tasks 51 6.3.1 Conservative assessment of the impact on the structure 51 6.3.2 Generic experiment on the break-up of a stratified layer 52 6.3.3 Experiment on the break-up of a stratified layer in a tank 53
7 CONCLUDING REMARKS 55
8 REFERENCES 57

Appendices Number of Pages
APPENDIX BWR-OG Workshop, Program and list of participants 2
StratRev
Page 1 (62)
1 Introduction
1.1 Background and objectives
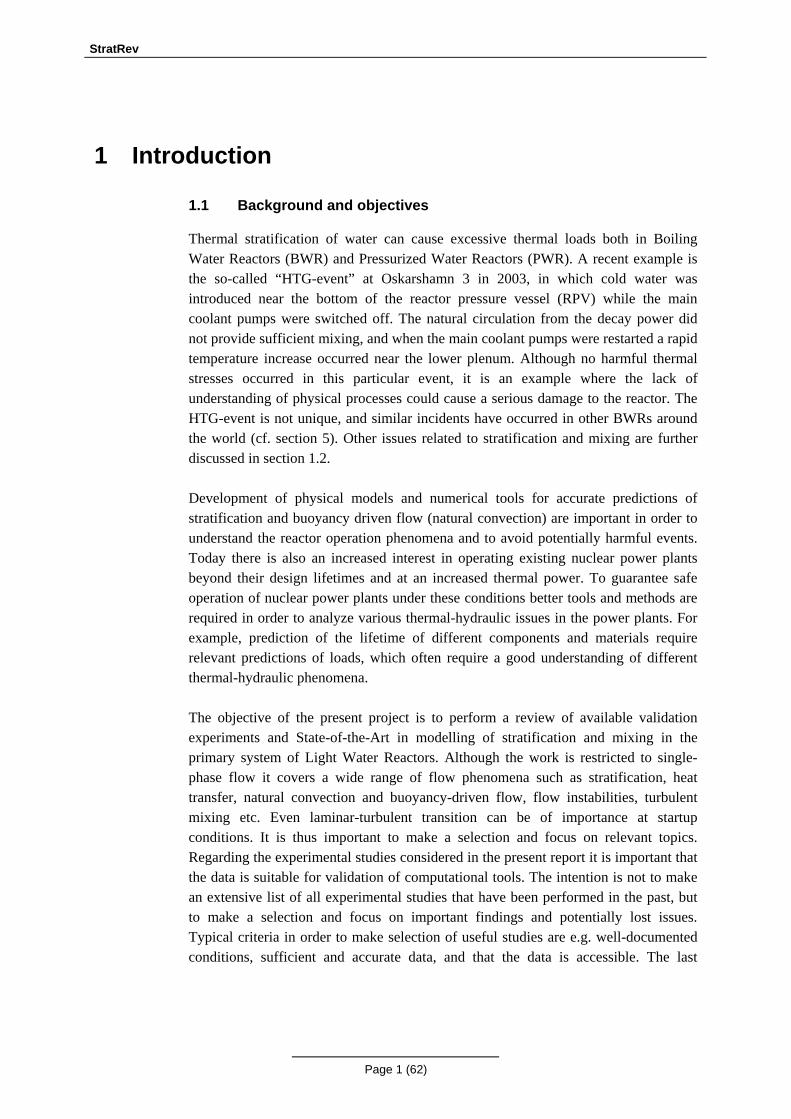
Thermal stratification of water can cause excessive thermal loads both in Boiling Water Reactors (BWR) and Pressurized Water Reactors (PWR). A recent example is the so-called “HTG-event” at Oskarshamn 3 in 2003, in which cold water was introduced near the bottom of the reactor pressure vessel (RPV) while the main coolant pumps were switched off. The natural circulation from the decay power did not provide sufficient mixing, and when the main coolant pumps were restarted a rapid temperature increase occurred near the lower plenum. Although no harmful thermal stresses occurred in this particular event, it is an example where the lack of understanding of physical processes could cause a serious damage to the reactor. The HTG-event is not unique, and similar incidents have occurred in other BWRs around the world (cf. section 5). Other issues related to stratification and mixing are further discussed in section 1.2. Development of physical models and numerical tools for accurate predictions of stratification and buoyancy driven flow (natural convection) are important in order to understand the reactor operation phenomena and to avoid potentially harmful events. Today there is also an increased interest in operating existing nuclear power plants beyond their design lifetimes and at an increased thermal power. To guarantee safe operation of nuclear power plants under these conditions better tools and methods are required in order to analyze various thermal-hydraulic issues in the power plants. For example, prediction of the lifetime of different components and materials require relevant predictions of loads, which often require a good understanding of different thermal-hydraulic phenomena. The objective of the present project is to perform a review of available validation experiments and State-of-the-Art in modelling of stratification and mixing in the primary system of Light Water Reactors. Although the work is restricted to single-phase flow it covers a wide range of flow phenomena such as stratification, heat transfer, natural convection and buoyancy-driven flow, flow instabilities, turbulent mixing etc. Even laminar-turbulent transition can be of importance at startup conditions. It is thus important to make a selection and focus on relevant topics. Regarding the experimental studies considered in the present report it is important that the data is suitable for validation of computational tools. The intention is not to make an extensive list of all experimental studies that have been performed in the past, but to make a selection and focus on important findings and potentially lost issues. Typical criteria in order to make selection of useful studies are e.g. well-documented conditions, sufficient and accurate data, and that the data is accessible. The last
StratRev
Page 2 (62)
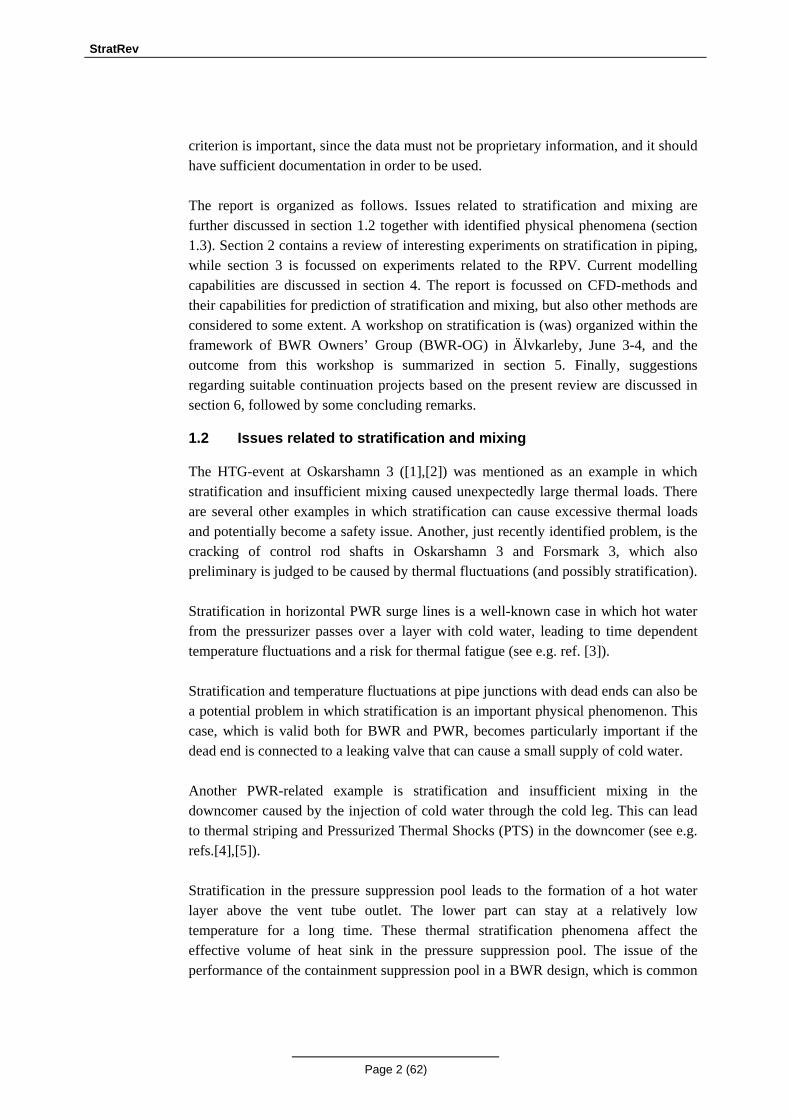
criterion is important, since the data must not be proprietary information, and it should have sufficient documentation in order to be used. The report is organized as follows. Issues related to stratification and mixing are further discussed in section 1.2 together with identified physical phenomena (section 1.3). Section 2 contains a review of interesting experiments on stratification in piping, while section 3 is focussed on experiments related to the RPV. Current modelling capabilities are discussed in section 4. The report is focussed on CFD-methods and their capabilities for prediction of stratification and mixing, but also other methods are considered to some extent. A workshop on stratification is (was) organized within the framework of BWR Owners’ Group (BWR-OG) in Älvkarleby, June 3-4, and the outcome from this workshop is summarized in section 5. Finally, suggestions regarding suitable continuation projects based on the present review are discussed in section 6, followed by some concluding remarks.
1.2 Issues related to stratification and mixing
The HTG-event at Oskarshamn 3 ([1],[2]) was mentioned as an example in which stratification and insufficient mixing caused unexpectedly large thermal loads. There are several other examples in which stratification can cause excessive thermal loads and potentially become a safety issue. Another, just recently identified problem, is the cracking of control rod shafts in Oskarshamn 3 and Forsmark 3, which also preliminary is judged to be caused by thermal fluctuations (and possibly stratification). Stratification in horizontal PWR surge lines is a well-known case in which hot water from the pressurizer passes over a layer with cold water, leading to time dependent temperature fluctuations and a risk for thermal fatigue (see e.g. ref. [3]). Stratification and temperature fluctuations at pipe junctions with dead ends can also be a potential problem in which stratification is an important physical phenomenon. This case, which is valid both for BWR and PWR, becomes particularly important if the dead end is connected to a leaking valve that can cause a small supply of cold water. Another PWR-related example is stratification and insufficient mixing in the downcomer caused by the injection of cold water through the cold leg. This can lead to thermal striping and Pressurized Thermal Shocks (PTS) in the downcomer (see e.g. refs.[4],[5]). Stratification in the pressure suppression pool leads to the formation of a hot water layer above the vent tube outlet. The lower part can stay at a relatively low temperature for a long time. These thermal stratification phenomena affect the effective volume of heat sink in the pressure suppression pool. The issue of the performance of the containment suppression pool in a BWR design, which is common
StratRev
Page 3 (62)
for Sweden and Finland, was addressed in a number of experimental studies including the latest experiment in PUMA [6] and POOLEX [7] facilities. Early in the project it was decided to focus on three specific stratification issues, namely the HTG-event, stratification in T-junctions and stratification in horizontal surge lines. It should be emphasized that the present review is not restricted to these three issues, but they have been given special attention in order to identify important physical phenomena. More details are given in the subsequent sections.
1.2.1 The HTG-event
The HTG-event1 at Oskarshamn 3 occurred on September 23, 2003, and the course of events is described in detail in refs. [1],[2]. The incident started with a grid failure leading to shutdown of all eight main circulation pumps (MCP). Approximately 1.5 h after scram the decay heat removal system (system 321) and the crud removal system (354) were started. During the time interval of 2.5 h from the start of the crud removal system until the restart of the first MCP approximately 104 m3 of water with a temperature of 60°C was sipping into the lower plenum of the RPV. Since the residual heat was not high enough to create sufficient thermal mixing, stratification occurred with a temperature of approximately 135°C at the bottom of the lower plenum. When the MCPs restarted (two pumps were started within two minutes), hot water jets (260-270°C) from the downcomer penetrated the cold water region. The maximum allowed change in RPV water temperature is 70°C/2 min, and temperature sensors at the lower plenum indicated a higher rate of change that triggered the HTG alarm. The HTG-event was followed by a thorough investigation:
• Analysis of the water flow in the reactor. The calculations were primarily carried out with CFD (ref. [56]), but initially thermal-hydraulic system codes such as GOBLIN [57] and Relap5 [8] were also used.
• Comparison of measured and calculated temperature transients • Detailed stress analysis of the RPV and its internal parts • Safety evaluation of the integrity of the RPV and its internals as well as the
control rod functionality [58] It is important to emphasize that the conclusion from the analysis is that no harmful thermal stresses occurred during this particular event. This conclusion was also supported by inspections carried out during the outage 2004. Based on the experiences at Oskarshamn 3 a project was initiated within the Nordic Owners Group (NOG) about thermal stratification in the RPV, with the intention to identify potential risks for harmful thermal transients in the BWR-designs used in Sweden and Finland, and to provide recommendations in order to avoid such events (ref. [59]-[62]).
1 HTG stands for maximum allowed temperature limit (in Swedish: “Högsta Tillåtna Gränsvärde”).
StratRev
Page 4 (62)
The rapid temperature variations in Oskarshamn 3 were measured with four temperature sensors located approximately 0.25 m above the bottom wall of the RPV. One concern is whether the actual water temperature close to the wall could be considerably lower than the measured value. However, in ref. [63] this was analysed showing only small temperature differences in this region. The recommendations that were given based on the analyses performed after the HTG-event and in the following NOG-project have been re-evaluated and summarized in a recent report [64]. Below follows some conclusions and recommendations:
• Currently used operating instructions are satisfactory and it is expected that large temperature variations can be avoided in the future
• Continuous monitoring of the temperature difference between the top and bottom of the RPV connected with an alarm at 60°C difference.
• To avoid reactivity transients it is suggested to inhibit restart of the main circulation pumps if not all control rods are fully inserted
• The existing HTG-value of maximum 70°C temperature change within two minutes should be replaced with a new measure of maximum 120°C between the top and bottom of the RPV.
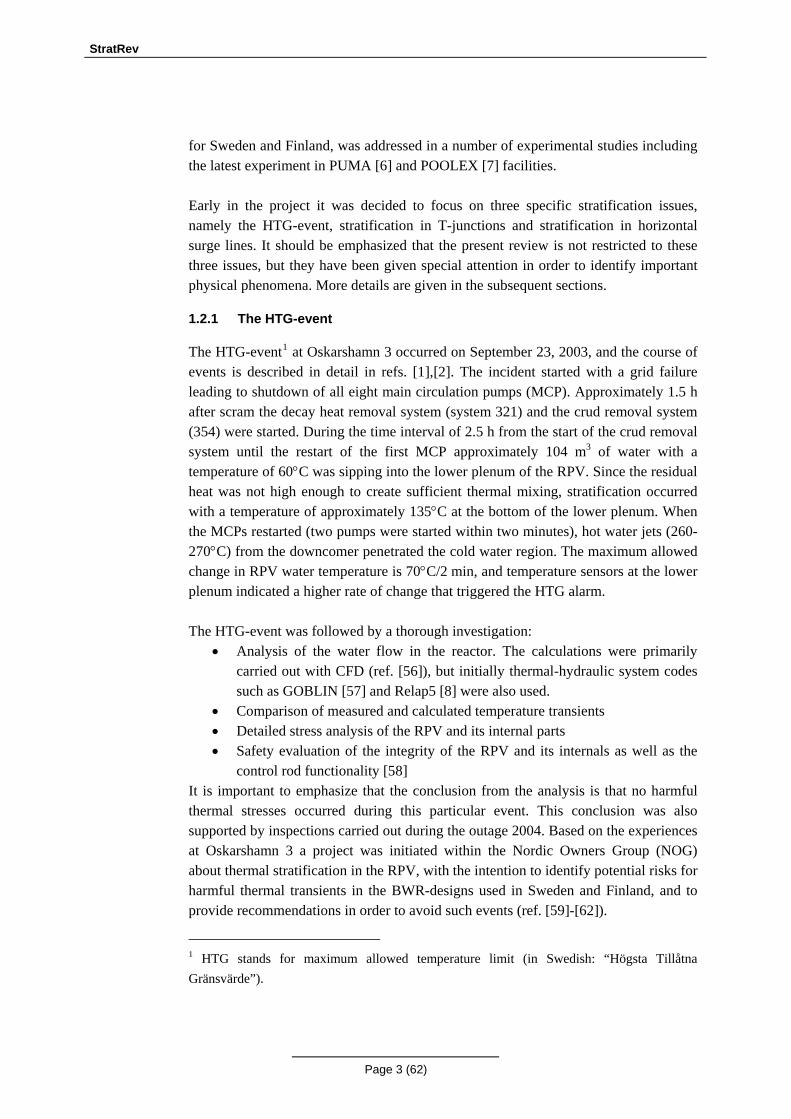
However, the HTG-event is not unique, and similar incidents have occurred in other plants. Ringhals 1 (1983) and Barsebäck 2 (1994) both experienced similar thermal transients (ref. [9]). At Gundremmingen C in Germany (1993) cold water was introduced at the bottom of the RPV leading to a rapid temperature increase when two MCPs were restarted. Since Gundremmingen C has a similar design as Oskarshamn 3 and Forsmark 3, the incident at Gundremmingen initiated an investigation at Forsmark regarding possible stratification in the lower plenum following a pump trip (ref. [9]). The conclusion from this study was that no design modifications were necessary, and a thermal transient similar to Gundremmingen or the HTG-event at Oskarshamn 3 is not possible due to restrictions during the startup procedure. Additional examples of stratification events in various BWR plants are given in section 5. An interesting observation from the analysis of the HTG-event is the different circulation loops that can be expected inside the RPV (see Figure 1). The residual heat in the core will create natural convection (buoyancy-driven flow), and the expected circulation loop will be directed from the core through the steam separators followed by a downward flow through the downcomer. However the analysis showed that two other circulation loops are important as well, where the downflow can occur either through peripheral fuel elements or through the control rod guide tubes. This implied that although the flow at the core inlet was of the order of 1400 kg/s, the flow through the downcomer was predicted to be about 300 kg/s.
StratRev
Page 5 (62)
Figure 1 Illustration of various natural circulation loops (Figure taken from ref. [1]).
1.2.2 Stratification in T-junctions (dead legs)
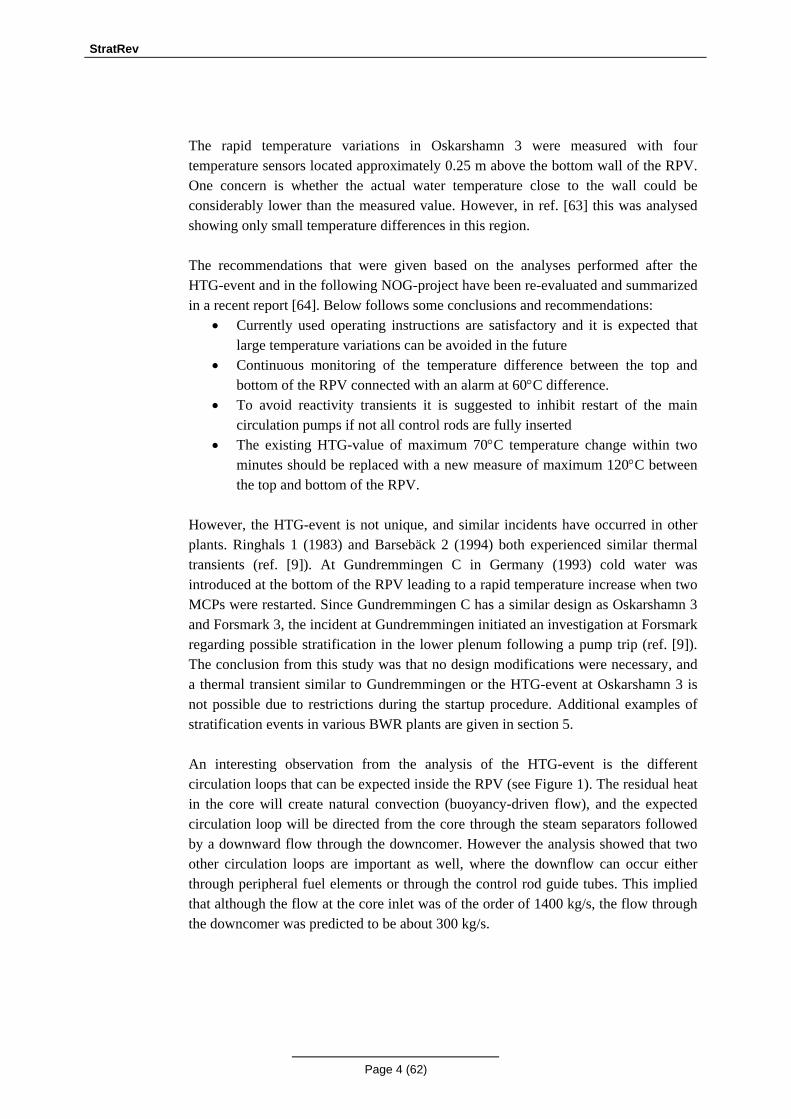
Thermal fluctuations and thermal loads in T-junctions is a well-known issue that has attracted considerable attention over the last thirty years. The important physical phenomena can be quite different depending on the flow rates between the main and branch pipes as well as the temperature differences between the fluids. The most commonly studied case is high-cycle fatigue due to mixing of cold and hot fluid in a T-junction (see e.g. the EU-project THERFAT, refs. [10],[11]). The mixing is enhanced by strong shear layer instabilities at the interface between the merging fluids, while stratification usually is of less importance. However, in T-junctions with a dead end stratification can be of significant importance and the primary cause of the upcoming temperature difference. The effect is usually enhanced if the dead end is connected to a leaking valve with a small supply of cold water. Figure 2 illustrates the flow pattern in a T-junction, where hot water flows with an average velocity of 60 cm/s in a horizontal main pipe. The horizontal flow in the main pipe drives a vortex in the top part of the vertical side branch, which has a dead end. Hot water is convected from the main pipe into the vortex region, where turbulence causes rapid mixing. In the uninsulated side branch, stratification occurs below the vortex, where also transition from turbulent to laminar flow occurs. Heat is conducted downwards along the steel wall to the region of the side branch where the flow is practically stagnant. In this region, below the stratified layer, the slightly heated wall drives a very slow natural circulation of water. Heat conduction, natural circulation
StratRev
Page 6 (62)
and molecular diffusion occur in time scales much longer than the convective time scale of the vortex.
Figure 2 Example of thermal mixing and stratification in a T-junction with a dead end. On
the top, horizontal flow of hot water in the insulated main pipe drives a vortex in an uninsulated vertical side branch. On the bottom left, calculated temperature of water and pipe wall are shown in the vertical side branch, where the hot water from the main pipe has penetrated. The flanges of densely instrumented test section are also shown. On the bottom right, flow velocity in the side branch is shown. (Figure taken from ref. [13]).
The position of the stratified layer may move when the operating conditions of the reactor change, for instance, during heat-up or shutdown of the plant ([14],[15]). In addition, a leaking valve in the dead end may induce motion of the stratified layer [16]. A leaking valve may even cause cyclic motion of the stratified layer where cyclic turbulent bursts of hot water penetrate into the side branch [17]. Another kind of mixing situation occurs, when the flow rate of cold water from the side branch to the main pipe is large. Then, hot water cannot penetrate from the main pipe into the side branch, and mixing of hot and cold water occurs in the main pipe. In
StratRev
Page 7 (62)
such a situation, the largest temperature gradients are located in the main pipe: in the region of the T-connection and downstream from the T-connection. If the main pipe has an elbow before or after the T-connection, the elbow induces swirling flow, which is superposed with mixing of hot and cold water.
1.2.3 Stratification in horizontal surge lines
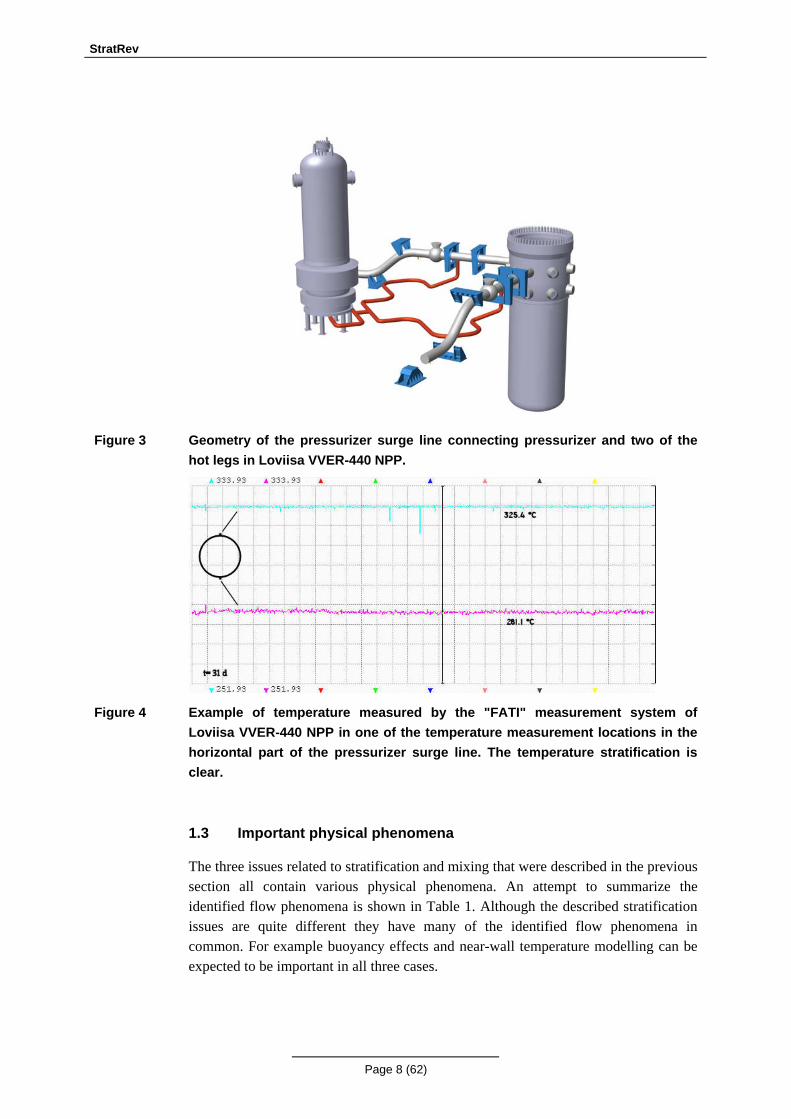
It is nowadays known and with plant measurements confirmed that thermal stratification may occur in the horizontal parts of the pressurizer surge line (Figure 3) during heatup, cooldown and steady-state operation of a power plant. While temperature stratification with cyclic variations may cause deformations and thermal fatigue, structural analysis is necessary in order to assure the integrity of the surge line. The flow and temperature field inside the pipe are the essential factors to be determined as input to the structural analysis. CFD is a potential method for calculation of the three-dimensional temperature field in a surge line pipe as demonstrated e.g. in the paper of Boros et. al. [18] While the current CFD codes contain models and tools for the modelling of stratification in horizontal pipes, the assessment of the accuracy of the CFD-methods as well as the recommendations for physical and numerical models to use are needed. Measurement data is essential for model development and assessment. The alternative data sources are plant measurements and model experiments. The plant measurements generally include temperature measurements at selected locations at the outer wall of the surge line (Figure 4). These can be used for CFD model development, however it is often difficult to determine the exact process values that are needed to set the correct boundary conditions for the CFD-simulation. Also the measurements at the outer wall do not necessarily give the full picture of the temperature stratification inside the pipe. Separate effect experiments would produce more detailed data, which could be used for CFD model development and validation. The experiments would not necessarily need to be made considering surge line stratification or nuclear applications, since the stratification phenomena is in many respects universal. One of the challenges for CFD-simulation of pressurizer surge lines is the determination of plant and transient specific boundary conditions. The practical CFD model would include the three-dimensional model of the surge lines, but the temperatures and flow rates at the pressurized and hot leg sides should be set as the boundary conditions. The boundary conditions could be determined based on the known plant process values, or system code simulations with plant models.
StratRev
Page 8 (62)
Figure 3 Geometry of the pressurizer surge line connecting pressurizer and two of the
hot legs in Loviisa VVER-440 NPP.
Figure 4 Example of temperature measured by the "FATI" measurement system of
Loviisa VVER-440 NPP in one of the temperature measurement locations in the horizontal part of the pressurizer surge line. The temperature stratification is clear.
1.3 Important physical phenomena
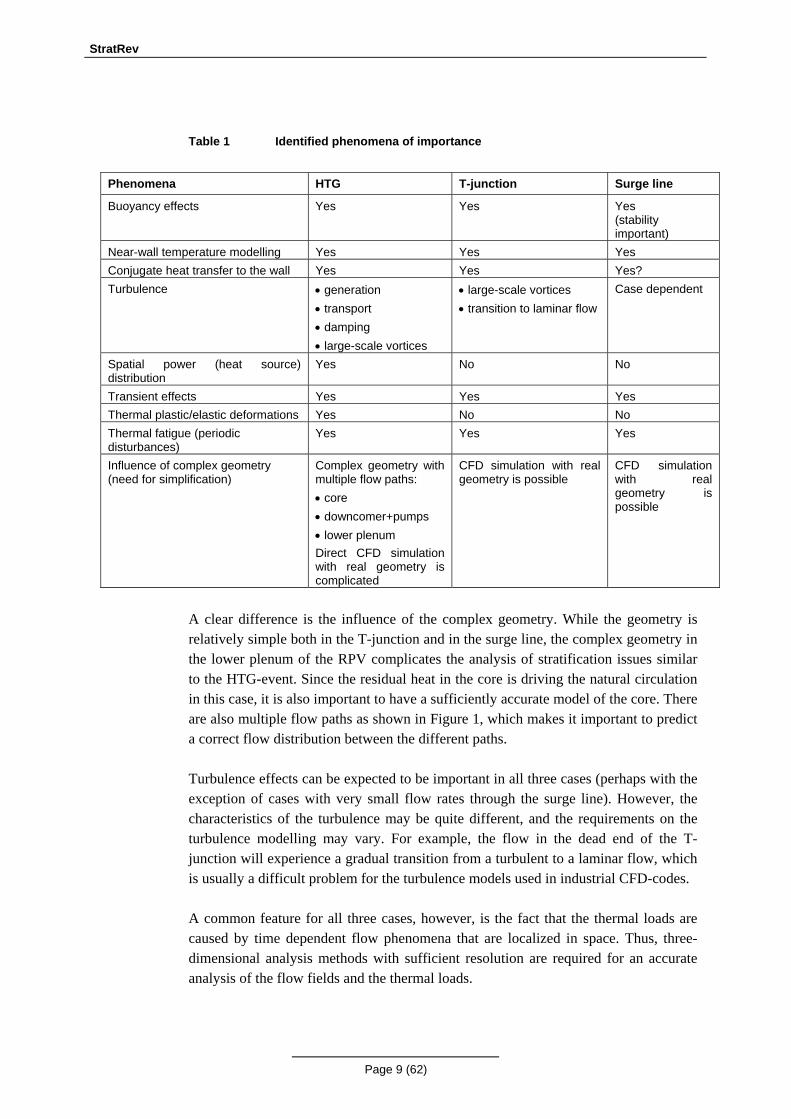
The three issues related to stratification and mixing that were described in the previous section all contain various physical phenomena. An attempt to summarize the identified flow phenomena is shown in Table 1. Although the described stratification issues are quite different they have many of the identified flow phenomena in common. For example buoyancy effects and near-wall temperature modelling can be expected to be important in all three cases.
StratRev
Page 9 (62)
Table 1 Identified phenomena of importance
Phenomena HTG T-junction Surge line
Buoyancy effects Yes Yes Yes (stability important)
Near-wall temperature modelling Yes Yes Yes Conjugate heat transfer to the wall Yes Yes Yes? Turbulence • generation
• transport • damping • large-scale vortices
• large-scale vortices • transition to laminar flow
Case dependent
Spatial power (heat source) distribution
Yes No No
Transient effects Yes Yes Yes Thermal plastic/elastic deformations Yes No No Thermal fatigue (periodic disturbances)
Yes Yes Yes
Influence of complex geometry (need for simplification)
Complex geometry with multiple flow paths: • core • downcomer+pumps • lower plenum Direct CFD simulation with real geometry is complicated
CFD simulation with real geometry is possible
CFD simulation with real geometry is possible
A clear difference is the influence of the complex geometry. While the geometry is relatively simple both in the T-junction and in the surge line, the complex geometry in the lower plenum of the RPV complicates the analysis of stratification issues similar to the HTG-event. Since the residual heat in the core is driving the natural circulation in this case, it is also important to have a sufficiently accurate model of the core. There are also multiple flow paths as shown in Figure 1, which makes it important to predict a correct flow distribution between the different paths. Turbulence effects can be expected to be important in all three cases (perhaps with the exception of cases with very small flow rates through the surge line). However, the characteristics of the turbulence may be quite different, and the requirements on the turbulence modelling may vary. For example, the flow in the dead end of the T-junction will experience a gradual transition from a turbulent to a laminar flow, which is usually a difficult problem for the turbulence models used in industrial CFD-codes. A common feature for all three cases, however, is the fact that the thermal loads are caused by time dependent flow phenomena that are localized in space. Thus, three-dimensional analysis methods with sufficient resolution are required for an accurate analysis of the flow fields and the thermal loads.
StratRev
Page 10 (62)
2 Experiments on stratification in piping In the following, two large-scale experiments on stratification in piping are reviewed. First, the HDR experiments performed in Germany thirty years ago are reviewed. Second, the ROSA experiment, which is being performed in Japan, is described. In addition, the availability of plant data on stratification in surge lines is discussed.
2.1 HDR-experiments on stratification in piping
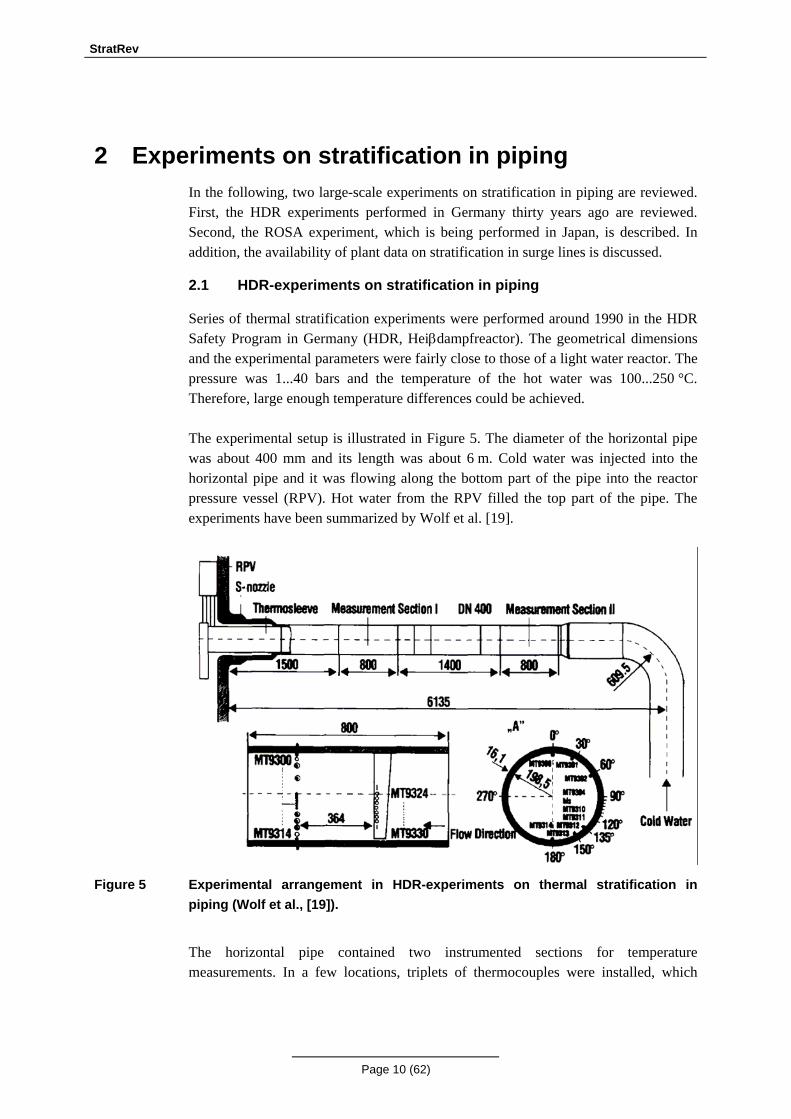
Series of thermal stratification experiments were performed around 1990 in the HDR Safety Program in Germany (HDR, Heiβdampfreactor). The geometrical dimensions and the experimental parameters were fairly close to those of a light water reactor. The pressure was 1...40 bars and the temperature of the hot water was 100...250 °C. Therefore, large enough temperature differences could be achieved. The experimental setup is illustrated in Figure 5. The diameter of the horizontal pipe was about 400 mm and its length was about 6 m. Cold water was injected into the horizontal pipe and it was flowing along the bottom part of the pipe into the reactor pressure vessel (RPV). Hot water from the RPV filled the top part of the pipe. The experiments have been summarized by Wolf et al. [19].
Figure 5 Experimental arrangement in HDR-experiments on thermal stratification in
piping (Wolf et al., [19]).
The horizontal pipe contained two instrumented sections for temperature measurements. In a few locations, triplets of thermocouples were installed, which
StratRev
Page 11 (62)
made it possible to measure the fluid temperature and the temperatures of the inner and outer walls. In addition, displacement sensors and axial and circumferential strain gauges were applied. In the TEMR test series, it was found that the flow velocity of the cold water determined the steepness of the temperature gradient between the cold and hot water. At large flow rates of cold water, the thickness of the cold/hot mixing layer was only about 10...15 mm. At small flow rates, a thicker mixing layer was observed. At the largest flow rates, the mixing layer was unstable which lead rapidly to temperature fluctuations. Typical frequencies of the fluctuations were in the range 0.1...10 Hz. Four different kinds of loads affect the wall:
• thermal shock during insurge of cold water • static load generated by the stratified flow • transient loads caused by changes in flow parameters • loads due to instability of the mixing layer, so-called striping
The loads on the pipe wall in the HDR experiments have been analyzed in detail by Talja and Hansjosten [20]. They correlated the observed temperature fluctuations to the flow velocity of the cold water. The fluctuations were found to increase when the flow velocity of the cold water increased and the mixing layer became unstable. Three-dimensional CFD calculations of the HDR experiments were already performed in the HDR project by using the CFD tools available at that time, such as COMMIX and SOLA-PTS. Recently, CFD calculations on the HDR experiments have been performed by Timperi [21] with the Star-CD code.
2.2 ROSA Project: Test on ECCS water injection
In the ROSA Project of OECD/NEA, Test 1-1 has been on “ECCS water injection under natural circulation condition” [22]. The Test 1-1 was performed in 2006 with the Large Scale Test Facility (LSTF) in Japan. The temperature distributions in cold legs and downcomer were measured during ECCS water injection with 144 new thermocouples installed for this test in addition to the previously existing ones; 28 of the thermocouples were in the cold legs. In addition, the flow was observed visually by using video probes located in the cold legs. In the Test 1-1, the steady-stated operating conditions of the LSTF were first established. The core power was about 6 MW, pressure was 155 bars and the cold leg temperature was 289 °C. Then the core power was set to 1.4 MW, which is 2% of the scaled nominal power. The primary coolant pumps were stopped so that steady-state natural circulation was established in the primary loop. The ECCS water was injected
StratRev
Page 12 (62)
into the two cold legs one after another and the evolution of the temperature distribution was measured. The temperature of the ECCS water was 27 °C and the duration of each injection was 80 s [22]. During injection, the mass flow rate in the cold leg was about 6 kg/s and the ECCS injection were about 0.3 and 1.0 kg/s. Stratified fluctuating flow in the two cold legs was observed and the mixing of the cold water in the downcomer was also monitored. In a later stage of the experiment, the primary inventory was reduced with a discharge through an auto bleed line, which made possible investigations on stratification in two-phase flow situations. CFD analysis of the ROSA Test 1-1 is in progress [23–25].
2.3 Plant data on stratification in surge lines
Temperatures at some selected locations in the pressurizer surge line of a PWR are typically monitored to determine the possibility of thermal fatique due to the cyclic temperature changes. The temperature measurements are located at different circumferential and axial locations to determine stratification and also temperature differences in the pipe axis direction. Temperature measurement is often made using thermocouples mounted at the outer wall of the pipe, between the pipe wall and the insulation material. In this case there is some difference between the measured temperature and the real temperature inside the pipe, which may must be taken into account when using the data. Complementary data for surge line thermal fatique analysis is often available from the normal process computer of the plant. This data includes e.g. the temperature and the water level in the pressurizer, and the temperatures and pressures in the primary circuit loops to which the surge line is connected. Both the data from the surge line temperature measurements and the data from the process computer are typically stored. While especially the process computer stores a lot of information, data is often time-averaged, which may reduce the applicability of the data for fatique analysis.
2.4 Discussion
The above mentioned experiments offer only limited possibility for CFD code validation. For better assessment of the modelling capabilities the temperature measurements are not sufficient, and more detailed information about the flow field (velocity distribution, turbulence properties) are needed. According to Farkas and Tóth [25] such tests are planned in the KFKI Atomic Energy Research Institute.
StratRev
Page 13 (62)
3 Experiments related to stratification in the RPV As was mentioned in chapter 1.2.1, the complex geometry of the reactor vessel internal structures can provide several flow paths for natural circulation in the vessel (Figure 1). The residual heat in the core creates buoyancy-driven flow, and it is not obvious which flow path will be “selected” by the flow at different conditions of reactor hot standby. Intensive internal core circulation can also be promoted by a highly peaked core design with large differences between the highest and the lowest power fuel assemblies. As a result of slow mixing in the lower plenum and supply of cold water during reactor hot standby, stratification can occur in the reactor vessel.
3.1 Integral large scale experiments
Experimental data is necessary for a general understanding and for the development of tools for prediction of natural circulation and thermal stratification in a BWR reactor vessel. Integral experiments are needed because they can capture complex conditions typical for plant conditions such as natural circulation in prototypical geometry of reactor vessel with internal structures and spatial non-uniform distribution of the heat source. Separate effect experiments are necessary to provide the database for model development and code validation. Intensive research in the area of natural circulation and thermal stratification, performed during the last decade, was motivated by recognition that the application of passive safety systems, can contribute to simplification and potentially to improved economics of new nuclear power plant designs. Extensive reviews and collections of results achieved so far by international community on natural circulation in water cooled nuclear power plants are presented in the IAEA documents [26],[27], summary of NACUSP (Natural circulation and stability performance of BWRs) project [74], and recent review of research on flow instabilities in natural circulation boiling systems [75]. Some of the integral test facilities mentioned in the reviews are listed in the Table 2. The need for validation data for reactor thermal hydraulics codes has prompted the worldwide development of separate effects and integral system test facilities. In
StratRev
Page 14 (62)
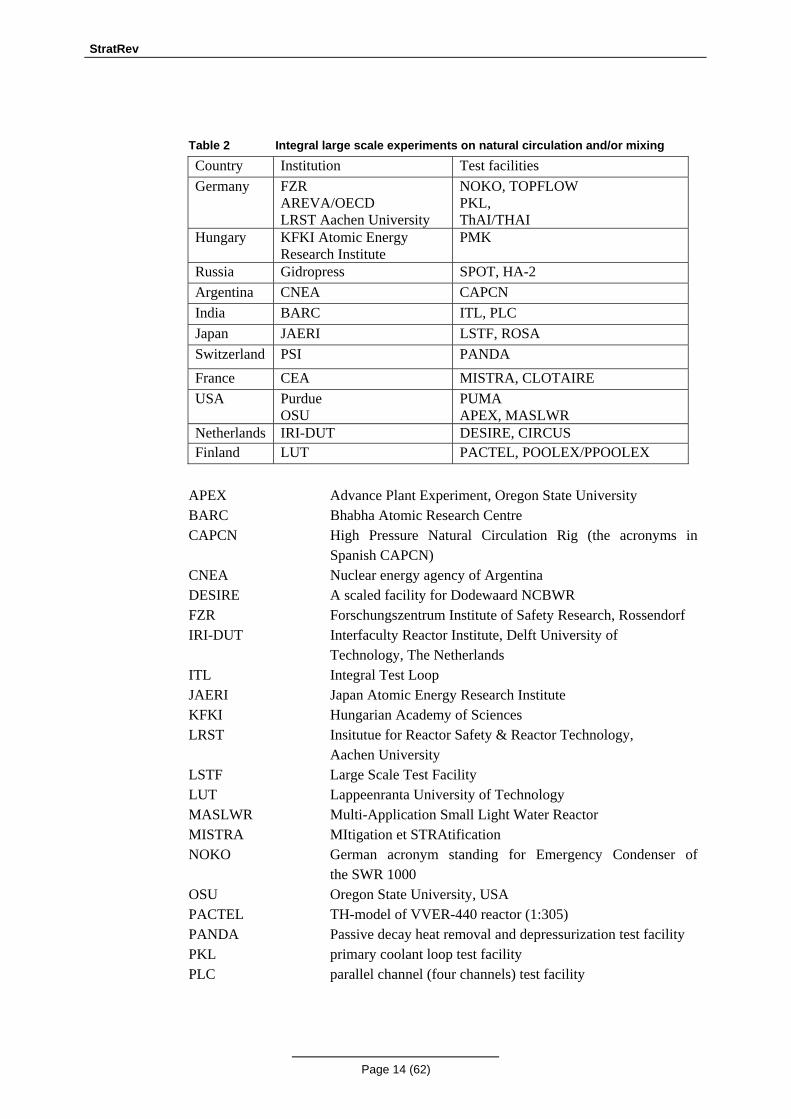
Table 2 Integral large scale experiments on natural circulation and/or mixing
Country Institution Test facilities Germany
FZR AREVA/OECD LRST Aachen University
NOKO, TOPFLOW PKL, ThAI/THAI
Hungary KFKI Atomic Energy Research Institute
PMK
Russia Gidropress SPOT, HA-2 Argentina CNEA CAPCN India BARC ITL, PLC Japan JAERI LSTF, ROSA Switzerland PSI PANDA France CEA MISTRA, CLOTAIRE USA Purdue
OSU PUMA APEX, MASLWR
Netherlands IRI-DUT DESIRE, CIRCUS Finland LUT PACTEL, POOLEX/PPOOLEX
APEX Advance Plant Experiment, Oregon State University BARC Bhabha Atomic Research Centre CAPCN High Pressure Natural Circulation Rig (the acronyms in Spanish CAPCN) CNEA Nuclear energy agency of Argentina DESIRE A scaled facility for Dodewaard NCBWR FZR Forschungszentrum Institute of Safety Research, Rossendorf IRI-DUT Interfaculty Reactor Institute, Delft University of Technology, The Netherlands ITL Integral Test Loop JAERI Japan Atomic Energy Research Institute KFKI Hungarian Academy of Sciences LRST Insitutue for Reactor Safety & Reactor Technology, Aachen University LSTF Large Scale Test Facility LUT Lappeenranta University of Technology MASLWR Multi-Application Small Light Water Reactor MISTRA MItigation et STRAtification NOKO German acronym standing for Emergency Condenser of the SWR 1000 OSU Oregon State University, USA PACTEL TH-model of VVER-440 reactor (1:305) PANDA Passive decay heat removal and depressurization test facility PKL primary coolant loop test facility PLC parallel channel (four channels) test facility
StratRev
Page 15 (62)
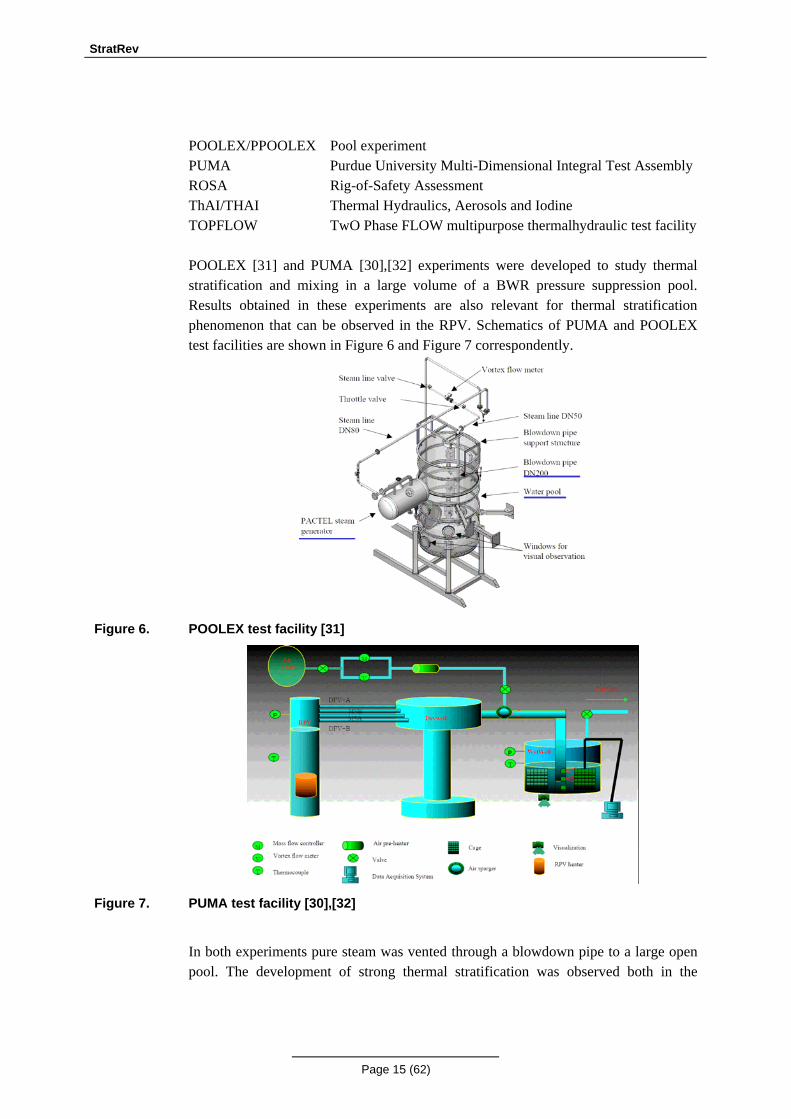
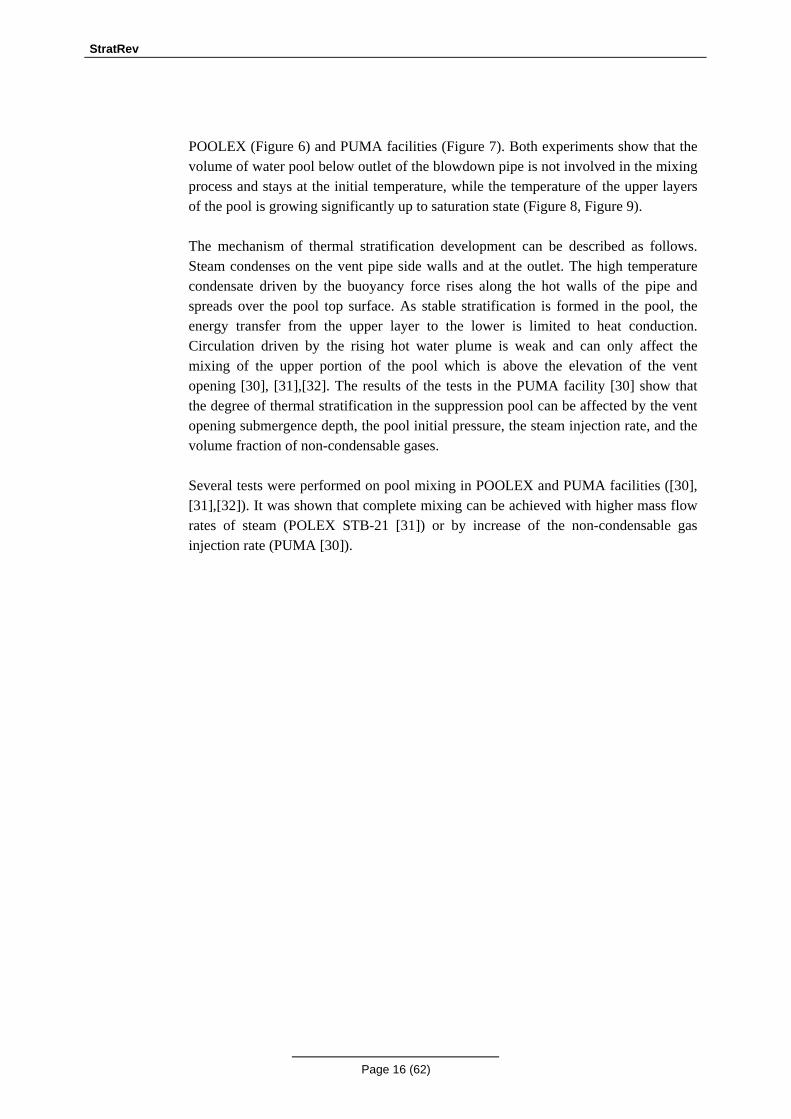
POOLEX/PPOOLEX Pool experiment PUMA Purdue University Multi-Dimensional Integral Test Assembly ROSA Rig-of-Safety Assessment ThAI/THAI Thermal Hydraulics, Aerosols and Iodine TOPFLOW TwO Phase FLOW multipurpose thermalhydraulic test facility POOLEX [31] and PUMA [30],[32] experiments were developed to study thermal stratification and mixing in a large volume of a BWR pressure suppression pool. Results obtained in these experiments are also relevant for thermal stratification phenomenon that can be observed in the RPV. Schematics of PUMA and POOLEX test facilities are shown in Figure 6 and Figure 7 correspondently.
Figure 6. POOLEX test facility [31]
Figure 7. PUMA test facility [30],[32]
In both experiments pure steam was vented through a blowdown pipe to a large open pool. The development of strong thermal stratification was observed both in the
StratRev
Page 16 (62)
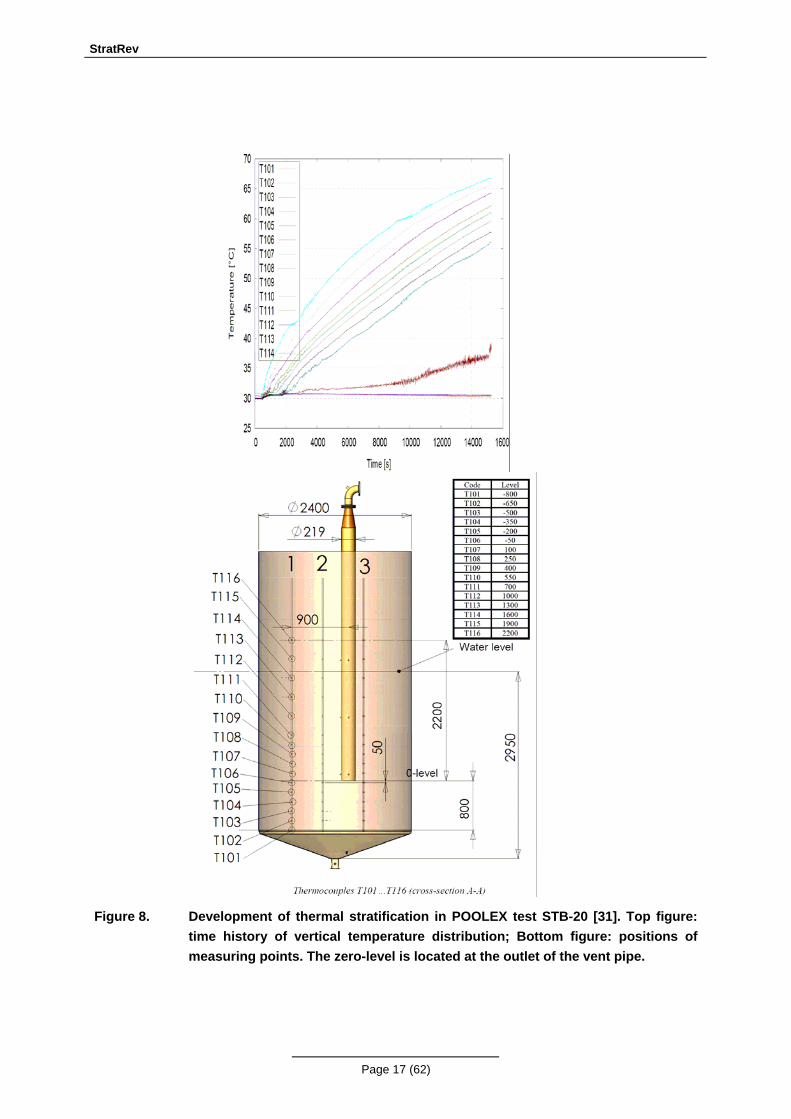
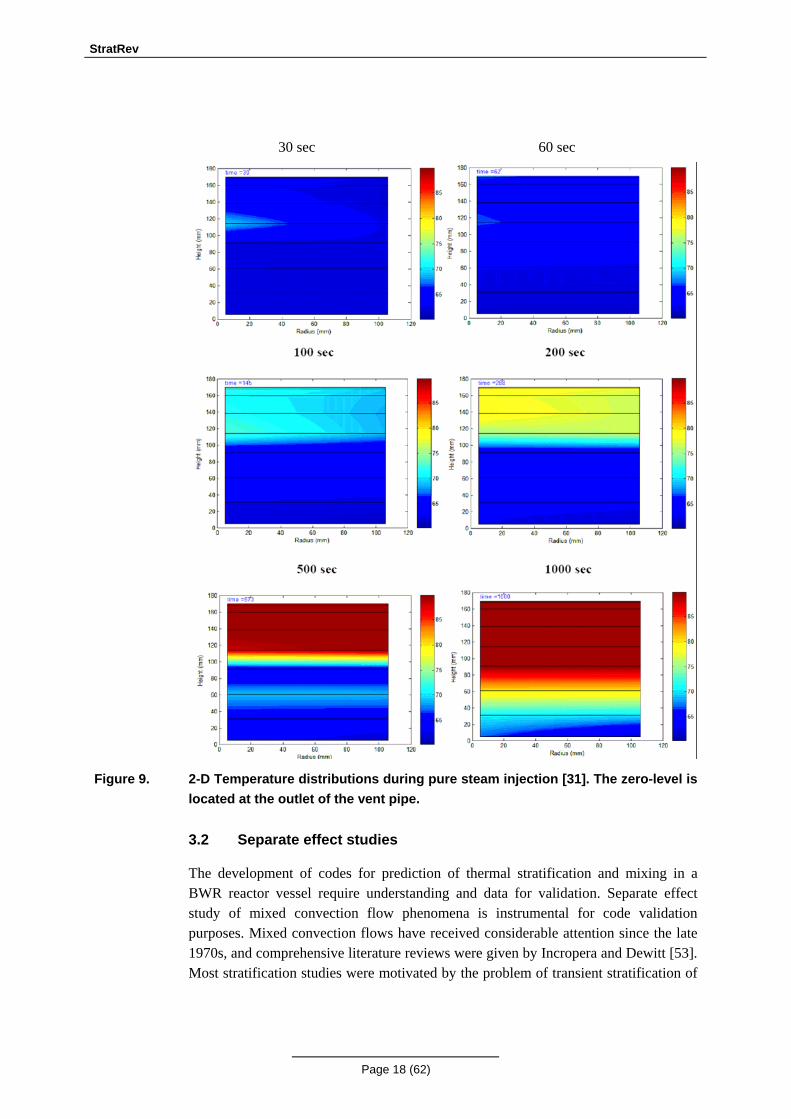
POOLEX (Figure 6) and PUMA facilities (Figure 7). Both experiments show that the volume of water pool below outlet of the blowdown pipe is not involved in the mixing process and stays at the initial temperature, while the temperature of the upper layers of the pool is growing significantly up to saturation state (Figure 8, Figure 9). The mechanism of thermal stratification development can be described as follows. Steam condenses on the vent pipe side walls and at the outlet. The high temperature condensate driven by the buoyancy force rises along the hot walls of the pipe and spreads over the pool top surface. As stable stratification is formed in the pool, the energy transfer from the upper layer to the lower is limited to heat conduction. Circulation driven by the rising hot water plume is weak and can only affect the mixing of the upper portion of the pool which is above the elevation of the vent opening [30], [31],[32]. The results of the tests in the PUMA facility [30] show that the degree of thermal stratification in the suppression pool can be affected by the vent opening submergence depth, the pool initial pressure, the steam injection rate, and the volume fraction of non-condensable gases. Several tests were performed on pool mixing in POOLEX and PUMA facilities ([30], [31],[32]). It was shown that complete mixing can be achieved with higher mass flow rates of steam (POLEX STB-21 [31]) or by increase of the non-condensable gas injection rate (PUMA [30]).
StratRev
Page 17 (62)
Figure 8. Development of thermal stratification in POOLEX test STB-20 [31]. Top figure: time history of vertical temperature distribution; Bottom figure: positions of measuring points. The zero-level is located at the outlet of the vent pipe.
StratRev
Page 18 (62)
30 sec 60 sec
Figure 9. 2-D Temperature distributions during pure steam injection [31]. The zero-level is
located at the outlet of the vent pipe.
3.2 Separate effect studies
The development of codes for prediction of thermal stratification and mixing in a BWR reactor vessel require understanding and data for validation. Separate effect study of mixed convection flow phenomena is instrumental for code validation purposes. Mixed convection flows have received considerable attention since the late 1970s, and comprehensive literature reviews were given by Incropera and Dewitt [53]. Most stratification studies were motivated by the problem of transient stratification of
StratRev
Page 19 (62)
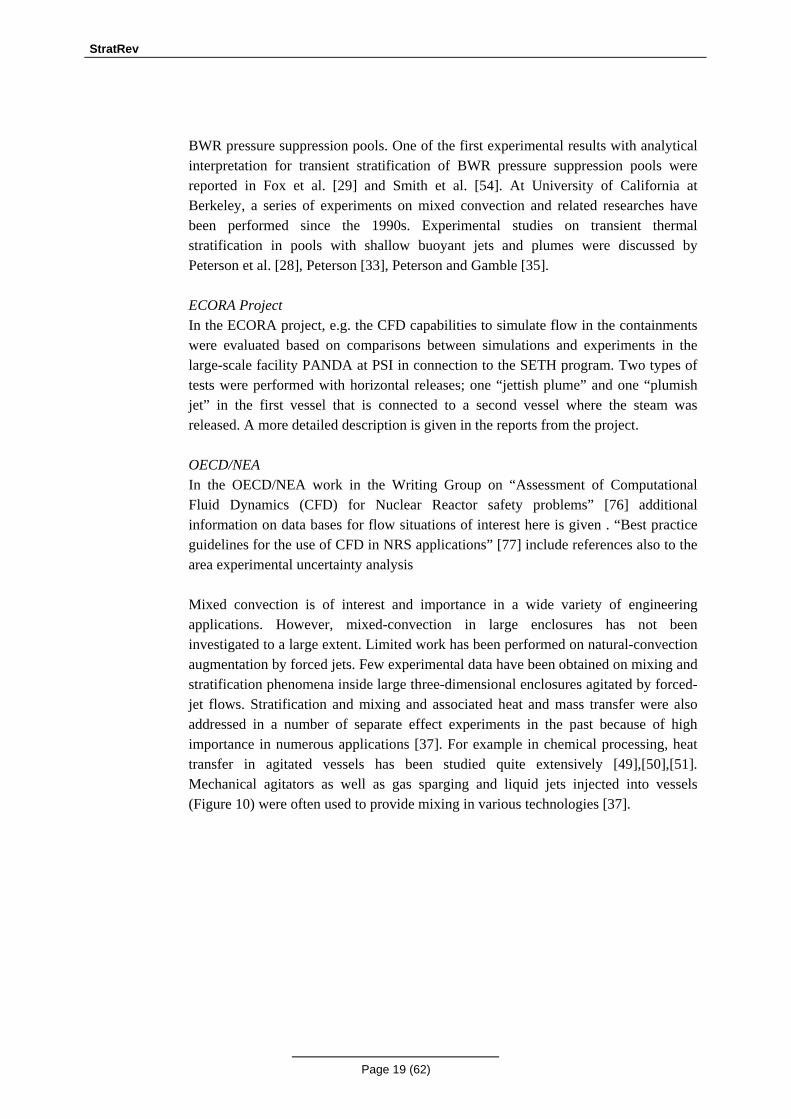
BWR pressure suppression pools. One of the first experimental results with analytical interpretation for transient stratification of BWR pressure suppression pools were reported in Fox et al. [29] and Smith et al. [54]. At University of California at Berkeley, a series of experiments on mixed convection and related researches have been performed since the 1990s. Experimental studies on transient thermal stratification in pools with shallow buoyant jets and plumes were discussed by Peterson et al. [28], Peterson [33], Peterson and Gamble [35]. ECORA Project In the ECORA project, e.g. the CFD capabilities to simulate flow in the containments were evaluated based on comparisons between simulations and experiments in the large-scale facility PANDA at PSI in connection to the SETH program. Two types of tests were performed with horizontal releases; one “jettish plume” and one “plumish jet” in the first vessel that is connected to a second vessel where the steam was released. A more detailed description is given in the reports from the project. OECD/NEA In the OECD/NEA work in the Writing Group on “Assessment of Computational Fluid Dynamics (CFD) for Nuclear Reactor safety problems” [76] additional information on data bases for flow situations of interest here is given . “Best practice guidelines for the use of CFD in NRS applications” [77] include references also to the area experimental uncertainty analysis Mixed convection is of interest and importance in a wide variety of engineering applications. However, mixed-convection in large enclosures has not been investigated to a large extent. Limited work has been performed on natural-convection augmentation by forced jets. Few experimental data have been obtained on mixing and stratification phenomena inside large three-dimensional enclosures agitated by forced-jet flows. Stratification and mixing and associated heat and mass transfer were also addressed in a number of separate effect experiments in the past because of high importance in numerous applications [37]. For example in chemical processing, heat transfer in agitated vessels has been studied quite extensively [49],[50],[51]. Mechanical agitators as well as gas sparging and liquid jets injected into vessels (Figure 10) were often used to provide mixing in various technologies [37].
StratRev
Page 20 (62)
Figure 10. Mixing processes for (a) jet-agitated, and (b) impeller agitated vessels [37]
Despite differences in mechanical impeller designs and tank geometry, heat transfer to vessel walls or to helical coils in mechanically agitated vessels was found to be dependent mostly on Reynolds number based on jet velocity and diameter or by impeller diameter and rotational speed [49],[50],[51]. Fossett and Prosser [52] studied the mixing of an aqueous Na2CO3 solution in tanks mixed by a jet. They carried out tests in a 1.50-m diameter, 0.92 m deep vessel in which a single jet was introduced to create large-scale recirculation flow patterns. The results of their jet mixing data suggested that the mixing time will be the same for jet nozzles of different diameters, if the effluent jet velocities are adjusted to provide the same momentum flux.
StratRev
Page 21 (62)
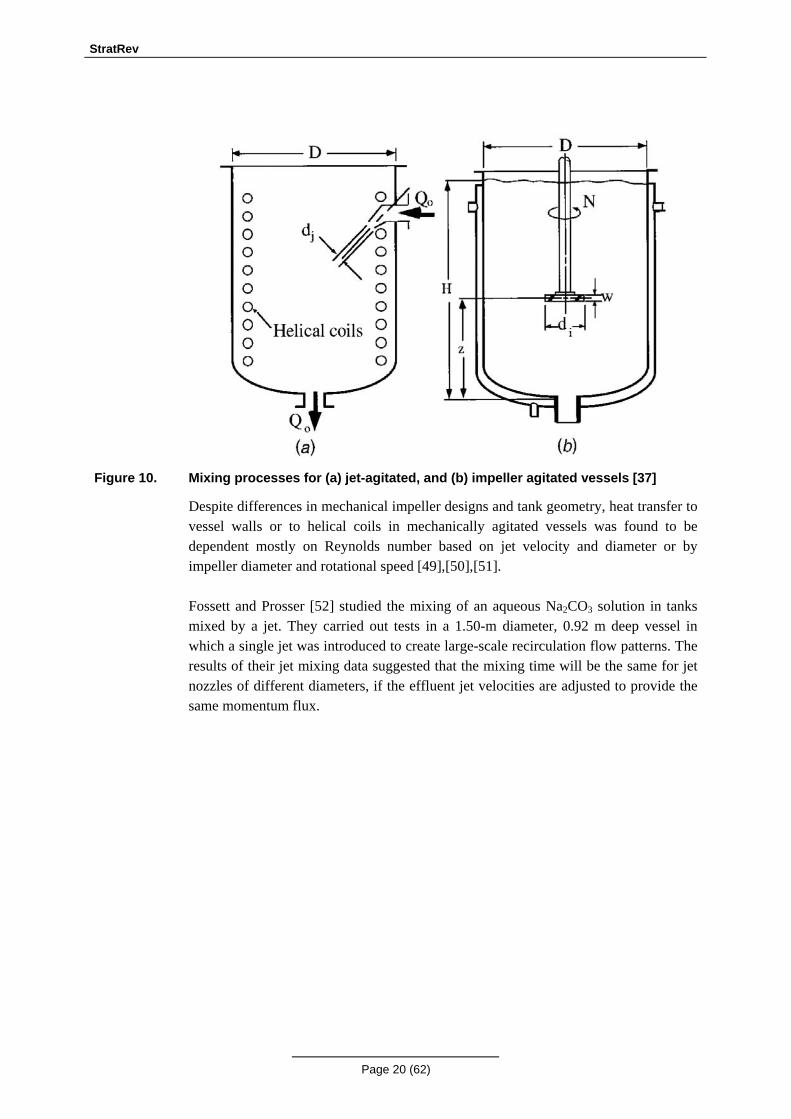
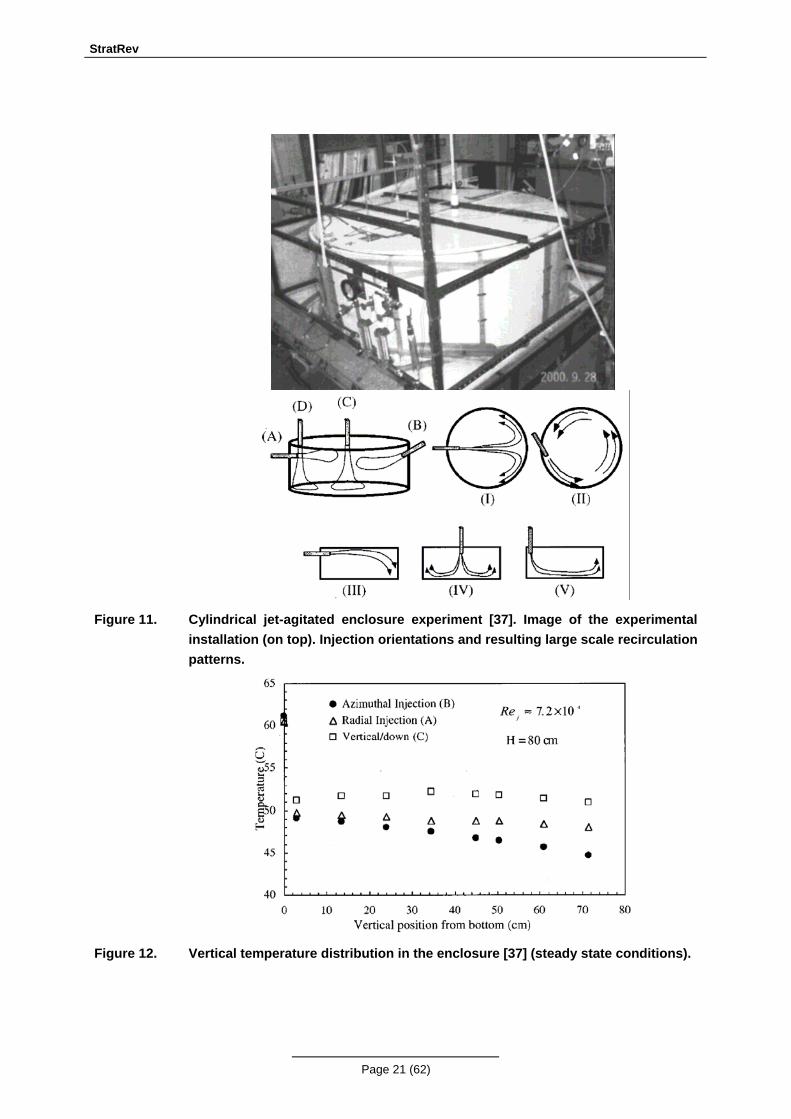
Figure 11. Cylindrical jet-agitated enclosure experiment [37]. Image of the experimental
installation (on top). Injection orientations and resulting large scale recirculation patterns.
Figure 12. Vertical temperature distribution in the enclosure [37] (steady state conditions).
StratRev
Page 22 (62)
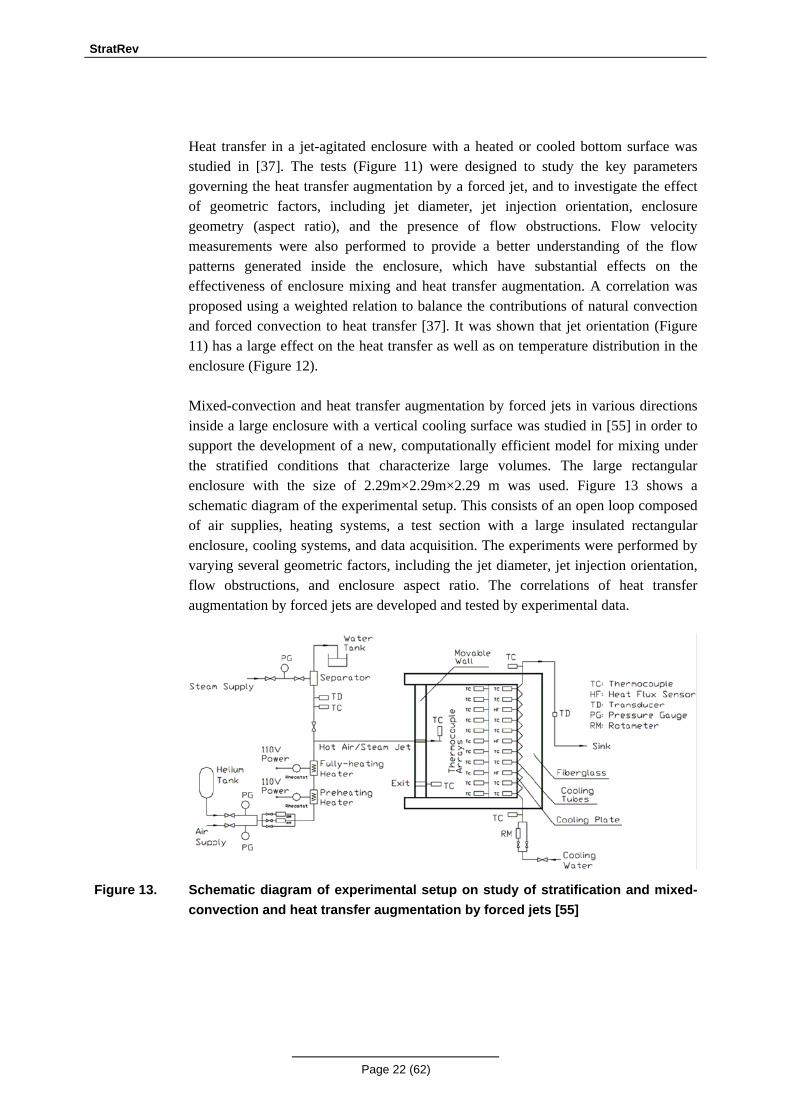
Heat transfer in a jet-agitated enclosure with a heated or cooled bottom surface was studied in [37]. The tests (Figure 11) were designed to study the key parameters governing the heat transfer augmentation by a forced jet, and to investigate the effect of geometric factors, including jet diameter, jet injection orientation, enclosure geometry (aspect ratio), and the presence of flow obstructions. Flow velocity measurements were also performed to provide a better understanding of the flow patterns generated inside the enclosure, which have substantial effects on the effectiveness of enclosure mixing and heat transfer augmentation. A correlation was proposed using a weighted relation to balance the contributions of natural convection and forced convection to heat transfer [37]. It was shown that jet orientation (Figure 11) has a large effect on the heat transfer as well as on temperature distribution in the enclosure (Figure 12). Mixed-convection and heat transfer augmentation by forced jets in various directions inside a large enclosure with a vertical cooling surface was studied in [55] in order to support the development of a new, computationally efficient model for mixing under the stratified conditions that characterize large volumes. The large rectangular enclosure with the size of 2.29m×2.29m×2.29 m was used. Figure 13 shows a schematic diagram of the experimental setup. This consists of an open loop composed of air supplies, heating systems, a test section with a large insulated rectangular enclosure, cooling systems, and data acquisition. The experiments were performed by varying several geometric factors, including the jet diameter, jet injection orientation, flow obstructions, and enclosure aspect ratio. The correlations of heat transfer augmentation by forced jets are developed and tested by experimental data.
Figure 13. Schematic diagram of experimental setup on study of stratification and mixed-
convection and heat transfer augmentation by forced jets [55]
StratRev
Page 23 (62)
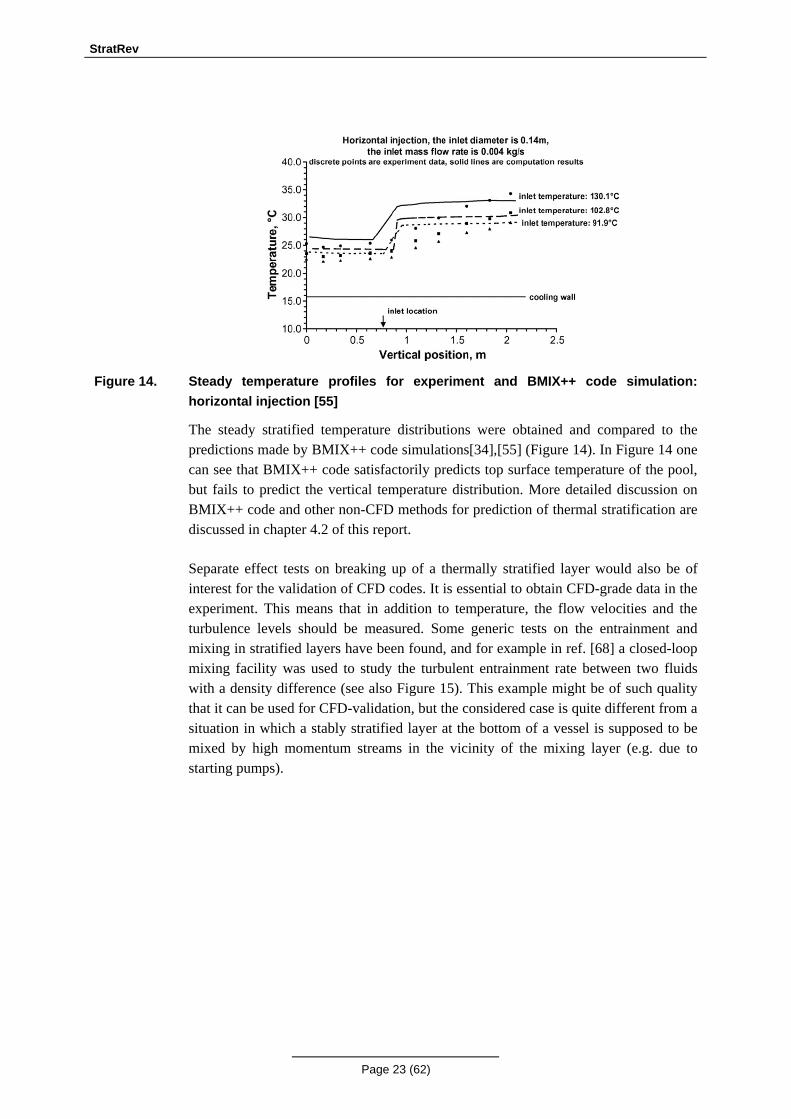
Figure 14. Steady temperature profiles for experiment and BMIX++ code simulation:
horizontal injection [55]
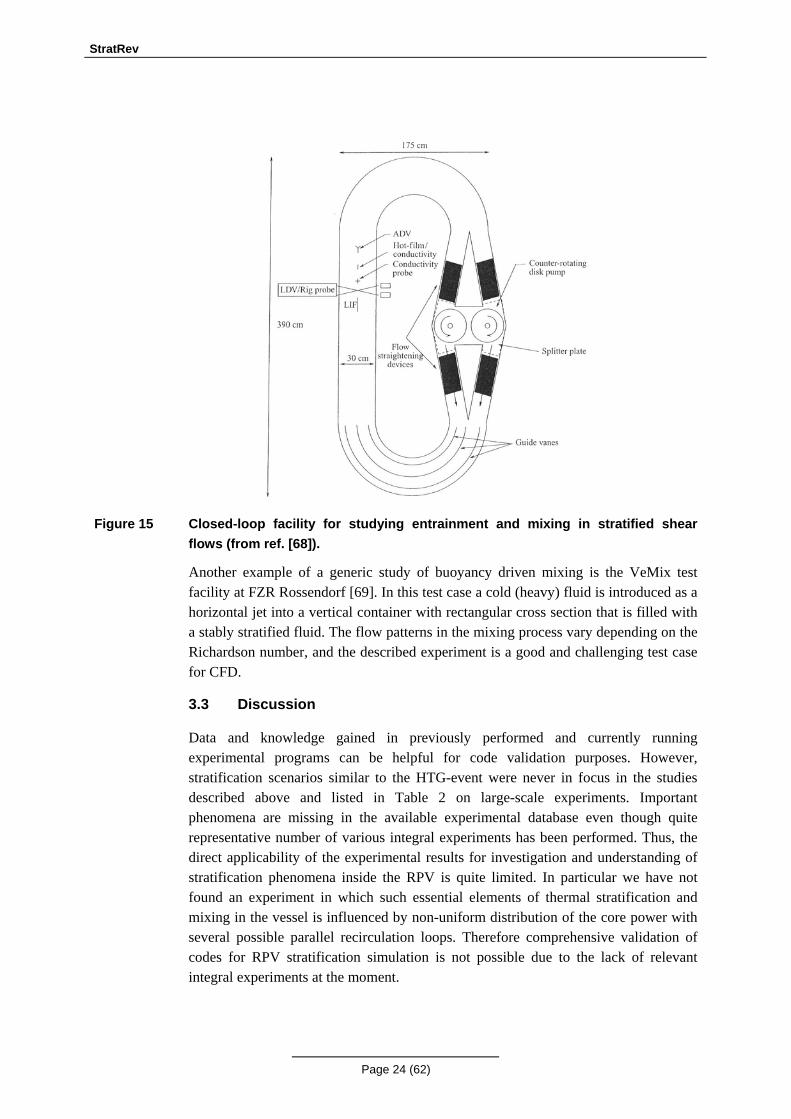
The steady stratified temperature distributions were obtained and compared to the predictions made by BMIX++ code simulations[34],[55] (Figure 14). In Figure 14 one can see that BMIX++ code satisfactorily predicts top surface temperature of the pool, but fails to predict the vertical temperature distribution. More detailed discussion on BMIX++ code and other non-CFD methods for prediction of thermal stratification are discussed in chapter 4.2 of this report. Separate effect tests on breaking up of a thermally stratified layer would also be of interest for the validation of CFD codes. It is essential to obtain CFD-grade data in the experiment. This means that in addition to temperature, the flow velocities and the turbulence levels should be measured. Some generic tests on the entrainment and mixing in stratified layers have been found, and for example in ref. [68] a closed-loop mixing facility was used to study the turbulent entrainment rate between two fluids with a density difference (see also Figure 15). This example might be of such quality that it can be used for CFD-validation, but the considered case is quite different from a situation in which a stably stratified layer at the bottom of a vessel is supposed to be mixed by high momentum streams in the vicinity of the mixing layer (e.g. due to starting pumps).
StratRev
Page 24 (62)
Figure 15 Closed-loop facility for studying entrainment and mixing in stratified shear
flows (from ref. [68]).
Another example of a generic study of buoyancy driven mixing is the VeMix test facility at FZR Rossendorf [69]. In this test case a cold (heavy) fluid is introduced as a horizontal jet into a vertical container with rectangular cross section that is filled with a stably stratified fluid. The flow patterns in the mixing process vary depending on the Richardson number, and the described experiment is a good and challenging test case for CFD.
3.3 Discussion
Data and knowledge gained in previously performed and currently running experimental programs can be helpful for code validation purposes. However, stratification scenarios similar to the HTG-event were never in focus in the studies described above and listed in Table 2 on large-scale experiments. Important phenomena are missing in the available experimental database even though quite representative number of various integral experiments has been performed. Thus, the direct applicability of the experimental results for investigation and understanding of stratification phenomena inside the RPV is quite limited. In particular we have not found an experiment in which such essential elements of thermal stratification and mixing in the vessel is influenced by non-uniform distribution of the core power with several possible parallel recirculation loops. Therefore comprehensive validation of codes for RPV stratification simulation is not possible due to the lack of relevant integral experiments at the moment.
StratRev
Page 25 (62)
Regarding the other category of experiments that was discussed, i.e. separate effect experiments on mixing and break-up of stratified layers, there exist several experimental studies of interest. However, in order to be suitable for CFD-validation well-documented boundary and initial conditions, as well as detailed measurements of the flow field (different velocity components, turbulence levels, concentration levels etc) are needed. These requirements significantly reduce the number of studies that are both available and suitable for CFD-validation. Reduction of epistemic uncertainty in physical phenomena of stratification development is problematic at the moment. Development of appropriately designed experimental facility with representation of important prototypical elements of reactor internal structures and non-uniform heat source distribution is a necessary step towards solution of various in-vessel thermal stratification issues.
StratRev
Page 26 (62)
4 Current modelling capabilities Thermal stratification in piping and in the RPV are inherently three-dimensional phenomena. Therefore, three-dimensional CFD calculations are needed in their adequate description. However, the computer time and the resources needed in construction of CFD models for complicated geometries limit the usability of CFD methods. In many situations it is not even practical to use CFD-methods. System codes are therefore often used despite their limited capabilities of describing three-dimensional phenomena. In the following, we describe current state-of the art of CFD codes for modelling thermal stratification in pressurizer surge lines, T-junctions and in reactor pressure vessels. Also, it is briefly described the possibilities of using non-CFD methods and the influence of core power distribution and geometry simplifications.
4.1 Use of Computational Fluid Dynamics (CFD): Examples, limitations and suggestions
4.1.1 Pressurizer surge line
In CFD analysis of a PWR surge line, one of the largest practical difficulties is the knowledge of the boundary conditions as was pointed out by Boros and Aszódi [18,48]. They modelled the surge line and a short section of the primary circuit. The boundary conditions of the CFD model were at the bottom outlet of the pressurizer and at the primary circuit. The boundary conditions needed for the CFD simulation are then:
• mass flow rate and temperature of water from the pressurizer to the surge line • mass flow rate, temperature and pressure in the primary circuit
Usually, the surge lines of PWRs contain temperature measurements, which can be used for determining the boundary value for the simulated transient. Determination of the mass flow rate from the pressurizer (outsurge) or into the pressurizer (insurge) is more challenging. Basically two alternatives for determining the mass flow rate exist:
• deduction of the mass flow rate from plant monitoring data such as the surface level in the pressurizer
• simulation of the pressurizer and large enough part of the primary circuit with a system code
StratRev
Page 27 (62)
System code simulations of the pressurizer loop have recently been performed by Takasuo [47] by using the APROS and TRACE codes. Modelling of turbulence can be of some importance in simulation of the surge lines. Boros and Aszódi [48] assumed in their work laminar flow. This can be expected to be a conservative assumption because it overestimates the temperature gradients. In simulation of a transient in a surge line, the situation can be fairly complicated. The flow velocities vary and even laminar to turbulent or turbulent to laminar transitions could occur. Modelling such transitions accurately and reliably is a challenge for current state-of-the-art in engineering CFD calculations. If the flow is turbulent, the turbulent Reynolds number can be small which makes it necessary to use low Reynolds number turbulence models or Large Eddy Simulation (LES), which increases the mesh size and computing time. In PWRs, temperature measurements are often available at the outer surface of the surge line pipes. Therefore, it is of interest to calculate the conjugate heat transfer from the fluid to the inner wall, and from the inner wall to the outer wall of the pipe. The heat capacity of the wall filters the rapid temperature variations which can not be properly seen on the outer pipe surface. Still they may have some effect on the thermal fatigue behaviour of the pipe. In current calculations of the outer wall temperature the CFD analysis plays an important role with the near-wall modelling being the most crucial and challenging task. At present, industrial CFD codes do not perform well in near-wall heat and mass transfer predictions of mixed and natural convection flows. Please see section 5.2.2 for more details.
4.1.2 Stratification in T-junctions
Stratification and mixing of hot and cold water in T-junctions has recently been studied in several national and international projects. As mentioned in section 1.2.2 the flow characteristics in a T-junction can be quite different depending on the relative flow rates, and in the THERFAT project ([10]) the flow is generalized into three different cases:
1) Tee connections with zero mass flow in the branch pipe (“dead leg”) 2) Tee connections with a small (usually cold fluid) mass flow in the branch pipe
(“leaking valve”) 3) Tee connections with a (usually hot fluid) flow in the branch pipe
The last case is characterized by thermal mixing mainly in the region downstream of the T-junction, associated with significant hot/cold temperature variations with relatively high frequencies. This flow situation is sometimes denoted as thermal striping (see e.g. the final report of the NESC-project, [38]), and both experimental and computation studies have been performed worldwide (see e.g. [39] - [44]).
StratRev
Page 28 (62)
These studies have demonstrated that simplistic Reynolds Averaged Navier Stokes (RANS) modelling could neither predict the amplitude of the temperature fluctuations, nor predict the correct spectral distribution. However, scale-resolving methods such as Large Eddy Simulations (LES), Detached Eddy Simulations (DES) and Scale-Adaptive Simulations (SAS) have shown promising results. A recent validation test case [44] have been used in a number of computational studies [44]-[46], and predictions using LES provide good agreement with experimental data when considering the amplitude and frequency content of the temperature fluctuations 1 mm from the pipe wall. Currently there is ongoing work in order to validate the computations versus test cases with other flow ratios between the hot and cold fluid. Moreover, a blind test case will be formulated based on new experimental data obtained in the Vattenfall T-junction test rig, and the validation data will be released in connection with the next CFD4NRS-meeting in 2010. A disadvantage with the scale-resolving methods is the fact that they are computationally expensive. Thus, if one can obtain accurate results and still retain the economy of a RANS approach by choosing an adequate turbulence closure for such applications, this is of great interest from an industrial point of view. For example, the Two-Component-Limit (TCL) Reynolds-Stress Model (RSM) of Craft et al [79] with a full set of equations for the turbulent heat fluxes and temperature variance can adequately predict not only the temperature fluctuations but also the stratification layer where turbulence reaches the two-component state. This approach should be evaluated also for the flow cases described above. If the accurate results for the near-wall region are not required then useful results away from walls can be obtained with relatively coarse near-wall mesh resolution provided the computational domain is adequately discretised in the region of interest and an appropriate turbulence model is used. To achieve accurate predictions of wall shear stress and heat transfer one needs either to adopt a very fine mesh, which is too expensive for industrial applications, or to use methods that can return good results for the near-wall region also on coarse near-wall meshes. Different approaches to model the near-wall region are currently under investigation, for example various types of wall-functions for LES, DES, hybrid methods using RANS-modelling near the wall and LES in the bulk flow, as well as SAS. An example of using Scale Adaptive Simulations is presented in [46]. Novel approaches for near-wall regions that can return good results on coarse near-wall meshes is also discussed in Section 5.2.2 and in works of Craft et al [80],[81]. This is true for both RANS and LES methodologies. Although buoyancy forces can be of importance in the thermal striping cases described above, the flow is mainly governed by turbulent mixing. In the other two generalized cases listed earlier, the “dead leg” and the “leaking valve”, stratification can be the primary cause for thermal loads. For example in the dead leg a stratified
StratRev
Page 29 (62)
layer that is formed in the branch pipe can perform oscillations causing cyclic temperature variations near the pipe wall. It is thus important with accurate predictions of both the stratified layer as well as the vortices and turbulence generated by the flow in the main pipe. Another complicating circumstance in the dead leg is the gradual change from turbulent to laminar flow in the branch pipe, and the prediction of laminar-turbulent transition should be approached with care in CFD-calculations. In conclusion, CFD-methods have potential to provide predictions of the temperature fluctuations in the branch pipe also for the dead leg and the leaking valve case, but the choice of modelling strategies must be balanced. Moreover, further development and validation of computational tools are needed.
4.1.3 Stratification in the RPV
Simulations of stratification and mixing in the RPV using CFD methods is a difficult task due to the high complexity of the reactor vessel internal geometry, the large difference between the smallest and the largest scales which are to be resolved, and the long physical time of the interesting transients. As a result, the grid size necessary for representation of real geometry is too big, and computational time is too long in order to perform parametric studies with CFD. Another difficulty is the poor performance of some standard RANS turbulence models in simulation of buoyancy driven flows [36]. Either more elaborated RANS strategies or LES approach can provide improved results in flow problems that are governed by large scale flow structures and with only negligible influence from the shear layers near solid walls. In such cases useful results can be obtained also on coarse meshes, but as soon as the wall-effects become important the mesh resolution requirements become enormous with currently available LES-methods. Nevertheless, CFD can be a very useful tool for simulation of separate effect problems in order to develop better understanding of physical phenomena related to thermal stratification in the RPV. CFD can also be used for detailed studies of certain flow regions in the RPV as long as relevant boundary conditions can be obtained. For example, in the CFD-calculation that was carried out as part of the analysis of the HTG-event [56] good agreement was obtained between computations and available plant data, and the CFD-model provided valuable information regarding possible local thermal transients in the RPV and its internals. The inlet boundary to this model was located in the downcomer, and the simulation region consisted of the lower part of the downcomer including the MCPs, the lower plenum of the RPV and a simplified model of the core. The outflow boundary condition was positioned above the core. The complex geometry near the lower plenum (e.g. the region with control rod guide tubes) and the core were simplified using porous media model with relevant pressure loss coefficients.
StratRev
Page 30 (62)
The continuous increase in computational power makes it possible to apply CFD to more complex problems, and there are a few validation studies in which single-phase calculations have been applied to large computational domains such as the entire PWR pressure vessel. Experimental studies in the ROCOM test facility in FZR Rossendorf have been used for validation studies of mixing in the downcomer and the lower plenum both with and without density differences [70],[71]. In [70] it was shown that calculations using Reynolds stress models as well as LES were able to provide good predictions of the mixing process observed in the validation experiment. Similar studies have also been performed within the EU-project FLOMIX-R for a test rig at Vattenfall [78]. Another example of massive CFD-computations of large and complex domains is the ongoing work by Böttcher (ref. [72]). The model that is currently used contains the entire RPV including a fairly detailed model of the core, as well as the four primary loops with simplified models of the circulation pumps and the steam generators. The calculation mesh consists of 34 million cells. The above examples show that CFD-calculations of single-phase flow through fairly large and complex flow domains will be feasible within near future granted that the CFD-models have been validated on relevant test cases. However, the possibility to apply various geometry simplifications (see also section 4.3) is an important topic, which to a large extent determines the type of problems that can be analyzed with CFD. For example, a correct simulation of the various natural circulation loops inside the core during hot standby (see Figure 1) would require a very detailed model of the geometry resulting in very large computational meshes. Another issue is the scalability of the CFD-calculations. Most validation studies are carried out in laboratory scale models at small or isothermal conditions, and the validated CFD-results may not necessarily be as accurate when scaled to the plant conditions. Finally, it should also be mentioned that as soon as the flow cannot be considered as single-phase (e.g. due to local boiling in the core) the applicability of currently available CFD-methods becomes questionable. On the basis of the above examples it can be concluded that CFD-methods can be very useful for analysis of local flow phenomena, and the methods can also be applied to fairly complex single-phase problems if the models are validated against suitable test cases. CFD simulations can also be used for the development of simplified, computationally effective models in order to make parametric studies with system scale computations affordable. The possibility to use simplified models (e.g. based on system codes) coupled to detailed CFD-models of certain flow domains is also an interesting alternative that requires further development.
StratRev
Page 31 (62)
4.2 Non-CFD prediction tools
Historically non-CFD methods were mostly used for development in the design and for the licensing of nuclear power plants. Such tools as system codes, scaling and empirical correlations are still very popular instruments for the nuclear engineering thermal-hydraulic calculations. Issues related to natural circulation, mixing and stratification during normal operations and abnormal behavior were studied frequently in the past with non-CFD methods. Stratification and mixing phenomena in a large water pool with a heat source have been studied experimentally [28], [29], [30], [31], [32], [38], [54], [55] and analytically [29], [32], [33], [34], [35], [54], [55]. Strong stratification above a heat source submerged in a water pool and heat transfer into the volume below the heat source only via conduction were observed in experiments. Fox et al. [29] and Smith et al. [54] claimed that experimental results for transient stratification of BWR pressure suppression pools could be predicted using numerical solutions of one-dimensional differential equations describing the effect of buoyant jets on the vertical temperature distribution. In University of California at Berkeley, some research studies on mixed convection and related areas have been performed since 1990s. Peterson et al. [28] studied experimentally and numerically the transient thermal stratification in pools with shallow buoyant jets. Peterson [33] showed that large bodies of water mixed by buoyant plumes and wall jets often can be expected to cause stratification, and provided a criterion for assessing when the momentum injected by forced jets would break up stratification in large enclosures. It was also shown in [33] that under stratified conditions in an enclosure the governing conservation equations for mass, momentum, energy can be reduced to simpler one-dimensional forms. Peterson and Gamble [35] presented a scaling method that could provide the basis for the design of scaled experiments for studying jet-induced heat and mass transfer in large enclosures. The BMIX++ code [55] was developed to solve numerically coupled, ordinary differential equations derived in [33]. BMIX++ code is a one-dimensional Lagrangian transient flow and heat transfer code. It is only used for cases with low Archimedes number, which is a ratio of square of Reynolds number divided by Grashof number. For high Archimedes number, the enclosure is well mixed and can be treated as a lumped mass. The modeling of mixing and stratification in a large stratified enclosure consists of two parts: modeling the ambient volume, which can be calculated using a one-dimensional Lagrangian method (tracking movable control volumes), and modeling substructures, such as the jets, plumes, and wall boundary flows, which can be calculated with one-dimensional integral methods or analytical methods. The two parts are coupled through entrainment and discharge processes. In each simulation of
StratRev
Page 32 (62)
the experiments, four basic models are employed in the BMIX++ code: free buoyant jet, isothermal wall jet, small vent, and wall conduction models. Some secondary effects, such as the ceiling jet caused by impingement of the free buoyant jet, wall jets along insulated vertical walls, floor jets caused by impingement of the wall jets, and radiation heat transfer, are neglected and contribute to differences between experimental and model results. A detailed description of the BMIX++ code can be found in [55]. As was mentioned in chapter 3.2 comparison between experimental simulation results obtained with the BMIX++ code was not quite satisfactory for steady, stratified temperature distributions (Figure 14). Results of experiments [32] on condensation and mixing phenomena during loss of coolant accident in a scaled down pressure suppression pool of a simplified boiling water reactor were compared with the TRACE code predictions and showed the deficiency for prediction of the pool thermal stratification. The GOBLIN code was used for analysis of the 2003 HTG event [57]. Several possible flow paths for reactor internal recirculation were identified in the simulations [57]. Yet the reliability of predictions of thermal stratification development and mixing by lumped parameter codes or 1D codes is questionable. As can be seen from the discussion above, despite quite representative experimental database for basic physical phenomena (see chapter 3 of the present report), the success in the development of simplified methods for reliable prediction of thermal stratification and mixing phenomena in real conditions of nuclear plant is still weak. The obvious general deficiency of non-CFD methods is their limited abilities to describe the effect of a complex geometry where the 3D flow pattern is important. Natural circulation, mixing and stratification are quite sensitive to slight changes in geometry and power source distribution. Lumped-parameter scaling based models (which may successfully describe mixing in a simple geometry tank) are not obviously extendable for more complex geometries to provide a consistent description of a thermal stratification process. More advanced one-dimensional models also have problems with taking into account real 3D geometry of the nuclear power plant structures. Thus, for the time being, both CFD and non-CFD methods are useful for engineering applications. Expensive CFD methods are suitable for the development of closures and models which then can be used in less computationally expensive system-like codes, as well as for detailed studies of smaller flow regions that might have a dominant ef
StratRev
Page 33 (62)
the flow situation. For the development of new approaches to such codes further investigations are necessary.
4.3 On the influence of the core power distribution and geometry simplifications
Fully three-dimensional simulation of the mixing and stratification phenomena in a reactor pressure vessel requires specification of the spatial distribution of the core power as well as description of the geometry details. Both these items can be specified only to a limited accuracy, for example the complexity of the core geometry requires geometry simplifications. Thus proper understanding of their influence on predicted results (using either system code or CFD approach) is necessary. The spatial power distribution in a reactor core after a shut-down depends on the core operational history, which determines the distribution of the fission products in the core and consequently the power distribution of the decay power. This distribution is known from the in-core fuel management calculations, thus it is subject to a certain modelling uncertainty. At the same time, the spatial power distribution significantly influences the creation of momentum in the buoyancy-driven flow. Depending on the power distribution, the flow pattern in the core region can take various forms, with up-flow in highly-heated regions and down-flow in low-heated regions. Such different flow patterns will obviously result in a spectrum of outcomes as far as thermal mixing and stratification is concerned. The reactor pressure vessel geometry is difficult to describe in various numerical approaches since it contains details of a wide range of scales: from sub-millimeters (fuel assemblies) to meters (lower plenum, downcomer). Thus, a fully detailed geometry description is unfeasible, since it would require a huge number of computational cells. Clearly, geometry simplifications are necessary to make the numerical simulations practically possible. Caution must be exercised, however, not to remove such geometry details that are expected to play a significant role in the simulated process. An example can be the existence of parallel flow paths, their mutual flow resistance and corresponding heat loads. Neglect of such flow paths or their inaccurate modelling can lead to significant errors in the predictions. The influence of both geometry simplifications and power distributions on the predicted mixing and stratification should be determined using a sensitivity study and uncertainty analysis approach. Variation of the parameters within their uncertainty bounds will produce a spectrum of results which can be described with statistical methods, based on a mean value and a standard deviation. Statistical approach to deal with modelling uncertainties seems to be unavoidable due to the complexity of the governing phenomena and a potentially chaotic behaviour of the system under consideration. Since chaotic systems are extremely sensitive to initial and boundary

StratRev
Page 34 (62)
conditions (and these are not known exactly in case of thermal stratification in reactor pressure vessel), they are subject to statistical analysis.
StratRev
Page 35 (62)
5 BWR-OG Workshop on Thermal Stratification A workshop on Thermal Stratification was organized within the framework of BWR Owner’s Group (BWR-OG) in Älvkarleby, Sweden, June 3-4, 2008, and the workshop attracted more than 50 participants both from industry and academia. The program and a list of the participants are enclosed in Appendix 1. In the present section a brief summary of the Workshop is given, including some comments from the final discussion. The first day of the workshop was mainly focussed on plant experiences related to thermal stratification phenomena, with presentations from different utilities. The majority of the presentations during the second day considered CFD-modelling of mixing and stratification.
5.1 Day 1 – June 3
5.1.1 BWR-OG Thermal Stratification Committee Update
Christopher Brennan (Exelon) gave a presentation with an update of the activities conducted by the BWR-OG Thermal Stratification Committee. The committee was formed in 2005 following the HTG-event at Oskarshamn 3, with the objective to develop an improved technical understanding and a consistent approach for the identification, prevention and mitigation of stresses induced by thermal stratification. A number of recent examples of thermal transients that have occurred in US BWRs were given, with identified rapid temperature changes in the range 111-144°C in the described events. He also described the work that has been undertaken to develop fleet training materials, as well as updating the technical specifications and to develop interim operating guidance in order to avoid thermal transients. Finally, a finite-element analysis performed by GE was described, in which a step change of 111°C was imposed near the RPV lower plenum. The analysis showed that the calculated stresses were acceptable.
5.1.2 The HTG-event at Oskarshamn 3
Two presentations were given regarding the HTG-event at Oskarshamn 3 (O3). Thomas Probert (OKG AB) described the actions that eventually resulted in the thermal transient at O3 and triggering of the HTG-alarm2. These actions have already been described in section 1.2.1. Prior to the restart of the plant, thermal hydraulic analysis (Goblin and CFD) as well as stress and deformation analyses were undertaken. The thermal hydraulic results indicated that the flow rate through the
2 HTG = Högsta Tillåtna Gränsvärde (Highest permissible limit), which is defined as 70°C in 2 minutes.
StratRev
Page 36 (62)
downcomer was smaller than expected considering the natural circulation flow that was created by the core power. This was explained by additional circulation loops within the core and through the control rod guide tubes. The conclusion from the analysis was that the HTG event was not a problem for the structural integrity of the RPV, the RPV internals or the RPV nozzles, nor was it a problem for the integrity of the fuel. However, as pointed out by Thomas Probert, the event illustrates the complexity of the thermal-hydraulic process in the RPV and the importance of fully understanding each local mechanism in order to understand the global (coupled) phenomenon. He also stressed the importance of a step-wise refinement of the models, and that each detail/mechanism must be modelled in such a way that the validity of the results are ensured.
5.1.3 The HTG-event at Oskarshamn 3 – Consequences for other Nordic BWRs
The second presentation related to the HTG-event was given by Bengt Wallner, Westinghouse Electric Sweden, who described the outcome of a study on possible consequences for other Nordic BWRs. The study showed that under certain conditions some kind of thermal stratification at the PRV bottom can occur in all studied plants. Structural analysis regarding the RPV bottom and the control rod function has been performed for some of the plants, using the same temperature difference as measured in Oskarshamn 3. The analysis did not identify any structural problems. The study did however recommend a number of actions in order to prevent temperature loads, e.g. automatic stop of the purge flow from the scram system when all main circulation pumps are switched off, monitoring of the temperature difference between the top and bottom of the RPV including alarm at high temperature difference, and update of operating instructions dealing with restart of main circulation pumps.
5.1.4 Cold water injection transient at NPP Krümmel
In June 2007 a main transformer at NPP Krümmel in Germany set fire, which initiated a sequence of events that resulted in a cold water injection transient. The scenario of the incident and the following thermal-hydraulic and structural analyses were presented by Gall, Ohlmeyer and Schümann from Vattenfall Europe. During the transformer fire a short loss of offsite power initiated reactor scram. Moreover, all feedwater pumps were tripped, and the 10 internal recirculation pumps were switched off. During approximately 14 minutes cold water was injected through the high-pressure injection systems, which caused thermal loads on the RPV and the internals. Simultaneously, two safety valves were opened (during 4 minutes) in order to reduce the reactor pressure. Thermal-hydraulic analysis was carried out with the ATHLET-code, in which the RPV and the connected systems were nodalized (divided into suitable control volumes) and modelled with a lumped-parameter approach. The results were validated with available plant data (reactor pressure and water level, steam mass flow rates), and
StratRev
Page 37 (62)
the calculated temperature changes were compared to the specified thermal loads during events such as “Loss of offsite power” as well as “automatic pressure relief”. The calculated temperature drop in the downcomer was 113K during approximately 500 s, which is lower than the licensed specified temperature change of 140 K during 300 s for the case “automatic pressure relief”. This case has been analyzed in the past, showing that the thermal stresses in the RPV-wall remain mainly elastic. Also the temperature difference between the inside and outside wall surface of the core shroud was calculated, which showed differences of approximately 30 K. These values were imposed to a finite element analysis of the core shroud. All analyses showed that any damage to the RPV and its internals due to the thermal loads can be excluded.
5.1.5 Stratification phenomena at NPP Gundremmingen II
Lars Behnke described two different stratification events that have been identified at Gundremmingen NPP in Germany. The first event occurred in 1993 and was caused by thermal stratification near the lower plenum of the RPV (similar to the HTG-event in Oskarshamn 3). The reactor was starting up after maintenance running at 13% thermal power when a turbine trip caused reactor scram and automatic depressurization. Electrical power was re-established after 10 minutes, but due to lubrication issues the main circulation pumps could not be restarted before two hours. During this time period approximately 57 tons of cold water (ca 20°C) was injected to the lower plenum through seal leakage water and control rod drive coolant water, and when the circulation pumps were restarted after two hours the temperature at the lower plenum was approximately 90°C. The start-up of the circulation pumps caused a thermal transient affecting the core as well as internals in the lower parts of the RPV. These issues were analyzed, and it was concluded that there were no safety concern, neither any significant fatigue level concern. The incident, however, have resulted in administrative specifications and requirements in order to avoid similar events in the future. The second event that was described considered thermal stratification inside a connection pipe to the main steam support system. The connection pipe is part of the residual heat removal system, and the stratification occurred when running in automatic condenser pool cooling mode. Due to heat conduction through a valve the water in a horizontal part of the connection pipe is heated, resulting in stratification as well as evaporation. The steam is ventilated to the condenser pool, and when the pressure in the connection pipe is reduced the pipe is re-flooded with colder water. This causes a cyclic temperature change especially at the lower wall of the horizontal pipe section, with a period time of approximately 8 hours. The temperature is varied within the range 50 to 150°C, and the maximum measured temperature difference between the upper and lower pipe wall is close to 107°C.
StratRev
Page 38 (62)
5.1.6 Events and evaluation of thermal stratification at Leibstadt NPP
Horst Eitschberger presented four different events of thermal stratification at Leibstadt NPP in Switzerland:
1) Feedwater line in steam tunnel 2) Feedwater nozzles 3) RPV bottom plenum 4) RPV upper plenum during a hydro-test
The first event occurred in the feedwater line near the outer isolation valve where hot water from the Reactor Water Cleanup system (RWCU) is returned to the feedwater through a branch pipe connected to the top of the feedwater pipe. Especially at cold startup when small flow rates of cold feedwater meet the hot water from the branch pipe stratification can occur, causing large temperature differences (up to 200K) between the top and bottom of the pipe. The following fatigue analysis indicated that actions must be taken to ensure that a cumulative fatigue value of 1 will not be reached within the plant lifetime. Consequently a number of actions were taken in order to reduce fatigue, e.g. modified operational procedures at low power, continuous monitoring of the temperature distribution in the feedwater line, and replacement of globe-valves by check-valves. The second issue considered the feedwater nozzles at the connection of the feedwater lines to the RPV. During startup temperature differences up to 230 K were observed between the top and bottom pipe wall near the nozzles, in combination with cyclic temperature variations. This occurs for feedwater flow rates below 7% of the rated flow, causing a stratified flow near the nozzle. The action taken is to use a single loop operation of the feedwater during startup, in combination with a continuous monitoring of the feedwater nozzle temperature distributions and thermal sleeve leakage. Stratification at the RPV bottom plenum can e.g. occur due to recirculation pump trip. However, the technical specifications at Leibstadt NPP inhibit restart of the pumps if the measured temperature difference between the dome and the bottom head drain is larger than a specified limit, and if this limit is exceeded cold shutdown is required. Horst also described a thermal transient caused by an automatic depressurization event with associated temperature change in the RPV. Structural analysis of the lower plenum was performed, showing acceptable stress levels.
5.1.7 Reliance on RPV bottom head drain line flow for temperature indication
Ronald Yantz from Cooper Nuclear Station raised the question about the reliability of temperature measurements based on the bottom head drain line flow. In many US BWRs the temperature at the lower plenum of the RPV is based on temperature measurements in the bottom head drain line, i.e. a thermocouple mounted inside a 2”-
StratRev
Page 39 (62)
pipe connected to the lower plenum. Since the monitoring point is located outside the RPV it is important to provide sufficient flow rate through the drain line in order to obtain reliable data. Today there is no monitoring of the flow rate through the drain lines, and it is questionable whether sufficient flow is obtained when the recirculation pumps are switched off. Insufficient flow through the drain line can lead to a reduced temperature of the drain line water due to the surrounding drywell ventilation. Thus, a possible consequence is an overprediction of the temperature difference between upper and lower plenum, which may inhibit restart of the recirculation pumps. Yantz suggested that the current Technical Specifications are revised regarding permissible temperature limits at restart of the recirculation pumps based on analyses. He also encouraged testing of the actual flow rates through the drain line in order to determine the suitability of temperature monitoring at this location.
5.1.8 BWR-OG current issues
Gregory Holmes who is the BWR-OG project manager gave a presentation about current issues within BWR-OG. The organization was described, including the different committees that are formed within BWR-OG. Recent and upcoming events were described, as well as the product releases (documents) that have been completed within BWR-OG during 2007 and 2008.
StratRev
Page 40 (62)
5.2 Day 2 – June 4
5.2.1 Safety importance of stratification phenomena – Regulatory aspects
A presentation by the Swedish Nuclear Inspectorate (SKI3) was prepared by Oddbjörn Sandervåg and presented by Wiktor Frid. Safety issues that are currently raised in Sweden are e.g. low power transients, temperature stratification phenomena, recirculation in the vessel when the recirculation pumps are switched off, and asymmetries in the core. SKI is together with industry supporting research on these topics, which are primarily performed by universities in Sweden and Finland. However, SKI requested experimentally supported analyses following the HTG-event at Oskarshamn 3. In the presentation the application of CFD for nuclear power applications was discussed. SKI welcomes the work on standards and guidelines for quality assurance of models, methods and data. Efforts like ERCOFTAC Best Practice Guidelines is a good start, but extensions to these guidelines are important and strongly encouraged. Finally, a number of other questions were raised such as pressurized thermal shock, hydraulic loads on structures and components, thermal fatigue (in components, tees and piping), and condensation water hammer.
5.2.2 Industrial buoyant flows: Features and advanced modelling
In this presentation Aleksey Gerasimov from ANSYS UK (former Fluent Europe Ltd, UK) stressed the importance of the near-wall modelling in CFD-simulations of buoyant flows. Buoyancy effects have a significant influence on the heat transfer, which can be either impaired or enhanced depending on the direction of the buoyancy forces as compared to the mean flow direction. The wall heat transfer is strongly dependent on the viscous sublayer close to the wall, which requires special attention in turbulence modelling. An expensive but usually rather accurate approach is so-called low-Reynolds number modelling, which means that a very fine near-wall mesh is used in order to resolve the viscous sublayer. This approach is usually not affordable in most industrial applications, and instead wall functions are used to resolve the near-wall flow region.
3 Since 1 July 2008 the Swedish Nuclear Inspectorate (SKI) and the Swedish Radiation Protection Institute (SSI) are merged into a new authority named the Swedish Radiation Safety Authority (SSM)
StratRev
Page 41 (62)
However, as pointed out in the presentation, the conventional wall functions are based on prescribed velocity and temperature profiles and, therefore, have a very limited range of applicability. The use of the standard wall functions in nuclear applications can easily result in highly overestimated heat transfer predictions and this, in turn, can adversely affect the nuclear design and safety studies. To improve the near-wall modelling a new Analytical Wall-Function (AWF) approach has been developed by researchers at the University of Manchester for the UK Nuclear Power Consortium. The AWF technology does not rely on prescribed velocity and temperature profiles and instead combines the analytical solution for the temperature and velocity fields in the vicinity of the wall. AWF is more physical and more general. It takes into account such effects as convective transport, pressure gradients and variable transport properties that are important in buoyancy-influenced flows. The analytical wall-function approach has been applied successfully and validated intensively in the flows that take place in nuclear reactors. The eddy-viscosity as well as the Reynolds Stress models can be used with this new near-wall treatment. The AWF approach has demonstrated significantly improved results as compared to conventional wall-functions. Regretfully, the analytical wall-functions have not been implemented in any commercial code as yet and, therefore, are unavailable for the nuclear industries outside the UK. Aleksey Gerasimov, as a developer of the AWF approach and current employee of ANSYS UK, has proposed to implement this approach in FLUENT software through the funded development framework, subject to external interest from worldwide nuclear power generation companies and authorities.
5.2.3 Experiments on mixing and stratification
Prof. Horst-Michael Prasser gave a presentation about ongoing research at ETH Zürich on turbulent mixing in T-junctions with and without density gradients. Mixing phenomena are studied in an experimental test facility with a horizontally oriented T-junction in which de-ionized water and tap water are mixed. Wire-mesh sensors (3 sensors with 16×16 measurement points each) are used to obtain time resolved data of the concentration field downstream of the T-junction. Also velocity data is obtained by point-to-point cross-correlation of the wire-mesh sensors. The experimental data were used for CFD-validation, and firstly results from steady-state calculations using different turbulence models were presented. The steady-state calculations underestimated the turbulent mixing, although improvements could be obtained by changing the turbulent Schmidt number and the modelling constant Cμ. However, the macroscopic density effects observed in the experiments were well reproduced by the steady state simulations.
StratRev
Page 42 (62)
Also some computational results using Large Eddy Simulations (LES) were presented and compared with experimental data obtained from the wire-mesh sensors. Moreover, cross-correlation of data within a single measurement plane was presented. Such correlations can be used to study prevailing flow structures from a statistical point of view, and it also constitutes a powerful code validation technique in order to validate results from transient CFD-calculations (such as LES or URANS) with experimental data.
5.2.4 Simulation of thermal stratification in T-junctions using scale resolving turbulence models in ANSYS CFD
Anders Jansson (Medeso AB) and Fredrik Carlsson (Ansys) presented results from simulations of thermal mixing in T-junctions. The computations were performed by Thomas Frank and co-workers at ANSYS Germany using the CFX-code, and Fredrik Carlsson at ANSYS Sweden using Fluent. Two test cases were considered: the T-junction experiment at ETH Zürich (see previous section) and a T-junction experiment performed by Vattenfall in Sweden. The computations were focussed on using Scale-Adaptive Simulations (SAS) based on the SST k-ω model. The SAS approach is similar to LES in the sense that larger scales are resolved in the computations while smaller turbulence scales are modelled, but with SAS there is no explicit dependency on the grid spacing as is the case in LES. The simulation results with the SAS-SST method were in many respects satisfactory when compared to the experimental data. Structures that can be associated with thermal striping were clearly visible in the simulations, and comparison to statistical quantities for the measured velocities and temperatures showed reasonably good agreement. It was also pointed out that application of best practice guidelines to LES-like simulations is still a challenge due to the extremely large computational times.
5.2.5 CFD modelling of mixing and stratification
The Nuclear Research and Consultancy Group (NRG) in the Netherlands has a CFD group working with both nuclear and non-nuclear applications. Arkadiusz Kuczaj presented two examples of research projects on mixing and stratification, namely pressurized thermal shock (PTS) and thermal mixing (thermal fatigue) in T-junctions. A major issue when modelling thermal stratification is an accurate modelling of turbulent mixing, since turbulent mixing is usually the major mechanism that counteracts the formation of stratified flow. The PTS calculations considered experimental data from the UPTF and ROCOM test facilities in Germany. The tests were performed in order to investigate thermal mixing in the cold leg and the downcomer during a SBLOCA with thermal stratification in the
StratRev
Page 43 (62)
cold leg. This scenario can occur when cold ECC-water is introduced into the cold leg during a LOCA. Unsteady RANS-calculations (URANS) were applied, and the objective was to determine the accuracy of the CFD-modelling for PTS. The results showed that the computations captured the stratification in the cold leg, but the calculations were less capable of predicting the oscillating flow in the downcomer. It was also suggested that more detailed unsteady calculations such as LES or SAS are more likely to solve the complex flow phenomena in the downcomer. The second test case is thermal mixing in T-junctions, with the objective of determining the accuracy of LES for predicting thermal fatigue. The considered test case is the Vattenfall experimental data, and stepwise refinements of the computational mesh were applied in order to determine the required mesh resolution. The results showed quite good agreement with experimental data, and the maximum error between measured and computed temperature fluctuations were 20%.
5.2.6 CFD simulation of the thermal mixing in the upper plenum and hot leg in a PWR
Onsala Ingenjörsbyrå (Lars Andersson, Pascal Veber) described a calculation covering the entire RPV that was performed in order to study the thermal mixing in the upper plenum and hot leg of a PWR. The computation is a good example of what is currently feasible to compute with CFD, and it also highlights some difficulties associated with such massive calculations. The computational model consists of 50 million cells, and it will be used to simulate how potentially new core loadings (due to power upgrades) will change the temperature distribution in the hot leg. The computational domain extends from the cold leg inlet to the hot leg outlet at the steam generators. The geometry of the internals is simplified but with the ambition to provide the correct pressure drop and flow field. The core region is modelled as 157 individual fuel elements with source terms giving the correct power and with porous material in order to simulate the pressure drop. In order to reduce the size of the computational mesh separate detailed studies of internals such as guide tubes, support columns and mixers were carried out. The calculations are steady-state calculations using the k-ε model. A number of computational results were shown, including a comparison of the influence of the turbulence model. It was shown that the computed temperature distribution in the hot leg was significantly different with the RNG k-ε model as compared to the realizable and the standard k-ε models, where the RNG k-ε model gave a more fragmented mean temperature distribution. Based on this observation a separate detailed study was performed on thermal mixing in an outlet pipe downstream of a larger inlet volume. The calculations were carried out with different RANS models and LES, and the results clearly showed that the modelled turbulent
StratRev
Page 44 (62)
viscosity was significantly larger with the realizable k-ε model as compared to the RNG k-ε and LES model.
5.2.7 Brittle fracture safety analysis of German RPVs based on advanced thermal hydraulic analysis
The PTS load case originating from the introduction of cold ECC water into the cold leg in a PWR (see also section 5.2.5) was considered in the presentation by Ulf Ilg, EnBW Kernkraft. The presentation described structural analysis based on predicted thermal loads for the PTS load case, where different sizes of a hot leg leak were considered. A global finite element model was used for temperature and stress calculations, where the core weld, the flange connection and the nozzle corner are the points of primary interest. Load paths (illustrated as stress intensity factor versus temperature) for the core weld and the nozzle corner were presented as a consequence of different leak sizes in the hot leg. The results obtained for the loss of coolant paths investigated demonstrated that brittle fracture can be excluded in these specific RPV areas, and sufficient safety margin can be demonstrated for all different injection modes.
5.2.8 The language of BWR design basis
In this presentation Ronald Yantz (Cooper Nuclear Station) discussed the importance of a correct use of technical terms as they were defined during licensing. In particular the terms heatup and cooldown in the reactor coolant system were discussed. There are specific licensed definitions of these terms, but non-technical interpretations of these critical terms have been allowed to flourish within the US BWR industry (meaning any temperature increase or decrease in the reactor coolant system). Appropriate use of these terms is important in order to ensure a proper application of the Technical Specifications. It was also stressed that a too simplistic interpretation of important technical terms may imply that inappropriate actions are taken during transient scenarios, with possible safety related consequences.
5.2.9 Stratification issues in the primary system. Status report from an ongoing State-of-the-Art review.
The presentation gave a brief description of the ongoing project StratRev. The objective of the project is to perform a review of available validation experiments and State-of-the-Art in modelling of stratification and mixing in the primary system of Light Water Reactors. The work is a co-operation between Vattenfall Research and Development (Sweden), the Royal Institute of Technology (Sweden), VTT (Finland) and Fortum (Finland), and financed by the Nordic Thermal Hydraulic Network (NORTHNET) and the Nordic Nuclear Safety Research (NKS). An important
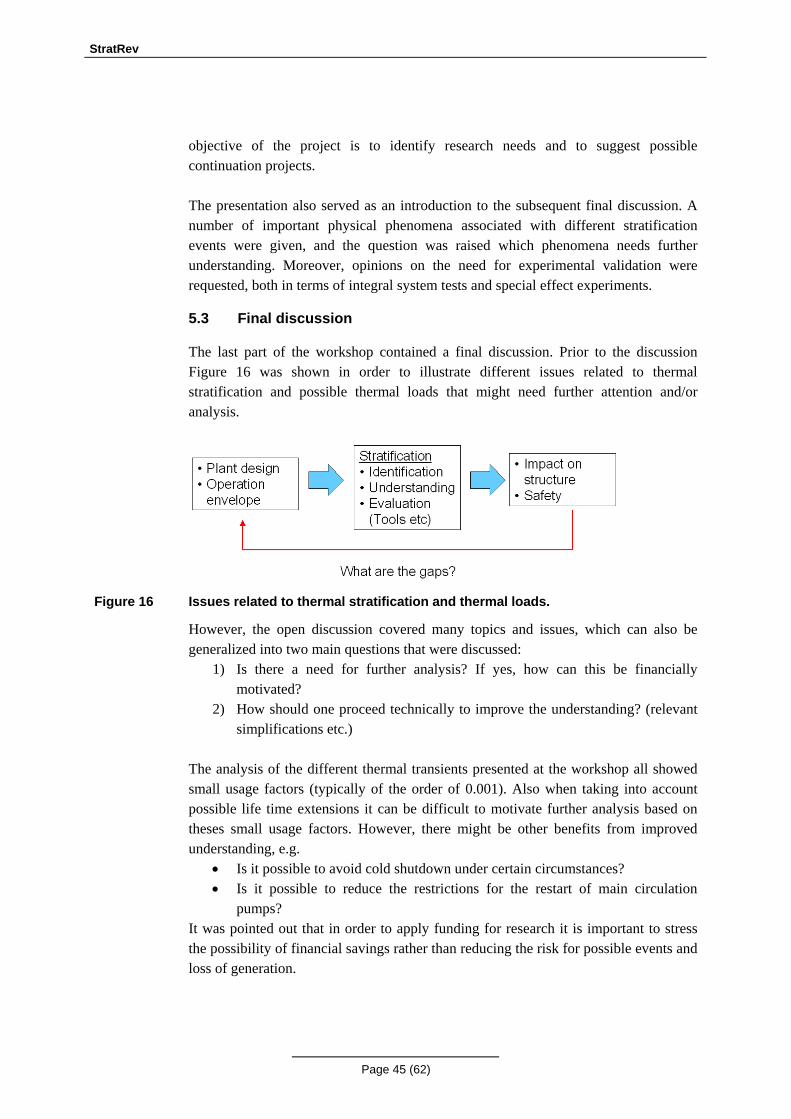
StratRev
Page 45 (62)
objective of the project is to identify research needs and to suggest possible continuation projects. The presentation also served as an introduction to the subsequent final discussion. A number of important physical phenomena associated with different stratification events were given, and the question was raised which phenomena needs further understanding. Moreover, opinions on the need for experimental validation were requested, both in terms of integral system tests and special effect experiments.
5.3 Final discussion
The last part of the workshop contained a final discussion. Prior to the discussion Figure 16 was shown in order to illustrate different issues related to thermal stratification and possible thermal loads that might need further attention and/or analysis.
Figure 16 Issues related to thermal stratification and thermal loads.
However, the open discussion covered many topics and issues, which can also be generalized into two main questions that were discussed:
1) Is there a need for further analysis? If yes, how can this be financially motivated?
2) How should one proceed technically to improve the understanding? (relevant simplifications etc.)
The analysis of the different thermal transients presented at the workshop all showed small usage factors (typically of the order of 0.001). Also when taking into account possible life time extensions it can be difficult to motivate further analysis based on theses small usage factors. However, there might be other benefits from improved understanding, e.g.
• Is it possible to avoid cold shutdown under certain circumstances? • Is it possible to reduce the restrictions for the restart of main circulation
pumps? It was pointed out that in order to apply funding for research it is important to stress the possibility of financial savings rather than reducing the risk for possible events and loss of generation.
StratRev
Page 46 (62)
The second issue on how to proceed technically was discussed, and especially how to simplify the problem. Is it for example possible to analyze the lower plenum separately using boundary conditions from a core model, or is it necessary to have a larger coupled model including the core and other internals? Different opinions were given on this issue. Below follows some of the comments related to possible further analysis:
• It is desirable to make the studies as generic as possible in order to avoid a strong dependence on plant specific geometries
• It is important to identify the driving forces (forces that enhance as well as counteract stratification) and to look at the uncertainties
• It is important to analyze more than one event/scenario in order to gain understanding
• It is desirable to start with a simple model followed by a step-wise increase in the complexity. One suggestion is to start with a stratified condition and study different types of disturbances that can breakup the stratification.
• Another suggestion was to study whether or not a stratified layer is formed in a vessel with a very hot core (i.e. just after SCRAM). It was suggested to start with a hot core and study the natural circulation loops that are created. The main objective is to determine whether a stagnant stratified layer is formed, and how long time that would be required to obtain stratified conditions. Such information would be useful in order to establish relevant operator actions, e.g. to determine when it is necessary to progress to cold shutdown.
• Another issue is where the cold crud removal flow enters the pressure vessel. In the US it is common to assume that the fluid escapes from the control rod guide tubes directly into the RPV bottom head. This assumption is questionable, and the crud removal flow is deposited above the core support plate. This difference may have a significant influence on the possibility to form a stratified layer.
Some other comments/questions from the discussion:
• Analysis with RELAP5 or RAMONA was recommended for analyzing some regions of the domain in order to save time.
• University of Manchester (UMIST) has experimental data for different generic test cases on natural circulation and stratification that might be of interest for continued analysis.
• The vendors (e.g. GE) have extensive experimental data from the time when the plants were deigned and built. Whether such data are accessible or not must be investigated.
• It would be useful to review and classify stratification events similar to the HTG-event at Oskarshamn. This is, however, a very time consuming task, and many of the important events may not be known due to limited instrumentation and measurements.
StratRev
Page 47 (62)
• It is important to understand why we should or should not restart the circulation pumps in case of an event.
• It is important to have similar technical specifications and limitations in different plants.
• At power uprates the core power distribution will be more uniform. Will this increase the risk for thermal stratification in the RPV?
To summarize the discussions, there is an interest to improve the understanding of the origin and the break-up of stratification in the RPV. It is, however, not obvious how to motivate this based solely on economical arguments. For possible further analysis the test cases should be selected in order to be as generic as possible, preferably with a stepwise increase in the degree of complexity. Possible continuation projects are discussed in the next section, taking the above comments into account.
StratRev
Page 48 (62)
6 Possible continuation projects
6.1 Goals and motivation
The HTG event in Oskarshamn and related similar events in other power plants (Ringhals 1, Barsebäck, Gundremmingen) reveal two important safety issues:
• stratification and thermal mixing in RPV and primary circuit are important phenomena that can affect the integrity of the system,
• there is lack of knowledge and procedures that should be applied when investigating and solving this type of events.
Thus, the ultimate goal for continuation projects will be to establish procedures and methodologies which will be applicable for analysis and assessment of stratification and mixing related issues. The outcome of the project will be Best Practice Guidelines (BPG) to be followed by utilities and authorities in case of such events. The benefit of the development of BPG will be two-fold:
• the regulators will be better prepared to substantiate the public safety, • the utilities will avoid lengthy production losses, since following established
BPG will significantly shorten the event analysis and assessment time. In addition, the developed methodology will address the assessment of safety margins in threats driven by stratification and mixing as well as provide knowledge and databases for risk informed decision making. The continuation projects will also have as an objective to assess the prediction capabilities of present computational methods. The important phenomena that need to be predicted include, but are not limited to, the turbulent mixing as well as movement and break-up of stratified layers, both in combination with buoyancy driven flows. The assessment will be carried out through validation of existing computational tools (preferably CFD-based) against experimental data. Prior to this the existing experimental database will be evaluated, and the identified gaps will be filled with new experiments proposed within the continuation projects. Two classes of experiments will be sought: experiments focused on separate effects (separate-effect tests) and experiments focused on system behaviour. The former will be used for validation of the physical models used in the computational tools, whereas the latter will be needed to assess the effects of geometry simplifications on the accuracy of predictions. Many experimental studies that have been performed in the past are not suitable for validation of CFD calculations since well-defined boundary conditions as well as fairly detailed characterization of the flow and temperature fields are needed in order to perform a thorough validation. However, the ROCOM test facility at FZR Rossendorf (see refs. [69]-[71]) is a fairly large-scale and well-equipped test facility that is suitable for studies of stratification and mixing. A possible
StratRev
Page 49 (62)
co-operation with FZR Rossendorf can thus be one possible option in order to obtain high-quality validation data. Based on these efforts, an extension of the existing Best Practice Guidelines for CFD in nuclear safety applications (OECD/NEA, ref. [77]) will be developed to cover new relevant applications. A methodology will be provided to evaluate safety margins in case of both conservative and best-estimate analysis. The methodology will be demonstrated and applied for a selected test case.
6.2 Outline of a research program for the development of BPG for stratification events
There are three major questions that might be asked in relation to possible stratification events both in the RPV and in primary system piping:
I) What is the possible impact on the structures? II) Can the event be prevented? III) What measures should we take in case of a stratification event?
These three questions are analogous with the three boxes shown in Figure 16, i.e. the first question is related to the impact on the structure and the safety concerns, question two deals with the plant design and the operation envelope, while the last question is closely related to the identification, understanding and evaluation of an upcoming stratification event. In the subsequent sections different tasks have been identified in order to address the questions above and to develop BPG for stratification events. Some of the tasks have already been considered in the analyses following the HTG-event and/or in the related NOG-projects. It should also be emphasized that the described research program is not proposed as one (large) continuation project, but rather a vision of the necessary steps towards BPG for analyzing stratification and mixing events. Many of the tasks can be carried out as individual projects, and the order of priority must take into account aspects such as most important knowledge gaps, risk assessment, available time frame and budget etc. I. What is the possible impact of stratification events on the RPV structures?
Task I.1: Conservative assessment of the impact on the structure A limiting scenario is considered in which the maximum possible thermo-mechanical load is applied in the structural analysis. The impact on different components must be considered, e.g. the RPV lower head and its penetrations, control rods, core shroud, etc. The primary purpose of this analysis is to determine whether or not structural damage may be a concern.
StratRev
Page 50 (62)
Task I.2: Quantification of the maximum realistic thermo-mechanical load To estimate the maximum realistic load, basic experiments might be necessary in order to produce data for code validation purposes. Analysis with validated methods (CFD and others) has to be provided in order to determine realistic magnitudes of the temperature gradients, thermal loading (amplitudes and frequencies), etc. Task I.3: Assessment of possible structural damage in case of realistic thermal loads Data obtained from task I.2 are used as boundary conditions for structural analysis similar to task I.1. Task I.4: Development of a structural impact map Various scenarios of possible thermo-mechanical loads and corresponding structural impact (damage) are considered and organized. The primary focus is the RPV lower plenum and its internals, but a similar map can also be developed for typical scenarios in primary system piping. II. Can stratification events be prevented?
Task II.1: Consider possible scenarios for development of stratification The objective of this task is to identify and analyze the driving mechanisms for the onset of stratified layers. This includes analysis of various internal circulation loops and their dependence on the specific geometry and core power distribution. This task might require fairly complicated experiments (e.g. complex geometry) and advanced analysis methods. Task II.2: Analyze the possibilities to prevent the most detrimental scenarios This task should provide recommendations on the operating procedures (or modifications) of the plants in order to prevent the origin of detrimental stratification scenarios. III. What measures should we take in case of a stratification event? Task III.1: Experiments of break-up and mixing of stratified layers This task should consider mixing phenomena related to the restart of the MCP (or other possible convection flows that can break up a stratified layer). Task III.2: Develop/validate codes for prediction of mixing The codes should be evaluated based on relevant experiments in task III.1 Task III.3: Procedures for the MCP restart Instructions and/or limitations on the restart of the MCPs following a stratification event should be analyzed. Task III.4: Define safety criteria
StratRev
Page 51 (62)
It is desirable to specify criteria for acceptable thermo-mechanical loads on the RPV lower head and penetrations, and to evaluate the safety margins. It is also important to reach a consensus in this respect, i.e. to define a common and accepted procedure to evaluate the safety margins and the usage factors.
6.2.1 Comments
In the NOG-projects various scenarios that could result in stratification in the RPV were identified for all Nordic BWRs (refs. [59]-[62]). Thus, considerable work to identify and to provide recommendations for preventing these scenarios (task II.1, II.2 and III.3) has already been carried out. Structural analyses have also been performed (cf. task I.1-I.4), although it is not clear to the present authors whether there are existing gaps in the structural analysis that needs further attention. Despite numerous and detailed studies performed in the past there is no general solution proposed for the events related to stratification in a RPV. There is no clear quantification of conservatism behind the present safety requirements [63]. The proposed program should develop transparent assessment of real safety margins in case of stratification induced thermal loads on RPV structures. Such assessment can be considered by the regulator as a background for the development of specific regulations for RPV stratification issues.
6.3 Possible initial tasks
Some more details regarding possible initial tasks to be performed are presented below.
6.3.1 Conservative assessment of the impact on the structure
Consideration of a bounding scenario with maximum possible thermo-mechanical load should give an answer for the question about risk significance of thermal stratification development. The maximum possible damage should be evaluated for different lower plenum structural elements (e.g. the RPV lower head and its penetrations, control rods, core shroud, etc.) In the analysis the worst scenarios of possible structural damage should be determined and considered. If the results of such bounding approach analysis will show that the potential damage and associated risk are acceptable even with conservative assumptions, then the results of such analysis may serve as background for reconsideration of safety regulations and procedures related to HTG-type events. Also a very important task, which can be performed in the framework of a conservative estimation approach, is identification of potential reasons for the control rod shaft failure in Oskarshamn 3 found in October 2008.
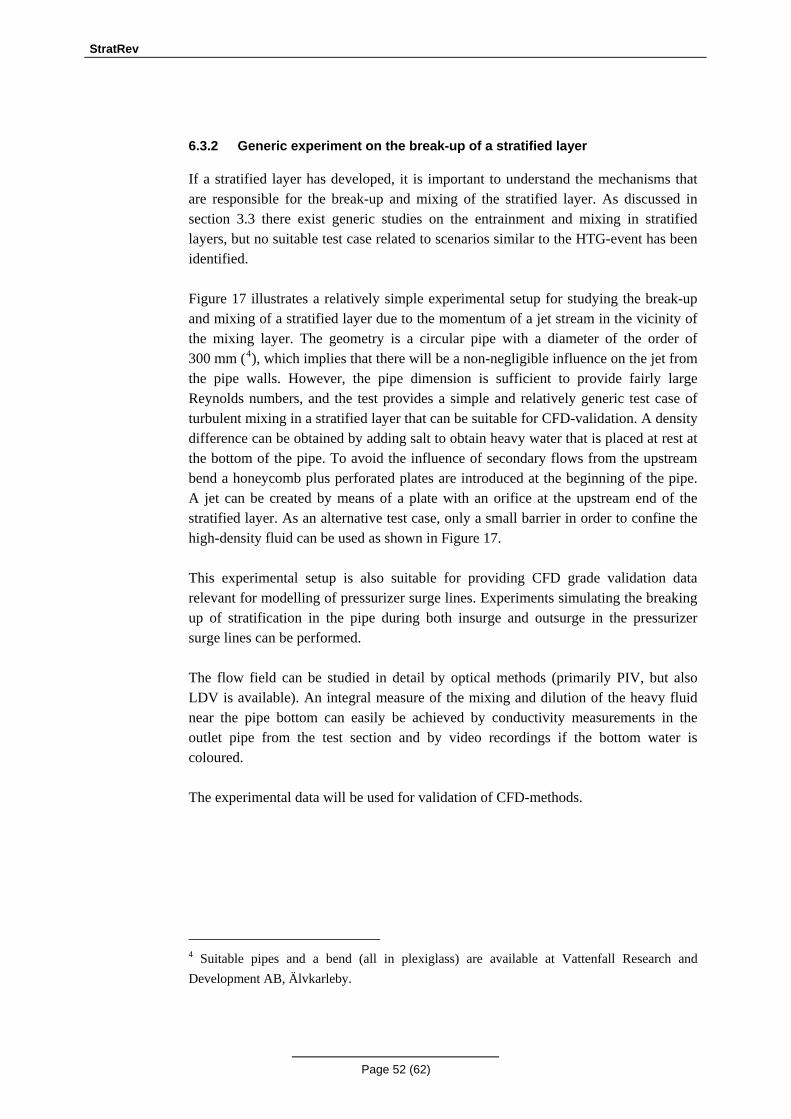
StratRev
Page 52 (62)
6.3.2 Generic experiment on the break-up of a stratified layer
If a stratified layer has developed, it is important to understand the mechanisms that are responsible for the break-up and mixing of the stratified layer. As discussed in section 3.3 there exist generic studies on the entrainment and mixing in stratified layers, but no suitable test case related to scenarios similar to the HTG-event has been identified. Figure 17 illustrates a relatively simple experimental setup for studying the break-up and mixing of a stratified layer due to the momentum of a jet stream in the vicinity of the mixing layer. The geometry is a circular pipe with a diameter of the order of 300 mm (4), which implies that there will be a non-negligible influence on the jet from the pipe walls. However, the pipe dimension is sufficient to provide fairly large Reynolds numbers, and the test provides a simple and relatively generic test case of turbulent mixing in a stratified layer that can be suitable for CFD-validation. A density difference can be obtained by adding salt to obtain heavy water that is placed at rest at the bottom of the pipe. To avoid the influence of secondary flows from the upstream bend a honeycomb plus perforated plates are introduced at the beginning of the pipe. A jet can be created by means of a plate with an orifice at the upstream end of the stratified layer. As an alternative test case, only a small barrier in order to confine the high-density fluid can be used as shown in Figure 17. This experimental setup is also suitable for providing CFD grade validation data relevant for modelling of pressurizer surge lines. Experiments simulating the breaking up of stratification in the pipe during both insurge and outsurge in the pressurizer surge lines can be performed. The flow field can be studied in detail by optical methods (primarily PIV, but also LDV is available). An integral measure of the mixing and dilution of the heavy fluid near the pipe bottom can easily be achieved by conductivity measurements in the outlet pipe from the test section and by video recordings if the bottom water is coloured. The experimental data will be used for validation of CFD-methods.
4 Suitable pipes and a bend (all in plexiglass) are available at Vattenfall Research and Development AB, Älvkarleby.
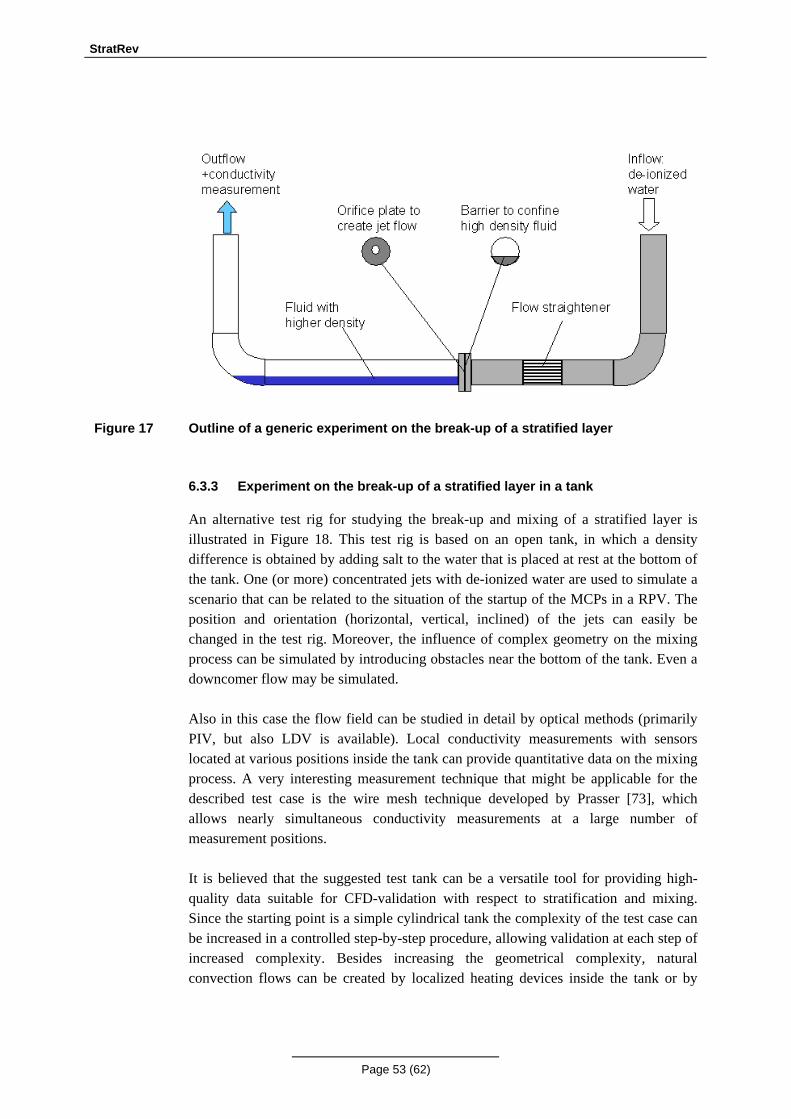
StratRev
Page 53 (62)
Figure 17 Outline of a generic experiment on the break-up of a stratified layer
6.3.3 Experiment on the break-up of a stratified layer in a tank
An alternative test rig for studying the break-up and mixing of a stratified layer is illustrated in Figure 18. This test rig is based on an open tank, in which a density difference is obtained by adding salt to the water that is placed at rest at the bottom of the tank. One (or more) concentrated jets with de-ionized water are used to simulate a scenario that can be related to the situation of the startup of the MCPs in a RPV. The position and orientation (horizontal, vertical, inclined) of the jets can easily be changed in the test rig. Moreover, the influence of complex geometry on the mixing process can be simulated by introducing obstacles near the bottom of the tank. Even a downcomer flow may be simulated. Also in this case the flow field can be studied in detail by optical methods (primarily PIV, but also LDV is available). Local conductivity measurements with sensors located at various positions inside the tank can provide quantitative data on the mixing process. A very interesting measurement technique that might be applicable for the described test case is the wire mesh technique developed by Prasser [73], which allows nearly simultaneous conductivity measurements at a large number of measurement positions. It is believed that the suggested test tank can be a versatile tool for providing high-quality data suitable for CFD-validation with respect to stratification and mixing. Since the starting point is a simple cylindrical tank the complexity of the test case can be increased in a controlled step-by-step procedure, allowing validation at each step of increased complexity. Besides increasing the geometrical complexity, natural convection flows can be created by localized heating devices inside the tank or by
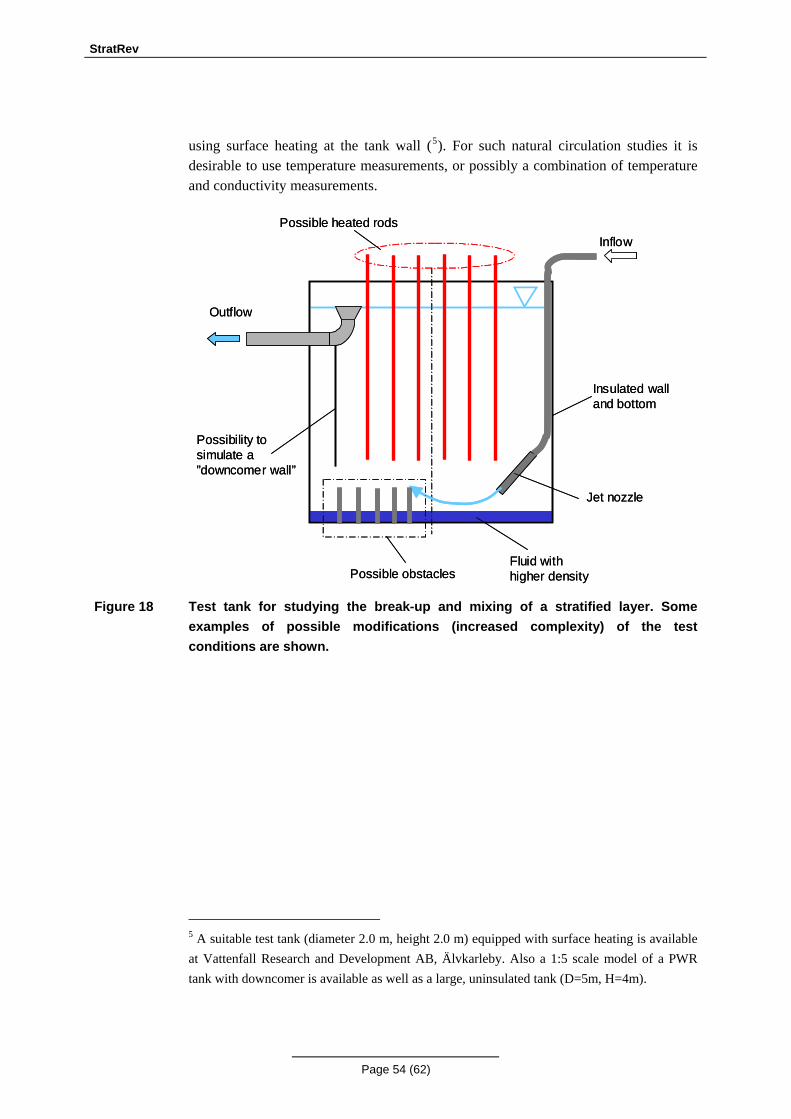
StratRev
Page 54 (62)
using surface heating at the tank wall (5). For such natural circulation studies it is desirable to use temperature measurements, or possibly a combination of temperature and conductivity measurements.
Outflow
Inflow
Jet nozzle
Possible obstaclesFluid withhigher density
Possible heated rods
Insulated walland bottom
Possibility to simulate a ”downcomer wall”
Outflow
Inflow
Jet nozzle
Possible obstaclesFluid withhigher density
Possible heated rods
Insulated walland bottom
Possibility to simulate a ”downcomer wall”
Figure 18 Test tank for studying the break-up and mixing of a stratified layer. Some
examples of possible modifications (increased complexity) of the test conditions are shown.
5 A suitable test tank (diameter 2.0 m, height 2.0 m) equipped with surface heating is available at Vattenfall Research and Development AB, Älvkarleby. Also a 1:5 scale model of a PWR tank with downcomer is available as well as a large, uninsulated tank (D=5m, H=4m).
StratRev
Page 55 (62)
7 Concluding remarks The objective of the present report is to review available validation experiments and State-of-the-Art in modelling of stratification and mixing in the primary system of Light Water Reactors. The main focus is on stratification and natural circulation in the RPV, but also issues related to stratification in primary system piping are discussed. The report does not claim to be a comprehensive review of stratification issues and related research work, and the contents are to a large extent based on the collected knowledge of the authors. However, a quite large number of references have been considered, and a good source of information regarding common stratification issues in nuclear power plants was the BWR-OG workshop that was arranged within the project. The presentations given by different utilities at the BWR-OG workshop showed that stratification issues are not unusual, and a number of different examples were given. However, the analysis of the different thermal transients all showed small usage factors, which raised questions whether current high-temperature alarms and operating restrictions after pump trips are relevant. Nevertheless, it is a fact that uncontrolled thermal transients have caused long and costly production stops during the period when the possible safety effects of the transients are analyzed, and it is likely that such events will occur also in the future. It is thus desirable to take actions in order to reduce the probability for stratification to occur, but also to develop well-validated and accepted tools and procedures for analyzing upcoming stratification events. The questions that should be considered to a greater extent are the following
1) What is the possible impact of stratification events on the RPV structures? 2) What can be done to prevent the occurrence of thermal transients? 3) What means should be taken in case of a stratification event?
A fairly ambitious research plan was outlined in section 6.2 covering all of the above questions, but also a few suggestions regarding more limited research activities were given. An important activity that requires further attention is validation of different computational methods with relevant test cases. Since many of the stratification events results in thermal loads that are localized in time and space, CFD is a (the) suitable tool. However, the often very large and complex geometry implies that CFD cannot be applied to the entire RPV. When possible it is desirable to divide the problem in smaller domains that can be analyzed with CFD, and it is also important to perform a step-by-step increase in complexity with intermediate validation versus relevant experimental data. The fact that CFD cannot be applied to the entire RPV also emphasizes the importance of other methods that can be applied to this type of flow problems. For example

StratRev
Page 56 (62)
modelling the complicated flow inside the reactor core is such a problem that is not feasible today with current CFD-methods, and it is thus important to continue to develop and validate integral methods that can be applied. Coupling of CFD and integral methods is another important issue. The ultimate goal is to establish Best Practice Guidelines that can be followed both by utilities and authorities in case of an event including stratification and thermal loads. An extension of the existing Best Practice Guidelines for CFD in nuclear safety applications developed by OECD/NEA is thus suggested as a relevant target for a continuation project.
StratRev
Page 57 (62)
8 References [1] Denfors, G, (2004) HTG-händelse, Proceedings from ”Kärnteknik 2004”,
Arlanda, December 1-2, 2004. [2] Arbman, B. (2003) Oskarshamn 3 – Rapport av händelseförloppet under HTG-
händelsen 2003-09-23, Report 2003-10099, OKG AB. [3] Yu, Y.J., Park, S.H., Sohn, G.H and Bak, W.J. (1997) Structural evaluation of
thermal stratification for PWR surge line, Nucl. Eng. Des. 178, 211-220. [4] Höhne, Th., Kliem, S., Rohde, U. and Weiss, F.-P. (2007) Modeling of
buoyancy-driven flow experiment at the Rocom test facility using the CFD-code Ansys CFX, Int. Journal for Nuclear Power, 3, 168-174.
[5] Toppila, T. (2006) CFD simulation of Fortum PTS experiment, Bencmarking of CFD codes for application to nuclear reactor safety (CFD4NRS), OECD NEA workshop, September 5-7, 2006, Garching, Germany.
[6] Ling C., Kyoung S.W., Ishii M., Lim J., Han J. (2006) Suppression pool mixing and condensation tests in PUMA facility International Conference on Nuclear Engineering, Proceedings, 2006, ICONE14-89348, 11p
[7] Laine J., Puustinen M. (2006) Thermal stratification experiments with the condensation pool test rig. Lappeenranta University of Technology, Finland. Research Report, NKS-117.
[8] Baltyn, W., (2003), Oskarshamn 3 HTG-analys fas 2. Modifiering av relap5-modell och analys av pumptransient, Report BC-2003-12, rev 0, Baltyn Consulting HB.
[9] Carlson, A., (1996) Forsmark 3 – Utredning avseende kallvattenansamling i reaktortankbotten, Rapport 96/63, Forsmarks Krfatgrupp 1996-10-10.
[10] Metzner, K.J. and Wilke, U. (2005) European THERFAT project – thermal fatigue evaluation of piping system ”Tee”-connections, Nucl. Eng. Des. 235, 474-484.
[11] Metzner, K.J. and Wilke, U. (2007) Thermal fatigue evaluation of piping system T connections (THERFAT), Fifth Framework Programme of the European Atomic Energy Community, Final synthesis report, Final issue, Rev. 1, July 2007, (ftp://ftp.cordis.europa.eu/pub/fp5-euratom/docs/therfat_projrep_en.pdf).
[12] Calonius, K.; Pättikangas, T. and Puustinen, M. (2001) Loading cases due to stratified flow situations, “Kärnteknik 2001”, Stockholm, 21-22 November, 2001, 10 p.
[13] Pättikangas, T., Manninen, M., Karppinen I. and Puustinen M. (2001) CFD simulations of thermal stratification in piping system dead legs, VTT Energy Reports 23/2001, 50 p.
[14] Anon. (2003) Assessment and management of ageing of major nuclear power plant components important to safety, IAEA-TECDOC-1361, Vienna, Austria, 235 p.
StratRev
Page 58 (62)
[15] Shah, V.N., Ware, A.G., Atwood, C.L., Sattison, M.B., Hartley, R.S., and Hsu, C. (1999) Assessment of field experience related to pressurized water reactor primary system leaks, ASME Pressure Vessels and Piping Conference, 1-5 August, 1999.
[16] Hytönen, Y. (1998) Two leakages induced by thermal stratification at the Loviisa power plant, NEA/CSNI specialists’ meeting on: Experiences with thermal fatigue in LWR piping caused by mixing and stratification, OECD Nuclear Energy Agency, 7-12 June 1998, Paris, France.
[17] Kim, J.H., Roidt, R.M. and Deardorff, A.F. (1993) Thermal stratification and reactor piping integrity, Nucl. Eng. Des. 139, 83-95.
[18] Boros, I., Aszódi, A. (2006) Analysis of thermal stratification in the primary circuit with the CFX code. Benchmarking of CFD codes for application to nuclear reactor safety (CFD4NRS), OECD NEA workshop, September 5-7, 2006, Garching, Germany.
[19] Wolf, L., Häfner, W., Geiss, M., Hansjosten, E. and Katzenmeier, G. (1992) Results of HDR-experiments for pipe loads under thermally stratified flow conditions, Nucl. Eng. Des. 137, 387–404.
[20] Talja, A., Hansjosten, E., (1990) Results of thermal stratification tests in a horizontal pipe line at the HDR-facility, Nucl. Eng. Des. 118, 29–41.
[21] Timperi, A. (2007) Numerical simulations of turbulent buoyancy-driven flows, Research Report VTT-R-11339-07, VTT, Espoo, 49 pp.
[22] OECD/NEA ROSA Project (2008) Final Data Report of OECD/NEA ROSA Project Test 1-1 (ECCS water injection under natural circulation condition: ST-NC-34 in JAEA), 64 pp.
[23] Mandy, C., Keijers S. (2008) Stratification test 1.1 – Preliminary results of CFD simulations with Ansys CFX, ROSA Meeting, Garching 20–21 May 2008.
[24] Watanabe, T. (2007) Preparation for temperature stratification experiment, ROSA Meeting, 7–8 November, 2007.
[25] Farkas, T. and Tóth, I. (2007) Fluent analysis of Test 1-1 – Preliminary results, ROSA Meeting, 7–8 November, 2007.
[26] Natural circulation data and methods for advanced water cooled nuclear power plant designs, Proceedings of a Technical Committee meeting held in Vienna, 18–21 July 2000, 2002, TEC-DOC-1281, 246 p.
[27] Natural circulation in water cooled nuclear power plants: Phenomena, models, and methodology for system reliability assessments, IAEA, VIENNA, 2005, IAEA-TECDOC-1474, 637 p.
[28] Peterson, P.F., Rao, I.J., Schrock, V.E. (1991) Transient thermal stratification in pools with shallow buoyant jets, American Society of Mechanical Engineers, Heat Transfer Division, HTD 190, pp. 55-62.
[29] Fox, R.J. (1992) Temperature distribution in pools with shallow buoyant jets, Fifth International Topical Meeting on Nuclear Reactor Thermal Hydraulics (NURETH-5), September 21-24, Salt Lake City, Utah. pp. 1227-1234.
StratRev
Page 59 (62)
[30] Ling, C., Kyoung, S.W., Ishii, M., Lim, J., Han, J. (2006) Suppression pool mixing and condensation tests in PUMA facility, International Conference on Nuclear Engineering, ICONE, 2006.
[31] Laine, J., Puustinen, M. (2006) Thermal stratification experiments with the condensation pool test rig, NKS-117, 2006.
[32] Norman, T.L., Park, H.-S., Revankar, S.T., Ishii, M., Kelly, J.M. (2006) Thermal stratification and mixing in an open water pool by submerged mixtures of steam and air, ASME International Mechanical Engineering Congress and Exposition, IMECE2006 - Nuclear Engineering.
[33] Peterson, P.F. (1994) Scaling and analysis of mixing in large stratified volumes, International Journal of Heat and Mass Transfer, 37, pp.97-106.
[34] Zhao, H. (2003) Computation of mixing in large stably stratified enclosures, Ph.D. Dissertation. University of California, Berkeley.
[35] Peterson, P.F., Gamble, R. (1998) Scaling for forced-convection augmentation of heat and mass transfer in large enclosures by injected jets, Trans. Am. Nucl. Soc., 78, pp.265–266.
[36] Nourgaliev, R.R., Dinh, T.N. (1997) The investigation of turbulence characteristics in an internally-heated unstably-stratified fluid layer, Nuclear engineering and design, 178, pp.235-258.
[37] Kuhn, S.-Z., Kang, H.K., Peterson, P.F. (2002) Study of Mixing and Augmentation of Natural Convection Heat Transfer by a Forced Jet in a Large Enclosure, Journal of Heat Transfer, 124, pp.660-666.
[38] Dahlberg, M., Nilsson, F.K., Taylor, N., Faidy, C., Wilke, U., Chapuliot, S., Kalkhof, D., Bretherton, I., Church, M., Solin, J. and Catalano, J., (2007) Development of a European Procedure for Assessment of High-Cycle Thermal Fatigue in Light-water Reactors: Final Report of the NESC Thermal Fatigue Project, European Commission Joint Research Centre, Report EUR 22763 EN.
[39] Braillard, O., Jarny, Y. and Balmigere, G., (2005) Thermal load determination in the mixing Tee impacted by a turbulent flow generated by two fluids at large gap of temperature, ICONE13-50361, 13th International Conference on Nuclear Engineering, Beijing, China, May 16-20, 2005.
[40] Chapuliot, S., Gourdin, C., Payen, T., Magnaud, J.P., and Monavon, A. (2005) Hydro-thermal-mechanical analysis of thermal fatigue in a mixing tee, Nucl. Eng. Des., 235, 575-596.
[41] Noguchi, H., Tanimoto, K., Kondo, Y., Ishiga, H., Ogura, K., Fukuda, T., Shiina, K., Moriya, S., Minami, Y. & Madarame, H. (2003) Study on high-cycle fatigue evaluation for thermal striping in mixing Tees with hot and cold water (3) (Type C: Characteristics of temperature fluctuations and heat transfer in mixing Tees with different pipe diameters), ICONE 11-36376, 11th International Conference on Nuclear Engineering, Tokyo, Japan, 2003.
[42] Ohtsuka, M., Kawamura, T, Fukuda, T., Moriya, S., Shiina, K., Kurosaki, M., Minami, Y. and Madarame, H. (2003) LES analysis of fluid temperature
StratRev
Page 60 (62)
fluctuations in a mixing Tee pipe with the same diameters, ICONE 11-36064, 11th International Conference on Nuclear Engineering, Tokyo, Japan, 2003.
[43] Westin, J., Alavyoon, F., Andersson, L., Veber, P., Henriksson, M. and Andersson, C. (2006) Experiments and unsteady CFD-calculations of thermal mixing in a T-junction, CFD4NRS, Garching, Germany, 2006.
[44] Westin, J., Veber, P., Andersson, L., ‘t Mannetje, C., Andersson, U., Eriksson, J., Henriksson, M., Alavyoon, F. and Andersson, C. (2008) High-cycle thermal fatigue in mixing Tees: Large-Eddy simulations compared to a new validation test case, ICONE16-48731, 16th International Conference on Nuclear Engineering, Orlando, USA, 2008.
[45] Kuczaj, A.K., Komen, E.M.J. (2008) Large-Eddy simulation study of thermal mixing in a T-junction, XCFD4NRS, Grenoble, France, 2008.
[46] Frank, T., Adlakha, M., Lifante, C., Prasser, H.-M., and Menter, F. (2008) Simulation of turbulent and thermal mixing in T-junctions using URANS and scale-resolving turbulence models in CFX, XCFD4NRS, Grenoble, France, 2008.
[47] Takasuo, E. (2006) Modeling of pressurizer using APROS and TRACE thermal hydraulic codes, VTT Research Notes 2339, Espoo 2006.
[48] Boros, I. and Aszódi, A. (2008) Analysis of thermal stratification in the primary circuit of a VVER-440 reactor with the CFX code, Nucl. Eng. Des. 238, pp. 453–459.
[49] Sterbacek, Z., and Tausk, P., 1965, Mixing in the Chemical Industry, Pergamon, London.
[50] Uhl, V. W., and Gary, J. B. (1966) Mixing-Theory and Processing, Vols. I and II, Academic, New York.
[51] Penney, W. R. (1983) Agitated Vessels, Heat Exchanger Design Handbook, E.U., Schlunder, ed., 2.2.6.2, Hemisphere Publishing Corp., New York.
[52] Fossett, H., and Prosser, L. E. (1951) Trans. Inst. Chem. Engr. London, 29, pp.322.
[53] Incropera, F.P., Dewitt, D.P. (1996) Fundamentals of Heat and Mass Transfer. John Wiley & Sons, New York, pp. 515–516.
[54] Smith, B.L., et al. (1992) Analysis of single-phase mixing experiments in open pools. Thermal Hydraulics of Advanced and Special Purpose Reactors, ASME HTD-Vol. 209, pp. 91–100.
[55] Niu, F., Zhao, H., Peterson, P.F., Woodcock, J., Henry, R.E. (2007) “Investigation of mixed convection in a large rectangular enclosure,” Nuclear Engineering and Design, 237, pp. 1025-1032.
[56] Andrén, A (2004) Oskarshamn 3 HTG Fas 2. CFD-analys av HTG-händelse, Report SES 04-016, rev0, Westinghouse Electric Sweden AB (Westinghouse proprietary. In Swedish).
[57] Bredolt, U. and Thulin, E. (2003) Oskarshamn 3. Termohydraulisk analys med GOBLIN av händelseförloppet som ledde till överskridande av HTG 2003-09-
StratRev
Page 61 (62)
23, Report SES 03-281, rev 0, Westinghouse Electric Sweden AB (Westinghouse proprietary. In Swedish).
[58] Gustafsson, B., Öhlin, T., Fredell, J. and Wallner, B. (2003) Oskarshamn 3 – Säkerhetsmässiga konsekvenser av överskridande av HTG, Report SEM 03-685, rev 1, Westinghouse Electric Sweden AB (Westinghouse proprietary. In Swedish).
[59] Gustafsson, B., Wallner, B. and Nordenberg, H. (2004) NOG – Onormala temperaturvariationer reaktortanken – Generell problembeskrivning, Report SES 04-027, rev 0, Westinghouse Electric Sweden AB (Westinghouse proprietary. In Swedish).
[60] Gustafsson, B., Wallner, B. and Nordenberg, H. (2004) NOG – Onormala temperaturvariationer reaktortanken – Generationsspecifik analys för avancerade internpumpsreaktorer, Report SES 04-071, rev 0, Westinghouse Electric Sweden AB (Westinghouse proprietary. In Swedish).
[61] Gustafsson, B., Wallner, B. and Nordenberg, H. (2004) NOG – Onormala temperaturvariationer reaktortanken – Generationsspecifik analys för internpumpsreaktorerna F1/2 och OL1/2, Report SES 04-072, rev 0, Westinghouse Electric Sweden AB (Westinghouse proprietary. In Swedish).
[62] Gustafsson, B., Wallner, B. and Nordenberg, H. (2004) NOG – Onormala temperaturvariationer reaktortanken – Generationsspecifik analys för externpumpsreaktorer, Report SES 04-073, rev 0, Westinghouse Electric Sweden AB (Westinghouse proprietary. In Swedish).
[63] Öhlin, T. (2004) Oskarshamn 3 HTG Temperaturbegränsningar vid kallvattenskiktning i reaktortanken, Report SES 04-013, rev 1, Westinghouse Electric Sweden AB (Westinghouse proprietary. In Swedish).
[64] Ivung, B., Gustafsson, B. and Öhlin, T. (2007) Oskarshamn 3 – Oönskade temperaturvariationer. Sammanfattande rapport, Report SEI 07-137, rev0, Westinghouse Electric Sweden AB (Westinghouse proprietary. In Swedish).
[65] Ivung, B., Gustafsson, B. and Öhlin, T. (2007) Oskarshamn 2 – Oönskade temperaturvariationer. Sammanfattande rapport, Report SEI 07-136, rev0, Westinghouse Electric Sweden AB (Westinghouse proprietary. In Swedish).
[66] Wallner, B. (2008) Oskarshamn 1 – Låg temperatur i reaktortankens bottenpå grund av utläckage från matarvattenstigledning, Report SES 08-012, rev0, Westinghouse Electric Sweden AB (Westinghouse proprietary. In Swedish).
[67] Ivung, B. (2007) NOG – Onormala temperaturvariationer reaktortanken – Tillförlitlig tempearturmätning, Report NOG 07-016, rev 0, Westinghouse Electric Sweden AB (Westinghouse proprietary. In Swedish).
[68] Strang, E.J. and Fernando, H.J.S. (2001) Entrainment and mixing in stratified shear layers, J. Fluid Mech. 428, 349-386.
[69] Da Silva, M., Thiele, S., Höhne, Th., Vaibar, R. and Hampel, U. (2008) Experimental studies and CFD-calculations for buoyancy driven mixing phenomena, XCFD4NRS, Grenoble, France, 2008
StratRev
Page 62 (62)
[70] Höhne, Th., Kliem, S. and Bieder, U. (2006) Modeling of buoyancy-driven flow experiment at the ROCOM test facility using CFD codes CFX-5 and Trio_U, Nucl. Eng. Design 236, 1309-1325.
[71] Kliem, S., Höhne, Th., Rohde, U. and Weiss, F.-P. (2008) Experiments on slug mixing under natural circulation conditions at the ROCOM test facility using high resolution measurement technique and numerical modeling, XCFD4NRS, Grenoble, France, 2008.
[72] Böttcher, M. (2008) Primary loop study of a VVER-1000 Reactor with special focus on coolant mixing, XCFD4NRS, Grenoble, France, 2008.
[73] Prasser, H.-M. (2008) Novel experimental measuring techniques required to provide data for CFD validation, Nucl. Eng. Design 238, 744-770.
[74] Aguirre, C., Caruge, D., Castrillo, F., Dominicus, G., Geutjes, A.J., Saldo, V., van der Hagen, T.H.J.J., Hennig, D., Huggenberger, M., Ketelaar, K.C.J., Manera, A., Munoz-Cobo, J.L., Prasser, H.-M., Rohde, U., Royer, E., Yadigaroglu G. (2005) Natural circulation and stability performance of BWRs (NACUSP). Nucl. Eng. Des., 235, 401-409.
[75] Prasad G.V.D., Pandey, M., Kalra, M.S. (2007) Review of research on flow instabilities in natural circulation boiling systems. Progress Nucl. Energy, 49, 429-451.
[76] Smith, B.L. et al (2007) Assessment of Computational Fluid Dynamics (CFD) for Nuclear Reactor Safety problems, NEA/CSNI/R(2007)13
[77] Mahaffy, J. et al (2007) Best Practice Guidelines for the use of CFD in Nuclear reactor Safety Applications, NEA/CSNI/R(2007)5.
[78] Dury, T.V., Hemström, B. and Shepel, S.v. (2007) CFD simulation of the Vattenfall 1/5th scale PWR model for boron dilution studies, Nucl. Eng. Design, vol. 238, Issue 3, 577-589.
[79] Craft, T.J., Ince, N.Z., Launder, B.E. (1996) Recent developments in second moment closure for buoyancy-affected flows, Dynamics of Atmospheres and Oceans, vol. 23, 99-114.
[80] Craft, T.J., Gerasimov, A.V., Iacovides, H., Launder, B.E. (2002) Progress in generalization of Wall-function treatments, Int. J. of Heat and Fluid Flow, vol. 23, 1348-160.
[81] Craft, T.J., Gerasimov, A.V. Iacovides, H., Kidger, J.W., Launder, B.E. (2004) The negatively buoyant turbulent wall jet: Performance of alternative options in RANS modeling, Int. J. of Heat and Fluid Flow, vol. 25, 809-823.
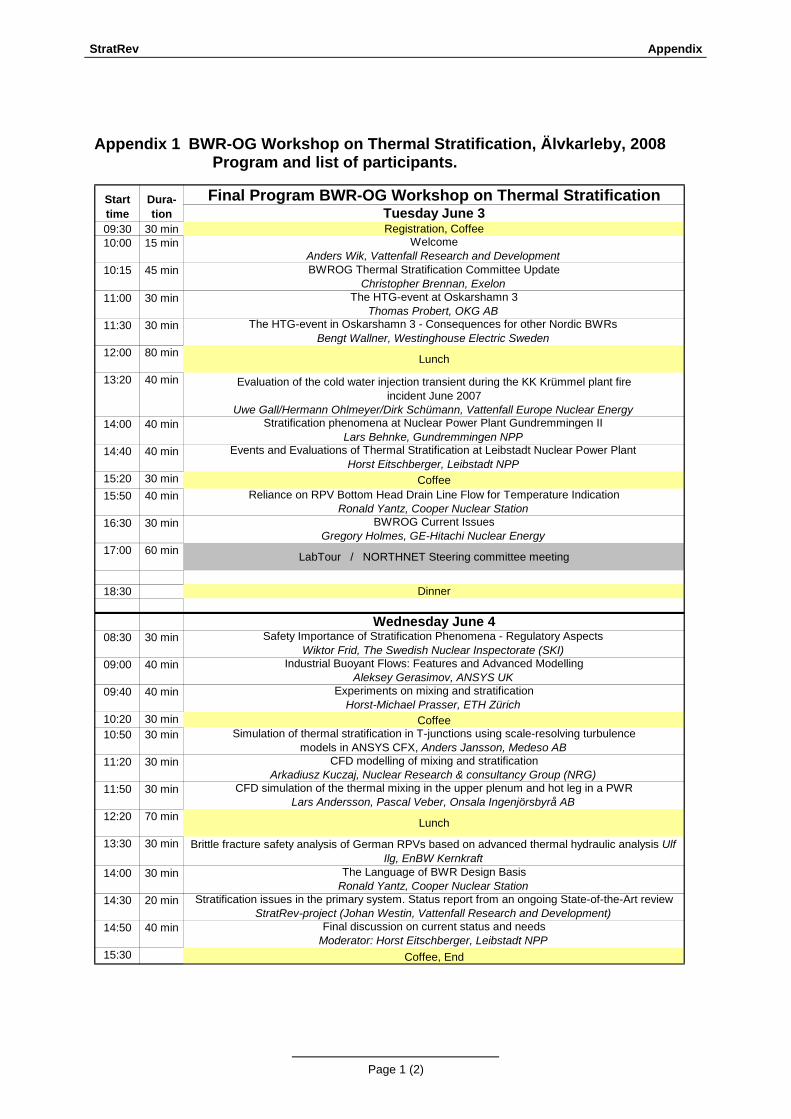
StratRev Appendix
Page 1 (2)
Appendix 1 BWR-OG Workshop on Thermal Stratification, Älvkarleby, 2008 Program and list of participants.
Final Program BWR-OG Workshop on Thermal StratificationTuesday June 3
09:30 30 min Registration, Coffee10:00 15 min Welcome
Anders Wik, Vattenfall Research and Development10:15 45 min BWROG Thermal Stratification Committee Update
Christopher Brennan, Exelon11:00 30 min The HTG-event at Oskarshamn 3
Thomas Probert, OKG AB11:30 30 min The HTG-event in Oskarshamn 3 - Consequences for other Nordic BWRs
Bengt Wallner, Westinghouse Electric Sweden12:00 80 min Lunch
13:20 40 min Evaluation of the cold water injection transient during the KK Krümmel plant fire incident June 2007
Uwe Gall/Hermann Ohlmeyer/Dirk Schümann, Vattenfall Europe Nuclear Energy14:00 40 min Stratification phenomena at Nuclear Power Plant Gundremmingen II
Lars Behnke, Gundremmingen NPP14:40 40 min Events and Evaluations of Thermal Stratification at Leibstadt Nuclear Power Plant
Horst Eitschberger, Leibstadt NPP15:20 30 min Coffee15:50 40 min Reliance on RPV Bottom Head Drain Line Flow for Temperature Indication
Ronald Yantz, Cooper Nuclear Station16:30 30 min BWROG Current Issues
Gregory Holmes, GE-Hitachi Nuclear Energy17:00 60 min LabTour / NORTHNET Steering committee meeting
18:30 Dinner
Wednesday June 408:30 30 min Safety Importance of Stratification Phenomena - Regulatory Aspects
Wiktor Frid, The Swedish Nuclear Inspectorate (SKI)09:00 40 min Industrial Buoyant Flows: Features and Advanced Modelling
Aleksey Gerasimov, ANSYS UK09:40 40 min Experiments on mixing and stratification
Horst-Michael Prasser, ETH Zürich10:20 30 min Coffee10:50 30 min Simulation of thermal stratification in T-junctions using scale-resolving turbulence
models in ANSYS CFX, Anders Jansson, Medeso AB11:20 30 min CFD modelling of mixing and stratification
Arkadiusz Kuczaj, Nuclear Research & consultancy Group (NRG)11:50 30 min CFD simulation of the thermal mixing in the upper plenum and hot leg in a PWR
Lars Andersson, Pascal Veber, Onsala Ingenjörsbyrå AB12:20 70 min Lunch
13:30 30 min Brittle fracture safety analysis of German RPVs based on advanced thermal hydraulic analysis Ulf Ilg, EnBW Kernkraft
14:00 30 min The Language of BWR Design BasisRonald Yantz, Cooper Nuclear Station
14:30 20 min Stratification issues in the primary system. Status report from an ongoing State-of-the-Art reviewStratRev-project (Johan Westin, Vattenfall Research and Development)
14:50 40 min Final discussion on current status and needsModerator: Horst Eitschberger, Leibstadt NPP
15:30 Coffee, End
Start time
Dura-tion
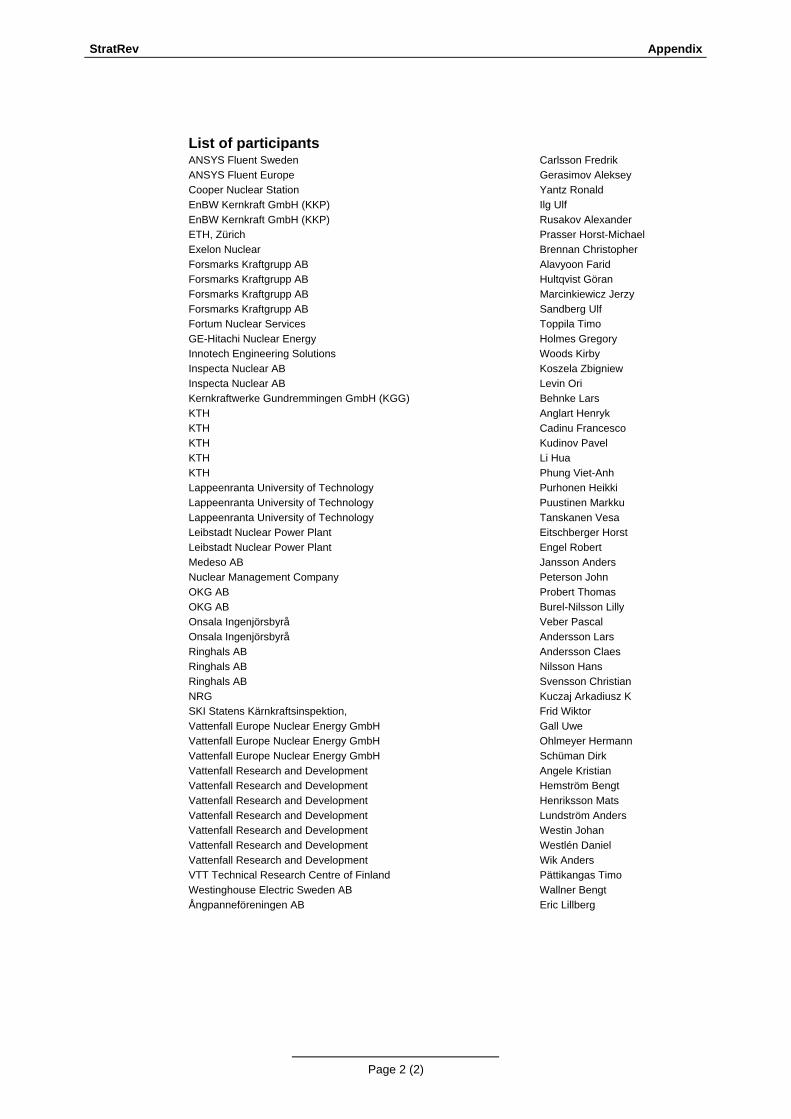
StratRev Appendix
Page 2 (2)
List of participants ANSYS Fluent Sweden Carlsson Fredrik ANSYS Fluent Europe Gerasimov Aleksey Cooper Nuclear Station Yantz Ronald EnBW Kernkraft GmbH (KKP) Ilg Ulf EnBW Kernkraft GmbH (KKP) Rusakov Alexander ETH, Zürich Prasser Horst-Michael Exelon Nuclear Brennan Christopher Forsmarks Kraftgrupp AB Alavyoon Farid Forsmarks Kraftgrupp AB Hultqvist Göran Forsmarks Kraftgrupp AB Marcinkiewicz Jerzy Forsmarks Kraftgrupp AB Sandberg Ulf Fortum Nuclear Services Toppila Timo GE-Hitachi Nuclear Energy Holmes Gregory Innotech Engineering Solutions Woods Kirby Inspecta Nuclear AB Koszela Zbigniew Inspecta Nuclear AB Levin Ori Kernkraftwerke Gundremmingen GmbH (KGG) Behnke Lars KTH Anglart Henryk KTH Cadinu Francesco KTH Kudinov Pavel KTH Li Hua KTH Phung Viet-Anh Lappeenranta University of Technology Purhonen Heikki Lappeenranta University of Technology Puustinen Markku Lappeenranta University of Technology Tanskanen Vesa Leibstadt Nuclear Power Plant Eitschberger Horst Leibstadt Nuclear Power Plant Engel Robert Medeso AB Jansson Anders Nuclear Management Company Peterson John OKG AB Probert Thomas OKG AB Burel-Nilsson Lilly Onsala Ingenjörsbyrå Veber Pascal Onsala Ingenjörsbyrå Andersson Lars Ringhals AB Andersson Claes Ringhals AB Nilsson Hans Ringhals AB Svensson Christian NRG Kuczaj Arkadiusz K SKI Statens Kärnkraftsinspektion, Frid Wiktor Vattenfall Europe Nuclear Energy GmbH Gall Uwe Vattenfall Europe Nuclear Energy GmbH Ohlmeyer Hermann Vattenfall Europe Nuclear Energy GmbH Schüman Dirk Vattenfall Research and Development Angele Kristian Vattenfall Research and Development Hemström Bengt Vattenfall Research and Development Henriksson Mats Vattenfall Research and Development Lundström Anders Vattenfall Research and Development Westin Johan Vattenfall Research and Development Westlén Daniel Vattenfall Research and Development Wik Anders VTT Technical Research Centre of Finland Pättikangas Timo Westinghouse Electric Sweden AB Wallner Bengt
Ångpanneföreningen AB Eric Lillberg
Bibliographic Data Sheet NKS-202 Title Stratification issues in the primary system. Review of available validation
experiments and State-of-the-Art in modelling capabilities (StratRev)
Author(s) Johan Westin, Vattenfall Research and Development AB Mats Henriksson,Vattenfall Research and Development AB Timo Pättikangas, VTT Timo Toppila, Fortum Nuclear Services Ltd Tommi Rämä, Fortum Nuclear Services Ltd Pavel Kudinov, KTH Nuclear Power Safety Henryk Anglart, KTH Nuclear Reactor Technology
Affiliation(s) Vattenfall Research and Development AB VTT Fortum Nuclear Services Ltd KTH Nuclear Power Safety KTH Nuclear Reactor Technology
ISBN 978-87-7893-271-6
Date August 2009
Project NKS-R / StratRev
No. of pages 62 No. of tables 2 No. of illustrations 18 No. of references 81
Abstract The objective of the present report is to review available validation
experiments and State-of-the-Art in modelling of stratification and mixing in the primary system of Light Water Reactors. A topical workshop was arranged in Älvkarleby in June 2008 within the framework of BWR-OG, and the presentations from various utilities showed that stratification issues are not unusual and can cause costly stops in the production. It is desirable to take actions in order to reduce the probability for stratification to occur, and to develop well-validated and accepted tools and procedures for analyzing upcoming stratification events. A research plan covering the main questions is outlined, and a few suggestions regarding more limited research activities are given. Since many of the stratification events results in thermal loads that are localized in time and space, CFD is a suitable tool. However, the often very large and complex geometry posses a great challenge to CFD, and it is important to perform a step-by-step increase in complexity with intermediate validation versus relevant experimental data. The ultimate goal is to establish Best Practice Guidelines that can be followed both by utilities and authorities in case of an event including stratification and thermal loads. An extension of the existing Best Practice Guidelines for CFD in nuclear safety applications developed by OECD/NEA is thus suggested as a relevant target for a continuation project.
Key words Nuclear power, stratification, primary system, reactor pressure vessel,
validation, CFD Available on request from the NKS Secretariat, P.O.Box 49, DK-4000 Roskilde, Denmark. Phone (+45) 4677 4045, fax (+45) 4677 4046, e-mail [email protected], www.nks.org