Embed Size (px)
Citation preview
24ème Congrès Français de Mécanique Brest, 26 au 30 Août 2019
On the dynamics of a deep quasi-permanent
anticylonic eddy in the Rockall Trough
M. Le Corre∗,a, J. Gulaa, A. Smilenovab,c, L. Houpertd
a. Laboratoire d’Océanographie Physique et Spatiale (LOPS), Université de Bretagne Occidentale(UBO), Institut Universitaire Européen de la Mer (IUEM)
b. Earth and Ocean Sciences, School of Natural Sciences, National University of Ireland, Galway(NUIG), University Road, Galway, Ireland, H91 TK33
c. Oceanographic Services, Ocean Sciences and Information Services (OSIS), Rinville, Co. Galway,Marine Institute, Ireland, H91 R673
d. National Oceanography Centre (NOC), European Way, Marine Physics and Ocean Climate Division,Southampton, England, UK, SO14 3ZH
∗ . Corresponding author at : LOPS, UBO, IUEM. E-mail address : [email protected](M.Le Corre)
Résumé :
Une étude récente a montré l’existence d’un anticyclone profond quasi-permanent dans le RockallTrough (RT) à l’ouest de l’Irlande. Ce tourbillon est localisé au croisement de différentes masses d’eauqui interagissent entre elles. Nous nous intéressons ici à la création et l’évolution de cet anticyclone àl’aide de simulations numériques à haute-résolution avec le modèle océanique CROCO. Nous montronsque la source principale de vorticité anticyclonique est la divergence des flux de vorticité tourbillo-naires, ceux-ci étant équilibrés par des effets de topographie et de frottements au fond. Ce flux de vor-ticité tourbillonaire est majoritairement associé à l’advection de vorticité par des anticyclones de pluspetite échelle, formés le long du bord est du RT. L’interaction entre le courant méridional, qui s’écoulevers le nord le long du Porcupine Bank, et la topographie permet de générer de la vorticité négativedans la couche limite de fond. Le détachement de cette vorticité à différents emplacements produit del’instabilité centrifuge et conduit à la formation de tourbillon de méso et sous-mésoéchelle. Ces tour-billons sont ensuite transportés vers le centre du RT et fusionnent avec l’anticyclone, l’alimentant ainsien permanence avec de la vorticité anticyclonique.
Abstract :
A recent study has put into perspective the presence of a quasi-permanent deep anticyclonic eddy in theRockall Trough (RT), west of Ireland. This eddy is located at a crossroad where different water massesmeet and interact with each other. Using a truly mesoscale resolving simulation with a terrain followingcoordinate oceanmodel (CROCO), we study the generation and life-cycle of the RT anticyclone.We showthat the main source of anticyclonic vorticity for the RT anticyclone is the divergence of eddy vorticityfluxes. Eddy vorticity fluxes are mostly due to the advection of vorticity by anticyclonic submesoscalecoherent vortices generated on the eastern RT slope. Interactions between the current flowing poleward
24ème Congrès Français de Mécanique Brest, 26 au 30 Août 2019
along the Porcupine Bank, on the eastern side of the RT, and the slope induce anticyclonic voticitygeneration in the bottom boundary layer. Detachment of the vorticity layer from the slope at specificlocations induces centrifugal instability and formation of anticyclonic eddies. These eddies are thenadvected toward the center of the RT and merge with the RT anticyclone, continuously feeding it withanticyclonic vorticity.
Mots clefs : Regional Oceanic Modelling System; eddy; interaction currenttopography; vorticity
1 IntroductionThe subpolar North Atlantic gyre is a key region for the ocean heat and carbon budgets. Mesoscaleeddies, with a radius in the range 10-100 km, play a big role in modulating the heat and carbon fluxes[1]. The distribution of eddy kinetic energy (EKE) computed from Argo floats at depth (1000–1500-m)in the subpolar North Atlantic gyre highlights the presence of energetic mesoscale eddies in the differentbasins [2]. Hot spots are visible in the Labrador Sea, where Irminger Rings are regularly shedded due toinstabilities of the Irminger current, and in the Iceland Basin and Rockall Trough (RT), where supolarwaters enter through the North Atlantic Current [3].
A strong EKE signal associated with a mean anticyclonic circulation is visible at depth in the RT at12 W, 55 N from the Argo floats database [2]. A surface signature has also been spotted at the samelocation from altimetry [4]. In-situ observations have recently highlighted that this signal was linked tothe presence of a quasi-permanent deep anticyclonic vortex : the RT anticyclone [5].
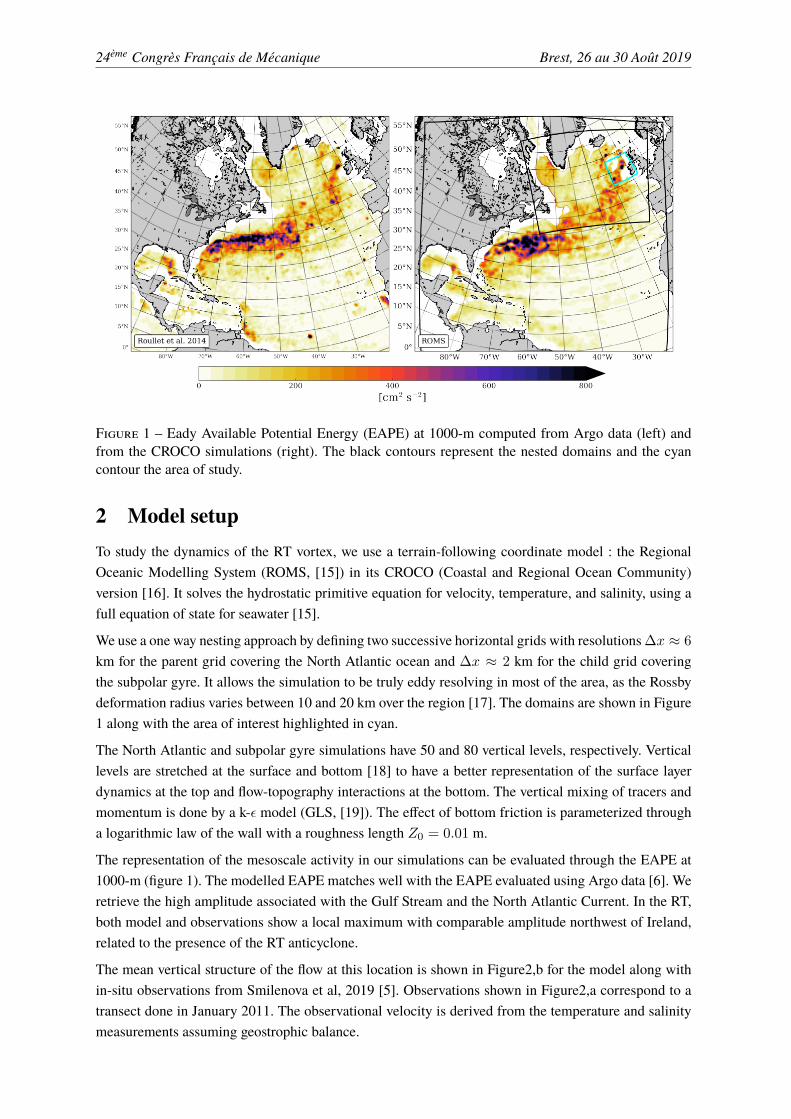
The signature of the RT anticyclone is also clearly visible in the Eddy Available Potential Energy (EAPE,figure 1a). The EAPE represents the amount of energy stored in the vertical isopycnal displacementsand is a signature of the mesoscale turbulence [6]. The strong signal in the RT highlights the recurrentpresence of the eddy, generating large vertical isopycnal displacements at around 1000-m.
Similar deep quasi-permanent eddies can be found in other parts of the ocean. One well studied exampleis the Lofoten Vortex [12, 13]. Dynamical studies of this feature have put forward the importance ofsmaller scale eddies for its formation and variability [14].
Numerical models with horizontal resolutions up to 1/12 do not seem able to reproduce the RT anti-cyclone [11]. Thus, we hypothesize that scales smaller than the local Rossby deformation radius (Rd ≈10− 20 km) may be important for the generation and dynamics of the RT anticyclone. This highlightsthe need for a truly mesoscale-resolving model in this area.
In this study we investigate the dynamics of the RT anticyclone using a high resolution simulation (dx =
2 km). The paper is organized as follows : The numerical model is presented and validated in Section 2.A barotropic vorticity balance for the RT anticyclone is analyzed in section 3. In section 4 we investigatethe generation of small scale eddies close to the topography. Finally in section 5 we track the origin ofthe different water masses using a Lagrangian approach.
24ème Congrès Français de Mécanique Brest, 26 au 30 Août 2019
Figure 1 – Eady Available Potential Energy (EAPE) at 1000-m computed from Argo data (left) andfrom the CROCO simulations (right). The black contours represent the nested domains and the cyancontour the area of study.
2 Model setupTo study the dynamics of the RT vortex, we use a terrain-following coordinate model : the RegionalOceanic Modelling System (ROMS, [15]) in its CROCO (Coastal and Regional Ocean Community)version [16]. It solves the hydrostatic primitive equation for velocity, temperature, and salinity, using afull equation of state for seawater [15].
We use a one way nesting approach by defining two successive horizontal grids with resolutions ∆x ≈ 6
km for the parent grid covering the North Atlantic ocean and ∆x ≈ 2 km for the child grid coveringthe subpolar gyre. It allows the simulation to be truly eddy resolving in most of the area, as the Rossbydeformation radius varies between 10 and 20 km over the region [17]. The domains are shown in Figure1 along with the area of interest highlighted in cyan.
The North Atlantic and subpolar gyre simulations have 50 and 80 vertical levels, respectively. Verticallevels are stretched at the surface and bottom [18] to have a better representation of the surface layerdynamics at the top and flow-topography interactions at the bottom. The vertical mixing of tracers andmomentum is done by a k-ε model (GLS, [19]). The effect of bottom friction is parameterized througha logarithmic law of the wall with a roughness length Z0 = 0.01 m.
The representation of the mesoscale activity in our simulations can be evaluated through the EAPE at1000-m (figure 1). The modelled EAPE matches well with the EAPE evaluated using Argo data [6]. Weretrieve the high amplitude associated with the Gulf Stream and the North Atlantic Current. In the RT,both model and observations show a local maximum with comparable amplitude northwest of Ireland,related to the presence of the RT anticyclone.
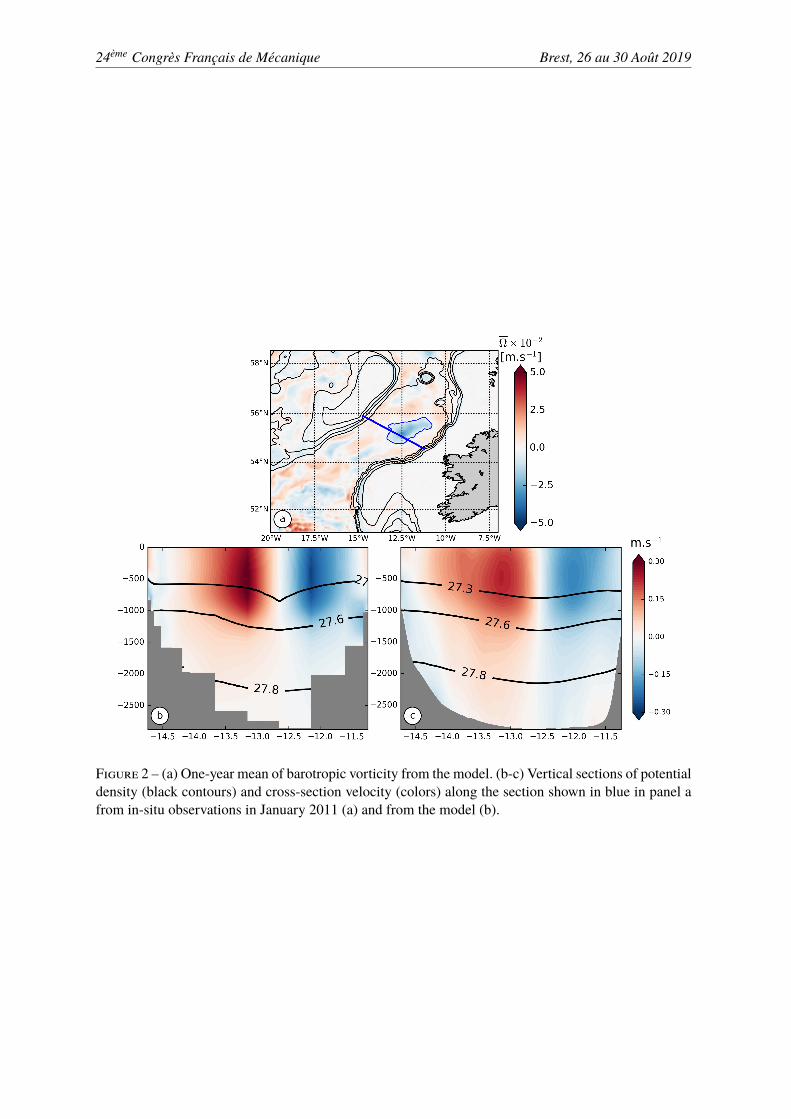
The mean vertical structure of the flow at this location is shown in Figure2,b for the model along within-situ observations from Smilenova et al, 2019 [5]. Observations shown in Figure2,a correspond to atransect done in January 2011. The observational velocity is derived from the temperature and salinitymeasurements assuming geostrophic balance.
24ème Congrès Français de Mécanique Brest, 26 au 30 Août 2019
Figure 2 – (a) One-year mean of barotropic vorticity from the model. (b-c) Vertical sections of potentialdensity (black contours) and cross-section velocity (colors) along the section shown in blue in panel afrom in-situ observations in January 2011 (a) and from the model (b).
24ème Congrès Français de Mécanique Brest, 26 au 30 Août 2019
3 On the dynamics of the Rockall Trough anticyclone
3.1 Barotropic vorticiy balanceThe RT anticyclone has a strong barotropic signature (Fig. 2). An effective way to understand its dy-namics is to look at the balance of barotropic vorticity. Such balance will provide information on thesources and sinks of anticyclonic vorticity and help us understand how the circulation can be sustainedover such a long period.
The barotropic vorticity is defined as the vorticity of the vertically integrated velocities [20] :
Ω =∂v
∂x− ∂u
∂y
with (u, v) the (x, y) components of the horizontal flow, and the overbar denotes a vertically integratedquantity,
u =
∫ ζ
−hu dz,
where ζ(x, y, t) is the free-surface height andh(x, y) > 0 the depth of the resting topography.H(i, j, t) =∫ ζ−h dz = ζ(i, j, t) + h(i, j) is the total depth of the water column.
The evolution equation for the barotropic vorticity is obtained by integrating the momentum equationsin the vertical and cross differentiating them :
∂Ω
∂t︸︷︷︸rate
= − ∇.(fu)︸ ︷︷ ︸planet. vort. adv.
+J(Pb, h)
ρ0︸ ︷︷ ︸bot. pres. torque
+ k.∇× τwindρ0︸ ︷︷ ︸
wind curl
− k.∇× τbotρ0︸ ︷︷ ︸
bot. drag curl
+ DΣ︸︷︷︸horiz. diffusion
− AΣ︸︷︷︸NLadvection
Integrated over a long enough period, the rate becomes negligible compared to the other terms, andthe time-mean planetary vorticity advection reduces to 〈−∇.(fu)〉 =
⟨−βV − f ∂η∂t
⟩≈
⟨−βV
⟩as⟨
∂η∂t
⟩≈ 0, where brackets corresponds to a time mean, β = df/dy is the variation of the Coriolis
parameter with latitude and V the velocity in the latitudinal direction. After one year of integration, theamplitude of the rate is already at least one order of magnitude smaller than the other terms.
The Bottom Pressure Torque (BPT) arises from the variation of bottom pressure along isobaths. It re-presents the contribution of the topography to the barotropic vorticity balance. This term is essential inbalancing the zonal wind stress curl for subpolar gyres and in locally balancing the planetary vorticityadvection for Western Boundary Current systems [21].
The non-linear term (NL) encompasses all non-linearities. It can be written as :
AΣ =∂2(vv − uu)
∂x∂y+∂2uv
∂x∂x− ∂2uv
∂y∂y
.
The viscosity effects are included in the DΣ term and the stress curls at the bottom and surface arerespectively∇× τbot
ρ0and ∇× τwind
ρ0.
24ème Congrès Français de Mécanique Brest, 26 au 30 Août 2019
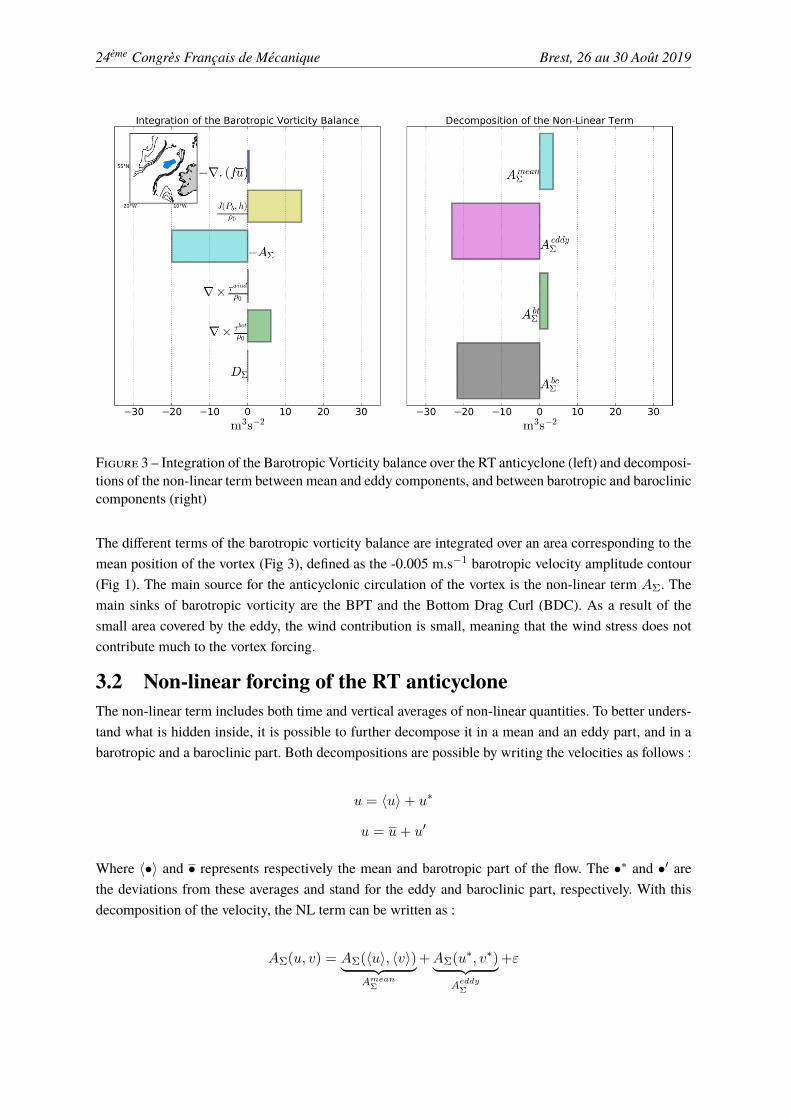
Figure 3 – Integration of the Barotropic Vorticity balance over the RT anticyclone (left) and decomposi-tions of the non-linear term between mean and eddy components, and between barotropic and barocliniccomponents (right)
The different terms of the barotropic vorticity balance are integrated over an area corresponding to themean position of the vortex (Fig 3), defined as the -0.005 m.s−1 barotropic velocity amplitude contour(Fig 1). The main source for the anticyclonic circulation of the vortex is the non-linear term AΣ. Themain sinks of barotropic vorticity are the BPT and the Bottom Drag Curl (BDC). As a result of thesmall area covered by the eddy, the wind contribution is small, meaning that the wind stress does notcontribute much to the vortex forcing.
3.2 Non-linear forcing of the RT anticycloneThe non-linear term includes both time and vertical averages of non-linear quantities. To better unders-tand what is hidden inside, it is possible to further decompose it in a mean and an eddy part, and in abarotropic and a baroclinic part. Both decompositions are possible by writing the velocities as follows :
u = 〈u〉+ u∗
u = u+ u′
Where 〈•〉 and • represents respectively the mean and barotropic part of the flow. The •∗ and •′ arethe deviations from these averages and stand for the eddy and baroclinic part, respectively. With thisdecomposition of the velocity, the NL term can be written as :
AΣ(u, v) = AΣ(〈u〉, 〈v〉)︸ ︷︷ ︸Amean
Σ
+AΣ(u∗, v∗)︸ ︷︷ ︸Aeddy
Σ
+ε
24ème Congrès Français de Mécanique Brest, 26 au 30 Août 2019
andAΣ(u, v) = A(u, v)︸ ︷︷ ︸
AbtΣ
+A(u′, v′)︸ ︷︷ ︸Abc
Σ
,
where ε is the residue of the cross product and is negligible compared to both the mean and the eddyparts (not shown). Spatial integrations of these terms on the mean RT anticyclone area are shown inFigure 3.
The NL term is strongly dominated by its eddying part. The time-mean flow does not feed the RT anti-cyclone, and the vorticity is provided only by eddy vorticity fluxes. The decomposition into a barotropicand a baroclinic part also shows only one term being dominant : the baroclinic component is much lar-ger than the barotropic one. The main source of negative barotropic vorticity for the vortex is due tobaroclinic eddy vorticity fluxes.
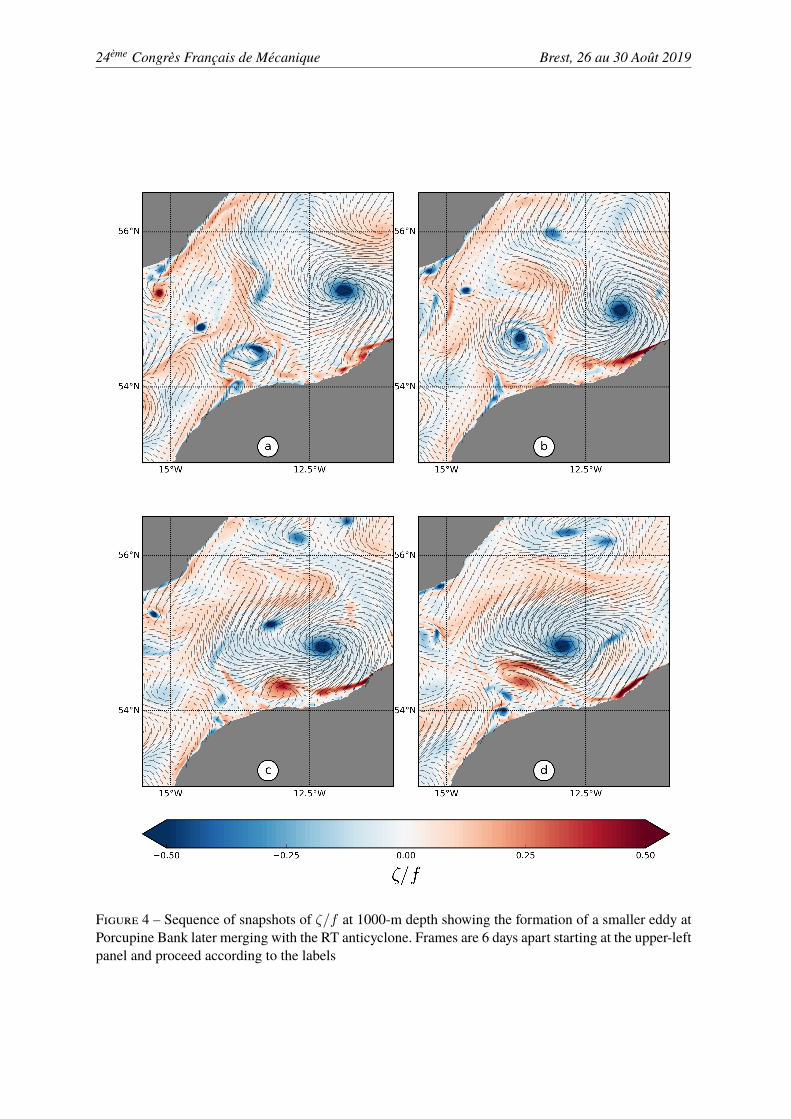
This vorticity balance can be interpreted as the RT vortex being fed by smaller subsurface anticycloniceddies with a localized structure in the vertical. This is illustrated by a typical example of a smaller scaleanticyclonic vortex merging with the RT anticyclone (Fig. 4). Snapshots of relative vorticity at 1000-mdepth show the formation of a negative vorticity filament along the Porcupine bank (figure. 4,a). Thefilament rolls up and form an anticyclonic eddy (figure. 4,b), which is attracted by the RT anticyclone(figure. 4,c), and is stretched around the RT anticyclone until they fully merge (figure. 4,d).
4 Eddy generationThe RT anticyclone seems to be fed mostly by small baroclinic anticyclonic eddies. In this section, weinvestigate the generation mechanisms for these smaller scale eddies.
Generation of anticyclonic eddies at this depth is mostly a result of current-topography interactionsaround the RT. Wintertime convection does not penetrate as deep.
The mean current is flowing cyclonically around the RT, i.e. with the shallower topography on his right.Frictional effects at the bottom will then trigger generation of negative relative vorticity and negativepotential vorticity (PV) in the bottom boundary layer. When the boundary layer detaches from the slope,it can lead to centrifugal instability and formation of coherent vortices [22, 23].
The PV is defined by q = ωa.∇b, with ωa = fz+∇×u the absolute vorticity and the buoyancy gradientb = −g σρ0
where σ is the potential density referenced to the surface, ρ0 the mean reference density andg the gravitational acceleration. The flux form of the PV equation can be written [24] :
∂q
∂t+∇.[ qu︸︷︷︸
JA
−ωaDb
Dt︸ ︷︷ ︸JD
+∇b× F︸ ︷︷ ︸JF
] = 0
where F corresponds to the non conservative forces per unit mass. Each term respectively represent thePV advection, the diabatic flux and the frictional flux. When integrated between two isopycnal levelsthat intersect the seafloor but do not outcrop (hereafter I) the previous equation can be reduced to :
∂
∂t
∫IqdV =
∫I
Jb︸︷︷︸−(JD+JF )
dV
24ème Congrès Français de Mécanique Brest, 26 au 30 Août 2019
Figure 4 – Sequence of snapshots of ζ/f at 1000-m depth showing the formation of a smaller eddy atPorcupine Bank later merging with the RT anticyclone. Frames are 6 days apart starting at the upper-leftpanel and proceed according to the labels
24ème Congrès Français de Mécanique Brest, 26 au 30 Août 2019
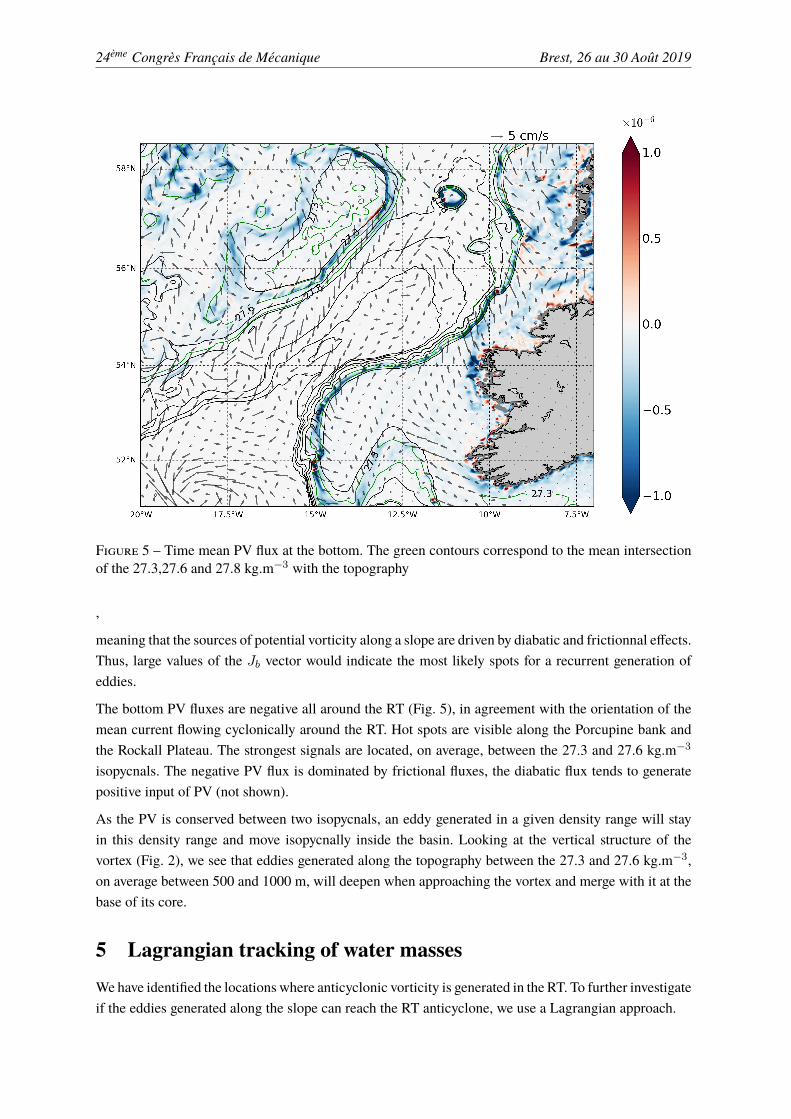
Figure 5 – Time mean PV flux at the bottom. The green contours correspond to the mean intersectionof the 27.3,27.6 and 27.8 kg.m−3 with the topography
,
meaning that the sources of potential vorticity along a slope are driven by diabatic and frictionnal effects.Thus, large values of the Jb vector would indicate the most likely spots for a recurrent generation ofeddies.
The bottom PV fluxes are negative all around the RT (Fig. 5), in agreement with the orientation of themean current flowing cyclonically around the RT. Hot spots are visible along the Porcupine bank andthe Rockall Plateau. The strongest signals are located, on average, between the 27.3 and 27.6 kg.m−3
isopycnals. The negative PV flux is dominated by frictional fluxes, the diabatic flux tends to generatepositive input of PV (not shown).
As the PV is conserved between two isopycnals, an eddy generated in a given density range will stayin this density range and move isopycnally inside the basin. Looking at the vertical structure of thevortex (Fig. 2), we see that eddies generated along the topography between the 27.3 and 27.6 kg.m−3,on average between 500 and 1000 m, will deepen when approaching the vortex and merge with it at thebase of its core.
5 Lagrangian tracking of water massesWehave identified the locations where anticyclonic vorticity is generated in the RT. To further investigateif the eddies generated along the slope can reach the RT anticyclone, we use a Lagrangian approach.
24ème Congrès Français de Mécanique Brest, 26 au 30 Août 2019
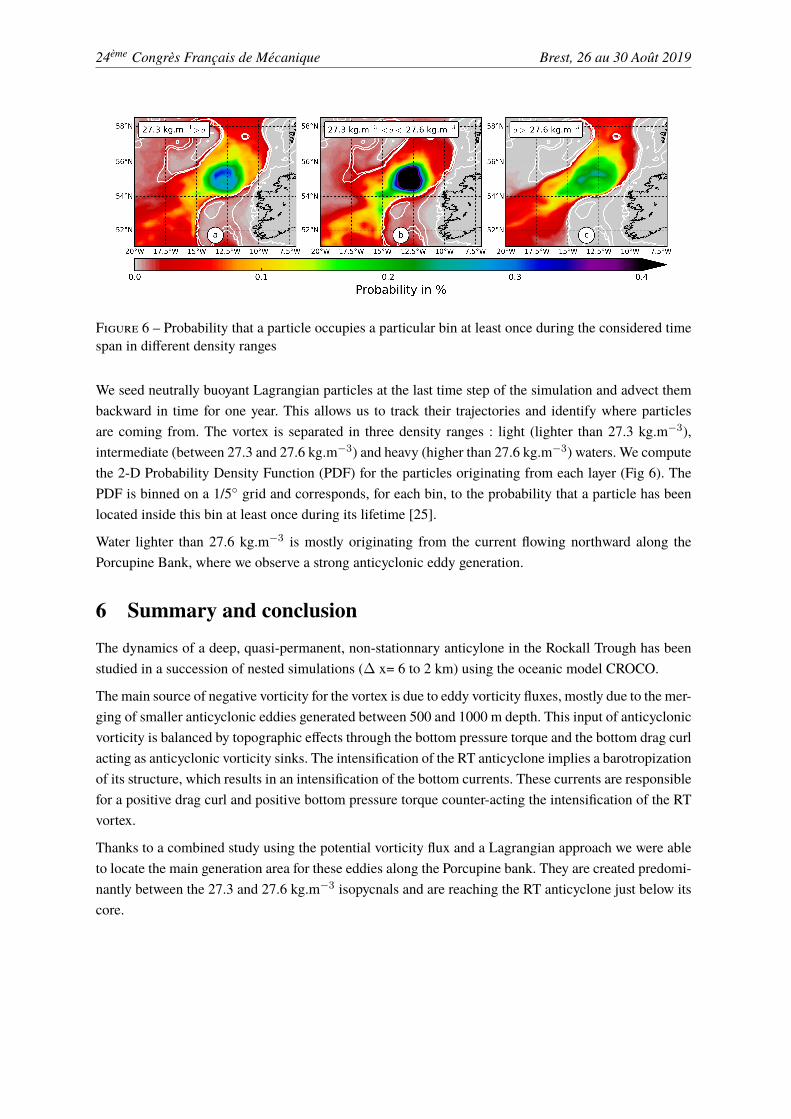
Figure 6 – Probability that a particle occupies a particular bin at least once during the considered timespan in different density ranges
We seed neutrally buoyant Lagrangian particles at the last time step of the simulation and advect thembackward in time for one year. This allows us to track their trajectories and identify where particlesare coming from. The vortex is separated in three density ranges : light (lighter than 27.3 kg.m−3),intermediate (between 27.3 and 27.6 kg.m−3) and heavy (higher than 27.6 kg.m−3) waters. We computethe 2-D Probability Density Function (PDF) for the particles originating from each layer (Fig 6). ThePDF is binned on a 1/5 grid and corresponds, for each bin, to the probability that a particle has beenlocated inside this bin at least once during its lifetime [25].
Water lighter than 27.6 kg.m−3 is mostly originating from the current flowing northward along thePorcupine Bank, where we observe a strong anticyclonic eddy generation.
6 Summary and conclusionThe dynamics of a deep, quasi-permanent, non-stationnary anticylone in the Rockall Trough has beenstudied in a succession of nested simulations (∆ x= 6 to 2 km) using the oceanic model CROCO.
The main source of negative vorticity for the vortex is due to eddy vorticity fluxes, mostly due to the mer-ging of smaller anticyclonic eddies generated between 500 and 1000 m depth. This input of anticyclonicvorticity is balanced by topographic effects through the bottom pressure torque and the bottom drag curlacting as anticyclonic vorticity sinks. The intensification of the RT anticyclone implies a barotropizationof its structure, which results in an intensification of the bottom currents. These currents are responsiblefor a positive drag curl and positive bottom pressure torque counter-acting the intensification of the RTvortex.
Thanks to a combined study using the potential vorticity flux and a Lagrangian approach we were ableto locate the main generation area for these eddies along the Porcupine bank. They are created predomi-nantly between the 27.3 and 27.6 kg.m−3 isopycnals and are reaching the RT anticyclone just below itscore.
24ème Congrès Français de Mécanique Brest, 26 au 30 Août 2019
Références
[1] J. Zhao, A. Bower, J. Yang, X. Lin, Meridional heat transport variability induced by mesoscaleprocesses in the subpolar North Atlantic, Nature Communications, 9 (2018) 1124.
[2] J. Fischer, J. Karstensen, M. Oltmanns, S. Schmidtko, Mean circulation and EKE distribution in theLabrador Sea Water level of the subpolar North Atlantic, Ocean Science, 14 (2018) 1167–1183.
[3] L. Houpert, M.E. Inall, E. Dumont, S. Gary, C. Johnson, M. Porter, W.E. Johns, S.A. Cunningham,Structure and transport of the north atlantic current in the Eastern Subpolar Gyre from sustainedglider observations, Journal of Geophysical Research : Oceans, 123 (2018) 6019–6038.
[4] D.L. Volkov, Interannual Variability of the Altimetry-Derived Eddy Field and Surface Circulation inthe Extratropical North Atlantic Ocean in 1993–2001, Journal of Physical Oceanography 35 (2005)405–426.
[5] A. Smilenova, J. Gula, M. Le Corre, L. Houpert, On the vertical structure and generation mecha-nism of a deep anticyclonic vortex in the central Rockall Trough, northeast North Atlantic, To besubmitted.
[6] G. Roullet, X. Capet, G. Maze, Global interior eddy available potential energy diagnosed from Argofloats, Geophysical Research Letters, 41 (2014) 1651–1656.
[7] D.J. Ellett, P. Kruseman, G.J. Prangsma, R.T. Pollard,H.M.V. Aken, A. Edwards, H.D. Dooley,W.J. Gould, J.A. Businger,J.G. Harvey, Water Masses and Mesoscale Circulation of North RockallTrough Waters during JASIN 1978, Philosophical Transactions of the Royal Society A, 308 (1983)231–252.
[8] D.A.Booth, Eddies in the Rockall Trough, Oceanologica Acta, 11,3 (1988) 213–219.
[9] J.E. Ullgren a, M. White Observations of mesoscale variability in the Rockall Trough, Deep-SeaResearch I, 64 (2012) 1–8.
[10] T.J. Sherwin, D. Aleynik, E. Dumont, M.E. Inall, Deep drivers of mesoscale circulation in thecentral Rockall Trough, Ocean Science, 11 (2015) 343–359.
[11] A.M. Treguier , S. Theeten , E.P. Chassignet, T. Penduff, R. Smith , L. Talley, J.O. Beismann, C.Böning, The North Atlantic Subpolar Gyre in Four High-Resolution Models, Journal of PhysicalOceanography, 35 (2005) 757–774.
[12] A. Köhl, Generation and Stability of a Quasi-Permanent Vortex in the Lofoten Basin, Journal ofPhysical Oceanography, 37 (2007) 2637–2651.
[13] R.P. Raj, L. Chafik, J.E.Ø. Nilsen, T. Eldevik, I. Halo, The Lofoten Vortex of the Nordic Seas,Deep-Sea Research I, 96 (2015) 1–14.
[14] D.L. Volkov, A.A. Kubryakov, R. Lumpkin, Formation and variability of the Lofoten basin vortexin a high-resolution ocean model, Deep-Sea Research I, 105 (2015) 142–157.
[15] A.F. Shchepetkin, J.C. McWilliams, The regional oceanic modeling system (ROMS) : a split-explicit, free-surface, topography-following-coordinate oceanic model, Ocean Modelling, 9 (2005)347–404.
[16] L. Debreu, P.Marchesiello, P. Penven, G. Cambon, Two-way nesting in split-explicit oceanmodels :Algorithms, implementation and validation, Ocean Modelling 49–50 (2012) 1–21.
24ème Congrès Français de Mécanique Brest, 26 au 30 Août 2019
[17] D.B. Chelton, R.A. De Szoeke, M.G. Schlax, Geographical Variability of the First BaroclinicRossby Radius of Deformation, Journal of Physical Oceanography, 28 (1998) 433–460.
[18] F. Lemarié, J. Kurian, A.F. Shchepetkin, M.J. Molemaker, F. Colas, J.C. McWilliams, Are thereinescapable issues prohibiting the use of terrain-following coordinates in climate models ? OceanModelling, 42 (2012) 57–79.
[19] L. Umlauf, H. Burchard, A generic length-scale equation for geophysical turbulence models, Jour-nal of Marine Research, 61 (2003) 235–265.
[20] J. Gula, M.J. Molemaker, J.C. McWilliam, Gulf Stream Dynamics along the Southeastern U.S.Seaboard, Journal of Physical Oceanography, 45 (2015) 690–715.
[21] C.W. Hughes, B.A. De Cuevas, WhyWestern Boundary Currents in Realistic Oceans are Inviscid :A Link between Form Stress and Bottom Pressure Torques, Journal if Physical Oceanography, 31(2001) 2871–2885.
[22] M.J. Molemaker, J.C. McWilliams,W.K. Dewar, Submesoscale instability and generation of me-soscale anticyclones near a separation of the California Undercurrent, Journal of Physical Oceano-graphy, 45 (2015) 613–629.
[23] J. Gula, M.J. Molemaker, J.C. McWilliams, Topographic generation of submesoscale centrifugalinstability and energy dissipation, Nature Communications, 7 (2016) 12811
[24] J. Gula, T.M. Blacic, R.E. Todd, Submesoscale Coherent Vortices in the Gulf Stream, GeophysicalResearch Letters, 46 (2019)
[25] E. van Sebille, S.M. Griffies, R. Abernathey, T.P. Adams, P. Berloff , A. Biastoch, B. Blanke, E.P.Chassignet, Y. Cheng, C.J. Cotter, E. Deleersnijder, K. Döös, H.F. Drake, S. Drijfhout, S.F. Gary,A.W. Heemink, J. Kjellsson, I.M. Koszalka, M. Lange, C. Lique, G.A. MacGilchrist, R. Marsh,C.G.M. Adame, R. McAdam, F. Nencioli, C.B. Paris, M.D. Piggott, J.A. Polton, S. Rühs, S.H.A.M.Shah, Ma.D. Thomas, J. Wang, P.J. Wolfram, L. Zanna, J.D. Zika, Lagrangian ocean analysis :Fundamentals and practices, Ocean Modelling, 121 (2018) 49–75.