Embed Size (px)
Citation preview
Optimisation of the heat treatment cycles of CSIR semi-solid
metal processed Al-7Si-Mg alloys A356/7
by
Heinrich Möller
Submitted for the
Degree of Philosophiae Doctor (Metallurgical Engineering)
in the
Faculty of Engineering, Built Environment and Information Technology
UNIVERSITY OF PRETORIA
Pretoria, South Africa
2011
Submission date: 25 March 2011
©© UUnniivveerrssiittyy ooff PPrreettoorriiaa
i
SUMMARY
Title: Optimisation of the heat treatment cycles of CSIR semi-solid metal processed
Al-7Si-Mg alloys A356/7
Candidate: Heinrich Möller
Supervisor: Professor Waldo E. Stumpf
Department: Materials Science and Metallurgical Engineering, University of Pretoria
Degree: Philosophiae Doctor (Metallurgical Engineering)
Conventional casting alloys Al-7Si-Mg A356/7 contain between 6.5 and 7.5% Si,
together with 0.25-0.7% Mg and are used for critical castings in the automotive and
aerospace industries. These alloys are also the most popular alloys used for semi-solid
metal (SSM) forming due to good castability and fluidity imparted by the large
volumes of the Al-Si eutectic. Despite their industrial importance, there is a lack of
detailed research work revealing precipitate micro- and nanostructural evolution
during aging of these alloys compared with the Al-Mg-Si 6000 series wrought alloys.
This study characterises the heat treatment response of SSM-processed Al-7Si-Mg
alloys in comparison with conventionally liquid cast alloys (investment casting and
gravity die casting). It is shown that, provided that the maximum quantity of the
alloy’s Mg is placed into solid solution during solution treatment, and that the alloy’s
Fe content is within specification, the response to age hardening of Al-7Si-Mg alloys
is independent of the processing technique used. The nanostructural evolution of Al-
7Si-Mg alloys after artificial aging with and without natural pre-aging has been
characterized using transmission electron microscopy and atom probe tomography
and correlated with hardness and mechanical tensile properties. The number densities
and Mg:Si ratios of solute clusters, GP zones and β″-needles were determined. The
heat treatment response of SSM-processed casting alloys A356/7 alloys are also
compared with SSM-processed Al-Mg-Si 6000 series wrought alloys, with the
advantage of having similar globular microstructures. The high Si-content of the
casting alloys compared to the wrought alloys offers several advantages, including a
faster artificial aging response (shorter T6 aging cycles), higher strength for
comparable Mg contents and less sensitivity to prior natural aging on peak strength.
Finally, an age-hardening model was developed for the Al-7Si-Mg alloys, including a
method of incorporating the effects of changes in Mg-content on the aging curves.

ii
Keywords: Al-Si-Mg alloys, heat treatment, natural aging, artificial aging, temper,
semi-solid metal, rheocasting, high pressure die casting, transmission electron
microscopy, atom probe tomography.
217
9. ACKNOWLEDGEMENTS
The following contributions are gratefully acknowledged:
• Professor Waldo Stumpf, my supervisor at the University of Pretoria, South
Africa.
• Dr Sagren Govender, Research Group Leader of the Advanced Casting
Technologies group at the CSIR.
• Dr Willie du Preez, Competency Area Manager of Metals and Metals Processes
and Dr Liesbeth Botha, Director of Materials Science and Manufacturing at the
CSIR.
• My colleagues at the CSIR who have contributed to the successful completion of
this particular work: Ulyate Curle, Pierre Rossouw, Prudence Masuku, Danie
Wilkins, Marius Grobler, Andre Grobler, Chris McDuling, Erich Guldenpfennig,
Dr Lillian Ivanchev, Martin Williams, Peter Malesa, Sam Papo, Mary Mojalefa
and Duncan Hope.
• Adrian Paine from SimLogic for assistance with ProCAST.
• Professor Rob Knutsen from the University of Cape Town, South Africa (impact
testing) and Professor Chris Pistorius from Carnegie-Mellon University in
Pittsburgh, United States of America (Thermo-Calc).
• The Department of Science and Technology (DST) in South Africa is
acknowledged for co-funding under the Advanced Metals Initiative (AMI)
Program.
• Funding from the CSIR Strategic Research Panel (SRP) “Young Researcher
Establishment Fund” (YREF) is gratefully acknowledged.
• The technical, scientific and financial assistance from the AMMRF (Australian
Microscopy and Microanalysis Research Facility) and specifically Dr Gang Sha,
Dr Junhai Xia and Prof Simon Ringer from the University of Sydney, Australia.
• My family, the Möllers and the Roose for their continuing support.
• My wonderful wife Lida and our two gorgeous daughters Christia and Celicia for
their love and support.
- Soli Deo Gloria -
iii
TABLE OF CONTENTS
1. INTRODUCTION 1
1.1. Historical perspective 1
1.2. Heat treatment and age hardening of Al-alloys 1
1.2.1. Al-Si-Mg alloys 1
1.3. Heat treatment of Al-7Si-Mg alloys 2
1.3.1. Conventional liquid cast Al-7Si-Mg alloys 2
1.3.2. SSM-processed Al-7Si-Mg alloys 2
1.4. Objective 3
1.5. Publications 4
2. LITERATURE SURVEY 5
2.1. Semi-solid metal processing 5
2.1.1. History and introduction 5
2.1.2. Thixoforming 7
2.1.3. Rheocasting 7
2.1.3.1. CSIR rheocasting system (CSIR-RCS) 8
2.1.4. Advantages and disadvantages of SSM-processing 9
2.2. Al-7Si-Mg alloys 10
2.2.1. Influence of important alloying elements in modified Al-7Si-Mg
alloys
12
2.2.1.1. Silicon 12
2.2.1.2. Magnesium 13
2.2.1.3. Iron 17
2.2.1.4. Beryllium 18
2.2.1.5. Copper 19
2.2.1.6. Manganese 20
2.2.1.7. Titanium 21
2.2.1.8. Strontium, Sodium and Antimony 22
2.3. Heat Treatment 24
2.3.1. Solution heat treatment 27
2.3.2. Quenching 33
iv
2.3.3. Aging 36
2.3.3.1. Natural aging 38
2.3.3.2. Artificial aging 39
2.3.3.3. Influence of natural pre-aging on subsequent artificial aging 43
2.3.3.4. Heat treatment response of SSM-processed Al-7Si-Mg
alloys in comparison with conventional liquid cast alloys
47
3. EXPERIMENTAL METHODS 53
3.1. Semi-solid metal processing 53
3.1.1. SSM-HPDC of rectangular plates 53
3.1.2. SSM-HPDC of automotive brake callipers 60
3.2. Investment casting of rectangular plates 62
3.3. SSM-HPDC of Al-Mg-Si wrought alloys 6082 and 6004 65
3.4. Thermo-Calc 66
3.5. Heat treatment of castings 66
3.5.1. Solution treatment 66
3.5.2. Quench after solution treatment 67
3.5.3. Natural aging and the T4 temper 67
3.5.4. Artificial aging and the T5 and T6 tempers 67
3.6. Tensile testing 68
3.6.1. The Quality Index (QI) 70
3.7. Impact testing 70
3.8. Optical microscopy and scanning electron microscopy 70
3.9. Transmission electron microscopy (TEM) and Atom probe
tomography (APT)
71
4. RESULTS 73
4.1. Semi-solid metal processing 73
4.1.1. ProCAST simulation of SSM-HPDC of plates 73
4.1.2. Optical microscopy of SSM-HPDC of plates 77
4.2. Solution heat treatment 79
4.2.1. Spheroidisation of eutectic Si 79
4.2.2. Dissolution of solutes and reduction of microsegregation 85
v
4.2.3. Impact strength 87
4.3. Quench after solution treatment 91
4.4. Natural aging and the T4 temper 93
4.5. Artificial aging and the T6 temper 95
4.6. The effects of Mg and Fe in Al-7Si-Mg alloys 103
4.7. Artificial aging and the T5 temper 122
4.8. Comparison between different temper conditions 125
4.9. Surface liquid segregation in SSM-HPDC castings 133
4.10. SSM-HPDC of automotive brake callipers 138
4.11. Comparison of aging response of globular and dendritic Al-7Si-Mg
alloys
139
4.11.1. SSM-HPDC and GDC automotive brake callipers 139
4.11.2. Investment cast plates 143
4.12. Correlations between hardness, yield strength and UTS in Al-7Si-Mg
alloys
146
4.13. Comparison of aging response of SSM-HPDC Al-7Si-Mg alloys with
SSM-HPDC 6000 series Al-Mg-Si wrought alloys
150
4.14. Nanostructural evolution during aging of Al-7Si-Mg alloys 156
4.14.1. Age hardening response and tensile properties 157
4.14.2. Nanostructural evaluation 159
4.14.2.1. Transmission electron microscopy (TEM) 159
4.14.2.2. Atom Probe Tomography (APT) 161
4.14.2.3. Chemical composition evolution of the matrix 164
4.14.2.4. Number density of precipitates 165
4.14.2.5. The Mg:Si ratio of clusters and precipitates in alloy F357 167
4.14.2.6. Incorporation of Al into clusters and precipitates of alloy
F357
168
4.14.2.7. Incorporation of Cu into clusters and precipitates of alloy
F357
168
5. DISCUSSION 171
5.1. SSM-HPDC 171
5.1.1. Rheoprocessing 171
vi
5.1.2. High pressure die casting 171
5.2. Solution heat treatment 172
5.2.1. Spheroidisation of eutectic Si 172
5.2.2. Dissolution of solutes and reduction of microsegregation 173
5.2.3. Impact strength 174
5.3. Quench after solution treatment 175
5.4. The T6 temper condition 177
5.5. The T5 temper condition 180
5.6. Comparison of aging response of globular and dendritic Al-7Si-Mg
alloys
182
5.7. Comparison of aging response of SSM-HPDC Al-7Si-Mg alloys with
SSM-HPDC 6000 series Al-Mg-Si wrought alloys
183
5.8. Nanostructural evolution during aging of Al-7Si-Mg alloys 185
5.8.1. Artificial aging with natural pre-aging 185
5.8.2. Artificial aging without natural pre-aging 186
5.8.3. Comparison of artificial aging with and without natural pre-aging 186
5.9. Characteristics of precipitates in Al-7Si-Mg alloys 188
5.9.1. Solute clusters 188
5.9.2. GP zones 188
5.9.3. β″-needles 189
5.10. Precipitation sequence of Al-7Si-Mg alloys 189
6. AGE HARDENING MODEL FOR Al-7Si-Mg ALLOYS 191
6.1. Age hardening models 191
6.2. The Shercliff-Ashby model 191
6.2.1. Calibration of the model 196
6.2.2. Application of the model in the literature 198
6.3. Application of the model in this study 200
6.4. Comparison of Al-7Si-Mg casting alloy A356 and wrought alloy 6082 205
6.5. Modelling of artificial aging curves of SSM-HPDC Al-7Si-Mg alloys
with varying Mg-contents
206
vii
7. CONCLUSIONS 210
7.1. SSM-HPDC 210
7.2. Solution heat treatment 210
7.3. Quench after solution treatment 210
7.4. Natural aging and the T4 temper condition 211
7.5. Artificial aging and the T5 temper condition 211
7.6. Artificial aging and the T6 temper condition 211
7.6.1. Artificial aging without natural pre-aging 211
7.6.2. Artificial aging with natural pre-aging 212
7.6.3. Characteristics of precipitates found in Al-7Si-Mg alloys 212
7.7. Influence of chemical composition fluctuations 212
7.8. Comparison of the aging response of globular and dendritic Al-7Si-Mg
alloys
213
7.9. Comparison of the aging response of Al-7Si-Mg alloys with 6000
series wrought alloys
213
7.10. Age hardening model for Al-7Si-Mg alloys 214
8. RECOMMENDATIONS 215
8.1. SSM-HPDC 215
8.2. Solution heat treatment 215
8.3. Quench after solution treatment 215
8.4. Artificial aging and the T5 temper condition 215
8.5. Artificial aging and the T6 temper condition 216
8.6. Influence of chemical composition fluctuations 216
8.7. Age hardening model for Al-7Si-Mg alloys 216
9. ACKNOWLEDGEMENTS 217
10. REFERENCES 218
1
1. INTRODUCTION
1.1. Historical perspective
The casting of metals is a prehistoric technology. Even though it is not exactly known
when casting began, archeologists give the name “chalcolithic” to the period in which
the making and use of metals were first being mastered in the Near East and date this
period to approximately between 5000 and 3000 BC (i.e. immediately preceding the
Bronze Age). The first metal used for casting was native copper as was deduced from
chemical analyses of the earliest cast axes and other objects. The fuel employed was
charcoal, which supplied a reducing atmosphere when the fire was enclosed in an
attempt to reduce the loss of heat and the molds were made of stone of a smooth
texture such as steatite or andesite [1].
In the early 1970’s, thixotropic behaviour was discovered in semi-solid metal alloys
which lead to the development of thixocasting and rheocasting (collectively called
semi-solid metal processing) [2]. Given the long history of metal casting, it can be
seen that this new processing technique is a modern technology.
1.2. Heat treatment and age hardening of Al-alloys
Alfred Wilm accidentally discovered age hardening in an Al-Cu-Mg alloy only
approximately 100 years ago and thereby paved the way for using Al-alloys as
engineering materials [3]. It took another 30 years before the mechanism of age-
hardening could be explained, when in 1938, Guinier and Preston postulated that
small precipitates were responsible for the effect [4,5].
1.2.1. Al-Si-Mg alloys
The commercial attraction of Al-Si cast alloys is based on the discovery of
modification of the Al-Si eutectic around 1920 by Aladar Pacz [6]. He discovered that
the brittle Al-Si eutectic changed its morphology from long plates to fine acicular
fibres when small quantities of alkali fluoride or sodium or potassium were added to
the melt. In 1921, Al-Si alloys containing up to 15% silicon were introduced in the
United States under the trade name "ALPAX" [7]. After World War I, Germany could
not afford to use copper in its aluminium alloys and the Al-Si castings provided an
alternative for example in the motor blocks of the Daimler cars. The alloy was also
used in France in streetcars and railways [6].
2
The addition of magnesium to Al-Si alloys makes them age-hardenable and these
alloys were also developed in the 1920’s [8]. The yield strengths of Al-Si-Mg alloys
in the T6 condition are more than double that of the binary Al-Si alloys containing the
same quantity of Si. They also exhibit good corrosion resistance and are used in the
aerospace and automotive industries [9]. With the advent of semi-solid metal (SSM)
processing, the Al-7Si-Mg alloys soon became the most popular alloys for study [10].
This is due to their good castability and fluidity imparted by the large volumes of the
Al-Si eutectic, with the additional advantage of the castings being age-hardenable to
improve strength.
1.3. Heat treatment of Al-7Si-Mg alloys
1.3.1. Conventional liquid cast Al-7Si-Mg alloys
Rinderer and co-workers [11] lamented the lack of detailed research work revealing
precipitate micro- and nanostructural evolution during aging of the Al-Si-Mg casting
alloys as recently as 2010. They attributed this situation to difficulties the eutectic
component causes in preparing high-quality samples for transmission electron
microscopy (TEM) and atom probe tomography (APT).
1.3.2. SSM-processed Al-7Si-Mg alloys
Dewhirst [12] stated that: “Due to the differences in thermal history and rheological
character between semi solid material and liquid metal, the necessary processing steps
are not the same as they have been for thousands of years of foundry experience. The
intuition of foundrymen, developed as the trade itself did over the millennia, is not
necessarily correct when it comes to semi solid metallurgy. Although knowledge of
the mechanisms behind heat treatment of metals is not nearly as old as metal casting
itself, those mechanisms have been around for almost 100 years. Through forging,
heat treatments have been around in one fashion or another for much longer. As with
all new processes, after the mechanisms for SSM heat treatment were commercialised,
the first heat treatments applied to it were essentially those already in use for dendritic
(liquid cast) materials. These treatment regimes are not necessarily the optimal ones,
as the differing microstructure and solidification history of SSM components changes
a number of factors.” He continued that: “The heat treatment principles for
conventionally cast aluminum alloys are well understood, but the different
microstructure and solidification history of SSM components indicate that heat
3
treatment conditions which were optimised for conventionally cast materials do not
apply to SSM components.”
However, Birol [13,14] postulated that the morphology of the primary α-Al, whether
dendritic or globular, has no effect on the artificial aging response of Al-7Si-Mg
alloys. He suggested that the favourable impact of the globular structure is most likely
offset by the relatively coarser structure in SSM-processed alloys. There is, therefore,
disagreement regarding the effects of SSM-processing on the subsequent heat
treatment response of these alloys.
1.4. Objective
The objective of this study is to characterise the heat treatment response of SSM-
processed Al-7Si-Mg alloys in comparison with conventionally liquid cast alloys
(investment casting and gravity die casting). The heat treatment parameters that are
specified for conventionally liquid cast alloys are critically analysed to determine
whether they are applicable to SSM-processed components and if they are still the
same optimised parameters for dendritic castings in a world where energy and
environmental features have changed since these cycles were originally developed.
The investigated heat treatment cycles include parameters that affect the T4, T5 and
T6 temper conditions i.e. the effects of solution heat treatment, quenching, natural
aging and artificial aging on hardness, tensile properties and impact properties are
considered. Chemical composition variations within specification (especially Mg) also
constitute a major part of this study. Techniques such as optical microscopy, scanning
electron microscopy, transmission electron microscopy and atom probe tomography
were employed to obtain an in-depth understanding of the processes that occur during
heat treatment of these alloys. In addition, commercially available software packages
Thermo-Calc and ProCAST were used to supplement the experimental observations.
Finally, an age-hardening model was developed based on the Shercliff and Ashby
methodology [15], including a method of incorporating the effects of changes in Mg-
content on the aging curves.

4
1.5. Publications
During the course of this study, a number of papers relating to the investigation have
been authored or co-authored by Heinrich Möller. These papers are distinguished
from other papers by including “HM” in front of the number in the reference list
[HM1-HM15].
5
2. LITERATURE SURVEY
2.1. Semi-solid metal processing
2.1.1. History and introduction
Thixotropy can be derived from the Greek words for “contact, touch”, and “change,
modification” [6]. Thixotropic materials flow when sheared, but when allowed to
stand they thicken up again. Common materials that display this behaviour are
mascara, honey and certain kinds of paint [16]. Thixotropic behaviour in metallic
alloys was first discovered by Spencer and co-workers in the early 1970’s while they
worked on hot tearing in the lead-tin system [2]. It was found that stirring the metal
alloys continuously during cooling from the fully liquid state to the semi-solid state
lowered the viscosity significantly compared to when the alloy was cooled into the
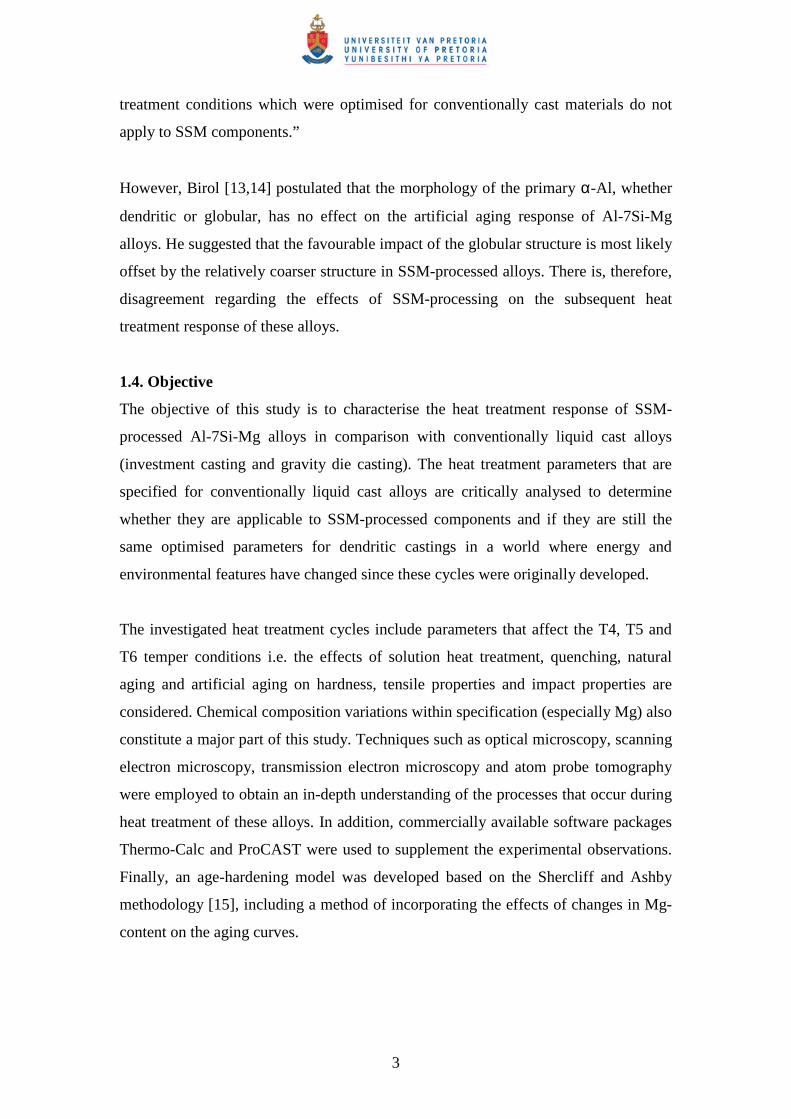
semi-solid state without stirring. Stirring breaks up the dendrites which would be
present in conventionally liquid cast alloys and results in a microstructure in the semi-
solid state consisting of spheroids or globules of solids surrounded by liquid (Fig. 2.1
[17]).
Figure 2.1: Micrograph of a typical (a) dendritic microstructure in an as-cast
sample and (b) globular microstructure in a semi-solid alloy sample [16].
This globular microstructure is a prerequisite for thixotropic behaviour and when such
a semi-solid microstructure is allowed to stand, the globules/spheroids agglomerate
and the viscosity increases with time [16]. If the material is sheared, the agglomerates
are broken up and the viscosity decreases. In the semi-solid state (with ~ 30-50%
liquid), the alloy will support its own weight when allowed to stand and can be
handled as a solid. However, as soon as it is sheared, it flows with a viscosity similar
to that of heavy machine oil. The cutting test, in which the alloy can be cut and spread
6
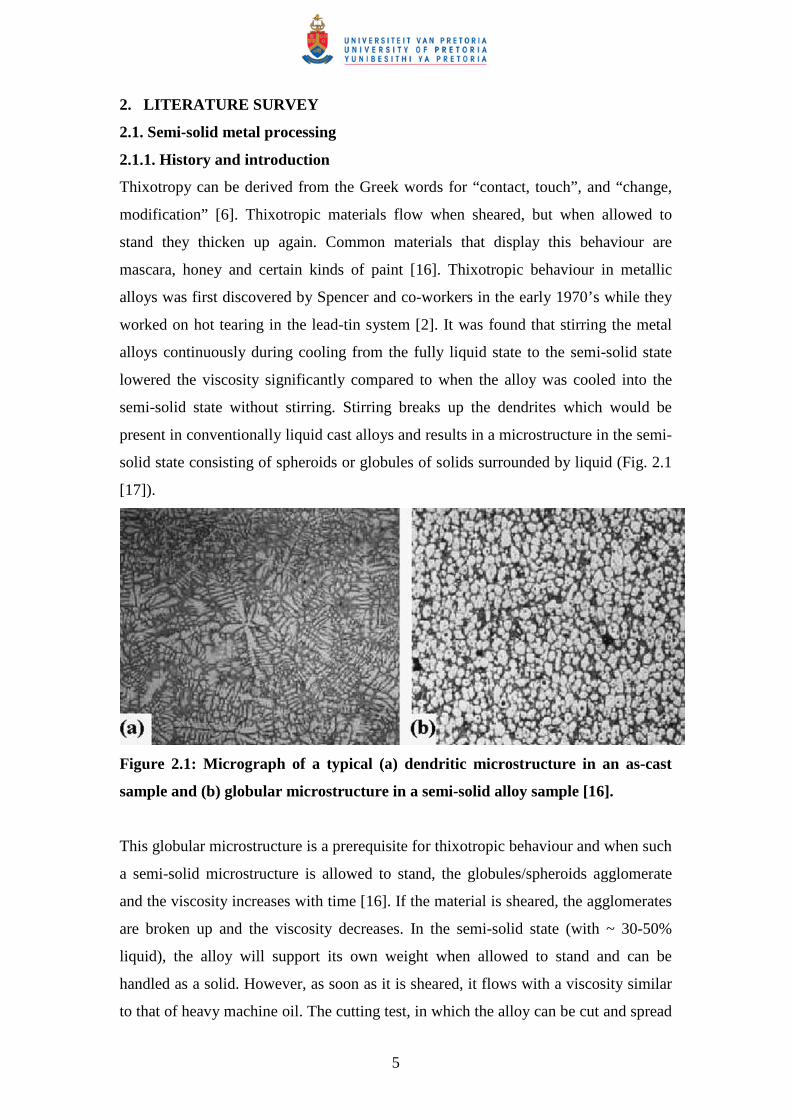
like butter, demonstrates the thixotropic behaviour of semi-solid alloy slugs in Figure
2.2 [16].
Figure 2.2: A photographic sequence illustrating the thixotropic behaviour of
semi-solid alloy slugs [16].
More than 30 years of research has been invested in the field of SSM-processing and
the interest in the field is highlighted by eleven international conferences [17-27] with
a twelfth planned in South Africa in 2012. SSM-processing presents an alternative
manufacturing route for aerospace, military and especially automotive components
[16,28]. Suspension parts, engine brackets and fuel rails for automotives are being
produced in Europe, whereas examples from the USA include mechanical parts for
snowmobiles and mountain bikes. Asia has focused more on the production of
electronic components such as electrical housing components and notebook cases
with emphasis on magnesium alloys [16]. Two main routes have subsequently been
developed for producing semi-solid parts, namely thixoforming and rheocasting.
7
2.1.2. Thixoforming
Thixoforming is a general term used to describe the near-net shape forming processes
from a partially melted, non-dendritic alloy slug within a metal die. If the component
shaping is performed in a closed die, it is referred to as thixocasting, while if the
shaping is achieved in an open die, it is called thixoforging [6,16]. There are two
separate stages involved in the thixoforming process namely reheating and forming.
Reheating to the semi-solid state is a particularly important phase in the thixoforming
process and is mainly achieved by induction heating, which guarantees exact and
rapid heating. The increased costs associated with thixocasting (for example recycling
of thixocast scrap and the necessity of an outside manufacturer for billet production)
have resulted in rheocasting becoming the preferred semi-solid process [16].
2.1.3. Rheocasting
Rheocasting involves preparation of a SSM slurry directly from the liquid, followed
by a forming process such as high pressure die casting (HPDC). Component shaping
directly from SSM slurries is inherently attractive due to its characteristics, such as
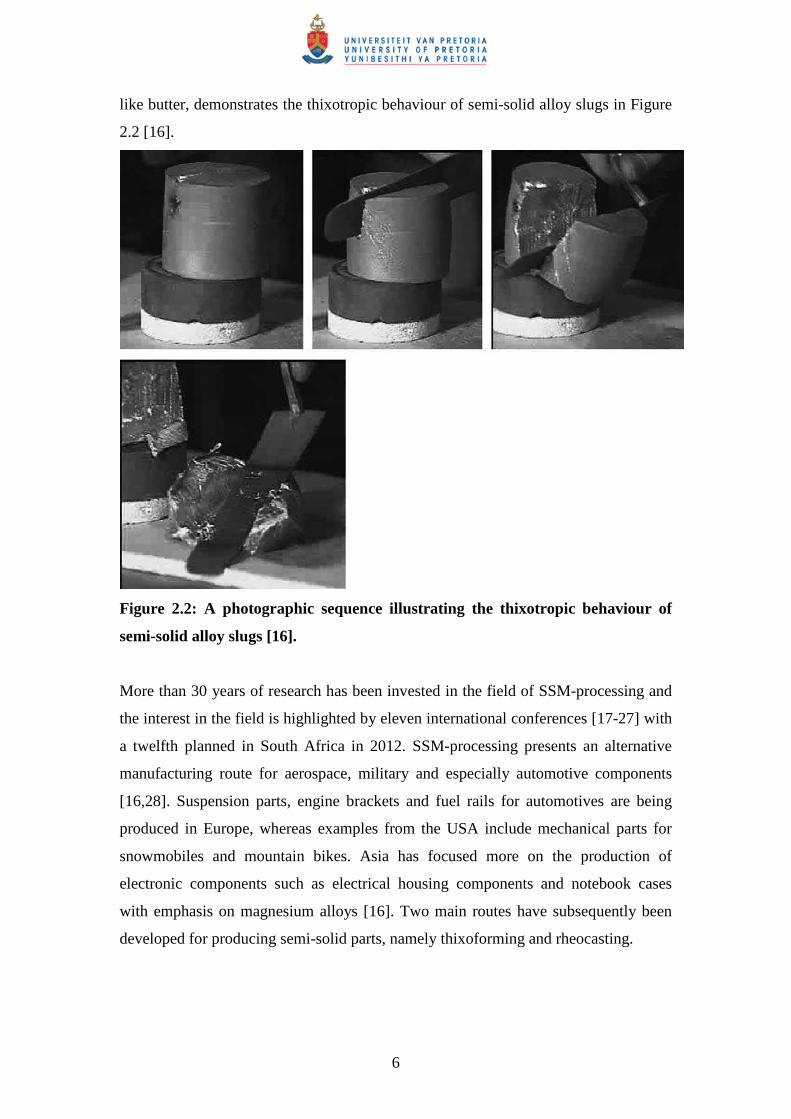
overall efficiency in production and energy management [6]. The distinctions between
thixocasting, thixoforging and rheocasting are illustrated graphically in Figure 2.3
[29].
Figure 2.3: Schematic illustration of different routes for SSM-processing [29].
8
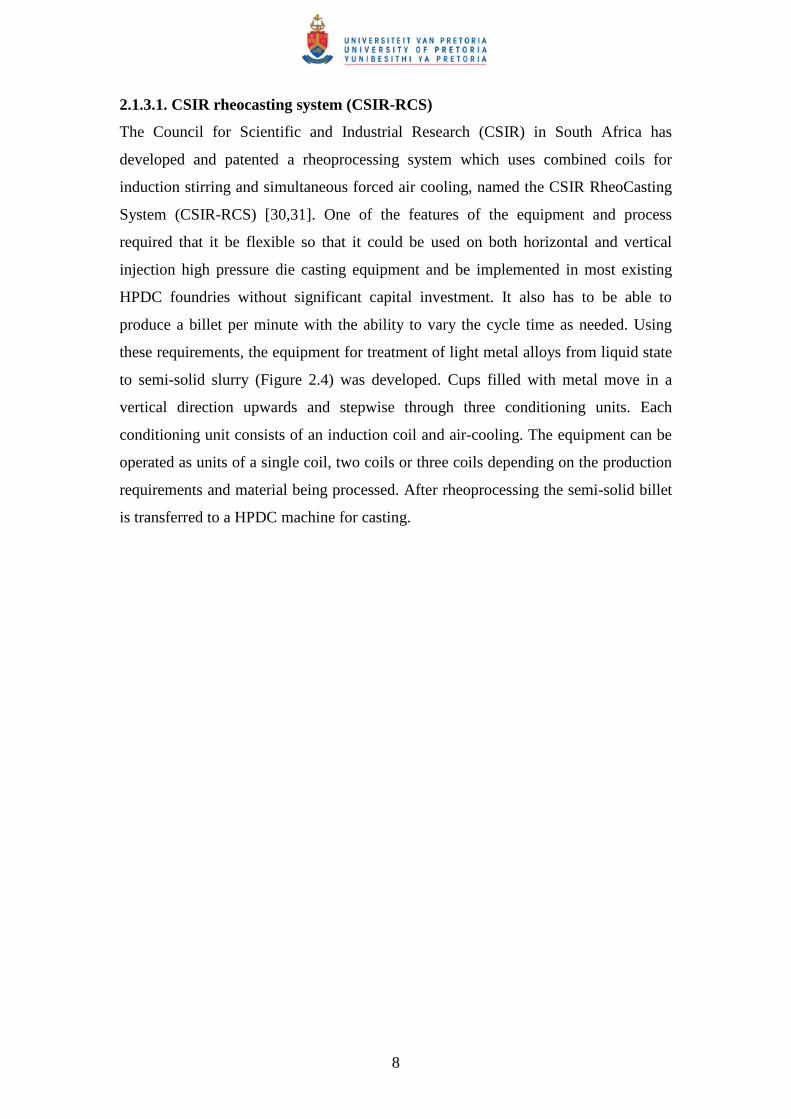
2.1.3.1. CSIR rheocasting system (CSIR-RCS)
The Council for Scientific and Industrial Research (CSIR) in South Africa has
developed and patented a rheoprocessing system which uses combined coils for
induction stirring and simultaneous forced air cooling, named the CSIR RheoCasting
System (CSIR-RCS) [30,31]. One of the features of the equipment and process
required that it be flexible so that it could be used on both horizontal and vertical
injection high pressure die casting equipment and be implemented in most existing
HPDC foundries without significant capital investment. It also has to be able to
produce a billet per minute with the ability to vary the cycle time as needed. Using
these requirements, the equipment for treatment of light metal alloys from liquid state
to semi-solid slurry (Figure 2.4) was developed. Cups filled with metal move in a
vertical direction upwards and stepwise through three conditioning units. Each
conditioning unit consists of an induction coil and air-cooling. The equipment can be
operated as units of a single coil, two coils or three coils depending on the production
requirements and material being processed. After rheoprocessing the semi-solid billet
is transferred to a HPDC machine for casting.
9
Figure 2.4: The CSIR Rheoprocessing slurry maker for continuous delivery of
SSM billets [31].
2.1.4. Advantages and disadvantages of SSM-processing
The main advantages and disadvantages of semi-solid processing (relative to die
casting) have been summarised by Atkinson [16] to be as follows:
Advantages
• Energy efficiency: metal is not being held in the liquid state over long periods of
time;
• Production rates are similar to pressure die casting or better;
• Smooth filling of the die with no air entrapment and low shrinkage porosity gives
parts of high integrity (including thin-walled sections) and allows application of
the process to higher-strength heat-treatable alloys;
• Lower processing temperatures reduce the thermal shock on the die, promoting
die life and allowing the use of non-traditional die materials;
• Fine, uniform microstructures give enhanced properties;
10
• Reduced solidification shrinkage gives dimensions closer to near net shape and
justifies the elimination of machining steps; and
• Surface quality is suitable for plating.
Disadvantages
• The cost of raw material for thixoforming can be high and the number of suppliers
small;
• Process knowledge and experience has to be continually built up in order to
facilitate application of the process to new components;
• Initially at least, personnel require a higher level of training and skill than with
more traditional processes;
• Temperature control: the fraction solid and viscosity in the semi-solid state are
very dependent on temperature. Alloys with a narrow temperature range in the
semi-solid region require accurate control of the temperature; and
• Liquid segregation due to non-uniform heating can result in non-uniform
composition in the component.
2.2. Al-7Si-Mg alloys
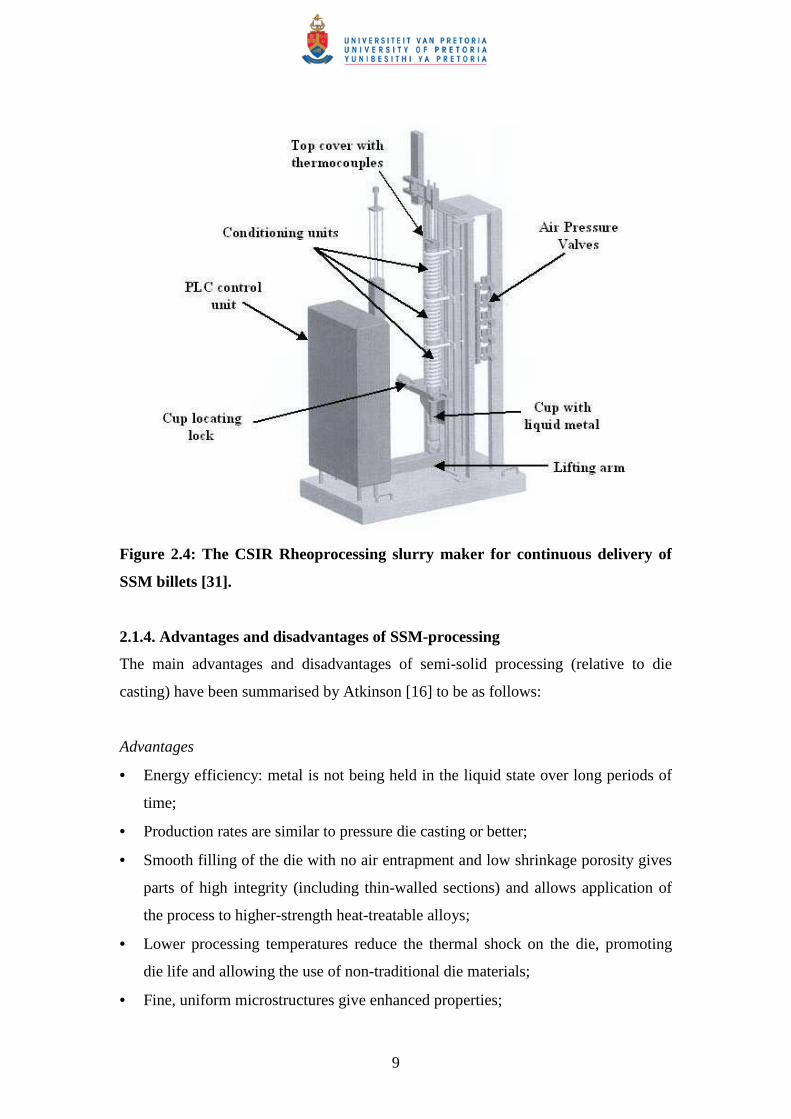
The Al-Si binary alloy system is an eutectic system with the eutectic composition at
12.6wt% Si (Fig. 2.5 [32]).
Conventional casting alloys Al-7Si-Mg A356/7 contain between 6.5 and 7.5% Si,
together with 0.25-0.7% Mg and are used for critical castings in aircraft such as the
engine support pylons, while automotive components include wheels and cylinder
heads [9]. These alloys are probably the most popular alloys used for semi-solid metal
forming due to good castability and fluidity imparted by the large volumes of the Al-
Si eutectic [10].
11
Figure 2.5: The Al-Si binary phase diagram [32].
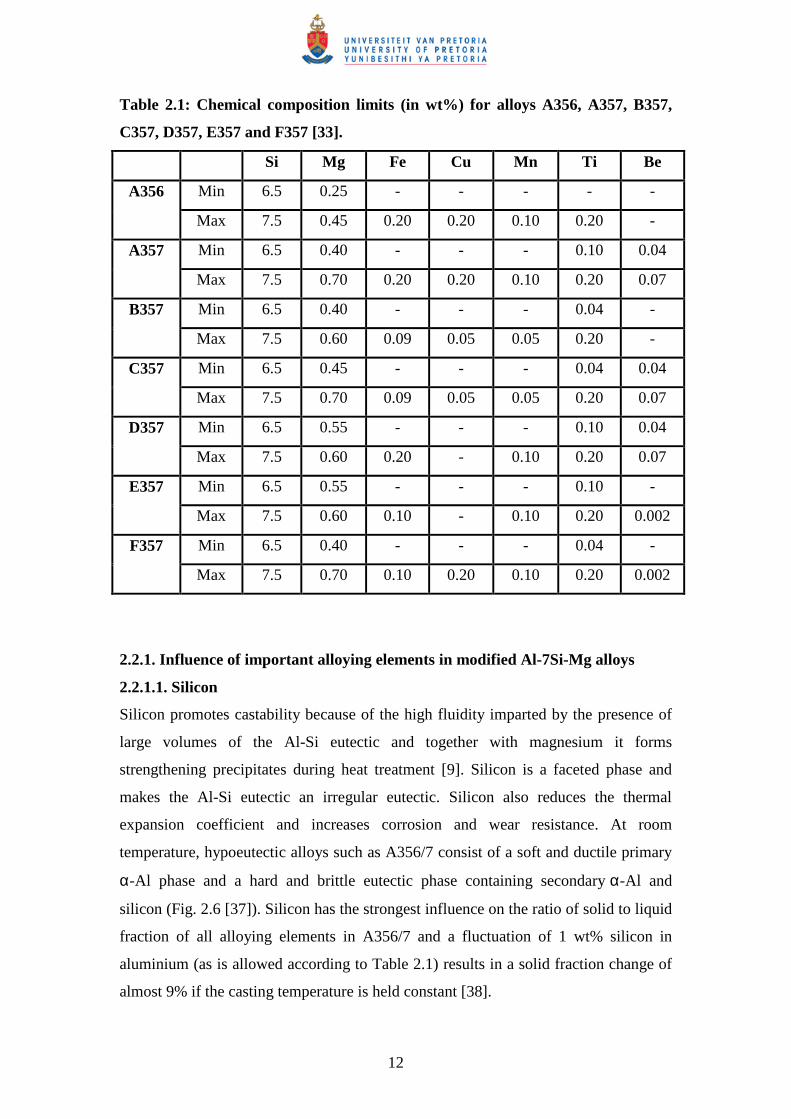
The chemical composition limits for alloys A356, as well as A357 to F357 are shown
in Table 2.1 [33]. International standards for aluminium alloys often permit significant
fluctuations in the content of alloying elements. The main difference between alloy
A356 and the F357 alloy lies in the magnesium content, whereas the main difference
between alloys F357 and A357 is their beryllium content (Table 2.1). The addition of
beryllium to this alloy system (e.g. alloy A357) leads to a change in the morphology
of the iron-rich intermetallics, which results in slightly better ductility [34] – see
section 2.2.1.4. The Be-containing alloys are gradually being phased out in many
applications due to the carcinogenic effects of beryllium, particularly at higher
concentrations used during make-up of the alloys. The beryllium-free alloy F357 is
frequently incorrectly labelled as A357, especially in semi-solid metal research
[35,36].
12
Table 2.1: Chemical composition limits (in wt%) for alloys A356, A357, B357,
C357, D357, E357 and F357 [33].
Si Mg Fe Cu Mn Ti Be
Min 6.5 0.25 - - - - - A356
Max 7.5 0.45 0.20 0.20 0.10 0.20 -
Min 6.5 0.40 - - - 0.10 0.04 A357
Max 7.5 0.70 0.20 0.20 0.10 0.20 0.07
Min 6.5 0.40 - - - 0.04 - B357
Max 7.5 0.60 0.09 0.05 0.05 0.20 -
Min 6.5 0.45 - - - 0.04 0.04 C357
Max 7.5 0.70 0.09 0.05 0.05 0.20 0.07
Min 6.5 0.55 - - - 0.10 0.04 D357
Max 7.5 0.60 0.20 - 0.10 0.20 0.07
Min 6.5 0.55 - - - 0.10 - E357
Max 7.5 0.60 0.10 - 0.10 0.20 0.002
Min 6.5 0.40 - - - 0.04 - F357
Max 7.5 0.70 0.10 0.20 0.10 0.20 0.002
2.2.1. Influence of important alloying elements in modified Al-7Si-Mg alloys
2.2.1.1. Silicon
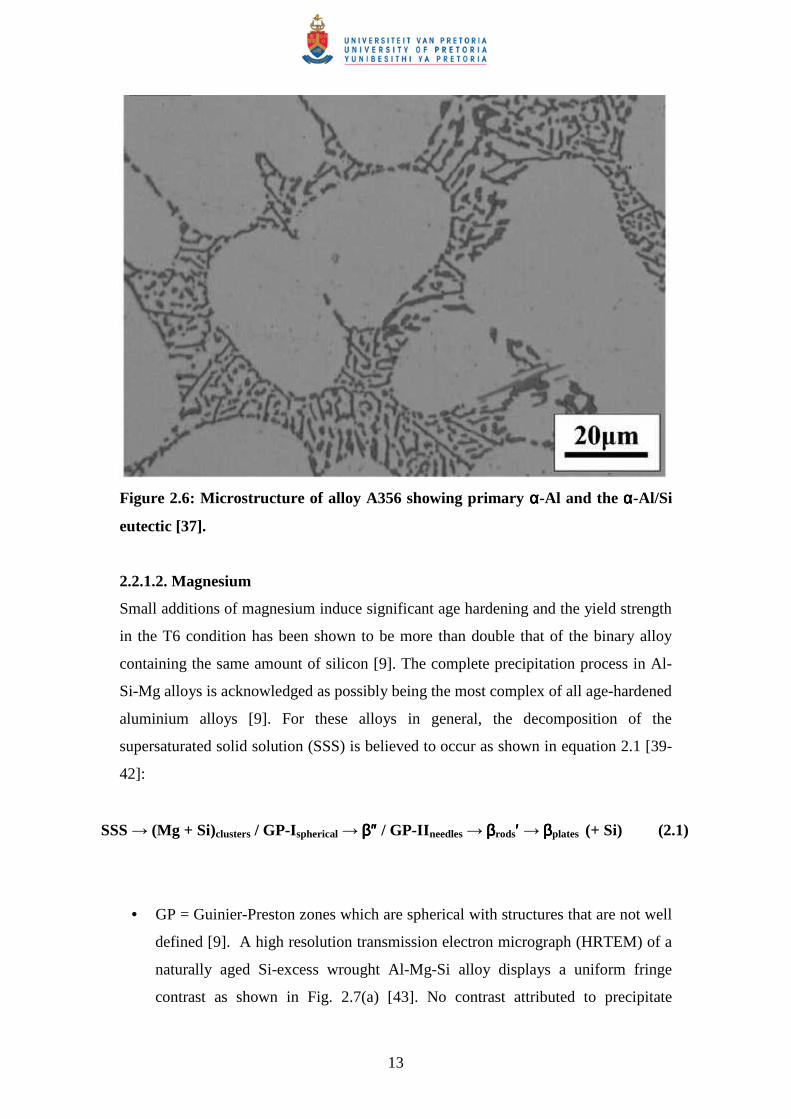
Silicon promotes castability because of the high fluidity imparted by the presence of
large volumes of the Al-Si eutectic and together with magnesium it forms
strengthening precipitates during heat treatment [9]. Silicon is a faceted phase and
makes the Al-Si eutectic an irregular eutectic. Silicon also reduces the thermal
expansion coefficient and increases corrosion and wear resistance. At room
temperature, hypoeutectic alloys such as A356/7 consist of a soft and ductile primary
α-Al phase and a hard and brittle eutectic phase containing secondary α-Al and
silicon (Fig. 2.6 [37]). Silicon has the strongest influence on the ratio of solid to liquid
fraction of all alloying elements in A356/7 and a fluctuation of 1 wt% silicon in
aluminium (as is allowed according to Table 2.1) results in a solid fraction change of
almost 9% if the casting temperature is held constant [38].
13
Figure 2.6: Microstructure of alloy A356 showing primary αααα-Al and the αααα-Al/Si
eutectic [37].
2.2.1.2. Magnesium
Small additions of magnesium induce significant age hardening and the yield strength
in the T6 condition has been shown to be more than double that of the binary alloy
containing the same amount of silicon [9]. The complete precipitation process in Al-
Si-Mg alloys is acknowledged as possibly being the most complex of all age-hardened
aluminium alloys [9]. For these alloys in general, the decomposition of the
supersaturated solid solution (SSS) is believed to occur as shown in equation 2.1 [39-
42]:
SSS → (Mg + Si)clusters / GP-Ispherical → ββββ″″″″ / GP-II needles → β β β βrods′′′′ → ββββplates (+ Si) (2.1)
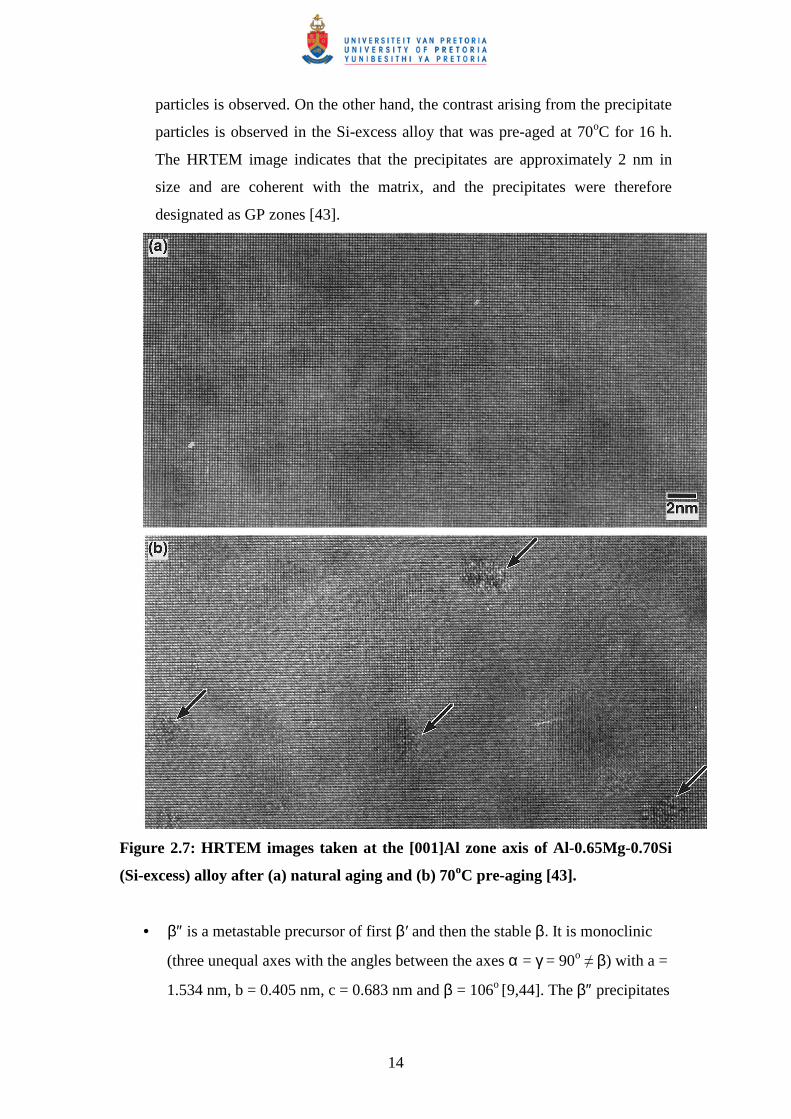
• GP = Guinier-Preston zones which are spherical with structures that are not well
defined [9]. A high resolution transmission electron micrograph (HRTEM) of a
naturally aged Si-excess wrought Al-Mg-Si alloy displays a uniform fringe
contrast as shown in Fig. 2.7(a) [43]. No contrast attributed to precipitate
14
particles is observed. On the other hand, the contrast arising from the precipitate
particles is observed in the Si-excess alloy that was pre-aged at 70oC for 16 h.
The HRTEM image indicates that the precipitates are approximately 2 nm in
size and are coherent with the matrix, and the precipitates were therefore
designated as GP zones [43].
Figure 2.7: HRTEM images taken at the [001]Al zone axis of Al-0.65Mg-0.70Si
(Si-excess) alloy after (a) natural aging and (b) 70oC pre-aging [43].
• β″ is a metastable precursor of first β′ and then the stable β. It is monoclinic
(three unequal axes with the angles between the axes α = γ = 90o ≠ β) with a =
1.534 nm, b = 0.405 nm, c = 0.683 nm and β = 106o [9,44]. The β″ precipitates
15
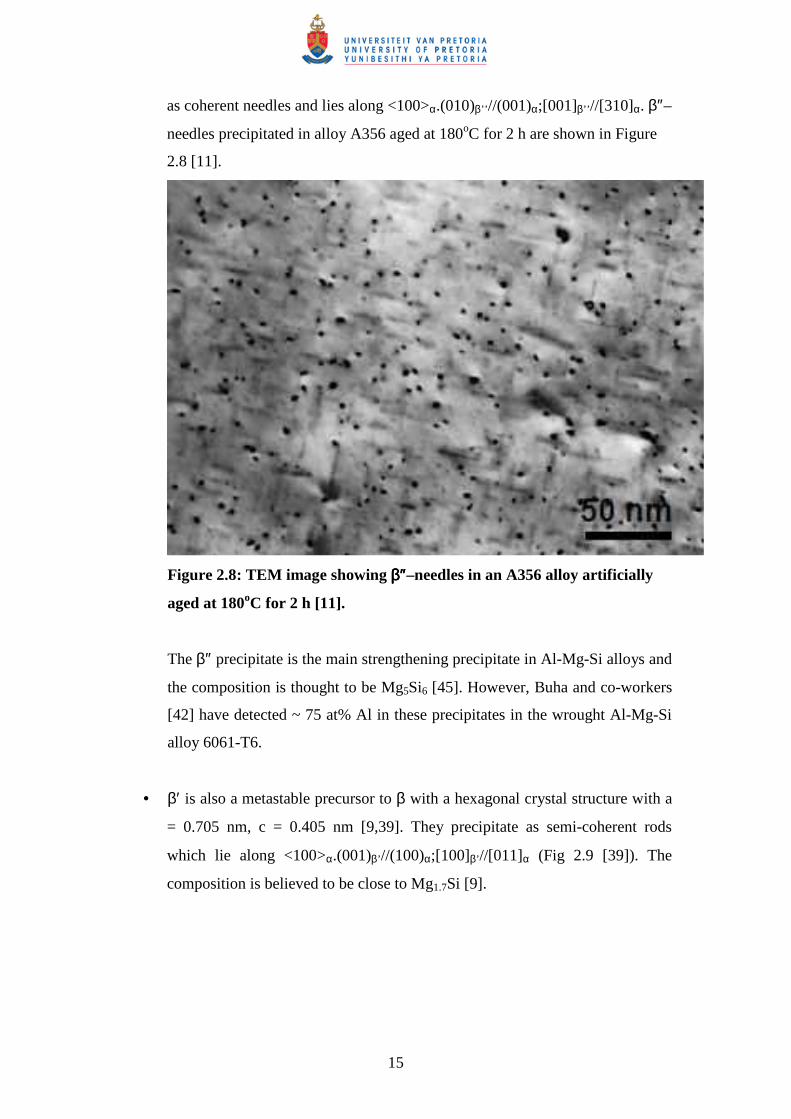
as coherent needles and lies along <100>α.(010)β’’ //(001)α;[001]β’’ //[310]α. β″–
needles precipitated in alloy A356 aged at 180oC for 2 h are shown in Figure
2.8 [11].
Figure 2.8: TEM image showing ββββ″″″″–needles in an A356 alloy artificially
aged at 180oC for 2 h [11].
The β″ precipitate is the main strengthening precipitate in Al-Mg-Si alloys and
the composition is thought to be Mg5Si6 [45]. However, Buha and co-workers
[42] have detected ~ 75 at% Al in these precipitates in the wrought Al-Mg-Si
alloy 6061-T6.
• β′ is also a metastable precursor to β with a hexagonal crystal structure with a
= 0.705 nm, c = 0.405 nm [9,39]. They precipitate as semi-coherent rods
which lie along <100>α.(001)β’//(100)α;[100]β’//[011]α (Fig 2.9 [39]). The
composition is believed to be close to Mg1.7Si [9].
16
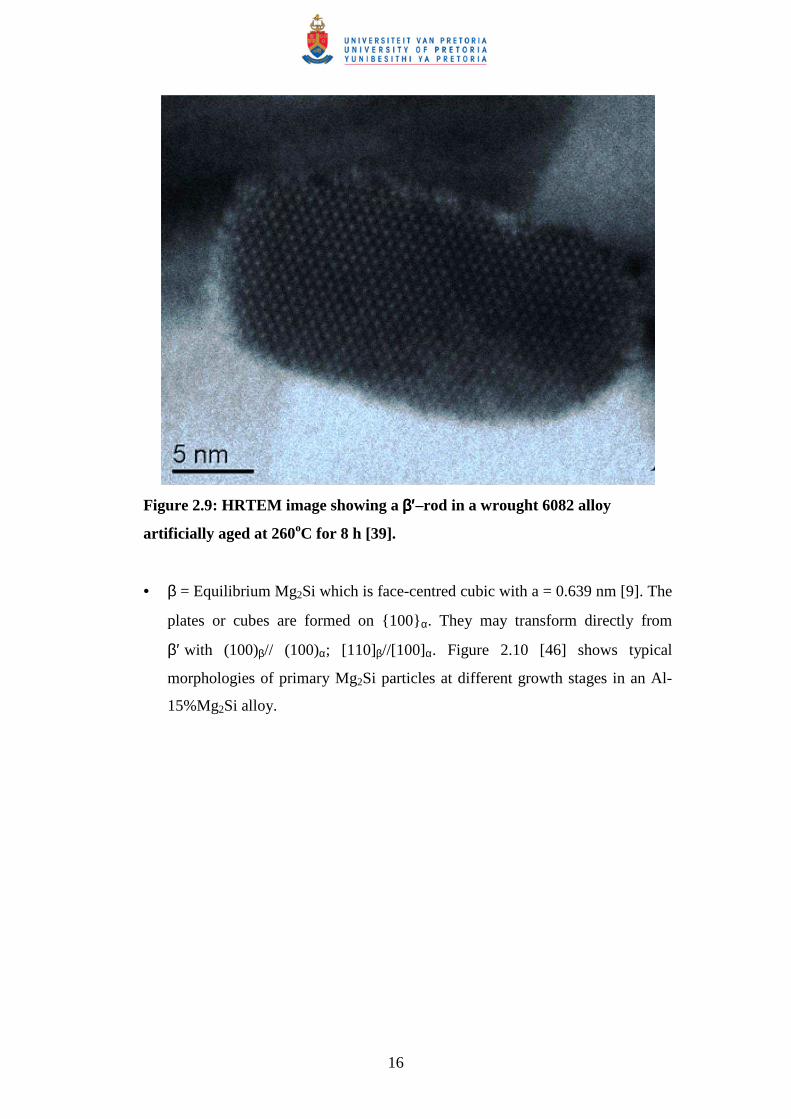
Figure 2.9: HRTEM image showing a ββββ′′′′–rod in a wrought 6082 alloy
artificially aged at 260oC for 8 h [39].
• β = Equilibrium Mg2Si which is face-centred cubic with a = 0.639 nm [9]. The
plates or cubes are formed on {100}α. They may transform directly from
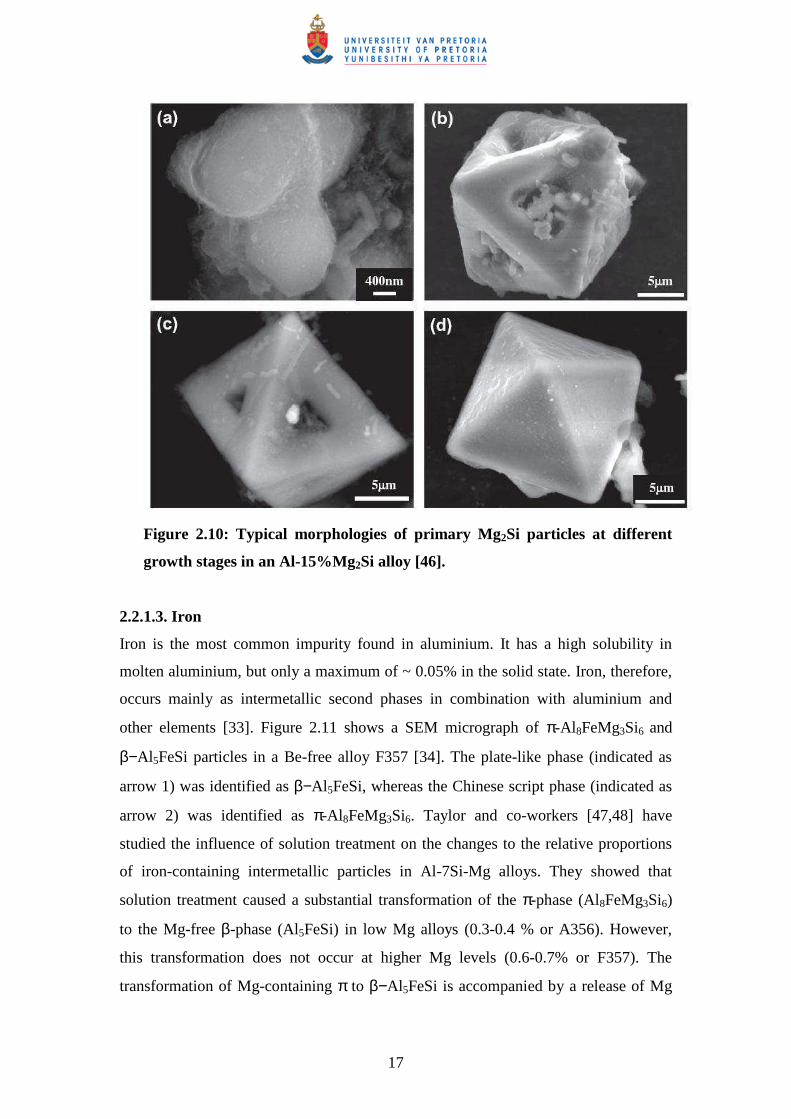
β′ with (100)β// (100)α; [110]β//[100]α. Figure 2.10 [46] shows typical
morphologies of primary Mg2Si particles at different growth stages in an Al-
15%Mg2Si alloy.
17
Figure 2.10: Typical morphologies of primary Mg2Si particles at different
growth stages in an Al-15%Mg2Si alloy [46].
2.2.1.3. Iron
Iron is the most common impurity found in aluminium. It has a high solubility in
molten aluminium, but only a maximum of ~ 0.05% in the solid state. Iron, therefore,
occurs mainly as intermetallic second phases in combination with aluminium and
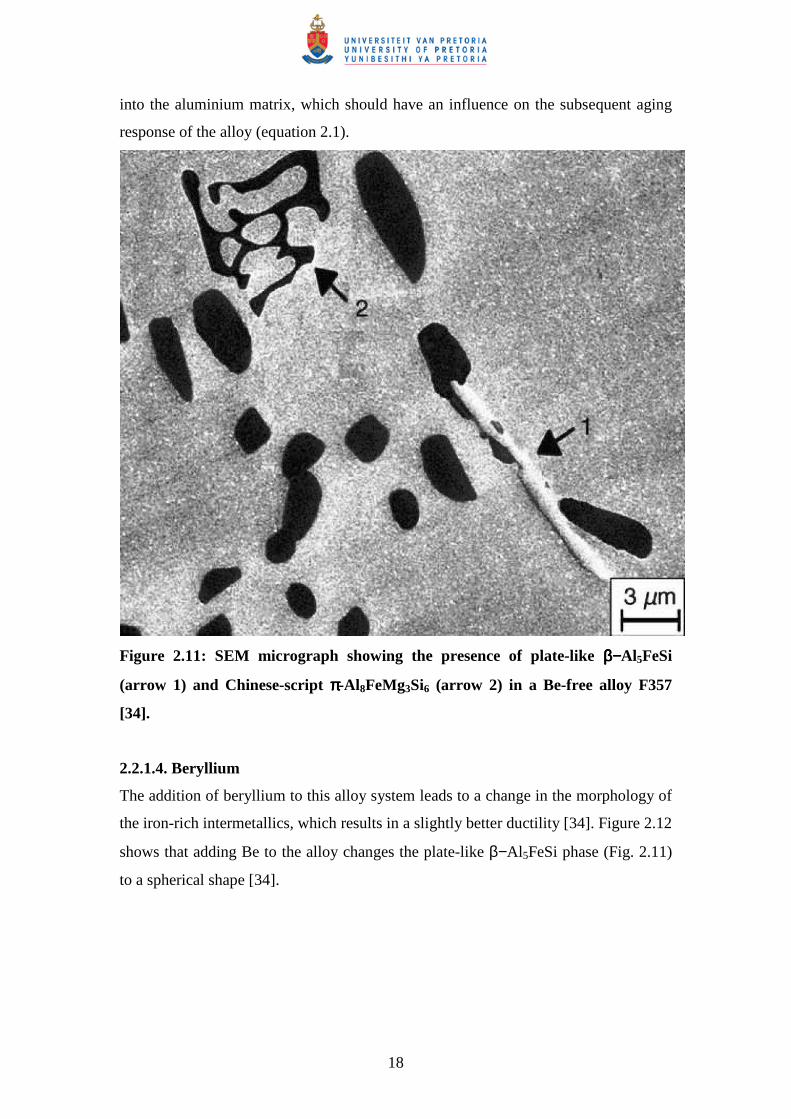
other elements [33]. Figure 2.11 shows a SEM micrograph of π-Al 8FeMg3Si6 and
β−Al5FeSi particles in a Be-free alloy F357 [34]. The plate-like phase (indicated as
arrow 1) was identified as β−Al 5FeSi, whereas the Chinese script phase (indicated as
arrow 2) was identified as π-Al 8FeMg3Si6. Taylor and co-workers [47,48] have
studied the influence of solution treatment on the changes to the relative proportions
of iron-containing intermetallic particles in Al-7Si-Mg alloys. They showed that
solution treatment caused a substantial transformation of the π-phase (Al8FeMg3Si6)
to the Mg-free β-phase (Al5FeSi) in low Mg alloys (0.3-0.4 % or A356). However,
this transformation does not occur at higher Mg levels (0.6-0.7% or F357). The
transformation of Mg-containing π to β−Al5FeSi is accompanied by a release of Mg
18
into the aluminium matrix, which should have an influence on the subsequent aging
response of the alloy (equation 2.1).
Figure 2.11: SEM micrograph showing the presence of plate-like β−β−β−β−Al5FeSi
(arrow 1) and Chinese-script ππππ-Al 8FeMg3Si6 (arrow 2) in a Be-free alloy F357
[34].
2.2.1.4. Beryllium
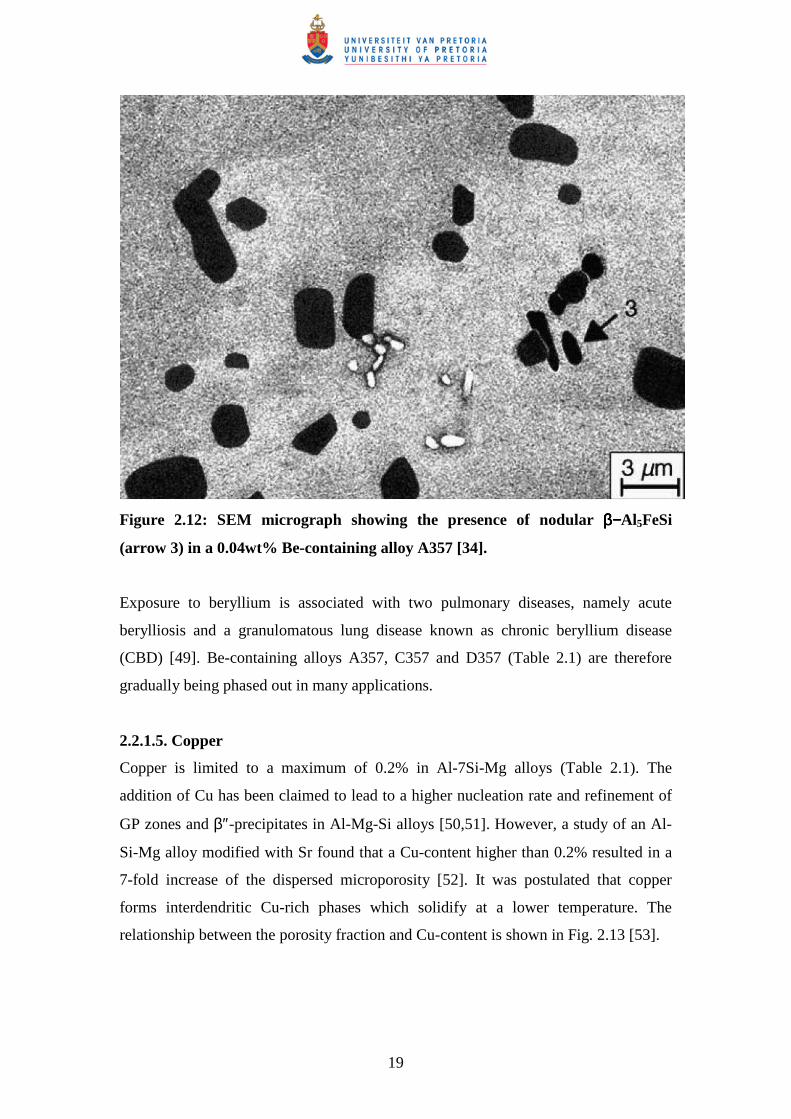
The addition of beryllium to this alloy system leads to a change in the morphology of
the iron-rich intermetallics, which results in a slightly better ductility [34]. Figure 2.12
shows that adding Be to the alloy changes the plate-like β−Al 5FeSi phase (Fig. 2.11)
to a spherical shape [34].
19
Figure 2.12: SEM micrograph showing the presence of nodular β−β−β−β−Al5FeSi
(arrow 3) in a 0.04wt% Be-containing alloy A357 [34].
Exposure to beryllium is associated with two pulmonary diseases, namely acute
berylliosis and a granulomatous lung disease known as chronic beryllium disease
(CBD) [49]. Be-containing alloys A357, C357 and D357 (Table 2.1) are therefore
gradually being phased out in many applications.
2.2.1.5. Copper
Copper is limited to a maximum of 0.2% in Al-7Si-Mg alloys (Table 2.1). The
addition of Cu has been claimed to lead to a higher nucleation rate and refinement of
GP zones and β″-precipitates in Al-Mg-Si alloys [50,51]. However, a study of an Al-
Si-Mg alloy modified with Sr found that a Cu-content higher than 0.2% resulted in a
7-fold increase of the dispersed microporosity [52]. It was postulated that copper
forms interdendritic Cu-rich phases which solidify at a lower temperature. The
relationship between the porosity fraction and Cu-content is shown in Fig. 2.13 [53].
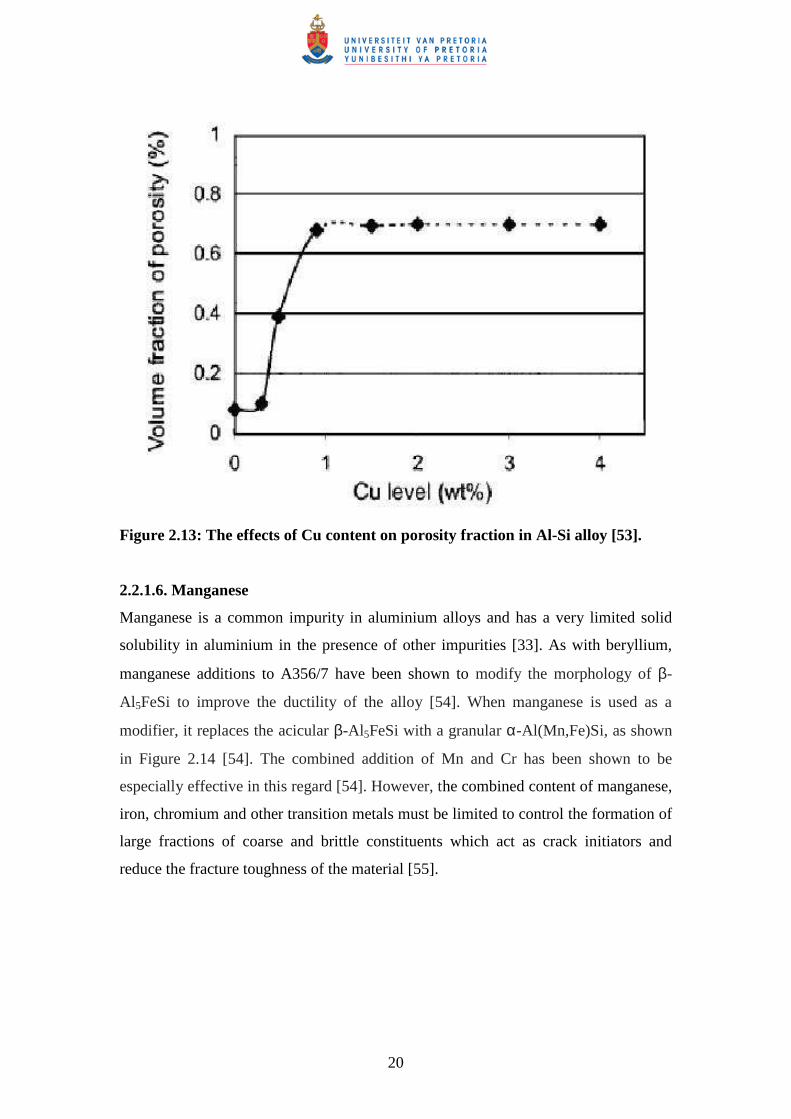
20
Figure 2.13: The effects of Cu content on porosity fraction in Al-Si alloy [53].
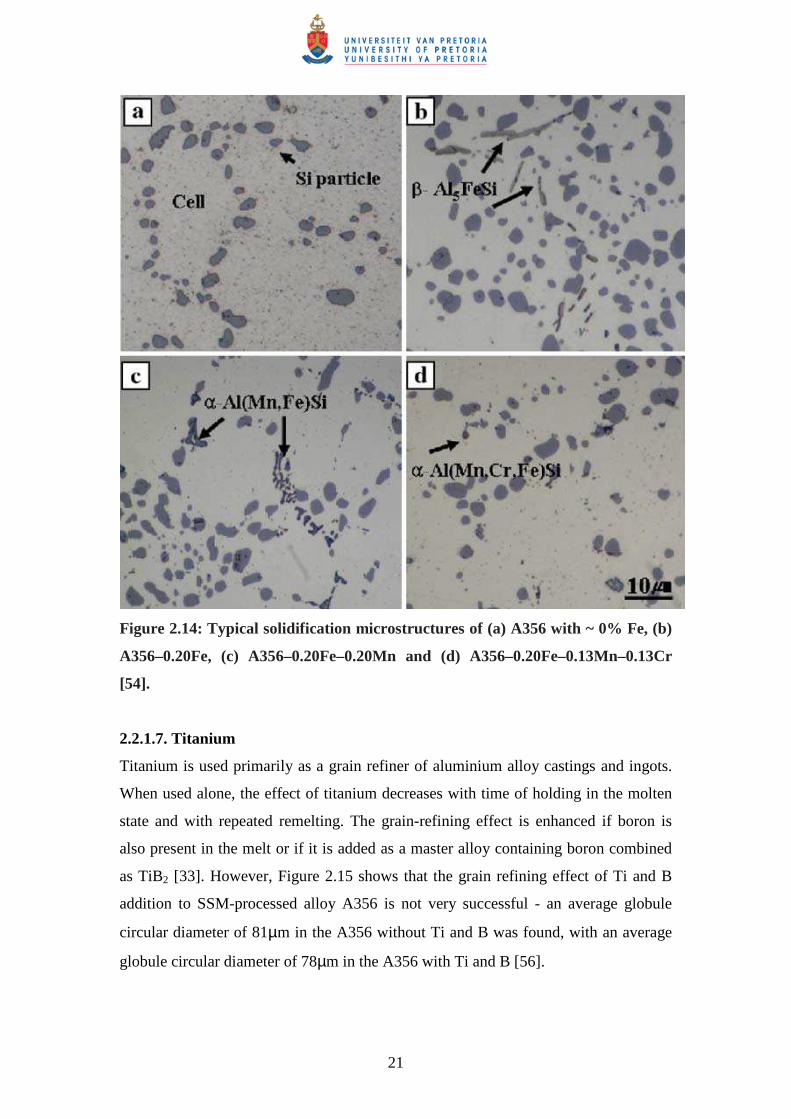
2.2.1.6. Manganese
Manganese is a common impurity in aluminium alloys and has a very limited solid
solubility in aluminium in the presence of other impurities [33]. As with beryllium,
manganese additions to A356/7 have been shown to modify the morphology of β-
Al5FeSi to improve the ductility of the alloy [54]. When manganese is used as a
modifier, it replaces the acicular β-Al5FeSi with a granular α-Al(Mn,Fe)Si, as shown
in Figure 2.14 [54]. The combined addition of Mn and Cr has been shown to be
especially effective in this regard [54]. However, the combined content of manganese,
iron, chromium and other transition metals must be limited to control the formation of
large fractions of coarse and brittle constituents which act as crack initiators and
reduce the fracture toughness of the material [55].
21
Figure 2.14: Typical solidification microstructures of (a) A356 with ~ 0% Fe, (b)
A356–0.20Fe, (c) A356–0.20Fe–0.20Mn and (d) A356–0.20Fe–0.13Mn–0.13Cr
[54].
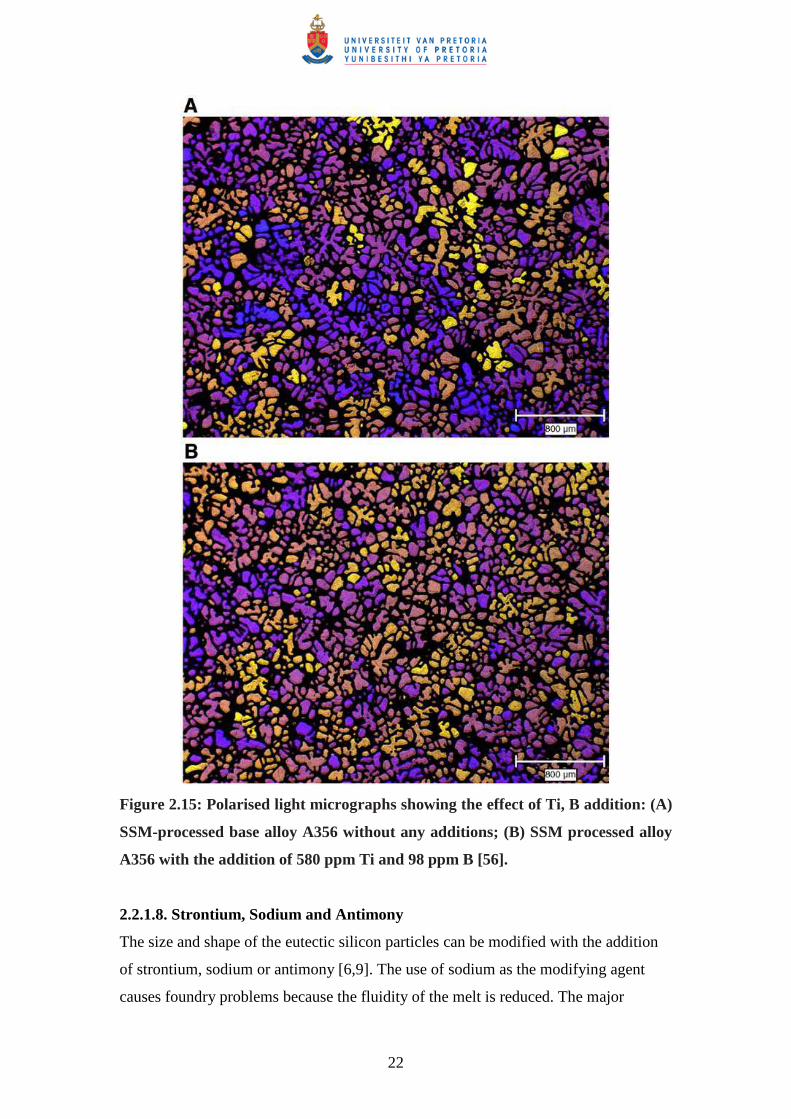
2.2.1.7. Titanium
Titanium is used primarily as a grain refiner of aluminium alloy castings and ingots.
When used alone, the effect of titanium decreases with time of holding in the molten
state and with repeated remelting. The grain-refining effect is enhanced if boron is
also present in the melt or if it is added as a master alloy containing boron combined
as TiB2 [33]. However, Figure 2.15 shows that the grain refining effect of Ti and B
addition to SSM-processed alloy A356 is not very successful - an average globule
circular diameter of 81µm in the A356 without Ti and B was found, with an average
globule circular diameter of 78µm in the A356 with Ti and B [56].
22
Figure 2.15: Polarised light micrographs showing the effect of Ti, B addition: (A)
SSM-processed base alloy A356 without any additions; (B) SSM processed alloy
A356 with the addition of 580 ppm Ti and 98 ppm B [56].
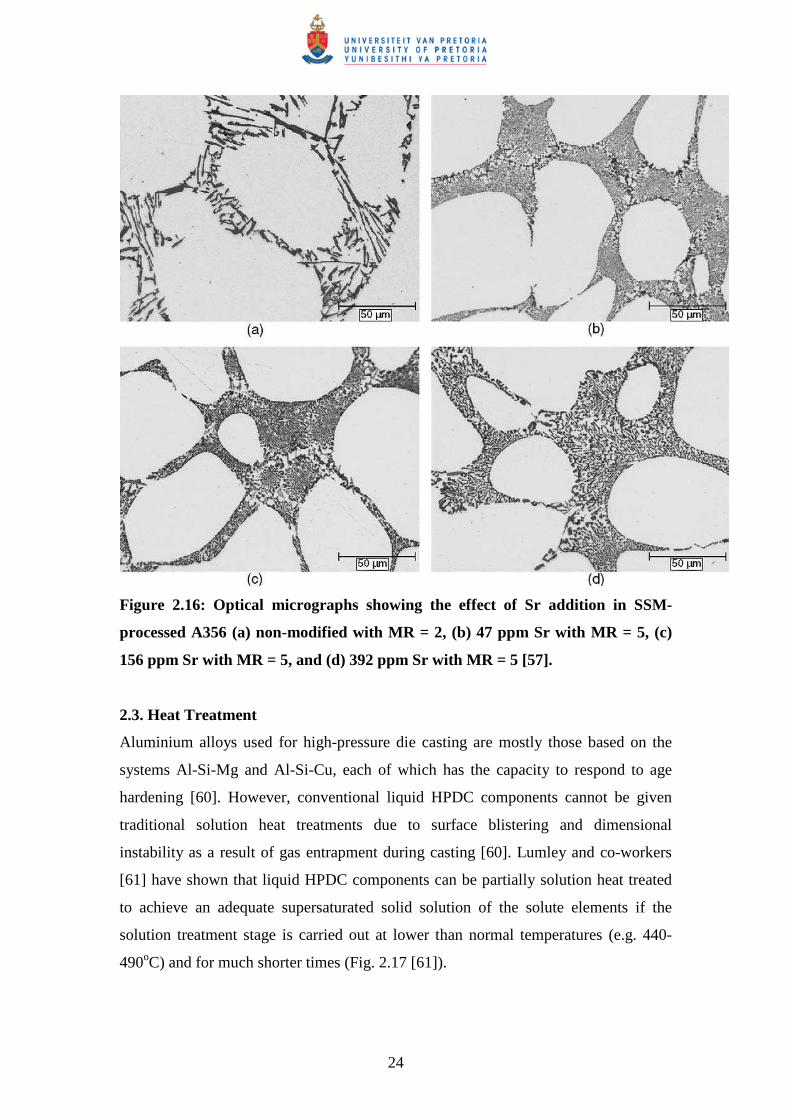
2.2.1.8. Strontium, Sodium and Antimony
The size and shape of the eutectic silicon particles can be modified with the addition
of strontium, sodium or antimony [6,9]. The use of sodium as the modifying agent
causes foundry problems because the fluidity of the melt is reduced. The major
23
difficulty is however its rapid and uncertain loss through evaporation or oxidation [9].
Additions of antimony at ~ 0.2% can also cause modification but result in a lamellar
rather than a fibrous eutectic [9]. Attention has therefore been directed at an
alternative method and modification is currently carried out mostly by using additions
of strontium (Fig. 2.16 [57]. The amounts of strontium needed range from 0.015 to
0.02% for hypoeutectic castings, but high cooling rates during solidification reduces
the amounts needed (Fig. 2.16(b)). Loss of strontium through volatilisation during
melting is less than sodium and the modified microstructure can be retained if the
alloys are remelted. Over-modification is not a significant problem, because excess
amounts are taken into compounds such as Al3SrSi3, Al2SiSr2 and Al4Si2Sr [9,57]. A
modification rating (MR) system classifies the eutectic Si structures commonly
observed in commercial Al-Si castings by a number from one to six [58]. Table 2.2
describes the MR system in more detail [59].
Table 2.2: Modification rating (MR) system for classification of eutectic Si
structures [59].
MR
number
Structure Description
1 Fully unmodified Si is present in the form of large plates as
well as in acicular form.
2 Lamellar A finer lamellar structure, though some
acicular Si may be present (but not large
plates).
3 Partially modified The lamellar structure starts to break up
into smaller pieces.
4 Absence of lamellae Complete disappearance of lamellar phase.
Some acicular phase may still be present.
5 Fibrous Si eutectic (Fully
modified)
The acicular phase is completely absent.
6 Very fine eutectic (Super
modified)
The fibrous Si becomes so small that
individual particles cannot be resolved with
optical microscopy.
24
Figure 2.16: Optical micrographs showing the effect of Sr addition in SSM-
processed A356 (a) non-modified with MR = 2, (b) 47 ppm Sr with MR = 5, (c)
156 ppm Sr with MR = 5, and (d) 392 ppm Sr with MR = 5 [57].
2.3. Heat Treatment
Aluminium alloys used for high-pressure die casting are mostly those based on the
systems Al-Si-Mg and Al-Si-Cu, each of which has the capacity to respond to age
hardening [60]. However, conventional liquid HPDC components cannot be given
traditional solution heat treatments due to surface blistering and dimensional
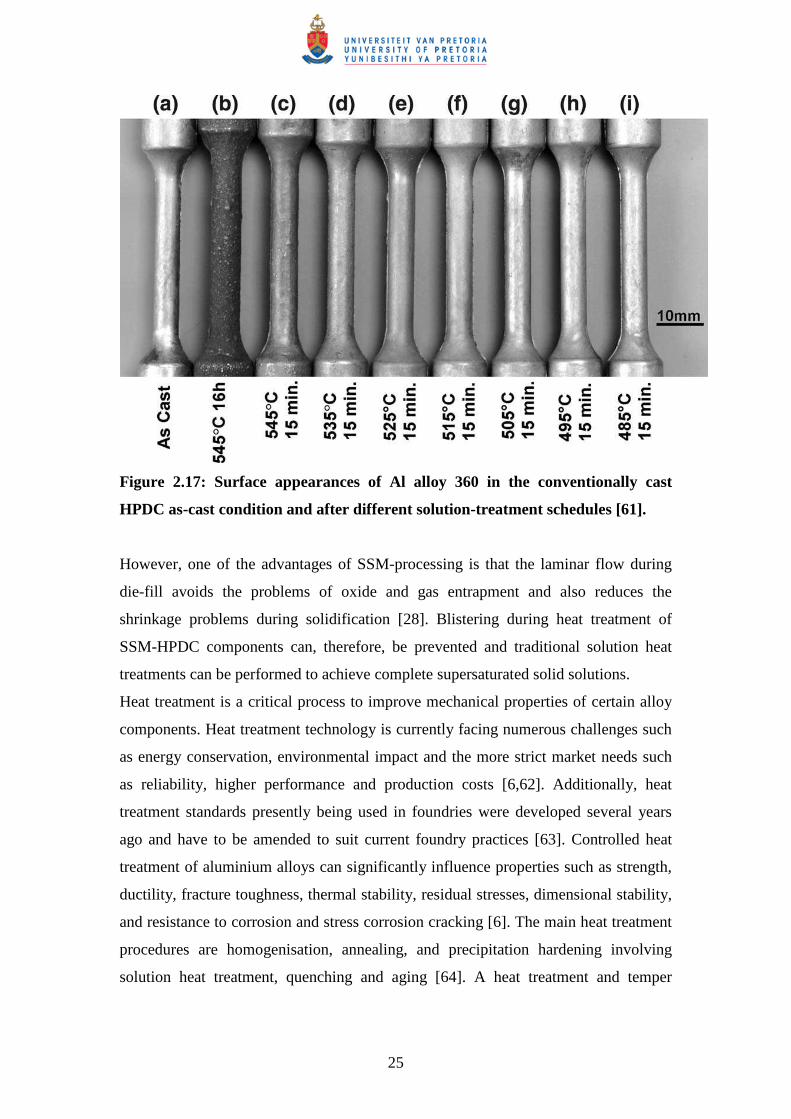
instability as a result of gas entrapment during casting [60]. Lumley and co-workers
[61] have shown that liquid HPDC components can be partially solution heat treated
to achieve an adequate supersaturated solid solution of the solute elements if the
solution treatment stage is carried out at lower than normal temperatures (e.g. 440-
490oC) and for much shorter times (Fig. 2.17 [61]).
25
Figure 2.17: Surface appearances of Al alloy 360 in the conventionally cast
HPDC as-cast condition and after different solution-treatment schedules [61].
However, one of the advantages of SSM-processing is that the laminar flow during
die-fill avoids the problems of oxide and gas entrapment and also reduces the
shrinkage problems during solidification [28]. Blistering during heat treatment of
SSM-HPDC components can, therefore, be prevented and traditional solution heat
treatments can be performed to achieve complete supersaturated solid solutions.
Heat treatment is a critical process to improve mechanical properties of certain alloy
components. Heat treatment technology is currently facing numerous challenges such
as energy conservation, environmental impact and the more strict market needs such
as reliability, higher performance and production costs [6,62]. Additionally, heat
treatment standards presently being used in foundries were developed several years
ago and have to be amended to suit current foundry practices [63]. Controlled heat
treatment of aluminium alloys can significantly influence properties such as strength,
ductility, fracture toughness, thermal stability, residual stresses, dimensional stability,
and resistance to corrosion and stress corrosion cracking [6]. The main heat treatment
procedures are homogenisation, annealing, and precipitation hardening involving
solution heat treatment, quenching and aging [64]. A heat treatment and temper
26
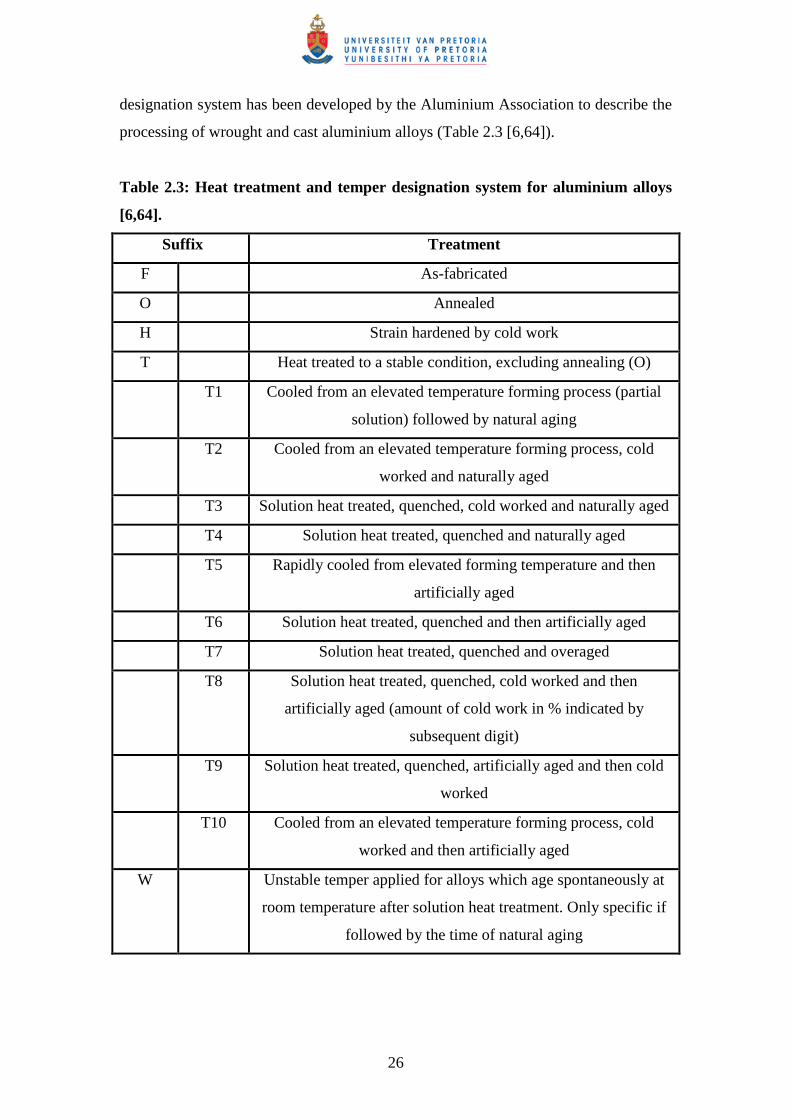
designation system has been developed by the Aluminium Association to describe the
processing of wrought and cast aluminium alloys (Table 2.3 [6,64]).
Table 2.3: Heat treatment and temper designation system for aluminium alloys
[6,64].
Suffix Treatment
F As-fabricated
O Annealed
H Strain hardened by cold work
T Heat treated to a stable condition, excluding annealing (O)
T1 Cooled from an elevated temperature forming process (partial
solution) followed by natural aging
T2 Cooled from an elevated temperature forming process, cold
worked and naturally aged
T3 Solution heat treated, quenched, cold worked and naturally aged
T4 Solution heat treated, quenched and naturally aged
T5 Rapidly cooled from elevated forming temperature and then
artificially aged
T6 Solution heat treated, quenched and then artificially aged
T7 Solution heat treated, quenched and overaged
T8 Solution heat treated, quenched, cold worked and then
artificially aged (amount of cold work in % indicated by
subsequent digit)
T9 Solution heat treated, quenched, artificially aged and then cold
worked
T10 Cooled from an elevated temperature forming process, cold
worked and then artificially aged
W Unstable temper applied for alloys which age spontaneously at
room temperature after solution heat treatment. Only specific if
followed by the time of natural aging
27
2.3.1. Solution heat treatment
A solution heat treatment is carried out at a sufficiently high temperature for
sufficiently long times to produce a nearly homogeneous solid solution [6]. The
temperature is determined based on the maximum solid solubility and composition
and is usually attained by heat treating near, but below, the eutectic temperature.
Temperature variations within ± 6°C are allowed in most cases, but may be even
stricter for some high-strength aluminium alloys [6]. Underheating can result in
incomplete solution and might reduce the strengthening potential of the alloy, but is
sometimes necessary for instance to avoid distortion and blistering in liquid HPDC
components [60,61]. Overheating can lead to incipient melting of low-melting point
phases (Fig. 2.13). The extent to which Mg and Si can be present in solid solution in
alloys A356/7 depends on the actual solution treatment temperature and alloy
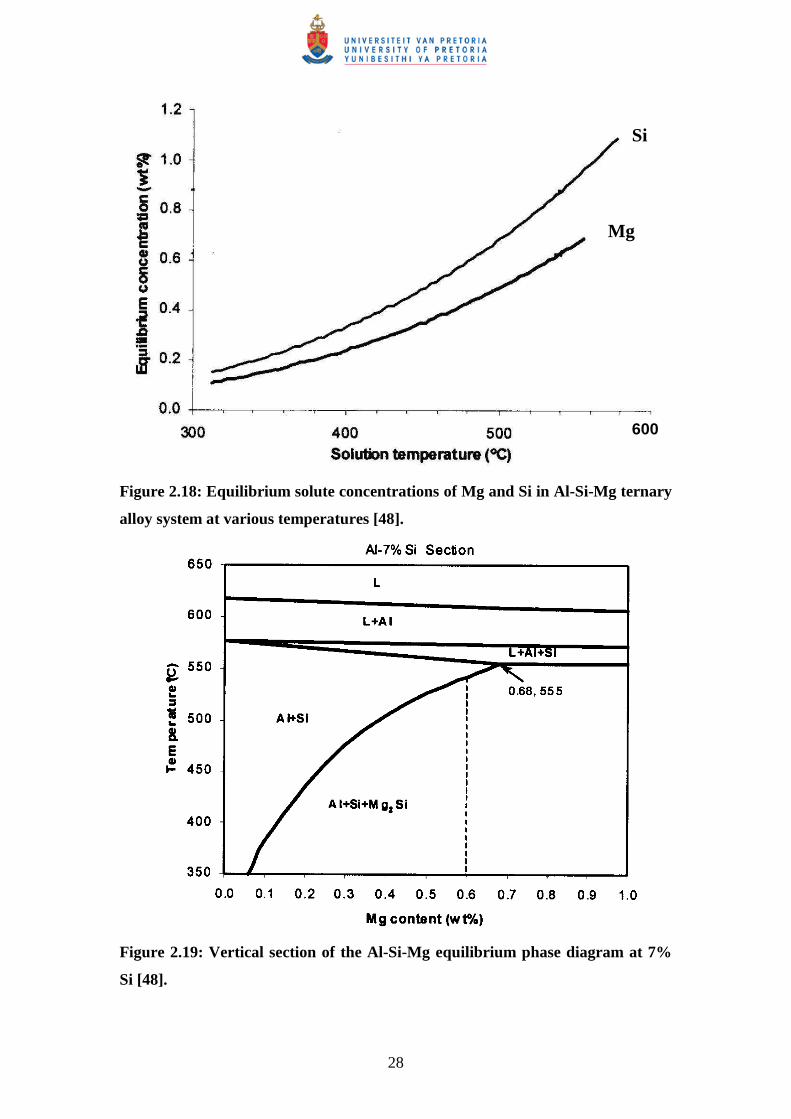
chemistry. Fig. 2.18 shows the equilibrium concentrations of Mg and Si versus
temperature in Al-Si-Mg ternary alloys in which both Si and Mg2Si phases are present
[48]. Figure 2.19 shows the 7% Si vertical section (as found in alloys A356/7) of the
Al-Si-Mg equilibrium phase diagram [48]. This shows that the maximum solubility of
Mg in this ternary alloy system is 0.68% at 555oC. This corresponds closely to the
maximum specification for alloy F357 of 0.70% in Table 2.1. Ohnishi and co-workers
[65] illustrated an increase in the extent of solutionizing (with a corresponding higher
strengthening potential of alloy A356) with an increase of solution treatment
temperature from 500 to 570oC. However, the most popular solution treatment
temperature employed for Al-7Si-Mg alloys is 540oC, which is 15oC below the
eutectic temperature [48]. From Fig. 2.18 it can be seen that the maximum solute
content of Mg and Si at 540oC should be 0.62 and 0.90% respectively. Using Fig.
2.19, it is seen that a 540oC solution treatment temperature would result in a
maximum Mg solute content of approximately 0.6% (dashed line).
28
Figure 2.18: Equilibrium solute concentrations of Mg and Si in Al-Si-Mg ternary
alloy system at various temperatures [48].
Figure 2.19: Vertical section of the Al-Si-Mg equilibrium phase diagram at 7%
Si [48].
Si
Mg
600
29
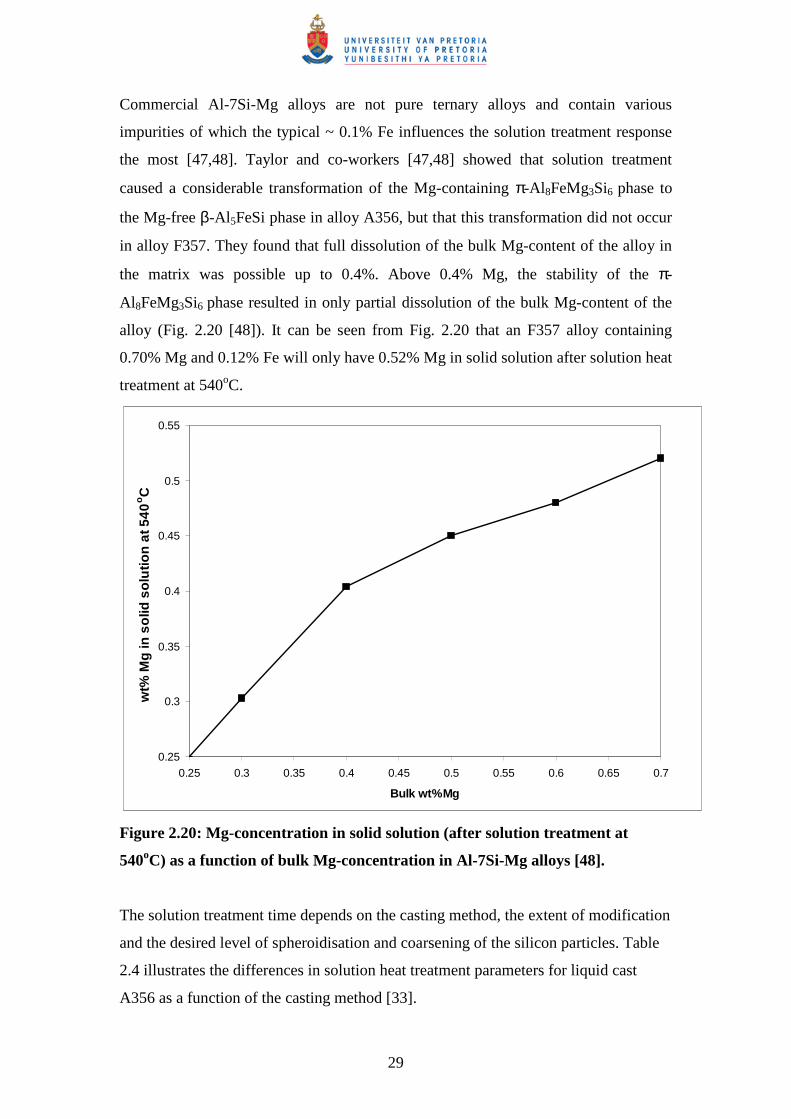
Commercial Al-7Si-Mg alloys are not pure ternary alloys and contain various
impurities of which the typical ~ 0.1% Fe influences the solution treatment response
the most [47,48]. Taylor and co-workers [47,48] showed that solution treatment
caused a considerable transformation of the Mg-containing π-Al 8FeMg3Si6 phase to
the Mg-free β-Al 5FeSi phase in alloy A356, but that this transformation did not occur
in alloy F357. They found that full dissolution of the bulk Mg-content of the alloy in
the matrix was possible up to 0.4%. Above 0.4% Mg, the stability of the π-
Al 8FeMg3Si6 phase resulted in only partial dissolution of the bulk Mg-content of the
alloy (Fig. 2.20 [48]). It can be seen from Fig. 2.20 that an F357 alloy containing
0.70% Mg and 0.12% Fe will only have 0.52% Mg in solid solution after solution heat
treatment at 540oC.
0.25
0.3
0.35
0.4
0.45
0.5
0.55
0.25 0.3 0.35 0.4 0.45 0.5 0.55 0.6 0.65 0.7
Bulk wt%Mg
wt%
Mg
in s
olid
so
lutio
n a
t 540
oC
Figure 2.20: Mg-concentration in solid solution (after solution treatment at
540oC) as a function of bulk Mg-concentration in Al-7Si-Mg alloys [48].
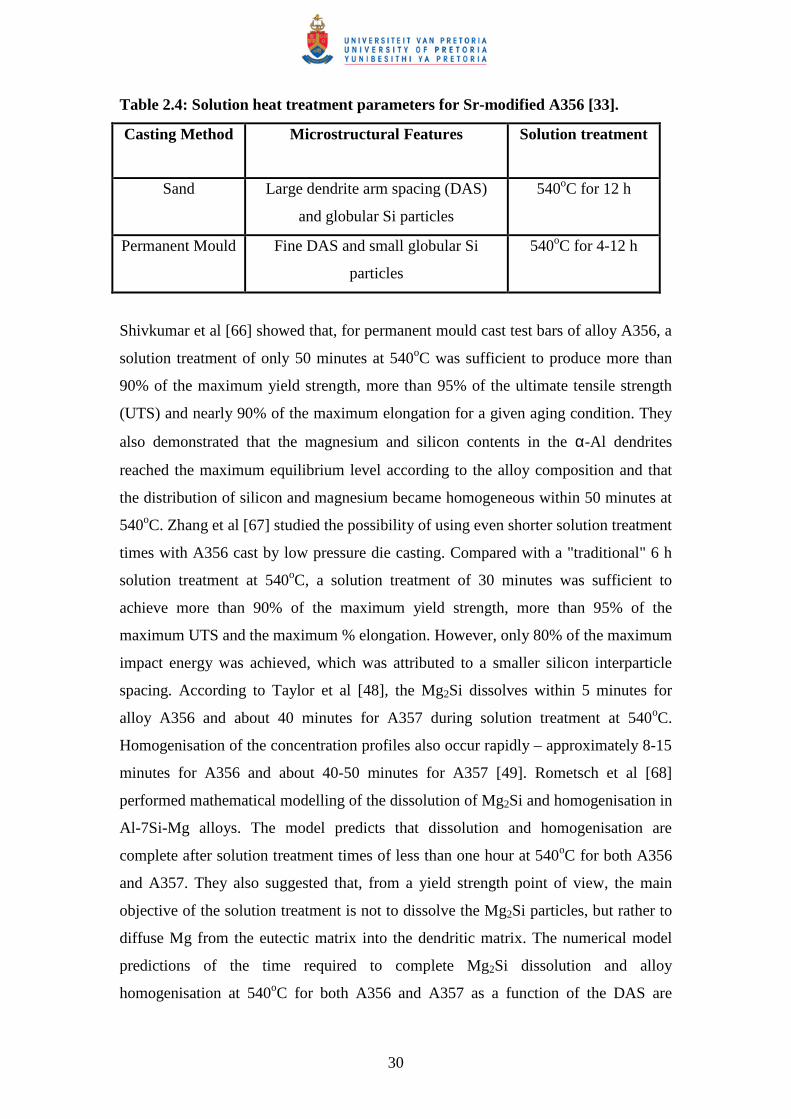
The solution treatment time depends on the casting method, the extent of modification
and the desired level of spheroidisation and coarsening of the silicon particles. Table
2.4 illustrates the differences in solution heat treatment parameters for liquid cast
A356 as a function of the casting method [33].
30
Table 2.4: Solution heat treatment parameters for Sr-modified A356 [33].
Casting Method Microstructural Features Solution treatment
Sand Large dendrite arm spacing (DAS)
and globular Si particles
540oC for 12 h
Permanent Mould Fine DAS and small globular Si
particles
540oC for 4-12 h
Shivkumar et al [66] showed that, for permanent mould cast test bars of alloy A356, a
solution treatment of only 50 minutes at 540oC was sufficient to produce more than
90% of the maximum yield strength, more than 95% of the ultimate tensile strength
(UTS) and nearly 90% of the maximum elongation for a given aging condition. They
also demonstrated that the magnesium and silicon contents in the α-Al dendrites
reached the maximum equilibrium level according to the alloy composition and that
the distribution of silicon and magnesium became homogeneous within 50 minutes at
540oC. Zhang et al [67] studied the possibility of using even shorter solution treatment
times with A356 cast by low pressure die casting. Compared with a "traditional" 6 h
solution treatment at 540oC, a solution treatment of 30 minutes was sufficient to
achieve more than 90% of the maximum yield strength, more than 95% of the
maximum UTS and the maximum % elongation. However, only 80% of the maximum
impact energy was achieved, which was attributed to a smaller silicon interparticle
spacing. According to Taylor et al [48], the Mg2Si dissolves within 5 minutes for
alloy A356 and about 40 minutes for A357 during solution treatment at 540oC.
Homogenisation of the concentration profiles also occur rapidly – approximately 8-15
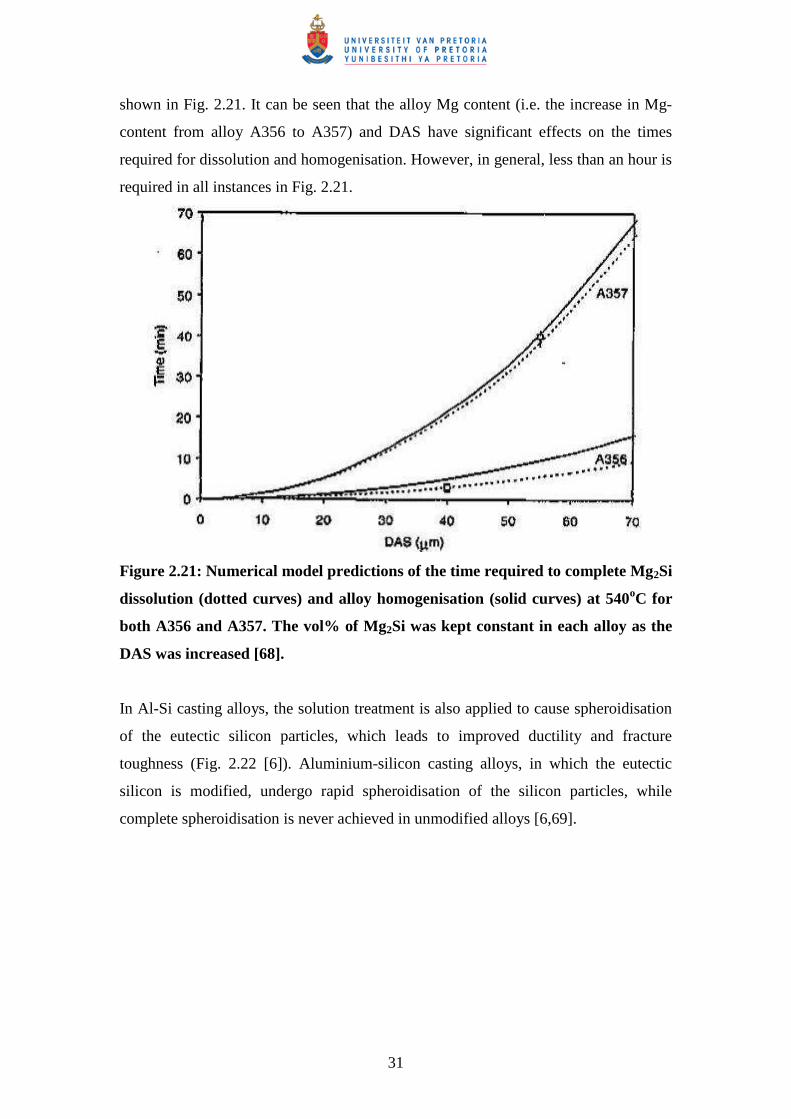
minutes for A356 and about 40-50 minutes for A357 [49]. Rometsch et al [68]
performed mathematical modelling of the dissolution of Mg2Si and homogenisation in
Al-7Si-Mg alloys. The model predicts that dissolution and homogenisation are
complete after solution treatment times of less than one hour at 540oC for both A356
and A357. They also suggested that, from a yield strength point of view, the main
objective of the solution treatment is not to dissolve the Mg2Si particles, but rather to
diffuse Mg from the eutectic matrix into the dendritic matrix. The numerical model
predictions of the time required to complete Mg2Si dissolution and alloy
homogenisation at 540oC for both A356 and A357 as a function of the DAS are
31
shown in Fig. 2.21. It can be seen that the alloy Mg content (i.e. the increase in Mg-
content from alloy A356 to A357) and DAS have significant effects on the times
required for dissolution and homogenisation. However, in general, less than an hour is
required in all instances in Fig. 2.21.
Figure 2.21: Numerical model predictions of the time required to complete Mg2Si
dissolution (dotted curves) and alloy homogenisation (solid curves) at 540oC for
both A356 and A357. The vol% of Mg2Si was kept constant in each alloy as the
DAS was increased [68].
In Al-Si casting alloys, the solution treatment is also applied to cause spheroidisation
of the eutectic silicon particles, which leads to improved ductility and fracture
toughness (Fig. 2.22 [6]). Aluminium-silicon casting alloys, in which the eutectic
silicon is modified, undergo rapid spheroidisation of the silicon particles, while
complete spheroidisation is never achieved in unmodified alloys [6,69].
32
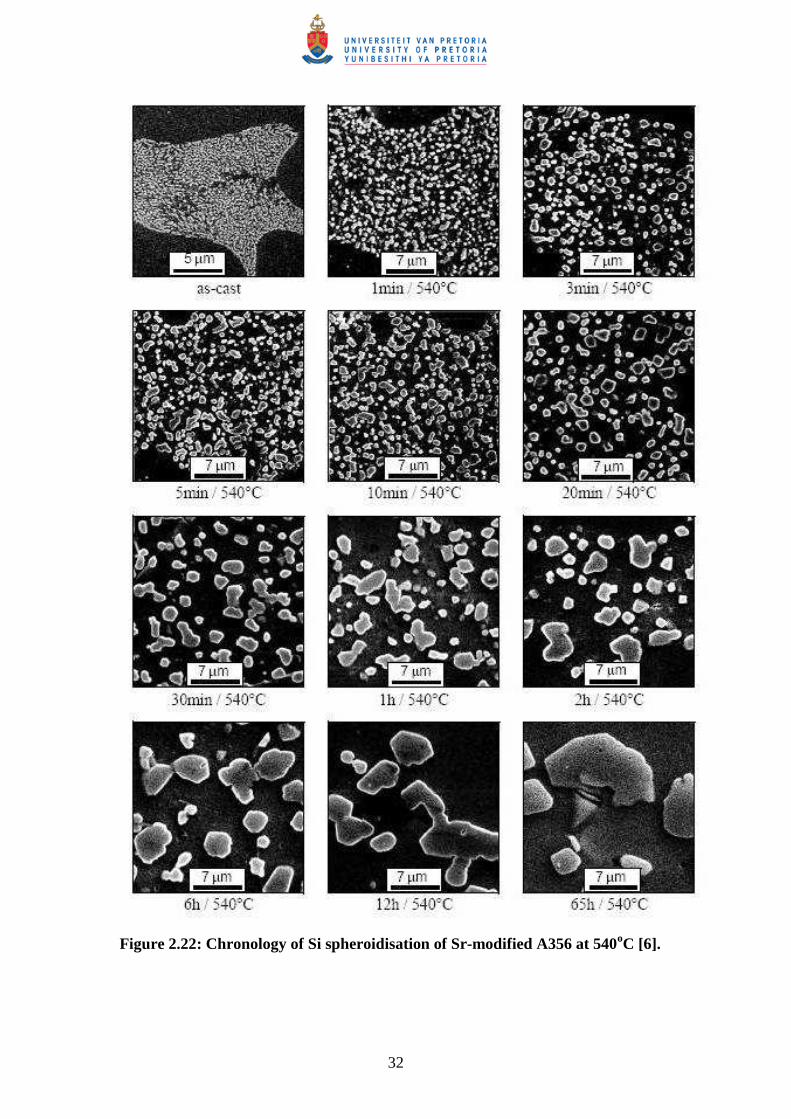
Figure 2.22: Chronology of Si spheroidisation of Sr-modified A356 at 540oC [6].
33
Detailed investigations on silicon spheroidisation in Sr-modified A356 by Ogris [6]
have shown that the disintegration and spheroidisation of the silicon coral branches is
complete within 3 minutes of soaking time between 500°C and 540°C (Fig. 2.22).
This is supported by the observation by Parker and co-workers [69] that
spheroidisation is complete in less than 10 minutes at 540oC.
It should be noted that, apart from chemical modification by additions of Sr, Na or Sb,
modification of eutectic Si-particles can also be achieved by high cooling rates during
solidification [57,59,70]. It is well known that the solidification rate during HPDC is
high [71] and lower levels of Sr are expected to be required to achieve modification
during SSM-HPDC of Al-7Si-Mg alloys (also see Fig. 2.16).
From the above discussion, it appears as if the frequently specified solution treatment
time of ≥ 6 h at 540oC is very conservative in terms of the times actually required to
achieve solute dissolution and Si-spheroidisation.
2.3.2. Quenching
Subsequent to solution heat treatment, the alloy must be cooled at a sufficiently high
rate to retain the solute in solid solution and to retain a high number of vacancies at
room temperature. High cooling rates associated with water quenching result in the
generation of thermal stresses leading to distortion and residual stresses, especially in
large castings with complex geometries [72]. Conversely, low cooling rates that
provide reduced levels of thermal stress, produce non-strengthening quench
precipitates (such as β′ and β in the Al-Mg-Si system), which ultimately reduce the
strength attainable after aging. An optimum balance between strength and thermal
stresses during quenching is therefore desired. Slower quenching rates can be
achieved by using water at 65-80°C, boiling water, polyalkylene glycol, forced air or
mist [72]. The average quench rates corresponding to different quench conditions, as
found by Zhang and Zheng [73], are listed in Table 2.5.
34
Table 2.5: The average quench rates in the temperature range of 450oC to 200oC
corresponding to different quenching conditions [73].
Quenching
condition
25oC
Water
60oC
Water
95oC
Water
Air Cool
Quench rate
(oC/s)
250 110 20 0.5
The sensitivity of alloys to quench rate and the allowable delay between solution heat
treatment and quenching is determined from quench factor analysis which is based on
avoiding the tip of the nose of the Continuous Cooling Transformation (CCT)
diagram. The 95% iso-yield strength contours for unmodified alloy A357 and wrought
alloy 6082 are presented in Figure 2.23 [74]. Alloy 6082, with almost the same β-
Mg2Si content as A357, is much less quench sensitive than A357. The relatively high
quench sensitivity of cast Al-7Si-Mg alloys is mainly due to the presence of Si
particles in the structure, which affects quench sensitivity in three ways: (1) Si in solid
solution diffuses to these particles, (2) particles serve as heterogeneous nucleation
sites for β-Mg2Si and (3) dislocation densities in dendrites of Al-7Si alloys are
expected to be high due to localised plastic strain from the mismatch of the coefficient
of thermal expansion (CTE) between Si and Al. Large differences in CTE between the
Al matrix and Si particles result in the generation of compressive residual stresses in
the particles and tensile residual stresses in the matrix during cooling from high
temperatures. Some of the CTE mismatch is accommodated by plastic relaxation in
the matrix, increasing its dislocation density, which provides more nucleation sites for
quench precipitates [74].
35
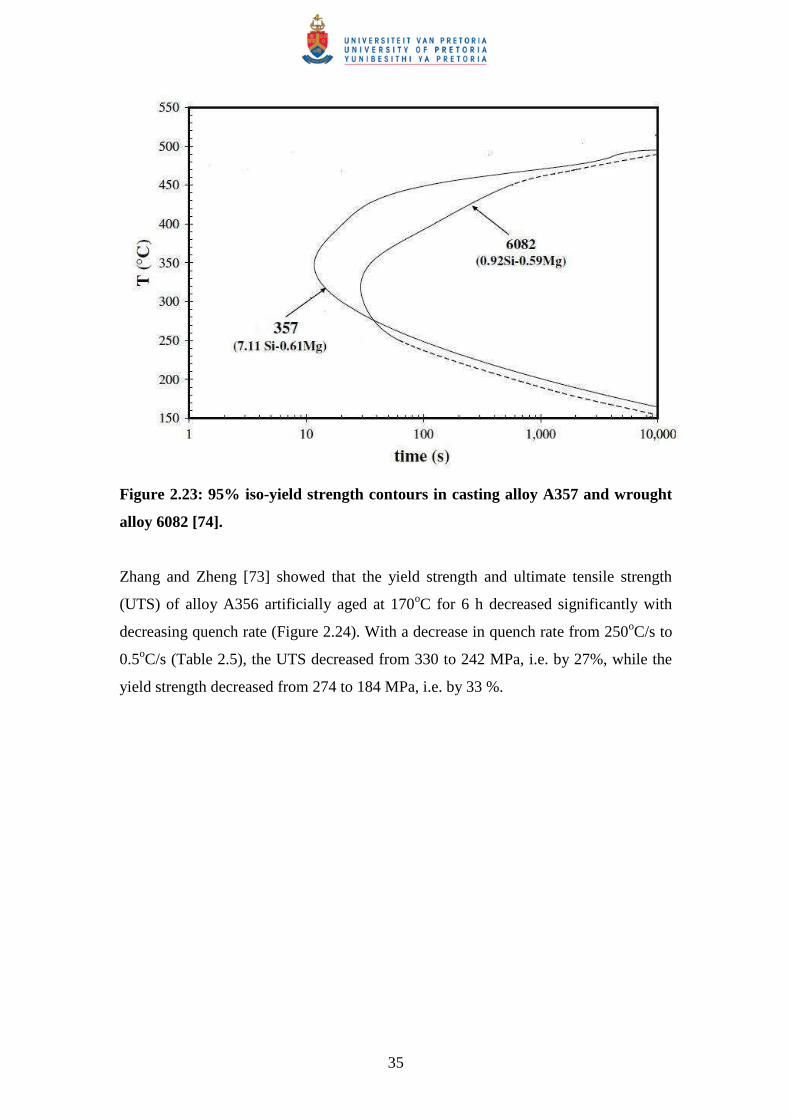
Figure 2.23: 95% iso-yield strength contours in casting alloy A357 and wrought
alloy 6082 [74].
Zhang and Zheng [73] showed that the yield strength and ultimate tensile strength
(UTS) of alloy A356 artificially aged at 170oC for 6 h decreased significantly with
decreasing quench rate (Figure 2.24). With a decrease in quench rate from 250oC/s to
0.5oC/s (Table 2.5), the UTS decreased from 330 to 242 MPa, i.e. by 27%, while the
yield strength decreased from 274 to 184 MPa, i.e. by 33 %.
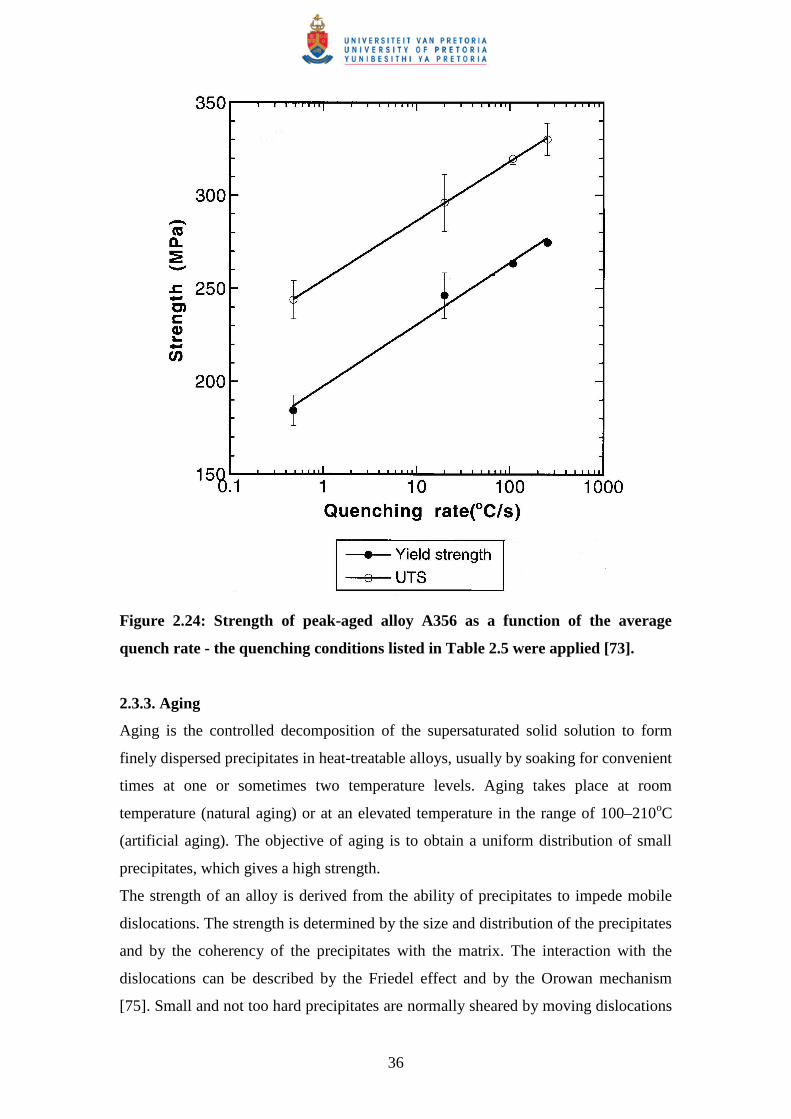
36
Figure 2.24: Strength of peak-aged alloy A356 as a function of the average
quench rate - the quenching conditions listed in Table 2.5 were applied [73].
2.3.3. Aging
Aging is the controlled decomposition of the supersaturated solid solution to form
finely dispersed precipitates in heat-treatable alloys, usually by soaking for convenient
times at one or sometimes two temperature levels. Aging takes place at room
temperature (natural aging) or at an elevated temperature in the range of 100–210oC
(artificial aging). The objective of aging is to obtain a uniform distribution of small
precipitates, which gives a high strength.
The strength of an alloy is derived from the ability of precipitates to impede mobile
dislocations. The strength is determined by the size and distribution of the precipitates
and by the coherency of the precipitates with the matrix. The interaction with the
dislocations can be described by the Friedel effect and by the Orowan mechanism
[75]. Small and not too hard precipitates are normally sheared by moving dislocations
37
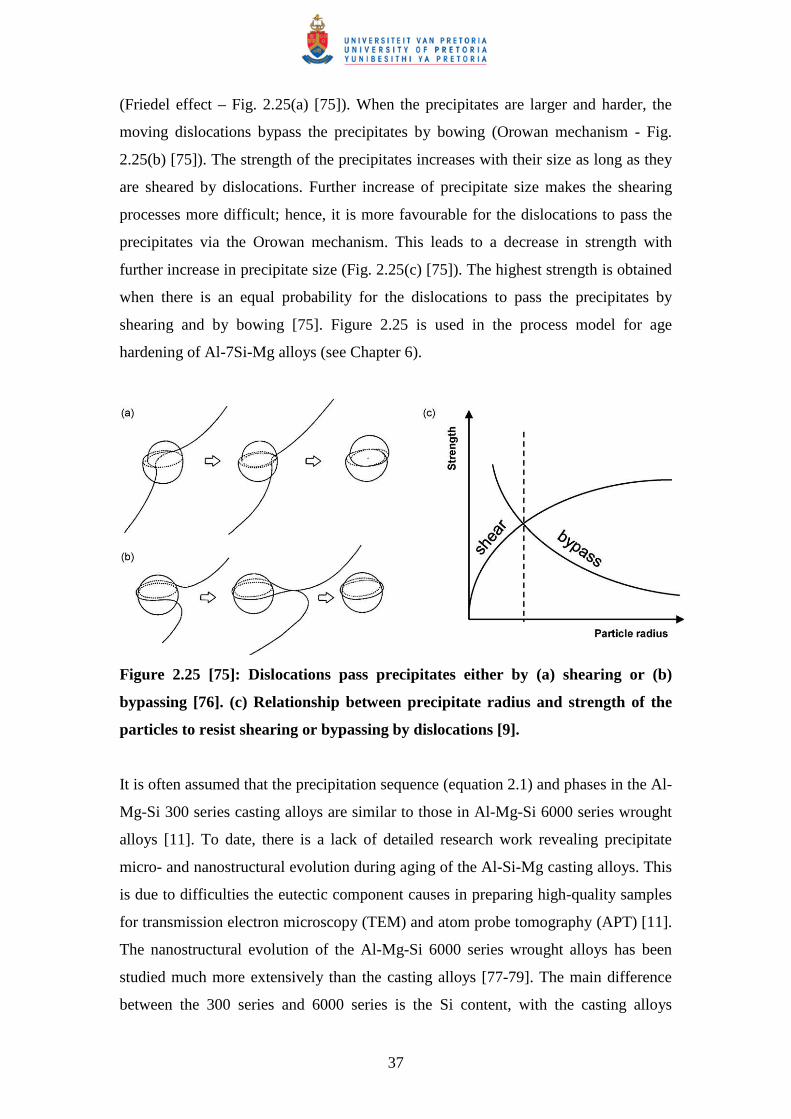
(Friedel effect – Fig. 2.25(a) [75]). When the precipitates are larger and harder, the
moving dislocations bypass the precipitates by bowing (Orowan mechanism - Fig.
2.25(b) [75]). The strength of the precipitates increases with their size as long as they
are sheared by dislocations. Further increase of precipitate size makes the shearing
processes more difficult; hence, it is more favourable for the dislocations to pass the
precipitates via the Orowan mechanism. This leads to a decrease in strength with
further increase in precipitate size (Fig. 2.25(c) [75]). The highest strength is obtained
when there is an equal probability for the dislocations to pass the precipitates by
shearing and by bowing [75]. Figure 2.25 is used in the process model for age
hardening of Al-7Si-Mg alloys (see Chapter 6).
Figure 2.25 [75]: Dislocations pass precipitates either by (a) shearing or (b)
bypassing [76]. (c) Relationship between precipitate radius and strength of the
particles to resist shearing or bypassing by dislocations [9].
It is often assumed that the precipitation sequence (equation 2.1) and phases in the Al-
Mg-Si 300 series casting alloys are similar to those in Al-Mg-Si 6000 series wrought
alloys [11]. To date, there is a lack of detailed research work revealing precipitate
micro- and nanostructural evolution during aging of the Al-Si-Mg casting alloys. This
is due to difficulties the eutectic component causes in preparing high-quality samples
for transmission electron microscopy (TEM) and atom probe tomography (APT) [11].
The nanostructural evolution of the Al-Mg-Si 6000 series wrought alloys has been
studied much more extensively than the casting alloys [77-79]. The main difference
between the 300 series and 6000 series is the Si content, with the casting alloys
38
containing a significantly higher quantity of this alloying element (Table 2.1). The
6000 series wrought alloys generally contain ≤ 1.5% Si and ≤ 1.2% Mg respectively
[80]. The following discussion on the aging characteristics of Al-Si-Mg alloys will
therefore also incorporate studies on the precipitation of the 6000 series wrought
alloys.
2.3.3.1. Natural aging
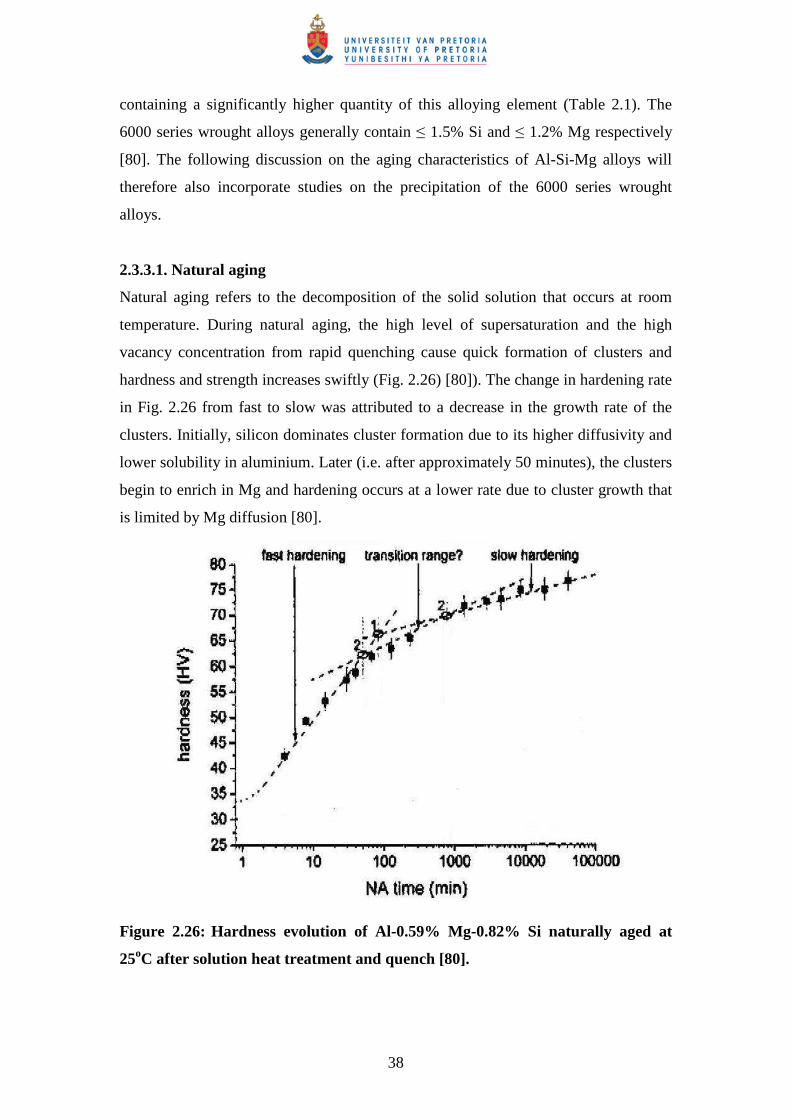
Natural aging refers to the decomposition of the solid solution that occurs at room
temperature. During natural aging, the high level of supersaturation and the high
vacancy concentration from rapid quenching cause quick formation of clusters and
hardness and strength increases swiftly (Fig. 2.26) [80]). The change in hardening rate
in Fig. 2.26 from fast to slow was attributed to a decrease in the growth rate of the
clusters. Initially, silicon dominates cluster formation due to its higher diffusivity and
lower solubility in aluminium. Later (i.e. after approximately 50 minutes), the clusters
begin to enrich in Mg and hardening occurs at a lower rate due to cluster growth that
is limited by Mg diffusion [80].
Figure 2.26: Hardness evolution of Al-0.59% Mg-0.82% Si naturally aged at
25oC after solution heat treatment and quench [80].
39
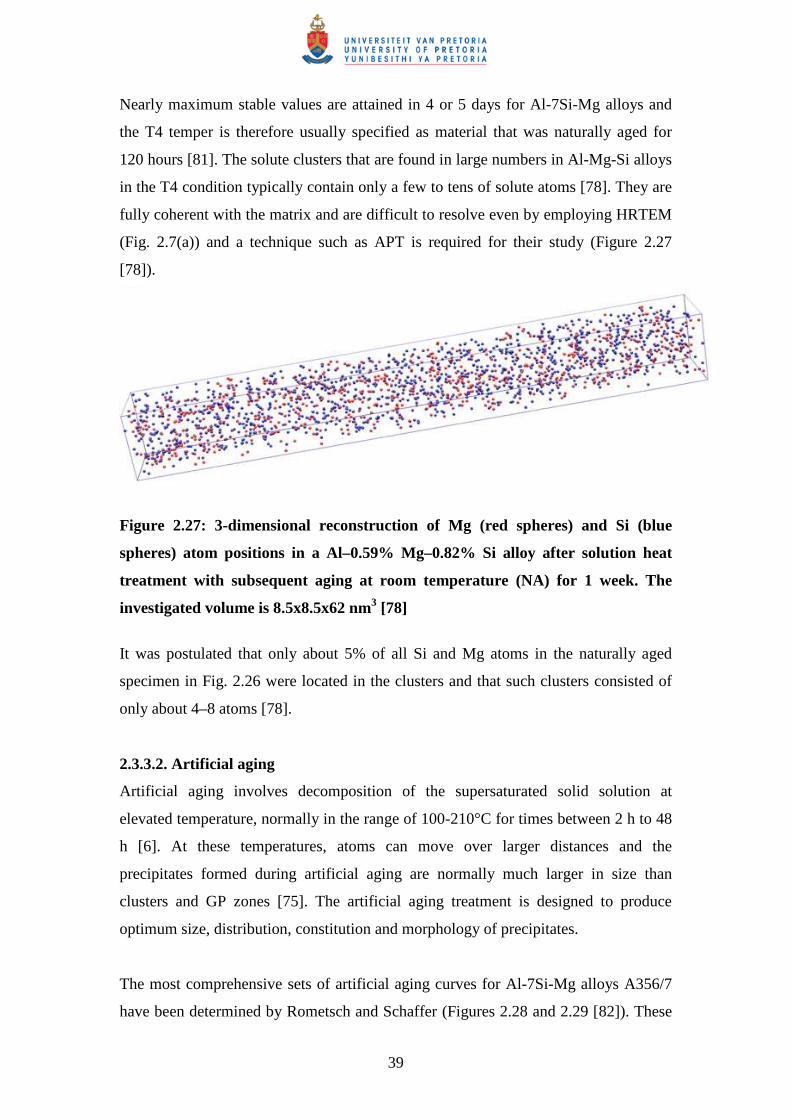
Nearly maximum stable values are attained in 4 or 5 days for Al-7Si-Mg alloys and
the T4 temper is therefore usually specified as material that was naturally aged for
120 hours [81]. The solute clusters that are found in large numbers in Al-Mg-Si alloys
in the T4 condition typically contain only a few to tens of solute atoms [78]. They are
fully coherent with the matrix and are difficult to resolve even by employing HRTEM
(Fig. 2.7(a)) and a technique such as APT is required for their study (Figure 2.27
[78]).
Figure 2.27: 3-dimensional reconstruction of Mg (red spheres) and Si (blue
spheres) atom positions in a Al–0.59% Mg–0.82% Si alloy after solution heat
treatment with subsequent aging at room temperature (NA) for 1 week. The
investigated volume is 8.5x8.5x62 nm3 [78]
It was postulated that only about 5% of all Si and Mg atoms in the naturally aged
specimen in Fig. 2.26 were located in the clusters and that such clusters consisted of
only about 4–8 atoms [78].
2.3.3.2. Artificial aging
Artificial aging involves decomposition of the supersaturated solid solution at
elevated temperature, normally in the range of 100-210°C for times between 2 h to 48
h [6]. At these temperatures, atoms can move over larger distances and the
precipitates formed during artificial aging are normally much larger in size than
clusters and GP zones [75]. The artificial aging treatment is designed to produce
optimum size, distribution, constitution and morphology of precipitates.
The most comprehensive sets of artificial aging curves for Al-7Si-Mg alloys A356/7
have been determined by Rometsch and Schaffer (Figures 2.28 and 2.29 [82]). These
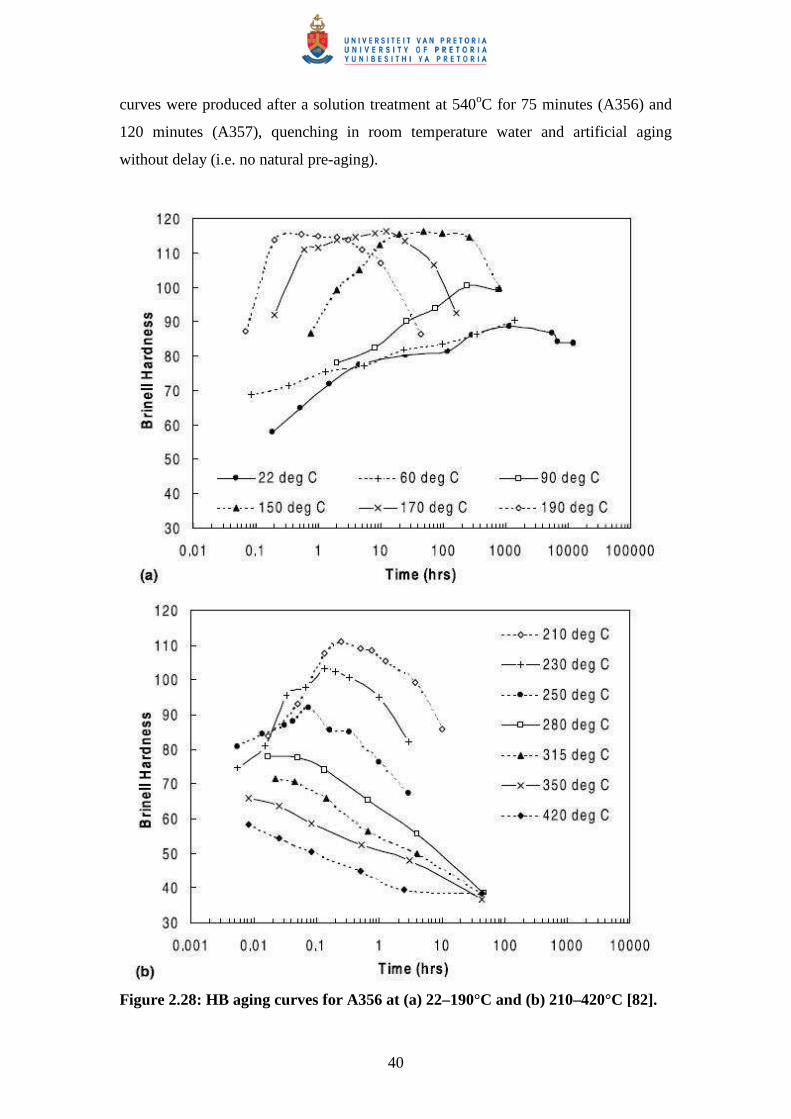
40
curves were produced after a solution treatment at 540oC for 75 minutes (A356) and
120 minutes (A357), quenching in room temperature water and artificial aging
without delay (i.e. no natural pre-aging).
Figure 2.28: HB aging curves for A356 at (a) 22–190°C and (b) 210–420°C [82].
41
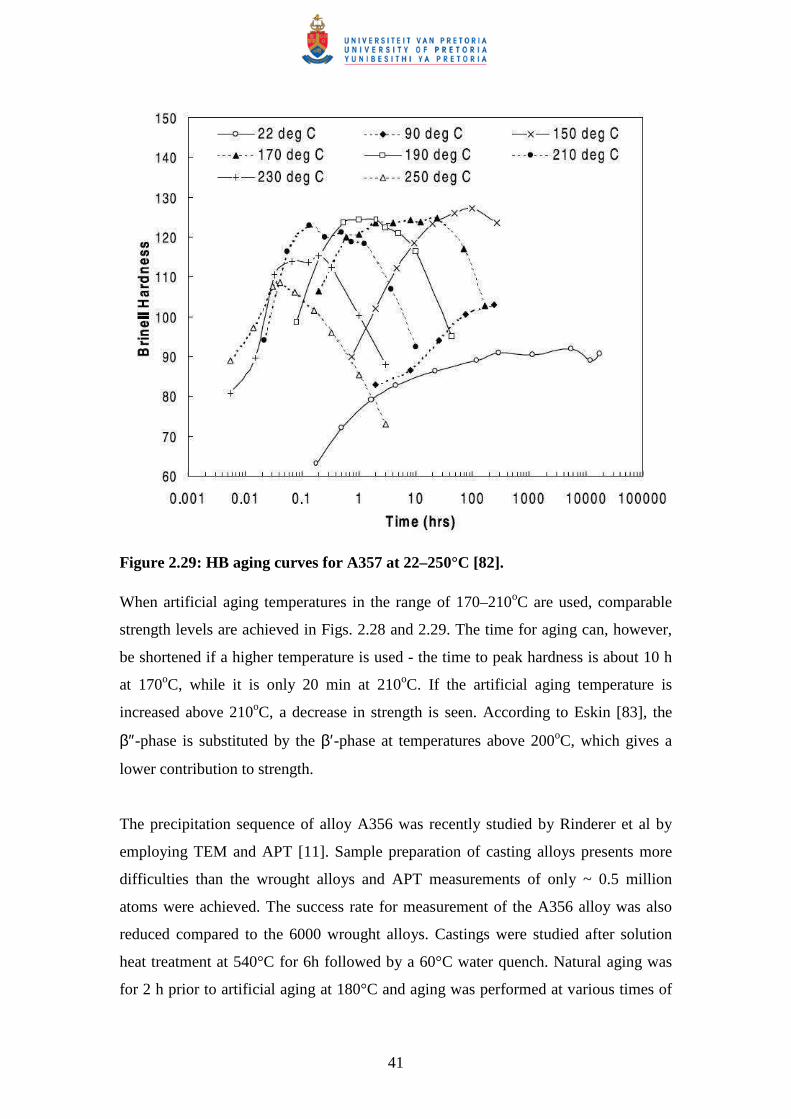
Figure 2.29: HB aging curves for A357 at 22–250°C [82].
When artificial aging temperatures in the range of 170–210oC are used, comparable
strength levels are achieved in Figs. 2.28 and 2.29. The time for aging can, however,
be shortened if a higher temperature is used - the time to peak hardness is about 10 h
at 170oC, while it is only 20 min at 210oC. If the artificial aging temperature is
increased above 210oC, a decrease in strength is seen. According to Eskin [83], the
β″-phase is substituted by the β′-phase at temperatures above 200oC, which gives a
lower contribution to strength.
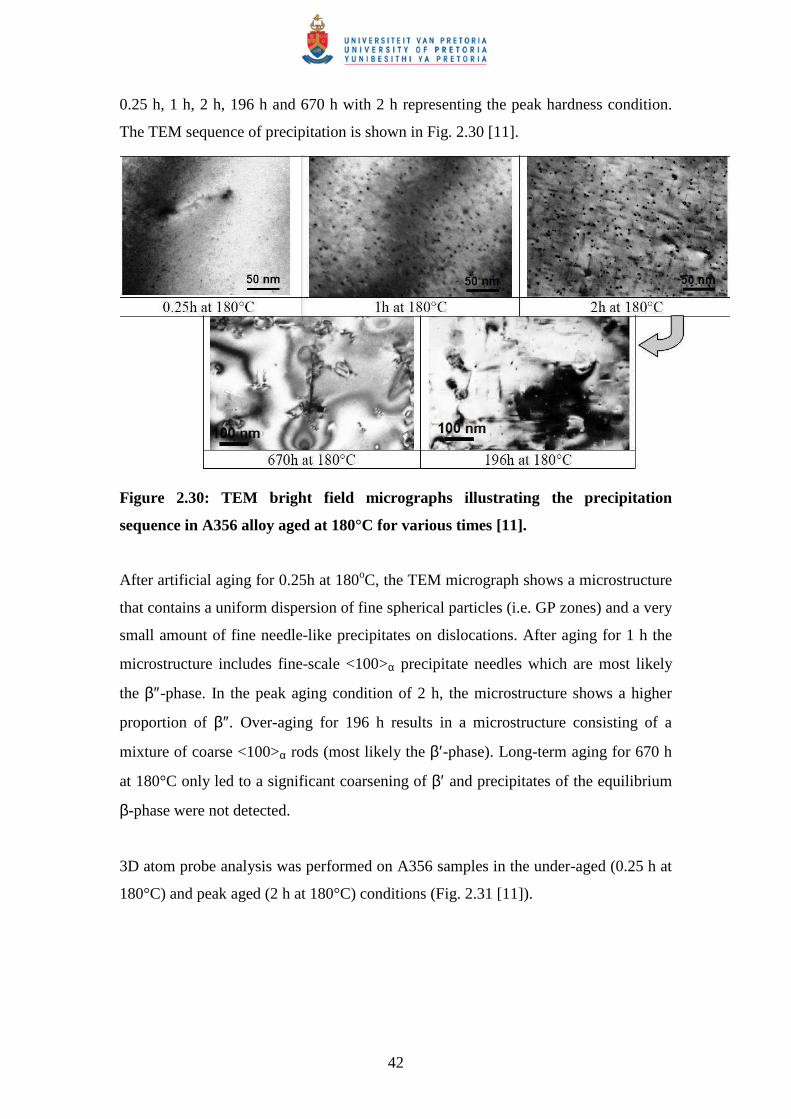
The precipitation sequence of alloy A356 was recently studied by Rinderer et al by
employing TEM and APT [11]. Sample preparation of casting alloys presents more
difficulties than the wrought alloys and APT measurements of only ~ 0.5 million
atoms were achieved. The success rate for measurement of the A356 alloy was also
reduced compared to the 6000 wrought alloys. Castings were studied after solution
heat treatment at 540°C for 6h followed by a 60°C water quench. Natural aging was
for 2 h prior to artificial aging at 180°C and aging was performed at various times of
42
0.25 h, 1 h, 2 h, 196 h and 670 h with 2 h representing the peak hardness condition.
The TEM sequence of precipitation is shown in Fig. 2.30 [11].
Figure 2.30: TEM bright field micrographs illustrating the precipitation
sequence in A356 alloy aged at 180°C for various times [11].
After artificial aging for 0.25h at 180oC, the TEM micrograph shows a microstructure
that contains a uniform dispersion of fine spherical particles (i.e. GP zones) and a very
small amount of fine needle-like precipitates on dislocations. After aging for 1 h the
microstructure includes fine-scale <100>α precipitate needles which are most likely
the β″-phase. In the peak aging condition of 2 h, the microstructure shows a higher
proportion of β″. Over-aging for 196 h results in a microstructure consisting of a
mixture of coarse <100>α rods (most likely the β′-phase). Long-term aging for 670 h
at 180°C only led to a significant coarsening of β′ and precipitates of the equilibrium
β-phase were not detected.
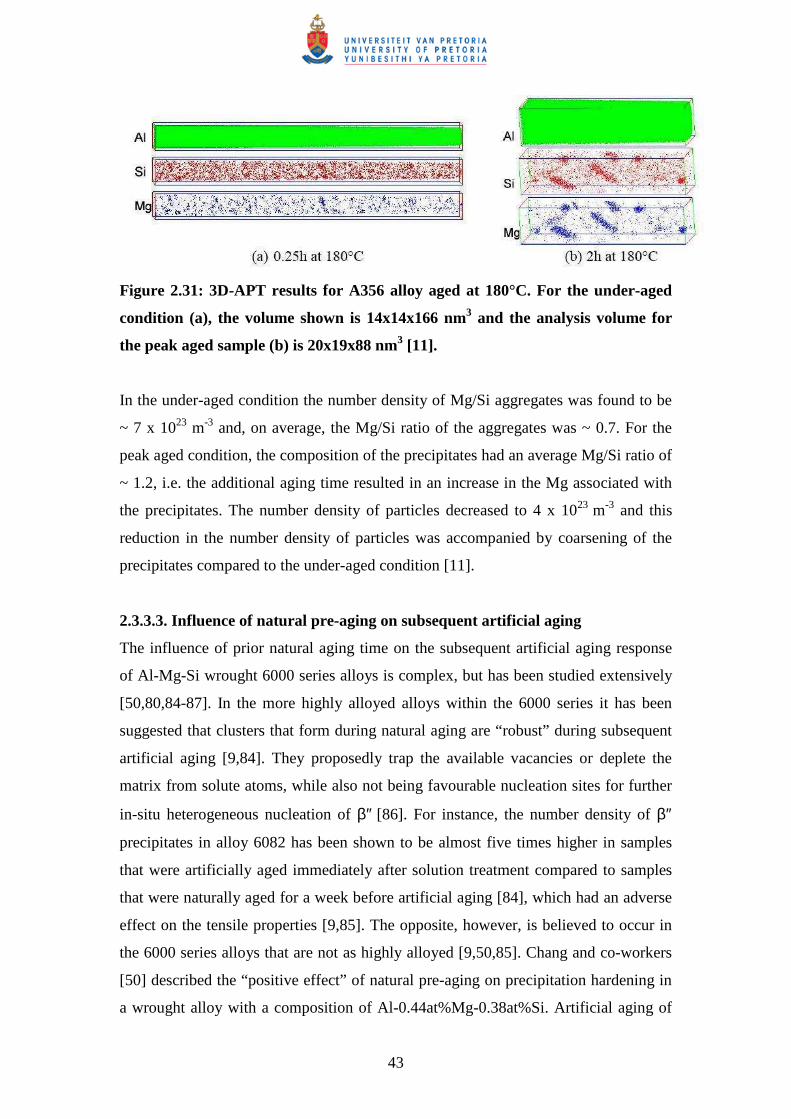
3D atom probe analysis was performed on A356 samples in the under-aged (0.25 h at
180°C) and peak aged (2 h at 180°C) conditions (Fig. 2.31 [11]).
43
Figure 2.31: 3D-APT results for A356 alloy aged at 180°C. For the under-aged
condition (a), the volume shown is 14x14x166 nm3 and the analysis volume for
the peak aged sample (b) is 20x19x88 nm3 [11].
In the under-aged condition the number density of Mg/Si aggregates was found to be
~ 7 x 10²³ m-3 and, on average, the Mg/Si ratio of the aggregates was ~ 0.7. For the
peak aged condition, the composition of the precipitates had an average Mg/Si ratio of
~ 1.2, i.e. the additional aging time resulted in an increase in the Mg associated with
the precipitates. The number density of particles decreased to 4 x 10²³ m-3 and this
reduction in the number density of particles was accompanied by coarsening of the
precipitates compared to the under-aged condition [11].
2.3.3.3. Influence of natural pre-aging on subsequent artificial aging
The influence of prior natural aging time on the subsequent artificial aging response
of Al-Mg-Si wrought 6000 series alloys is complex, but has been studied extensively
[50,80,84-87]. In the more highly alloyed alloys within the 6000 series it has been
suggested that clusters that form during natural aging are “robust” during subsequent
artificial aging [9,84]. They proposedly trap the available vacancies or deplete the
matrix from solute atoms, while also not being favourable nucleation sites for further
in-situ heterogeneous nucleation of β″ [86]. For instance, the number density of β″
precipitates in alloy 6082 has been shown to be almost five times higher in samples
that were artificially aged immediately after solution treatment compared to samples
that were naturally aged for a week before artificial aging [84], which had an adverse
effect on the tensile properties [9,85]. The opposite, however, is believed to occur in
the 6000 series alloys that are not as highly alloyed [9,50,85]. Chang and co-workers
[50] described the “positive effect” of natural pre-aging on precipitation hardening in
a wrought alloy with a composition of Al-0.44at%Mg-0.38at%Si. Artificial aging of
44
naturally aged samples increased the value of the peak hardness which was attributed
to an increase in the number density of β″ needle-like precipitates as compared to
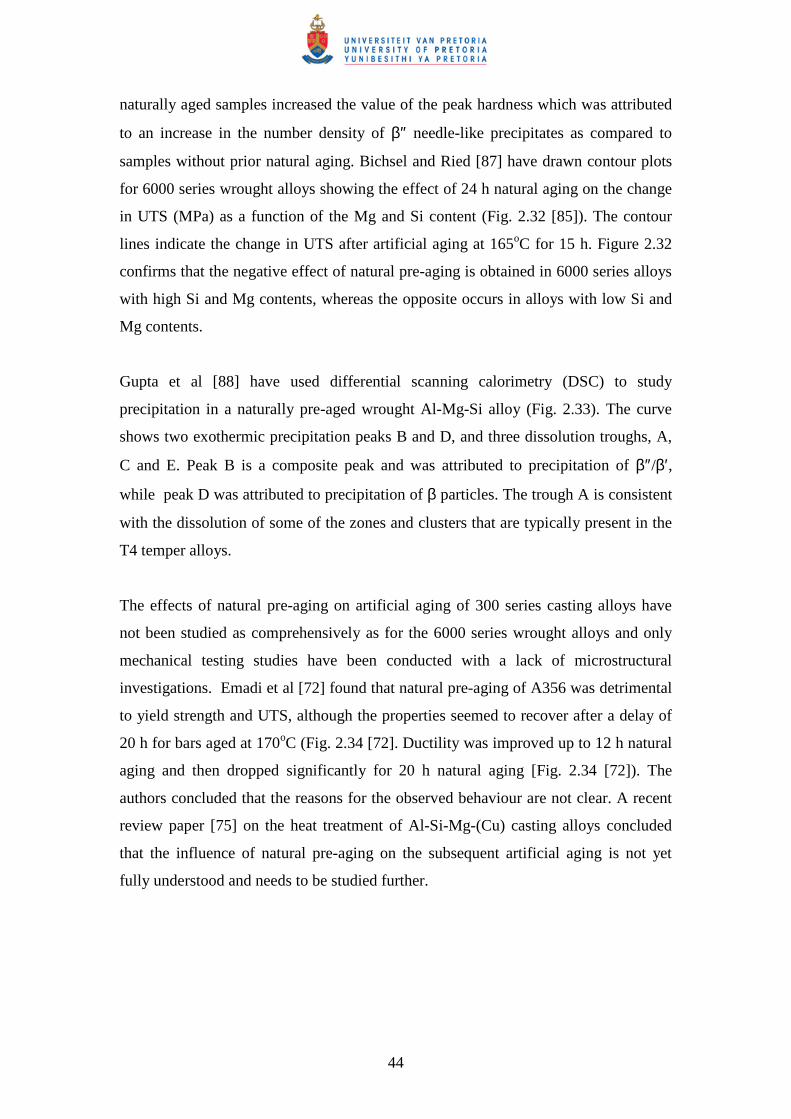
samples without prior natural aging. Bichsel and Ried [87] have drawn contour plots
for 6000 series wrought alloys showing the effect of 24 h natural aging on the change
in UTS (MPa) as a function of the Mg and Si content (Fig. 2.32 [85]). The contour
lines indicate the change in UTS after artificial aging at 165oC for 15 h. Figure 2.32
confirms that the negative effect of natural pre-aging is obtained in 6000 series alloys
with high Si and Mg contents, whereas the opposite occurs in alloys with low Si and
Mg contents.
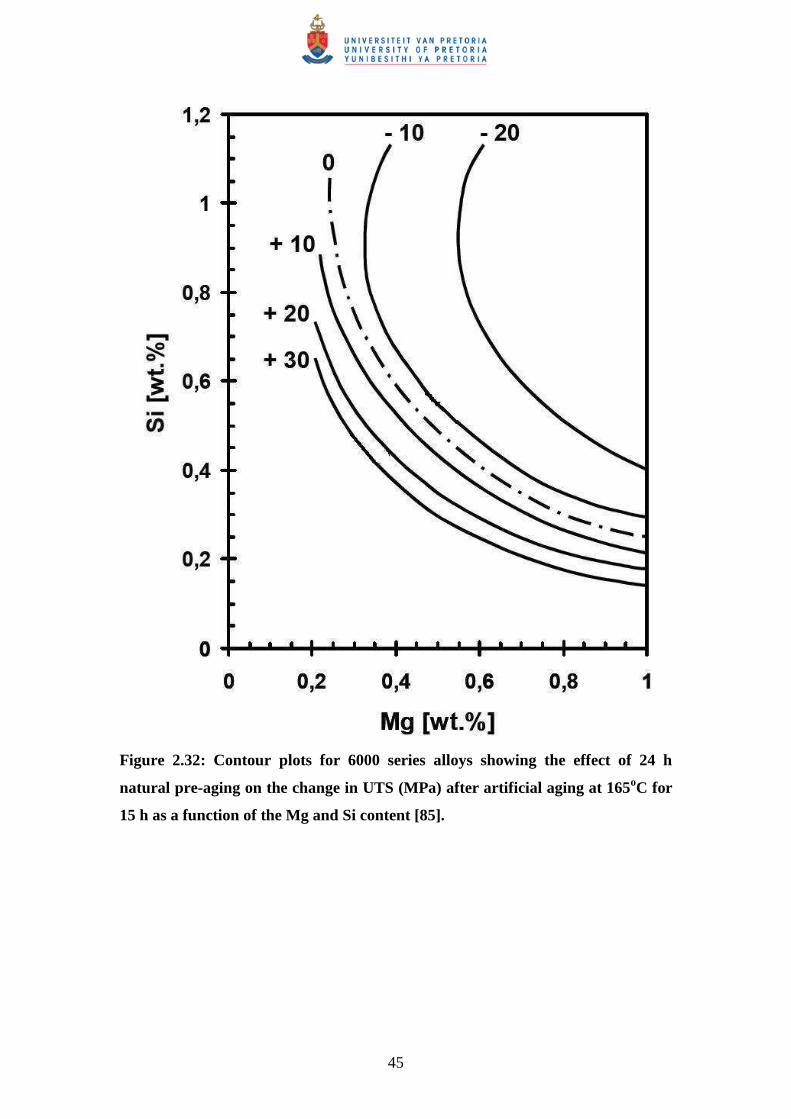
Gupta et al [88] have used differential scanning calorimetry (DSC) to study
precipitation in a naturally pre-aged wrought Al-Mg-Si alloy (Fig. 2.33). The curve
shows two exothermic precipitation peaks B and D, and three dissolution troughs, A,
C and E. Peak B is a composite peak and was attributed to precipitation of β″/β′,
while peak D was attributed to precipitation of β particles. The trough A is consistent
with the dissolution of some of the zones and clusters that are typically present in the
T4 temper alloys.
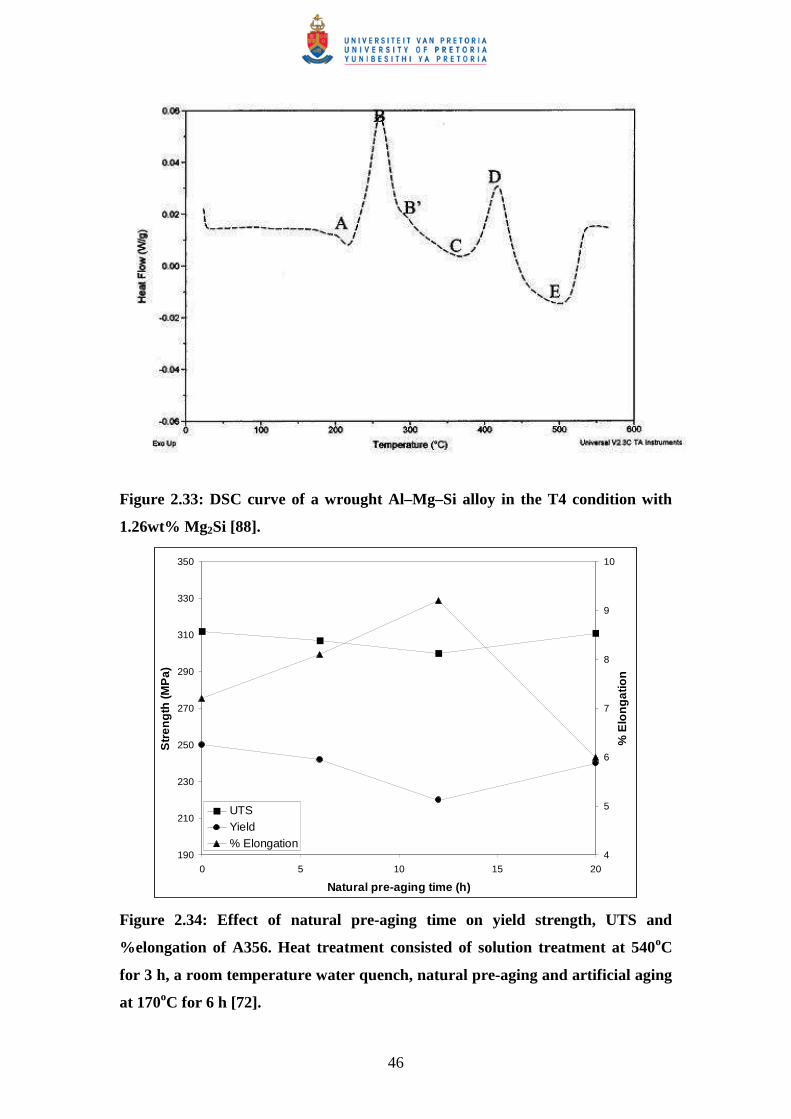
The effects of natural pre-aging on artificial aging of 300 series casting alloys have
not been studied as comprehensively as for the 6000 series wrought alloys and only
mechanical testing studies have been conducted with a lack of microstructural
investigations. Emadi et al [72] found that natural pre-aging of A356 was detrimental
to yield strength and UTS, although the properties seemed to recover after a delay of
20 h for bars aged at 170oC (Fig. 2.34 [72]. Ductility was improved up to 12 h natural
aging and then dropped significantly for 20 h natural aging [Fig. 2.34 [72]). The
authors concluded that the reasons for the observed behaviour are not clear. A recent
review paper [75] on the heat treatment of Al-Si-Mg-(Cu) casting alloys concluded
that the influence of natural pre-aging on the subsequent artificial aging is not yet
fully understood and needs to be studied further.
45
Figure 2.32: Contour plots for 6000 series alloys showing the effect of 24 h
natural pre-aging on the change in UTS (MPa) after artificial aging at 165oC for
15 h as a function of the Mg and Si content [85].
46
Figure 2.33: DSC curve of a wrought Al–Mg–Si alloy in the T4 condition with
1.26wt% Mg2Si [88].
190
210
230
250
270
290
310
330
350
0 5 10 15 20
Natural pre-aging time (h)
Str
eng
th (M
Pa)
4
5
6
7
8
9
10
% E
lon
gat
ion
UTS Yield% Elongation
Figure 2.34: Effect of natural pre-aging time on yield strength, UTS and
%elongation of A356. Heat treatment consisted of solution treatment at 540oC
for 3 h, a room temperature water quench, natural pre-aging and artificial aging
at 170oC for 6 h [72].
47
2.3.3.4. Heat treatment response of SSM-processed Al-7Si-Mg alloys in
comparison with conventional liquid cast alloys
According to Dewhirst [12], after the mechanisms for SSM heat treatment were
commercialised, the first heat treatments applied to it were essentially those already in
use for dendritic materials. These treatment regimes are not necessarily the optimal
ones as the different microstructure and solidification history of SSM components
should be considered.
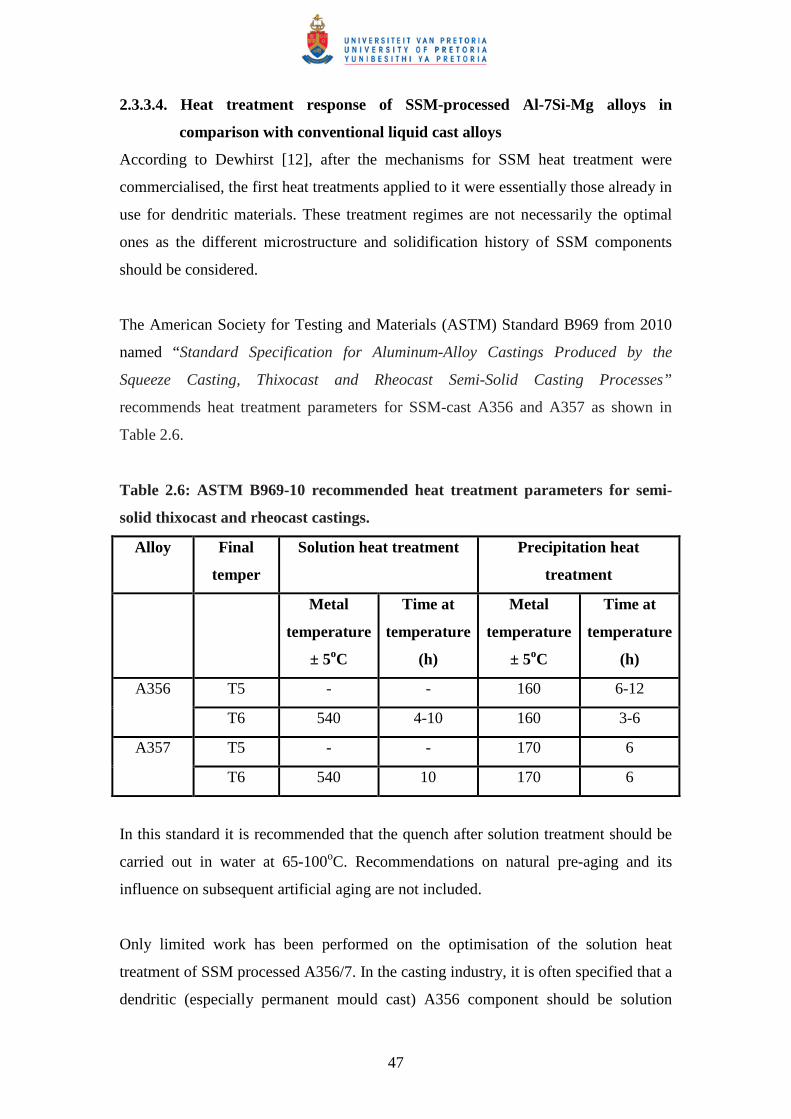
The American Society for Testing and Materials (ASTM) Standard B969 from 2010
named “Standard Specification for Aluminum-Alloy Castings Produced by the
Squeeze Casting, Thixocast and Rheocast Semi-Solid Casting Processes”
recommends heat treatment parameters for SSM-cast A356 and A357 as shown in
Table 2.6.
Table 2.6: ASTM B969-10 recommended heat treatment parameters for semi-
solid thixocast and rheocast castings.
Alloy Final
temper
Solution heat treatment Precipitation heat
treatment
Metal
temperature
± 5oC
Time at
temperature
(h)
Metal
temperature
± 5oC
Time at
temperature
(h)
T5 - - 160 6-12 A356
T6 540 4-10 160 3-6
T5 - - 170 6 A357
T6 540 10 170 6
In this standard it is recommended that the quench after solution treatment should be
carried out in water at 65-100oC. Recommendations on natural pre-aging and its
influence on subsequent artificial aging are not included.
Only limited work has been performed on the optimisation of the solution heat
treatment of SSM processed A356/7. In the casting industry, it is often specified that a
dendritic (especially permanent mould cast) A356 component should be solution
48
treated for 6 hours at 540oC [67]. This has also been the most popular solution heat
treatment used for SSM-processed A356 [81,89]. According to Dewhirst [12], the
time needed for the solution treatment for semi-solid metal processed A356 should be
less than for dendritic A356 due to shorter diffusion paths (due to a globular
microstructure) and because the thermal history of SSM-processed components
promotes enhanced solutionising before heat treatment commences. Rosso and Actis
Grande [90] proposed that a solution heat treatment of 1 hour at 540oC is sufficient to
obtain a high level of properties in the T6 temper. A solution treatment of only 30
minutes caused the presence of brittle intermetallic phases due to an incomplete
solution process. According to Dewhirst [12], the optimum solution treatment time at
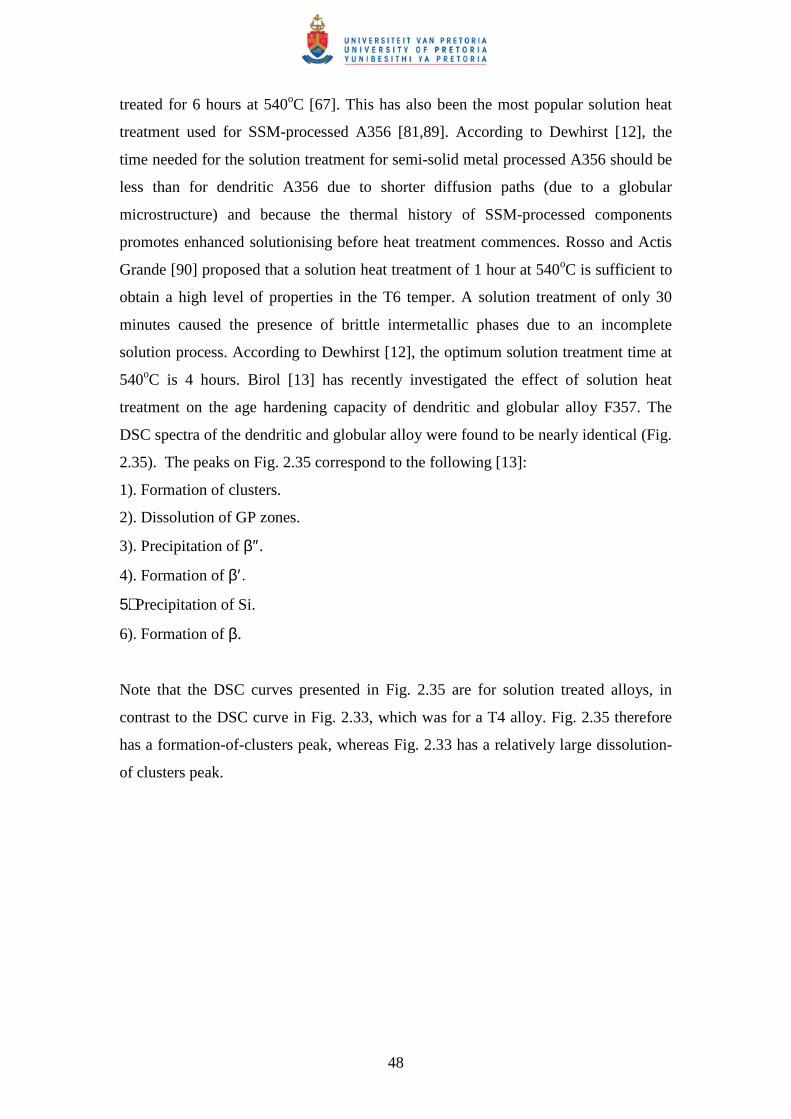
540oC is 4 hours. Birol [13] has recently investigated the effect of solution heat
treatment on the age hardening capacity of dendritic and globular alloy F357. The
DSC spectra of the dendritic and globular alloy were found to be nearly identical (Fig.
2.35). The peaks on Fig. 2.35 correspond to the following [13]:
1). Formation of clusters.
2). Dissolution of GP zones.
3). Precipitation of β″.
4). Formation of β′.
5). Precipitation of Si.
6). Formation of β.
Note that the DSC curves presented in Fig. 2.35 are for solution treated alloys, in
contrast to the DSC curve in Fig. 2.33, which was for a T4 alloy. Fig. 2.35 therefore
has a formation-of-clusters peak, whereas Fig. 2.33 has a relatively large dissolution-
of clusters peak.
49
Figure 2.35: DSC scans of (a) dendritic and (b) globular F357 alloy after soaking
at 540oC for different times [13].
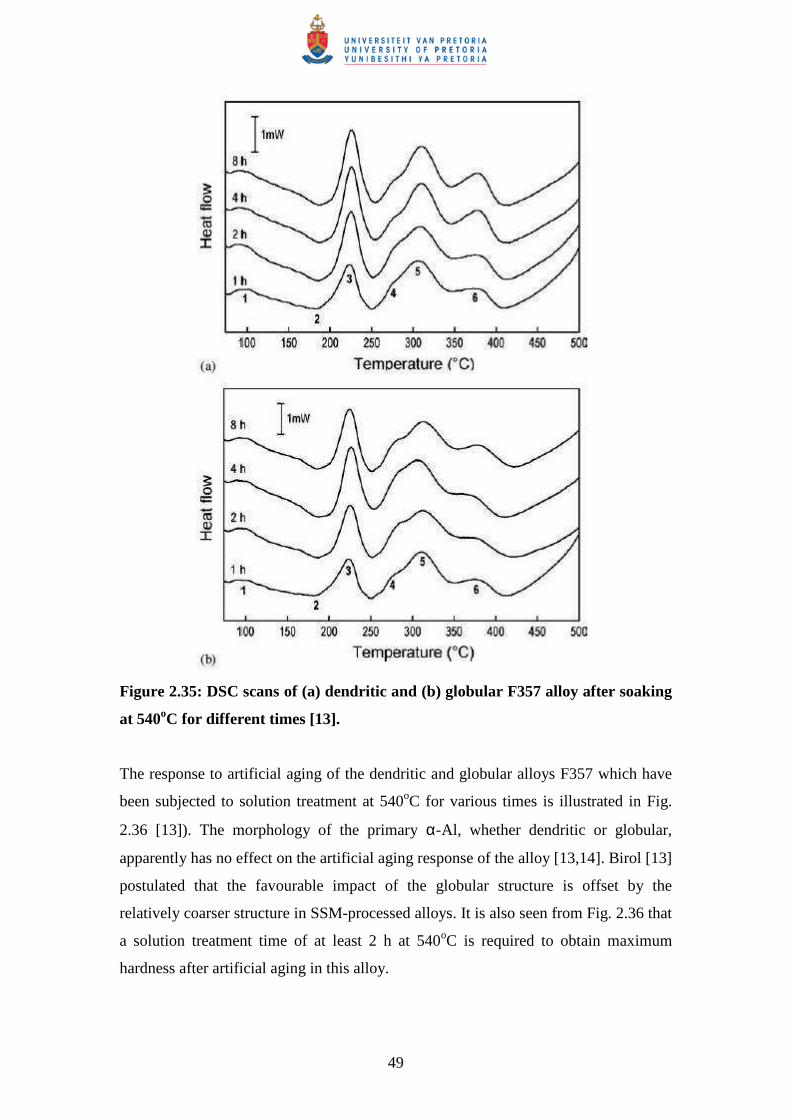
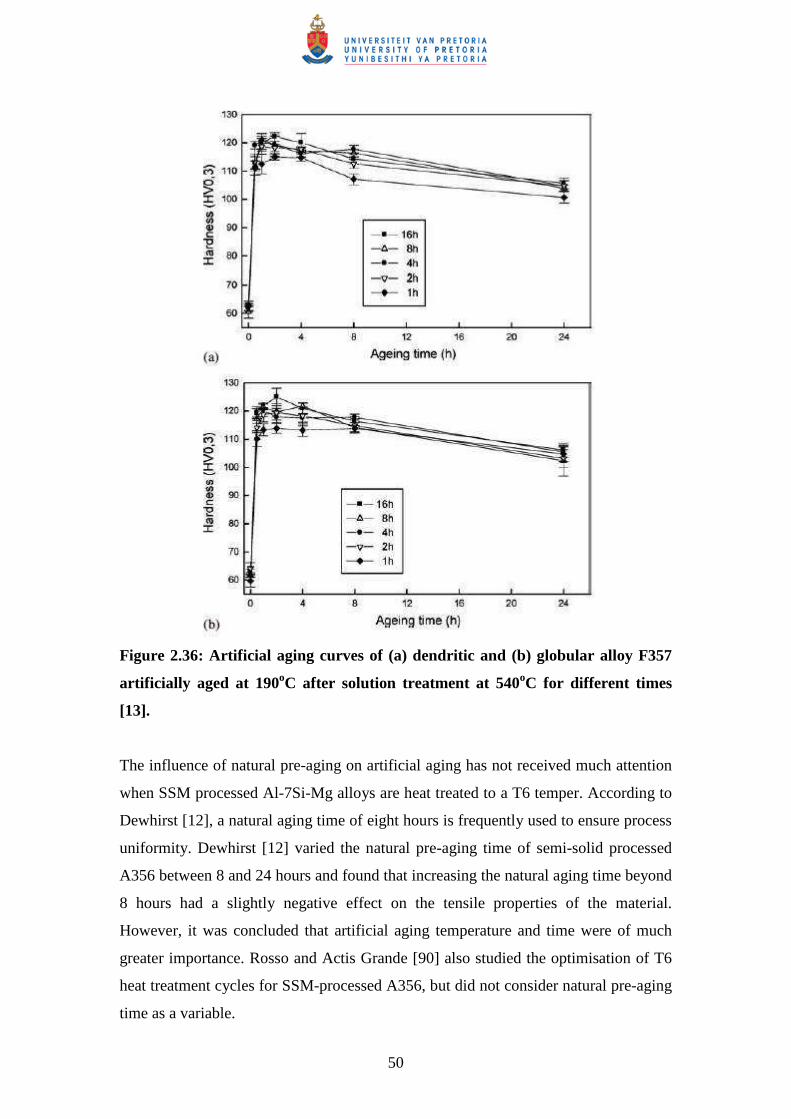
The response to artificial aging of the dendritic and globular alloys F357 which have
been subjected to solution treatment at 540oC for various times is illustrated in Fig.
2.36 [13]). The morphology of the primary α-Al, whether dendritic or globular,
apparently has no effect on the artificial aging response of the alloy [13,14]. Birol [13]
postulated that the favourable impact of the globular structure is offset by the
relatively coarser structure in SSM-processed alloys. It is also seen from Fig. 2.36 that
a solution treatment time of at least 2 h at 540oC is required to obtain maximum
hardness after artificial aging in this alloy.
50
Figure 2.36: Artificial aging curves of (a) dendritic and (b) globular alloy F357
artificially aged at 190oC after solution treatment at 540oC for different times
[13].
The influence of natural pre-aging on artificial aging has not received much attention
when SSM processed Al-7Si-Mg alloys are heat treated to a T6 temper. According to
Dewhirst [12], a natural aging time of eight hours is frequently used to ensure process
uniformity. Dewhirst [12] varied the natural pre-aging time of semi-solid processed
A356 between 8 and 24 hours and found that increasing the natural aging time beyond
8 hours had a slightly negative effect on the tensile properties of the material.
However, it was concluded that artificial aging temperature and time were of much
greater importance. Rosso and Actis Grande [90] also studied the optimisation of T6
heat treatment cycles for SSM-processed A356, but did not consider natural pre-aging
time as a variable.
51
The artificial aging parameters of 170oC for 6 hours are probably the most popular for
SSM processed A356 [81,89,90]. There have been a few attempts to also shorten this
treatment without compromising mechanical properties. Both Dewhirst [12] and
Rosso and Actis Grande [90] determined the optimum artificial aging treatment for
SSM processed A356 to be 4 h at 180oC, with Birol [13,14] proposing 190oC for 2 h
for F357. The tensile properties for SSM-processed A356-T6 using the “traditional”
heat treatment cycles, as well as the shorter cycles of 540oC-1h and 180oC-4h as
proposed by Rosso and Actis Grande [90] are compared in Table 2.7.
Table 2.7: Brinell hardness (HB), yield strength (YS), UTS and %elongation of
SSM-processed A356-T6 [90].
Heat
treatment
HB YS (MPa) UTS (MPa) %Elongation
Traditional 112 273 333 11
540oC-1h;
180oC-4h
113 279 332 10
The new, shorter cycles could lead to significant economic and environmental
advantages. Temperature control (especially in the solution treatment step) and the
performance and reliability of heat treating furnaces would then be of primary
importance [90]. A summary of ASTM B969, the traditional and the proposed
optimum heat treatment parameters for SSM-processed Al-7Si-Mg alloys is presented
in Table 2.8.
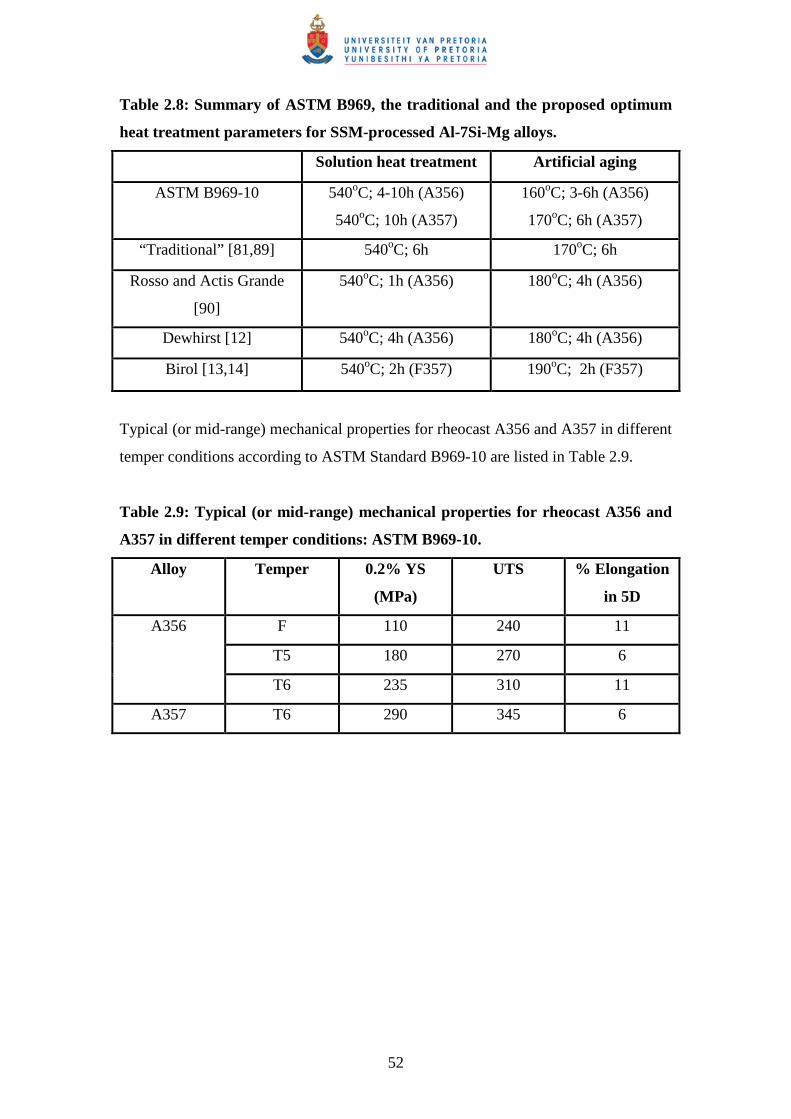
52
Table 2.8: Summary of ASTM B969, the traditional and the proposed optimum
heat treatment parameters for SSM-processed Al-7Si-Mg alloys.
Solution heat treatment Artificial aging
ASTM B969-10 540oC; 4-10h (A356)
540oC; 10h (A357)
160oC; 3-6h (A356)
170oC; 6h (A357)
“Traditional” [81,89] 540oC; 6h 170oC; 6h
Rosso and Actis Grande
[90]
540oC; 1h (A356) 180oC; 4h (A356)
Dewhirst [12] 540oC; 4h (A356) 180oC; 4h (A356)
Birol [13,14] 540oC; 2h (F357) 190oC; 2h (F357)
Typical (or mid-range) mechanical properties for rheocast A356 and A357 in different
temper conditions according to ASTM Standard B969-10 are listed in Table 2.9.
Table 2.9: Typical (or mid-range) mechanical properties for rheocast A356 and
A357 in different temper conditions: ASTM B969-10.
Alloy Temper 0.2% YS
(MPa)
UTS % Elongation
in 5D
F 110 240 11
T5 180 270 6
A356
T6 235 310 11
A357 T6 290 345 6
53
3. EXPERIMENTAL METHODS
3.1. Semi-solid metal processing
3.1.1. SSM-HPDC of rectangular plates
The SSM-processing of each batch of alloy A356 or F357 commenced by melting a
master melt of A356 (with composition of 0.36% Mg in Table 3.1) in a 20 kg
resistance heated tilting furnace. Additions of Mg and Al-10Sr were made to the melt
to obtain the desired composition and thereafter the melt was degassed with argon.
A356 alloys with Mg-contents less than that of the master melt (< 0.36% Mg) were
obtained by allowing evaporation of Mg from the melt followed by subsequent
addition of Sr to compensate for evaporation losses. A sample was poured from the
melt, cooled and the chemical composition analysed by optical emission spectroscopy
(Thermo Quantris OES). Table 3.1 shows the chemical compositions for each of the
alloys. It can be seen that almost the whole Mg-composition range of these alloys is
covered (Table 2.1).
The thermodynamic properties (liquidus and solidus) of the alloys were then
calculated with an aluminium thermodynamic database (ProCAST) from the specific
OES compositions by employing the Scheil equation (or non-equilibrium lever rule)
[91]. The Scheil equation was used since solidification during SSM-HPDC does not
occur under equilibrium conditions due to the fast cooling rates that are achieved.
These thermodynamic properties were used to determine SSM processing parameters
namely pouring temperature and SSM casting temperature. A pouring temperature of
approximately 40oC above the liquidus and a SSM processing temperature
corresponding to a solid fraction of ~30% were used from experience with this
specific SSM processing system. For example, Figure 3.1 shows the solid fraction as a
function of temperature for a typical A356 composition of Al-7Si-0.3Mg-0.1Fe-
0.03Sr and F357 with composition of Al-7Si-0.6Mg-0.1Fe-0.03Sr. Table 3.2
summarises the calculated thermodynamic properties and derived rheocasting
parameters for these compositions. It is seen that the processing parameters do not
differ much for A356 and F357. This procedure was used for each of the compositions
shown in Table 3.1.
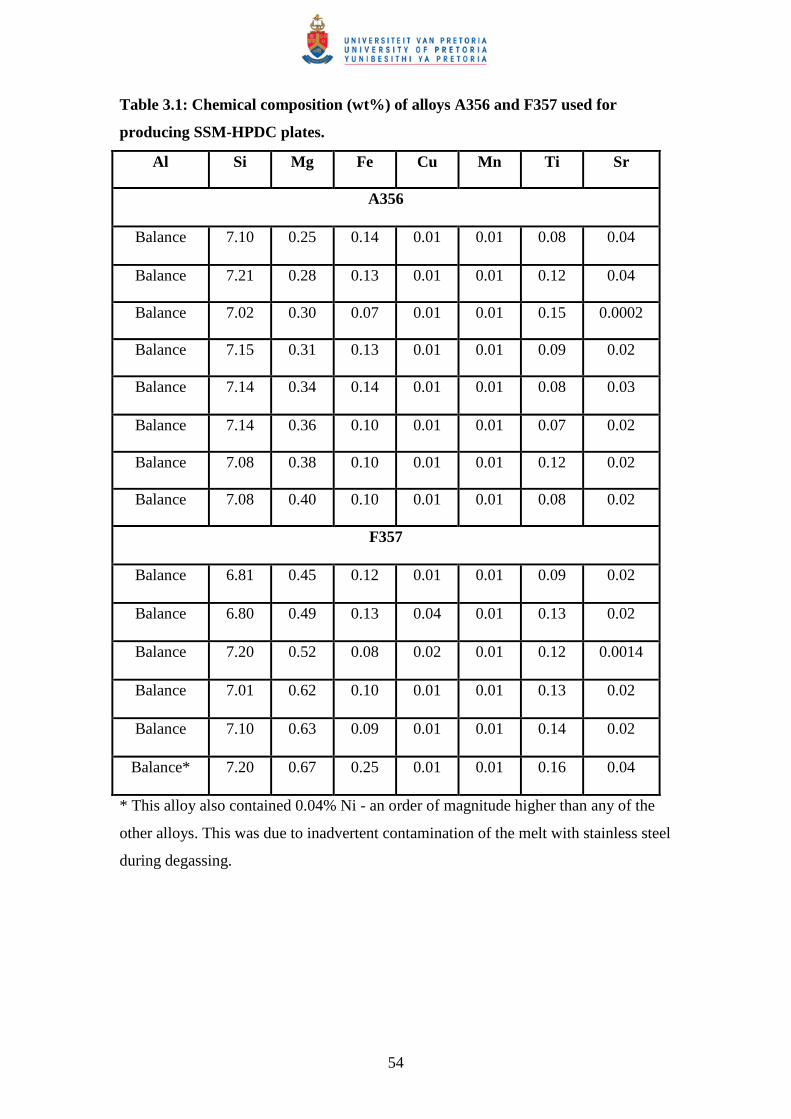
54
Table 3.1: Chemical composition (wt%) of alloys A356 and F357 used for
producing SSM-HPDC plates.
Al Si Mg Fe Cu Mn Ti Sr
A356
Balance 7.10 0.25 0.14 0.01 0.01 0.08 0.04
Balance 7.21 0.28 0.13 0.01 0.01 0.12 0.04
Balance 7.02 0.30 0.07 0.01 0.01 0.15 0.0002
Balance 7.15 0.31 0.13 0.01 0.01 0.09 0.02
Balance 7.14 0.34 0.14 0.01 0.01 0.08 0.03
Balance 7.14 0.36 0.10 0.01 0.01 0.07 0.02
Balance 7.08 0.38 0.10 0.01 0.01 0.12 0.02
Balance 7.08 0.40 0.10 0.01 0.01 0.08 0.02
F357
Balance 6.81 0.45 0.12 0.01 0.01 0.09 0.02
Balance 6.80 0.49 0.13 0.04 0.01 0.13 0.02
Balance 7.20 0.52 0.08 0.02 0.01 0.12 0.0014
Balance 7.01 0.62 0.10 0.01 0.01 0.13 0.02
Balance 7.10 0.63 0.09 0.01 0.01 0.14 0.02
Balance* 7.20 0.67 0.25 0.01 0.01 0.16 0.04
* This alloy also contained 0.04% Ni - an order of magnitude higher than any of the
other alloys. This was due to inadvertent contamination of the melt with stainless steel
during degassing.
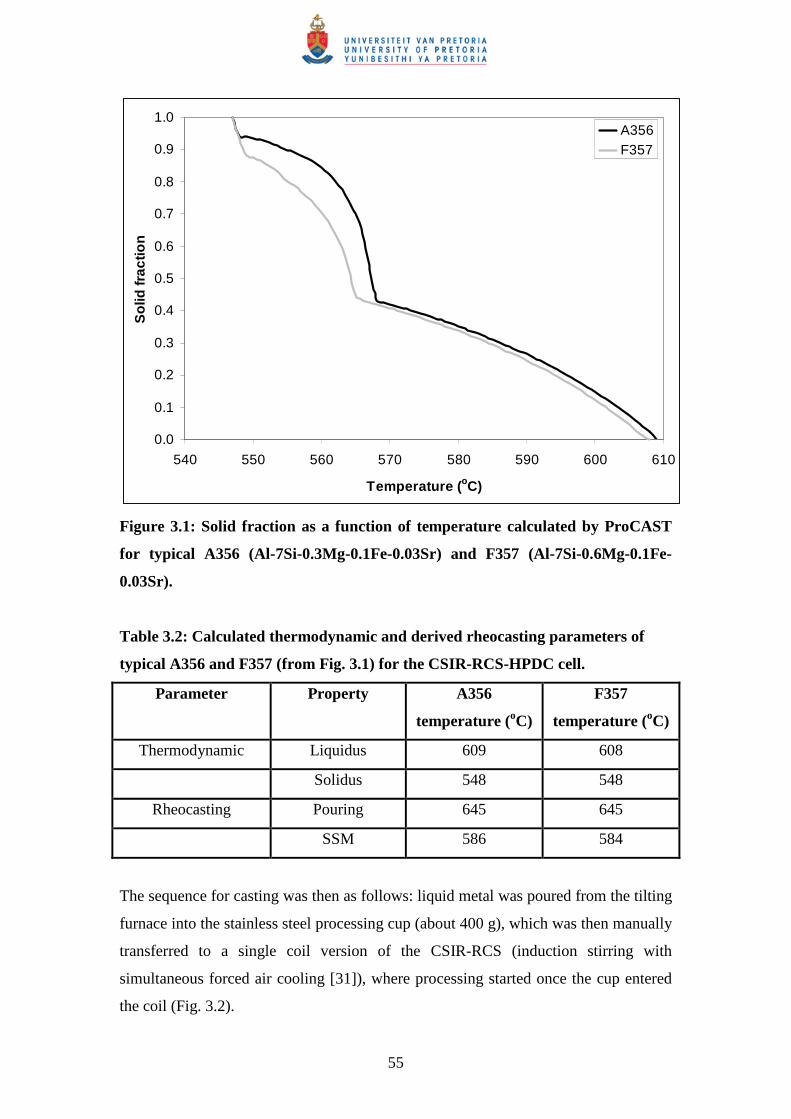
55
0.0
0.1
0.2
0.3
0.4
0.5
0.6
0.7
0.8
0.9
1.0
540 550 560 570 580 590 600 610
Temperature (oC)
So
lid fr
actio
nA356F357
Figure 3.1: Solid fraction as a function of temperature calculated by ProCAST
for typical A356 (Al-7Si-0.3Mg-0.1Fe-0.03Sr) and F357 (Al-7Si-0.6Mg-0.1Fe-
0.03Sr).
Table 3.2: Calculated thermodynamic and derived rheocasting parameters of
typical A356 and F357 (from Fig. 3.1) for the CSIR-RCS-HPDC cell.
Parameter Property A356
temperature (oC)
F357
temperature (oC)
Thermodynamic Liquidus 609 608
Solidus 548 548
Rheocasting Pouring 645 645
SSM 586 584
The sequence for casting was then as follows: liquid metal was poured from the tilting
furnace into the stainless steel processing cup (about 400 g), which was then manually
transferred to a single coil version of the CSIR-RCS (induction stirring with
simultaneous forced air cooling [31]), where processing started once the cup entered
the coil (Fig. 3.2).
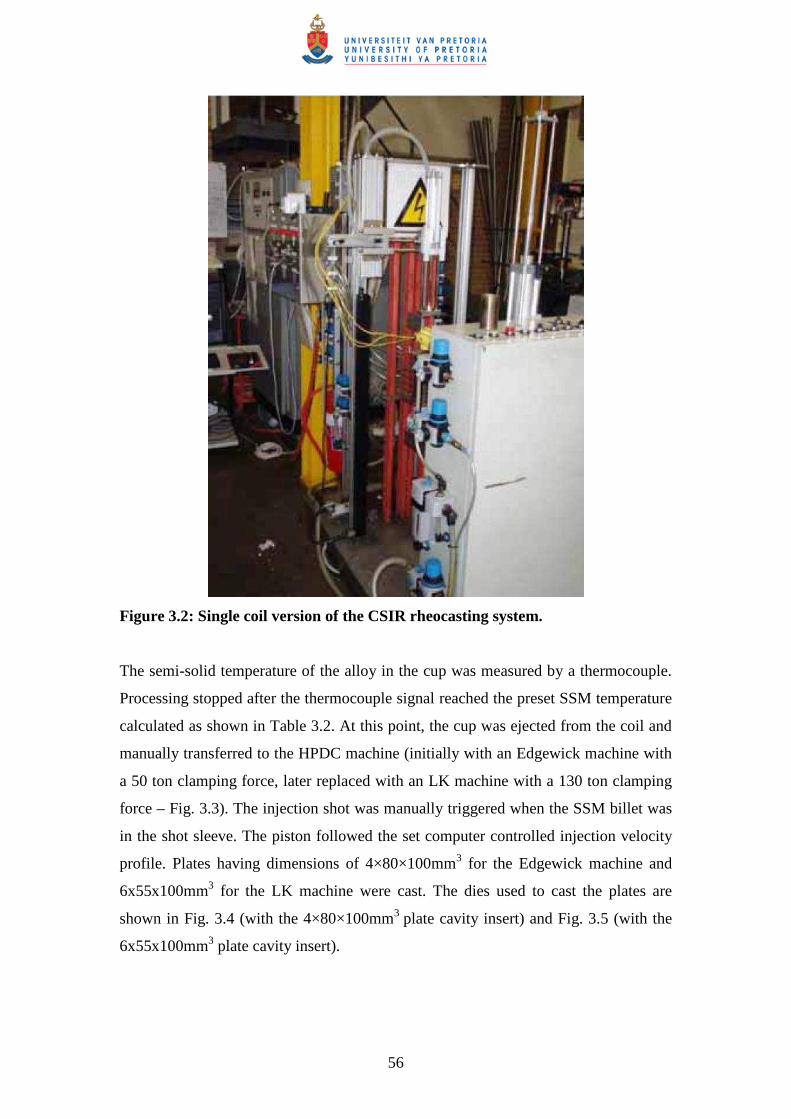
56
Figure 3.2: Single coil version of the CSIR rheocasting system.
The semi-solid temperature of the alloy in the cup was measured by a thermocouple.
Processing stopped after the thermocouple signal reached the preset SSM temperature
calculated as shown in Table 3.2. At this point, the cup was ejected from the coil and
manually transferred to the HPDC machine (initially with an Edgewick machine with
a 50 ton clamping force, later replaced with an LK machine with a 130 ton clamping
force – Fig. 3.3). The injection shot was manually triggered when the SSM billet was
in the shot sleeve. The piston followed the set computer controlled injection velocity
profile. Plates having dimensions of 4×80×100mm3 for the Edgewick machine and
6x55x100mm3 for the LK machine were cast. The dies used to cast the plates are
shown in Fig. 3.4 (with the 4×80×100mm3 plate cavity insert) and Fig. 3.5 (with the
6x55x100mm3 plate cavity insert).
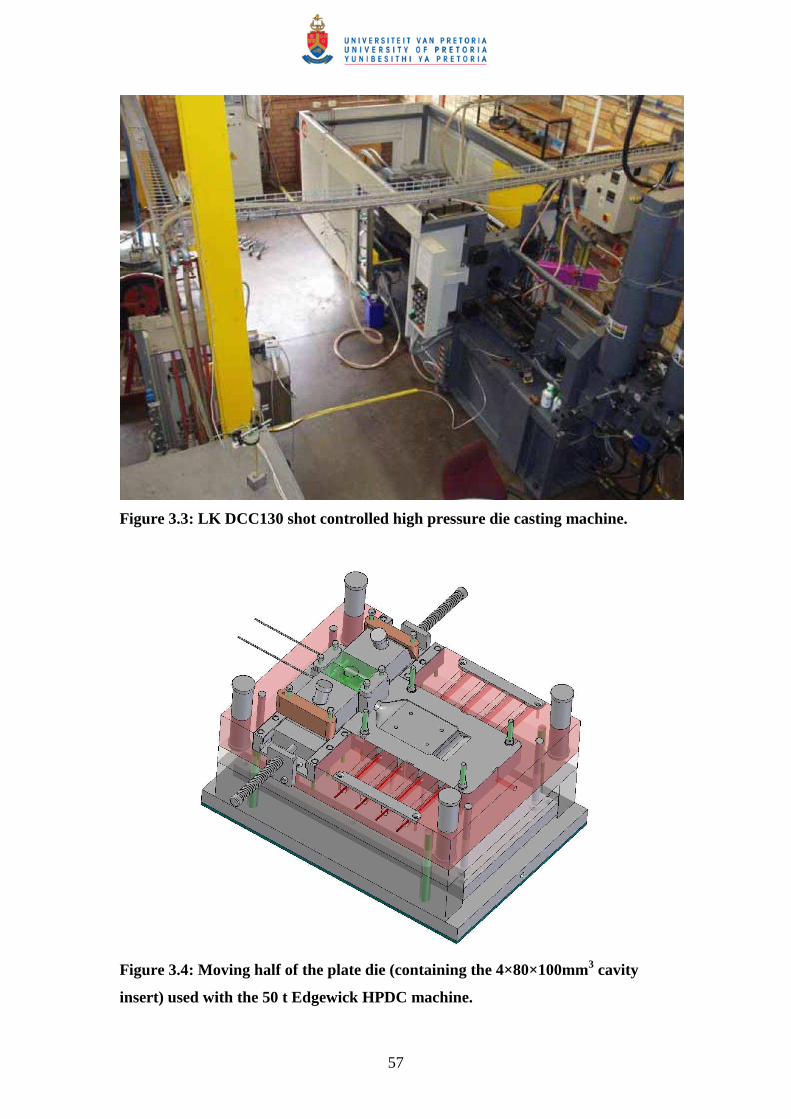
57
Figure 3.3: LK DCC130 shot controlled high pressure die casting machine.
Figure 3.4: Moving half of the plate die (containing the 4×80×100mm3 cavity
insert) used with the 50 t Edgewick HPDC machine.
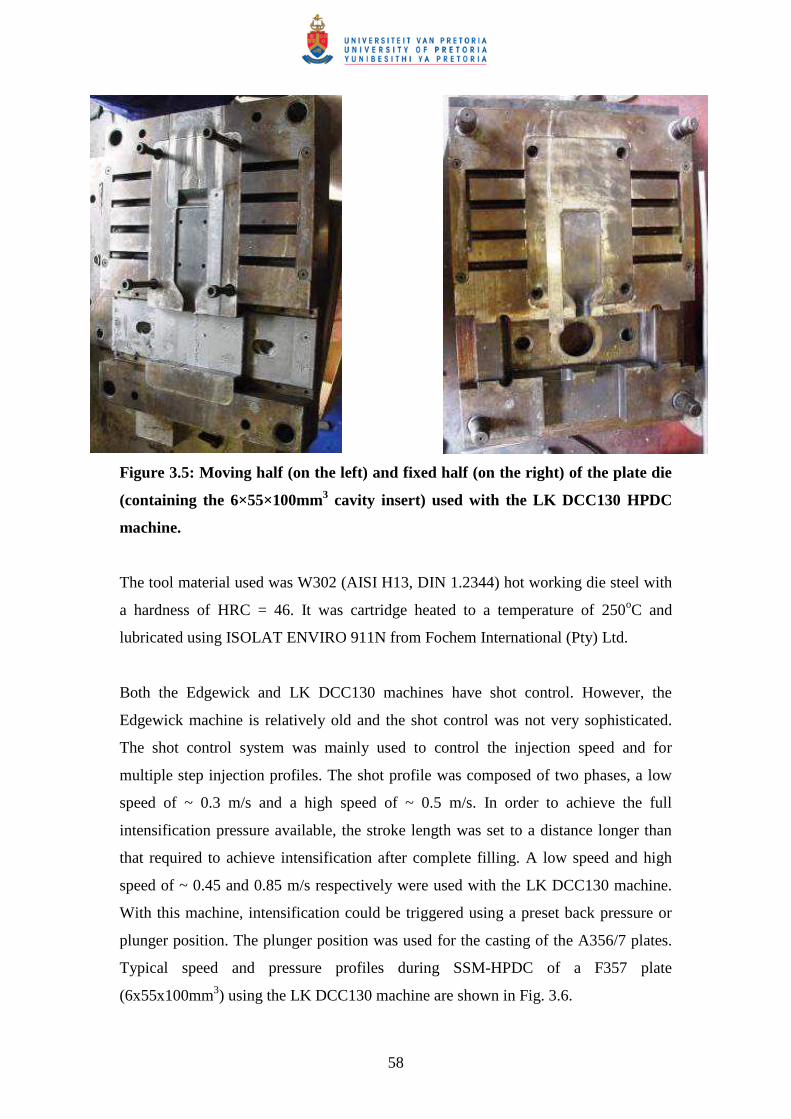
58
Figure 3.5: Moving half (on the left) and fixed half (on the right) of the plate die
(containing the 6×55×100mm3 cavity insert) used with the LK DCC130 HPDC
machine.
The tool material used was W302 (AISI H13, DIN 1.2344) hot working die steel with
a hardness of HRC = 46. It was cartridge heated to a temperature of 250oC and
lubricated using ISOLAT ENVIRO 911N from Fochem International (Pty) Ltd.
Both the Edgewick and LK DCC130 machines have shot control. However, the
Edgewick machine is relatively old and the shot control was not very sophisticated.
The shot control system was mainly used to control the injection speed and for
multiple step injection profiles. The shot profile was composed of two phases, a low
speed of ~ 0.3 m/s and a high speed of ~ 0.5 m/s. In order to achieve the full
intensification pressure available, the stroke length was set to a distance longer than
that required to achieve intensification after complete filling. A low speed and high
speed of ~ 0.45 and 0.85 m/s respectively were used with the LK DCC130 machine.
With this machine, intensification could be triggered using a preset back pressure or
plunger position. The plunger position was used for the casting of the A356/7 plates.
Typical speed and pressure profiles during SSM-HPDC of a F357 plate
(6x55x100mm3) using the LK DCC130 machine are shown in Fig. 3.6.
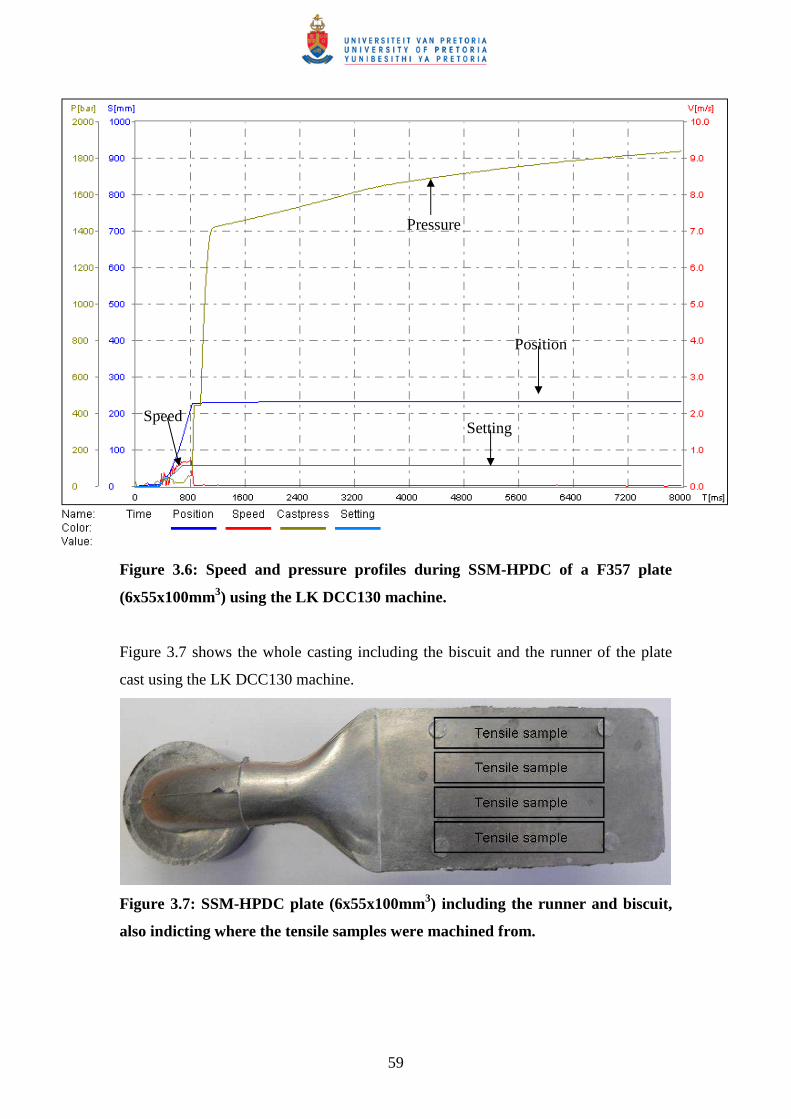
59
Figure 3.6: Speed and pressure profiles during SSM-HPDC of a F357 plate
(6x55x100mm3) using the LK DCC130 machine.
Figure 3.7 shows the whole casting including the biscuit and the runner of the plate
cast using the LK DCC130 machine.
Figure 3.7: SSM-HPDC plate (6x55x100mm3) including the runner and biscuit,
also indicting where the tensile samples were machined from.
Pressure
Speed Setting
Position
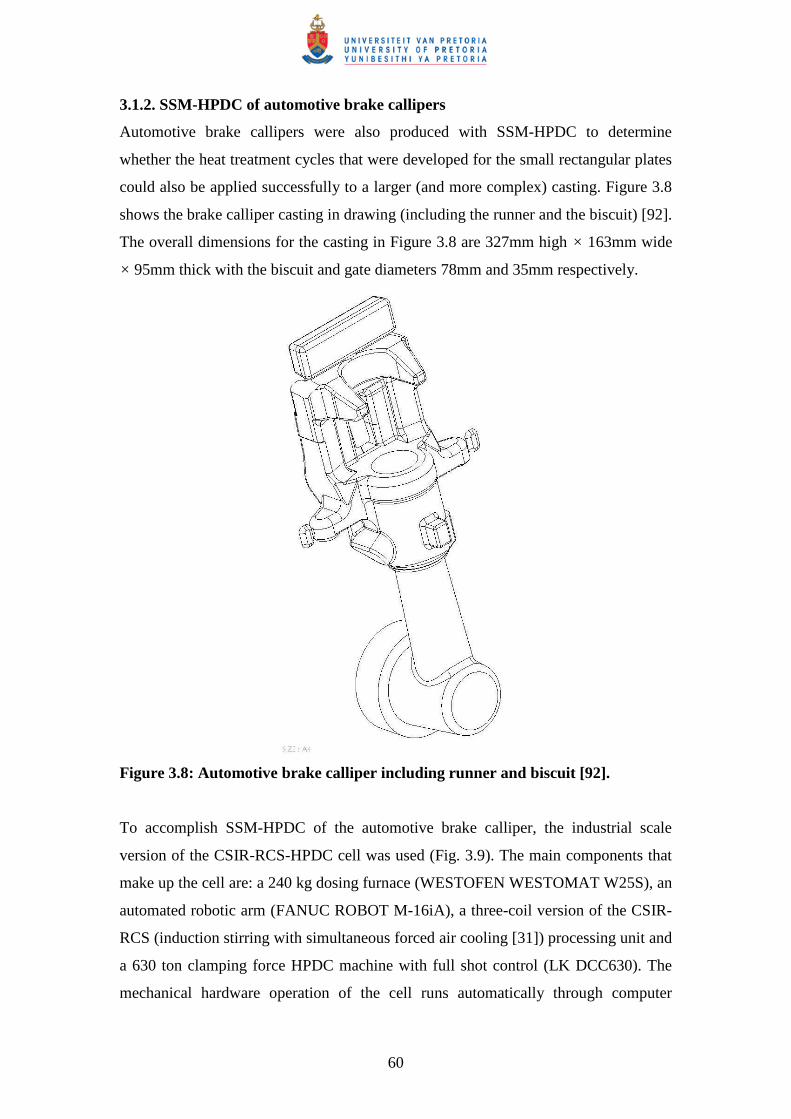
60
3.1.2. SSM-HPDC of automotive brake callipers
Automotive brake callipers were also produced with SSM-HPDC to determine
whether the heat treatment cycles that were developed for the small rectangular plates
could also be applied successfully to a larger (and more complex) casting. Figure 3.8
shows the brake calliper casting in drawing (including the runner and the biscuit) [92].
The overall dimensions for the casting in Figure 3.8 are 327mm high × 163mm wide
× 95mm thick with the biscuit and gate diameters 78mm and 35mm respectively.
Figure 3.8: Automotive brake calliper including runner and biscuit [92].
To accomplish SSM-HPDC of the automotive brake calliper, the industrial scale
version of the CSIR-RCS-HPDC cell was used (Fig. 3.9). The main components that
make up the cell are: a 240 kg dosing furnace (WESTOFEN WESTOMAT W25S), an
automated robotic arm (FANUC ROBOT M-16iA), a three-coil version of the CSIR-
RCS (induction stirring with simultaneous forced air cooling [31]) processing unit and
a 630 ton clamping force HPDC machine with full shot control (LK DCC630). The
mechanical hardware operation of the cell runs automatically through computer
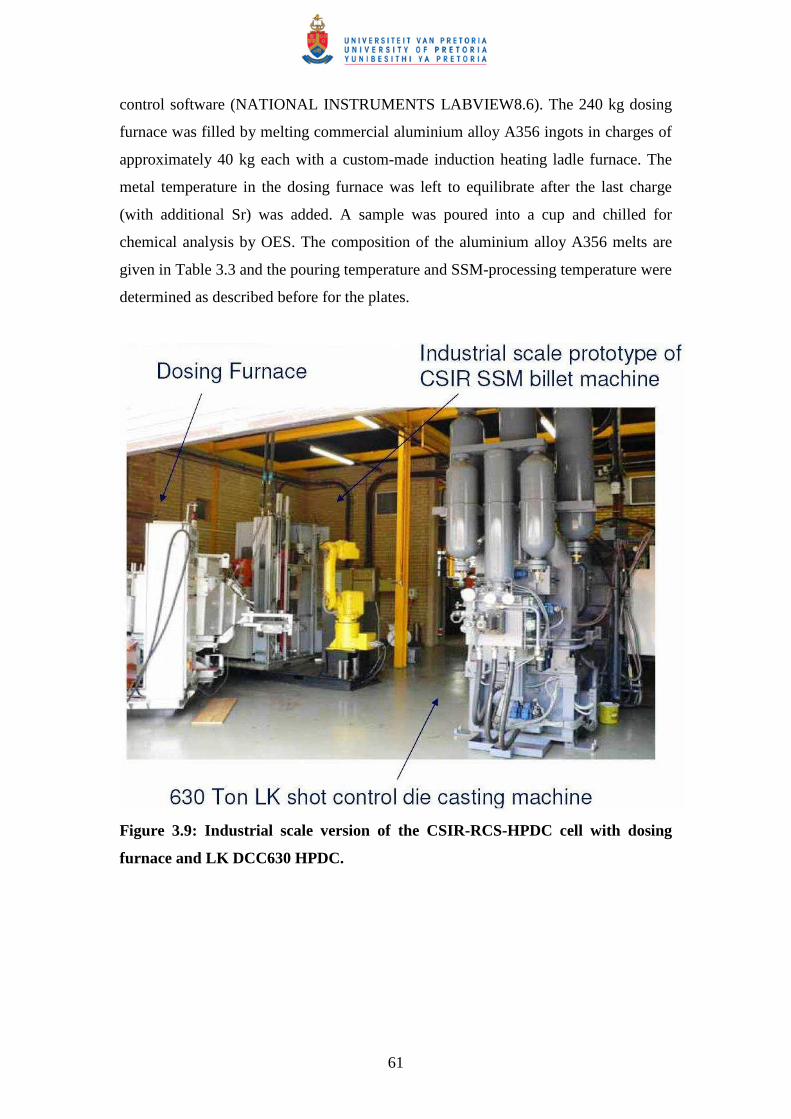
61
control software (NATIONAL INSTRUMENTS LABVIEW8.6). The 240 kg dosing
furnace was filled by melting commercial aluminium alloy A356 ingots in charges of
approximately 40 kg each with a custom-made induction heating ladle furnace. The
metal temperature in the dosing furnace was left to equilibrate after the last charge
(with additional Sr) was added. A sample was poured into a cup and chilled for
chemical analysis by OES. The composition of the aluminium alloy A356 melts are
given in Table 3.3 and the pouring temperature and SSM-processing temperature were
determined as described before for the plates.
Figure 3.9: Industrial scale version of the CSIR-RCS-HPDC cell with dosing
furnace and LK DCC630 HPDC.
62
Table 3.3: Chemical composition (wt%) of alloy A356 used for producing SSM-
HPDC and gravity die cast (GDC) automotive brake callipers.
Method Al Si Mg Fe Cu Mn Ti Sr
SSM-
HPDC (1)
Balance 7.3 0.31 0.14 0.01 0.01 0.16 0.03
SSM-
HPDC (2)
Balance 7.0 0.35 0.14 0.01 0.01 0.14 0.02
GDC Balance 6.6 0.36 0.27 0.03 0.01 0.06 0.02
The sequence for casting was as follows: liquid metal was poured from the dosing
furnace into a stainless steel processing cup (approximately 2 kg) which was then
robotically transferred to the CSIR-RCS unit and entered the coil train at the bottom.
All three coils in the processing unit were inductive while forced air cooling was only
used (manually activated) on the top coil to control the SSM temperature which was
measured with a thermocouple in the semi-solid metal contained in the cup. When this
cup at the top of the train had been processed after reaching the SSM temperature, it
was robotically transferred to the shot sleeve of the HPDC machine and the injection
shot was triggered automatically to fill the die. The die temperature was controlled by
two oil heaters (REGLOPLAS 300 L), one for each half of the die, and was set at
170oC. The piston followed a set computer-controlled injection velocity profile to
achieve the best filling result [92]. To make comparisons between the heat treatment
response of globular and dendritic A356, automotive brake callipers of similar
composition (Table 3.3) and exact design (shape, size, mass) were cast by a local
manufacturer using gravity die casting (GDC).
3.2. Investment casting of rectangular plates
To make further comparisons of the heat treatment response of globular and dendritic
A356, rectangular plates (95x30x4mm3) with a composition given in Table 3.4 were
cast using investment casting (IC) to obtain a coarser dendritic microstructure than
achieved in the brake calliper cast using GDC.
63
Table 3.4: Chemical composition (wt%) of alloy A356 used for producing
investment cast (IC) plates.
Al Si Mg Fe Cu Mn Ti Sr
Balance 6.70 0.25 0.10 0.01 0.01 0.06 0.03
Wax pattern assemblies consisted of 6 of the plates assembled with 3 plates per
opposite side, spaced 40 mm apart. A vertical 25mm x 20mm rectangular runner bar
was used (250mm long) as shown in Fig. 3.10. The plates were assembled at an angle
of 75 degrees inclined to the runner bar. The runner bar extended below the lowest
plate’s tip to form a dross trap. A pouring cup was attached to the top of the runner
bar. The wax used was Remet 289B green wax. The preferred bottom pouring method
for aluminium was not used to simplify the assembly and to ensure symmetry in the
mould. Wax assemblies were prepared by washing with Pattern Wash 6 from Remet
and rinsed with de-ionised water. The wax assemblies were left for 24 h to dry and to
stabilise at the dipping room temperature of 21°C. The primary slurry consisted of
Ransom & Randolph Primecote, colloidal silica 30% binder and Zircon flour (Zircon
silicate) -325mesh as refractory filler. The secondary slurry consisted of Ransom and
Randolph Customcote colloidal silica 25% binder with fused silica (-325mesh) as the
refractory filler. The face coat stucco used was Zircon sand P109 (mean 109µm) and
the back-up coat stucco was Chamotte (Aluminosilicate). The shell making facility
was temperature controlled to 21°C±1°C and the humidity was monitored – the
relative humidity was measured as ±60%. The dipping procedure is given in Table
3.5.
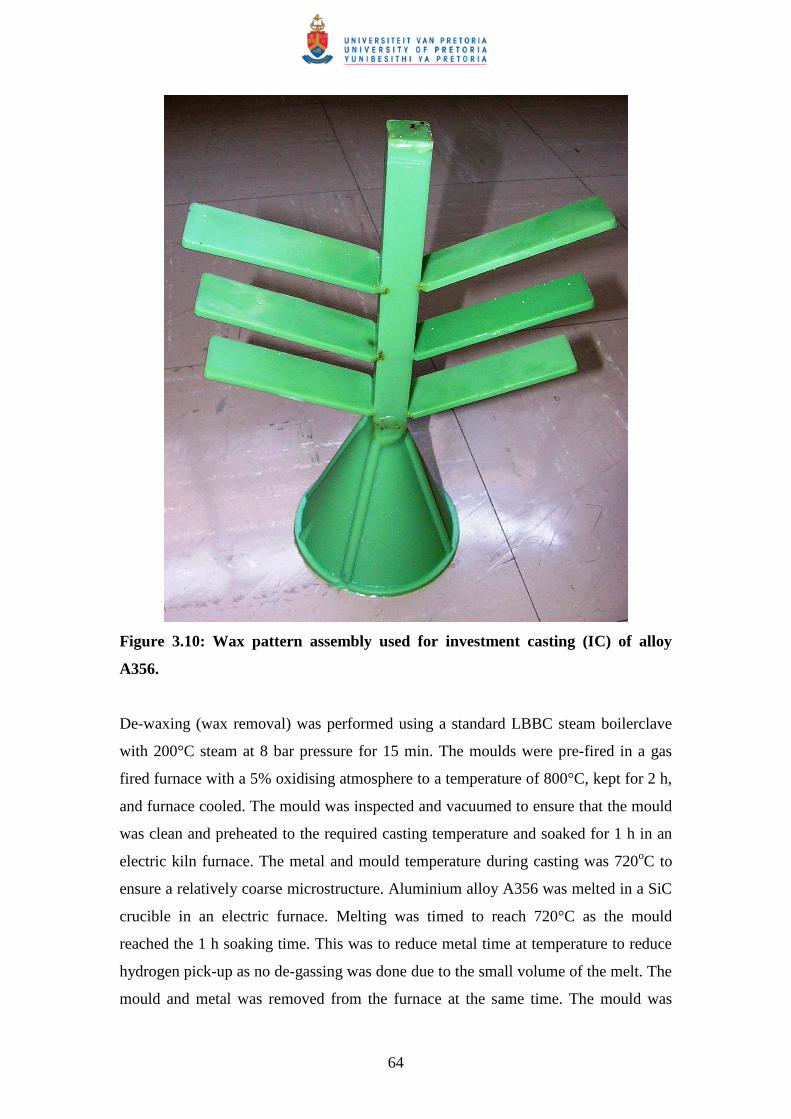
64
Figure 3.10: Wax pattern assembly used for investment casting (IC) of alloy
A356.
De-waxing (wax removal) was performed using a standard LBBC steam boilerclave
with 200°C steam at 8 bar pressure for 15 min. The moulds were pre-fired in a gas
fired furnace with a 5% oxidising atmosphere to a temperature of 800°C, kept for 2 h,
and furnace cooled. The mould was inspected and vacuumed to ensure that the mould
was clean and preheated to the required casting temperature and soaked for 1 h in an
electric kiln furnace. The metal and mould temperature during casting was 720oC to
ensure a relatively coarse microstructure. Aluminium alloy A356 was melted in a SiC
crucible in an electric furnace. Melting was timed to reach 720°C as the mould
reached the 1 h soaking time. This was to reduce metal time at temperature to reduce
hydrogen pick-up as no de-gassing was done due to the small volume of the melt. The
mould and metal was removed from the furnace at the same time. The mould was
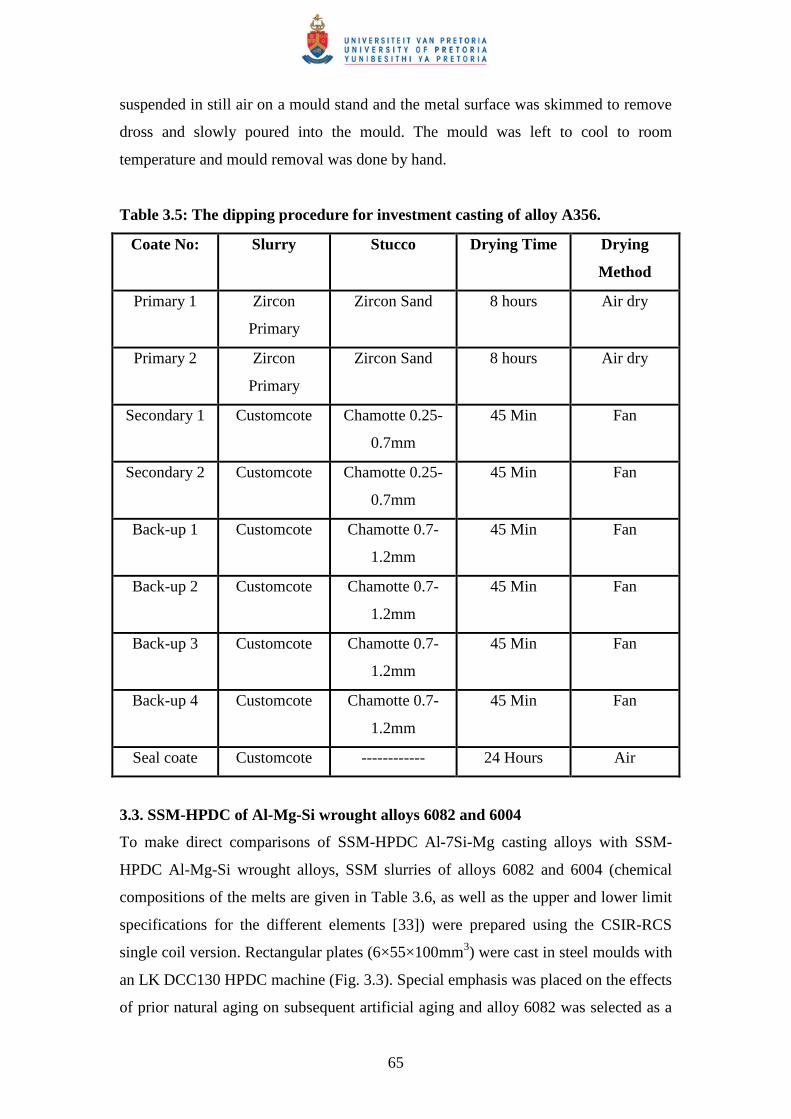
65
suspended in still air on a mould stand and the metal surface was skimmed to remove
dross and slowly poured into the mould. The mould was left to cool to room
temperature and mould removal was done by hand.
Table 3.5: The dipping procedure for investment casting of alloy A356.
Coate No: Slurry Stucco Drying Time Drying
Method
Primary 1 Zircon
Primary
Zircon Sand 8 hours Air dry
Primary 2 Zircon
Primary
Zircon Sand 8 hours Air dry
Secondary 1 Customcote Chamotte 0.25-
0.7mm
45 Min Fan
Secondary 2 Customcote Chamotte 0.25-
0.7mm
45 Min Fan
Back-up 1 Customcote Chamotte 0.7-
1.2mm
45 Min Fan
Back-up 2 Customcote Chamotte 0.7-
1.2mm
45 Min Fan
Back-up 3 Customcote Chamotte 0.7-
1.2mm
45 Min Fan
Back-up 4 Customcote Chamotte 0.7-
1.2mm
45 Min Fan
Seal coate Customcote ------------ 24 Hours Air
3.3. SSM-HPDC of Al-Mg-Si wrought alloys 6082 and 6004
To make direct comparisons of SSM-HPDC Al-7Si-Mg casting alloys with SSM-
HPDC Al-Mg-Si wrought alloys, SSM slurries of alloys 6082 and 6004 (chemical
compositions of the melts are given in Table 3.6, as well as the upper and lower limit
specifications for the different elements [33]) were prepared using the CSIR-RCS
single coil version. Rectangular plates (6×55×100mm3) were cast in steel moulds with
an LK DCC130 HPDC machine (Fig. 3.3). Special emphasis was placed on the effects
of prior natural aging on subsequent artificial aging and alloy 6082 was selected as a
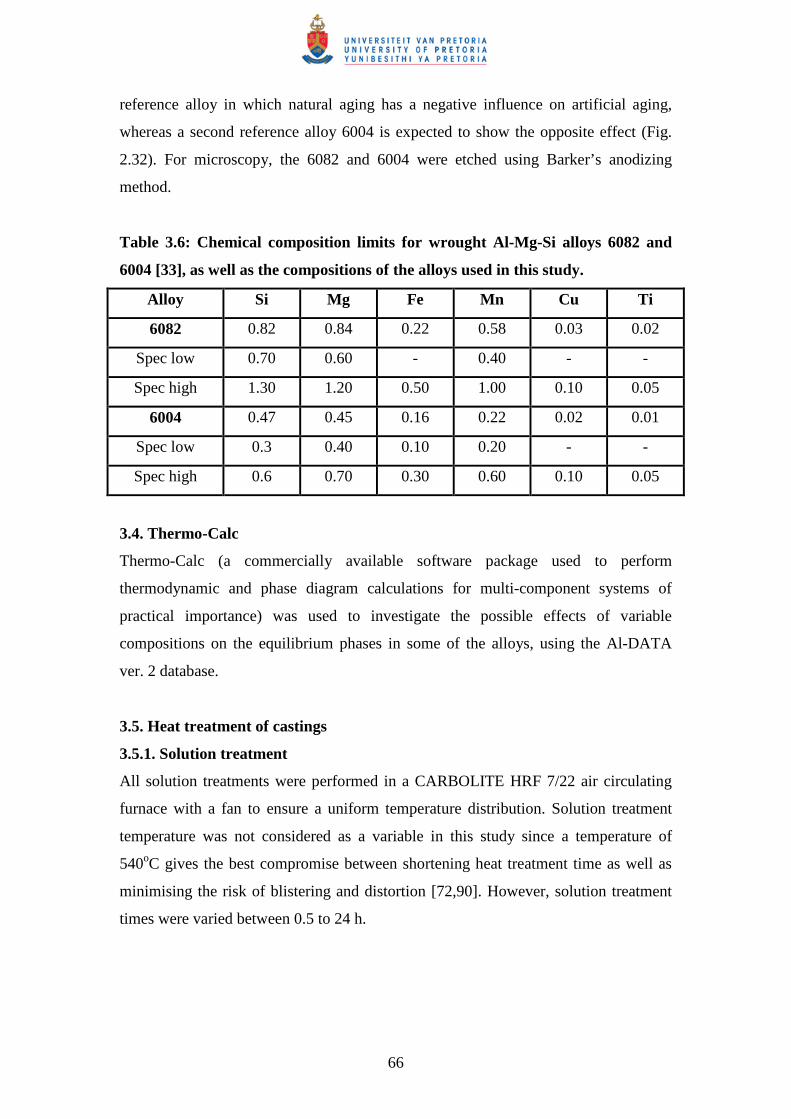
66
reference alloy in which natural aging has a negative influence on artificial aging,
whereas a second reference alloy 6004 is expected to show the opposite effect (Fig.
2.32). For microscopy, the 6082 and 6004 were etched using Barker’s anodizing
method.
Table 3.6: Chemical composition limits for wrought Al-Mg-Si alloys 6082 and
6004 [33], as well as the compositions of the alloys used in this study.
Alloy Si Mg Fe Mn Cu Ti
6082 0.82 0.84 0.22 0.58 0.03 0.02
Spec low 0.70 0.60 - 0.40 - -
Spec high 1.30 1.20 0.50 1.00 0.10 0.05
6004 0.47 0.45 0.16 0.22 0.02 0.01
Spec low 0.3 0.40 0.10 0.20 - -
Spec high 0.6 0.70 0.30 0.60 0.10 0.05
3.4. Thermo-Calc
Thermo-Calc (a commercially available software package used to perform
thermodynamic and phase diagram calculations for multi-component systems of
practical importance) was used to investigate the possible effects of variable
compositions on the equilibrium phases in some of the alloys, using the Al-DATA
ver. 2 database.
3.5. Heat treatment of castings
3.5.1. Solution treatment
All solution treatments were performed in a CARBOLITE HRF 7/22 air circulating
furnace with a fan to ensure a uniform temperature distribution. Solution treatment
temperature was not considered as a variable in this study since a temperature of
540oC gives the best compromise between shortening heat treatment time as well as
minimising the risk of blistering and distortion [72,90]. However, solution treatment
times were varied between 0.5 to 24 h.
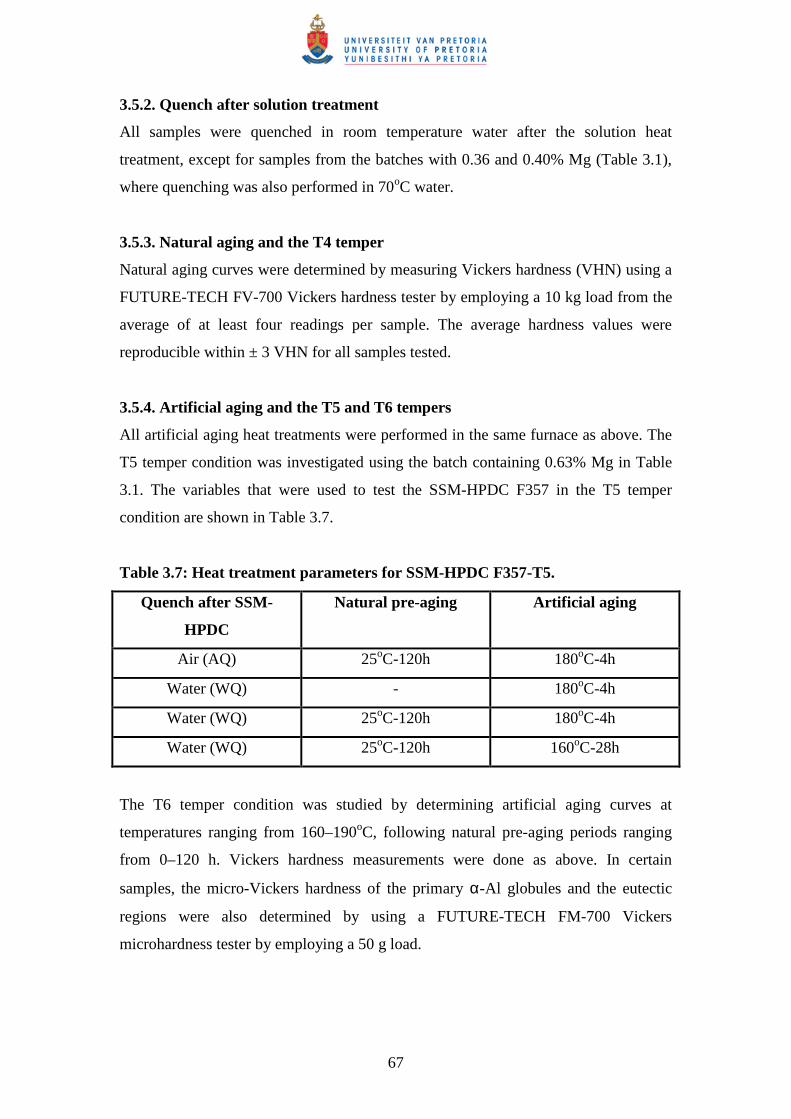
67
3.5.2. Quench after solution treatment
All samples were quenched in room temperature water after the solution heat
treatment, except for samples from the batches with 0.36 and 0.40% Mg (Table 3.1),
where quenching was also performed in 70oC water.
3.5.3. Natural aging and the T4 temper
Natural aging curves were determined by measuring Vickers hardness (VHN) using a
FUTURE-TECH FV-700 Vickers hardness tester by employing a 10 kg load from the
average of at least four readings per sample. The average hardness values were
reproducible within ± 3 VHN for all samples tested.
3.5.4. Artificial aging and the T5 and T6 tempers
All artificial aging heat treatments were performed in the same furnace as above. The
T5 temper condition was investigated using the batch containing 0.63% Mg in Table
3.1. The variables that were used to test the SSM-HPDC F357 in the T5 temper
condition are shown in Table 3.7.
Table 3.7: Heat treatment parameters for SSM-HPDC F357-T5.
Quench after SSM-
HPDC
Natural pre-aging Artificial aging
Air (AQ) 25oC-120h 180oC-4h
Water (WQ) - 180oC-4h
Water (WQ) 25oC-120h 180oC-4h
Water (WQ) 25oC-120h 160oC-28h
The T6 temper condition was studied by determining artificial aging curves at
temperatures ranging from 160–190oC, following natural pre-aging periods ranging
from 0–120 h. Vickers hardness measurements were done as above. In certain
samples, the micro-Vickers hardness of the primary α-Al globules and the eutectic
regions were also determined by using a FUTURE-TECH FM-700 Vickers
microhardness tester by employing a 50 g load.
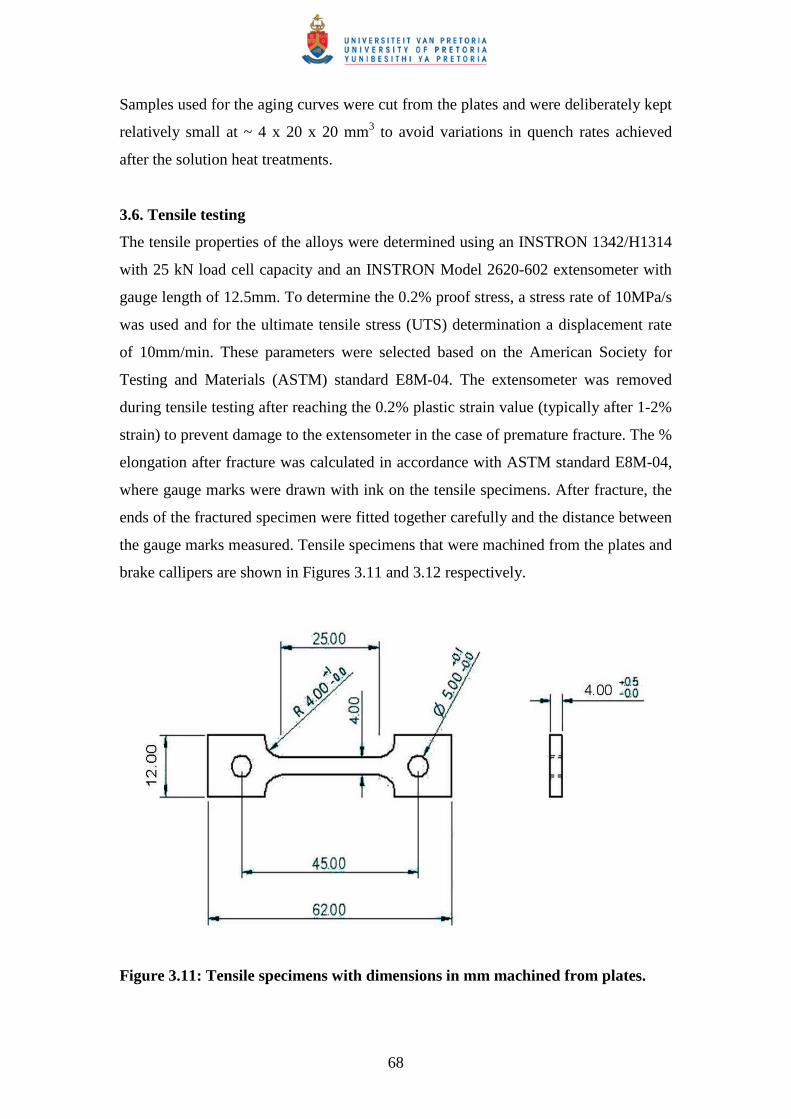
68
Samples used for the aging curves were cut from the plates and were deliberately kept
relatively small at ~ 4 x 20 x 20 mm3 to avoid variations in quench rates achieved
after the solution heat treatments.
3.6. Tensile testing
The tensile properties of the alloys were determined using an INSTRON 1342/H1314
with 25 kN load cell capacity and an INSTRON Model 2620-602 extensometer with
gauge length of 12.5mm. To determine the 0.2% proof stress, a stress rate of 10MPa/s
was used and for the ultimate tensile stress (UTS) determination a displacement rate
of 10mm/min. These parameters were selected based on the American Society for
Testing and Materials (ASTM) standard E8M-04. The extensometer was removed
during tensile testing after reaching the 0.2% plastic strain value (typically after 1-2%
strain) to prevent damage to the extensometer in the case of premature fracture. The %
elongation after fracture was calculated in accordance with ASTM standard E8M-04,
where gauge marks were drawn with ink on the tensile specimens. After fracture, the
ends of the fractured specimen were fitted together carefully and the distance between
the gauge marks measured. Tensile specimens that were machined from the plates and
brake callipers are shown in Figures 3.11 and 3.12 respectively.
Figure 3.11: Tensile specimens with dimensions in mm machined from plates.
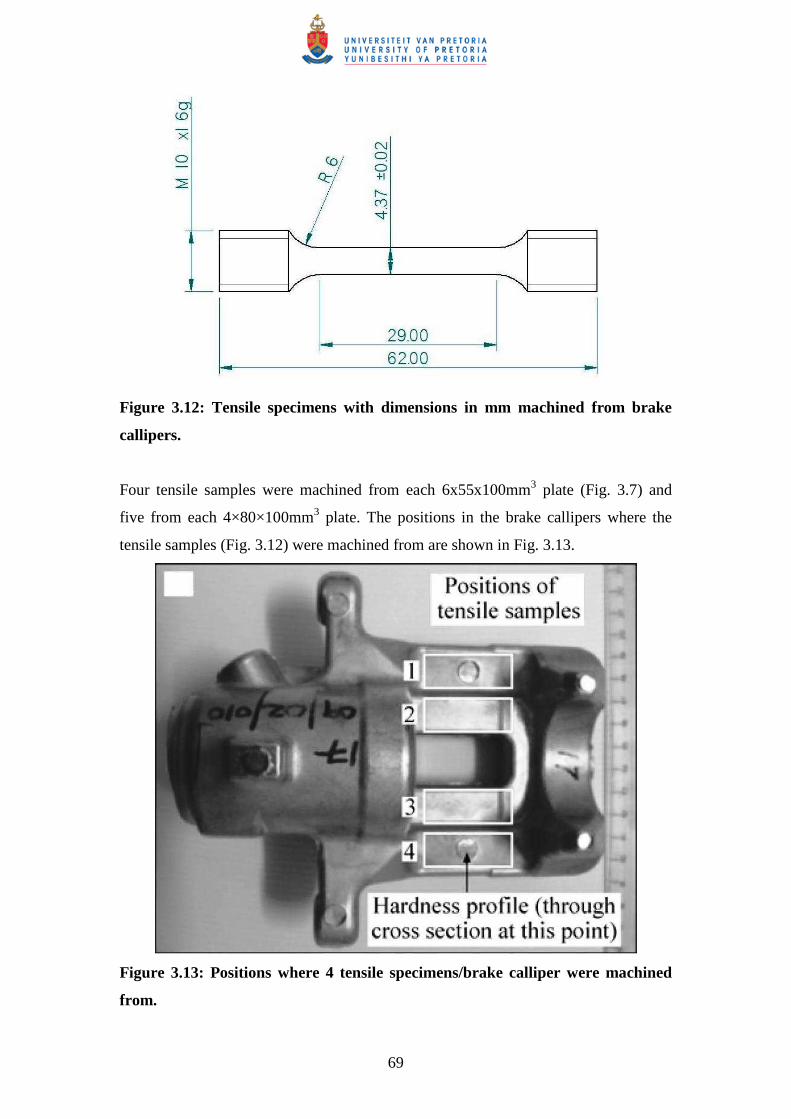
69
Figure 3.12: Tensile specimens with dimensions in mm machined from brake
callipers.
Four tensile samples were machined from each 6x55x100mm3 plate (Fig. 3.7) and
five from each 4×80×100mm3 plate. The positions in the brake callipers where the
tensile samples (Fig. 3.12) were machined from are shown in Fig. 3.13.
Figure 3.13: Positions where 4 tensile specimens/brake calliper were machined
from.
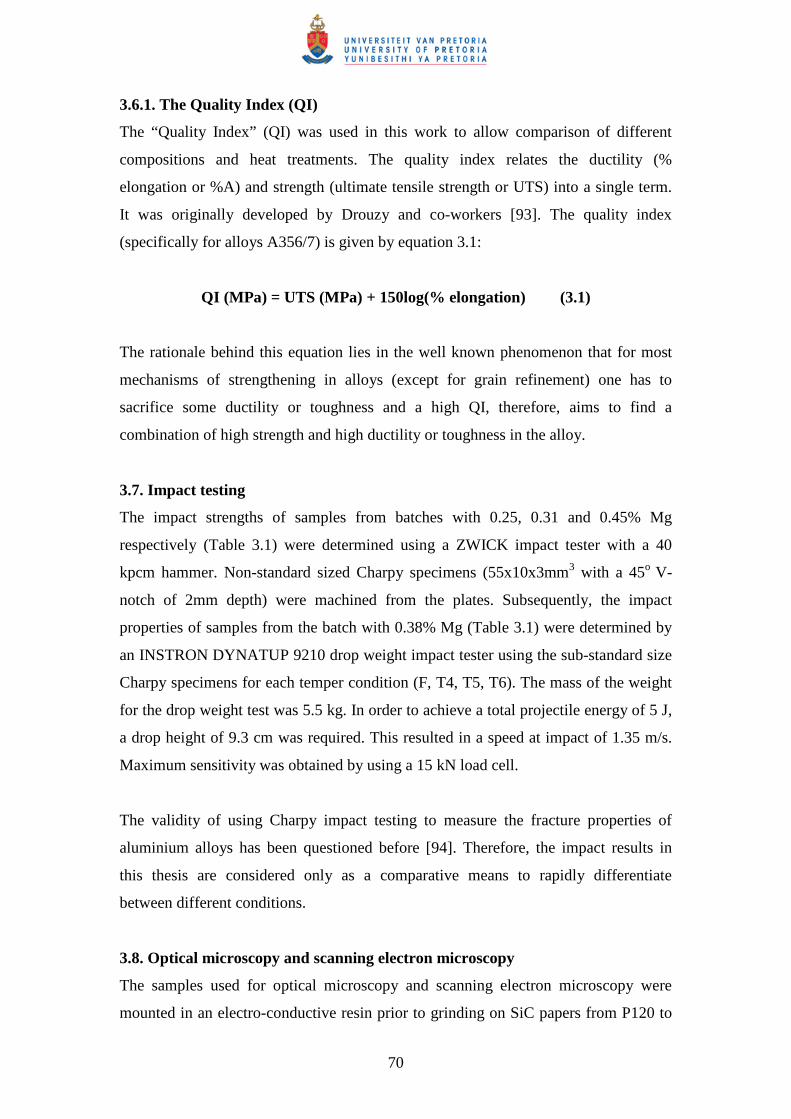
70
3.6.1. The Quality Index (QI)
The “Quality Index” (QI) was used in this work to allow comparison of different
compositions and heat treatments. The quality index relates the ductility (%
elongation or %A) and strength (ultimate tensile strength or UTS) into a single term.
It was originally developed by Drouzy and co-workers [93]. The quality index
(specifically for alloys A356/7) is given by equation 3.1:
QI (MPa) = UTS (MPa) + 150log(% elongation) (3.1)
The rationale behind this equation lies in the well known phenomenon that for most
mechanisms of strengthening in alloys (except for grain refinement) one has to
sacrifice some ductility or toughness and a high QI, therefore, aims to find a
combination of high strength and high ductility or toughness in the alloy.
3.7. Impact testing
The impact strengths of samples from batches with 0.25, 0.31 and 0.45% Mg
respectively (Table 3.1) were determined using a ZWICK impact tester with a 40
kpcm hammer. Non-standard sized Charpy specimens (55x10x3mm3 with a 45o V-
notch of 2mm depth) were machined from the plates. Subsequently, the impact
properties of samples from the batch with 0.38% Mg (Table 3.1) were determined by
an INSTRON DYNATUP 9210 drop weight impact tester using the sub-standard size
Charpy specimens for each temper condition (F, T4, T5, T6). The mass of the weight
for the drop weight test was 5.5 kg. In order to achieve a total projectile energy of 5 J,
a drop height of 9.3 cm was required. This resulted in a speed at impact of 1.35 m/s.
Maximum sensitivity was obtained by using a 15 kN load cell.
The validity of using Charpy impact testing to measure the fracture properties of
aluminium alloys has been questioned before [94]. Therefore, the impact results in
this thesis are considered only as a comparative means to rapidly differentiate
between different conditions.
3.8. Optical microscopy and scanning electron microscopy
The samples used for optical microscopy and scanning electron microscopy were
mounted in an electro-conductive resin prior to grinding on SiC papers from P120 to
71
P2400 grit. This was followed by polishing using 9 to 1 µm diamond suspension,
finishing with 50 nm colloidal silica. An optical microscope (LEICA DMI5000 M)
equipped with a camera (LEICA DFC480) and imaging software (Image–Pro MC
v6.0) was used to study the microstructures of the alloys. Scanning electron
microscopy (SEM) was performed with a JEOL JSM-6510. Etching was performed
using an aqueous solution containing 0.5% HF.
3.9. Transmission electron microscopy (TEM) and Atom probe tomography
(APT)
The TEM and APT investigations were conducted at the Australian Centre for
Microscopy & Microanalysis (ACMM), The University of Sydney, Australia. Thin
foil samples of the alloy from the batch with 0.49% Mg (Table 3.1) were prepared
from punched 3 mm discs using electrochemical jet polishing in a solution of 30%
nitric acid in methanol at -30oC. TEM studies were performed using a PHILIPS
CM120 operated at 120 kV. Needle-like samples with fine tips with radii ~ 50 nm for
APT were prepared from blanks with dimensions of 0.3x0.3x15mm3 using a two-
stage electropolishing technique [95]. The first stage involved electropolishing in a
room temperature solution of 25% perchloric acid in acetic acid at 15V, whereas the
second stage was conducted in a room temperature solution of 5% perchloric acid in
2-butoxyethanol at 20V. APT analysis was done using a Local Electrode Atom Probe
(LEAP®) manufactured by Imago Scientific instruments, under ultrahigh vacuum (~
1 x 10⁻⁸ Pa) at a sample temperature of ~ 20 K, with a proven detector efficiency of
this instrument of 57% [96]. The pulse fraction or ratio of pulse voltage to DC
standing voltage employed was 20% with a pulse repetition rate of 200 kHz. In spite
of concerns regarding preparation of APT samples for casting alloys, measurements
with more than 8 million atoms were attained, which is significantly more than what
has been reported for these alloys before [11]. Reconstruction and visualization of the
APT data was done with the Imago Visualization and Analysis Software (IVASTM) in
combination with advanced calibration techniques [96,97]. For quantification of
clusters, the maximum separation algorithm was employed [98]. Mg, Si and Cu atoms
were identified as clusters if they had a separation distance of less than 0.6 nm. A
surrounding distance from these atoms of 0.5 nm was chosen to include all other
elements. The smallest solute clusters taken into account were designated to contain at
72
least n = 10 solute atoms in order to minimise the effect of small solute clusters that
exist in the alloy having a random distribution of solutes [99]. Areas within the
primary α-Al grains were used for study for both TEM and APT, rather than the
eutectic α-Al grains. The rate of nucleation and growth of precipitates has been shown
to be different in the eutectic region of Al-Mg-Si alloys, which is a high solute density
region of the material, compared to the primary α-Al grains [100].
73
4. RESULTS
4.1. Semi-solid metal processing
4.1.1. ProCAST simulation of SSM-HPDC of plates
ProCAST (operating in semi-solid mode with “Viscosity” defined with “Power Cut-
Off”) was used to provide an indication of the flow behaviour and cooling
characteristics of the plates during HPDC. Figure 4.1 shows the simulated flow
behaviour of the SSM-slurry during HPDC. Complete filling of the die is predicted to
occur after only ~ 0.33 s (Fig. 4.1(c)).
To determine how the plates cool down in the die during the intensification step,
values of Tinitial = 580oC (casting temperature) and Tdie = 250oC were used for the
simulation. Complete solidification is predicted to occur within ~ 5.5 s within the
plate (Fig. 4.2(a)), whereas it is predicted to occur only after ~ 20 s in the relatively
high-volume biscuit (Fig. 4.2(b)).
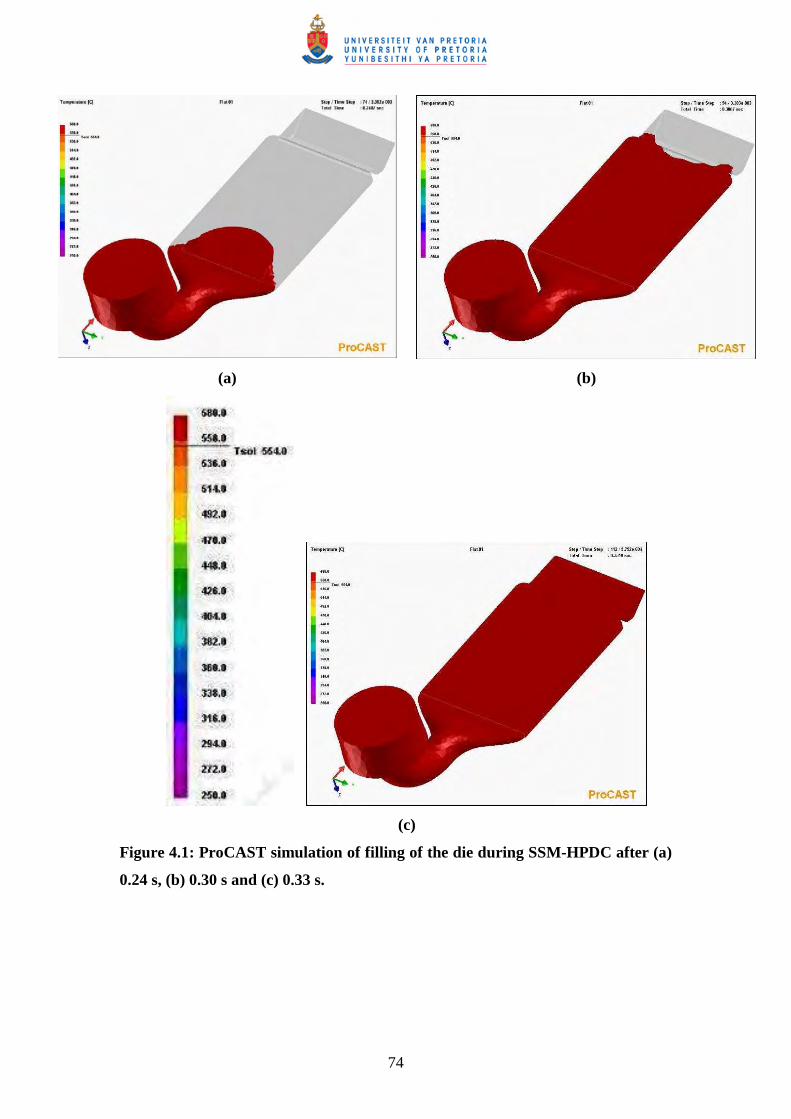
74
(a) (b)
(c)
Figure 4.1: ProCAST simulation of filling of the die during SSM-HPDC after (a)
0.24 s, (b) 0.30 s and (c) 0.33 s.
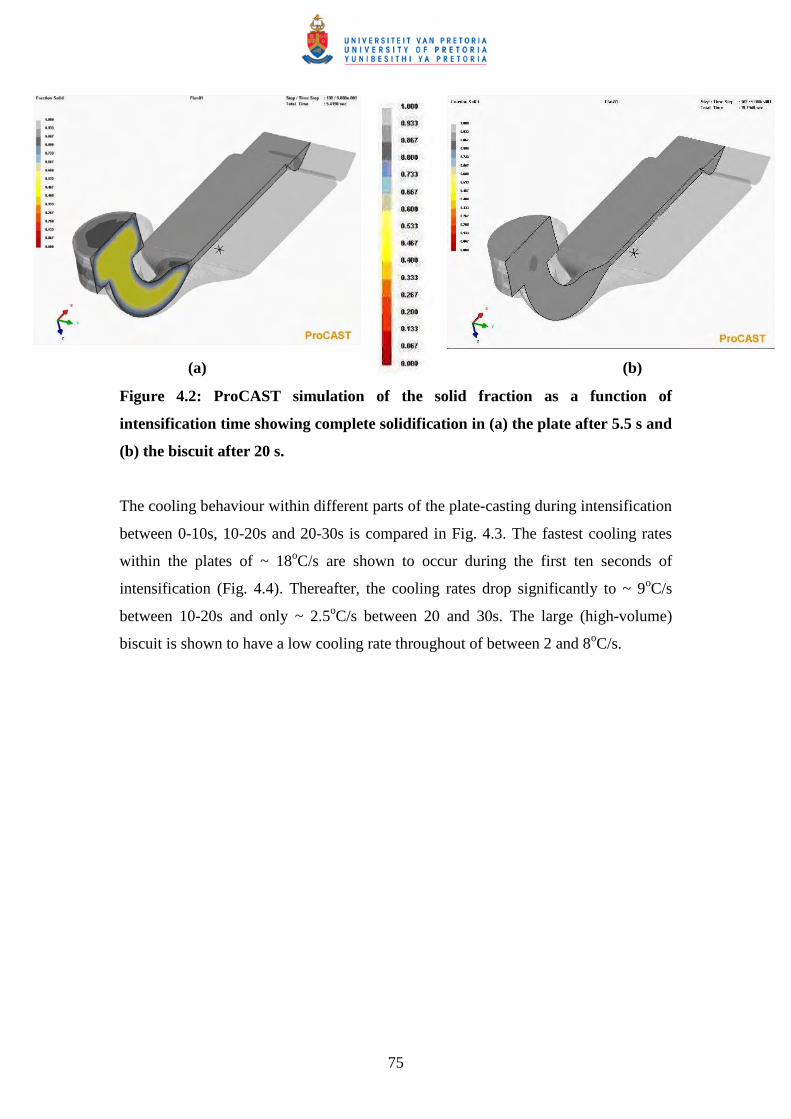
75
(a) (b)
Figure 4.2: ProCAST simulation of the solid fraction as a function of
intensification time showing complete solidification in (a) the plate after 5.5 s and
(b) the biscuit after 20 s.
The cooling behaviour within different parts of the plate-casting during intensification
between 0-10s, 10-20s and 20-30s is compared in Fig. 4.3. The fastest cooling rates
within the plates of ~ 18oC/s are shown to occur during the first ten seconds of
intensification (Fig. 4.4). Thereafter, the cooling rates drop significantly to ~ 9oC/s
between 10-20s and only ~ 2.5oC/s between 20 and 30s. The large (high-volume)
biscuit is shown to have a low cooling rate throughout of between 2 and 8oC/s.
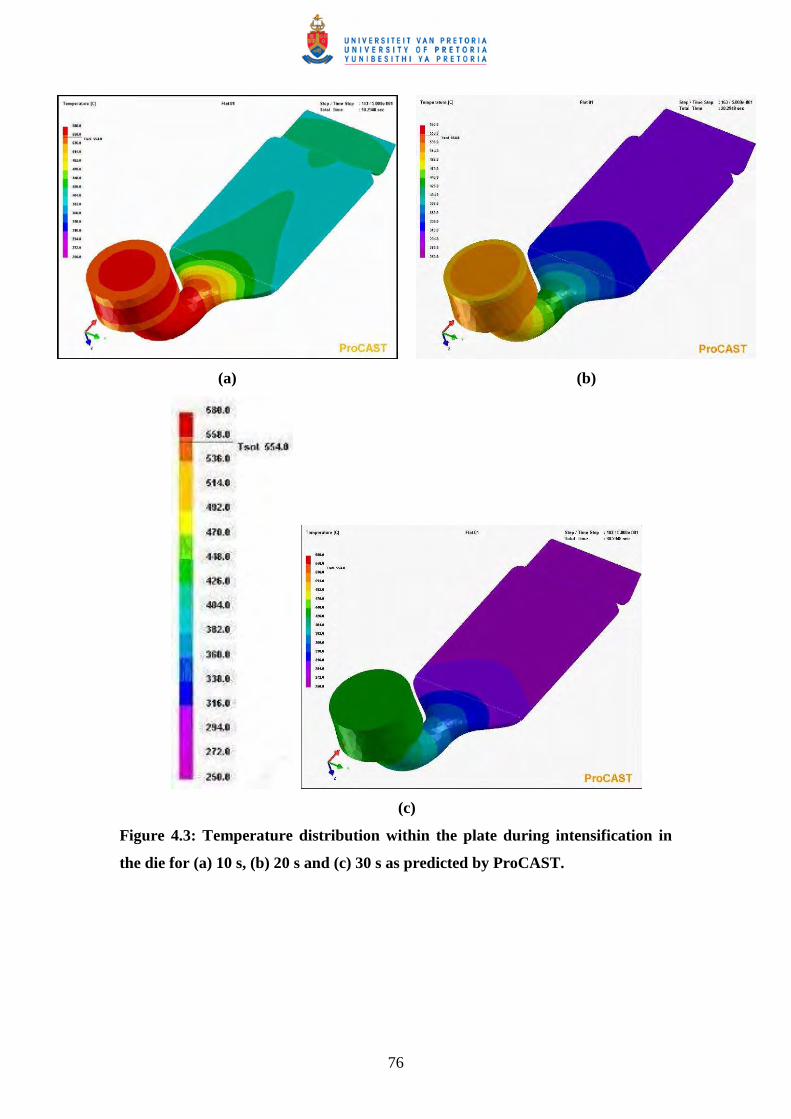
76
(a) (b)
(c)
Figure 4.3: Temperature distribution within the plate during intensification in
the die for (a) 10 s, (b) 20 s and (c) 30 s as predicted by ProCAST.
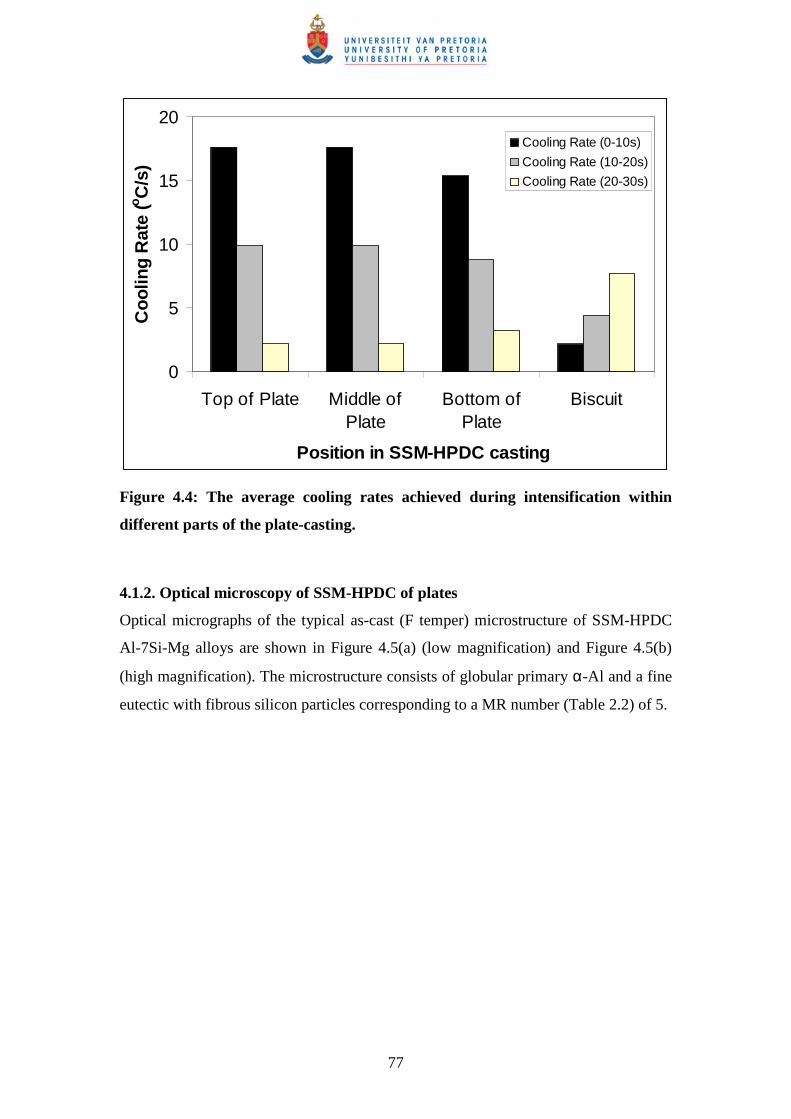
77
0
5
10
15
20
Top of Plate Middle ofPlate
Bottom ofPlate
Biscuit
Position in SSM-HPDC casting
Co
olin
g R
ate
(oC
/s)
Cooling Rate (0-10s)
Cooling Rate (10-20s)
Cooling Rate (20-30s)
Figure 4.4: The average cooling rates achieved during intensification within
different parts of the plate-casting.
4.1.2. Optical microscopy of SSM-HPDC of plates
Optical micrographs of the typical as-cast (F temper) microstructure of SSM-HPDC
Al-7Si-Mg alloys are shown in Figure 4.5(a) (low magnification) and Figure 4.5(b)
(high magnification). The microstructure consists of globular primary α-Al and a fine
eutectic with fibrous silicon particles corresponding to a MR number (Table 2.2) of 5.
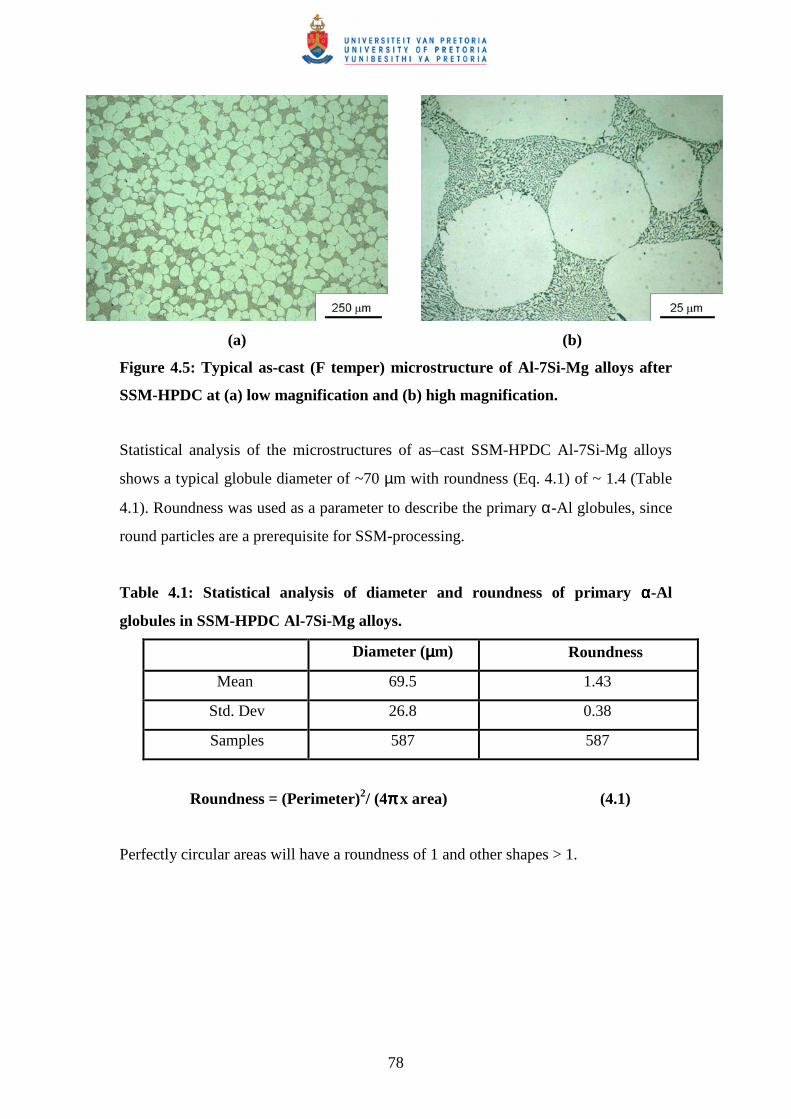
78
(a) (b)
Figure 4.5: Typical as-cast (F temper) microstructure of Al-7Si-Mg alloys after
SSM-HPDC at (a) low magnification and (b) high magnification.
Statistical analysis of the microstructures of as–cast SSM-HPDC Al-7Si-Mg alloys
shows a typical globule diameter of ~70 µm with roundness (Eq. 4.1) of ~ 1.4 (Table
4.1). Roundness was used as a parameter to describe the primary α-Al globules, since
round particles are a prerequisite for SSM-processing.
Table 4.1: Statistical analysis of diameter and roundness of primary αααα-Al
globules in SSM-HPDC Al-7Si-Mg alloys.
Diameter (µµµµm) Roundness
Mean 69.5 1.43
Std. Dev 26.8 0.38
Samples 587 587
Roundness = (Perimeter)2/ (4ππππ x area) (4.1)
Perfectly circular areas will have a roundness of 1 and other shapes > 1.
79
4.2. Solution heat treatment
4.2.1. Spheroidisation of eutectic Si
The size and shape of the eutectic silicon particles in Al-7Si-Mg alloys can be
“modified” (refined) either by chemical additions such as Sr or by rapid cooling
during solidification (Table 2.2). Figure 4.6 shows optical micrographs of as-cast
SSM-HPDC Al-7Si-Mg alloys with varying Sr contents. Statistical analysis of the
eutectic Si-particles in these samples is presented in Table 4.2. The aspect ratio (the
ratio between the major axis and minor axis of an ellipse equivalent to the object) is
used for the eutectic Si-particles, since this parameter has been shown to influence the
properties of these alloys [101].
Table 4.2: Statistical analysis of equivalent diameter and aspect ratio of eutectic
Si in as-cast SSM-HPDC Al-7Si-Mg alloys with 2, 14 and 200 ppm Sr.
Diameter (µµµµm) Aspect ratio
2 ppm 14 ppm 200 ppm 2 ppm 14 ppm 200 ppm
Mean 1.47 0.62 0.86 2.59 2.03 2.13
Std.Dev 1.22 0.57 0.79 2.0 0.95 1.2
Samples 772 1302 792 772 1302 792
The SSM-HPDC processed alloy containing 2 ppm Sr has coarser Si-eutectic particles
with a higher aspect ratio (MR = 3) than the 14 ppm Sr and the 200 ppm Sr alloys
(Table 4.2). The full modification (MR = 5) of the 14 ppm Sr alloy is due to the high
cooling rates that are achieved during HPDC (Fig. 4.4). For comparison, Fig. 4.7
shows the unmodified microstructure (MR = 1) of the 14 ppm Sr alloy that had been
rheoprocessed only and left to cool to room temperature in air (no HPDC).
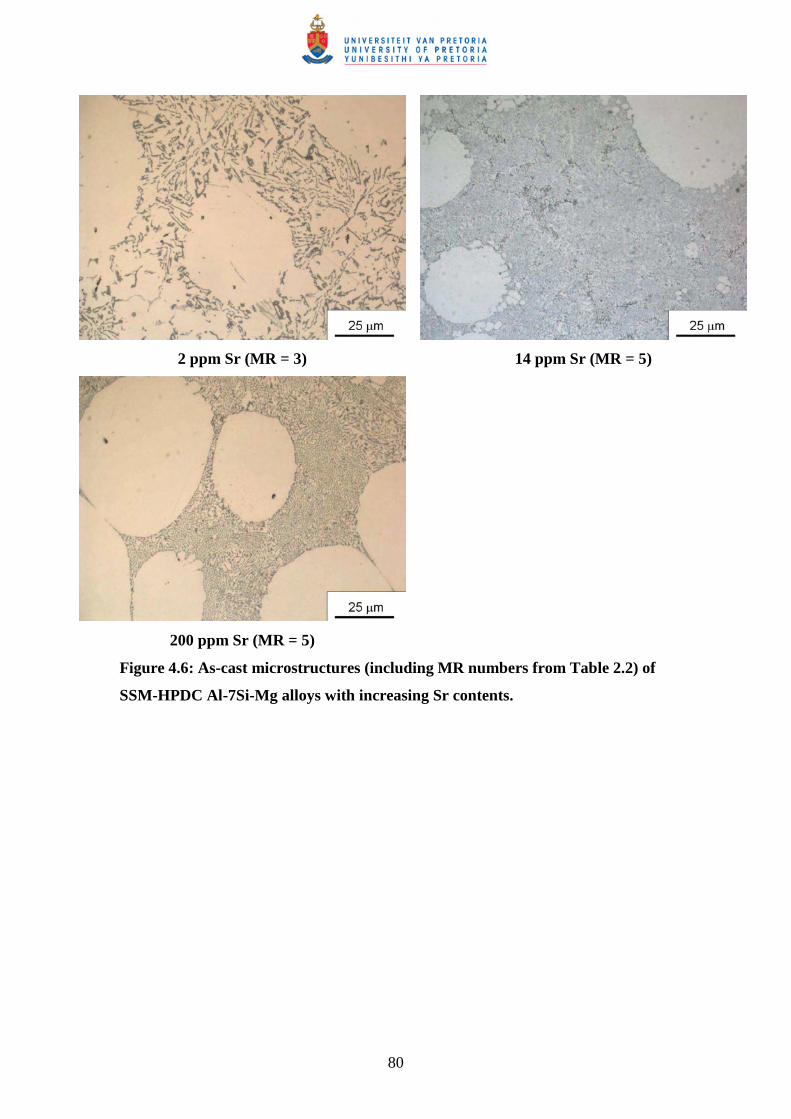
80
2 ppm Sr (MR = 3) 14 ppm Sr (MR = 5)
200 ppm Sr (MR = 5)
Figure 4.6: As-cast microstructures (including MR numbers from Table 2.2) of
SSM-HPDC Al-7Si-Mg alloys with increasing Sr contents.
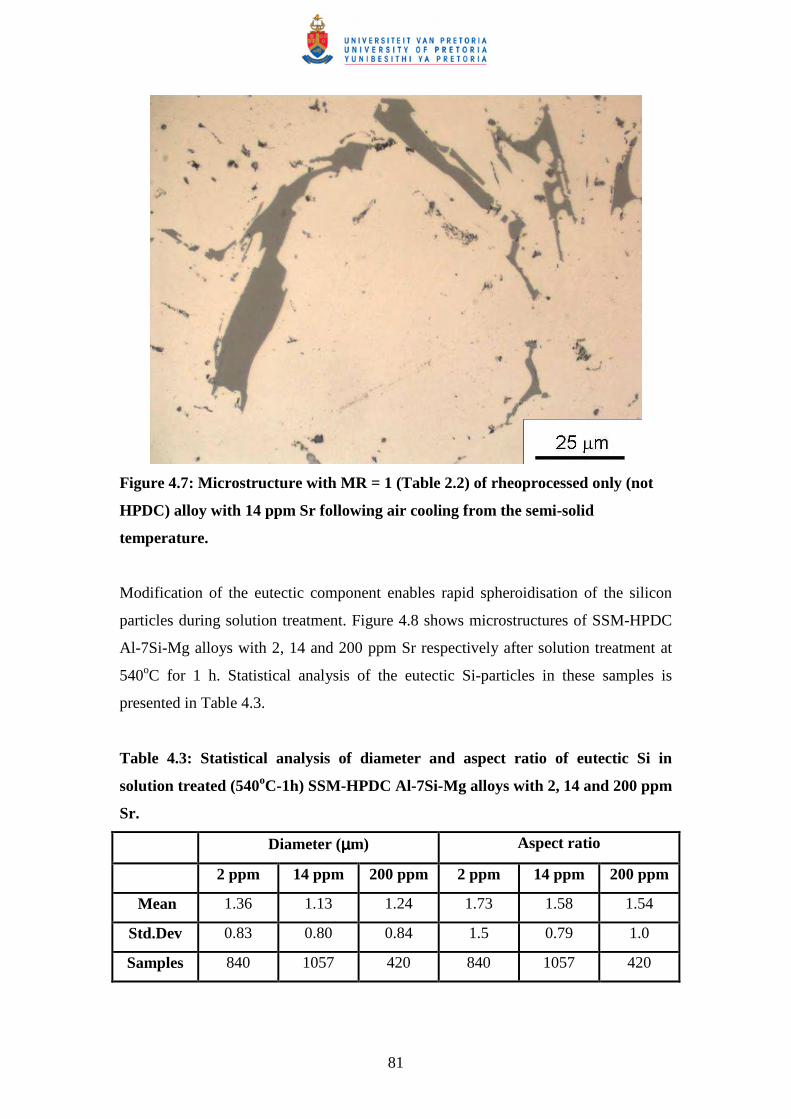
81
Figure 4.7: Microstructure with MR = 1 (Table 2.2) of rheoprocessed only (not
HPDC) alloy with 14 ppm Sr following air cooling from the semi-solid
temperature.
Modification of the eutectic component enables rapid spheroidisation of the silicon
particles during solution treatment. Figure 4.8 shows microstructures of SSM-HPDC
Al-7Si-Mg alloys with 2, 14 and 200 ppm Sr respectively after solution treatment at
540oC for 1 h. Statistical analysis of the eutectic Si-particles in these samples is
presented in Table 4.3.
Table 4.3: Statistical analysis of diameter and aspect ratio of eutectic Si in
solution treated (540oC-1h) SSM-HPDC Al-7Si-Mg alloys with 2, 14 and 200 ppm
Sr.
Diameter (µµµµm) Aspect ratio
2 ppm 14 ppm 200 ppm 2 ppm 14 ppm 200 ppm
Mean 1.36 1.13 1.24 1.73 1.58 1.54
Std.Dev 0.83 0.80 0.84 1.5 0.79 1.0
Samples 840 1057 420 840 1057 420
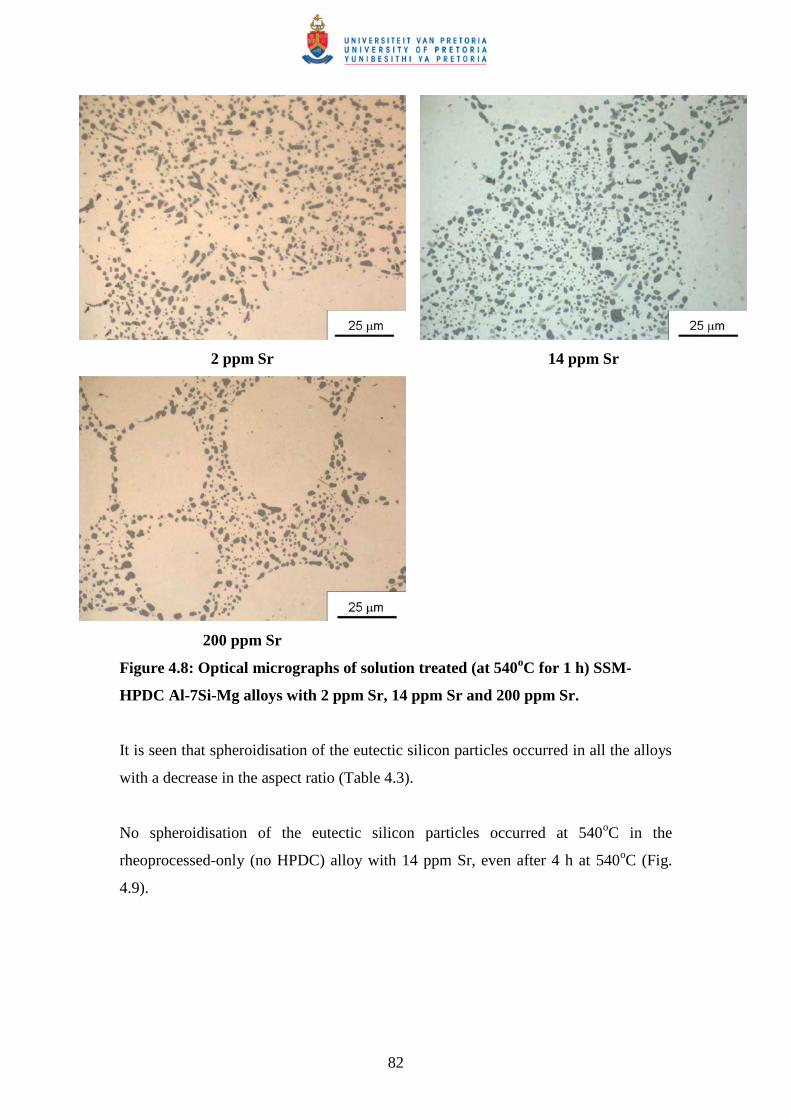
82
2 ppm Sr 14 ppm Sr
200 ppm Sr
Figure 4.8: Optical micrographs of solution treated (at 540oC for 1 h) SSM-
HPDC Al-7Si-Mg alloys with 2 ppm Sr, 14 ppm Sr and 200 ppm Sr.
It is seen that spheroidisation of the eutectic silicon particles occurred in all the alloys
with a decrease in the aspect ratio (Table 4.3).
No spheroidisation of the eutectic silicon particles occurred at 540oC in the
rheoprocessed-only (no HPDC) alloy with 14 ppm Sr, even after 4 h at 540oC (Fig.
4.9).
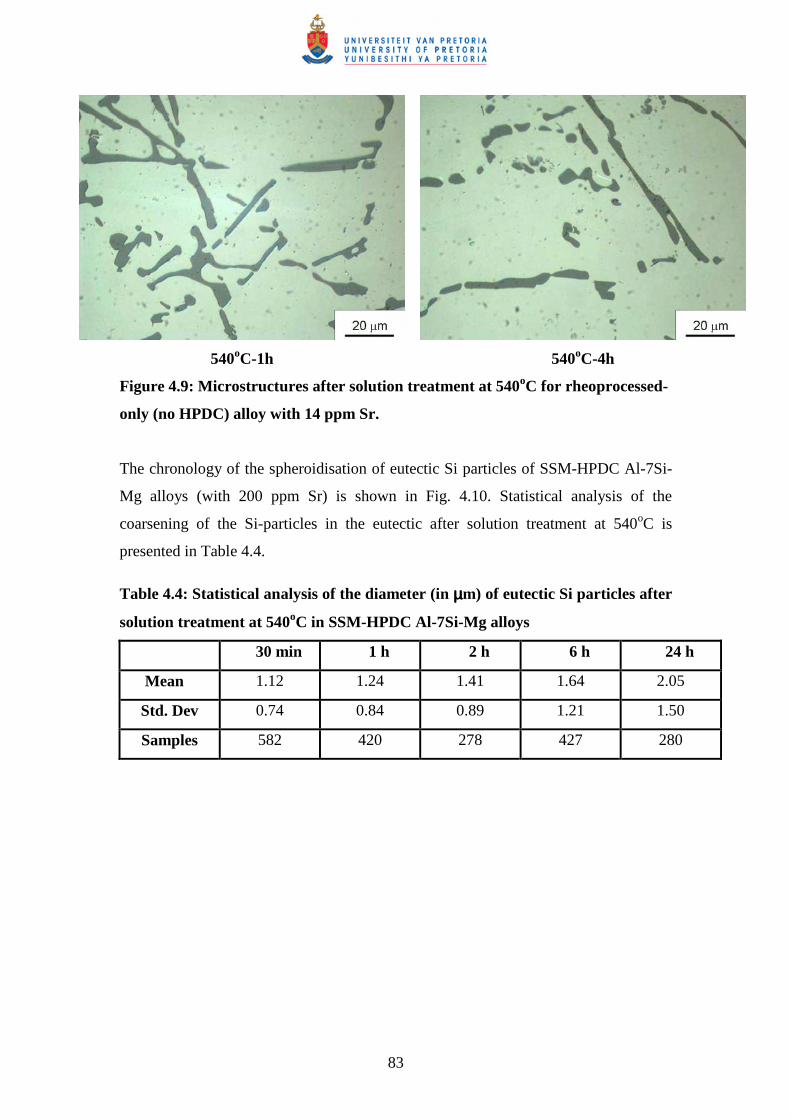
83
540oC-1h 540oC-4h
Figure 4.9: Microstructures after solution treatment at 540oC for rheoprocessed-
only (no HPDC) alloy with 14 ppm Sr.
The chronology of the spheroidisation of eutectic Si particles of SSM-HPDC Al-7Si-
Mg alloys (with 200 ppm Sr) is shown in Fig. 4.10. Statistical analysis of the
coarsening of the Si-particles in the eutectic after solution treatment at 540oC is
presented in Table 4.4.
Table 4.4: Statistical analysis of the diameter (in µµµµm) of eutectic Si particles after
solution treatment at 540oC in SSM-HPDC Al-7Si-Mg alloys
30 min 1 h 2 h 6 h 24 h
Mean 1.12 1.24 1.41 1.64 2.05
Std. Dev 0.74 0.84 0.89 1.21 1.50
Samples 582 420 278 427 280
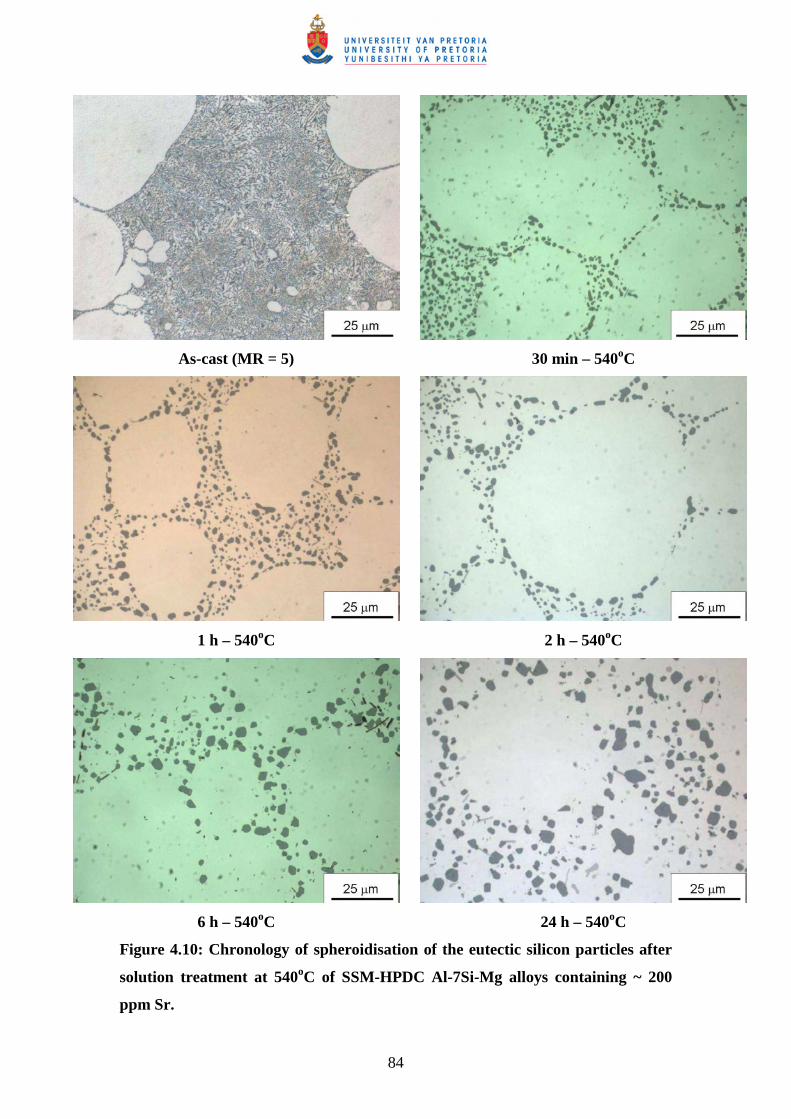
84
As-cast (MR = 5) 30 min – 540oC
1 h – 540oC 2 h – 540oC
6 h – 540oC 24 h – 540oC
Figure 4.10: Chronology of spheroidisation of the eutectic silicon particles after
solution treatment at 540oC of SSM-HPDC Al-7Si-Mg alloys containing ~ 200
ppm Sr.
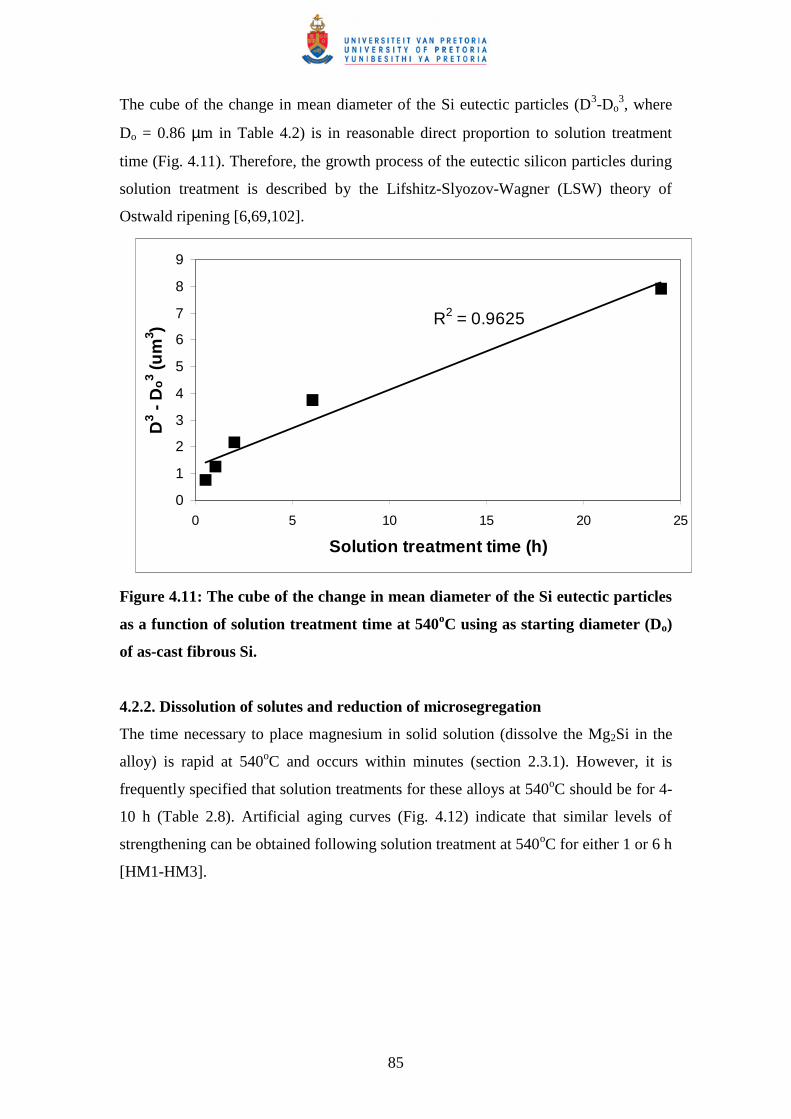
85
The cube of the change in mean diameter of the Si eutectic particles (D3-Do3, where
Do = 0.86 µm in Table 4.2) is in reasonable direct proportion to solution treatment
time (Fig. 4.11). Therefore, the growth process of the eutectic silicon particles during
solution treatment is described by the Lifshitz-Slyozov-Wagner (LSW) theory of
Ostwald ripening [6,69,102].
R2 = 0.9625
0
1
2
3
4
5
6
7
8
9
0 5 10 15 20 25
Solution treatment time (h)
D3 -
Do
3 (um
3 )
Figure 4.11: The cube of the change in mean diameter of the Si eutectic particles
as a function of solution treatment time at 540oC using as starting diameter (Do)
of as-cast fibrous Si.
4.2.2. Dissolution of solutes and reduction of microsegregation
The time necessary to place magnesium in solid solution (dissolve the Mg2Si in the
alloy) is rapid at 540oC and occurs within minutes (section 2.3.1). However, it is
frequently specified that solution treatments for these alloys at 540oC should be for 4-
10 h (Table 2.8). Artificial aging curves (Fig. 4.12) indicate that similar levels of
strengthening can be obtained following solution treatment at 540oC for either 1 or 6 h
[HM1-HM3].
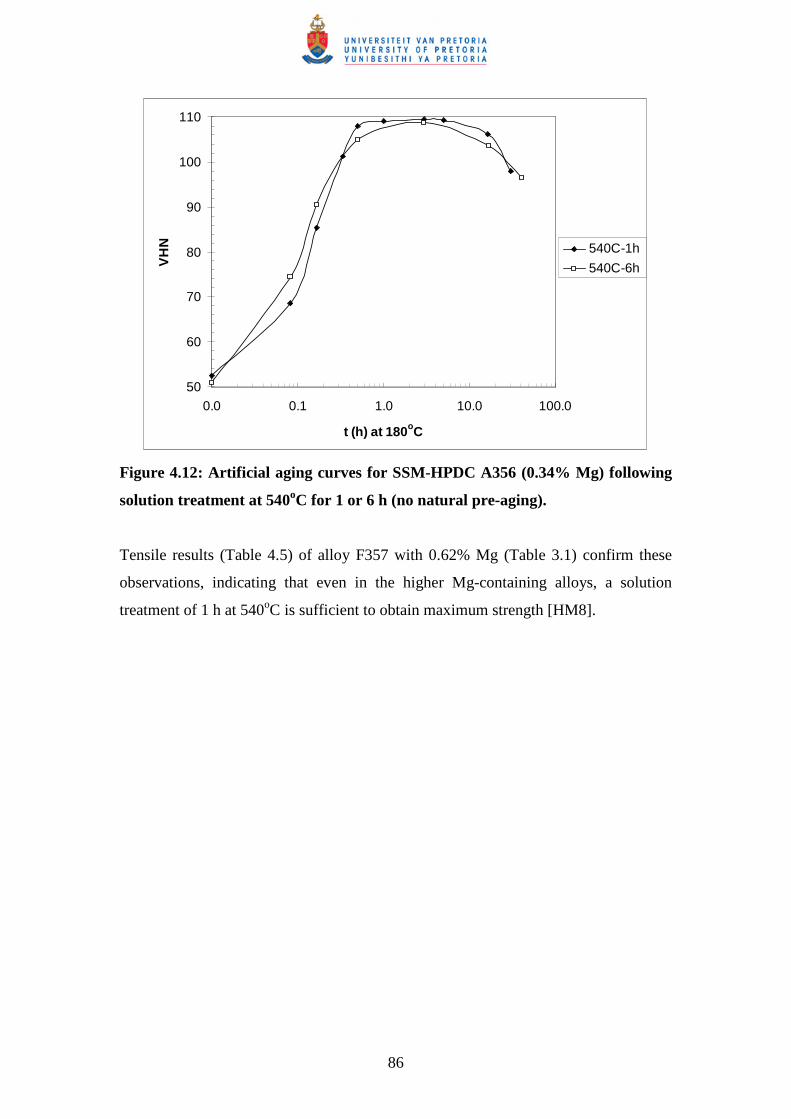
86
50
60
70
80
90
100
110
0.0 0.1 1.0 10.0 100.0
t (h) at 180oC
VH
N 540C-1h
540C-6h
Figure 4.12: Artificial aging curves for SSM-HPDC A356 (0.34% Mg) following
solution treatment at 540oC for 1 or 6 h (no natural pre-aging).
Tensile results (Table 4.5) of alloy F357 with 0.62% Mg (Table 3.1) confirm these
observations, indicating that even in the higher Mg-containing alloys, a solution
treatment of 1 h at 540oC is sufficient to obtain maximum strength [HM8].
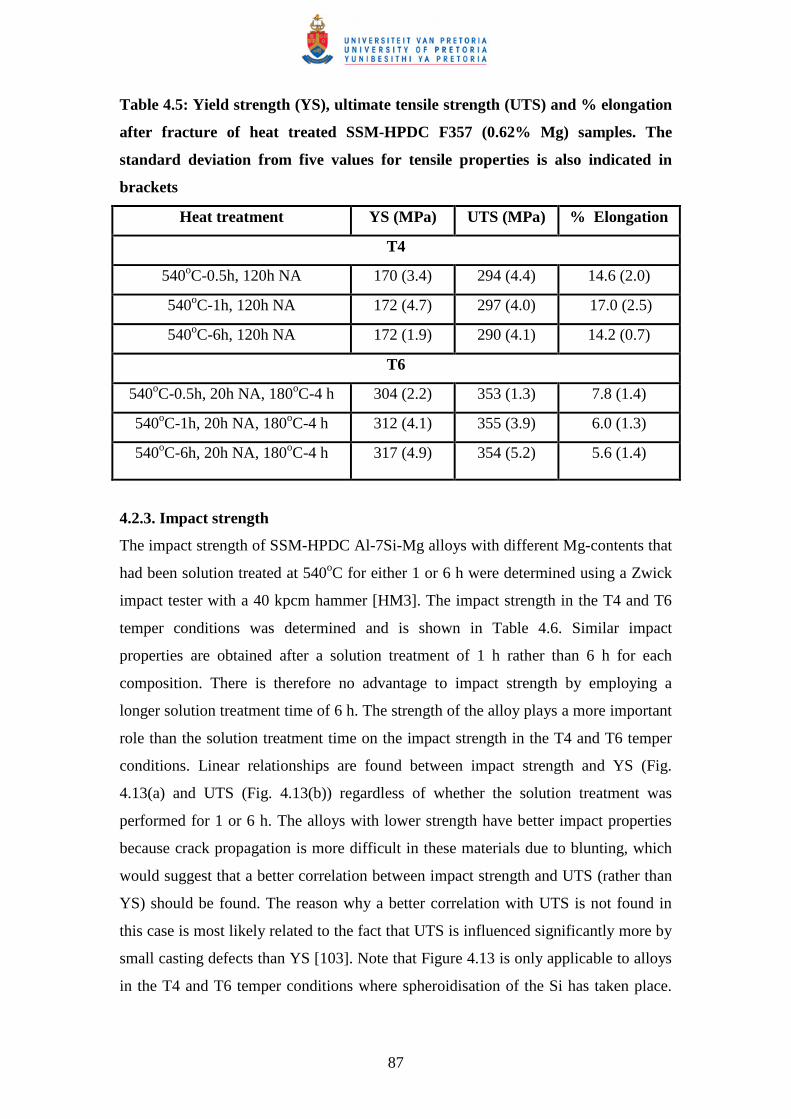
87
Table 4.5: Yield strength (YS), ultimate tensile strength (UTS) and % elongation
after fracture of heat treated SSM-HPDC F357 (0.62% Mg) samples. The
standard deviation from five values for tensile properties is also indicated in
brackets
Heat treatment YS (MPa) UTS (MPa) % Elongation
T4
540oC-0.5h, 120h NA 170 (3.4) 294 (4.4) 14.6 (2.0)
540oC-1h, 120h NA 172 (4.7) 297 (4.0) 17.0 (2.5)
540oC-6h, 120h NA 172 (1.9) 290 (4.1) 14.2 (0.7)
T6
540oC-0.5h, 20h NA, 180oC-4 h 304 (2.2) 353 (1.3) 7.8 (1.4)
540oC-1h, 20h NA, 180oC-4 h 312 (4.1) 355 (3.9) 6.0 (1.3)
540oC-6h, 20h NA, 180oC-4 h 317 (4.9) 354 (5.2) 5.6 (1.4)
4.2.3. Impact strength
The impact strength of SSM-HPDC Al-7Si-Mg alloys with different Mg-contents that
had been solution treated at 540oC for either 1 or 6 h were determined using a Zwick
impact tester with a 40 kpcm hammer [HM3]. The impact strength in the T4 and T6
temper conditions was determined and is shown in Table 4.6. Similar impact
properties are obtained after a solution treatment of 1 h rather than 6 h for each
composition. There is therefore no advantage to impact strength by employing a
longer solution treatment time of 6 h. The strength of the alloy plays a more important
role than the solution treatment time on the impact strength in the T4 and T6 temper
conditions. Linear relationships are found between impact strength and YS (Fig.
4.13(a) and UTS (Fig. 4.13(b)) regardless of whether the solution treatment was
performed for 1 or 6 h. The alloys with lower strength have better impact properties
because crack propagation is more difficult in these materials due to blunting, which
would suggest that a better correlation between impact strength and UTS (rather than
YS) should be found. The reason why a better correlation with UTS is not found in
this case is most likely related to the fact that UTS is influenced significantly more by
small casting defects than YS [103]. Note that Figure 4.13 is only applicable to alloys
in the T4 and T6 temper conditions where spheroidisation of the Si has taken place.
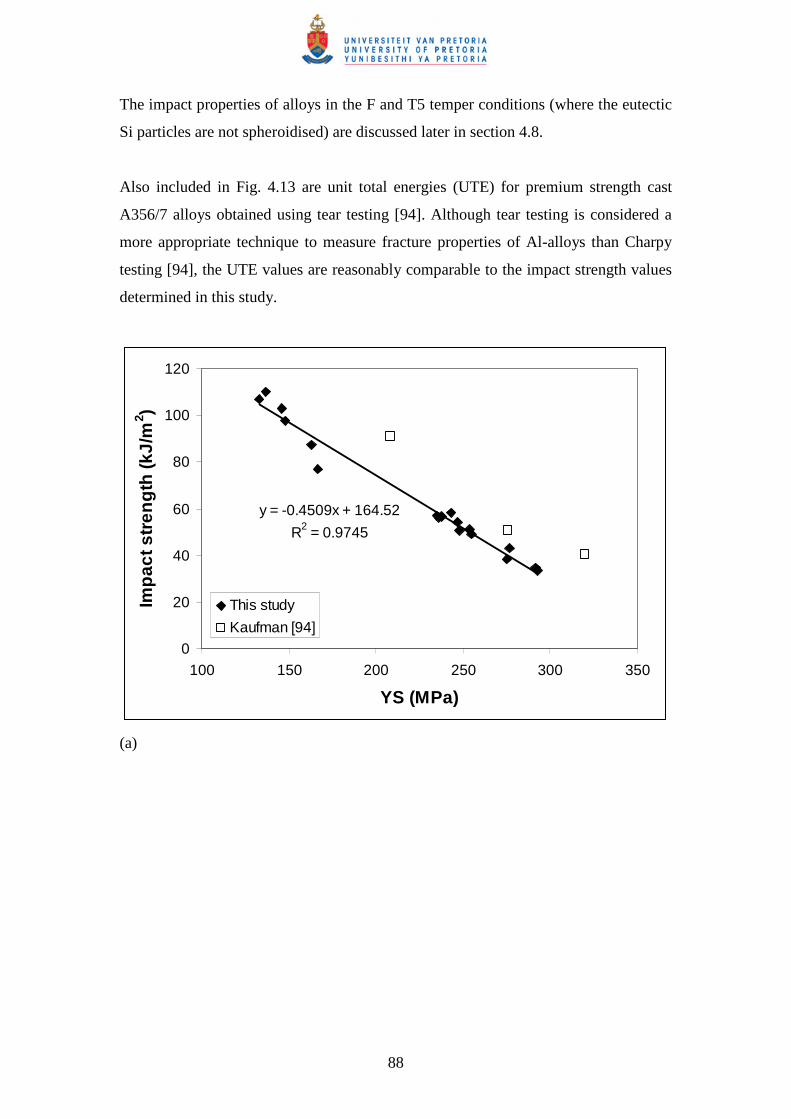
88
The impact properties of alloys in the F and T5 temper conditions (where the eutectic
Si particles are not spheroidised) are discussed later in section 4.8.
Also included in Fig. 4.13 are unit total energies (UTE) for premium strength cast
A356/7 alloys obtained using tear testing [94]. Although tear testing is considered a
more appropriate technique to measure fracture properties of Al-alloys than Charpy
testing [94], the UTE values are reasonably comparable to the impact strength values
determined in this study.
y = -0.4509x + 164.52
R2 = 0.9745
0
20
40
60
80
100
120
100 150 200 250 300 350
YS (MPa)
Imp
act s
tren
gth
(kJ/
m2 )
This study
Kaufman [94]
(a)
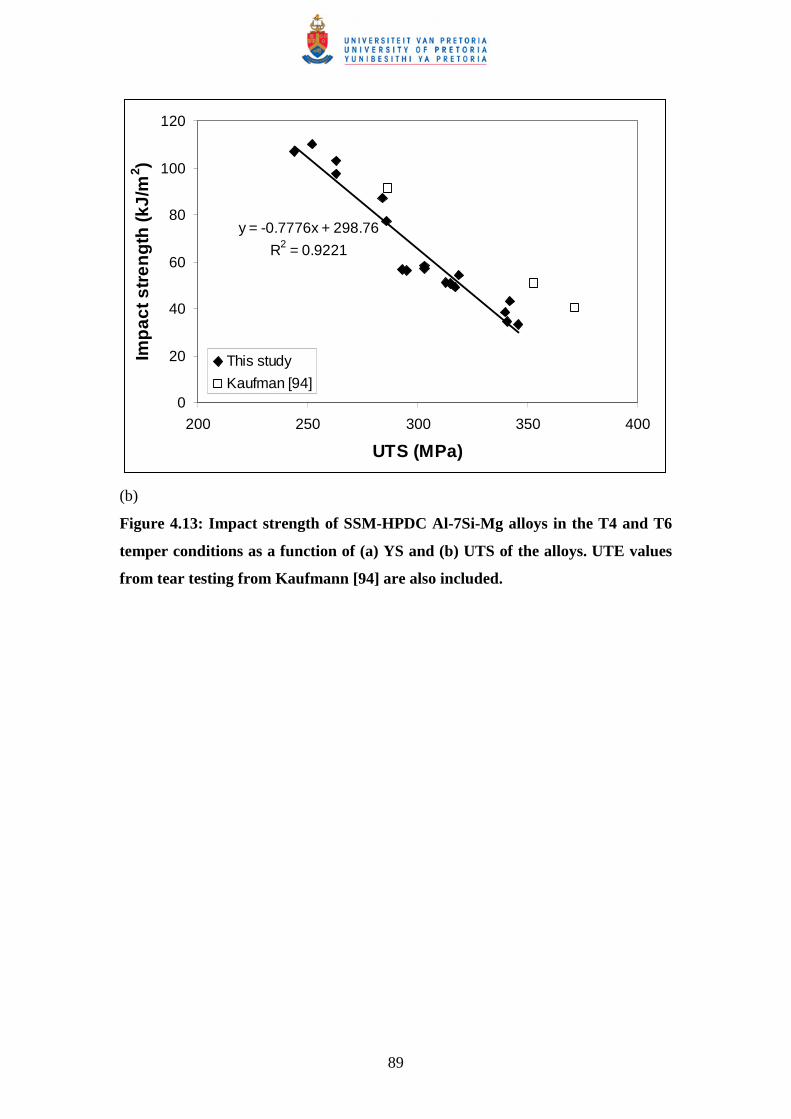
89
y = -0.7776x + 298.76
R2 = 0.9221
0
20
40
60
80
100
120
200 250 300 350 400
UTS (MPa)
Imp
act s
tren
gth
(kJ/
m2 )
This study
Kaufman [94]
(b)
Figure 4.13: Impact strength of SSM-HPDC Al-7Si-Mg alloys in the T4 and T6
temper conditions as a function of (a) YS and (b) UTS of the alloys. UTE values
from tear testing from Kaufmann [94] are also included.
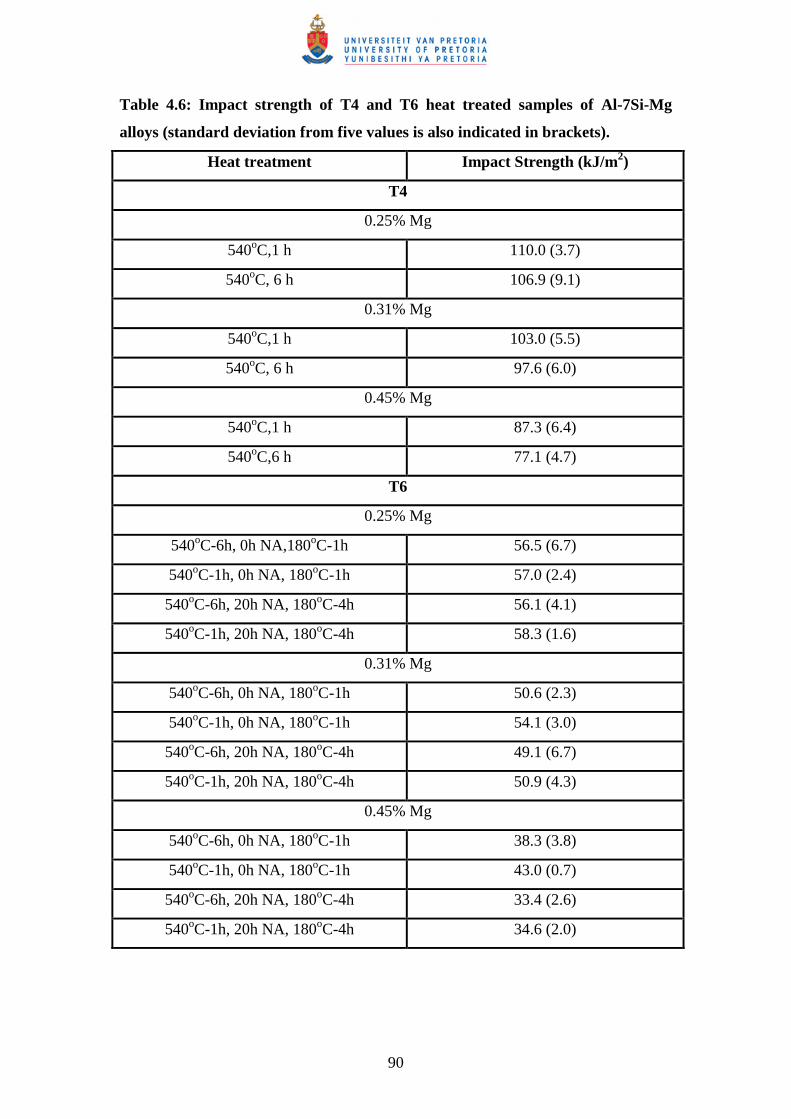
90
Table 4.6: Impact strength of T4 and T6 heat treated samples of Al-7Si-Mg
alloys (standard deviation from five values is also indicated in brackets).
Heat treatment Impact Strength (kJ/m2)
T4
0.25% Mg
540oC,1 h 110.0 (3.7)
540oC, 6 h 106.9 (9.1)
0.31% Mg
540oC,1 h 103.0 (5.5)
540oC, 6 h 97.6 (6.0)
0.45% Mg
540oC,1 h 87.3 (6.4)
540oC,6 h 77.1 (4.7)
T6
0.25% Mg
540oC-6h, 0h NA,180oC-1h 56.5 (6.7)
540oC-1h, 0h NA, 180oC-1h 57.0 (2.4)
540oC-6h, 20h NA, 180oC-4h 56.1 (4.1)
540oC-1h, 20h NA, 180oC-4h 58.3 (1.6)
0.31% Mg
540oC-6h, 0h NA, 180oC-1h 50.6 (2.3)
540oC-1h, 0h NA, 180oC-1h 54.1 (3.0)
540oC-6h, 20h NA, 180oC-4h 49.1 (6.7)
540oC-1h, 20h NA, 180oC-4h 50.9 (4.3)
0.45% Mg
540oC-6h, 0h NA, 180oC-1h 38.3 (3.8)
540oC-1h, 0h NA, 180oC-1h 43.0 (0.7)
540oC-6h, 20h NA, 180oC-4h 33.4 (2.6)
540oC-1h, 20h NA, 180oC-4h 34.6 (2.0)
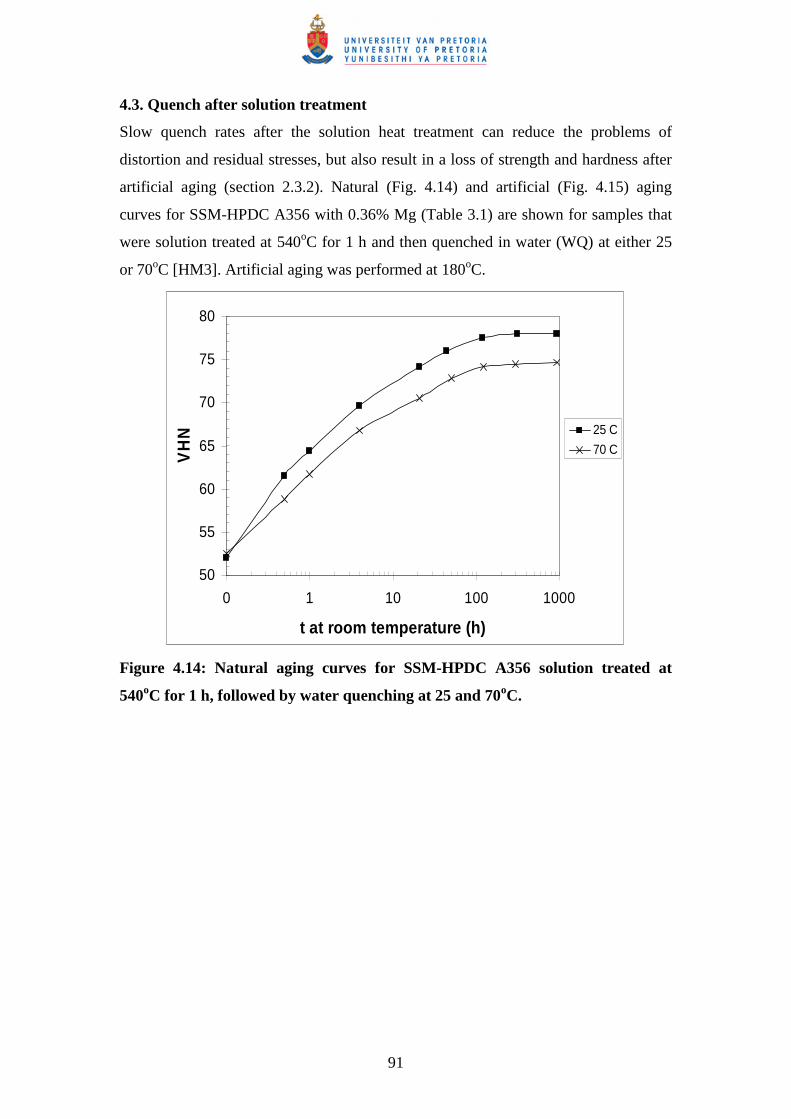
91
4.3. Quench after solution treatment
Slow quench rates after the solution heat treatment can reduce the problems of
distortion and residual stresses, but also result in a loss of strength and hardness after
artificial aging (section 2.3.2). Natural (Fig. 4.14) and artificial (Fig. 4.15) aging
curves for SSM-HPDC A356 with 0.36% Mg (Table 3.1) are shown for samples that
were solution treated at 540oC for 1 h and then quenched in water (WQ) at either 25
or 70oC [HM3]. Artificial aging was performed at 180oC.
50
55
60
65
70
75
80
0 1 10 100 1000
t at room temperature (h)
VH
N 25 C
70 C
Figure 4.14: Natural aging curves for SSM-HPDC A356 solution treated at
540oC for 1 h, followed by water quenching at 25 and 70oC.
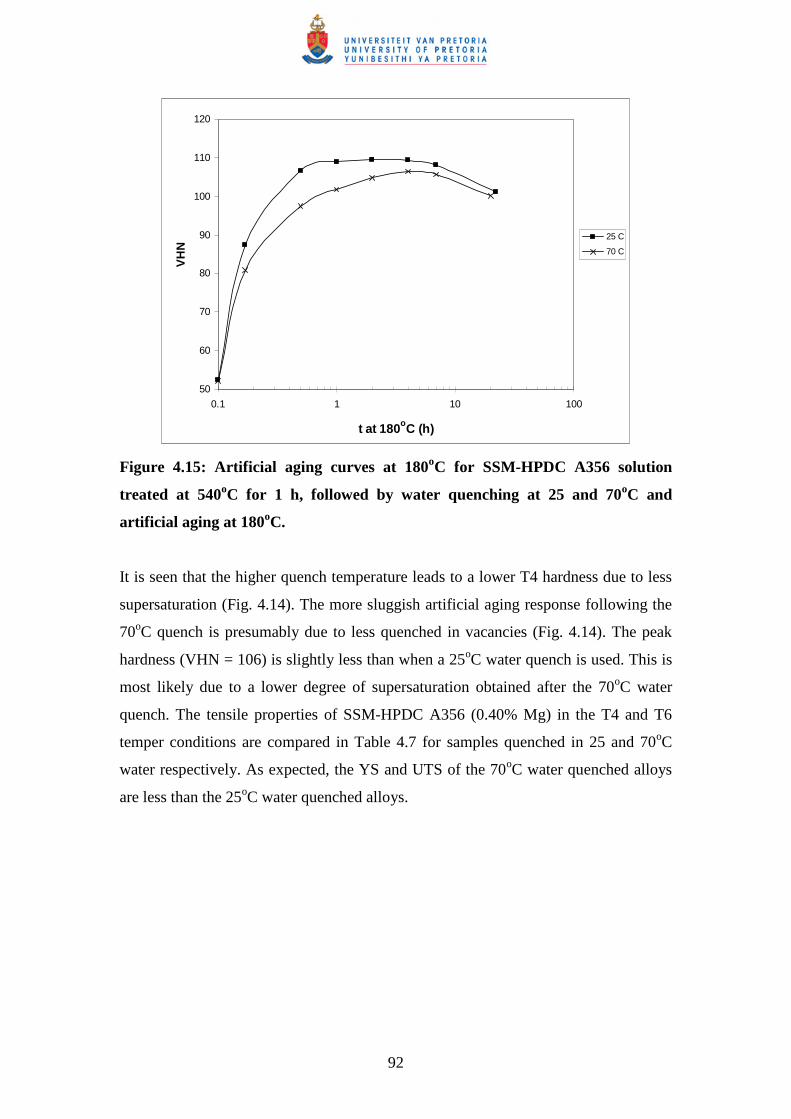
92
50
60
70
80
90
100
110
120
0.1 1 10 100
t at 180oC (h)
VH
N
25 C
70 C
Figure 4.15: Artificial aging curves at 180oC for SSM-HPDC A356 solution
treated at 540oC for 1 h, followed by water quenching at 25 and 70oC and
artificial aging at 180oC.
It is seen that the higher quench temperature leads to a lower T4 hardness due to less
supersaturation (Fig. 4.14). The more sluggish artificial aging response following the
70oC quench is presumably due to less quenched in vacancies (Fig. 4.14). The peak
hardness (VHN = 106) is slightly less than when a 25oC water quench is used. This is
most likely due to a lower degree of supersaturation obtained after the 70oC water
quench. The tensile properties of SSM-HPDC A356 (0.40% Mg) in the T4 and T6
temper conditions are compared in Table 4.7 for samples quenched in 25 and 70oC
water respectively. As expected, the YS and UTS of the 70oC water quenched alloys
are less than the 25oC water quenched alloys.
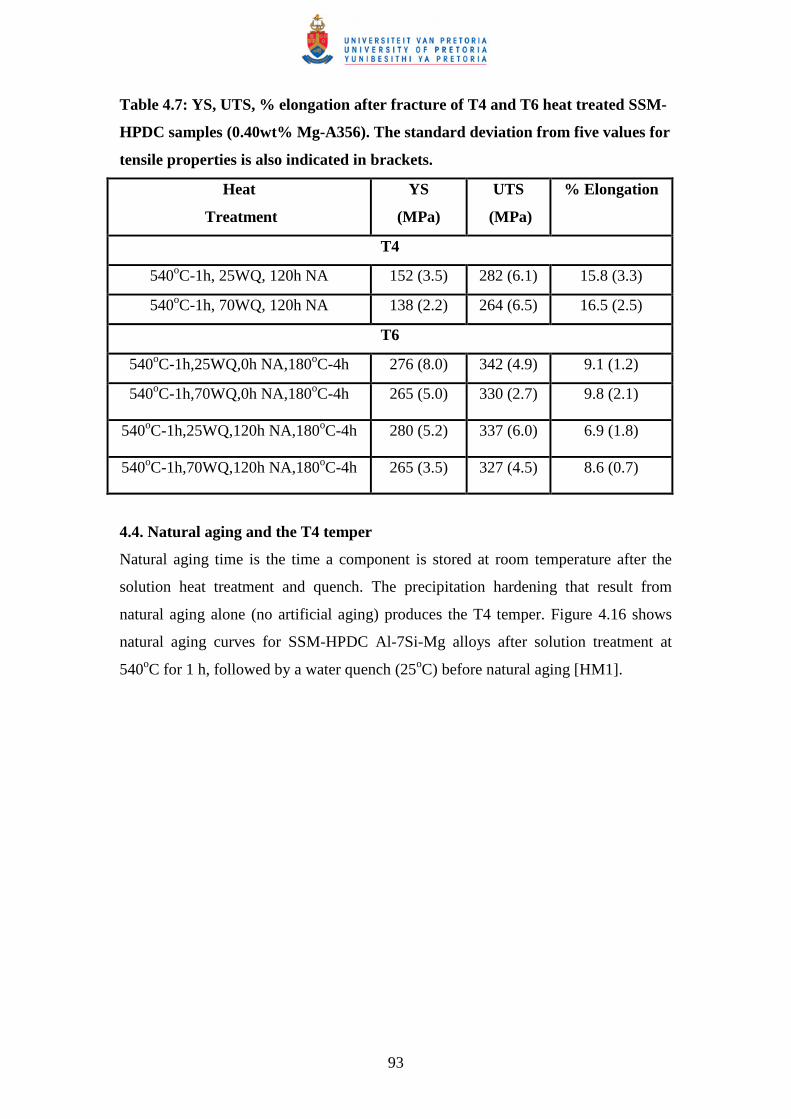
93
Table 4.7: YS, UTS, % elongation after fracture of T4 and T6 heat treated SSM-
HPDC samples (0.40wt% Mg-A356). The standard deviation from five values for
tensile properties is also indicated in brackets.
Heat
Treatment
YS
(MPa)
UTS
(MPa)
% Elongation
T4
540oC-1h, 25WQ, 120h NA 152 (3.5) 282 (6.1) 15.8 (3.3)
540oC-1h, 70WQ, 120h NA 138 (2.2) 264 (6.5) 16.5 (2.5)
T6
540oC-1h,25WQ,0h NA,180oC-4h 276 (8.0) 342 (4.9) 9.1 (1.2)
540oC-1h,70WQ,0h NA,180oC-4h 265 (5.0) 330 (2.7) 9.8 (2.1)
540oC-1h,25WQ,120h NA,180oC-4h 280 (5.2) 337 (6.0) 6.9 (1.8)
540oC-1h,70WQ,120h NA,180oC-4h 265 (3.5) 327 (4.5) 8.6 (0.7)
4.4. Natural aging and the T4 temper
Natural aging time is the time a component is stored at room temperature after the
solution heat treatment and quench. The precipitation hardening that result from
natural aging alone (no artificial aging) produces the T4 temper. Figure 4.16 shows
natural aging curves for SSM-HPDC Al-7Si-Mg alloys after solution treatment at
540oC for 1 h, followed by a water quench (25oC) before natural aging [HM1].
94
50
55
60
65
70
75
80
85
90
0 1 10 100 1000
Natural aging time (h)
VH
N
0.28% Mg
0.34% Mg
0.45% Mg
Figure 4.16: Natural aging curves for SSM-HPDC Al-7Si-Mg alloys following
solution treatment at 540oC for 1 h and a 25oC water quench.
The alloy is relatively soft immediately after quenching (VHN = ~ 53), but thereafter
the hardness increases rapidly and eventually levels out after about 120 h
corresponding to the stable T4 temper. The natural aging response of these alloys is
considered to be due to the forming of (Mg+Si) clusters (see APT results in section
4.14). The tensile properties of SSM-HPDC Al-7Si-Mg alloys with different Mg-
contents are shown in Table 4.8.
95
Table 4.8: YS, UTS, % elongation after fracture of T4 heat treated SSM-HPDC
Al-7Si-Mg alloys (solution treated at 540oC-1 h, 25oC water quench and natural
aging for at least 120 h). The standard deviation from five values for tensile
properties is also indicated in brackets.
Mg-content
(wt%)
YS
(MPa)
UTS
(MPa)
% Elongation
0.25 137 (4.2) 252 (6.2) 20.2 (0.94)
0.31 146 (7.3) 263 (8.8) 17.4 (1.8)
0.38 152 (2.1) 268 (3.9) 14.5 (1.3)
0.40 152 (3.5) 282 (6.1) 15.8 (3.3)
0.45 163 (1.5) 284 (2.6) 16.5 (1.9)
0.62 172 (4.7) 297 (4.0) 17.0 (2.5)
4.5. Artificial aging and the T6 temper
Artificial aging is performed at temperatures above room temperature to cause
precipitation of strengthening phases. Artificial aging curves at artificial aging
temperatures of 160, 180 and 190oC are shown in Fig. 4.17 [HM2]. The curves were
determined for samples that were solution treated at 540oC for 6 h, water quenched
and naturally aged for 20 h before artificial aging. As expected, the maximum
hardness is reached in a shorter time as aging temperatures are increased due to higher
diffusion rates. However, the maximum hardness achieved simultaneously decreases
slightly, due to the higher solubility and hence lower supersaturation, leading to a
lower nucleation rate and volume fraction of strengthening phases at higher aging
temperatures. The optimum artificial aging parameters depend on the properties
required. If a high hardness (strength) is required, a low aging temperature is required
(such as 160oC), but this unfortunately takes relatively long times to obtain this high
hardness (Fig. 4.17). The best combination of relatively short aging treatments
resulting in acceptably high hardness values is obtained by aging at 170-180oC. If a
short aging time is, however, a more important factor than maximum hardness
(strength), then 185-195oC will give optimum results.
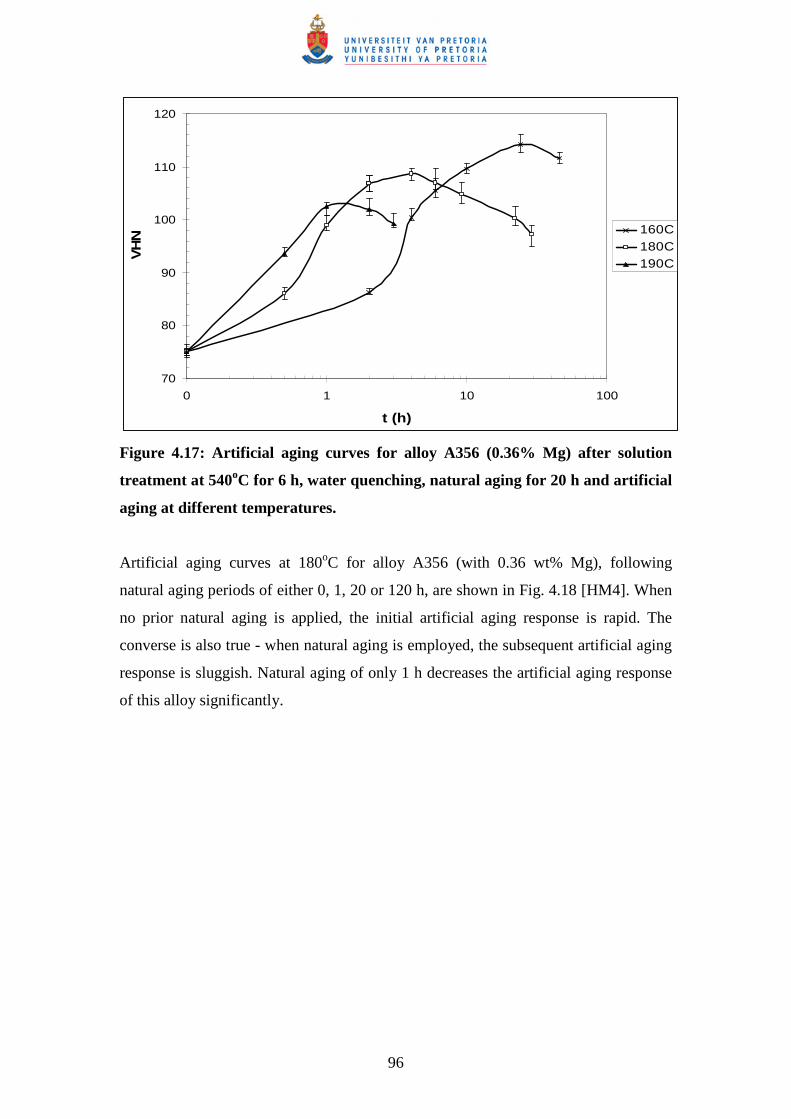
96
70
80
90
100
110
120
0 1 10 100
t (h)
VH
N 160C180C190C
Figure 4.17: Artificial aging curves for alloy A356 (0.36% Mg) after solution
treatment at 540oC for 6 h, water quenching, natural aging for 20 h and artificial
aging at different temperatures.
Artificial aging curves at 180oC for alloy A356 (with 0.36 wt% Mg), following
natural aging periods of either 0, 1, 20 or 120 h, are shown in Fig. 4.18 [HM4]. When
no prior natural aging is applied, the initial artificial aging response is rapid. The
converse is also true - when natural aging is employed, the subsequent artificial aging
response is sluggish. Natural aging of only 1 h decreases the artificial aging response
of this alloy significantly.
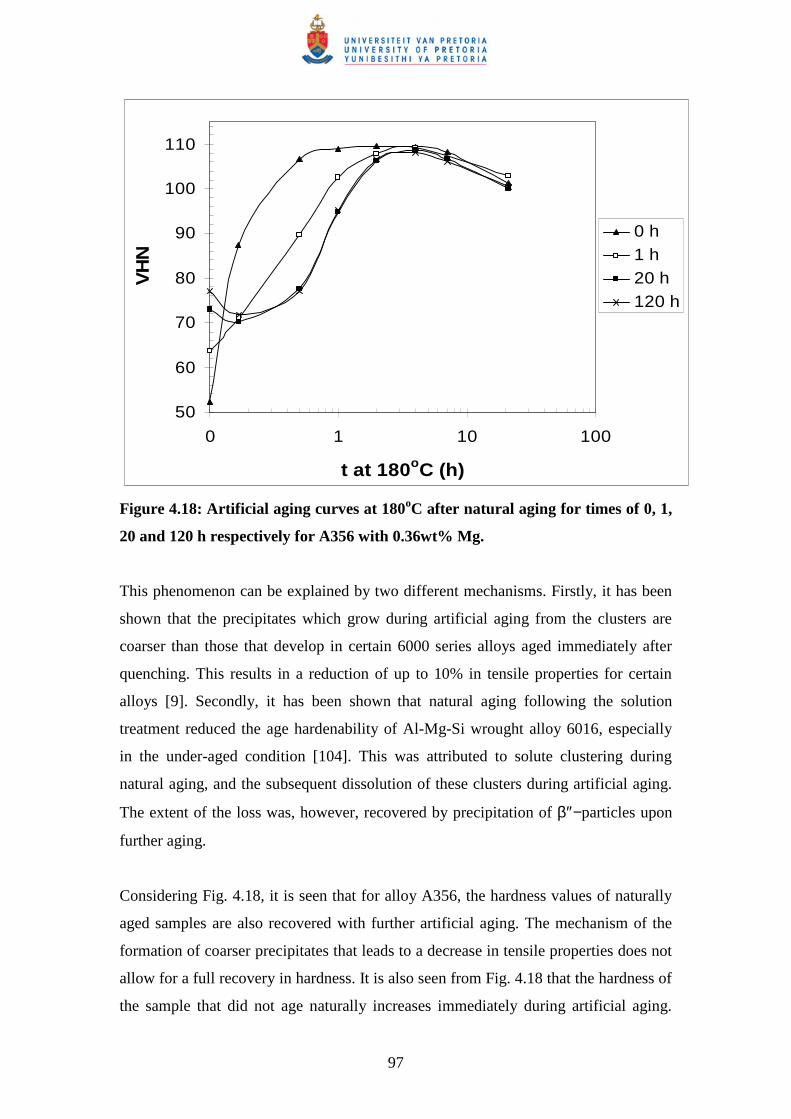
97
50
60
70
80
90
100
110
0 1 10 100
t at 180oC (h)
VH
N
0 h1 h20 h120 h
Figure 4.18: Artificial aging curves at 180oC after natural aging for times of 0, 1,
20 and 120 h respectively for A356 with 0.36wt% Mg.
This phenomenon can be explained by two different mechanisms. Firstly, it has been
shown that the precipitates which grow during artificial aging from the clusters are
coarser than those that develop in certain 6000 series alloys aged immediately after
quenching. This results in a reduction of up to 10% in tensile properties for certain
alloys [9]. Secondly, it has been shown that natural aging following the solution
treatment reduced the age hardenability of Al-Mg-Si wrought alloy 6016, especially
in the under-aged condition [104]. This was attributed to solute clustering during
natural aging, and the subsequent dissolution of these clusters during artificial aging.
The extent of the loss was, however, recovered by precipitation of β″−particles upon
further aging.
Considering Fig. 4.18, it is seen that for alloy A356, the hardness values of naturally
aged samples are also recovered with further artificial aging. The mechanism of the
formation of coarser precipitates that leads to a decrease in tensile properties does not
allow for a full recovery in hardness. It is also seen from Fig. 4.18 that the hardness of
the sample that did not age naturally increases immediately during artificial aging.
98
However, the samples that were naturally aged soften during the first 10 minutes at
180oC, before the hardness increases again. The clusters that form during natural
aging and their response during artificial aging are shown in detail in the APT results
in section 4.14.
When no natural pre-aging occurs, a plateau is maintained once the maximum
hardness is reached during artificial aging after about 1 to 5 h (Fig. 4.18). This differs
from when natural pre-aging occurs, when a hardness peak is observed after
approximately 4 h. The tensile properties (YS and UTS) are shown Table 4.9 as a
function of the artificial aging time within the hardness plateau (with no prior natural
aging). It is seen that the ultimate tensile strengths of the samples on the hardness
plateau are similar. However, the yield strength of the 1 hour artificially aged sample
is significantly lower than the rest of the samples with a concurrent higher ductility.
The hardness plateau allows more freedom in terms of the artificial aging times that
can be used and the dangers of either under-aging or over-aging are therefore
minimised. Once natural aging occurs, a hardness plateau is not maintained during the
subsequent artificial aging. Instead, a hardness peak is reached after approximately 4
h (Fig. 4.18). This would necessitate stricter control in terms of artificial aging time
(i.e. aging for less than 4 h will result in under-aging, and aging for more than 4 h will
result in over-aging). The tensile properties after artificial aging for 4 h at 180oC as a
function of prior natural aging time are also shown in Table 4.9. In this case, no
significant differences are seen in either the yield strength or ultimate tensile strength.
The influence of natural aging prior to artificial aging can therefore be removed by a 4
h, 180oC artificial aging treatment. It is seen from Fig. 4.18 that, while artificial aging
at 180oC for 1 h causes maximum hardening in SSM-HPDC A356 that was not
naturally aged, under-aging is achieved in samples that were naturally aged prior to
artificial aging. The tensile properties of 0.40wt% Mg-A356 were determined under
these conditions (1 h artificial aging at 180oC for samples that were naturally aged for
0 h, 20 h and 120 h). The negative influence of natural aging on the initial stages of
artificial aging can be seen in Table 4.9. Similar effects to those observed for SSM-
HPDC A356 in Table 4.9 have also been found for the higher Mg-containing (0.62%)
SSM-HPDC alloy F357 and are presented in Table 4.10 [HM8].
99
Table 4.9: Yield strength (YS), UTS and % elongation after fracture of SSM-
HPDC A356. The standard deviation from five values for tensile properties is
also indicated in brackets.
Heat treatment YS (MPa) UTS (MPa) % Elongation
0.36wt% Mg
540oC-1h,0h NA,180oC-1h 255 (4.8) 330 (6.4) 10.4 (2.5)
540oC-1h,0h NA,180oC-2h 269 (8.5) 334 (6.8) 7.5 (1.9)
540oC-1h,0h NA,180oC-4h 273 (6.5) 333 (8.4) 8.4 (2.1)
540oC-1h,0h NA,180oC-5h 273 (3.1) 328 (6.9) 7.7 (3.1)
540oC-1h,1h NA,180oC-4h 269 (5.8) 325 (4.6) 10.3 (3.4)
540oC-1h,20h NA,180oC-4h 270 (4.7) 325 (2.8) 9.3 (1.7)
540oC-1h,120h NA,180oC-4h 270 (5.5) 328 (5.8) 8.0 (2.2)
0.40wt% Mg
540oC-1h,0h NA,180oC-1h 266 (7.5) 341 (9.5) 7.8 (1.8)
540oC-1h,20h NA,180oC-1h 224 (7.5) 315 (3.4) 12.5 (1.4)
540oC-1h,120h NA,180oC-1h 233 (8.2) 318 (5.2) 10.0 (2.7)
540oC-1h,-18oC for 20h,180oC-1h 266 (6.7) 343 (4.7) 9.1 (1.9)
Table 4.10: Yield strength (YS), ultimate tensile strength (UTS) and %
elongation after fracture of SSM-HPDC F357 (0.62% Mg). The standard
deviation from five values for tensile properties is also indicated in brackets
Heat treatment YS (MPa) UTS (MPa) % Elongation
540oC-1h,0h NA,180oC-1h 296 (2.9) 358 (3.7) 7.4 (0.7)
540oC-1h,0h NA,180oC-2h 307 (3.1) 364 (2.5) 9.6 (2.4)
540oC-1h,0h NA,180oC-4h 315 (5.2) 360 (5.0) 5.7 (1.1)
540oC-1h,20h NA,180oC-1h 243 (6.2) 320 (7.9) 9.5 (2.6)
540oC-1h,20h NA,180oC-2h 289 (10.7) 346 (4.5) 8.0 (2.4)
540oC-1h,20h NA,180oC-4h 312 (4.1) 355 (3.9) 6.0 (1.3)
To determine whether the process of natural aging could be impeded by low
temperatures, SSM-HPDC A356 samples were stored in a freezer at -18oC for 20 h
after quenching, before artificial aging at 180oC for 1 h. The tensile properties (Table
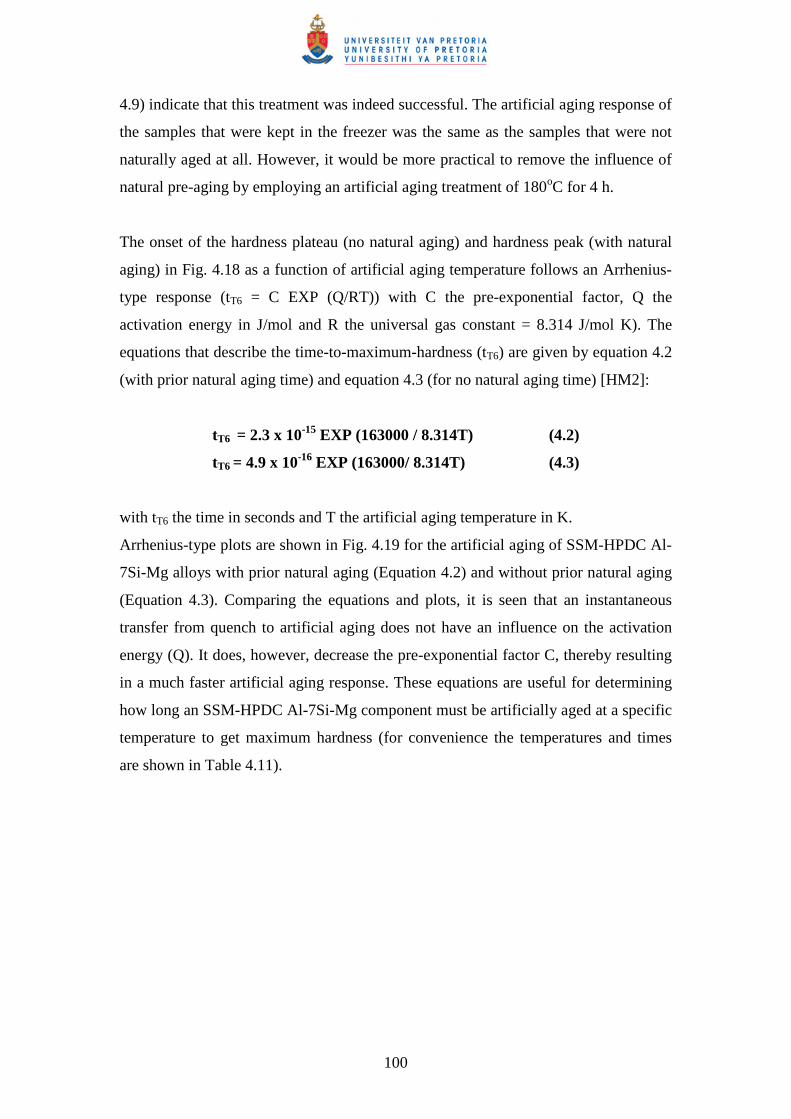
100
4.9) indicate that this treatment was indeed successful. The artificial aging response of
the samples that were kept in the freezer was the same as the samples that were not
naturally aged at all. However, it would be more practical to remove the influence of
natural pre-aging by employing an artificial aging treatment of 180oC for 4 h.
The onset of the hardness plateau (no natural aging) and hardness peak (with natural
aging) in Fig. 4.18 as a function of artificial aging temperature follows an Arrhenius-
type response (tT6 = C EXP (Q/RT)) with C the pre-exponential factor, Q the
activation energy in J/mol and R the universal gas constant = 8.314 J/mol K). The
equations that describe the time-to-maximum-hardness (tT6) are given by equation 4.2
(with prior natural aging time) and equation 4.3 (for no natural aging time) [HM2]:
tT6 = 2.3 x 10⁻¹⁵ EXP (163000 / 8.314T) (4.2)
tT6 = 4.9 x 10⁻¹⁶ EXP (163000/ 8.314T) (4.3)
with tT6 the time in seconds and T the artificial aging temperature in K.
Arrhenius-type plots are shown in Fig. 4.19 for the artificial aging of SSM-HPDC Al-
7Si-Mg alloys with prior natural aging (Equation 4.2) and without prior natural aging
(Equation 4.3). Comparing the equations and plots, it is seen that an instantaneous
transfer from quench to artificial aging does not have an influence on the activation
energy (Q). It does, however, decrease the pre-exponential factor C, thereby resulting
in a much faster artificial aging response. These equations are useful for determining
how long an SSM-HPDC Al-7Si-Mg component must be artificially aged at a specific
temperature to get maximum hardness (for convenience the temperatures and times
are shown in Table 4.11).
101
R2 = 0.9998
R2 = 0.9927
100
1000
10000
100000
1000000
0.0021 0.00215 0.0022 0.00225 0.0023 0.00235 0.0024
1/T (K-1)
t T6
(s)
Equation 4.2
Experimental 4.2
Equation 4.3
Experimental 4.3
Figure 4.19: Arrhenius-type plots for the artificial aging of SSM-HPDC A356
with prior natural aging (Equation 4.2) and without prior natural aging
(Equation 4.3).
The determined activation energy of 163 kJ/mol is higher than those reported by
Rometsch and Schaffer [82] (130-138 kJ/mol) and Shercliff and Ashby [15] (130-145
kJ/mol) for Al-Si-Mg alloys. The activation energy for diffusion of Si in Al has been
proposed in a range from 118 kJ/mol [105] to 151 kJ/mol [106]. Similarly, the
activation energy for diffusion of Mg in Al has been proposed in a range from 111
kJ/mol [107] to 161 kJ/mol [108].
Table 4.11: Time-to-maximum-hardness (tT6) at different artificial aging
temperatures (using equations 4.2 and 4.3).
Temperature (oC) tT6 (with natural aging)
(h)
tT6 (with no natural aging)
(h)
160 29 6.5
165 18 4.0
170 10 2.5
175 6.5 1.5
180 4 1.0
185 2.5 0.5
190 1.5 0.3
102
Note that equation 4.3 (no natural pre-aging) calculates the onset of the hardness
plateau (Fig. 4.18). As was shown in Tables 4.9 and 4.10, this does not necessarily
result in maximum yield strength (i.e. time-to-maximum-hardness is not the same as
time-to-maximum-yield strength). With equation 4.2 (with natural pre-aging),
however, time-to-maximum-hardness and time-to-maximum-yield strength are the
same. To ensure that maximum yield strength is reached in samples with no prior
natural pre-aging, equation 4.2 should rather be used. According to Table 4.11, the
traditional artificial aging temperature of 170oC for 6 h (Table 2.7) results in under-
aging of naturally pre-aged Al-7Si-Mg alloys, with over-aging of alloys that were not
naturally pre-aged. This is not an ideal situation where different properties are
obtained as a function of natural pre-aging (see Fig. 2.34). As discussed before,
application of equation 4.2 will result in similar tensile properties being obtained
regardless of natural pre-aging. Table 4.12 shows tensile properties of alloy F357
(with 0.62% Mg) after artificial aging at 170oC for 6 and 10 h respectively [HM8]. It
can be seen that higher strength (especially YS) is indeed obtained as predicted by
Table 4.11.
Table 4.12: Yield strength (YS), ultimate tensile strength (UTS) and %
elongation after fracture of heat treated F357 samples (0.62% Mg). The standard
deviation from five values for tensile properties is also indicated in brackets.
Heat treatment YS (MPa) UTS (MPa) % Elongation
540oC-6h, 20h NA, 170oC-6h 307 (5.7) 356 (4.8) 6.1 (1.5)
540oC-6h, 20h NA, 170oC-10h 320 (4.5) 358 (3.1) 5.8 (1.2)
The tensile properties of SSM-HPDC Al-7Si-Mg alloys heat treated with the
traditional heat treatment (540oC-6h, 20h NA, 170oC-6h) are compared with those
heat treated with the shortened cycles (540oC-1h, 0-120h NA, 180oC-4h) in Table
4.13. The tensile properties obtained using the traditional and short heat treatment
cycles are remarkably similar over a wide range of Mg-compositions. The advantage
of the shortened cycles is that it involves only 5 hours at elevated temperatures
compared to 12 h with the traditional treatment, with obvious productivity increases
and energy savings. The reason why similar properties can be obtained at the higher
artificial aging temperature of 180oC compared to 170oC is due to the fact that the
103
180oC-4h treatment results in peak aging, whereas 170oC-6h results in under-aging
(Table 4.11).
Table 4.13: Yield strength (YS), ultimate tensile strength (UTS) and %
elongation after fracture of SSM-HPDC Al-7Si-Mg samples heat treated with the
traditional or shortened heat treatments. The standard deviation from five
values for tensile properties is also indicated in brackets.
Heat treatment YS (MPa) UTS (MPa) % Elongation
0.28% Mg
540oC-6h, 20h NA, 170oC-6h 243 (4.1) 296 (6.5) 7.2 (1.3)
540oC-1h, 0-120h NA, 180oC-4h 240 (2.8) 301 (3.1) 9.4 (0.9)
0.34% Mg
540oC-6h, 20h NA, 170oC-6h 261 (4.5) 316 (5.9) 8.3 (2.1)
540oC-1h, 0-120h NA, 180oC-4h 259 (5.2) 317 (7.1) 8.8 (1.4)
0.45% Mg
540oC-6h, 20h NA, 170oC-6h 297 (5.0) 345 (5.6) 7.3 (2.3)
540oC-1h, 0-120h NA, 180oC-4h 294 (5.8) 344 (3.1) 7.1 (1.4)
0.62% Mg
540oC-6h, 20h NA, 170oC-6h 307 (5.7) 356 (4.8) 6.1 (1.5)
540oC-1h, 0-120h NA, 180oC-4h 312 (4.1) 355 (3.9) 6.0 (1.3)
4.6. The effects of Mg and Fe in Al-7Si-Mg alloys
The tensile properties of SSM-HPDC Al-7Si-Mg alloys from this study are compared
in Fig. 4.20 with SSM-processed Al-7Si-Mg alloys from other researchers [35,89], all
heat treated with the traditional T6 heat treatment cycles.
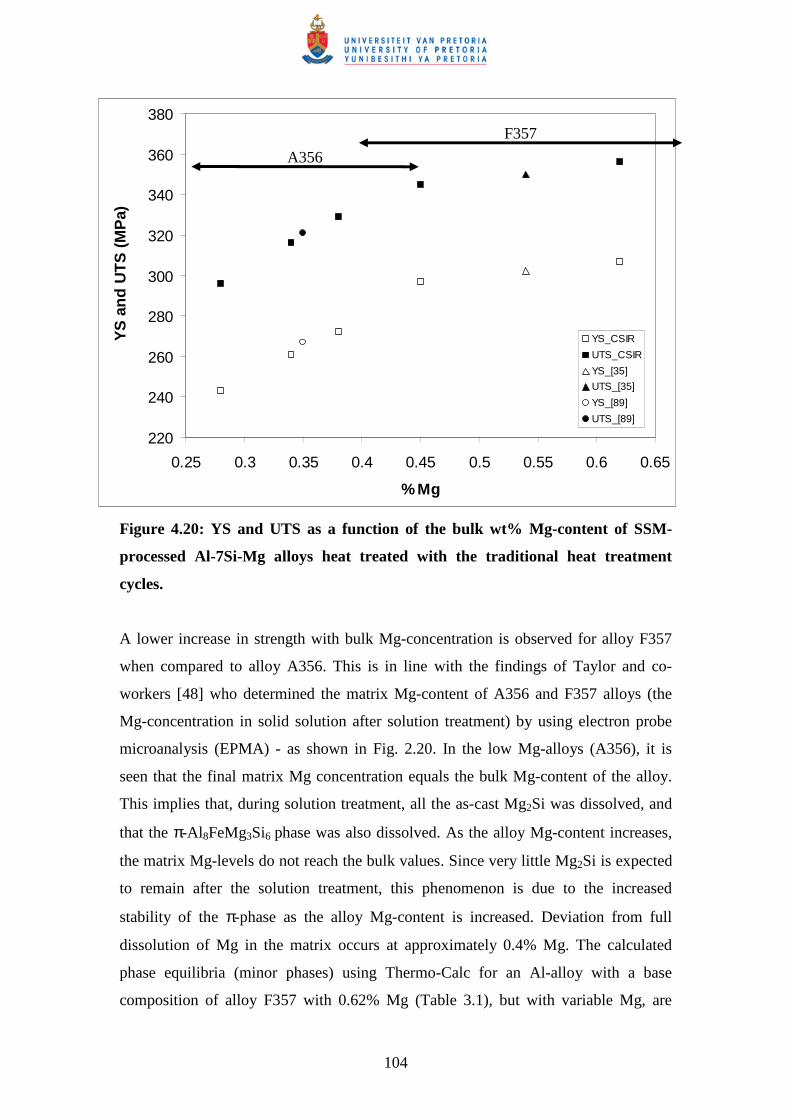
104
220
240
260
280
300
320
340
360
380
0.25 0.3 0.35 0.4 0.45 0.5 0.55 0.6 0.65
% Mg
YS
an
d U
TS
(M
Pa)
YS_CSIR
UTS_CSIR
YS_[35]
UTS_[35]
YS_[89]
UTS_[89]
Figure 4.20: YS and UTS as a function of the bulk wt% Mg-content of SSM-
processed Al-7Si-Mg alloys heat treated with the traditional heat treatment
cycles.
A lower increase in strength with bulk Mg-concentration is observed for alloy F357
when compared to alloy A356. This is in line with the findings of Taylor and co-
workers [48] who determined the matrix Mg-content of A356 and F357 alloys (the
Mg-concentration in solid solution after solution treatment) by using electron probe
microanalysis (EPMA) - as shown in Fig. 2.20. In the low Mg-alloys (A356), it is
seen that the final matrix Mg concentration equals the bulk Mg-content of the alloy.
This implies that, during solution treatment, all the as-cast Mg2Si was dissolved, and
that the π-Al 8FeMg3Si6 phase was also dissolved. As the alloy Mg-content increases,
the matrix Mg-levels do not reach the bulk values. Since very little Mg2Si is expected
to remain after the solution treatment, this phenomenon is due to the increased
stability of the π-phase as the alloy Mg-content is increased. Deviation from full
dissolution of Mg in the matrix occurs at approximately 0.4% Mg. The calculated
phase equilibria (minor phases) using Thermo-Calc for an Al-alloy with a base
composition of alloy F357 with 0.62% Mg (Table 3.1), but with variable Mg, are
A356
F357
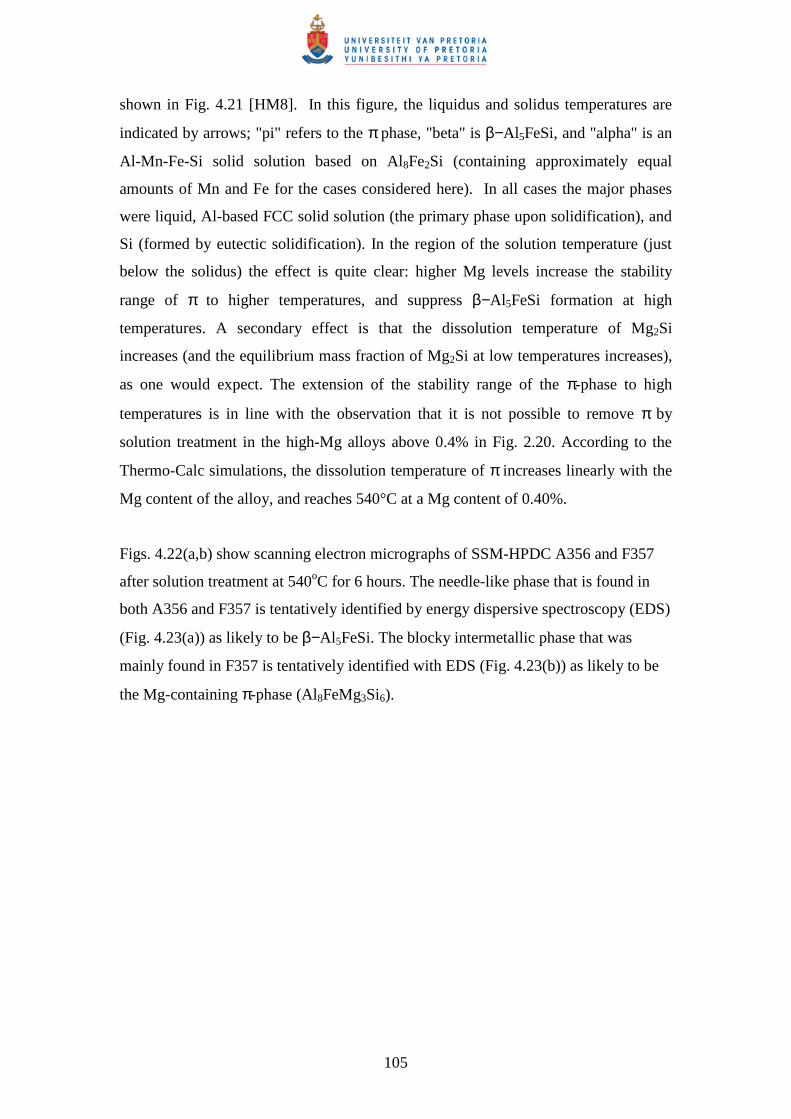
105
shown in Fig. 4.21 [HM8]. In this figure, the liquidus and solidus temperatures are
indicated by arrows; "pi" refers to the π phase, "beta" is β−Al5FeSi, and "alpha" is an
Al-Mn-Fe-Si solid solution based on Al8Fe2Si (containing approximately equal
amounts of Mn and Fe for the cases considered here). In all cases the major phases
were liquid, Al-based FCC solid solution (the primary phase upon solidification), and
Si (formed by eutectic solidification). In the region of the solution temperature (just
below the solidus) the effect is quite clear: higher Mg levels increase the stability
range of π to higher temperatures, and suppress β−Al5FeSi formation at high
temperatures. A secondary effect is that the dissolution temperature of Mg2Si
increases (and the equilibrium mass fraction of Mg2Si at low temperatures increases),
as one would expect. The extension of the stability range of the π-phase to high
temperatures is in line with the observation that it is not possible to remove π by
solution treatment in the high-Mg alloys above 0.4% in Fig. 2.20. According to the
Thermo-Calc simulations, the dissolution temperature of π increases linearly with the
Mg content of the alloy, and reaches 540°C at a Mg content of 0.40%.
Figs. 4.22(a,b) show scanning electron micrographs of SSM-HPDC A356 and F357
after solution treatment at 540oC for 6 hours. The needle-like phase that is found in
both A356 and F357 is tentatively identified by energy dispersive spectroscopy (EDS)
(Fig. 4.23(a)) as likely to be β−Al 5FeSi. The blocky intermetallic phase that was
mainly found in F357 is tentatively identified with EDS (Fig. 4.23(b)) as likely to be
the Mg-containing π-phase (Al8FeMg3Si6).
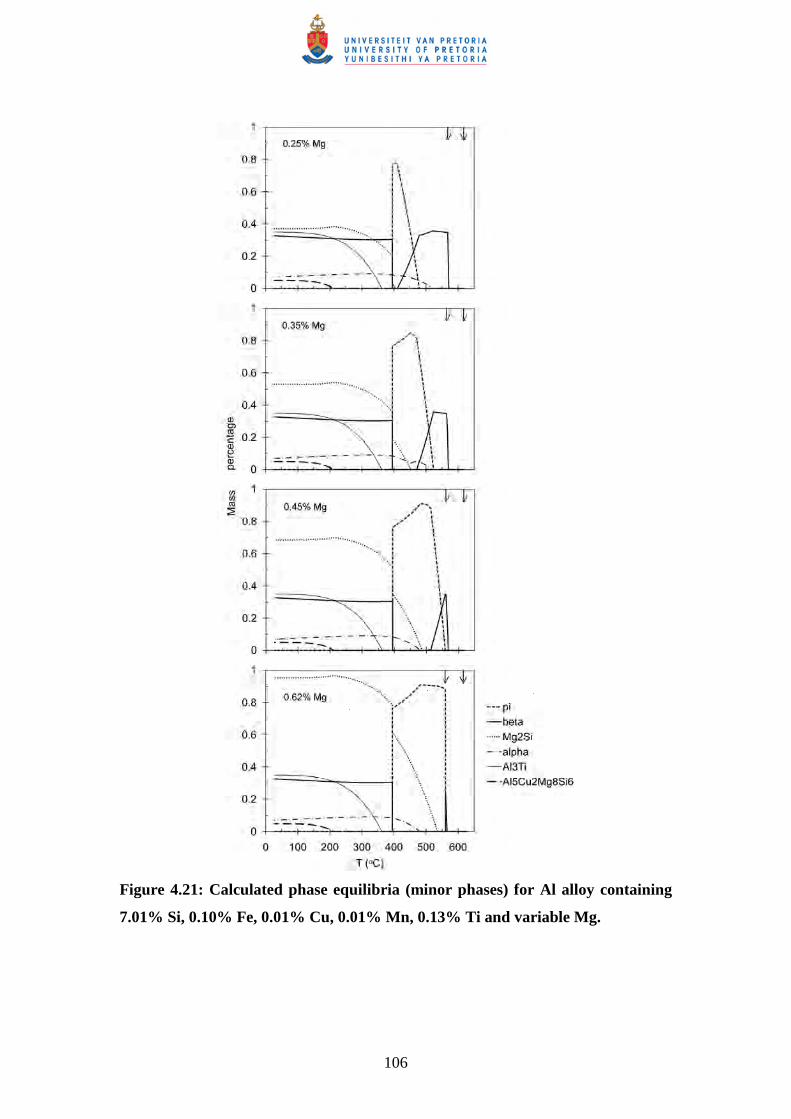
106
Figure 4.21: Calculated phase equilibria (minor phases) for Al alloy containing
7.01% Si, 0.10% Fe, 0.01% Cu, 0.01% Mn, 0.13% Ti and variable Mg.
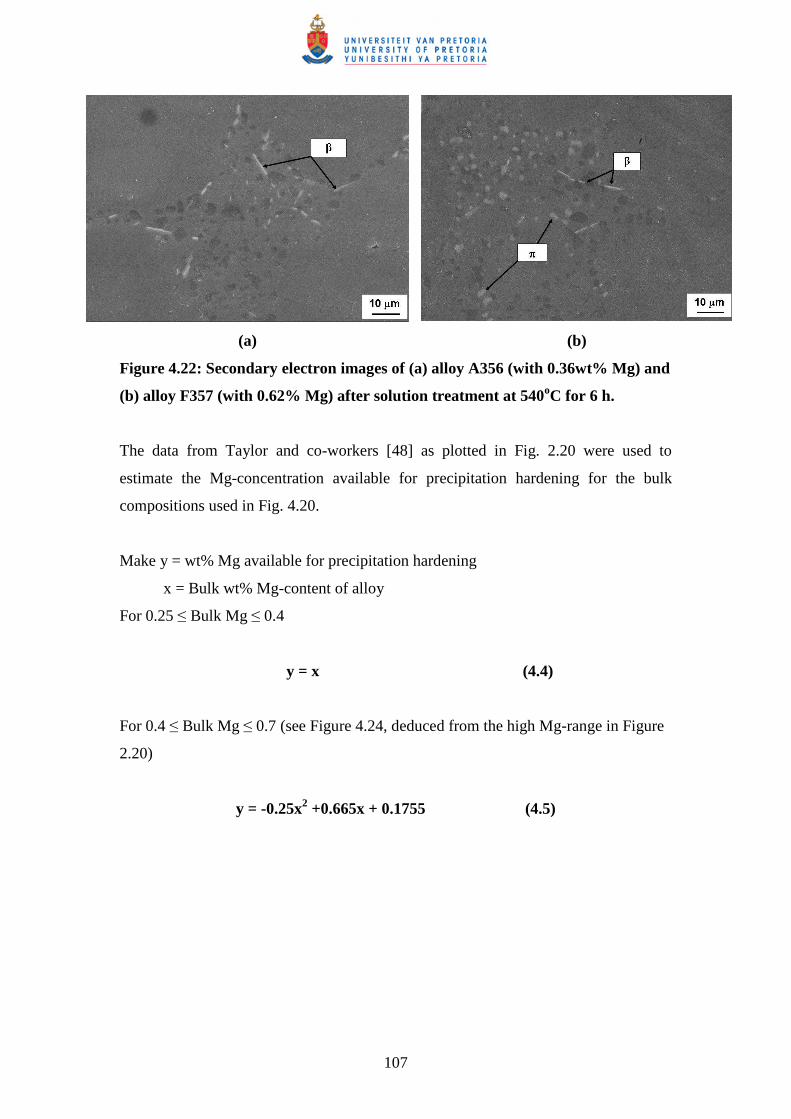
107
(a) (b)
Figure 4.22: Secondary electron images of (a) alloy A356 (with 0.36wt% Mg) and
(b) alloy F357 (with 0.62% Mg) after solution treatment at 540oC for 6 h.
The data from Taylor and co-workers [48] as plotted in Fig. 2.20 were used to
estimate the Mg-concentration available for precipitation hardening for the bulk
compositions used in Fig. 4.20.
Make y = wt% Mg available for precipitation hardening
x = Bulk wt% Mg-content of alloy
For 0.25 ≤ Bulk Mg ≤ 0.4
y = x (4.4)
For 0.4 ≤ Bulk Mg ≤ 0.7 (see Figure 4.24, deduced from the high Mg-range in Figure
2.20)
y = -0.25x2 +0.665x + 0.1755 (4.5)
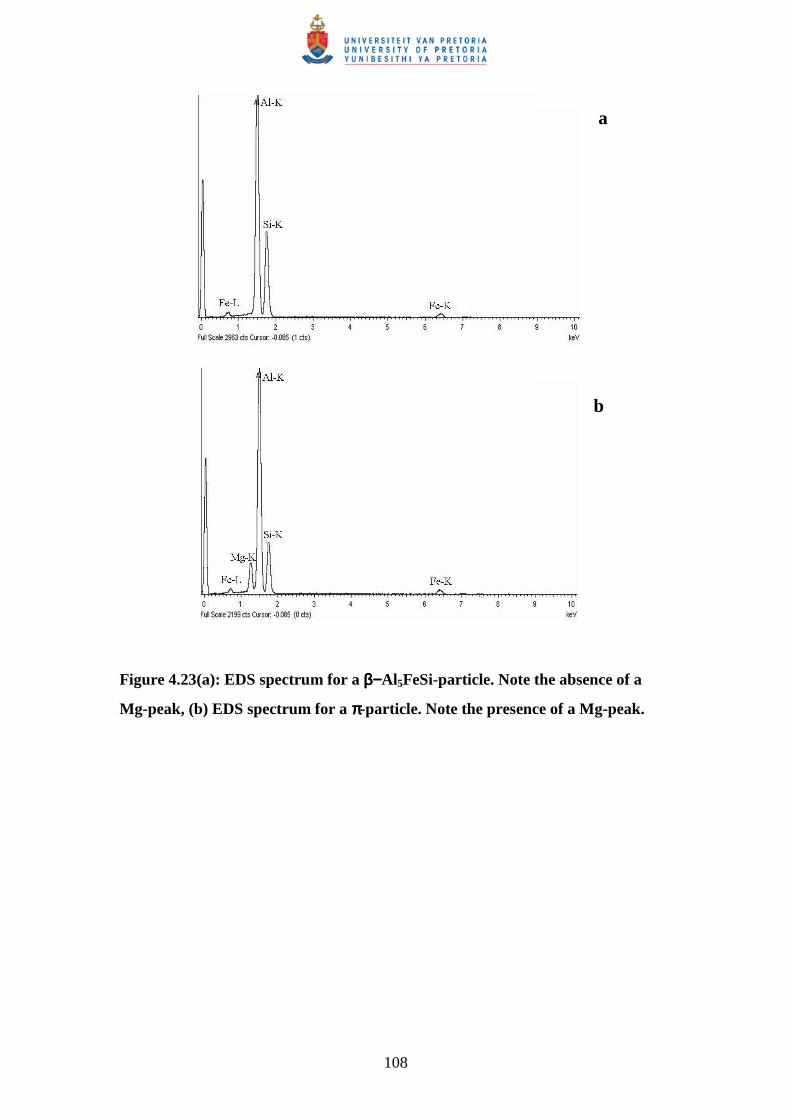
108
Figure 4.23(a): EDS spectrum for a β−β−β−β−Al5FeSi-particle. Note the absence of a
Mg-peak, (b) EDS spectrum for a ππππ-particle. Note the presence of a Mg-peak.
a
b
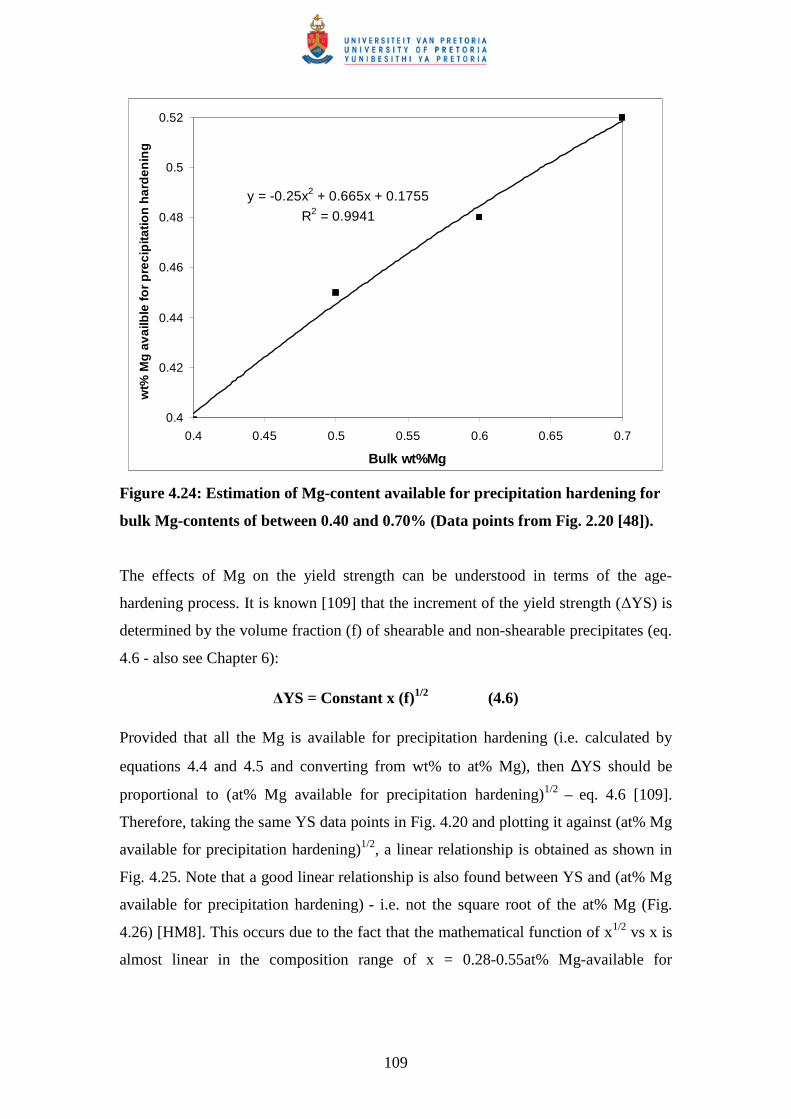
109
y = -0.25x2 + 0.665x + 0.1755
R2 = 0.9941
0.4
0.42
0.44
0.46
0.48
0.5
0.52
0.4 0.45 0.5 0.55 0.6 0.65 0.7
Bulk wt%Mg
wt%
Mg
ava
ilble
for
pre
cip
itatio
n h
ard
enin
g
Figure 4.24: Estimation of Mg-content available for precipitation hardening for
bulk Mg-contents of between 0.40 and 0.70% (Data points from Fig. 2.20 [48]).
The effects of Mg on the yield strength can be understood in terms of the age-
hardening process. It is known [109] that the increment of the yield strength (∆YS) is
determined by the volume fraction (f) of shearable and non-shearable precipitates (eq.
4.6 - also see Chapter 6):
∆YS = Constant x (f)1/2 (4.6)
Provided that all the Mg is available for precipitation hardening (i.e. calculated by
equations 4.4 and 4.5 and converting from wt% to at% Mg), then ∆YS should be
proportional to (at% Mg available for precipitation hardening)1/2 – eq. 4.6 [109].
Therefore, taking the same YS data points in Fig. 4.20 and plotting it against (at% Mg
available for precipitation hardening)1/2, a linear relationship is obtained as shown in
Fig. 4.25. Note that a good linear relationship is also found between YS and (at% Mg
available for precipitation hardening) - i.e. not the square root of the at% Mg (Fig.
4.26) [HM8]. This occurs due to the fact that the mathematical function of x1/2 vs x is
almost linear in the composition range of x = 0.28-0.55at% Mg-available for
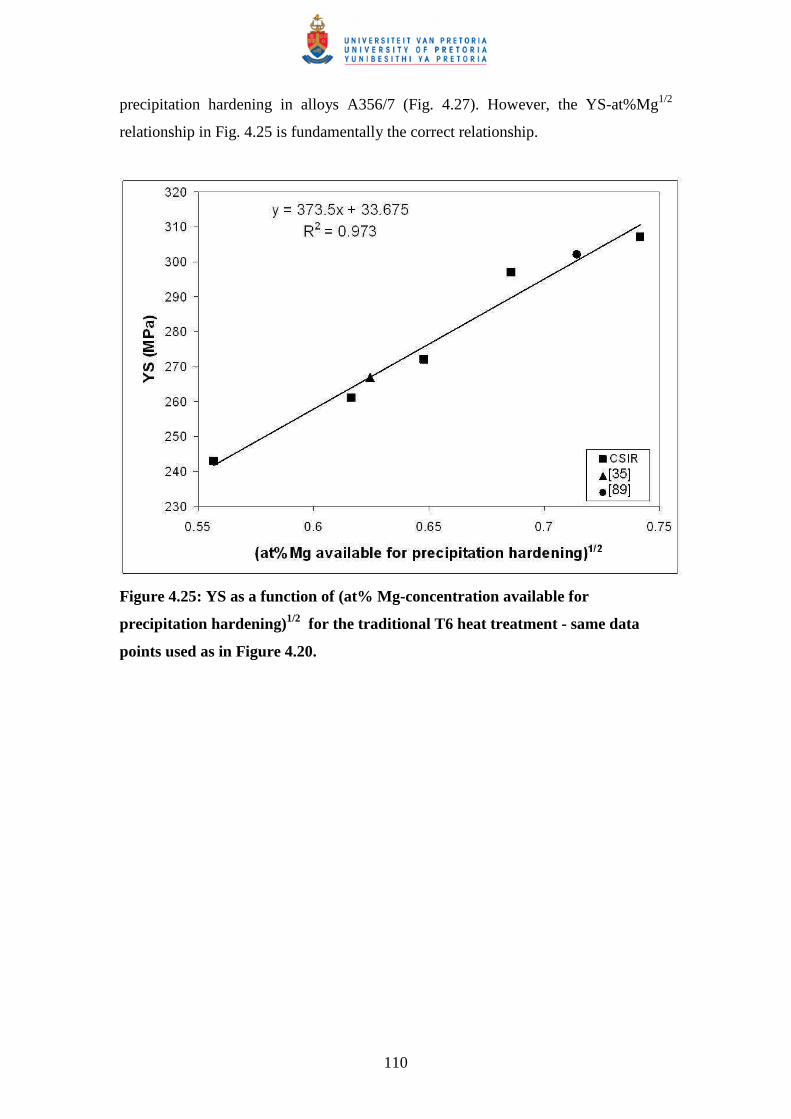
110
precipitation hardening in alloys A356/7 (Fig. 4.27). However, the YS-at%Mg1/2
relationship in Fig. 4.25 is fundamentally the correct relationship.
Figure 4.25: YS as a function of (at% Mg-concentration available for
precipitation hardening)1/2 for the traditional T6 heat treatment - same data
points used as in Figure 4.20.
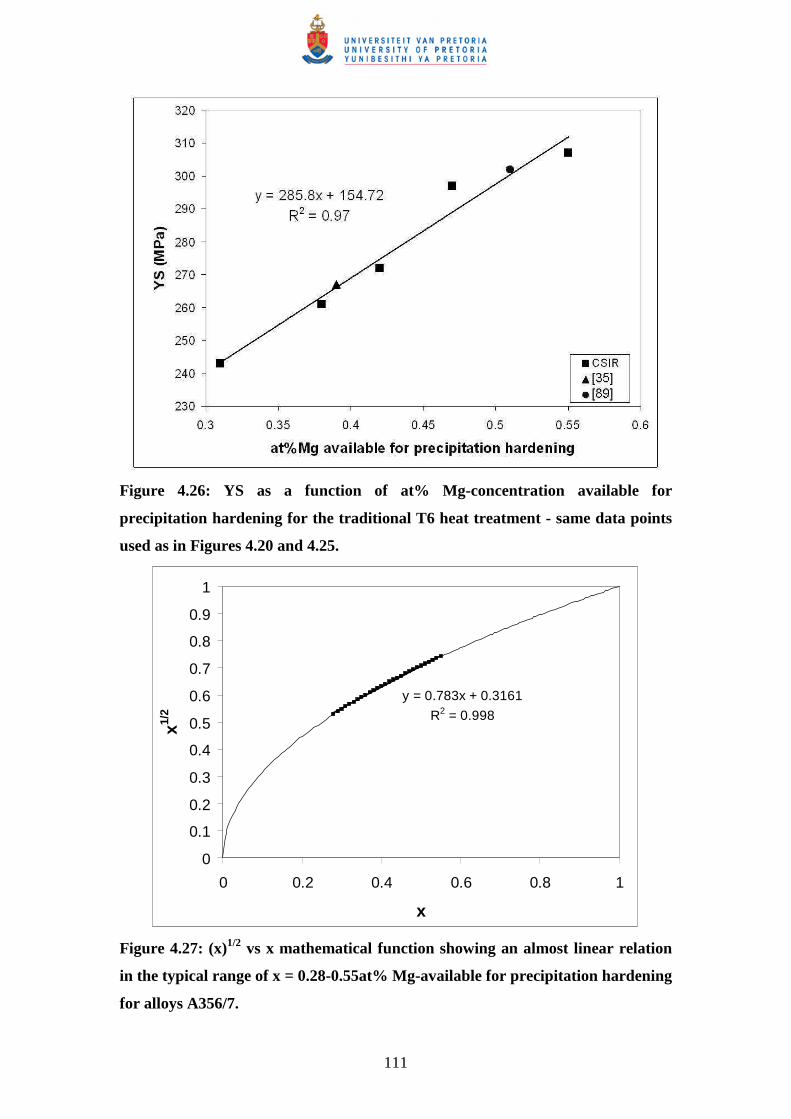
111
Figure 4.26: YS as a function of at% Mg-concentration available for
precipitation hardening for the traditional T6 heat treatment - same data points
used as in Figures 4.20 and 4.25.
y = 0.783x + 0.3161
R2 = 0.998
0
0.1
0.2
0.3
0.4
0.5
0.6
0.7
0.8
0.9
1
0 0.2 0.4 0.6 0.8 1
x
x1/2
Figure 4.27: (x)1/2 vs x mathematical function showing an almost linear relation
in the typical range of x = 0.28-0.55at% Mg-available for precipitation hardening
for alloys A356/7.
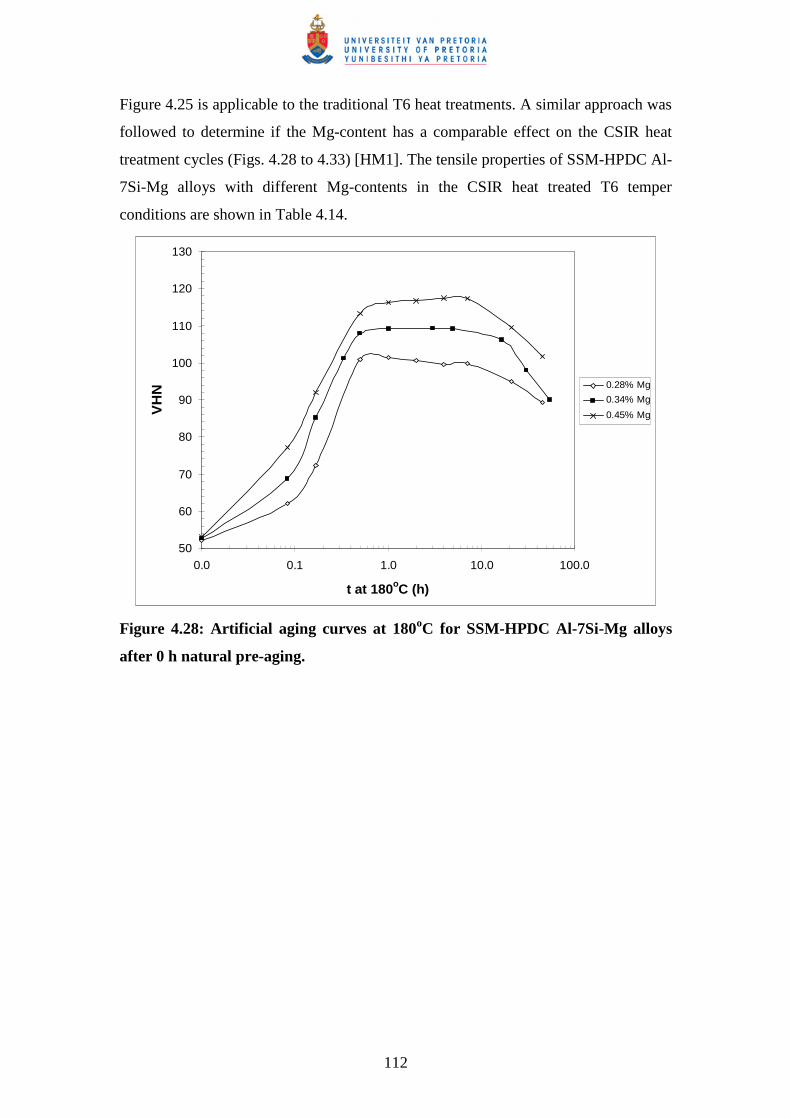
112
Figure 4.25 is applicable to the traditional T6 heat treatments. A similar approach was
followed to determine if the Mg-content has a comparable effect on the CSIR heat
treatment cycles (Figs. 4.28 to 4.33) [HM1]. The tensile properties of SSM-HPDC Al-
7Si-Mg alloys with different Mg-contents in the CSIR heat treated T6 temper
conditions are shown in Table 4.14.
50
60
70
80
90
100
110
120
130
0.0 0.1 1.0 10.0 100.0
t at 180oC (h)
VH
N 0.28% Mg
0.34% Mg
0.45% Mg
Figure 4.28: Artificial aging curves at 180oC for SSM-HPDC Al-7Si-Mg alloys
after 0 h natural pre-aging.
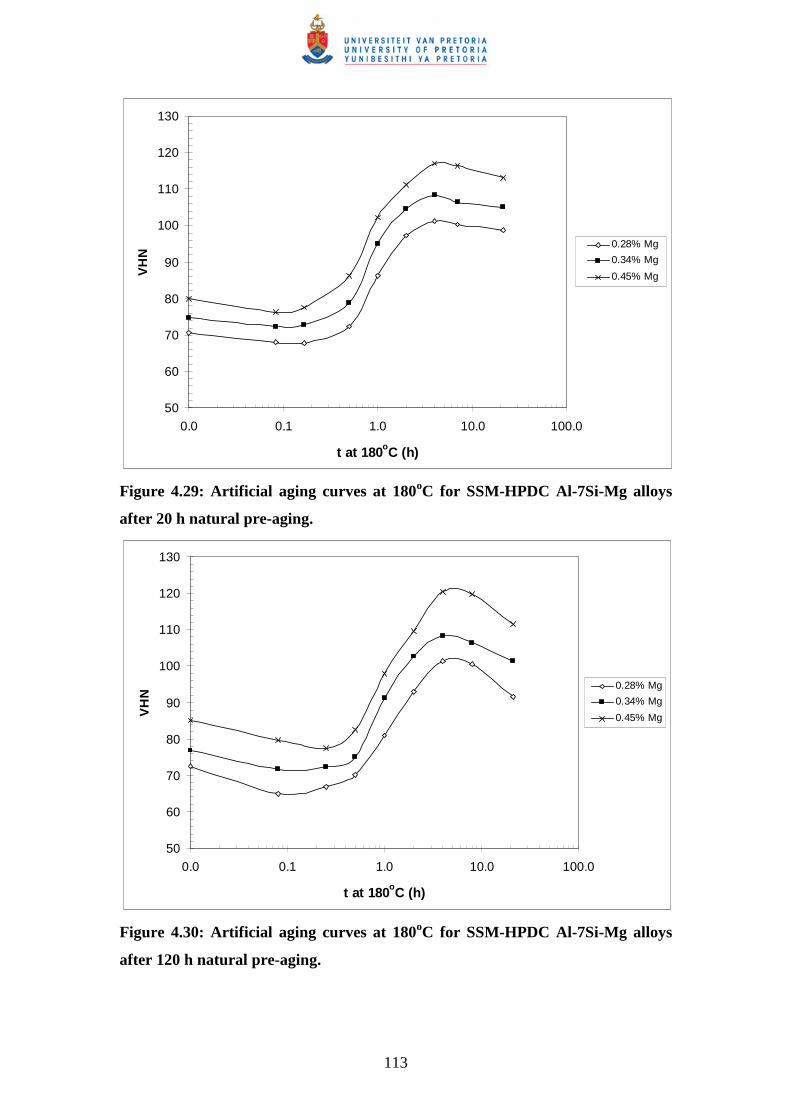
113
50
60
70
80
90
100
110
120
130
0.0 0.1 1.0 10.0 100.0
t at 180oC (h)
VH
N
0.28% Mg
0.34% Mg
0.45% Mg
Figure 4.29: Artificial aging curves at 180oC for SSM-HPDC Al-7Si-Mg alloys
after 20 h natural pre-aging.
50
60
70
80
90
100
110
120
130
0.0 0.1 1.0 10.0 100.0
t at 180oC (h)
VH
N
0.28% Mg
0.34% Mg
0.45% Mg
Figure 4.30: Artificial aging curves at 180oC for SSM-HPDC Al-7Si-Mg alloys
after 120 h natural pre-aging.
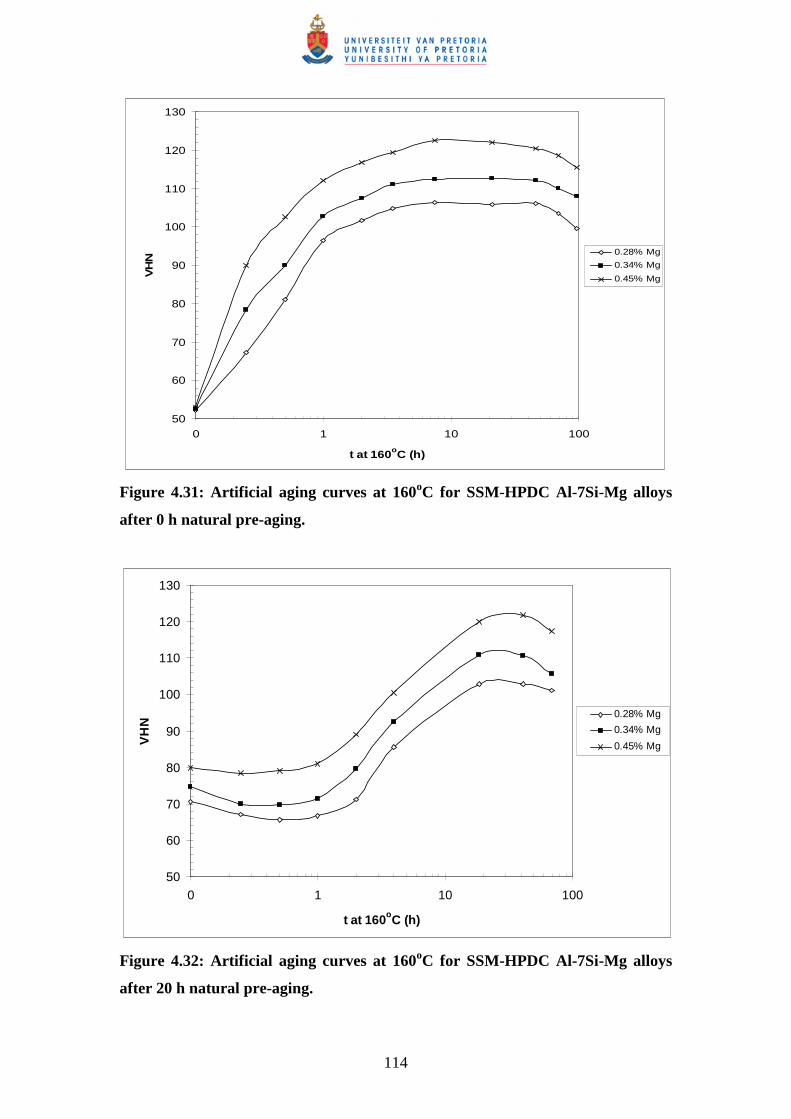
114
50
60
70
80
90
100
110
120
130
0 1 10 100
t at 160oC (h)
VH
N
0.28% Mg
0.34% Mg
0.45% Mg
Figure 4.31: Artificial aging curves at 160oC for SSM-HPDC Al-7Si-Mg alloys
after 0 h natural pre-aging.
50
60
70
80
90
100
110
120
130
0 1 10 100
t at 160oC (h)
VH
N
0.28% Mg
0.34% Mg
0.45% Mg
Figure 4.32: Artificial aging curves at 160oC for SSM-HPDC Al-7Si-Mg alloys
after 20 h natural pre-aging.
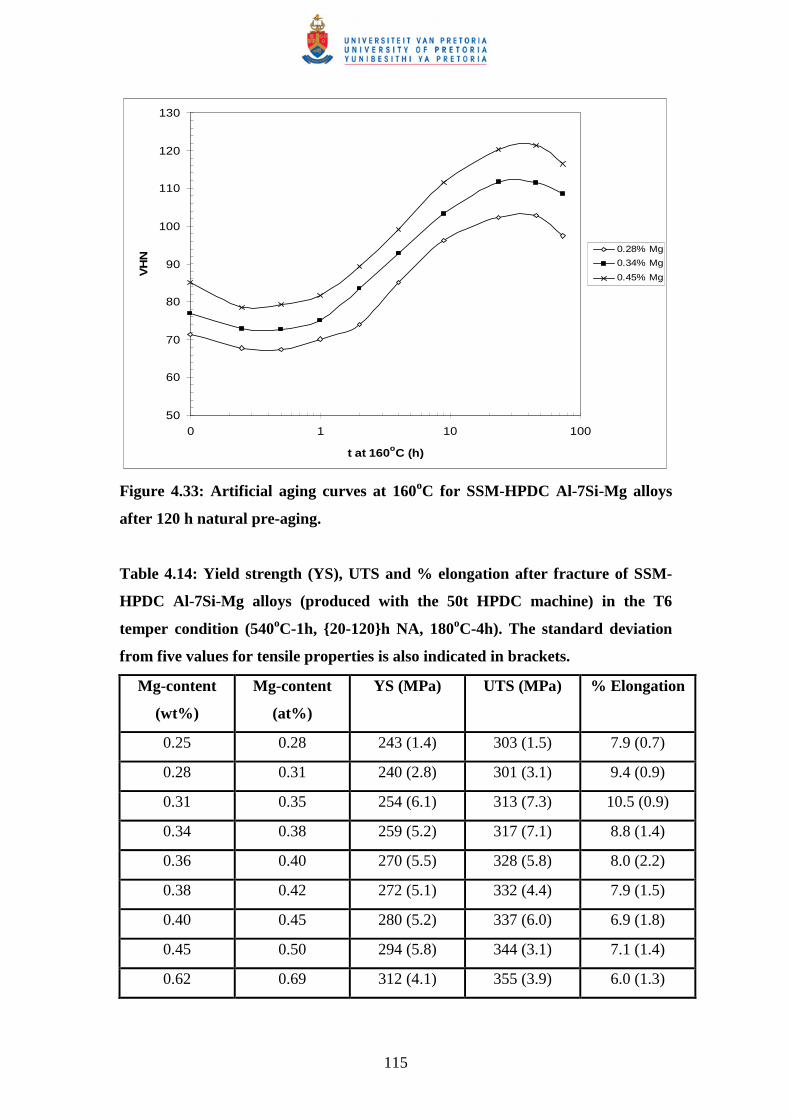
115
50
60
70
80
90
100
110
120
130
0 1 10 100
t at 160oC (h)
VH
N
0.28% Mg
0.34% Mg
0.45% Mg
Figure 4.33: Artificial aging curves at 160oC for SSM-HPDC Al-7Si-Mg alloys
after 120 h natural pre-aging.
Table 4.14: Yield strength (YS), UTS and % elongation after fracture of SSM-
HPDC Al-7Si-Mg alloys (produced with the 50t HPDC machine) in the T6
temper condition (540oC-1h, {20-120}h NA, 180oC-4h). The standard deviation
from five values for tensile properties is also indicated in brackets.
Mg-content
(wt%)
Mg-content
(at%)
YS (MPa) UTS (MPa) % Elongation
0.25 0.28 243 (1.4) 303 (1.5) 7.9 (0.7)
0.28 0.31 240 (2.8) 301 (3.1) 9.4 (0.9)
0.31 0.35 254 (6.1) 313 (7.3) 10.5 (0.9)
0.34 0.38 259 (5.2) 317 (7.1) 8.8 (1.4)
0.36 0.40 270 (5.5) 328 (5.8) 8.0 (2.2)
0.38 0.42 272 (5.1) 332 (4.4) 7.9 (1.5)
0.40 0.45 280 (5.2) 337 (6.0) 6.9 (1.8)
0.45 0.50 294 (5.8) 344 (3.1) 7.1 (1.4)
0.62 0.69 312 (4.1) 355 (3.9) 6.0 (1.3)
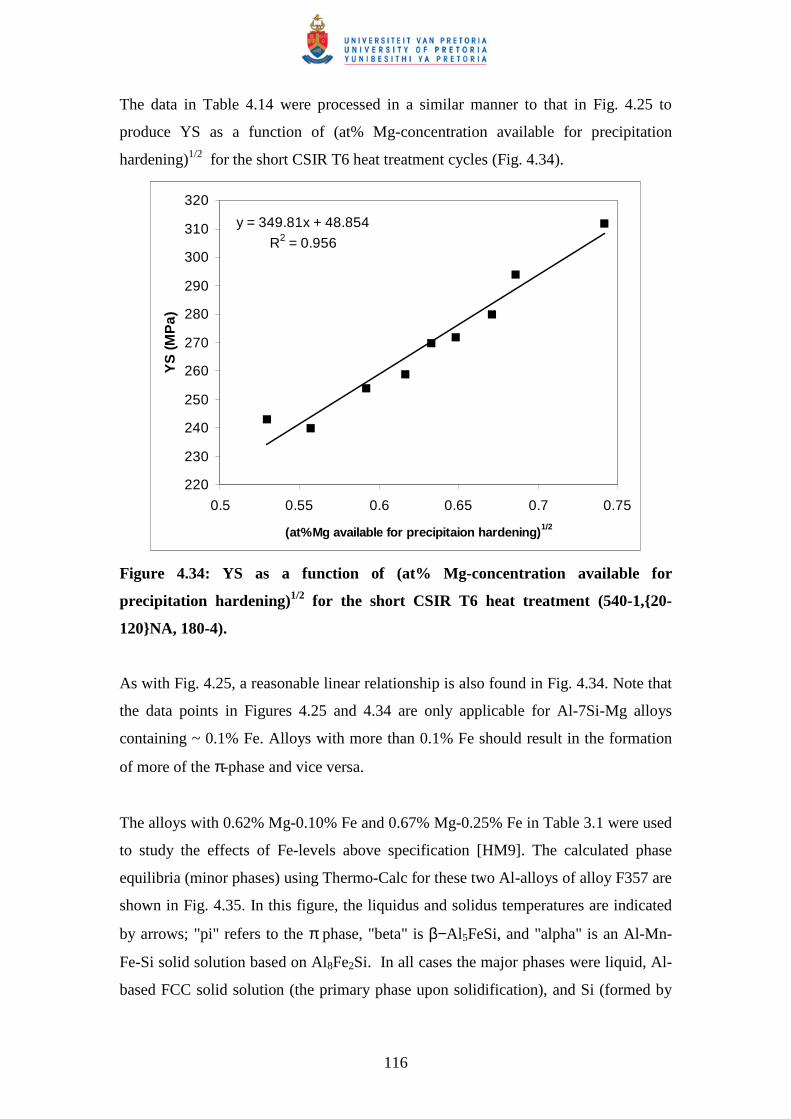
116
The data in Table 4.14 were processed in a similar manner to that in Fig. 4.25 to
produce YS as a function of (at% Mg-concentration available for precipitation
hardening)1/2 for the short CSIR T6 heat treatment cycles (Fig. 4.34).
y = 349.81x + 48.854
R2 = 0.956
220
230
240
250
260
270
280
290
300
310
320
0.5 0.55 0.6 0.65 0.7 0.75
(at%Mg available for precipitaion hardening)1/2
YS
(MP
a)
Figure 4.34: YS as a function of (at% Mg-concentration available for
precipitation hardening)1/2 for the short CSIR T6 heat treatment (540-1,{20-
120}NA, 180-4).
As with Fig. 4.25, a reasonable linear relationship is also found in Fig. 4.34. Note that
the data points in Figures 4.25 and 4.34 are only applicable for Al-7Si-Mg alloys
containing ~ 0.1% Fe. Alloys with more than 0.1% Fe should result in the formation
of more of the π-phase and vice versa.
The alloys with 0.62% Mg-0.10% Fe and 0.67% Mg-0.25% Fe in Table 3.1 were used
to study the effects of Fe-levels above specification [HM9]. The calculated phase
equilibria (minor phases) using Thermo-Calc for these two Al-alloys of alloy F357 are
shown in Fig. 4.35. In this figure, the liquidus and solidus temperatures are indicated
by arrows; "pi" refers to the π phase, "beta" is β−Al 5FeSi, and "alpha" is an Al-Mn-
Fe-Si solid solution based on Al8Fe2Si. In all cases the major phases were liquid, Al-
based FCC solid solution (the primary phase upon solidification), and Si (formed by
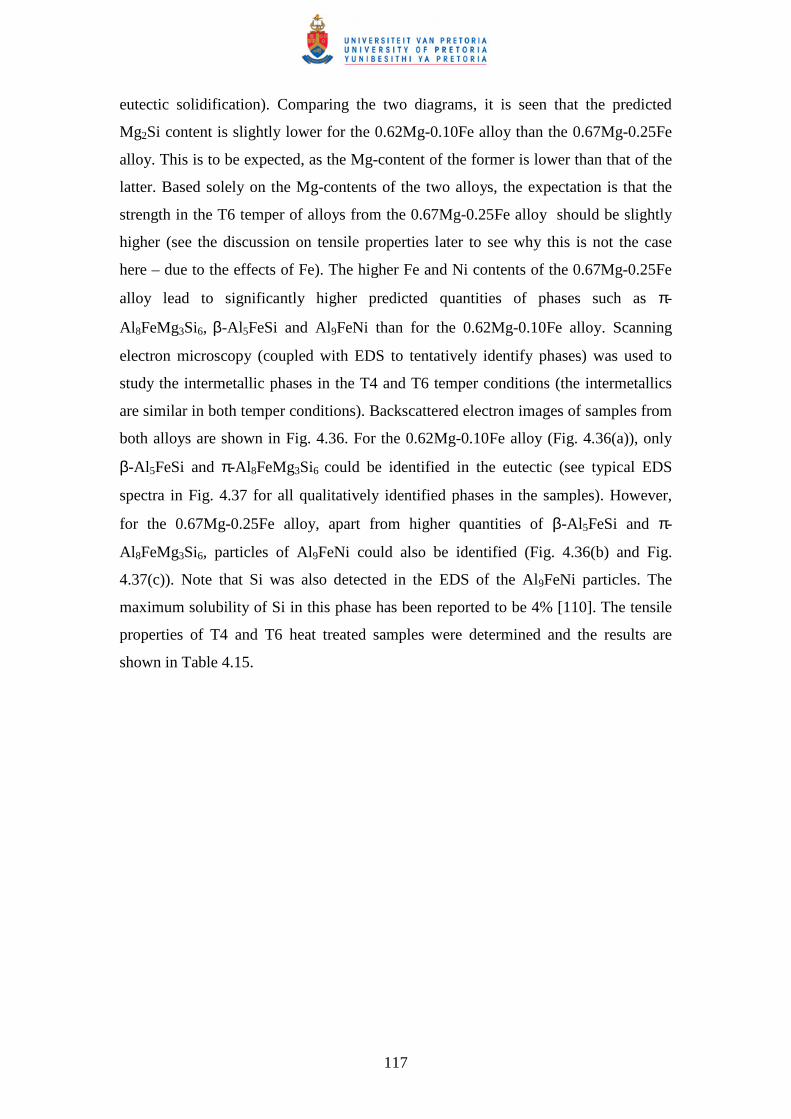
117
eutectic solidification). Comparing the two diagrams, it is seen that the predicted
Mg2Si content is slightly lower for the 0.62Mg-0.10Fe alloy than the 0.67Mg-0.25Fe
alloy. This is to be expected, as the Mg-content of the former is lower than that of the
latter. Based solely on the Mg-contents of the two alloys, the expectation is that the
strength in the T6 temper of alloys from the 0.67Mg-0.25Fe alloy should be slightly
higher (see the discussion on tensile properties later to see why this is not the case
here – due to the effects of Fe). The higher Fe and Ni contents of the 0.67Mg-0.25Fe
alloy lead to significantly higher predicted quantities of phases such as π-
Al 8FeMg3Si6, β-Al5FeSi and Al9FeNi than for the 0.62Mg-0.10Fe alloy. Scanning
electron microscopy (coupled with EDS to tentatively identify phases) was used to
study the intermetallic phases in the T4 and T6 temper conditions (the intermetallics
are similar in both temper conditions). Backscattered electron images of samples from
both alloys are shown in Fig. 4.36. For the 0.62Mg-0.10Fe alloy (Fig. 4.36(a)), only
β-Al 5FeSi and π-Al 8FeMg3Si6 could be identified in the eutectic (see typical EDS
spectra in Fig. 4.37 for all qualitatively identified phases in the samples). However,
for the 0.67Mg-0.25Fe alloy, apart from higher quantities of β-Al 5FeSi and π-
Al8FeMg3Si6, particles of Al9FeNi could also be identified (Fig. 4.36(b) and Fig.
4.37(c)). Note that Si was also detected in the EDS of the Al9FeNi particles. The
maximum solubility of Si in this phase has been reported to be 4% [110]. The tensile
properties of T4 and T6 heat treated samples were determined and the results are
shown in Table 4.15.
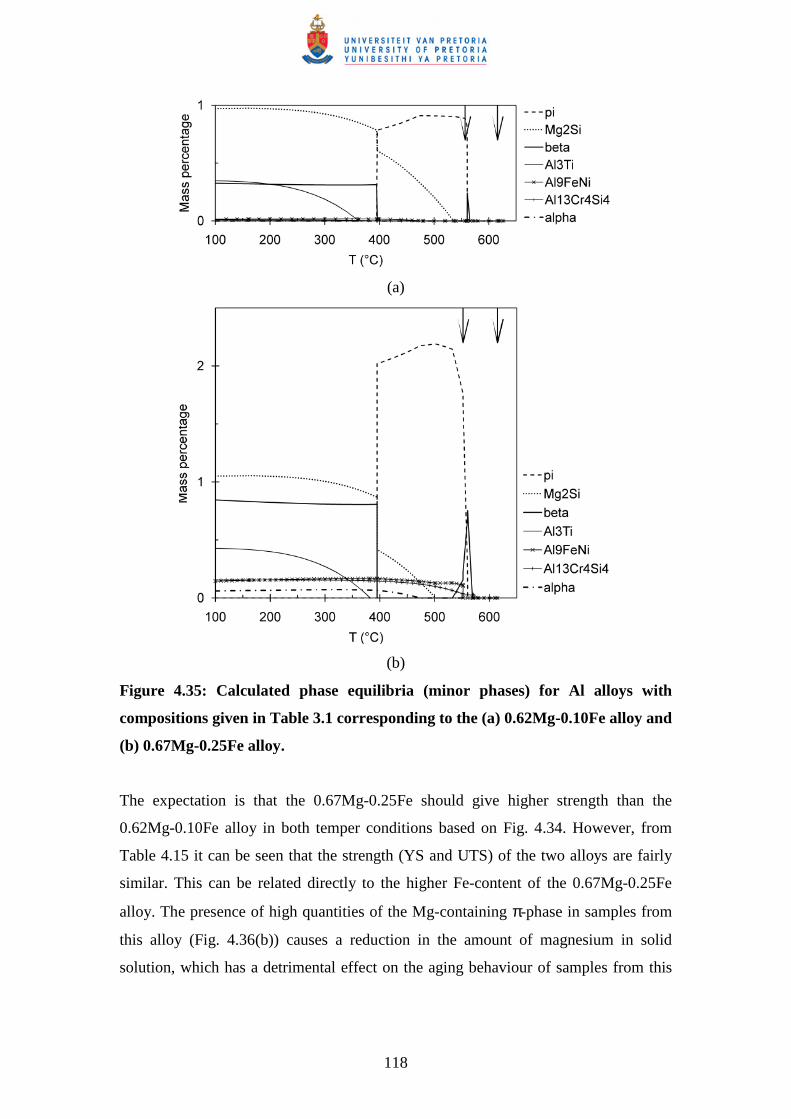
118
(a)
(b)
Figure 4.35: Calculated phase equilibria (minor phases) for Al alloys with
compositions given in Table 3.1 corresponding to the (a) 0.62Mg-0.10Fe alloy and
(b) 0.67Mg-0.25Fe alloy.
The expectation is that the 0.67Mg-0.25Fe should give higher strength than the
0.62Mg-0.10Fe alloy in both temper conditions based on Fig. 4.34. However, from
Table 4.15 it can be seen that the strength (YS and UTS) of the two alloys are fairly
similar. This can be related directly to the higher Fe-content of the 0.67Mg-0.25Fe
alloy. The presence of high quantities of the Mg-containing π-phase in samples from
this alloy (Fig. 4.36(b)) causes a reduction in the amount of magnesium in solid
solution, which has a detrimental effect on the aging behaviour of samples from this
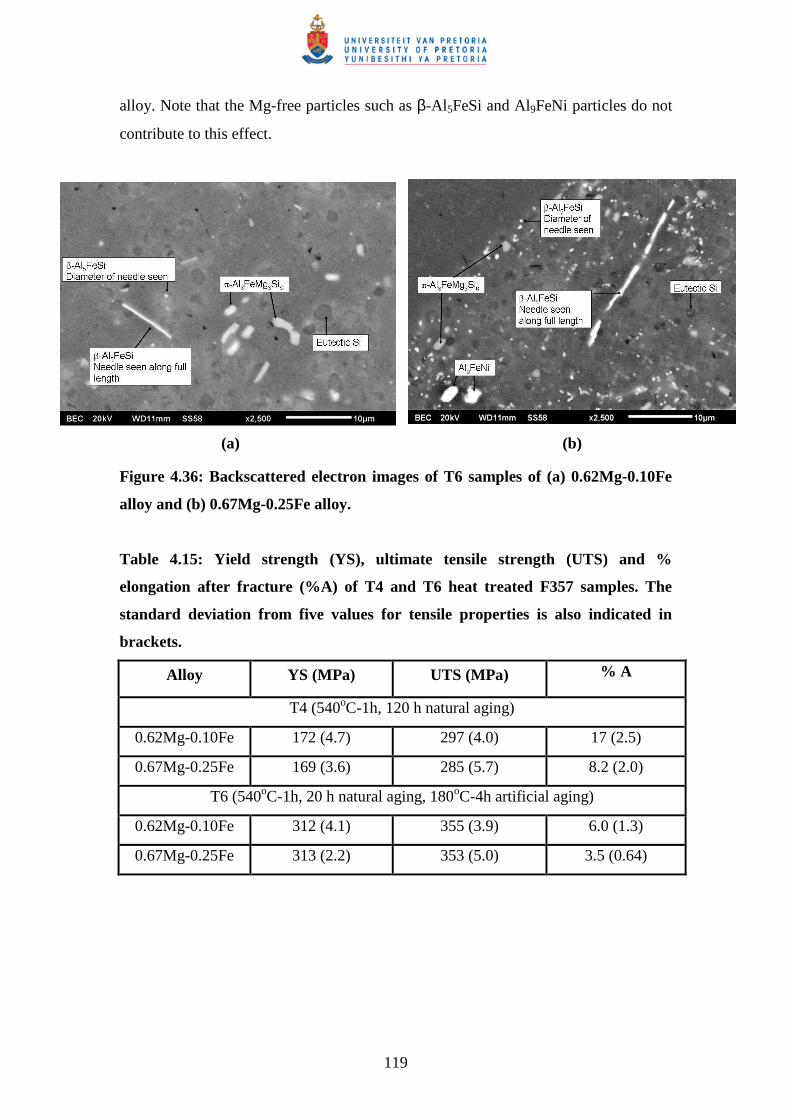
119
alloy. Note that the Mg-free particles such as β-Al 5FeSi and Al9FeNi particles do not
contribute to this effect.
(a) (b)
Figure 4.36: Backscattered electron images of T6 samples of (a) 0.62Mg-0.10Fe
alloy and (b) 0.67Mg-0.25Fe alloy.
Table 4.15: Yield strength (YS), ultimate tensile strength (UTS) and %
elongation after fracture (%A) of T4 and T6 heat treated F357 samples. The
standard deviation from five values for tensile properties is also indicated in
brackets.
Alloy YS (MPa) UTS (MPa) % A
T4 (540oC-1h, 120 h natural aging)
0.62Mg-0.10Fe 172 (4.7) 297 (4.0) 17 (2.5)
0.67Mg-0.25Fe 169 (3.6) 285 (5.7) 8.2 (2.0)
T6 (540oC-1h, 20 h natural aging, 180oC-4h artificial aging)
0.62Mg-0.10Fe 312 (4.1) 355 (3.9) 6.0 (1.3)
0.67Mg-0.25Fe 313 (2.2) 353 (5.0) 3.5 (0.64)
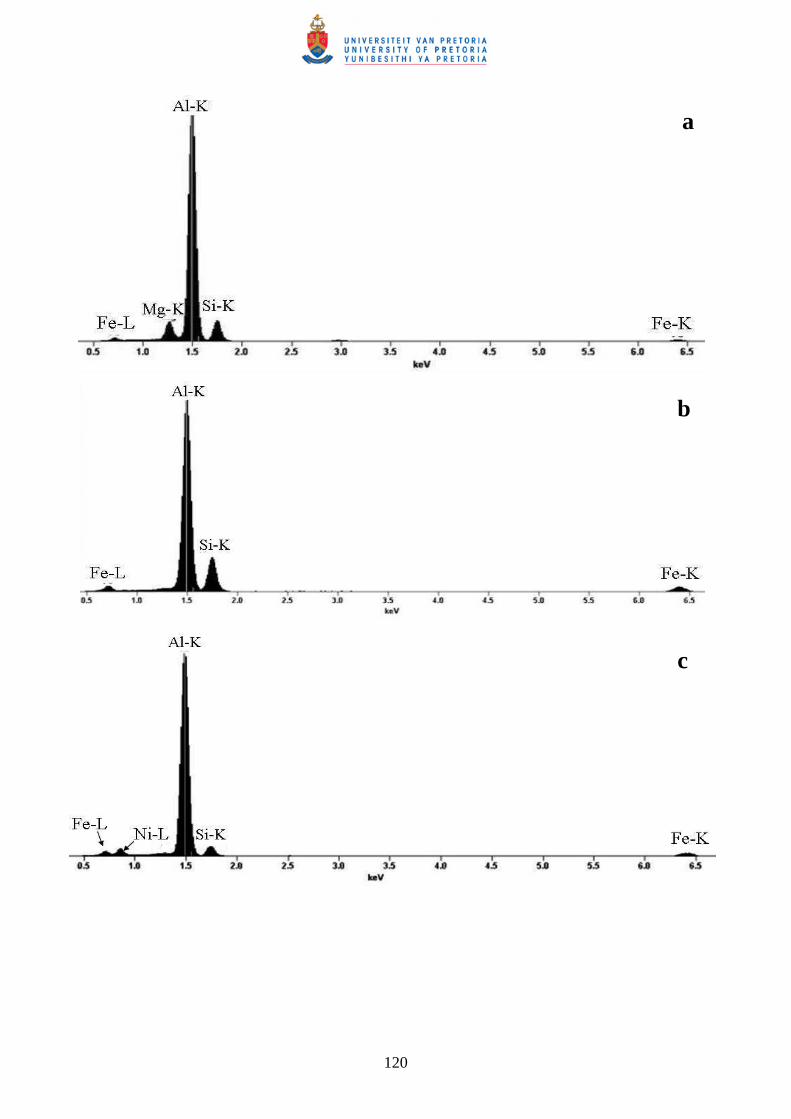
120
a
b
c
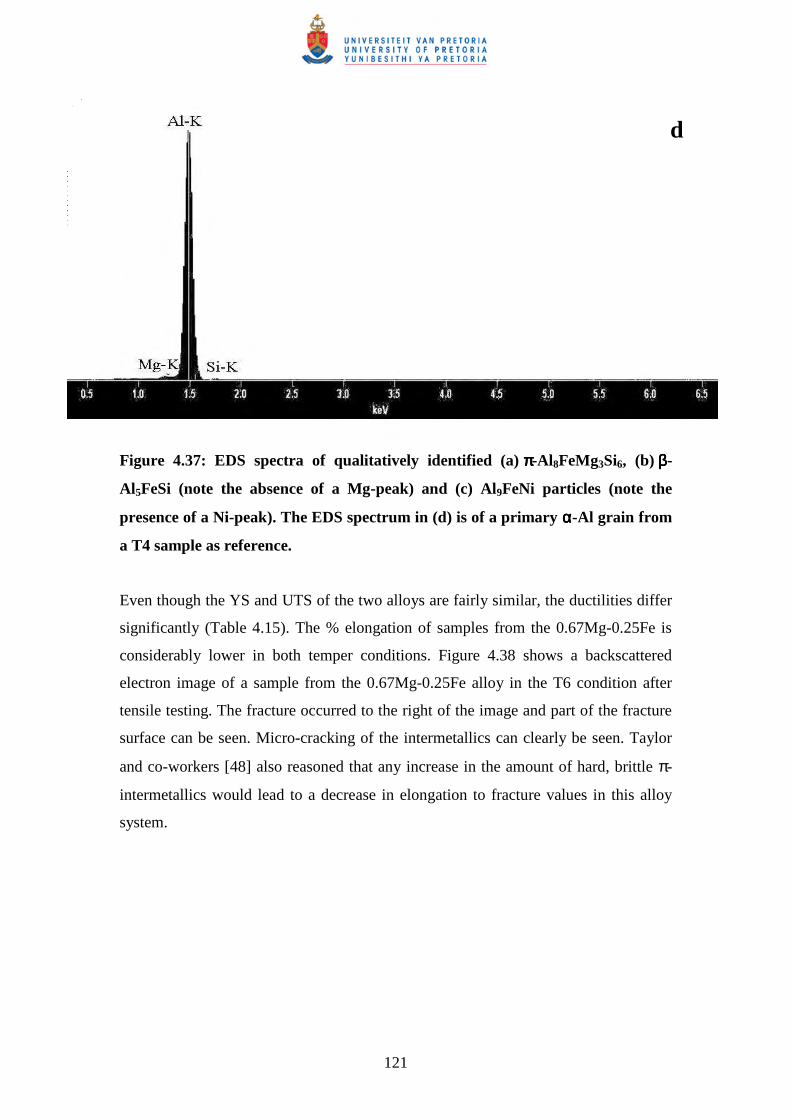
121
Figure 4.37: EDS spectra of qualitatively identified (a) π π π π-Al 8FeMg3Si6, (b) β β β β-
Al 5FeSi (note the absence of a Mg-peak) and (c) Al9FeNi particles (note the
presence of a Ni-peak). The EDS spectrum in (d) is of a primary αααα-Al grain from
a T4 sample as reference.
Even though the YS and UTS of the two alloys are fairly similar, the ductilities differ
significantly (Table 4.15). The % elongation of samples from the 0.67Mg-0.25Fe is
considerably lower in both temper conditions. Figure 4.38 shows a backscattered
electron image of a sample from the 0.67Mg-0.25Fe alloy in the T6 condition after
tensile testing. The fracture occurred to the right of the image and part of the fracture
surface can be seen. Micro-cracking of the intermetallics can clearly be seen. Taylor
and co-workers [48] also reasoned that any increase in the amount of hard, brittle π-
intermetallics would lead to a decrease in elongation to fracture values in this alloy
system.
d
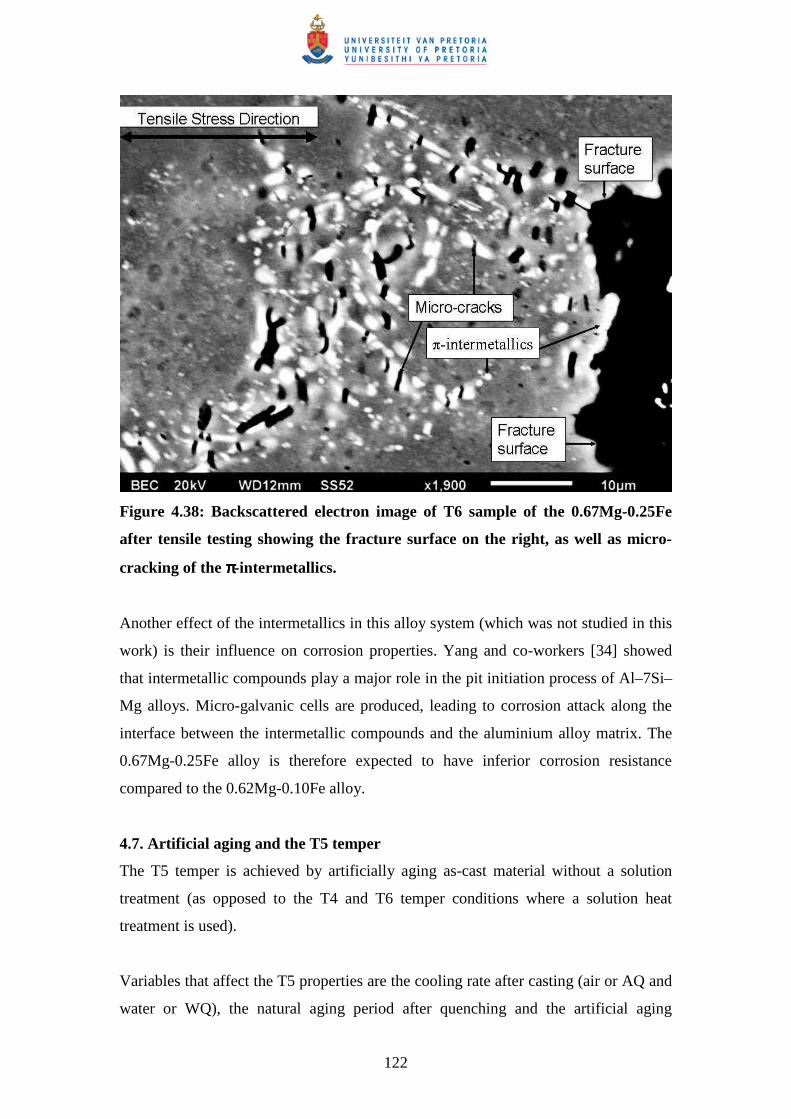
122
Figure 4.38: Backscattered electron image of T6 sample of the 0.67Mg-0.25Fe
after tensile testing showing the fracture surface on the right, as well as micro-
cracking of the ππππ-intermetallics.
Another effect of the intermetallics in this alloy system (which was not studied in this
work) is their influence on corrosion properties. Yang and co-workers [34] showed
that intermetallic compounds play a major role in the pit initiation process of Al–7Si–
Mg alloys. Micro-galvanic cells are produced, leading to corrosion attack along the
interface between the intermetallic compounds and the aluminium alloy matrix. The
0.67Mg-0.25Fe alloy is therefore expected to have inferior corrosion resistance
compared to the 0.62Mg-0.10Fe alloy.
4.7. Artificial aging and the T5 temper
The T5 temper is achieved by artificially aging as-cast material without a solution
treatment (as opposed to the T4 and T6 temper conditions where a solution heat
treatment is used).
Variables that affect the T5 properties are the cooling rate after casting (air or AQ and
water or WQ), the natural aging period after quenching and the artificial aging
123
temperature and time. The tensile properties of differently T5-treated SSM-HPDC
alloy F357 (with 0.63% Mg) are compared in Table 4.16 [HM6]. As expected, higher
tensile properties are obtained by water quenching the alloy after SSM-HPDC rather
than cooling in air. Also, it can be seen from Table 4.16 that there is a significant
difference in tensile properties between the as-cast material that was cooled in air
[F357-F(AQ)] and the F357-T5(AQ) sample. This implies that most of the elements
are actually placed in solution during cooling with SSM-HPDC, rather than with the
quench after SSM-HPDC. It has been shown that the solidification rate during HPDC
is relatively high (Fig. 4.4).
Table 4.16: Yield strength (YS), ultimate tensile strength (UTS) and %
elongation after fracture (%A) of SSM-HPDC F357 with 0.63% Mg. The
standard deviation from 12 values for tensile properties is also indicated in
brackets.
Quench after
SSM-HPDC
Natural Aging
(NA)
Artificial
aging (AA)
YS (MPa) UTS (MPa) % A
Air (AQ) 25oC-120 h - 117 (2.2) 229 (4.9) 9.9 (1.7)
Water (WQ) 25oC-120 h - 124 (2.7) 241 (6.1) 9.4 (1.7)
Air (AQ) 25oC-120 h 180oC-4 h 170 (9.9) 256 (10.9) 7.2 (1.5)
Water (WQ) - 180oC-4 h 186 (3.6) 273 (3.8) 6.6 (1.1)
Water (WQ) 25oC-120 h 180oC-4 h 188 (1.9) 278 (4.9) 6.4 (1.0)
Water (WQ) 25oC-120 h 160oC-28 h 205 (3.1) 290 (4.9) 6.1 (1.3)
Differences in the morphology of β-Mg2Si in the F(AQ) and F(WQ) can be observed
using backscattered electron imaging (Fig. 4.39(a,b)). The β-Mg2Si is significantly
coarser in the F(AQ) samples than in the F(WQ) samples, which corresponds to a
slower cooling rate to room temperature in the former sample.
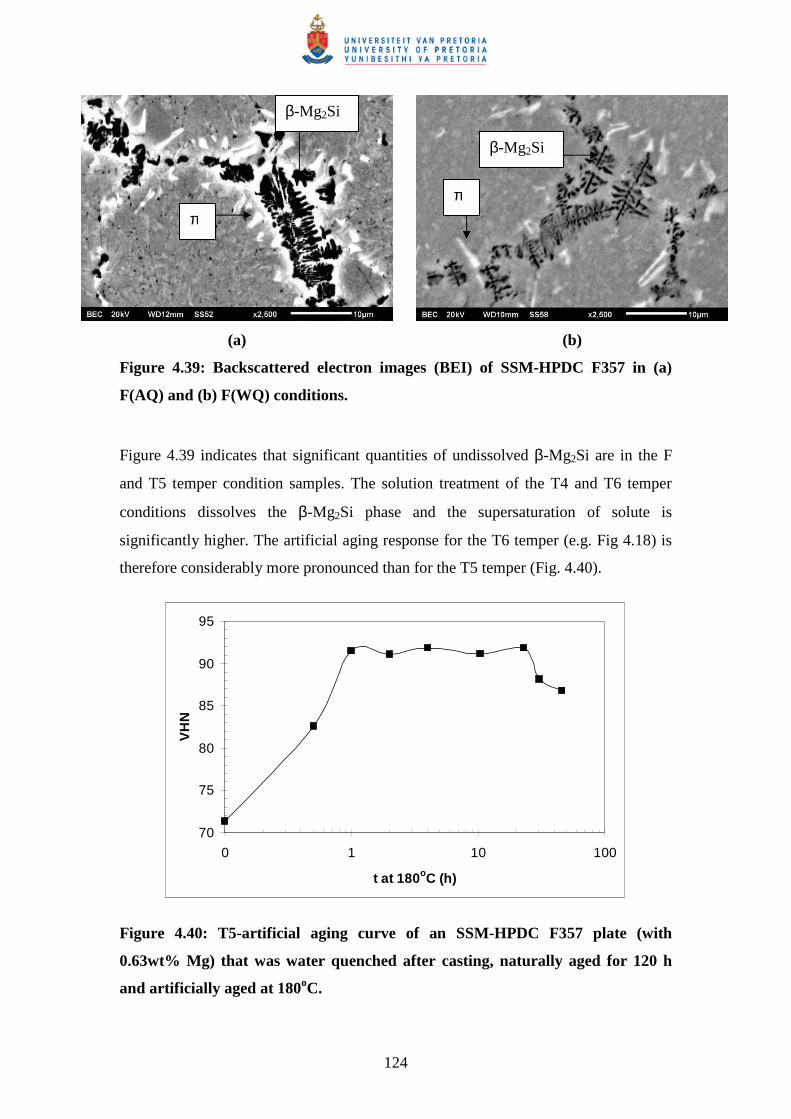
124
(a) (b)
Figure 4.39: Backscattered electron images (BEI) of SSM-HPDC F357 in (a)
F(AQ) and (b) F(WQ) conditions.
Figure 4.39 indicates that significant quantities of undissolved β-Mg2Si are in the F
and T5 temper condition samples. The solution treatment of the T4 and T6 temper
conditions dissolves the β-Mg2Si phase and the supersaturation of solute is
significantly higher. The artificial aging response for the T6 temper (e.g. Fig 4.18) is
therefore considerably more pronounced than for the T5 temper (Fig. 4.40).
70
75
80
85
90
95
0 1 10 100
t at 180oC (h)
VH
N
Figure 4.40: T5-artificial aging curve of an SSM-HPDC F357 plate (with
0.63wt% Mg) that was water quenched after casting, naturally aged for 120 h
and artificially aged at 180oC.
π
π
β-Mg2Si
β-Mg2Si
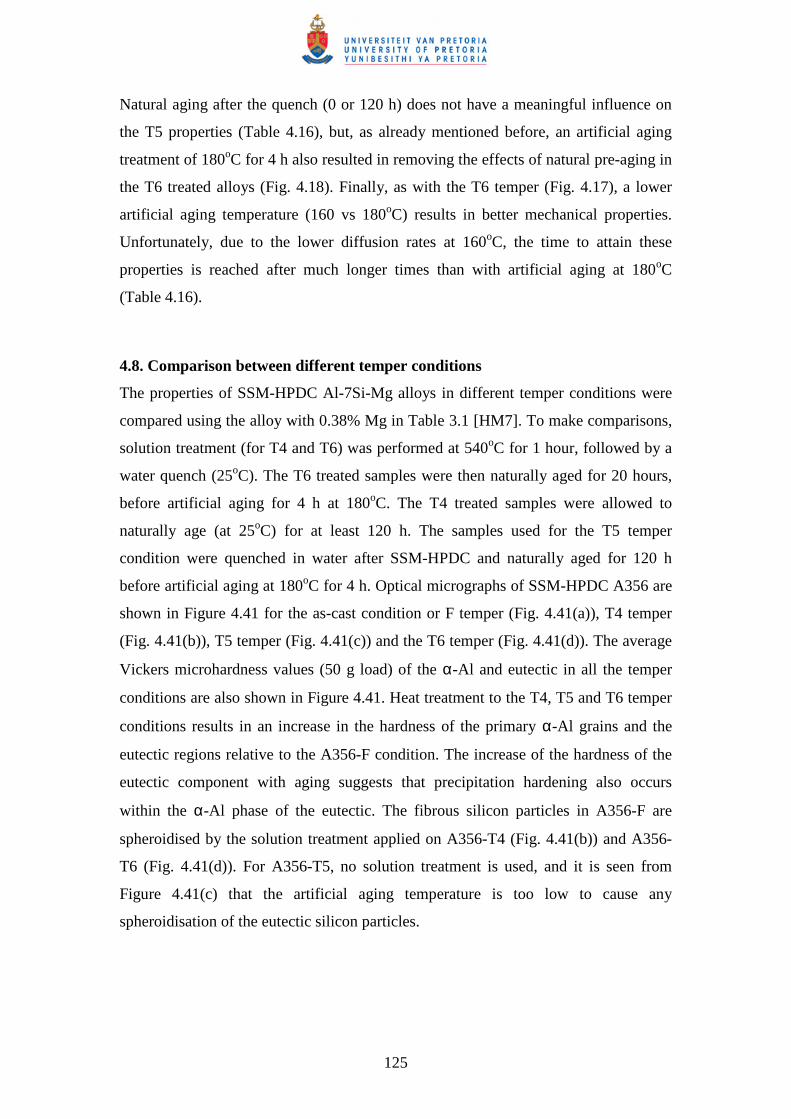
125
Natural aging after the quench (0 or 120 h) does not have a meaningful influence on
the T5 properties (Table 4.16), but, as already mentioned before, an artificial aging
treatment of 180oC for 4 h also resulted in removing the effects of natural pre-aging in
the T6 treated alloys (Fig. 4.18). Finally, as with the T6 temper (Fig. 4.17), a lower
artificial aging temperature (160 vs 180oC) results in better mechanical properties.
Unfortunately, due to the lower diffusion rates at 160oC, the time to attain these
properties is reached after much longer times than with artificial aging at 180oC
(Table 4.16).
4.8. Comparison between different temper conditions
The properties of SSM-HPDC Al-7Si-Mg alloys in different temper conditions were
compared using the alloy with 0.38% Mg in Table 3.1 [HM7]. To make comparisons,
solution treatment (for T4 and T6) was performed at 540oC for 1 hour, followed by a
water quench (25oC). The T6 treated samples were then naturally aged for 20 hours,
before artificial aging for 4 h at 180oC. The T4 treated samples were allowed to
naturally age (at 25oC) for at least 120 h. The samples used for the T5 temper
condition were quenched in water after SSM-HPDC and naturally aged for 120 h
before artificial aging at 180oC for 4 h. Optical micrographs of SSM-HPDC A356 are
shown in Figure 4.41 for the as-cast condition or F temper (Fig. 4.41(a)), T4 temper
(Fig. 4.41(b)), T5 temper (Fig. 4.41(c)) and the T6 temper (Fig. 4.41(d)). The average
Vickers microhardness values (50 g load) of the α-Al and eutectic in all the temper
conditions are also shown in Figure 4.41. Heat treatment to the T4, T5 and T6 temper
conditions results in an increase in the hardness of the primary α-Al grains and the
eutectic regions relative to the A356-F condition. The increase of the hardness of the
eutectic component with aging suggests that precipitation hardening also occurs
within the α-Al phase of the eutectic. The fibrous silicon particles in A356-F are
spheroidised by the solution treatment applied on A356-T4 (Fig. 4.41(b)) and A356-
T6 (Fig. 4.41(d)). For A356-T5, no solution treatment is used, and it is seen from
Figure 4.41(c) that the artificial aging temperature is too low to cause any
spheroidisation of the eutectic silicon particles.
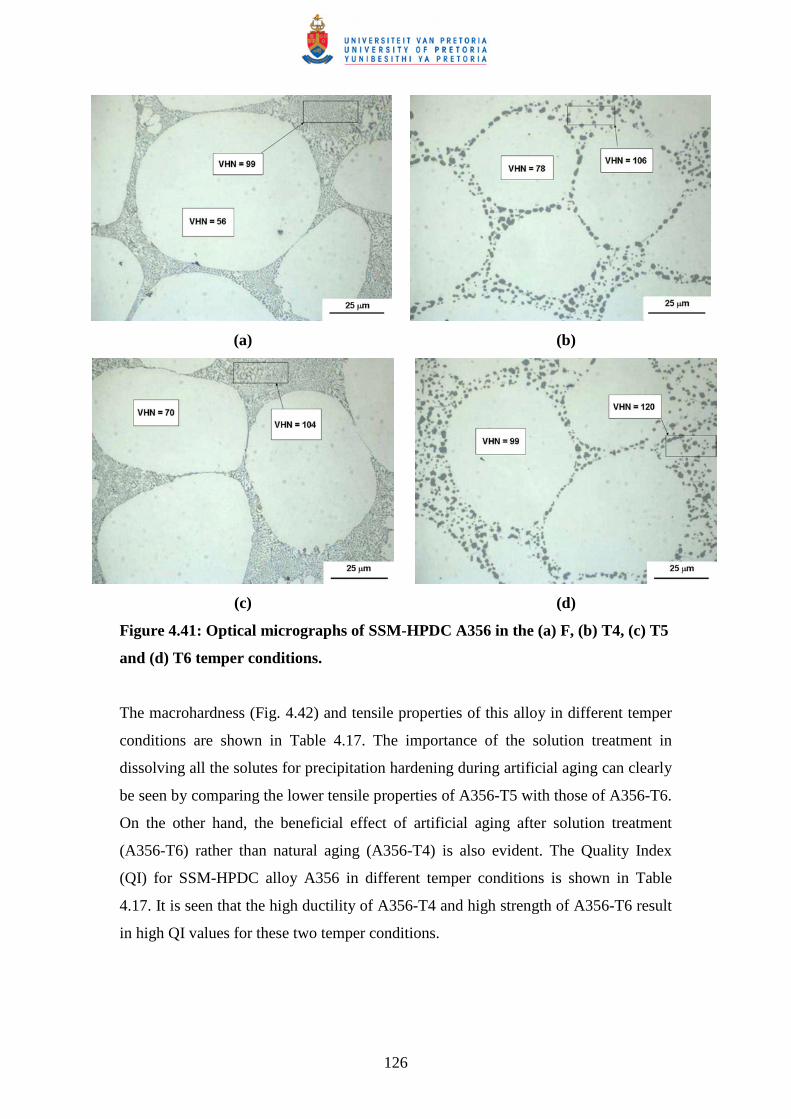
126
(a) (b)
(c) (d)
Figure 4.41: Optical micrographs of SSM-HPDC A356 in the (a) F, (b) T4, (c) T5
and (d) T6 temper conditions.
The macrohardness (Fig. 4.42) and tensile properties of this alloy in different temper
conditions are shown in Table 4.17. The importance of the solution treatment in
dissolving all the solutes for precipitation hardening during artificial aging can clearly
be seen by comparing the lower tensile properties of A356-T5 with those of A356-T6.
On the other hand, the beneficial effect of artificial aging after solution treatment
(A356-T6) rather than natural aging (A356-T4) is also evident. The Quality Index
(QI) for SSM-HPDC alloy A356 in different temper conditions is shown in Table
4.17. It is seen that the high ductility of A356-T4 and high strength of A356-T6 result
in high QI values for these two temper conditions.
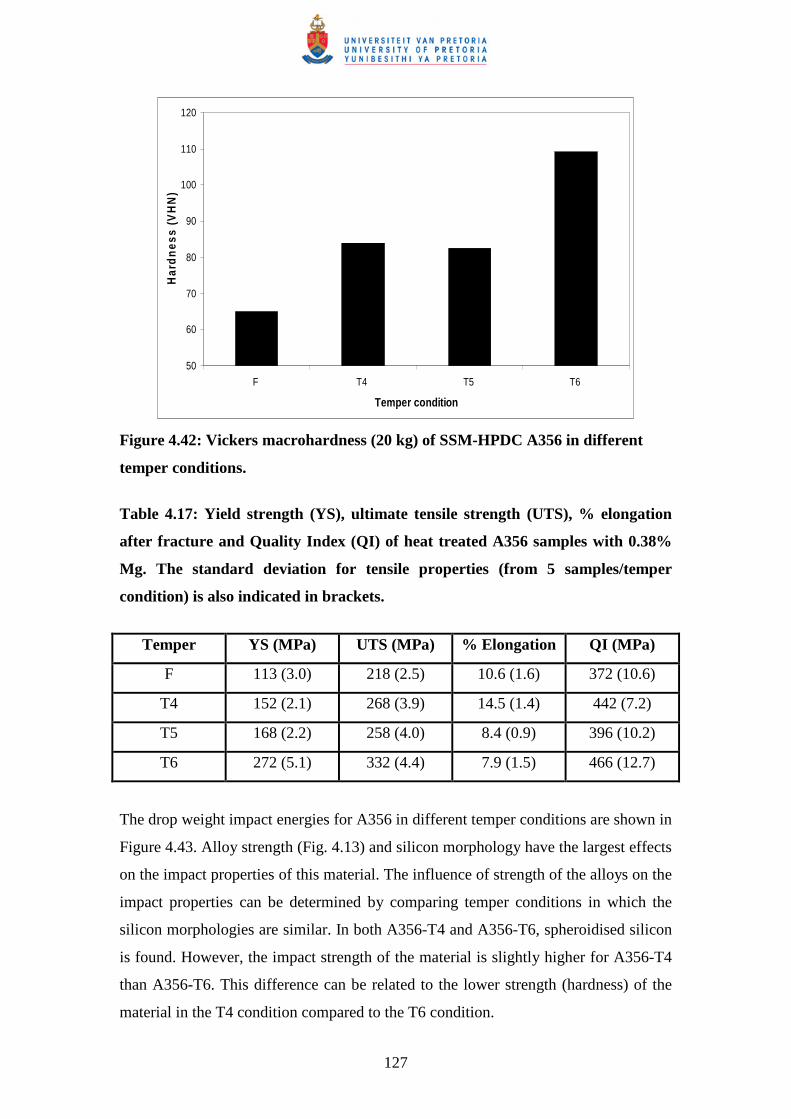
127
50
60
70
80
90
100
110
120
F T4 T5 T6
Temper condition
Har
dn
ess
(VH
N)
Figure 4.42: Vickers macrohardness (20 kg) of SSM-HPDC A356 in different
temper conditions.
Table 4.17: Yield strength (YS), ultimate tensile strength (UTS), % elongation
after fracture and Quality Index (QI) of heat treated A356 samples with 0.38%
Mg. The standard deviation for tensile properties (from 5 samples/temper
condition) is also indicated in brackets.
Temper YS (MPa) UTS (MPa) % Elongation QI (MPa)
F 113 (3.0) 218 (2.5) 10.6 (1.6) 372 (10.6)
T4 152 (2.1) 268 (3.9) 14.5 (1.4) 442 (7.2)
T5 168 (2.2) 258 (4.0) 8.4 (0.9) 396 (10.2)
T6 272 (5.1) 332 (4.4) 7.9 (1.5) 466 (12.7)
The drop weight impact energies for A356 in different temper conditions are shown in
Figure 4.43. Alloy strength (Fig. 4.13) and silicon morphology have the largest effects
on the impact properties of this material. The influence of strength of the alloys on the
impact properties can be determined by comparing temper conditions in which the
silicon morphologies are similar. In both A356-T4 and A356-T6, spheroidised silicon
is found. However, the impact strength of the material is slightly higher for A356-T4
than A356-T6. This difference can be related to the lower strength (hardness) of the
material in the T4 condition compared to the T6 condition.
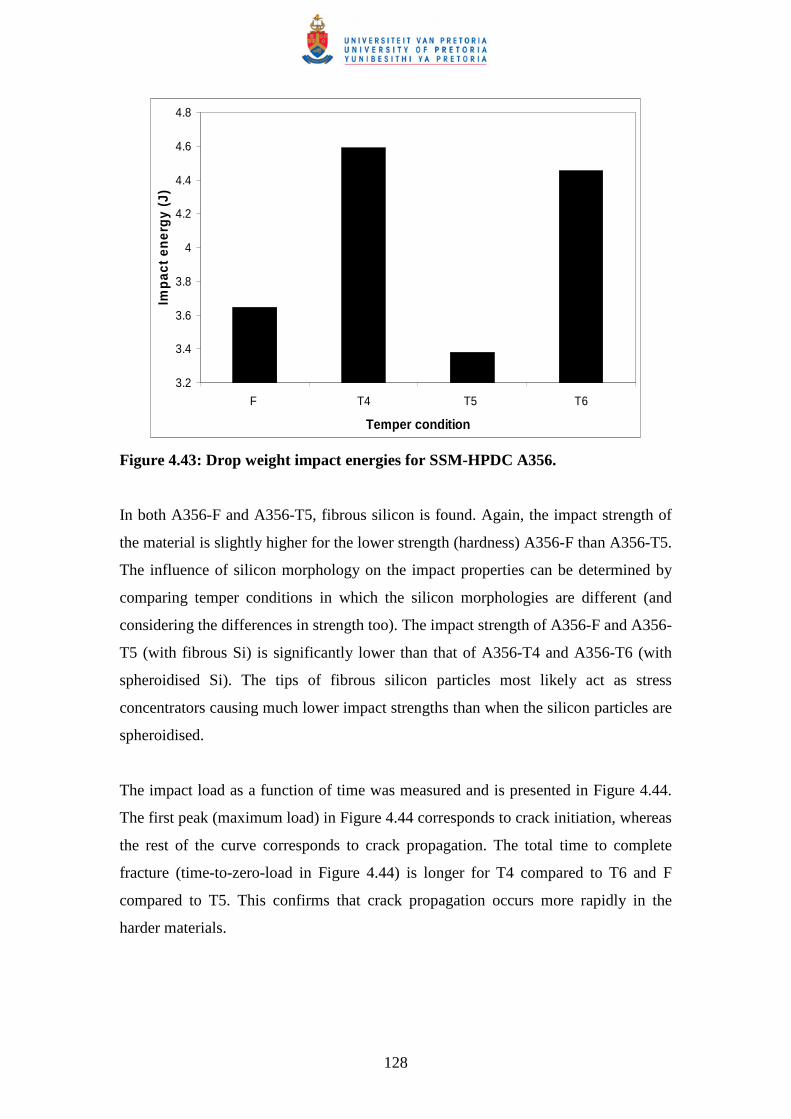
128
3.2
3.4
3.6
3.8
4
4.2
4.4
4.6
4.8
F T4 T5 T6
Temper condition
Imp
act
ener
gy
(J)
Figure 4.43: Drop weight impact energies for SSM-HPDC A356.
In both A356-F and A356-T5, fibrous silicon is found. Again, the impact strength of
the material is slightly higher for the lower strength (hardness) A356-F than A356-T5.
The influence of silicon morphology on the impact properties can be determined by
comparing temper conditions in which the silicon morphologies are different (and
considering the differences in strength too). The impact strength of A356-F and A356-
T5 (with fibrous Si) is significantly lower than that of A356-T4 and A356-T6 (with
spheroidised Si). The tips of fibrous silicon particles most likely act as stress
concentrators causing much lower impact strengths than when the silicon particles are
spheroidised.
The impact load as a function of time was measured and is presented in Figure 4.44.
The first peak (maximum load) in Figure 4.44 corresponds to crack initiation, whereas
the rest of the curve corresponds to crack propagation. The total time to complete
fracture (time-to-zero-load in Figure 4.44) is longer for T4 compared to T6 and F
compared to T5. This confirms that crack propagation occurs more rapidly in the
harder materials.
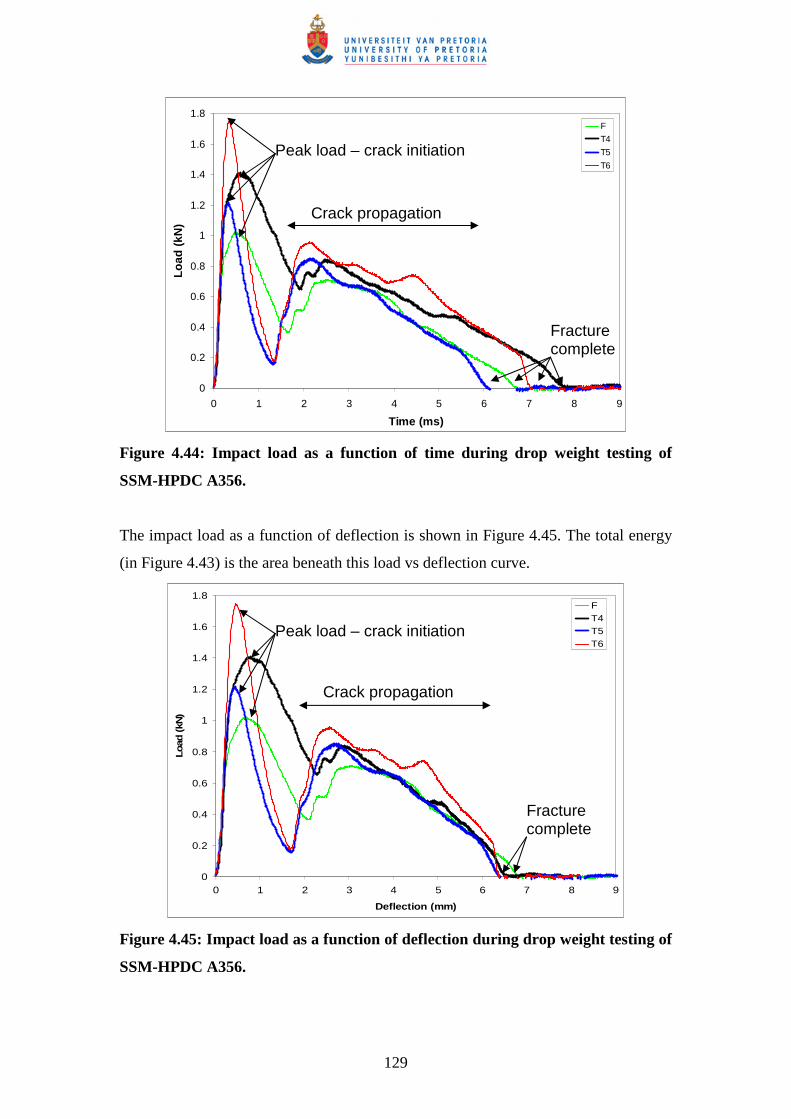
129
0
0.2
0.4
0.6
0.8
1
1.2
1.4
1.6
1.8
0 1 2 3 4 5 6 7 8 9
Time (ms)
Lo
ad (
kN)
F
T4
T5
T6
Figure 4.44: Impact load as a function of time during drop weight testing of
SSM-HPDC A356.
The impact load as a function of deflection is shown in Figure 4.45. The total energy
(in Figure 4.43) is the area beneath this load vs deflection curve.
0
0.2
0.4
0.6
0.8
1
1.2
1.4
1.6
1.8
0 1 2 3 4 5 6 7 8 9
Deflection (mm)
Load
(kN
)
FT4T5T6
Figure 4.45: Impact load as a function of deflection during drop weight testing of
SSM-HPDC A356.
Peak load – crack initiation
Crack propagation
Fracture complete
Peak load – crack initiation
Crack propagation
Fracture complete
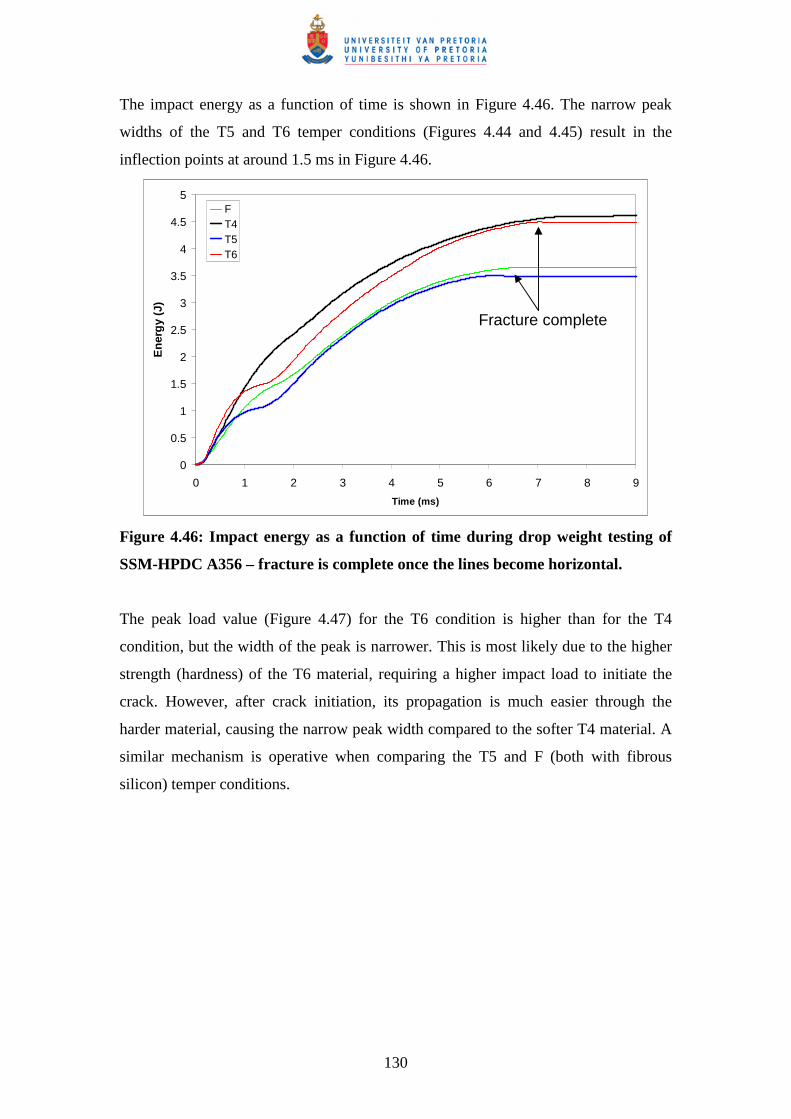
130
The impact energy as a function of time is shown in Figure 4.46. The narrow peak
widths of the T5 and T6 temper conditions (Figures 4.44 and 4.45) result in the
inflection points at around 1.5 ms in Figure 4.46.
0
0.5
1
1.5
2
2.5
3
3.5
4
4.5
5
0 1 2 3 4 5 6 7 8 9
Time (ms)
En
erg
y (J
)
FT4T5T6
Figure 4.46: Impact energy as a function of time during drop weight testing of
SSM-HPDC A356 – fracture is complete once the lines become horizontal.
The peak load value (Figure 4.47) for the T6 condition is higher than for the T4
condition, but the width of the peak is narrower. This is most likely due to the higher
strength (hardness) of the T6 material, requiring a higher impact load to initiate the
crack. However, after crack initiation, its propagation is much easier through the
harder material, causing the narrow peak width compared to the softer T4 material. A
similar mechanism is operative when comparing the T5 and F (both with fibrous
silicon) temper conditions.
Fracture complete
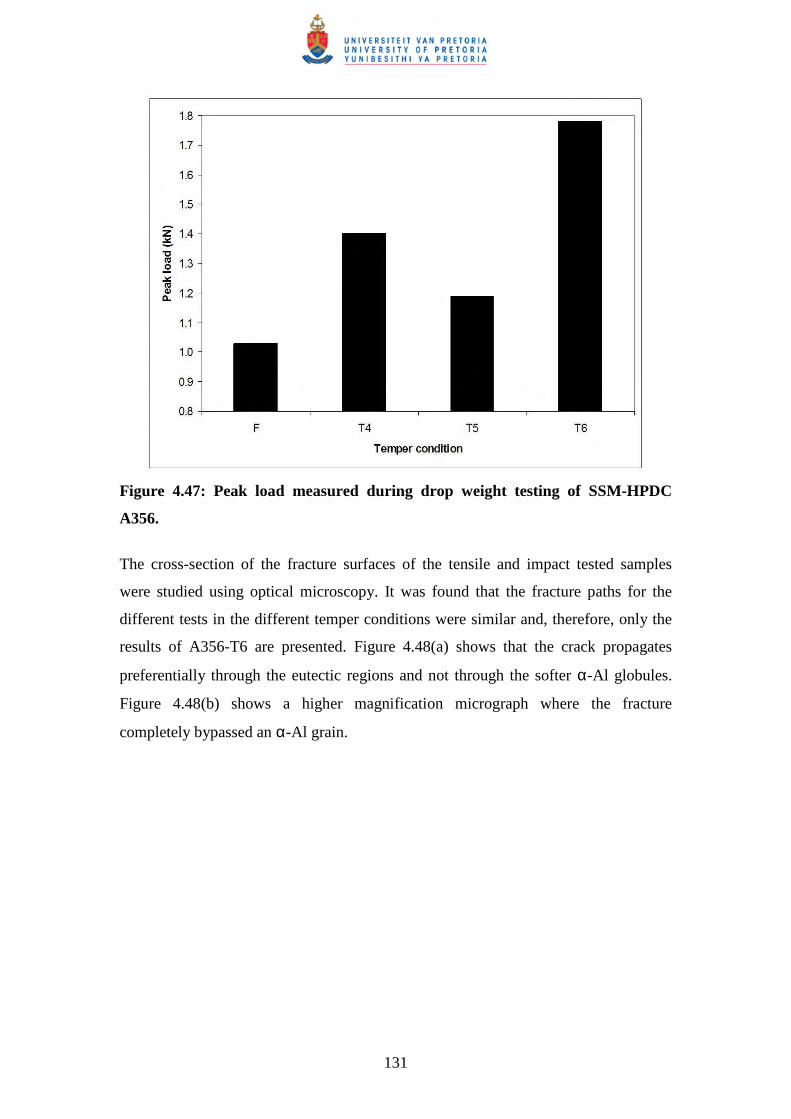
131
Figure 4.47: Peak load measured during drop weight testing of SSM-HPDC
A356.
The cross-section of the fracture surfaces of the tensile and impact tested samples
were studied using optical microscopy. It was found that the fracture paths for the
different tests in the different temper conditions were similar and, therefore, only the
results of A356-T6 are presented. Figure 4.48(a) shows that the crack propagates
preferentially through the eutectic regions and not through the softer α-Al globules.
Figure 4.48(b) shows a higher magnification micrograph where the fracture
completely bypassed an α-Al grain.
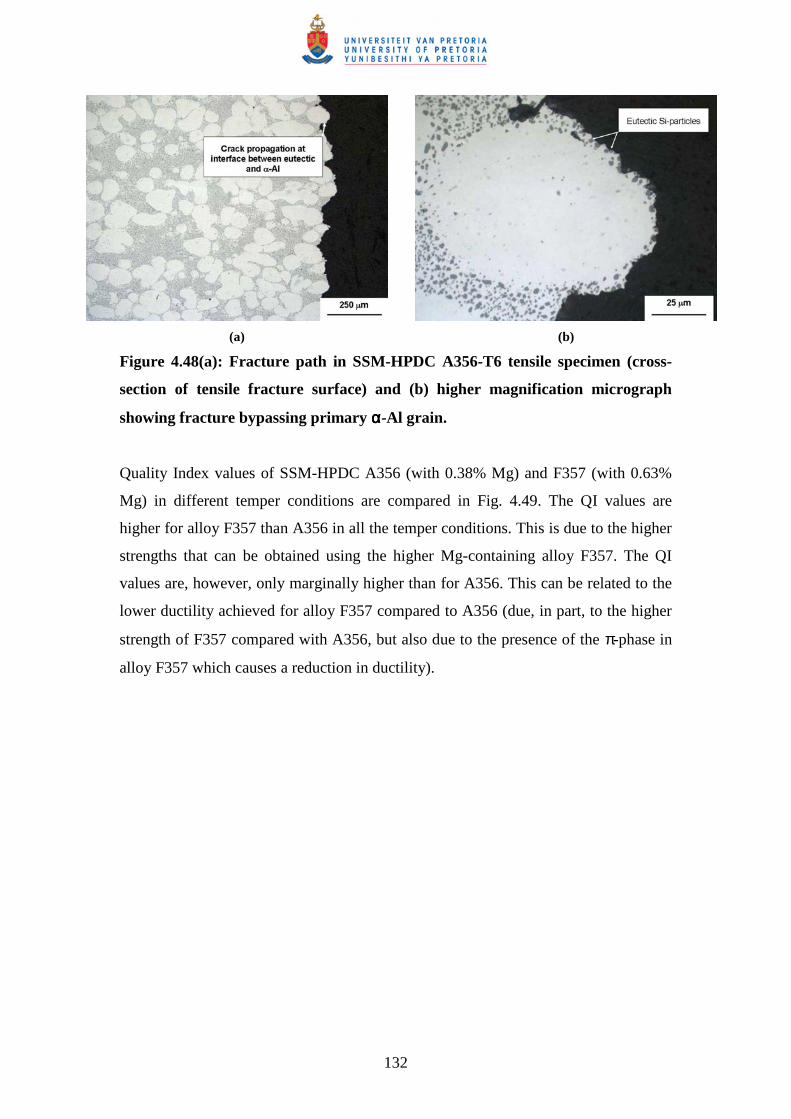
132
(a) (b)
Figure 4.48(a): Fracture path in SSM-HPDC A356-T6 tensile specimen (cross-
section of tensile fracture surface) and (b) higher magnification micrograph
showing fracture bypassing primary αααα-Al grain.
Quality Index values of SSM-HPDC A356 (with 0.38% Mg) and F357 (with 0.63%
Mg) in different temper conditions are compared in Fig. 4.49. The QI values are
higher for alloy F357 than A356 in all the temper conditions. This is due to the higher
strengths that can be obtained using the higher Mg-containing alloy F357. The QI
values are, however, only marginally higher than for A356. This can be related to the
lower ductility achieved for alloy F357 compared to A356 (due, in part, to the higher
strength of F357 compared with A356, but also due to the presence of the π-phase in
alloy F357 which causes a reduction in ductility).
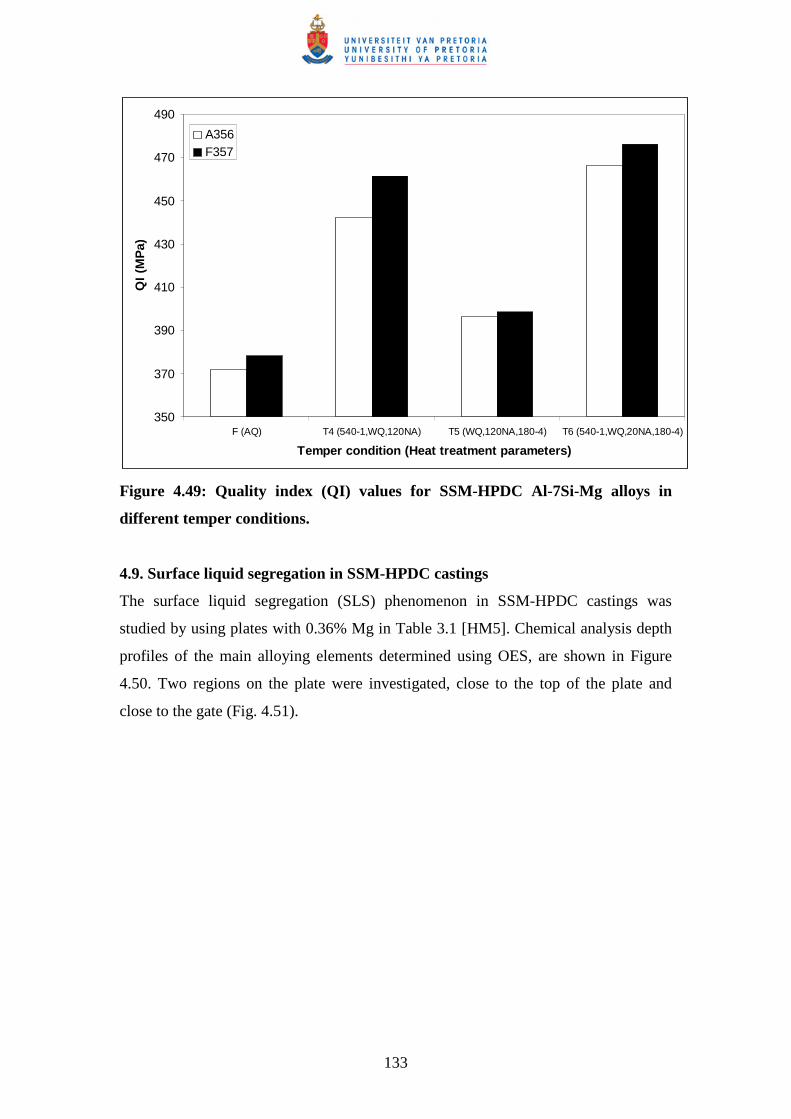
133
350
370
390
410
430
450
470
490
F (AQ) T4 (540-1,WQ,120NA) T5 (WQ,120NA,180-4) T6 (540-1,WQ,20NA,180-4)
Temper condition (Heat treatment parameters)
QI
(MP
a)A356F357
Figure 4.49: Quality index (QI) values for SSM-HPDC Al-7Si-Mg alloys in
different temper conditions.
4.9. Surface liquid segregation in SSM-HPDC castings
The surface liquid segregation (SLS) phenomenon in SSM-HPDC castings was
studied by using plates with 0.36% Mg in Table 3.1 [HM5]. Chemical analysis depth
profiles of the main alloying elements determined using OES, are shown in Figure
4.50. Two regions on the plate were investigated, close to the top of the plate and
close to the gate (Fig. 4.51).
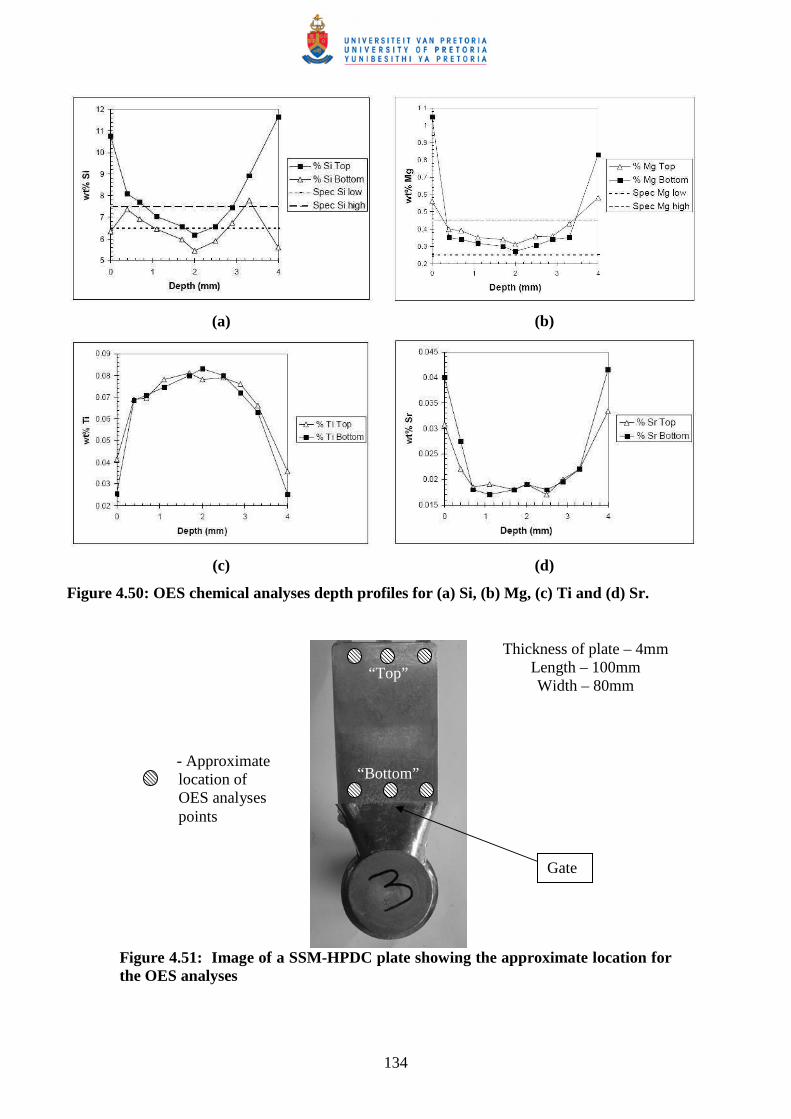
134
(a)
(b)
(c)
(d)
Figure 4.50: OES chemical analyses depth profiles for (a) Si, (b) Mg, (c) Ti and (d) Sr.
Thickness of plate – 4mm Length – 100mm Width – 80mm
Figure 4.51: Image of a SSM-HPDC plate showing the approximate location for the OES analyses
Gate
- Approximate location of OES analyses points
“Top”
“Bottom”
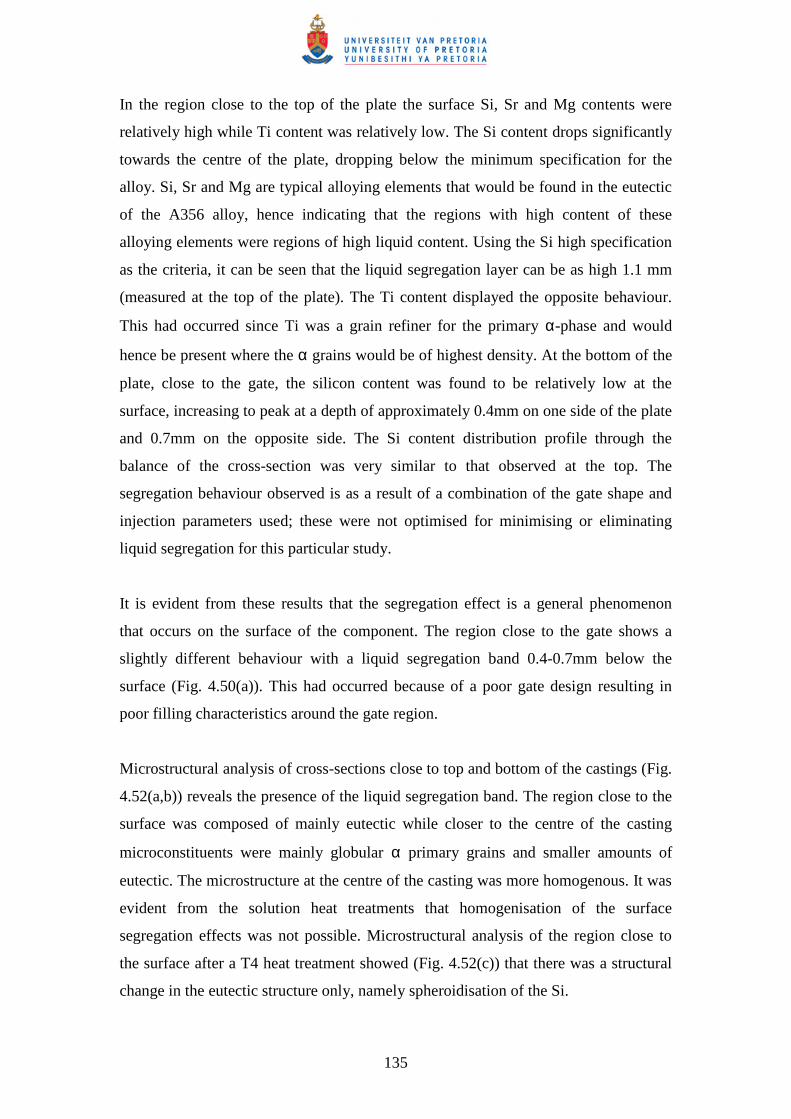
135
In the region close to the top of the plate the surface Si, Sr and Mg contents were
relatively high while Ti content was relatively low. The Si content drops significantly
towards the centre of the plate, dropping below the minimum specification for the
alloy. Si, Sr and Mg are typical alloying elements that would be found in the eutectic
of the A356 alloy, hence indicating that the regions with high content of these
alloying elements were regions of high liquid content. Using the Si high specification
as the criteria, it can be seen that the liquid segregation layer can be as high 1.1 mm
(measured at the top of the plate). The Ti content displayed the opposite behaviour.
This had occurred since Ti was a grain refiner for the primary α-phase and would
hence be present where the α grains would be of highest density. At the bottom of the
plate, close to the gate, the silicon content was found to be relatively low at the
surface, increasing to peak at a depth of approximately 0.4mm on one side of the plate
and 0.7mm on the opposite side. The Si content distribution profile through the
balance of the cross-section was very similar to that observed at the top. The
segregation behaviour observed is as a result of a combination of the gate shape and
injection parameters used; these were not optimised for minimising or eliminating
liquid segregation for this particular study.
It is evident from these results that the segregation effect is a general phenomenon
that occurs on the surface of the component. The region close to the gate shows a
slightly different behaviour with a liquid segregation band 0.4-0.7mm below the
surface (Fig. 4.50(a)). This had occurred because of a poor gate design resulting in
poor filling characteristics around the gate region.
Microstructural analysis of cross-sections close to top and bottom of the castings (Fig.
4.52(a,b)) reveals the presence of the liquid segregation band. The region close to the
surface was composed of mainly eutectic while closer to the centre of the casting
microconstituents were mainly globular α primary grains and smaller amounts of
eutectic. The microstructure at the centre of the casting was more homogenous. It was
evident from the solution heat treatments that homogenisation of the surface
segregation effects was not possible. Microstructural analysis of the region close to
the surface after a T4 heat treatment showed (Fig. 4.52(c)) that there was a structural
change in the eutectic structure only, namely spheroidisation of the Si.
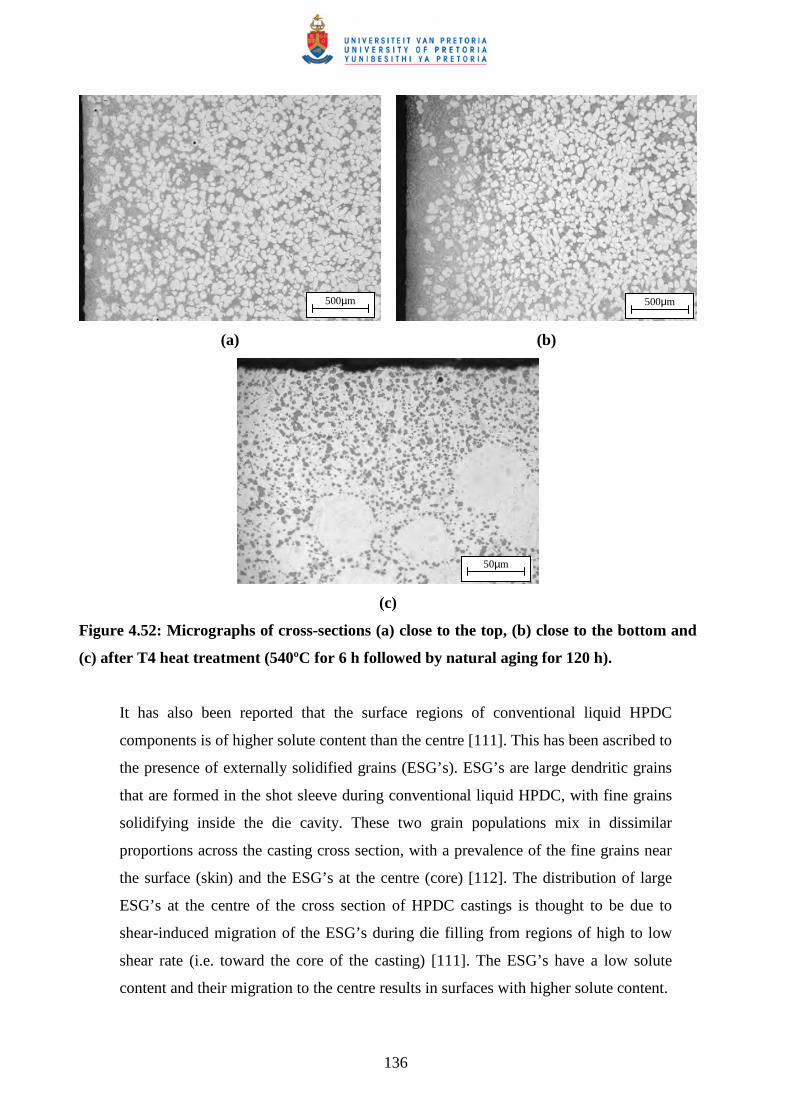
136
(a)
(b)
(c)
Figure 4.52: Micrographs of cross-sections (a) close to the top, (b) close to the bottom and
(c) after T4 heat treatment (540ºC for 6 h followed by natural aging for 120 h).
It has also been reported that the surface regions of conventional liquid HPDC
components is of higher solute content than the centre [111]. This has been ascribed to
the presence of externally solidified grains (ESG’s). ESG’s are large dendritic grains
that are formed in the shot sleeve during conventional liquid HPDC, with fine grains
solidifying inside the die cavity. These two grain populations mix in dissimilar
proportions across the casting cross section, with a prevalence of the fine grains near
the surface (skin) and the ESG’s at the centre (core) [112]. The distribution of large
ESG’s at the centre of the cross section of HPDC castings is thought to be due to
shear-induced migration of the ESG’s during die filling from regions of high to low
shear rate (i.e. toward the core of the casting) [111]. The ESG’s have a low solute
content and their migration to the centre results in surfaces with higher solute content.
50µm
500µm 500µm
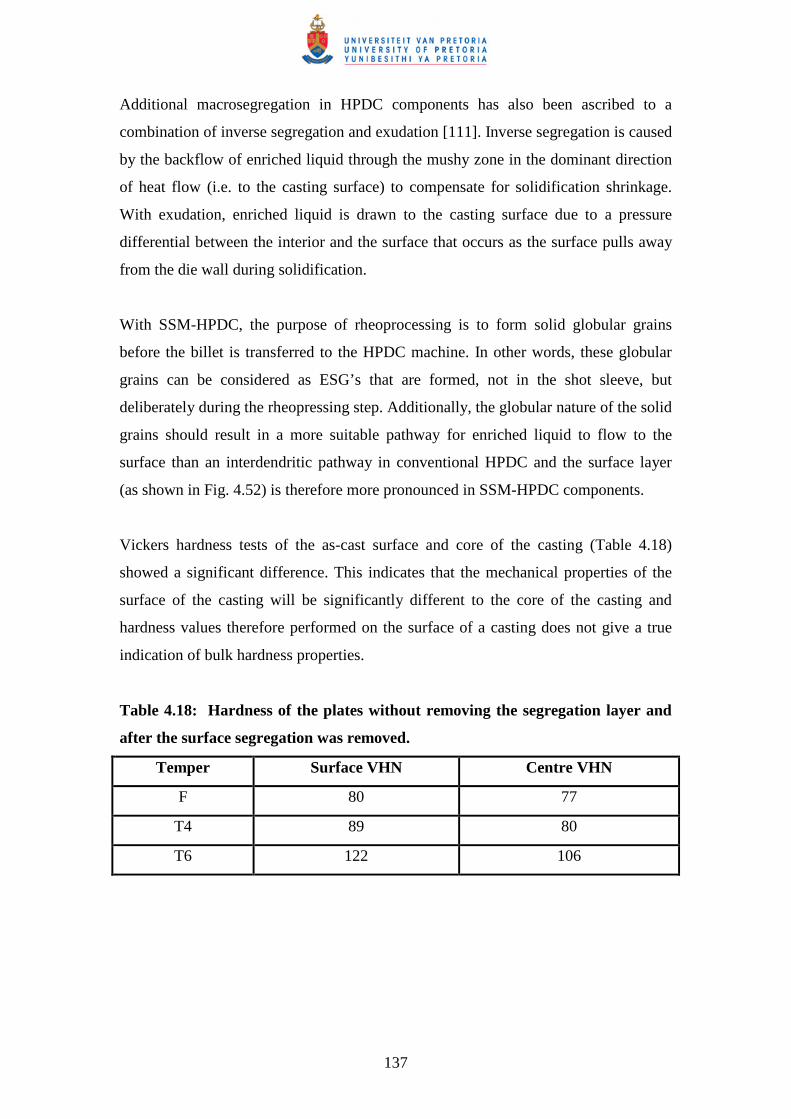
137
Additional macrosegregation in HPDC components has also been ascribed to a
combination of inverse segregation and exudation [111]. Inverse segregation is caused
by the backflow of enriched liquid through the mushy zone in the dominant direction
of heat flow (i.e. to the casting surface) to compensate for solidification shrinkage.
With exudation, enriched liquid is drawn to the casting surface due to a pressure
differential between the interior and the surface that occurs as the surface pulls away
from the die wall during solidification.
With SSM-HPDC, the purpose of rheoprocessing is to form solid globular grains
before the billet is transferred to the HPDC machine. In other words, these globular
grains can be considered as ESG’s that are formed, not in the shot sleeve, but
deliberately during the rheopressing step. Additionally, the globular nature of the solid
grains should result in a more suitable pathway for enriched liquid to flow to the
surface than an interdendritic pathway in conventional HPDC and the surface layer
(as shown in Fig. 4.52) is therefore more pronounced in SSM-HPDC components.
Vickers hardness tests of the as-cast surface and core of the casting (Table 4.18)
showed a significant difference. This indicates that the mechanical properties of the
surface of the casting will be significantly different to the core of the casting and
hardness values therefore performed on the surface of a casting does not give a true
indication of bulk hardness properties.
Table 4.18: Hardness of the plates without removing the segregation layer and
after the surface segregation was removed.
Temper Surface VHN Centre VHN
F 80 77
T4 89 80
T6 122 106
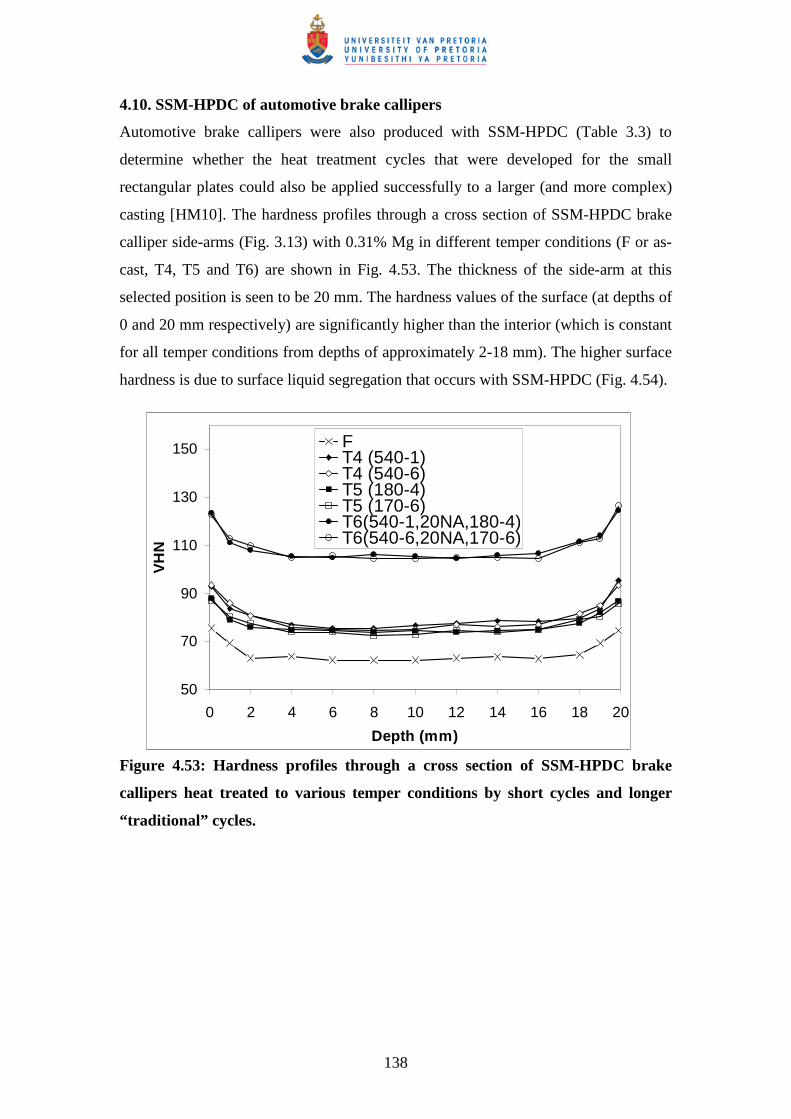
138
4.10. SSM-HPDC of automotive brake callipers
Automotive brake callipers were also produced with SSM-HPDC (Table 3.3) to
determine whether the heat treatment cycles that were developed for the small
rectangular plates could also be applied successfully to a larger (and more complex)
casting [HM10]. The hardness profiles through a cross section of SSM-HPDC brake
calliper side-arms (Fig. 3.13) with 0.31% Mg in different temper conditions (F or as-
cast, T4, T5 and T6) are shown in Fig. 4.53. The thickness of the side-arm at this
selected position is seen to be 20 mm. The hardness values of the surface (at depths of
0 and 20 mm respectively) are significantly higher than the interior (which is constant
for all temper conditions from depths of approximately 2-18 mm). The higher surface
hardness is due to surface liquid segregation that occurs with SSM-HPDC (Fig. 4.54).
Figure 4.53: Hardness profiles through a cross section of SSM-HPDC brake
callipers heat treated to various temper conditions by short cycles and longer
“traditional” cycles.
50
70
90
110
130
150
0 2 4 6 8 10 12 14 16 18 20
Depth (mm)
VH
N
FT4 (540-1)T4 (540-6)T5 (180-4)T5 (170-6)T6(540-1,20NA,180-4)T6(540-6,20NA,170-6)
139
Figure 4.54: Optical micrograph showing the eutectic surface layer found in
SSM-HPDC brake callipers.
The hardness profile in the T4 temper condition using the short cycle (540oC for 1 h,
quench and natural aging (NA) for 5 days) is very similar to when the longer
“traditional” cycle is used (540oC for 6 h, quench and NA for 5 days). Similarly, the
shorter T5 cycle (artificial aging (AA) at 180oC for 4 h) results in a comparable
hardness profile to the longer “traditional” T5 cycle (AA at 170oC for 6 h). Finally,
the short CSIR T6 cycle (540oC for 1 h, quench, NA for 20 h, AA at 180oC for 4 h)
results in an almost identical hardness profile than for the “traditional” T6 cycle
(540oC for 6 h, quench, NA for 20 h, AA at 170oC for 6 h). Figure 4.53 illustrates that
shorter heat treatment cycles can be employed on larger castings to obtain significant
energy savings and increased productivity without the loss of properties.
4.11. Comparison of aging response of globular and dendritic Al-7Si-Mg alloys
4.11.1. SSM-HPDC and GDC automotive brake callipers
The investigation entailed comparing SSM-HPDC brake callipers (globular) to gravity
die cast (GDC) brake callipers (dendritic) [HM10]. From Table 3.3 it can be seen that
the Mg-contents of these brake callipers are similar (0.35 and 0.36% respectively).
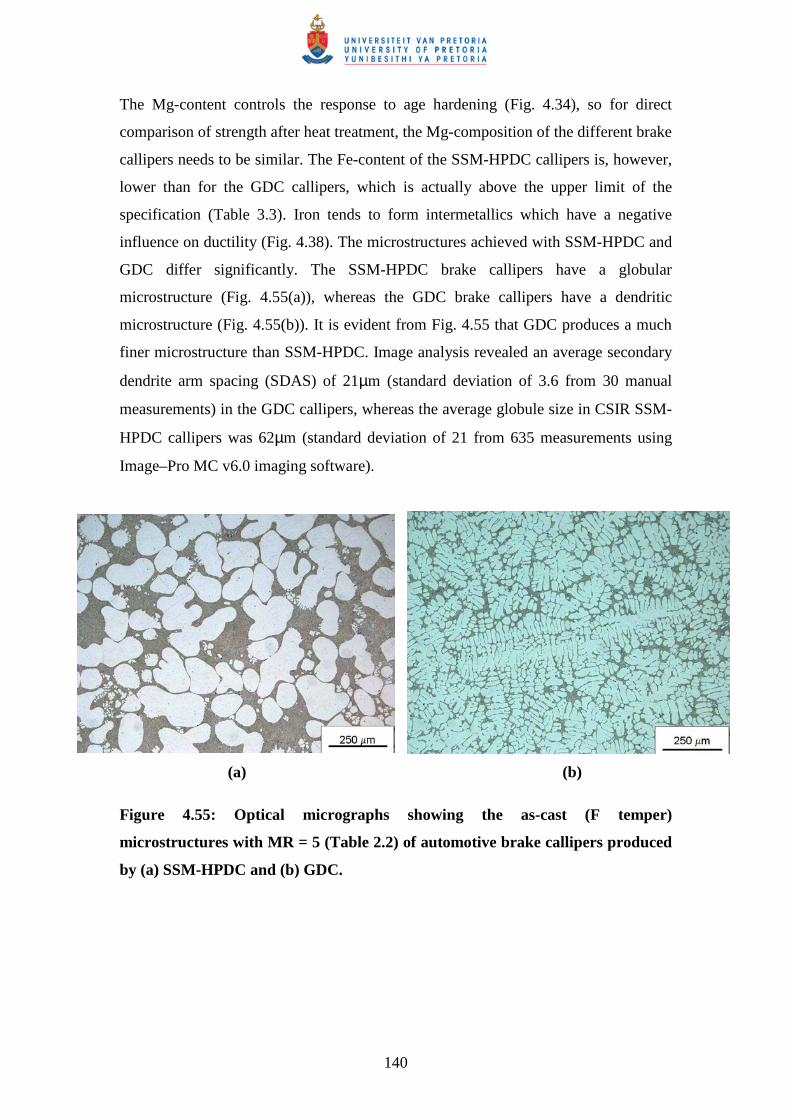
140
The Mg-content controls the response to age hardening (Fig. 4.34), so for direct
comparison of strength after heat treatment, the Mg-composition of the different brake
callipers needs to be similar. The Fe-content of the SSM-HPDC callipers is, however,
lower than for the GDC callipers, which is actually above the upper limit of the
specification (Table 3.3). Iron tends to form intermetallics which have a negative
influence on ductility (Fig. 4.38). The microstructures achieved with SSM-HPDC and
GDC differ significantly. The SSM-HPDC brake callipers have a globular
microstructure (Fig. 4.55(a)), whereas the GDC brake callipers have a dendritic
microstructure (Fig. 4.55(b)). It is evident from Fig. 4.55 that GDC produces a much
finer microstructure than SSM-HPDC. Image analysis revealed an average secondary
dendrite arm spacing (SDAS) of 21µm (standard deviation of 3.6 from 30 manual
measurements) in the GDC callipers, whereas the average globule size in CSIR SSM-
HPDC callipers was 62µm (standard deviation of 21 from 635 measurements using
Image–Pro MC v6.0 imaging software).
(a) (b)
Figure 4.55: Optical micrographs showing the as-cast (F temper)
microstructures with MR = 5 (Table 2.2) of automotive brake callipers produced
by (a) SSM-HPDC and (b) GDC.
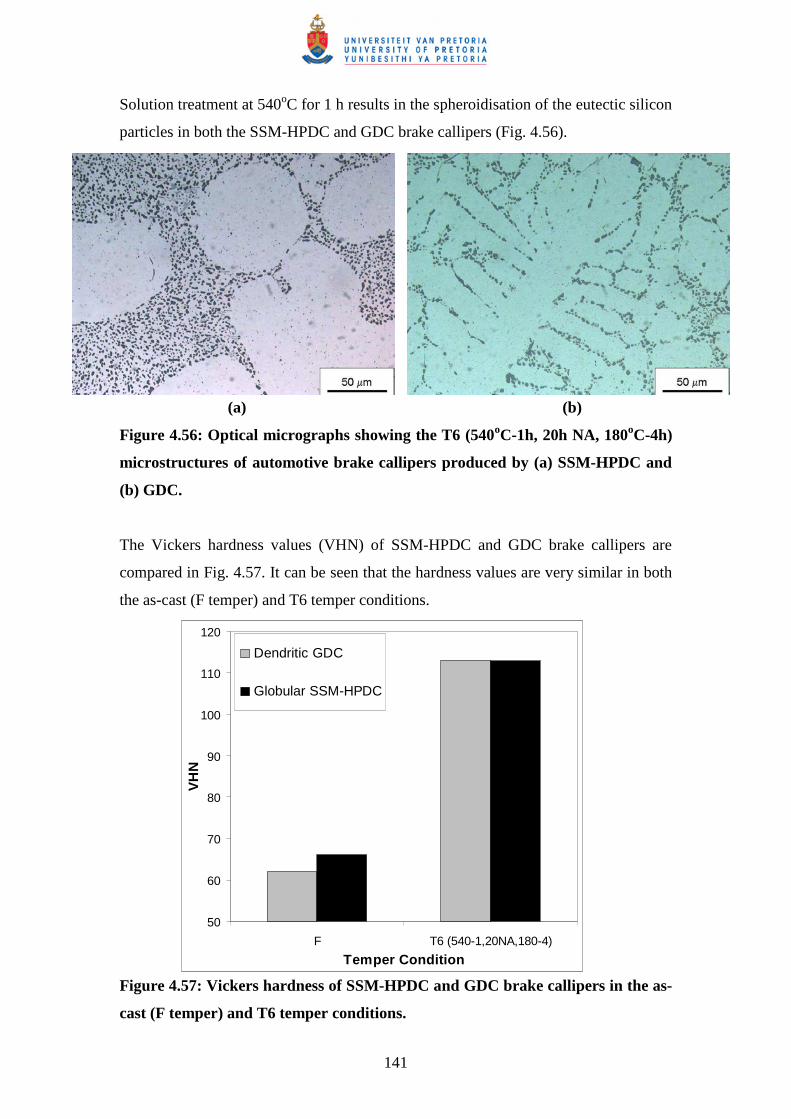
141
Solution treatment at 540oC for 1 h results in the spheroidisation of the eutectic silicon
particles in both the SSM-HPDC and GDC brake callipers (Fig. 4.56).
(a) (b)
Figure 4.56: Optical micrographs showing the T6 (540oC-1h, 20h NA, 180oC-4h)
microstructures of automotive brake callipers produced by (a) SSM-HPDC and
(b) GDC.
The Vickers hardness values (VHN) of SSM-HPDC and GDC brake callipers are
compared in Fig. 4.57. It can be seen that the hardness values are very similar in both
the as-cast (F temper) and T6 temper conditions.
Figure 4.57: Vickers hardness of SSM-HPDC and GDC brake callipers in the as-
cast (F temper) and T6 temper conditions.
50
60
70
80
90
100
110
120
F T6 (540-1,20NA,180-4)
Temper Condition
VH
N
Dendritic GDC
Globular SSM-HPDC
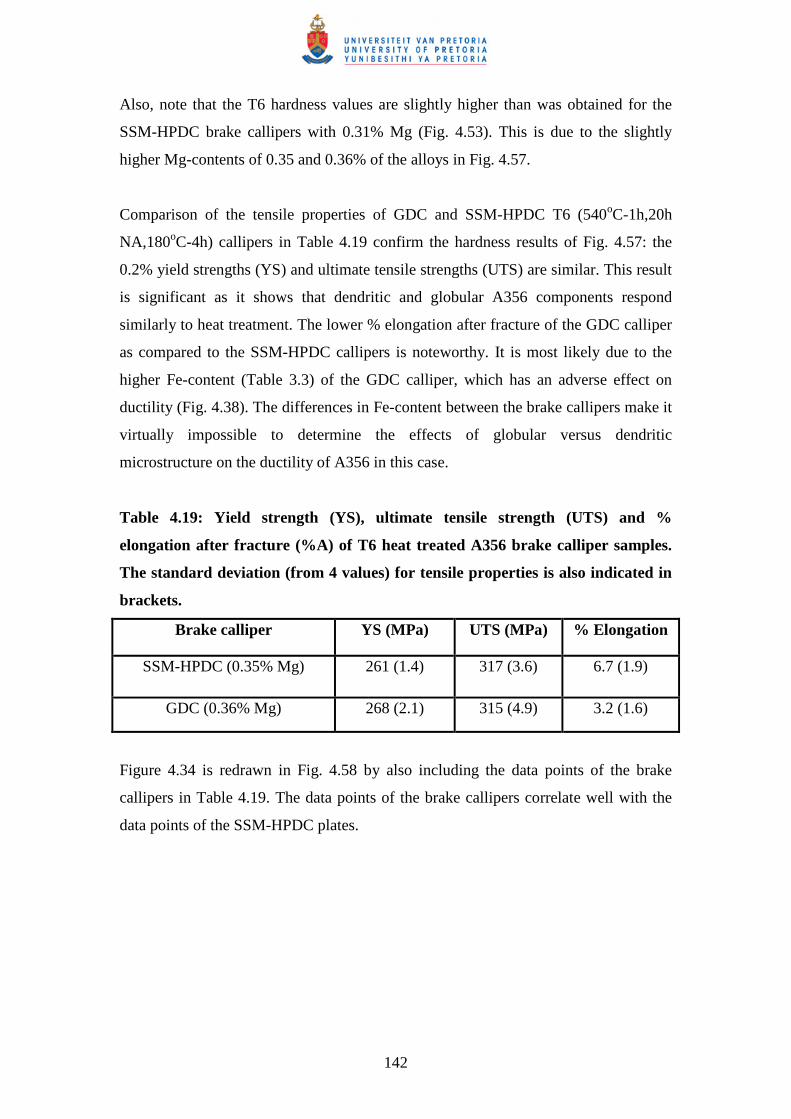
142
Also, note that the T6 hardness values are slightly higher than was obtained for the
SSM-HPDC brake callipers with 0.31% Mg (Fig. 4.53). This is due to the slightly
higher Mg-contents of 0.35 and 0.36% of the alloys in Fig. 4.57.
Comparison of the tensile properties of GDC and SSM-HPDC T6 (540oC-1h,20h
NA,180oC-4h) callipers in Table 4.19 confirm the hardness results of Fig. 4.57: the
0.2% yield strengths (YS) and ultimate tensile strengths (UTS) are similar. This result
is significant as it shows that dendritic and globular A356 components respond
similarly to heat treatment. The lower % elongation after fracture of the GDC calliper
as compared to the SSM-HPDC callipers is noteworthy. It is most likely due to the
higher Fe-content (Table 3.3) of the GDC calliper, which has an adverse effect on
ductility (Fig. 4.38). The differences in Fe-content between the brake callipers make it
virtually impossible to determine the effects of globular versus dendritic
microstructure on the ductility of A356 in this case.
Table 4.19: Yield strength (YS), ultimate tensile strength (UTS) and %
elongation after fracture (%A) of T6 heat treated A356 brake calliper samples.
The standard deviation (from 4 values) for tensile properties is also indicated in
brackets.
Brake calliper YS (MPa) UTS (MPa) % Elongation
SSM-HPDC (0.35% Mg) 261 (1.4) 317 (3.6) 6.7 (1.9)
GDC (0.36% Mg) 268 (2.1) 315 (4.9) 3.2 (1.6)
Figure 4.34 is redrawn in Fig. 4.58 by also including the data points of the brake
callipers in Table 4.19. The data points of the brake callipers correlate well with the
data points of the SSM-HPDC plates.
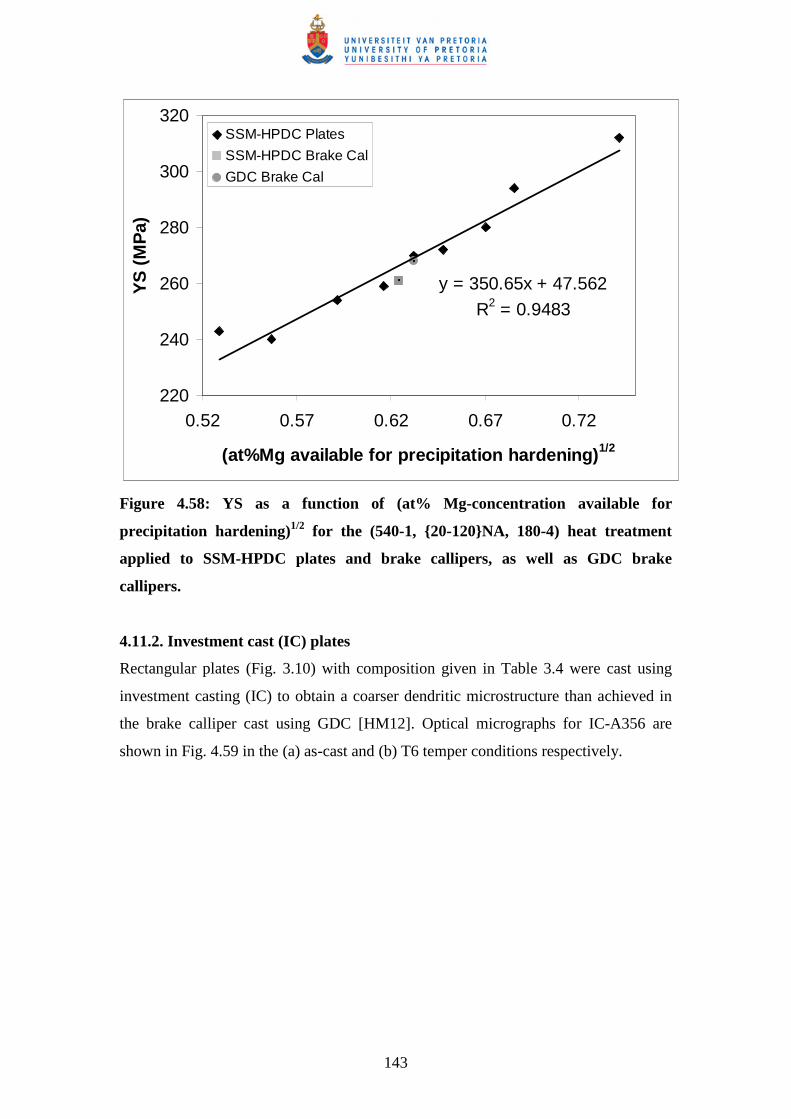
143
y = 350.65x + 47.562
R2 = 0.9483
220
240
260
280
300
320
0.52 0.57 0.62 0.67 0.72
(at%Mg available for precipitation hardening)1/2
YS
(M
Pa)
SSM-HPDC Plates
SSM-HPDC Brake Cal
GDC Brake Cal
Figure 4.58: YS as a function of (at% Mg-concentration available for
precipitation hardening)1/2 for the (540-1, {20-120}NA, 180-4) heat treatment
applied to SSM-HPDC plates and brake callipers, as well as GDC brake
callipers.
4.11.2. Investment cast (IC) plates
Rectangular plates (Fig. 3.10) with composition given in Table 3.4 were cast using
investment casting (IC) to obtain a coarser dendritic microstructure than achieved in
the brake calliper cast using GDC [HM12]. Optical micrographs for IC-A356 are
shown in Fig. 4.59 in the (a) as-cast and (b) T6 temper conditions respectively.
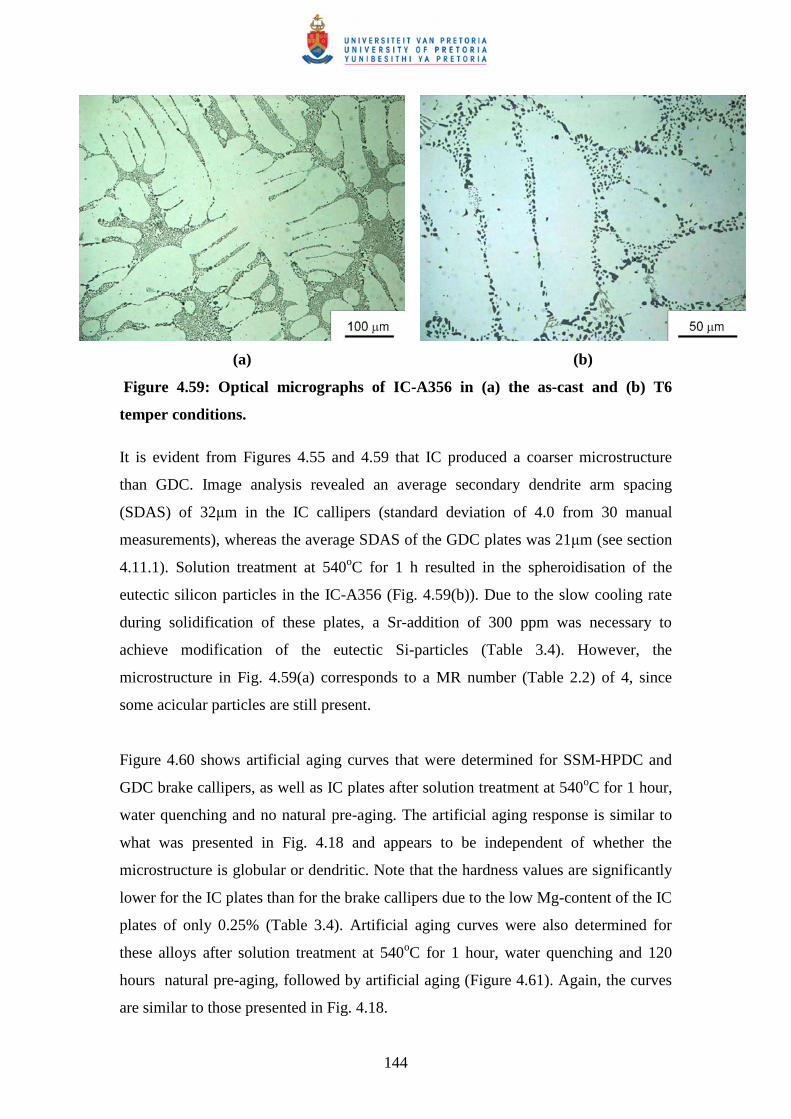
144
(a) (b)
Figure 4.59: Optical micrographs of IC-A356 in (a) the as-cast and (b) T6
temper conditions.
It is evident from Figures 4.55 and 4.59 that IC produced a coarser microstructure
than GDC. Image analysis revealed an average secondary dendrite arm spacing
(SDAS) of 32µm in the IC callipers (standard deviation of 4.0 from 30 manual
measurements), whereas the average SDAS of the GDC plates was 21µm (see section
4.11.1). Solution treatment at 540oC for 1 h resulted in the spheroidisation of the
eutectic silicon particles in the IC-A356 (Fig. 4.59(b)). Due to the slow cooling rate
during solidification of these plates, a Sr-addition of 300 ppm was necessary to
achieve modification of the eutectic Si-particles (Table 3.4). However, the
microstructure in Fig. 4.59(a) corresponds to a MR number (Table 2.2) of 4, since
some acicular particles are still present.
Figure 4.60 shows artificial aging curves that were determined for SSM-HPDC and
GDC brake callipers, as well as IC plates after solution treatment at 540oC for 1 hour,
water quenching and no natural pre-aging. The artificial aging response is similar to
what was presented in Fig. 4.18 and appears to be independent of whether the
microstructure is globular or dendritic. Note that the hardness values are significantly
lower for the IC plates than for the brake callipers due to the low Mg-content of the IC
plates of only 0.25% (Table 3.4). Artificial aging curves were also determined for
these alloys after solution treatment at 540oC for 1 hour, water quenching and 120
hours natural pre-aging, followed by artificial aging (Figure 4.61). Again, the curves
are similar to those presented in Fig. 4.18.
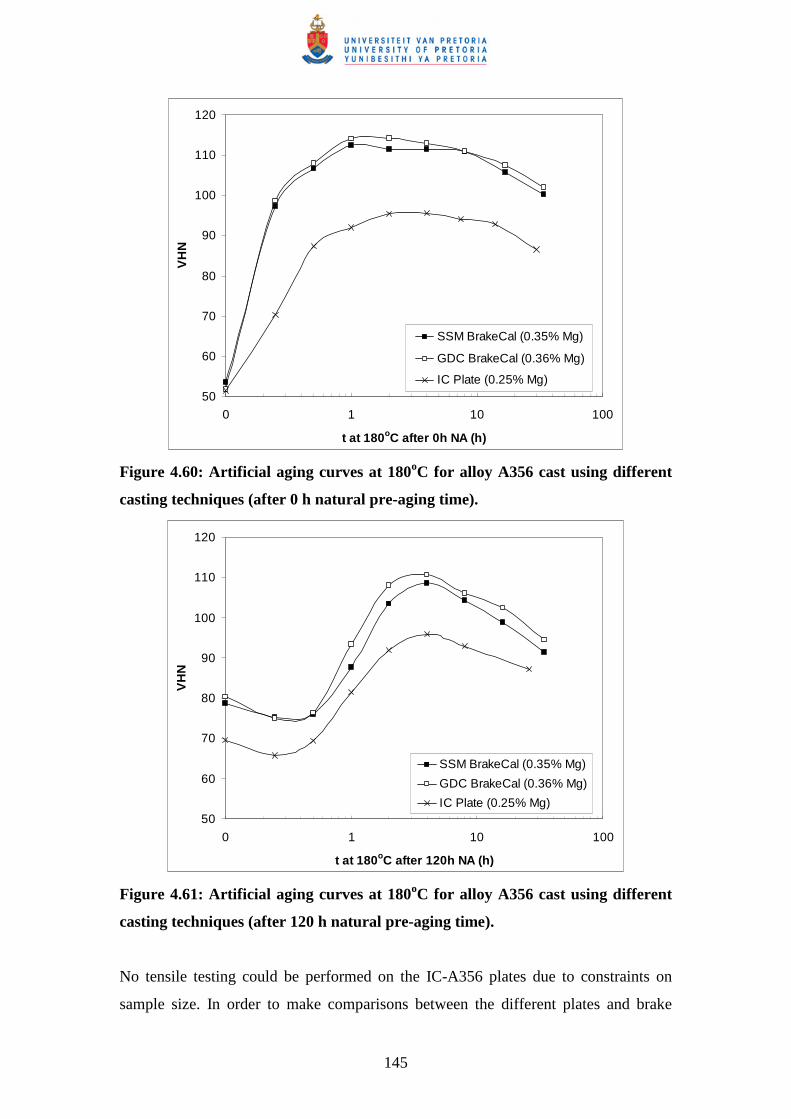
145
50
60
70
80
90
100
110
120
0 1 10 100
t at 180oC after 0h NA (h)
VH
N
SSM BrakeCal (0.35% Mg)
GDC BrakeCal (0.36% Mg)
IC Plate (0.25% Mg)
Figure 4.60: Artificial aging curves at 180oC for alloy A356 cast using different
casting techniques (after 0 h natural pre-aging time).
50
60
70
80
90
100
110
120
0 1 10 100
t at 180oC after 120h NA (h)
VH
N
SSM BrakeCal (0.35% Mg)
GDC BrakeCal (0.36% Mg)
IC Plate (0.25% Mg)
Figure 4.61: Artificial aging curves at 180oC for alloy A356 cast using different
casting techniques (after 120 h natural pre-aging time).
No tensile testing could be performed on the IC-A356 plates due to constraints on
sample size. In order to make comparisons between the different plates and brake
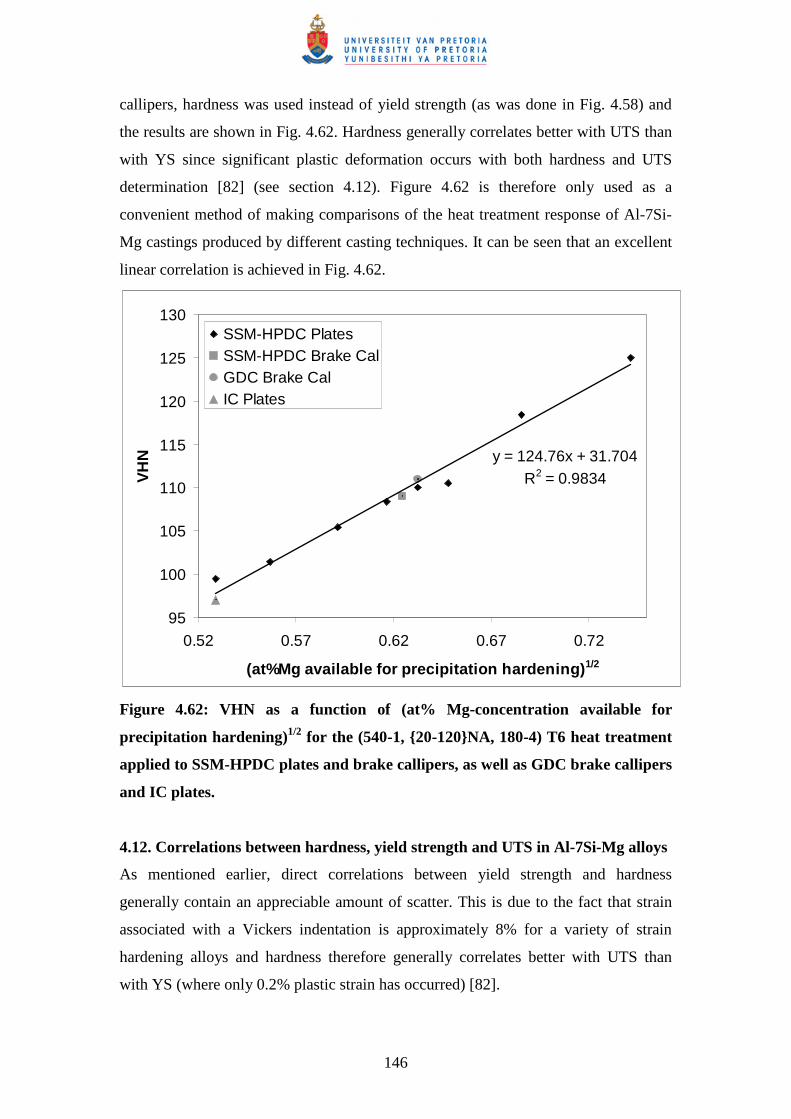
146
callipers, hardness was used instead of yield strength (as was done in Fig. 4.58) and
the results are shown in Fig. 4.62. Hardness generally correlates better with UTS than
with YS since significant plastic deformation occurs with both hardness and UTS
determination [82] (see section 4.12). Figure 4.62 is therefore only used as a
convenient method of making comparisons of the heat treatment response of Al-7Si-
Mg castings produced by different casting techniques. It can be seen that an excellent
linear correlation is achieved in Fig. 4.62.
y = 124.76x + 31.704R2 = 0.9834
95
100
105
110
115
120
125
130
0.52 0.57 0.62 0.67 0.72
(at%Mg available for precipitation hardening)1/2
VH
N
SSM-HPDC PlatesSSM-HPDC Brake CalGDC Brake CalIC Plates
Figure 4.62: VHN as a function of (at% Mg-concentration available for
precipitation hardening)1/2 for the (540-1, {20-120}NA, 180-4) T6 heat treatment
applied to SSM-HPDC plates and brake callipers, as well as GDC brake callipers
and IC plates.
4.12. Correlations between hardness, yield strength and UTS in Al-7Si-Mg alloys
As mentioned earlier, direct correlations between yield strength and hardness
generally contain an appreciable amount of scatter. This is due to the fact that strain
associated with a Vickers indentation is approximately 8% for a variety of strain
hardening alloys and hardness therefore generally correlates better with UTS than
with YS (where only 0.2% plastic strain has occurred) [82].
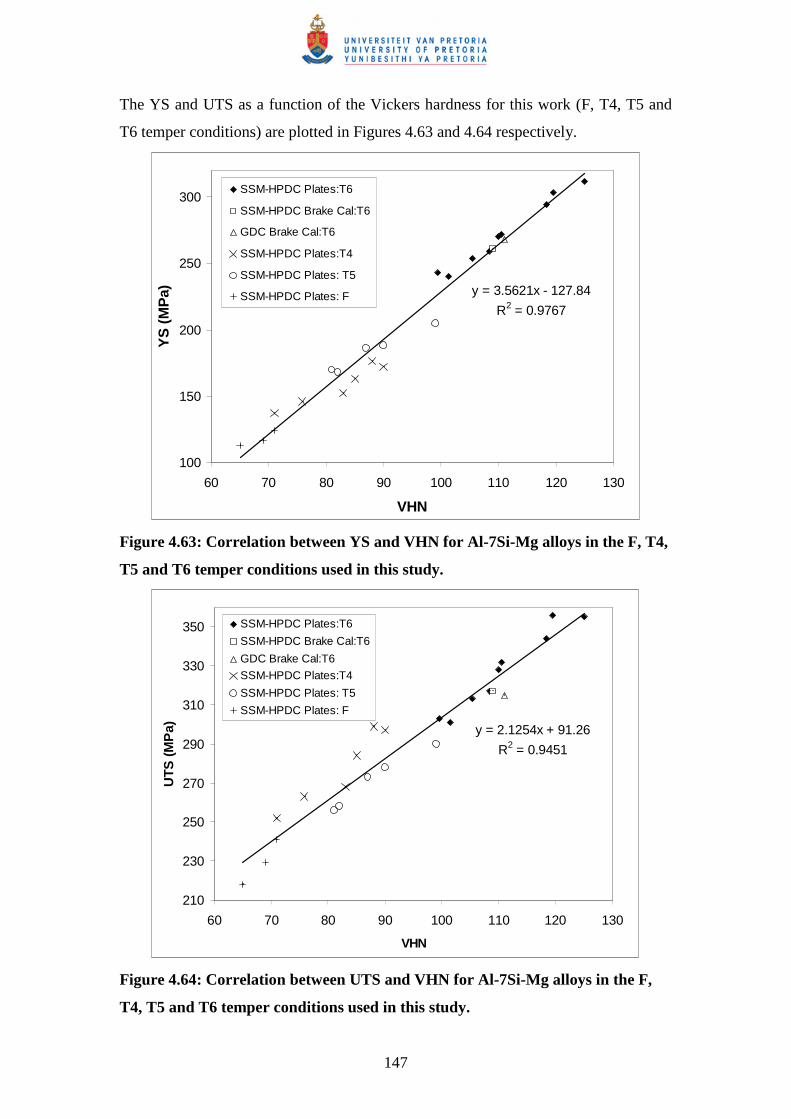
147
The YS and UTS as a function of the Vickers hardness for this work (F, T4, T5 and
T6 temper conditions) are plotted in Figures 4.63 and 4.64 respectively.
y = 3.5621x - 127.84
R2 = 0.9767
100
150
200
250
300
60 70 80 90 100 110 120 130
VHN
YS
(M
Pa)
SSM-HPDC Plates:T6
SSM-HPDC Brake Cal:T6
GDC Brake Cal:T6
SSM-HPDC Plates:T4
SSM-HPDC Plates: T5
SSM-HPDC Plates: F
Figure 4.63: Correlation between YS and VHN for Al-7Si-Mg alloys in the F, T4,
T5 and T6 temper conditions used in this study.
y = 2.1254x + 91.26
R2 = 0.9451
210
230
250
270
290
310
330
350
60 70 80 90 100 110 120 130
VHN
UTS
(MP
a)
SSM-HPDC Plates:T6
SSM-HPDC Brake Cal:T6
GDC Brake Cal:T6
SSM-HPDC Plates:T4
SSM-HPDC Plates: T5
SSM-HPDC Plates: F
Figure 4.64: Correlation between UTS and VHN for Al-7Si-Mg alloys in the F,
T4, T5 and T6 temper conditions used in this study.
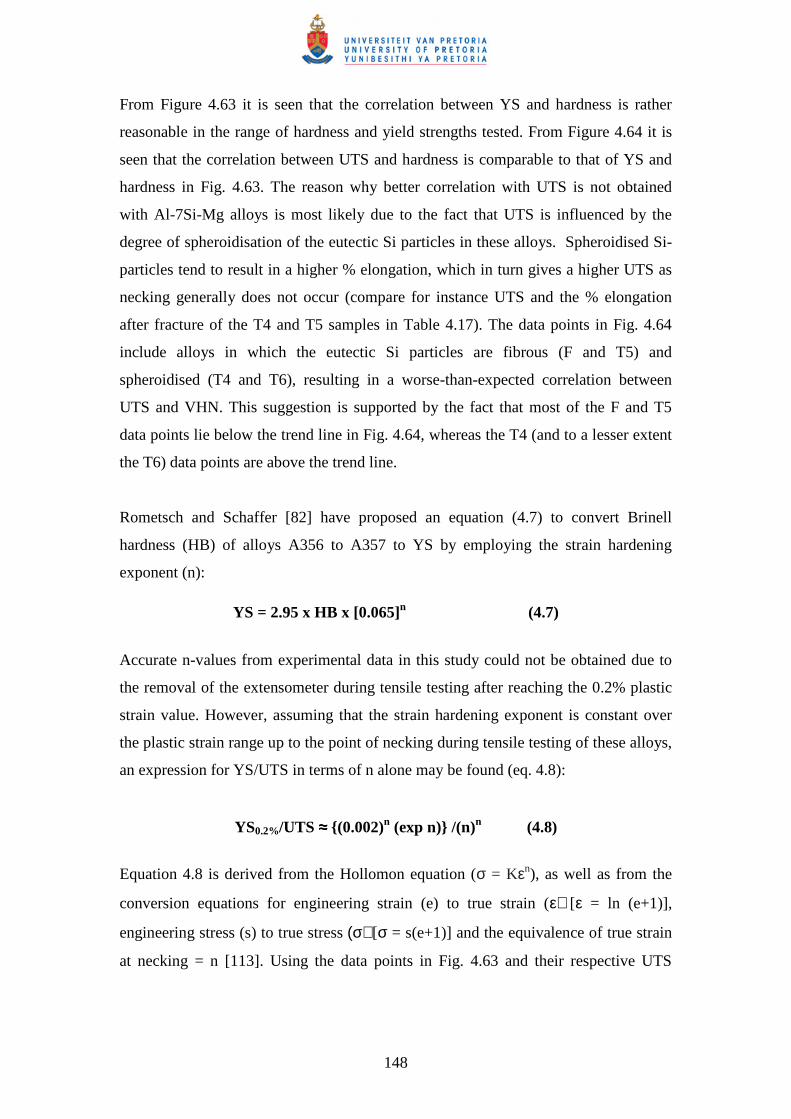
148
From Figure 4.63 it is seen that the correlation between YS and hardness is rather
reasonable in the range of hardness and yield strengths tested. From Figure 4.64 it is
seen that the correlation between UTS and hardness is comparable to that of YS and
hardness in Fig. 4.63. The reason why better correlation with UTS is not obtained
with Al-7Si-Mg alloys is most likely due to the fact that UTS is influenced by the
degree of spheroidisation of the eutectic Si particles in these alloys. Spheroidised Si-
particles tend to result in a higher % elongation, which in turn gives a higher UTS as
necking generally does not occur (compare for instance UTS and the % elongation
after fracture of the T4 and T5 samples in Table 4.17). The data points in Fig. 4.64
include alloys in which the eutectic Si particles are fibrous (F and T5) and
spheroidised (T4 and T6), resulting in a worse-than-expected correlation between
UTS and VHN. This suggestion is supported by the fact that most of the F and T5
data points lie below the trend line in Fig. 4.64, whereas the T4 (and to a lesser extent
the T6) data points are above the trend line.
Rometsch and Schaffer [82] have proposed an equation (4.7) to convert Brinell
hardness (HB) of alloys A356 to A357 to YS by employing the strain hardening
exponent (n):
YS = 2.95 x HB x [0.065]n (4.7)
Accurate n-values from experimental data in this study could not be obtained due to
the removal of the extensometer during tensile testing after reaching the 0.2% plastic
strain value. However, assuming that the strain hardening exponent is constant over
the plastic strain range up to the point of necking during tensile testing of these alloys,
an expression for YS/UTS in terms of n alone may be found (eq. 4.8):
YS0.2%/UTS ≈≈≈≈ {(0.002)n (exp n)} /(n)n (4.8)
Equation 4.8 is derived from the Hollomon equation (σ = Kεn), as well as from the
conversion equations for engineering strain (e) to true strain (ε) [ε = ln (e+1)],
engineering stress (s) to true stress (σ) [σ = s(e+1)] and the equivalence of true strain
at necking = n [113]. Using the data points in Fig. 4.63 and their respective UTS
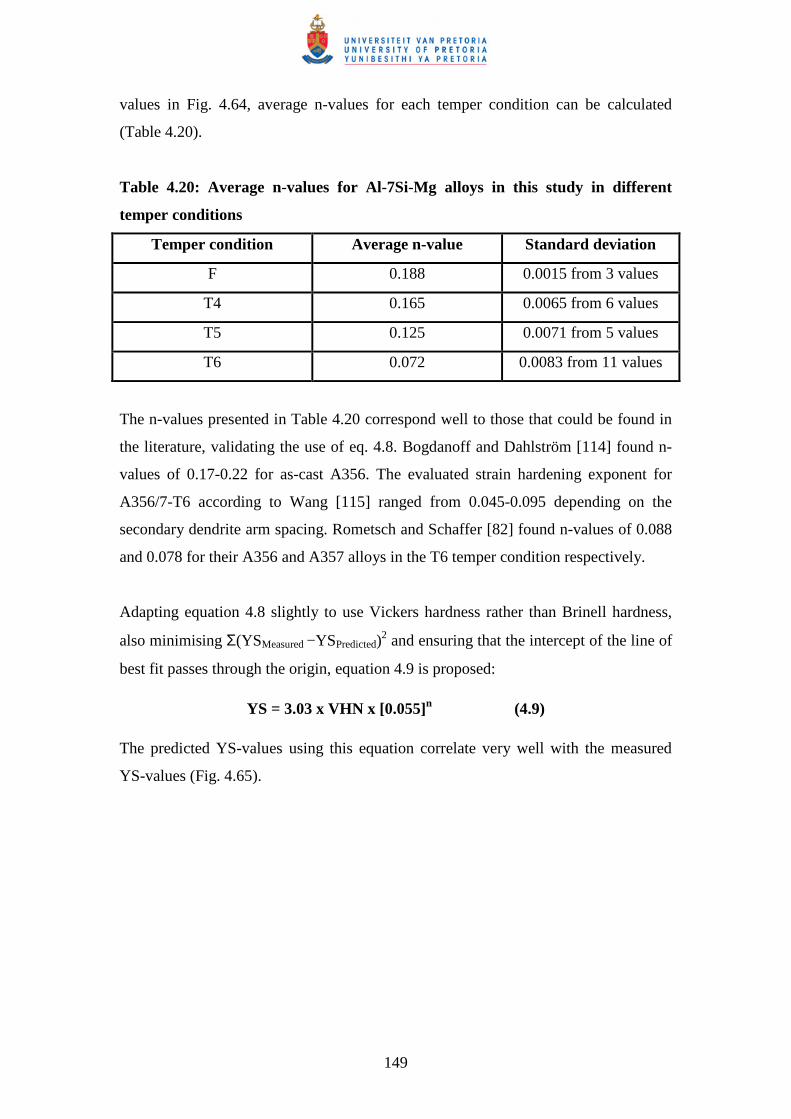
149
values in Fig. 4.64, average n-values for each temper condition can be calculated
(Table 4.20).
Table 4.20: Average n-values for Al-7Si-Mg alloys in this study in different
temper conditions
Temper condition Average n-value Standard deviation
F 0.188 0.0015 from 3 values
T4 0.165 0.0065 from 6 values
T5 0.125 0.0071 from 5 values
T6 0.072 0.0083 from 11 values
The n-values presented in Table 4.20 correspond well to those that could be found in
the literature, validating the use of eq. 4.8. Bogdanoff and Dahlström [114] found n-
values of 0.17-0.22 for as-cast A356. The evaluated strain hardening exponent for
A356/7-T6 according to Wang [115] ranged from 0.045-0.095 depending on the
secondary dendrite arm spacing. Rometsch and Schaffer [82] found n-values of 0.088
and 0.078 for their A356 and A357 alloys in the T6 temper condition respectively.
Adapting equation 4.8 slightly to use Vickers hardness rather than Brinell hardness,
also minimising Σ(YSMeasured −YSPredicted)2 and ensuring that the intercept of the line of
best fit passes through the origin, equation 4.9 is proposed:
YS = 3.03 x VHN x [0.055]n (4.9)
The predicted YS-values using this equation correlate very well with the measured
YS-values (Fig. 4.65).
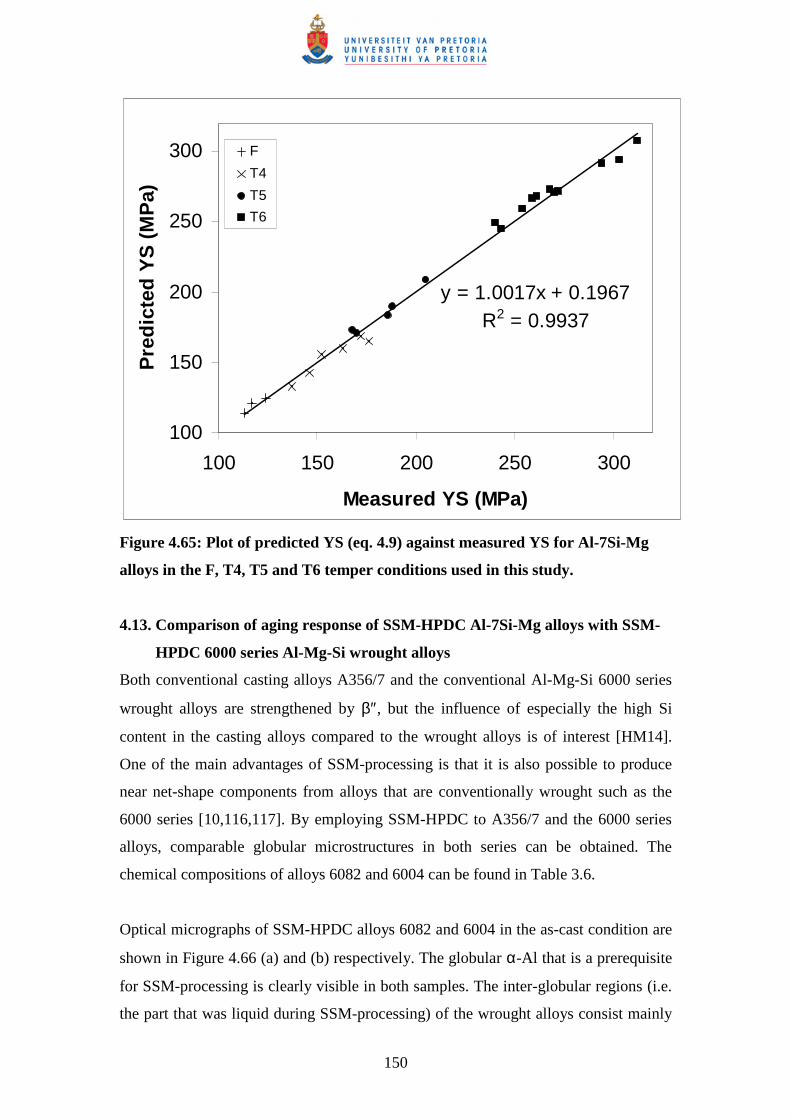
150
y = 1.0017x + 0.1967R2 = 0.9937
100
150
200
250
300
100 150 200 250 300
Measured YS (MPa)
Pre
dic
ted
YS
(M
Pa)
F
T4
T5
T6
Figure 4.65: Plot of predicted YS (eq. 4.9) against measured YS for Al-7Si-Mg
alloys in the F, T4, T5 and T6 temper conditions used in this study.
4.13. Comparison of aging response of SSM-HPDC Al-7Si-Mg alloys with SSM-
HPDC 6000 series Al-Mg-Si wrought alloys
Both conventional casting alloys A356/7 and the conventional Al-Mg-Si 6000 series
wrought alloys are strengthened by β″, but the influence of especially the high Si
content in the casting alloys compared to the wrought alloys is of interest [HM14].
One of the main advantages of SSM-processing is that it is also possible to produce
near net-shape components from alloys that are conventionally wrought such as the
6000 series [10,116,117]. By employing SSM-HPDC to A356/7 and the 6000 series
alloys, comparable globular microstructures in both series can be obtained. The
chemical compositions of alloys 6082 and 6004 can be found in Table 3.6.
Optical micrographs of SSM-HPDC alloys 6082 and 6004 in the as-cast condition are
shown in Figure 4.66 (a) and (b) respectively. The globular α-Al that is a prerequisite
for SSM-processing is clearly visible in both samples. The inter-globular regions (i.e.
the part that was liquid during SSM-processing) of the wrought alloys consist mainly
151
of fine α-Al (Fig. 4.67), in contrast to the inter-globular regions of the casting alloys
which consist mainly of eutectic (α-Al and Si) (Fig. 4.10) due to the high Si content
of ~ 7%.
(a) (b)
Figure 4.66: Optical micrographs of SSM-HPDC alloys in the as-cast condition
for (a) 6082 and (b) 6004.
Figure 4.67: High magnification optical micrograph of SSM-HPDC alloy 6004 in
the as-cast condition showing the inter-globular regions.
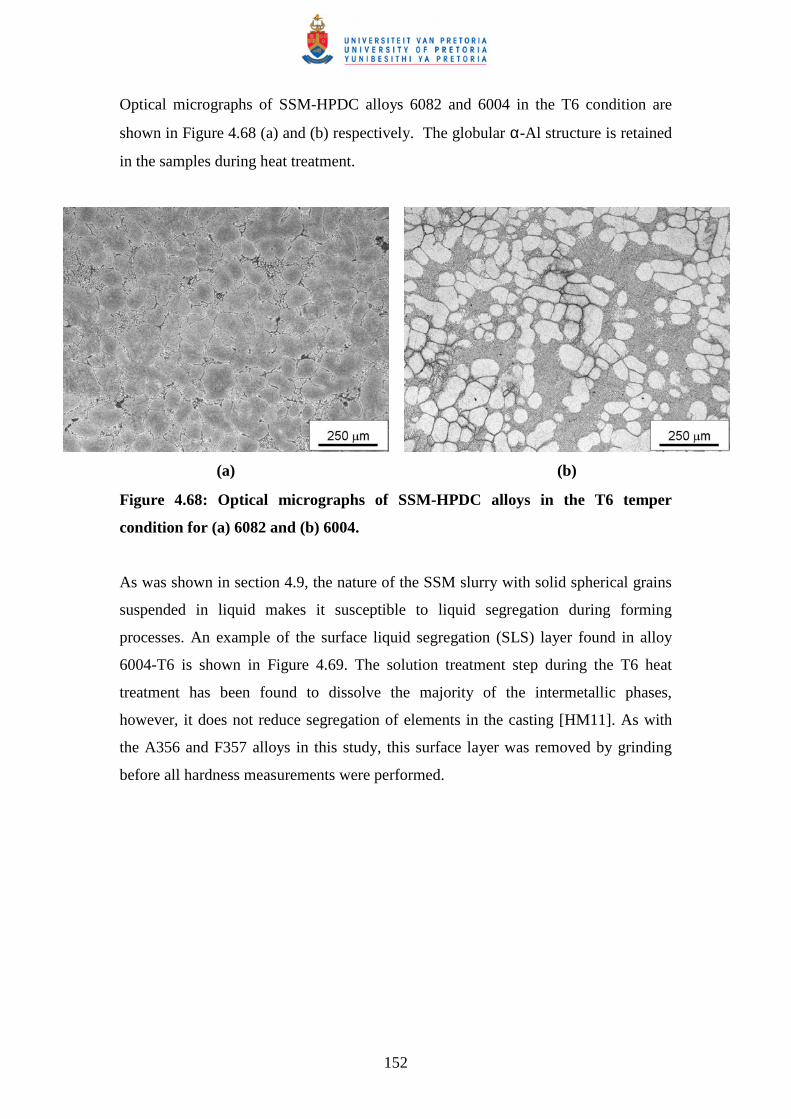
152
Optical micrographs of SSM-HPDC alloys 6082 and 6004 in the T6 condition are
shown in Figure 4.68 (a) and (b) respectively. The globular α-Al structure is retained
in the samples during heat treatment.
(a) (b)
Figure 4.68: Optical micrographs of SSM-HPDC alloys in the T6 temper
condition for (a) 6082 and (b) 6004.
As was shown in section 4.9, the nature of the SSM slurry with solid spherical grains
suspended in liquid makes it susceptible to liquid segregation during forming
processes. An example of the surface liquid segregation (SLS) layer found in alloy
6004-T6 is shown in Figure 4.69. The solution treatment step during the T6 heat
treatment has been found to dissolve the majority of the intermetallic phases,
however, it does not reduce segregation of elements in the casting [HM11]. As with
the A356 and F357 alloys in this study, this surface layer was removed by grinding
before all hardness measurements were performed.
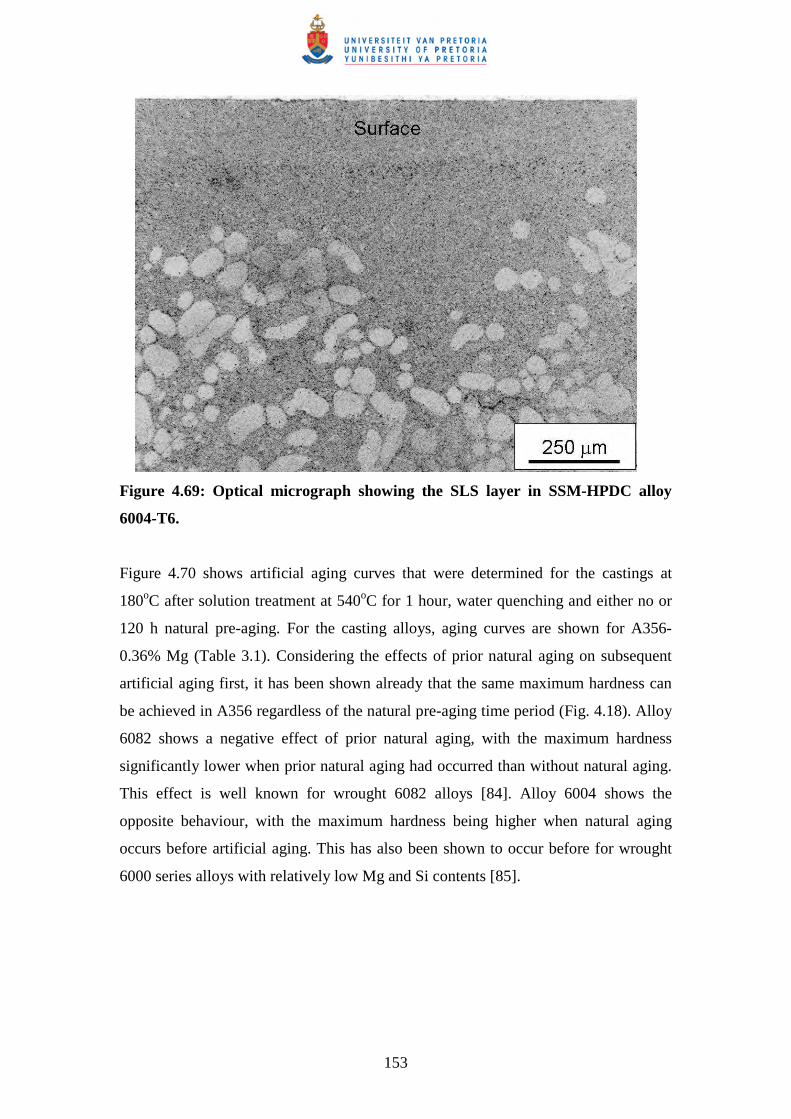
153
Figure 4.69: Optical micrograph showing the SLS layer in SSM-HPDC alloy
6004-T6.
Figure 4.70 shows artificial aging curves that were determined for the castings at
180oC after solution treatment at 540oC for 1 hour, water quenching and either no or
120 h natural pre-aging. For the casting alloys, aging curves are shown for A356-
0.36% Mg (Table 3.1). Considering the effects of prior natural aging on subsequent
artificial aging first, it has been shown already that the same maximum hardness can
be achieved in A356 regardless of the natural pre-aging time period (Fig. 4.18). Alloy
6082 shows a negative effect of prior natural aging, with the maximum hardness
significantly lower when prior natural aging had occurred than without natural aging.
This effect is well known for wrought 6082 alloys [84]. Alloy 6004 shows the
opposite behaviour, with the maximum hardness being higher when natural aging
occurs before artificial aging. This has also been shown to occur before for wrought
6000 series alloys with relatively low Mg and Si contents [85].
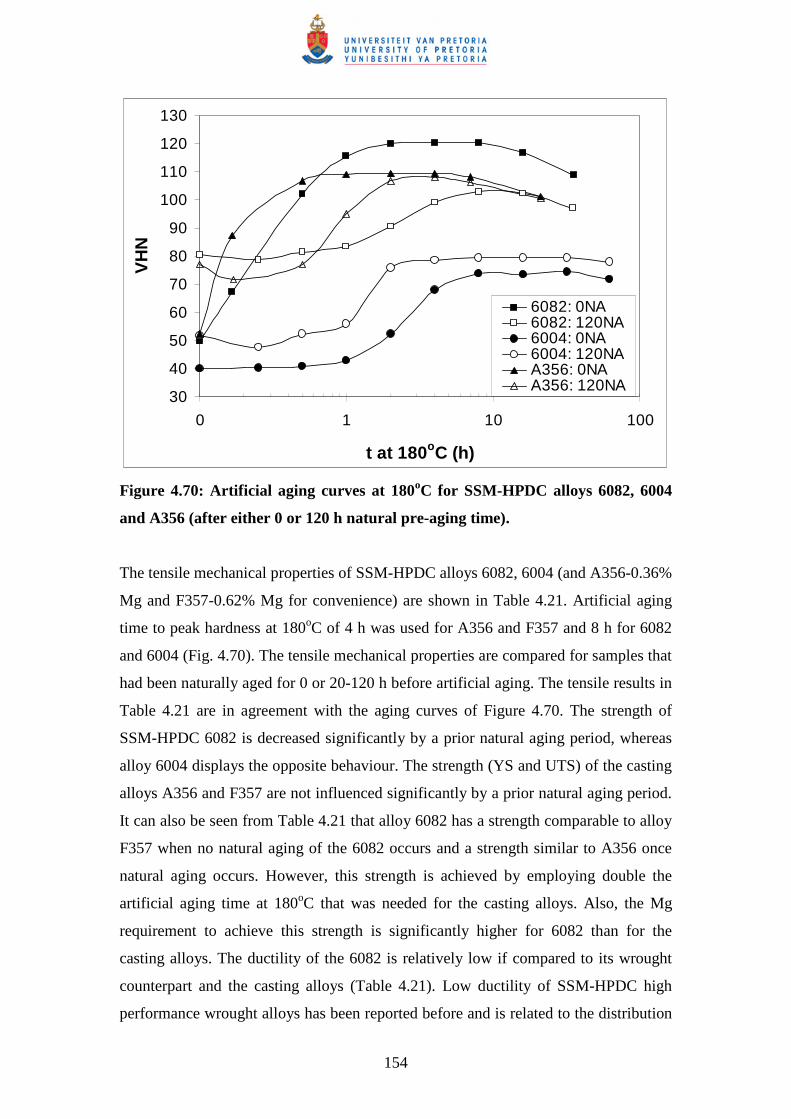
154
30
40
50
60
70
80
90
100
110
120
130
0 1 10 100
t at 180oC (h)
VH
N
6082: 0NA6082: 120NA6004: 0NA6004: 120NAA356: 0NAA356: 120NA
Figure 4.70: Artificial aging curves at 180oC for SSM-HPDC alloys 6082, 6004
and A356 (after either 0 or 120 h natural pre-aging time).
The tensile mechanical properties of SSM-HPDC alloys 6082, 6004 (and A356-0.36%
Mg and F357-0.62% Mg for convenience) are shown in Table 4.21. Artificial aging
time to peak hardness at 180oC of 4 h was used for A356 and F357 and 8 h for 6082
and 6004 (Fig. 4.70). The tensile mechanical properties are compared for samples that
had been naturally aged for 0 or 20-120 h before artificial aging. The tensile results in
Table 4.21 are in agreement with the aging curves of Figure 4.70. The strength of
SSM-HPDC 6082 is decreased significantly by a prior natural aging period, whereas
alloy 6004 displays the opposite behaviour. The strength (YS and UTS) of the casting
alloys A356 and F357 are not influenced significantly by a prior natural aging period.
It can also be seen from Table 4.21 that alloy 6082 has a strength comparable to alloy
F357 when no natural aging of the 6082 occurs and a strength similar to A356 once
natural aging occurs. However, this strength is achieved by employing double the
artificial aging time at 180oC that was needed for the casting alloys. Also, the Mg
requirement to achieve this strength is significantly higher for 6082 than for the
casting alloys. The ductility of the 6082 is relatively low if compared to its wrought
counterpart and the casting alloys (Table 4.21). Low ductility of SSM-HPDC high
performance wrought alloys has been reported before and is related to the distribution
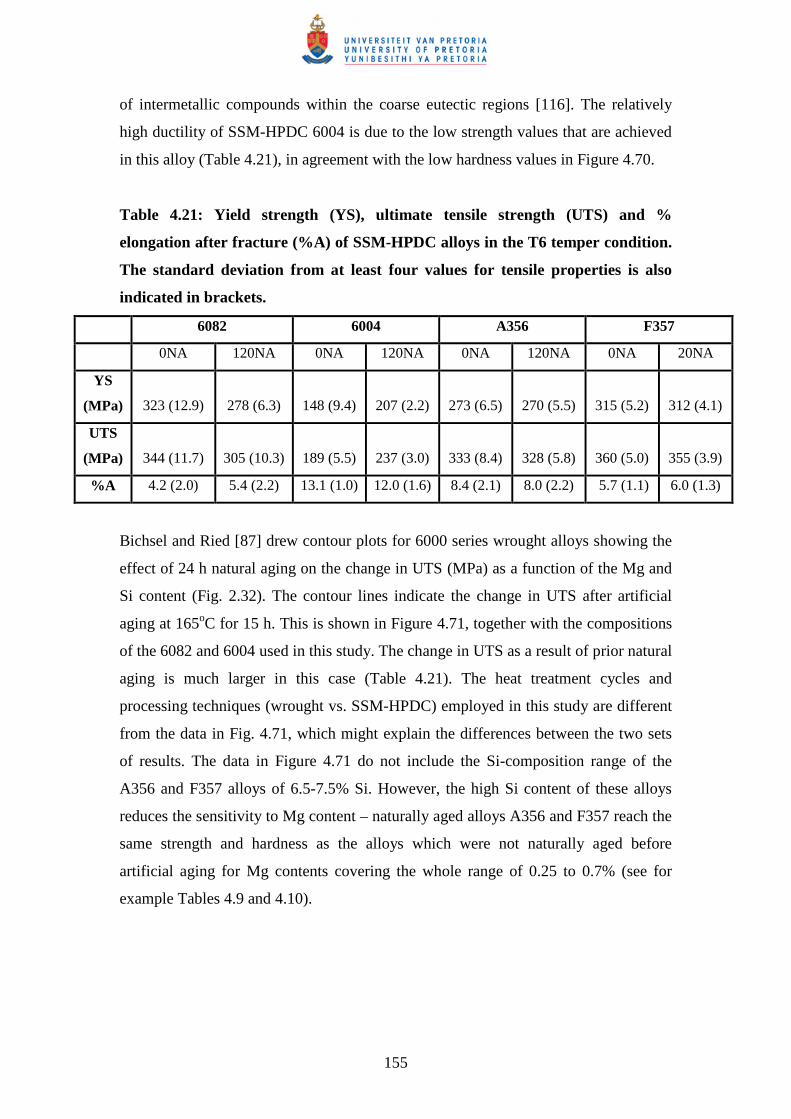
155
of intermetallic compounds within the coarse eutectic regions [116]. The relatively
high ductility of SSM-HPDC 6004 is due to the low strength values that are achieved
in this alloy (Table 4.21), in agreement with the low hardness values in Figure 4.70.
Table 4.21: Yield strength (YS), ultimate tensile strength (UTS) and %
elongation after fracture (%A) of SSM-HPDC alloys in the T6 temper condition.
The standard deviation from at least four values for tensile properties is also
indicated in brackets.
6082 6004 A356 F357
0NA 120NA 0NA 120NA 0NA 120NA 0NA 20NA
YS
(MPa) 323 (12.9) 278 (6.3) 148 (9.4) 207 (2.2) 273 (6.5) 270 (5.5) 315 (5.2) 312 (4.1)
UTS
(MPa) 344 (11.7) 305 (10.3) 189 (5.5) 237 (3.0) 333 (8.4) 328 (5.8) 360 (5.0) 355 (3.9)
%A 4.2 (2.0) 5.4 (2.2) 13.1 (1.0) 12.0 (1.6) 8.4 (2.1) 8.0 (2.2) 5.7 (1.1) 6.0 (1.3)
Bichsel and Ried [87] drew contour plots for 6000 series wrought alloys showing the
effect of 24 h natural aging on the change in UTS (MPa) as a function of the Mg and
Si content (Fig. 2.32). The contour lines indicate the change in UTS after artificial
aging at 165oC for 15 h. This is shown in Figure 4.71, together with the compositions
of the 6082 and 6004 used in this study. The change in UTS as a result of prior natural
aging is much larger in this case (Table 4.21). The heat treatment cycles and
processing techniques (wrought vs. SSM-HPDC) employed in this study are different
from the data in Fig. 4.71, which might explain the differences between the two sets
of results. The data in Figure 4.71 do not include the Si-composition range of the
A356 and F357 alloys of 6.5-7.5% Si. However, the high Si content of these alloys
reduces the sensitivity to Mg content – naturally aged alloys A356 and F357 reach the
same strength and hardness as the alloys which were not naturally aged before
artificial aging for Mg contents covering the whole range of 0.25 to 0.7% (see for
example Tables 4.9 and 4.10).
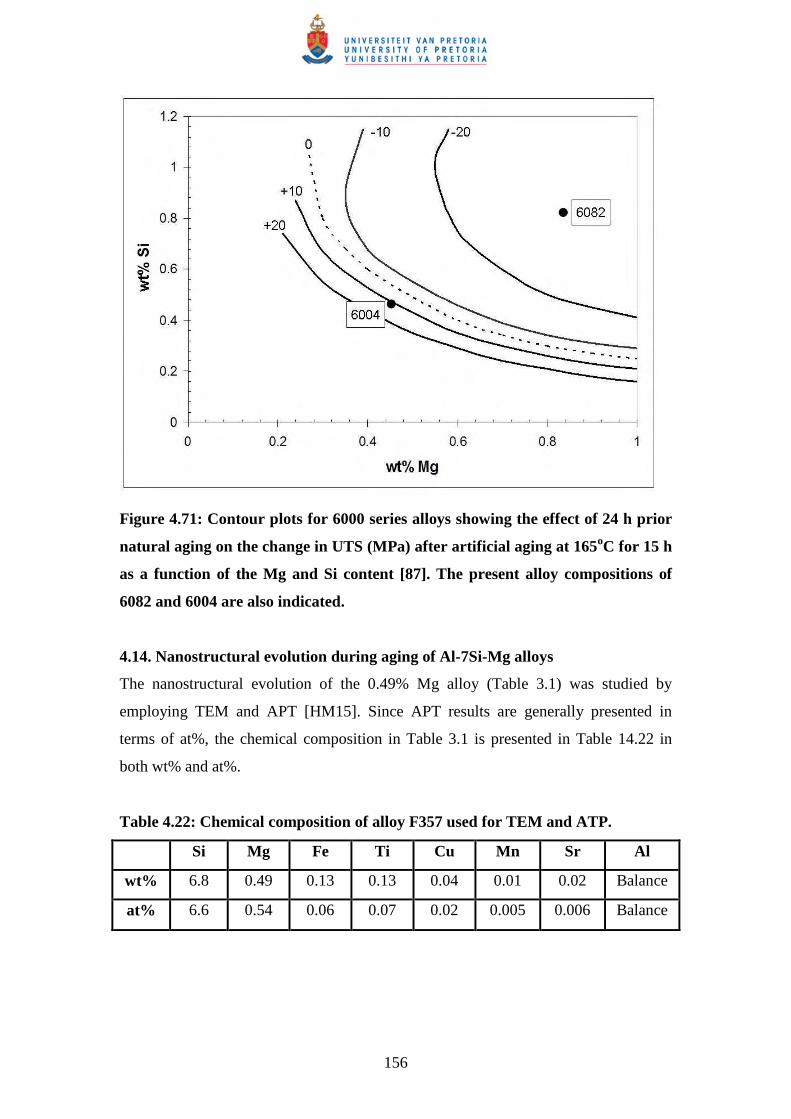
156
Figure 4.71: Contour plots for 6000 series alloys showing the effect of 24 h prior
natural aging on the change in UTS (MPa) after artificial aging at 165oC for 15 h
as a function of the Mg and Si content [87]. The present alloy compositions of
6082 and 6004 are also indicated.
4.14. Nanostructural evolution during aging of Al-7Si-Mg alloys
The nanostructural evolution of the 0.49% Mg alloy (Table 3.1) was studied by
employing TEM and APT [HM15]. Since APT results are generally presented in
terms of at%, the chemical composition in Table 3.1 is presented in Table 14.22 in
both wt% and at%.
Table 4.22: Chemical composition of alloy F357 used for TEM and ATP.
Si Mg Fe Ti Cu Mn Sr Al
wt% 6.8 0.49 0.13 0.13 0.04 0.01 0.02 Balance
at% 6.6 0.54 0.06 0.07 0.02 0.005 0.006 Balance
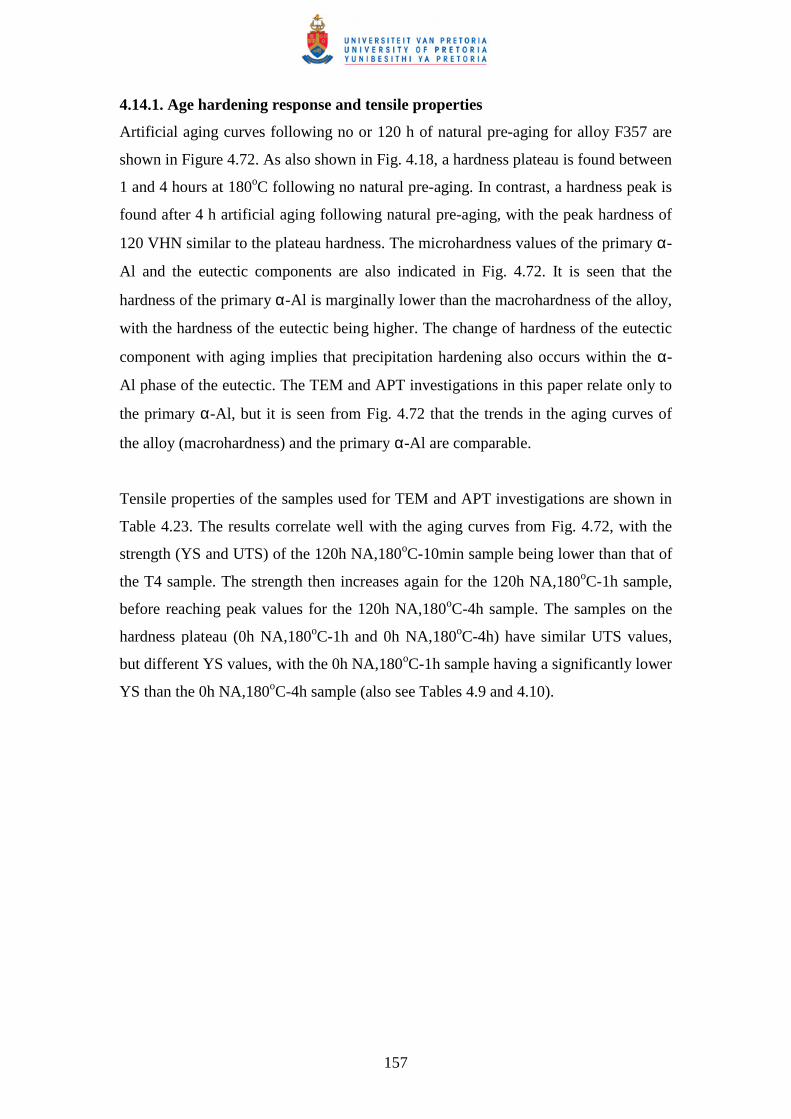
157
4.14.1. Age hardening response and tensile properties
Artificial aging curves following no or 120 h of natural pre-aging for alloy F357 are
shown in Figure 4.72. As also shown in Fig. 4.18, a hardness plateau is found between
1 and 4 hours at 180oC following no natural pre-aging. In contrast, a hardness peak is
found after 4 h artificial aging following natural pre-aging, with the peak hardness of
120 VHN similar to the plateau hardness. The microhardness values of the primary α-
Al and the eutectic components are also indicated in Fig. 4.72. It is seen that the
hardness of the primary α-Al is marginally lower than the macrohardness of the alloy,
with the hardness of the eutectic being higher. The change of hardness of the eutectic
component with aging implies that precipitation hardening also occurs within the α-
Al phase of the eutectic. The TEM and APT investigations in this paper relate only to
the primary α-Al, but it is seen from Fig. 4.72 that the trends in the aging curves of
the alloy (macrohardness) and the primary α-Al are comparable.
Tensile properties of the samples used for TEM and APT investigations are shown in
Table 4.23. The results correlate well with the aging curves from Fig. 4.72, with the
strength (YS and UTS) of the 120h NA,180oC-10min sample being lower than that of
the T4 sample. The strength then increases again for the 120h NA,180oC-1h sample,
before reaching peak values for the 120h NA,180oC-4h sample. The samples on the
hardness plateau (0h NA,180oC-1h and 0h NA,180oC-4h) have similar UTS values,
but different YS values, with the 0h NA,180oC-1h sample having a significantly lower
YS than the 0h NA,180oC-4h sample (also see Tables 4.9 and 4.10).
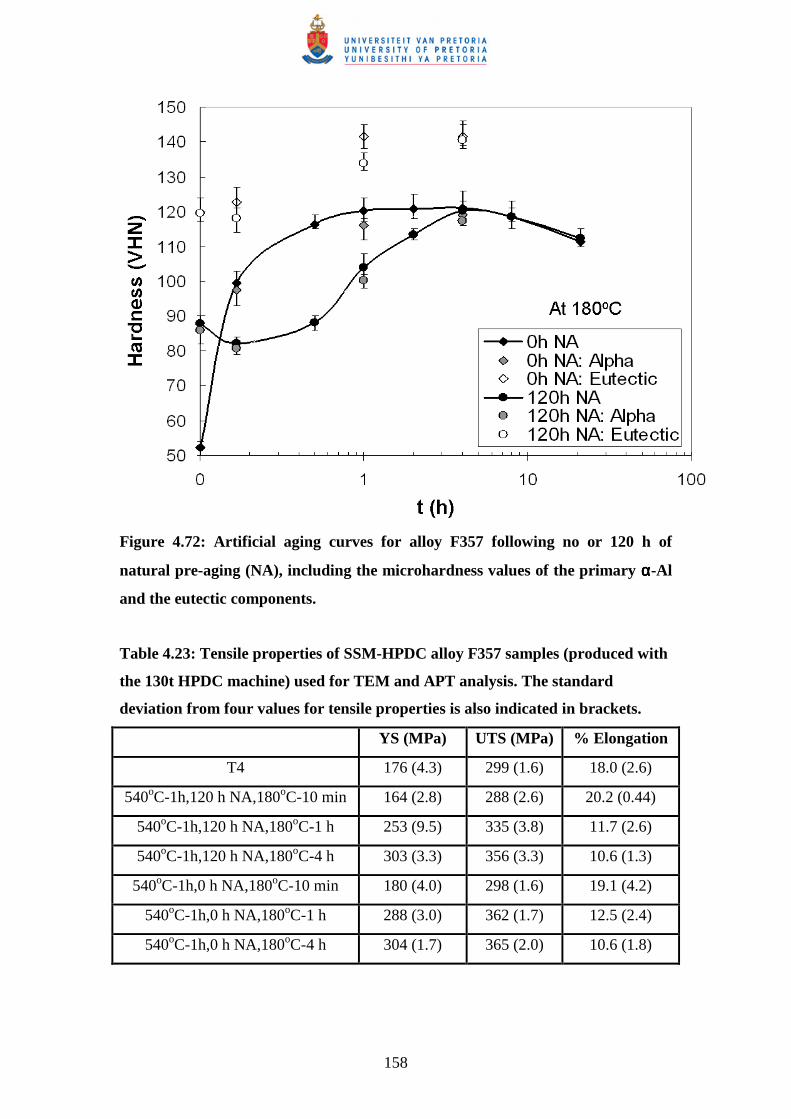
158
Figure 4.72: Artificial aging curves for alloy F357 following no or 120 h of
natural pre-aging (NA), including the microhardness values of the primary αααα-Al
and the eutectic components.
Table 4.23: Tensile properties of SSM-HPDC alloy F357 samples (produced with
the 130t HPDC machine) used for TEM and APT analysis. The standard
deviation from four values for tensile properties is also indicated in brackets.
YS (MPa) UTS (MPa) % Elongation
T4 176 (4.3) 299 (1.6) 18.0 (2.6)
540oC-1h,120 h NA,180oC-10 min 164 (2.8) 288 (2.6) 20.2 (0.44)
540oC-1h,120 h NA,180oC-1 h 253 (9.5) 335 (3.8) 11.7 (2.6)
540oC-1h,120 h NA,180oC-4 h 303 (3.3) 356 (3.3) 10.6 (1.3)
540oC-1h,0 h NA,180oC-10 min 180 (4.0) 298 (1.6) 19.1 (4.2)
540oC-1h,0 h NA,180oC-1 h 288 (3.0) 362 (1.7) 12.5 (2.4)
540oC-1h,0 h NA,180oC-4 h 304 (1.7) 365 (2.0) 10.6 (1.8)
159
4.14.2. Nanostructural evaluation
4.14.2.1. Transmission electron microscopy (TEM)
Figure 4.73 shows bright field (BF) images and selected area diffraction patterns
(SADPs) recorded with the electron beam near <001>Al for samples that experienced
120 h natural pre-aging before artificial aging at 180oC for up to 4 h, whereas Figure
4.74 shows the same for samples that experienced no natural pre-aging prior to
artificial aging at 180oC for up to 4 h. The <001>Al zone axis has been shown to be
the best orientation for visualizing the β″ phase [44,118].
There is no indication of precipitation in the bright field images and the SADPs of the
T4 sample and the 120h NA,180oC-10min sample in Figures 4.73 (a,b) respectively.
The solute clusters that are found in large numbers in Al-alloys in the T4 (Fig.
4.73(a)) and under-aged T6 conditions (Fig. 4.73(b) typically contain only a few to
tens of solute atoms [11,78,80]. They are known to be fully coherent with the matrix
and are difficult to resolve even by employing high resolution transmission electron
microscopy (HRTEM). However, dark contrast arising from GP zones (~ 2 nm
diameter) can be seen in the 0 h NA, 180oC-10min sample in Fig. 4.74(a). Faint
streaks in the <100>Al SADP of this sample, as shown in Fig. 4.74(a), indicated that
there was limited precipitation of β″ [44]. “Cross-shaped” streaks were observed in
the <100>Al SADPs of all the samples aged at 180oC for 1 or 4 h, which correspond to
weak diffractions produced by the needle β″-precipitates (Figs. 4.73(c,d) and Figs.
4.74(b,c)) [44]. The bright shadows surrounding the needles are reflections of the
coherency strains present in the adjoining Al-matrix [44]. The β″-needles increase in
size from ~ 2 nm diameter x 10 nm length in the 120h NA, 180oC-1h sample (Fig.
4.73(c)) to ~ 4 nm diameter x 25 nm length in the 120h NA, 180oC-4h sample (Fig.
4.73(d)). Similarly, the β″-needles increase in size from ~ 3 nm diameter x 20 nm
length in the 0h NA, 180oC-1h sample (Fig. 4.74(b)) to ~ 4 nm diameter x 25 nm
length in the 0h NA, 180oC-4h sample (Fig. 4.74(c)).
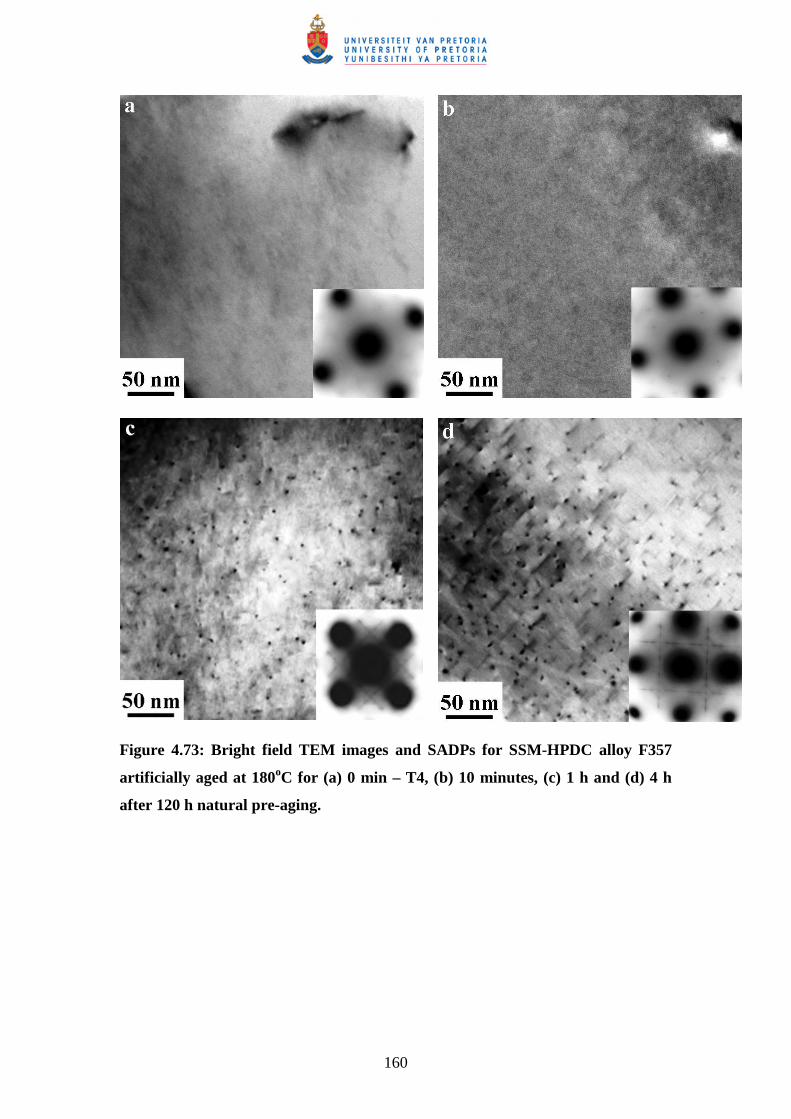
160
Figure 4.73: Bright field TEM images and SADPs for SSM-HPDC alloy F357
artificially aged at 180oC for (a) 0 min – T4, (b) 10 minutes, (c) 1 h and (d) 4 h
after 120 h natural pre-aging.
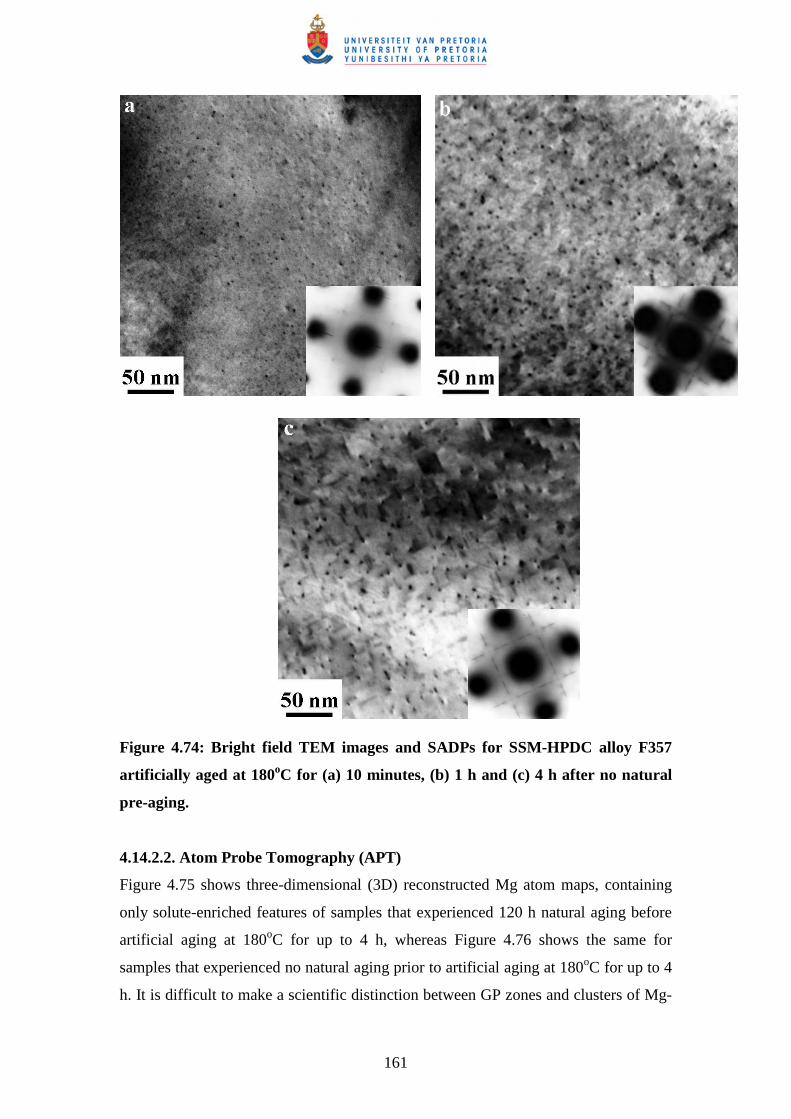
161
Figure 4.74: Bright field TEM images and SADPs for SSM-HPDC alloy F357
artificially aged at 180oC for (a) 10 minutes, (b) 1 h and (c) 4 h after no natural
pre-aging.
4.14.2.2. Atom Probe Tomography (APT)
Figure 4.75 shows three-dimensional (3D) reconstructed Mg atom maps, containing
only solute-enriched features of samples that experienced 120 h natural aging before
artificial aging at 180oC for up to 4 h, whereas Figure 4.76 shows the same for
samples that experienced no natural aging prior to artificial aging at 180oC for up to 4
h. It is difficult to make a scientific distinction between GP zones and clusters of Mg-
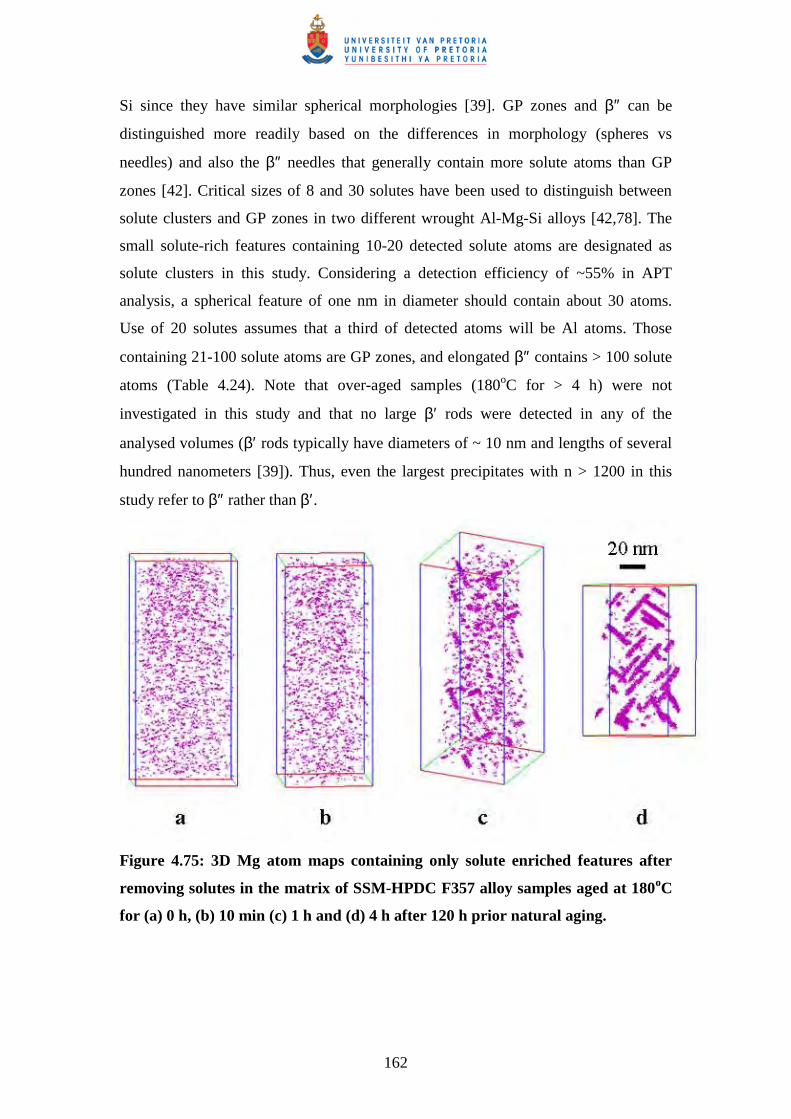
162
Si since they have similar spherical morphologies [39]. GP zones and β″ can be
distinguished more readily based on the differences in morphology (spheres vs
needles) and also the β″ needles that generally contain more solute atoms than GP
zones [42]. Critical sizes of 8 and 30 solutes have been used to distinguish between
solute clusters and GP zones in two different wrought Al-Mg-Si alloys [42,78]. The
small solute-rich features containing 10-20 detected solute atoms are designated as
solute clusters in this study. Considering a detection efficiency of ~55% in APT
analysis, a spherical feature of one nm in diameter should contain about 30 atoms.
Use of 20 solutes assumes that a third of detected atoms will be Al atoms. Those
containing 21-100 solute atoms are GP zones, and elongated β″ contains > 100 solute
atoms (Table 4.24). Note that over-aged samples (180oC for > 4 h) were not
investigated in this study and that no large β′ rods were detected in any of the
analysed volumes (β′ rods typically have diameters of ~ 10 nm and lengths of several
hundred nanometers [39]). Thus, even the largest precipitates with n > 1200 in this
study refer to β″ rather than β′.
Figure 4.75: 3D Mg atom maps containing only solute enriched features after
removing solutes in the matrix of SSM-HPDC F357 alloy samples aged at 180oC
for (a) 0 h, (b) 10 min (c) 1 h and (d) 4 h after 120 h prior natural aging.
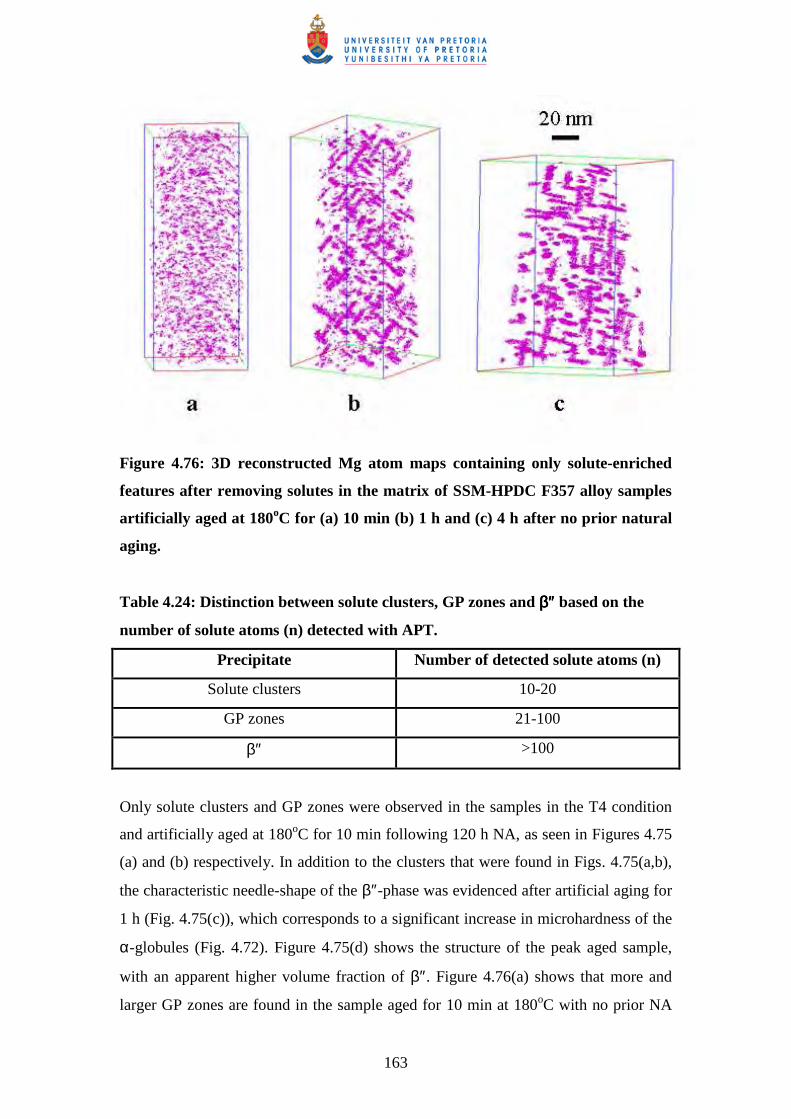
163
Figure 4.76: 3D reconstructed Mg atom maps containing only solute-enriched
features after removing solutes in the matrix of SSM-HPDC F357 alloy samples
artificially aged at 180oC for (a) 10 min (b) 1 h and (c) 4 h after no prior natural
aging.
Table 4.24: Distinction between solute clusters, GP zones and ββββ″″″″ based on the
number of solute atoms (n) detected with APT.
Precipitate Number of detected solute atoms (n)
Solute clusters 10-20
GP zones 21-100
β″ >100
Only solute clusters and GP zones were observed in the samples in the T4 condition
and artificially aged at 180oC for 10 min following 120 h NA, as seen in Figures 4.75
(a) and (b) respectively. In addition to the clusters that were found in Figs. 4.75(a,b),
the characteristic needle-shape of the β″-phase was evidenced after artificial aging for
1 h (Fig. 4.75(c)), which corresponds to a significant increase in microhardness of the
α-globules (Fig. 4.72). Figure 4.75(d) shows the structure of the peak aged sample,
with an apparent higher volume fraction of β″. Figure 4.76(a) shows that more and
larger GP zones are found in the sample aged for 10 min at 180oC with no prior NA
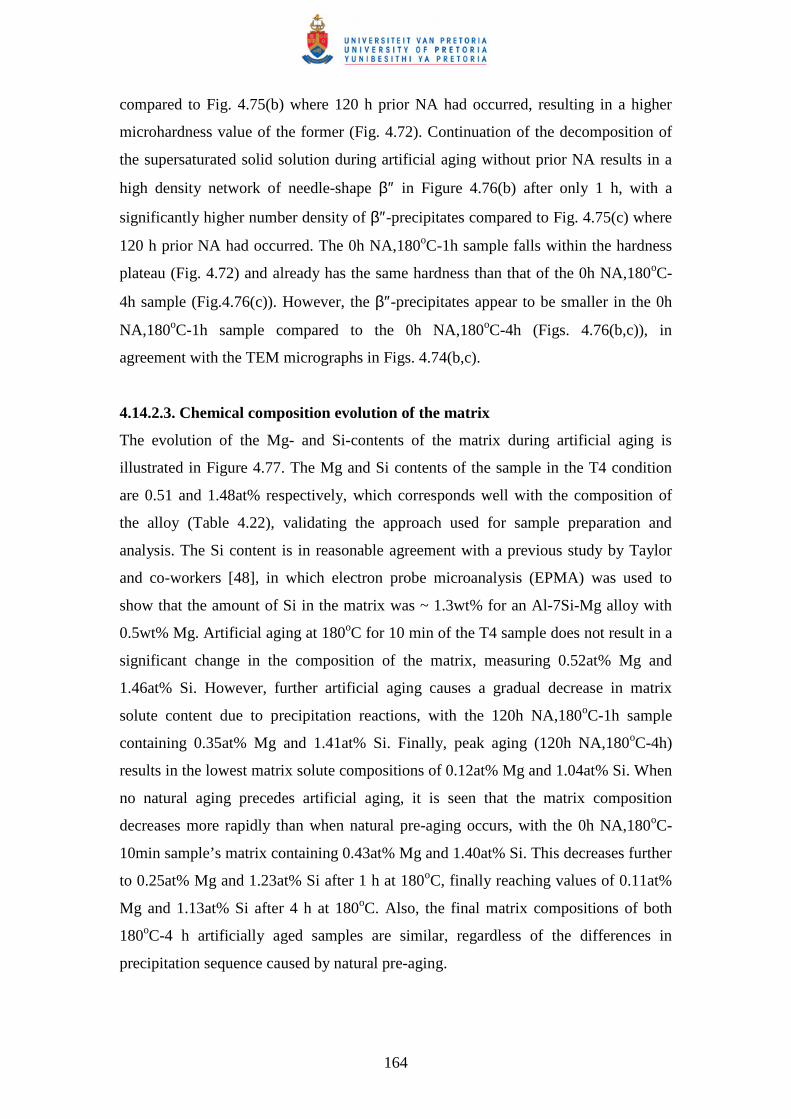
164
compared to Fig. 4.75(b) where 120 h prior NA had occurred, resulting in a higher
microhardness value of the former (Fig. 4.72). Continuation of the decomposition of
the supersaturated solid solution during artificial aging without prior NA results in a
high density network of needle-shape β″ in Figure 4.76(b) after only 1 h, with a
significantly higher number density of β″-precipitates compared to Fig. 4.75(c) where
120 h prior NA had occurred. The 0h NA,180oC-1h sample falls within the hardness
plateau (Fig. 4.72) and already has the same hardness than that of the 0h NA,180oC-
4h sample (Fig.4.76(c)). However, the β″-precipitates appear to be smaller in the 0h
NA,180oC-1h sample compared to the 0h NA,180oC-4h (Figs. 4.76(b,c)), in
agreement with the TEM micrographs in Figs. 4.74(b,c).
4.14.2.3. Chemical composition evolution of the matrix
The evolution of the Mg- and Si-contents of the matrix during artificial aging is
illustrated in Figure 4.77. The Mg and Si contents of the sample in the T4 condition
are 0.51 and 1.48at% respectively, which corresponds well with the composition of
the alloy (Table 4.22), validating the approach used for sample preparation and
analysis. The Si content is in reasonable agreement with a previous study by Taylor
and co-workers [48], in which electron probe microanalysis (EPMA) was used to
show that the amount of Si in the matrix was ~ 1.3wt% for an Al-7Si-Mg alloy with
0.5wt% Mg. Artificial aging at 180oC for 10 min of the T4 sample does not result in a
significant change in the composition of the matrix, measuring 0.52at% Mg and
1.46at% Si. However, further artificial aging causes a gradual decrease in matrix
solute content due to precipitation reactions, with the 120h NA,180oC-1h sample
containing 0.35at% Mg and 1.41at% Si. Finally, peak aging (120h NA,180oC-4h)
results in the lowest matrix solute compositions of 0.12at% Mg and 1.04at% Si. When
no natural aging precedes artificial aging, it is seen that the matrix composition
decreases more rapidly than when natural pre-aging occurs, with the 0h NA,180oC-
10min sample’s matrix containing 0.43at% Mg and 1.40at% Si. This decreases further
to 0.25at% Mg and 1.23at% Si after 1 h at 180oC, finally reaching values of 0.11at%
Mg and 1.13at% Si after 4 h at 180oC. Also, the final matrix compositions of both
180oC-4 h artificially aged samples are similar, regardless of the differences in
precipitation sequence caused by natural pre-aging.
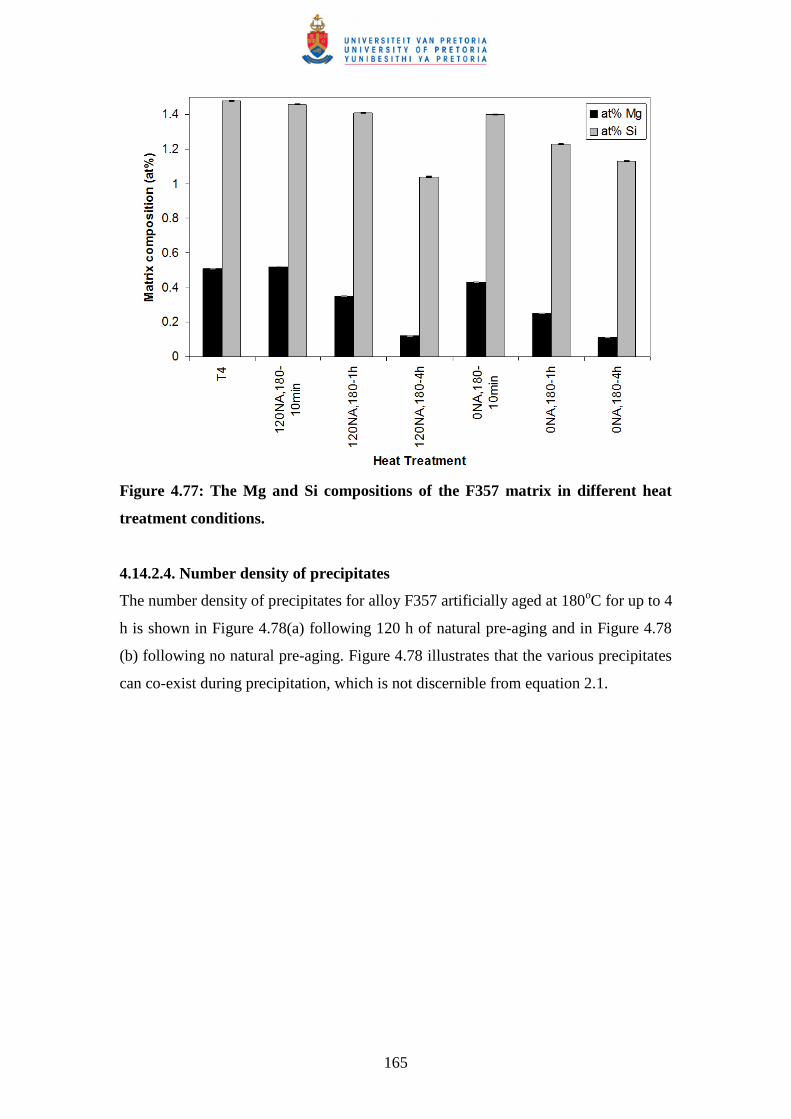
165
Figure 4.77: The Mg and Si compositions of the F357 matrix in different heat
treatment conditions.
4.14.2.4. Number density of precipitates
The number density of precipitates for alloy F357 artificially aged at 180oC for up to 4
h is shown in Figure 4.78(a) following 120 h of natural pre-aging and in Figure 4.78
(b) following no natural pre-aging. Figure 4.78 illustrates that the various precipitates
can co-exist during precipitation, which is not discernible from equation 2.1.
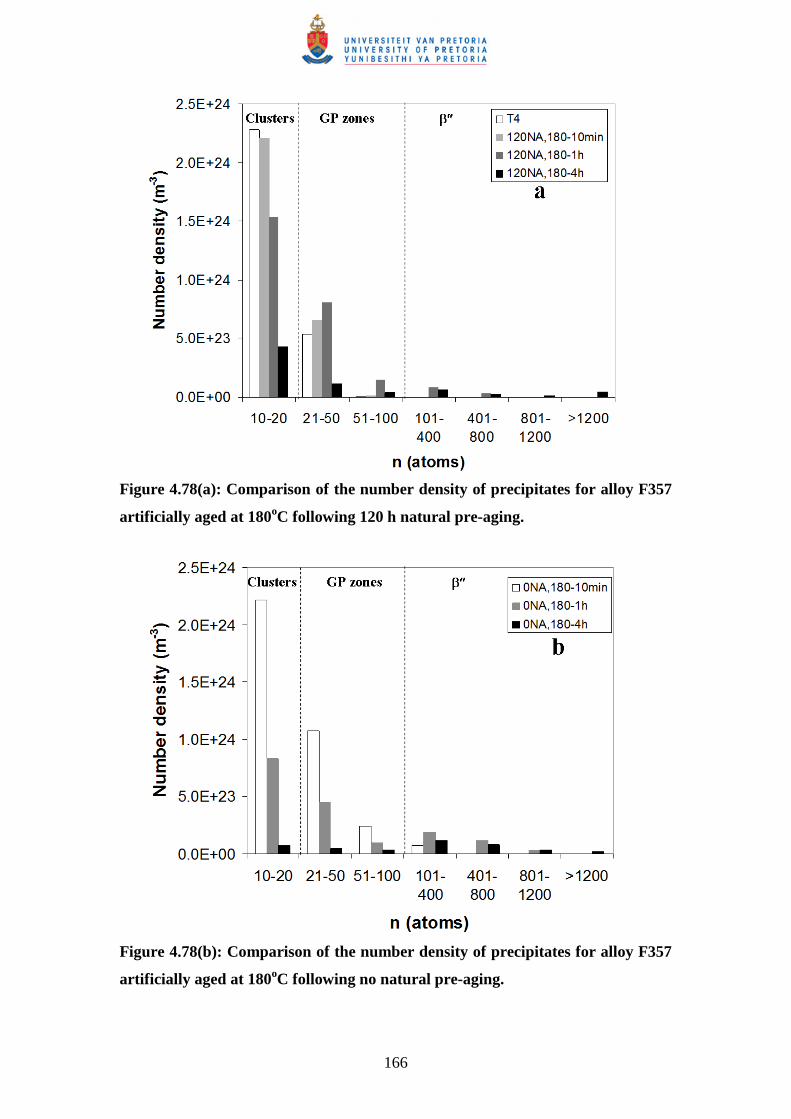
166
Figure 4.78(a): Comparison of the number density of precipitates for alloy F357
artificially aged at 180oC following 120 h natural pre-aging.
Figure 4.78(b): Comparison of the number density of precipitates for alloy F357
artificially aged at 180oC following no natural pre-aging.
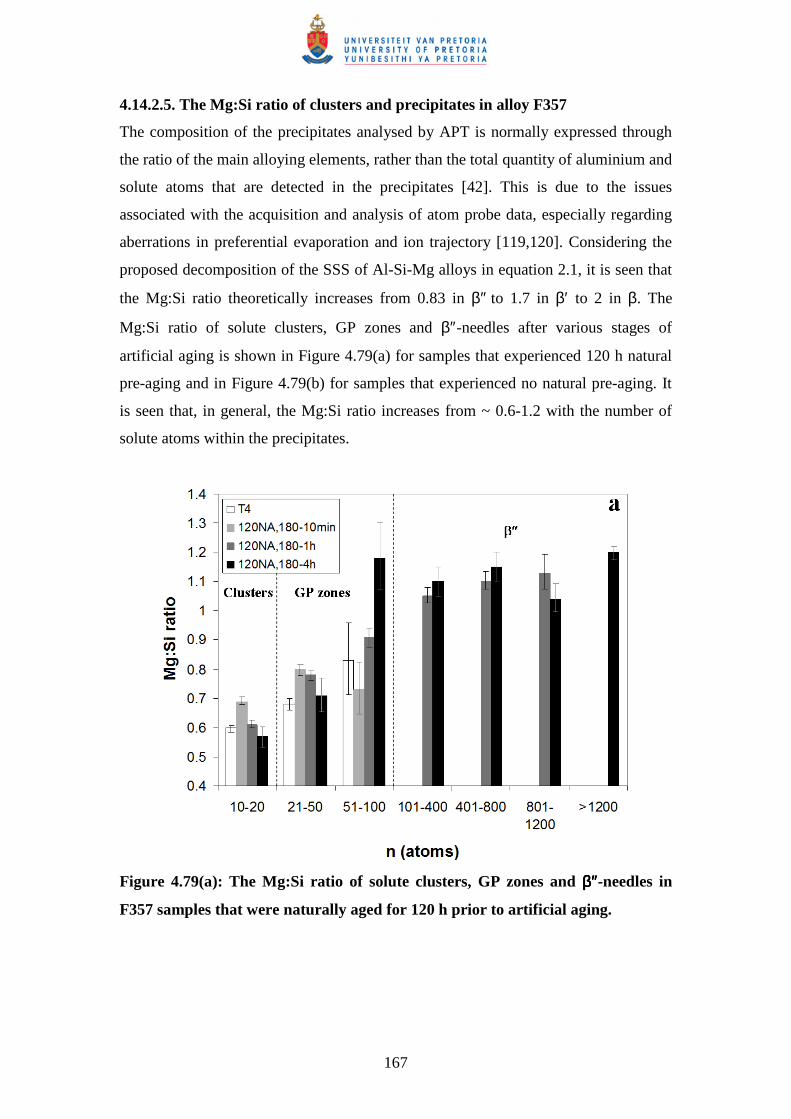
167
4.14.2.5. The Mg:Si ratio of clusters and precipitates in alloy F357
The composition of the precipitates analysed by APT is normally expressed through
the ratio of the main alloying elements, rather than the total quantity of aluminium and
solute atoms that are detected in the precipitates [42]. This is due to the issues
associated with the acquisition and analysis of atom probe data, especially regarding
aberrations in preferential evaporation and ion trajectory [119,120]. Considering the
proposed decomposition of the SSS of Al-Si-Mg alloys in equation 2.1, it is seen that
the Mg:Si ratio theoretically increases from 0.83 in β″ to 1.7 in β′ to 2 in β. The
Mg:Si ratio of solute clusters, GP zones and β″-needles after various stages of
artificial aging is shown in Figure 4.79(a) for samples that experienced 120 h natural
pre-aging and in Figure 4.79(b) for samples that experienced no natural pre-aging. It
is seen that, in general, the Mg:Si ratio increases from ~ 0.6-1.2 with the number of
solute atoms within the precipitates.
Figure 4.79(a): The Mg:Si ratio of solute clusters, GP zones and ββββ″″″″-needles in
F357 samples that were naturally aged for 120 h prior to artificial aging.
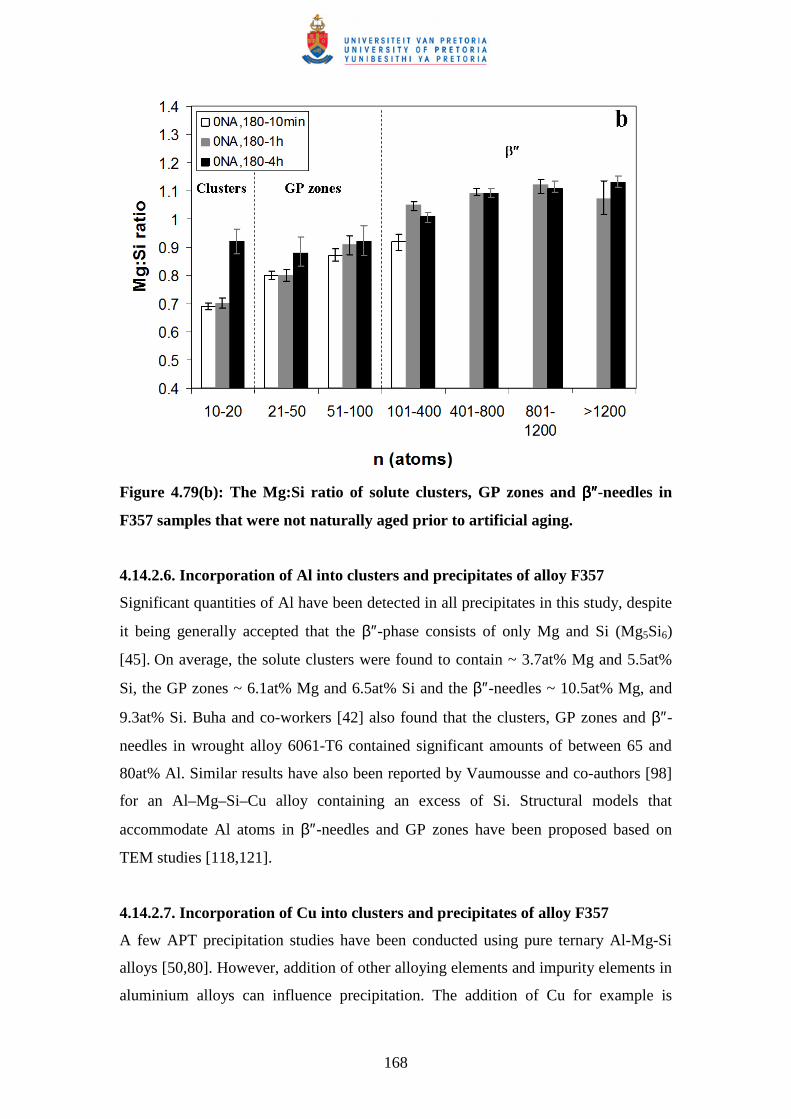
168
Figure 4.79(b): The Mg:Si ratio of solute clusters, GP zones and ββββ″″″″-needles in
F357 samples that were not naturally aged prior to artificial aging.
4.14.2.6. Incorporation of Al into clusters and precipitates of alloy F357
Significant quantities of Al have been detected in all precipitates in this study, despite
it being generally accepted that the β″-phase consists of only Mg and Si (Mg5Si6)
[45]. On average, the solute clusters were found to contain ~ 3.7at% Mg and 5.5at%
Si, the GP zones ~ 6.1at% Mg and 6.5at% Si and the β″-needles ~ 10.5at% Mg, and
9.3at% Si. Buha and co-workers [42] also found that the clusters, GP zones and β″-
needles in wrought alloy 6061-T6 contained significant amounts of between 65 and
80at% Al. Similar results have also been reported by Vaumousse and co-authors [98]
for an Al–Mg–Si–Cu alloy containing an excess of Si. Structural models that
accommodate Al atoms in β″-needles and GP zones have been proposed based on
TEM studies [118,121].
4.14.2.7. Incorporation of Cu into clusters and precipitates of alloy F357
A few APT precipitation studies have been conducted using pure ternary Al-Mg-Si
alloys [50,80]. However, addition of other alloying elements and impurity elements in
aluminium alloys can influence precipitation. The addition of Cu for example is
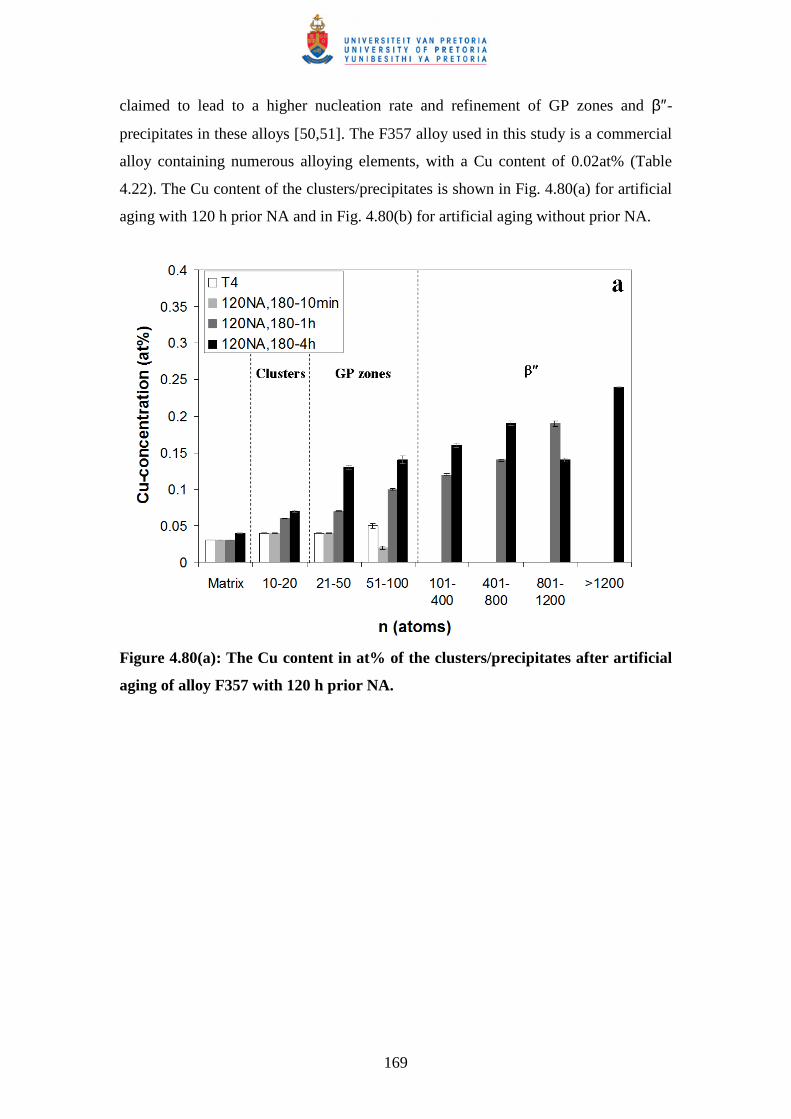
169
claimed to lead to a higher nucleation rate and refinement of GP zones and β″-
precipitates in these alloys [50,51]. The F357 alloy used in this study is a commercial
alloy containing numerous alloying elements, with a Cu content of 0.02at% (Table
4.22). The Cu content of the clusters/precipitates is shown in Fig. 4.80(a) for artificial
aging with 120 h prior NA and in Fig. 4.80(b) for artificial aging without prior NA.
Figure 4.80(a): The Cu content in at% of the clusters/precipitates after artificial
aging of alloy F357 with 120 h prior NA.
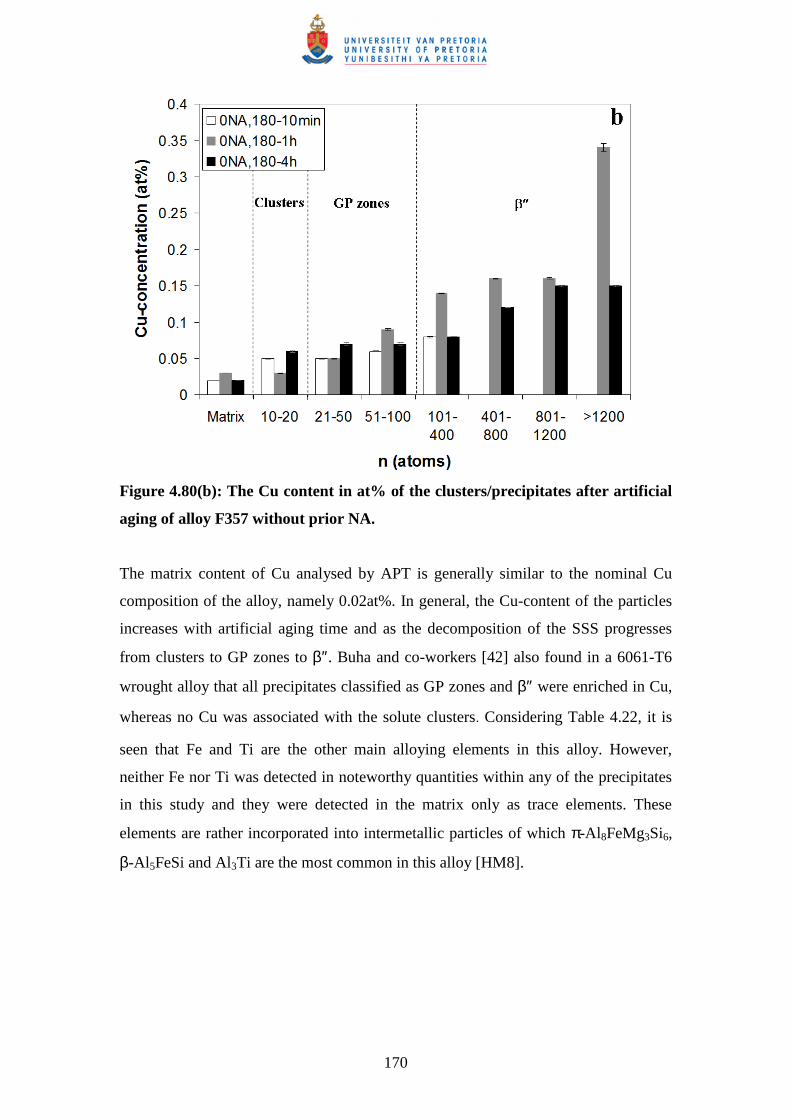
170
Figure 4.80(b): The Cu content in at% of the clusters/precipitates after artificial
aging of alloy F357 without prior NA.
The matrix content of Cu analysed by APT is generally similar to the nominal Cu
composition of the alloy, namely 0.02at%. In general, the Cu-content of the particles
increases with artificial aging time and as the decomposition of the SSS progresses
from clusters to GP zones to β″. Buha and co-workers [42] also found in a 6061-T6
wrought alloy that all precipitates classified as GP zones and β″ were enriched in Cu,
whereas no Cu was associated with the solute clusters. Considering Table 4.22, it is
seen that Fe and Ti are the other main alloying elements in this alloy. However,
neither Fe nor Ti was detected in noteworthy quantities within any of the precipitates
in this study and they were detected in the matrix only as trace elements. These
elements are rather incorporated into intermetallic particles of which π-Al 8FeMg3Si6,
β-Al 5FeSi and Al3Ti are the most common in this alloy [HM8].
171
5. DISCUSSION
5.1. SSM-HPDC
5.1.1. Rheoprocessing
The rheoprocessing step during SSM-HPDC produces relatively coarse globular
primary α-Al grains (Fig. 4.5). The coarse α-Al primary globular structure of 60-
70µm diameter (Table 4.1 and Fig. 4.55(a)) is typical for SSM-processed A356/7
alloys – see for instance Fig. 2.15 from Nafisi et al [56]) where even coarser average
globule circular diameters of 81µm in A356 without Ti and B, and with a diameter of
78µm in A356 with Ti and B, was found. Birol [13,14] postulated that the favourable
impact of the globular structure (presumably lower surface area/volume) of the
globular primary α-Al is offset by this relatively coarse structure in SSM-processed
alloys and that this is the main cause of the comparable heat treatment response
between globular and dendritic A356/7 alloys. However, this study has considered the
effects of both fine (Fig. 4.55(b)) and relatively coarse (Fig. 4.59) dendritic
microstructures in comparison with the globular SSM-processed microstructure and
found that the strength (or hardness) in the T6 temper condition is controlled primarily
by the Mg-content of the alloy (see Fig. 4.62), rather than primary α-Al
microstructure.
5.1.2. High pressure die casting
The relatively high cooling rates that are achieved with HPDC (Fig. 4.4) play an
important role in the microstructural evolution and heat treatment response of these
alloys. Figure 4.4 illustrates that cooling rates of ~ 18oC/s are estimated during the
initial stages of solidification of SSM-HPDC castings and this results in modification
of the eutectic component, even at low Sr levels of only 14 ppm (Fig. 4.6). It also
enables rapid spheroidisation of the eutectic silicon particles during solution treatment
(Fig. 4.8 and also see section 5.2.1).
The high cooling rates additionally retain a relatively high quantity of solutes in solid
solution which causes a decrease in the time needed for solution treatment (see section
5.2.2) and allows a relatively high aging response for the T5 temper condition (see
section 5.5).
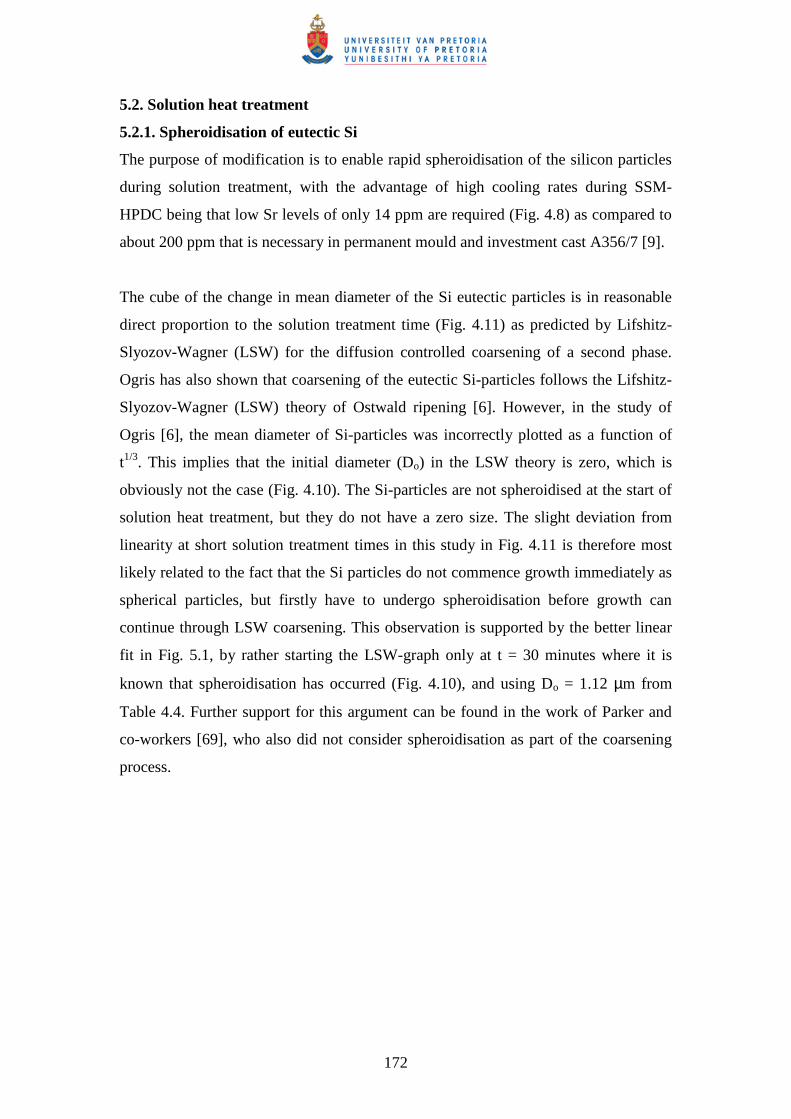
172
5.2. Solution heat treatment
5.2.1. Spheroidisation of eutectic Si
The purpose of modification is to enable rapid spheroidisation of the silicon particles
during solution treatment, with the advantage of high cooling rates during SSM-
HPDC being that low Sr levels of only 14 ppm are required (Fig. 4.8) as compared to
about 200 ppm that is necessary in permanent mould and investment cast A356/7 [9].
The cube of the change in mean diameter of the Si eutectic particles is in reasonable
direct proportion to the solution treatment time (Fig. 4.11) as predicted by Lifshitz-
Slyozov-Wagner (LSW) for the diffusion controlled coarsening of a second phase.
Ogris has also shown that coarsening of the eutectic Si-particles follows the Lifshitz-
Slyozov-Wagner (LSW) theory of Ostwald ripening [6]. However, in the study of
Ogris [6], the mean diameter of Si-particles was incorrectly plotted as a function of
t1/3. This implies that the initial diameter (Do) in the LSW theory is zero, which is
obviously not the case (Fig. 4.10). The Si-particles are not spheroidised at the start of
solution heat treatment, but they do not have a zero size. The slight deviation from
linearity at short solution treatment times in this study in Fig. 4.11 is therefore most
likely related to the fact that the Si particles do not commence growth immediately as
spherical particles, but firstly have to undergo spheroidisation before growth can
continue through LSW coarsening. This observation is supported by the better linear
fit in Fig. 5.1, by rather starting the LSW-graph only at t = 30 minutes where it is
known that spheroidisation has occurred (Fig. 4.10), and using Do = 1.12 µm from
Table 4.4. Further support for this argument can be found in the work of Parker and
co-workers [69], who also did not consider spheroidisation as part of the coarsening
process.
173
R2 = 0.9744
0
1
2
3
4
5
6
7
8
0 5 10 15 20 25
Solution treatment time (h)
D3 -
Do
3 (um
3 )
Figure 5.1: The cube of the change in mean diameter of the Si eutectic particles
as a function of solution treatment time at 540oC using a starting diameter (Do)
of spheroidised Si after 30 minutes of solution treatment.
Spheroidisation of the eutectic Si occurs rapidly at 540oC (Fig. 4.10), with Parker and
co-workers [69], as well as Ogris [6] suggesting that it is complete in less than 10
minutes. The eutectic Si-particles in unmodified alloys do not spheroidise, even after
long times at 540oC (Fig. 4.9). The long solution treatment times (4-10 h) frequently
specified for these alloys (Table 2.6) most likely cater for unmodified alloys and
would be an energy and production restriction for modified alloys, provided that
complete solutionising of solutes can also occur in shorter times [58].
5.2.2. Dissolution of solutes and reduction of microsegregation
Taylor et al [47] and Rometsch et al [68] showed that dissolution of Mg2Si particles
and homogenisation of the concentration profiles are complete within one hour at
540oC for both A356 and A357. In spite of these short reported times (and the rapid
spheroidisation of the Si-particles in modified alloys), times of 4-10 h are specified
for these alloys at 540oC (Table 2.6). Rosso and Actis Grande [90] proposed that a
solution heat treatment of 1 hour at 540oC is sufficient to obtain a high level of
properties in the T6 temper of SSM-processed A356. According to Dewhirst [12], the
optimum solution treatment time for SSM-processed A356 at 540oC is 4 h. Birol [13]
174
suggested that a solution treatment time of at least 2 h at 540oC is required to obtain
maximum hardness after artificial aging in the SSM-processed alloy F357 (Fig. 2.36).
A large variation in suggested solution treatment times is therefore found in the
literature for SSM-processed alloys A356/7. The tensile results in Table 4.5 of SSM-
HPDC alloy F357 with a high Mg-content of 0.62% Mg in this study show that a high
level of properties in the T6 temper condition can be obtained after only 30 minutes of
solution treatment at 540oC. This is in contradiction to the results of Birol in Fig. 2.36
[13] and is most likely caused by the fact that HPDC was used in this study, resulting
in higher cooling rates during solidification (Fig. 4.4) than achieved by Birol in his
study. These high cooling rates achieved with HPDC promotes enhanced solutionising
before heat treatment commences and result in shorter times being required.
5.2.3. Impact strength
Another important consideration to optimise solution treatment time is the impact
strength of the alloys that can be achieved (Table 4.6). Zhang et al [67] found that
shorter solution treatments than the standard 6 hours resulted in lower impact
strengths for permanent mould cast A356-T6. This was attributed to the smaller
interparticle Si-spacing after shorter solution treatments, which assisted with crack
growth. However, Ogris [6] showed that the impact strength for thixoformed A357-T6
was better using only 3 minutes solution treatment compared to 12 hours. This was
postulated to be due to the fact that the Si was three dimensionally separated after 3
minutes at 540oC, whereas longer times caused the silicon to agglomerate and form
large interconnected silicon crystals. This hypothesis seems unlikely as the
agglomeration of the Si should rather form large crystals that are not interconnected as
the Si- interparticle spacing increases due to coarsening. Similar impact properties
were obtained after a solution treatment of 1 h rather than 6 h for each composition in
this study in the T4 and T6 temper conditions (Table 4.6). However, it was also
shown in Fig. 4.13 that the strength of the alloy plays a more important role in the
impact strength in the T4 and T6 temper conditions than the solution treatment time.
The higher impact strength for thixormed A357-T6 found by Ogris [6] using only 3
minutes solution treatment time rather than 12 h, is therefore most likely a “strength
effect” rather than a “Si-interparticle spacing effect”. Solution treatment for only 3
minutes does not allow complete dissolution of strengthening solutes, resulting in a
lower strength in the T6 temper condition (YS = 240 MPa, UTS = 325 MPa) than
175
after 12 h solution treatment (YS = 312 MPa, UTS = 358 MPa) [6]. The lower
strength of the 3 minute solution treated sample will, however, improve the impact
properties of the alloy according to Fig. 4.13.
In addition, Figure 4.53 also indicates that good mechanical properties in the T4 and
T6 temper conditions can be achieved in a larger, more complex casting such as an
automotive brake calliper by using shorter solution treatment times.
Conclusion: Considering the processes of spheroidisation of eutectic Si-particles,
dissolution of solutes, reduction of microsegregation, achieving the optimum tensile
and impact properties, as well as the size of the casting, the optimum solution
treatment parameters for SSM-HPDC alloys A356 and F357 are suggested to be
540oC for 1 h.
5.3. Quench after solution treatment
Slow quench rates after the solution heat treatment can reduce the problems of
distortion and residual stresses, but also result in a loss of strength after artificial aging
(Table 4.7). To get an estimate of the quench rate in water at 70oC, the data of Zhang
and Zheng [73] (Table 2.5) were plotted as shown in Fig. 5.2.
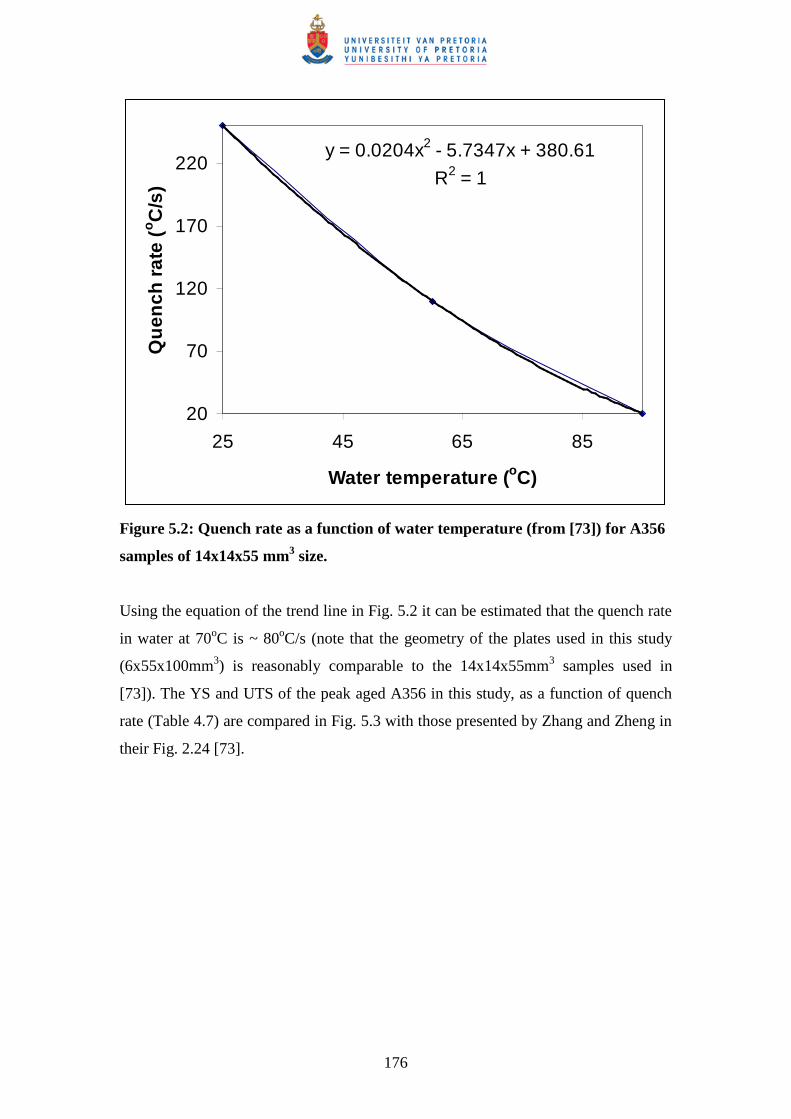
176
y = 0.0204x2 - 5.7347x + 380.61
R2 = 1
20
70
120
170
220
25 45 65 85
Water temperature (oC)
Qu
ench
rat
e (o
C/s
)
Figure 5.2: Quench rate as a function of water temperature (from [73]) for A356
samples of 14x14x55 mm3 size.
Using the equation of the trend line in Fig. 5.2 it can be estimated that the quench rate
in water at 70oC is ~ 80oC/s (note that the geometry of the plates used in this study
(6x55x100mm3) is reasonably comparable to the 14x14x55mm3 samples used in
[73]). The YS and UTS of the peak aged A356 in this study, as a function of quench
rate (Table 4.7) are compared in Fig. 5.3 with those presented by Zhang and Zheng in
their Fig. 2.24 [73].
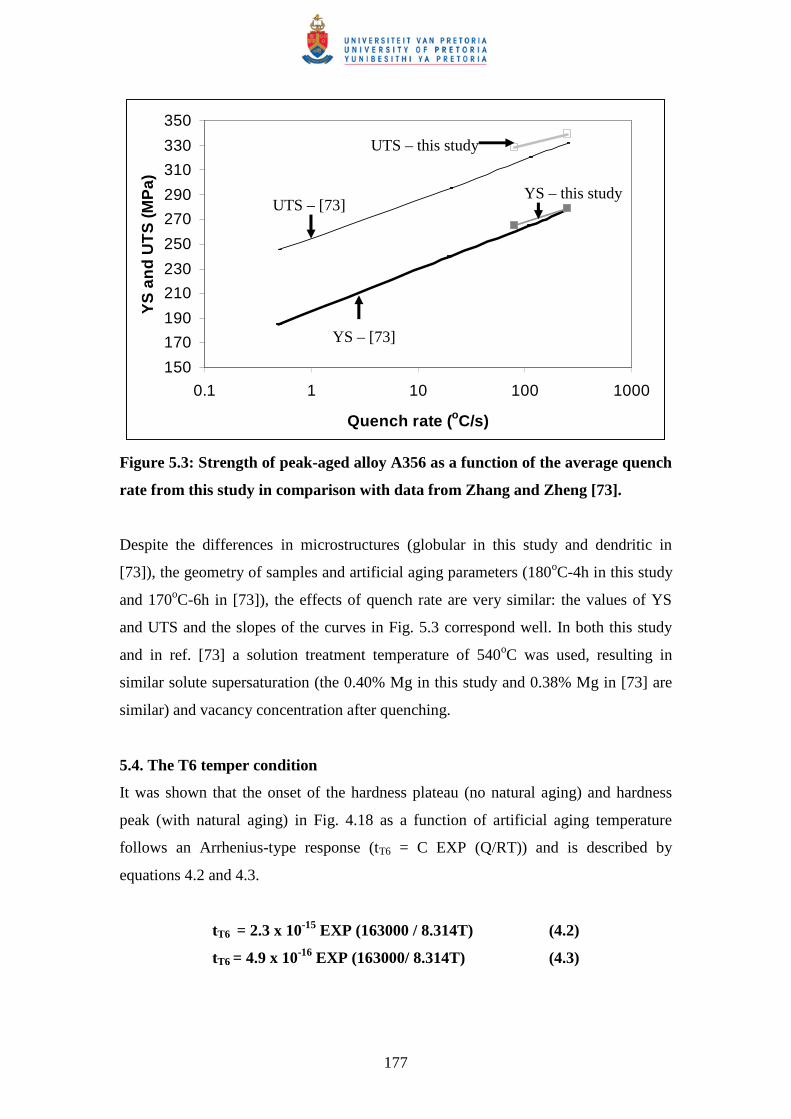
177
150
170
190
210
230
250
270
290
310
330
350
0.1 1 10 100 1000
Quench rate (oC/s)
YS
an
d U
TS
(MP
a)
Figure 5.3: Strength of peak-aged alloy A356 as a function of the average quench
rate from this study in comparison with data from Zhang and Zheng [73].
Despite the differences in microstructures (globular in this study and dendritic in
[73]), the geometry of samples and artificial aging parameters (180oC-4h in this study
and 170oC-6h in [73]), the effects of quench rate are very similar: the values of YS
and UTS and the slopes of the curves in Fig. 5.3 correspond well. In both this study
and in ref. [73] a solution treatment temperature of 540oC was used, resulting in
similar solute supersaturation (the 0.40% Mg in this study and 0.38% Mg in [73] are
similar) and vacancy concentration after quenching.
5.4. The T6 temper condition
It was shown that the onset of the hardness plateau (no natural aging) and hardness
peak (with natural aging) in Fig. 4.18 as a function of artificial aging temperature
follows an Arrhenius-type response (tT6 = C EXP (Q/RT)) and is described by
equations 4.2 and 4.3.
tT6 = 2.3 x 10⁻¹⁵ EXP (163000 / 8.314T) (4.2)
tT6 = 4.9 x 10⁻¹⁶ EXP (163000/ 8.314T) (4.3)
YS – [73]
UTS – [73] YS – this study
UTS – this study
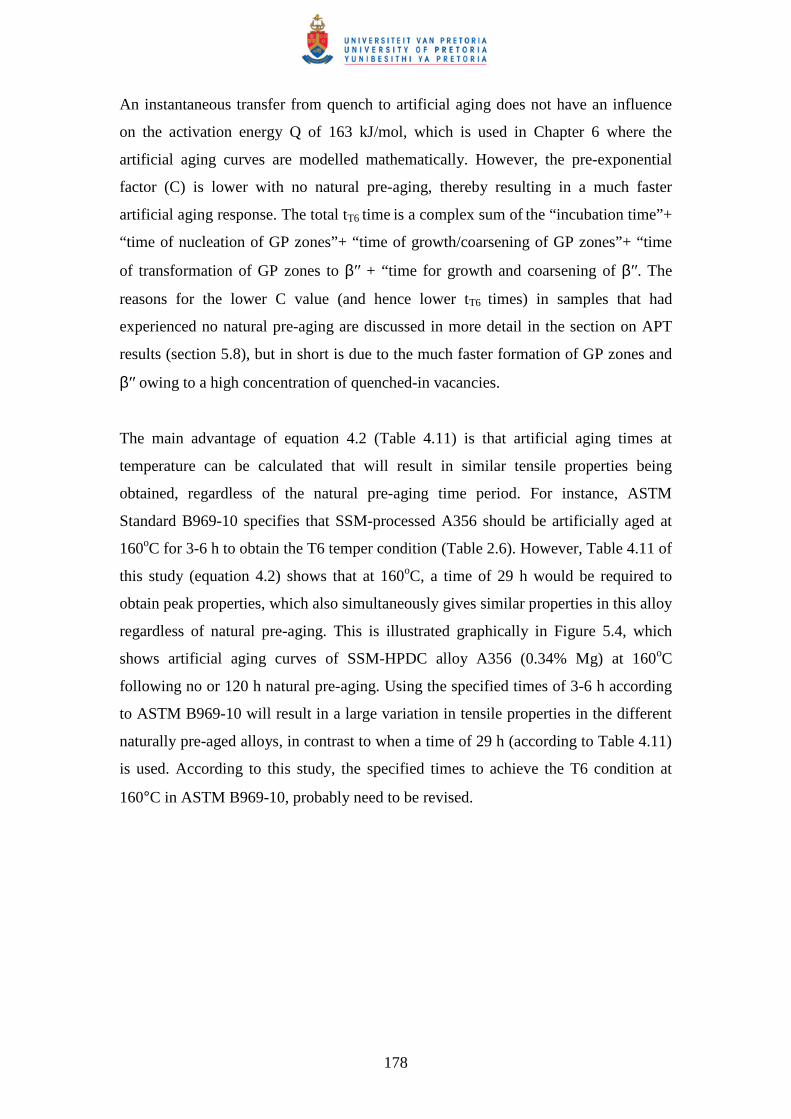
178
An instantaneous transfer from quench to artificial aging does not have an influence
on the activation energy Q of 163 kJ/mol, which is used in Chapter 6 where the
artificial aging curves are modelled mathematically. However, the pre-exponential
factor (C) is lower with no natural pre-aging, thereby resulting in a much faster
artificial aging response. The total tT6 time is a complex sum of the “incubation time”+
“time of nucleation of GP zones”+ “time of growth/coarsening of GP zones”+ “time
of transformation of GP zones to β′′ + “time for growth and coarsening of β′′. The
reasons for the lower C value (and hence lower tT6 times) in samples that had
experienced no natural pre-aging are discussed in more detail in the section on APT
results (section 5.8), but in short is due to the much faster formation of GP zones and
β′′ owing to a high concentration of quenched-in vacancies.
The main advantage of equation 4.2 (Table 4.11) is that artificial aging times at
temperature can be calculated that will result in similar tensile properties being
obtained, regardless of the natural pre-aging time period. For instance, ASTM
Standard B969-10 specifies that SSM-processed A356 should be artificially aged at
160oC for 3-6 h to obtain the T6 temper condition (Table 2.6). However, Table 4.11 of
this study (equation 4.2) shows that at 160oC, a time of 29 h would be required to
obtain peak properties, which also simultaneously gives similar properties in this alloy
regardless of natural pre-aging. This is illustrated graphically in Figure 5.4, which
shows artificial aging curves of SSM-HPDC alloy A356 (0.34% Mg) at 160oC
following no or 120 h natural pre-aging. Using the specified times of 3-6 h according
to ASTM B969-10 will result in a large variation in tensile properties in the different
naturally pre-aged alloys, in contrast to when a time of 29 h (according to Table 4.11)
is used. According to this study, the specified times to achieve the T6 condition at
160°C in ASTM B969-10, probably need to be revised.
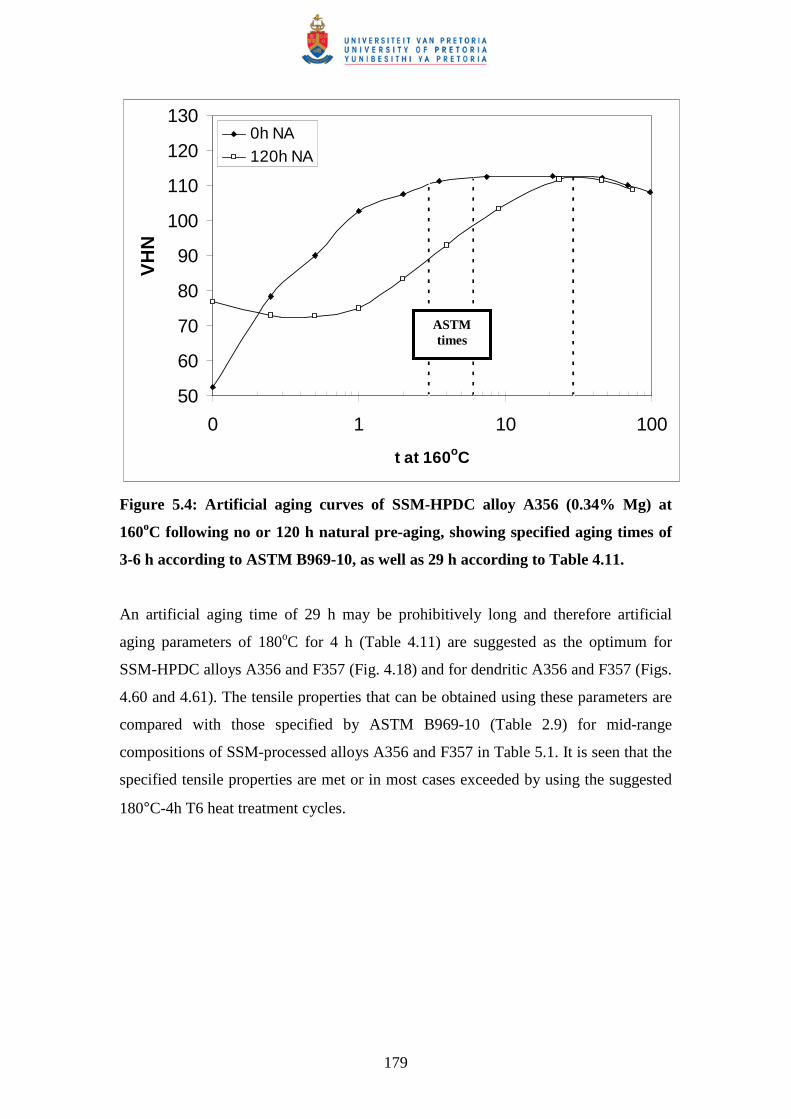
179
50
60
70
80
90
100
110
120
130
0 1 10 100
t at 160oC
VH
N0h NA120h NA
Figure 5.4: Artificial aging curves of SSM-HPDC alloy A356 (0.34% Mg) at
160oC following no or 120 h natural pre-aging, showing specified aging times of
3-6 h according to ASTM B969-10, as well as 29 h according to Table 4.11.
An artificial aging time of 29 h may be prohibitively long and therefore artificial
aging parameters of 180oC for 4 h (Table 4.11) are suggested as the optimum for
SSM-HPDC alloys A356 and F357 (Fig. 4.18) and for dendritic A356 and F357 (Figs.
4.60 and 4.61). The tensile properties that can be obtained using these parameters are
compared with those specified by ASTM B969-10 (Table 2.9) for mid-range
compositions of SSM-processed alloys A356 and F357 in Table 5.1. It is seen that the
specified tensile properties are met or in most cases exceeded by using the suggested
180°C-4h T6 heat treatment cycles.
ASTM times
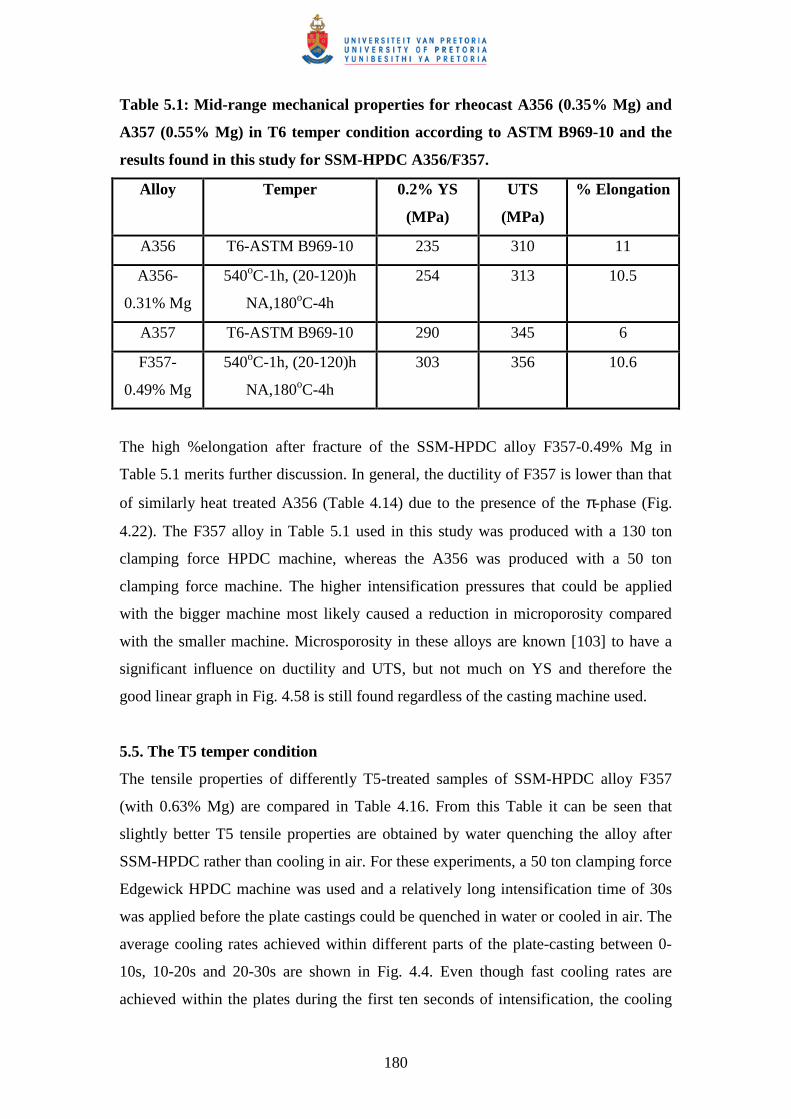
180
Table 5.1: Mid-range mechanical properties for rheocast A356 (0.35% Mg) and
A357 (0.55% Mg) in T6 temper condition according to ASTM B969-10 and the
results found in this study for SSM-HPDC A356/F357.
Alloy Temper 0.2% YS
(MPa)
UTS
(MPa)
% Elongation
A356 T6-ASTM B969-10 235 310 11
A356-
0.31% Mg
540oC-1h, (20-120)h
NA,180oC-4h
254 313 10.5
A357 T6-ASTM B969-10 290 345 6
F357-
0.49% Mg
540oC-1h, (20-120)h
NA,180oC-4h
303 356 10.6
The high %elongation after fracture of the SSM-HPDC alloy F357-0.49% Mg in
Table 5.1 merits further discussion. In general, the ductility of F357 is lower than that
of similarly heat treated A356 (Table 4.14) due to the presence of the π-phase (Fig.
4.22). The F357 alloy in Table 5.1 used in this study was produced with a 130 ton
clamping force HPDC machine, whereas the A356 was produced with a 50 ton
clamping force machine. The higher intensification pressures that could be applied
with the bigger machine most likely caused a reduction in microporosity compared
with the smaller machine. Microsporosity in these alloys are known [103] to have a
significant influence on ductility and UTS, but not much on YS and therefore the
good linear graph in Fig. 4.58 is still found regardless of the casting machine used.
5.5. The T5 temper condition
The tensile properties of differently T5-treated samples of SSM-HPDC alloy F357
(with 0.63% Mg) are compared in Table 4.16. From this Table it can be seen that
slightly better T5 tensile properties are obtained by water quenching the alloy after
SSM-HPDC rather than cooling in air. For these experiments, a 50 ton clamping force
Edgewick HPDC machine was used and a relatively long intensification time of 30s
was applied before the plate castings could be quenched in water or cooled in air. The
average cooling rates achieved within different parts of the plate-casting between 0-
10s, 10-20s and 20-30s are shown in Fig. 4.4. Even though fast cooling rates are
achieved within the plates during the first ten seconds of intensification, the cooling
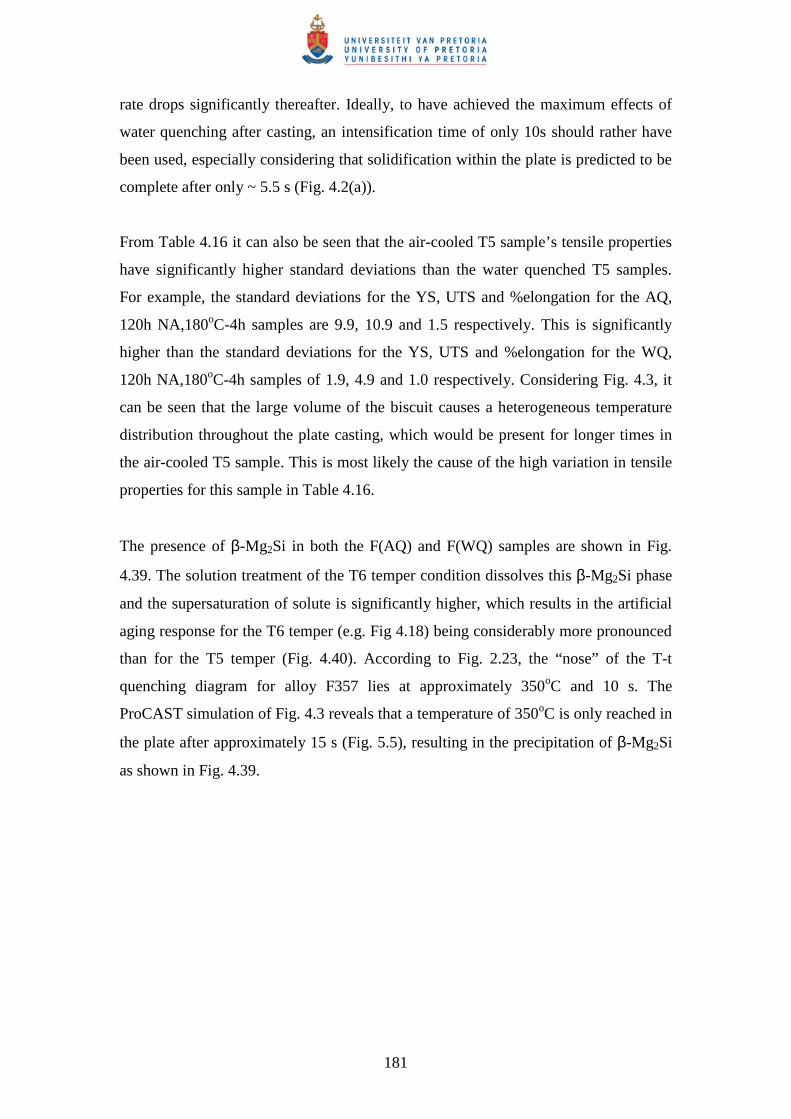
181
rate drops significantly thereafter. Ideally, to have achieved the maximum effects of
water quenching after casting, an intensification time of only 10s should rather have
been used, especially considering that solidification within the plate is predicted to be
complete after only ~ 5.5 s (Fig. 4.2(a)).
From Table 4.16 it can also be seen that the air-cooled T5 sample’s tensile properties
have significantly higher standard deviations than the water quenched T5 samples.
For example, the standard deviations for the YS, UTS and %elongation for the AQ,
120h NA,180oC-4h samples are 9.9, 10.9 and 1.5 respectively. This is significantly
higher than the standard deviations for the YS, UTS and %elongation for the WQ,
120h NA,180oC-4h samples of 1.9, 4.9 and 1.0 respectively. Considering Fig. 4.3, it
can be seen that the large volume of the biscuit causes a heterogeneous temperature
distribution throughout the plate casting, which would be present for longer times in
the air-cooled T5 sample. This is most likely the cause of the high variation in tensile
properties for this sample in Table 4.16.
The presence of β-Mg2Si in both the F(AQ) and F(WQ) samples are shown in Fig.
4.39. The solution treatment of the T6 temper condition dissolves this β-Mg2Si phase
and the supersaturation of solute is significantly higher, which results in the artificial
aging response for the T6 temper (e.g. Fig 4.18) being considerably more pronounced
than for the T5 temper (Fig. 4.40). According to Fig. 2.23, the “nose” of the T-t
quenching diagram for alloy F357 lies at approximately 350oC and 10 s. The
ProCAST simulation of Fig. 4.3 reveals that a temperature of 350oC is only reached in
the plate after approximately 15 s (Fig. 5.5), resulting in the precipitation of β-Mg2Si
as shown in Fig. 4.39.
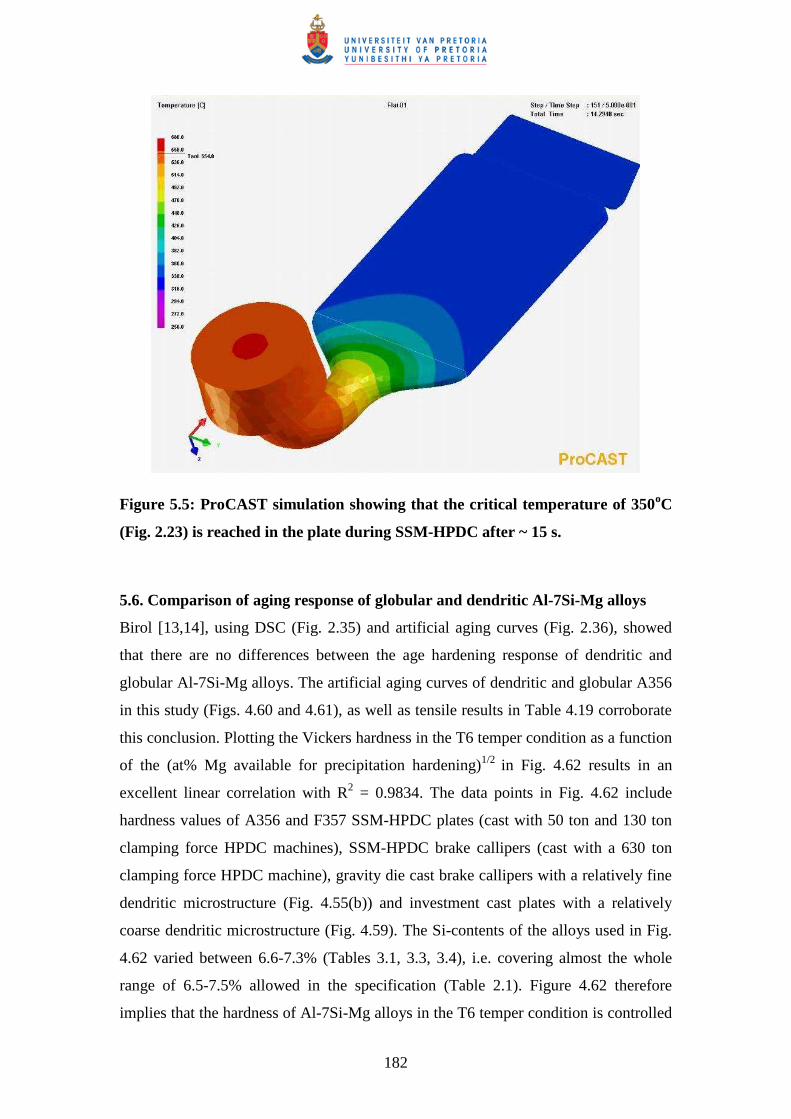
182
Figure 5.5: ProCAST simulation showing that the critical temperature of 350oC
(Fig. 2.23) is reached in the plate during SSM-HPDC after ~ 15 s.
5.6. Comparison of aging response of globular and dendritic Al-7Si-Mg alloys
Birol [13,14], using DSC (Fig. 2.35) and artificial aging curves (Fig. 2.36), showed
that there are no differences between the age hardening response of dendritic and
globular Al-7Si-Mg alloys. The artificial aging curves of dendritic and globular A356
in this study (Figs. 4.60 and 4.61), as well as tensile results in Table 4.19 corroborate
this conclusion. Plotting the Vickers hardness in the T6 temper condition as a function
of the (at% Mg available for precipitation hardening)1/2 in Fig. 4.62 results in an
excellent linear correlation with R2 = 0.9834. The data points in Fig. 4.62 include
hardness values of A356 and F357 SSM-HPDC plates (cast with 50 ton and 130 ton
clamping force HPDC machines), SSM-HPDC brake callipers (cast with a 630 ton
clamping force HPDC machine), gravity die cast brake callipers with a relatively fine
dendritic microstructure (Fig. 4.55(b)) and investment cast plates with a relatively
coarse dendritic microstructure (Fig. 4.59). The Si-contents of the alloys used in Fig.
4.62 varied between 6.6-7.3% (Tables 3.1, 3.3, 3.4), i.e. covering almost the whole
range of 6.5-7.5% allowed in the specification (Table 2.1). Figure 4.62 therefore
implies that the hardness of Al-7Si-Mg alloys in the T6 temper condition is controlled
183
primarily by the Mg-content available for precipitation hardening after solution
treatment and is independent of the casting technique used (i.e. dendritic or globular
primary α-Al microstructure). The insignificant influence of Si-content variation is
due to the fact that these Al-7Si-Mg casting alloys contain an excess Si that is
required to form the strengthening β″−precipitates, which has a Mg:Si ratio of 1.1-1.2
(Fig. 4.79). The other important alloying element controlling the age-hardening
capacity of (dendritic and globular) Al-7Si-Mg alloys is in fact iron (section 4.6). The
data points in Fig. 4.62 are all for alloys containing ~ 0.1% Fe. Higher Fe-contents
(especially in alloys containing > 0.40% Mg) will result in a reduced response to age-
hardening due to the stability of the π-Al 8FeMg3Si6 phase (Fig. 4.22(b)). Therefore,
provided that the maximum quantity of the alloy’s Mg is placed into solid solution
during solution treatment (which might take longer than 1 h at 540oC for dendritic
alloys with a very coarse dendritic microstructures such as in large sand castings), and
the alloy’s Fe content is within specification (but preferably ~ 0.1%), the response to
age hardening of Al-7Si-Mg alloys should be independent of the processing technique
used.
5.7. Comparison of aging response of SSM-HPDC Al-7Si-Mg alloys with SSM-
HPDC 6000 series Al-Mg-Si wrought alloys
Both conventional casting alloys A356/7 and the conventional Al-Mg-Si 6000 series
wrought alloys are strengthened by β″, but the high Si content in the casting alloys
compared to the wrought alloys has a significant influence on the age-hardening
response (Fig. 4.70). The solute clusters that are formed during natural aging in alloy
6082 are known to be relatively stable at the artificial aging temperature [9]. This
claim is supported by the small initial decrease in hardness during artificial aging of
the naturally aged 6082 sample compared to the naturally aged A356 sample in Fig.
4.70. Natural pre-aging of 6082 has an important effect on the precipitation of GP
zones and β″ [84]. The atomic clusters, which formed during natural pre-aging, and
the low concentration of the quenched-in vacancies in the naturally pre-aged samples,
have a delaying effect upon the nucleation of GP zones. As a result, the final β″
structure developed in these 6082 samples is coarse. However, the large number of
GP zones formed in the 6082 samples artificially aged without natural pre-aging,
transform into a dense structure of small β″ particles, with the number density of β″
184
precipitates being five times higher in samples that were artificially aged immediately
after solution treatment compared to samples that were naturally aged for a week
before artificial aging (i.e. 200 000 vs 40 000 particles/µm3) [84]. The opposite of
these processes is believed to occur in alloys such as 6004 [9]. Chang and co-workers
[50] described the positive effect of natural pre-aging on precipitation hardening in a
wrought alloy with a composition similar to the 6004 in this study. They showed, in
an Al-0.44at% Mg-0.38at%Si alloy, that artificial aging of naturally aged samples
increased the level of the peak hardness. This was attributed to the increase in the
number density of needle-like precipitates (β″) as compared to the samples without
prior natural aging.
It can also be seen from Figure 4.70 that the hardening response of alloy A356 is very
rapid compared to that of the wrought alloys (with the response of 6004 being the
slowest). Gupta and co-workers [88] studied the precipitation hardening in wrought
6000 series alloys with and without excess Si that is required to form stoichiometric
Mg2Si. They found that excess Si (which is most pronounced in the casting alloys in
this study) reduced the time to initiate strengthening, possibly due to a higher driving
force for nucleation which will lead to a finer particle size and shorter diffusion
distances. They also found that excess Si increases strength in both the T4 and
artificially aged tempers (T6), most likely due to a higher volume fraction of
strengthening precipitates as well as from a finer particle size from the higher driving
force for nucleation. This is also applicable to Fig. 4.70, where alloy A356 has higher
hardness values than alloy 6004, even though A356 contained 0.36% Mg compared to
the 0.45% Mg of the 6004. Low hardness values for wrought alloy 6004 upon aging
have been reported before [122]. Gupta and co-authors [88] claimed that the
improvements to the aging response due to excess Si were caused by enhanced
precipitation of fine, uniformly distributed β″ particles. They also claimed that excess
Si reduced the Mg/Si ratio in the zones/clusters and β″-precipitates, thus allowing
higher levels of precipitation and strengthening. From Figure 4.70 it is evident that
over-aging also occurs faster in A356 than the wrought 6000 series alloys. Especially
alloy 6004 maintained its maximum hardness for a long time at 180oC. Gupta and co-
workers [88] determined that excess Si reduced the peak strength stability in the over-
185
aged conditions. The reduced Mg/Si ratio is believed to make the β″ phase less stable,
and as a result, the stability in strength beyond the peak aging condition is reduced.
5.8. Nanostructural evolution during aging of Al-7Si-Mg alloys
The nanostructural evolution of Al-7Si-Mg alloys as studied by means of APT and
TEM (section 4.14) allows the quantification of the precipitation sequence of Al-7Si-
Mg alloys, while also considering the effects of natural pre-aging.
5.8.1. Artificial aging with natural pre-aging
The T4 sample (Fig. 4.75(a)) has a large number density (2.3 x 1024 m-3) of solute
clusters containing n = 10-20 solute atoms with few GP zones (5.4 x 10²³ m-3) and no
β″-needles (Fig. 4.78(a)). Figure 4.78(a) also shows that the 120h NA,180oC-10min
sample has a slightly lower number density (2.2 x 1024 m-3) of solute clusters than the
T4 sample, but also a marginally higher number density of GP zones (6.7 x 10²³ m-3)
and no β″-needles. This suggests that the 10 min artificial aging at 180oC may have
resulted in the dissolution of some of the solute clusters (< 20 solute atoms), with
concurrent nucleation of some new and growth of all of the GP zones (> 20 solute
atoms), which results in a small decrease in macrohardness (Fig. 4.72), YS and UTS
(Table 4.23). Dissolution of room temperature clusters with artificial aging has been
inferred from DSC before (Fig. 2.33). However, dissolution of a large number of
clusters should result in an increase in Mg and Si concentrations of the matrix after 10
min at 180oC. As shown in Fig. 4.77, however, no significant changes were measured
with Mg and Si essentially remaining constant at 0.51 to 0.52at% and 1.48 to 1.46at%
respectively. Therefore, it is more likely that the observed nanostructural change may
be due to coarsening of some small solute clusters as was also postulated before for
alloy 7050 [123]. The 120h NA,180oC-1h sample has less clusters (1.5 x 1024 m-3) and
more GP zones (9.5 x 10²³ m-3) than the 120h NA,180oC-10min sample (2.2 x 1024 m-
3 clusters and 6.7 x 10²³ m-3 GP zones respectively), indicating further growth of
clusters to GP zones during this artificial aging time period. Also, in contrast to the T4
and 120h NA,180oC-10min samples where no β″-needles were found, the 120h
NA,180oC-1h sample has 1.2 x 10²³ m-3 small β″-needles with n = 100 – 1200 solute
atoms, but no β″-needles with n > 1200 solute atoms (Fig. 4.78(a)). This corresponds
to a higher hardness and strength, as seen in Fig. 4.72 and Table 4.23. Further
186
artificial aging to peak hardness (Fig. 4.72) after 4 h at 180oC results in a significant
decrease in solute clusters (4.3 x 10²³ m-3) and GP zones (1.6 x 10²³ m-3) compared to
the 120h NA,180oC-1h sample. However, the number density of β″-needles needles is
concurrently increased, with large needles containing > 1200 solute atoms (4.3 x 10²²
m-3) found in this sample resulting in peak strength (Table 4.23). Heterogeneous
nucleation of β″-needles from GP zones has been postulated before [43,84].
5.8.2. Artificial aging without natural pre-aging
The 0h NA,180oC-10min sample has a high number density of solute clusters (2.2 x
1024 m-3) and GP zones (1.3 x 1024 m-3), with a lower number density of small β″-
needles with n = 100-400 solute atoms (7.6 x 10²² m-3) (Fig. 4.78(b)). This is in good
agreement with the faint streaks observed in the <001> SADP of the sample (Fig.
4.74(a)) as discussed previously. Further artificial aging to 1 h at 180oC caused a
decrease in the number density of both solute clusters (8.3 × 10²³ m-3) and GP zones
(5.4 × 10²³ m-3), with a concurrent increase of this number in small β″-needles
containing 101-1200 solute atoms (3.3 × 10²³ m-3) and large β″-needles with n > 1200
in a low number density of 2.4 × 10²¹ m-3. With the increase in aging time from 1 h to
4 h at 180oC, the number density of solute clusters decreases almost 12 times to 7.3 ×
1022 m-3 and that of GP zones more than 6 times to 8.5 × 10²² m-3. Concurrently, the
number density of large β″-needles with > 1200 solute atoms increased almost 8 times
to 1.9 × 10²² m-3 (Fig. 4.78(b)). This coincides with the hardness plateau as shown in
Fig. 4.72. During coarsening of the β″-precipitates within the hardness plateau, both
the UTS and macrohardness values remain relatively constant, but the YS increases
(Table 4.23).
5.8.3. Comparison of artificial aging with and without natural pre-aging
The 120h NA,180oC-10min and 0h NA,180oC-10min samples have similar number
densities of solute clusters, but the latter sample has a significantly higher number
density of GP zones and also contains small β″-needles with n = 100-400 solute atoms
(Fig. 4.78). The vacancy-rich solute clusters that are formed during natural aging
diminish the matrix of quenched-in vacancies [84,124]. The lower concentration of
quenched-in vacancies in the 120h NA,180oC-10min sample compared to the 0h
NA,180oC-10min sample most likely had a delaying effect on precipitation of GP
187
zones by limiting diffusion. This also agrees with the model for GP zone growth
postulated by Herman [125]. The clusters are vacancy-rich due to lattice strains
caused by the differences in atom radii of Al, Mg and Si of 0.143, 0.160 and 0.117 nm
respectively [126], which results in misfits of +11.9% for Al-Mg and -18.2% for Al-
Si. The higher number densities of GP zones and small β″-needles in the 0h
NA,180oC-10min sample compared to the 120h NA,180oC-10min sample causes a
marked increased hardness (Fig. 4.72) and strength (Table 4.23)
The 120h NA,180oC-1h sample has a higher number density of solute clusters and GP
zones than the 0h NA,180oC-1h sample, with a concurrent lower number density of
β″-needles (Fig. 4.78), which results in lower hardness (Fig. 4.72) and strength (Table
4.23).
The 120h NA,180oC-4h sample has similar hardness, YS and UTS than the 0h
NA,180oC-4h sample (Table 4.23). However, the 120h NA,180oC-4h sample has a
significantly higher number density of solute clusters and GP zones than the 0h
NA,180oC-4h sample (Fig. 4.78). The presence of a larger number of small clusters
and GP zones in the naturally pre-aged sample is most likely due to remnants of
clusters and GP zones that had formed during natural aging. These would have been
the room temperature clusters and GP zones that were durable during artificial aging
and which did not undergo reversion. Such stability of room temperature clusters
during artificial aging at 180oC of Al-Mg-Si alloys has been reported before [50,86].
Yamada and co-workers [86] postulated that these clusters are Si and –vacancy rich
(see section 5.9.1) and are durable at 180oC due to the strong covalent bonds between
the Si atoms within these clusters. The 120h NA,180oC-4h sample also has a higher
number density of large β″-needles with n > 1200 solute atoms than the 0h
NA,180oC-4h sample and a correspondingly lower number density of smaller β″-
needles with n = 100-1200 solute atoms. Whereas the 0h NA,180oC-4h sample
therefore relies mostly on a relatively high volume fraction of comparatively small β″-
needles for its hardness and strength, the 120h NA,180oC-4h sample relies more on a
combined presence of solute clusters, GP zones and large β″-needles.
188
After aging for 4 h at 180°C, the relative reductions of the matrix solute
concentrations detected in the two samples reached the same level, which indicates
that the decomposition of the supersaturated solid solution in the two respective
microstructures has developed to a similar stage (Fig. 4.77). The initial vacancy
concentration difference between the two samples therefore has little influence on the
long-term precipitation process after 4 hour aging. After 1 h aging at 180°C, the
vacancy concentrations of the two samples appear to have quickly evolved to the
stable concentration at that temperature.
5.9. Characteristics of precipitates in Al-7Si-Mg alloys
5.9.1. Solute clusters
The solute clusters are fully coherent with the matrix and cannot be resolved by TEM
(Fig. 4.73(a)). They are Si-rich with a Mg:Si ratio of less than the theoretical 0.83 of
β″ (Fig. 4.79). Rinderer and co-workers [11] showed that the clusters in under-aged
A356 have a Mg:Si ratio of 0.7, which is in good agreement with the results in this
study. The clusters are enriched in Si [80,86] due to its higher diffusion rate and lower
solubility than Mg in Al [39,50]. The strong covalent bonds between the Si atoms in
the clusters presumably make them durable at artificial aging temperatures of 180oC,
even at a time of 4 h that corresponds to the peak aged condition.
5.9.2. GP zones
The GP zones are approximately 2 nm in diameter and can be resolved by TEM in
Fig. 4.74(a). GP zones are fully coherent with the matrix and do not have a distinct
structure and therefore their SADP’s (Fig. 4.74(a)) do not show extra reflections nor
diffuse scattering. The Mg:Si ratio of GP zones of 0.8-1.1 (Fig. 4.79) is higher than
those of the solute clusters and are close to the theoretical value of 0.83 of β″. The
increase in Mg-content of the GP zones compared to clusters indicates that Mg-
diffusion is rate limiting during precipitation [80]. Using the Arrhenius parameters
from Du and co-authors [105], it can be calculated that the diffusivity of Mg in Al at
180oC is half of that of Si in Al (1.9 x 10⁻¹⁹ and 3.8 x 10⁻¹⁹ m2/s respectively).
189
5.9.3. ββββ″″″″-needles
The β″-needles range in size from ~ 2 nm diameter x 10 nm length early during
artificial aging (Fig. 4.73(c)) to ~ 4 nm diameter x 25 nm in the peak aged condition
(Fig. 4.73(d)). The β″-needles have the highest Mg:Si ratio of all the precipitates due
to the precipitation process being controlled by Mg-diffusion (Fig. 4.79). The needles
with > 1200 solute atoms for instance have a Mg:Si ratio of ~ 1.0–1.2 (more than 0.83
of β″ but less than 1.7 of β′) - in excellent agreement with the ratio of 1.2 found by
Rinderer and co-workers [11] for peak aged β″-needles in alloy A356. Recent first
principle calculations suggest that the lowest formation enthalpy configuration of
β″ has a Mg:Si ratio of 1.25 [127].
5.10. Precipitation sequence of Al-7Si-Mg alloys
By considering the results obtained by employing TEM and APT in this study, the
precipitation sequence can be expressed as follows, while also elucidating the co-
existence of precipitates during precipitation.
� During natural aging (T4): Formation of a high number density of vacancy-
and Si-rich Si-Mg clusters with a significantly lower number density of GP
zones and no β″-needles.
� During artificial aging after natural pre-aging: Coarsening of the room
temperature clusters → spherical GP zones → β″-needles, coinciding with a
decrease of the matrix Mg and Si content and an increase in Mg:Si ratio of the
precipitates, while retaining a relatively high number density of room
temperature Si-rich clusters and GP zones that remain durable during artificial
aging.
� During artificial aging without natural pre-aging: A high concentration of
solute and quenched-in vacancies leads to rapid formation of clusters and GP
zones → relatively small β″-needles at the start of the hardness plateau →
coarsening of β″-needles during the hardness plateau depleting the matrix
from Mg and Si, increasing the Mg:Si ratio of the precipitates, whilst retaining
only a few clusters and GP zones, which results in constant hardness and UTS,
but increasing YS.

190
Summary: SSS → solute clusters → solute clusters + GP-zones → solute clusters
+ GP-zones + β″needles.
A natural pre-aging treatment has a significant influence on the precipitation
kinetics during initial 1 h artificial aging of alloy F357. Natural pre-aging,
however, has no influence on the precipitation sequence, but it affects the relative
proportion of solute clusters, GP zones and β″-needles.
191
6. AGE HARDENING MODEL FOR Al-7Si-Mg ALLOYS
6.1. Age hardening models
Since the precipitation of strengthening phases is critical to the properties of age-
hardenable alloys, modelling of precipitation and strengthening has gained
considerable interest among researchers. Various age hardening models have been
developed, especially for wrought aluminium alloys [15,128-130]. In contrast to the
wrought aluminium alloys, little modelling work on the age-hardening of casting
aluminium alloys has been performed [82,131]. In the work of Rometsch and Schaffer
[82], the methodology used by Shercliff and Ashby [15] was applied to model aging
curves of Al-7Si-Mg alloys. In the work by Wu and Ferguson [131], the methodology
used by Kampmann and Wagner was applied [132]. Wu and Ferguson [131] also
summarised the modelling approaches of both Shercliff-Ashby and Kampmann-
Wagner. The Shercliff-Ashby process model draws together established knowledge of
the kinetics of microstructure evolution with dislocation behaviour in order to
determine the mechanical properties. In the Kampmann-Wagner model, a numerical
approach capable of describing the particle size distribution in the time domain, while
dealing with the nucleation-growth-coarsening phenomena within the same
formulation, is used. A strength model is then used to evaluate the resulting change in
hardness or yield strength.
For the purposes of this study, the Shercliff-Ashby process model approach was used,
firstly due to its relative simplicity compared to the Kampmann-Wagner approach and
secondly, to allow comparison with the work of Rometsh and Schaffer on alloys A356
and A357 [82], as well as comparison with the original work of Shercliff and Ashby
on alloy 6082 [15].
6.2. The Shercliff-Ashby model
Shercliff and Ashby [15] developed a process model to describe the changes in
hardness or yield strength due to age hardening of heat treatable alloys. The model
was successfully applied to the isothermal aging curves of wrought Al-alloys 6061
and 6082.
192
Included in the model are expressions for:
• the decrease in solute concentration and growth in volume fraction of precipitates
during the early stages of precipitation;
• the effect of aging temperature on the equilibrium volume fraction of precipitates;
• the coarsening of precipitates by LSW ripening;
• the strength contribution from solute atoms; and
• the strength contribution from both shearable and non-shearable precipitates.
Equations describing these events are kept as straightforward as possible by
combining unknown constants into physically or empirically meaningful parameters
and by using dimensionless variables where possible. Only the most necessary
variables to describe the microstructure and strengthening are incorporated. The
methodology is consistent across the sub-models and is calibrated using experimental
aging curves (i.e. making it a “mechanistic” model). Aging curves for hardness and
yield strength may be calibrated equally well as some of the constants have the
dimensions of yield strength and may take values in any appropriate units. As
described in section 4.12, it is fundamentally more correct to make a comparison
between hardness and UTS, rather than YS. However, in Fig. 4.63 it was shown that
the correlation between VHN and YS in the ranges found in these alloys is acceptable.
The total Vickers hardness (VHNt) of an Al-7Si-Mg alloy is given by equation 6.1
[15]:
VHN t =VHN o+ ∆∆∆∆VΗΝΗΝΗΝΗΝSi + ∆∆∆∆VHNFe +∆∆∆∆VHN ss,Si + ∆∆∆∆VHN ss,Mg + ∆∆∆∆VΗΝΗΝΗΝΗΝppt,Si + ∆∆∆∆VHN ppt,Mg−Si (6.1)
where VHNo is the hardness of pure aluminium, ∆VΗΝSi is the contribution to the
hardness due to eutectic Si particles, ∆VHNFe from the eutectic Fe-phase particles,
∆VHNss,Si from the Si in solid solution, ∆VHNss,Mg from the Mg in solid solution,
∆VΗΝppt,Si from the Si precipitates and ∆VHNppt,Mg−Si due to Mg–Si precipitates.
Equation 6.1 may be simplified because ∆VΗΝSi, ∆VHNFe and ∆VHNss,Si are
expected to remain reasonably unchanged during aging. Although ∆VHNss,Si may
fluctuate with aging time and temperature, these effects are expected to be negligible
193
since changes in the Si concentration from 0.5 to 1.2 wt.% in solid solution in a binary
Al–Si alloy are known to increase YS in the annealed condition by not more than 2–3
MPa [9,82]. For simplicity, it is also assumed that ∆VΗΝppt,Si is negligibly small,
particularly in relation to the large strengthening contribution due to Mg–Si type
precipitates. Accordingly, Eq. (6.1) may be simplified to:
VHN t =VHN i + ∆∆∆∆VHN ss,Mg + ∆∆∆∆VHN ppt,Mg−Si (6.2)
where VHNi is the intrinsic strength of the alloy, which may be defined as being the
sum of VHNo and those strengthening contributions which remain invariable during
aging. Potential differences in age hardening characteristics between primary α-Al
and the eutectic regions are assumed as being insignificant since the α-Al phase is
mostly homogenised during the solution treatment. This assumption is supported by
the aging curves in Fig. 4.72 which showed that both the hardness of the eutectic and
primary α-Al components increased during artificial aging.
When precipitates are small and coherent they are sheared by moving dislocations
(Fig. 2.25(a)). Their contribution to the strength of the alloy involves a convolution of
the resistance to shear of one particle, their population and the flexibility of the
dislocations with which they interact – known as the Friedel effect [15]. It is normally
accepted that the contribution to VHN by shearable precipitates (∆VHNs) is
approximately related to the precipitate volume fraction (f) and the precipitate radius
(r) through a constant c1:
∆∆∆∆VHN s =c1f 1/2r1/2 (6.3)
The spacing of precipitates increases during coarsening and there becomes a spacing
at which the stress required to bend a dislocation (so that it bows between
neighbouring particles in its slip plane, known as the Orowan mechanism) becomes
less than that required to shear through them (Fig. 2.25(b)). The contribution to VHN
due to the bypassing of dislocations around non-shearable precipitates (∆VHNb) is
approximately related to the precipitate volume fraction and the precipitate radius
through a constant c2:
194
∆∆∆∆VHNb =c2f ½/r (6.4)
Shercliff and Ashby [15] have shown that single-peak aging curves are satisfactorily
described by taking the harmonic mean of eqs. (6.3) and (6.4):
∆∆∆∆VHNppt,Mg−Si = [2S(P*)1/6]/[1+(P*)1/2] (6.5)
where S is the precipitate strength and P* = P/Pp. The term P is the “normalised
temperature-corrected time”, in s/K.
P = t/T exp (-QA/RT) (6.6)
where t is the aging time, T the aging temperature, QA the activation energy for
volume diffusion of atoms through the matrix and R the gas constant (8.314 J/mol K).
The parameter Pp is the value of P at the peak in the aging curve and is a constant for
a given set of aging conditions.
The assumption of a single-peak aging curve is an important consideration, because it
implies that only the contribution of β″-precipitation is considered. It has been shown
in section 4.14 that β″-needles are mostly responsible for peak aging, with solute
clusters and GP zones mainly occurring in the under-aged condition. Even though
βrods′ was not investigated in this study, it is known that these precipitates are found in
Al-7Si-Mg alloys in the over-aged condition (Fig. 2.30). By therefore only
considering β″-precipitation, the expectation is that peak aging will be predicted more
accurately than under- and over-aging.
The precipitate strength, S, as a function of aging time (t) and temperature (T) is
expressed as follows [82]:
(6.7)
195
where the strength parameter (So)max, the solvus enthalpy (Qs) and the metastable
solvus temperature (Ts) are determined from experimental aging data. The constant τ1
is related to the aging time corresponding to the peak tp by the constant K1:
ττττ1 1 1 1 = Κ= Κ= Κ= Κ1111 t (6.8)
The solid solution hardening component ∆∆∆∆VHN ss,Mg in Eq. (6.2) has been described to
vary with aging time as follows:
∆∆∆∆VHN ss,Mg = [(∆∆∆∆VHN ss0)3/2
+ [(∆∆∆∆VHN ssi)3/2
- (∆∆∆∆VHN ss0)3/2
]exp(-t/ττττ1]2/3 (6.9)
where the subscripts refer to initial ∆VHNssi and final ∆VHNss0 solid solution
strengthening contributions. The initial solid solution strengthening contribution is the
difference between the as-quenched hardness (VHNq) and the intrinsic hardness
(VHN i), whereas the final solid solution strengthening contribution is the difference
between the over-aged hardness (VHNoa) at that aging temperature and VHNi. VHNoa
may be determined from known values of VHNq and VHNi:
VHNoa = VHN i + (VHNq − VHNi) exp(−2Qs/3R)(1/T – 1/Ts) (6.10)
The contribution to the strength (or hardness) of all 3 sub-models in equation 6.2 is
shown schematically in Fig. 6.1 [15]. Note that the effective mechanism of
precipitation hardening is the one requiring the least shear stress, with a smooth
transition between the two.
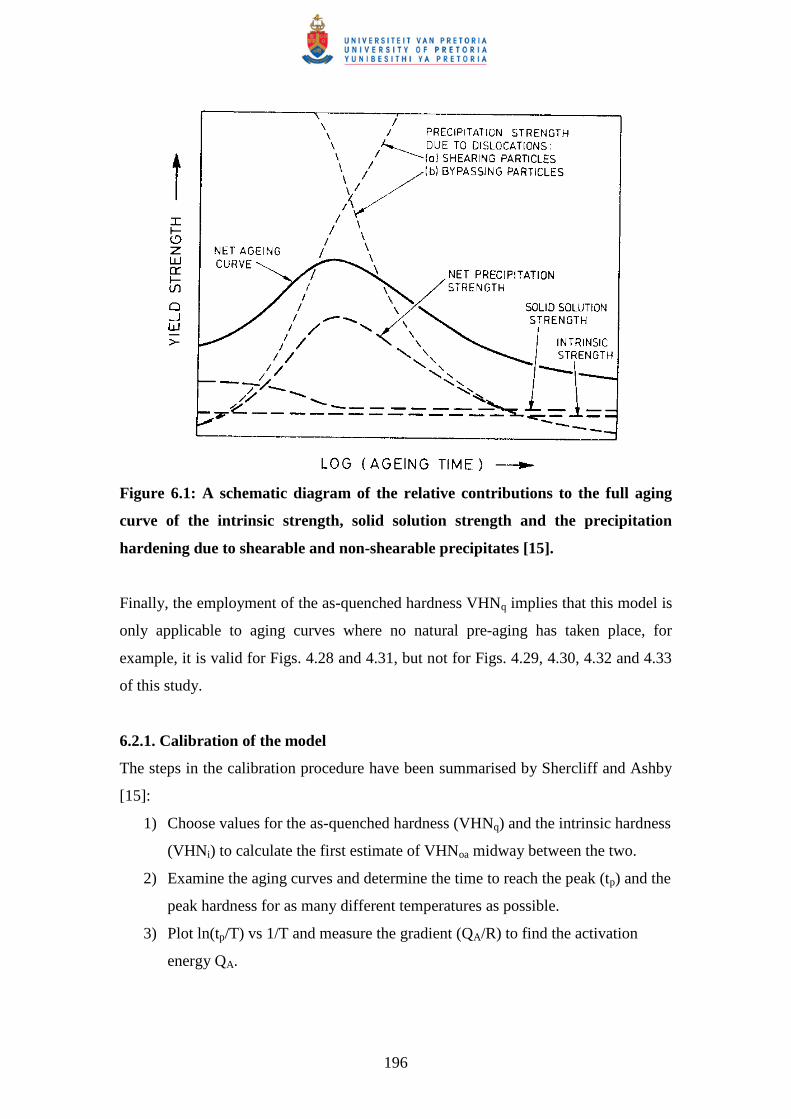
196
Figure 6.1: A schematic diagram of the relative contributions to the full aging
curve of the intrinsic strength, solid solution strength and the precipitation
hardening due to shearable and non-shearable precipitates [15].
Finally, the employment of the as-quenched hardness VHNq implies that this model is
only applicable to aging curves where no natural pre-aging has taken place, for
example, it is valid for Figs. 4.28 and 4.31, but not for Figs. 4.29, 4.30, 4.32 and 4.33
of this study.
6.2.1. Calibration of the model
The steps in the calibration procedure have been summarised by Shercliff and Ashby
[15]:
1) Choose values for the as-quenched hardness (VHNq) and the intrinsic hardness
(VHN i) to calculate the first estimate of VHNoa midway between the two.
2) Examine the aging curves and determine the time to reach the peak (tp) and the
peak hardness for as many different temperatures as possible.
3) Plot ln(tp/T) vs 1/T and measure the gradient (QA/R) to find the activation
energy QA.
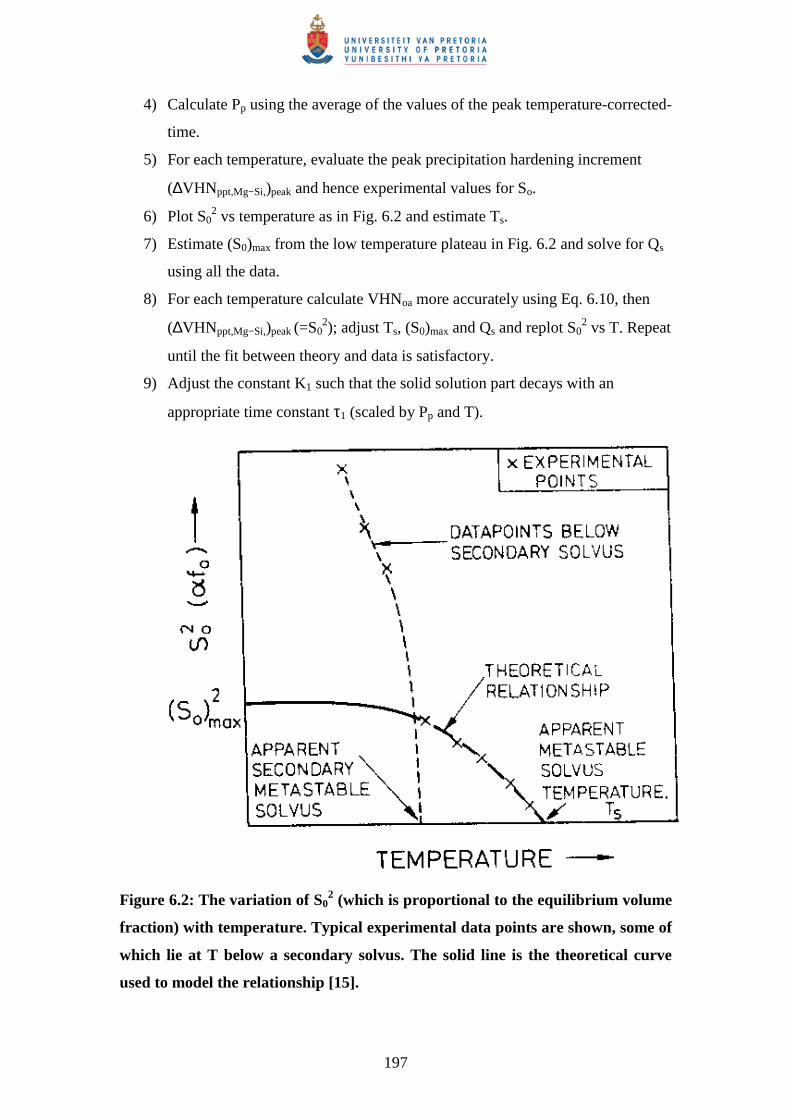
197
4) Calculate Pp using the average of the values of the peak temperature-corrected-
time.
5) For each temperature, evaluate the peak precipitation hardening increment
(∆VHNppt,Mg−Si,)peak and hence experimental values for So.
6) Plot S02 vs temperature as in Fig. 6.2 and estimate Ts.
7) Estimate (S0)max from the low temperature plateau in Fig. 6.2 and solve for Qs
using all the data.
8) For each temperature calculate VHNoa more accurately using Eq. 6.10, then
(∆VHNppt,Mg−Si,)peak (=S02); adjust Ts, (S0)max and Qs and replot S0
2 vs T. Repeat
until the fit between theory and data is satisfactory.
9) Adjust the constant K1 such that the solid solution part decays with an
appropriate time constant τ1 (scaled by Pp and T).
Figure 6.2: The variation of S02 (which is proportional to the equilibrium volume
fraction) with temperature. Typical experimental data points are shown, some of
which lie at T below a secondary solvus. The solid line is the theoretical curve
used to model the relationship [15].
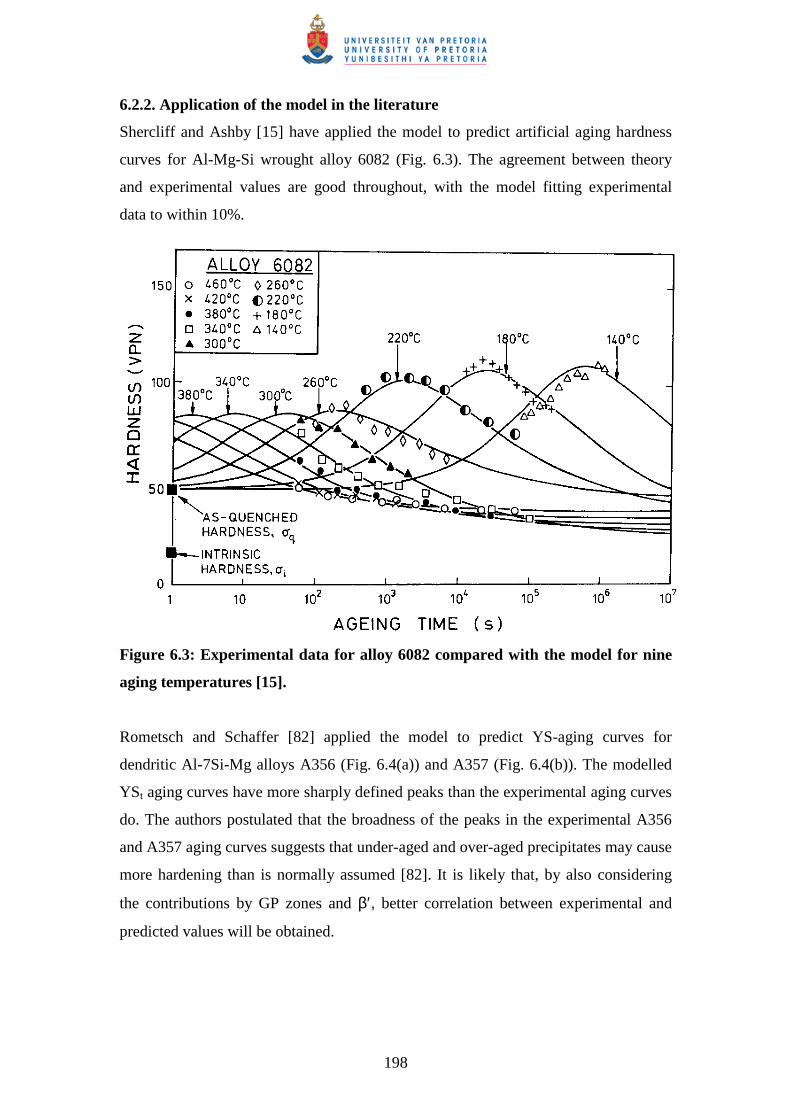
198
6.2.2. Application of the model in the literature
Shercliff and Ashby [15] have applied the model to predict artificial aging hardness
curves for Al-Mg-Si wrought alloy 6082 (Fig. 6.3). The agreement between theory
and experimental values are good throughout, with the model fitting experimental
data to within 10%.
Figure 6.3: Experimental data for alloy 6082 compared with the model for nine
aging temperatures [15].
Rometsch and Schaffer [82] applied the model to predict YS-aging curves for
dendritic Al-7Si-Mg alloys A356 (Fig. 6.4(a)) and A357 (Fig. 6.4(b)). The modelled
YSt aging curves have more sharply defined peaks than the experimental aging curves
do. The authors postulated that the broadness of the peaks in the experimental A356
and A357 aging curves suggests that under-aged and over-aged precipitates may cause
more hardening than is normally assumed [82]. It is likely that, by also considering
the contributions by GP zones and β′, better correlation between experimental and
predicted values will be obtained.
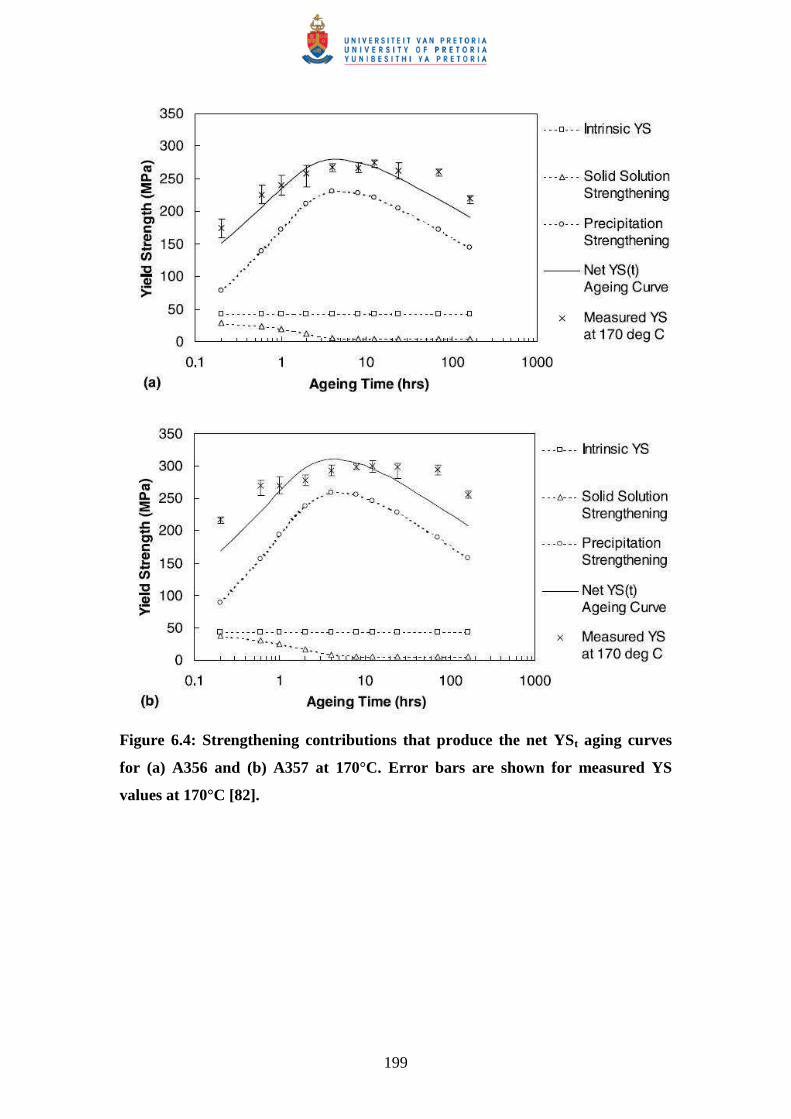
199
Figure 6.4: Strengthening contributions that produce the net YSt aging curves
for (a) A356 and (b) A357 at 170°C. Error bars are shown for measured YS
values at 170°C [82].
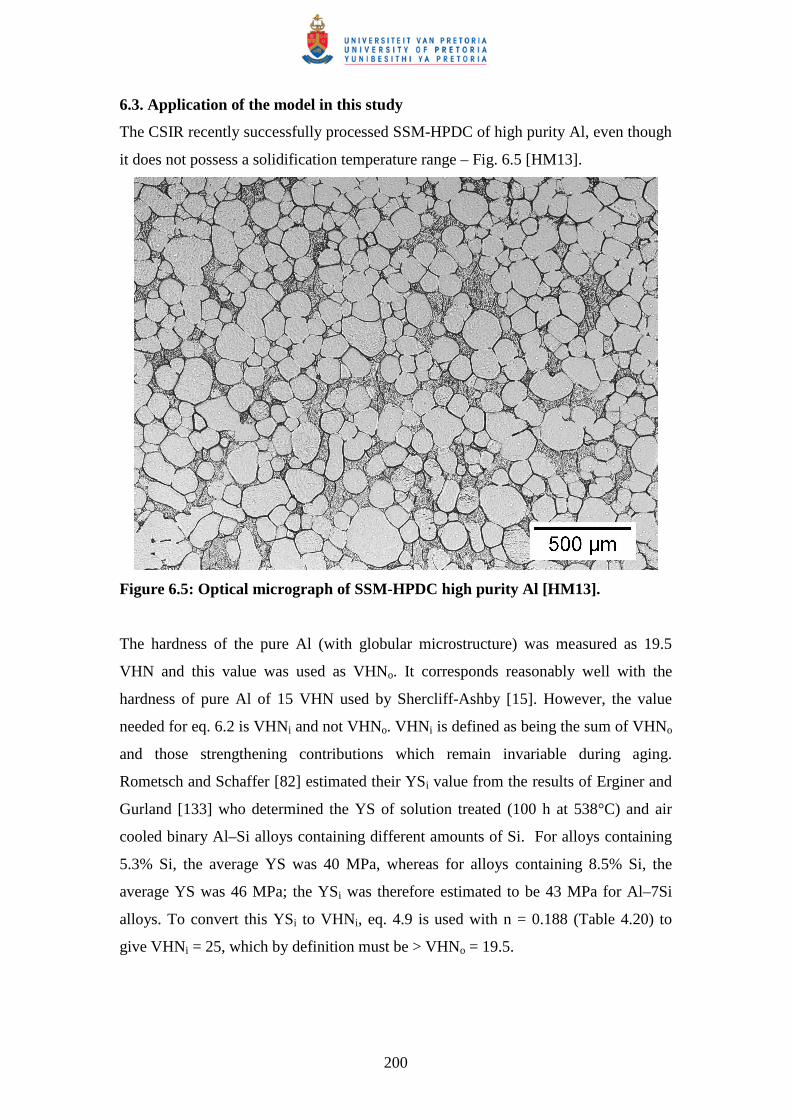
200
6.3. Application of the model in this study
The CSIR recently successfully processed SSM-HPDC of high purity Al, even though
it does not possess a solidification temperature range – Fig. 6.5 [HM13].
Figure 6.5: Optical micrograph of SSM-HPDC high purity Al [HM13].
The hardness of the pure Al (with globular microstructure) was measured as 19.5
VHN and this value was used as VHNo. It corresponds reasonably well with the
hardness of pure Al of 15 VHN used by Shercliff-Ashby [15]. However, the value
needed for eq. 6.2 is VHNi and not VHNo. VHNi is defined as being the sum of VHNo
and those strengthening contributions which remain invariable during aging.
Rometsch and Schaffer [82] estimated their YSi value from the results of Erginer and
Gurland [133] who determined the YS of solution treated (100 h at 538°C) and air
cooled binary Al–Si alloys containing different amounts of Si. For alloys containing
5.3% Si, the average YS was 40 MPa, whereas for alloys containing 8.5% Si, the
average YS was 46 MPa; the YSi was therefore estimated to be 43 MPa for Al–7Si
alloys. To convert this YSi to VHNi, eq. 4.9 is used with n = 0.188 (Table 4.20) to
give VHNi = 25, which by definition must be > VHNo = 19.5.
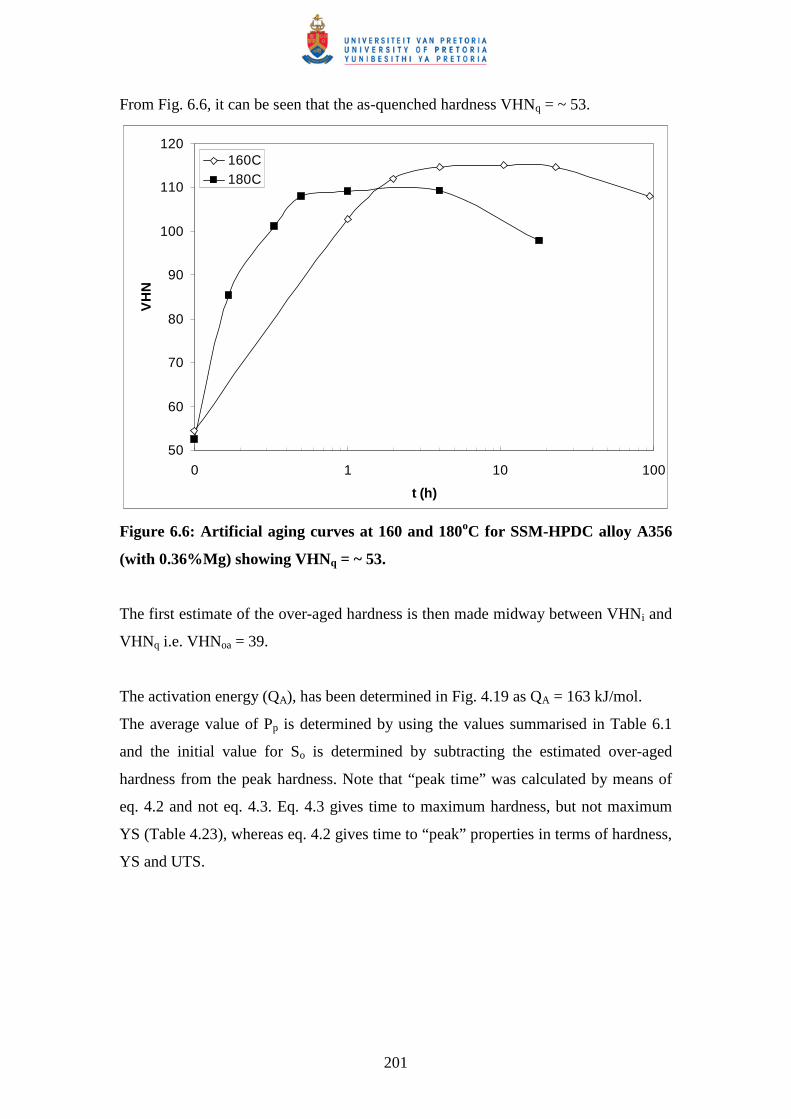
201
From Fig. 6.6, it can be seen that the as-quenched hardness VHNq = ~ 53.
50
60
70
80
90
100
110
120
0 1 10 100
t (h)
VH
N160C180C
Figure 6.6: Artificial aging curves at 160 and 180oC for SSM-HPDC alloy A356
(with 0.36%Mg) showing VHNq = ~ 53.
The first estimate of the over-aged hardness is then made midway between VHNi and
VHNq i.e. VHNoa = 39.
The activation energy (QA), has been determined in Fig. 4.19 as QA = 163 kJ/mol.
The average value of Pp is determined by using the values summarised in Table 6.1
and the initial value for So is determined by subtracting the estimated over-aged
hardness from the peak hardness. Note that “peak time” was calculated by means of
eq. 4.2 and not eq. 4.3. Eq. 4.3 gives time to maximum hardness, but not maximum
YS (Table 4.23), whereas eq. 4.2 gives time to “peak” properties in terms of hardness,
YS and UTS.
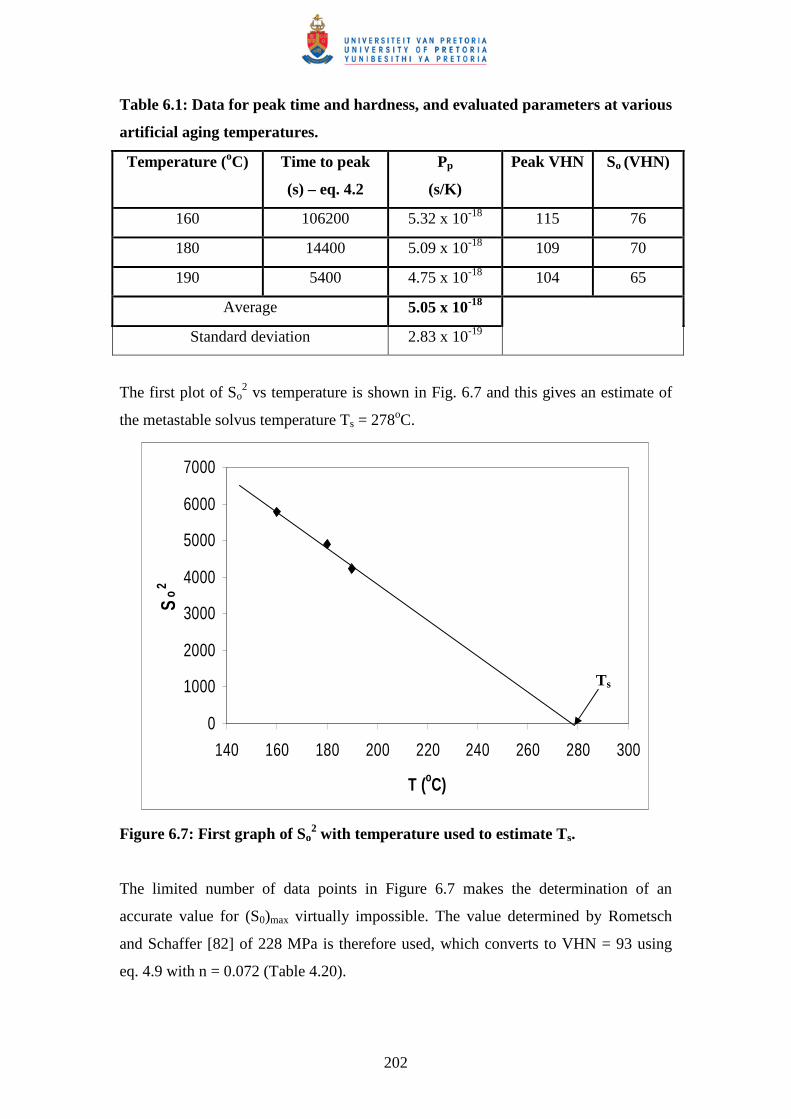
202
Table 6.1: Data for peak time and hardness, and evaluated parameters at various
artificial aging temperatures.
Temperature (oC) Time to peak
(s) – eq. 4.2
Pp
(s/K)
Peak VHN So (VHN)
160 106200 5.32 x 10⁻¹⁸ 115 76
180 14400 5.09 x 10⁻¹⁸ 109 70
190 5400 4.75 x 10⁻¹⁸ 104 65
Average 5.05 x 10⁻¹⁸
Standard deviation 2.83 x 10⁻¹⁹
The first plot of So2 vs temperature is shown in Fig. 6.7 and this gives an estimate of
the metastable solvus temperature Ts = 278oC.
0
1000
2000
3000
4000
5000
6000
7000
140 160 180 200 220 240 260 280 300
T (oC)
So
2
Figure 6.7: First graph of So2 with temperature used to estimate Ts.
The limited number of data points in Figure 6.7 makes the determination of an
accurate value for (S0)max virtually impossible. The value determined by Rometsch
and Schaffer [82] of 228 MPa is therefore used, which converts to VHN = 93 using
eq. 4.9 with n = 0.072 (Table 4.20).
Ts
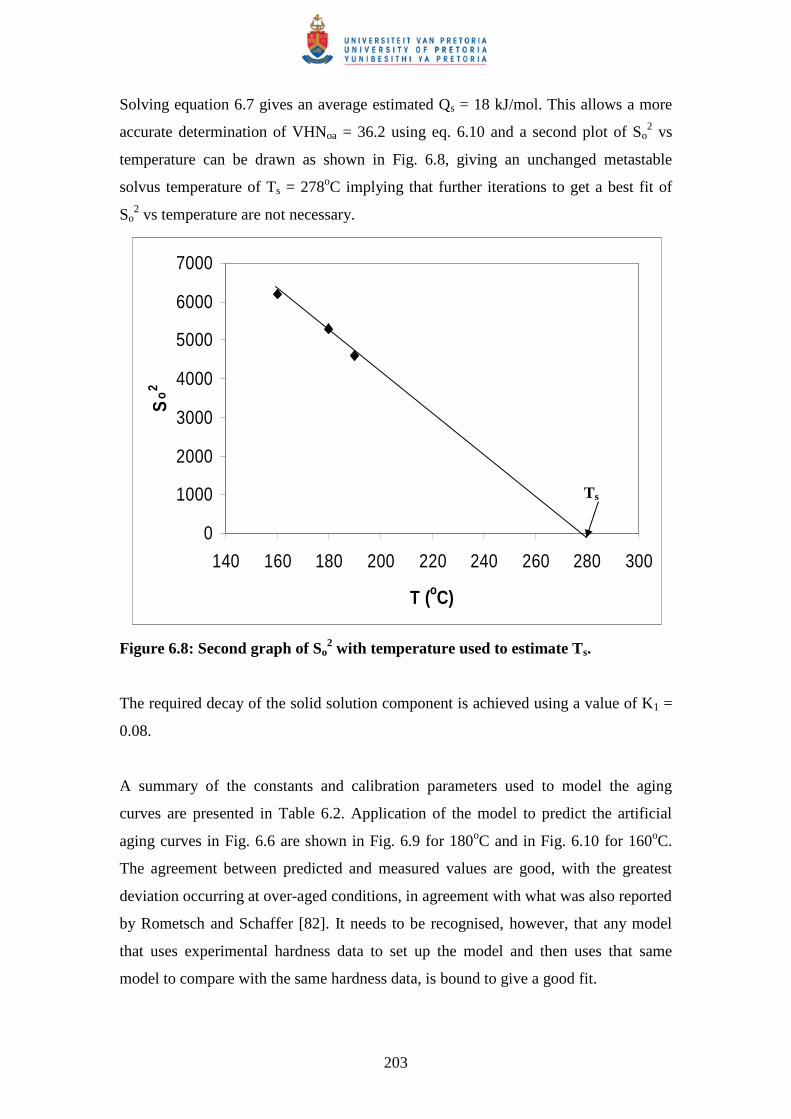
203
Solving equation 6.7 gives an average estimated Qs = 18 kJ/mol. This allows a more
accurate determination of VHNoa = 36.2 using eq. 6.10 and a second plot of So2 vs
temperature can be drawn as shown in Fig. 6.8, giving an unchanged metastable
solvus temperature of Ts = 278oC implying that further iterations to get a best fit of
So2 vs temperature are not necessary.
0
1000
2000
3000
4000
5000
6000
7000
140 160 180 200 220 240 260 280 300
T (oC)
So
2
Figure 6.8: Second graph of So2 with temperature used to estimate Ts.
The required decay of the solid solution component is achieved using a value of K1 =
0.08.
A summary of the constants and calibration parameters used to model the aging
curves are presented in Table 6.2. Application of the model to predict the artificial
aging curves in Fig. 6.6 are shown in Fig. 6.9 for 180oC and in Fig. 6.10 for 160oC.
The agreement between predicted and measured values are good, with the greatest
deviation occurring at over-aged conditions, in agreement with what was also reported
by Rometsch and Schaffer [82]. It needs to be recognised, however, that any model
that uses experimental hardness data to set up the model and then uses that same
model to compare with the same hardness data, is bound to give a good fit.
Ts
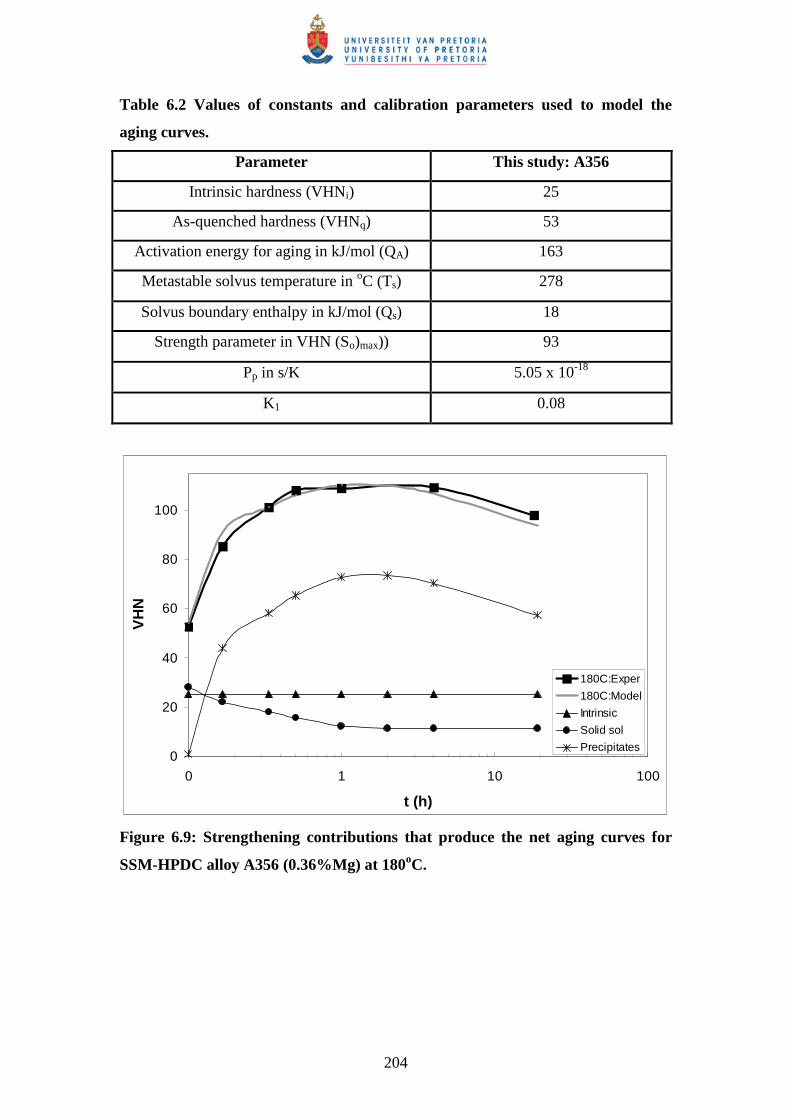
204
Table 6.2 Values of constants and calibration parameters used to model the
aging curves.
Parameter This study: A356
Intrinsic hardness (VHNi) 25
As-quenched hardness (VHNq) 53
Activation energy for aging in kJ/mol (QA) 163
Metastable solvus temperature in oC (Ts) 278
Solvus boundary enthalpy in kJ/mol (Qs) 18
Strength parameter in VHN (So)max)) 93
Pp in s/K 5.05 x 10⁻¹⁸
K1 0.08
0
20
40
60
80
100
0 1 10 100
t (h)
VH
N
180C:Exper
180C:Model
Intrinsic
Solid sol
Precipitates
Figure 6.9: Strengthening contributions that produce the net aging curves for
SSM-HPDC alloy A356 (0.36%Mg) at 180oC.
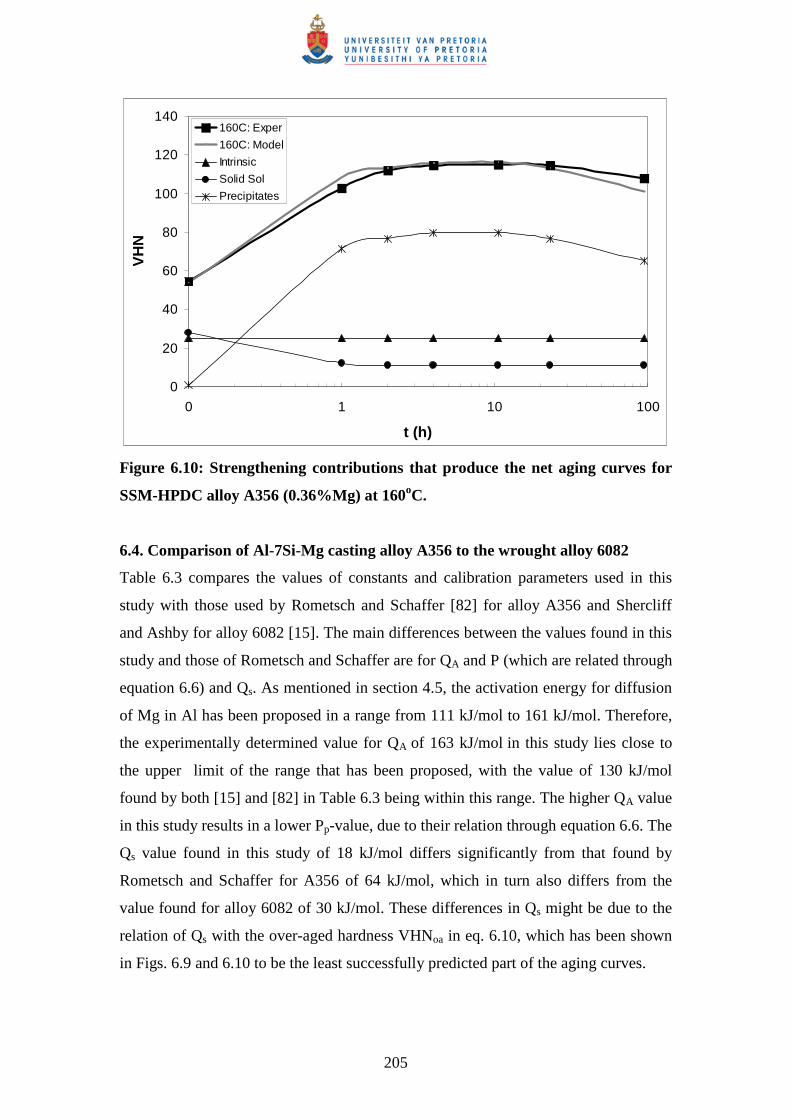
205
0
20
40
60
80
100
120
140
0 1 10 100
t (h)
VH
N160C: Exper
160C: Model
Intrinsic
Solid Sol
Precipitates
Figure 6.10: Strengthening contributions that produce the net aging curves for
SSM-HPDC alloy A356 (0.36%Mg) at 160oC.
6.4. Comparison of Al-7Si-Mg casting alloy A356 to the wrought alloy 6082
Table 6.3 compares the values of constants and calibration parameters used in this
study with those used by Rometsch and Schaffer [82] for alloy A356 and Shercliff
and Ashby for alloy 6082 [15]. The main differences between the values found in this
study and those of Rometsch and Schaffer are for QA and P (which are related through
equation 6.6) and Qs. As mentioned in section 4.5, the activation energy for diffusion
of Mg in Al has been proposed in a range from 111 kJ/mol to 161 kJ/mol. Therefore,
the experimentally determined value for QA of 163 kJ/mol in this study lies close to
the upper limit of the range that has been proposed, with the value of 130 kJ/mol
found by both [15] and [82] in Table 6.3 being within this range. The higher QA value
in this study results in a lower Pp-value, due to their relation through equation 6.6. The
Qs value found in this study of 18 kJ/mol differs significantly from that found by
Rometsch and Schaffer for A356 of 64 kJ/mol, which in turn also differs from the
value found for alloy 6082 of 30 kJ/mol. These differences in Qs might be due to the
relation of Qs with the over-aged hardness VHNoa in eq. 6.10, which has been shown
in Figs. 6.9 and 6.10 to be the least successfully predicted part of the aging curves.
206
Table 6.3 Comparison of values of constants and calibration parameters used to
model the aging curves in this study with references [15] and [82].
Parameter This study:
A356
Rometsch-
Schaffer:
A356 [82]
Shercliff-
Ashby:
6082 [15]
Activation energy for aging in kJ/mol (QA) 163 130 130
Metastable solvus temperature in oC (Ts) 278 271 282
Solvus boundary enthalpy in kJ/mol (Qs) 18 64 30
Strength parameter in VHN (So)max)) 93 93 94
Pp in s/K 5.05 x 10⁻¹⁸ 3.71 x 10⁻¹⁴ 5.50 x 10⁻¹⁴
K1 0.08 0.11 0.50
The solvus temperatures found in Table 6.3 ranges from 271-282oC, which
corresponds well with the peak for β″-precipitation in the DSC curve shown in Fig.
2.33. In addition, Rometsch and Schaffer [134] have also shown by means of DSC
that the β″ solvus occurs at about 270-280oC. The strength parameter (So)max of 93
VHN was derived from the values found by Rometsch and Schaffer [82] and also
corresponds well with the value of 94 VHN found for alloy 6082 in Table 6.3. This
would suggest that similar precipitation strengthening occurs in alloys A356 and
6082. The constant K1, which relates τ1 to tp through eq. 6.8, is similar for this study
and the A356 of Rometsch and Schaffer (~0.1), but significantly lower than the 0.5
for alloy 6082. The decay of the solid solution component therefore occurs faster in
alloy A356 than in alloy 6082, a conclusion that is supported by the artificial aging
curves presented in Fig. 4.70. As discussed in section 5.7, the excess Si in the casting
alloys in this study is believed to reduce the time to initiate strengthening, presumably
due to a higher driving force for nucleation which will lead to a finer particle size and
shorter diffusion distances.
6.5. Modelling of artificial aging curves of SSM-HPDC Al-7Si-Mg alloys with
varying Mg-contents
The parameters derived in Table 6.2 for the artificial aging curves of Figs. 6.9 and
6.10 are only applicable for a single composition – in this case the 0.36wt% Mg alloy
in Table 3.1. Theoretically, to model the aging curves of the other compositions listed
207
in Table 3.1, new parameters must be derived by determining artificial aging curves at
as many temperatures as possible. This would be a very time consuming process and a
simple, but accurate method to convert the aging curves of one composition to that of
another composition would be beneficial.
From Fig. 4.62 it is seen that the peak hardness of Al-7Si-Mg alloys is linearly related
to the (at% Mg-concentration available for precipitation hardening)1/2. In addition,
from Figs. 4.28 to 4.33 it can be seen that the shape of the aging curve is not
influenced by the Mg-content of the alloy and the curve is shifted either upwards or
downwards depending on the Mg-content. Therefore, using the 0.36wt% Mg alloy as
a reference alloy, artificial aging curves of other alloys can be predicted using the
following procedure by employing the 0.49wt% Mg alloy (Fig. 4.72) as example:
• Calculate the wt% Mg available for precipitation hardening by employing
either eq. 4.4 or 4.5. For the 0.49wt% Mg alloy, eq. 4.5 must be used and the
wt% Mg available for strengthening is then 0.44wt% (also ensure that the Fe-
content of the alloy is ~0.1%, otherwise eq. 4.5 becomes invalid).
• Convert the wt% Mg to at% Mg. For the specific alloy in question, the at%
Mg available for strengthening is calculated as 0.49at%.
• Estimate the peak hardness at 180oC of this alloy by using the equation of the
trend line in Fig. 4.62 (after converting the at% to at%1/2). For the alloy in
question the estimated peak hardness is 119 VHN.
• The peak hardness of the reference alloy at 180oC is 109 (Fig. 6.6). Take the
ratio of the peak hardness of the alloy in question to the peak hardness of the
reference alloy giving 1.092.
• Keep the intrinsic hardness value VHNi unchanged at 25, but scale the
contribution of solid solution strengthening and precipitation hardening with
the ratio of 1.092. The actual and predicted aging curves for the 0.49wt% Mg
alloy are compared in Fig. 6.11.
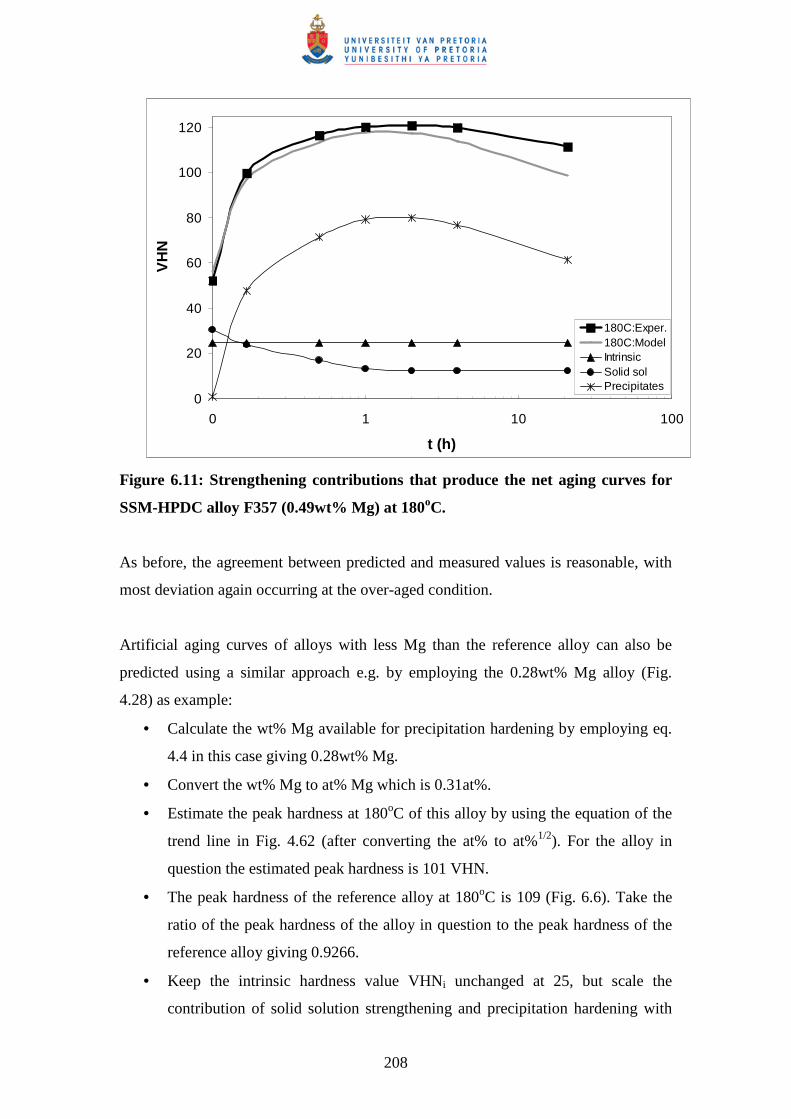
208
0
20
40
60
80
100
120
0 1 10 100
t (h)
VH
N
180C:Exper.180C:ModelIntrinsicSolid solPrecipitates
Figure 6.11: Strengthening contributions that produce the net aging curves for
SSM-HPDC alloy F357 (0.49wt% Mg) at 180oC.
As before, the agreement between predicted and measured values is reasonable, with
most deviation again occurring at the over-aged condition.
Artificial aging curves of alloys with less Mg than the reference alloy can also be
predicted using a similar approach e.g. by employing the 0.28wt% Mg alloy (Fig.
4.28) as example:
• Calculate the wt% Mg available for precipitation hardening by employing eq.
4.4 in this case giving 0.28wt% Mg.
• Convert the wt% Mg to at% Mg which is 0.31at%.
• Estimate the peak hardness at 180oC of this alloy by using the equation of the
trend line in Fig. 4.62 (after converting the at% to at%1/2). For the alloy in
question the estimated peak hardness is 101 VHN.
• The peak hardness of the reference alloy at 180oC is 109 (Fig. 6.6). Take the
ratio of the peak hardness of the alloy in question to the peak hardness of the
reference alloy giving 0.9266.
• Keep the intrinsic hardness value VHNi unchanged at 25, but scale the
contribution of solid solution strengthening and precipitation hardening with
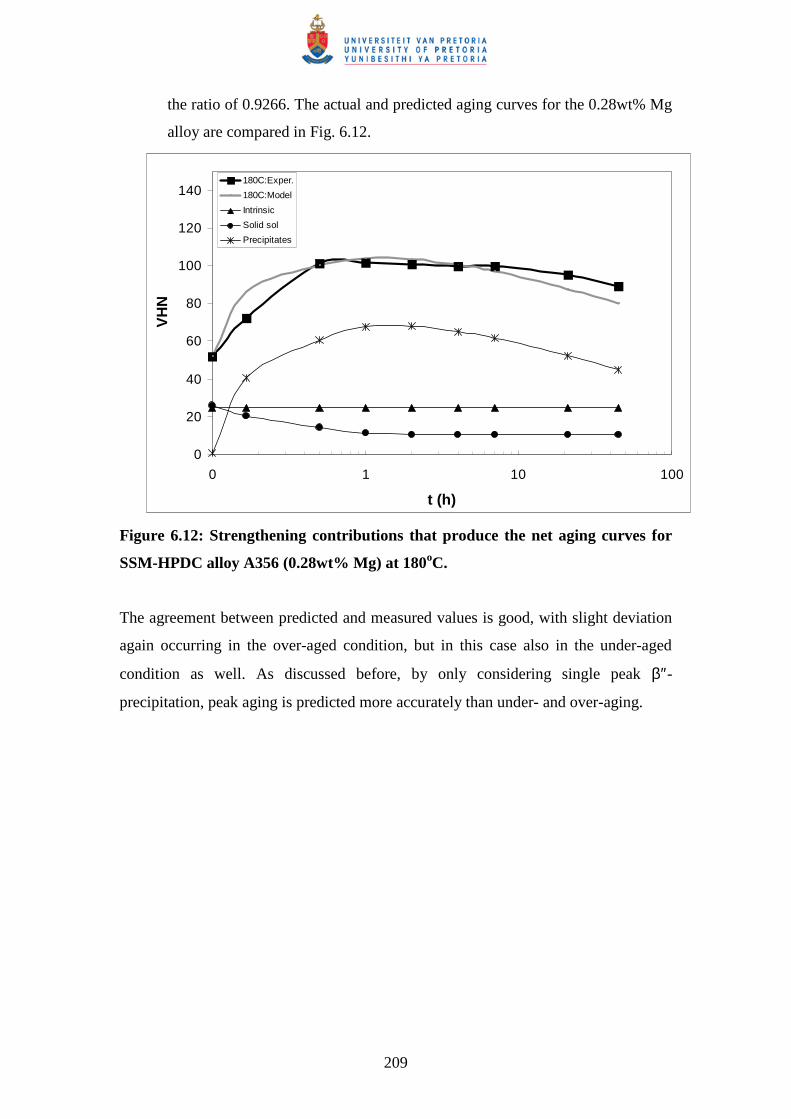
209
the ratio of 0.9266. The actual and predicted aging curves for the 0.28wt% Mg
alloy are compared in Fig. 6.12.
0
20
40
60
80
100
120
140
0 1 10 100
t (h)
VH
N180C:Exper.
180C:Model
Intrinsic
Solid sol
Precipitates
Figure 6.12: Strengthening contributions that produce the net aging curves for
SSM-HPDC alloy A356 (0.28wt% Mg) at 180oC.
The agreement between predicted and measured values is good, with slight deviation
again occurring in the over-aged condition, but in this case also in the under-aged
condition as well. As discussed before, by only considering single peak β″-
precipitation, peak aging is predicted more accurately than under- and over-aging.
210
7. CONCLUSIONS
7.1. SSM-HPDC
• Rheoprocessing of Al-7Si-Mg alloys with the CSIR rheocasting system results in
a globular microstructure with primary α-Al globule diameters of 60-70 µm.
• High cooling rates of ~ 18oC/s are achieved during the initial stages of the HPDC
step, resulting in predicted solidification being completed within 5.5s in the plate
castings.
• The eutectic component in these alloys is modified by the high cooling rates
achieved during HPDC, with levels of Sr as low as 14 ppm being sufficient, as
opposed to about 200 ppm Sr necessary for conventional casting techniques such
as permanent mould casting and investment casting.
7.2. Solution heat treatment
• The solution treatment of Al-7Si-Mg alloys has a dual beneficial effect – it causes
spheroidisation of the eutectic silicon particles (improved ductility and impact
properties) and it causes complete dissolution of the strengthening solutes
(maximum strength after artificial aging).
• Spheroidisation of the eutectic Si particles occurs rapidly at 540oC, with their
coarsening being described reasonably well by means of LSW-coarsening.
• The high cooling rates achieved during HPDC result in a high concentration of
solute being retained in solid solution after casting. A solution treatment time at
540oC for only 1 h is therefore sufficient to obtain a high level of mechanical
properties in the T4 and T6 temper conditions.
• The impact strength of the alloys in the T4 and T6 temper conditions is not
influenced significantly by the solution treatment time (and hence the Si-
interparticle spacing), but rather by the strength of the alloy.
7.3. Quench after solution treatment
• Slow quench rates after the solution heat treatment can reduce the problems of
distortion and residual stresses, but also result in a loss of strength and hardness
after natural- and artificial aging.
211
7.4. Natural aging and the T4 temper condition
• Al-7Si-Mg alloys are relatively soft directly after quenching (VHN = ~ 53), but
thereafter, the hardness increases rapidly at room temperature, eventually levelling
out after 4-5 days at 70-95 VHN, depending on the Mg-content of the alloy.
• Natural aging of Al-7Si-Mg alloys result in the formation of a high number
density of vacancy- and Si-rich Si-Mg clusters with a significantly lower number
density of GP zones and no β″-needles.
• The solute clusters are fully coherent with the matrix and they have a low Mg:Si
ratio of ~ 0.6-0.7.
7.5. Artificial aging and the T5 temper condition
• The relatively fast cooling rates achieved with HPDC result in an adequate
quantity of solutes remaining in solid solution after casting, which allows a
reasonable response to age hardening in the T5 temper condition.
• No spheroidisation of the eutectic Si occurs in the T5 condition due to the lack of
a solution treatment step, causing relatively low elongation and impact strength.
7.6. Artificial aging and the T6 temper condition
• Artificial aging at lower temperatures (e.g. 160oC) produces slightly higher peak
hardnesses compared to artificial aging at higher temperatures (e.g. 180oC), but
the time-to-peak hardness is significantly increased.
• The time required to obtain maximum hardness at different artificial aging
temperatures can be predicted using Arrhenius-type equations.
• When no natural pre-aging occurs, a hardness plateau is maintained once the
maximum hardness is reached during artificial aging at 180oC after about 1 to 5
hours. This differs from when natural pre-aging occurs when a hardness peak is
observed after approximately 4 hours.
• The effects of any natural aging can largely be removed by an artificial aging
treatment of 180oC for 4 hours.
7.6.1. Artificial aging without natural pre-aging
• A high concentration of solute and quenched-in vacancies leads to rapid formation
of clusters and GP zones → transformation to relatively small β″-needles at the
212
start of the hardness plateau → coarsening of β″-needles during the hardness
plateau. This depletes the matrix from Mg and Si, while increasing the Mg:Si ratio
of the precipitates, whilst retaining only a few clusters and GP zones. This results
in constant hardness and UTS, but increasing YS.
7.6.2. Artificial aging with natural pre-aging
• Coarsening of the room temperature clusters → spherical GP zones → β″-needles,
coinciding with a decrease of the matrix Mg and Si content and an increase in
Mg:Si ratio of the precipitates, while retaining a relatively high number density of
room temperature Si-rich clusters and GP zones that remain durable during
artificial aging.
7.6.3. Characteristics of precipitates found in Al-7Si-Mg alloys
• Solute clusters
The Si-rich room temperature clusters are durable at artificial aging temperatures
of 180oC, even at a time of 4 h that corresponds to the peak aged condition.
• GP zones
The GP zones are approximately 2 nm in diameter and are fully coherent with the
matrix. The Mg:Si ratio of GP zones of 0.8-1.1 is higher than those of the solute
clusters, which indicates that Mg-diffusion is rate limiting during precipitation.
• ββββ″″″″-needles
The β″-needles range in size from ~ 2 nm diameter x 10 nm length early during
artificial aging to ~ 4 nm diameter x 25 nm in the peak aged condition. The β″-
needles have the highest Mg:Si ratio of all the precipitates due to the precipitation
process being controlled by Mg-diffusion with the needles with > 1200 solute
atoms having a Mg:Si ratio of ~ 1.0 – 1.2.
7.7. Influence of chemical composition fluctuations
• The strength and macrohardness values of Al-7Si-Mg alloys show good linear
relationships to (at% Mg-concentration available for precipitation hardening)1/2.
• Higher Mg-levels (> 0.4wt%) in Al-7Si-Mg alloys increase the stability range of
the Mg-containing π−phase to higher temperatures, and suppress the Mg-free
β−FeSiAl5 phase at high temperatures.
213
• The stability of the π-phase in alloy F357 causes a reduction in the amount of
magnesium in solid solution. This has a detrimental effect on the aging behaviour
of this alloy compared to alloy A356.
• High Fe-levels above specification (> 0.20%) in alloy F357 result in the formation
of high volume fractions of intermetallics such as π-Al 8FeMg3Si6 and β-Al 5FeSi.
Micro-cracking of these intermetallics during tensile testing causes a marked
reduction in ductility.
7.8. Comparison of the aging response of globular and dendritic Al-7Si-Mg alloys
• The natural aging (T4) and artificial aging (T6) responses of Al-7Si-Mg alloys are
not influenced by having a globular or dendritic microstructure.
• Provided that the maximum quantity of the alloy’s Mg is placed into solid solution
during solution treatment, and that the alloy’s Fe content is within specification,
the response to age hardening of Al-7Si-Mg alloys should be independent of the
processing technique used.
• The frequently specified artificial aging parameters of 160oC for 3-6 h or 170oC
for 6 h for both dendritic and globular Al-7Si-Mg alloys will result in large
variations in properties depending on the natural pre-aging period. Parameters of
180oC for 4 h are proposed as an alternative to overcome this shortcoming.
7.9. Comparison of the aging response of Al-7Si-Mg alloys with 6000 series
wrought alloys
• Conventional casting alloys A356 and F357 obtain the same level of strength
(hardness) in the T6 temper regardless of the prior natural aging period employed
over a relatively wide range of Mg compositions. Alloy 6082 (with relatively high
Si and Mg contents for a 6000 series alloy) displays a much reduced strength and
hardness in the T6 condition following natural aging. Alloy 6004 (with relatively
low Mg and Si) displays the opposite behaviour.
• The high Si content of the conventional casting alloys compared to the 6000
wrought series alloys results in a faster artificial aging response (shorter T6 aging
cycles), higher strength for comparable Mg contents and less sensitivity to prior
natural aging on peak strength. However, over-aging occurs earlier in the casting
alloys than for the wrought alloys.
214
7.10. Age hardening model for Al-7Si-Mg alloys
• The Shercliff-Ashby methodology was followed to successfully predict artificial
aging curves (with no natural pre-aging) of Al-7Si-Mg alloys.
• A method to allow prediction of artificial aging curves with Mg-contents different
from that of the reference alloy has been proposed.
215
8. RECOMMENDATIONS
Based on the results of this study, the following recommendations for future research
are made:
8.1. SSM-HPDC
• The surface liquid segregation (SLS) layer found in castings produced by means
of SSM-HPDC has been noted during this study. The effects of this SLS layer on
mechanical properties, but especially surface-sensitive properties such as fatigue
and corrosion, need to be investigated.
8.2. Solution heat treatment
• Even though the impact strength of the alloys in the T4 and T6 temper conditions
is not influenced significantly by the solution treatment time, the effects on other
properties such as fatigue, creep and corrosion (which also includes stress
corrosion cracking and corrosion fatigue), must be characterised.
8.3. Quench after solution treatment
• More data points at lower cooling rates during quenching of SSM-HPDC Al-7Si-
Mg alloys after solution heat treatment would be beneficial, as well as
quantification of distortion and the development of residual stresses.
8.4. Artificial aging and the T5 temper condition
• The relatively fast cooling rates achieved with HPDC has not been utilised to the
full for the T5 temper condition in this study due to too long intensification times
being employed during HPDC. Optimisation of intensification parameters and
subsequent quenching should result in a more improved response to age hardening
in the T5 temper condition.
• APT was done only on samples in the T4 and T6 temper conditions in this study.
APT analyses of samples in the T5 temper condition (i.e. air cooled or water
quenched after HPDC, with or without natural pre-aging and artificially aged at
different temperatures and times) would reveal the influence of different levels of
supersaturation on the nanostructural evolution during aging.
216
8.5. Artificial aging and the T6 temper condition
• APT was done only on samples artificially aged at 180oC for times up to 4 h in
this study. APT analyses revealing the transformation of βneedles″ to βrods′ to βplates
in over-aged samples (t > 4 h at 180oC) would be beneficial.
• APT analyses of samples artificially aged at lower and higher temperatures than
180oC would quantify how the differences in solubility and hence supersaturation
would lead to different nucleation rates and volume fractions of strengthening
phases.
8.6. Influence of chemical composition fluctuations
• The strength and macrohardness values of Al-7Si-Mg alloys show good linear
relationships to (at% Mg-concentration available for precipitation hardening)1/2.
The APT analysis in this study was only performed for a single Al-7Si-Mg alloy.
APT analyses on alloys with varying Mg-contents (but constant Fe-contents)
should quantitatively reveal the origin of this linear relation.
8.7. Age hardening model for Al-7Si-Mg alloys
• The Shercliff-Ashby methodology can be improved by not only considering the
βneedles″ (peak aging), but also considering the effects of solute clusters and GP
zones (under-aging) and βrods′ and βplates (over-aging).
218
10. REFERENCES
1. Metals Handbook Volume 15: Casting, Metals Park, Ohio, ASM International,
1988.
2. Spencer DB, Mehrabian R, Flemings MC. Metallurgical Transactions, vol. 3,
1972, pp. 1925-1932.
3. Wilm A. Metallurgie, vol. 8, 1911, pp. 225-227.
4. Guinier A. Nature, vol. 142, 1938, pp. 569-570.
5. Preston GD. Nature, vol. 142, 1938, p. 570.
6. Ogris E. Development of Al-Si-Mg Alloys for Semi-Solid Processing and Silicon
Spheroidization Treatment (SST) for Al-Si Cast Alloys. Doctoral dissertation,
Swiss Federal Institute of Technology, 2002.
7. Pacz A. U.S. patent 1387900, 1921.
8. Archer RS, Jeffries Z. Transactions of AIME, vol. 71, 1925, p. 828.
9. Polmear I. Light alloys: from traditional alloys to nanocrystals. 4th ed. Oxford:
Butterworth-Heinemann; 2006.
10. Liu D, Atkinson HV, Kapranos P, Jirattiticharoean W, Jones H. Materials Science
and Engineering A, vol. 361, 2003, pp. 213-224.
11. Rinderer B, Couper M, Xiong X, Gao S, Nie J-F. Materials Science Forum, vols.
654-656, 2010, pp. 590-595.
12. Dewhirst BA. Optimization of the heat treatment of semi solid processed A356
aluminum alloy. Masters Thesis, Worcester Polytechnic Institute, 2005.
13. Birol Y. International Journal of Materials Research, vol. 101, 2010, pp. 439-
444.
14. Birol Y. Journal of Alloys and Compounds, vol. 484, 2009, pp. 164-167.
15. Shercliff HR, Ashby MF. Acta Metallurgica et Materialia, vol. 38, 1990, pp.
1789-1802.
16. Atkinson HV. Progress in Materials Science, vol. 50, 2005. pp. 341-412.
17. Proc. 1st Int. Conf. on Semi-Solid Processing of Alloys and Composites, Ecole
Nationale Superieure des Mines de Paris, Societe Francaise de Metallurgie,
Cemef, Sophia-Antipolis, France, 1990.
18. Brown SB, Flemings MC, editors. In: Proc. 2nd Int. Conf. on Semi-Solid
Processing of Alloys and Composites, Cambridge, MA, USA, June 1992.
Warrendale: TMS; 1992.
219
19. Kiuchi M, editor. In: Proc. 3rd Int. Conf. on Semi-Solid Processing of Alloys and
Composites Tokyo, Japan, June 1994. Tokyo Institute of Industrial Science, 1994.
20. Kirkwood DH, Kapranos P, editors. In: Proc. 4th Int. Conf. on Semi-Solid
Processing of Alloys and Composites, Sheffield, UK, June 1996, University of
Sheffield, 1996.
21. Bhasin AK, Moore JJ, Young KP, Midson S, editors. In: Proc. 5th Int. Conf. on
Semi-Solid Processing of Alloys and Composites, Golden, Colorado, USA, June
1998. Golden, CO: Colorado, School of Mines, USA; 1998.
22. Chiarmetta GL, Rosso M, editors. In: Proc. 6th Int. Conf. on Semi-Solid
Processing of Alloys and Composites, Turin, Italy, Sept 2000, Brescia. Italy:
Edimet Spa; 2000.
23. Tsutsui Y, Kiuchi M, Ichikawa K, editors. In: Proc. 7th Int. Conf. on Advanced
Semi-Solid Processing of Alloys and Composites, Tsukuba, Japan, Sept 2002.
Japan: National Institute of Advanced Industrial Science and Technology and the
Japan Society for Technology of Plasticity; 2002.
24. Proc. 8th Int. Conf. on Semi-Solid Processing of Alloys and Composites,
Limassol, Cyprus, September 2004.
25. Kang CG, Kim SK. Lee SY, editors. In: Proc. 9th Int. Conf. on Semi-Solid
Processing of Alloys and Composites, Busan, Korea, September 2006, Pusan
National University, Trans Tech Publications; 2006.
26. Hirt G, Rassili A, Buhrig-Polaczek A, editors. In: Proc. 10th Int. Conf. on Semi-
Solid Processing of Alloys and Composites, Aachen, Germany and Liege,
Belgium, Trans Tech Publications; September 2008.
27. Huang W, Kang Y, Yang X, editors. In: Proc. 11th Int. Conf. on Semi-Solid
Processing of Alloys and Composites, Beijing, China, Elsevier; September 2010.
28. Winterbottom WL. Metallurgical Science and Technology, vol. 18, 2000. pp. 5-
10.
29. Quaak CJ, Katgerman L, Kool WH. Proceedings of the 4th International
Conference on Semi-solid processing of alloys and composites, Sheffield, United
Kingdom, June 1996, pp. 35-39.
30. Bruwer R, Wilkins JD, Ivanchev LH, Rossouw P, Damm OFRA. US Patent No.
7368690, 2008.
220
31. Ivanchev LH, Wilkins JD, Govender G. Proceedings of the 8th International
Conference on Semi-solid Processing of Alloys and Composites, Limassol,
Cyprus, 2004, Paper # 152.
32. Massalski TB, Okamoto H, Subramanian PR, Kacprzak L. Binary Alloy Phase
Diagrams, ASM International, Materials Park OH, 1990.
33. ASM Specialty Handbook: Aluminium and Aluminium Alloys, Materials Park,
Ohio, ASM International, 1993.
34. Yang CY, Lee SL, Lee CK, Lin JC. Materials Chemistry and Physics, vol. 93,
2005, pp. 412-419.
35. Rosso M, Romano E, Giordano P, Chiarmetta GL. Proc. 7th Int. Conf. on
Advanced semi-solid processing of alloys and composites, Tsukuba, Japan, Japan
Society for Technology of Plasticity, 2002, pp. 151-156.
36. Forn A, Baile MT, Martin E, Goni J, Sarries I. Solid State Phenomena, vols. 116-
117, 2006, pp. 181-184.
37. Zhao H, Bai H, Wang J, Guan S. Materials Characterization, vol. 60, 2009. pp.
377-383.
38. Kaufmann H, Fragner W, Galovsky U, Uggowitzer PJ. Proceedings of the 2nd
International Light Metals Technology Conference, St. Wolfgang, Austria, 2005,
pp. 169-177.
39. Vissers R, van Huis MA, Jansen J, Zandbergen HW, Marioara CD, Andersen SJ.
Acta Materialia, vol. 55, 2007, pp. 3815-3823.
40. Zander J, Sandström, R. Materials & Design, vol. 29, 2008, pp.1540-1548.
41. Abdulwahab M, Madugu IA, Yaro SA, Hassan SB, Popoola API. Materials &
Design, vol. 32, 2011, pp. 1159-1166.
42. Buha J, Lumley RN, Crosky AG. Philosophical Magazine, vol. 88, 2008, pp. 373-
390.
43. Murayama M, Hono K. Acta Materialia, vol. 47, 1999, pp. 1537-1548.
44. Yang W, Wang M, Zhang R, Zhang Q, Sheng X. Scripta Materialia, vol. 62,
2010, pp. 705-708.
45. Zandbergen HW, Andersen SJ, Jansen J. Science, vol. 277, 1997, pp. 1221-1225.
46. Li C, Wu YY, Li H, Liu XF. Acta Materialia, vol. 59, 2011. pp. 1058-1067.
47. Taylor JA, StJohn DH, Zheng LH, Edwards GA, Barresi J, Couper MJ. Aluminum
Transactions, vols. 4-5, 2001, pp. 95-110.
221
48. Taylor JA, StJohn DH, Couper MJ. Aluminum Transactions, vols. 4-5, 2001, pp.
111-124.
49. Muller-Quernheim J. Chronic beryllium disease, Orphanet Encyclopedia, Nov.
2005, pp. 1-10.
50. Chang CST, Wieler I, Wanderka N, Banhart J. Ultramicroscopy, vol. 109, 2009,
pp. 585-592.
51. Eskin DG, Kharakterova ML. Materiali in Technologije, vol. 35, 2001, pp. 5-8.
52. Caceres CH, Djurdjevic MB, Stockwell TJ, Sokolowski JH. Scripta Materialia,
vol. 40, 1999, pp. 631-637.
53. Ye, H. Journal of Materials Engineering and Performance, vol. 12, 2003, pp.
288-297.
54. Kim HY, Han SW, Lee HM. Materials Letters, vol. 60, 2006, pp. 1880-1883.
55. Castillo LD, Lavernia EJ. Metallurgical and Materials Transactions A, vol. 31,
2000, pp. 2287-2298.
56. Nafisi S, Ghomashchi R. Materials Characterization, vol. 57, 2006, pp. 371-385.
57. Nafisi S, Ghomashchi R. Materials Science and Engineering A, vol. 415, 2006,
pp. 273-285.
58. Sigworth GK. International Journal of Metalcasting, vol. 2, 2008, pp. 19-40.
59. Hegde S, Prabhu KN. Journal of Materials Science, vol. 43, 2008, pp. 3009-3027.
60. Lumley RN, Polmear IJ, Curtis PR. Metallurgical and Materials Transactions A,
vol. 40, 2009, pp. 1716-1726.
61. Lumley RN, O’Donnell RG, Gunasegaram DR, Givord M. Metallurgical and
Materials Transactions A, vol. 38, 2007, pp. 2564-2574.
62. Funatani K. Proc. 1st Automotive Heat Treating Conf., Puerto Vallata, Mexico,
13-15 July, 1998, pp. 283-290.
63. Apelian D, Shivkumar S, Sigworth G. AFS Transactions, vol. 97, 1990, pp. 727-
742.
64. Dahle AK. Heat Treatment of Aluminium Alloys, Encyclopedia of Material
Science and Technology, vol. 3, 2001, pp. 1-3.
65. Ohnisi N, Takaai T, Nakayama Y, Ohmori M. Journal of the Japan Institute of
Light Metals, vol. 45, 1995, pp. 447-452.
66. Shivkumar S, Ricci S, Steenhoff B, Apelian D, Sigworth G. AFS Transactions,
vol. 138, 1989, pp. 791-810.
222
67. Zhang DL, Zheng LH, StJohn DH. Journal of Light Metals, vol. 2, 2002, pp. 27-
36.
68. Rometsch PA, Arnberg L, Zhang DL. International Journal of Cast Metals
Research, vol. 12, 1999, pp. 1-8.
69. Parker BA, Saunders DS, Griffiths JR. Metals Forum, vol. 5, 1982, pp. 48-53.
70. Shabestari SG, Shahri, F. Journal of Materials Science, vol. 39, 2004, pp. 2023-
2032.
71. Otarawanna S, Gourlay CM, Laukli HI, Dahle AK, Metallurgical and Materials
Transactions A, vol. 40, 2009, pp. 1645-1659.
72. Emadi D, Whiting LV, Sahoo M, Sokolowski JH, Burke P, Hart M. Light Metals
2003, pp. 983-989.
73. Zhang DL, Zheng LH. Metallurgical and Materials Transactions A, vol. 27, 1996,
pp. 3983-3991.
74. Tiryakioglu M, Shuery RT. Metallurgical and Materials Transactions B, vol. 38,
2007, pp. 575-582.
75. Sjölander E, Seiffedine S. Journal of Materials Processing Technology, vol. 210,
2010, pp. 1249-1259.
76. Gerold V. Precipitation hardening. In: Nabarro, F.R.N. (Ed.), Dislocations in
Solids. North-Holland, 1979, p. 222.
77. Buha J, Lumley RN, Crosky AG, Hono K. Acta Materialia, vol. 55, 2007, pp.
3015-3024.
78. Wanderka N, Lazarev N, Chang CST, Banhart J. Ultramicroscopy, 2010;
doi:10.1016/j.ultramic.2010.11.022.
79. Edwards GA, Stiller K, Dunlop GL, Couper MJ. Acta Materialia, vol. 46, 1998,
pp. 3893-3904.
80. Banhart J, Chang CST, Liang Z, Wanderka N, Lay MDH, Hill AJ. Advanced
Engineering Materials, vol. 12, 2010, pp. 559-571.
81. Govender G, Ivanchev L, Jahajeeah N, Bëan R. Solid State Phenomena, vols. 116-
117, 2006. pp. 501-504.
82. Rometsch PA, Schaffer GB. Materials Science and Engineering A, vol. 325, 2002.
pp. 424-434.
83. Eskin DG. Journal of Materials Science, vol. 38, 2003, pp. 279–290.
84. Marioara CD, Andersen SJ, Jansen J, Zandbergen HW. Acta Materialia, vol. 51,
2003, pp. 789-796.
223
85. Royset J, Stene T, Saeter JA, Reiso O. Materials Science Forum, vols. 519-521,
2006, pp. 239-244.
86. Yamada K, Sato T, Kamio A. Materials Science Forum, vols. 331-337, 2000, pp.
669-674.
87. Bichsel H, Ried A, Warmebehandeling, D. Gesellsch. Fur Metallkunde e.V. 1973,
p. 173.
88. Gupta AK, Lloyd DJ, Court SA. Materials Science and Engineering A, vol. 316,
2001, pp.11-17.
89. Badiali M, Davidson CJ, Griffiths JR, Zanada A. Proceedings of the 6th
International Conference on Semi-solid Processing of Alloys and Composites,
Turin, Italy, 2000, pp. 349-354.
90. Rosso M, Actis Grande M. Solid State Phenomena, vols. 116-117, 2006, pp. 505-
508.
91. Reed-Hill RE, Abbaschian R. Physical Metallurgy Principles. Boston: PWS
Publishing Compony; 1994.
92. Curle UA, Wilkins JD, Govender G. Advances in Materials Science and
Engineering, vol. 2011, 2011, Article ID 195406.
93. Drouzy M, Jacob S, Richard M. International Cast Metals Research Journal, vol.
5, 1980, pp. 43-50.
94. Kaufman JG. Fracture resistance of aluminium alloys: notch toughness, tear
resistance and fracture toughness, ASM International, 2001.
95. Miller MK. Atom probe tomography: analysis at the atomic level. New York:
Kluwer Academic/Plenum Publishers; 2000.
96. Gault B, Moody MP, de Geuser F, Tsafnat G, La Fontaine A, Stephenson LT, et
al. Journal of Applied Physics, vol. 105, 2009, Article no. 034913.
97. Moody MP, Gault B, Stephenson LT, Haley D, Ringer SP. Ultramicroscopy, vol.
109, 2009, pp. 815-824.
98. Vaumousse D, Cerezo A, Warren PJ. Ultramicroscopy, vol. 95, 2003, pp. 215-
221.
99. Marceau RKW, Sha G, Ferragut R, Dupasquier A, Ringer SP. Acta Materialia,
vol. 58, 2010, pp. 4923-4939.
100. Cabibbo M, Spigarelli S, Evangelista E. Materials Characterization, vol. 49,
2003, pp. 193-202.
224
101. Su JF, Nie X, Stoilov V. Materials Science and Engineering A, vol. 527, 2010,
pp. 7168-7175.
102. Lifshitz IM, Slyozov VV. Journal of Physical Chemistry of Solids, vol. 19,
1961, pp. 35-50.
103. Lee CD. Materials Science and Engineering A, vol. 464, 2007, pp. 249-254.
104. Gupta AK, Lloyd DJ, Court SA. Materials Science and Engineering A, vol.
301, 2001, pp. 140-146.
105. Du Y, Chang YA, Huang B, Gong W, Jin Z, Xu H, et al. Materials Science
and Engineering A, vol. 363, 2003, pp. 140-151.
106. Fricke WG in: van Horn KR (Ed.), Aluminum, vol. 1, Properties Physical
Metallurgy and Phase Diagrams, American Society for Metals, Metals Park, OH,
1967.
107. Doig P, Edington JW, Philosophical Magazine, vol. 28, 1973, p. 961.
108. Brick RM, Phillips A, Transactions of AIME, vol. 124, 1937, p. 331.
109. Caceres CH, Griffiths JR, Wang QG, Davidson CJ. Metallurgical and
Materials Transactions A, vol. 30, 1999, pp. 2611-2618.
110. Chen C-L, Thomson RC. Journal of Alloys and Compounds, vol. 490, 2010,
pp. 293−300.
111. Gourlay CM, Laukli HI, Dahle AK. Metallurgical and Materials Transactions
A, vol. 38A, 2007, pp. 1833-1844.
112. Nagasekhar AV, Caceres CH, Kong C. Materials Characterization, vol. 61,
2010, pp. 1035-1042.
113. Dieter GE. Mechanical Metallurgy. Boston: McGraw-Hill; 1986.
114. Bogdanov T, Dahlström J. The influence of copper on an Al-Si-Mg alloy A356
- Microstructure and mechanical properties. Bachelor’s thesis, Jönköping
University, Sweden, 2009.
115. Wang QG. Metallurgical and Materials Transactions A, vol. 35, 2004, pp.
2707-2718.
116. Curle UA. Transactions of the Nonferrous Metals Society of China, vol. 20,
2010, pp. 1719-1724.
117. Birol Y. Journal of Alloys and Compounds, vol. 455, 2008, pp.178-185.
118. Marioara CD, Andersen SJ, Jansen J, Zandbergen HW. Acta Materialia, vol.
49, 2001, pp. 321-328.
225
119. Miller MK, Cerezo A, Hetherington MG, Smith GDW. Atom Probe Field Ion
Microscopy, Oxford: Oxford University Press; 1996.
120. Blavette D, Vurpillot F, Pareige P, Menand A. Ultramicroscopy, vol. 89,
2001, pp. 145-153.
121. Matsuda K, Naoi T, Fujii K, Uetani Y, Sato T, Kamio A, Ikeno S. Materials
Science and Engineering A, vol. 262, 1999, pp. 232-237.
122. Bryantsev PY, Zolotorevskiy VS, Portnoy VK. Materials Science Forum,
vols. 519-521, 2006, pp. 401-406.
123. Sha G, Cerezo A. Acta Materialia, vol. 53, 2005, pp. 907-917.
124. Cuniberti A, Tolley A, Castro Riglos MV, Giovachini R. Materials Science
and Engineering A, vol. 527, 2010, pp. 5307-5311.
125. Herman H. Metallurgical Transactions, vol. 2, 1971, pp.13-22.
126. Smith WF. Principles of Materials Science and Engineering, New York:
McGraw-Hill; 1996.
127. Hasting HS, Froseth AG, Andersen SJ, Vissers R, Walmsley JC, Marioara
CD, Danoix F, Lefebvre W, Holmestad R. Journal of Applied Physics, vol.
106, 2009, Article number 123527.
128. Myhr OR, Grong O. Acta Metallurgica et Materialia, vol. 39, 1991, pp. 2693-
2702.
129. Deschamps A, Brechet Y. Acta Materialia, vol. 47, 1999, pp. 293-305.
130. Starink, MJ, Wang P, Sinclair I, Gregson PJ. Acta Materialia, vol. 47, 1999,
pp. 3855-3868.
131. Wu L, Ferguson WG in: Aluminium Alloys: Theory and Applications,
INTECHopen, 2011, pp. 307-330.
132. Kampmann R, Wagner R. GKSS-Forschungszentrum, Inst fuer, Physik,
Geesthacht, West Ger, GKSS-Forschungszentrum, Inst fuer Physik,
Geesthacht, West Germany, 1984.
133. Erginer E, Gurland J. Zeitschrift für Metallkunde, vol. 61, 1970, p. 606.
134. Rometsch PA, Schaffer GB. International Journal of Cast Metals Research,
vol. 12, 2000, pp. 431-439.
226
HM1: Möller H, Govender G, Stumpf WE. International Journal of Cast Metals
Research, vol. 20, 2007, pp. 340-346.
HM2: Möller H, Govender G, Stumpf WE. Open Materials Science Journal, vol. 2,
2008, pp. 6-10.
HM3: Möller H, Govender G, Stumpf WE. Open Materials Science Journal, vol. 2,
2008, pp. 11-18.
HM4: Möller H, Govender G, Stumpf WE. Solid State Phenomena, vols. 141-143,
2008, pp. 737-742.
HM5: Govender G, Möller H. Solid State Phenomena, vols. 141-143, 2008, pp. 433-
438.
HM6: Möller H, Govender G, Stumpf WE. Materials Science Forum, vols. 618-619,
2009, pp. 365-368.
HM7: Möller H, Govender G, Stumpf WE, Knutsen RD. International Journal of
Cast Metals Research, vol. 22, 2009, pp. 417-421.
HM8: Möller H, Govender G, Stumpf WE, Pistorius PC. International Journal of
Cast Metals Research, vol. 23, 2010, pp. 37-43.
HM9: Möller H, Govender G, Stumpf WE. Transactions of the Nonferrous Metals
Society of China, vol. 20, 2010, pp. s842-s846.
HM10: Möller H, Govender G, Stumpf WE. Transactions of the Nonferrous Metals
Society of China, vol. 20, 2010, pp. 1780-1785.
HM11: Möller H, Curle UA, Masuku EP. Transactions of the Nonferrous Metals
Society of China, vol. 20, 2010, pp. s847-s851.
HM12: Möller H, Govender G, Rossouw P, Stumpf WE. Advances in Materials
Science and Engineering, vol. 2011, 2011, Article ID 375150.
HM13: Curle UA, Möller H, Wilkins JD. Scripta Materialia, vol. 64, 2011, pp. 479-
482.
HM14: Möller H, Govender G, Stumpf WE. Materials Science Forum, vol. 690,
2011, pp. 53-56.
HM15: Sha G, Möller H, Stumpf WE, Xia JH, Govender G, Ringer SP. Submitted to
Acta Materialia, 2011.


![Journal of Membrane Science · of 1021m2 g-1and pore volume of 0.40cm3 g [38]), high resistance to heat, (430–540°C [37,39]), mechanical pressure and water adsorption [40,41]](https://img.pdfslide.fr/doc/110x75/5ecce269bfe251793f43740e/journal-of-membrane-science-of-1021m2-g-1and-pore-volume-of-040cm3-g-38-high.jpg)