Embed Size (px)
Citation preview
PHYSICAL REVIEW B 85, 224402 (2012)
Two-step transition in a magnetoelectric ferrimagnet Cu2OSeO3
I. Zivkovic,1,* D. Pajic,2 T. Ivek,1 and H. Berger3
1Institute of Physics, P.O. Box 304, HR-10 000, Zagreb, Croatia2Department of Physics, Faculty of Science, Bijenicka c.32, HR-10 000 Zagreb, Croatia
3Institute of Physics of Complex Matter, EPFL, CH-1015 Lausanne, Switzerland(Received 24 January 2012; revised manuscript received 6 April 2012; published 7 June 2012)
We report a detailed single-crystal investigation of a magnetoelectric ferrimagnet Cu2OSeO3 using dcmagnetization and ac susceptibility along the three principal directions [100], [110], and [111]. We have observedthat in small magnetic fields two magnetic transitions occur, one at Tc = 57 K and the second one at TN = 58K. At Tc the nonlinear susceptibility reveals the emergence of the ferromagnetic component and below Tc
the magnetization measurements show the splitting between field-cooled and zero-field-cooled regimes. Above1000 Oe the magnetization saturates and the system is in a single domain state. The temperature dependenceof the saturation below Tc can be well described by μ(T ) = μ(0)[1 − (T/Tc)2]β , with μ(0) = 0.56μB /Cu,corresponding to the 3-up-1-down configuration. The dielectric constant measured on a thin single crystal showsa systematic deviation below the transition, indicating an intrinsic magnetoelectric effect.
DOI: 10.1103/PhysRevB.85.224402 PACS number(s): 75.50.Gg, 75.30.Cr, 75.40.Cx, 75.85.+t
I. INTRODUCTION
Although first investigations of magnetoelectrics wereperformed in 1960s,1 a revitalization of the interest in thistype of materials came with the discovery of a colossalmagnetoelectric effect in manganites RMnO3 (Ref. 2) andRMn2O5 (Ref. 3). Since then numerous materials have beeninvestigated with different types of coupling between theelectric and magnetic order parameters.4 The prospect of usingthese materials in new types of memory elements where themagnetic order could be easily manipulated with the appliedvoltage is stimulating further investigation of new materials.
Recently, it was shown that Cu2OSeO3, a ferrimagnet below≈60 K, shows a magnetoelectric effect below the magnetictransition.5 This has been revealed through the change ofthe dielectric constant across the magnetic transition5 andlater confirmed by infrared measurements.6,7 Cu2OSeO3 crys-tallizes in a cubic space group P 213 and a high-resolutionstructural investigation revealed that it remains metricallycubic down to 10 K (Ref. 5). There are two crystallographicallyinequivalent copper sites, CuI within a trigonal bipyramidalCuIO5 unit and CuII within a square pyramidal CuIIO5 unit.Both copper ions are in a 2+ oxidation state, resulting inone unpaired electron per site, giving rise to spin S = 1/2on each magnetic ion. The observed ferrimagnetic structureis a result of a CuI : CuII = 1 : 3 ratio, with all the momentspointing along the space diagonal.5 From the neutron scatter-ing experiments it has been found that the coupling betweenthe nearest-neighbor (NN) moments is antiferromagnetic forCuI-CuII and ferromagnetic for CuII-CuII (Ref. 5), which waslater confirmed by the NMR study.8
The exact nature of the magnetoelectric coupling inCu2OSeO3 is still unclear and deeper insight is needed inthe basic magnetic properties of the system. It is especiallyimportant to elucidate the details of the magnetic transitionwhere the dielectric measurements on powdered sampleshowed the critical behavior.5 In this report we present detaileddc magnetization and ac susceptibility measurements alongthree principal directions in the cubic system ([100], [110],and [111]). Our results show that in zero field the domain
structure becomes important, giving rise to a complicated M-Hdependence as the field is applied. A rather small field of1000 Oe is enough to drive the system to saturation, wherethe value of the magnetization of the plateau follows thesame temperature dependence found for the internal fieldby μSR (Ref. 9). However, in zero field the susceptibilityabove the transition does not show the critical behavior. Also,our dielectric measurements did not reveal a strong kink atthe transition, as observed for the powdered sample.5 On theother hand, below the transition the dielectric constant deviatesfrom the high-temperature behavior, supporting the conclusionabout the magnetoelectric effect in Cu2OSeO3.
II. EXPERIMENTAL DETAILS
Single crystals were prepared by the chemical vapor phasemethod. Details of the preparation can be found in previousreports.6,8 The orientation of single crystals was performedusing the x-ray Laue camera after which the samples werecut into shapes with dimensions of 1 × 1 × 4 mm3, with thelongest side along [100], [110], and [111].
Magnetization measurements were performed on a com-mercial Quantum Design MPMS5 magnetometer with atemperature range of 2 K–800 K and magnetic fields up to5 T. The ac susceptibility was measured using a commercialCryoBIND system with a temperature range of 4 K–400 Kand a frequency range of 10 mHz–10 kHz. The dielectricresponse was measured using the home-made setup with theHP 4284A LCR meter in the frequency range 20 Hz–1 MHz,with excitation voltages of 50 mV and 1 V. The sample usedhas a plan-parallel shape with a cross section of 2.8 mm2 and athickness of 0.4 mm. The contacts were prepared using DuPont4929N silver paint.
III. RESULTS
In Fig. 1 we present a detailed investigation of thetemperature dependence of the magnetization (M) for variousapplied fields below the transition for all three principaldirections. Two sets of measurements are presented for each
224402-11098-0121/2012/85(22)/224402(7) ©2012 American Physical Society
I. ZIVKOVIC, D. PAJIC, T. IVEK, AND H. BERGER PHYSICAL REVIEW B 85, 224402 (2012)
0 20 40 6010
0
101
102
103
Temperature (K)
M (
emu/
mol
Cu)
H || [100]
(a)
0 20 40 6010
0
101
102
103
Temperature (K)
H || [110]
(b)
0 20 40 6010
0
101
102
103
Temperature (K)
H || [111]
(c)
10 Oe 50 Oe 100 Oe 300 Oe 500 Oe1000 Oe
10 Oe 50 Oe 100 Oe 300 Oe 500 Oe1000 Oe
10 Oe 50 Oe 100 Oe 300 Oe 500 Oe1000 Oe
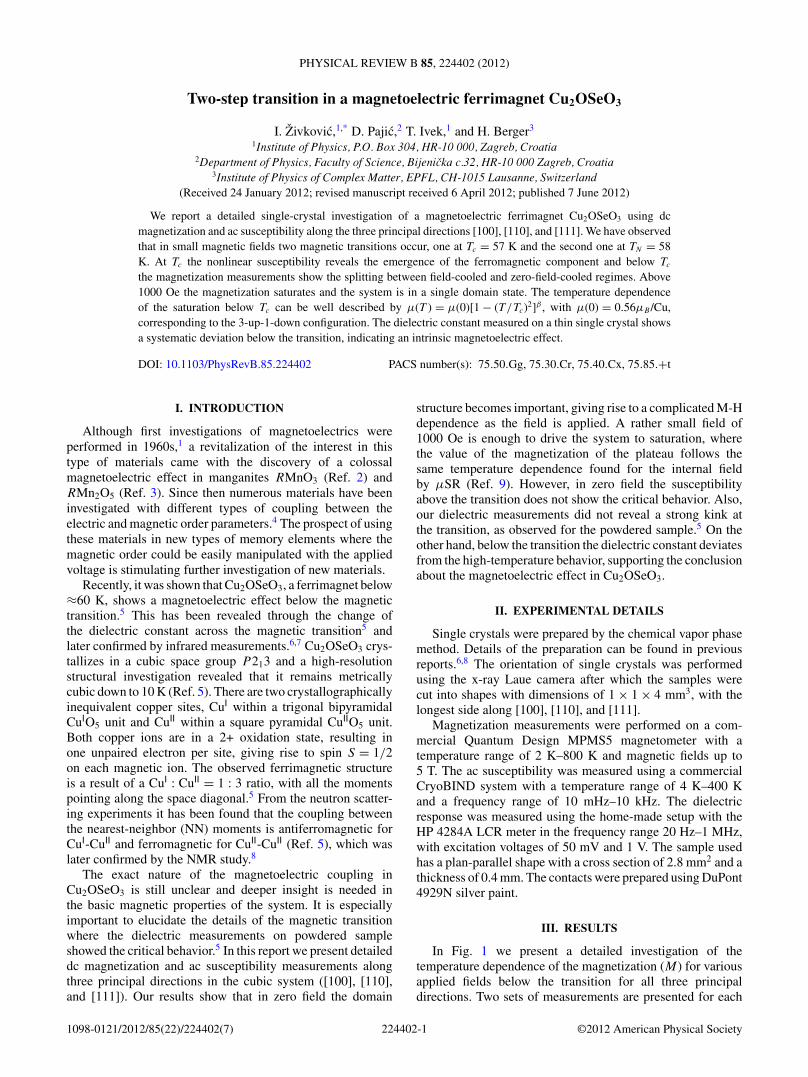
FIG. 1. (Color online) Temperature dependence of the magnetization for (a) [100], (b) [110], and (c) [111] directions. Upper branches(solid symbols) correspond to the FC regime, while the lower branches (open symbols) correspond to the ZFC regime.
field, field-cooled (FC) and zero-field-cooled (ZFC) curves.The procedure for ZFC measurements includes cooling thesample in zero field, applying the field and measuring whilewarming up. FC measurements were performed while coolingthe sample with the field applied.
A noticeable feature is the development of the differencebetween ZFC and FC curves. For a small field (H ≈ 10 Oe)no difference is observed. As the field is increased (H ≈ 100Oe), the splitting starts below the transition, goes througha maximum around 40 K–50 K and then decreases. Foreven larger fields (H ≈ 500 Oe) ZFC and FC curves overlapdown to 20 K–30 K and then gradually split below 20 K.Finally, for fields H � 1000 Oe again no splitting occurs.These observations are in accordance with the results from thepowder investigation,5 where an opening of a small hysteresisloop was reported in the range 300–500 Oe.
Of the three principal directions, [100] shows a somewhatdifferent behavior compared to [110] and [111] (which arequalitatively very similar) regarding the development of theFC-ZFC splitting. For H = 10 and 1000 Oe fields all threedirections show almost identical behavior. However, alreadyfor 50 Oe the measured FC-ZFC difference is larger forthe [100] direction. With 100 Oe it persists down to lowesttemperatures with H ||[100] while for the other two directionsit decreases toward zero (more so for H ||[111]). For H = 300Oe M [100] reveals a broad maximum around 40 K, where M [110]
and M [111] continue to increase down to 5 K. Finally, withH = 500 Oe, there is a change in the slope in M [100] around25 K. All this points to a very complicated mechanism ofmagnetization processes which is very sensitive to small fieldsand the orientation of the sample.
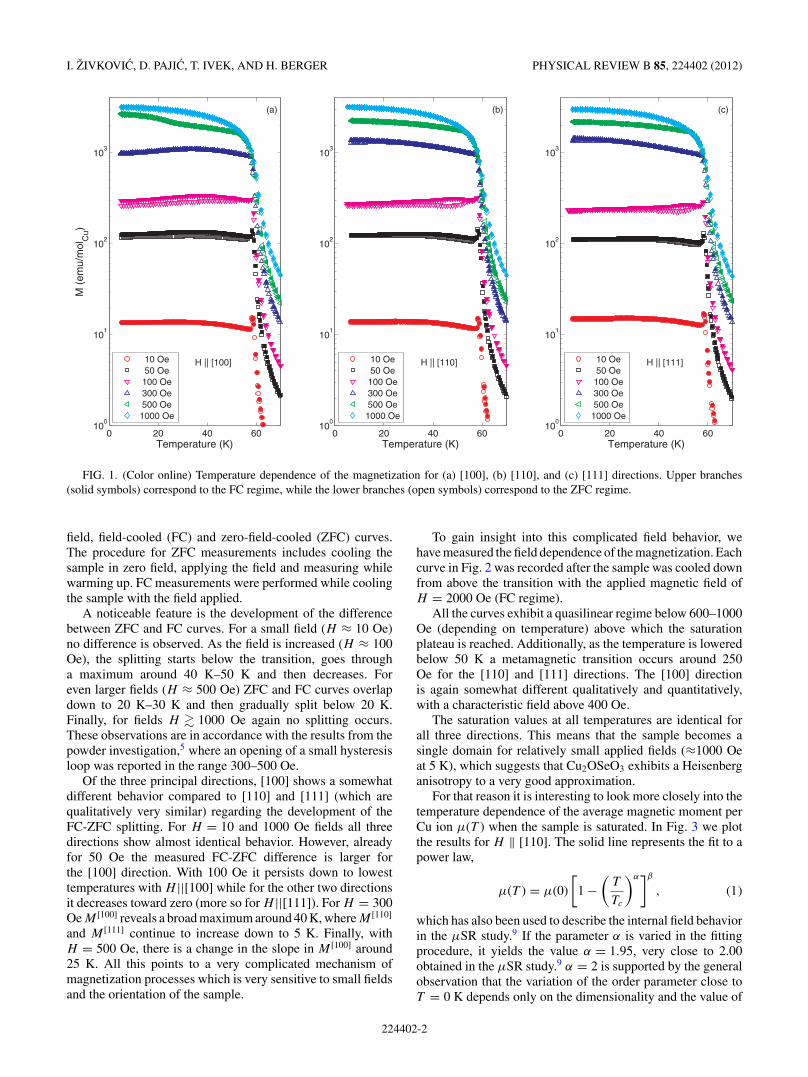
To gain insight into this complicated field behavior, wehave measured the field dependence of the magnetization. Eachcurve in Fig. 2 was recorded after the sample was cooled downfrom above the transition with the applied magnetic field ofH = 2000 Oe (FC regime).
All the curves exhibit a quasilinear regime below 600–1000Oe (depending on temperature) above which the saturationplateau is reached. Additionally, as the temperature is loweredbelow 50 K a metamagnetic transition occurs around 250Oe for the [110] and [111] directions. The [100] directionis again somewhat different qualitatively and quantitatively,with a characteristic field above 400 Oe.
The saturation values at all temperatures are identical forall three directions. This means that the sample becomes asingle domain for relatively small applied fields (≈1000 Oeat 5 K), which suggests that Cu2OSeO3 exhibits a Heisenberganisotropy to a very good approximation.
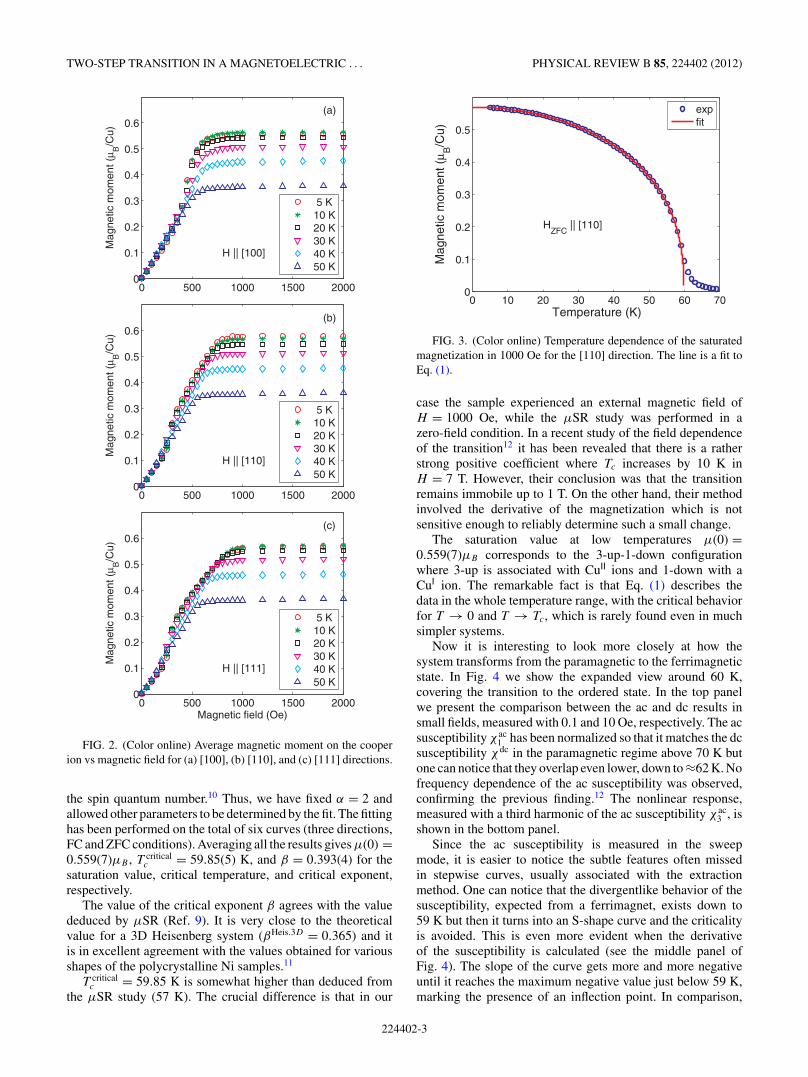
For that reason it is interesting to look more closely into thetemperature dependence of the average magnetic moment perCu ion μ(T ) when the sample is saturated. In Fig. 3 we plotthe results for H ‖ [110]. The solid line represents the fit to apower law,
μ(T ) = μ(0)
[1 −
(T
Tc
)α]β
, (1)
which has also been used to describe the internal field behaviorin the μSR study.9 If the parameter α is varied in the fittingprocedure, it yields the value α = 1.95, very close to 2.00obtained in the μSR study.9 α = 2 is supported by the generalobservation that the variation of the order parameter close toT = 0 K depends only on the dimensionality and the value of
224402-2
TWO-STEP TRANSITION IN A MAGNETOELECTRIC . . . PHYSICAL REVIEW B 85, 224402 (2012)
0 500 1000 1500 20000
0.1
0.2
0.3
0.4
0.5
0.6M
agne
tic m
omen
t (μ B
/Cu)
H || [100]
(a)
5 K10 K20 K30 K40 K50 K
0 500 1000 1500 20000
0.1
0.2
0.3
0.4
0.5
0.6
Mag
netic
mom
ent (
μ B/C
u)
H || [110]
(b)
5 K10 K20 K30 K40 K50 K
0 500 1000 1500 20000
0.1
0.2
0.3
0.4
0.5
0.6
Magnetic field (Oe)
Mag
netic
mom
ent (
μ B/C
u)
H || [111]
(c)
5 K10 K20 K30 K40 K50 K
FIG. 2. (Color online) Average magnetic moment on the cooperion vs magnetic field for (a) [100], (b) [110], and (c) [111] directions.
the spin quantum number.10 Thus, we have fixed α = 2 andallowed other parameters to be determined by the fit. The fittinghas been performed on the total of six curves (three directions,FC and ZFC conditions). Averaging all the results gives μ(0) =0.559(7)μB , T critical
c = 59.85(5) K, and β = 0.393(4) for thesaturation value, critical temperature, and critical exponent,respectively.
The value of the critical exponent β agrees with the valuededuced by μSR (Ref. 9). It is very close to the theoreticalvalue for a 3D Heisenberg system (βHeis.3D = 0.365) and itis in excellent agreement with the values obtained for variousshapes of the polycrystalline Ni samples.11
T criticalc = 59.85 K is somewhat higher than deduced from
the μSR study (57 K). The crucial difference is that in our
0 10 20 30 40 50 60 700
0.1
0.2
0.3
0.4
0.5
Temperature (K)
Mag
netic
mom
ent (
μ B/C
u)
HZFC
|| [110]
expfit
FIG. 3. (Color online) Temperature dependence of the saturatedmagnetization in 1000 Oe for the [110] direction. The line is a fit toEq. (1).
case the sample experienced an external magnetic field ofH = 1000 Oe, while the μSR study was performed in azero-field condition. In a recent study of the field dependenceof the transition12 it has been revealed that there is a ratherstrong positive coefficient where Tc increases by 10 K inH = 7 T. However, their conclusion was that the transitionremains immobile up to 1 T. On the other hand, their methodinvolved the derivative of the magnetization which is notsensitive enough to reliably determine such a small change.
The saturation value at low temperatures μ(0) =0.559(7)μB corresponds to the 3-up-1-down configurationwhere 3-up is associated with CuII ions and 1-down with aCuI ion. The remarkable fact is that Eq. (1) describes thedata in the whole temperature range, with the critical behaviorfor T → 0 and T → Tc, which is rarely found even in muchsimpler systems.
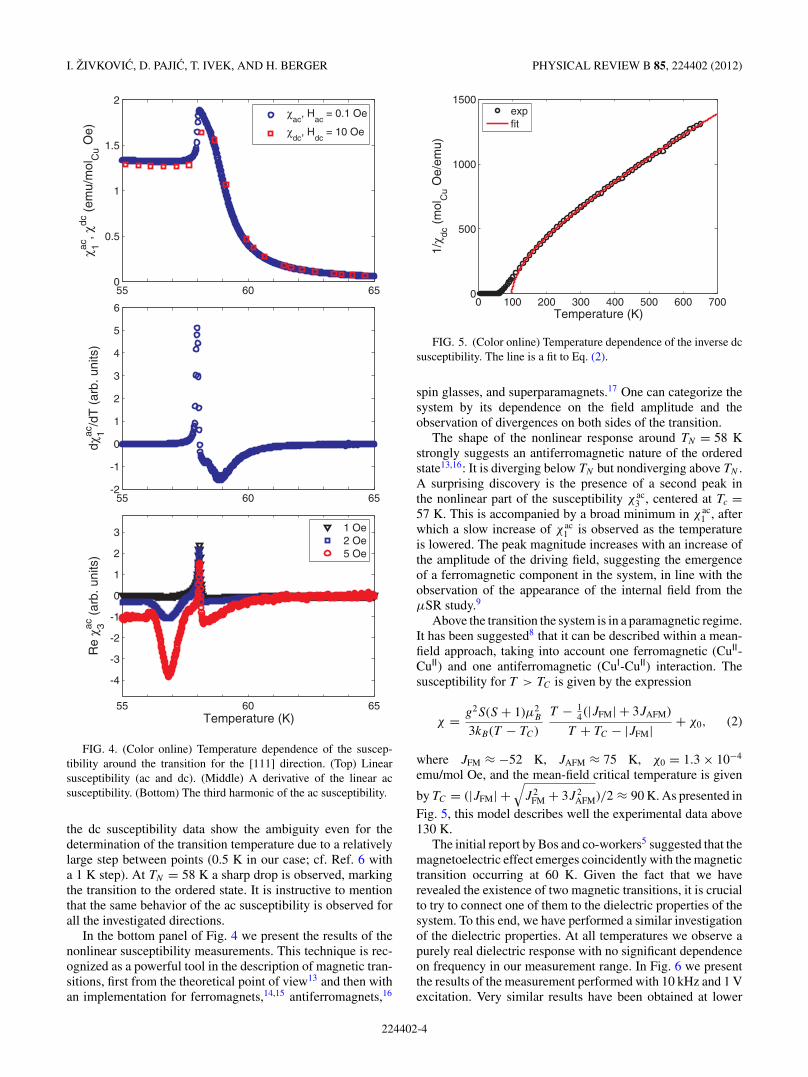
Now it is interesting to look more closely at how thesystem transforms from the paramagnetic to the ferrimagneticstate. In Fig. 4 we show the expanded view around 60 K,covering the transition to the ordered state. In the top panelwe present the comparison between the ac and dc results insmall fields, measured with 0.1 and 10 Oe, respectively. The acsusceptibility χ ac
1 has been normalized so that it matches the dcsusceptibility χdc in the paramagnetic regime above 70 K butone can notice that they overlap even lower, down to ≈62 K. Nofrequency dependence of the ac susceptibility was observed,confirming the previous finding.12 The nonlinear response,measured with a third harmonic of the ac susceptibility χ ac
3 , isshown in the bottom panel.
Since the ac susceptibility is measured in the sweepmode, it is easier to notice the subtle features often missedin stepwise curves, usually associated with the extractionmethod. One can notice that the divergentlike behavior of thesusceptibility, expected from a ferrimagnet, exists down to59 K but then it turns into an S-shape curve and the criticalityis avoided. This is even more evident when the derivativeof the susceptibility is calculated (see the middle panel ofFig. 4). The slope of the curve gets more and more negativeuntil it reaches the maximum negative value just below 59 K,marking the presence of an inflection point. In comparison,
224402-3
I. ZIVKOVIC, D. PAJIC, T. IVEK, AND H. BERGER PHYSICAL REVIEW B 85, 224402 (2012)
55 60 650
0.5
1
1.5
2χ 1ac
,χdc
(em
u/m
olC
u Oe)
χac
, Hac
= 0.1 Oe
χdc
, Hdc
= 10 Oe
55 60 65-2
-1
0
1
2
3
4
5
6
dχ1ac
/dT
(ar
b. u
nits
)
55 60 65
-4
-3
-2
-1
0
1
2
3
Temperature (K)
Re
χ 3ac (
arb.
uni
ts)
1 Oe2 Oe5 Oe
FIG. 4. (Color online) Temperature dependence of the suscep-tibility around the transition for the [111] direction. (Top) Linearsusceptibility (ac and dc). (Middle) A derivative of the linear acsusceptibility. (Bottom) The third harmonic of the ac susceptibility.
the dc susceptibility data show the ambiguity even for thedetermination of the transition temperature due to a relativelylarge step between points (0.5 K in our case; cf. Ref. 6 witha 1 K step). At TN = 58 K a sharp drop is observed, markingthe transition to the ordered state. It is instructive to mentionthat the same behavior of the ac susceptibility is observed forall the investigated directions.
In the bottom panel of Fig. 4 we present the results of thenonlinear susceptibility measurements. This technique is rec-ognized as a powerful tool in the description of magnetic tran-sitions, first from the theoretical point of view13 and then withan implementation for ferromagnets,14,15 antiferromagnets,16
0 100 200 300 400 500 600 7000
500
1000
1500
Temperature (K)
1/χ dc
(m
olC
u Oe/
emu)
expfit
FIG. 5. (Color online) Temperature dependence of the inverse dcsusceptibility. The line is a fit to Eq. (2).
spin glasses, and superparamagnets.17 One can categorize thesystem by its dependence on the field amplitude and theobservation of divergences on both sides of the transition.
The shape of the nonlinear response around TN = 58 Kstrongly suggests an antiferromagnetic nature of the orderedstate13,16: It is diverging below TN but nondiverging above TN .A surprising discovery is the presence of a second peak inthe nonlinear part of the susceptibility χ ac
3 , centered at Tc =57 K. This is accompanied by a broad minimum in χ ac
1 , afterwhich a slow increase of χ ac
1 is observed as the temperatureis lowered. The peak magnitude increases with an increase ofthe amplitude of the driving field, suggesting the emergenceof a ferromagnetic component in the system, in line with theobservation of the appearance of the internal field from theμSR study.9
Above the transition the system is in a paramagnetic regime.It has been suggested8 that it can be described within a mean-field approach, taking into account one ferromagnetic (CuII-CuII) and one antiferromagnetic (CuI-CuII) interaction. Thesusceptibility for T > TC is given by the expression
χ = g2S(S + 1)μ2B
3kB(T − TC)
T − 14 (|JFM| + 3JAFM)
T + TC − |JFM| + χ0, (2)
where JFM ≈ −52 K, JAFM ≈ 75 K, χ0 = 1.3 × 10⁻⁴
emu/mol Oe, and the mean-field critical temperature is given
by TC = (|JFM| +√
J 2FM + 3J 2
AFM)/2 ≈ 90 K. As presented inFig. 5, this model describes well the experimental data above130 K.
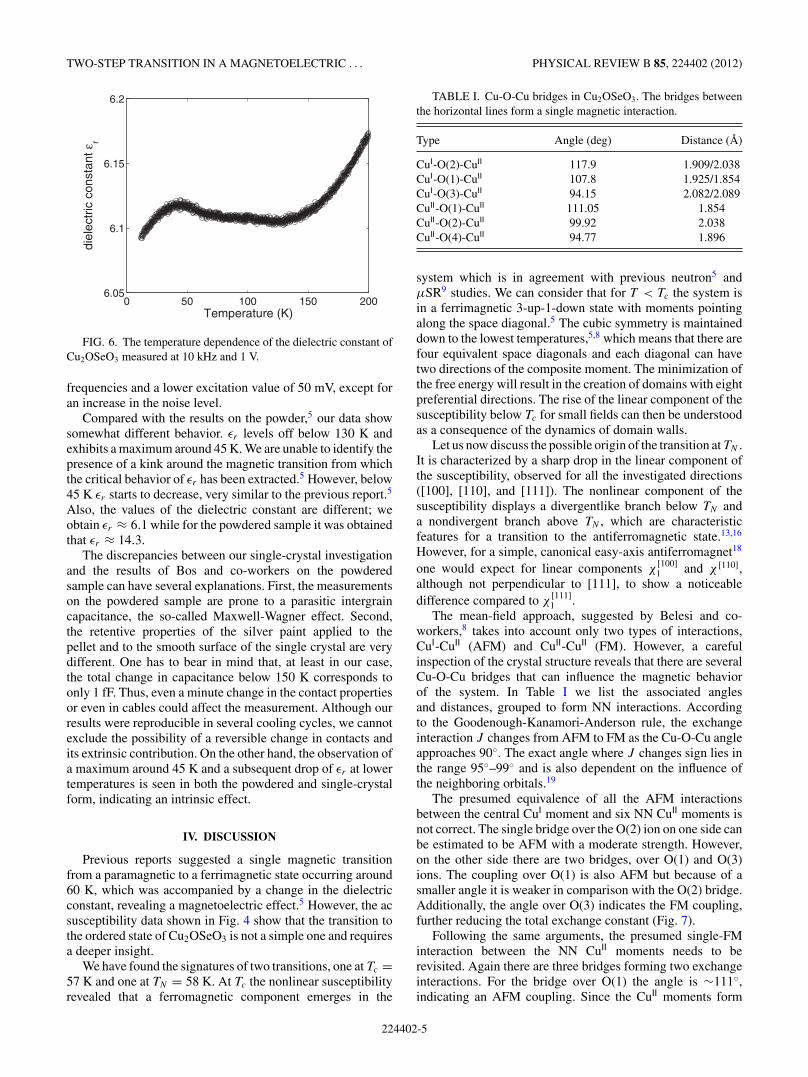
The initial report by Bos and co-workers5 suggested that themagnetoelectric effect emerges coincidently with the magnetictransition occurring at 60 K. Given the fact that we haverevealed the existence of two magnetic transitions, it is crucialto try to connect one of them to the dielectric properties of thesystem. To this end, we have performed a similar investigationof the dielectric properties. At all temperatures we observe apurely real dielectric response with no significant dependenceon frequency in our measurement range. In Fig. 6 we presentthe results of the measurement performed with 10 kHz and 1 Vexcitation. Very similar results have been obtained at lower
224402-4
TWO-STEP TRANSITION IN A MAGNETOELECTRIC . . . PHYSICAL REVIEW B 85, 224402 (2012)
0 50 100 150 2006.05
6.1
6.15
6.2
Temperature (K)
diel
ectr
ic c
onst
ant ε
r
FIG. 6. The temperature dependence of the dielectric constant ofCu2OSeO3 measured at 10 kHz and 1 V.
frequencies and a lower excitation value of 50 mV, except foran increase in the noise level.
Compared with the results on the powder,5 our data showsomewhat different behavior. εr levels off below 130 K andexhibits a maximum around 45 K. We are unable to identify thepresence of a kink around the magnetic transition from whichthe critical behavior of εr has been extracted.5 However, below45 K εr starts to decrease, very similar to the previous report.5
Also, the values of the dielectric constant are different; weobtain εr ≈ 6.1 while for the powdered sample it was obtainedthat εr ≈ 14.3.
The discrepancies between our single-crystal investigationand the results of Bos and co-workers on the powderedsample can have several explanations. First, the measurementson the powdered sample are prone to a parasitic intergraincapacitance, the so-called Maxwell-Wagner effect. Second,the retentive properties of the silver paint applied to thepellet and to the smooth surface of the single crystal are verydifferent. One has to bear in mind that, at least in our case,the total change in capacitance below 150 K corresponds toonly 1 fF. Thus, even a minute change in the contact propertiesor even in cables could affect the measurement. Although ourresults were reproducible in several cooling cycles, we cannotexclude the possibility of a reversible change in contacts andits extrinsic contribution. On the other hand, the observation ofa maximum around 45 K and a subsequent drop of εr at lowertemperatures is seen in both the powdered and single-crystalform, indicating an intrinsic effect.
IV. DISCUSSION
Previous reports suggested a single magnetic transitionfrom a paramagnetic to a ferrimagnetic state occurring around60 K, which was accompanied by a change in the dielectricconstant, revealing a magnetoelectric effect.5 However, the acsusceptibility data shown in Fig. 4 show that the transition tothe ordered state of Cu2OSeO3 is not a simple one and requiresa deeper insight.
We have found the signatures of two transitions, one at Tc =57 K and one at TN = 58 K. At Tc the nonlinear susceptibilityrevealed that a ferromagnetic component emerges in the
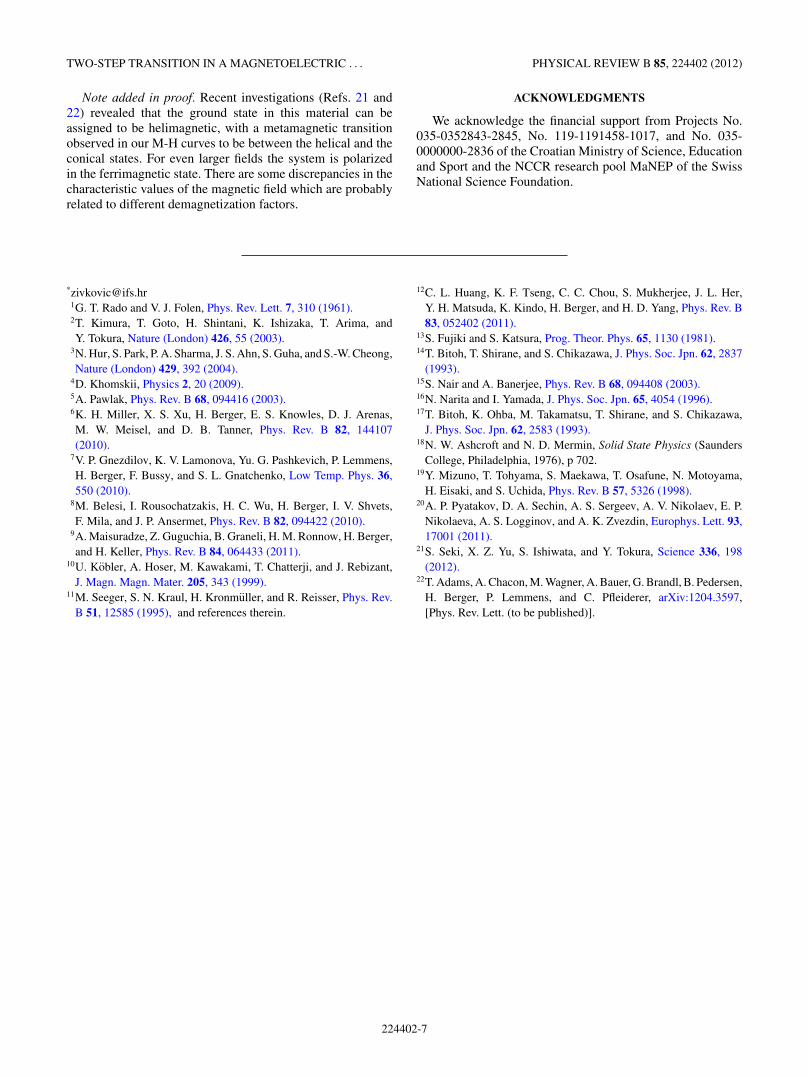
TABLE I. Cu-O-Cu bridges in Cu2OSeO3. The bridges betweenthe horizontal lines form a single magnetic interaction.
Type Angle (deg) Distance (A)
CuI-O(2)-CuII 117.9 1.909/2.038CuI-O(1)-CuII 107.8 1.925/1.854CuI-O(3)-CuII 94.15 2.082/2.089CuII-O(1)-CuII 111.05 1.854CuII-O(2)-CuII 99.92 2.038CuII-O(4)-CuII 94.77 1.896
system which is in agreement with previous neutron5 andμSR9 studies. We can consider that for T < Tc the system isin a ferrimagnetic 3-up-1-down state with moments pointingalong the space diagonal.5 The cubic symmetry is maintaineddown to the lowest temperatures,5,8 which means that there arefour equivalent space diagonals and each diagonal can havetwo directions of the composite moment. The minimization ofthe free energy will result in the creation of domains with eightpreferential directions. The rise of the linear component of thesusceptibility below Tc for small fields can then be understoodas a consequence of the dynamics of domain walls.
Let us now discuss the possible origin of the transition at TN .It is characterized by a sharp drop in the linear component ofthe susceptibility, observed for all the investigated directions([100], [110], and [111]). The nonlinear component of thesusceptibility displays a divergentlike branch below TN anda nondivergent branch above TN , which are characteristicfeatures for a transition to the antiferromagnetic state.13,16
However, for a simple, canonical easy-axis antiferromagnet18
one would expect for linear components χ[100]1 and χ [110],
although not perpendicular to [111], to show a noticeabledifference compared to χ
[111]1 .
The mean-field approach, suggested by Belesi and co-workers,8 takes into account only two types of interactions,CuI-CuII (AFM) and CuII-CuII (FM). However, a carefulinspection of the crystal structure reveals that there are severalCu-O-Cu bridges that can influence the magnetic behaviorof the system. In Table I we list the associated anglesand distances, grouped to form NN interactions. Accordingto the Goodenough-Kanamori-Anderson rule, the exchangeinteraction J changes from AFM to FM as the Cu-O-Cu angleapproaches 90◦. The exact angle where J changes sign lies inthe range 95◦–99◦ and is also dependent on the influence ofthe neighboring orbitals.19
The presumed equivalence of all the AFM interactionsbetween the central CuI moment and six NN CuII moments isnot correct. The single bridge over the O(2) ion on one side canbe estimated to be AFM with a moderate strength. However,on the other side there are two bridges, over O(1) and O(3)ions. The coupling over O(1) is also AFM but because of asmaller angle it is weaker in comparison with the O(2) bridge.Additionally, the angle over O(3) indicates the FM coupling,further reducing the total exchange constant (Fig. 7).
Following the same arguments, the presumed single-FMinteraction between the NN CuII moments needs to berevisited. Again there are three bridges forming two exchangeinteractions. For the bridge over O(1) the angle is ∼111◦,indicating an AFM coupling. Since the CuII moments form
224402-5

I. ZIVKOVIC, D. PAJIC, T. IVEK, AND H. BERGER PHYSICAL REVIEW B 85, 224402 (2012)
FIG. 7. (Color online) Local environment around CuI and CuII
ions in Cu2OSeO3.
a triangle, there is induced frustration. A single interactionis mediated via O(2) and O(4) bridges and its sign cannotbe estimated easily. Considering the angles over O(2) andO(4), the couplings should be AFM and FM, respectively, butthe exact calculation is needed to determine which type isdominant.
Such a configuration of NN interactions can, in principle,be approximated with a mean-field theory so that on averageone FM and one AFM interaction describe well the high-temperature behavior. However, close to the transition onewould expect that the details of the couplings start to playan important role. This can explain the overestimation of thecritical temperature in the mean-field model.8
Below Tc, in the ferrimagnetic state, the magnetizationgrows linearly when the dc magnetic field is applied. Ourresults show that all principal directions have very similar M-Hslope. We attribute this to the formation of domains along fourequivalent space diagonals of the cube. Since each diagonal canhave two directions of the composite moment in a ferrimagnet,we have eight preferred domain orientations in total for H = 0.The application of a small magnetic field causes domain wallsto move, increasing the volume of domains preferentiallyoriented in the direction of the field. As the temperature islowered, the pinning of domain walls becomes important,giving rise to the observed FC-ZFC splitting. Also, dependingon the orientation of the applied field, there will be one +three ([111] + [111], [111], [111]), two ([111], [111]), orfour ([111], [111], [111], [111]) preferred domains for H ‖[111], [110], and [100], respectively. This means that therewill be a value of the magnetic field H meta where the samplewill consist of only preferred domains and for H > H meta thedomains will start to collectively rotate toward the direction ofthe magnetic field. We suggest that this process is responsiblefor the observed metamagnetic transition in the range 200–500Oe, depending on the orientation.
At a sufficiently high field a crossover to a plateau occurs,where the crossover field and the magnetization of the plateauincrease as the temperature is decreased. We have foundthat the magnetization of the plateau is well described by apower law [see Eq. (1)], similar to the zero-field μSR study.9
This is easily understood if we take into account that theinternal fields sensed by muons are dominated by domains,irrespective of their orientation. Polarizing the sample andmeasuring its total magnetization should then give the same
temperature dependence. However, a surprising shift of thecritical temperature from 57 K in zero-field conditions9 to 60 Kat H = 1000 Oe is observed. We can speculate that in zerofield the ferromagnetic fluctuations are suppressed due to thefrustration between the CuII moments, producing the inflectionpoint at 59 K and avoiding the criticality. The application of asmall field is enough to disturb the delicate balance within theinteractions in the system and the critical temperature rises up.
In closing, we would like to discuss how our resultsrelate to the observed magnetoelectric effect in Cu2OSeO3.The frequency-independent dielectric response suggests anabsence of dielectric relaxation processes in the Hz–MHzregion, both above and below the two magnetic transitions. Wewere not able to observe a substantial influence of the magnetictransitions on the value of the dielectric constant. In the initialreport Bos and co-workers claimed5 that after subtraction ofthe lattice contribution εr exhibited a critical behavior aroundTN . Together with the evidence that in zero magnetic fieldthe magnetic subsystem shows avoided criticality, we findit questionable whether any kind of criticality exists in thedielectric subsystem. However, the observed maximum around45 K and the decrease of the dielectric constant below it, whichhave been also observed on the powdered sample, do suggestthe existence of a weak magnetoelectric effect. It is interestingto note that a sizable magnetocapacitance of the powder occursonly below 1000 Oe (Ref. 5). We have demonstrated thatthis field range is characterized by the presence of domainsand domain walls. Thus, we propose that the magnetoelectriceffect in Cu2OSeO3 arises as a consequence of the rotationof magnetic moments within domain walls. As they spiralfrom one orientation to another, the (local) spatial symmetryis broken, which allows the emergence of the polarization in asimilar fashion, as has been demonstrated in TbMnO3 (Ref. 2).Recently, it has been shown that such a scenario is realizedin iron-garnet thin films.20 This way a rather small changeof the dielectric constant can be naturally explained sincedomain walls occupy only a small fraction of the sample’svolume. Further studies are needed to clarify the details of themagnetoelectric coupling.
V. CONCLUSIONS
We have presented a detailed single-crystal magnetizationand susceptibility study of Cu2OSeO3. Our results suggest thatthe transition from the paramagnetic to the ordered state ismore complicated than previously reported. The mean-fieldapproach, with one FM and one AFM interaction, workswell at higher temperatures. However, close to the transitionit is important to take into account more realistic magneticcouplings between the copper ions.
Below the transition the magnetic dynamics is dominated bythe presence of domains and domain walls. A rather small fieldof 1000 Oe is enough to drive the system in a single-domainstate, where the magnetization follows the critical behaviorand a critical exponent β ≈ 0.39 can be extracted, as publishedbefore.9
The dielectric measurements showed that below the mag-netic transition the dielectric constant deviates from thehigh-temperature behavior, suggesting a weak magnetoelectriceffect related to the presence of domain walls.
224402-6
TWO-STEP TRANSITION IN A MAGNETOELECTRIC . . . PHYSICAL REVIEW B 85, 224402 (2012)
Note added in proof. Recent investigations (Refs. 21 and22) revealed that the ground state in this material can beassigned to be helimagnetic, with a metamagnetic transitionobserved in our M-H curves to be between the helical and theconical states. For even larger fields the system is polarizedin the ferrimagnetic state. There are some discrepancies in thecharacteristic values of the magnetic field which are probablyrelated to different demagnetization factors.
ACKNOWLEDGMENTS
We acknowledge the financial support from Projects No.035-0352843-2845, No. 119-1191458-1017, and No. 035-0000000-2836 of the Croatian Ministry of Science, Educationand Sport and the NCCR research pool MaNEP of the SwissNational Science Foundation.
*[email protected]. T. Rado and V. J. Folen, Phys. Rev. Lett. 7, 310 (1961).2T. Kimura, T. Goto, H. Shintani, K. Ishizaka, T. Arima, andY. Tokura, Nature (London) 426, 55 (2003).
3N. Hur, S. Park, P. A. Sharma, J. S. Ahn, S. Guha, and S.-W. Cheong,Nature (London) 429, 392 (2004).
4D. Khomskii, Physics 2, 20 (2009).5A. Pawlak, Phys. Rev. B 68, 094416 (2003).6K. H. Miller, X. S. Xu, H. Berger, E. S. Knowles, D. J. Arenas,M. W. Meisel, and D. B. Tanner, Phys. Rev. B 82, 144107(2010).
7V. P. Gnezdilov, K. V. Lamonova, Yu. G. Pashkevich, P. Lemmens,H. Berger, F. Bussy, and S. L. Gnatchenko, Low Temp. Phys. 36,550 (2010).
8M. Belesi, I. Rousochatzakis, H. C. Wu, H. Berger, I. V. Shvets,F. Mila, and J. P. Ansermet, Phys. Rev. B 82, 094422 (2010).
9A. Maisuradze, Z. Guguchia, B. Graneli, H. M. Ronnow, H. Berger,and H. Keller, Phys. Rev. B 84, 064433 (2011).
10U. Kobler, A. Hoser, M. Kawakami, T. Chatterji, and J. Rebizant,J. Magn. Magn. Mater. 205, 343 (1999).
11M. Seeger, S. N. Kraul, H. Kronmuller, and R. Reisser, Phys. Rev.B 51, 12585 (1995), and references therein.
12C. L. Huang, K. F. Tseng, C. C. Chou, S. Mukherjee, J. L. Her,Y. H. Matsuda, K. Kindo, H. Berger, and H. D. Yang, Phys. Rev. B83, 052402 (2011).
13S. Fujiki and S. Katsura, Prog. Theor. Phys. 65, 1130 (1981).14T. Bitoh, T. Shirane, and S. Chikazawa, J. Phys. Soc. Jpn. 62, 2837
(1993).15S. Nair and A. Banerjee, Phys. Rev. B 68, 094408 (2003).16N. Narita and I. Yamada, J. Phys. Soc. Jpn. 65, 4054 (1996).17T. Bitoh, K. Ohba, M. Takamatsu, T. Shirane, and S. Chikazawa,
J. Phys. Soc. Jpn. 62, 2583 (1993).18N. W. Ashcroft and N. D. Mermin, Solid State Physics (Saunders
College, Philadelphia, 1976), p 702.19Y. Mizuno, T. Tohyama, S. Maekawa, T. Osafune, N. Motoyama,
H. Eisaki, and S. Uchida, Phys. Rev. B 57, 5326 (1998).20A. P. Pyatakov, D. A. Sechin, A. S. Sergeev, A. V. Nikolaev, E. P.
Nikolaeva, A. S. Logginov, and A. K. Zvezdin, Europhys. Lett. 93,17001 (2011).
21S. Seki, X. Z. Yu, S. Ishiwata, and Y. Tokura, Science 336, 198(2012).
22T. Adams, A. Chacon, M. Wagner, A. Bauer, G. Brandl, B. Pedersen,H. Berger, P. Lemmens, and C. Pfleiderer, arXiv:1204.3597,[Phys. Rev. Lett. (to be published)].
224402-7


![OSEO Rapport Annuel 2009[1]](https://img.pdfslide.fr/doc/110x75/5571fc9e4979599169979d4b/oseo-rapport-annuel-20091.jpg)