Embed Size (px)
Citation preview
Posterior transformation, neurological abnormalities, and severe hematopoi.etic defects in mice with a targeted deletion of the bmi-1 proto-oncogene Nathalie M.T. van der Lugt, 1 Jos D o m e n , 1'2 Koert Linders) Marian van Roon, 1 Els Robanus-Maandag, 1 He in te Riele, ~ Mart in van der Valk, 1 Jacqueline D e s c h a m p s , 3 Michae l Sofroniew, 4 Maarten van Lohuizen , ~,5 and A n t o n Berns 1'4
1Department of Molecular Genetics, The Netherlands Cancer Institute, 1066 CX Amsterdam, The Netherlands; ~Department of Pathology, Beckman Center B263, Stanford University, Stanford, California 94305-5428 USA; 3Hubrecht Laboratory, 3584 CT Utrecht, The Netherlands; 4Somatix Therapy Corporation, Alameda, California 94501 USA; 5University of California at San Francisco School of Medicine, Department of Biochemistry and Biophysics, San Fransisco, California 94143-0448 USA
The bmi-1 proto-oncogene has been implicated in B-cell lymphomagenesis in E~t-myc transgenic mice. Distinct domains of the Bmi-1 protein are highly conserved within the Drosophila protein Posterior Sex Combs, a member of the Polycomb group involved in maintaining stable repression of homeotic genes during development. We have inactivated the bmi-1 gene in the germ line of mice by homologous recombination in ES cells. Null mutant mice display three phenotypic alterations: (1) a progressive decrease in the number of hematopoietic cells and an impaired proliferative response of these cells to mitogens; (2) neurological abnormalities manifested by an ataxic gait and sporadic seizures; and (3) posterior transformation, in most cases along the complete anteroposterior axis of the skeleton. The observations indicate that Bmi-1 plays an important role in morphogenesis during embryonic development and in hematopoiesis throughout pre- and postnatal life. Furthermore, these data provide the first evidence of functional conservation of a mammalian Polycomb group homolog.
[Key Words: Targeted disruption; bmi-1; posterior transformation; hematopoiesis; IL-7; cerebellum]
Received December 2, 1993; revised version accepted February 3, 1994.
The bmi-1 gene was identified as a common proviral integration site in Moloney murine leukemia virus (Mo- MuLV)-induced B-cell lymphomas in El~-myc transgenic mice (Haupt et al. 1991; van Lohuizen et al. 1991a). In 35% of these B-cell lymphomas, proviral insertions are found in close proximity of the bmi-1 gene, resulting in enhanced transcription of bmi.I. In most tissues, low levels of the bmi-1 mRNA are detected, whereas higher mRNA levels are found in thymus, heart, brain, and tes- tes. bmi-1 is also expressed in embryonic stern (ES) cells during embryonic development and in placenta. The bmi-1 gene encodes a nuclear protein of 324 amino acids that harbors several motifs found in transcriptional reg- ulators, including an unusual zinc finger motif shared by several diverse nuclear proteins (van Lohuizen et al. 1991a}.
A close relative is me1-18, a gene cloned from a mela- noma cell line (Tagawa et al. 1990; Goebl 1991). The mouse Bmi-1 protein has 70% identity with the Mel-18 protein, reel-18 mRNA is detected in brain, testes, lung, and kidney (M. Alkema, pers. comm.).
Bmi-l-specific motifs are conserved in the Posterior Sex Combs (Psc) protein from Drosophila melanogaster (Jfirgens et al. 1985; Adler et al. 1991; Brunk et al. 1991). The conserved domains between Bmi-1 and Psc are lo- cated in the amino-terminal part of the much larger Psc protein and are also found in the Suppressor-2 of Zeste [Su(z)2] protein from Drosophila (Adler et al. 1989; Wu et al. 1989; Brunk et a1.1991; van Lohuizen et al. 1991b). Drosophila loss-of-function mutants of Psc are embry- onic lethals displaying head defects and partial transfor- mation of several segments into more posterior ones, as well as partial ventral-to-dorsal transformations (Jfirgens et al. 1985; Adler et al. 1989, 1991). Psc belongs to the Polycomb group (Pc-G), the members of which are in- volved in maintaining homeotic genes in the suppressed state after their local down-regulation at a specific time during development (Lewis 1978; Paro 1990; Zink et al. 1991). These data suggest that Bmi-1 could be involved in the regulation of expression of murine homeotic genes.
To gain more insight into the function of Bmi-1, we
GENES & DEVELOPMENT 8:757-769 © 1994 by Cold Spring Harbor Laboratory Press ISSN 0890-9369/94 $5.00 757
Cold Spring Harbor Laboratory Press on January 29, 2022 - Published by genesdev.cshlp.orgDownloaded from
van det Lugt et al.
have inactivated the bmi-1 gene in mice by homologous recombination in ES cells. Here, we report on the phe- notypic alterations seen in hematopoietic organs, the nervous system, and the axial skeleton of bmi-1 - / - mice.
Results
Generation of bmi-1 null mu tan t mice
To inactivate the bmi-1 gene in ES cells, two replace- ment-type targeting constructs were made (Fig. 1B). The deletion of the majority of the coding region, including the AUG start codon, the zinc finger motif, and part of the helix-turn-helix motif, is expected to result in a gen- uine null mutant of the gene. Upon electroporation of the targeting constructs into ES cells, hygromycin- and G418-resistant clones were expanded and screened for homologous recombination events by Southern blot hy- bridization (by use of probe B; see Fig. 1A). As shown in Figure 2a, successfully targeted ES cell clones were ob- tained with both the Hyg and Neo construct. In 14% of
the clones analyzed, the 8.5-kb wild-type HindlII frag- ment was replaced by either a 8.2- or a 7.5-kb HindIII- KpnI fragment, respectively. Two HygR-and two G418 R- targeted ES cell clones were used to generate chimeric mice. Chimeras transmitting the targeted bmi-1 allele to their offspring were obtained with each ES cell clone injected into C57B1/6 blastocysts. Chimeric males were crossed with either 129/Ola or FVB female mice to gen- erate inbred or outbred offspring, respectively. Heterozy- gous bmi-1 mutant mice were obtained at the expected frequency (121 of 256 pups born) and appeared healthy and fertile. Crossbreeding of heterozygous bmi-1 mutant mice resulted in birth of mice homozygous for the bmi-1 mutant allele (bmi-1 - / - ) {Fig. 2b). Rehybridization of the blot shown in Figure 2b with a probe located in the region that was deleted from the targeting construct proved that this coding region was absent in the bmi-1 - / - genome (Fig. 2c). Northern analysis with a bmi-1 eDNA probe (comprising exons 2-9} revealed no bmi-1 transcripts present in spleen, testis, liver, and brain of bmi-1 - / - mice and no Bmi-1 protein could be detected by Western blot analysis of nuclear extracts of brain and
(A)
B H N NB B H K
II I I | ~ n.h, , .
~ 8.5kb
RV H B N
! LI I t
l k b
(S) B RV RV K RV H B N
!i I t
~)
B RV K RV B N
B H N NB RV RVK RV H B
il ID i l t • • 8 . 2 k b ~. .,, 6 .6kb
H B H N N B RV K RV H B N
J If IDt l !J i 4 ~ 7 . 5 k b q .~ 6 .6kb
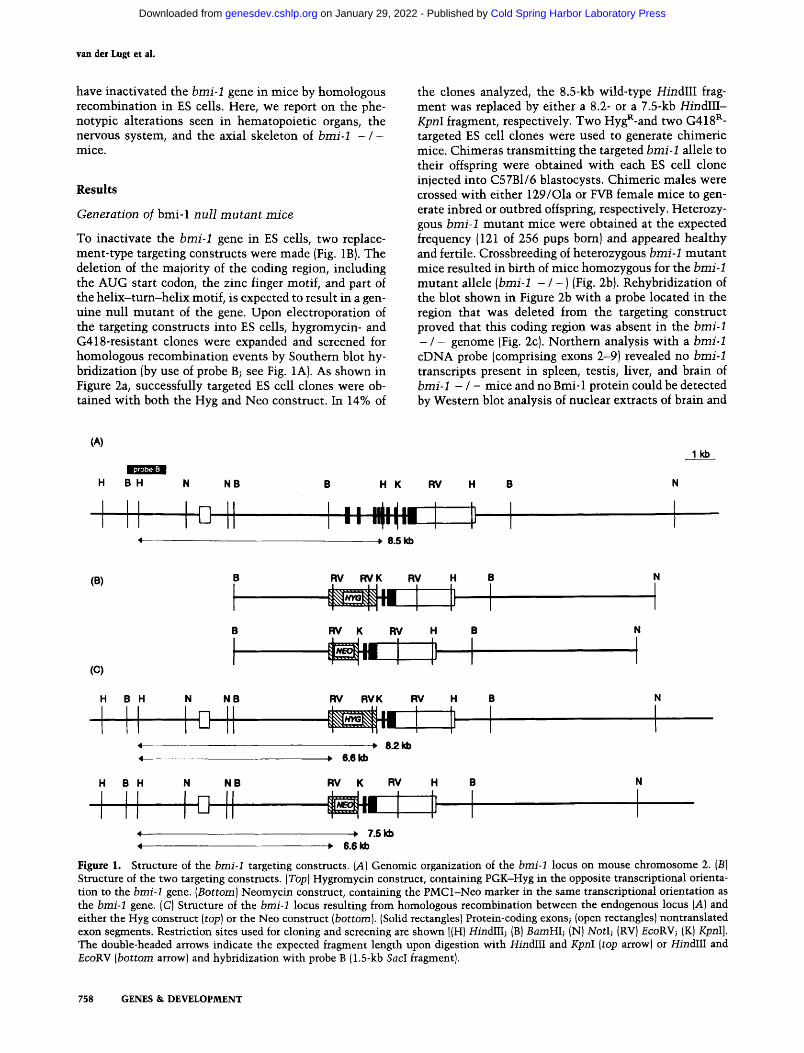
F igure 1. Structure of the bmi-1 targeting constructs. (A) Genomic organization of the bmi-1 locus on mouse chromosome 2. (B) Structure of the two targeting constructs. (Top) Hygromycin construct, containing PGK-Hyg in the opposite transcriptional orienta- tion to the bmi-1 gene. (Bottom) Neomycin construct, containing the PMC1-Neo marker in the same transcriptional orientation as the bmi-1 gene. (C) Structure of the bmi-1 locus resulting from homologous recombination between the endogenous locus (A) and either the Hyg construct (top) or the Neo construct (bottom). (Solid rectangles) Protein-coding exons; (open rectangles) nontranslated exon segments. Restriction sites used for cloning and screening are shown [(H) HindlII; (B) BamHI; (N) NotI; (RV) EcoRV; (K) KpnI]. The double-headed arrows indicate the expected fragment length upon digestion with HindIU and KpnI (top arrow) or HindIII and EcoRV (bottom arrow) and hybridization with probe B (1.5-kb SacI fragment).
758 GENES & DEVELOPMENT
Cold Spring Harbor Laboratory Press on January 29, 2022 - Published by genesdev.cshlp.orgDownloaded from
+/4" +/- +/-
kb
- e - - - 8.5 ~ 8 . 2
-9~--Z5
X lit/K4ml
+/+ +/- 4- +/- ~+ +/- +/. ../. ÷/.
kb
- I - - - 8 .5
.,i----b.6
H I I I /RV
+/~ +/- -/- ÷/- +/÷ ÷/- ÷/. -/- ÷Io
~ - - - 8.5
H l i t /RV
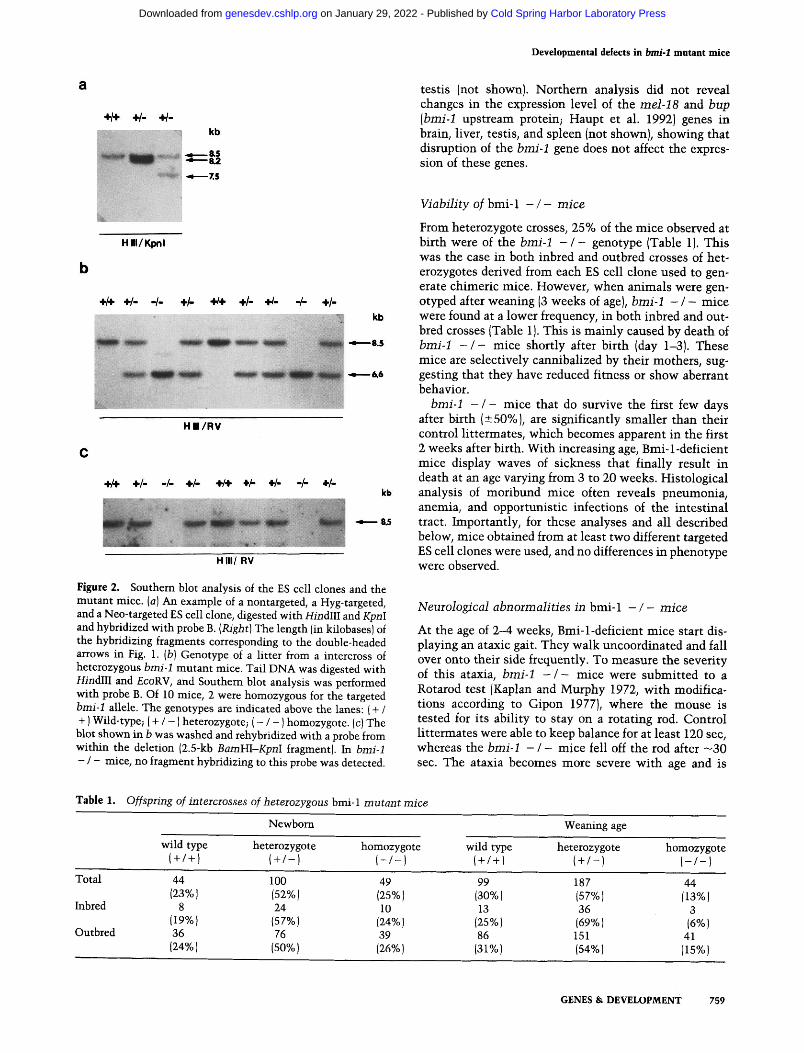
Figure 2. Southern blot analysis of the ES cell clones and the mutant mice. (a) An example of a nontargeted, a Hyg-targeted, and a Neo-targeted ES cell clone, digested with HindIII and KpnI and hybridized with probe B. (Right) The length {in kilobases) of the hybridizing fragments corresponding to the double-headed arrows in Fig. 1. (b) Genotype of a litter from a intercross of heterozygous bmi-1 mutant mice. Tail DNA was digested with HindlII and EcoRV, and Southern blot analysis was performed with probe B. Of 10 mice, 2 were homozygous for the targeted bmi-1 allele. The genotypes are indicated above the lanes: { + / +) Wild-type; (+ / - ) heterozygote; ( - / - ) homozygote. (c) The blot shown in b was washed and rehybridized with a probe from within the deletion (2.5-kb BamHI-KpnI fragment). In bmi-1 - / - mice, no fragment hybridizing to this probe was detected.
Developmental defects in brai-1 mutant mice
testis (not shown). Northern analysis did not reveal changes in the expression level of the mel-18 and bup (bmi-1 upstream protein; Haupt et al. 1992) genes in brain, liver, testis, and spleen (not shown), showing that disruption of the bmi-1 gene does not affect the expres- sion of these genes.
Viabi l i ty of bmi-1 - / - m i c e
From heterozygote crosses, 25% of the mice observed at birth were of the bmi-1 - / - genotype (Table 1). This was the case in both inbred and outbred crosses of het- erozygotes derived from each ES cell clone used to gen- erate chimeric mice. However, when animals were gen- otyped after weaning (3 weeks of age), bmi-1 - / - mice were found at a lower frequency, in both inbred and out- bred crosses (Table 1). This is mainly caused by death of bmi-1 - / - mice shortly after birth (day 1-3). These mice are selectively cannibalized by their mothers, sug- gesting that they have reduced fitness or show aberrant behavior.
bmi-1 - / - mice that do survive the first few days after birth (+50%), are significantly smaller than their control littermates, which becomes apparent in the first 2 weeks after birth. With increasing age, Bmi-1-deficient mice display waves of sickness that finally result in death at an age varying from 3 to 20 weeks. Histological analysis of moribund mice often reveals pneumonia, anemia, and opportunistic infections of the intestinal tract. Importantly, for these analyses and all described below, mice obtained from at least two different targeted ES cell clones were used, and no differences in phenotype were observed.
Neurological abnormal i t ies in bmi-1 - / - mice
At the age of 2-4 weeks, Bmi-l-deficient mice start dis- playing an ataxic gait. They walk uncoordinated and fall over onto their side frequently. To measure the severity of this ataxia, bmi-1 - / - mice were submitted to a Rotarod test (Kaplan and Murphy 1972, with modifica- tions according to Gipon 1977), where the mouse is tested for its ability to stay on a rotating rod. Control littermates were able to keep balance for at least 120 sec, whereas the bmi-1 - / - mice fell off the rod after - 3 0 sec. The ataxia becomes more severe with age and is
Table 1. Offspring of intercrosses of heterozygous bmi-1 mutant mice
Newborn Weaning age
wild type heterozygote homozygote wild type heterozygote homozygote (+ /+) ( + / - ) { - / - ) (+/+1 ( + / - ) I - / - 1
Total 44 100 49 99 187 44 (23%) (52%) (25%) (30%) {57%) (13%)
Inbred 8 24 10 13 36 3 {19%) {57%) {24%) (25%) (69%) (6%)
Outbred 36 76 39 86 151 41 (24%) (50%) (26%) (31%) (54%) (15%)
GENES & DEVELOPMENT 759
Cold Spring Harbor Laboratory Press on January 29, 2022 - Published by genesdev.cshlp.orgDownloaded from
van der Lugt et al.
accompanied by sporadic epileptic-like seizures and tremors.
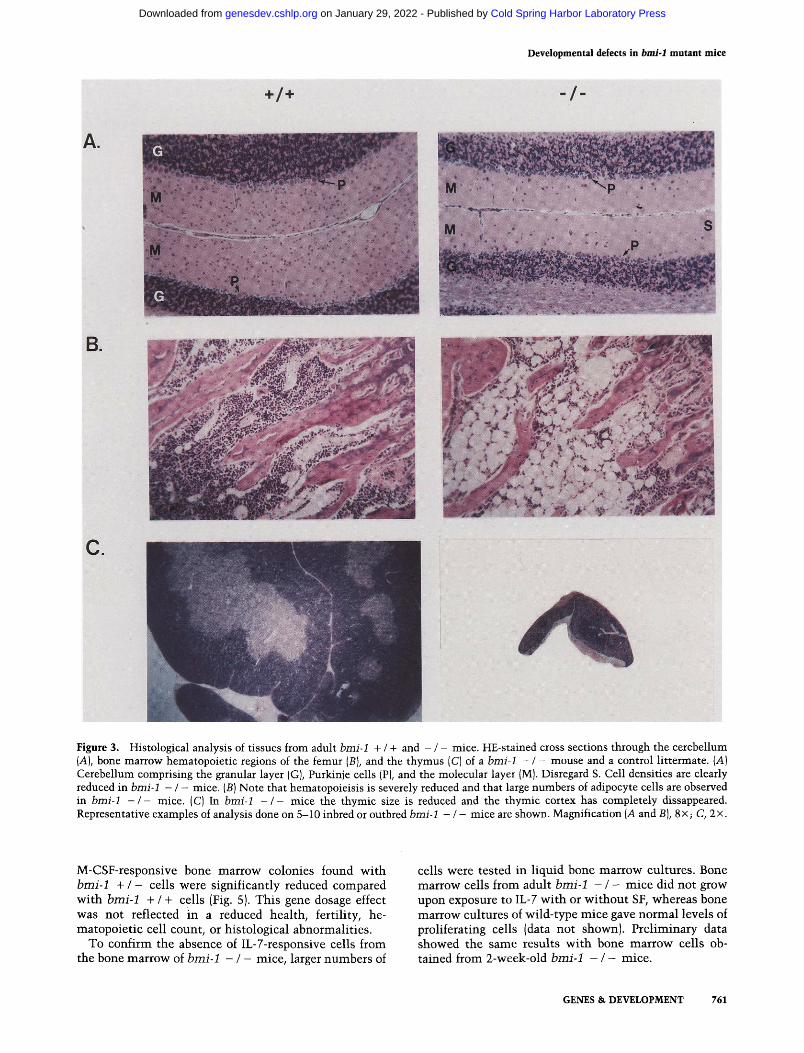
Histological analysis of the cerebral cortex, the spinal cord, and the peripheral nerves of the hindlegs did not reveal clear alterations in the b m i - 1 - / - mice. The cerebellum however, a major motor coordination center, showed clear abnormalities in Bmi-1-deficient mice. The cell density in the different layers of the cerebellum was significantly decreased in b m i - 1 - / - mice compared with control littermates (Fig. 3A). Most pronounced was the reduction in thickness of the molecular layer with massive loss of neurons. In addition, Purkinje cells were markedly shrunken and reduced in number. In the hip- pocampus of some but not all b m i - 1 - / - mice, dark shrunken and degenerating neurons were observed. Im- munohistological analysis indicated that major white matter tracts, such as the corpus callosum, showed ex- tensive gliosis in the form of many glial fibrillary acidic protein (GFAP)-positive reactive astrocytes [not shown).
H e m a t o p o i e t i c a b n o r m a l i t i e s
Macroscopic examination of 2- to 3-month-old (further referred to as adult) b m i - 1 - / - mice showed a severely involuted thymus and a significantly smaller spleen size as compared with wild-type or heterozygous littermates. Histological analysis showed severe hypoplasia of the thymic cortex (Fig. 3C) and of both the red and white pulp regions of the spleen. However, the morphological changes observed in bone marrow were most profound. In tibiae, femurs, pelvis, and even vertebrae of these mice, regions of hematopoiesis were severely hypoplas- tic and occupied by adipocytes IFig. 3B}. This was ob- served both in adult and in 2-week-old b m i - 1 - / - mice.
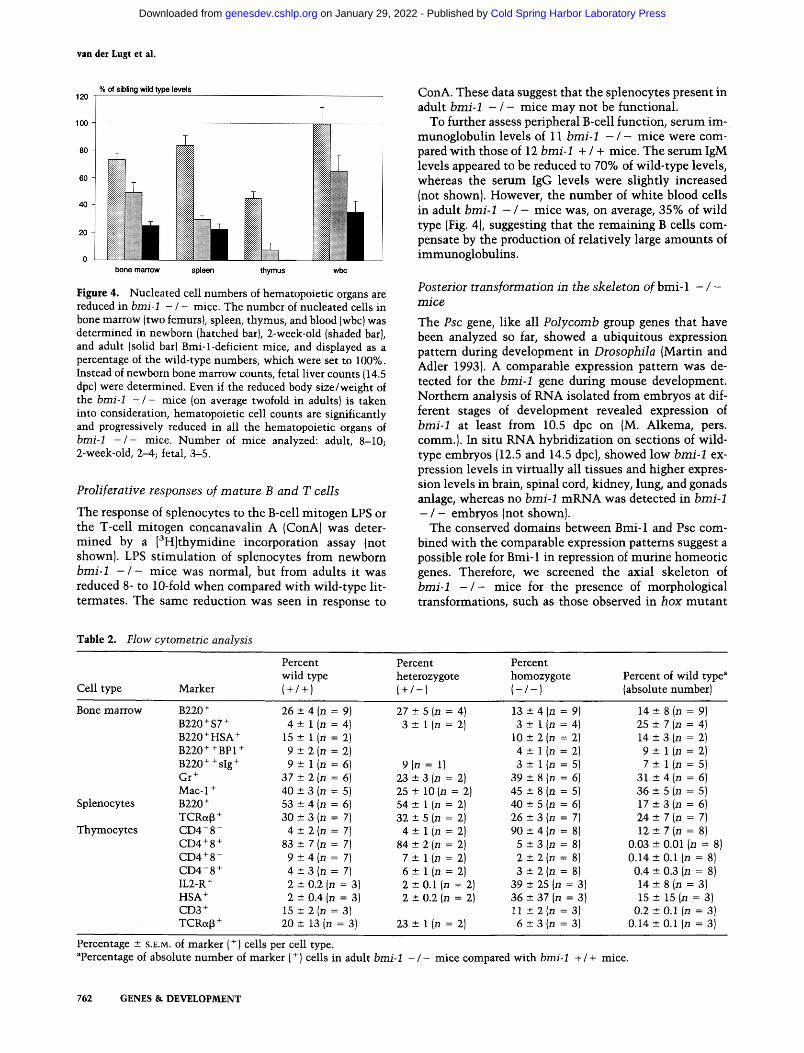
Nucleated cells were quantitated in peripheral blood, in bone marrow obtained from femurs and tibiae, and in cell suspensions of thymus and spleen of mice at differ- ent ages. From early on in development the hematopoi- etic cell counts were reduced in b m i - 1 - / - mice, and a further progressive decrease was observed: In the adult the cell counts were reduced to -30% of wild-type lev- els, and the number of thymocytes even decreased to <1% (Fig. 4). The determination of red blood cell counts and several other blood parameters (hemoglobin concen- tration, hematocrit, platelet count, and mean red blood cell volume) did not reveal abnormalities in b m i - 1 - / -
mice (not shown). To determine whether specific cell populations were
affected in Bmi-1-deficient mice, flow cytometric analy- sis (FACS) of thymocytes, splenocytes, and bone marrow cells was performed with standard lymphoid and my- eloid markers (Table 2). The immature C D 4 - / C D 8 - thymocyte population is increased from 4% of total cells in b m i - 1 + / + mice to 90% of total cells in b m i - 1 - / -
mice, although in absolute numbers, this population size is decreased to 12% of wild-type [Table 2). On average, one-third of these immature C D 4 - / C D 8 - thymocytes stain positive for the interleukin-2 (IL2) receptor and one-third for heat stable antigen (HSA). The presence in b m i - 1 - / - mice of mainly immature thymocytes sug-
gests that these cells fail to mature either as a direct result of the absence of Bmi-1 from these cells or by the overall stress imposed on these animals by the absence of Bmi- 1.
In bone marrow of b m i - 1 - / - mice the absolute numbers of both B lymphoid (B220 + ) and myeloid (Mac- 1 +, Gr +) cell populations were significantly reduced to 14 and -30% of wild-type levels, respectively [Table 2). A more detailed analysis of B-cell populations as defined by Hardy et al. (1991) was performed. The absolute num- ber of immature B cells (B220+/HSA + and B220+/ BP1 + ), as well as the number of mature B cells (B220 + + / sIg+), was significantly reduced in b m i - 1 - / - mice compared with wild-type mice. However, the most im- mature cell population (B220 +/$7 +) was decreased to a lesser extent, indicating that with increasing matura- tion, B-cell populations are affected more severely. How- ever, it is important to stress that B cells of all matura- tion stages that we could identify were found in b m i - 1
- / - mice. FACS analysis of splenocytes of b m i - 1 - / - mice
shows that both the B- and T-cell compartments are re- duced in size although their relative percentages have not changed dramatically (53-40% and 30-26%, respec- tively).
F u n c t i o n a l a n a l y s i s o f b o n e m a r r o w c e l l s
Bone marrow colony assays were performed to compare growth factor responses of hematopoietic cells of b m i - 1
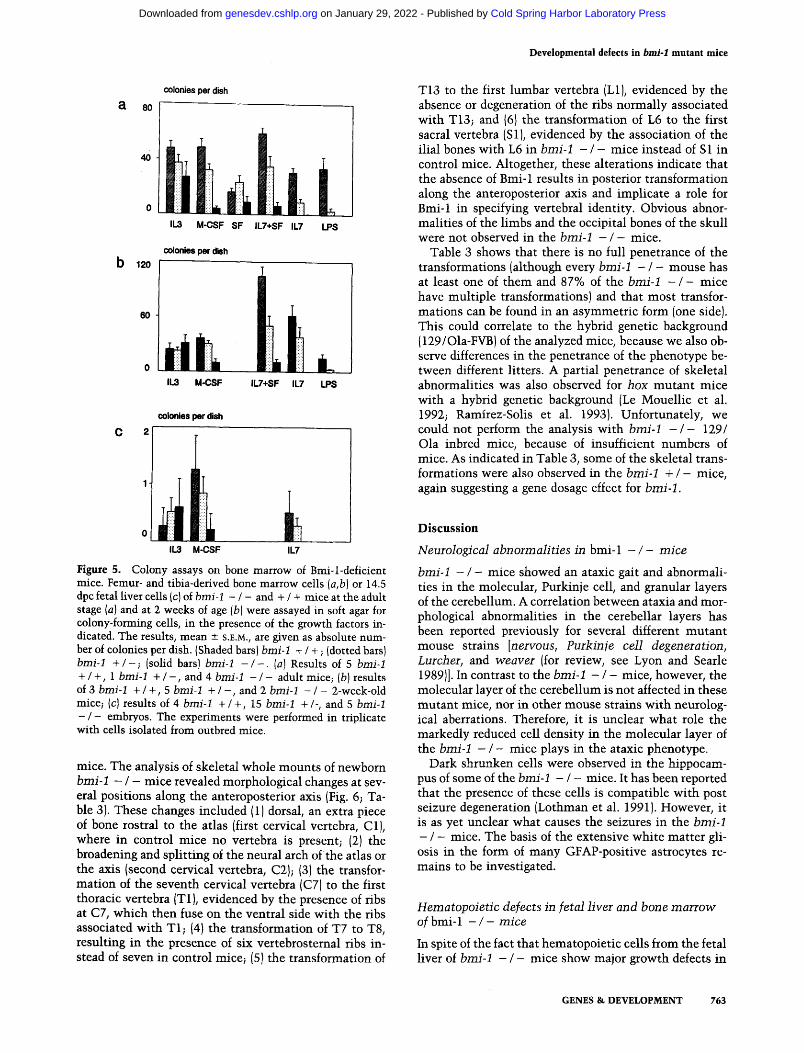
- / - mice and control littermates (Fig. 5a, b). Freshly isolated bone marrow cells were cultured in soft agar in the presence of either interleukin-3 (IL-3), macrophage colony-stimulating-factor (M-CSF), steel factor (SF), in- terleukin-7 (IL-7), or lipopolysaccharide (LPS), and at day 8, the number of colonies was determined. Bone marrow cells of b m i - 1 - / - mice did not respond to IL-7, which normally induces pre-B-cell colonies (Lee et al. 1989; Suda et al. 1989). The response to IL-7 + SF, which also induces more primitive cells to differentiate into pre-B cells (McNiece et al. 1991), was changed: In the absence of Bmi-1, few colonies were present, and these consisted predominantly of neutrophils. This was also seen with wild-type bone marrow in response to SF only. Further- more, no colonies were obtained in response to LPS, in- dicating that functional mature B cells were virtually absent from b m i - 1 - / - bone marrow. The number of myeloid (macrophagel colonies induced by L-cell-condi- tioned medium, containing M-CSF (Stanley et al. 1983), was reduced 4- to 10-fold in b m i - 1 - / - mice as com- pared with wild type. The number of IL-3-responsive col- onies was not reduced significantly in b m i - 1 - / - mice.
An impaired response to IL-7 and M-CSF (P= 0.03 and P = 0.05, respectively) was also observed in colony assays of fetal liver cells [14.5 days postcoitum (dpc)], whereas the response to IL-3 was normal (Fig. 5c). This shows that defects in hematopoiesis in b m i - 1 - / - mice start early in development and are not a consequence of over- all growth retardation of the animals.
Interestingly, also the numbers of IL-7-, LPS- and
760 GENES & DEVELOPMENT
Cold Spring Harbor Laboratory Press on January 29, 2022 - Published by genesdev.cshlp.orgDownloaded from
Developmental defects in bmi-1 mutant mice
+/+ "1-
Am
BD
C. II
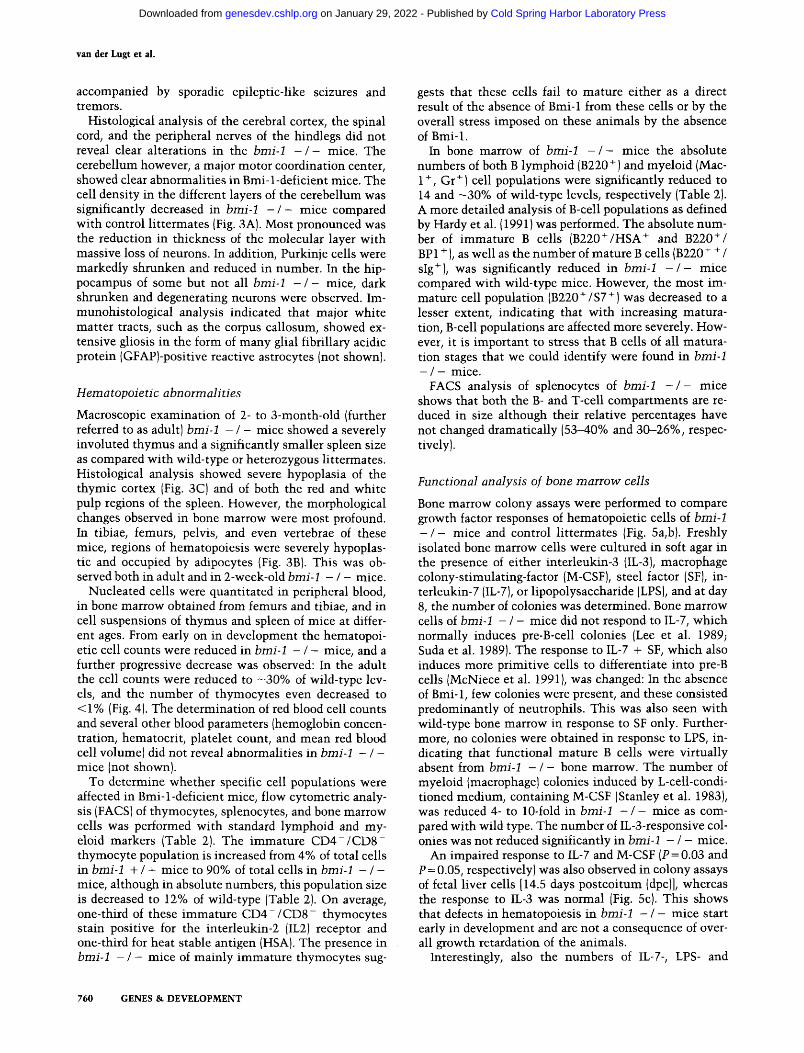
Figure 3. Histological analysis of tissues from adult b m i - I + / + and - / - mice. HE-stained cross sections through the cerebellum (A), bone marrow hematopoietic regions of the femur (B), and the thymus (C) of a b m i - 1 - / - mouse and a control littermate. (A} Cerebellum comprising the granular layer (G), Purkinje cells (P), and the molecular layer (M). Disregard S. Cell densities are clearly reduced in b m i - 1 - / - mice. (B) Note that hematopoieisis is severely reduced and that large numbers of adipocyte cells are observed in b m i - 1 - / - mice. (C) In b m i - I - / - mice the thymic size is reduced and the thymic cortex has completely dissappeared. Representative examples of analysis done on 5-10 inbred or outbred b m i - 1 - / - mice are shown. Magnification (A and B), 8 x; C, 2 x.
M-CSF-responsive bone marrow colonies found with b m i - 1 + / - cells were significantly reduced compared with b m i - 1 + / + cells (Fig. 5). This gene dosage effect was not reflected in a reduced health, fertility, he- matopoietic cell count, or histological abnormalities.
To confirm the absence of IL-7-responsive cells from the bone marrow of b m i - 1 - / - mice, larger numbers of
cells were tested in liquid bone marrow cultures. Bone marrow cells from adult b m i - 1 - / - mice did not grow upon exposure to IL-7 with or wi thout SF, whereas bone marrow cultures of wild-type mice gave normal levels of proliferating cells (data not shown). Prel iminary data showed the same results wi th bone marrow cells ob- tained from 2-week-old b m i - 1 - / - mice.
GENES & DEVELOPMENT 761
Cold Spring Harbor Laboratory Press on January 29, 2022 - Published by genesdev.cshlp.orgDownloaded from
van der Lugt et al.
% of sibling wild type levels 120
100
bone marrow spleen thymus
Figure 4. Nuc lea t ed cell n u m b e r s of hema topo ie t i c organs are reduced in bmi-1 - / - mice. The n u m b e r of nuc lea ted cells in bone m a r r o w (two femurs}, spleen, t hymus , and blood (wbc) was de t e rmined in newborn (hatched bar), 2-week-old (shaded bar), and adul t (solid bar) Bmi- l -def ic ien t mice, and displayed as a percentage of the wild- type numbers , w h i c h were set to 100%. Instead of newborn bone m a r r o w counts , fetal l iver counts (14.5 dpc) were de te rmined . Even if the reduced body s ize /weigh t of the bmi-1 - / - mice (on average twofold in adults} is t aken into considerat ion, hema topo ie t i c cell counts are s ignif icant ly and progressively reduced in all the hematopo ie t i c organs of bmi-1 - / - mice. N u m b e r of mice analyzed: adult, 8-10; 2-week-old, 2--4; fetal, 3-5.
Proliferative responses of m a t u r e B and T cells
The response of splenocytes to the B-cell mitogen LPS or the T-cell mitogen concanavalin A (ConA) was deter- mined by a [aH]thymidine incorporation assay {not shown). LPS stimulation of splenocytes from newborn bmi-1 - / - mice was normal, but from adults it was reduced 8- to 10-fold when compared with wild-type lit- termates. The same reduction was seen in response to
ConA. These data suggest that the splenocytes present in adult bmi-1 - / - mice may not be functional.
To further assess peripheral B-cell function, serum im- munoglobulin levels of 11 bmi-1 - / - mice were com- pared with those of 12 bmi-1 + / + mice. The serum IgM levels appeared to be reduced to 70% of wild-type levels, whereas the serum IgG levels were slightly increased (not shown). However, the number of white blood cells in adult bmi-1 - / - mice was, on average, 35% of wild type (Fig. 4), suggesting that the remaining B cells com- pensate by the production of relatively large amounts of immunoglobulins.
Posterior t rans format ion in the ske le ton of bmi-1 - / - m i c e
The Psc gene, like all P o l y c o m b group genes that have been analyzed so far, showed a ubiquitous expression pattem during development in Drosophila (Martin and Adler 1993). A comparable expression pattern was de- tected for the bmi-1 gene during mouse development. Northem analysis of RNA isolated from embryos at dif- ferent stages of development revealed expression of bmi-1 at least from 10.5 dpc on (M. Alkema, pers. comm.). In situ RNA hybridization on sections of wild- type embryos (12.5 and 14.5 dpc}, showed low bmi-1 ex- pression levels in virtually all tissues and higher expres- sion levels in brain, spinal cord, kidney, lung, and gonads anlage, whereas no bmi-1 mRNA was detected in bmi-1 - / - embryos (not shown).
The conserved domains between Bmi-1 and Psc com- bined with the comparable expression patterns suggest a possible role for Bmi-1 in repression of murine homeotic genes. Therefore, we screened the axial skeleton of bmi-1 - / - mice for the presence of morphological transformations, such as those observed in hox mutant
T a b l e 2. F l o w cy tometr ic analys is
Cell type Marker
Percent wild type (+/+)
Percent Percent he terozygote h o m o z y g o t e Percent of wi ld type a ( + / - ) ( - / - ) {absolute number )
Bone m a r r o w
Splenocytes
T h y m o c y t e s
B220 + 26 + B220+$7 + 4 ± B220+HSA + 15 ± B220 + +BP1 + 9 ± B220 + + sIg + 9 ± Gr + 37 ± Mac-1 + 40 + B220 + 53 ± TCR~8 + 30 ± C D 4 - 8 - 4 _+ CD4+8 + 83 ± CD4+8 - 9 ± C D 4 - 8 + 4 ± IL2-R + 2 + HSA + 2 ± CD3 + 15 -+ TCRe,~ + 20 +
4 [ n = 9 l ( n = 4 l(n = 2 2(n = 2 l ( n = 6 2 (n = 6 3 ( n = 5 4 (n = 6 3 ( n = 7 2(n = 7
7(n = 7
4(n = 7
3(n = 7
0.2 (n = 3)
0.4 (n = 3) 2 ( n = 3) 13 (n = 3)
2 7 + 5 { n = 4) 1 3 + - 4 ( n = 9) 1 4 ± 8 ( n = 9) 3 ± l ( n = 2) 3 - l ( n = 4 ) 2 5 + 7 (n = 4)
1 0 ± 2 ( n = 2) 1 4 + 3 ( n = 2) 4 ± l ( n = 2) 9 ± l ( n = 2)
9(n = I) 3± l(n = 5) 7± l(n = 5)
23 + 3 (n = 2) 39 +- 8 {n = 6) 31 ± 4 (n = 6) 2 5 ± 10{n = 2) 4 5 - + 8 ( n = 5) 3 6 ± 5 ( n = 5) 5 4 ± l ( n = 2) 4 0 ± 5 ( n = 6) 1 7 + 3 ( n = 6) 3 2 + 5 ( n = 2) 2 6 ± 3 ( n = 7) 9 . 4 ± 7 ( n = 7)
4 ± l ( n = 2) 9 0 - - - 4 ( n = 8) 1 2 ± 7 ( n = 8) 8 4 ± 2 ( n = 2) 5 - + 3 ( n = 8) 0 . 0 3 ± 0 . 0 1 ( n = 8)
7 ± l{n = 2) 2 + 2 ( n = 8) 0 . 1 4 ± 0 . 1 ( n = 8) 6 ± l ( n = 2) 3 - + 2 ( n = 8) 0 . 4 ± 0 . 3 ( n = 8) 2 ± 0 . 1 ( n = 2) 3 9 - 2 5 { n = 3) 1 4 ± 8 ( n = 3) 2 - - -0 .2 (n = 2) 3 6 ± 3 7 ( n = 3 ) 1 5 + 15(n = 3)
l l - 2 ( n = 31 0 . 2 ± 0 . 1 ( n = 3 ) 2 3 ± l ( n = 2) 6 - - - 3 ( n = 3 ) 0 . 1 4 ± 0 . 1 ( n = 3)
Percentage -- S.E.M. of m a r k e r (+) cells per cell type. aPercentage of absolute n u m b e r of m a r k e r (+) cells in adult bmi-1 - / - mice compared wi th bmi-1 + / + mice.
762 GENES & DEVELOPMENT
Cold Spring Harbor Laboratory Press on January 29, 2022 - Published by genesdev.cshlp.orgDownloaded from
Developmental defects in bmi-1 mutant mice
a 80
40
colonies per dish
IL3 M-CSF SF IL7+SF IL7 LPS
b 12o
60
colonies per dish
IL3 M-CSF IL7+SF IL7 LPS
colonies per dish
C 2
IL3 M-CSF IL7
Figure 5. Colony assays on bone marrow of Bmi-l-deficient mice. Femur- and tibia-derived bone marrow cells (a,b) or 14.5 dpc fetal liver cells {c) of bmi-I - / - and + / + mice at the adult stage (a) and at 2 weeks of age (b) were assayed in soft agar for colony-forming cells, in the presence of the growth factors in- dicated. The results, mean +- S.E.M., are given as absolute num- ber of colonies per dish. (Shaded bars) bmi-1 + / + ; (dotted bars) bmi-1 + / - ; (solid bars) bmi-1 - / - . (a) Results of 5 brni-1
+ / +, 1 brni-I + / - , and 4 brni-I - / - adult mice; (b) results of 3 bmi-1 + / +, 5 brni-1 + / - , and 2 bmi-1 - / - 2-week-old mice; (c] results of 4 bmi-1 +/+ , 15 bmi-1 +/-, and 5 bmi-1
- / - embryos. The experiments were performed in triplicate with cells isolated from outbred mice.
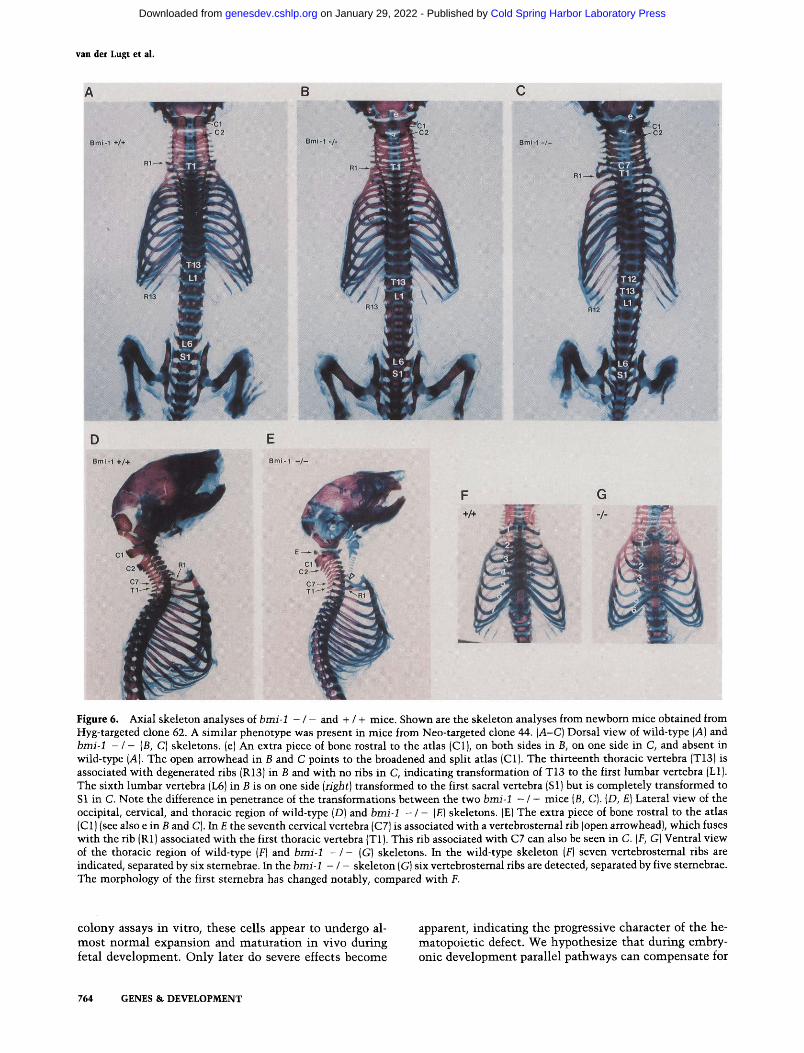
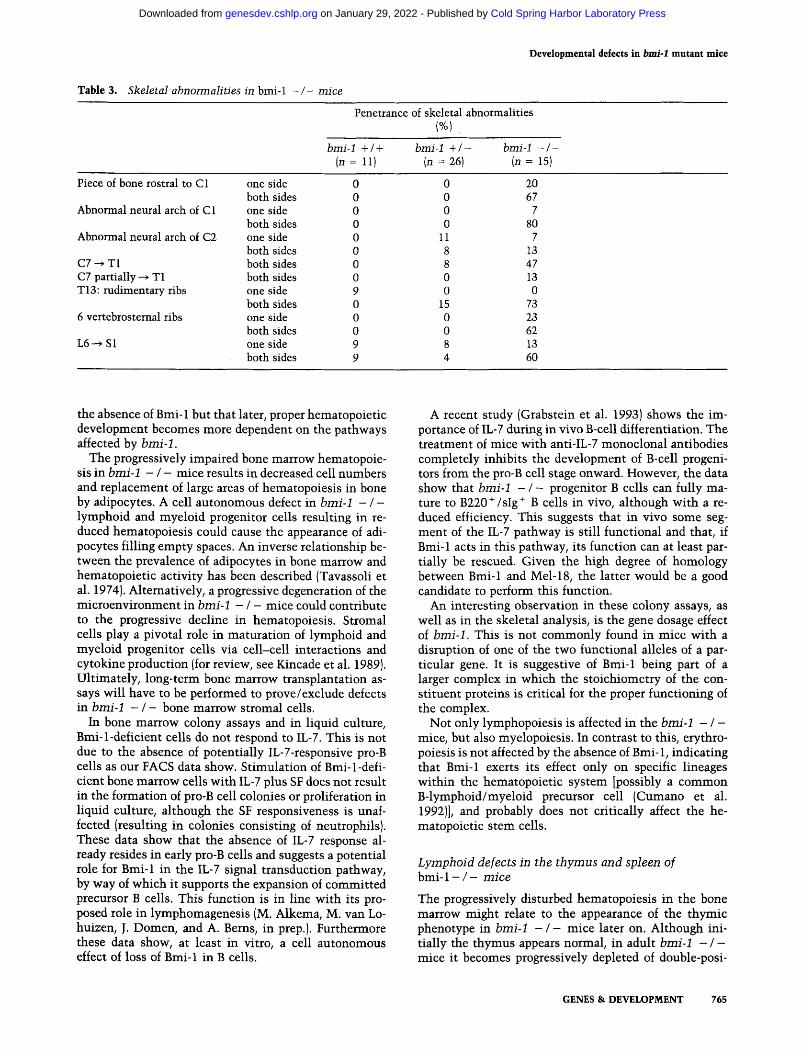
mice. The analysis of skeletal whole mounts of newborn b m i - 1 - / - mice revealed morphological changes at sev- eral positions along the anteroposterior axis (Fig. 6; Ta- ble 3). These changes included (1) dorsal, an extra piece of bone rostral to the atlas (first cervical vertebra, C1), where in control mice no vertebra is present; (2) the broadening and splitting of the neural arch of the atlas or the axis (second cervical vertebra, C2); (3) the transfor- mation of the seventh cervical vertebra (C7) to the first thoracic vertebra (T1), evidenced by the presence of ribs at C7, which then fuse on the ventral side with the ribs associated with T1; (4) the transformation of T7 to T8, resulting in the presence of six vertebrosternal ribs in- stead of seven in control mice; (5) the transformation of
T13 to the first lumbar vertebra (L1), evidenced by the absence or degeneration of the ribs normally associated with T13; and (6) the transformation of L6 to the first sacral vertebra (S1), evidenced by the association of the ilial bones with L6 in b m i - 1 - / - mice instead of Sl in control mice. Altogether, these alterations indicate that the absence of Bmi-1 results in posterior transformation along the anteroposterior axis and implicate a role for Bmi-1 in specifying vertebral identity. Obvious abnor- malities of the limbs and the occipital bones of the skull were not observed in the b m i - 1 - / - mice.
Table 3 shows that there is no full penetrance of the transformations (although every b m i - 1 - / - mouse has at least one of them and 87% of the b m i - 1 - / - mice have multiple transformations) and that most transfor- mations can be found in an asymmetric form (one side). This could correlate to the hybrid genetic background (129/Ola-FVB) of the analyzed mice, because we also ob- serve differences in the penetrance of the phenotype be- tween different litters. A partial penetrance of skeletal abnormalities was also observed for h o x mutant mice with a hybrid genetic background (Le Mouellic et al. 1992; Ramirez-Solis et al. 1993). Unfortunately, we could not perform the analysis with b m i - 1 - / - 129/ Ola inbred mice, because of insufficient numbers of mice. As indicated in Table 3, some of the skeletal trans- formations were also observed in the b m i - 1 + / - mice, again suggesting a gene dosage effect for b m i - 1 .
Discussion
N e u r o l o g i c a l a b n o r m a l i t i e s in bmi-1 - / - m i c e
b m i - 1 - / - mice showed an ataxic gait and abnormali- ties in the molecular, Purkinje cell, and granular layers of the cerebellum. A correlation between ataxia and mor- phological abnormalities in the cerebellar layers has been reported previously for several different mutant mouse strains [nervous , P u r k i n j e ce l l d e g e n e r a t i o n ,
Lurcher , and w e a v e r (for review, see Lyon and Searle 1989)]. In contrast to the brni-1 - / - mice, however, the molecular layer of the cerebellum is not affected in these mutant mice, nor in other mouse strains with neurolog- ical aberrations. Therefore, it is unclear what role the markedly reduced cell density in the molecular layer of the b m i - 1 - / - mice plays in the ataxic phenotype.
Dark shrunken cells were observed in the hippocam- pus of some of the b m i - 1 - / - mice. It has been reported that the presence of these cells is compatible with post seizure degeneration (Lothman et al. 1991). However, it is as yet unclear what causes the seizures in the b m i - 1
- / - mice. The basis of the extensive white matter gli- osis in the form of many GFAP-positive astrocytes re- mains to be investigated.
H e m a t o p o i e t i c d e f e c t s m f e t a l l i v e r a n d b o n e m a r r o w
o f bmi- 1 - / - m i c e
In spite of the fact that hematopoietic cells from the fetal liver of b m i - 1 - / - mice show major growth defects in
GENES & DEVELOPMENT 763
Cold Spring Harbor Laboratory Press on January 29, 2022 - Published by genesdev.cshlp.orgDownloaded from
van der Lugt et al.
i - 1 - / -
F G
/ ii
~ ii ~7
Figure 6. Axial skeleton analyses of b m i - I - / - and + / + mice. Shown are the skeleton analyses from newborn mice obtained from Hyg-targeted clone 62. A similar phenotype was present in mice from Neo-targeted clone 44. { A - C ) Dorsal view of wild-type (A) and b m i - 1 - / - (B, C) skeletons. (e) An extra piece of bone rostral to the atlas (C1), on both sides in B, on one side in C, and absent in wild-type (A). The open arrowhead in B and C points to the broadened and split atlas (C1). The thirteenth thoracic vertebra (T13) is associated with degenerated ribs (R13) in B and with no ribs in C, indicating transformation of T13 to the first lumbar vertebra (L1). The sixth lumbar vertebra (L6) in B is on one side ( r i g h t ) transformed to the first sacral vertebra (S1) but is completely transformed to S 1 in C. Note the difference in penetrance of the transformations between the two b m i - 1 - / - mice (B, C}. (D, El Lateral view of the occipital, cervical, and thoracic region of wild-type (D) and b m i - I - / - (E) skeletons. (E) The extra piece of bone rostral to the atlas (C1) (see also e in B and C). In E the seventh cervical vertebra (C7) is associated with a vertebrostemal rib (open arrowhead), which fuses with the rib (R1) associated with the first thoracic vertebra (T1). This rib associated with C7 can also be seen in C. (F, G) Ventral view of the thoracic region of wild-type (F) and b m i - 1 - / - (G} skeletons. In the wild-type skeleton (F) seven vertebrostemal ribs are indicated, separated by six sternebrae. In the b m i - 1 - / - skeleton (G) six vertebrostemal ribs are detected, separated by five sternebrae. The morphology of the first stemebra has changed notably, compared with F.
co lony assays in vitro, these cells appear to undergo al- mos t no rma l expans ion and m a t u r a t i o n in vivo dur ing fetal deve lopment . O n l y la ter do severe effects become
apparent, ind ica t ing the progressive character of the he- ma topo ie t i c defect. We hypo thes i ze tha t dur ing embry- onic deve lopment paral lel pa thways can compensa t e for
764 GENES & D E V E L O P M E N T
Cold Spring Harbor Laboratory Press on January 29, 2022 - Published by genesdev.cshlp.orgDownloaded from
Developmental defects in bmi-1 mutant mice
Table 3. Skele tal abnormal i t ies in bmi-1 - / - mice
Penetrance of skeletal abnormalities I%1 ....
bmi-1 + / + bmi-1 + / - bmi-1 - / - (n = 11) (n = 26) (n = 15)
Piece of bone rostral to C1 one side both sides
Abnormal neural arch of C 1 one side both sides
Abnormal neural arch of C2 one side both sides
C7 ~ T1 both sides C7 partially ~ T1 both sides T13: rudimentary ribs one side
both sides 6 vertebrostemal ribs one side
both sides L6 ~ S 1 one side
both sides
0 0 20 0 0 67 0 0 7 0 0 80 0 11 7 0 8 13 0 8 47 0 0 13 9 0 0 0 15 73 0 0 23 0 0 62 9 8 13 9 4 60
the absence of Bmi- 1 but that later, proper hematopoietic development becomes more dependent on the pathways affected by b m i - 1 .
The progressively impaired bone marrow hematopoie- sis in b m i - 1 - / - mice results in decreased cell numbers and replacement of large areas of hematopoiesis in bone by adipocytes. A cell autonomous defect in b m i - 1 - / -
lymphoid and myeloid progenitor cells resulting in re- duced hematopoiesis could cause the appearance of adi- pocytes filling empty spaces. An inverse relationship be- tween the prevalence of adipocytes in bone marrow and hematopoietic activity has been described (Tavassoli et al. 1974). Alternatively, a progressive degeneration of the microenvironment in b m i - 1 - / - mice could contribute to the progressive decline in hematopoiesis. Stromal cells play a pivotal role in maturation of lymphoid and myeloid progenitor cells via cell-cell interactions and cytokine production (for review, see Kincade et al. 1989). Ultimately, long-term bone marrow transplantation as- says will have to be performed to prove/exclude defects in b m i - 1 - / - bone marrow stromal cells.
In bone marrow colony assays and in liquid culture, Bmi-l-deficient cells do not respond to IL-7. This is not due to the absence of potentially IL-7-responsive pro-B cells as our FACS data show. Stimulation of Bmi-1-defi- cient bone marrow cells with IL-7 plus SF does not result in the formation of pro-B cell colonies or proliferation in liquid culture, although the SF responsiveness is unaf- fected (resulting in colonies consisting of neutrophils). These data show that the absence of IL-7 response al- ready resides in early pro-B cells and suggests a potential role for Bmi-1 in the IL-7 signal transduction pathway, by way of which it supports the expansion of committed precursor B cells. This function is in line with its pro- posed role in lymphomagenesis (M. Alkema, M. van Lo- huizen, J. Domen, and A. Betas, in prep.). Furthermore these data show, at least in vitro, a cell autonomous effect of loss of Bmi-1 in B cells.
A recent study (Grabstein et al. 1993) shows the im- portance of IL-7 during in vivo B-cell differentiation. The treatment of mice with anti-IL-7 monoclonal antibodies completely inhibits the development of B-cell progeni- tors from the pro-B cell stage onward. However, the data show that b m i - 1 - / - progenitor B cells can fully ma- ture to B220+/sIg + B cells in vivo, although with a re- duced efficiency. This suggests that in vivo some seg- ment of the IL-7 pathway is still functional and that, if Bmi-1 acts in this pathway, its function can at least par- tially be rescued. Given the high degree of homology between Bmi-1 and Mel-18, the latter would be a good candidate to perform this function.
An interesting observation in these colony assays, as well as in the skeletal analysis, is the gene dosage effect of b m i - 1 . This is not commonly found in mice with a disruption of one of the two functional alleles of a par- ticular gene. It is suggestive of Bmi-1 being part of a larger complex in which the stoichiometry of the con- stituent proteins is critical for the proper functioning of the complex.
Not only lymphopoiesis is affected in the b m i - 1 - / -
mice, but also myelopoiesis. In contrast to this, erythro- poiesis is not affected by the absence of Bmi-1, indicating that Bmi-1 exerts its effect only on specific lineages within the hematopoietic system [possibly a common B-lymphoid/myeloid precursor cell (Cumano et al. 1992)], and probably does not critically affect the he- matopoietic stem cells.
L y m p h o i d d e f e c t s in t h e t h y m u s a n d s p l e e n o f
bmi-1 - / - m i c e
The progressively disturbed hematopoiesis in the bone marrow might relate to the appearance of the thymic phenotype in b m i - 1 - / - mice later on. Although ini- tially the thymus appears normal, in adult b m i . 1 - / -
mice it becomes progressively depleted of double-posi-
GENES & DEVELOPMENT 765
Cold Spring Harbor Laboratory Press on January 29, 2022 - Published by genesdev.cshlp.orgDownloaded from
van der Lugt et al.
tive (CD4+/CD8 +) thymocytes, whereas immature cells (CD4- /CD8- ) are still present. Mice lacking c-fos show a comparable phenotype (Wang et al. 1992); al- though bone marrow hematopoiesis is impaired from early on, thymic involution is observed upon further de- velopment.
Thymic involution is also observed in some mutant mice displaying a neurological phenotype, such as Tum- bler and Lethargic (lh) mice (Lyon and Searle 1989). The thymic involution in these mice often coincides with the onset of their neurological symptoms (Dung 1975), a correlation that seems to hold for the bmi-1 - / - mice as well. lh mice show an ataxic gait, sporadic seizures, and thymic involution at 3-4 weeks accompanied by a decrease in the lymphocyte count (Dung 1981). The mapping of the lh locus on chromosome 2 and the re- semblance in phenotype made us perform a more de- tailed analysis of the lh mice as well. We could not de- tect differences in the bmi-1 expression pattern by Northern analysis and detected a normal sized Bmi-1 protein in these mice. Preliminary analysis do not reveal B-lymphoid aberrations, and no clear morphological changes were observed in the bone marrow, cerebellum, and skeleton of lh mice (not shown). Therefore it is very unlikely that the bmi-1 gene is affected in lh mice, but it is possible that lh and bmi-1 - / - mice show a partial overlap with respect to their defective molecular path- ways.
The thymic phenotype in bmi-1 - / - mice could also have been caused by IL-7 unresponsiveness of precursor T cells, because IL-7 has been shown to be an important factor for both B- and T-cell development (Suda and Zlot- nik 1991).
Splenocytes in bmi-1 - / - mice show a severely im- paired proliferative response to B- and T-cell mitogens. Whether this represents a cell-autonomous defect in lymphoid cells lacking Bmi-1 or a form of anergy, in- duced by an abnormal microenvironment during their maturation, will have to await results from bone marrow transplantation experiments. In spite of the impaired re- sponse to mitogens, the limited number of peripheral B cells are able to remain close to normal levels of serum immunoglobulins. Similar observations were made in leaky scid mice, which contain only a few clones of im- munoglobulin-producing B cells but can have abnor- mally high concentrations of serum immunoglobulin (Bosma et al. 1988).
Posterior t rans format ion in the bmi-1 - / - m i c e
The analyses of the bmi-1 - / - skeletal preparations revealed a number of morphological alterations. The identity of a given vertebra has changed to that of the juxtaposed posterior vertebra, a feature described as pos- terior transformation. Several hox gain- and loss-of-func- tion mutant mice show comparable posterior or anterior transformation of the axial skeleton (Kessel et al. 1990; Chisaka and Capecchi 1991; Lufkin et al. 1991, 1992; Jegalian and De Robertis 1992; Le Mouellic et al. 1992; McLain et al. 1992; Pollock et al. 1992; Ramirez-Solis et
al. 1993), supporting the role of h o x genes in the speci- fication of structures along the anteroposterior axis of the developing embryo (for review, see Deschamps and Meijlink 1992; McGinnis and Krumlauf 1992). The ef- fects of some hox mutations, however, are complex and difficult to identify as posterior or anterior transforma- tion (Chisaka et al. 1992). Also in the bmi-1 - / - mice it is unclear whether the broadening and the splitting of the atlas (C1) or the axis (C2) is true posterior transfor- mation. However, a similar alteration is observed in hoxb-7 transgenic mice (McLain et al. 1992; for new no- menclature, see Scott 1992), which simultaneously dis- play posterior transformation of C7 to T1. Possibly, par- tial redundancy, because of overlapping expression of paralogs from the different hox clusters in the mouse, might obscure clear transformation.
box mutant mice display their transforming pheno- type in general at a restricted region of the vertebral col- umn. In bmi-1 - / - mice, however, we observe trans- formation along the complete anteroposterior axis in most cases. In that respect, bmi-1 - / - mice resemble more retinoic acid (RA)-treated mice. In a detailed study, Kessel and Gruss (1991) detected posterior transforma- tion of vertebrae along the length of the vertebral col- umn after exposure of mice to RA on day 7 of gestation: Interestingly, both vertebra identity and expression of several h o x genes were affected. These data imply that in the bmi-1 - / - mice as well, the expression boundaries of several hox genes may have shifted to a more anterior position, possibly as an indirect effect of changes in RA- mediated pathways. Although (in)direct regulation of hox genes by Bmi-1 remains to be established, the im- plication that Bmi-1 exerts its effect on at least a number of hox genes is in line with the way Psc, a member of the Pc-G of genes, is thought to function in Drosophila. Dif- ferent members of the Pc-G are believed to form a large protein complex that facilitates or regulates the forma- tion of condensed chromatin along specific regions of the chromosome, thereby causing permanent and heritable repression of homeotic genes (for review, see Paro 1990). Analogously, Bmi-1 could be one of the proteins of such a complex in the mouse, keeping genes of one or more of the hox clusters in a repressed heterochromatin state. A logical extension of this work should involve a detailed analysis of hox gene expression both during embryonic development as well as in the different hematopoietic lineages in which hox gene function has been implied (for review, see Lawrence and Largrnan 1992).
Material and methods
Construction of targeting vectors
A 129/Ola genomic phage library was screened with a bmi-1 eDNA probe 13.1 (van Lohuizen et al. 1991a), and two overlap- ping ~ clones were obtained. A 15.2-kb BamHI-NotI fragment was subcloned in the pGEM4 vector (Promega), and subse- quently a 2.5-kb BamHI-KpnI fragment spanning exons 2-8 was replaced by either a 1.7-kb PGK-Hyg BamHI-BglII fragment (te Riele et al. 1990) or a 1.0-kb pMCI-Neo BamHI fragment (te Riele et al. 1992). The targeting constructs were electroporated
766 GENES & DEVELOPMENT
Cold Spring Harbor Laboratory Press on January 29, 2022 - Published by genesdev.cshlp.orgDownloaded from
Developmental defects in bmi-1 mutant mice
as a SalI fragment, separated from the vector sequences by gel electrophoresis.
Propagation of the ES cells, targeting, and DNA analysis
129/Ola-derived El4 ES cells (Hooper et al. 1987) were cultured in BRL-conditioned medium as described (Smith and Hooper 1987). Cells (1.2 x 10⁸) were mixed with 90 ~g of either targeting construct in a volume of 600 ~1 of PBS and electroporated with the Bio-Rad Gene Pulser (0.8 kV, 3 txF; electrode distance, 0.4 cm). Cells were reseeded on 10-cm tissue culture dishes at a density of 1.4x 10 r cells per dish. Drug selection (200 ~g/ml of G418 or 150 Izg/ml of hygromycin) was started after 24 hr, and after 8 days resistant colonies were randomly picked and ex- panded. Clones were grown to confluency in 1 well of a 12-well dish; thereafter one-third of the cells was frozen in 10% DMSO in liquid nitrogen while the remainder of the cells was used to isolate genomic DNA for Southern blot analysis.
Histological and anatomical analysis
Tissues were isolated from mice and directly fixed in EAF [4% (vol/vol) formol, 40% (vol/vol) ethanol, 0.43% (wt/vol) NaC1 and 5% (vol/vol) acetic acid) for 24 hr. Bone-containing tissues were decalcified in formic acid for -1 week. Fixed and dehy- drated tissues were embedded in Histowax and cut at 5-~m sections and stained with hematoxylin and eosin stain. GFAP immunohistochemistry was performed with an polyclonal anti- GFAP antibody (Chemicon, E1 Segundo, CA) and the avidin- biotin immunoperoxidase method (Hsu et al. 1981) on 4% paraformaldehyde-fixed cryosections. In situ hybridization ex- periments were performed as described elsewhere (Vogels et al. 1990). The bmi-1 3SS-labeled antisense RNA probe was tran- scribed by T7 RNA polymerase from a 803-bp HpaII-BamHI eDNA fragment and partially hydrolyzed to an average length of 100 nucleotides. Skeletal whole mounts of newborn mice were performed on completely eviscerated animals with the skin re- moved. The livers were used for DNA isolation and genotype analysis by Southern blot hybridization. Corpses were fixed in 96% ethanol for 5 days and transferred to acetone for 2 days. Staining was performed in 0.005% alizarin red S, 0.015% alcian blue 8GS in 5% acetic acid, 5% H20, and 90% ethanol for 3 days at 37°C. Samples were washed in H20 and cleared for 2 days in 1% KOH followed by clearing steps in 0.8% KOH and 20% glycerol, in 0.5% KOH and 50% glycerol, and in 0.2% KOH and 80% glycerol for at least 1 week each. Cleared skel- etons were stored in 100% glycerol.
Nucleated cell count determinations
Whole blood was isolated in heparin-coated tubes, thymus and spleen were dissected from the mice, and single-cell suspen- sions were prepared in RPMI medium by use of open filter chambers to disrupt the tissue. Bone marrow cells were flushed from femurs and/or tibia with Fishers or RPMI medium. Nu- cleated cell count determination and blood cell scans were per- formed with an automated cell counter (Sysmex Toa FS00).
Flow cytometric analysis
Cells (3 x l0 s) were incubated in 96-well plates for 30-45 min at 4°C in 20 txl of PBS ~+ (phosphate-buffered saline with 1% BSA and 0.1% sodium azide) and saturating amounts of monoclonal antibody. Cells were washed two times with PBS 2+ and incu- bated with streptavidin-phycoerytrin for biotinylated antibod- ies or mouse-anti-rat-K-fluorescein for unconjugated antibod- ies. The cells were analyzed on a FACScan (Becton Dickinson).
The following antibodies were used: CD45R/B220 (6B2), CD3 (145-2C11), CD4 (RM4-5), CD8 (53-6.7), TCRotf~ (H57-597), Gr-1 (RB6-8C5), CD43 ($7), IL-2R (7D4) and mouse-anti-rat K light chain (MRK-1), all from Pharmingen (San Diego, CA). Heat sta- ble antigen (30F1) was kindly provided by K. Rajewski (Univer- sity of Cologne, Germany). Mac-1 (M 1/70-15) was from Trow- bridge and Omary (1981), and slg/goat anti-mouse immunoglob- ulin was from Tago (Burlingame, CA).
Tissue culture
Colony assays were performed as described (Domen et al. 1993). Briefly, 5 x 10⁴ bone marrow cells were plated in 3.5-cm dishes in 1 ml of medium containing 0.25% agar. Cells were incubated in Fisher's medium with 20% horse serum (GIBCO) in the pres- ence of 20% L-cell-conditioned medium (containing M-CSF) or 20% WEHI-conditioned medium (containing IL-3) or in RPMI1640 medium (Flow) with 20% fetal calf serum (GIBCO), 5x 10-SM B-mercaptoethanol and either 10 ng/ml of recombi- nant IL-7 (gift from Amgen Biologicals, Thousand Oaks, CA), 10 ng/ml of recombinant IL-7 + 35 ng/ml of SF (rrSCF 164, gift from Amgen), or 30 ~zg/ml of LPS (Difco, Detroit, MI). Plates were incubated in a fully humidified incubator with 5% CO2 for 8 days and colonies were counted. Every incubation was per- formed in triplicate. For liquid cultures, 1 x 10⁶ bone marrow cells were incubated in 5 mls of medium (RPMI 1640 plus 5% fetal calf serum, 5x10sM f~-mercaptoethanol, penicillin, and streptomycin) and 10% 3T3-IL-7 conditioned medium with or without 60 ng/ml of SF (rrSCF164). The cells were incubated for 8-10 days, and samples were counted every other day.
Proliferation assay
Splenocytes were seeded at various densities in 96-well plates (U-bottom) in 100 ~1 of complete Iscove's medium, supple- mented with 2.5 ~g/ml of ConA or 30 txg/ml of LPS. After 24 hr of incubation at 37°C, [aH]thymidine was added to a final con- centration of 4 ~Ci/ml. The cultures were incubated for an additional 4 hr at 37°C. The cells were collected on filters, washed, and [3H]thymidine incorporation was determined by scintillation counting.
A c k n o w l e d g e m e n t s
We thank Joost Verhagen for assistance with the neurological analysis, Antje Brouwer and Ronald Vogels for their instruc- tions and help with the in situ hybridization analysis, Eric Noteboom for assistance with the FACS analysis, K. Zsebo (Amgen, Thousand Oaks, CA) for a gift of Escherichia coli-de- rived rat SCF 164, and Nel Bosnie, Tania Maidment, Auke Zwerver, and Loes Rijswijk for their help with handling and care of the mice. We thank M. Alkema for critically reading the manuscript. This work was supported~by the Netherlands Or- ganization for Scientific Research (NWO) (N.v.d.L; E.R.-M.) and by the Dutch Cancer Society (KWF) (K.L; M.v.R; H.teR.).
The publication costs of this article were defrayed in part by payment of page charges. This article must therefore be hereby marked "advertisement" in accordance with 18 USC section 1734 solely to indicate this fact.
R e f e r e n c e s
Adler, P.N., J. Charlton, and B. Brunk. 1989. Genetic interac- tions of the Suppressor two of zeste region genes. Dev. Genet. 10: 249-260.
Adler, P.N., E.C. Martin, J. Charlton, and K. Jones. 1991. Phe-
GENES & DEVELOPMENT 767
Cold Spring Harbor Laboratory Press on January 29, 2022 - Published by genesdev.cshlp.orgDownloaded from
van der Lugt et al.
notypic consequences and genetic interaction of a null mu- tant in the Drosophila Posterior Sex Combs gene. Dev. Genet. 12: 349-361.
Bosma, G.C., M. Fried, R.P. Custer, A. Carroll, D.M. Gibson, and M.J. Bosma. 1988. Evidence of functional lymphocytes in some (leaky) scid mice. J. Exp. Med. 167: 1016-1033.
Brunk, B.P., E.C. Martin, and P.N. Adler. 1991. Drosophila genes Posterior Sex Combs and Suppressor two of zeste en- code proteins with homology to the murine bmi-1 oncogene. Nature 353: 351-353.
Chisaka, O. and M.R. Capecchi. 1991. Regionally restricted de- velopmental defects resulting from targeted disruption of the mouse homeobox gene Hoxl.5. Nature 350: 473-479.
Chisaka, O., T.S. Musci, and M.R. Capecchi. t992. Develop- mental defects of the ear, cranial nerves and hindbrain re- sulting from targeted disruption of the mouse homeobox gene Hox-l.6. Nature 355: 516-520.
Cumano, A., C.J. Paige, N.N. Iscove, and G. Brady. 1992. Bipo- tential precursors of B cells and macrophages in murine fetal liver. Nature 356: 612-615.
Deschamps, J. and F. Meijlink. 1992. Mammalian homeobox genes in normal development and neoplasia. Crit. Rev. On- cogenesis 3:117-173.
Domen, J., N.M.T. van der Lugt, D. Acton, P.W. Laird, K. Linders, and A. Betas. 1993. Pim-1 levels determine the size of early B lymphoid compartments in bone marrow. 1. Exp. Med. 178: 1665-1673.
Dung, H.C. 1975. Growth retardation, high mortality and low reproductivity of neurological mutant mice. Anat. Rec. 181: 347-348.
~ . . 1981. Lethargic mice. In Immunological defects in laboratory animals {ed. M.E. Gershwin and B. Merchant) vol. 2, pp.17-37. Plenum Press, New York.
Gipon, L.P., P. Schotman, F.G.I. Jennekens, and W.H. Gispen. 1977. Polyneuropathies and CNS protein metabolism. I. De- scription of the acrylamide syndrome in rats. Neuropathol. Appl. Neurobiol. 3: 115-123.
Goebl, M.G. 1992. The bmi-1 and mel-18 gene products define a new family of DNA-binding proteins involved in cell pro- liferation and tumorigenesis. Cell 66: 623.
Grabstein, K.H., T.J. Waldschmidt, F.D. Finkelman, B.W. Hess, A.R. Alpert, N.E. Boiani, A.E. Namen, and P.J. Morrissey. 1993. Inhibition of murine B and T lymphopoiesis in vivo by an anti-interleukin 7 monoclonal antibody. J. Exp. Med. 178: 257-264.
Hardy, R.R., C.E. Carmack, S.A. Shinton, J.D. Kemp, and K. Hayakawa. 1991. Resolution and characterization of pro-B and pre-pro-B cell stages in normal mouse bone marrow. J. Exp. Med. 173: 1213-1225.
Haupt, Y., G. Barri, and J.M. Adams. 1992. Nucleotide sequence of bup, an upstream gene in the bmi-I proviral insertion locus. Mol. Biol. Rep. 17: 17-20.
Haupt, Y., W.S. Alexander, G. Barri, S.P. Klinken, and J.M. Ad- ams. 1991. Novel zinc finger gene implicated as myc collab- orator by retrovirally accelerated lymphomagenesis in E~- myc transgenic mice. Cell 65: 753-763.
Hooper, M., K. Hardy, A. Handyside, S. Hunter, and M. Monk. 1987. HPRT-deficient (Lesch-Nyhan) mouse embryos de- rived from germ line colonization by cultured cells. Nature 326: 292--295.
Hsu, S.M., L. Raine, and H. Fanger. 1981. The use of avidin- biotin peroxidase complex {ABC} in immunoperoxidase techniques: A comparison between ABG and unlabeled an- tibody (PAP) procedures. J. Histochem. Cytochem. 29: 577- 580.
Jegalian, B.G. and E.M. De Robertis. 1992. Homeotic transfor-
mations in the mouse induced by overexpression of a human Hox3.3 transgene. Cell 71: 901-910.
Jfirgens, G. 1985. A group of genes controlling the spatial ex- pression of the bithorax complex in Drosophila. Nature 316: 153-155.
Kaplan, M.L. and S.D. Murphy. 1972. Effect of acrylamide on Rotarod performance and sciatic nerve ~-glucuronidase ac- tivity of rats. Toxicol. Appl. Pharmacol. 22: 259-268.
Kessel, M. and P. Gruss. 1991. Homeotic transformation of mu- rine vertebrae and concomitant alteration of hox codes in- duced by retinoic acid. Cell 67: 89-104.
Kessel, M., R. Bailing, and P. Gruss. 1990. Variations of cervical vertebrae after expression of a Hox1.1 transgene in mice. Cell 61: 301-308.
Kincade, P.W., G. Lee, C.E. Pietrangeli, S. Hayashi, and J.M. Gimble. 1989. Cells and molecules that regulate B lym- phopoiesis in bone marrow. Annu. Rev. Immunol. 7:111- 143.
Lawrence, H.J. and C. Largman. 1992. Homeobox genes in nor- mal hematopoiesis and leukemia. Blood 80: 2445-2453.
Lee, G., A.E. Namen, S. Gillis, L.R. Ellingsworth, and P.W. Kin- cade. 1989. Normal B-cell precursors responsive to recombi- nant routine IL-7 and inhibition of IL-7 activity by trans- forming growth factor-B. J. Immunol. 142: 3875-3883.
Le Mouellic, H., Y. Lallemand, and P. Brulet. 1992. Homeosis in the mouse induced by a null mutation in the Hox3.1 gene. Cell 69: 251-264.
Lewis, E.B. 1978. A gene complex controlling segmentation in Drosophila. Nature 276: 565-570.
Lothman, E.W., E.H. Betram, and J.L. Stringer. 1991. Functional anatomy of hippocampal seizures. Prog. Neurobiol. 37: 1- 82.
Lufkin, T., A. Dierich, M. LeMeur, M. Mark, and P. Chambon. 1991. Disruption of the Hoxl.6 homeobox gene results in defects in a region corresponding to its rostral domain of expression. Cell 66:1105-1119.
Lufkin, T., M. Mark, C. Hart, P. Doll6, M. LeMeur, and P. Chambon. 1992. Homeotic transformation of the occipital bones of the skull by ectopic expression of a homeobox gene in transgenic mice. Nature 359: 835-841.
Lyon, M.F. and A.G. Searle, eds. 1989. Genetic variants and strains of the laboratory mouse, 2nd ed, Oxford University Press, Oxford, England.
Martin, E.G. and P.N. Adler. 1993. The Polycomb group gene Posterior Sex Combs encodes a chromosomal protein. De- velopment 117: 641-655.
McGinnis, W. and R. Krumlauf. 1992. Homeobox genes and axial patterning. Cell 68: 283-302.
McLain, K., G. Schreiner, K.Y. Yager, J.L. Stock, and S.S. Potter. 1992. Ectopic expression of Hox2.3 induces craniofacial and skeletal malformations in transgenic mice. Mech. Dev. 39: 3-16.
McNiece, K., K.E. Langley, and K.M. Zsebo. 1991. The role of recombinant stem cell factor in early B cell development. J. Immunol. 146: 3785--3790.
Paro, R. 1990. Imprinting a determined state into the chromatin of Drosophila. Trends Genet. 6: 416--421.
Pollock, R.A., G. Jay, and C.J. Bieberich. 1992. Altering the boundaries of Hox3.I expression: Evidence for antipodal gene regulation. Cell 71:911-923.
Ramirez-Solis, R., H. Zheng, J. Whiting, R. Krumlauf, and A. Bradley. 1993. Hoxb-4 (Hox2.6) mutant mice show homeotic transformation of a cervical vertebra and defects in the clo- sure of the sternal rudiments. Cell 73: 279-294.
Scott, M.P. 1992. Vertebrate homeobox gene nomenclature. Cell 71: 551-553.
768 GENES & DEVELOPMENT
Cold Spring Harbor Laboratory Press on January 29, 2022 - Published by genesdev.cshlp.orgDownloaded from
Developmental defects in bmi-1 mutant mice
Smith, A.G. and M.L. Hooper. 1987. Buffalo rat liver cells pro- duce a diffusible activity which inhibits the differentiation of murine embryonal carcinoma and embryonic stem cells. Dev. Biol. 121: 1-9.
Stanley, E.R., L.J. Guilbert, R.J. Tushinski, and S.H. Bartelmez. 1983. CSF-1 mononuclear phagocyte lineage-specific he- matopoietic growth factor. J. Cell. Biochem. 21:151-159.
Suda, T. and A. Zlotnik. 1991. IL-7 maintains the T cell precur- sor potential of C D 4 - / C D 8 - / C D 3 - thymocytes. J. Immu- nol. 146: 3068-3073.
Suda, T., S. Okada, J. Suda, Y. Miura, M. Ito, T. Sudo, S-I. Ha- yashi, N-I. Nishikawa, and H. Nakauchi. 1989. A stimula- tory effect of recombinant interleukin-7 on B-cell colony for- mation and an inhibitory effect of interleukin-la. Blood 74: 1936-1941.
Tagawa, M., T. Sakamoto, K. Shigemoto, H. Matsubaru, Y. Tamura, T. Ito, I. Nakamura, A. Okitsu, K. Imai, and M. Taniguchi. 1990. Expression of a novel DNA-binding protein with zinc finger structure in various tumor ceils. J. Biol. Chem. 265: 20021-20026.
Tavassoli, M., A. Maniatis, and W.H. Crosby. 1974. Induction of sustained hemopoiesis in fatty marrow. Blood 43: 33-38.
te Riele, H., E. Robanus Maandag, A. Clarke, M. Hooper, and A. Berns. 1990. Consecutive inactivation of both alleles of the pim-1 proto-oncogene by homologous recombination in em- bryonic stem cells. Nature 348: 649-651.
te Riele, H., E. Robanus Maandag, and A. Bems. 1992. Highly efficient gene targeting in embryonic stem cells through ho- mologous recombination with isogenic DNA constructs. Proc. Natl. Acad. Sci. 89: 5128-5132.
Trowbridge, I.S. and M.B. Omary. 1981. Molecular complexity of leucocyte surface glycoproteins related to the macrophage differentiation antigen mac-1. J. Exp. Meal. 154: 1517-1524.
van Lohuizen, M., S. Verbeek, B. Scheijen, E. Wientjens, H. van der Gulden, and A. Berns. 1991a. Identification of cooperat- ing oncogenes in El~-myc transgenic mice by provirus tag- ging. Cell 65: 737-752.
van Lohuizen, M., M. Frasch, E. Wientjens, and A. Berns. 1991b. Sequence similarity between the mammalian bmi-1 proto- oncogene and the Drosophila regulatory genes Psc and Su{z)2. Nature 353: 353-355.
Vogels, R., W. de Graaff, and J. Deschamps. 1990. Expression of the routine homeobox-containing gene hox-2.3 suggests multiple time-dependent and tissue-specific roles during de- velopment. Development 110:1159-1168.
Wang, Z., C. Ovitt, A.E. Grigoriadis, U. M6hle-Steinlein, U. Riither, and E.F. Wagner. 1992. Bone and haematopoietic defects in mice lacking c-los. Nature 360: 741-745.
Wu, C.T., R.S. Jones, P.F. Lasko, and W.M. Gelbart. 1989. Ho- meosis and the interaction of zeste and white in Drosophila. Mol. Gen. Genet. 218: 559-564.
Zink, B., Y. Engstr6m, W.J. Gehring, and R. Paro. 1991. Direct interaction of the Polycomb protein with Antennapedia reg- ulatory sequences in polytene chromosomes of Drosophila melanogaster. EMBO J. 10: 153-162.
GENES & DEVELOPMENT 769
Cold Spring Harbor Laboratory Press on January 29, 2022 - Published by genesdev.cshlp.orgDownloaded from
10.1101/gad.8.7.757Access the most recent version at doi: 8:1994, Genes Dev.
N M van der Lugt, J Domen, K Linders, et al. proto-oncogene.hematopoietic defects in mice with a targeted deletion of the bmi-1 Posterior transformation, neurological abnormalities, and severe
References
http://genesdev.cshlp.org/content/8/7/757.full.html#ref-list-1
This article cites 54 articles, 15 of which can be accessed free at:
License
ServiceEmail Alerting
click here.right corner of the article or
Receive free email alerts when new articles cite this article - sign up in the box at the top
Copyright © Cold Spring Harbor Laboratory Press
Cold Spring Harbor Laboratory Press on January 29, 2022 - Published by genesdev.cshlp.orgDownloaded from