Embed Size (px)
Citation preview

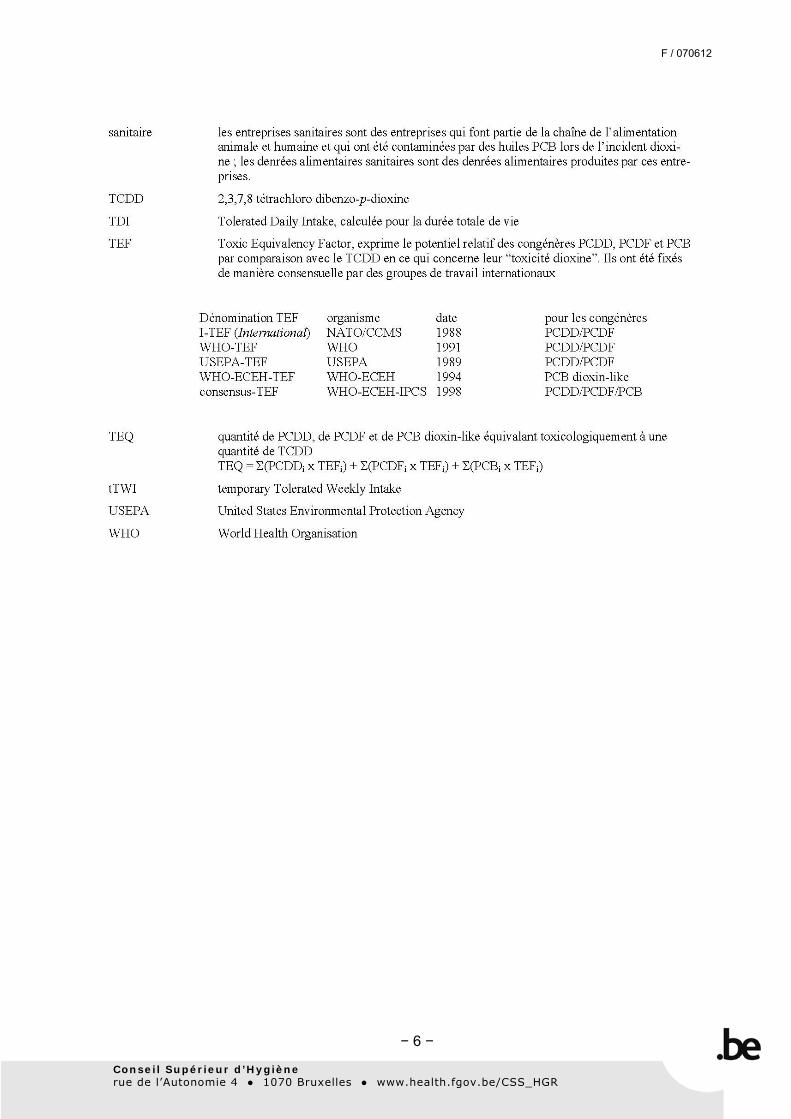
F / 070612
− 1 −
Conseil Supérieur d’Hygiène rue de l’Autonomie 4 ● 1070 Bruxelles ● www.health.fgov.be/CSS_HGR
PUBLICATION DU CONSEIL SUPERIEUR D’HYGIENE N° 7300/1
L’Incident PCB-Dioxine, Belgique, 1999
DIOXINE – CHARGE CORPORELLE
Groupe de travail ad hoc sur les dioxines
Vakgroep Farmacologie - Heymans Instituut, Gent
Vakgroep Maatschappelijke Gezondheidskunde, Gent Vakgroep Levensmiddelentechnologie en Voeding, Gent
Vakgroep Toegepaste Wiskunde en Informatica, Gent Département de Pharmaco-Bromatologie, Institut scientifique de Santé Publique, Bruxelles
30 avril 2001
PREFACE Lorsque l’incident dioxine a été rendu public fin mai 1999, différents acteurs ont rapidement été interpellés par la problématique: l’ensemble du secteur de la viande, les autorités belges, les autorités européennes, le public. Leur interaction a conduit à une situation de crise aux conséquences finalement plutôt catastrophiques notamment pour les secteurs agricoles concernés et, de manière plus générale, pour l’industrie alimentaire belge. Afin de contribuer à la gestion de la crise, il a été fait appel, début juin 1999, à un soutien scientifique, tant sur base de contributions individuelles que, de manière plus ou moins structurée, par l’intermédiaire du groupe de travail temporaire ad hoc sur les Dioxines du Conseil Supérieur d’Hygiène. Soutenir un processus de maîtrise du risque suppose une évaluation scientifique du risque, reposant sur une évaluation du danger et de l’exposition, ce qui implique nécessairement, sur le plan de la communication du risque, la prise en compte du vécu de ce risque par la population. Tous ceux qui ont pris part à ces travaux peuvent témoigner du fait qu’il s’agit là d’un processus relativement complexe. L’évaluation du danger potentiel s’est en premier lieu concentrée sur les composants « dioxin-like » de la contamination. La toxicité et le rapport dose-effet de telles substances étaient connus et le Conseil Supérieur d’Hygiène avait, suivant en cela l’Organisation Mondiale de la Santé, proposé une ingestion journalière tolérée (TDI) pour les dioxines. Par ailleurs, il existait déjà en Belgique une norme pour les dioxines dans le lait mais pas pour les autres denrées alimentaires. Même si des normes avaient pu être fixées, il n’aurait de toute façon pas été possible de déterminer à grande échelle la contamination des denrées alimentaires par les dioxines – à titre de critère pour la mise ou non sur le marché – en raison de la complexité du travail et du coût. Des progrès ont été réalisés lorsque l’on a constaté que les composants « dioxin-like » provenaient d’une contamination par les PCBs et qu’il existait un rapport relativement constant dans les œufs et le poulet – les denrées alimentaires les plus fortement contaminées – entre les concentrations en dioxine et en PCB. Après avoir longuement consulté et dialogué avec les autorités européennes, des normes temporaires ont été acceptées pour les PCBs dans différentes denrées alimentaires et les laboratoires ont pu commencer à effectuer des analyses.
F / 070612
− 2 −
Conseil Supérieur d’Hygiène rue de l’Autonomie 4 ● 1070 Bruxelles ● www.health.fgov.be/CSS_HGR
L’analyse des fondements de cette norme a constitué un apport réel de la science dans la gestion de la crise. En réponse à la crainte de la population essentiellement par rapport au risque de cancer, quelques efforts ont par ailleurs pu être engrangés pour parvenir à une évaluation du risque sanitaire encouru par la population durant les premiers mois de la crise, sur la base d’une évaluation de l’exposition. Une première évaluation a établi que seule une quantité limitée de dioxines était, en fin de compte, parvenue dans la chaîne alimentaire et que l’impact final sur la population était négligeable. Une deuxième évaluation a pris comme point de départ la même quantité limitée de contaminants, mais l’a traitée au moyen de la procédure du low dose extrapolation – une technique surtout utilisée par l’US Environmental Protection Agency pour l’évaluation du risque des cancérogènes. La conclusion en est que quelque 8.000 cas de cancer supplémentaires pourraient se déclarer dans les prochaines années. Enfin, une troisième évaluation reposant sur des données de consommation alimentaire, qui tenait compte de la contamination existant à la base et d’un nombre limité de données sur la période de crise, a montré qu’une partie limitée de la population a peut-être ingéré suffisamment de contaminants pour atteindre la charge corporelle (body burden) associée, dans l’expérimentation animale, à une incidence accrue des préjudices pour la santé. Parallèlement, des scientifiques se sont penchés sur une série de projets sur le terrain. Ceux-ci visaient à mesurer l’accroissement dans l’ingestion de contaminants, ce qui a permis de fonder le suivi ultérieur des préjudices potentiels pour la santé. Ces projets concernaient surtout les femmes enceintes en tant que groupe cible particulièrement vulnérable. Alors que les analyses de risque ont eu seulement un impact limité ou nul sur l’évolution ultérieure de la crise, le message d’apaisement qui transparaît de l’une de celles-ci a entraîné le blocage de moyens importants, nécessaires pour effectuer des recherches sur le terrain. Il s’agit malheureusement d’une occasion perdue qui, ne fût-ce qu’à titre de compensation, aurait permis d’enrichir notre connaissance très limitée du degré de contamination par les dioxines de la population belge. Malgré la réelle contribution scientifique en vue des contrôles PCB et les efforts des autorités pour contrôler la crise, celle-ci s’est amplifiée et est devenue une catastrophe économique pour le secteur concerné. Il faut sans doute y voir l’expression d’une crainte parfois irrationnelle manifestée par la population face au cancer, mais surtout un manque de transparence de notre chaîne alimentaire où la circulation des différents composants de base s’est avérée relativement obscure, notamment pour des motifs liés à la fraude et à l’évasion fiscale. Les contrôles ont donc été pendant longtemps en décalage avec la réalité. En pareilles circonstances, l’autorité – quelle qu’elle soit – est impuissante, même si épaulée de manière optimale au plan scientifique, surtout dans le contexte d’une Europe où les réflexes protectionnistes n’influencent que trop facilement la prise de décision. Le présent rapport comprend les résultats d’une analyse de risque plus approfondie de l’incident PCB-dioxine – le seul projet proposé par le groupe de travail ad hoc sur les dioxines ayant pu être réalisé – et il est logique de clôturer ainsi les interventions de ce groupe de travail dans le cadre de la crise de la dioxine. Il me semble néanmoins opportun, à partir de notre expérience, de formuler quelques suggestions visant à déterminer comment la science pourrait soutenir la sécurité de notre chaîne alimentaire à l’avenir: − Une première mission est l’analyse permanente de tous les processus au sein de la chaîne
alimentaire, notamment l’identification des différents points sensibles et des contaminants susceptibles d’y apparaître. Ceci doit conduire à l’élaboration d’une chaîne de contrôle hermétique et au suivi continu des résultats d’analyse.
− La deuxième mission est le fondement scientifique des normes – concentrations limites de référence pour les analyses de contrôle – pour les différents contaminants possibles dans l’alimentation. A cet égard, il y a lieu d’attirer l’attention sur la possibilité de développer des normes à court terme, à côté des normes classiques à long terme.
F / 070612
− 3 −
Conseil Supérieur d’Hygiène rue de l’Autonomie 4 ● 1070 Bruxelles ● www.health.fgov.be/CSS_HGR
Il est crucial de veiller dès à présent à la mise en œuvre de ces deux missions. Il serait vain d’attendre l’apparition d’un nouvel incident. Enfin, il me semble utile de confier ces deux missions à deux organismes différents. L’étude permanente et le suivi de la chaîne alimentaire relève clairement des tâches du Comité scientifique de l’Agence fédérale pour la sécurité de la chaîne alimentaire (AFSCA). L’étude des fondements scientifiques des concentrations limites semble, en revanche, s’inscrire davantage dans la mission du Conseil Supérieur d’Hygiène (CSH) au sein duquel il existe un large éventail d’expertise dans le domaine de la toxicologie qui ne se limite pas au domaine de la sécurité alimentaire. Jan Willems Président suppléant Groupe de travail ad hoc sur les dioxines
F / 070612
− 4 −
Conseil Supérieur d’Hygiène rue de l’Autonomie 4 ● 1070 Bruxelles ● www.health.fgov.be/CSS_HGR
SOMMAIRE Terminologie utilisée et abréviations Résumé synoptique et conclusions Chapter I: The dioxin and polychlorinated biphenyl contamination of the 1999 food chain: a critical analysis Chapter II: Probabilistic intake assessment of dioxin-like substances Chapter III: Body burden estimation and risk assessment Literature references Annexes 1 – 2 REMERCIEMENTS La présente étude résulte d’une suggestion de Dieter Flesch-Janys (Hamburg), émise lors d’une réunion organisée par Rolaf Van Leeuwen (16 juillet 1999, WHO-ECEH, Bilthoven). Nous le remercions pour ses suggestions utiles et ses commentaires lors de la réalisation de notre projet. Nous remercions également Edwin De Pauw (ULg) et ses collaborateurs pour les données originales concernant l’exposition de base aux PCDD/Fs et PCBs « dioxin-like ». Enfin, nous remercions Godfried Thiers (ISP) qui a permis de commencer ce travail.
F / 070612
− 5 −
Conseil Supérieur d’Hygiène rue de l’Autonomie 4 ● 1070 Bruxelles ● www.health.fgov.be/CSS_HGR
F / 070612
− 6 −
Conseil Supérieur d’Hygiène rue de l’Autonomie 4 ● 1070 Bruxelles ● www.health.fgov.be/CSS_HGR
F / 070612
− 7 −
Conseil Supérieur d’Hygiène rue de l’Autonomie 4 ● 1070 Bruxelles ● www.health.fgov.be/CSS_HGR
RESUME SYNOPTIQUE ET CONCLUSIONS Jan L. Willems et Leo Goeyens PROBLEMATIQUE On s’est beaucoup soucié, au nom de la « santé publique », des effets potentiels sur la santé de l’incident dioxine qui a contaminé la chaîne alimentaire voici quelques mois déjà lorsqu’il a été rendu public fin mai 1999. Au niveau belge et européen, des mesures extrêmes ont été prises, qui ont fait de l’incident une véritable catastrophe pour le secteur économique touché (Van Der Donckt, 2000). Celles-ci ont finalement été suivies de mesures compensatoires, afin d’atténuer les conséquences économiques de la crise. Une question importante – celle de savoir si un danger sérieux a existé ou existe encore ou non pour la santé publique – a été posée et quelques analyses préliminaires du risque ont été effectuées (Bernard, 2000; Bernard et al., 1999; Hens, 2000; Willems, 2000). Les moyens manquaient toutefois pour les développer d’une manière scientifiquement fondée. Une telle tentative a démarré début 2000, lorsque l’Institut scientifique de Santé publique a dégagé des moyens afin de formuler une réponse aussi détaillée que possible à cette question, en partant d’une approche basée sur un modèle mathématique. L’étude est partie de deux bases de données, d’une part les résultats des analyses chimiques de toute une série de denrées alimentaires complétés par des données de base provenant de la littérature, et d’autre part les habitudes alimentaires connues ou simulées de certains groupes de la population. Les deux banques de données ont été combinées, afin de parvenir à une estimation probabiliste de l’ingestion la plus vraisemblable de dioxines et de PCBs durant la crise parmi ces groupes de la population. Le résultat de cette analyse d’exposition détaillée (exposure assessment) comprend l’ordre de grandeur de l’ingestion avec sa variabilité d’une personne à l’autre et ses incertitudes. Sur base de l’ingestion, une première estimation peut être établie de ce que celle-ci aurait entraîné en termes d’augmentation de la charge corporelle ou body burden en dioxines. Une comparaison de ce body burden avec le danger potentiel (hazard) permet une analyse du risque (risk assessment) qui comprend l’estimation des effets néfastes possibles sur la santé publique suite à l’exposition dans son ensemble (exposition de base et crise). ORGANISATION DES BANQUES DE DONNÉES Dans une première phase, la banque de données disponible au Ministère de l’Agriculture, où sont stockés les résultats des analyses de PCB et de dioxines effectuées en 1999, a été analysée. Cette banque de données contient les résultats des échantillons d’exportation, des échantillons sanitaires et des échantillons de certification. Les échantillons d’exportation proviennent d’entreprises qui ne faisaient pas partie de la chaîne alimentaire contaminée et qui avaient besoin d’une analyse pour poursuivre les exportations. Les échantillons sanitaires proviennent d’entreprises bloquées qui faisaient partie de la chaîne alimentaire contaminée. Les échantillons de certification constituent le point de départ du contrôle de routine, entrepris après la crise, sur toutes les denrées alimentaires contenant des graisses. La banque de données contient, de cette manière, 42.396 résultats d’analyse pour les 7 PCB marqueurs. Comme mentionné ci-dessous, seuls 15.261 échantillons sanitaires ont finalement été utilisés. Ce nombre a ensuite été réduit à 5.264 échantillons provenant d’ingrédients de base de l’alimentation susceptibles de se retrouver dans la chaîne alimentaire. Sur 221 échantillons parmi ces 5.264 une analyse des PCDDs et des PCDFs a également été effectuée. Cette réduction s’explique par une étude de qualité très poussée de la banque de données, en ce compris le contrôle de l’identification complète des données – lieu, origine, matrice, date de prise d’échantillons – et l’élimination des doublons et la correction des résultats contradictoires. Cela a été possible notamment grâce à la constitution de différentes banques de données, dont une contenait les différents congénères, les 7 PCB marqueurs et les 17 congénères PCDD/F, chacun introduit manuellement. Des concentrations ont également été introduites, mais pas d’équivalents TCDD toxiques (TEQ) que l’on obtient en multipliant les concentrations par les facteurs d’équivalence toxiques (TEF). Les valeurs censurées – valeurs inférieures aux limites de détection – ont été clairement indiquées, éventuellement après avoir interrogé le laboratoire
F / 070612
− 8 −
Conseil Supérieur d’Hygiène rue de l’Autonomie 4 ● 1070 Bruxelles ● www.health.fgov.be/CSS_HGR
ayant effectué l’analyse. Afin de permettre un contrôle avec les moyens dont nous disposions, les résultats ont été transférés de la banque de données d’origine Oracle en Access 2000 et un programme en visual basic a été écrit dont le but était de contrôler la qualité des banques de données et de corriger les erreurs éventuelles lors de l’encodage. La banque de données principale a finalement aussi été corrigée et transférée en Access 2000. Elle contient maintenant les résultats (principalement les PCB marqueurs) de 42.396 échantil-lons, dont 26.666 pour les porcs, 5.309 pour les bovins, 8.313 pour la volaille et 495 autres. Elle sert à estimer le nombre d’entreprises suspectes durant la crise et à estimer la distribution des valeurs PCB pour chaque type d’animal et ce, pour les entreprises sanitaires et les entre-prises exportatrices séparément. Cette partie de l’étude est largement analysée aux chapitres I (relatif aux corrections apportées) et II (relatif à l’introduction de l’ingestion dans l’estimation). Pour ce qui est de l’élaboration de la banque de données à proprement parler, nous renvoyons à la 2e partie du présent rapport. ANALYSE DES PROFILS DES CONGÉNÈRES Cet aspect de l’étude vise principalement une meilleure description de la contamination; les caractéristiques tant qualitatives que quantitatives ont été prises en compte. A cet égard, on s’est intéressé au fingerprint ou profil de la contamination dans les différentes matrices. Quelques problèmes devaient encore être abordés à ce niveau, à savoir le nombre important de valeurs below detection limit (BDL), la pertinence statistique des différences de profil et la disponibilité limitée des données de quelques matrices dans les programmes de Certification et d’Exportation. Les techniques utilisées sont expliquées in extenso au Chapitre 1. Des valeurs BDL ont été estimées à l’aide d’une simulation Markov Chain Monte Carlo plutôt que par l’introduction d’une valeur BDL constante. Pour l’étude de profil, une data scaling a été appliquée afin de disposer de valeurs normalisées, pour lesquelles l’unité utilisée ne joue aucun rôle. Les données ont ensuite été traitées selon une opération statistique « traditionnelle » et des calculs basés sur des modèles mathématiques. La visualisation repose généralement sur des représentations graphiques de l’approche traditionnelle. Les différences entre les profils des échantillons spécifiques de l’incident et ceux des échantillons de base ne sont pas significatives. Ceci ne signifie pas qu’il n’existe pas de différences entre les différentes matrices entre elles – alimentation animale et graisse présentent effectivement des différences – mais pour les mêmes matrices aucune différence n’a été notée. On peut de ce fait supposer que la contamination de base (qui, finalement, est toujours présente) et l’incident stricto sensu ont la même source. CONSOMMATION ALIMENTAIRE ET DEGRÉ DE CONTAMINATION Consommation alimentaire En l’absence de données alimentaires récentes applicables à l’ensemble de la population belge, une banque de données datant de 1997 a tout d’abord été utilisée pour ses données détaillées de consommation alimentaire durant 7 jours chez 341 adolescents (14-18 ans). Sur base d’anciennes études comparatives entre adolescents et adultes, confirmées en 1998 encore par une enquête de consommation alimentaire aux Pays-Bas, on peut toutefois dire que les habitudes alimentaires des adultes ne différeront pas fondamentalement de celles des ado-lescents. Lorsqu’il est apparu, dans une première analyse des données sur base d’un modèle mathématique, que le poisson constitue une importante source de dioxines – ce qui, vu le degré de contamination connu, n’était pas inattendu – on a alors utilisé comme point de départ un régime détaillé de 14 jours pour des patients coronariens. Il s’agit d’un régime proposé par les Associations européennes de Cardiologie, où l’ingestion de poisson est en moyenne plus élevée que dans le reste de la population. En outre, une deuxième base de données détaillée établie à partir d’une enquête alimentaire auprès de 1.340 séniors (1995) était disponible . Bien que pratiquement aussi détaillée que celle réalisée auprès des jeunes, son utilité était limitée étant
F / 070612
− 9 −
Conseil Supérieur d’Hygiène rue de l’Autonomie 4 ● 1070 Bruxelles ● www.health.fgov.be/CSS_HGR
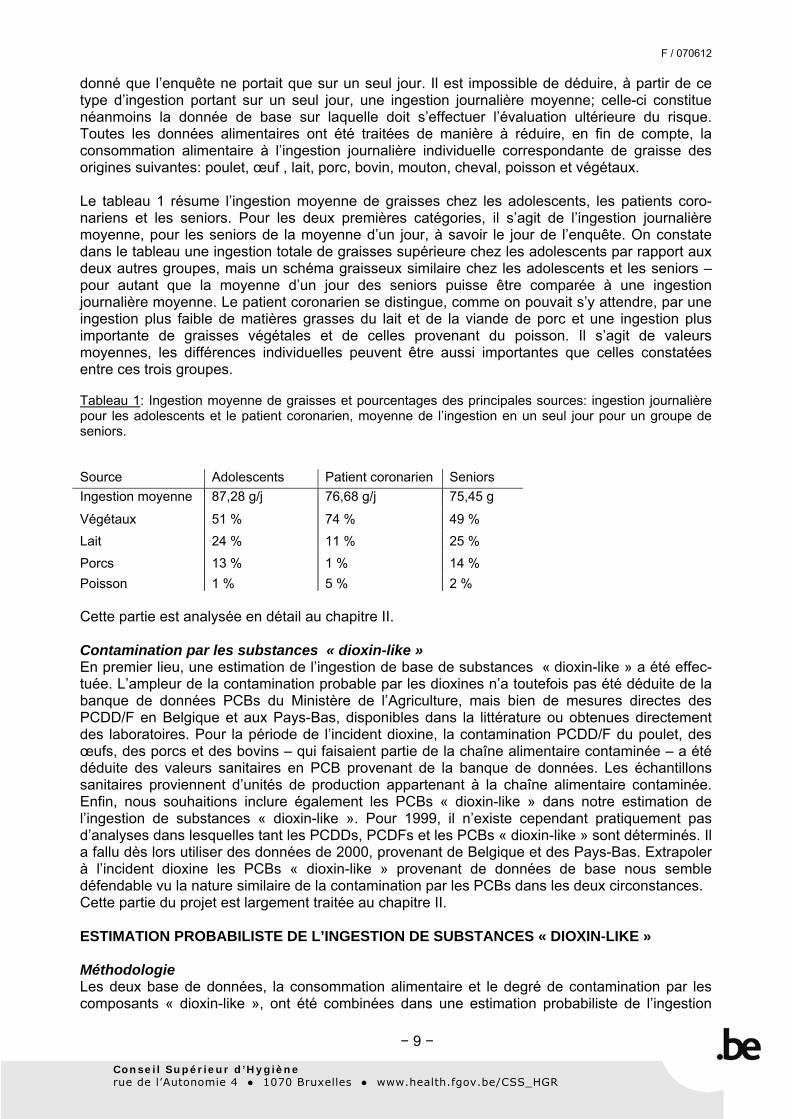
donné que l’enquête ne portait que sur un seul jour. Il est impossible de déduire, à partir de ce type d’ingestion portant sur un seul jour, une ingestion journalière moyenne; celle-ci constitue néanmoins la donnée de base sur laquelle doit s’effectuer l’évaluation ultérieure du risque. Toutes les données alimentaires ont été traitées de manière à réduire, en fin de compte, la consommation alimentaire à l’ingestion journalière individuelle correspondante de graisse des origines suivantes: poulet, œuf , lait, porc, bovin, mouton, cheval, poisson et végétaux. Le tableau 1 résume l’ingestion moyenne de graisses chez les adolescents, les patients coro-nariens et les seniors. Pour les deux premières catégories, il s’agit de l’ingestion journalière moyenne, pour les seniors de la moyenne d’un jour, à savoir le jour de l’enquête. On constate dans le tableau une ingestion totale de graisses supérieure chez les adolescents par rapport aux deux autres groupes, mais un schéma graisseux similaire chez les adolescents et les seniors – pour autant que la moyenne d’un jour des seniors puisse être comparée à une ingestion journalière moyenne. Le patient coronarien se distingue, comme on pouvait s’y attendre, par une ingestion plus faible de matières grasses du lait et de la viande de porc et une ingestion plus importante de graisses végétales et de celles provenant du poisson. Il s’agit de valeurs moyennes, les différences individuelles peuvent être aussi importantes que celles constatées entre ces trois groupes. Tableau 1: Ingestion moyenne de graisses et pourcentages des principales sources: ingestion journalière pour les adolescents et le patient coronarien, moyenne de l’ingestion en un seul jour pour un groupe de seniors. Source Adolescents Patient coronarien Seniors Ingestion moyenne 87,28 g/j 76,68 g/j 75,45 g
Végétaux 51 % 74 % 49 % Lait 24 % 11 % 25 % Porcs 13 % 1 % 14 % Poisson 1 % 5 % 2 % Cette partie est analysée en détail au chapitre II. Contamination par les substances « dioxin-like » En premier lieu, une estimation de l’ingestion de base de substances « dioxin-like » a été effec-tuée. L’ampleur de la contamination probable par les dioxines n’a toutefois pas été déduite de la banque de données PCBs du Ministère de l’Agriculture, mais bien de mesures directes des PCDD/F en Belgique et aux Pays-Bas, disponibles dans la littérature ou obtenues directement des laboratoires. Pour la période de l’incident dioxine, la contamination PCDD/F du poulet, des œufs, des porcs et des bovins – qui faisaient partie de la chaîne alimentaire contaminée – a été déduite des valeurs sanitaires en PCB provenant de la banque de données. Les échantillons sanitaires proviennent d’unités de production appartenant à la chaîne alimentaire contaminée. Enfin, nous souhaitions inclure également les PCBs « dioxin-like » dans notre estimation de l’ingestion de substances « dioxin-like ». Pour 1999, il n’existe cependant pratiquement pas d’analyses dans lesquelles tant les PCDDs, PCDFs et les PCBs « dioxin-like » sont déterminés. Il a fallu dès lors utiliser des données de 2000, provenant de Belgique et des Pays-Bas. Extrapoler à l’incident dioxine les PCBs « dioxin-like » provenant de données de base nous semble défendable vu la nature similaire de la contamination par les PCBs dans les deux circonstances. Cette partie du projet est largement traitée au chapitre II. ESTIMATION PROBABILISTE DE L’INGESTION DE SUBSTANCES « DIOXIN-LIKE » Méthodologie Les deux base de données, la consommation alimentaire et le degré de contamination par les composants « dioxin-like », ont été combinées dans une estimation probabiliste de l’ingestion
F / 070612
− 10 −
Conseil Supérieur d’Hygiène rue de l’Autonomie 4 ● 1070 Bruxelles ● www.health.fgov.be/CSS_HGR
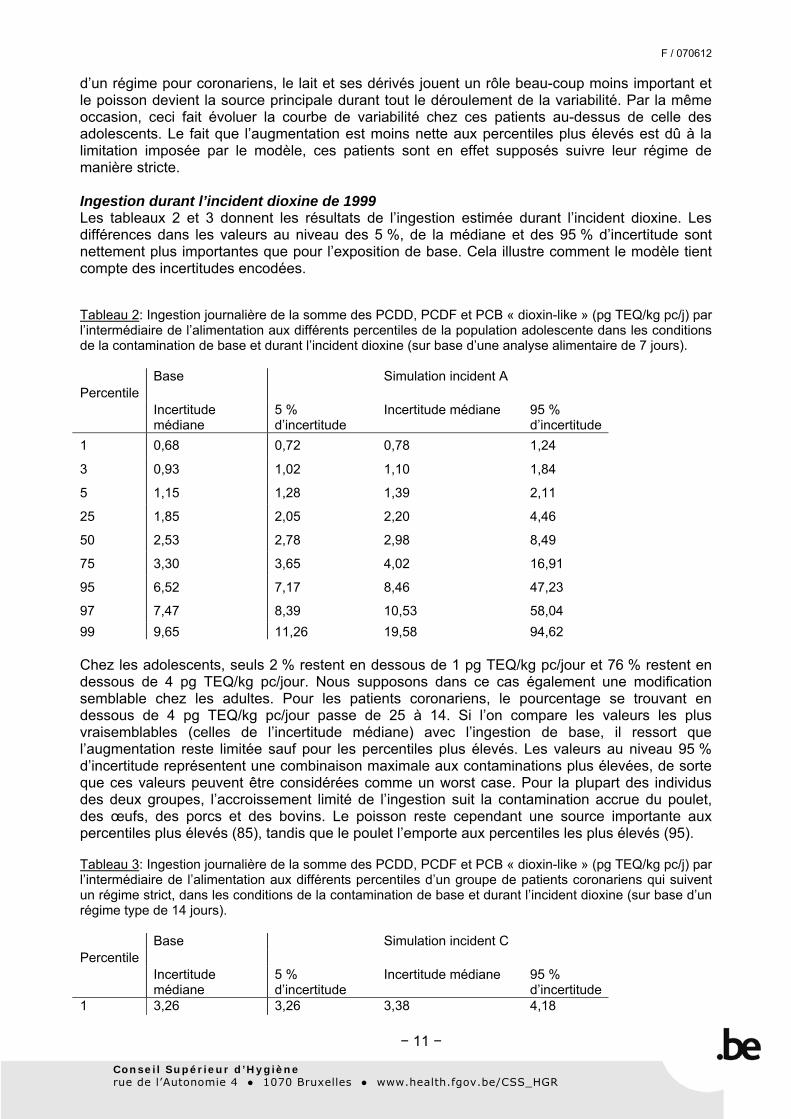
selon une analyse bidimensionnelle Monte Carlo. Nous nous référons pour plus de détails au sujet de cette estimation au chapitre II. En ce qui concerne l’ingestion de base, cette estimation est relativement univoque. La variabilité des résultats réside dans la variabilité et les limites des différentes données que nous prenons pour point de départ. Le modèle lui-même n’introduit pas d’incertitudes. En laissant la simulation Monte Carlo se dérouler de manière bidimensionnelle avec 1.500 contre-études, les variations dans les données encodées ont été ramenées à une moyenne de sorte que la variabilité dans le résultat final est celle qui existe entre les différents individus. En ce qui concerne l’apport de l’incident dioxine, les incertitudes sont plus importantes. Afin de prendre en compte cet élément, différentes sources d’incertitude ont été introduites dans le modèle: 1) la probabilité qu’un composant gras déterminé provenait de la chaîne sanitaire en opposition aux unités de production non contaminées, 2) la possibilité que certains groupes de personnes, en contact direct avec les unités contaminées, avaient manifestement été plus exposés que d’autres, qui n’avaient pas de contact avec la contamination, 3) l’incertitude concernant la période de prise d’échantillons pouvant être considérée comme représentative pour la période avant que l’incident ne soit rendu public, 4) l’incertitude lors de la déduction de concentrations en PCDD et PCDF des résultats des PCB marqueurs. Pour la période de l’incident on obtient ainsi une courbe d’incertitude médiane de variabilité entre les individus, de même que des courbes d’incertitude 5 % et 95 % de variabilité. La courbe médiane est la plus probable, la courbe d’incertitude 95 % où tout concourt à maximaliser l’ingestion, est un scénario worst case. La durée de l’incident est considérée comme allant de début février à fin mai (112 jours), la période d’où proviennent les résultats d’analyse a débuté le 1er mai et s’est terminée, pour le poulet et les œufs, soit les denrées alimentaires les plus contaminées, entre le 15 mai et le 15 juillet (simulations A, C et D). Exposition de base Dans la colonne 2 du tableau 2 figurent les résultats d’ingestion estimée pour le groupe des adolescents et dans le tableau 3 ceux pour les patients coronariens. Pour l’exposition de base, l’estimation n’est donnée que pour l’incertitude médiane. La dispersion de l’incertitude des résultats est d’ailleurs limitée vu que celle-ci ne repose que sur des degrés variables de contamination de base. Bien que lors d’études relatives à la sécurité alimentaire, qui ne s’occupent généralement pas de schémas alimentaires extrêmes, la répartition en percentiles de la population concernée est limitée vers le haut au percentile 97, les tableaux mentionnent aussi le percentile 99. Chez les adolescents, 3 % restent en dessous de 1 pg TEQ/kg pc/jour – la TDI la plus basse proposée par l’OMS – et 85 % restent en dessous de 4 pg TEQ/kg pc/jour – la TDI la plus élevée proposée par l’OMS. Vu l’ingestion similaire de graisses chez les adultes, on peut s’attendre à ce que ceux-ci se situent dans le même ordre de grandeur. Cette ingestion est entièrement comparable aux valeurs calculées pour d’autres pays européens industrialisés. Nous devons, à ce sujet, attirer l’attention sur le fait que la plupart des données de littérature disponibles ne comprennent que les PCDDs et les PCDFs et non les PCBs « dioxin-like ». Pour pouvoir les comparer avec nos chiffres, il y a lieu de les diviser environ par 2. Les personnes qui suivraient précisément un régime pour coronariens se trouvent au-dessus de 1 pg TEQ/kg pc/jour, 25 % d’entre elles restent en dessous des 4 pg TEQ/kg pc/jour. Chez les seniors, on constate une médiane, ingestion pour un seul jour, nettement inférieure à celle des adolescents (tableau 4). Une comparaison complète entre ces groupes n’est pas possible étant donné que, chez les seniors, il s’agit d’un jour pris au hasard et non d’une ingestion journalière mesurée sur plusieurs jours. On peut cependant accepter que la médiane, ou ingestion moyenne sur un jour, correspondra relativement bien à une médiane ou ingestion moyenne sur plusieurs jours. Lorsque l’on répartit l’ingestion journalière de substances « dioxin-like » dans des conditions de base chez les adolescents entre les différentes sources possibles, il apparaît que le lait et ses dérivés occupent une place importante, relativement homogène pour l’ensemble du groupe. Le poisson et ses dérivés constituent les principales sources à partir du percentile 85 et expliquent presque entièrement l’ingestion accrue de dioxine aux percentiles les plus élevés. Dans le cadre
F / 070612
− 11 −
Conseil Supérieur d’Hygiène rue de l’Autonomie 4 ● 1070 Bruxelles ● www.health.fgov.be/CSS_HGR
d’un régime pour coronariens, le lait et ses dérivés jouent un rôle beau-coup moins important et le poisson devient la source principale durant tout le déroulement de la variabilité. Par la même occasion, ceci fait évoluer la courbe de variabilité chez ces patients au-dessus de celle des adolescents. Le fait que l’augmentation est moins nette aux percentiles plus élevés est dû à la limitation imposée par le modèle, ces patients sont en effet supposés suivre leur régime de manière stricte. Ingestion durant l’incident dioxine de 1999 Les tableaux 2 et 3 donnent les résultats de l’ingestion estimée durant l’incident dioxine. Les différences dans les valeurs au niveau des 5 %, de la médiane et des 95 % d’incertitude sont nettement plus importantes que pour l’exposition de base. Cela illustre comment le modèle tient compte des incertitudes encodées. Tableau 2: Ingestion journalière de la somme des PCDD, PCDF et PCB « dioxin-like » (pg TEQ/kg pc/j) par l’intermédiaire de l’alimentation aux différents percentiles de la population adolescente dans les conditions de la contamination de base et durant l’incident dioxine (sur base d’une analyse alimentaire de 7 jours). Base Simulation incident A Percentile Incertitude
médiane 5 % d’incertitude
Incertitude médiane 95 % d’incertitude
1 0,68 0,72 0,78 1,24
3 0,93 1,02 1,10 1,84
5 1,15 1,28 1,39 2,11
25 1,85 2,05 2,20 4,46
50 2,53 2,78 2,98 8,49
75 3,30 3,65 4,02 16,91
95 6,52 7,17 8,46 47,23
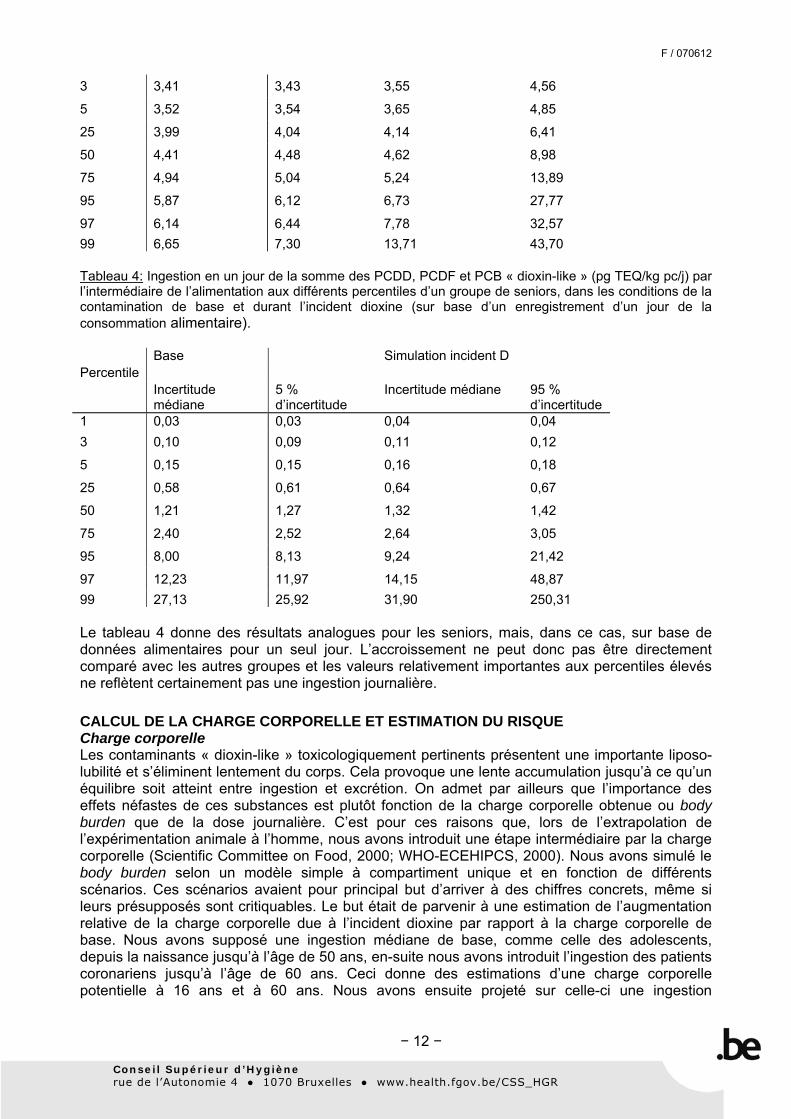
97 7,47 8,39 10,53 58,04 99 9,65 11,26 19,58 94,62 Chez les adolescents, seuls 2 % restent en dessous de 1 pg TEQ/kg pc/jour et 76 % restent en dessous de 4 pg TEQ/kg pc/jour. Nous supposons dans ce cas également une modification semblable chez les adultes. Pour les patients coronariens, le pourcentage se trouvant en dessous de 4 pg TEQ/kg pc/jour passe de 25 à 14. Si l’on compare les valeurs les plus vraisemblables (celles de l’incertitude médiane) avec l’ingestion de base, il ressort que l’augmentation reste limitée sauf pour les percentiles plus élevés. Les valeurs au niveau 95 % d’incertitude représentent une combinaison maximale aux contaminations plus élevées, de sorte que ces valeurs peuvent être considérées comme un worst case. Pour la plupart des individus des deux groupes, l’accroissement limité de l’ingestion suit la contamination accrue du poulet, des œufs, des porcs et des bovins. Le poisson reste cependant une source importante aux percentiles plus élevés (85), tandis que le poulet l’emporte aux percentiles les plus élevés (95). Tableau 3: Ingestion journalière de la somme des PCDD, PCDF et PCB « dioxin-like » (pg TEQ/kg pc/j) par l’intermédiaire de l’alimentation aux différents percentiles d’un groupe de patients coronariens qui suivent un régime strict, dans les conditions de la contamination de base et durant l’incident dioxine (sur base d’un régime type de 14 jours). Base Simulation incident C Percentile Incertitude
médiane 5 % d’incertitude
Incertitude médiane 95 % d’incertitude
1 3,26 3,26 3,38 4,18
F / 070612
− 12 −
Conseil Supérieur d’Hygiène rue de l’Autonomie 4 ● 1070 Bruxelles ● www.health.fgov.be/CSS_HGR
3 3,41 3,43 3,55 4,56
5 3,52 3,54 3,65 4,85
25 3,99 4,04 4,14 6,41
50 4,41 4,48 4,62 8,98
75 4,94 5,04 5,24 13,89
95 5,87 6,12 6,73 27,77
97 6,14 6,44 7,78 32,57 99 6,65 7,30 13,71 43,70 Tableau 4: Ingestion en un jour de la somme des PCDD, PCDF et PCB « dioxin-like » (pg TEQ/kg pc/j) par l’intermédiaire de l’alimentation aux différents percentiles d’un groupe de seniors, dans les conditions de la contamination de base et durant l’incident dioxine (sur base d’un enregistrement d’un jour de la consommation alimentaire). Base Simulation incident D Percentile Incertitude
médiane 5 % d’incertitude
Incertitude médiane 95 % d’incertitude
1 0,03 0,03 0,04 0,04 3 0,10 0,09 0,11 0,12
5 0,15 0,15 0,16 0,18
25 0,58 0,61 0,64 0,67
50 1,21 1,27 1,32 1,42
75 2,40 2,52 2,64 3,05
95 8,00 8,13 9,24 21,42
97 12,23 11,97 14,15 48,87 99 27,13 25,92 31,90 250,31 Le tableau 4 donne des résultats analogues pour les seniors, mais, dans ce cas, sur base de données alimentaires pour un seul jour. L’accroissement ne peut donc pas être directement comparé avec les autres groupes et les valeurs relativement importantes aux percentiles élevés ne reflètent certainement pas une ingestion journalière. CALCUL DE LA CHARGE CORPORELLE ET ESTIMATION DU RISQUE Charge corporelle Les contaminants « dioxin-like » toxicologiquement pertinents présentent une importante liposo-lubilité et s’éliminent lentement du corps. Cela provoque une lente accumulation jusqu’à ce qu’un équilibre soit atteint entre ingestion et excrétion. On admet par ailleurs que l’importance des effets néfastes de ces substances est plutôt fonction de la charge corporelle obtenue ou body burden que de la dose journalière. C’est pour ces raisons que, lors de l’extrapolation de l’expérimentation animale à l’homme, nous avons introduit une étape intermédiaire par la charge corporelle (Scientific Committee on Food, 2000; WHO-ECEHIPCS, 2000). Nous avons simulé le body burden selon un modèle simple à compartiment unique et en fonction de différents scénarios. Ces scénarios avaient pour principal but d’arriver à des chiffres concrets, même si leurs présupposés sont critiquables. Le but était de parvenir à une estimation de l’augmentation relative de la charge corporelle due à l’incident dioxine par rapport à la charge corporelle de base. Nous avons supposé une ingestion médiane de base, comme celle des adolescents, depuis la naissance jusqu’à l’âge de 50 ans, en-suite nous avons introduit l’ingestion des patients coronariens jusqu’à l’âge de 60 ans. Ceci donne des estimations d’une charge corporelle potentielle à 16 ans et à 60 ans. Nous avons ensuite projeté sur celle-ci une ingestion
F / 070612
− 13 −
Conseil Supérieur d’Hygiène rue de l’Autonomie 4 ● 1070 Bruxelles ● www.health.fgov.be/CSS_HGR
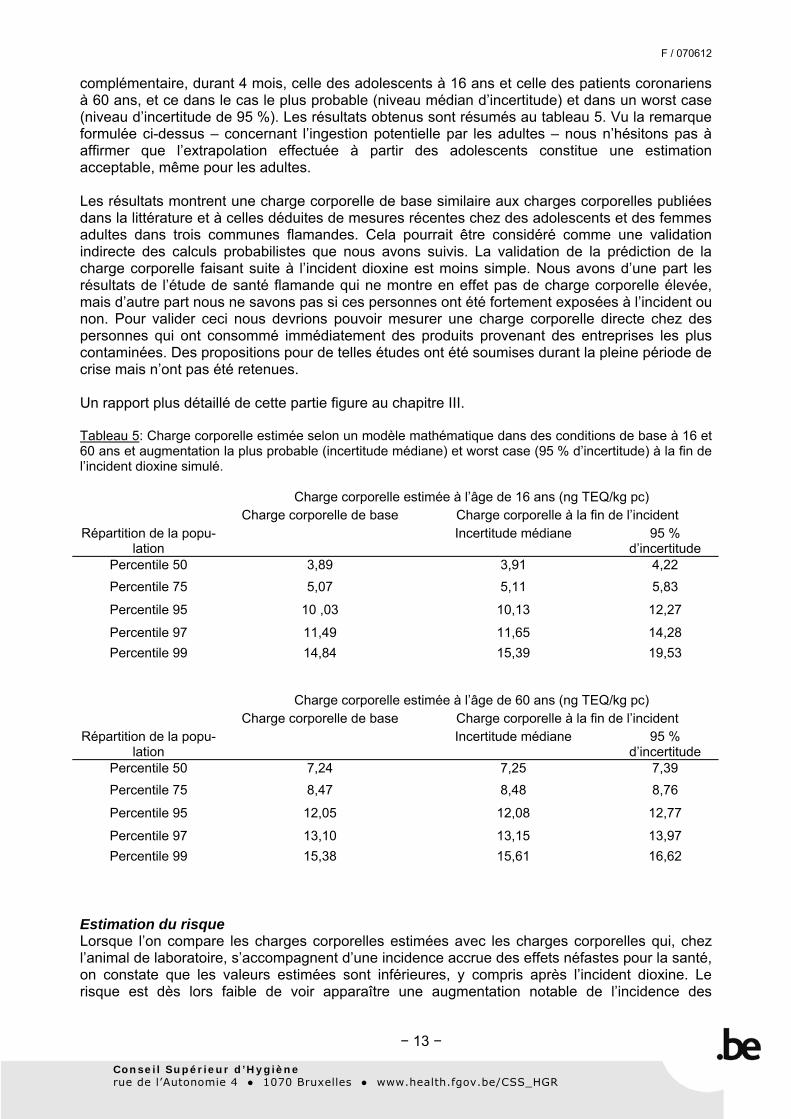
complémentaire, durant 4 mois, celle des adolescents à 16 ans et celle des patients coronariens à 60 ans, et ce dans le cas le plus probable (niveau médian d’incertitude) et dans un worst case (niveau d’incertitude de 95 %). Les résultats obtenus sont résumés au tableau 5. Vu la remarque formulée ci-dessus – concernant l’ingestion potentielle par les adultes – nous n’hésitons pas à affirmer que l’extrapolation effectuée à partir des adolescents constitue une estimation acceptable, même pour les adultes. Les résultats montrent une charge corporelle de base similaire aux charges corporelles publiées dans la littérature et à celles déduites de mesures récentes chez des adolescents et des femmes adultes dans trois communes flamandes. Cela pourrait être considéré comme une validation indirecte des calculs probabilistes que nous avons suivis. La validation de la prédiction de la charge corporelle faisant suite à l’incident dioxine est moins simple. Nous avons d’une part les résultats de l’étude de santé flamande qui ne montre en effet pas de charge corporelle élevée, mais d’autre part nous ne savons pas si ces personnes ont été fortement exposées à l’incident ou non. Pour valider ceci nous devrions pouvoir mesurer une charge corporelle directe chez des personnes qui ont consommé immédiatement des produits provenant des entreprises les plus contaminées. Des propositions pour de telles études ont été soumises durant la pleine période de crise mais n’ont pas été retenues. Un rapport plus détaillé de cette partie figure au chapitre III. Tableau 5: Charge corporelle estimée selon un modèle mathématique dans des conditions de base à 16 et 60 ans et augmentation la plus probable (incertitude médiane) et worst case (95 % d’incertitude) à la fin de l’incident dioxine simulé.
Charge corporelle estimée à l’âge de 16 ans (ng TEQ/kg pc) Charge corporelle de base Charge corporelle à la fin de l’incident
Répartition de la popu-lation
Incertitude médiane 95 % d’incertitude
Percentile 50 3,89 3,91 4,22 Percentile 75 5,07 5,11 5,83
Percentile 95 10 ,03 10,13 12,27
Percentile 97 11,49 11,65 14,28 Percentile 99 14,84 15,39 19,53
Charge corporelle estimée à l’âge de 60 ans (ng TEQ/kg pc) Charge corporelle de base Charge corporelle à la fin de l’incident
Répartition de la popu-lation
Incertitude médiane 95 % d’incertitude
Percentile 50 7,24 7,25 7,39 Percentile 75 8,47 8,48 8,76
Percentile 95 12,05 12,08 12,77
Percentile 97 13,10 13,15 13,97 Percentile 99 15,38 15,61 16,62
Estimation du risque Lorsque l’on compare les charges corporelles estimées avec les charges corporelles qui, chez l’animal de laboratoire, s’accompagnent d’une incidence accrue des effets néfastes pour la santé, on constate que les valeurs estimées sont inférieures, y compris après l’incident dioxine. Le risque est dès lors faible de voir apparaître une augmentation notable de l’incidence des
F / 070612
− 14 −
Conseil Supérieur d’Hygiène rue de l’Autonomie 4 ● 1070 Bruxelles ● www.health.fgov.be/CSS_HGR
préjudices pour la santé dans l’ensemble de la population. Ceci n’exclut cependant pas que certaines personnes, dans les groupes dont l’exposition est la plus élevée, se situent à la limite de la toxicité et que, chez celles-ci, des préjudices apparaissent. A moins qu’un follow up stricte soit réalisé, par exemple auprès de femmes enceintes ou allaitantes ayant été en contact direct avec les élevages de poulet contaminés, ces préjudices pour la santé ne seront jamais détectés. Cette conclusion fait écho au principe suivant lequel les effets des dioxines présentent une valeur seuil et, plus particluièrement, à l’idée qu’en dessous d’une certaine charge l’effet est négligeable, sans même essayer de le quantifier. Ce principe, qui a entraîné la définition d’une TDI, est utilisé en Europe pour les effets néfastes sur le développement des jeunes animaux, pour les troubles endocriniens, de même que pour l’augmentation du cancer (Scientific Committee on Food, 2000; WHO-ECEH-IPCS, 2000). Les inductions enzymatiques apparaîtraient effectivement à des charges corporelles plus faibles, inférieures à 10 ng TEQ/kg pc, mais leur importance du point de vue des préjudices pour la santé n’est pas établie. L’USEPA, en revanche, n’admet pas de valeur seuil pour les substances cancérigènes, ni pour les promoteurs du cancer, et établit par conséquent un risque quantitatif pour la cancérogénicité. Ces valeurs cancer potency sont relativement variables dans le temps selon qu’on accorde plus d’importance à l’un ou l’autre résultat expérimental ou à des observations chez l’homme. Ces calculs s’effectuent cependant toujours au départ de doses relativement élevées avec extrapolation vers les doses faibles. En Belgique, une telle procédure a entraîné la prédiction de 8.000 décès supplémentaires dus au cancer dans les 70 prochaines années à la suite de l’incident dioxine – chiffre qui doit être comparé aux 2.000.000 à 3.000.000 de décès dus au cancer auxquels on doit s’attendre en Belgique pour les 70 prochaines années. Nous ne sommes pas partisans de telles prédictions et considérons que des déclarations au sujet de l’augmentation de la mortalité due au cancer à la suite de l’incident dioxine ne peuvent être faites qu’en accordant une attention particulière aux incertitudes y afférentes, chose qui se perd généralement dans le processus d’information du public au sujet du risque. Aux Etats-Unis, de plus en plus de voix s’élèvent également pour considérer cette low dose extrapolation plutôt comme un critère pour la prise des mesures les plus urgentes que comme un modèle prédictif dans une situation concrète. Le chapitre III développe plus avant l’estimation du risque. CONCLUSIONS
⇒ Nous avons effectué une estimation probabiliste de l’ingestion de PCDDs, PCDFs et de PCBs « dioxin-like » sur base d’ingestions alimentaires détaillées et du degré de contamination dans des conditions de base et durant l’incident dioxine. Cette estimation repose sur une analyse bidimensionnelle Monte Carlo.
⇒ Les différences entre les profils des échantillons spécifiques de l’incident et des échantillons de base ne sont pas statistiquement significatives. De ce fait, on peut supposer que la contamination de base (qui est finalement toujours présente) et l’incident stricto sensu ont la même source.
⇒ Dans la banque de données reprenant les résultats analytiques de la période de l’incident seuls ont été utilisés les résultats bien identifiables et provenant de denrées alimentaires de base qui se retrouvaient directement dans la chaîne alimentaire.
⇒ Les données de consommation alimentaire suivantes ont été utilisées: une enquête détail-lée de 7 jours chez les adolescents, un régime détaillé de 14 jours pour les patients coronariens et une enquête d’un seul jour chez les seniors.
⇒ Le résultat indique une ingestion globale de substances « dioxin-like » similaire à celle des autres pays industrialisés. Trois pour cent des adolescents restent en dessous de 1 pg TEQ/kg pc/jour – la TDI la plus basse de l’OMS; 85 % des adolescents et 25 % des patients coronariens restent en dessous de 4 pg TEQ/kg px/jour – la TDI la plus élevée de l’OMS. Le lait et ses dérivés constituent une source importante pour l’ensemble des
F / 070612
− 15 −
Conseil Supérieur d’Hygiène rue de l’Autonomie 4 ● 1070 Bruxelles ● www.health.fgov.be/CSS_HGR
groupes, le poisson est la source la plus importante pour ceux dont l’ingestion est plus élevée.
⇒ Durant l’incident dioxine, une augmentation modérée de l’ingestion est apparue chez la plupart des membres de ces groupes. Deux pour cent des adolescents restent ici en dessous de 1 pg TEQ/kg pc/jour, 76 % des adolescents et 17 % des patients coronariens restent en dessous de 4 pg/kg pc/jour. Dans quelques cas, une augmentation importante est apparue, due principalement à un apport par le poulet.
⇒ Malgré l’ingestion accrue aux percentiles les plus élevés, la charge corporelle résultante reste en dessous du niveau auquel, chez l’animal de laboratoire, une augmentation de l’incidence des effets néfastes pour la santé est constatée. Il est dès lors invraisemblable que des effets sur la santé soient décelés au sein de l’ensemble de population, mais cela n’exclut toutefois pas, chez certaines personnes parmi les plus exposées, l’apparition d’effets. Seule une étude épidémiologique rigoureuse permettrait toutefois d’identifier ces effets.
F / 070612
− 16 −
Conseil Supérieur d’Hygiène rue de l’Autonomie 4 ● 1070 Bruxelles ● www.health.fgov.be/CSS_HGR
COLLABORATEURS Vakgroep Farmacologie - Heymans Instituut, Faculteit Geneeskunde en Gezondheidswetenschappen, Universiteit Gent Bilau Maaike Vanpoucke Isolde Vrijens Bernard Willems Jan Vakgroep Maatschappelijke Gezondheidszorg, Faculteit Geneeskunde en Gezondheidswetenschappen, Universiteit Gent Bellemans Mia De Backer Guy De Henauw Stefaan De Maeyer Mieke Matthys Christophe Vakgroep Levensmiddelentechnologie en Voeding, Faculteit Landbouwkundige en Toegepaste Wetenschappen, Universiteit Gent Dewettinck Koen Huyghebaert Andre Mulas Silvano Vakgroep Toegepaste Wiskunde en Informatica, Faculteit Wetenschappen, Universiteit Gent Goetghebeur Els Département Pharmaco-Bromatologie, Institut Scientifique pour la Santé Publique, Bruxelles Goeyens Leo Srebrnik Sarah Talloen Willem Vleminckx Michael Vrijens Bernard Consum data bank, Ministère Fédéral de l’Agriculture et des Classes Moyennes, Bruxelles De Cock An De Poorter Geert Vleminckx Michael MANDANT Ministère fédéral de la Santé publique, Bruxelles FINANCEMENT Institut scientifique de Santé Publique, Bruxelles Ministère de l’Agriculture et des Classes Moyennes, Bruxelles Universiteit Gent
Chapter I:
The dioxin and polychlorinated biphenyl contamination
of the 1999 food chain: a critical analysis
Willem Talloen, Bernard Vrijens, Sarah Srebrnik and Leo Goeyens
Contents
1 Introduction ....................................................................................................................... 3
2 Materials and methods ...................................................................................................... 7
3 Results............................................................................................................................... 11
3.1 General description of the data................................................................................ 11
3.2 Degree of contamination ......................................................................................... 12
3.3 Congener specific analyses...................................................................................... 14
3.4 Furans : dioxin : PCB ratios .................................................................................... 16
3.5 Profile comparisons ................................................................................................. 17
3.5.1 Pairwise correlations ........................................................................................... 17
3.5.2 PCB profiles ......................................................................................................... 18
3.5.3 Dioxin and furan profiles ..................................................................................... 21
3.5.4 Principal component analysis .............................................................................. 21
3.5.5 Relation to Aroclor mixtures ................................................................................ 22
4 Conclusion ........................................................................................................................ 23
1 Introduction
The Belgian dioxin/PCB crisis — In February and March 1999 Belgian farmers especially
witnessed significant decreases in egg production and egg hatching as well as increased
mortality of chicks. These were indicator observations of a dioxi n/PCB crisis which
incriminated the livestock feed sector. At the origin of this contamination was a fat rendering
company, where one animal fat tank was contaminated (voluntary or accidentally) with
polychloro biphenyls (PCBs) and dioxins (Ashraf, 1999). Feeding stuff manufactured with
this fat was delivered to many poultry, pig and cattle farms.
Since the source of dioxins was found to be PCBs, the Belgian government installed a
thorough monitoring program making the link between dioxins and the 7 marker PCBs.
Contaminated samples contained consistently enhanced concentrations of PCBs; the highest
values observed amounted to ~0.5 mg PCB g-1 fat and ~10 ng TEQ g-1 fat, respectively. On
average, the PCB to dioxin ratio (pg PCBs per g fat : pg TEQ per g fat) was 50000:1, a
constant PCB to dioxin ratio which refers predominantly to the chicken fat and egg analyses
carried out during the earliest phase of the crisis. Pork and beef data show largely deviating
PCB to dioxin ratios, however (Vrijens et al., this issue). This 50000:1 ratio led to the
implementation of a maximal tolerance level of 200 ng PCB g-1 fat to be applied as risk
management tool during the crisis.
In addition to the intensive monitoring program, identified as sanitair (SANI), a certification
system was installed for both the export market as well as the intracommunity trade. These
samples, termed export (EXPO) and certificate (CERT) samples respectively, will be used in
the present study as representative of background contamination, because they are assumed
not to be affected by the feed incident.
Properties and sources of dioxins and dioxin-like PCBs — Dioxins is the general collective
term for chlorinated aromatic compounds, consisting of a group called polychloro dibenzo-p-
dioxins (PCDDs) and polychloro dibenzofurans (PCDFs). The group of PCDDs consists of 75
congeners (similar but not isomeric molecular structures), whereas the group of PCDFs
consists of 135 congeners (Figure 1). 2,3,7,8- Tetrachloro dibenzo-p-dioxin (TCDD) is the
prototype for this class of aromatic hydrocarbons which have similar patterns of toxicity.
Characteristic of all the compounds is their high melting point, low vapour pressure and good
solubility in and affinity for apolar media. Therefore, PCDDs and PCDFs have been identified
worldwide in very diverse environmental media (Safe, 1994). Moreover, they accumulate and
biomagnify in the food chain due to elevated fat solubility and pronounced resistance towards
metabolic degradation.
In contrast to the dioxins’ group which does not have any known use and is not synthesized
intentionally, PCBs had well specified commercial uses such as dielectric, heat-exchange and
hydraulic fluids in capacitors and transformers. Their production has ceased decades ago, but
they are still among the priority global contaminants. Chemically, the term PCBs denotes a
family of 209 congeners (Figure 2), which exhibit a wide range of toxicological properties.
The congeners differ by their number and position of chlorine atoms. PCBs are usually
present in environmental samples as complex mixtures of about 135 congeners (Ballschmiter
and Zell, 1980), not all of them having the same importance and toxicity. Some of them such
as PCBs 28, 52, 101, 118, 138, 153 and 180 (7 marker PCBs; Ballschmiter and Zell, 1980) are
used for biomonitoring studies due to their high concentration in technical mixtures and
recalcitrance (Serrano et al., 2000).
Those PCBs known as dioxin-like are potentially the most toxic given their structural
similarity to PCDDs and PCDFs. They are likely to achieve dioxin-like planar configurations
due to two or less chlorine atoms at their ortho positions. One distinguishes non-ortho, mono-
ortho and di-ortho PCBs (Figure 2), with non-ortho PCBs being considered to be most toxic
as they exhibit a co-planar structure.
Dioxins have the well-deserved reputation of being the most potent man-made biological
agents and along with the dioxin-like PCBs they are ubiquitous in the environment (Clapp and
Ozonoff, 2000). Dioxins are primarily released to the environment through emissions from
the incineration of municipal, chemical and medical wastes, from backyard burning and from
improper disposal of chlorinated chemical wastes. Other sources might previously have gone
unnoticed but are potentially important. Baker and Hites (2000) e.g. conclude that
photochemical synthesis of octachloro dibenzo-p-dioxin (OCDD) from pentachlorophenol
(PCP) in atmospheric water is a most significant source of OCDD in the environment.
PCDDs, PCDFs and PCBs occur in general as extremely complex mixtures of congeners,
their relative concentrations differing substantially across the “contaminated” matrices due to
differences in solubility, volatility and metabolic rates. Release of PCDDs and PCDFs occurs
mainly as impurities or by-products associated with anthropogenic activities as well as natural
processes (e.g. volcano outbursts and forest fires). This complexity of contaminant mixtures
enhances dramatically the difficulty of risk evaluation for humans and wildlife. Because of
the need to estimate the toxicity, the international community came up with the concept of
toxic equivalency factors (TEFs) to address and facilitate risk assessment. Different TEF
schemes have been developed (Barnes et al., 1989; NATO; Ahlborg et al., 1994; Van de Berg
et al., 1998; Safe, 1997 and 1998). The most recent consensus TEFs for humans, fish and
wildlife risk assessment were derived at a WHO/IPCS (World Health Organisation /
International Program on Chemical Safety) meeting in Stockholm on 15-18 June 1997 (Van
de Berg et al., 1998 and 2000).
There is an agreement that most effects of PCDDs, PCDFs, and dioxin-like PCBs are
mediated through the action of the aryl hydrocarbon receptor (AhR), a cytosolic protein
characterised by high affinity for these compounds (Birnbaum, 1994; Denison and Heath-
Pagliuso, 1998). The occurrence of this common mechanism legitimates the use of the TEF
concept even when the quantitative response of the species varies. Congeners with 4 lateral
chlorine atoms exhibit strongest effects; increasing chlorination reduces the potency mainly
by decreasing the Ah receptor binding. Toxic potencies of the different congeners relative to
TCDD are indicated by their corresponding TEF values. TEFs have been assigned to 7
dioxins, 10 furans and 12 PCBs. They range from 0.00001 to 1, what illustrates the
pronounced variability in toxicity (Van den Berg et al., 2000). TEFs in combination with the
chemical residue value—predominantly congener concentrations obtained by gas
chromatography-high resolution mass spectroscopy—are used to calculate the toxic
equivalent concentrations (TEQs) in the samples:
TEQ = Σ (PCDDi x TEFi) + Σ (PCDFi x TEFi) + Σ (PCBi x TEFi).
Considering adverse hormonal, reproduction and developmental effects seen in animal
studies, a consultation convened by the WHO established a tolerable daily intake (TDI) range
from 1 to 4 pg TEQ per kilogram body weight (WHO, 1999).
Congener-specific fingerprinting — Since dioxins and PCBs are most often detected as
complex congener mixtures, their relative composition serves as a “fingerprint” or “signature”
of the contamination. Fingerprinting has found interesting applications in contamination
source identification, categorization and classification of chemicals, elucidation of transport
and transformation pathways as well as formation mechanisms (Liebman, 1978; Buekens et
al., 2000).
During the last decades multivariate fingerprinting has been ameliorated, and nowadays
congener-specific pattern recognition techniques are an important statistical tool in the
analytical laboratory (Ferguson, 1998). These methodologies were utilized in a number of
investigations linking environmental concentrations to their original point source (Luotamo et
al., 1991).
The application of chemometrics became an increasingly important tool to recognize and
distinguish chemical fingerprint patterns; its suitability was often shown by evaluations of
similarities and differences of discrete sets of environmental samples. Researchers noticed the
advantages of the pattern-recognition methodology in studies addressing the quality of the
data, identifying similar sample groups, determining prevalent chemical constituents or
physical attributes among different samples or providing a classification method for
identifying the group or class to which a sample corresponds (Wenning et al., 1993). For
example, multivariate data analysis techniques such as Principle Components Analysis (PCA)
have been succesfully used to characterise the congener-specific fingerprint of dioxin-
contaminated sediments and soils and to differentiate the sources of these contaminants in the
environment (Stalling et al., 1985; Wenning et al., 1993; Schuhmacher et al., 2000). Buekens
et al. (1998 and 2000) have compared the PCDD/F profiles from eight different kinds of
industrial metallurgical processes.
More relevant to the current study is the application of suchlike pattern recognition techniques
to concentrations present in biological receptors. A non-exhaustive list of illustrative studies
refers amongst others to investigations on herring gull eggs of the Great Lakes (Macdonald et
al., 1992), on Forster’s terns eggs of the Wisconsin region (Schwartz and Stalling, 1991), on
bioaccumulation rates in different fish (De Boer and Stronck, 1993; Foster et al., 1999;
Serrano et al., 2000) and fish-eating wildlife (de Wit et al., 1992; Storr-Hansen et al., 1995)
and on dioxins’ presence in cow milk following ingestion of PCP treated wood (Fries et al.,
1999).
Typically this form of investigative analyses faces difficulties due to the ubiquitous nature of
the studied compounds, the lack of background data, and the enhancing influences of other
external contaminant sources. However, with the EXPO and CERT data, which are assumed
not to be contaminated by the incident, the available dataset allows for exploration of possible
differences between incident contaminated and background contaminated samples in a variety
of matrices.
Objectives — The present study aims primarily at a qualitative and quantitative description
of the dioxins and PCBs contamination in multifold matrices sampled during the crisis.
Congener specific profiles or fingerprints are studied in order to highlight incident-specific
impacts, consistency between and within the sampled matrices and differences in
contamination patterns between incident contaminated and background contaminated
samples.
2 Materials and methods
Data sets — The majority of samples taken within the framework of the EXPO, CERT and
SANI programs were analysed for 7 PCB congeners; positive samples were in general
analysed for 17 PCDD/F congeners.
Standard PCB analyses, either carried out by gas chromatography-mass spectroscopy
(GC/MS) or gas chromatography with electron capture detection (GC/ECD), consisted in
detection and quantification of 7 marker PCBs. Quantifications were not always possible,
however, due to numerous below detection limit concentrations. Each single analysis i
combines information on sample characteristics (such as sampling moment, sampling
location, laboratory, ...) with a vector
Yi = (yij, j=1, ..., 7)
which is a function of the concentrations of the 7 marker PCBs. Generally, the 7 marker PCBs
contribute for approximately one third of the whole PCB content in the contaminated feed
(Tuomisto, 1999).
Most of the positive samples, meaning samples exhibiting PCB concentrations exceeding 200
ng g-1 fat, were additionally analysed for PCDD and PCDF concentrations. This resulted in
PCDD/F profiles, determined according to the reference GC-HRMS technique. Sample sizes
of PCB and PCDD/F analyses for the matrices animal feed, eggs, milk, chicken, beef, pork
and derived products are given in Tables 1 and 2 , respectively.
In order to verify the quality of the PCB analyses performed, an intercomparison study was
organised by the dioxin-PCB unit of the Ministries of Public Health and Agriculture
(Beernaert and De Poorter, personal communication). This study revealed very high
coefficients of variation under repeatability and reproducibility conditions. The inter- and
intralaboratory differences in accuracy showed considerable variability, calling into question
the participation of some of the laboratories and complicating the subsequent data handling.
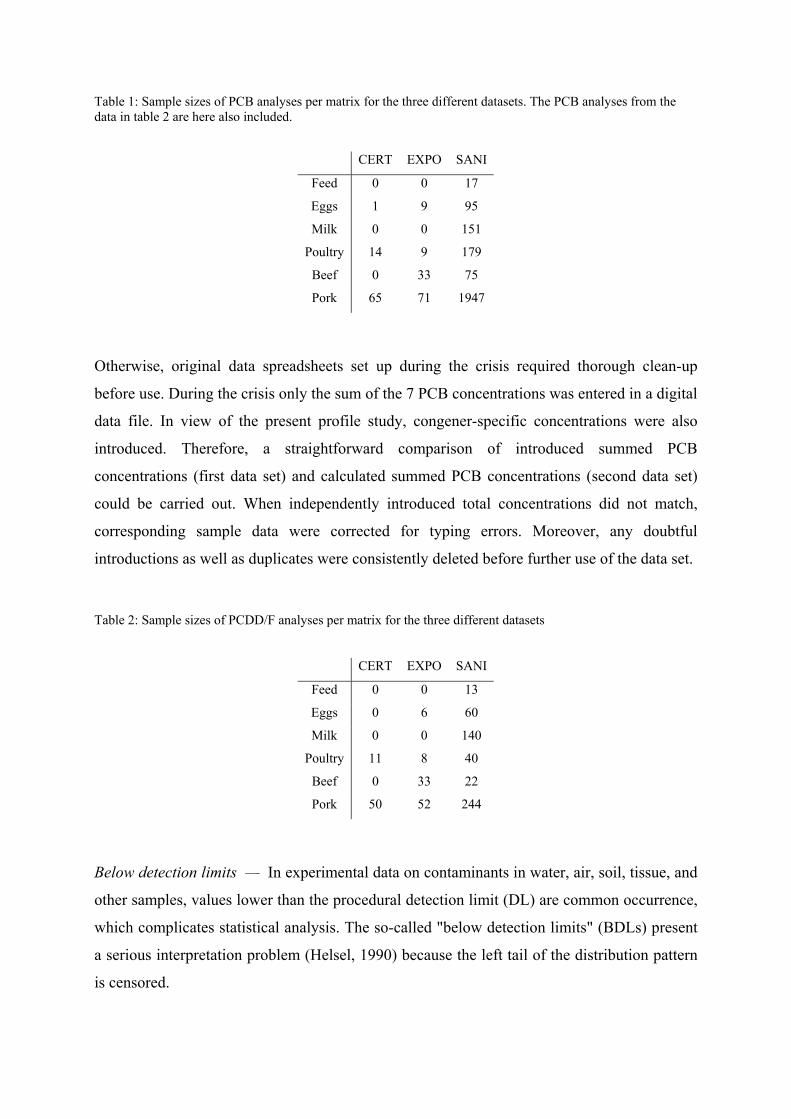
Table 1: Sample sizes of PCB analyses per matrix for the three different datasets. The PCB analyses from the data in table 2 are here also included.
CERT EXPO SANI
Feed 0 0 17
Eggs 1 9 95
Milk 0 0 151
Poultry 14 9 179
Beef 0 33 75
Pork 65 71 1947
Otherwise, original data spreadsheets set up during the crisis required thorough clean-up
before use. During the crisis only the sum of the 7 PCB concentrations was entered in a digital
data file. In view of the present profile study, congener-specific concentrations were also
introduced. Therefore, a straightforward comparison of introduced summed PCB
concentrations (first data set) and calculated summed PCB concentrations (second data set)
could be carried out. When independently introduced total concentrations did not match,
corresponding sample data were corrected for typing errors. Moreover, any doubtful
introductions as well as duplicates were consistently deleted before further use of the data set.
Table 2: Sample sizes of PCDD/F analyses per matrix for the three different datasets
CERT EXPO SANI
Feed 0 0 13
Eggs 0 6 60
Milk 0 0 140
Poultry 11 8 40
Beef 0 33 22
Pork 50 52 244
Below detection limits — In experimental data on contaminants in water, air, soil, tissue, and
other samples, values lower than the procedural detection limit (DL) are common occurrence,
which complicates statistical analysis. The so-called "below detection limits" (BDLs) present
a serious interpretation problem (Helsel, 1990) because the left tail of the distribution pattern
is censored.
Many common practices for handling BDLs, such as deletion of these values or simple
substition of each value by either zero, or the DL or half of the DL are known to generate
biased estimates for means and variances. Moreover, they lack sound statistical justification
(Helsel, 1990; Slymen and de Peyster, 1994). Substitution by zero or the DL will respectively
result in underestimates and overestimates of the “true” concentration. Hoogerbrugge and
Liem (2000) showed that imputation of one half the DL improved remarkably the estimates
compared to substitution by zero or the value of the DL. However, substitution by one half of
the DL assumes uniformly distributed values between zero and the DL, which is inconsistent
with typical distributional assumptions for values above the DL, such as the normal or
lognormal distrbutions. Moreover, replacing each value below the detection limit with the
same value alters the variation attributable to the sample. Unbiased estimates of the “true”
BDLs are therefore highly desirable.
A variety of different statistical techniques are available for estimating parameters of censored
data derived from environmental sampling. Historically, a number of investigators have used
the maximum likelihood estimates (MLE), based on specific distributions (e.g. normal,
lognormal, delta, etc.), to estimate the missing data points (Owen and DeRouen, 1981).
Another commonly used technique involves estimations of missing data in censored
observations from a least squares regression on expected order statistics in order to fit the
uncensored observations plotted on a log-probability scale (Newman et al., 1989; Gilliom and
Helsel, 1986). More recently Bayesian techniques have become the preferred method for data
extrapolation by revising prior probabilities based on additional available information,
however (Ferguson, 1998).
In addition to the application of the mentionned Bayesian approach, exploratory comparisons
of the profiles were done by visual inspection of data, with values below the detection limit
being replaced by one half the value of the DL. When analysing the sum of the concentrations
(either PCBs or PCDD/Fs) the data are univariate (i.e. they depend on one variable only) and,
therefore, censoring through the use of regression models within the framework of survival
analysis (Slymen and de Peyster, 1994) is appropriate. Vrijens et al. (this issue) have
elaborated this modelling approach. On the other hand, profile investigation requires the
inspection of multifold measurements (of the different congeners) for each sample. Thus the
data are multivariate distributed (i.e. they depend on more than one variable), which
complicates the accommodation of the BDLs. A Bayesian approach in combination with
Markov Chain-Monte Carlo (MCMC) simulation (Talloen et al., 2000) is used for the tests
and profile investigations. The accommodation of censoring being nowadays impossible with
PCA, a “traditional” PCA investigation of the data sets was carried out after substitution of
BDLs by zero, half of the DL and the DL.
Data scaling and transformation — In accordance with Schwartz and Stalling (1991) and
Wenning et al. (1993), the data were scaled to minimize the statistical bias associated with
differences in chemical concentrations exceeding one order of magnitude. As the results of
pattern recognition analyses such as PCA are highly influenced by the applied scaling
procedure, careful consideration must be given to the appropriate scaling method (Wenning et
al., 1993). In each matrix the concentrations were scaled by expressing the concentrations as
percentages of the combined sum of the concentrations (i.e. the mass fractions of the specific
congeners).
Scaling the data results in removal of differences based on congener-specific concentration
levels and allows, therefore, for an investigation and comparison of the proper PCB, PCDD
and PCDF profiles. Moreover, this use of percentages installs a common metric for variable
concentrations and units (e.g. ppt, ng m-³ or others) and normalises the distribution.
Profile modelling using a MCMC approach — It is here suggested to model the percentages
(i.e., the scaled concentrations) as if they issued from a multinomial distribution. In order to
acknowledge for extra-multinomial variation that can be expected to arise from concentration
data, random effects were added. This was implemented in a MCMC framework by means of
the Multinomial-Poisson transformation (Baker, 1994), where censored observations are
included in an appropriate way by introducing an additional parameter for each censored
observation (BDL). In this way, all conditional distributions remain unchanged from the
analysis with no censored observations and a new set of conditional distributions for the set of
censored observations is introduced. An additional advantage of this approach is that it
provides estimates of the full posterior distributions of the parameters, implying that the
estimates are based on both parameters as data, and not merely on the data as in traditional
statistics. This MCMC approach is carried out in a Bayesian inference framework using Gibbs
sampling as simulation technique in the Software WinBUGS 1.2 (Spiegelhalter et al., 1995).
Principal component analysis — PCA considers the problem of analysing the structure of the
interrelationships among a large number of variables (i.e., the scaled congener-specific
concentrations) within the dataset (i.e. matrix- or contamination-specific samples) by defining
a set of common underlying dimensions, termed factors, with as little loss of information as
possible. More specifically, PCA techniques can satisfy either of two objectives: (1)
identifying structure through data summarisation or (2) data reduction (Johnson and Wichern,
1992). For the purpose of the current study, computing the principle components (PCs) allows
for the reduction of the dimensionality of the data under consideration (i.e. the number of
PCB, dioxin or furan congeners considered indicative of a specific chemical fingerprint).
The goal of principle component analysis is to maximize the variance of a linear combination
of the variables (i.e. an array of all possible bivariate correlations between variables). Aiming
at a linear combination with maximal variance, the researcher is essentially searching for a
dimension (or several dimensions) along which the observations are maximally separated and
distinct with respect to their bivariate intercorrelational structure (Rencher, 1995). In essence,
PCAs should allow for reduction of 7 PCB congener or 17 dioxin and furan congener
variables to approximately 2 to 4 factors, representative of the entire profile.
The power of principle components modelling of multivariate data, such as met in complex
mixtures, provides a basis for graphical presentation of sample similarity, that complements
more traditional statistical analyses (Stalling et al., 1986). As noted previously, PCA models
project data from a multidimensional space (n dimensions) onto a lower dimensional space
(generally two or three dimensions) in a way that preserves the maximum amount of variance
and relations among samples and variables (Schwartz and Stalling, 1991).
In the field of statistics the factors are affected by little changes in the large numbers of
variables, a problem typically referred to as closure of the data (Schwartz and Stalling, 1991).
Logarithmic transformations (Townsend, 1986; Norwood et al., 1989), normalization
(Stalling et al., 1985), and autoscaling (Zitko, 1989) are the methods most frequently used as
precursors to pattern recognition analyses (Wenning et al., 1993a). In the present PCA
analysis the autoscaled values are implemented.
3 Results
3.1 General description of the data
The data used for this study are classified in sampling sets that differ in sampling conditions
and motivations. SANI samples were taken within the framework of the sanitary
investigations of farms, upon which a distress was levied (De Cock, 2000). This sample set
contains screening samples of the contaminated products and the resulting values will
consequently be considered as the incident-specific data. EXPO and CERT samplings refer to
samples taken within the framework of the export procedure (ministerial decree of August 6,
1999) and within the framework of the enterprises’ certification procedure (ministerial decree
of September 17, 1999), respectively (De Cock, 2000). These measures were installed in view
of affirming the quality of export and home trade. Both EXPO and CERT samples were
assumed not to be contaminated by the Verkest incident; we will refer to the combination of
the latter data sets as the background contaminated (BACK) samples. The approach of the
current study is based on the suggested source-related distinction between SANI and BACK
samples.
Additionally, the analytical results available for the present study vary in terms of chemical
information. Three different data sets were studied. The largest data set (PCBsum; n=41731)
groups concentration sums of the 7 PCB markers only. The second largest set (PCBprof;
n=2933) contains congener-specific concentrations and, hence, the profiles with the relative
contribution of each congener concentration for the 7 marker PCBs. The smallest set
(PCDDFprof; n=709) gathers in addition to the congener-specific concentrations of the 7
marker PCBs also the concentrations of the 17 measured PCDD/F congeners.
3.2 Degree of contamination
The concentration sums of the 7 PCB markers for the three data sets are given in Table 3 for
the incident-specific or SANI samples and in Table 4 for the BACK samples. BDLs were
hereby replaced by half the detection limit.
The incident-specific samples are clearly much more contaminated than the background
samples, both with respect to maximum detected concentrations as well as overall median
concentrations per matrix. Considering the sample sizes of three data sets, PCBsum is the
largest containing most of the samples of PCBprof, which in turn contains all PCDDFprof
samples. Generally, PCBprof and PCDDFprof gather “positive” samples, i.e. samples
containing concentrations above the norm (1000 ng/g fat for animal feed or 200 ng/g fat for
other matrices). This explains why the median values of these two data sets exceed the
median of the PCBsum data and emphasizes the important implication for further congener-
specific analysis. The subgroup of highly contaminated samples is not representative for the
entire sample population.
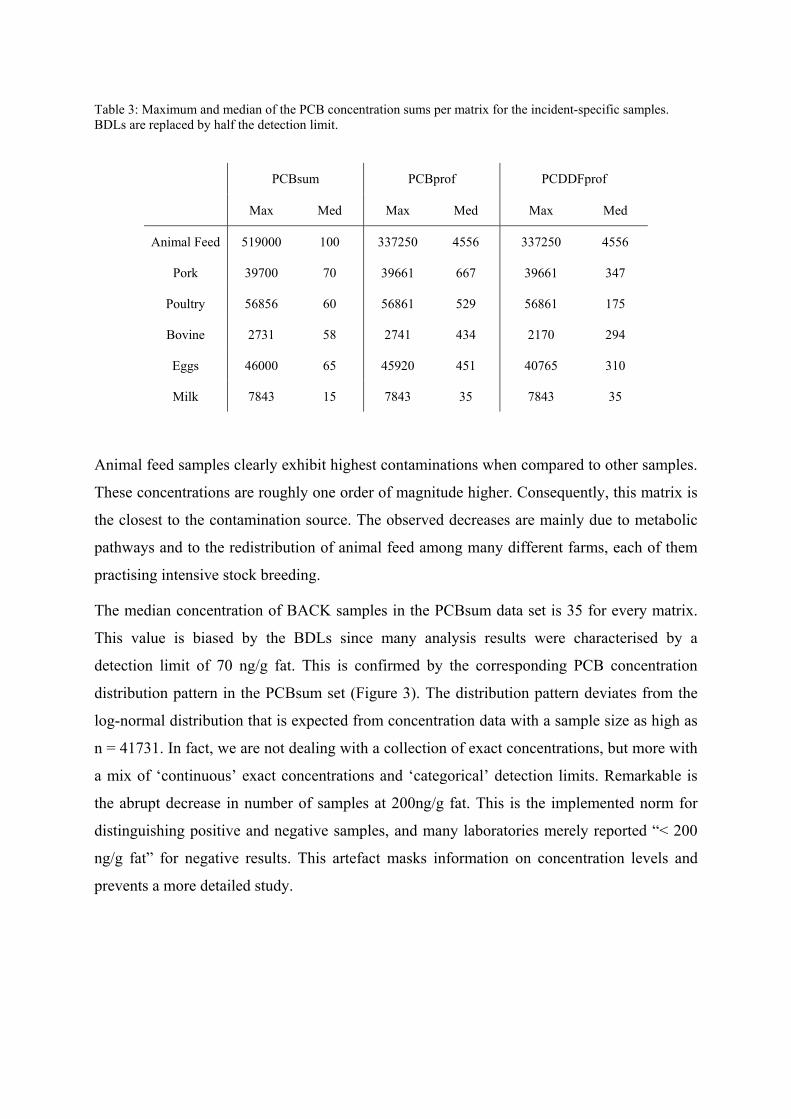
Table 3: Maximum and median of the PCB concentration sums per matrix for the incident-specific samples. BDLs are replaced by half the detection limit.
PCBsum PCBprof PCDDFprof
Max Med Max Med Max Med
337250 4556 337250 4556 519000
39700
100
70 39661 667 39661 347
56856 60 56861 529 56861 175
2731 58 2741 434 2170 294
46000 65 45920 451 40765 310
Animal Feed
Pork
Poultry
Bovine
Eggs
Milk 7843 15 7843 35 7843 35
Animal feed samples clearly exhibit highest contaminations when compared to other samples.
These concentrations are roughly one order of magnitude higher. Consequently, this matrix is
the closest to the contamination source. The observed decreases are mainly due to metabolic
pathways and to the redistribution of animal feed among many different farms, each of them
practising intensive stock breeding.
The median concentration of BACK samples in the PCBsum data set is 35 for every matrix.
This value is biased by the BDLs since many analysis results were characterised by a
detection limit of 70 ng/g fat. This is confirmed by the corresponding PCB concentration
distribution pattern in the PCBsum set (Figure 3). The distribution pattern deviates from the
log-normal distribution that is expected from concentration data with a sample size as high as
n = 41731. In fact, we are not dealing with a collection of exact concentrations, but more with
a mix of ‘continuous’ exact concentrations and ‘categorical’ detection limits. Remarkable is
the abrupt decrease in number of samples at 200ng/g fat. This is the implemented norm for
distinguishing positive and negative samples, and many laboratories merely reported “< 200
ng/g fat” for negative results. This artefact masks information on concentration levels and
prevents a more detailed study.
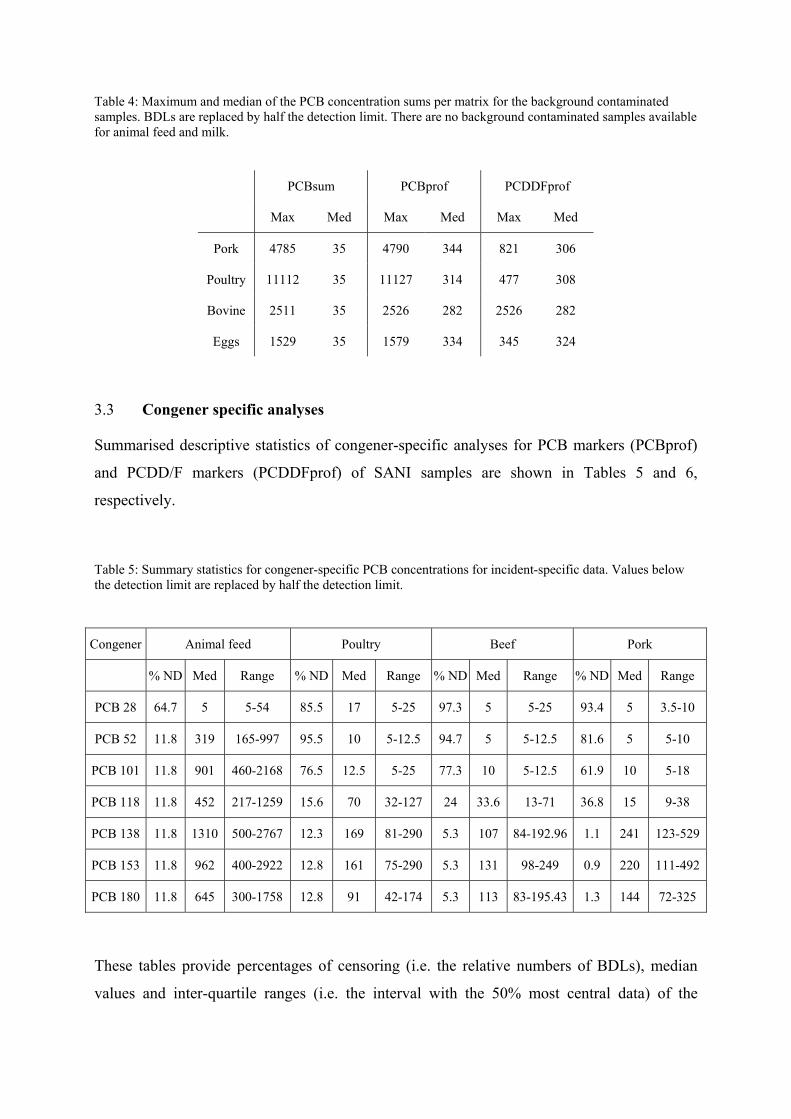
Table 4: Maximum and median of the PCB concentration sums per matrix for the background contaminated samples. BDLs are replaced by half the detection limit. There are no background contaminated samples available for animal feed and milk.
PCBsum PCBprof PCDDFprof
Max Med Max Med Max Med
Pork 4785 35 4790 344 821 306
Poultry 11112 35 11127 314 477 308
Bovine 2511 35 2526 282 2526 282
Eggs 1529 35 1579 334 345 324
3.3 Congener specific analyses
Summarised descriptive statistics of congener-specific analyses for PCB markers (PCBprof)
and PCDD/F markers (PCDDFprof) of SANI samples are shown in Tables 5 and 6,
respectively.
Table 5: Summary statistics for congener-specific PCB concentrations for incident-specific data. Values below the detection limit are replaced by half the detection limit.
Congener Animal feed Poultry Beef Pork
% ND Med Range % ND Med Range % ND Med Range % ND Med Range
PCB 28 64.7 5 5-54 85.5 17 5-25 97.3 5 5-25 93.4 5 3.5-10
PCB 52 11.8 319 165-997 95.5 10 5-12.5 94.7 5 5-12.5 81.6 5 5-10
PCB 101 11.8 901 460-2168 76.5 12.5 5-25 77.3 10 5-12.5 61.9 10 5-18
PCB 118 11.8 452 217-1259 15.6 70 32-127 24 33.6 13-71 36.8 15 9-38
PCB 138 11.8 1310 500-2767 12.3 169 81-290 5.3 107 84-192.96 1.1 241 123-529
PCB 153 11.8 962 400-2922 12.8 161 75-290 5.3 131 98-249 0.9 220 111-492
PCB 180 11.8 645 300-1758 12.8 91 42-174 5.3 113 83-195.43 1.3 144 72-325
These tables provide percentages of censoring (i.e. the relative numbers of BDLs), median
values and inter-quartile ranges (i.e. the interval with the 50% most central data) of the
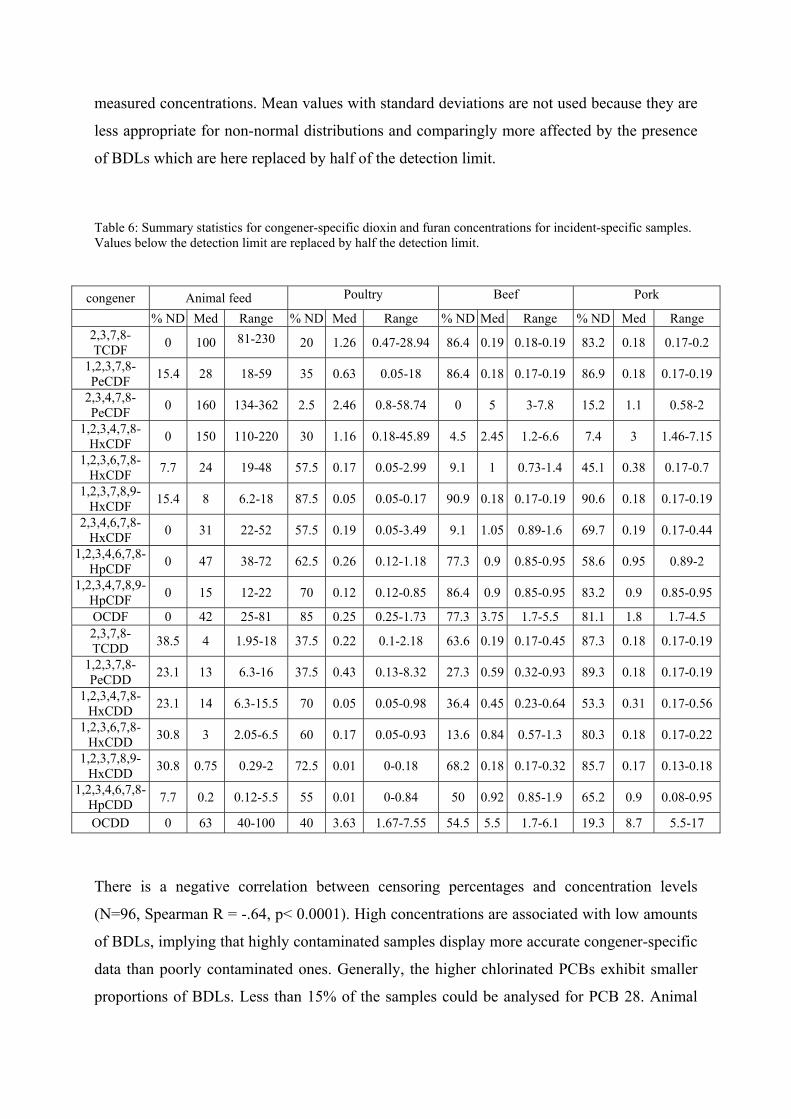
measured concentrations. Mean values with standard deviations are not used because they are
less appropriate for non-normal distributions and comparingly more affected by the presence
of BDLs which are here replaced by half of the detection limit.
Table 6: Summary statistics for congener-specific dioxin and furan concentrations for incident-specific samples. Values below the detection limit are replaced by half the detection limit.
congener Animal feed Poultry Beef Pork
% ND Med Range % ND Med Range % ND Med Range % ND Med Range 2,3,7,8- TCDF 0 100 81-230 20 1.26 0.47-28.94 86.4 0.19 0.18-0.19 83.2 0.18 0.17-0.2
1,2,3,7,8- PeCDF 15.4 28 18-59 35 0.63 0.05-18 86.4 0.18 0.17-0.19 86.9 0.18 0.17-0.19
2,3,4,7,8- PeCDF 0 160 134-362 2.5 2.46 0.8-58.74 0 5 3-7.8 15.2 1.1 0.58-2
1,2,3,4,7,8- HxCDF 0 150 110-220 30 1.16 0.18-45.89 4.5 2.45 1.2-6.6 7.4 3 1.46-7.15
1,2,3,6,7,8- HxCDF 7.7 24 19-48 57.5 0.17 0.05-2.99 9.1 1 0.73-1.4 45.1 0.38 0.17-0.7
1,2,3,7,8,9- HxCDF 15.4 8 6.2-18 87.5 0.05 0.05-0.17 90.9 0.18 0.17-0.19 90.6 0.18 0.17-0.19
2,3,4,6,7,8- HxCDF 0 31 22-52 57.5 0.19 0.05-3.49 9.1 1.05 0.89-1.6 69.7 0.19 0.17-0.44
1,2,3,4,6,7,8-HpCDF 0 47 38-72 62.5 0.26 0.12-1.18 77.3 0.9 0.85-0.95 58.6 0.95 0.89-2
1,2,3,4,7,8,9-HpCDF 0 15 12-22 70 0.12 0.12-0.85 86.4 0.9 0.85-0.95 83.2 0.9 0.85-0.95
OCDF 0 42 25-81 85 0.25 0.25-1.73 77.3 3.75 1.7-5.5 81.1 1.8 1.7-4.5 2,3,7,8- TCDD 38.5 4 1.95-18 37.5 0.22 0.1-2.18 63.6 0.19 0.17-0.45 87.3 0.18 0.17-0.19
1,2,3,7,8- PeCDD 23.1 13 6.3-16 37.5 0.43 0.13-8.32 27.3 0.59 0.32-0.93 89.3 0.18 0.17-0.19
1,2,3,4,7,8- HxCDD 23.1 14 6.3-15.5 70 0.05 0.05-0.98 36.4 0.45 0.23-0.64 53.3 0.31 0.17-0.56
1,2,3,6,7,8- HxCDD 30.8 3 2.05-6.5 60 0.17 0.05-0.93 13.6 0.84 0.57-1.3 80.3 0.18 0.17-0.22
1,2,3,7,8,9- HxCDD 30.8 0.75 0.29-2 72.5 0.01 0-0.18 68.2 0.18 0.17-0.32 85.7 0.17 0.13-0.18
1,2,3,4,6,7,8-HpCDD 7.7 0.2 0.12-5.5 55 0.01 0-0.84 50 0.92 0.85-1.9 65.2 0.9 0.08-0.95
OCDD 0 63 40-100 40 3.63 1.67-7.55 54.5 5.5 1.7-6.1 19.3 8.7 5.5-17
There is a negative correlation between censoring percentages and concentration levels
(N=96, Spearman R = -.64, p< 0.0001). High concentrations are associated with low amounts
of BDLs, implying that highly contaminated samples display more accurate congener-specific
data than poorly contaminated ones. Generally, the higher chlorinated PCBs exhibit smaller
proportions of BDLs. Less than 15% of the samples could be analysed for PCB 28. Animal
feed was the matrix with the lowest non-detect percentage but still less than 40% is
determined exactly.
PCDD and PCDF congener concentrations are even more often below the limit of detection
than PCBs. This failure to obtain precise concentrations undermines the accuracy and
sensitivity of the recognition analyses carried out with the congener-specific profiles.
Congener concentrations of animal feed always exceed corresponding concentrations in the
other matrices (Table 5 and 6). It is shown in Table 5 that PCB 138 has consistently the
highest concentration in every matrix except beef, where PCB 153 has the highest
concentration. The elevated contribution of PCB congeners 138 and 153 is very normal, since
these are major components of technical PCB mixtures (Safe et al., 1985; McFarland and
Clarke, 1989). Moreover, they are classified as difficult to metabolize congeners (McFarland
and Clarke, 1989; Serrano et al., 2000). This explains why they are often the predominantly
contributing congeners (Serrano et al., 2000).
From Table 6 it is obvious that the dibenzofuran concentrations of animal feed exceed
considerably the dibenzodioxin concentrations. This phenomenon is less pronounced for the
other matrices. 2,3,4,7,8-PeCDF is the most concentrated congener in animal feed, poultry
and beef, whereas 1,2,3,4,7,8-HxCDF is most concentrated in pork. The dibenzo—p-dioxin
congener with the highest concentration is consistently OCDD for all matrices.
3.4 Furans : dioxin : PCB ratios
For all samples PCB concentrations are much higher than PCDD/F concentrations (one-sided
t-test if mean proportion PCB/PCDDF is greater than 1; all p<0.0001). Moreover, the ratio of
PCBs to PCDD/Fs does not significantly differ between SANI and BACK samples (t=1.27,
df=707, p=0.2, Figure 4). The values are ~11000 and ~12000, respectively. It must be added
here that the ratios considered are concentration ratios (pg g-1 fat over pg g-1 fat). They can not
be compared to the "constant" ratio of 50000 pg PCB g-1 fat over pg TEQ g-1 fat used for risk
management during the incident.
The major part of the PCDD/F concentration is contributed by the PCDFs; in all samples the
furans are present in higher concentrations than the dioxins (one-sided t-test if mean
proportion furan/dioxin is greater than 1; all p<0.05). As observed for PCB to PCDDF ratios,
the ratios of furans to dioxins do not differ significantly between SANI and BACK
contaminated samples (t = -0.21, df = 707, p = 0.8, Figure 5).
For the SANI samples, animal feed contains significantly more furans than dioxins (Figure 6)
compared to poultry (t = -2.39, df = 51, p-value = 0.021), beef (t = -2.4, df = 33, p-value =
0.022) or pork (t = -5.76, df = 255, p-value = 0,0001). Knowing that the overall
concentrations decrease from feed to fat, a faster decrease in furan concentration leads to
equal distributions of dioxin and furan concentrations. Because animal feed is most closely
linked to the contamination source, this increased furan/dioxin proportion suggests that the
contamination source itself contains a higher concentration of furans compared to dioxins also
or gives rise to such a disprportionality. The lack of animal feed samples in the BACK data
set perturbs the investigation of this proportion in background-contaminated animal feed.
In conclusion, for all samples PCB concentrations are consistently higher than PCDD/F
concentrations, and most furan concentrations consistently exceed those of dioxins. There are
no typical differences between SANI and BACK samples in their relative amounts of PCBs,
dioxins and furans. The PCB/PCDDF or furans/dioxins ratios do not present incident-specific
characteristics which can typify the identity of the contamination source. The animal feed
samples contain more furans than dioxins compared to animal fat.
3.5 Profile comparisons
3.5.1 Pairwise correlations
Prior to initiating multivariate statistics (i.e. profile analyses and PCA) on scaled and log-
transformed data, pairwise scatterplot matrices of correlations between the various dioxin,
furan and PCB congeners were evaluated to corroborate some degree of inter-correlation
between the congener and/or isomeric groups. Should the data lack pairwise correlation
between individual matrix variables, it is unlikely that subsequent multivariate analyses would
generate a statistically significant congener-specific fingerprint representing the overall
sample set. To this end, Figures 7, 8 and 9 provide pairwise scatterplot matrices of observed
correlations for the SANI sample set. Visual inspection of the congener-specific matrices
indicates that most of the congeners are correlated and that correlations are not merely
restricted to specific isomer groups such as within the 3 hexa-dioxin congeners or the 2 hepta-
furan congeners.
At the left hand side of the PCB scatterplot (Figure 7), PCB 28 exhibits the more
discontinuous pattern, especially in the lower concentration ranges. This must be explained by
the elevated presence of BDLs, which are here substituted by the half of the detection limit.
Furthermore, this bias of BDLs also gives rise to a much less consistent correlation between
PCB 28 concentrations and all other congeners. The best correlations are observed for the
higher chlorinated ones (right bottom of Figure 7), that are hardly subject to the biasing effect
of BDLs. Additionally, "noisy" correlations with PCB 28 are due to analytical difficulties.
The chromatographic resolution between PCB 28 and PCB 31 is not always optimal and
concentrations of PCB 28 can be overestimated by the presence of PCB 31.
All lower chlorinated dioxin congeners are strongly correlated among each other (Figure 8).
The hepta- and octo-chlorinated dioxins (DIO15 and DIO17 on Figure 8) are, however,
weakly correlated with each other as well as with the other dioxin congeners. The furans are
more consistently correlated with each other compared to the dioxin congeners (Figure 9).
The two hepta-chlorinated furans (DIO 13 and 14) are correlated with all lower-chlorinated
congeners. The only furan congener that does not correlate is the octo-chlorinated furan
(DIO16, Figure 9).
3.5.1.1 3.5.2 PCB profiles
The initial visual exploration focuses on individual PCB profiles of the matrices beef, pork,
eggs and poultry as shown for SANI samples (Figure 10) as well as BACK samples (Figure
11). In the figures all samples with 4 or more BDLs were excluded. Samples containing many
non-detected congeners bias the profiles in two ways. On the one hand, the profiles show a
more horizontal-like pattern due to identical detection limits for the different congeners,
whereas realistic chemical fingerprints are more variable. On the other hand, the variability of
a profile can be inflated by giving excessive weight to the few congeners that could be
quantified exactly. Because the congener percentages of a sample are interdependent,
underestimations in most non-detected congeners result in an inflated contribution of the few
exactly determined congeners. Because both biases result in signals representing more
detection accuracy rather than real congener concentrations, these profiles are irrelevant for
source identification and therefore excluded.
Exept a few outlying individual values, there is low variability among these individual-
specific PCB profiles. Individuals follow in a consistent way the chemical fingerprint of their
specific subgroup. Outlying profiles are mostly due to the presence of BDLs. The higher
variability of PCB 28 can also result from heterogeneity in the chemical analyses as
mentioned previously, however.
To gain more insight in the identity of the contamination source, this study focused on
chemical characteristics of the incident-contaminated samples which differentiate them from
the ubiquitous background pollution. This makes the testing for profile differences between
SANI and BACK samples relevant in this study. Visual inspection of the profiles (Figure 10
and 11) does not suggest major differences in profiles between the different matrices of the
two sample sets. The apparent higher variability of the incident-specific profiles is due to the
much higher sample sizes. In the case of the pork samples for instance, it is logical to expect a
higher variability when 1324 samples are inspected rather than 34.
Besides these qualitative visual comparisons we also tested these profile differences
quantitatively, incorporating their multivariate distribution and the presence of non-detected
congeners. These rigorous tests did not find any significant difference between SANI and
BACK profiles for the different matrices. Beef profiles do not differ between the two sample
sets (LR=12, df=6, p=0.06), nor do the pork profiles (LR=10, df=6, p=0.12). For poultry the
sample size of the background contaminated data is too small (n=8) to have valid tests, but
visual inspection does not suggest any difference in profile between BACK and SANI. For
animal feed—one of the most interesting matrices because of its close link to the
contamination source—there were unfortunately no congener-specific data available in the
background sampling set.
In contrast to the absence of profile differences between SANI and BACK samples, there are
significant differences between profiles of different matrices. All animal fat profiles differ
significantly from the animal feed profile (all p<0.001). There are significant profile
differences between poultry and beef, between poultry and pork and between beef and pork
(all p<0.001). This profile study is done on the SANI samples because their sample size is
sufficiently large and because profiles do not differ from the background samples.
Besides the appropriate multivariate way testing, the MCMC model can also be used to obtain
correct estimates of mean and standard errors by acknowledging for the presence of BDLs.
These obtained estimates are shown in Figure 12. The profile difference between animal feed
and the different kinds of animal fat (poultry, beef and pork) is most striking. The proportions
of PCB 52 and 101 are substantially decreased during the passage from feed to fat. These
differences in profiles between feed and animal fat samples were expected since the amount
of persistent PCB congeners increases in the consumer (Storr-Hansen et al. 1995). Generally,
higher substituted PCB congeners have a lower pressure vapour, a higher Kow constant, and a
higher half-life than the less substituted congeners (Shiu et al. 1988). The PCB 28 proportion
was already low in the animal fat samples. This can be the result of a low proportion of PCB
28 in the contamination source, but could also be caused by its lower stability compared to the
other PCBs.
Boon et al. (1987) e.g. attributed the differences in PCB profiles between seals' food (fish)
and blood to the enzyme-mediated metabolism (biotransformation): only congeners with
vicinal hydrogen atoms in (i) the ortho- and meta-positions in combination with a maximum
of 1 ortho-chlorine substituent or (ii) the meta- and para-positions irrespective of the ortho-
chlorine substitution pattern could be metabolised.
This transformation of profile characteristics by metabolic pathways does presumably have a
major impact on the profiles of the 7 PCB markers and obscures somehow the influence of the
original contamination source. Experiments with growing swine and sheep fed on three
dietary variations led to minor differences in total PCB with varying diets (Hansen et al.,
1977). The overall profiles remained remarkably constant and would, consequently, be more
species- or tissue- specific than source-specific. This can explain the absence of intra-specific
profile differences between the two sample sets. However, referring to the same data as Boon
et al. (1987), Storr-Hansen et al. (1995) found a differentiation in PCB patterns between two
groups of seals, which could be only ascribed to different PCB congener patterns in their
food. These results were obtained by profile analyses on 21 PCB markers with practically no
concentrations below the detection limit. Another possible reason of our inability to
differentiate between different contamination sources is a lack of information to find this
difference (due to the restricted number of marker PCBs, the poor variability through
pronounced persistence and the high number of BDLs). We are namely looking at 7 out of
209 existing congeners; 3 of them (PCB 138, PCB 153 and PCB 180) being known as very
persistent and accordingly quite invariable (Boon et al., 1994). The small selection of
relatively stable congeners prevents large variation in profiles and accordingly possible
between-group differences.
The PCB profile of pork differs from poultry or beef samples by its lower proportion of PCB
101. If all animals shared the same contamination source, this implies that pigs can excrete or
transform PCB 101 more effectively than cattle or poultry. The difference between poultry
and beef is even more subtle and is mainly due to a higher proportion PCB 180 in poultry.
PCA of the PCB profiles does not give clusters. Based on these statistics a distinction between
the different matrices or between the SANI and the BACK samples is impossible.
3.5.1.2 3.5.3 Dioxin and furan profiles
Subject-specific PCDD and PCDF profiles for the incident-specific matrices are shown in
Figure 13. In contrast with pronounced variability in PCDD profiles, the PCDF profiles were
much more consistent. This was already suggested earlier by the stronger pairwise
correlations between furan congeners compared to dioxin congeners. The furan profiles of
animal feed are clearly the most consistent, followed by the furan profiles of poultry.
For the incident-specific animal feed samples, individual dioxin profiles are more
heterogeneous than the respective furan profiles. This indicates that the contamination source
constitutes a more homogeneous furan than dioxin source. In poultry the same trend of more
variable dioxin profiles compared to the more consistent furans is present.
The most striking difference between the incident-specific dioxin and furan profiles is due to
a different contribution of their respective octa-chlorinated compound. While the octa-
chlorinated congener (OCDD) dominates the dioxin profiles, OCDF is not the predominant
furan congener. This is in contrast with the normal environmental soil samples, where both
OCDD and OCDF are the predominant congeners (Schuhmacher et al., 2000; Wenning et al.,
1993). From this viewpoint, the dioxin profile is more “environmental”-like than the furan
profile, suggesting that a possible non-background contamination disturbed the PCDF
distribution more than the PCDD distribution. This suggested hypothesis is confirmed by the
PCDDF profiles of the BACK pork and poultry samples (Figure 14). In these matrices the
OCDF contribution to the total furan concentration is clearly more important than it was for
the SANI pork and poultry samples (Figure 13). Interestingly, this profile difference due to a
lower OCDF contribution in the incident-specific samples was not present in beef. In SANI
beef OCDF is still the congener that contains the highest furan concentration. Unfortunately, a
more elaborated analysis of the profiles by means of a MCMC approach or a PCA was
impossible due to the high amount of BDLs in combination with low sample sizes.
3.5.4 Principal component analysis
The principal component analysis of PCB and dioxin normalised data does not indicate clear
differences in patterns between species (figures not shown). Based on the principal
component analysis of the SANI furan normalised data, minor differences between the
matrices can be distinguished (Figure 15). The plot of the samples on the first two principal
components (Figure 15a) shows that chicken and animal feed are quite alike and are separated
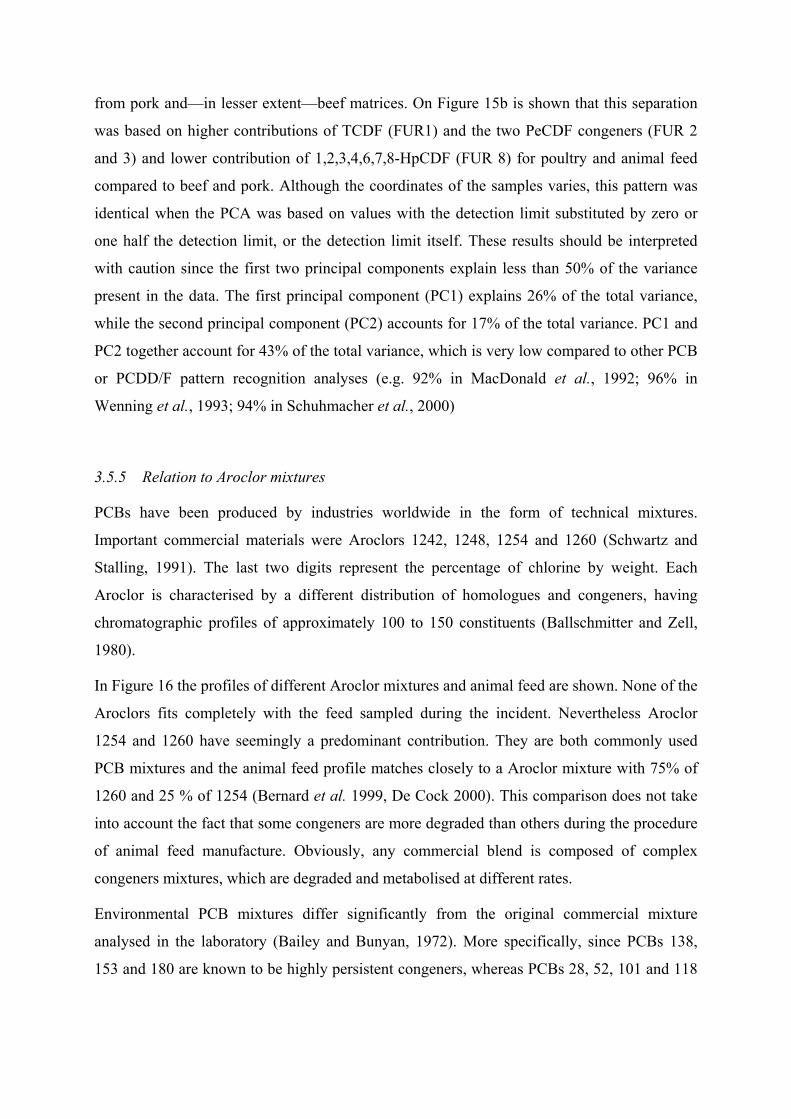
from pork and—in lesser extent—beef matrices. On Figure 15b is shown that this separation
was based on higher contributions of TCDF (FUR1) and the two PeCDF congeners (FUR 2
and 3) and lower contribution of 1,2,3,4,6,7,8-HpCDF (FUR 8) for poultry and animal feed
compared to beef and pork. Although the coordinates of the samples varies, this pattern was
identical when the PCA was based on values with the detection limit substituted by zero or
one half the detection limit, or the detection limit itself. These results should be interpreted
with caution since the first two principal components explain less than 50% of the variance
present in the data. The first principal component (PC1) explains 26% of the total variance,
while the second principal component (PC2) accounts for 17% of the total variance. PC1 and
PC2 together account for 43% of the total variance, which is very low compared to other PCB
or PCDD/F pattern recognition analyses (e.g. 92% in MacDonald et al., 1992; 96% in
Wenning et al., 1993; 94% in Schuhmacher et al., 2000)
3.5.5 Relation to Aroclor mixtures
PCBs have been produced by industries worldwide in the form of technical mixtures.
Important commercial materials were Aroclors 1242, 1248, 1254 and 1260 (Schwartz and
Stalling, 1991). The last two digits represent the percentage of chlorine by weight. Each
Aroclor is characterised by a different distribution of homologues and congeners, having
chromatographic profiles of approximately 100 to 150 constituents (Ballschmitter and Zell,
1980).
In Figure 16 the profiles of different Aroclor mixtures and animal feed are shown. None of the
Aroclors fits completely with the feed sampled during the incident. Nevertheless Aroclor
1254 and 1260 have seemingly a predominant contribution. They are both commonly used
PCB mixtures and the animal feed profile matches closely to a Aroclor mixture with 75% of
1260 and 25 % of 1254 (Bernard et al. 1999, De Cock 2000). This comparison does not take
into account the fact that some congeners are more degraded than others during the procedure
of animal feed manufacture. Obviously, any commercial blend is composed of complex
congeners mixtures, which are degraded and metabolised at different rates.
Environmental PCB mixtures differ significantly from the original commercial mixture
analysed in the laboratory (Bailey and Bunyan, 1972). More specifically, since PCBs 138,
153 and 180 are known to be highly persistent congeners, whereas PCBs 28, 52, 101 and 118
are not (De Boer, 1995; Serrano et al., 2000) a contamination by Aroclor 1254 is very likely
also.
3 4 Conclusion
Several results of this study underpin the original hypothesis that the contamination source of
the Belgian dioxin incident was a PCB contamination. All PCB concentrations exceeded the
PCDDF concentrations. Moreover, furans were present in higher amounts than dioxins. It is
known that PCBs give rise to higher furan concentrations than dioxin concentrations.
Commercial PCBs were shown to contain PCDF impurities, whereas PCDDs were low to non
detectable (Buser, 1985). After utilisation of commercial PCBs they showed increased levels
of furans, indicating reaction pathways leading to the formation of PCDFs. Buser (1985)
demonstrated the conversion to PCDFs from small quantities of commercial PCBs (Aroclor
1254 and 1260) in laboratory experiments. These reactions led easily and exclusively to
PCDFs formation, neither PCDDs nor polychlorinated biphenylenes being observed.
Both the excess of PCBs versus PCDDF and the excess of PCDFs versus PCDDs are most
pronounced in the animal feed. This points to a contamination with PCBs. The furan
congeners are more strongly correlated among each other and contain less inter-individual
profile variability, indicating a more homogeneous, incident-specific source of furans
compared to dioxins. The incident-specific furan profiles are, moreover, less environmental-
like than the respective dioxin profiles with respect to their octa-chlorinated congeners
(Schuhmacher et al., 2000; Wenning et al., 1993).
SANI and BACK dioxin profiles contain high proportions of the octa-chlorinated compound
OCDD. The octa-chlorinated furan compound OCDF, however, has an important contribution
in the background-contaminated but not in the incident-specific samples.
A major remaining question is why the PCB profiles do not differ between the SANI and the
BACK profiles. It could be that the working assumption of this study is not correct, implying
that the BACK samples are in fact not background-contaminated but also incident-specific. It
is plausible, however, that largely differing sampling conditions and motivations as well as
significant differences in the degree of contamination between SANI and BACK (Tables 3
and 4) confirm independence between SANI and BACK samples. But even if they are
independent, it is possible that the source of the ubiquitous background contamination has a
similar identity as the incident-specific source. Both the SANI and BACK samples were a
subgroup of highly contaminated samples, not representative for the entire sample population.
A third explanation would be that profiles are rather species- or tissue- specific than source-
specific. A transformation of the profile characteristics by metabolic pathways has a major
impact on the profiles of the 7 PCB markers, obscuring any influence of the original
contamination source. In this study we found indeed no intra-species differences between the
SANI and BACK samples, although we found profile differences between species which were
known to be contaminated by the same incident (pork and poultry).
Finally, it must be stressed that a differentiation between contamination sources is suppressed
by strongly reduced parameter variablity. The data set gathers 7 PCB markers only, with 3 out
of 7 (PCB 138, PCB 153 and PCB 180) being very persistent and accordingly quite invariable
(Boon et al. 1994). The other congeners which are more variable have higher BDL numbers.
Less than 15% of the samples could be analysed for PCB 28 for instance. This failure to
obtain precise concentrations undermines of course also the accuracy and sensitivity of the
recognition analyses carried out with the congener-specific profiles.
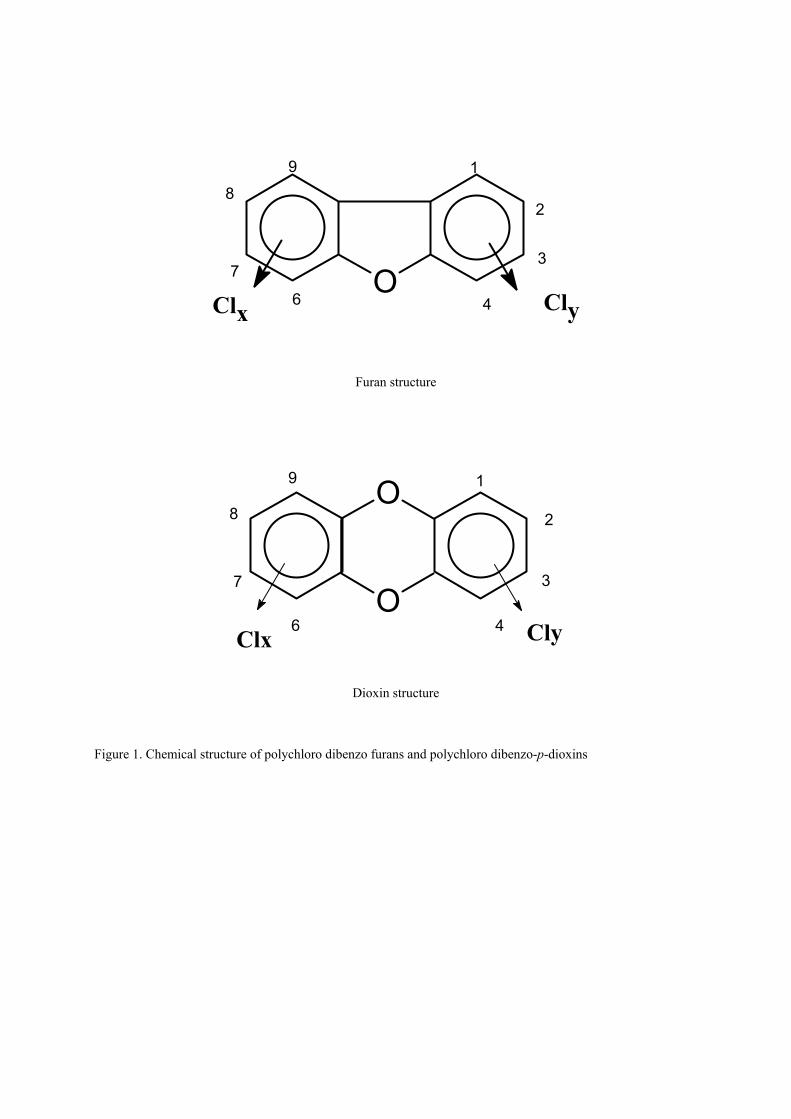
OClx Cly
9
8
7
6 4
3
2
1
Furan structure
O
O
9
8
7
6 4
3
2
1
Clx Cly
Dioxin structure
Figure 1. Chemical structure of polychloro dibenzo furans and polychloro dibenzo-p-dioxins
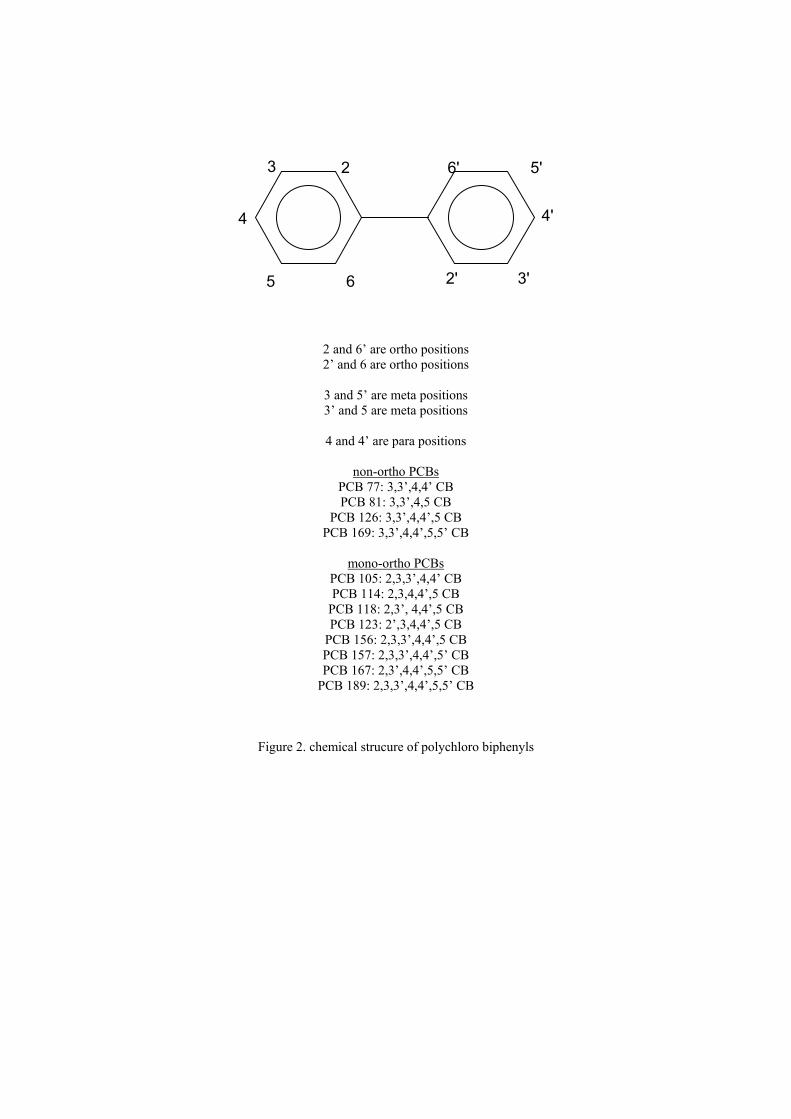
3
4
5 6
2 6' 5'
4'
3'2'
2 and 6’ are ortho positions 2’ and 6 are ortho positions
3 and 5’ are meta positions 3’ and 5 are meta positions
4 and 4’ are para positions
non-ortho PCBs
PCB 77: 3,3’,4,4’ CB PCB 81: 3,3’,4,5 CB
PCB 126: 3,3’,4,4’,5 CB PCB 169: 3,3’,4,4’,5,5’ CB
mono-ortho PCBs
PCB 105: 2,3,3’,4,4’ CB PCB 114: 2,3,4,4’,5 CB
PCB 118: 2,3’, 4,4’,5 CB PCB 123: 2’,3,4,4’,5 CB
PCB 156: 2,3,3’,4,4’,5 CB PCB 157: 2,3,3’,4,4’,5’ CB PCB 167: 2,3’,4,4’,5,5’ CB
PCB 189: 2,3,3’,4,4’,5,5’ CB
Figure 2. chemical strucure of polychloro biphenyls
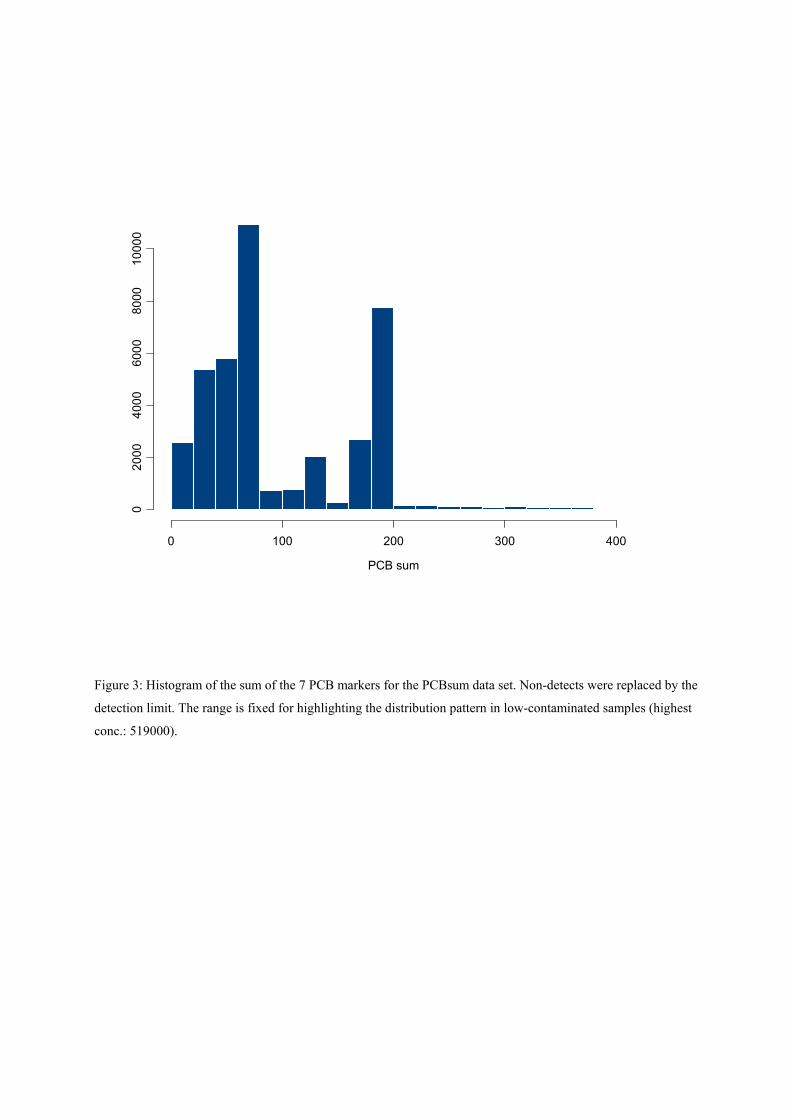
Figure 3: Histogram of the sum of the 7 PCB markers for the PCBsum data set. Non-detects were replaced by the
detection limit. The range is fixed for highlighting the distribution pattern in low-contaminated samples (highest
conc.: 519000).
0 100 200 300 400
020
0040
0060
0080
0010
000
PCB sum
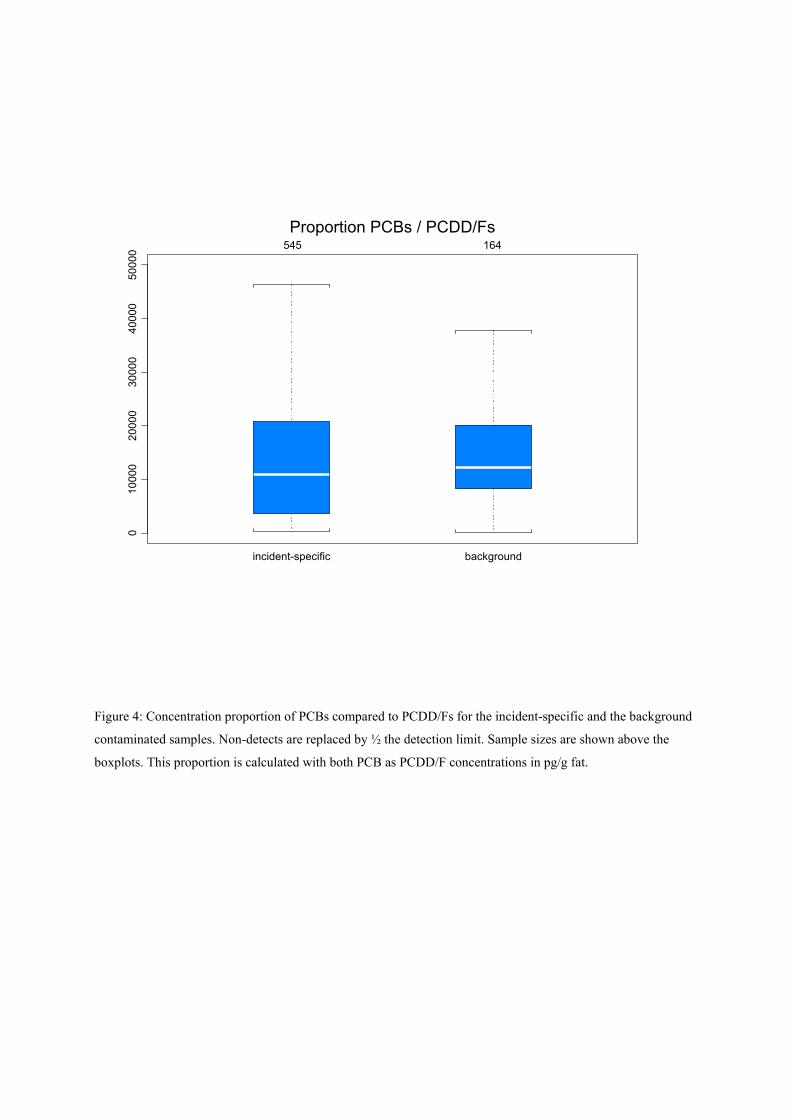
Figure 4: Concentration proportion of PCBs compared to PCDD/Fs for the incident-specific and the background
contaminated samples. Non-detects are replaced by ½ the detection limit. Sample sizes are shown above the
boxplots. This proportion is calculated with both PCB as PCDD/F concentrations in pg/g fat.
010
000
2000
030
000
4000
050
000
incident-specific background
Proportion PCBs / PCDD/Fs545 164
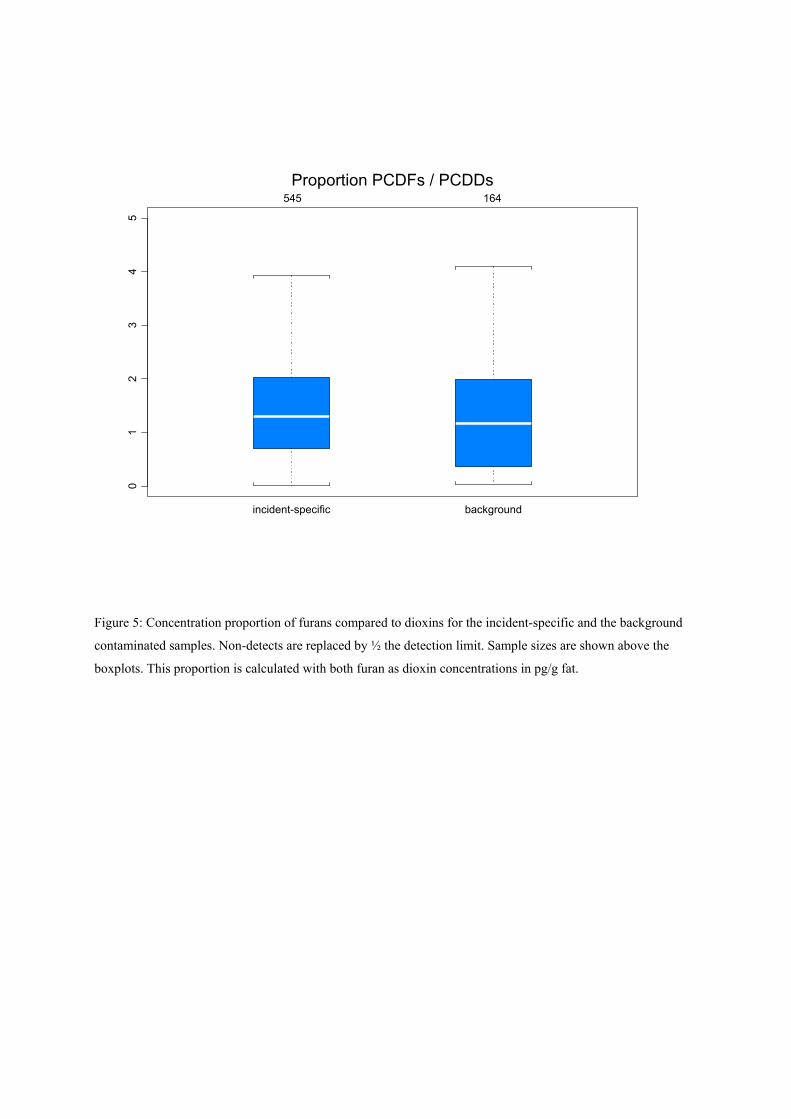
Figure 5: Concentration proportion of furans compared to dioxins for the incident-specific and the background
contaminated samples. Non-detects are replaced by ½ the detection limit. Sample sizes are shown above the
boxplots. This proportion is calculated with both furan as dioxin concentrations in pg/g fat.
01
23
45
incident-specific background
Proportion PCDFs / PCDDs545 164
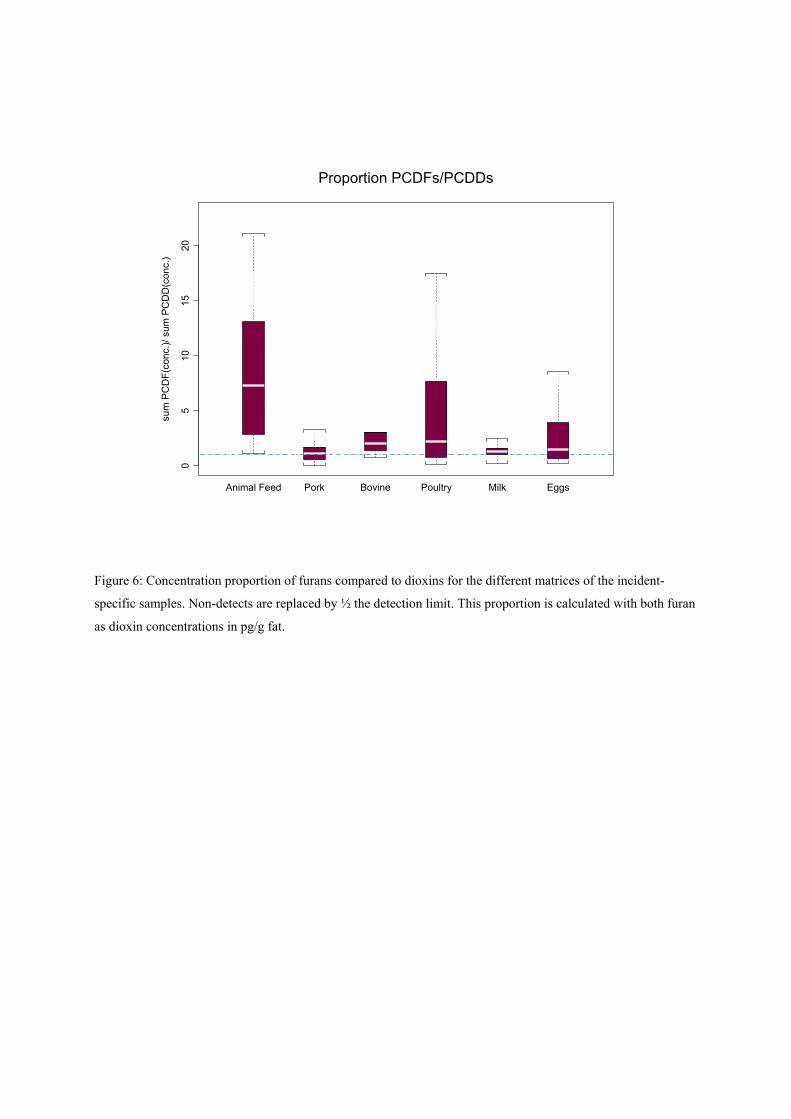
05
1015
20
Animal Feed Pork Bovine Poultry Milk Eggs
sum
PC
DF(
conc
.)/ s
um P
CD
D(c
onc.
)Proportion PCDFs/PCDDs
Figure 6: Concentration proportion of furans compared to dioxins for the different matrices of the incident-
specific samples. Non-detects are replaced by ½ the detection limit. This proportion is calculated with both furan
as dioxin concentrations in pg/g fat.
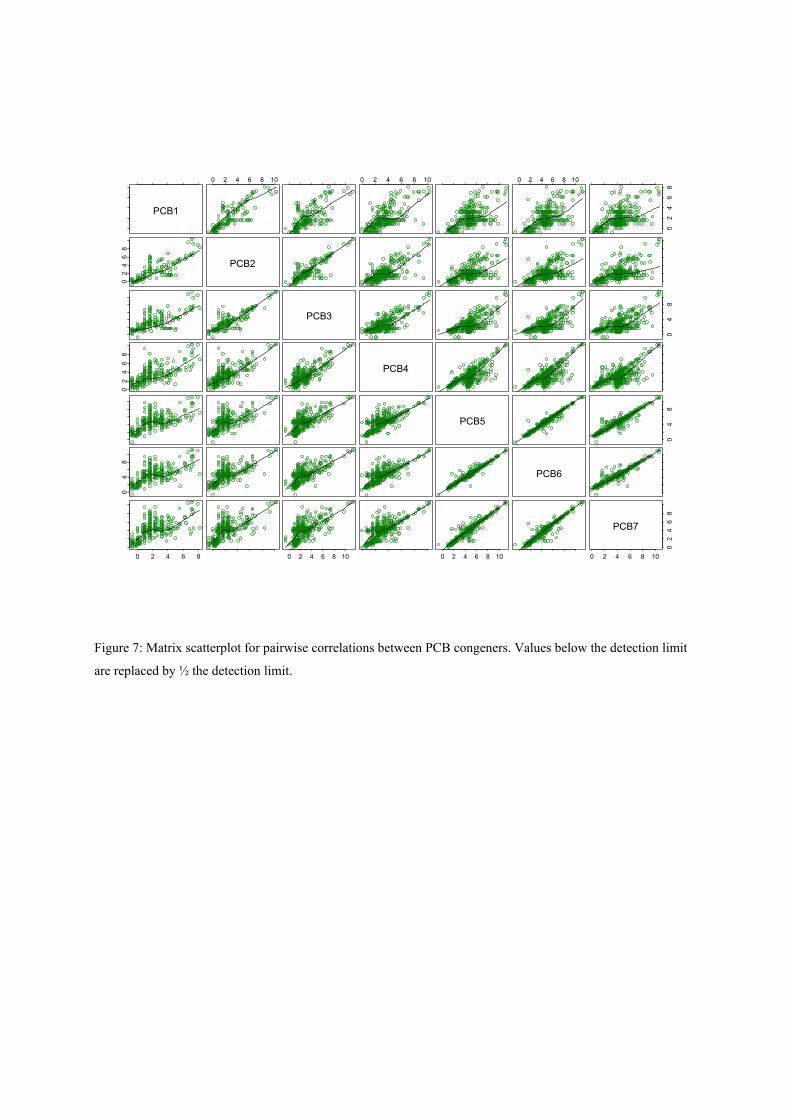
Figure 7: Matrix scatterplot for pairwise correlations between PCB congeners. Values below the detection limit
are replaced by ½ the detection limit.
PCB1
0 2 4 6 8 10 0 2 4 6 8 10 0 2 4 6 8 10
02
46
8
02
46
8
PCB2
PCB3
04
8
02
46
8
PCB4
PCB5
04
8
04
8
PCB6
0 2 4 6 8 0 2 4 6 8 10 0 2 4 6 8 10 0 2 4 6 8 10
02
46
8
PCB7
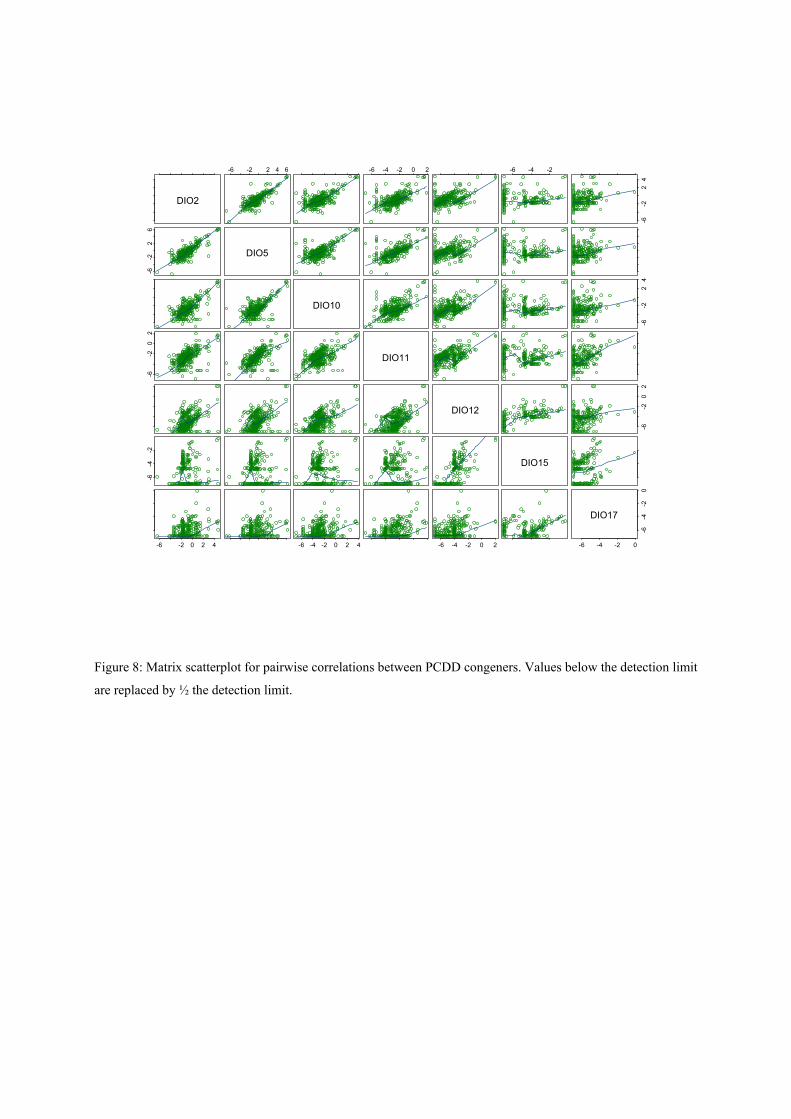
DIO2
-6 -2 2 4 6 -6 -4 -2 0 2 -6 -4 -2
-6-2
24
-6-2
26
DIO5
DIO10
-6-2
24
-6-2
02
DIO11
DIO12
-6-2
02
-6-4
-2
DIO15
-6 -2 0 2 4 -6 -4 -2 0 2 4 -6 -4 -2 0 2 -6 -4 -2 0
-6-4
-20
DIO17
Figure 8: Matrix scatterplot for pairwise correlations between PCDD congeners. Values below the detection limit
are replaced by ½ the detection limit.
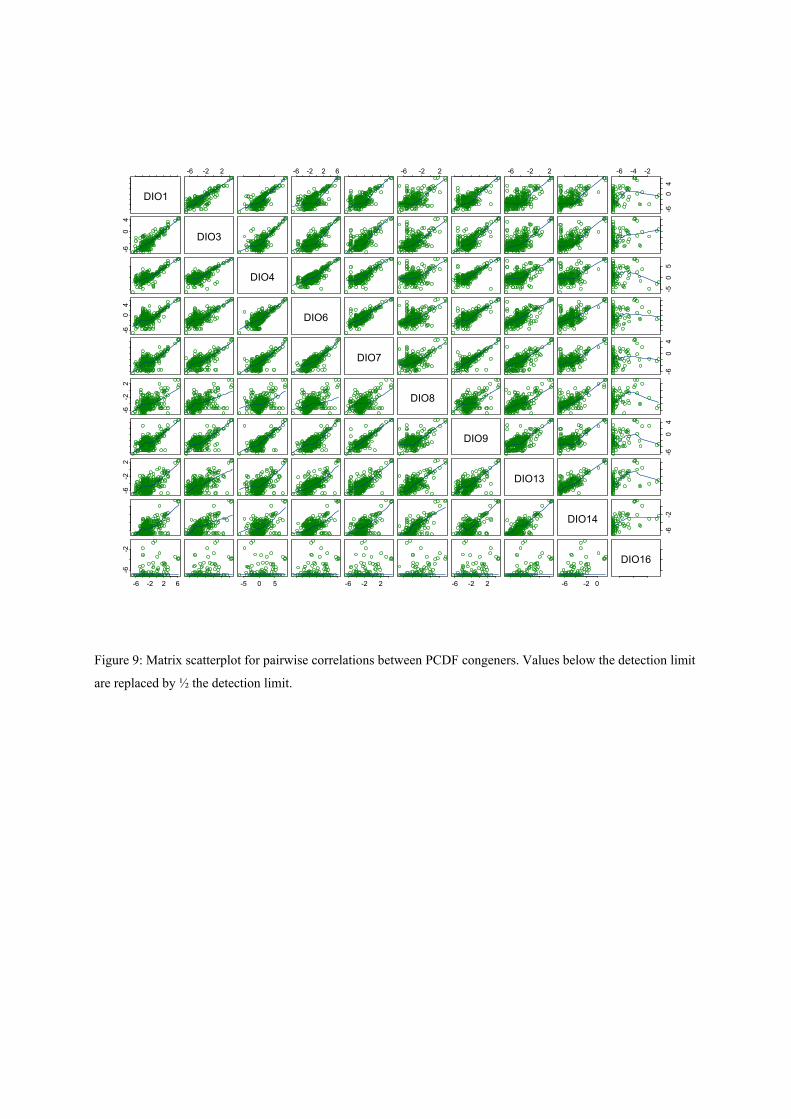
DIO1
-6 -2 2 -6 -2 2 6 -6 -2 2 -6 -2 2 -6 -4 -2
-60
4
-60
4
DIO3
DIO4
-50
5
-60
4
DIO6
DIO7
-60
4
-6-2
2
DIO8
DIO9
-60
4
-6-2
2
DIO13
DIO14
-6-2
-6 -2 2 6
-6-2
-5 0 5 -6 -2 2 -6 -2 2 -6 -2 0
DIO16
Figure 9: Matrix scatterplot for pairwise correlations between PCDF congeners. Values below the detection limit
are replaced by ½ the detection limit.
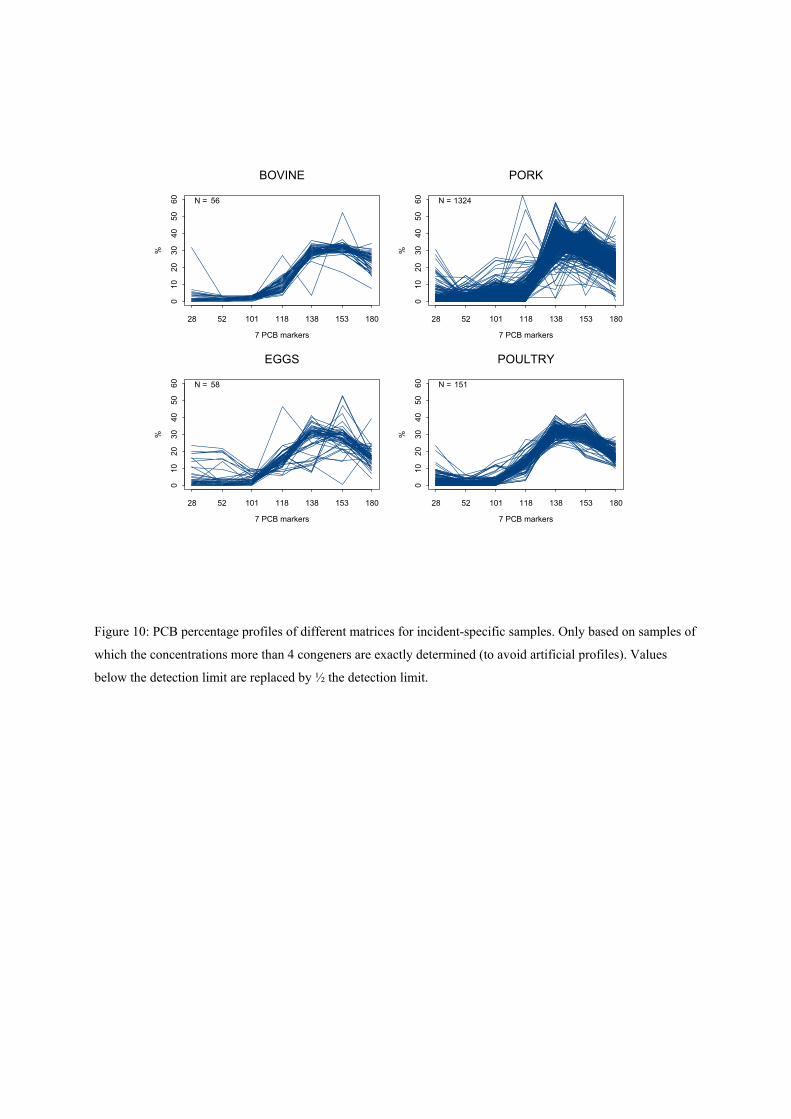
BOVINE
7 PCB markers
%
010
2030
4050
60 N = 56
28 52 101 118 138 153 180
PORK
7 PCB markers
%
010
2030
4050
60 N = 1324
28 52 101 118 138 153 180
EGGS
7 PCB markers
%
010
2030
4050
60 N = 58
28 52 101 118 138 153 180
POULTRY
7 PCB markers
%
010
2030
4050
60 N = 151
28 52 101 118 138 153 180
Figure 10: PCB percentage profiles of different matrices for incident-specific samples. Only based on samples of
which the concentrations more than 4 congeners are exactly determined (to avoid artificial profiles). Values
below the detection limit are replaced by ½ the detection limit.
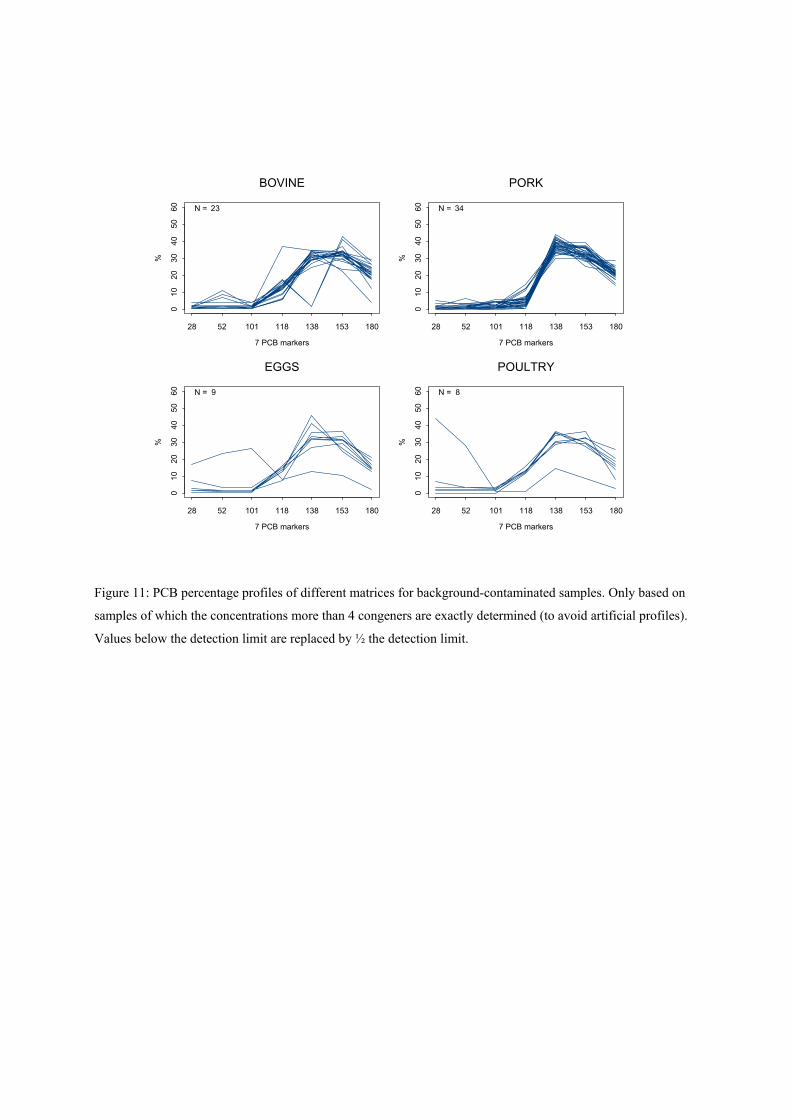
BOVINE
7 PCB markers
%
010
2030
4050
60 N = 23
28 52 101 118 138 153 180
PORK
7 PCB markers
%
010
2030
4050
60 N = 34
28 52 101 118 138 153 180
EGGS
7 PCB markers
%
010
2030
4050
60 N = 9
28 52 101 118 138 153 180
POULTRY
7 PCB markers
%
010
2030
4050
60 N = 8
28 52 101 118 138 153 180
Figure 11: PCB percentage profiles of different matrices for background-contaminated samples. Only based on
samples of which the concentrations more than 4 congeners are exactly determined (to avoid artificial profiles).
Values below the detection limit are replaced by ½ the detection limit.
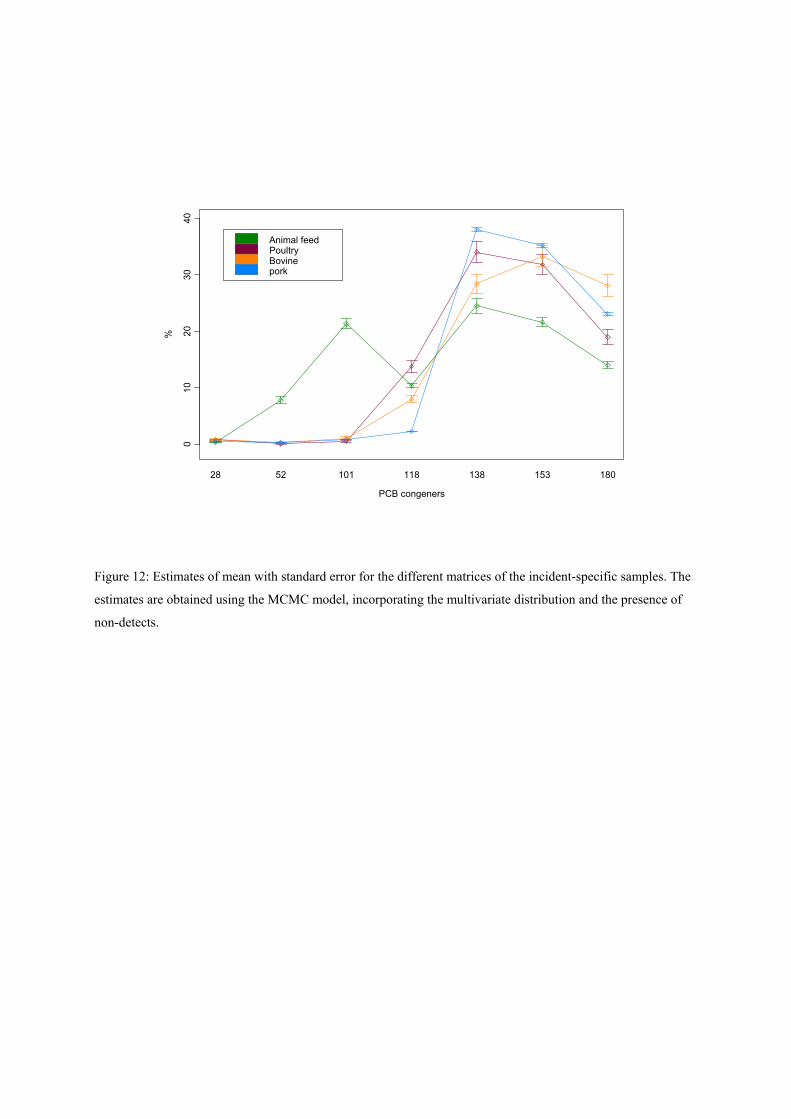
Figure 12: Estimates of mean with standard error for the different matrices of the incident-specific samples. The
estimates are obtained using the MCMC model, incorporating the multivariate distribution and the presence of
non-detects.
PCB congeners
%
010
2030
40
28 52 101 118 138 153 180
Animal feedPoultryBovinepork
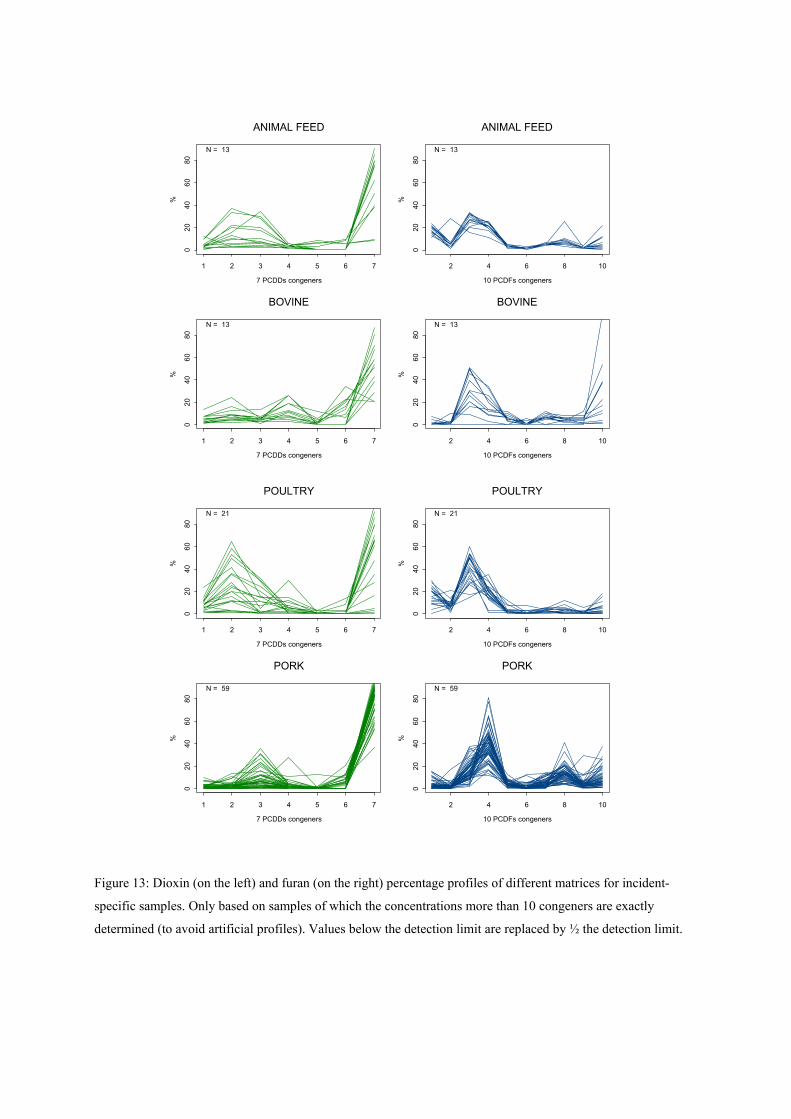
ANIMAL FEED
7 PCDDs congeners
%
1 2 3 4 5 6 7
020
4060
80
N = 13
ANIMAL FEED
10 PCDFs congeners
%
2 4 6 8 10
020
4060
80
N = 13
BOVINE
7 PCDDs congeners
%
1 2 3 4 5 6 7
020
4060
80
N = 13
BOVINE
10 PCDFs congeners
%
2 4 6 8 10
020
4060
80
N = 13
POULTRY
7 PCDDs congeners
%
1 2 3 4 5 6 7
020
4060
80
N = 21
POULTRY
10 PCDFs congeners
%
2 4 6 8 10
020
4060
80
N = 21
PORK
7 PCDDs congeners
%
1 2 3 4 5 6 7
020
4060
80
N = 59
PORK
10 PCDFs congeners
%
2 4 6 8 10
020
4060
80
N = 59
Figure 13: Dioxin (on the left) and furan (on the right) percentage profiles of different matrices for incident-
specific samples. Only based on samples of which the concentrations more than 10 congeners are exactly
determined (to avoid artificial profiles). Values below the detection limit are replaced by ½ the detection limit.
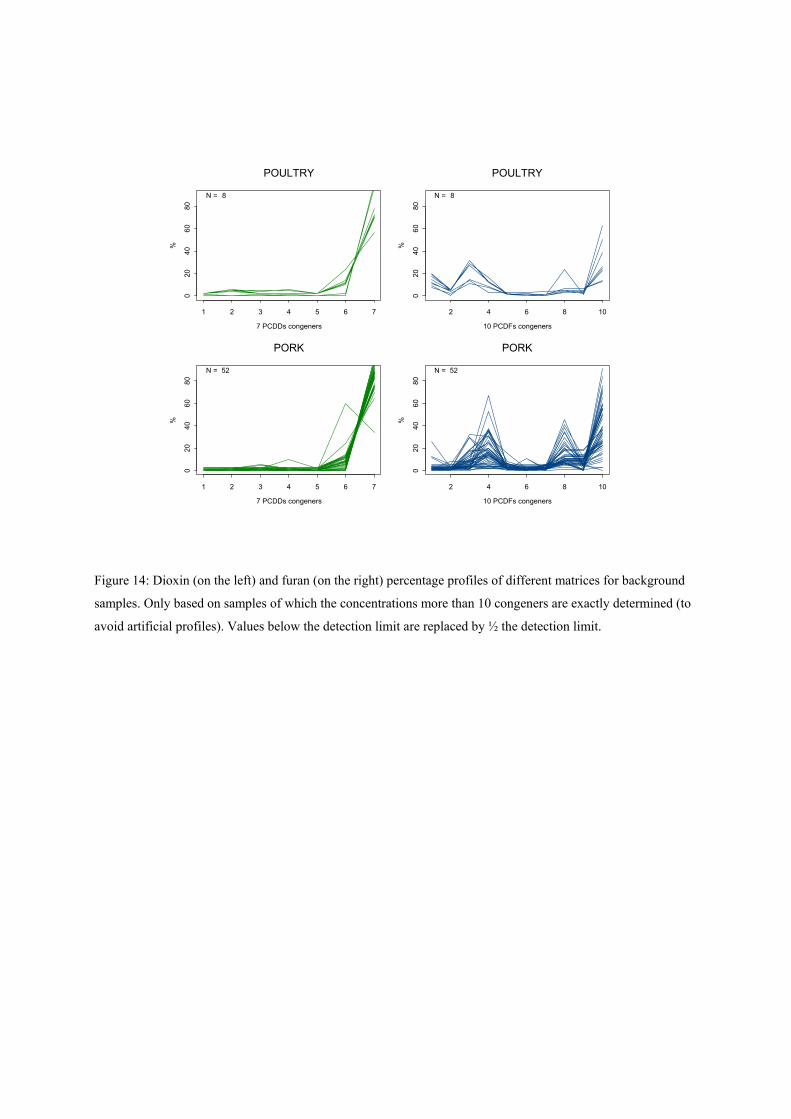
POULTRY
7 PCDDs congeners
%
1 2 3 4 5 6 7
020
4060
80N = 8
POULTRY
10 PCDFs congeners
%
2 4 6 8 10
020
4060
80
N = 8
PORK
7 PCDDs congeners
%
1 2 3 4 5 6 7
020
4060
80
N = 52
PORK
10 PCDFs congeners
%
2 4 6 8 10
020
4060
80
N = 52
Figure 14: Dioxin (on the left) and furan (on the right) percentage profiles of different matrices for background
samples. Only based on samples of which the concentrations more than 10 congeners are exactly determined (to
avoid artificial profiles). Values below the detection limit are replaced by ½ the detection limit.
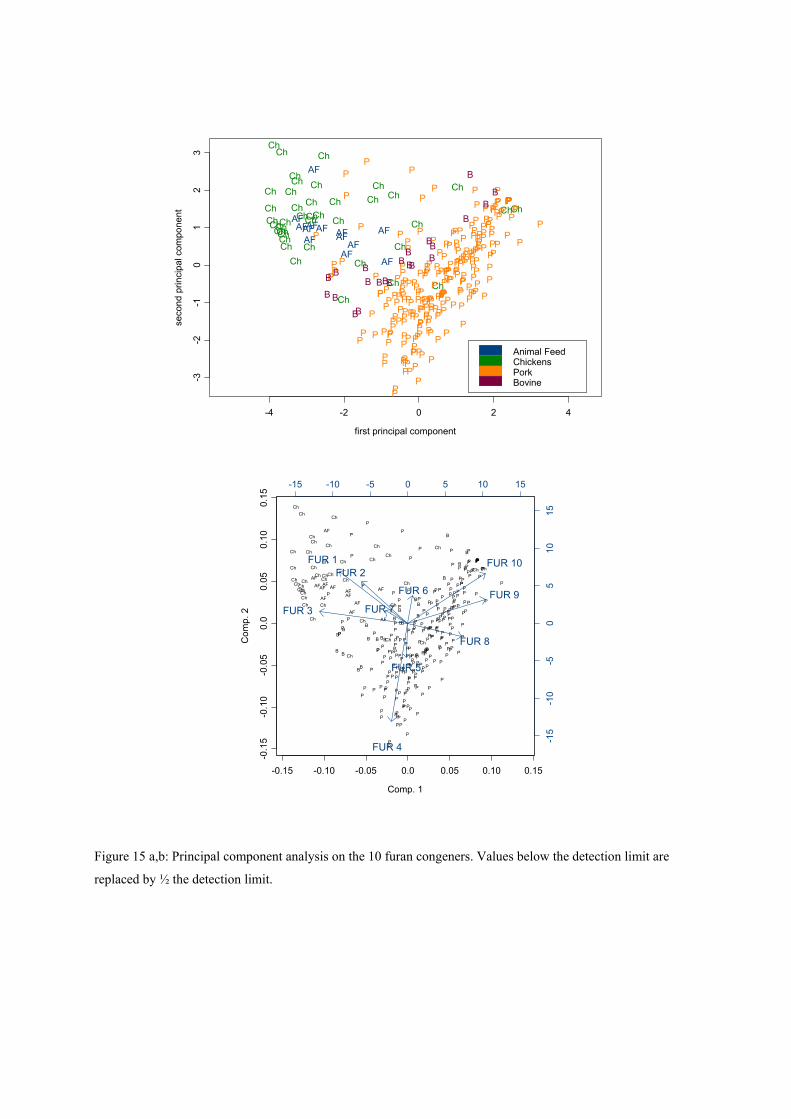
first principal component
seco
nd p
rinci
pal c
ompo
nent
-4 -2 0 2 4
-3-2
-10
12
3
AFAF AFAFAF AF
AF
AF
AFAF
AF
AFAFCh
ChCh
Ch
Ch
ChCh
ChCh
Ch
Ch
ChCh
Ch
Ch
Ch
ChCh
Ch
ChCh
ChCh
Ch
Ch
Ch
ChCh
Ch
ChCh
Ch
Ch
Ch
Ch ChCh
Ch
Ch
Ch
P
PP
P
P
P
P
P
P
P
P
PP
P
P
P
P
P
P
P
P
PP
P
P
P
P
P
P
P
P
PP
P
P
P
P
PP
P P
P
P
P
P
PP
P
P
P
P
P
P P
P
PP
P P
P
PP
P
PPP
PP
P
P
P
PP
P
PP
P
P
P
P
P
P P
P
P
P
PPP
P
PP
P
PP
P
P
P
P
P
P
P
PP
PP
P
P
P
P
P
P
PP
P
P
P
P
P
PP
P
P
P
P
P
P
P
P
P
P
P
P
P P
PP
P
PP
PP
P
P
P
P
P P
P
P
P
P
P
P
P P
P
PPP
P
P
P
P
PP
P
P
PP
P
P
P
P
P
P
P
P
P
P
P
P
P
P
P
PP
PP
PP
P
P
P
P
P
P
P
P
P
P
P
P
P
P
P
P
P
PP
PP
P
P
P
P
P
P
P
P
P
PP
PP
PP
PP
P
PP
P
P
P
P
PP
PP
PP
P
P
B
B
B
B
BB
BB
B
B
B
B
B
B
B
BB
B
BB
BB
Animal FeedChickensPorkBovine
Comp. 1
Com
p. 2
-0.15 -0.10 -0.05 0.0 0.05 0.10 0.15
-0.1
5-0
.10
-0.0
50.
00.
050.
100.
15
AFAF AF
AFAF AF
AF
AF
AF
AF
AF
AFAF
Ch
ChCh
Ch
Ch
ChCh
ChCh
Ch
Ch
ChCh
Ch
Ch
Ch
Ch
Ch
Ch
ChCh
Ch
Ch
Ch
Ch
Ch
Ch
Ch
Ch
ChCh
Ch
Ch
Ch
ChCh
Ch
Ch
Ch
Ch
P
P
P
P
P
P
P
P
P
P
P
PP
P
P
P
P
P
P
P
P
PP
P
P
P
P
P
P
P
P
P
P
P
P
P
P
P
P
P P
P
P
P
P
P
P
P
P
P
P
P
P P
P
P
P
P P
P
P
P
P
PPP
P
P
P
P
P
PP
P
PP
P
P
P
P
P
PP
P
P
P
PP
P
P
PP
P
P
P
P
P
P
P
P
P
P
PP
PP
P
P
P
P
P
P
PP
P
P
P
P
P
PP
P
P
P
P
P
P
P
P
P
P
P
P
PP
PP
P
P
P
PP
P
P
P
P
P P
P
P
P
P
P
P
P P
P
PPP
P
P
P
P
P
P
P
P
P
P
P
P
P
P
P
P
P
P
P
P
P
P
P
P
P
P
P
PP
P
PP
P
P
P
P
P
P
P
P
P
P
P
P
P
P
P
P
P
P
PP
P
P
P
P
P
P
P
P
P
P
P
P
P
P
P
P
P
P
P
P
P
P
P
P
P
P
P
P
PP
P
P
B
B
B
B
B
B
B
B
B
B
B
B
B
B
B
B
B
B
B
B
BB
-15 -10 -5 0 5 10 15
-15
-10
-50
510
15FUR 1
FUR 2
FUR 3
FUR 4
FUR 5
FUR 6
FUR 7
FUR 8
FUR 9
FUR 10
Figure 15 a,b: Principal component analysis on the 10 furan congeners. Values below the detection limit are
replaced by ½ the detection limit.
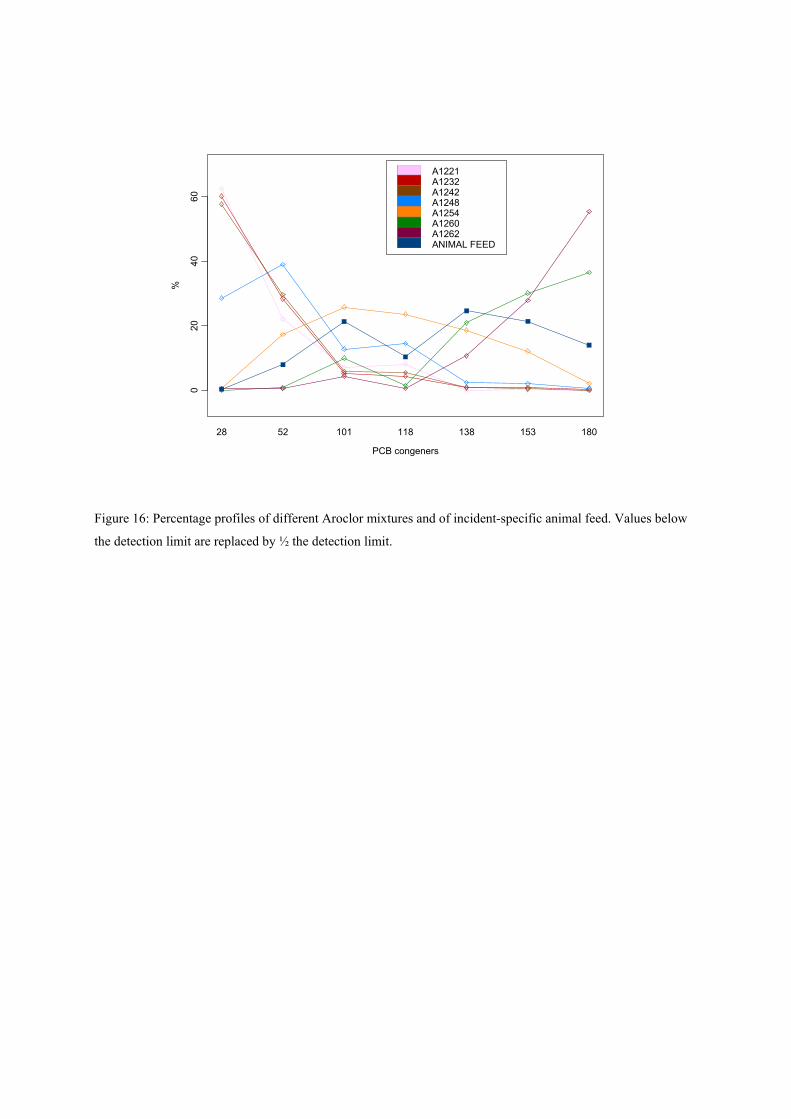
PCB congeners
%
020
4060
28 52 101 118 138 153 180
A1221A1232A1242A1248A1254A1260A1262ANIMAL FEED
Figure 16: Percentage profiles of different Aroclor mixtures and of incident-specific animal feed. Values below
the detection limit are replaced by ½ the detection limit.
������� ��
�� �������� ��� �� ��������� ��
����������� ����� ����
������� ������ � ��� ���� ����� ������ ����� ��� ��� �������
������� �� ������� ��� ��������� ����� �� ������ ����� � ����� ��� !�� �� �������
" �� ����������� ���#�� ���� ��� $���� ���%��&�����
'� ! ��%��&����
����� ��� ��
���� ������ ���� �� �� ��
��������
� ������� �� �
� ���� �� �� ������ �
� � ��� ��������� � � � � � � � � � � � � � � � � � � � � � � � � � � � � � � � � � � � � �
� � ��� �������� � � � � � � � � � � � � � � � � � � � � � � � � � � � � � � � � � � � � �
�� � ��� ������ � � � � � � � � � � � � � � � � � � � � � � � � � � � � � � � � � � � � � �
� ������� ��
�� � � � ������� � ���� � � � � � � � � � � � � � � � � � � � � � � � � � � � � � � � �
�� ������ ��� � ��������� � � � �� ��� �� � � � � � � � � � � � � � � � � � � !
��� � ��������� � "��# �� ��� �� � �� �������$ �� ����� � ����� � � � � � � � �
��! � ��������� � "��# �� %��&���� ����� '����� ��� ��� �������$ �������� � � � � �
��( � ��� ���� �������� �� � ����$ ������ � �� %��&���� ��'������� )�� � � ��
'����� ��� � ����� �� � � � � � � � � � � � � � � � � � � � � � � � � � � � � � � � �
��� � ��� ���� �������� �� � ����$ ������ � �� %��&���� ��'������� )�� � � ������
�#� ������� �� %��&�������� � � � � � � � � � � � � � � � � � � � � � � � � � � � � � � �
��� *�����+���� � � ��$ � ����'�� �� � �#� '��"���&��',��� )������ � ��� ��� ������
����������$ �� �#� ������ �������� � � � � � � � � � � � � � � � � � � � � � � � � � � �
� �������� �� ����� �� ��
!� �������� ��� ���# �� � � � � � � � � � � � � � � � � � � � � � � � � � � � � � � � � �!
���� ������ ���� �� �� �� �
!� ��� ������ '$ �#� �#��� ��'�� ��� � � � � � � � � � � � � � � � � � � � � � � � � � � ��
!�� ������ ��� ����$ ������ � �� %��&���� � ���������� � � � � � � � � � � � � � � � � ��
!�! *������� ����$ ������ � �� %��&���� � ���������� � � � � � � � � � � � � � � � � � � �-
� ������� ��� ��
���� ������ ���� �� �� �� !
� ������� ��
.#� /// ������� ��� ��� �� %��&�������� ��� � ����� � ����� �' �� � ���'�� ���� �� #����#
�0���� �� �#� ������� � ������ �� � �����'�� ���� ����������1"��# ������ � �� �� �� ���
��� �� %��&���� ����� �#� � �� #�2��� �� ���� � �#� � ��������� �1"��� # "�)��� 3���� ��4&
����� ������� ���� ��������� �#� � �� �����$ ������ ������'��� � � �#��� �� %��&���� ��'�������
)�� � �� � � �#� ���� � �#�� � ���������� � � ����� #�� �������� � �#� ������� "��� � �
�)����'��� .#� ���������)�� �#� ����������� � �� � �� � ��� �� %��&���� ��� � �������&
�� �� �� '� � ����� 5���� �� �#� � ������ �� �������� �%������ '������ � �#� ��������# � �
�������$� ���� ����� �� )����� � ������ � ����$� ��'&�� ��� � �� ��� � �� �%� ��� �#�� �#&
���� ��� '������ � �#� #��# � ��� ������ � �#�� ���� � ������� ��� ����$���� *� "��� �#���� ���
������� �#�� �� ������� �# ��� '� ���� � '���� � � � ������� � ����� �� �������� �� � �&
��'��� �� � ���������� ������� � ������ � ��'�� ���� � ������� ��� �%���� �#� �%������ �� %��
� ��������� � ����'���� ������� ������ �#� ��������� ��� � � �'��� ' �# �� � �� '�'�������
�%� ���� ����������� .#�� �%� ���� 3�����+���� � #�� ���� �� � ���'�� � ���� �� � �� %��
' �$ '����� �������� �1�� � ������ ' �# � '����� ��� ������ ��� � �#� ������������$ ������
��� � �#� ��������1� �� "�� '$ � ���� ���������� '���� � �� "� � %����$ ���� � �� %���� �
����������$ �������� '���� � � ������� ���'�� � ����� #�� '��� ��������� '�� �� 67�������
���8� ����� �����#$ �������� �� �#�� �%������ ����$ ������� �� ������ ���� .#�� �#����� ��&
� ��� �#� �%�� ����� � � �#� ����'���� �#� ����$��� � ��)���� � � � ������� � ����� ��� �#�
�� '�'������� �%� ���� �����������
� ���� �� �� ������
.#� �� '�'������� �%� ���� ���������� � "���� �� %��&���� � ���������� �� '���� � � � ���
���� �������� �� ���� ������ � ������ � )����'�� ������ "��# �#��� ������������� ��� � ����$
������ � ���� .#� )����� ��������� � �#� � ��� ��� � �#� � ���� � �#� �������� � �� ���� ��
����������� �� �#� 5 "�#��� ��)�� �� +���� �
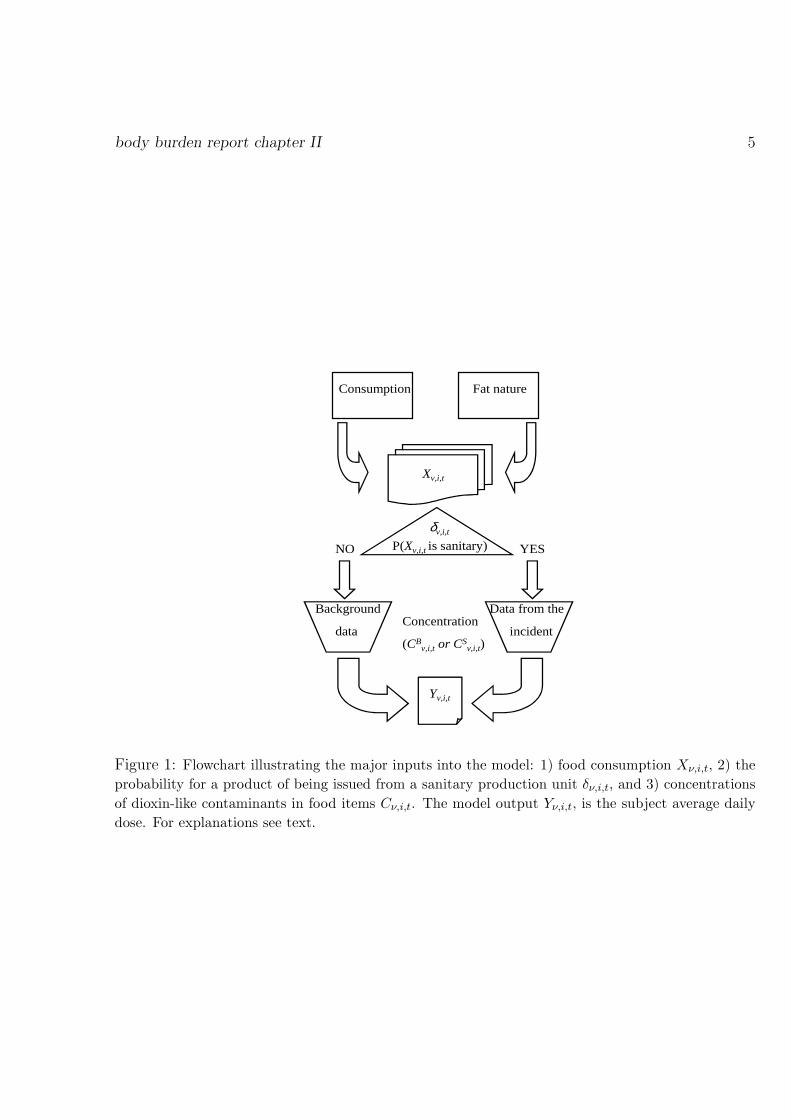
���� ������ ���� �� �� �� (
Xv,i,t
Consumption Fat nature
P(Xv,i,t is sanitary)NO YES
Background
data
Data from the
incidentConcentration
(CBv,i,t or CS
v,i,t)
Yv,i,t
δv,i,t
������ 9 (� ������ ����������% ��� �� � ����� ��� ��� � ���) *+ � � � ������ � ������� ,+ ���
�� &�&����� � � � �� ���� � &���% ���� �� � � ������� �� ����� � ���� ������� ��� -+ � ��������� �
� �� .��/���� � ��������� �� � � ���� ������0 1�� � ��� ����� ������� � ��� �&��� �#���%� �����
� �0 ( � �.������� � �� ��.�0
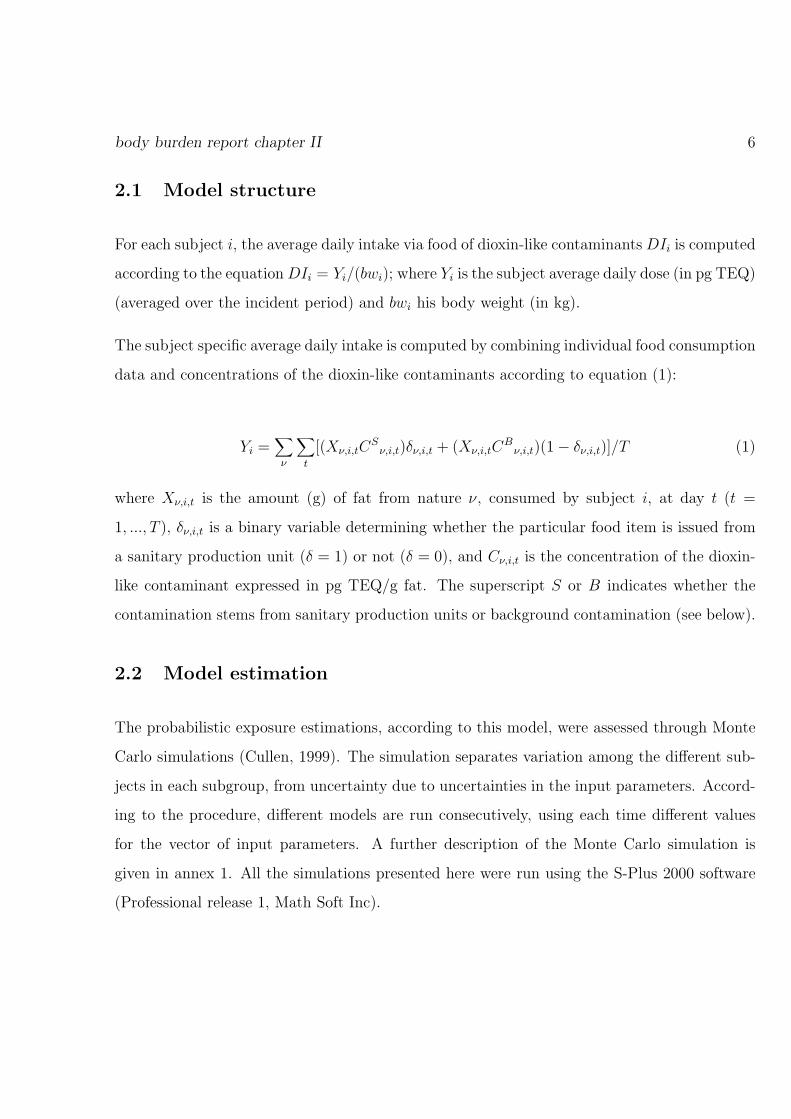
���� ������ ���� �� �� �� �
��� ���� �������
� � ���# ��',��� �� �#� �)����� ����$ ������ )�� � � � �� %��&���� � ������������� �� � ������
��� ����� � �#� �3���� ���� : ���6���8; "#��� �� �� �#� ��',��� �)����� ����$ � �� 6�� �� .<=8
6�)������ )�� �#� �������� ���� �8 ��� ��� #�� ' �$ "���#� 6�� ��8�
.#� ��',��� �����+� �)����� ����$ ������ �� � ������ '$ � �'����� ����)����� � � � ������� �
���� ��� � ��������� �� � �#� �� %��&���� � ���������� ��� ����� � �3���� � 689
�� :�
�
�
�
>6������������8����� ? 6������
������86� �����8@�� 68
"#��� ������ �� �#� �� ��� 6�8 � ��� �� � ������ �� � ������ '$ ��',��� �� �� ��$ 6 :
� ���� � 8� ����� �� � '����$ )����'�� ����������� "#��#�� �#� ���������� � � ���� �� ������ �� �
� �������$ �� ����� � ���� 6 : 8 � � � 6 : �8� ��� ����� �� �#� � ��������� � � �#� �� %��&
���� � ��������� �%������� �� �� .<=A� ���� .#� ����������� � � � ��������� "#��#�� �#�
� ��������� � ����� �� � �������$ �� ����� � ����� � '����� ��� � ��������� � 6��� '�� "8�
��� ���� ��� ��� ��
.#� �� '�'������� �%� ���� �������� ��� ��� ����� � �#�� � ���� "��� �������� �#� ��# � ���
���� �������� �� 6������� ///8� .#� �������� � ��������� )������ � �� �� �#� ��0����� ��'&
,���� �� ���# ��'�� ��� �� � ����������$ ��� � ������������� �� �#� ����� ����������� ��� ��&
��� � �#� �� ������� ��0����� � ���� ��� ��� � �������)��$� ����� ���# ���� ��0����� )�����
� � �#� )��� � � ����� ����������� � ����#�� ��������� � � �#� � ��� ���� �������� � ��
��)�� �� ����% � ��� �#� �������� �� ��������� #��� "��� ��� ����� �#� B&���� ��� � ��"���
6�� ����� ��� ������� � ���# B �� *��8�
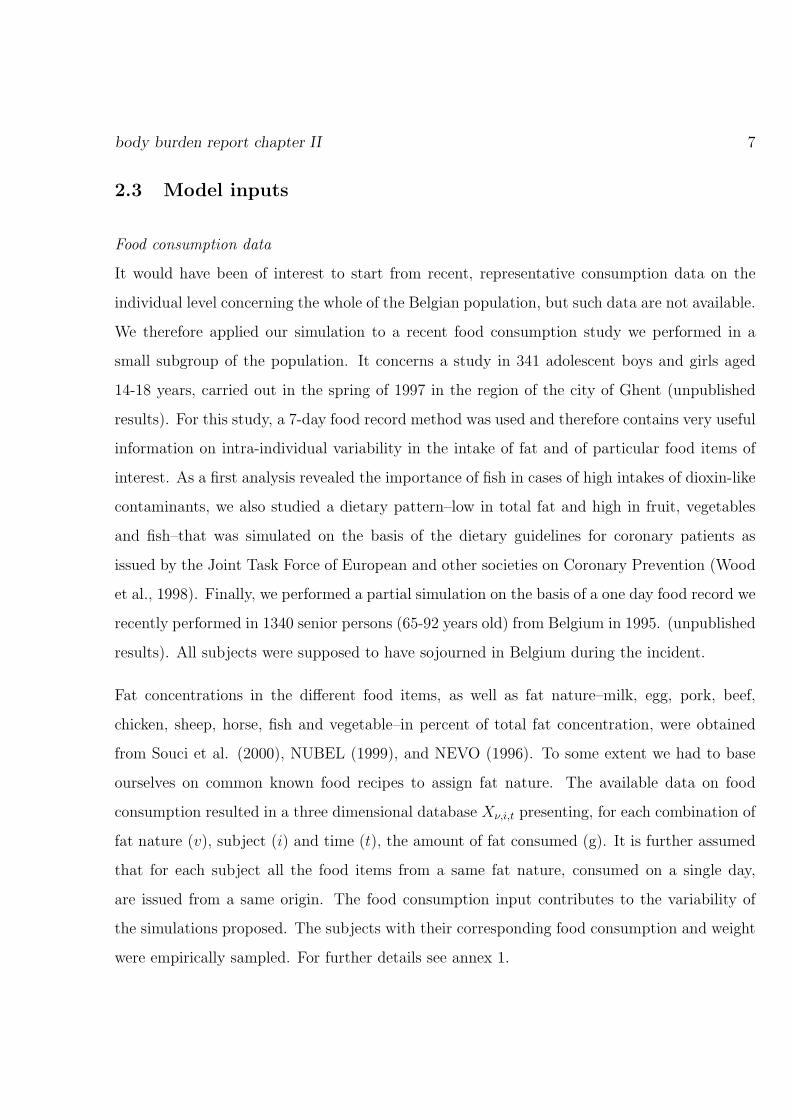
���� ������ ���� �� �� �� �
��� ���� �����
���� ��������� ���
*� " ��� #�)� '��� � �������� � ����� �� � ������� ������������)� � ������� � ���� � �#�
����)����� ��)�� � �������� �#� "# �� � �#� ������� � ������ �� '�� ���# ���� ��� � � �)����'���
7� �#���� �� ������� �� �������� � � � ������ � � � ������� � ����$ "� ���� ���� �� �
����� ��'�� �� � �#� � ������ �� *� � ������ � ����$ �� �! �� ������� ' $� ��� ����� ����
!&- $����� ������� �� �� �#� ������ � //� �� �#� ���� � � �#� ���$ � C#��� 6����'���#��
�������8� � � �#�� ����$� � �&��$ � � ��� �� ���# � "�� ���� ��� �#���� �� � ������ )��$ ������
��� ����� � � �����&����)����� )����'����$ �� �#� ������ � ��� ��� � ���������� � � ����� �
��������� �� � +��� ����$��� ��)����� �#� ��� ������ � +�# �� ����� � #��# ������� � �� %��&����
� ����������� "� ��� ������� � ������$ �������1� " �� � ��� ��� ��� #��# �� ������ )�����'���
��� +�#1�#�� "�� ��������� � �#� '���� � �#� ������$ ���������� � � � � ���$ �������� ��
������ '$ �#� D ��� .��� � ��� � <�� ���� ��� �#�� � ������� � � � ���$ ���)���� � 67 �
�� ���� //-8� ������$� "� ���� ���� � ������� �������� � � �#� '���� � � �� ��$ � � ��� �� "�
�������$ ���� ���� �� �!� ���� � ���� �� 6�(&/ $���� ��8 �� � ������� �� //(� 6����'���#��
�������8� ��� ��',���� "��� ���� ��� � #�)� � , ����� �� ������� ������ �#� ���������
��� � ��������� �� �� �#� ��0����� � � ������ �� "��� �� ��� ������1����� ���� � ��� '����
�#������ �#���� # ���� +�# ��� )�����'��1�� ������� � � ��� ��� � ��������� �� "��� '������
�� � B ��� �� ��� 6���8� EF�<G 6///8� ��� E<HI 6//�8� . � �� �%���� "� #�� � '���
�����)�� � � �� � �� "� � � ������� � ������ ��� ������� .#� �)����'�� ���� � � �
� ������� � �������� �� � �#��� ������� ��� ����'��� ������ ����������� � � ���# � �'����� � �
��� ������ 6�8� ��',��� 6�8 ��� ���� 6 8� �#� �� ��� � ��� � ������ 6�8� *� �� ����#�� �������
�#�� � � ���# ��',��� ��� �#� � � ����� �� � � ���� ��� ������� � ������ � � ������ ��$�
��� ������ �� � � ���� ������ .#� � � � ������� � ����� � ����'���� � �#� )����'����$ �
�#� �������� �� �� � ���� .#� ��',���� "��# �#��� � ����� ����� � � � ������� � ��� "���#�
"��� ����������$ �������� � � ����#�� ������� ��� ����% �
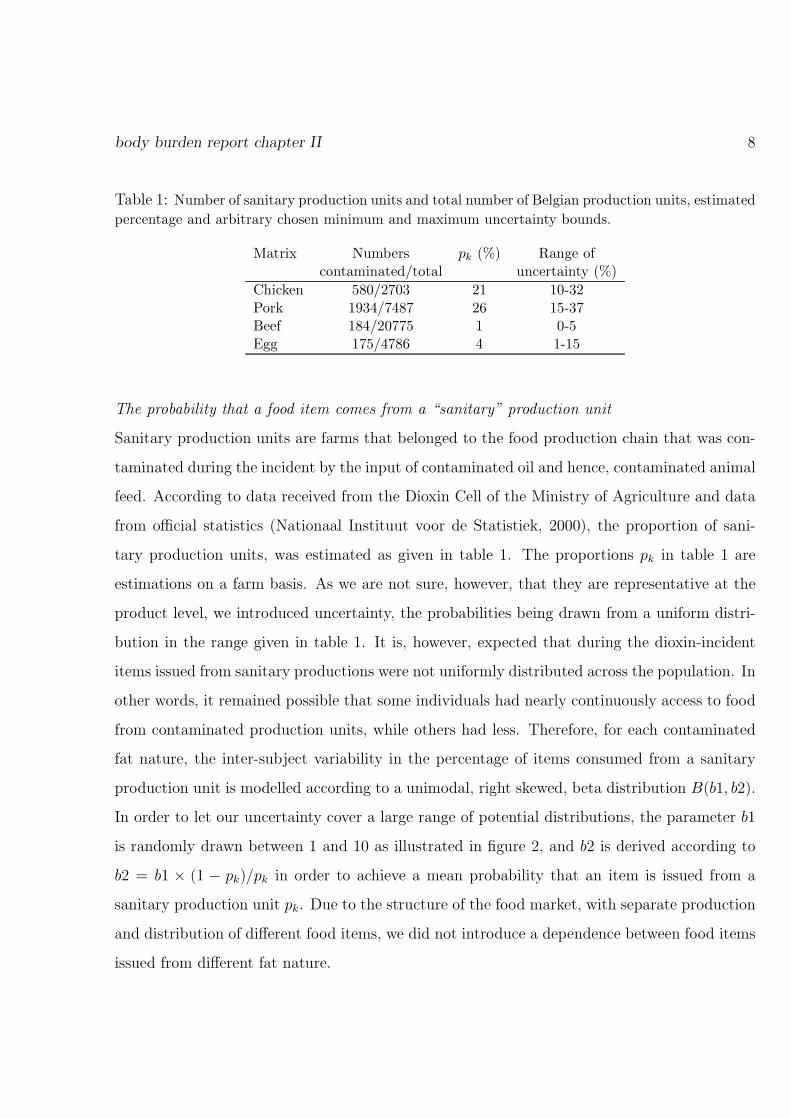
���� ������ ���� �� �� �� -
.�'�� 9 2��&�� � ������� �� ����� � ���� ��� � ��� ���&�� � ���%��� �� ����� � ����� ����������������%� ��� ��&������ �� �� ������� ��� ��.���� ����������� & ���0
�����. 2��&�� �� 34+ 5��%� �� ����������6� ��� ����������� 34+
������� 7896,:9- ,* *9/-,; �� *<-=6:=8: ,> *7/-:���� *8=6,9::7 * 9/7'%% *:76=:8> = */*7
�� ��������� �� � ���� ��� ����� ���� � ��������� �������� ���
B������$ �� ����� � ����� ��� ����� �#�� '�� ���� � �#� � � �� ����� � �#��� �#�� "�� � �&
��������� ������ �#� �������� '$ �#� ����� � � ���������� �� ��� #����� � ���������� ������
����� ��� ����� � ���� �����)�� �� � �#� � %�� ���� � �#� �������$ � ����������� ��� ����
�� � 4���� ���������� 6E��� ���� *�������� ) � �� B���������� ���8� �#� �� � ��� � � ����&
���$ �� ����� � ������ "�� ��������� �� ��)�� �� ��'�� � .#� �� � ��� �� �� �� ��'�� ���
�������� �� � � ���� '����� �� "� ��� � � ����� # "�)��� �#�� �#�$ ��� ������������)� �� �#�
�� ���� ��)��� "� ���� ����� ����������$� �#� �� '�'������� '���� ���"� �� � � ���� �� ������&
'��� � �� �#� ����� ��)�� �� ��'�� � *� ��� # "�)��� �%������ �#�� ������ �#� �� %��&��������
����� ������ �� � �������$ �� ����� �� "��� � � ���� ���$ ������'���� ��� �� �#� � ������ �� *�
�#�� " ���� �� �������� � ���'�� �#�� � �� ����)������ #�� �����$ � ����� ���$ ������ � � �
�� � � ���������� �� ����� � ������ "#��� �#��� #�� ����� .#���� ��� � � ���# � ����������
��� ������� �#� �����&��',��� )����'����$ �� �#� ���������� � ����� � ������ �� � � �������$
�� ����� � ���� �� � ������ ��� ����� � � ���� ���� ���#� ���"��� '��� ������'��� � �6�� �8�
*� ���� � ��� �� ����������$ � )�� � ����� ����� � � ������� ������'��� ��� �#� ��������� �
�� ���� ��$ ���"� '��"��� ��� � �� ����������� �� +���� � ��� � �� ����)�� ��� ����� �
� : � � 6 � ��8��� �� ���� � ��#��)� � ���� �� '�'����$ �#�� �� ���� �� ������ �� � �
�������$ �� ����� � ���� ��� �� � �#� ��������� � �#� � � ������� "��# �������� �� ����� �
��� ������'��� � � ��0����� � � ������ "� ��� � � ���� ���� � ���������� '��"��� � � �����
������ �� � ��0����� ��� �������
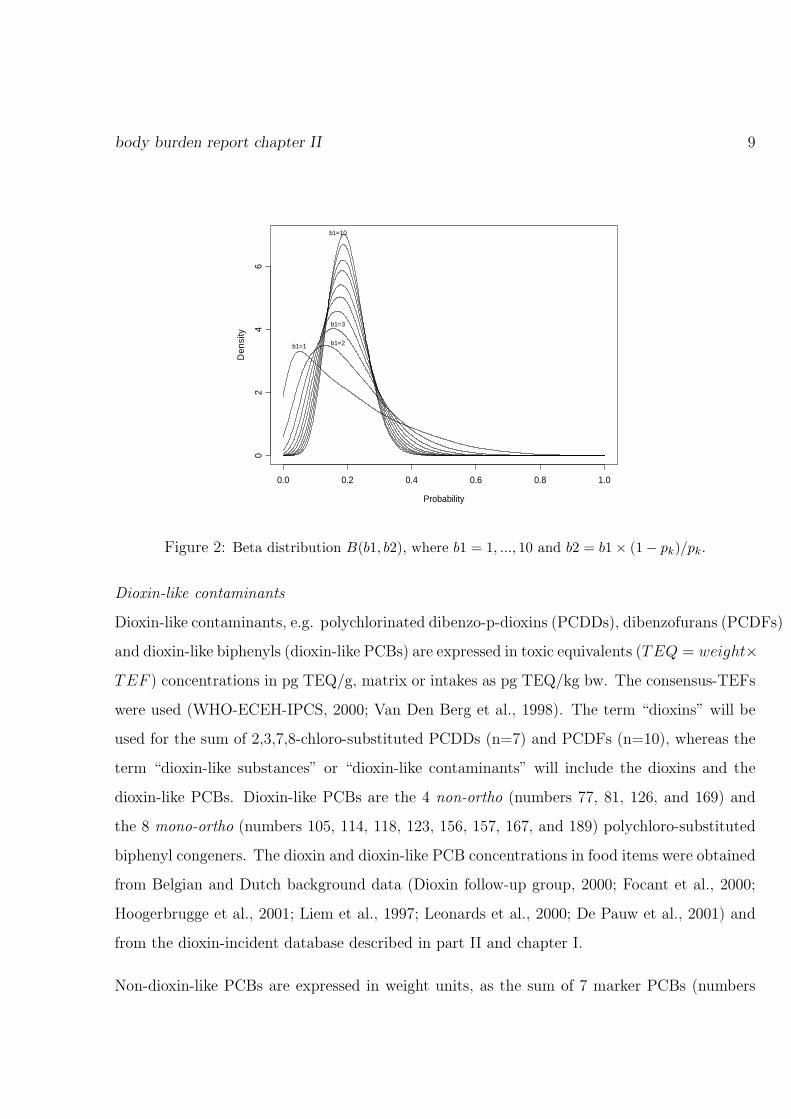
���� ������ ���� �� �� �� /
Probability
Den
sity
0.0 0.2 0.4 0.6 0.8 1.0
02
46
b1=1 b1=2
b1=3
b1=10
������ 9 ���� �����&��� � �3�*� �,+� ����� �* ? *� � *9 ��� �, ? �*� 3*� ��+��0
����������� ����������
� %��&���� � ����������� ���� � �$�#� ������� ��'��2 &�&�� %��� 6�� �8� ��'��2 ������ 6�� ��8
��� �� %��&���� '��#��$�� 6�� %��&���� ����8 ��� �%������� �� � %�� �3��)������ 6��� : ����� �
��� 8 � ��������� �� �� �� .<=A�� �����% � ������� �� �� .<=A�� '"� .#� � �������&.<��
"��� ���� 67JI&<�<J&*��B� ���; H�� �� ���� �� ���� //-8� .#� ���� K�� %���L "��� '�
���� � � �#� ��� � �����-&�#� � &��'�������� �� � 6�:�8 ��� �� �� 6�:�8� "#����� �#�
���� K�� %��&���� ��'�������L � K�� %��&���� � ����������L "��� ������� �#� �� %��� ��� �#�
�� %��&���� ����� � %��&���� ���� ��� �#� ! �������� 6���'��� ��� -� �� ��� �/8 ���
�#� - ��������� 6���'��� �(� !� -� �� (�� (�� ��� ��� -/8 � �$�#� � &��'��������
'��#��$� � �������� .#� �� %�� ��� �� %��&���� ��� � ��������� �� �� � � ����� "��� '������
�� � ������� ��� ���# '����� ��� ���� 6 � %�� � �� "&�� �� ��� ���; � ���� �� ���� ���;
J ���'����� �� ���� ��; G��� �� ���� //�; G� ����� �� ���� ���; � ���" �� ���� ��8 ���
�� � �#� �� %��&�������� ����'��� ������'�� �� ���� ** ��� �#����� *�
E �&�� %��&���� ���� ��� �%������� �� "���#� ������ �� �#� ��� � � ������ ���� 6���'���
���� ������ ���� �� �� �� �
-� (� �� -� �-� (�� ��� -�8� .#��� � ��������� �� �� � � ����� �� � � �����������
�������$ �� ����� � ����� "��� '������ �� � �#� �� %��&�������� ����'����
7��#�� �#� �������$ �� ����� � ������ �� �������)� �������� �� ���� � � ������ ���� #��
'��� ��������� J "�)��� ��$ ������� �#�� "��� �' )� ������� ����� � ��������� �� � � �#� ���
� �#� � ������ ���� "��� ��� �������� � � �� %��� 6�� A�8� .#� �� %�� �������� �#���� ���
� � � � �������� � ���� � ������ �� � �#� �� %�� � ��������� �� �� �#� )����� � � �����
��� �#�$ ��� � � '� ���� � � ��������� � �������� ��������� .#���� ��� ��������� �������� "��
������� � �#� � �&�� %��&���� ��� � ��������� �� ���� ��� ����� � �3���� � 68 �#� �� %��
� ��������� �� "��� ��������� �� � �#� ������ ��� � ��������� ��9
���6���8 : ��; � � ���� ��� ��� ���������6���8 : �� ? ����6��8; � � � � ���� ��� ��� �������
68
7#��� �� �� �#� ���� �������� � � � ������� �#�� ��� ���� ��� � � �#� ������ ��� )����; �� ���
�� ��� �#� ��������� ��� �#� �� �� "#�� ���������� �#� � �����#� � �#� �� %�� � ��������� �� ��
������ � � �#� � �����#� � �#� ��� � �#� ��)�� ������ ����� B���� � �� � �#� .<= )�����
"��� ���� ���A � ���#� ���� ��� "� ���� ���������� �������� �� ���� "������� � � ���� ���
'���)��� � �� ���� � �������� �#� �������� � ���������� 6���)M�� ������ � �� B���� ���8�
.#� ���������� � �#� �������� � � ��� ��� ��������� � � ����� ������ ��2�� ��������� ��
�����'�� ���������� F���������$ �' �� �#��� ����������� ��� � +���� ������ ��2�� �� ��5�����
�� �#��� ��������)� ��������� �������� ��� ��� *� ���� � ���� "����� � � �#�� ����������$ �� �#�
�������� � ����������� "� ��� � �����)������ � ���� ������'��� � � ��������� �#� � ������ �
���� ���������� ��� ��� � )������� � �#� � � ������ ���� .<= )������
7#�� �#� � � ���� "�� ������� � � �� �� � � � �&�������$ �� ����� � ����� '����� ���
��)��� � �� %�� 6�� A�8 � ���������� "��� �������� .#� ������ � � ��������� � "�� ���&
���� ���� ��$� ����� � �������� ������'��� � � '����� ��� ��)���� B���� '����� ��� ��)��� "���
3���� ������� �� ������� ����� �� /// ��� �� ���� ��� �)����'�� ���� "��� �������� �� �#�
����$��� 6��� �������8� .#� �� %��&�������� ����'��� � ������� � ����� ���'�� � ������ ���
���� ������ ���� �� �� ��
����$��� �� �%� �� �� ����� � ������ � �&� ���������� ������ �#� ��������� � �������'�$ ���&
��������� '����� ��� ����� .#� ����� # "�)��� "��� ������� � ��� �� � ���� �#������ � ��
��� '���1�� ��� �� '���� #���� � � � ����� ��� � ������� �����$ � �� %�� ���� "��� �������1
��� �#� )������$ � �� �%���� ���� � � �#� �� %��� �� � �#� ������ ���� � ��� � � '� ����&
������� .#���� �� �� � ��� � � '� ���� �� � � ���� � � '����� ��� �� %�� � ��������� � �����
I�� � �� %��&���� ����� � �� � ������� 6��� ��� ��� -� ��� �� ��� ��� �/8 ���
� " �$�����������$ ��������� � ���#�� "��# �� � ��� �� ��� �� � ���'�� � � � ������
"��#�� �� ������ � ��������� � � ��� � �� ���� 6 � ���"� ��8� 7��# �#� �%����� � � )��$
��" ����$���� � �� %��&���� ����1��������� �$�����������$ �#� ! �������� ��� - ���������
� �������1#�� '��� �������� �� �#� � ��� ���� �� ���� �� �#� ���� � �#� /// �� %��&��������
� �� ���)� �� � ��� ���� �� ����� � �������� �� %�� '����� ��� � ��������� � �� ��������
�� �#� � ������ �� +�� �� '����� ��� ��� � ��������� � "�� 3���� ������� � �#� ��������
������� ���� 6��� �#����� *8� "� ���� ���# ��2�� � ���$ � �#� � �� ������ ������� �� ���� �
�������� �#� ���� � �#� � ��������� � � � ��� �� %��&���� ��'������� � �#� � ��������� �� �
�� � ��� �� �� �� ��� ����� � �������� � � �� ������ ����������� ���# ��# �#�$ ���������
��$ ���� � �#� �� %��&���� ����� �#�$ ������� � ������� � ��� �/� �#� � �� ��� ����� ���
"��# ������ � � %����$ 6.<� )����� �� ��� ���8� � � )��$ � " � ��������� � ��)���1���#��
� " �� A�� � � ��������� �� � � " �� %��&���� ��� � ��������� �1�#� ���������� ���� �
��� )��$ ��������� ��� � ���� � ������� � �� �#� ����$����� ����������� �� .#��� ���� � "���
� � ����� ��� ��� ���� *� �#� �������� ��� ��������� �������� "��#�� �#� ������'��� � � ���� �
"�� �����2�� ���������$ � � ���# ��� ������� � � +�#� �#� �� %��&���� ��� � ��������� � "��
������ � ���# �� %�� � ��������� � ����)������$� ����� ��� ������� �)����'�� #�� '��� ����$���
� � �� �� �� �� ��� �� %��&���� ���� 6��������� �#� �������� ��� ��������� � �������8�
������� �� �� �������
.#� �%� ���� ���������� ��������� �� �#�� ����� �� �������� � �� ���� �� �������� � �#�
�)����� ����$ � �� ������ �#� ������� �� %��&��������� � �# ��� #�� � '� ���� ��� �� "��
�������� �#�� �#� �������� ������� � ��'����$ ��� ����� ��� � ��$� ///� .#�� ����� �
���� � ��������� ������ ������ � "���� 6� : ��$�8�
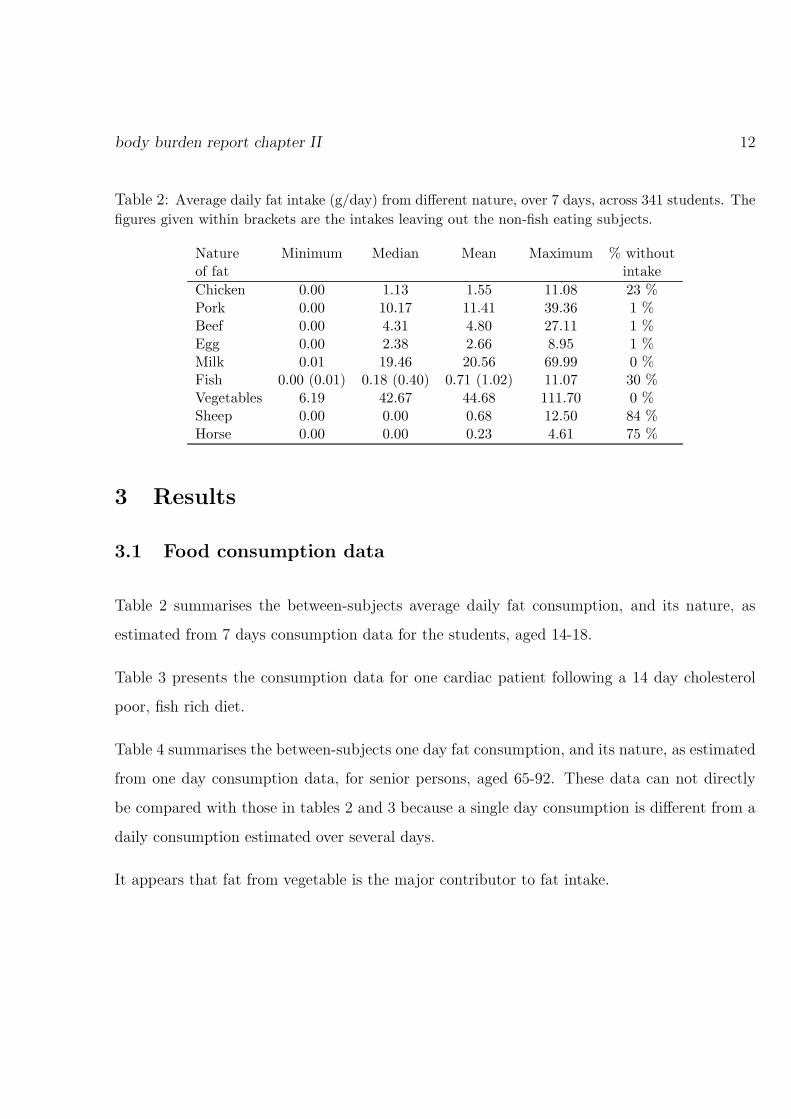
���� ������ ���� �� �� ��
.�'�� 9 $#���%� ����� ��� ������ 3%6���+ �� � �� ����� ������� #�� : ���� ��� -=* ������0 1��
@%��� %�#�� ������ &������ ��� ��� ������ ���#��% �� ��� � �/@� �����% �&���0
2����� ������� ������ ���� ��.���� 4 ���� �� � ��� ������
������� 9099 *0*- *077 **098 ,- 4; �� 9099 *90*: **0=* -<0-> * 4���� 9099 =0-* =089 ,:0** * 4'%% 9099 ,0-8 ,0>> 80<7 * 4���� 909* *<0=> ,907> ><0<< 9 4(�� 9099 3909*+ 90*8 390=9+ 90:* 3*09,+ **09: -9 4��%���&�� >0*< =,0>: ==0>8 ***0:9 9 4����� 9099 9099 90>8 *,079 8= 4� �� 9099 9099 90,- =0>* :7 4
� �������
��� ��� �������� �� ���
.�'�� ���������� �#� '��"���&��',���� �)����� ����$ ��� � ������� �� ��� ��� ������� ��
��������� �� � � ��$� � ������� � ���� � � �#� ��������� ���� !&-�
.�'�� � �������� �#� � ������� � ���� � � �� ������� ������� � �� "��� � ! ��$ �# ������ �
� �� +�# ���# �����
.�'�� ! ���������� �#� '��"���&��',���� �� ��$ ��� � ������� �� ��� ��� ������� �� ���������
�� � �� ��$ � ������� � ����� � � ���� � ���� ��� ���� �(&/� .#��� ���� ��� � � �������$
'� � ������ "��# �# �� �� ��'��� ��� � '������ � ������ ��$ � ������� � �� ��0����� �� � �
����$ � ������� � ��������� )�� ��)���� ��$��
*� ������� �#�� ��� �� � )�����'�� �� �#� ��, � � ����'�� � � ��� �������
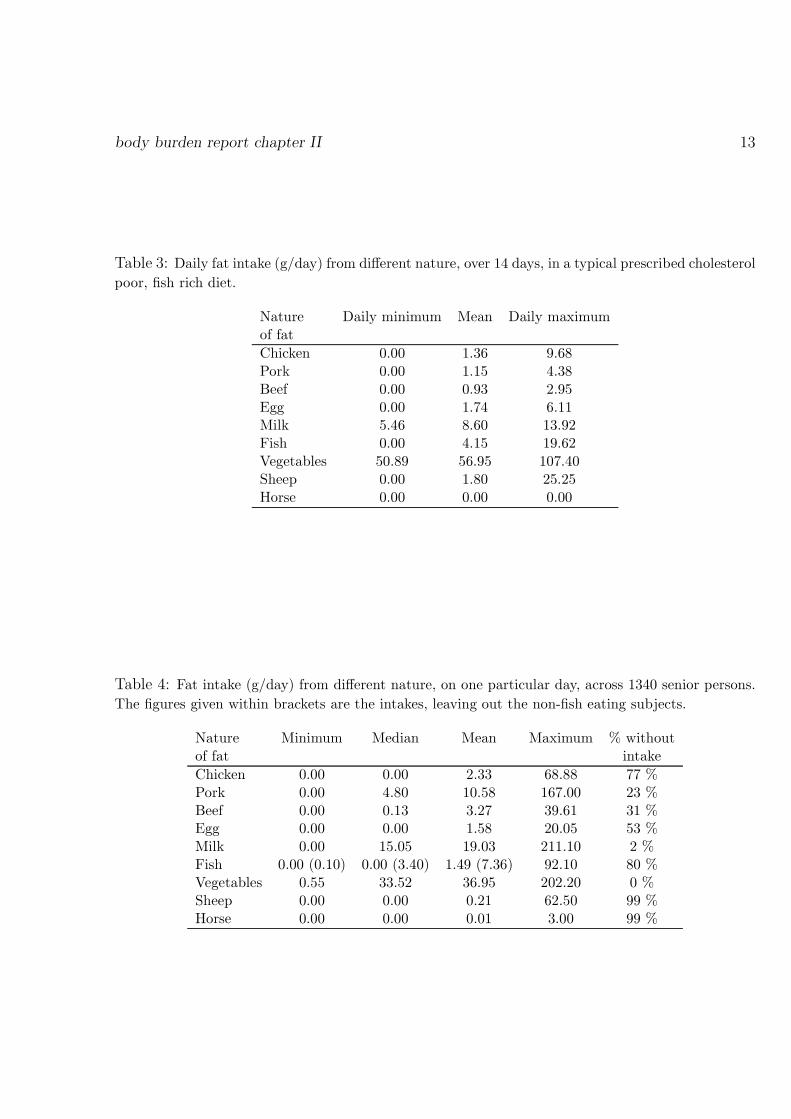
���� ������ ���� �� �� �� �
.�'�� �9 ����� ��� ������ 3%6���+ �� � �� ����� ������� #�� *= ���� �� � ������� ������&�� �� ����� �
� �� @� ���� ����0
2����� ����� ������� ���� ����� ��.���� � ���
������� 9099 *0-> <0>8; �� 9099 *0*7 =0-8���� 9099 90<- ,0<7'%% 9099 *0:= >0**���� 70=> 80>9 *-0<,(�� 9099 =0*7 *<0>,��%���&�� 7908< 7>0<7 *9:0=9����� 9099 *089 ,70,7� �� 9099 9099 9099
.�'�� !9 (�� ������ 3%6���+ �� � �� ����� ������� � �� ���������� ���� ��� *-=9 ��� � ��� �0
1�� @%��� %�#�� ������ &������ ��� ��� ������� ���#��% �� ��� � �/@� �����% �&���0
2����� ������� ������ ���� ��.���� 4 ���� �� � ��� ������
������� 9099 9099 ,0-- >8088 :: 4; �� 9099 =089 *9078 *>:099 ,- 4���� 9099 90*- -0,: -<0>* -* 4'%% 9099 9099 *078 ,9097 7- 4���� 9099 *7097 *<09- ,**0*9 , 4(�� 9099 390*9+ 9099 3-0=9+ *0=< 3:0->+ <,0*9 89 4��%���&�� 9077 --07, ->0<7 ,9,0,9 9 4����� 9099 9099 90,* >,079 << 4� �� 9099 9099 909* -099 << 4
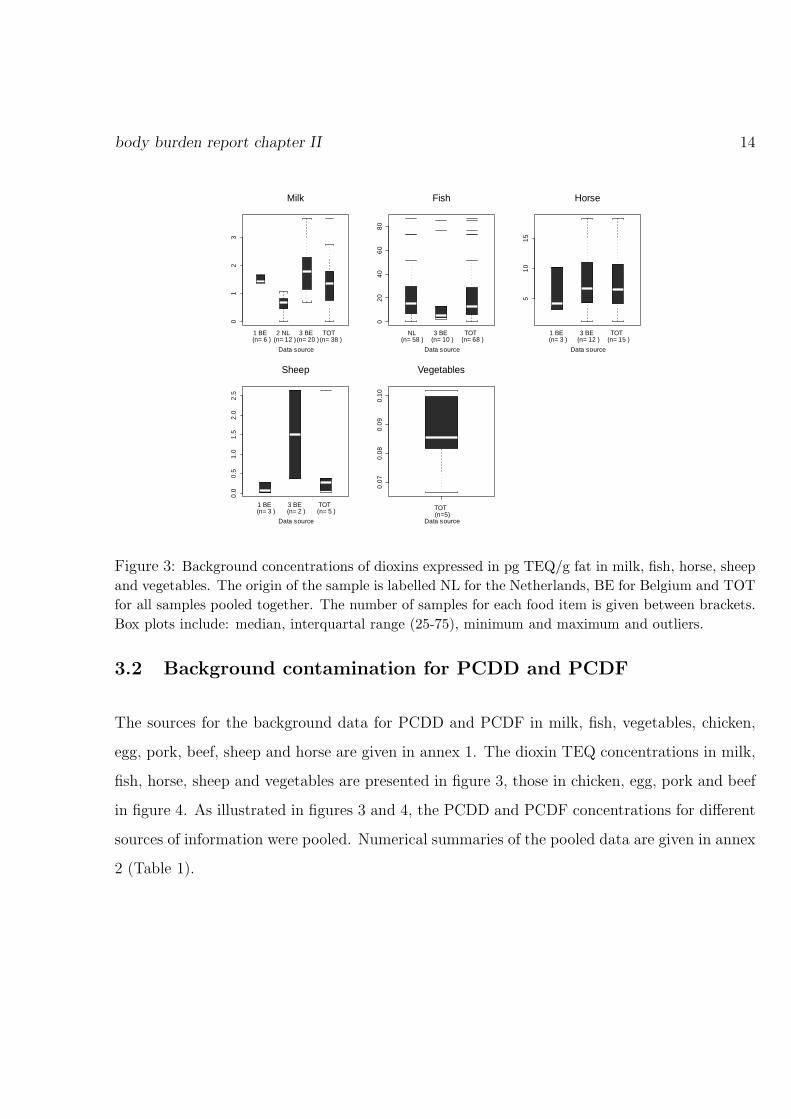
���� ������ ���� �� �� �� !
01
23
1 BE (n= 6 )
2 NL (n= 12 )
3 BE (n= 20 )
TOT (n= 38 )
Milk
Data source
02
04
06
08
0
NL (n= 58 )
3 BE (n= 10 )
TOT (n= 68 )
Fish
Data source
51
01
5
1 BE (n= 3 )
3 BE (n= 12 )
TOT (n= 15 )
Horse
Data source
0.0
0.5
1.0
1.5
2.0
2.5
1 BE (n= 3 )
3 BE (n= 2 )
TOT (n= 5 )
Sheep
Data source
0.0
70
.08
0.0
90
.10
Vegetables
Data source
TOT (n=5)
������ �9 ����%� ��� � ��������� � � �� .�� �.����� �� �% 1'A6% ��� �� ����� @�� � ��� ������� #�%���&��0 1�� ��%�� � ��� ����� � ��&����� 2B � � ��� 2���������� �' � � ���%��� ��� 1C1
� � ��� ����� � ��� � %�����0 1�� ���&�� � ����� � � ���� � � ���� � %�#�� &������ &������0
� . �� � �������) ������� �����D������ ���%� 3,7/:7+� ������� ��� ��.���� ��� ������0
��� �������� ������ ��� �� �� �� �� �� �
.#� � ����� � � �#� '����� ��� ���� � � �� ��� �� � �� ����� +�#� )�����'���� �#������
���� � ��� '���� �#��� ��� # ��� ��� ��)�� �� ����% � .#� �� %�� .<= � ��������� �� �� �����
+�#� # ���� �#��� ��� )�����'��� ��� ��������� �� +���� �� �# �� �� �#������ ���� � �� ��� '���
�� +���� !� �� ����������� �� +����� � ��� !� �#� �� ��� �� � � ��������� �� � � ��0�����
� ����� � ��� ����� � "��� � ���� E�������� ��������� � �#� � ��� ���� ��� ��)�� �� ����%
6.�'�� 8�
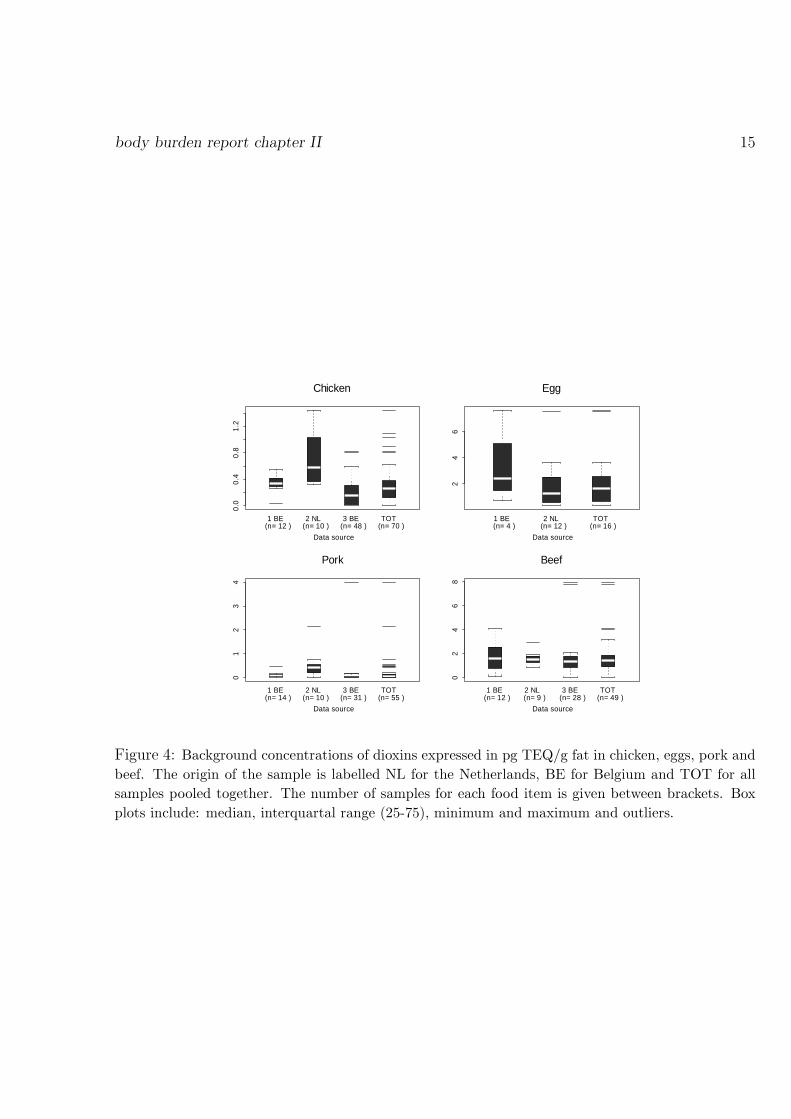
���� ������ ���� �� �� �� (
0.0
0.4
0.8
1.2
1 BE (n= 12 )
2 NL (n= 10 )
3 BE (n= 48 )
TOT (n= 70 )
Chicken
Data source
24
6
1 BE (n= 4 )
2 NL (n= 12 )
TOT (n= 16 )
Egg
Data source
01
23
4
1 BE (n= 14 )
2 NL (n= 10 )
3 BE (n= 31 )
TOT (n= 55 )
Pork
Data source
02
46
8
1 BE (n= 12 )
2 NL (n= 9 )
3 BE (n= 28 )
TOT (n= 49 )
Beef
Data source
������ !9 ����%� ��� � ��������� � � �� .�� �.����� �� �% 1'A6% ��� �� �������� �%%� � �� ���&���0 1�� ��%�� � ��� ����� � ��&����� 2B � � ��� 2���������� �' � � ���%��� ��� 1C1 � � ���
����� � ��� � %�����0 1�� ���&�� � ����� � � ���� � � ���� � %�#�� &������ &������0 � .
�� � �������) ������� �����D������ ���%� 3,7/:7+� ������� ��� ��.���� ��� ������0
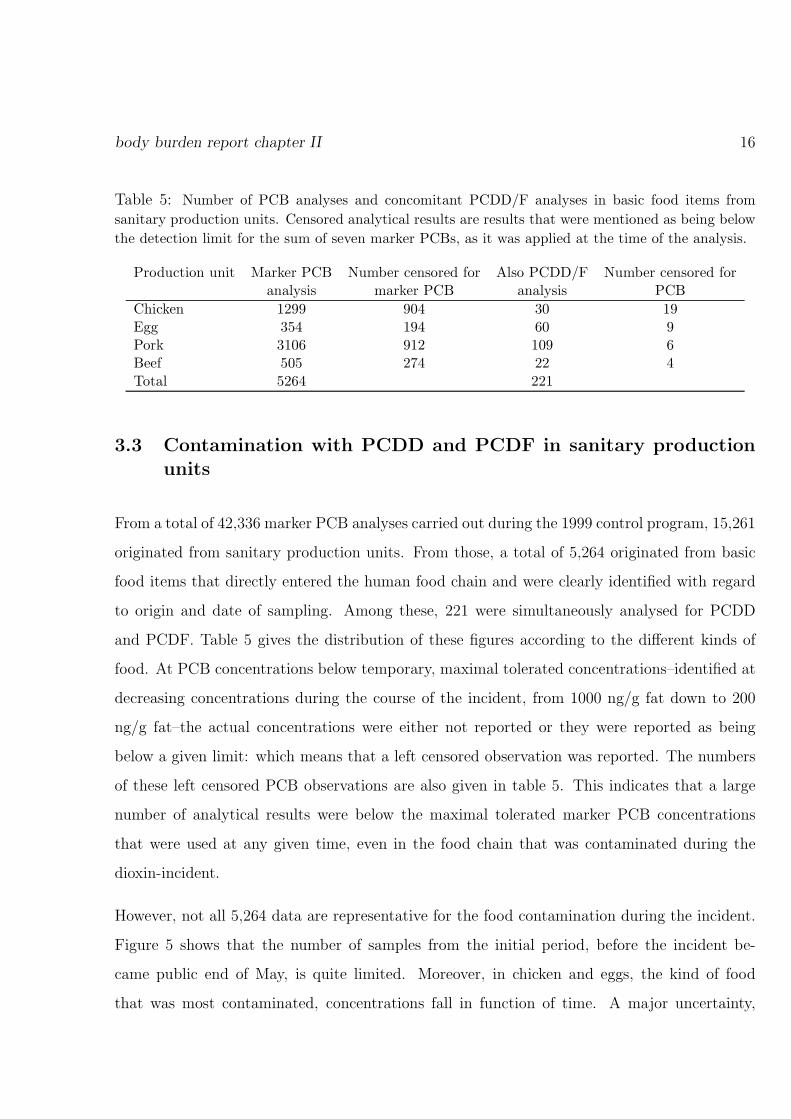
���� ������ ���� �� �� �� �
.�'�� (9 2��&�� � ;�� ������ ��� � �� ������ ;���6( ������ �� &��� � � ���� �� �
������� �� ����� � ����0 ��� ��� ���������� ����� ��� ����� ���� ���� ����� ��� � &���% &�� �
��� ������� � ����� � � ��� �� � �#�� ������ ;��� � �� �� ������� �� ��� ���� � ��� ������0
;� ����� � ���� ������ ;�� 2��&�� ��� ��� � � $� ;���6( 2��&�� ��� ��� � ������� ������ ;�� ������ ;��
������� *,<< <9= -9 *<'%% -7= *<= >9 <; �� -*9> <*, *9< >���� 797 ,:= ,, =1 ��� 7,>= ,,*
��� ������ ��� �� ! �� �� �� �� � � ��� ��" ����� ��
�� ��
�� � � � ��� � !���� ������ ��� ����$��� ������� �� ������ �#� /// � ��� � �� ����� (��
��������� �� � �������$ �� ����� � ������ �� � �# ��� � � ��� � (��! ��������� �� � '����
� � ����� �#�� �������$ ������� �#� #���� � � �#��� ��� "��� ������$ ������+�� "��# ������
� ����� ��� ���� � ��������� �� �� �#���� "��� ��������� ���$ ����$��� � � ��
��� �� �� .�'�� ( ��)�� �#� ������'��� � � �#��� +����� ��� ����� � �#� ��0����� ����� �
� �� �� ��� � ��������� �� '�� " ���� ���$� ��%���� � ������� � ��������� ��1������+�� ��
���������� � ��������� �� ������ �#� � ���� � �#� ��������� �� � ��� ��A� ��� � "� � ��
��A� ���1�#� ������ � ��������� �� "��� ���#�� � � ��� ���� � �#�$ "��� ��� ���� �� '����
'�� " � ��)�� �����9 "#��# ����� �#�� � ���� ���� ��� '���)��� � "�� ��� ����� .#� ���'���
� �#��� ���� ���� ��� ��� '���)��� �� ��� ��� ��)�� �� ��'�� (� .#�� ��������� �#�� � �����
���'�� � ����$����� ������� "��� '�� " �#� ��%���� � ������� ������ ��� � ��������� ��
�#�� "��� ���� �� ��$ ��)�� ����� �)�� �� �#� � � �#��� �#�� "�� � ���������� ������ �#�
�� %��&���������
J "�)��� � � ��� (��! ���� ��� ������������)� � � �#� � � � ��������� � ������ �#� ���������
������ ( �# "� �#�� �#� ���'�� � ������� �� � �#� ������� ���� �� '�� �� �#� �������� '�&
���� ��'��� ��� � ��$� �� 3���� �������� � �� )��� �� �#����� ��� ����� �#� ���� � � �
�#�� "�� � �� � ����������� � ��������� �� ���� �� ������ � � ����� � ��, � ����������$�
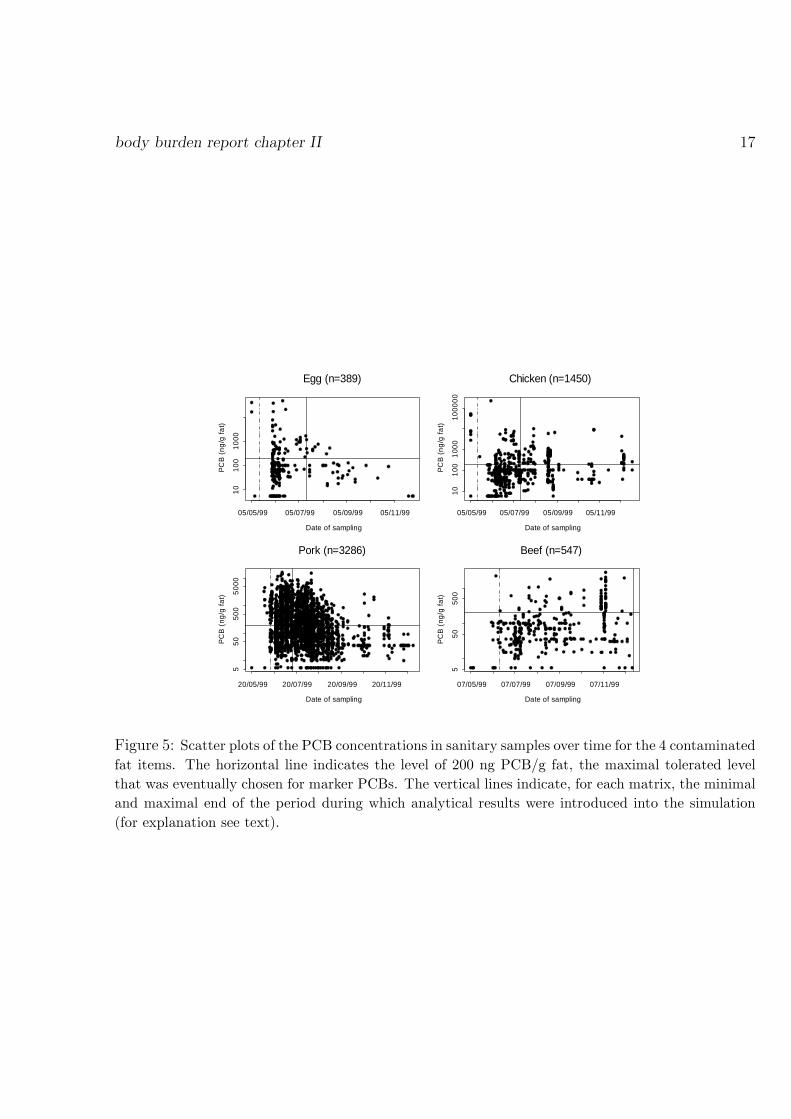
���� ������ ���� �� �� �� �
Egg (n=389)
Date of sampling
PC
B (
ng
/g f
at)
10
10
01
000
05/05/99 05/07/99 05/09/99 05/11/99
Chicken (n=1450)
Date of sampling
PC
B (
ng
/g f
at)
101
001
000
1000
00
05/05/99 05/07/99 05/09/99 05/11/99
Pork (n=3286)
Date of sampling
PC
B (
ng/g
fa
t)
55
050
05
000
20/05/99 20/07/99 20/09/99 20/11/99
Beef (n=547)
Date of sampling
PC
B (
ng/g
fa
t)
55
050
0
07/05/99 07/07/99 07/09/99 07/11/99
������ (9 ������� �� � � ��� ;�� � ��������� � �� ������� ����� #�� ���� � � ��� = � ����������
��� ����0 1�� � ��E ���� ���� �������� ��� ��#�� � ,99 �% ;��6% ���� ��� ��.���� � ������� ��#��
���� �� �#�������� �� �� � � ������ ;��0 1�� #������� ���� ��������� � � ���� �����.� ��� �������
��� ��.���� ��� � ��� ���� � �����% ����� ���������� ����� ���� ���� ����� ��� ��� ������� �
3� � �.������� � �� ��.�+0
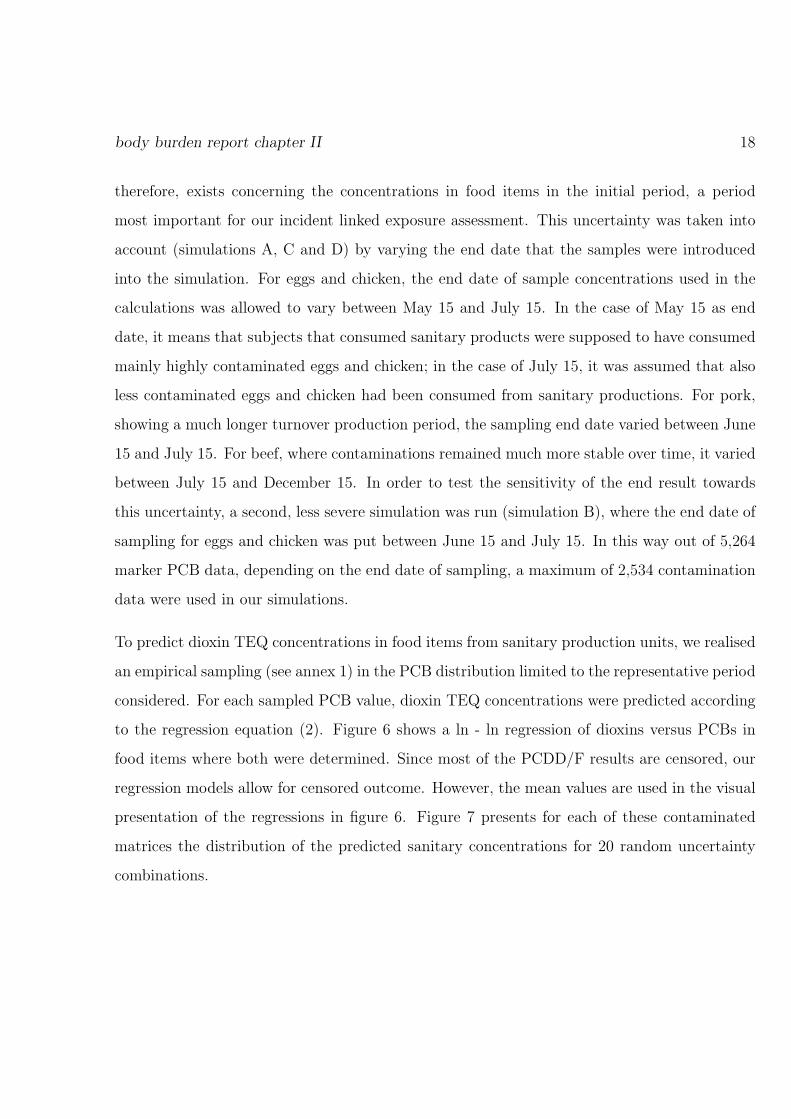
���� ������ ���� �� �� �� -
�#���� ��� �%���� � �������� �#� � ��������� �� �� � � ����� �� �#� ������� ���� �� � ���� �
� �� ��� ����� � � �� �������� ������ �%� ���� ����������� .#�� ����������$ "�� ����� ���
��� ��� 6�������� �� �� � ��� 8 '$ )��$��� �#� ��� ���� �#�� �#� ������� "��� ���� �����
��� �#� �������� �� � � ���� ��� �#������ �#� ��� ���� � ������ � ��������� �� ���� �� �#�
��������� �� "�� ��� "�� � )��$ '��"��� ��$ ( ��� D��$ (� *� �#� ���� � ��$ ( �� ���
����� �� ����� �#�� ��',���� �#�� � ������ �������$ �� ����� "��� ���� ��� � #�)� � ������
�����$ #��#�$ � ���������� ���� ��� �#�����; �� �#� ���� � D��$ (� �� "�� ������� �#�� ���
���� � ���������� ���� ��� �#����� #�� '��� � ������ �� � �������$ �� ����� ��� � � � ���
�# "��� � ���# � ���� ���� )�� �� ����� � ���� �� �#� �������� ��� ���� )����� '��"��� D���
( ��� D��$ (� � � '���� "#��� � ��������� �� �������� ���# � �� ���'�� )�� ����� �� )�����
'��"��� D��$ ( ��� ����'�� (� *� ���� � ���� �#� �������)��$ � �#� ��� ������ � "����
�#�� ����������$� � ��� ��� ���� ��)��� �������� � "�� ��� 6�������� � �8� "#��� �#� ��� ���� �
�������� � � ���� ��� �#����� "�� ��� '��"��� D��� ( ��� D��$ (� *� �#�� "�$ �� � (��!
������ ��� ����� ��������� � �#� ��� ���� � ��������� � ��%���� � �(�! � ��������� �
���� "��� ���� �� �� �������� ���
. ������� �� %�� .<= � ��������� �� �� � � ����� �� � �������$ �� ����� � ������ "� ��������
�� ��������� �������� 6��� ����% 8 �� �#� ��� ������'��� � ������� � �#� ������������)� ���� �
� ��������� � � ���# ������� ��� )����� �� %�� .<= � ��������� �� "��� ��������� ��� �����
� �#� �������� � �3���� � 68� ������ � �# "� � �� & �� �������� � � �� %��� )����� ���� ��
� � ����� "#��� ' �# "��� ����������� B���� � �� � �#� �� A� ������� ��� ���� ���� ��
�������� � � ���� ��� " � � ���� ��� ��� ��� J "�)��� �#� ���� )����� ��� ���� �� �#� )�����
���������� � � �#� �������� �� �� +���� �� ������ � �������� � � ���# � �#��� � ����������
�������� �#� ������'��� � � �#� ��������� �������$ � ��������� �� � � � ���� � ����������$
� �'����� ���
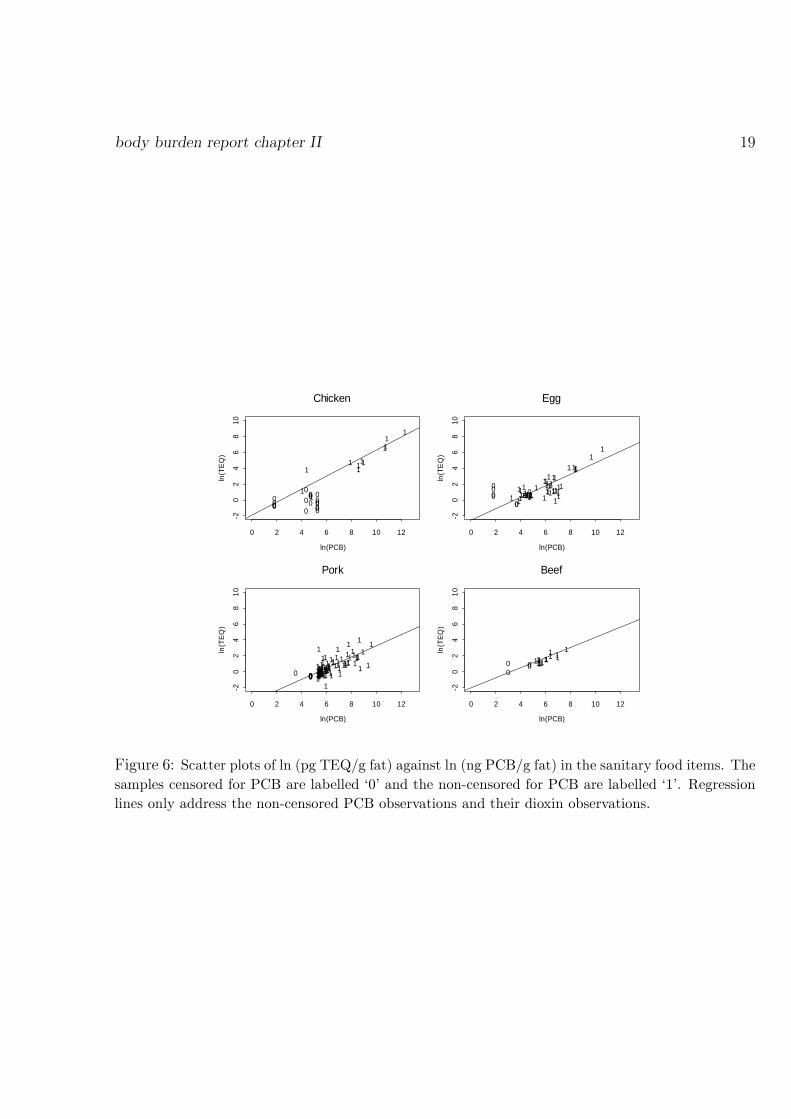
���� ������ ���� �� �� �� /
Chicken
ln(PCB)
ln(T
EQ
)
0 2 4 6 8 10 12
-20
24
68
10
11
1
1
0
1
1 1
0 0
111
0
0 0 0 0 0
1 0 0
0 0 01 0
0 0 0 0
Egg
ln(PCB)
ln(T
EQ
)
0 2 4 6 8 10 12
-20
24
68
10
1
1
11
11
1
11
1
11111
111 111
1
1 0 0 0
111
11
111
1
1 0 011
11
11 0 111 01 1
1 1
11 0
11 0
1
Pork
ln(PCB)
ln(T
EQ
)
0 2 4 6 8 10 12
-20
24
68
10
1 1
111
11 11
11 1
1111 11 1
1
11 11
1
1
1 0 1111111
1 11
1
1
1
1 11
11111
1111
1
111 1
1 111
1
11111 1
11 1
1
1
1
1 11
1
11111111
11
11
1
11 0 0 0 111111 11
0 01
1
Beef
ln(PCB)
ln(T
EQ
)
0 2 4 6 8 10 12
-20
24
68
10
1 0 1 1111 11
11 11
11
0
111 0 0
������ �9 ������� �� � � �� 3�% 1'A6% ���+ �%���� �� 3�% ;��6% ���+ �� ��� ������� � � ����0 1������� ��� ��� � � ;�� ��� ��&����� F9G ��� ��� � �/��� ��� � � ;�� ��� ��&����� F*G0 5�%��� �
���� ��� ����� ��� � �/��� ��� ;�� &��#��� � ��� ����� �� .�� &��#��� �0
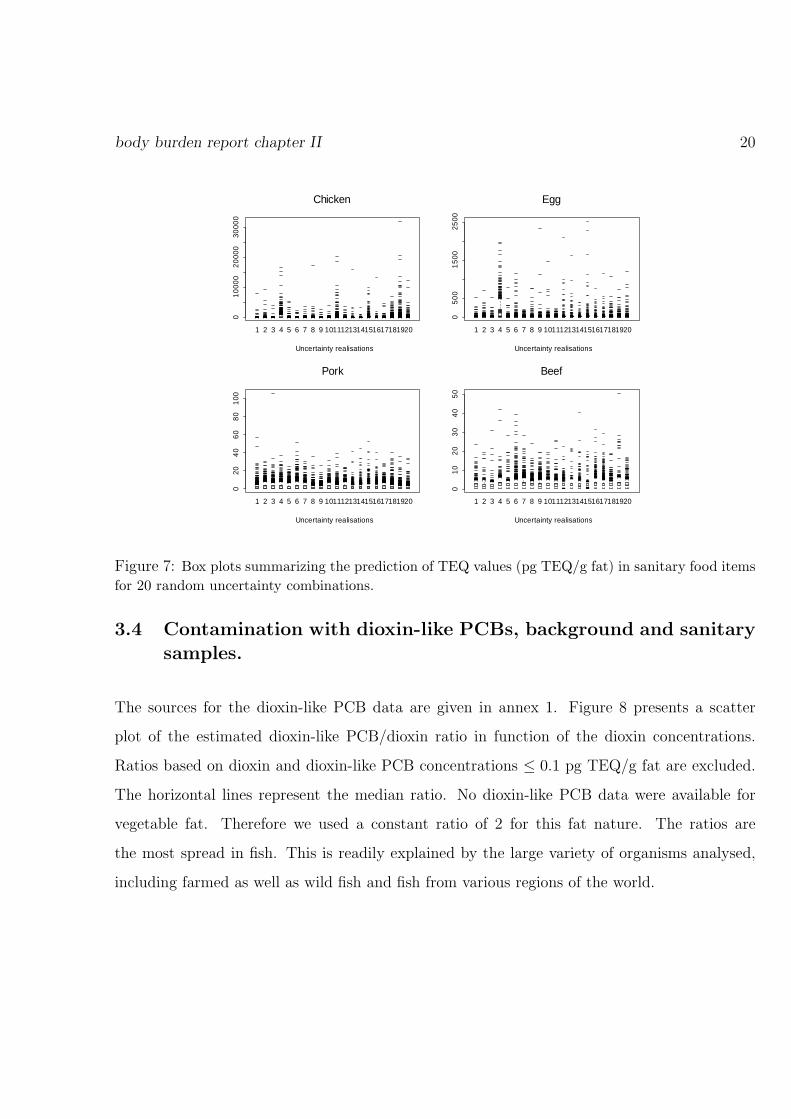
���� ������ ���� �� �� �� �
01
000
02
000
030
000
1 2 3 4 5 6 7 8 9 1011121314151617181920
Chicken
Uncertainty realisations
05
00
15
0025
00
1 2 3 4 5 6 7 8 9 1011121314151617181920
Egg
Uncertainty realisations
020
40
60
80
100
1 2 3 4 5 6 7 8 9 1011121314151617181920
Pork
Uncertainty realisations
01
02
03
04
05
0
1 2 3 4 5 6 7 8 9 1011121314151617181920
Beef
Uncertainty realisations
������ �9 � . �� � ������E��% ��� �������� � � 1'A #���� 3�% 1'A6% ���+ �� ������� � � ����
� � ,9 ���� � ����������� � �&����� �0
��� ������ ��� �� ! �� �# �$� �� ����% &������� �� ��� ��"
��������
.#� � ����� � � �#� �� %��&���� ��� ���� ��� ��)�� �� ����% � ������ - �������� � �������
�� � � �#� ��������� �� %��&���� ���A�� %�� ���� �� ������ � � �#� �� %�� � ��������� ���
M��� � '���� � �� %�� ��� �� %��&���� ��� � ��������� �� � �� �� .<=A� ��� ��� �%�������
.#� # ��2 ���� ����� ��������� �#� ������ ���� � E �� %��&���� ��� ���� "��� �)����'�� � �
)�����'�� ���� .#���� �� "� ���� � � ������ ���� � � � �#�� ��� ������� .#� ���� � ���
�#� � �� ������ �� +�#� .#�� �� ������$ �%������� '$ �#� ����� )�����$ � �������� ����$����
��������� ������ �� "��� �� "��� +�# ��� +�# �� � )��� �� ���� �� � �#� " ����

���� ������ ���� �� �� ��
Milk
TEQ dioxin (pg/g f at)
Rat
io
1.4 1.5 1.6
24
68
1012
Egg
TEQ dioxin (pg/g f at)
Rat
io
2 4 6
24
68
1012
Fish
TEQ dioxin (pg/g f at)
Rat
io
0 20 40 60 80
24
68
1012
Horse
TEQ dioxin (pg/g f at)R
atio
5 10 15
24
68
1012
Sheep
TEQ dioxin (pg/g f at)
Rat
io
0.5 1.0 1.5 2.0 2.5
24
68
1012
Beef
TEQ dioxin (pg/g f at)
Rat
io
0 2 4 6 8
24
68
1012
Pork
TEQ dioxin (pg/g f at)
Rat
io
0 1 2 3 4
24
68
1012
Chicken
TEQ dioxin (pg/g f at)
Rat
io
0.2 0.4 0.6 0.8
24
68
1012
������ -9 ������� �� � � ��� ���� � � ��� �� .��/���� � ��������� � ;���6;��( � ��������� �
�� � ���� � �����0 1�� � ��E ���� ���� �������� ��� ������ ���� 0 �� ��� @%��� � ���� � �� ���
������� �� ��� ���� &��� � �� .�� ��� �� .��/���� ;�� � ��������� � � 9* �% 1'A6% ��� ����
���0
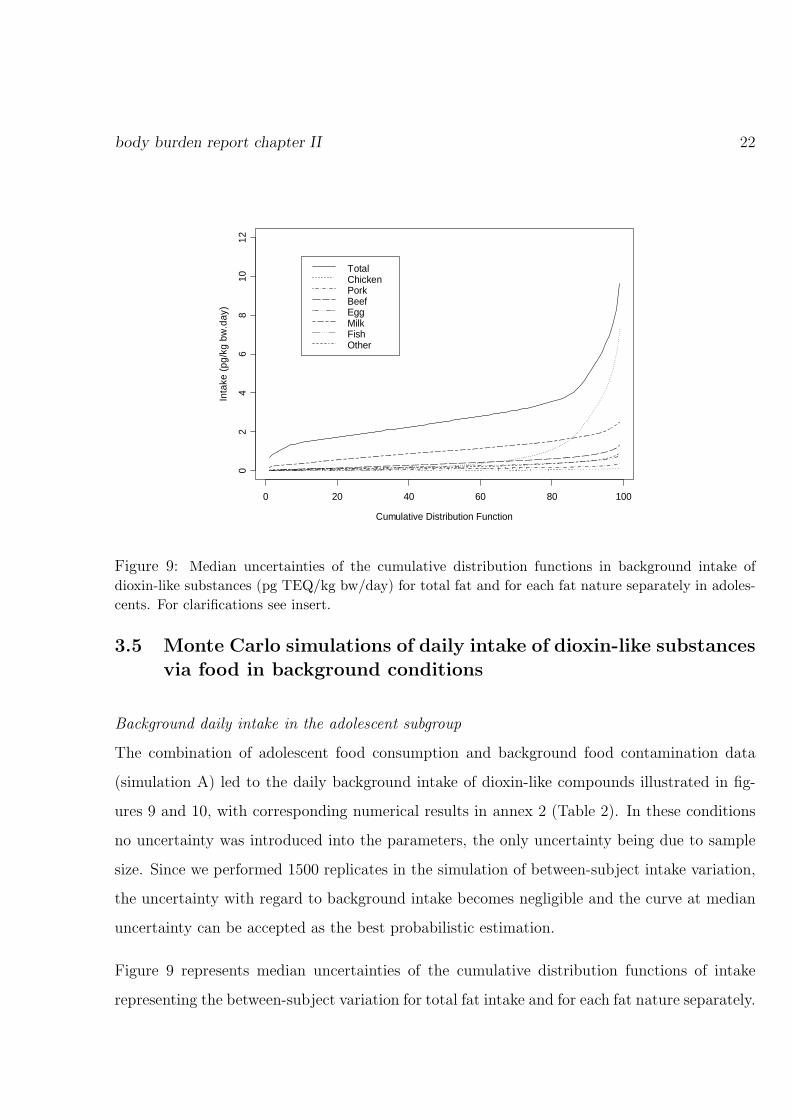
���� ������ ���� �� �� ��
Cumulative Distribution Function
Inta
ke (
pg/k
g bw
.day
)
0 20 40 60 80 100
02
46
810
12
TotalChickenPorkBeefEggMilkFishOther
������ /9 ������ ������������ � ��� ��������#� �����&��� � ������ � �� &���%� ��� ������ �
�� .��/���� �&����� 3�% 1'A6�% &�6���+ � � � ��� ��� ��� � � ���� ��� ������ ��������� �� �� ��/
����0 ( � �����@���� � �� �����0
��� ����� ���� � ����� ��� �� � �" ����� �� �# �$� �� ��&�������
' � ��� � &������� ��� � ���
���������� ����� ����� �� �� ��������� �������
.#� � �'����� � � �� ������� � � � ������� � ��� '����� ��� � � � ��������� � ����
6�������� � �8 ��� � �#� ����$ '����� ��� ������ � �� %��&���� � �� ���� ����������� �� +�&
���� / ��� �� "��# � ����� ����� ��������� ������� �� ����% 6.�'�� 8� *� �#��� � ����� ��
� ����������$ "�� ���� ����� ��� �#� ����������� �#� ��$ ����������$ '���� ��� � ������
��2�� B���� "� ���� ���� (�� ���������� �� �#� �������� � � '��"���&��',��� ������ )������ ��
�#� ����������$ "��# ������ � '����� ��� ������ '�� ��� �������'�� ��� �#� ���)� �� ������
����������$ ��� '� �������� �� �#� '��� �� '�'������� �������� ��
������ / ���������� ������ ������������� � �#� ��������)� ������'��� � ������ �� � ������
������������ �#� '��"���&��',��� )������ � � � � ��� ��� ������ ��� � � ���# ��� ������ ���������$�
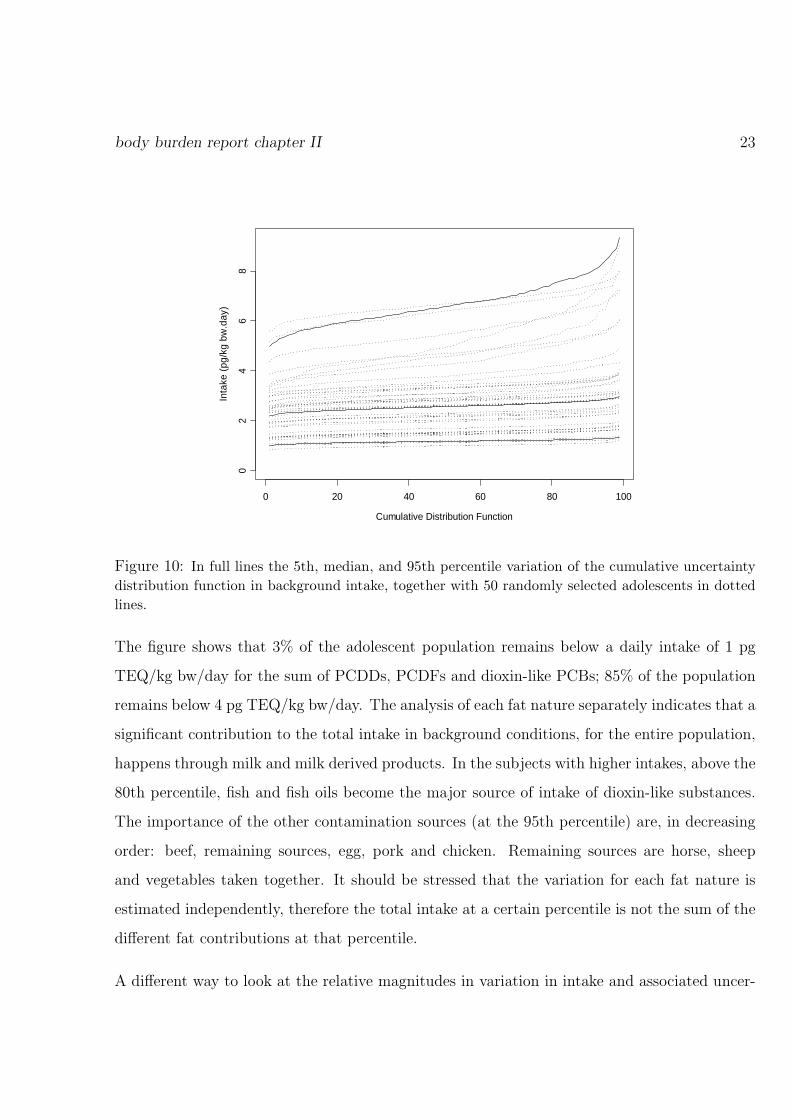
���� ������ ���� �� �� �� �
Cumulative Distribution Function
Inta
ke (
pg/k
g bw
.day
)
0 20 40 60 80 100
02
46
8
������ �9 �� ���� ���� ��� 7��� ������� ��� <7�� ���������� #������ � � ��� ��������#� �����������
�����&��� � ������ � �� &���%� ��� ������� � %����� ���� 79 ���� ��� ������� �� ������ �� � ����
����0
.#� +���� �# "� �#�� �N � �#� �� ������� � ������ � ������� '�� " � ����$ ������ � ��
.<=A�� '"A��$ � � �#� ��� � �� �� �� �� ��� �� %��&���� ����; -(N � �#� � ������ �
������� '�� " ! �� .<=A�� '"A��$� .#� ����$��� � ���# ��� ������ ���������$ ��������� �#�� �
�����+���� � ����'��� � � �#� � ��� ������ �� '����� ��� � ����� ��� � � �#� ������ � ������ ��
#������ �#� ��# ���� ��� ���� ����)�� �� ������ *� �#� ��',���� "��# #��#�� �������� �' )� �#�
-��# ����������� +�# ��� +�# ��� '�� �� �#� ��, � � ���� � ������ � �� %��&���� ��'��������
.#� ��� ������ � �#� �#�� � ��������� � � ����� 6�� �#� /(�# ����������8 ���� �� ����������
����9 '���� ��������� � ������ ���� � �� ��� �#������ M�������� � ����� ��� # ���� �#���
��� )�����'��� ����� � ���#��� *� �# ��� '� �������� �#�� �#� )������ � � � ���# ��� ������ ��
��������� ������������$� �#���� �� �#� � ��� ������ �� � ������� ���������� �� � � �#� ��� � �#�
��0����� ��� � ����'��� �� �� �#�� �����������
� ��0����� "�$ � � � �� �#� ������)� ���������� �� )������ � �� ������ ��� ��� ������ �����&
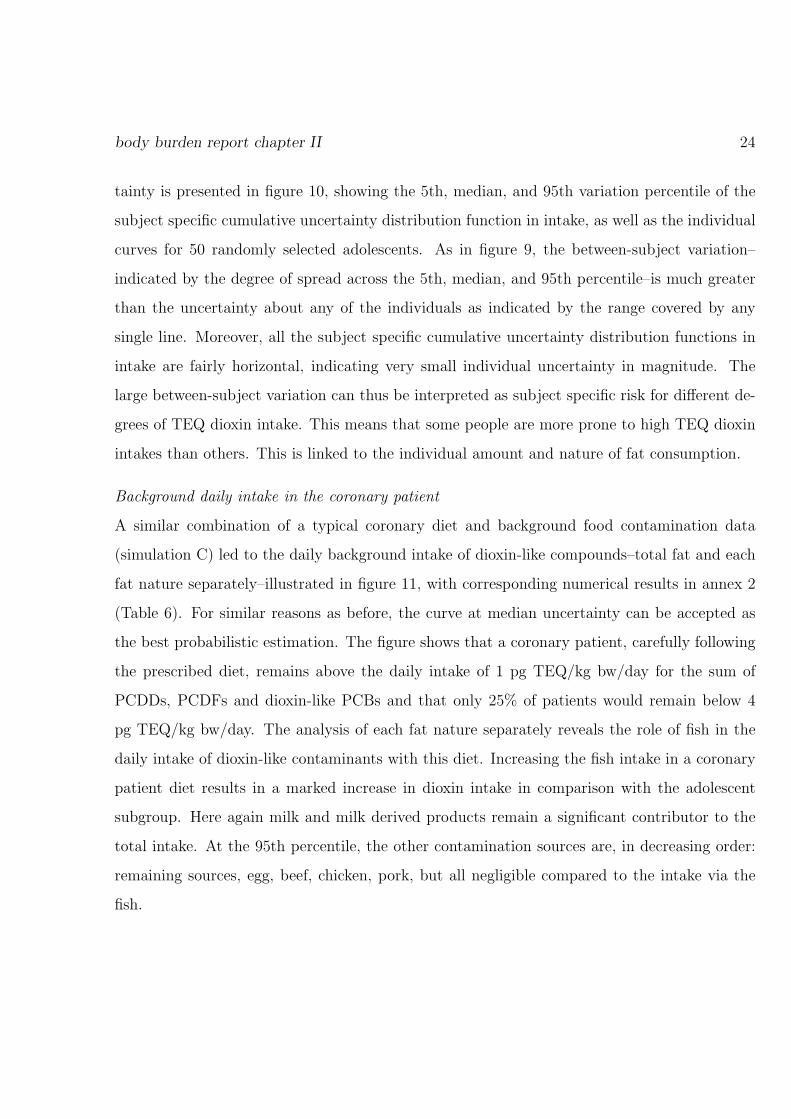
���� ������ ���� �� �� �� !
�����$ �� ��������� �� +���� �� �# "��� �#� (�#� ������� ��� /(�# )������ � ���������� � �#�
��',��� �����+� ��������)� ����������$ ������'��� � ������ � �� ������� �� "��� �� �#� ����)�����
���)�� � � (� ���� ��$ �������� �� ��������� �� �� +���� /� �#� '��"���&��',��� )������ �1
��������� '$ �#� ������ � ������ ��� �� �#� (�#� ������� ��� /(�# ����������1�� ���# �������
�#�� �#� ����������$ �' �� ��$ � �#� ����)������ �� ��������� '$ �#� ����� � )���� '$ ��$
������ ����� � �� )��� ��� �#� ��',��� �����+� ��������)� ����������$ ������'��� � ������ �� ��
������ ��� �����$ # ��2 ����� ���������� )��$ ����� ����)����� ����������$ �� ���������� .#�
����� '��"���&��',��� )������ � ��� �#�� '� ����������� �� ��',��� �����+� ���� � � ��0����� ��&
����� � .<= �� %�� ������� .#�� ����� �#�� � �� �� ��� ��� � �� �� �� � #��# .<= �� %��
������� �#�� �#���� .#�� �� ������ � �#� ����)����� �� ��� ��� ������ � ��� � ������� ��
���������� ����� ����� �� �� �������� ����
� ������� � �'����� � � � �$����� � � ���$ ���� ��� '����� ��� � � � ��������� � ����
6�������� � �8 ��� � �#� ����$ '����� ��� ������ � �� %��&���� � �� ����1� ��� ��� ��� ���#
��� ������ ���������$1����������� �� +���� � "��# � ����� ����� ��������� ������� �� ����%
6.�'�� �8� � � ������� ���� �� �� '�� ��� �#� ���)� �� ������ ����������$ ��� '� �������� ��
�#� '��� �� '�'������� �������� �� .#� +���� �# "� �#�� � � � ���$ �������� ��������$ � �� "���
�#� �������'�� ����� ������� �' )� �#� ����$ ������ � �� .<=A�� '"A��$ � � �#� ��� �
�� �� �� �� ��� �� %��&���� ���� ��� �#�� ��$ (N � �������� " ��� ������ '�� " !
�� .<=A�� '"A��$� .#� ����$��� � ���# ��� ������ ���������$ ��)���� �#� � �� � +�# �� �#�
����$ ������ � �� %��&���� � ���������� "��# �#�� ����� *��������� �#� +�# ������ �� � � � ���$
������� ���� ������� �� � ������ �������� �� �� %�� ������ �� � ������ � "��# �#� �� �������
��'�� ��� J��� ����� ���� ��� ���� ����)�� �� ����� ������ � �����+���� � ����'�� � � �#�
� ��� ������� �� �#� /(�# ����������� �#� �#�� � ��������� � � ����� ���� �� ���������� ����9
��������� � ������ ���� '���� �#������ � ��� '�� ��� �������'�� � ������ � �#� ������ )�� �#�
+�#�
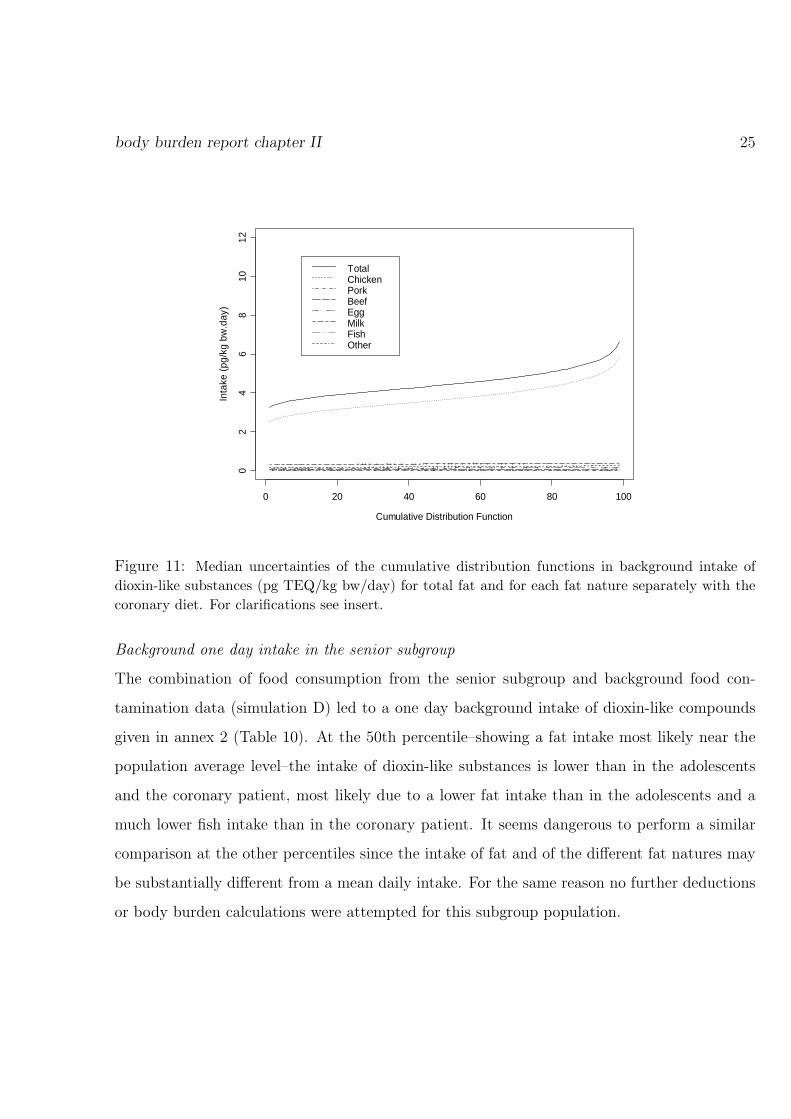
���� ������ ���� �� �� �� (
Cumulative Distribution Function
Inta
ke (
pg/k
g bw
.day
)
0 20 40 60 80 100
02
46
810
12
TotalChickenPorkBeefEggMilkFishOther
������ 9 ������ ������������ � ��� ��������#� �����&��� � ������ � �� &���%� ��� ������ �
�� .��/���� �&����� 3�% 1'A6�% &�6���+ � � � ��� ��� ��� � � ���� ��� ������ ��������� ���� ���
� � ���� ����0 ( � �����@���� � �� �����0
���������� ��� ��� ����� �� �� ������ �������
.#� � �'����� � � � � � ������� � �� � �#� ���� � ��'�� �� ��� '����� ��� � � � �&
�������� � ���� 6�������� � 8 ��� � � �� ��$ '����� ��� ������ � �� %��&���� � �� ����
��)�� �� ����% 6.�'�� �8� �� �#� (��# ����������1�# "��� � ��� ������ � �� �����$ ���� �#�
� ������ � �)����� ��)��1�#� ������ � �� %��&���� ��'������� �� � "�� �#�� �� �#� �� ��������
��� �#� � � ���$ �������� � �� �����$ ��� � � � "�� ��� ������ �#�� �� �#� �� �������� ��� �
���# � "�� +�# ������ �#�� �� �#� � � ���$ �������� *� ����� ������ �� � ���� �� � �������
� ������ � �� �#� �#�� ����������� ����� �#� ������ � ��� ��� � �#� ��0����� ��� ������� ��$
'� ��'���������$ ��0����� �� � � ���� ����$ ������� � � �#� ���� ���� � � ����#�� ������� ��
� ' �$ '����� ��������� �� "��� ��������� � � �#�� ��'�� �� � ������ ��
���� ������ ���� �� �� �� �
Cumulative Distribution Function
Inta
ke (
pg/k
g bw
.day
)
0 20 40 60 80 100
05
1015
20
������ 9 74 3� ��� ����� ����+� ������ 3����� ���� ����+� ��� <74 3����� ����� ����+ ������������
� ��� ��������#� �����&��� � ������ � �� �������� � ��� 1'A ������ 3�%6�% &�6���+� � %����� ����
��� ������ &���%� ��� ������ ���#� 3� ��� ���� ����+ �� �� ������0 � ��E ���� � ���� ���� ��������
��� ��C ��� ������� 1�� � * ��� = �%6�% &�6���0
��( ����� ���� � ����� ��� �� � �" ����� �� �# �$� �� ��&�������
' � ��� � �� ��� ���� �� �# �$ �� ���
������� ����� ����� �� �� ��������� �������
*��� ������ �������� � ��������� � ���� � � �#������ ���� � �� ��� '���� ��� '����� ��� � �&
�������� � ���� � � ����� +�#� )�����'���� �#��� ��� # ��� �� �������� � � ��� � �#� ��������
����$ ������ � �� %��&���� � ���������� ����������� �� +����� � !� "��# � ����� ����� ��&
������� ������� �� ����% 6.�'��� �&(8� 7#��� �#� ������� ��������� ���� "����� � � ��� � ���'��
����������$ � �'����� ��� �#� ���)� �� ������ ����������$ ���������� �#� � �� �����$ ������� ��
.#� (N ��� /(N ����������$ ���)�� ��������� �#� (N � "�� ��� /(N ����� ' ��� �� '�'�������
� �%� ���� � � "�� � #��#�� ������� � � ��������� ��
������ ������$ ��������� �#� '��"���&��',��� )������ � �� �������� ������ "��#�� �#�� �� ��
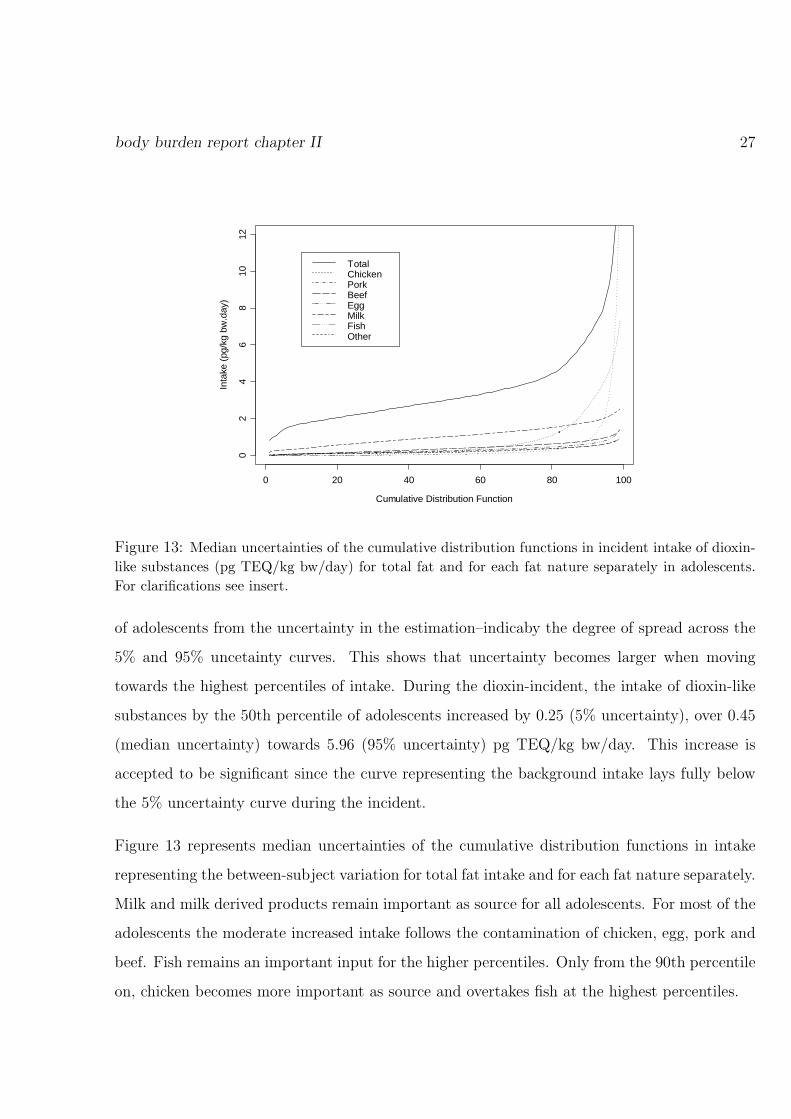
���� ������ ���� �� �� �� �
Cumulative Distribution Function
Inta
ke (
pg/k
g bw
.day
)
0 20 40 60 80 100
02
46
810
12
TotalChickenPorkBeefEggMilkFishOther
������ �9 ������ ������������ � ��� ��������#� �����&��� � ������ � �� �������� ������ � �� .��/
���� �&����� 3�% 1'A6�% &�6���+ � � � ��� ��� ��� � � ���� ��� ������ ��������� �� �� ������0
( � �����@���� � �� �����0
� �� �������� �� � �#� ����������$ �� �#� �������� �1������'$ �#� ������ � ������ ��� �� �#�
(N ��� /(N ���������$ ���)��� .#�� �# "� �#�� ����������$ '�� ��� ������ "#�� � )���
� "���� �#� #��#��� ����������� � ������� ����� �#� �� %��&��������� �#� ������ � �� %��&����
��'������� '$ �#� (��# ���������� � �� �������� ��������� '$ ��( 6(N ����������$8� )�� ��!(
6������ ����������$8 � "���� (�/� 6/(N ����������$8 �� .<=A�� '"A��$� .#�� �������� ��
�������� � '� �����+���� ����� �#� ���)� ������������ �#� '����� ��� ������ ��$� ����$ '�� "
�#� (N ����������$ ���)� ������ �#� ���������
������ � ���������� ������ ������������� � �#� ��������)� ������'��� � ������ �� �� ������
������������ �#� '��"���&��',��� )������ � � � � ��� ��� ������ ��� � � ���# ��� ������ ���������$�
���� ��� ���� ����)�� �� ����� ������ ��� ����� �� � ���� � � ��� �� ��������� � � � �� � �#�
�� �������� �#� � ������ ��������� ������ � �� "� �#� � ��������� � � �#������ ���� � �� ���
'���� ���# ������� �� ��� ����� ����� � � �#� #��#�� ������������ I��$ �� � �#� /��# ����������
�� �#����� '�� ��� � �� ��� ����� �� � ���� ��� )������� +�# �� �#� #��#��� ������������
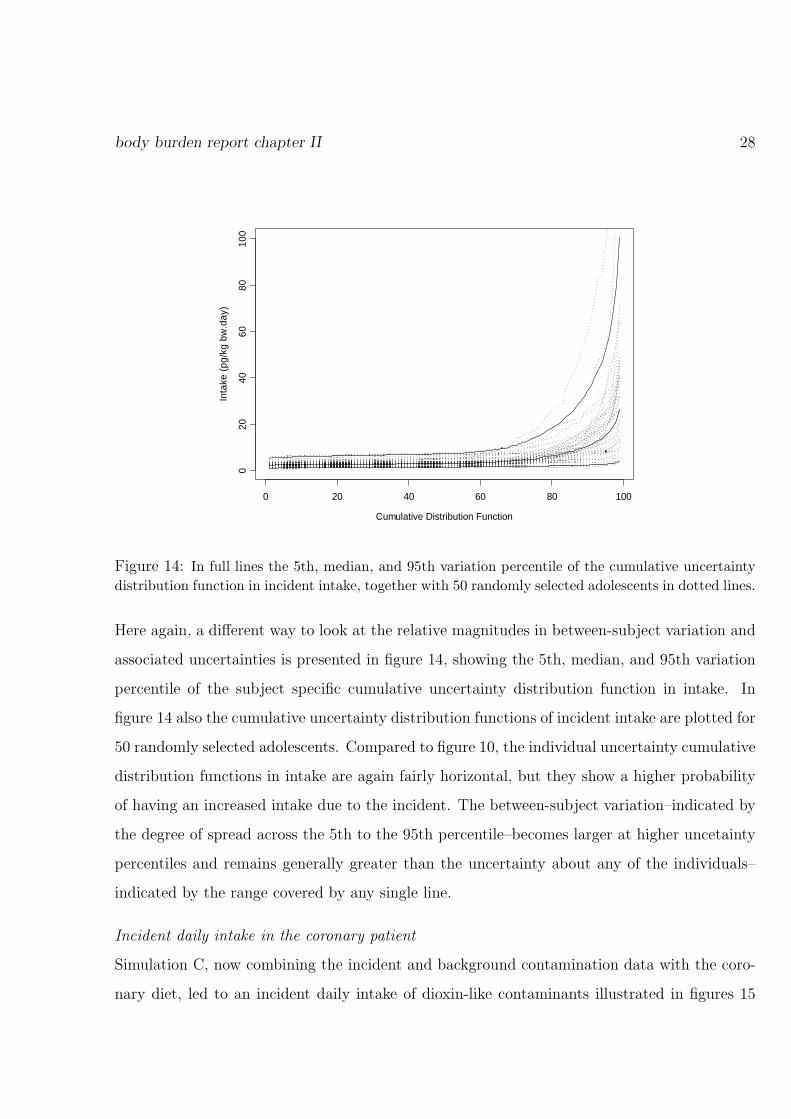
���� ������ ���� �� �� �� -
Cumulative Distribution Function
Inta
ke (
pg/k
g bw
.day
)
0 20 40 60 80 100
020
4060
8010
0
������ !9 �� ���� ���� ��� 7��� ������� ��� <7�� #������ � ���������� � ��� ��������#� �����������
�����&��� � ������ � �� �������� ������� � %����� ���� 79 ���� ��� ������� �� ������ �� � ���� ����0
J��� ������ � ��0����� "�$ � � � �� �#� ������)� ���������� �� '��"���&��',��� )������ � ���
��� ������ ������������� �� ��������� �� +���� !� �# "��� �#� (�#� ������� ��� /(�# )������ �
���������� � �#� ��',��� �����+� ��������)� ����������$ ������'��� � ������ � �� ������� *�
+���� ! ��� �#� ��������)� ����������$ ������'��� � ������ �� � �������� ������ ��� �� ���� � �
(� ���� ��$ �������� �� ��������� � ������ � +���� �� �#� ����)����� ����������$ ��������)�
������'��� � ������ �� �� ������ ��� ����� �����$ # ��2 ����� '�� �#�$ �# " � #��#�� �� '�'����$
� #�)��� �� ��������� ������ ��� � �#� ��������� .#� '��"���&��',��� )������ �1��������� '$
�#� ������ � ������ ��� �� �#� (�# � �#� /(�# ����������1'�� ��� ������ �� #��#�� ���������$
����������� ��� ������� ��������$ ������� �#�� �#� ����������$ �' �� ��$ � �#� ����)������1
��������� '$ �#� ����� � )���� '$ ��$ ������ �����
������� ����� ����� �� �� �������� ����
B������� � �� � " � �'����� �#� �������� ��� '����� ��� � ��������� � ���� "��# �#� � � &
���$ ����� ��� � �� �������� ����$ ������ � �� %��&���� � ���������� ����������� �� +����� (
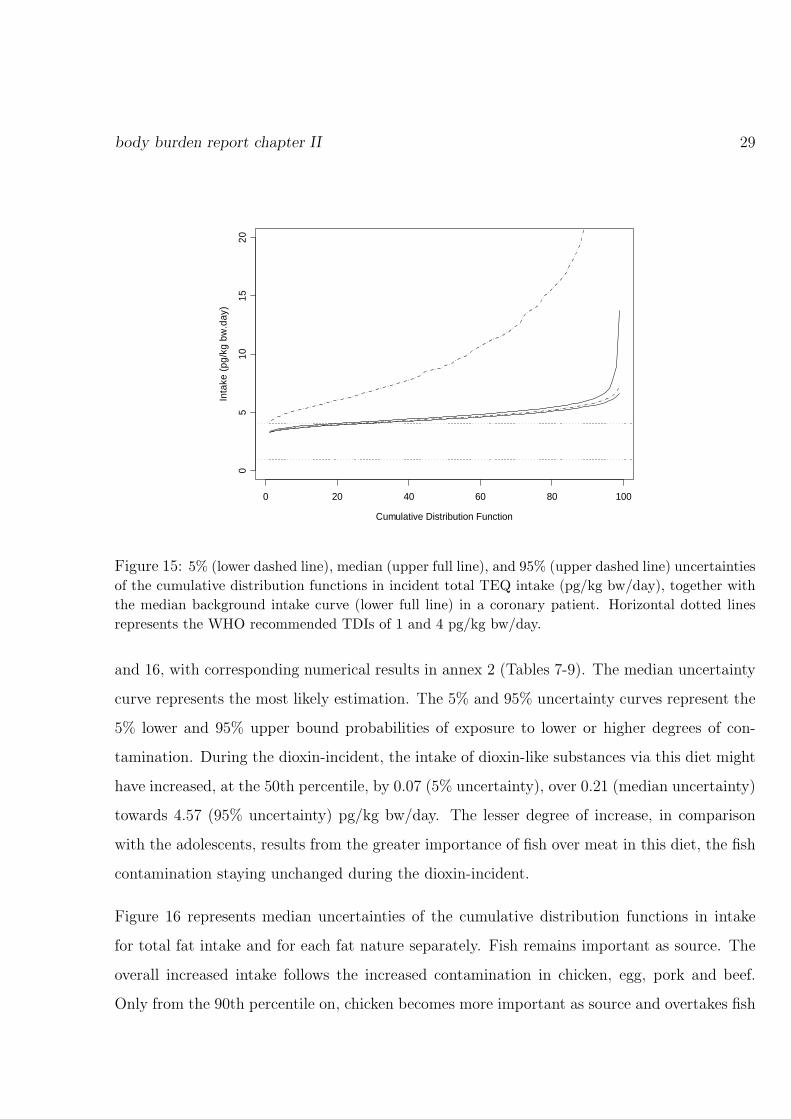
���� ������ ���� �� �� �� /
Cumulative Distribution Function
Inta
ke (
pg/k
g bw
.day
)
0 20 40 60 80 100
05
1015
20
������ (9 74 3� ��� ����� ����+� ������ 3����� ���� ����+� ��� <74 3����� ����� ����+ ������������
� ��� ��������#� �����&��� � ������ � �� �������� � ��� 1'A ������ 3�%6�% &�6���+� � %����� ����
��� ������ &���%� ��� ������ ���#� 3� ��� ���� ����+ �� � � � ���� �������0 � ��E ���� � ���� ����
�������� ��� ��C ��� ������� 1�� � * ��� = �%6�% &�6���0
��� �� "��# � ����� ����� ��������� ������� �� ����% 6.�'��� �&/8� .#� ������ ����������$
���)� ���������� �#� � �� �����$ �������� �� .#� (N ��� /(N ����������$ ���)�� ��������� �#�
(N � "�� ��� /(N ����� ' ��� �� '�'������� � �%� ���� � � "�� � #��#�� ������� � � �&
�������� �� ����� �#� �� %��&��������� �#� ������ � �� %��&���� ��'������� )�� �#�� ���� ���#�
#�)� ���������� �� �#� (��# ����������� '$ ���� 6(N ����������$8� )�� �� 6������ ����������$8
� "���� !�(� 6/(N ����������$8 ��A�� '"A��$� .#� ������ ������ � ��������� �� � ������ �
"��# �#� �� ��������� ������� �� � �#� ������� ��� ������ � +�# )�� ���� �� �#�� ����� �#� +�#
� ��������� � ���$��� ���#����� ������ �#� �� %��&���������
������ � ���������� ������ ������������� � �#� ��������)� ������'��� � ������ �� �� ������
� � � ��� ��� ������ ��� � � ���# ��� ������ ���������$� ���# ������� ��� ����� �� � ����� .#�
)����� ��������� ������ � �� "� �#� ��������� � ��������� � �� �#������ ���� � �� ��� '����
I��$ �� � �#� /��# ���������� �� �#����� '�� ��� � �� ��� ����� �� � ���� ��� )������� +�#
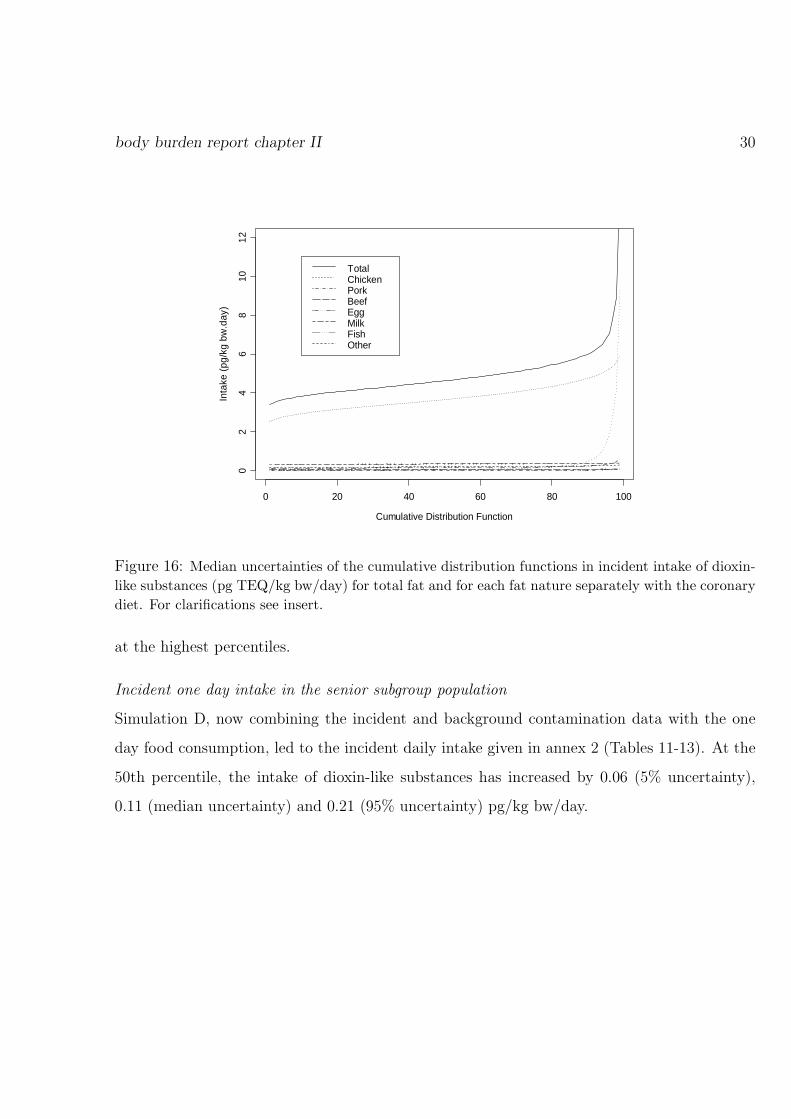
���� ������ ���� �� �� �� ��
Cumulative Distribution Function
Inta
ke (
pg/k
g bw
.day
)
0 20 40 60 80 100
02
46
810
12
TotalChickenPorkBeefEggMilkFishOther
������ �9 ������ ������������ � ��� ��������#� �����&��� � ������ � �� �������� ������ � �� .��/
���� �&����� 3�% 1'A6�% &�6���+ � � � ��� ��� ��� � � ���� ��� ������ ��������� ���� ��� � � ����
����0 ( � �����@���� � �� �����0
�� �#� #��#��� ������������
������� ��� ��� ����� �� �� ������ ������� �������
B������� � � � " � �'����� �#� �������� ��� '����� ��� � ��������� � ���� "��# �#� ��
��$ � � � ������� �� ��� � �#� �������� ����$ ������ ��)�� �� ����% 6.�'��� &�8� �� �#�
(��# ����������� �#� ������ � �� %��&���� ��'������� #�� ��������� '$ ���� 6(N ����������$8�
�� 6������ ����������$8 ��� �� 6/(N ����������$8 ��A�� '"A��$�
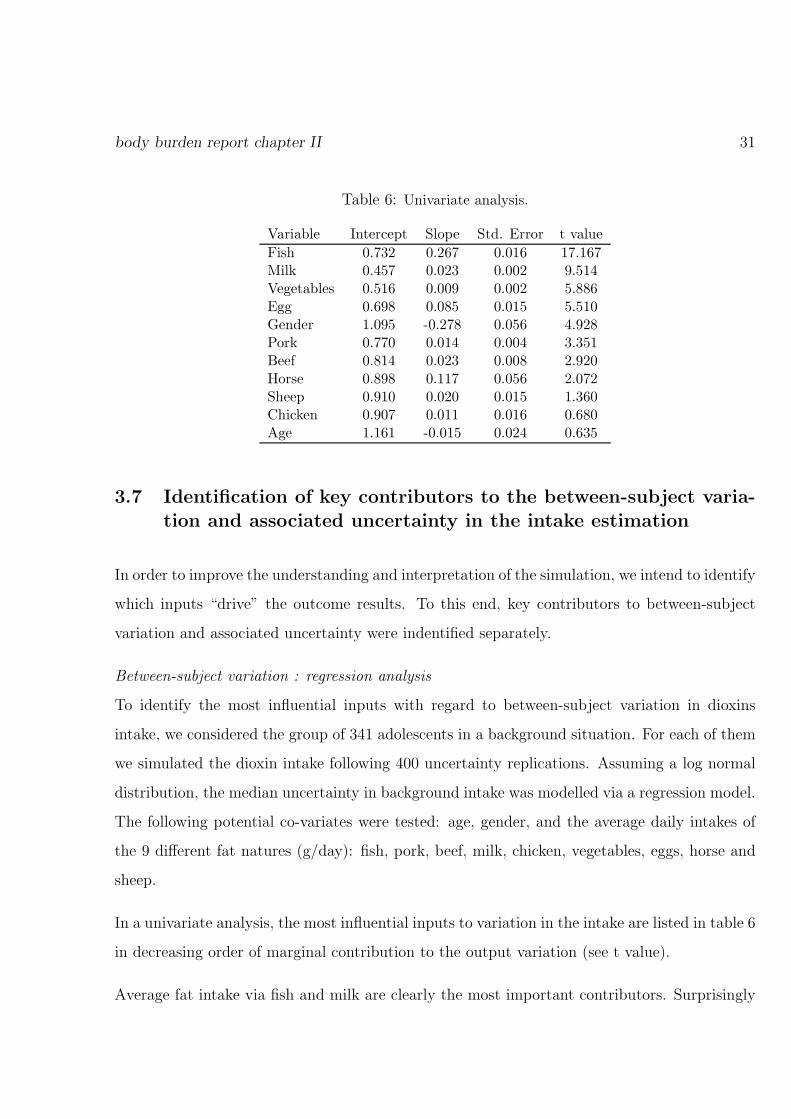
���� ������ ���� �� �� �� �
.�'�� �9 H��#������ ������0
�����&�� ��������� �� �� ���0 '�� � � #����
(�� 90:-, 90,>: 909*> *:0*>:���� 90=7: 909,- 9099, <07*=��%���&�� 907*> 9099< 9099, 7088>'%% 90><8 90987 909*7 707*9!����� *09<7 /90,:8 9097> =0<,8; �� 90::9 909*= 9099= -0-7*���� 908*= 909,- 90998 ,0<,9� �� 908<8 90**: 9097> ,09:,����� 90<*9 909,9 909*7 *0->9������� 90<9: 909** 909*> 90>89$%� *0*>* /909*7 909,= 90>-7
��) ���� *��� �� �� ��" ���� &���� �� ��� &��!���$��&+��� '� �$
� �� �� ����� ��� ������ ��" � ��� ����� ��� ��� ��
*� ���� � ���� )� �#� ������������� ��� ������������ � � �#� �������� �� "� ������ � �������$
"#��# ������ K���)�L �#� ��� �� �������� . �#�� ���� ��$ � ����'�� �� � '��"���&��',���
)������ � ��� ��� ������ ����������$ "��� �������+�� ���������$�
������������� ������� ! ���������� ��������
. �������$ �#� � �� ��5������� ������ "��# ������ � '��"���&��',��� )������ � �� �� %���
������� "� � �������� �#� �� �� � �! �� �������� �� � '����� ��� ������� �� � � ���# � �#��
"� ��������� �#� �� %�� ������ � �� "��� !�� ����������$ ��������� ��� �������� � � � � ����
������'��� �� �#� ������ ����������$ �� '����� ��� ������ "�� � ������ )�� � �������� � � ����
.#� � �� "��� � ������� � &)������� "��� ������9 ���� ������� ��� �#� �)����� ����$ ������� �
�#� / ��0����� ��� ������� 6�A��$89 +�#� � ��� '���� ����� �#������ )�����'���� ����� # ��� ���
�#����
*� � ���)������ ����$���� �#� � �� ��5������� ������ � )������ � �� �#� ������ ��� ������ �� ��'�� �
�� ���������� ���� � �������� � ����'��� � � �#� ����� )������ � 6��� � )����8�
�)����� ��� ������ )�� +�# ��� ���� ��� ������$ �#� � �� ��� ����� � ����'�� ��� B����������$
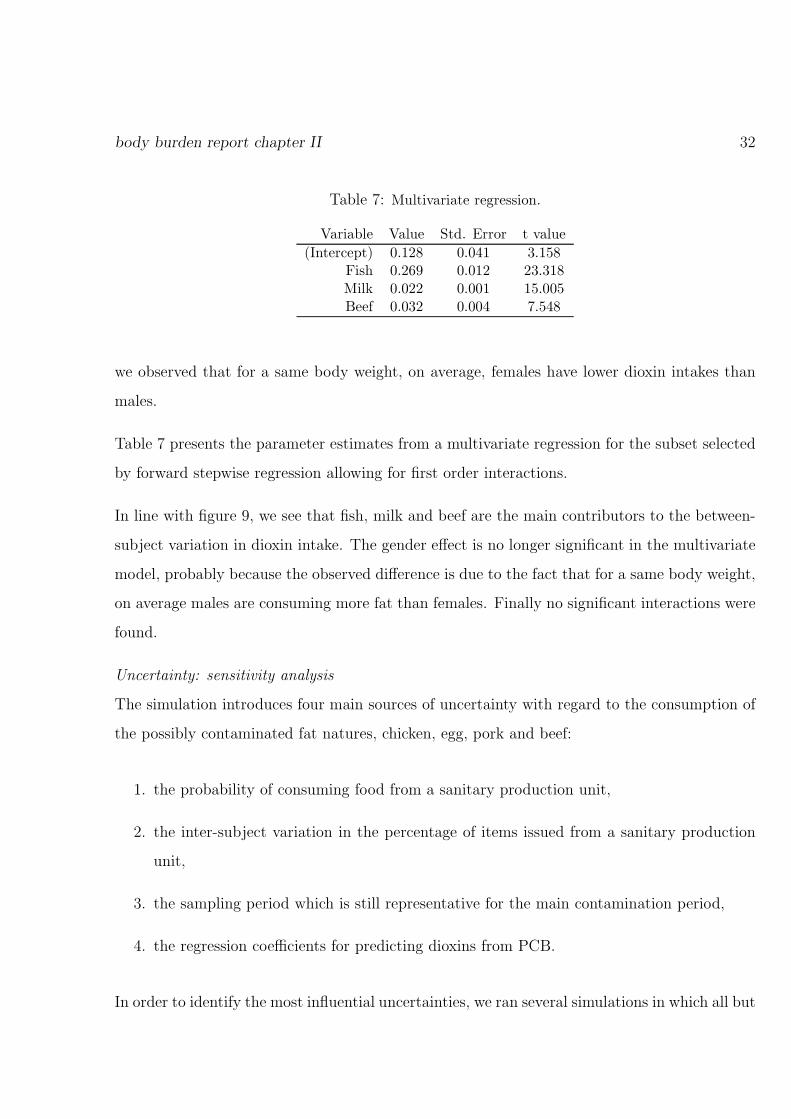
���� ������ ���� �� �� �� �
.�'�� �9 �����#������ ��%��� �0
�����&�� ����� ���0 '�� � � #����
3���������+ 90*,8 909=* -0*78(�� 90,>< 909*, ,-0-*8���� 909,, 9099* *70997���� 909-, 9099= :07=8
"� '���)�� �#�� � � � ���� ' �$ "���#�� � �)������ ������� #�)� � "�� �� %�� ������� �#��
������
.�'�� � �������� �#� ��������� ��������� �� � � �����)������ �������� � � � �#� ��'��� ��������
'$ � �"��� ����"��� �������� � ��� "��� � � +��� ���� ��������� ���
*� ���� "��# +���� /� "� ��� �#�� +�#� ���� ��� '��� ��� �#� ���� � ����'�� �� � �#� '��"���&
��',��� )������ � �� �� %�� ������� .#� ������ �0��� �� � � ���� �����+���� �� �#� �����)������
� ���� �� '�'�$ '������ �#� '���)�� ��0������ �� ��� � �#� ���� �#�� � � � ���� ' �$ "���#��
� �)����� ����� ��� � ������� � �� ��� �#�� �������� ������$ � �����+���� ��������� �� "���
� ����
"��������! ������ �� ��������
.#� �������� � ���� ����� � �� ���� � ����� � ����������$ "��# ������ � �#� � ������� � �
�#� � ���'�$ � ���������� ��� �������� �#������ ���� � �� ��� '���9
� �#� �� '�'����$ � � ������� � � �� � � �������$ �� ����� � �����
� �#� �����&��',��� )������ � �� �#� ���������� � ����� ������ �� � � �������$ �� ����� �
�����
�� �#� �������� ���� � "#��# �� ����� ������������)� � � �#� ���� � ��������� � ���� ��
!� �#� �������� � � �4������ � � ���������� �� %��� �� � ����
*� ���� � �������$ �#� � �� ��5������� �������������� "� ��� ��)���� �������� �� �� "#��# ��� '��
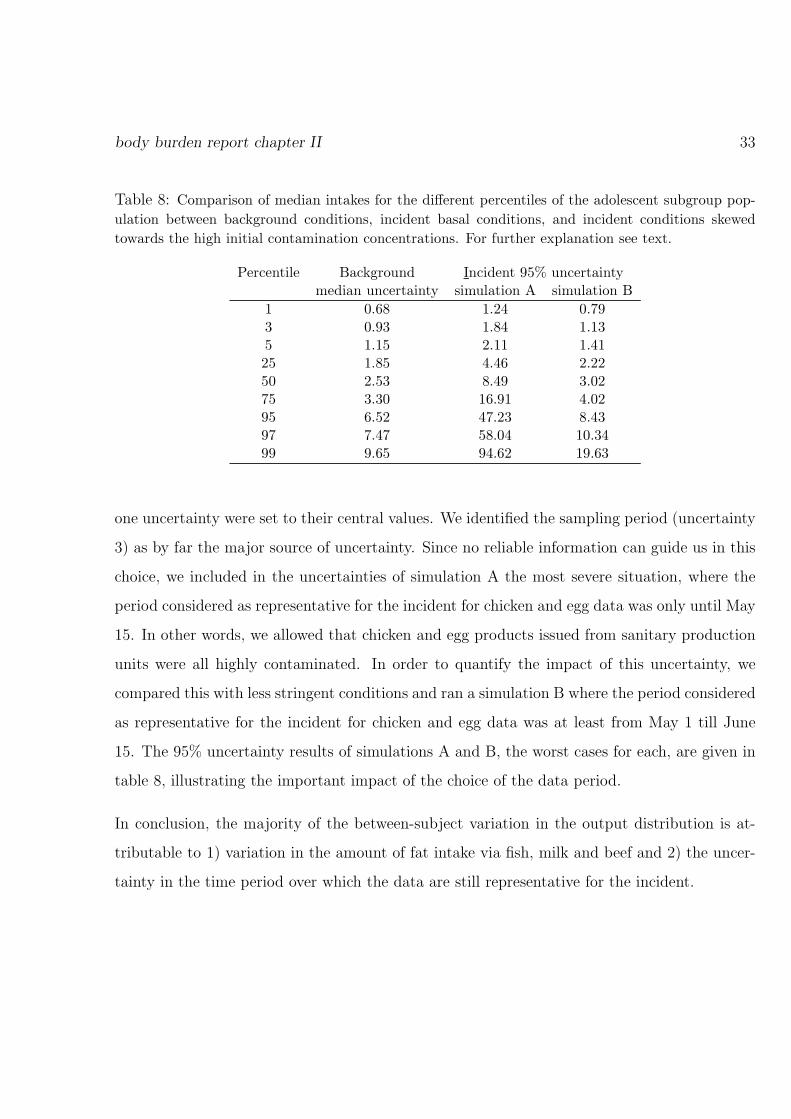
���� ������ ���� �� �� �� ��
.�'�� -9 � ����� � � ������ ������ � � ��� �� ����� ���������� � ��� �� ������ �&%� �� � �/
����� � &������ &���%� ��� � ����� �� �������� &��� � ����� �� ��� �������� � ����� � �����
� ���� ��� ��%� ������� � ��������� � � ��������� �0 ( � ������� �.������� � �� ��.�0
;��������� ����%� ��� �������� <74 ����������������� ����������� ������� � $ ������� � �
* 90>8 *0,= 90:<- 90<- *08= *0*-7 *0*7 ,0** *0=*,7 *087 =0=> ,0,,79 ,07- 80=< -09,:7 -0-9 *>0<* =09,<7 >07, =:0,- 80=-<: :0=: 7809= *90-=<< <0>7 <=0>, *<0>-
�� ����������$ "��� ��� � �#��� ������� )������ 7� ������+�� �#� �������� ���� � 6����������$
�8 �� '$ ��� �#� ��, � � ���� � ����������$� B���� � �����'�� ��� ����� � ��� ����� �� �� �#��
�# ���� "� �������� �� �#� ������������� � �������� � � �#� � �� ��)��� ������� �� "#��� �#�
���� � � �������� �� ������������)� � � �#� �������� � � �#����� ��� ��� ���� "�� ��$ ����� ��$
(� *� �#�� " ���� "� ��� "�� �#�� �#����� ��� ��� �� ����� ������ �� � �������$ �� ����� �
����� "��� ��� #��#�$ � ����������� *� ���� � 3������$ �#� ������ � �#�� ����������$� "�
� ������ �#�� "��# ���� ��������� � ����� �� ��� ��� � �������� � � "#��� �#� ���� � � ��������
�� ������������)� � � �#� �������� � � �#����� ��� ��� ���� "�� �� ����� �� � ��$ ���� D���
(� .#� /(N ����������$ ������� � �������� �� � ��� �� �#� " ��� ����� � � ���#� ��� ��)�� ��
��'�� -� ������������ �#� ��� ����� ������ � �#� �# ��� � �#� ���� ���� ��
*� � ������ �� �#� ��, ���$ � �#� '��"���&��',��� )������ � �� �#� ����� ������'��� � �� ��&
���'���'�� � 8 )������ � �� �#� �� ��� � ��� ������ )�� +�#� ���� ��� '��� ��� 8 �#� �����&
�����$ �� �#� ���� ���� � )�� "#��# �#� ���� ��� ����� ������������)� � � �#� ���������
���� ������ ���� �� �� �� �!
� �������� �� ����� ��
��� ���� �� �� ������
.#� �����'����$ � � �� '�'������� �%� ���� ���������� ������$ ������� � �#� �����'����$ ���
���#���� � �#� ����� ����� .#�� ����� �#��� �� ��� �� � � � ������� � �� � �������� �
�� '�'������� ���� ��# � �#� )����'����$ "��#�� �#� � ������ � �� ��$ � ���'�� "��# ��������
� � ���)�$� ��� � � "��# �)����� ����� 7� ��� � �+���� �#�� �#� � � � ������� � ���� ����
�� �� ���������� ��� ������������)� � � �#� ��'�� ��� �� � "#��# �#�$ "��� � ���������� .#�
�������� � � �#� �� � ��� � � ��� ������ �� � �#� ��0����� ��� ������� ��� # "�)��� ��',��� �
����������$� *� � ������ � �#���� �#�� ����������$ "�� � � ���� ����� ��� �� �� '�'�������
�%� ���� � ���� J "�)��� "� ������ � �#� '��� �)����'�� ���� ��� � �#� �%������� � �� � &
" ����� � ������� �� �#�� +���� ����#��� �� "� �%���� �#�� ��$ ������������� " ��� #�����
���� ��$ ��� �#���� �� ��� � � ���� ���� ��$ �����+���� '��� �� �� �������� ������$� �#�
��������� ������ ��� ������� �� �� ��'�� �� � ������ �� 6��� ��'��� � �� ! ��� /8 ������ �
'� � �#� ���� ���� �� �# �� ��������� � � �#� ���# ������� � ������ � 6��� ��'�� (�� �� G���
��� .#������ //�8�
I�� �� %�� ������ ���������� �������� �� �� �� �� ��� �� %��&���� ����� ������� � "����
�� )����� ������ �%������� �� �� .<=A�� '"A��$� .#�� ������ ���#� '� � ��"#�� �����&
��������� ����� � � ��)���� � � ����� '����� ��� �� %��&���� ��� � ��������� �� "��� ��$
�������� � � �#� �������� ����� '�� ��������� �#� � � ������ "��# �#� #��#��� .<� )�����
*� ������� �� �� �� �� �� ��� �� %��&���� ����� "� ���$ �� ���� "��# �#� <�� ����
B������+� � ������� � � � 6B��8 �#�� ������ �#�� �#� . *1���� �#���� ��� ��� �#� *1
� � �����-&.� � ��� '� �%������ � ������� ��� �����-&��'�������� �� � ��� �� ���
��� �� %��&���� ����� ���# ���������� '$ �#��� ��������)� .<� 6B������+� � ������� � � ��
���8� *� �#� ��������� ����� � �#�� �#������ �� "��� �� �� �#� ����% � �� �� ������$ ������'��
# " "� �������� �� ���$ ����$����� ������� �� � ���'��� �� ��� �� �#�$ "��� �����'�� � � )��
' �# /// '����� ��� ��� �������� ������� � � � ��������� ��� �� ��� ����� '���)��� �
���� ������ ���� �� �� �� �(
�� �#��� ������ �#� �� %��&��������� � ��, � ���� � � � ����� � ������� ��)��� � �� %��&����
��'������� �#�� ��� � � �%���� '����� ��� � ��������� �� *������ ��$ ���� � �#� ������
���� �#��� #�� '��� � ���������� ���� �)�� �� �������$ �� ����� � ������ � ��, � ������ � �
� � �� ����� � ������� ��)��� � � ��������� ������� � '����� ��� ��)����
B�)���� ��, � ������������� ������� � �#� �������� "��� ����� ��� ��� ��� �� �#� ���#��������
� ������� ��� 7� ���� ����� ��� �#� ��������� �� � �� ���� �$��� � ����������$� � ��, �
����������$ "�� �#� �����$ �'����� � ������� ����� �� � � � �#�� ���� � �#� ������ '�&
�"��� ��'����$ ��� ��$ ///� '�� �� �#� �������)� � � � ��� ���� �� ����� �������� .#��
����������$ "�� ��������� �� �� �������� �� �� � ��� '$ �������� �� � �#� �������� ����$�����
���� 6��$ 8 ��� )��$��� �#� ��� ���� "��#�� "#��# ����$����� ���� "��� �������� �� � ��$ (
� D��$ (� ��� �� � �#� ������� ���� �� ��$ � (� �� � �� ����� � ����� �������$ � ��#��
'$ �#� � ��������� � � ����� ��� �� ��������$ ��������� �#� � �� ��)��� � ��������� � �� �#�
'�������� � �#� �������� �#�� "�� �'�� � ����# �#� � � ������� .#�� ����������$ �����$ ��&
����� � �#� � ��������� � �� ���� ��� �#������ �� � ������ � �#� � �� ���'�� � ��������� ��
�� � �� ��� '���� .#� ��� �� �������� � � ��� "�� � � �� ��� ���� �� � D��� ( � D��$ (�
������� � � ���� ��)��� �������� ������ �������� �� . ���#�� "��# �#� �#�� ������������� �����
��� ��� ���1�� '�'����$ � � � �� � � �������$ �� ����� � ����� '��� ������'��� �� ��� �#�
������� � � �� A� � ��������� � �� � ������ ��� ����1�#�� ����� � �#� ���� ����� � �
����������$ ��0���������� �� � �#� )����'����$ "��#�� �#� � ������ �� �� ��� �� �#� � ����'��� �
� �� %��&���� ���� � "���� �#� � ��� �� %��&���� � ��������� � �� � �������� "� #�� � ���$
�����$ � ���� �� � ���� *����� ��$ )��$ ��" ����$��� � � ������ ���� #�� '��� ���� ����
������ �#� ���� � � �#� �� %��&���������
*� ������� ��� �� '�'������� ����$���� "#��� �#� '��"���&��',��� )������ � ��� ��� ������ �����&
�������� ��� � � ��������� ��� ��� ���&������� ����$ �� ������� �#� ��# �#� �%� ���� � ����
�#� ����� " ��� #�)� ��������� �� #$'��� ������'��� � � ���'�$ ������� � ��� �� �� �����������
.#�� #����� � ���3�����$ 3������$ �#� '��"��� ��',��� )������ � �� ������ �#�� ������+�� ���&
��+���� ��'� ������ ��� ���� �� ��� ������ +�#� �#�� ����� � �� � ����� ������� ��
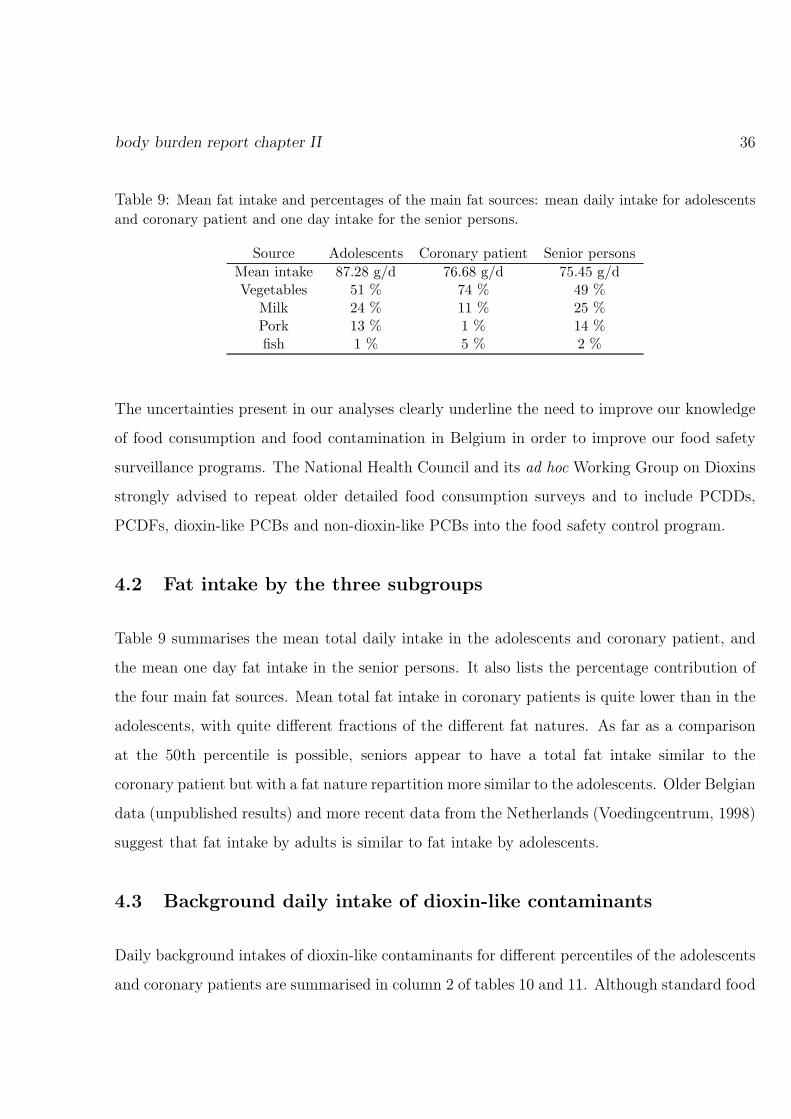
���� ������ ���� �� �� �� ��
.�'�� /9 ���� ��� ������ ��� ��������%� � ��� ���� ��� ����) ���� ����� ������ � � �� ������
��� � � ���� ������� ��� �� ��� ������ � � ��� ��� � ��� �0
� ���� $� ������ � � ���� ������� ���� � ��� �
���� ������ 8:0,8 %6� :>0>8 %6� :70=7 %6���%���&�� 7* 4 := 4 =< 4
���� ,= 4 ** 4 ,7 4; �� *- 4 * 4 *= 4@� * 4 7 4 , 4
.#� ������������� ������� �� �� ����$��� ������$ ��������� �#� ���� � ���� )� �� �� "�����
� � � � ������� � ��� � � � ��������� � �� ������� �� ���� � ���� )� �� � � �����$
���)�������� �� ������ .#� E��� ��� J����# � ����� ��� ��� �� ��� 7 ����� C� �� � � %���
��� ���$ ��)���� � ������ ���� �������� � � � ������� � ���)�$� ��� � ������� �� ��
�� ��� �� %��&���� ���� ��� � �&�� %��&���� ���� ��� �#� � � �����$ � ��� � �� �����
��� ��� ����� &" ��� ���� ��&�����
.�'�� / ���������� �#� ���� � ��� ����$ ������ �� �#� �� �������� ��� � � ���$ �������� ���
�#� ���� �� ��$ ��� ������ �� �#� ���� � ���� ��� *� ��� ����� �#� ���������� � ����'��� � �
�#� � �� ���� ��� � ������ ���� � ��� ��� ������ �� � � ���$ �������� �� 3���� � "�� �#�� �� �#�
�� ��������� "��# 3���� ��0����� ������ �� � �#� ��0����� ��� �������� �� ��� �� � � ������ �
�� �#� (��# ���������� �� � ���'��� ���� �� ������ � #�)� � � ��� ��� ������ ������� � �#�
� � ���$ ������� '�� "��# � ��� ������ ��������� � � �� ������� � �#� �� ��������� I���� �������
���� 6����'���#�� �������8 ��� � �� ������ ���� �� � �#� E��#������� 6H ������������� //-8
������� �#�� ��� ������ '$ ������ �� ������� � ��� ������ '$ �� ���������
��� �������� � �" ����� �� �# �$� �� ������ �����
���$ '����� ��� ������� � �� %��&���� � ���������� � � ��0����� ����������� � �#� �� ��������
��� � � ���$ �������� ��� ���������� �� � ���� � ��'��� � ��� � ���# ��# �������� � �
���� ������ ���� �� �� �� ��
� ������� � ��� � � �����$ ����������� �$������$ � � � ������� ����������� �' )� /�� ��� � �
����� �� ��� � ���������� �������������� ��'��� � ��� � ������� �#� //�# ����������� I��
������ ���� ��)� � 3���� �����'�� �������� � � �#� ������$ ����� �#�$ ��� '���� � ������ ��������
'���)��� �� ��� ����$���� .#� ������ ���� � � �#� � � ���$ �������� �# " � ������� '��"���&
��',��� )������ � �#�� �# �� � �#� �� ��������� .#�� �� �%������ ����� �#��� �� � )������ �
�� � � � ������� � �� �#�� �������� � '�� ��$ �� ������ � � ��������� �� ���"���&��',���
)������ � �� � ���� �� �� � � � ���$ �������� " ��� '� �������
.�'�� � +����$� �# "� �� � ���� �#� ���������� )������ � �� ��������� '����� ��� ������
� �� %��&���� ��'������� '$ �#� ���� � ��'�� �� � � �� ���������� ��$� *� � �� � � ��� " �#�
�������� � � � ����$ ������� ���# ��# �� ���#� '� ������� �#�� �#� �� ��$ ������ �������
�������� )�� �!� ���� � ���� ��� ���#� '� �� �#� ���� ���� � ��������� �� �#� ����$ ������
�������� �� �#� ���� ���� �� )�� ��)���� ��$��
I�� ������� �# ��� '� � ������ � ������ ����������� �#�� � �� "�� � ��0����� ���# � � �$ ���
�#�� ��� �)����'�� �� � �#� ����������� 7#�� � ��� � � �� �# ��� '� ������� � � � � ����� ����
'���� � �� �� �� �� ��� �� %��&���� ���� "��# ���� ��$ '���� � �� � ��� �� ���
*� �#�� ���� �� ������ ���� �# ��� '� ��)���� '$ ���� %������$ � ���� � � ��� ����� � G���
��� .#����� 6//�8 �#� ���#�������� ���� � � �#� ����$ ������ � �� � ��� �� �� �� �#�
���# � ������ � " ��� '� ��! �� .<=A�� '"A��$� ��� ����� � �������� �� ��� 6///8 �#�
���� � � �#� ����$ ������ � �� �� �� ��� ��� �� %��&���� ���� �� ���# ����� ��� �������
� � � � $���� �� " ��� '�� ��������)��$ �( ��� � �� .<=A�� '"A��$� .#� <�� ����
B������+� � ������� � � � 6���8 ����� �� �� �)����� ������ � �� %��&���� � ����������
)�� ��0����� <�� ���� � ������� � � � ��� �� .<=A�� '"A��$� I�� ������ ���������� �� �#�
�� �������� �� �#� (��# ���������� �� 3���� � �����'��� ����#�� � ������ ��� � �� ���������$
"��# ������ � #��#�� ������������ ��� � � � ���'�� '������ �#� ���� �� � �#� ���������� � � �
������� �#� '��"���&��',��� )������ � ����� "��#�� � ���������� �� �� �� �#� ���� "�$�
������$� �� �� %�� ������ �������� � �� ��� �#��� ��'�� ��� ������$ ������+�� ����� ���� ����)��
�� ����� ��� +�# �� ��, � � ����� � '����� ��� ������ � �� %��&���� � ����������� � ��
���� ������ ���� �� �� �� �-
���������$� +�# '�� ��� ��� ����� � � �# �� "# ��� +�# ��)���� ����� � "���� 7#��#�� �#��
" ��� ���� � "���� �� ��)��� � �������� +�# ������ �� ���������� ��'�� ��� �� ���� ������ *�����
+�# � ������� � �� ��������$ �������� �� �� ����� � ������� ��#�� ����� ��� ��� �#�� �� ���&
��)� ���� � ��$ ��"���# �#� � ������� ������ � �#� � ���������� �� ��������� I�� ������
�������� � ���#�� # "�)��� ����� ��� �#� ��)��� ��)�� '$ �#� FB� � ��� FB<��1'���� �
������$ � ����� �� +�#1�#�� �������� " ��� ��� ������� " ��� �# ��� � � ��� +�# �� �
� �&� �������� � ����� � �� �#�� ��� � "��� 6FB<��� ��8� I�� ������� ���#� �)�� "���
������� +�# �� � � �������� � ������ �������� " ��� ��� ������ �#� � �� )������'�� �� ��
"��# ������ � �� %��&���� � ���������� 6��� �#����� ***8�
��� ��� ��� � �" ����� �� �# �$� �� ������ �����
.#� ��������� �������� ������ ����� �� �#� (N� ������� ��� /(N ��)�� � ������������� ���
���������� �� �#� ��'��� �� ��� � .#� ������ ����������$ ���������� �#� � �� �����$
�������� � � �#� ������ ������ �#� �� %��&��������� �#� /(N ����������$ ���)� �#� " ��� �����
.#� ����������$ �� �������$ #��#�� �#�� �� '����� ��� � ����� ��� ��� � �#� �������������
���� ������ �#� � ��������� � ���� �� � � �#�� "�� ���� ����� ��� �#� ������ '�� �� �#�
�%���� � �#� � ��������� � '����� ����$ ������� �� � � �#� �� �������� ��� �#� � � ���$
������� ����$ ������� ��� ��)��� � � �#� ���� � ���� �� �#� ������ � �� ���������� ��$ �� ��)���
.#� � ���'�� ��������� �� ������ � � ��0����� ����������� �� �#� ��0����� ��'�� ���� ��� � �
��0����� ������� � ����������$� ��� �����$ '� ���������� �� � �#��� ��'���� .#� ������ � �
�#� �� ������� � ������ � "��# �� ������ � ���� � �3��� � �� .<=A�� '"A��$1�#� � "��
7JI . * 67JI&<�<J&*��B� ���81��������� �� � �N � "���� N ������ �#� ���������
.#� ������ � � �#� � ������ � "��# �� ������ � ���� � �3��� � ! �� .<=A�� '"A��$1�#�
#��#�� 7JI . * 67JI&<�<J&*��B� ���81��������� �� � -(N � "���� ��N ������ �#�
��������� .#� ������ � � �#� � � ���$ �������� "��# �� ������ � ���� � �3��� � ! �� .<=A��
'"A��$1�#� #��#�� 7JI . *1��������� �� � (N � "���� �N ������ �#� ���������
� � � �� � �#� ��',����� �#� � ������ �������� �� ������ ������ �#� �������� � �� "� �#� � �&
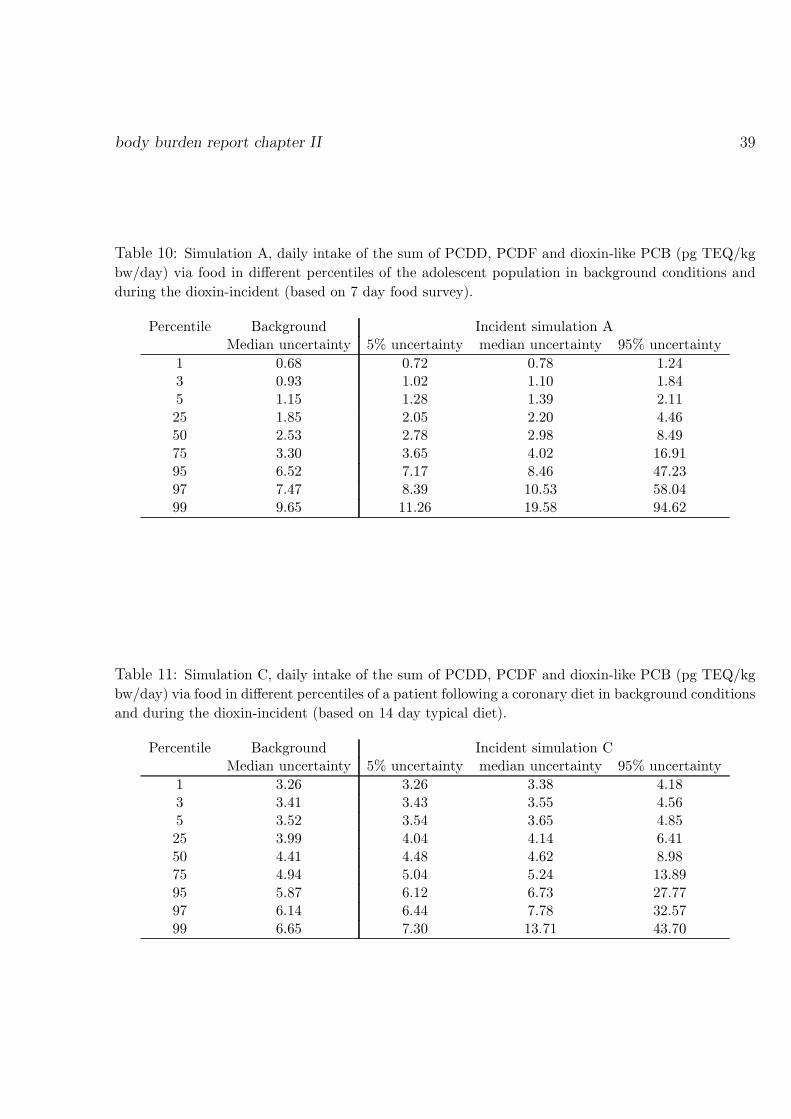
���� ������ ���� �� �� �� �/
.�'�� �9 �������� � $� ����� ������ � ��� �� � ;���� ;��( ��� �� .��/���� ;�� 3�% 1'A6�%
&�6���+ #�� � � �� �� ����� ���������� � ��� �� ������ � ������ � �� &���%� ��� � ����� � ���
�����% ��� �� .��/�������� 3&��� � : ��� � � ��#��+0
;��������� ����%� ��� �������� ������� � $������ ����������� 74 ����������� ������ ����������� <74 �����������
* 90>8 90:, 90:8 *0,=- 90<- *09, *0*9 *08=7 *0*7 *0,8 *0-< ,0**,7 *087 ,097 ,0,9 =0=>79 ,07- ,0:8 ,0<8 80=<:7 -0-9 -0>7 =09, *>0<*<7 >07, :0*: 80=> =:0,-<: :0=: 80-< *907- 7809=<< <0>7 **0,> *<078 <=0>,
.�'�� 9 �������� � �� ����� ������ � ��� �� � ;���� ;��( ��� �� .��/���� ;�� 3�% 1'A6�%
&�6���+ #�� � � �� �� ����� ���������� � � ������� � �� ���% � � � ���� ���� �� &���%� ��� � ����� �
��� �����% ��� �� .��/�������� 3&��� � *= ��� ������� ����+0
;��������� ����%� ��� �������� ������� � ������� ����������� 74 ����������� ������ ����������� <74 �����������
* -0,> -0,> -0-8 =0*8- -0=* -0=- -077 =07>7 -07, -07= -0>7 =087,7 -0<< =09= =0*= >0=*79 =0=* =0=8 =0>, 80<8:7 =0<= 709= 70,= *-08<<7 708: >0*, >0:- ,:0::<: >0*= >0== :0:8 -,07:<< >0>7 :0-9 *-0:* =-0:9
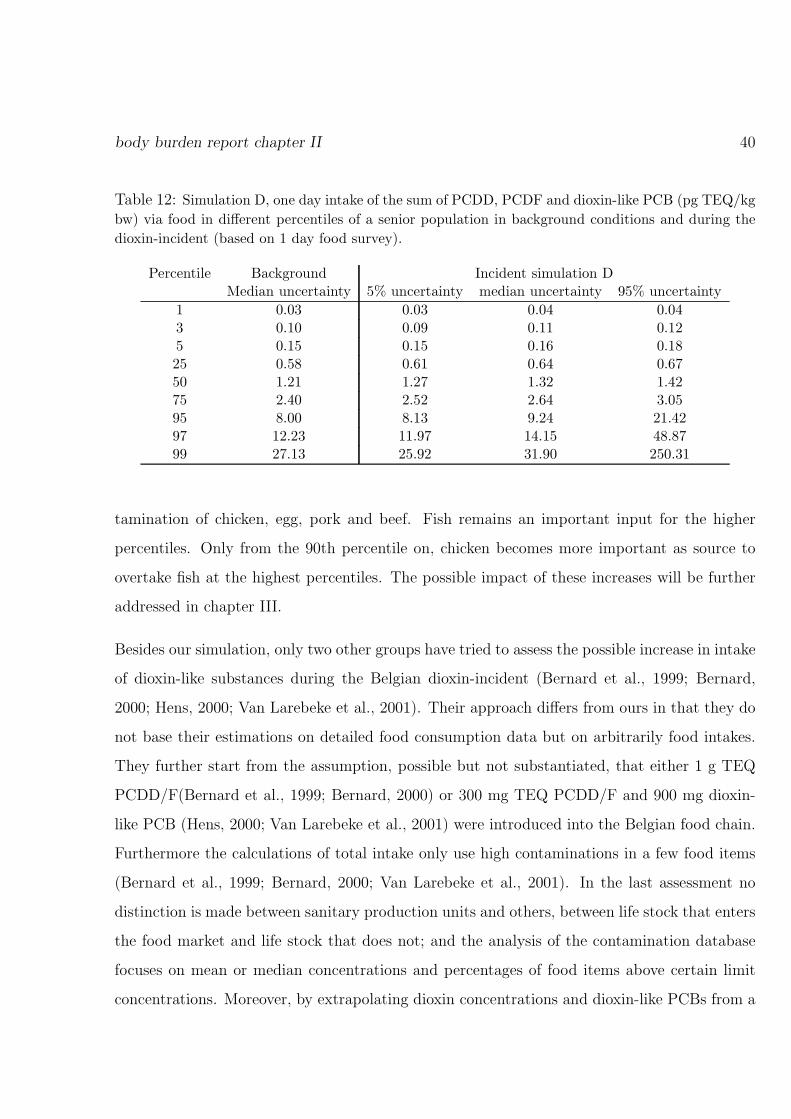
���� ������ ���� �� �� �� !�
.�'�� 9 �������� � �� �� ��� ������ � ��� �� � ;���� ;��( ��� �� .��/���� ;�� 3�% 1'A6�%
&�+ #�� � � �� �� ����� ���������� � � ��� � � ������ � �� &���%� ��� � ����� � ��� �����% ���
�� .��/�������� 3&��� � * ��� � � ��#��+0
;��������� ����%� ��� �������� ������� � ������� ����������� 74 ����������� ������ ����������� <74 �����������
* 909- 909- 909= 909=- 90*9 909< 90** 90*,7 90*7 90*7 90*> 90*8,7 9078 90>* 90>= 90>:79 *0,* *0,: *0-, *0=,:7 ,0=9 ,07, ,0>= -097<7 8099 80*- <0,= ,*0=,<: *,0,- **0<: *=0*7 =808:<< ,:0*- ,70<, -*0<9 ,790-*
�������� � � �#������ ���� � �� ��� '���� ���# ������� �� ��� ����� ����� � � �#� #��#��
������������ I��$ �� � �#� /��# ���������� �� �#����� '�� ��� � �� ��� ����� �� � ���� �
)������ +�# �� �#� #��#��� ������������ .#� � ���'�� ������ � �#��� ��������� "��� '� ����#��
��������� �� �#����� ***�
������� �� �������� �� ��$ �" �#�� �� ��� #�)� ����� � ������ �#� � ���'�� �������� �� ������
� �� %��&���� ��'������� ������ �#� ������� �� %��&�������� 6������� �� ���� ///; ��������
���; J���� ���; H�� G���'��� �� ���� ��8� .#��� ���� ��# ��0��� �� � ��� �� �#�� �#�$ �
� � '��� �#��� �������� �� � �������� � � � ������� � ���� '�� � ��'�������$ � � ��������
.#�$ ����#�� ����� �� � �#� �������� �� � ���'�� '�� � � ��'����������� �#�� ���#�� � .<=
�� A�6������� �� ���� ///; �������� ���8 � ��� �� .<= �� A� ��� /�� �� �� %��&
���� ��� 6J���� ���; H�� G���'��� �� ���� ��8 "��� ���� ����� ��� �#� ������� � � �#����
����#��� �� �#� ��������� �� � � ��� ������ ��$ ��� #��# � ��������� �� �� � ��" � � �����
6������� �� ���� ///; �������� ���; H�� G���'��� �� ���� ��8� *� �#� ���� ���������� �
��������� � �� ���� '��"��� �������$ �� ����� � ����� ��� �#���� '��"��� ���� �� �� �#�� ������
�#� � � ������ ��� ���� �� �� �#�� � �� � �; ��� �#� ����$��� � �#� � ��������� � ����'���
� ����� � ���� � ������ � ��������� �� ��� ����������� � � � ����� �' )� ������� �����
� ��������� ��� � �� )��� '$ �%���� ������ �� %�� � ��������� �� ��� �� %��&���� ���� �� � �
���� ������ ���� �� �� �� !
)��$ ������� ���'�� � �������� #��)��$ � ���������� '$ ����� � �#� "# �� � � � � � ����� ��
"#��# ������ ���� #�)� '��� ��������� '��� �� ���� ������ *� �� � ���'�� �#�� �#��� ���������
� ����� �� � � �� ���������� ���� ������ '�� �%���� ���� � �� � �#��� � �#� � �� �������
� ������ � ������� 3���� #�2��� ��� I�� ���� ��������$ �� )��� � � �� �����'�� �������� �
� �#� �� %�� ������ �� �� �������� ���� �� )���� �#�� � � � ������� � �������� ��� �� "��
��� " ������� �� � '� ���� � "���� �#�� ��'�� �� � ������ ��� I�� �%����� # " �#�� � ���
'� � �� �� ������$ ��)�� �� �� � � ���$ ������� �����
���� ������ ���� �� �� �� !
� ������� ���
� � �� '�'������� ������ ���������� � �� �� �� ��� ��� �� %��&���� ���� "�� ��&
�������� '���� � �������� � � � ������� � �������� ��� � '����� ��� ��� �� %��&
�������� � ��������� � ����� ����� � � ��� ���� �������� ��
� �� � �#� �������� � ��������� � ����'���� ��$ � ��������� �� �� � "��� ������+�� ���&
���� �� � '���� � � ����� �#�� ����� �#� #���� � � �#��� "��� �������� �� �#� � ����
� � � � ������� � ���� ���� �� � � ��������� ��)�� ��$ ���)�$ �� �� ��������� �� � �
� ������ ��$� ������� ���� � � � � ���$ ��������� ��� �� � � ��������� �� ��$ ���)�$ ��
���� � ���� ���
� .#� �� '�'������� ������ ���������� ��� � '����� ��� ������� �#�� ��� ������� �� �# ��
��'���#�� � � � ������ �� �� � �#�� �������������� � �������� .#��� ������� � �#� �� &
�������� ������ '�� " �� .<=A�� '"A��$1�#� � "�� 7JI . *1� � �#� ��� � ��� �
�� �� �� �� ��� �� %��&���� ����� <��#�$&+)� N � �#� �� �������� ��� (N � �#�
����� � � ���$ �������� #�� ����$ ������� � ���� �#�� ! �� .<=A�� '"A��$1�#� �����
7JI . *� ���� ��� ���� ����)�� �� ����� �� )��� � ���'�� � ���� � �� %��&���� � �&
���������� +�# � ��������� �#� ���� � ���� �� �#� #��#�� ������ ��)����
� ����� �#� �� %��&��������� � � ������ �������� �� ������ �������� I��$ N � �#�
�� �������� ������ '�� " �� .<=A�� '"A��$� B�)���$&��% N � �#� �� �������� ���
�N � �#� � � ���$ �������� � " ������ '�� " ! �� .<=A�� '"A��$� *� � ��" ����� �
� �� �� � ����� �������� �� ������ ����� "#��# �� '� ��#� �' �� '$ �#� ������ � #��#�$
� ���������� �#������
������� ���
�� ���� ��������� ��� ����
����������
��� ������ ������ ������ ��� ������
����� ��� ��
���� ������ ���� �� �� ���
��������
� ������� �� �
� ���� �� �� ������ �
� ������� �
� �������� �
� � �� ���������� �
�� ��� ������ ��� ���������� ��� ������ � � � � � � � � � � � � � � � � � � � � � � �
�� ��� ������ ��� ������� ��������� � ��������� ��������� ��� ������ ���������
������ � � � � � � � � � � � � � � � � � � � � � � � � � � � � � � � � � � � � � � � � � �
��� ����� ���� � ��� ������� ��!������ � ��������� ��������� �"�� ��� ������ ����
������ ������ � � � � � � � � � � � � � � � � � � � � � � � � � � � � � � � � � � � � �
��# $%��� $%�&� ���'����� � $% � ��� �������'����� � $% � � � � � � � � � � � � � �
� ������� ��� ��
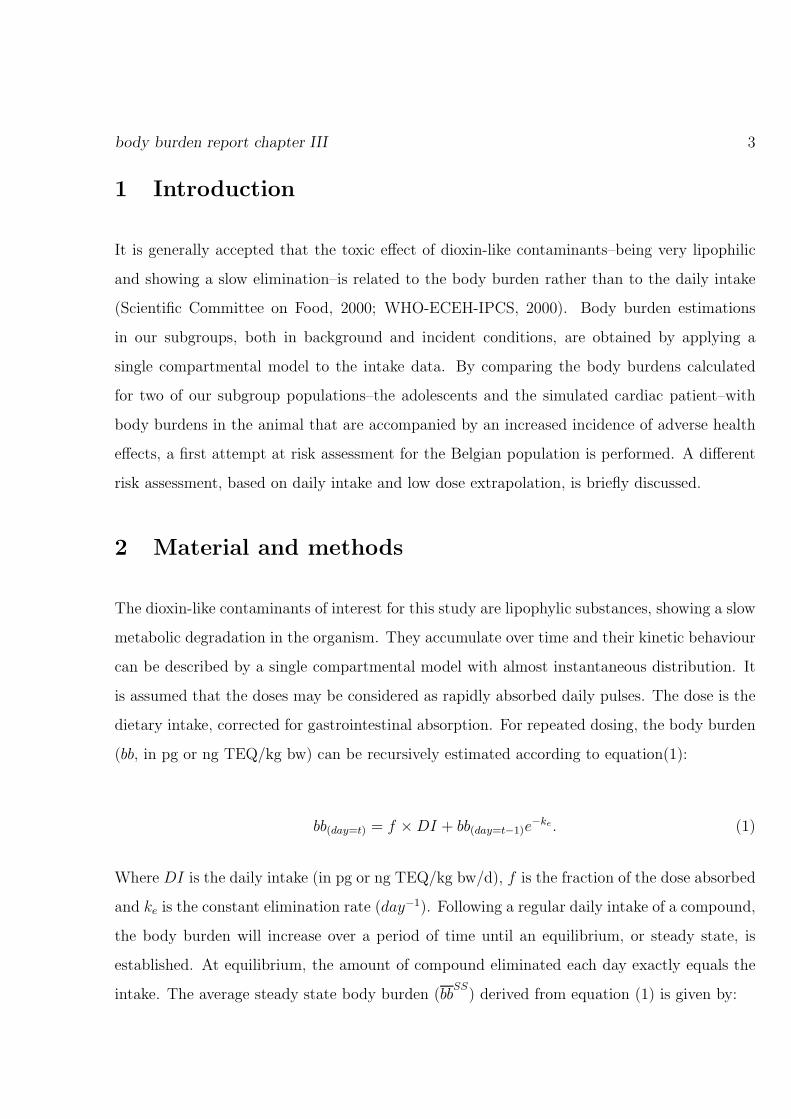
���� ������ ���� �� �� ��� �
� ������� ��
(� �� ��������� �������� ���� ��� ��'�� �)��� �� ���'����� � ������������*����� "��� ����������
��� ���+��� � ���+ �����������*�� ������� �� ��� ���� ������ ������ ���� �� ��� ����� ���� �
,-������.� %�������� �� &���� ���/ 012�3%31�($%-� ���4� ��� ������ �����������
�� ��� ���������� ���� �� ��� ������ ��� �������� ����������� ��� �������� �� �������� �
������ ������������� ����� �� ��� ���� � ����� � ��������� ��� ���� ������� ����������
��� �+� �� ��� �������� �����������*��� ����������� ��� ��� ��������� ������� �������*+���
���� ������� �� ��� ������ ���� ��� ����������� �� �� ��������� ��������� �� ��"���� ������
�)����� � .��� ������� �� ��� ���������� ��� ��� ������ ���������� �� ���������� � ��)�����
��� ����������� ����� �� ����� ���� � ��� ��+ ���� �'������������ �� ����5� ����������
� ���� �� �� ������
6�� ���'����� � ������������ �� �������� ��� ���� ����� ��� ���������� ����������� ���+��� � ���+
��������� ����������� �� ��� ��������� 6��� ���������� �"�� ���� ��� ����� ������ ����"����
��� �� ��������� �� � ������ ������������� ����� +��� ������ ������������� ������������� (�
�� ������� ���� ��� ����� ��� �� ���������� �� ������� �������� ����� ������� 6�� ���� �� ���
������� ���� �� ��������� ��� ���������������� ����������� &�� �������� ������� ��� ���� ������
,��� �� �� �� �� 6378 � �+4 ��� �� �������"��� ��������� ��������� �� �9������,4:
��������� ; � ��� < ���������������� ,4
0���� �� �� ��� ����� ���� � ,�� �� �� �� 6378 � �+8�4� � �� ��� �������� �� ��� ���� ��������
��� �� �� ��� �������� ����������� ���� ,���4� &����+��� � ������� ����� ���� � �� � ���������
��� ���� ������ +��� �������� �"�� � ������ �� ���� ����� �� �9���������� �� ������ ������ ��
������������ �� �9���������� ��� ������ �� �������� ���������� ���� ��� �'����� �9���� ���
���� �� 6�� �"����� ������ ����� ���� ������ ,����4 ����"�� ���� �9������ ,4 �� ��"�� ��:
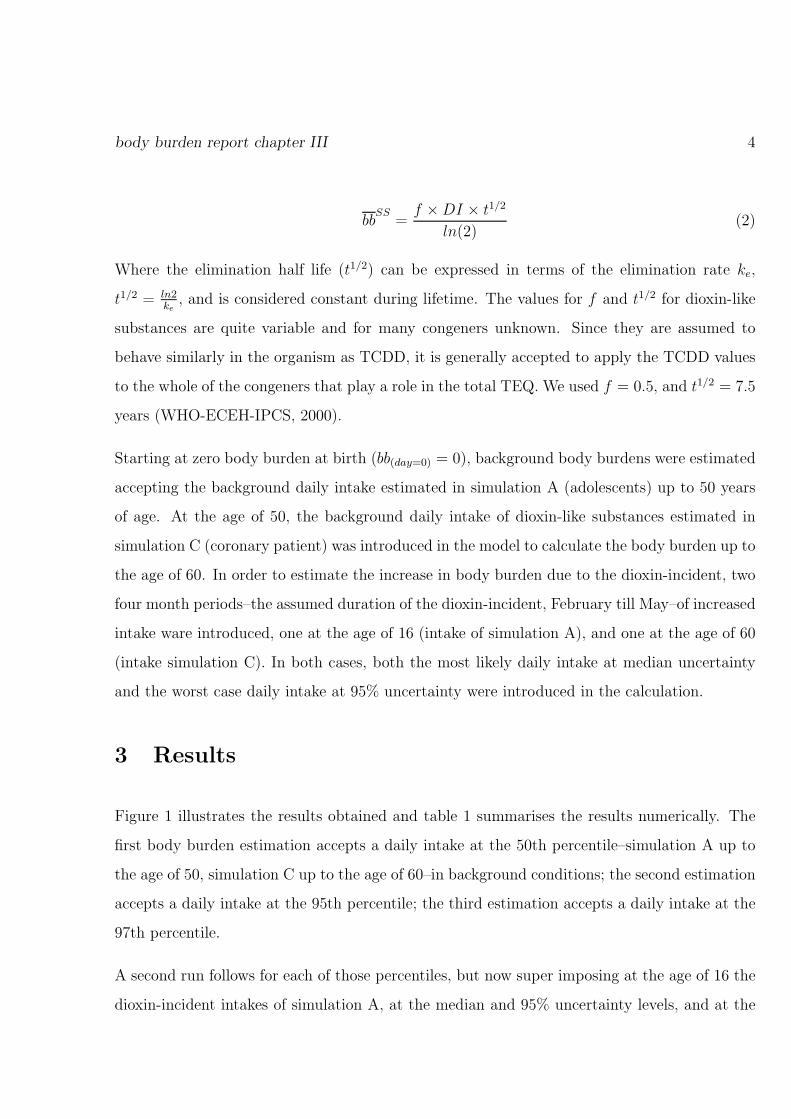
���� ������ ���� �� �� ��� #
����
;� ��� � ����
� ,4,4
0���� ��� ����������� ���� ���� ,����4 ��� �� �'������� �� ����� �� ��� ����������� ���� ���
���� ; ���� ��� �� ���������� �������� ������ ��������� 6�� "����� ��� � ��� ���� ��� ���'����� �
���������� ��� 9���� "������� ��� ��� ���� ��������� �� ��+�� -���� ���� ��� ������� ��
����"� ��������� �� ��� �������� �� 6%��� �� �� ��������� �������� �� ����� ��� 6%�� "�����
�� ��� +���� �� ��� ��������� ���� ���� � ���� �� ��� ����� 637� 0� ���� � ; ���� ��� ���� ; =��
����� ,012�3%31�($%-� ���4�
-������� �� >��� ���� ������ �� ����� ,��������� ; �4� ��� ������ ���� ������� +��� ���������
��������� ��� ��� ������ ����� ���� � ��������� �� ���������� � ,�����������4 �� �� �� �����
�� ���� �� ��� ��� �� ��� ��� ��� ������ ����� ���� � �� ���'����� � ���������� ��������� ��
���������� % ,�������� �������4 +�� ���������� �� ��� ����� �� ��������� ��� ���� ������ �� ��
��� ��� �� ?�� (� ����� �� �������� ��� �������� �� ���� ������ ��� �� ��� ���'������������ �+�
���� ����� �������*��� ������� �������� �� ��� ���'������������ &������� ���� @��*�� ���������
���� � +��� ����������� ��� �� ��� ��� �� ? ,���� � �� ���������� �4� ��� ��� �� ��� ��� �� ?�
,���� � ���������� %4� (� ���� ������ ���� ��� ���� �� ��� ����� ���� � �� ������ �����������
��� ��� +���� ���� ����� ���� � �� ��A ����������� +��� ���������� �� ��� ������������
� �������
&����� ����������� ��� ������� �������� ��� ����� ���������� ��� ������� ������������ 6��
.��� ���� ������ ���������� ������� � ����� ���� � �� ��� ���� ����������*���������� � �� ��
��� ��� �� ��� ���������� % �� �� ��� ��� �� ?�*�� ��� ������ ����������/ ��� ������ ����������
������� � ����� ���� � �� ��� ���� ����������/ ��� ����� ���������� ������� � ����� ���� � �� ���
�=�� �����������
� ������ ��� �����+� ��� ���� �� ����� ������������ ��� ��+ ����� �������� �� ��� ��� �� ? ���
���'����������� ���� �� �� ���������� �� �� ��� ������ ��� ��A ����������� ��"���� ��� �� ���
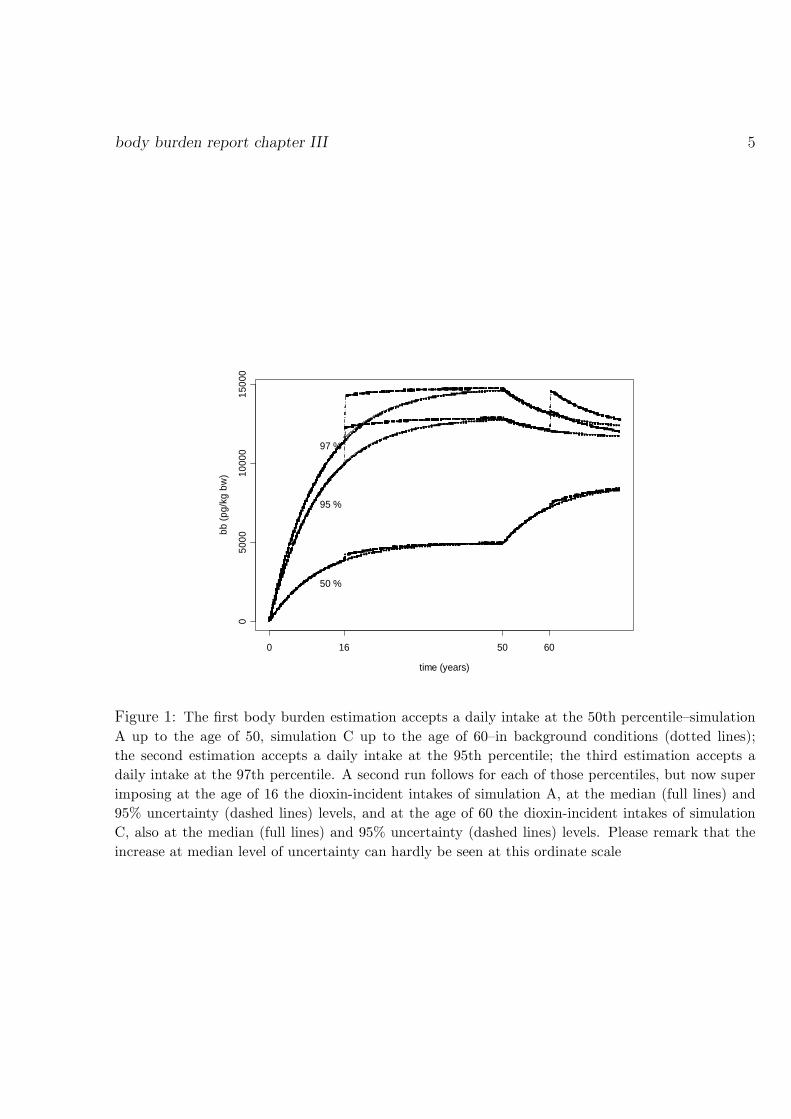
���� ������ ���� �� �� ��� �
time (years)
bb (
pg/k
g bw
)
050
0010
000
1500
0
0 16 50 60
50 %
95 %
97 %
&����� : ��� ��� �� � ��� �� ��������� ������ � ���� ������ �� ��� ���� �������������������� �� �� ��� �!� �" �� ��������� # �� �� ��� �!� �" $���� ����!���� ��� ����� % ���� ����&'
��� ���� ��������� ������ � ���� ������ �� ��� (��� ����������' ��� ���� ��������� ������ �
���� ������ �� ��� ()�� ����������* ���� ��� "����+ "�� ���� �" ���� ���������� ��� ��+ ����
������! �� ��� �!� �" ,$ ��� ��-��.���� ��� ������ �" ��������� �� ��� �� ��� %"��� ����& ��
(�/ ����������� % ��� ����& ��0�� �� �� ��� �!� �" $� ��� ��-��.���� ��� ������ �" ���������
# ��� �� ��� �� ��� %"��� ����& �� (�/ ����������� % ��� ����& ��0��* 1���� ������ ���� ���
������� �� �� ��� ��0�� �" ����������� ��� ��� �� �� ��� �� ��� �� ����� ����
���� ������ ���� �� �� ��� ?
��� �� ?� ��� ���'����������� ���� �� �� ���������� %� ���� �� ��� ������ ��� ��A �����������
��"����
%������� �� ��� ��� �� �� ���� �� ���������� ����� ���� � ��+���� ���� �� ��� �������� �������
�������� �� �������� �� ���� ������ �� ��� ���� ����������� ��� � �������� �� ��� ���� ��� �=��
������������ 6��� ����������� ����� �� ����.���� ����� ��� �������� �������� ����� ���� �� �� ���
���� ��� �=�� ����������� ��� ���� �������� ����������������� ����� �� �� ������� ��������
��������� �� ��� ����������� ����� (� �� ������� ��"���� ���� ��� .���� ���� ��� ���������
���'����������� ������� ��������� �� ���� ������ �� ��� ������ ��"�� �� ����������� ��� 9����
��+ ��� ���� �� ��� ����������� �� ���� �� �� ��� ��A ����������� ��"�� � ���� ��� �� ��������
�� ���� ������ ������� ��������� +���� �� ���������� �� �� ��� ��� �� ���
� ��������
2�� ������������ ��� ��� ���� �"������� �������� �� ��� ���� �� ��� ���� ������ �� ��� ��� ��
��� $%���� $%�&�� ��� ���'����� � $% � �� ��� ������ ����������� ��� �'��� ����������� ��
+���� +���� ��9���� �� �'�����"� �������� �������� �� ���'����� � ������������ �� ����� ������
�� � ����� ������ �� ������� �����+�� �� �� ���������� �� ��� ����� ���� ��� �������� 6���
��� �� ���������� ������ ��"� ���� ������������ ����������� ����� ��� ���'����������� ���
�������� �� ��+� ��� ������ ����� 6��� ��� �� ����������� �� ��� �"������� ��� �������
�� �������� ����� �� ��������� ����� ���� �� +��� ���������� ��� ���� ���������"��
0� ���������� ��� ���� � �� ���'����� � ������������ �� ��� ���� � "�� ����� 6��� ����������
�� ��������������� �� ��� ���� ������� ���� ��� ��+�"��� ����� ����� �� �� ��������� ��������
���� �� ����� ��A �� ��� ���� � �� ���'����� � ���������� ������ "�� ����� -��� ������� ,"��
��� @���� �� ���� ��?/ B���>�� �� ���� ��=4 �������� ��������������� ������ �������� ������
,$ $B4 ������ ��� ��� ������ ����"���� �� ���'���� 6���� $ $B ������ �������� ������� ��
��"���� ������������� +��� .��� ����� �������� 1�+�"��� �������� ������ ���� ��� ��� ��)�����
��������� �� �������� ��� 9���� ���������� ��� ��)����� ���������� �� ��� ������ ������ ���
���� ������ ���� �� �� ��� =
����� ������� +��� �������������� -���� +� ������ �� �"������ ���� ���� ���� ������� +� ����� ��
���� ����������� �� ������ ����� ���� ������ ��������� ��� �� ��� � ������ ����������� �����
���� �� ���� �� ���� ������' ��� ��������� ������� �� �������� ���� �����+�� �� ��� -%&
,-������.� %�������� �� &���� ���4� 0� ������� ������� ���� � >��� ���� ������� ��� �� ���
���� ������� ��� ���'�� ���� ������ �� ����� �� ��� �������� ���� ���� � +��� ������ �������� �
����������� ��������� �������� ���� ���������� ���� ������ ���� �� ��� � ��������� ���� �� ����
�������� ��� �9��������� ���� ������ +�� ��������� �� ��� ���� ������ +� ����������� &�������
+� ������� ��� ��������� ���� � �� ���������� � ,�����������4 ���� ��� � �� ��� ��� �� ����
������� ��� ����� ���� ������� ���� ������ ������ �� ��� ����+ ��� � ������� ���� � �����������
��� �� ��� ����� �� ����� ���� ��� �� ����� ����� �� �� ���� �� ��� ���� ��� ���� � �� ������ �������
��������� ��� ���� � �� ����������� ,C�������������� ��D4� 6�� ���� ������� ��������� ��
��� ��� �� ��� ���������� ������ � ���� �������� ��� ���� �� ��� ������ ����������� &��� ���
��� �� �� ���� ?�� +� ������� ��� ���� � ���� ���� ���������� % ,�������� ��������4�
2�� ��� ������ ����������� ��� 9���� ������� �� ��� ������ ���� ������� ��������� �� �������
0��� ������� ,4 �� ������� �� ��� �"����� 3������� ����� ���� �� ��� $%��� $%�& ���
���'����� � $% �*� � � �� 6378 � �+8��� ,3-& ��+� �������� ���4*�"����� ���� �������
��� �������� �� ��D � ���� �� 6378 � �+� @����"��� �'����������� ���� ���'����� � ����"���
�� ����� ������ ���� ����� ��)����� &������ ������� ,-��������� ���4*�������� �A ���� ���*
����� �� �"����� ���� ������ "����� �� ��� �� �� �� 6378 � �+ ��� D ����� ���� ��� ?� ��
D�? �� 6378 � �+ ��� +���� �� �� �� ?� ����� �� ���� 6�� ���������� ���� �� ��� ������� ���
������ ����������� �� ����� ������������ 6��� ���������� ���"���� �� �������� "��������� �� ���
������������� ��������� ���������� ���� ��� �'����������� �� ���� ������� ���������� �� ���
����� �� � ����� ���� � �� ����������� ��+���� ��� ����� ����������� +��� ��� �'������� �� ������
�����+��� � ���������� �����
� �+������� ���� ��� ������ ���� � ��+���� ��� ���� � ������ ��� ���'������������ +� ���
�������� ������ ���� ��� ����"������ �� ��� ����� ���� ��� �=�� ���������� ��� ��� ���� ��
��� ������ ���������� �� ������ ��� ���'������������ 6��� �� ��� ��� ����� �� ���� ��� �������
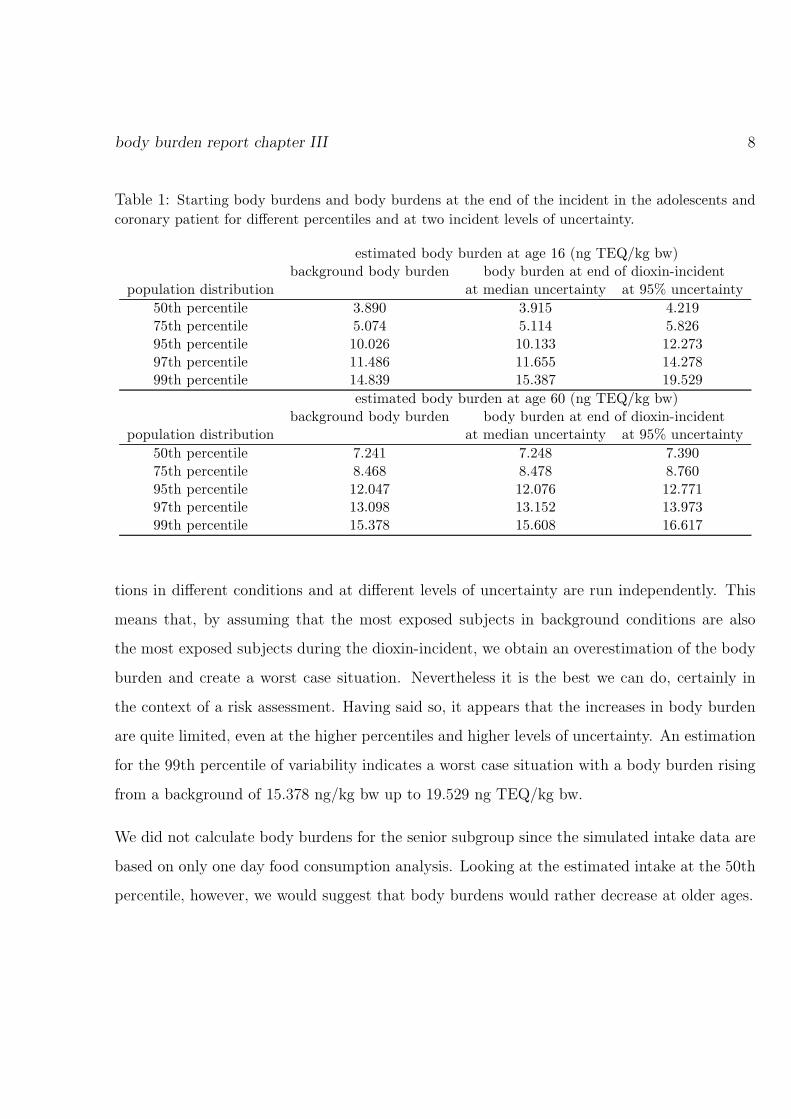
���� ������ ���� �� �� ��� D
6���� : 2������! �� � ��� �� �� �� � ��� �� �� ��� �� �" ��� ���� ��� �� ��� � ������� �� �������� ������� "�� �3����� ���������� �� �� �+� ���� ��� ��0�� �" �����������*
������� �� � ��� �� �� �!� ,$ %�! �456�! �+&����!���� �� � ��� �� �� � ��� �� �� �� �" ��-��.���� ���
���������� ���������� �� �� ��� ����������� �� (�/ �����������
���� ���������� 7*8(� 7*(,� 9*:,()��� ���������� �*�)9 �*,,9 �*8:$(��� ���������� ,�*�:$ ,�*,77 ,:*:)7()�� ���������� ,,*98$ ,,*$�� ,9*:)8((�� ���������� ,9*87( ,�*78) ,(*�:(
������� �� � ��� �� �� �!� $� %�! �456�! �+&����!���� �� � ��� �� �� � ��� �� �� �� �" ��-��.���� ���
���������� ���������� �� �� ��� ����������� �� (�/ �����������
���� ���������� )*:9, )*:98 )*7(�)��� ���������� 8*9$8 8*9)8 8*)$�(��� ���������� ,:*�9) ,:*�)$ ,:*)),()�� ���������� ,7*�(8 ,7*,�: ,7*()7((�� ���������� ,�*7)8 ,�*$�8 ,$*$,)
����� �� ��)����� ���������� ��� �� ��)����� ��"��� �� ����������� ��� ��� �������������� 6���
����� ����� �� �������� ���� ��� ���� �'����� ���!���� �� ��� ������ ���������� ��� ����
��� ���� �'����� ���!���� ������ ��� ���'������������ +� ������ �� �"������������ �� ��� ����
������ ��� ������ � +���� ���� ���������� E�"��������� �� �� ��� ���� +� ��� ��� ��������� ��
��� �����'� �� � ��� ����������� 1�"��� ���� ��� �� ������� ���� ��� ��������� �� ���� ������
��� 9���� �������� �"�� �� ��� ������ ����������� ��� ������ ��"��� �� ������������ �� ����������
��� ��� ���� ���������� �� "���������� ��������� � +���� ���� ��������� +��� � ���� ������ ������
���� � ��� ������ �� ���=D ��8 � �+ �� �� ���� �� 6378 � �+�
0� ��� ��� ��������� ���� ������� ��� ��� ������ �������� ����� ��� ��������� ���� � ���� ���
����� �� ���� ��� ��� ���� ����������� ��������� F�� ��� �� ��� ��������� ���� � �� ��� ����
����������� ��+�"��� +� +���� ������� ���� ���� ������� +���� ������ �������� �� ����� �����
���� ������ ���� �� �� ��� �
� � �� ����������
6�� ���� ������ ���!��� ��� �� 9���������"� �'������ ���� ��+���� ���'����� � ���������� ���
������� ���� ������� ��� ��� ������ ����������� ������ ��� ����� ��� ��� ���'������������
���� ��� �� ���� �� �������� ����� �� �������� �� ������ �������������� 2� ���� ����� � ���
���������� �� ��� ���'����������� ��� �� ���������� E�"���������� +� ����� ����� �������� ����
������ �� "�������� �� ����������� ��������������� ������ ������ ��������
��� ��� ���� �� ��������� �� � ���
&�� ��� ���������� ��������� �� �� ��������� �������� ���� �)���� ���� ����� �� ��� ������
�� ������� ���� ������� �� ���'����� � ����������� ������ ���� ����� �� ��� �� ������� ��"����
-������ �� �� �������� ������� �G���� ��� �� ��������� �������� ��������� �� �� �������� ���
��"������ ������� ���� ������ ��� �� ���� ����������� �� ���=�D�6%�� ���� ��������"� ������
�������/ ������� �� ����� ����������� �� �������� �)���� ������� ���������"� ��������������/ ����
�������� �� ������������ �)���� ���+��� ������ ��� ������ �������� ���� ������ ���� �� �����
� ������ �� � ���� �������"� ���� ������� ,-������.� %�������� �� &���� ���4� @����"��� ���
��� ���������� �������� �����"������ +��� � ������� ���� �� ���� ������ �� ���=�D�6%�� ���
�� �'���������� �� ��� ���� 637 ���� �� ���� ������ ��� � ��'���� �� ���'����� � �����������
6�� ��� ������ ��� ���'����������� ���� �������� ��������� �� ��� ����� �� ��� $%��� $%�&�
��� ���'����� � $% ���� � ������������ ��� ������ ��� ���� ������� ����� �� ��� �'����������
������� ��� ����������� �� ����������� ��� ���������� �)���� ���� ��� �� ��� ��� ���� ��
��"���� �)����*����� %H$�8 ���������� 3I&��������� ��+������������ ��� �'�����"� ������*
��� �� ��������� "���� �������"��� ,����� 4� (� �� �������� ���� ���� �'������ ��������� �'������
��� "���������� �� ����� ���������� +����� ��� �����������
2� ��� ����� ����� ��� ���� �������� �"�� �� ��� ������� �������� ���� ��� ������ ����+
��� ���� ������� ���� +��� ����������� �� ��� �'���������� ������ +��� �����"�� ���������
���������� �� ��"���� ������ �)����� ����� ��"���������� �������'����� ��� ����������"� ��'�����
���� ������ ���� �� �� ��� �
,����� 4� &�� ����� �)����� ��������� ����� ��� ��������� �������� ����+ +���� ��� ��� ��
������� �� �� ����������� +������ 9���������� ���� �'��� ��+ ��� � 6��� ����� �� ��� ����������
���� ��� ��� ������ ���'����������� +���� ���� �� ���� ��� �� �����+�� �� ��� �����+��� ����� �� �
���������� �'���� �� ��"���� ������ �)����� (� ���� ���� ��+�"��� �'����� ���� � ������� ������
�� ������ ����� ��� ������� �'����� +��� ������ �'�������� ��"���� ������ �)����� -�"���� �� ���
������ ���� ������� ��� ����� �� ��� ��+��� �����"�� ��"���� �)��� ��"�� ,F2�3F4� +������
��+��� ��� ���� �� �����"�� ��"���� �)��� ��"�� ,E2�3F4� -��� �� ��� ��"���� �)���� ����
������� ������� ����� �� ��+�� �'������ ��"���� @����"��� +����� ��� ����� ���������� ����
����� �� ���� �������"� ���� ������� 6�� ��� ���������� �������� ���������� ���������� 0����
��"���� �)���� �� ��� ��!�� ���� �� ��� ���������� ������ 9���� ���� ���� ������ �)���� �� �
����� �������� �� ��� ������� �'����� ���!���� ������ ��������� 6��� ����� ������������ �� ��
�������� ��� +���� ���� +��� �������� ������ ��� ���'����������� �� ������ �������� �������
������ 6�� �����+��� �� ����� �)���� ������ ��9���� � �������� ��������������� ����� �� ���������
���� ��"� ���� ���� �'����� ���� ������� ����� ���!���� ���� ��9����� ����� ���� �������� ����
������������ ���� �� ������
��� ��� ���� �� �����! ���� � �" � ������� ������ �� #�
����� ���� �" �"����
6%�� ��� ���'����� � ���������� ��� ������������ �� ��� �'���������� ������ �� ��� ����� ��
� ������ ��������� �)���� (� ���� ����� 3������� ����������� ��������� ����� ��� ���������
���������� ���������� ���� ����+ � ������� ���� �� ���� ������ ��� ����������� �� ������ ��
����������� (� ����� �� ���� �'��� ��+ ��� �� ��� 9�����.��� ������������ �� ��� �� ���������
���� ����� ���� �� ���� �� �� � ���� ������ �� �� �� 6378 � �+ ,�# ��"���� �� �
����������� ������ �� �4� ��� ������ ��� +���� �� ����������� 6��� ����� �� ��� ���������� ����
��� ��� ������ ���'����������� +����� ���� �� ���� ��� �� �����+�� �� ��� �����+��� ����� ��
�� �'���� �� ������� �� ��� �����������
�������� �����+��� �����9���������"� ����������� ����� �� ����� ����������� ���������� ���
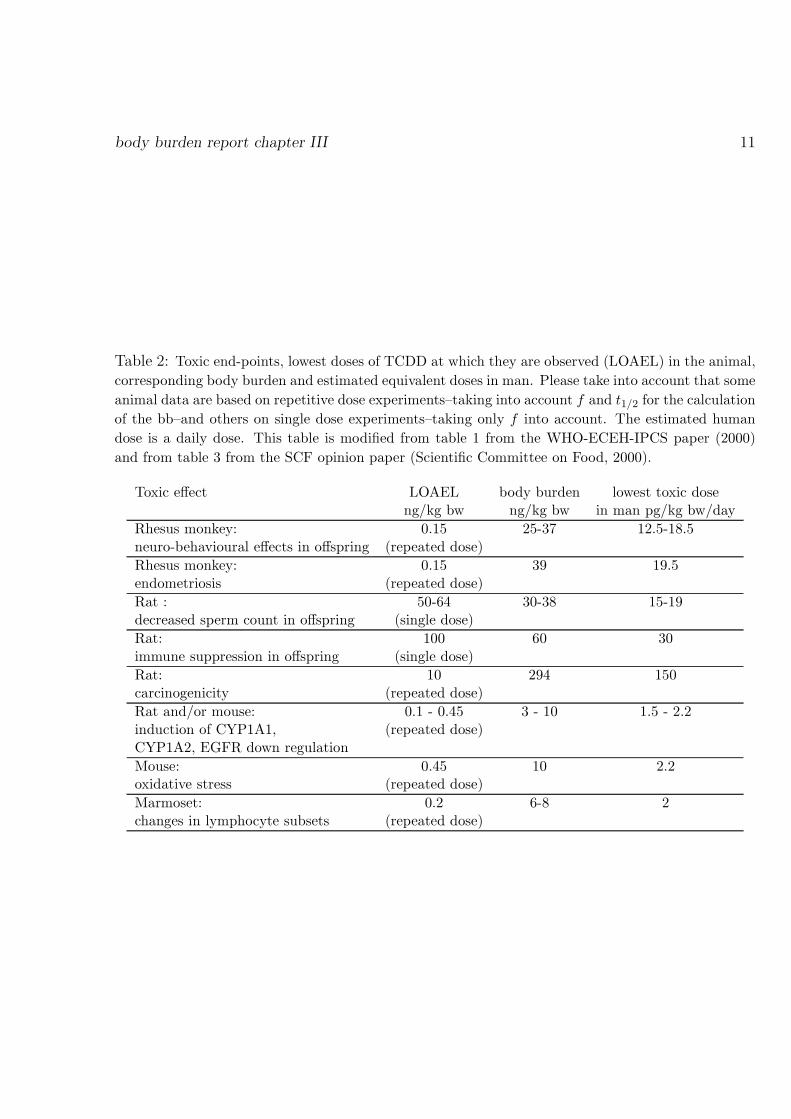
���� ������ ���� �� �� ���
6���� : ��-�� �� .����� ��+�� �� �" �#;; �� +���� ���� ��� ����0� %�< 4�& �� ��� �������������� ��! �� � ��� �� �� ������� �=��0����� �� �� ���* 1���� ���� ���� ������� ���� ���
������ ��� ��� ��� �� ��������0� �� �-��������������! ���� ������� � �� ���� "�� ��� �����������
�" ��� ����� ����� �� ��!�� �� �-��������������! ���� � ���� �������* ��� ������� �����
�� � � ���� ��* ��� ����� � �� ��� "��� ����� , "��� ��� �><.4#4>.?1#2 ����� %:���&
�� "��� ����� 7 "��� ��� 2#@ ������� ����� %2�������� #�������� �� @�� :���&*
��-�� �3��� �< 4� �� � ��� �� ��+�� ��-�� ���!6�! �+ �!6�! �+ �� ��� �!6�! �+6 ��
A��� ������B �*,� :�.7) ,:*�.,8*������.����0������ �3��� �� �3����! %������� ��&
A��� ������B �*,� 7( ,(*��� �������� %������� ��&
A�� B ��.$9 7�.78 ,�.,( ������ ���� ����� �� �3����! %��!�� ��&
A��B ,�� $� 7������� �������� �� �3����! %��!�� ��&
A��B ,� :(9 ,���������!������� %������� ��&
A�� �� 6�� ����B �*, . �*9� 7 . ,� ,*� . :*:�� ������ �" #C1, , %������� ��&#C1, : 4�@A �+� ��!�������
D���B �*9� ,� :*:�-� ���0� ��� %������� ��&
D������B �*: $.8 :����!� �� ���������� ���� %������� ��&
���� ������ ���� �� �� ���
������ ��������� ���� � �� ���'����� � ����������� ����� �"��������� �� ��� ������ ���'�����������
���� ���� �� ��� ���������� ���� ���� ������� +���� ��"� �� ������ �� ������ ������ , ������
�� ���� ���/ ������� ���/ 6������� �� ���� ���/ 3-& ��+� �������� ���4�
��� $� �� ����� �� �����! �%��� �" � ������� ������ �� �&��
#� ����� ���� �" �"����
6�� J-3$�� �� ���� ������ ��� 3������� ����������� �� ��� ������ � ��������� ��� ������
��������� ������� @������������� �� ��� ����� ����� ���� � +��� ��� ��A ����� ���.�����
������ ������� ,9K� �'���������� ���� ������ ����4 ����� �� �� ��A ����� ���.����� �����
�� �'���� ������ ������ ����� �'���� ������ �� �� ������� �� �'����� �� ?�# �� 6%��8 �
�+8���� 6��� ��A ����� ���.����� ������ ��+�"��� ���"���� �� ����� ��� �������� ����
�� 9���� ������"���"�� ��� ���� ��� ����� ���� �� ��� ���� ��+�� ,F�"��� ��� 6������ ��?/
%����� ��?4� 0��� ������ �� ���'����� � ����������� �� ����� ���������� ��� ���� �����
�� ������ ��������� �� �� ������������ ������ �'����� �� ���=�D�6%��� ���� �'���� ������
����� �� �� �� �� ������ �'����� �� �� 6378 � �+8��� , ����� �� ���� ��D/ &������L�����
���4� 2� ��� ����� �� ���� ��� �� ������������ 1��� ��� C�� F����� � ��������� ��� �����
����� �� �'���� ������ ������ �����+��� �'������ �� ���'����� � ���������� ������ ��� ������
���'����������� �� D���� ����� ,1���� ���/ "�� F����� � �� ���� ��4� 6��� .���� �� D���� �����
�"�� =� ����� ������ �� �������� �� ��� �'������ ������ ����� ���� �� �������� �� ���������
����� �"�� =� ����� �� ��� ������ ����������� (� ������ �� ����� ���� ����� ������� �������
��������� ��� ���� ���� ���� .���� �� �� ����� �������� ��� ���� �� ������� ��� ������ �����
�� ���� ��+��� 1�+�"��� �� ��� ������� �� M��� �������������N ���� ������������� �������
��������� ����� �� ����� ��� ������ ��� ��� ���� .���� +���� �� �� �� ��� �������� �� ����� ��
���� �� ��� ������� �� D���� �'���� ����� .����� �� ��"���� ��������� �� ��� ���� �����
(� +� �����+ ��� ���� ��+ ���� �'�����������*����������� ��� ��������� ���� � �� ���'����� �
���������� ��� ���� ���������� �� ��� ���������� ���������� ��� �"������� �� �"�� =� �����*+�
����� �� ��� ���� �� ��� ������ ����������� ��"��� �� � ��+�� ����� �������� �� �'���� ������
���� ������ ���� �� �� ��� �
������ �� == ��� �� ����� ����� �������� �� ==�� �� ��� +���� ���� ���������� ��A �����������
��"��� ��� .����� ������ ?#D ��� ?�#== ��������"���� 0� ������� ��+�"��� �� ������� ���� ����
��� �� ������������ +���� ���"��� ������� �� ��� ���������� ����������� �� ������� ��"����
������ �)���� �� � ���������� ��������� ,%����� ��?4�
��� '�$$! '�$(! �) ��� �� '��� �� ���� �) ��� �� '���
2�� ��� ���������� �� ����� ����� �� ��� 9���������"� �'������ ���������� ��+���� ���'����� �
������������� �������'����� � $% � +��� ��� ��������� 6�� ������ ��� ���� �� 4 ���� ��� ����
�� ��� ��� �������������� ������� �� ������ ���� ����� �� ��� ������ ���������� ������ �'���
��� 4 ���� ��� 9���������"� ��>��� ���������� �� �������'����� � $% � ��� ��� ���� �������
�� ����� �� �� ��� ���� ���� ��� ��� ���'����� � ����������� 6��� �� ���� �������>�� �� 1����
+�� ������� ���� �������'����� � $% � +���� �� ����������� ��� ���� �� ��� D���� �'����
������ ������ ,1���� ���/ C�� F����� �� ��4� 6��� ���� �������� �� ���� ���������� ���
9���������"� ��'����� �� ��'����� �� �������'����� � $% �� ��� ��� ����"���� �� ��� = ��� ��
$% - �� ���� ��'������ +� ������ �� ����� ��� ��� ���������� �� ��� ���� ��'�� ���'����� �
�����������
���� ������ ���� �� �� ��� #
� ������� ���
� 2� ��� ����� �� � ������ ������������� ������ ���� ������� �� ��� ��� �� $%����
$%�&�� ��� ���'����� � $% � +��� ��������� �� ��� ����� �� ��� ��� ������ ����� ���� �
�� ����������� ��� �� �������� ��������� 6�� ���9����� ������������ �� "���������� �����
�� ���� ������� ���� ��� ���������� �� ���� ������� ��������� �� ��� �����������
� �� ��� ��� �� � # ����� ���'����������� ������� ��������� �� ��� ���� �� ? ��� ?�� �
�������� �������� �� ���� ������ +�� ���������� 6�� ������� "���� �������� +�� ����
�� 6378 � �+ �� ��� ���� ���������� �� ��� ����������� ��� �� ��� ��A ����� �����
����������� ��"��� 6��� ��� ��������� �� �"������������ ����� ���� ���������� �������
���� ��� ������ �� ��� ���� ���������� �� ��� ������ ���� � ���� +�� ��� ������ �� ���
���� ���������� ������ ��� ���'������������ +���� �� ��� ��� �����
� � ���������� �� ��� ���� ������� ��������� �� ��� ��� �� ��� ���'����������� +��� ����
������� ���� ��� ����������� �� ��� �'���������� ������ +��� �� �����"�� ���������
��������� �� ��"���� ������ �)����� �������� ���� �� ��!�� ������ �)���� +��� ������ ����
��� ���'����������� �� ��� ������� ����������� (� ���� ��� ��+�"�� �'����� ���� ���� ��
��� ���!���� ��������� �'����� �� ��� ������� ��"��� �� ������������� ������ ��� ��������
����� ��"� �� ��������� ��� �� ��"������� ���� ��"���� �)���� 6��� ���� ��������
������� �� +���� +�� +��� �������� �� ������ �������� ������ �� ������� ����� ���
�������� ������ ��� +�� ��� ������ ������ �� ���� ���� ������������ ���� �� ������

Literature
body burden report literature references 2
Ahlborg UG, Becking GC, Birnbaum LS, Brouwer A, Derks HJGM, Feeley M, Golor G, Hanberg A, Larsen JC, Liem AKD, Safe SH, Schlatter C, Wærn F, Younes M, Yrjänkeikki E (1994)
Toxic equivalency factors for dioxin-like PCBs. Report on a WHO-ECEH and IPCS consultation, December 1993. Chemosphere 28: 1049-1067.
Ashraf H (1999) European dioxin-contaminated food crisis grows and grows. The Lancet 353: 2049.
Bailey S, Buynan PJ (1972) Interpretation of persistence and effects of polychlorinated biphenyls in birds. Nature 236: 34-36
Baker JI, Hites RA (2000) Is combustion the major source of polychlorinated dibenzo-p-dioxins and dibenzofurans to the environment? A mass balance investigation. Environ Sci Technol 34: 2879-2886.
Baker SG (1994) The Multinomial-Poisson transformation. The Statistician 43 (4): 495-504.
Ballschmiter K, Zell M (1980) Analysis of polychlorinated biphenyls (PCB) by glass capillary gas chromotography: Composition of technical Aroclor- and Clophen PCB mixtures. Fres Z Anal Chem 302: 1049-1067.
Becher H, Steindorf K, Flesch-Janys D (1998) Quantitative cancer risk assessment for dioxins using an occupational cohort. Environ Health Perspect 106 S2: 663-670.
Beernaert, De Poorter G (1999) Personal communication.
Bernard A (2000) La crise PCB/dioxine en Belgique: analyse de la contamination et evaluation des risques pour la santé. In “Parlementair onderzoek naar de belgische vlees-, zuivel- en eierproductie en naar de politieke verantwoordelijkheden in het licht van de zogenaamde dioxinecrisis”. Belgische Kamer van Volksvertegenwoordigers. Doc 50 0018/007, 40-50.
Bernard A, Hermans C, Broeckaert F, De Poorter G, De Cock A, Houins G (1999) Food contamination by PCBs and dioxins. An isolated episode in Belgium is unlikely to have affected public health. Nature 401: 231-232.
Birnbaum LS (1994) The mechanism of dioxin toxicity: relationship to risk assessment. Environ Health Perspect 102 S9: 157-167.
Boon JP, Reijnders PJH, Dols J, Wensvoort P, Hillebrand MTJ (1987) The kinetics of individual polychlorinated biphenyl congeners in female harbour seals (Phoca vitulina), with evidence for structure related metabolism. Aquat Toxicol 10: 307-324.
body burden report literature references 3
Buekens A, Stieglitz L, Huang H, Cornelis E (1998) Formation of dioxin in industrial combustors and pyrometallurgical plants. Environ Engrg Sci 15: 29-36.
Buekens A, Cornelis E, Huang H, Dewettinck T (2000) Fingerprints of dioxin from thermal industrial processes. Chemosphere 40: 1021-1024.
Buser HR (1985) Formation, occurrence and analysis of polychlorinated dibenzofurans, dioxins and related compounds. Environ Health Perspect 60: 259-267.
Clapp R, Ozonoff R (2000) Where the boys aren’t: dioxin and the sex ratio. The Lancet 355: 1838-1839.
Crump KS (1996) The linearized multistage model and the future of quantitative risk assessment. Human Exper Toxicol 15: 787-798.
Cullen AC, Frey HC (1999) Probabilistic Techniques in Exposure Assessment. New York and London: Plenum Press.
De Boer J, Stronck CJN, Traag WA, van der Meer J (1993) Non-ortho and mono-ortho substituted chlorobiphenyls and chlorinated dibenzo-p-dioxins and dibenzofurans in marine and freshwater fish and shellfish from the netherlands. Chemosphere 26: 1823-1843.
De Cock A (2000) De centrale gegevensbank tijdens de Belgische dioxinecrisis: cijfers en grafieken. Stagewerk bij Ministerie van Middenstand en Landbouw, Inspectie-generaal Grondstoffen en Verwerkte producten.
Denison MS, Heath-Pagliuso S (1998) The Ah receptor: a regulator of the biochemical and toxicological actions of structurally diverse chemicals. Bull Environ Contam Toxicol 61: 557-568.
De Pauw E (2001) A Belgian food contamination control program (Institute for Veterinary Control, IVK-IEV). Analytical results for PCDD, PCDF, and dioxin-like PCB, personal communication.
De Wit C, Jansson B, Bergek S, Hjelt M, Rappe C, Olsson M, Andersson O (1992) Polychlorinated dibenzo-p-dioxin and polychlorinated dibenzofuran levels and patterns in fish and fish-eating wildlife in the baltic sea. Chemosphere 25(1-2): 185-188.
Dioxin follow-up group (2000) Uitslagen van dioxinebepalingen in Belgishe mengmelk / Résultats des analyses de dioxines dans le lait de mélange Belge. Scientific Institute of Public Health, Brussels.
body burden report literature references 4
Domingo JL, Schuhmacher M, Granero S, Llobet JM, de Kok HAM (1999) PCDD/F levels in the vicinity of an old municipal solid waste incinerator: temporal variation in soils. Arch Environ Contam Toxicol 36: 377-383.
ESF news release (2000) European Science Foundation Workshop on Dioxin Food Contamination. Bayreuth, September 29 – October 1, 2000. http://www.esf.org/update/news/00/dioxin.htm.
Ferguson GM (1998) Use of congener-specific chemical fingerprints in the environmental health risk assessment of releases from a PCB incineration facility. MSc. Thesis. Waterloo, Ontario, Canada.
Flesch-Janys D (2000) Exposure assessment and dose-response relationship for PCDD/F and cancer mortality and implications for risk assessment. In “Proceedings of the Workshop on possible health implications of the dioxin crisis”. Verhandelingen van de Koninklijke Academie voor Geneeskunde van België 112: 90-91.
Focant JF, Eppe G, Houziaux JS, Xhrouet C, André JE, Dipede D, De Pauw E (2000) Contribution and importance of non-ortho (coplanar) PCBs for the I-TEQ evaluation in “dioxins analysis” of biological matrices. Proceedings of the 20th International Symposium on Halogenated Environmental Organic Polluants & POPS 48: 312-315.
Foster EP, Drake D, Farlow R (1999) Polychlorinated dibenzo-p-dioxin and polychlorinated dibensofuran congener profiles in fish, crayfish and sediment collected near a wood treating fecility and a bleached kraft pulp mill. Bull Environ Contam Toxicol 62: 239-246.
Fries GF, Paustenbach DJ, Mather DB, Luksemburg WJ (1999) A congener specific evaluation of transfer of chlorinated dibenzo-p-dioxins and dibenzofurans to milk of cows following ingestion of pentachlorophenol-treated wood. Environ Sci Technol 33: 1165-1170.
Gilliom RJ, Helsel DR (1986) Estimation of distributional parameters for censored trace level water quality data: 1. Estimation techniques. Water resources Research 22(2): 135-146.
Hansen LG, Welborn ME, Borchard RE, Teske RH, Metcalf (1977) Tissue distribution of PCB components in swine and sheep fed three ratios containing aroclors 1242 and 1254. Arch Environ Contam Toxicol 5: 257-278.
Helsel DR (1990) Less than obvious: statistical treatment of data below the detection limit, ES & T features. Environ Sci Technol 24(12): 1767-1774.
body burden report literature references 5
Hens L (2000) Gezondheidsaspecten van blootstelling aan dioxins, furanen en bifenylen in België. In “Parlementair onderzoek naar de belgische vlees-, zuivel- en eierproductie en naar de politieke verantwoordelijkheden in het licht van de zogenaamde dioxinecrisis”. Belgische Kamer van Volksvertegenwoordigers. Doc 50 0018/007, 72-84.
Hoogerbrugge R, Freijer JI, Liem AKD, Traag WA, Hoogenboom LAP, van Klaveren JD (2001) Relationship between critical levels and estimated percentage of non compliance and effect on intakes, personal communication.
Johnson RA, Wichern DW (1992) Applied multivariate statistical analysis. Third edition. Prentice Hall, inc. New Jersey.
Kreuzer PE, Csanady GyA, Baur C, Kessler W, Päpke O, Greim H, Filser JG (1997) 2,3,7,8-Tetrachlorodibenzo-p-dioxin (TCDD) and congeners in infants. A toxicokinetic model of human lifetime body burden by TCDD with special emphasis on its uptake by nutrition. Arch Toxicol 71: 383-400.
Leonards PEG, Lohman M, de Wit MM, Booy G, Brandsma SH, de Boer J (2000) Actuele situatie van gechloreerde dioxines, furanen en polychloorbifenylen in visserij-producten: Quick- en Full-scan. RIVO rapport nummer C034/00.
Liebman SA, Ahlstrom DH, Hoke TA (1978) Multivariate profile analysis of gas chromatograms. Chromatographia 11(8): 427-429.
Liem AKD, Theelen RMC (1997) Dioxins: chemical analysis, exposure and risk assessment. Thesis University Utrecht. ISBN 90-393-2012-8.
Lovell DP, Thomas G (1996) Quantitative risk assessment and the limitations of the linearized multistage model. Human Exper Toxicol 15: 87-104.
Luotamo M, Jarvisalo J, Aitio A (1991) Assessment of exposure to polychlorinated biphenyls: analysis of selected isomers in blood and adipose tissue. Environ Res 54: 121-134.
MacDonald RJ, Norstrom RJ, Turle R (1992) Application of pattern recognition techniques to assessment of biomagnification and sources of polychlorinated multicomponent pollutants, such as PCBs, PCDDs and PCDFs. Chemosphere 25(1-2): 129-134.
McFarland VA, Clarke JU (1989) Environmental occurrence, abundance, and potential toxicity of polychlorinated biphenyl congeners: considerations for a congener-specific analysis. Environ Health Perspect 81: 225-239.
Nationaal Instituut voor de Statistiek (2000) Landbouwstatistieken, landbouw- en tuinbouwtelling op 15 mei 1999. Ministerie van Economische Zaken. Brussel.
body burden report literature references 6
NEVO (1996) NEVO Tabel. Nederlands voedingstoffenbestand. Velotekst, Den Haag.
Newman MC, Dixon PM, Looney B, Pinder JE (1989) Estimating mean variance for environmental samples with below detection limit observations. Water resources bulletin 25(4): 905-916.
Norwood CB, Hackett M, Pruell RJ, Butterworth BC, Williamson KJ, Naumann SM (1989) Polychlorinated dibenzo-p-dioxins and dibenzofurans in selected estuarine sediments. Chemosphere 18: 553-560.
NUBEL (1999) Belgische Voedingsmiddelentabel. 3de editie. VZW NUBEL, Brussels.
Owen WJ, DeRouen TA (1981) Estimation of the mean for lognormal data containing zeroes and left-censored values, with applications to the measurement of worker exposure to air contaminants. Biometrics 36: 707-719.
Patandin S, Dagnelie PC, Mulder PGH, Op de Coul E, van der Veen JE, Weisglas-Kuperus N, Sauer PJJ (1999)
Dietary exposure to polychlorinated biphenyls and dioxins from infancy until adulthood: a comparison between breast-feeding, toddler, and long-term exposure. Environ Health Perspect 107: 45-51.
Rencher AC (1995) Methods of multivariate analysis. Chapter 12: Principal component analysis. Wiley series in probability and mathematical statistics. John Wiley and sons, inc. New York.
Safe S (1994) Polychlorinated biphenyls (PCBs): Environmental impact, biochemical and toxic responses, and implications for risk assessment. Crit Rev Toxicol 24(2): 87-149.
Safe S (1997/98) Limitations of the toxic equivalency factor approach for risk assessment of TCDD and related compounds. Teratog Carcinog Mutagen 17 (4-5): 285 – 304.
Safe S, Bandiera S, Sawyer T, Robertson L, Parkinson A, Thomas PE, Ryan DE, Reik LM, Levin W, Denomme MA, Fujita T (1985)
PCBs: structure-function relationships and mechanism of action. Environ Health Perspect 60: 47-56.
Schoeters G (2000) Samenvatting van het toxicologie luik “Milieu en Gezondheid”. In KUL, VITO, RUG, PIH, UIA “Milieu en Gezondheid in Vlaanderen”. http://www.wvc.vlaanderen.be/gezondmilieu/onderzoek/toxicologie/pdf/koepeltekst.pdf.
Schuhmacher M, Granero S, Rivera J, Müller L, Llobet JM, Domingo JL (2000) Atmospheric deposition of PCDD/Fs near an old municipal solid waste incinerator: levels in soil and vegetation. Chemosphere 40: 593-600.
body burden report literature references 7
Schwartz TR, Stalling DL (1991) Chemometric comparison of polychlorinated biphenyl residues in toxicologically active polychlorinated biphenyl congeners in the eggs of Forster’s terns (Sterna fosteri). Arch Environ Contam Toxicol 20: 183-199.
Scientific Committee on Food (2000) Opinion of the SCF on the risk assessment of dioxins and dioxin-like PCBs in food. SCF/CS/CNTM/DIOXIN/8 Final. http://www.europa.eu.int/comm/food/fs/sc/scf/index_en.html.
Serrano R, Fernandez M, Rabanal R, Hernandez M, Gonzalez MJ (2000) Congener-specific determination of polychlorinated biphenyls in shark and grouper livers from the Northwest African Atlantic Ocean. Arch Environ Contam Toxicol 38: 217-224.
Shiu WY, Doucette W, Gobas FAPC, Andren A, Mackay D (1988) Physical-chemical properties of chlorinated dibenzo-p-dioxins. Environ Sci Technol 22: 651-658.
Slymen DJ, de Peyster A (1994) Hypothesis testing with values below detection limit in environmental studies. Environ Sci Technol 28: 898-902.
Souci SW, Fachmann W, Kraut H (2000) Souci Fachmann Kraut Food Composition and Nutrition Tables. 6th revised and completed edition. Medpharm Scientific Publishers Stuttgart, CRC Press, London.
Spiegelhalter DJ, Thomas A, Best NG, Gilks WR (1995) BUGS: Bayesian Inference Using Gibbs Sampling, version 0.50. MRC Biostatistics Unit, Cambridge, UK.
Stalling DL, Peterman PH, Smith LM, Norstrom RJ, Simon M (1986) Use of pattern recognition in the evaluation of PCDD and PCDF residue data from GC/MS analyses. Chemosphere 15(9-12): 1435-1443.
Stalling DL, Petty JD, Smith LM, Dunn WJ (1986) Dioxins and furans in the environment: a problem for chemometrics. In: Kamin MA, Rudgers PW Eds. Dioxins in the environment. Hemosphere publishing company. Washington DC, pp 101-126.
Storr-Hansen E, Spliid H, Boon JP (1995) Patterns of chlorinated biphenyl congeners in harbor seals (Phoca vitulina) and in their food: Statistical analysis. Arch Environ Contam Toxicol 28: 48-54.
Talloen W, Vrijens B, Vleminckx M, De Cock A, De Poorter G, Srebrnik S, Goeyens L, Willems J (2000)
A statistical method for the analysis of PCB profiles in the presence of values below the detection limit. Organohalogen compounds 45: 9-12.
Townsend DI (1986) The use of isomer specific data to characterize and differentiate sources of dioxins into the environment. Chemosphere 15: 1461-1466.
body burden report literature references 8
Tuomisto J, Vartiainen T, Tuomisto JT (1999) Synopsis on dioxins and PCBs. KTL (National Public Health Institute, Finland), Division of Environmental Health Finland. Http://www.ktl.fi/dioxin.
USEPA (2001) EPA Note to correspondents. FDA and EPA issue advisories on fish. Released January 12, 2001. Http://www.fda.gov.
van den Berg M, Birnbaum L, Bosveld BTC, Brunström B, Cook P, Feeley M, Giesy JP, Hanberg A, Hasegawa R, Kennedy SW, Kubiak T, Larsen JC, van Leeuwen FXR, Liem AKD, Nolt C, Peterson RE, Poellinger L, Safe S, Schrenk D, Tillitt D, Tysklind M, Younes M, Waern F, Zacharewski T (1998)
Toxic equivalency factors (TEFs) for PCBs, PCDDs, PCDFs for humans and wildlife. Environ Health Perspect 106: 775-792.
van den Berg M, Peterson RE, Schrenk D (2000) Human risk assessment and TEFs. Food Add Contam 17: 347-358.
van der Molen GW, Kooijman SALM, Slob W (1996) A generic toxicokinetic model for persistent lipophilic compounds in humans: an application to TCDD. Fund Appl Toxicol 31: 83-94.
Van Larebeke N, Hens L, Schepens P, Covaci A, Baeyens J, Everaert K, Bernheim JL, Vlietinck R, De Poorter G (2001)
The Belgian PCB and dioxin incident of January-June 1999: exposure data and potential impact on health. Environ Health Perspect 109: 265-273.
Wenning RJ, Paustenbach D, Johnson G, Ehrlic R, Harris M, Bedbury H (1993) Chemometric analysis of potential sources of polychlorinated dibenzo-p-dioxins and dibenzofurans in surficial sediments from Newark Bay, New Jersey. Chemosphere 27(1-3): 55-64.
WHO (1999) Consultation on assessment of the health risk of dioxins: re-evaluation of the tolerable daily intake (TDI). Executive Summary. Document EHBI 010201, September 1999, WHO European Center for Environment and Health, Bilthoven Division.
WHO-ECEH-IPCS (2000) Consultation on assessment of the health risks of dioxins; re-evaluation of the tolerable daily intake (TDI): Executive Summary. Food Add Contam 17: 223-240.
Willems JL (2000) The Belgian dioxin accident: risk assessment and risk communication. In “Proceedings of the Workshop on possible health implications of the dioxin crisis”. Verhandelingen van de Koninklijke Academie voor Geneeskunde van België 112: 84-86.
Zitko V (1989) Composition of chlorinated dibenzodioxins and dibenzofurans in various samples. Sci Total Environ 80: 127-137.

����� �
����� ��� ��
���� ������ ���� �����
��������
� ����� ��� �� ������� �
� � ����� �� ������ � ����� �
� ���� ����� ����� ������ �
� �������� ���� ������ �� ����� ����� �� ������ ���� ��� !
���� ������ ���� ����� �
� ����� ��� �� �������
����� ��� �� ��� ����� ����� ���������� �������� ����� �� ������� �� ��� ����������� �� ���
���� ������ �� ������������� � ����� �� ��� ��� ��� ���������!���� ����� ���� ���� � �����
!����� ��� ��� !����� �� ����� ����������" #���� !����� ��� �������� �� ��� ����� �� ���
����������� ����������� �� ���� ���������" $���� ����� ��� �������� ����� ���������� %���
������������ ��� !���� ���� ���� �� ������ �������������� �� ���� ���������� �� ��� ����������"
#�� ����� ����� ���������� ��� �� ���� �� ���!� ��� � ��� �� ������ ���� � ����� �� �
���������� %���� � �� ��� ������ �� ��� �� !�������� ���� ��� ������ �� ��� �� ��" &� ���
�%� ���������� ����������� �� �� �� �� ���������� �%� � ����� ������� �� !��������" #�� '���
������� ���%���(���)��� !��������� �� � �������� �� ��� ������ ��� �� �� �� ����������*� ��
!��������� �� ��������������� ���%��� �� �!� ���� ���� ����������� �� %������� �� !���������
�� ��� ��� �������������" #�� ����� ������� ������������ �� � �������� �� ��� ������� �� ��
����������*� �� ����������� �� ��� ������ ����������� �� �� ����������� �� �� ������ ��*�"
+� �� �� �� ��������� ����������� �!�� ��� ������ �� ��� ����������� �� ���� �� ������� �� ���
��������� �� �� ������ %��� �� �" #���� ��� ���� ��� �� ����������� �� ��������� ������
��� ���%���(���)��� !�������� �� ������ %�� ������� ������� ,�� ������������" #�� ������ ��
� �%� ���������� ����� ���� ��!��� ��� ���� ����������� �� �������������� � ��� �� !����� ���
��� �� �� ������ !�������� %���� ��� �� ������ ������������� �� �� ���� %��� �� �-������������
�� ����������� �����!� ��� �� ���" #��� ������ �� �� �!������ ��� ��������!� �����������
�������� �� ��� ��������� �� ���� ���%���(���)��� !�������� �� �����������"
#�� ��������� �� ��� ��������!� ����������� �������� ��� ����������� ���� ������ ���� ��(
������� �� ����������� ������ �� ��� ���� ���� ����������" .����������� ��� ��������!�
����������� �������� ����%� ��� /���������!� ������� ����� ��� ��� ����������� �� ��� �������(
����" �������� ��� ���������� �� ������ !����� ��� �� �� ����� ���������� �� �������������� ���
�-������� �� ��� �� �� ��� � ��!�� ��� �� �������� �� ����������� ������� ������������" #�� � (
!������ �� ����� ����� ����� �� ��%�!��� �� ���� ����� ������������ ����������� ��� �������
���� ������ ���� ����� 0
�� � ������ ���� ���� � ��������� �������� ���� ��� �������!��� �� ��� �� �� �� !��������� �� ���
����� ����������� �� %��� �� ���� ��� ��������� �� ��������� ��� ���������� �������" +� ����%�
��� �� ����� �� ��� ��� ���� �� ����������� ����������� ��� %���� !����� ��� �� �������� �� �
��������� ������ ���� ��������� �� ����� %���� ��� ������������ ���������" ��� ��� �����������
�������� %��� ��� ����� ��� $(1��� ��� ����%��� �1����������� ������� � ���� $��� +���"
� � ����� �� ������ � �����
+� �� �� �� ��������� !���������� %������ ��� � ������� )� ����� ����� ��� �������������
������� ��������� �� 2�� �������� ������������ %��� ��� " +� ��� ��������� ������������ !��(
��� ��� ������� ��� ���� ������ ����� ��� �����!������� %��� �����������" +� ��� ��������
������������ ��� '���� ����� �� �������� !����� �� �!� � ���� ���(�����!���" &����� ���� ���(
�����!��� !����� ��� ������ ��������� ����� ��� �� ��� �����!� ���/�����" #�� ���� �����
�� �������� %�� �������� �� ����� %���� ���� � ����� ������ ��*� %�� �!�������" #���� �����(
������� ��� �� ��� �� ��������� ��� ��� �� � ���������� �����"
� ���� ����� ����� ������
.�� ����������� ��� %��� ����� ���� �%� ������ �-������ �������� ���� ������ ���!���
������ ��� �� �� �!� ��� ��!��� ��� 3$�� � �� ������ ������ �� 0(4 ����� �� � ��������� ��
��� ������ �� 5����6 �� ��� 3$�� � �� ��� /������ �� ���� ����� ��� ��� �� 7, ����� �� 8������6"
#�� '��� ��� � %�� ������ ��� �� ��� ������ �� ��9" :� ��� ����� �� ������� ��������� ������
��� ����� �� ���� �� ��������� � ����� �� �0 � ��������� �� ���� �� ������ %��� �������
���� 7 ����� ��� ������� �� ��� ������ �� 5����" #�� �������� %�� ��� �� ���� � %�� ���� ���
����� �� ������� ����!��� �� ������� �� ���� �� ��� � ��������� ��!��� %��� ���������� �� ���
������" ;������ ������ %��� ������� �� ��� ����� �� � <9( �� �������� ��� ����� ����� <"
.�� ���� �������� � ����(����� �� ��� ���� %�� �!����� � �� %���� ��� ��� ���� %��� ����
���� ������ ���� ����� ,
�� ���� ��� ��� ����� ������� ����� � ����� �� 9 ���������!� ���" ;������ ������������
%��� ��!�� �� ��������� ����� ��� ���� �� ����������� �� ���� �� ��� ���� ����� �� ���
��� ������� �� ��� �2��!������� ������� �� ���� �� ����%����� ����(����� �� ���� ����
������������ ����" �����!��� ����� ������ %��� ������ �� ������ ���������=�� ��� ��������
�� ��� ��� ����=�!��� �%� ��� �� �� �� �� ����� ������� ����������� �� 2�� �� ���� � �������
����������� ��� � ��� �� � �/���� ���������� �� ��� ������" +� ���������� ��� ������� %���
�������� ��� �����'� /�������� ����� ��� ��� ��� ����"
#�� ����� ��� ����������� ��� ����� ���������� �� � /��������!� �� /���������!� 0 ��
��� �������� � �� ��� 8������ ��� ��������� >������ %�� ��� �� � ����� ��� ��� ����������
�� ��-�� ������ �� �������� ��������� ���!� � ���� �����%� ��� ��� ���������� �&�� �� ��"�
��4�
#�� ���� ��� � %�� � �����%(�� ��� � �� � ������ �� ������ %�� �� ����������� �� � ������(
%� � ������� ���������� ���� ��� � �� ��� ��������� �� ��� �������� ��4�(�40�� ��� 8+?@A
1��)��� �8������ +�������!������ ?������� �� @�������� �� A������" #��� 8+?@A 1��)��� %��
����������� ���� �� ��!���������� ��� ������������ ���%��� ������ ������ �� �����(�����'�
����� ��� �� ��������� �� 8������ �� �������� �� � ����� ��� �� ���( �� ��� ��(������'�
������ �@ B "0� �� ��� ����� 8������ ���������� ��� ,(90 �����" .�� ��� CD������ ��
���� ��� �<� ��� ������������ ���� ��� 8+?@A 1��)��� %�� %��� ����� ��!��� �� 8������ �� �����
���!� �� ��� ���� �� ��� ����� �� ��� �����%(��� %��� ��(�������� ��� � �����%(�� �-����������
����� ��� � ������ ���!�� ���,�" #�� CD������ �� ���� ��� �< ����� � �0� �9�� ����� ��
7� �������� ��� 7,(� �����" #�� ������ ���!�� �� ��� �����%(�� ��� � %�� ��� ���� �� �� ���
�������� ���!��� �"�" � 0 ���� �������� ��� ����� ����� " +����������� ��� ��� ����������
�� ���� ����� �� ��� /������ ������� �� ��� ��� %�� ��� �� ������ ���������"
.�� ���� ��� ��� �� ��� �������� ���� ��� ��� ���� ��� ��� ������ %��� /�����'� ��
�� � �� �-�������� ���������" #�� ����%��� ��� ������� �� ��� ��� %�� ��� ��(����� <8����
1��������<� �!����� �� E����!�� ( !������ 8@0" .�� ���� ��� ���� ��� ��� ���������� ���
����� %��� � ����'� " +� ��� <�������� ��� �<� ,9 ��� ����� ��� �� � ����� �� 90, ��������
���� ������ ���� ����� 7
���������� ������� �� ���" +� ��� <D������ �� ���� ��� �<� ���� %�� 0� ��� �� 70" ��� ���
���������� ��� ����� %��� ���� ������� ��� �� �� ��� ����� ������ �� ��� �� =�� ����!���=���
������!� ���������� �� � ����� ����� �� ��� �%������ ���� !�������� ������ �� ���� �������� ����
����� ����� ������ ������ ���� �� '��� �� ��� ���������� ��� ����"
� �������� ���� ������ �� ����� ����� �� ������
���� ���
8�������� ��� �� ���� %��� ����� ���� ����� � ����� �������F � 7 ���� ������� ����
8������ ��� ������ �� ��� ����� $�������� ( @�!����� ��� �.����� �� ��"� ����G �
��� �� ������� ���� �� �!� ��� ����� ������ ��� @�������� �� �� ��� ����� :������ ��4 (
����� ��� �A����������� �� ��"� ���G �� �� � ��-� ���� ������� ��� ���� 8������ ���!�����
�� ��� ����� ����� ( :������ ��� �;��-�� �����%(�� ������ ����"
8�������� ��� �� '�� %��� ����� ���� �%� � ����� �������F � ��� ?+H: ������ ���02��
�>����� � �� ��"� ����" +� ���� ��� � 7� '�� ������� %��� ������� " &� �-��� � , <���������<
������� ������� ���� ���%� !��� ���� ��-�� #ID ��!��� ������� �� ��� ����� �������� %����
���� ��� ��� !��� ����� ������� G �� � � '�� ������� �������� ����� � ��� �������������
������� ������� �� 8������ �� ��� ����� ����� ( ;������� ��� �;� 1��%� ���"
8�������� ��� �� !�������� ���� �� ���� %��� ����� ���� ;���� ��� �>��� �� #�������
��9� ���� 7��� ���������� � ������� ����� �� ������������� �� ��� ����� ����� ����� ���(
J�%���� �������� �� ���� ������"
8�������� ��� �� ������� %��� ����� ���� ����� � ����� �������F � ������� �������
���� 8������ ��� ������ �� ��� ����� $�������� ( @�!����� ��� �.����� �� ��"� ����G � �
��� �� ������� ���� �� �!� ��� ������� �� ;���� ��������� ������� �� ��� ����� :������ ��4
( ����� ��� �A����������� �� ��"� ���G �� �� 04 ������� ������� �������� ����� � ���
������������� ������� ������� �� 8������ �� ��� ����� ����� ( ;������� ��� �;� 1��%�
���
���� ������ ���� ����� 9
8�������� ��� �� ���� %��� ����� ���� �%� � ����� �������F � 0 ���� ������� ���� 8������
��� ������ �� ��� ����� $�������� ( @�!����� ��� �.����� �� ��"� ����G �� � ��� ��
������� ���� �� �!� ��� ;���� ������ �� ��� ����� :������ ��4 ( ����� ��� �A�����������
�� ��"� ���"
8�������� ��� �� ��� %��� ����� ���� ����� � ����� �������F � 0 ��� ������� ���� 8������
��� ������ �� ��� ����� $�������� ( @�!����� ��� �.����� �� ��"� ����G � � ��� ��
������� ���� �� �!� ��� ������� �� ;���� ��������� ������� �� ��� ����� :������ ��4 ( �����
��� �A����������� �� ��"� ���G �� �� � ��� ������� �������� ����� � ��� �������������
������� ������� �� 8������ �� ��� ����� ����� ( ;������� ��� �;� 1��%� ���"
8�������� ��� �� ���� %��� ����� ���� ����� � ����� �������F � ���� ������� ����
8������ ��� ������ �� ��� ����� $�������� ( @�!����� ��� �.����� �� ��"� ����G � �
��� �� ������� ���� �� �!� ��� ������� �� ;���� ��������� ������� �� ��� ����� :������
��4 ( ����� ��� �A����������� �� ��"� ���G �� �� 4 ���� ������� �������� ����� � ���
������������� ������� ������� �� 8������ �� ��� ����� ����� ( ;������� ��� �;� 1��%�
���"
8�������� ��� �� ����� %��� ����� ���� �%� � ����� ������� F � � ����� ������� ����
8������ ��� ������ �� ��� ����� $�������� ( @�!����� ��� �.����� �� ��"� ����G �� �
����� ������� �������� ����� � ��� ������������� ������� ������� �� 8������ �� ��� �����
����� ( ;������� ��� �;� 1��%� ���"
8�������� ��� �� ����� %��� ����� ���� �%� � ����� ������� F � � ����� ������� ����
8������ ��� ������ �� ��� ����� $�������� ( @�!����� ��� �.����� �� ��"� ����G �� �
����� ������� �������� ����� � ��� ������������� ������� ������� �� 8������ �� ��� �����
����� ( ;������� ��� �;� 1��%� ���

����� �
����� ��� ��
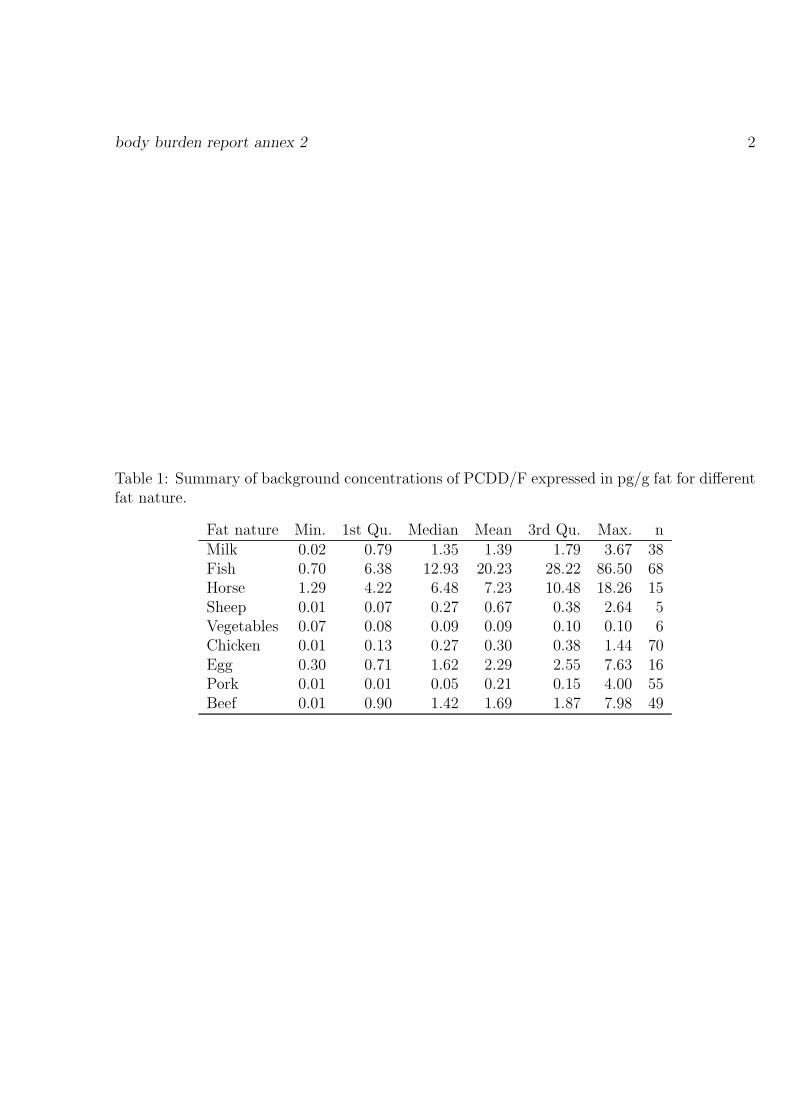
���� ������ ���� �����
�� �� � ������� �� ��������� �������������� �� ���� ! �"������� �� �� � ��� ��� ��#�������� ������$
!�� ������ %��$ �� &�$ %����� %��� ��� &�$ %�"$ �%��� �$� �$'( $�) $�( $'( �$*' �+!��, �$'� *$�+ $(� �$� +$ +*$)� *+-���� $( .$ *$.+ '$� �$.+ +$* )�,��� �$� �$�' �$' �$*' �$�+ $*. )/����� ��� �$�' �$�+ �$�( �$�( �$� �$� *�,����� �$� �$� �$' �$�� �$�+ $.. '�0�� �$�� �$' $* $( $)) '$*� *���� �$� �$� �$�) �$ �$) .$�� ))1��� �$� �$(� $. $*( $+' '$(+ .(

���� ������ ���� ����� �
�� �� � ���������� �� ����� ������ �� �,� ��� �� ����� ���! ��� ���"��2���� ��1 3���0&$�� 4 �5 6�� ���� �� ��#����� ����������� �� �,� ���������� ���������� �� ��������� ���2������� ���������� 4��, ������ �����������$ 3�,� ��������6� ������ ����� �������� �� ���������������������� ��� ���, ��� ������� �,������� ������ �� ����� 7�����8 �� ��� �9��� �� �,� ��� ���,� ��#����� ��� �������$5
���������� �,����� ���� 1��� 0�� %��� !��, :�,�� ������� 6���� �����
; �$�� �$�� �$�� �$�� �$) �$�� �$�� �$*+�; �$�� �$� �$� �$� �$* �$�� �$�) �$(�); �$�� �$� �$�) �$�. �$( �$�� �$�* $)
�; �$�� �$�� �$�+ �$�* �$�* �$�� �$�+ $.)); �$�� �$�. �$ �$�( �$.* �$�� �$�( $)(�; �$�� �$�) �$� �$� �$)* �$�� �$� $'); �$�� �$�* �$' �$ �$*� �$�� �$ $+)��; �$�� �$�' �$ �$. �$' �$� �$ $((�); �$� �$�' �$. �$* �$'( �$�' �$� $.�; �$� �$�+ �$' �$+ �$+' �$ �$. $�.); �$� �$�( �$� �$� �$(. �$) �$) $�')�; �$� �$� �$�) �$ $�� �$ �$' $)�)); �$� �$ �$�+ �$. $�' �$+ �$+ $*'*�; �$� �$ �$. �$* $. �$�' �$ $+�*); �$�� �$ �$.* �$+ $� �$.' �$� $()'�; �$�� �$. �$) �$�� $� �$*� �$' �$'); �$�. �$) �$)* �$�� $.� �$'+ �$� �$��+�; �$�. �$* �$* �$�' $) $�+ �$�* �$).+); �$�) �$+ �$*+ �$. $*) $* �$. �$(�(�; �$�* �$ �$'+ �$.+ $+� $*� �$.( .$((); �$�+ �$) �$() �$)* $�. .$� �$* *$)('; �$� �$+ $�' �$*� $. )$+ �$' '$.'((; �$� �$�) $�. �$'( $) '$+ �$( ($*)��; �$) �$)' $'. $( �$. *$ $'+ +$).

���� ������ ���� ����� .
�� �� �� ���������� �� ����� ������ �� �,� ��� �� ����� ���! ��� ���"��2���� ��1 3���0&$�� 4 �5 6�� ���� �� ��#����� ����������� �� �,� ���������� ���������� ������ �,� ���"���������� ���������� 4��, ������ �����������$ 3�,� ��������6� ������ ����� �������� �� ���������������������� ��� ���, ��� ������� �,������� ������ �� ����� 7�����8 �� ��� �9��� �� �,� ��� ���,� ��#����� ��� �������$5
���������� �,����� ���� 1��� 0�� %��� !��, :�,�� ������� 6���� �����
; �$�� �$�� �$�� �$�� �$) �$�� �$�� �$'+�; �$�� �$� �$� �$� �$* �$�� �$�) $�); �$�� �$�. �$�) �$�. �$( �$�� �$�* $�(
�; �$�� �$�* �$�+ �$�' �$�* �$�� �$�+ $'); �$�� �$�+ �$ �$� �$.* �$�� �$�( $+(�; �$�� �$� �$. �$ �$)* �$�� �$� $�)); �$�� �$ �$' �$. �$*� �$�� �$ $���; �$� �$. �$ �$* �$' �$� �$ $�)�); �$� �$) �$. �$( �$'( �$�' �$� $).�; �$�� �$' �$+ �$ �$+' �$ �$. $*+.); �$�. �$( �$� �$� �$(. �$) �$) $+.)�; �$�) �$ �$�) �$) $�� �$ �$' $(+)); �$�' �$� �$�( �$+ $�' �$+ �$+ �$.*�; �$�( �$) �$.� �$�� $. �$�' �$ �$�*); �$ �$+ �$.' �$�� $� �$.' �$� �$)�'�; �$) �$�� �$) �$�' $� �$*� �$' �$'.'); �$� �$�. �$)* �$. $.� �$'+ �$� .$�+�; �$( �$�+ �$* �$.* $) $�+ �$�* .$.�+); �$.) �$. �$*( �$) $*) $* �$. )$(�; �$+� �$)� �$'( �$* $+� $*� �$.( *$.)(); $� �$* �$(' �$+� $�. .$� �$* +$.*('; .$+) �$' $�( �$(' $. )$+ �$' �$)�((; )$�� �$(. $�' $) $) '$+ �$( ($)+��; *$. $+. $'( *$' �$. *$ $'+ +$+*
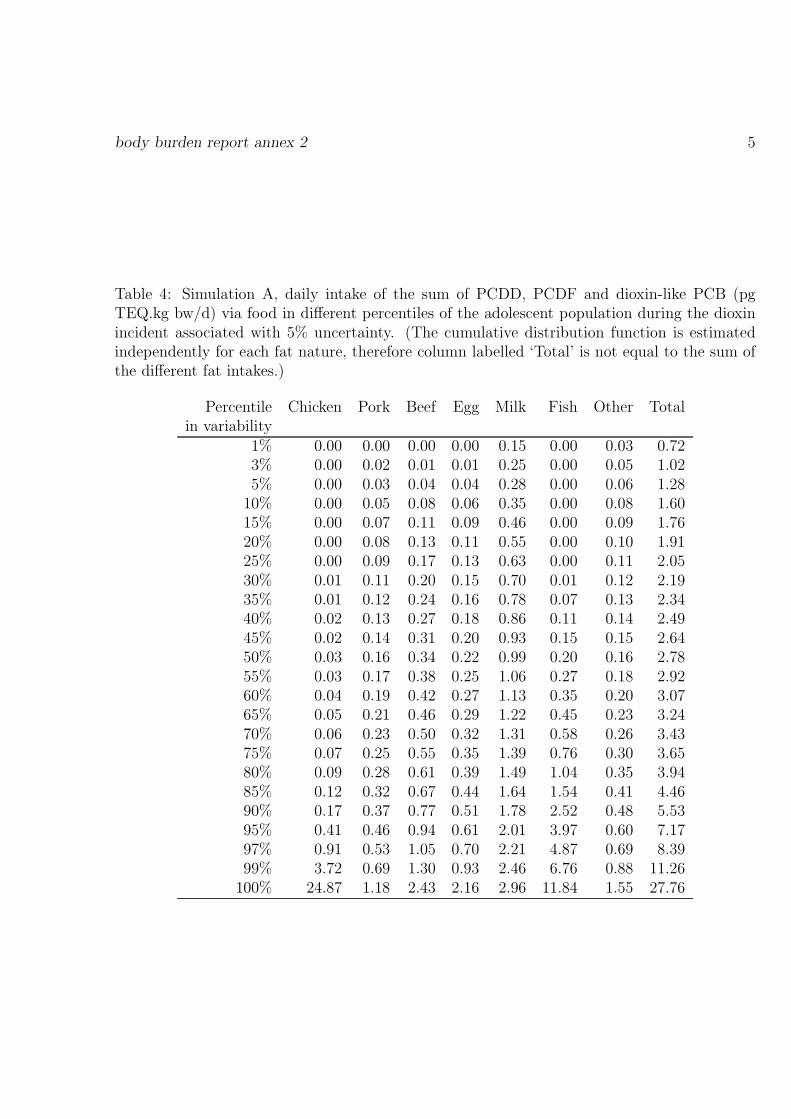
���� ������ ���� ����� )
�� �� .� ���������� �� ����� ������ �� �,� ��� �� ����� ���! ��� ���"��2���� ��1 3���0&$�� 4 �5 6�� ���� �� ��#����� ����������� �� �,� ���������� ���������� ������ �,� ���"���������� ���������� 4��, ); �����������$ 3�,� ��������6� ������ ����� �������� �� ���������������������� ��� ���, ��� ������� �,������� ������ �� ����� 7�����8 �� ��� �9��� �� �,� ��� ���,� ��#����� ��� �������$5
���������� �,����� ���� 1��� 0�� %��� !��, :�,�� ������� 6���� �����
; �$�� �$�� �$�� �$�� �$) �$�� �$�� �$'�; �$�� �$� �$� �$� �$) �$�� �$�) $�); �$�� �$�� �$�. �$�. �$+ �$�� �$�* $+
�; �$�� �$�) �$�+ �$�* �$�) �$�� �$�+ $*�); �$�� �$�' �$ �$�( �$.* �$�� �$�( $'*�; �$�� �$�+ �$� �$ �$)) �$�� �$� $(); �$�� �$�( �$' �$� �$*� �$�� �$ $�)��; �$� �$ �$� �$) �$'� �$� �$ $(�); �$� �$ �$. �$* �$'+ �$�' �$� $�..�; �$� �$� �$' �$+ �$+* �$ �$. $.(.); �$� �$. �$� �$� �$(� �$) �$) $*.)�; �$�� �$* �$�. �$ �$(( �$� �$* $'+)); �$�� �$' �$�+ �$) $�* �$' �$+ $(*�; �$�. �$( �$. �$' $� �$�) �$� �$�'*); �$�) �$ �$.* �$( $ �$.) �$� �$.'�; �$�* �$� �$)� �$� $� �$)+ �$* �$.�'); �$�' �$) �$)) �$�) $�( �$'* �$�� �$*)+�; �$�( �$+ �$* �$�( $.( $�. �$�) �$(.+); �$ �$� �$*' �$.. $*. $). �$. .$.*(�; �$' �$�' �$'' �$) $'+ $) �$.+ )$)�(); �$. �$.* �$(. �$* $� �$(' �$*� '$'('; �$( �$)� $�) �$'� $ .$+' �$*( +$�(((; �$' �$*( $�� �$(� $.* *$'* �$++ $*��; .$+' $+ $.� $* $(* $+. $)) '$'*
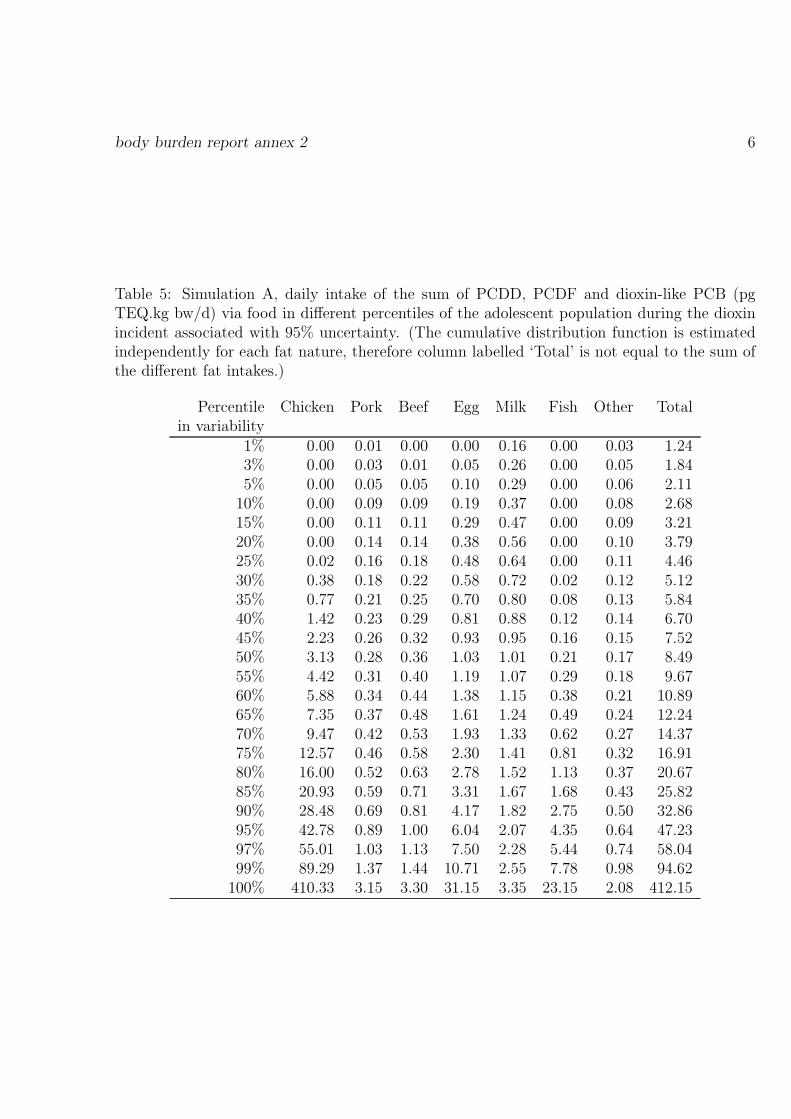
���� ������ ���� ����� *
�� �� )� ���������� �� ����� ������ �� �,� ��� �� ����� ���! ��� ���"��2���� ��1 3���0&$�� 4 �5 6�� ���� �� ��#����� ����������� �� �,� ���������� ���������� ������ �,� ���"���������� ���������� 4��, (); �����������$ 3�,� ��������6� ������ ����� �������� �� ���������������������� ��� ���, ��� ������� �,������� ������ �� ����� 7�����8 �� ��� �9��� �� �,� ��� ���,� ��#����� ��� �������$5
���������� �,����� ���� 1��� 0�� %��� !��, :�,�� ������� 6���� �����
; �$�� �$� �$�� �$�� �$* �$�� �$�� $.�; �$�� �$�� �$� �$�) �$* �$�� �$�) $+.); �$�� �$�) �$�) �$� �$( �$�� �$�* $
�; �$�� �$�( �$�( �$( �$�' �$�� �$�+ $*+); �$�� �$ �$ �$( �$.' �$�� �$�( �$�; �$�� �$. �$. �$�+ �$)* �$�� �$� �$'(); �$� �$* �$+ �$.+ �$*. �$�� �$ .$.*��; �$�+ �$+ �$ �$)+ �$' �$� �$ )$�); �$'' �$ �$) �$'� �$+� �$�+ �$� )$+..�; $. �$� �$( �$+ �$++ �$ �$. *$'�.); $� �$* �$� �$(� �$() �$* �$) '$))�; �$� �$+ �$�* $�� $� �$ �$' +$.()); .$. �$� �$.� $( $�' �$( �$+ ($*'*�; )$++ �$�. �$.. $�+ $) �$�+ �$ �$+(*); '$�) �$�' �$.+ $* $. �$.( �$. $.'�; ($.' �$. �$)� $(� $�� �$* �$' .$�''); $)' �$.* �$)+ $�� $. �$+ �$� *$(+�; *$�� �$) �$*� $'+ $) $� �$�' �$*'+); �$(� �$)( �$' �$� $*' $*+ �$.� )$+(�; +$.+ �$*( �$+ .$' $+ $') �$)� �$+*(); .$'+ �$+( $�� *$�. $�' .$�) �$*. .'$�('; ))$� $�� $� '$)� $+ )$.. �$'. )+$�.((; +($( $�' $.. �$' $)) '$'+ �$(+ (.$*
��; .�$�� �$) �$�� �$) �$�) �$) $�+ .$)
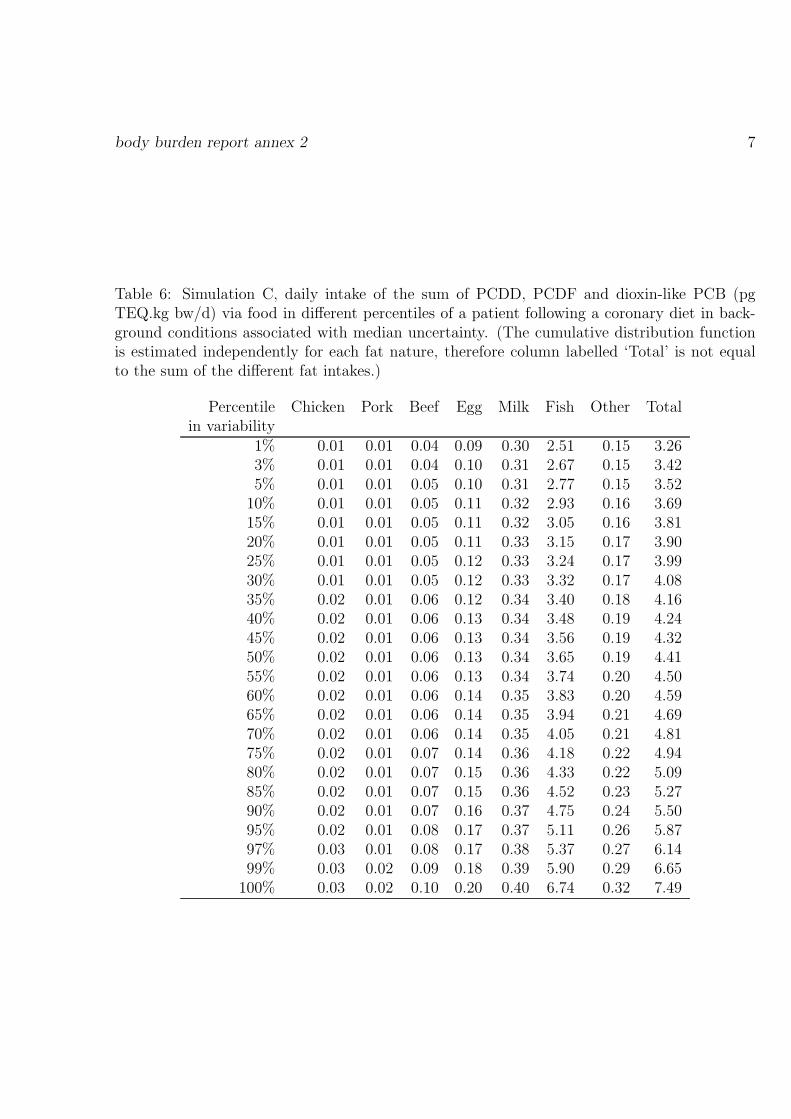
���� ������ ���� ����� '
�� �� *� ���������� �� ����� ������ �� �,� ��� �� ����� ���! ��� ���"��2���� ��1 3���0&$�� 4 �5 6�� ���� �� ��#����� ����������� �� � ������� �����4��� � �������� ���� �� ���2������ ���������� ���������� 4��, ������ �����������$ 3�,� ��������6� ������ ����� ���������� ��������� ������������� ��� ���, ��� ������� �,������� ������ �� ����� 7�����8 �� ��� �9����� �,� ��� �� �,� ��#����� ��� �������$5
���������� �,����� ���� 1��� 0�� %��� !��, :�,�� ������� 6���� �����
; �$� �$� �$�. �$�( �$�� $) �$) �$*�; �$� �$� �$�. �$� �$� $*' �$) �$.); �$� �$� �$�) �$� �$� $'' �$) �$)
�; �$� �$� �$�) �$ �$� $(� �$* �$*(); �$� �$� �$�) �$ �$� �$�) �$* �$+�; �$� �$� �$�) �$ �$�� �$) �$' �$(�); �$� �$� �$�) �$ �$�� �$. �$' �$((��; �$� �$� �$�) �$ �$�� �$� �$' .$�+�); �$� �$� �$�* �$ �$�. �$.� �$+ .$*.�; �$� �$� �$�* �$� �$�. �$.+ �$( .$..); �$� �$� �$�* �$� �$�. �$)* �$( .$�)�; �$� �$� �$�* �$� �$�. �$*) �$( .$.)); �$� �$� �$�* �$� �$�. �$'. �$� .$)�*�; �$� �$� �$�* �$. �$�) �$+� �$� .$)(*); �$� �$� �$�* �$. �$�) �$(. �$ .$*('�; �$� �$� �$�* �$. �$�) .$�) �$ .$+'); �$� �$� �$�' �$. �$�* .$+ �$ .$(.+�; �$� �$� �$�' �$) �$�* .$�� �$ )$�(+); �$� �$� �$�' �$) �$�* .$) �$� )$'(�; �$� �$� �$�' �$* �$�' .$') �$. )$)�(); �$� �$� �$�+ �$' �$�' )$ �$* )$+'('; �$�� �$� �$�+ �$' �$�+ )$�' �$' *$.((; �$�� �$� �$�( �$+ �$�( )$(� �$( *$*)
��; �$�� �$� �$� �$� �$.� *$'. �$� '$.(
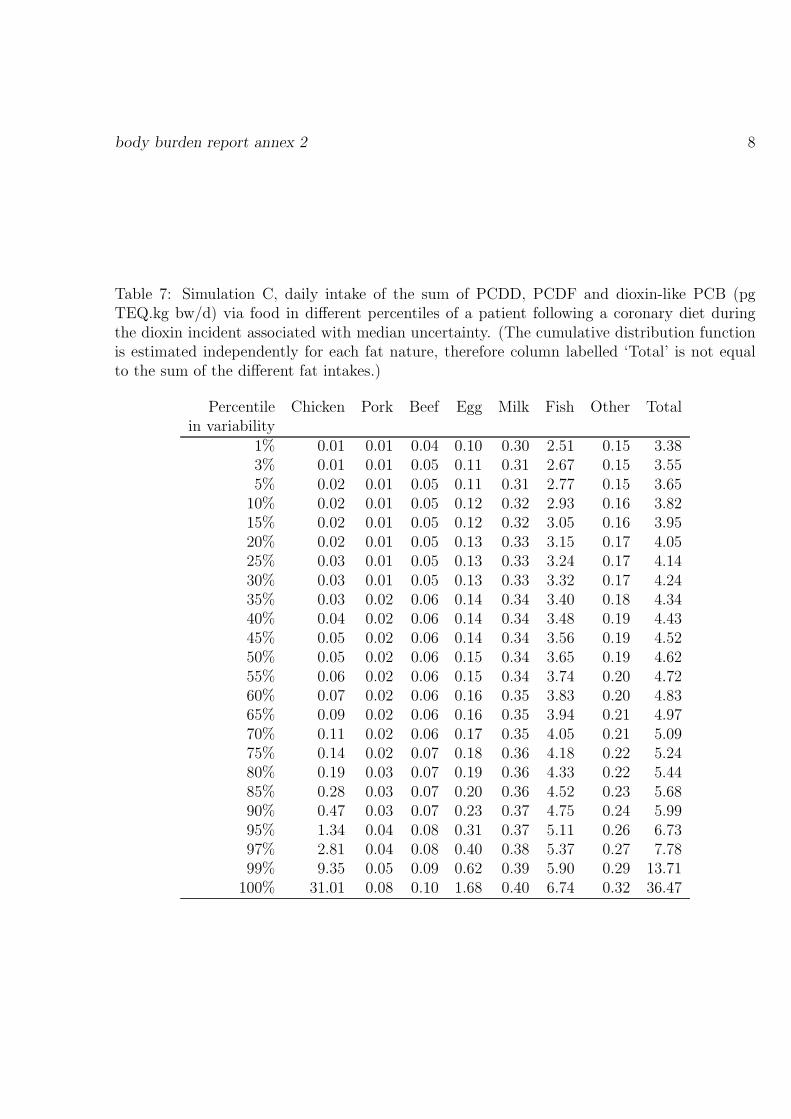
���� ������ ���� ����� +
�� �� '� ���������� �� ����� ������ �� �,� ��� �� ����� ���! ��� ���"��2���� ��1 3���0&$�� 4 �5 6�� ���� �� ��#����� ����������� �� � ������� �����4��� � �������� ���� �������,� ���"�� �������� ���������� 4��, ������ �����������$ 3�,� ��������6� ������ ����� ���������� ��������� ������������� ��� ���, ��� ������� �,������� ������ �� ����� 7�����8 �� ��� �9����� �,� ��� �� �,� ��#����� ��� �������$5
���������� �,����� ���� 1��� 0�� %��� !��, :�,�� ������� 6���� �����
; �$� �$� �$�. �$� �$�� $) �$) �$�+�; �$� �$� �$�) �$ �$� $*' �$) �$))); �$� �$� �$�) �$ �$� $'' �$) �$*)
�; �$� �$� �$�) �$ �$� $(� �$* �$+); �$� �$� �$�) �$ �$� �$�) �$* �$()�; �$� �$� �$�) �$� �$�� �$) �$' .$�)); �$�� �$� �$�) �$� �$�� �$. �$' .$.��; �$�� �$� �$�) �$� �$�� �$� �$' .$.�); �$�� �$� �$�* �$. �$�. �$.� �$+ .$�..�; �$�. �$� �$�* �$. �$�. �$.+ �$( .$.�.); �$�) �$� �$�* �$. �$�. �$)* �$( .$))�; �$�) �$� �$�* �$) �$�. �$*) �$( .$*)); �$�* �$� �$�* �$) �$�. �$'. �$� .$'*�; �$�' �$� �$�* �$* �$�) �$+� �$� .$+�*); �$�( �$� �$�* �$* �$�) �$(. �$ .$(''�; �$ �$� �$�* �$' �$�) .$�) �$ )$�('); �$. �$� �$�' �$+ �$�* .$+ �$ )$.+�; �$( �$�� �$�' �$( �$�* .$�� �$ )$..+); �$+ �$�� �$�' �$� �$�* .$) �$� )$*+(�; �$.' �$�� �$�' �$� �$�' .$') �$. )$(((); $�. �$�. �$�+ �$� �$�' )$ �$* *$'�('; $+ �$�. �$�+ �$.� �$�+ )$�' �$' '$'+((; ($�) �$�) �$�( �$* �$�( )$(� �$( �$'
��; �$� �$�+ �$� $*+ �$.� *$'. �$� �*$.'
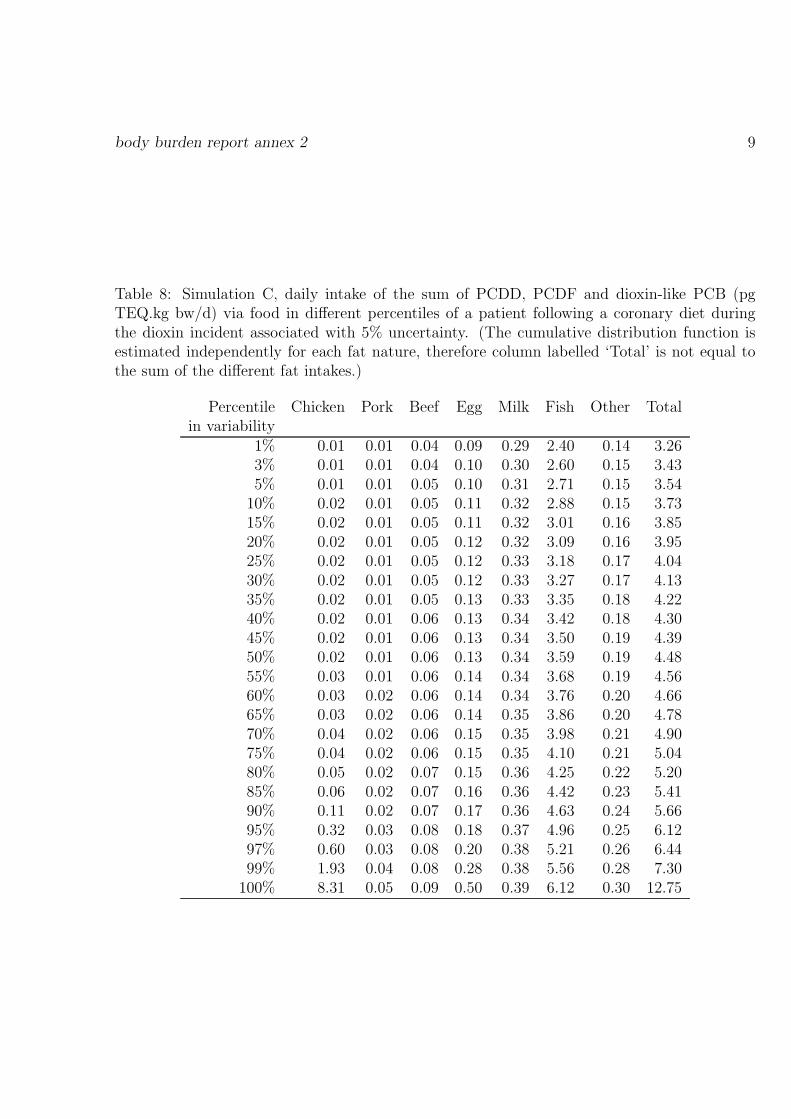
���� ������ ���� ����� (
�� �� +� ���������� �� ����� ������ �� �,� ��� �� ����� ���! ��� ���"��2���� ��1 3���0&$�� 4 �5 6�� ���� �� ��#����� ����������� �� � ������� �����4��� � �������� ���� �������,� ���"�� �������� ���������� 4��, ); �����������$ 3�,� ��������6� ������ ����� �������� ����������� ������������� ��� ���, ��� ������� �,������� ������ �� ����� 7�����8 �� ��� �9��� ���,� ��� �� �,� ��#����� ��� �������$5
���������� �,����� ���� 1��� 0�� %��� !��, :�,�� ������� 6���� �����
; �$� �$� �$�. �$�( �$( $.� �$. �$*�; �$� �$� �$�. �$� �$�� $*� �$) �$.�); �$� �$� �$�) �$� �$� $' �$) �$).
�; �$� �$� �$�) �$ �$� $++ �$) �$'�); �$� �$� �$�) �$ �$� �$� �$* �$+)�; �$� �$� �$�) �$ �$� �$�( �$* �$()); �$� �$� �$�) �$ �$�� �$+ �$' .$�.��; �$� �$� �$�) �$ �$�� �$' �$' .$��); �$� �$� �$�) �$� �$�� �$�) �$+ .$.�; �$� �$� �$�* �$� �$�. �$. �$+ .$��.); �$� �$� �$�* �$� �$�. �$)� �$( .$�()�; �$� �$� �$�* �$� �$�. �$)( �$( .$.+)); �$�� �$� �$�* �$. �$�. �$*+ �$( .$)**�; �$�� �$� �$�* �$. �$�. �$'* �$� .$***); �$�� �$� �$�* �$. �$�) �$+* �$� .$'+'�; �$�. �$� �$�* �$) �$�) �$(+ �$ .$(�'); �$�. �$� �$�* �$) �$�) .$� �$ )$�.+�; �$�) �$� �$�' �$) �$�* .$) �$ )$�+); �$�* �$� �$�' �$* �$�* .$. �$� )$.(�; �$ �$� �$�' �$' �$�* .$*� �$. )$**(); �$� �$�� �$�+ �$+ �$�' .$(* �$) *$('; �$*� �$�� �$�+ �$� �$�+ )$ �$* *$..((; $(� �$�. �$�+ �$+ �$�+ )$)* �$+ '$��
��; +$� �$�) �$�( �$)� �$�( *$ �$�� $')
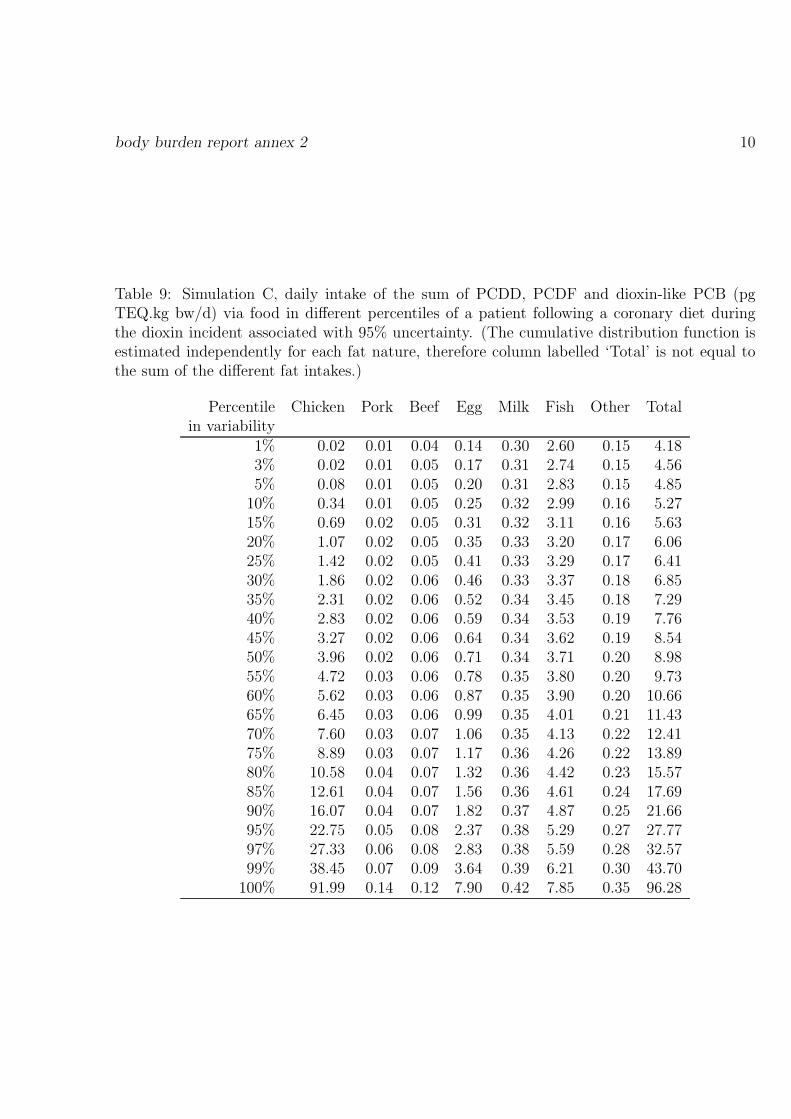
���� ������ ���� ����� �
�� �� (� ���������� �� ����� ������ �� �,� ��� �� ����� ���! ��� ���"��2���� ��1 3���0&$�� 4 �5 6�� ���� �� ��#����� ����������� �� � ������� �����4��� � �������� ���� �������,� ���"�� �������� ���������� 4��, (); �����������$ 3�,� ��������6� ������ ����� �������� ����������� ������������� ��� ���, ��� ������� �,������� ������ �� ����� 7�����8 �� ��� �9��� ���,� ��� �� �,� ��#����� ��� �������$5
���������� �,����� ���� 1��� 0�� %��� !��, :�,�� ������� 6���� �����
; �$� �$� �$�. �$. �$�� $*� �$) .$+�; �$� �$� �$�) �$' �$� $'. �$) .$)*); �$�+ �$� �$�) �$� �$� $+� �$) .$+)
�; �$�. �$� �$�) �$) �$� $(( �$* )$'); �$*( �$� �$�) �$� �$� �$ �$* )$*��; $�' �$� �$�) �$�) �$�� �$� �$' *$�*); $. �$� �$�) �$. �$�� �$( �$' *$.��; $+* �$� �$�* �$.* �$�� �$�' �$+ *$+)�); $� �$� �$�* �$) �$�. �$.) �$+ '$(.�; $+� �$� �$�* �$)( �$�. �$)� �$( '$'*.); �$' �$� �$�* �$*. �$�. �$* �$( +$).)�; �$(* �$� �$�* �$' �$�. �$' �$� +$(+)); .$' �$�� �$�* �$'+ �$�) �$+� �$� ($'�*�; )$* �$�� �$�* �$+' �$�) �$(� �$� �$***); *$.) �$�� �$�* �$(( �$�) .$� �$ $.�'�; '$*� �$�� �$�' $�* �$�) .$� �$ $.'); +$+( �$�� �$�' $' �$�* .$* �$ �$+(+�; �$)+ �$�. �$�' $� �$�* .$. �$� )$)'+); $* �$�. �$�' $)* �$�* .$* �$. '$*((�; *$�' �$�. �$�' $+ �$�' .$+' �$) $**(); $') �$�) �$�+ $�' �$�+ )$( �$' '$''('; '$�� �$�* �$�+ $+� �$�+ )$)( �$+ �$)'((; �+$.) �$�' �$�( �$*. �$�( *$ �$�� .�$'�
��; ($(( �$. �$ '$(� �$. '$+) �$�) (*$+

���� ������ ���� �����
�� �� �� ���������� �� ��� ��� ������ �� �,� ��� �� ����� ���! ��� ���"��2���� ��1 3���0&$�� 4 �5 6�� ���� �� ��#����� ����������� �� �,� ������ ���������� �� ��������� �����2����� ���������� 4��, ������ �����������$ 3�,� ��������6� ������ ����� �������� �� ���������������������� ��� ���, ��� ������� �,������� ������ �� ����� 7�����8 �� ��� �9��� �� �,� ��� ���,� ��#����� ��� �������$5
���������� �,����� ���� 1��� 0�� %��� !��, :�,�� ������� 6���� �����
; �$�� �$�� �$�� �$�� �$�� �$�� �$�� �$���; �$�� �$�� �$�� �$�� �$�� �$�� �$� �$�); �$�� �$�� �$�� �$�� �$�� �$�� �$� �$)
�; �$�� �$�� �$�� �$�� �$� �$�� �$� �$*); �$�� �$�� �$�� �$�� �$�. �$�� �$�� �$�'�; �$�� �$�� �$�� �$�� �$�' �$�� �$�. �$.'); �$�� �$�� �$�� �$�� �$� �$�� �$�. �$)+��; �$�� �$�� �$�� �$�� �$) �$�� �$�) �$'��); �$�� �$�� �$�� �$�� �$� �$�� �$�* �$+.�; �$�� �$�� �$�� �$�� �$* �$�� �$�* �$(..); �$�� �$� �$�� �$�� �$�� �$�� �$�' $�')�; �$�� �$� �$�� �$�� �$. �$�� �$�+ $)); �$�� �$� �$� �$�� �$) �$�� �$�+ $�+*�; �$�� �$�� �$�) �$� �$* �$�� �$�( $)**); �$�� �$�. �$�+ �$�� �$'� �$�� �$� $'('�; �$�� �$�) �$ �$�) �$+' �$�� �$ $�)'); �$�� �$�' �$+ �$�+ $�. �$�� �$ $.�+�; �$� �$�( �$* �$� $) �$�. �$� $+*+); �$�� �$� �$�+ �$� $). �$' �$) �$)*(�; �$�+ �$( �$)* �$�� $(( $. �$' .$'.(); �$+ �$�� �$(+ �$*. $'* *$� �$ +$��('; �$' �$.' $�( �$( �$.� �$*( �$. $((; �$). $� $*� $') .$+. )$(� �$� '$�
��; $� '$+ $)' *$( $*. +.$'. '$' +)$��
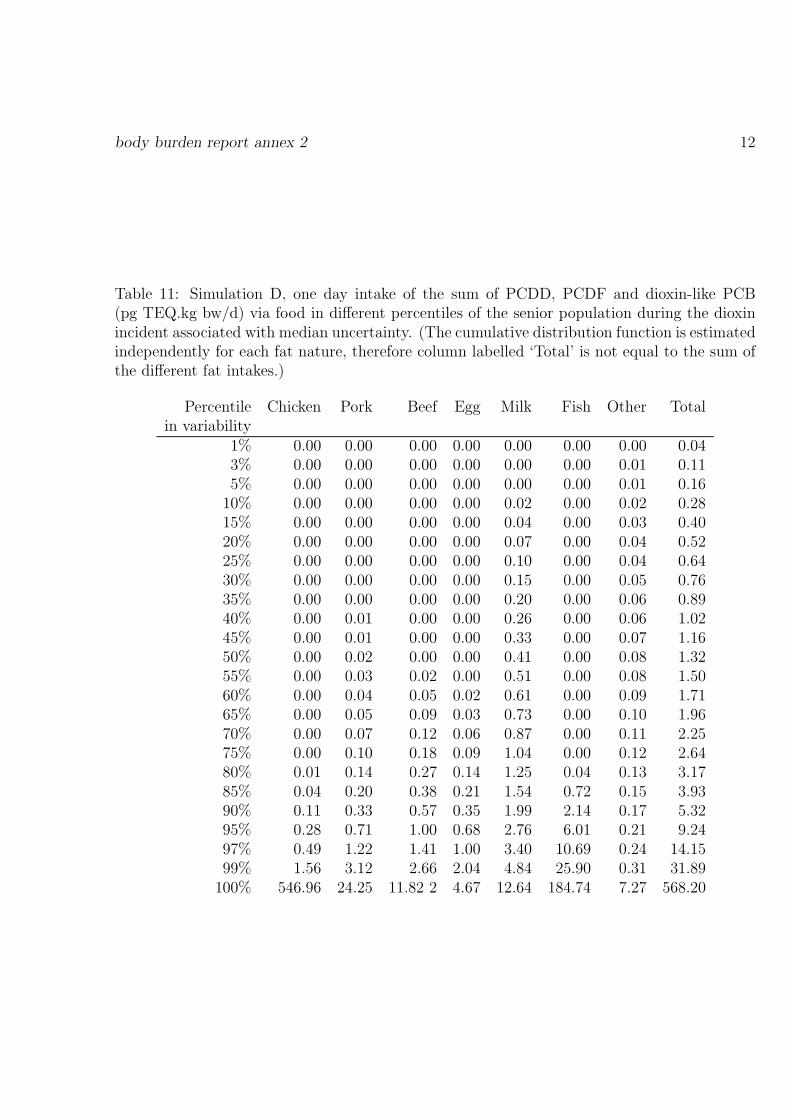
���� ������ ���� �����
�� �� � ���������� �� ��� ��� ������ �� �,� ��� �� ����� ���! ��� ���"��2���� ��13�� �0&$�� 4 �5 6�� ���� �� ��#����� ����������� �� �,� ������ ���������� ������ �,� ���"���������� ���������� 4��, ������ �����������$ 3�,� ��������6� ������ ����� �������� �� ���������������������� ��� ���, ��� ������� �,������� ������ �� ����� 7�����8 �� ��� �9��� �� �,� ��� ���,� ��#����� ��� �������$5
���������� �,����� ���� 1��� 0�� %��� !��, :�,�� ������� 6���� �����
; �$�� �$�� �$�� �$�� �$�� �$�� �$�� �$�.�; �$�� �$�� �$�� �$�� �$�� �$�� �$� �$); �$�� �$�� �$�� �$�� �$�� �$�� �$� �$*
�; �$�� �$�� �$�� �$�� �$� �$�� �$� �$+); �$�� �$�� �$�� �$�� �$�. �$�� �$�� �$.��; �$�� �$�� �$�� �$�� �$�' �$�� �$�. �$)); �$�� �$�� �$�� �$�� �$� �$�� �$�. �$*.��; �$�� �$�� �$�� �$�� �$) �$�� �$�) �$'*�); �$�� �$�� �$�� �$�� �$� �$�� �$�* �$+(.�; �$�� �$� �$�� �$�� �$* �$�� �$�* $�.); �$�� �$� �$�� �$�� �$�� �$�� �$�' $*)�; �$�� �$� �$�� �$�� �$. �$�� �$�+ $�)); �$�� �$�� �$� �$�� �$) �$�� �$�+ $)�*�; �$�� �$�. �$�) �$� �$* �$�� �$�( $'*); �$�� �$�) �$�( �$�� �$'� �$�� �$� $(*'�; �$�� �$�' �$ �$�* �$+' �$�� �$ $)'); �$�� �$� �$+ �$�( $�. �$�� �$ $*.+�; �$� �$. �$' �$. $) �$�. �$� �$'+); �$�. �$� �$�+ �$ $). �$' �$) �$(�(�; �$ �$�� �$)' �$�) $(( $. �$' )$�(); �$+ �$' $�� �$*+ $'* *$� �$ ($.('; �$.( $ $. $�� �$.� �$*( �$. .$)((; $)* �$ $** $�. .$+. )$(� �$� �$+(��; ).*$(* .$) $+ .$*' $*. +.$'. '$' )*+$�
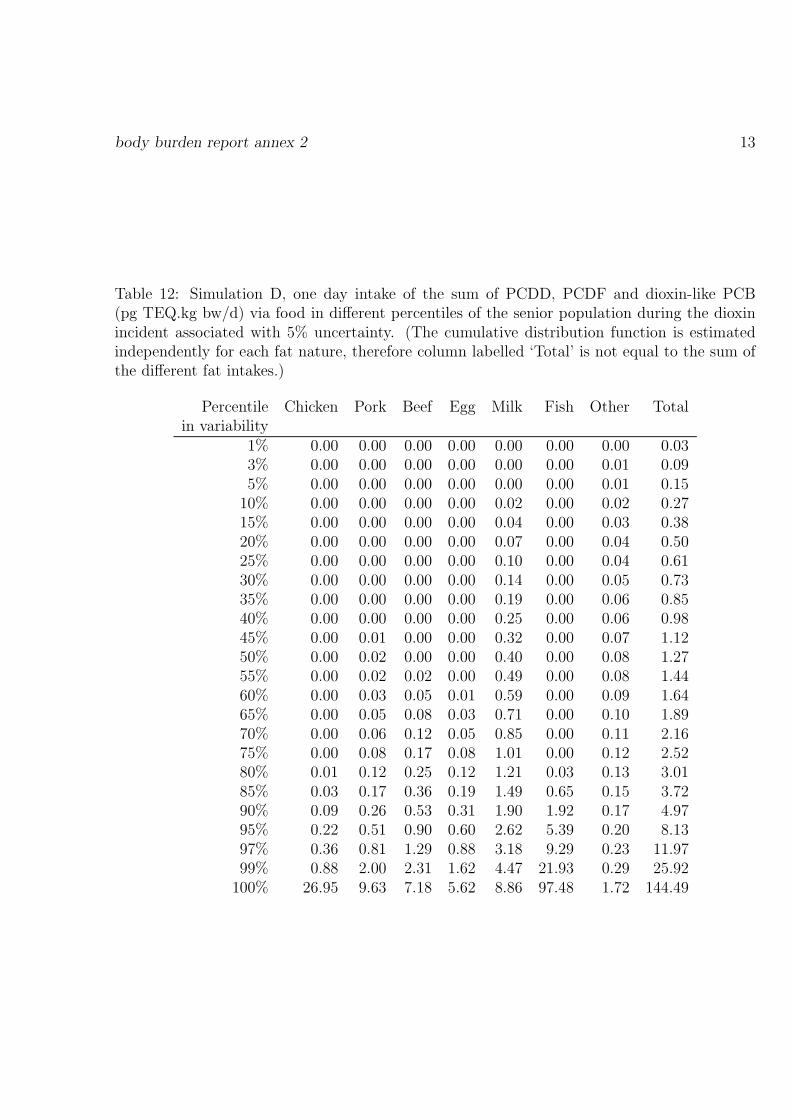
���� ������ ���� ����� �
�� �� � ���������� �� ��� ��� ������ �� �,� ��� �� ����� ���! ��� ���"��2���� ��13�� �0&$�� 4 �5 6�� ���� �� ��#����� ����������� �� �,� ������ ���������� ������ �,� ���"���������� ���������� 4��, ); �����������$ 3�,� ��������6� ������ ����� �������� �� ���������������������� ��� ���, ��� ������� �,������� ������ �� ����� 7�����8 �� ��� �9��� �� �,� ��� ���,� ��#����� ��� �������$5
���������� �,����� ���� 1��� 0�� %��� !��, :�,�� ������� 6���� �����
; �$�� �$�� �$�� �$�� �$�� �$�� �$�� �$���; �$�� �$�� �$�� �$�� �$�� �$�� �$� �$�(); �$�� �$�� �$�� �$�� �$�� �$�� �$� �$)
�; �$�� �$�� �$�� �$�� �$� �$�� �$� �$'); �$�� �$�� �$�� �$�� �$�. �$�� �$�� �$�+�; �$�� �$�� �$�� �$�� �$�' �$�� �$�. �$)�); �$�� �$�� �$�� �$�� �$� �$�� �$�. �$*��; �$�� �$�� �$�� �$�� �$. �$�� �$�) �$'��); �$�� �$�� �$�� �$�� �$( �$�� �$�* �$+).�; �$�� �$�� �$�� �$�� �$) �$�� �$�* �$(+.); �$�� �$� �$�� �$�� �$� �$�� �$�' $)�; �$�� �$� �$�� �$�� �$.� �$�� �$�+ $')); �$�� �$� �$� �$�� �$.( �$�� �$�+ $..*�; �$�� �$�� �$�) �$� �$)( �$�� �$�( $*.*); �$�� �$�) �$�+ �$�� �$' �$�� �$� $+('�; �$�� �$�* �$ �$�) �$+) �$�� �$ $*'); �$�� �$�+ �$' �$�+ $� �$�� �$ $)+�; �$� �$ �$) �$ $ �$�� �$� �$�+); �$�� �$' �$�* �$( $.( �$*) �$) �$'(�; �$�( �$* �$)� �$� $(� $( �$' .$('(); �$ �$) �$(� �$*� $* )$�( �$� +$�('; �$�* �$+ $( �$++ �$+ ($( �$� $('((; �$++ $�� $� $* .$.' $(� �$( )$(��; *$() ($*� '$+ )$* +$+* ('$.+ $' ..$.(
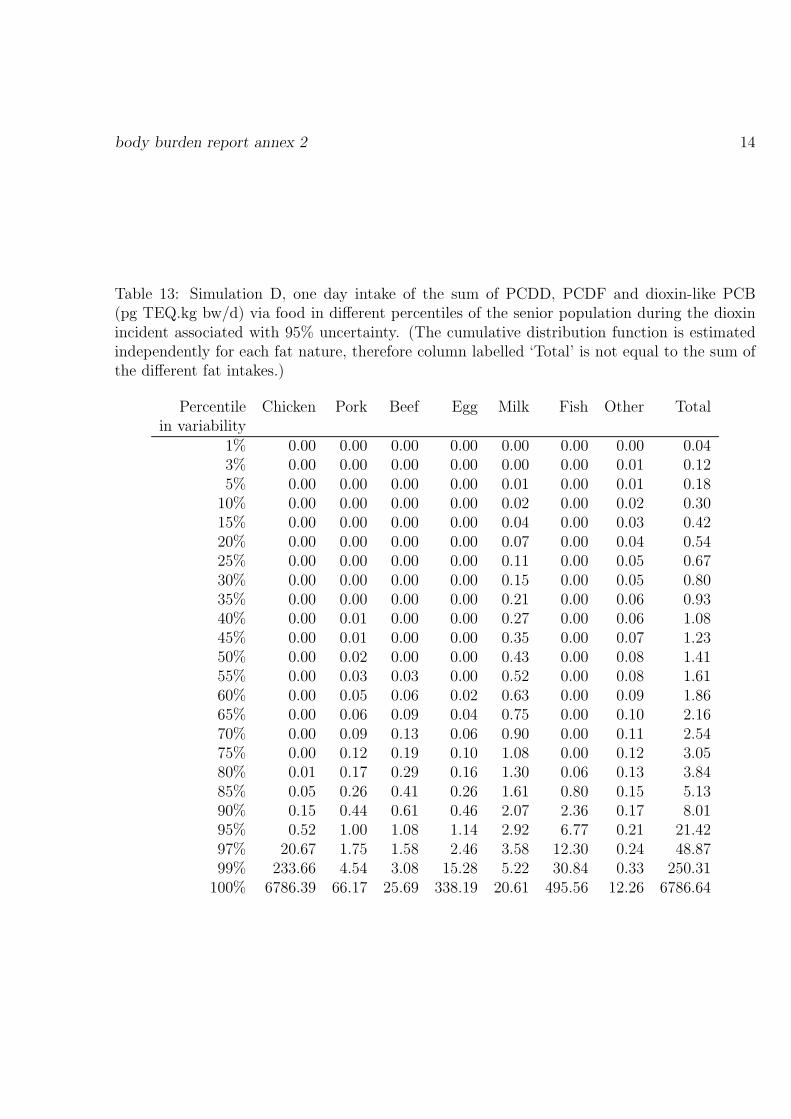
���� ������ ���� ����� .
�� �� �� ���������� �� ��� ��� ������ �� �,� ��� �� ����� ���! ��� ���"��2���� ��13�� �0&$�� 4 �5 6�� ���� �� ��#����� ����������� �� �,� ������ ���������� ������ �,� ���"���������� ���������� 4��, (); �����������$ 3�,� ��������6� ������ ����� �������� �� ���������������������� ��� ���, ��� ������� �,������� ������ �� ����� 7�����8 �� ��� �9��� �� �,� ��� ���,� ��#����� ��� �������$5
���������� �,����� ���� 1��� 0�� %��� !��, :�,�� ������� 6���� �����
; �$�� �$�� �$�� �$�� �$�� �$�� �$�� �$�.�; �$�� �$�� �$�� �$�� �$�� �$�� �$� �$); �$�� �$�� �$�� �$�� �$� �$�� �$� �$+
�; �$�� �$�� �$�� �$�� �$� �$�� �$� �$��); �$�� �$�� �$�� �$�� �$�. �$�� �$�� �$.�; �$�� �$�� �$�� �$�� �$�' �$�� �$�. �$).); �$�� �$�� �$�� �$�� �$ �$�� �$�) �$*'��; �$�� �$�� �$�� �$�� �$) �$�� �$�) �$+��); �$�� �$�� �$�� �$�� �$ �$�� �$�* �$(�.�; �$�� �$� �$�� �$�� �$' �$�� �$�* $�+.); �$�� �$� �$�� �$�� �$�) �$�� �$�' $�)�; �$�� �$� �$�� �$�� �$.� �$�� �$�+ $.)); �$�� �$�� �$�� �$�� �$) �$�� �$�+ $**�; �$�� �$�) �$�* �$� �$*� �$�� �$�( $+**); �$�� �$�* �$�( �$�. �$') �$�� �$� $*'�; �$�� �$�( �$� �$�* �$(� �$�� �$ $).'); �$�� �$ �$( �$� $�+ �$�� �$ �$�)+�; �$� �$' �$( �$* $�� �$�* �$� �$+.+); �$�) �$* �$. �$* $* �$+� �$) )$�(�; �$) �$.. �$* �$.* $�' $�* �$' +$�(); �$) $�� $�+ $. $( *$'' �$ $.('; �$*' $') $)+ $.* �$)+ $�� �$. .+$+'((; ��$** .$). �$�+ )$+ )$ ��$+. �$�� )�$�
��; *'+*$�( **$' )$*( ��+$( �$* .()$)* $* *'+*$*.