Embed Size (px)
Citation preview
Quoi de neuf en imagerie? Utilisation de la tomographie
périphérique à haute résolution
Pr Roland Chapurlat INSERM UMR 1033, Université de Lyon
Hôpital Edouard Herriot Lyon, France
Paris, 15 janvier 2016
Quoi de neuf en imagerie ? Utilisation de l’HRpQCT
Etudes de physiopathologie osseuse Etude de la prédiction du risque de fracture Chez la femme ménopausée Dans l’insuffisance rénale chronique
Christen P, et al. Nat Commun 2014
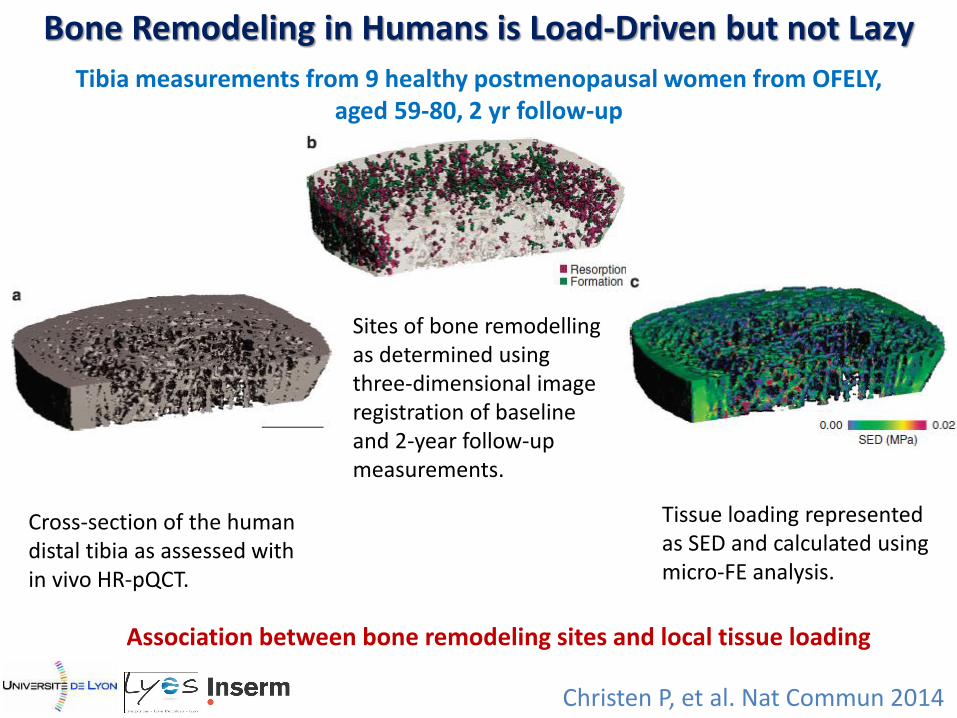
Bone Remodeling in Humans is Load-Driven but not Lazy
Cross-section of the human distal tibia as assessed with in vivo HR-pQCT.
Sites of bone remodelling as determined using three-dimensional image registration of baseline and 2-year follow-up measurements.
Tissue loading represented as SED and calculated using micro-FE analysis.
Tibia measurements from 9 healthy postmenopausal women from OFELY, aged 59-80, 2 yr follow-up
Association between bone remodeling sites and local tissue loading
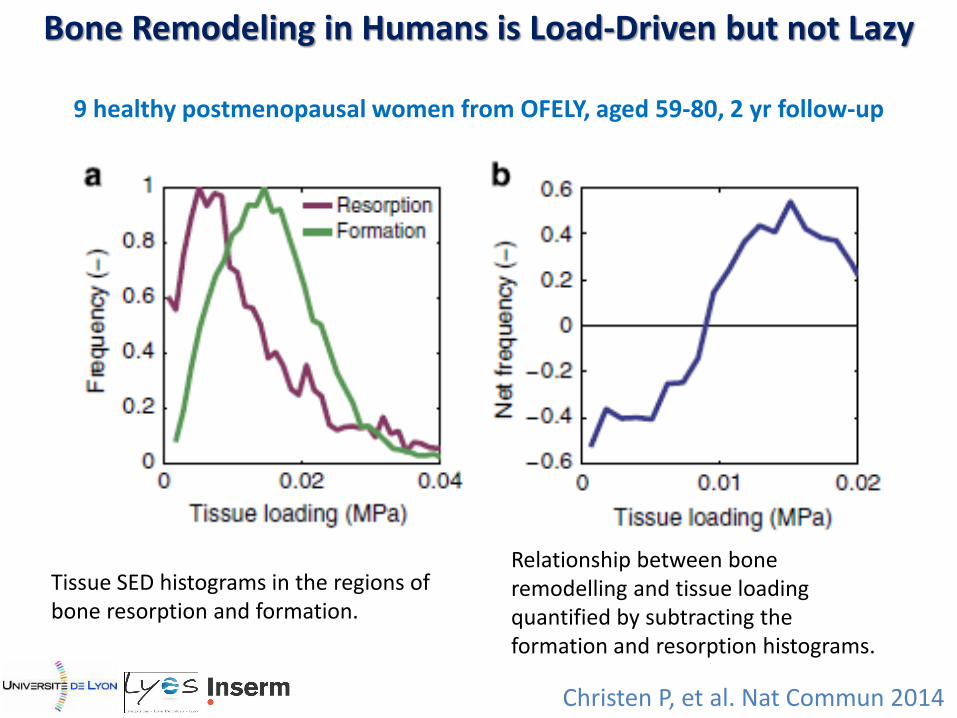
Christen P, et al. Nat Commun 2014
Bone Remodeling in Humans is Load-Driven but not Lazy
9 healthy postmenopausal women from OFELY, aged 59-80, 2 yr follow-up
Tissue SED histograms in the regions of bone resorption and formation.
Relationship between bone remodelling and tissue loading quantified by subtracting the formation and resorption histograms.
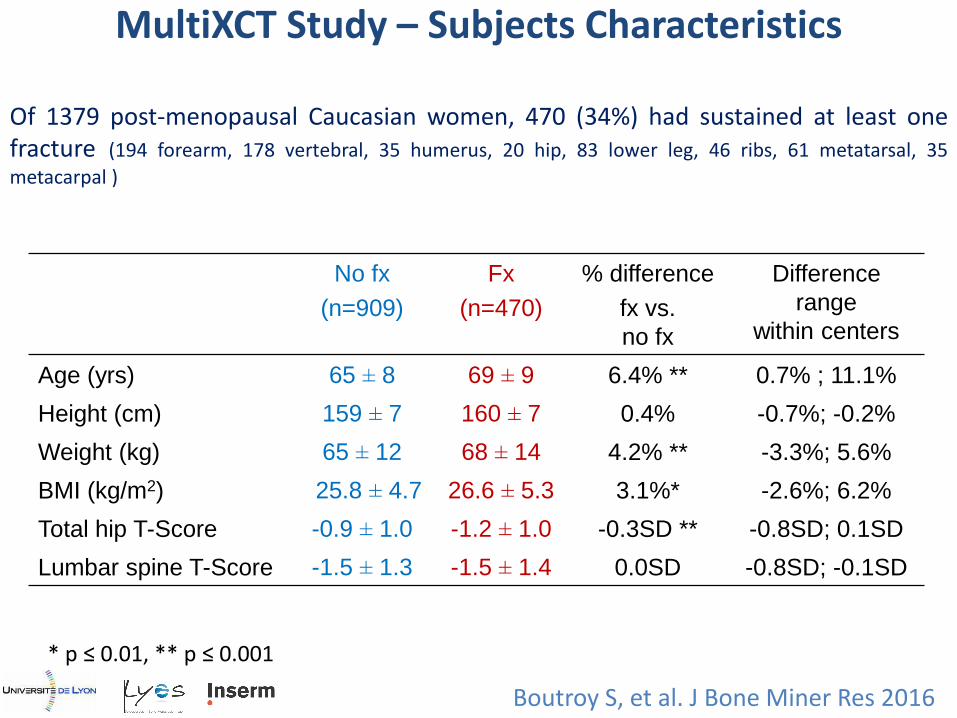
Of 1379 post-menopausal Caucasian women, 470 (34%) had sustained at least one fracture (194 forearm, 178 vertebral, 35 humerus, 20 hip, 83 lower leg, 46 ribs, 61 metatarsal, 35
metacarpal )
No fx
(n=909)
Fx
(n=470)
% difference
fx vs.
no fx
Difference
range
within centers
Age (yrs) 65 ± 8 69 ± 9 6.4% ** 0.7% ; 11.1%
Height (cm) 159 ± 7 160 ± 7 0.4% -0.7%; -0.2%
Weight (kg) 65 ± 12 68 ± 14 4.2% ** -3.3%; 5.6%
BMI (kg/m2) 25.8 ± 4.7 26.6 ± 5.3 3.1%* -2.6%; 6.2%
Total hip T-Score -0.9 ± 1.0 -1.2 ± 1.0 -0.3SD ** -0.8SD; 0.1SD
Lumbar spine T-Score -1.5 ± 1.3 -1.5 ± 1.4 0.0SD -0.8SD; -0.1SD
* p ≤ 0.01, ** p ≤ 0.001
MultiXCT Study – Subjects Characteristics
Boutroy S, et al. J Bone Miner Res 2016
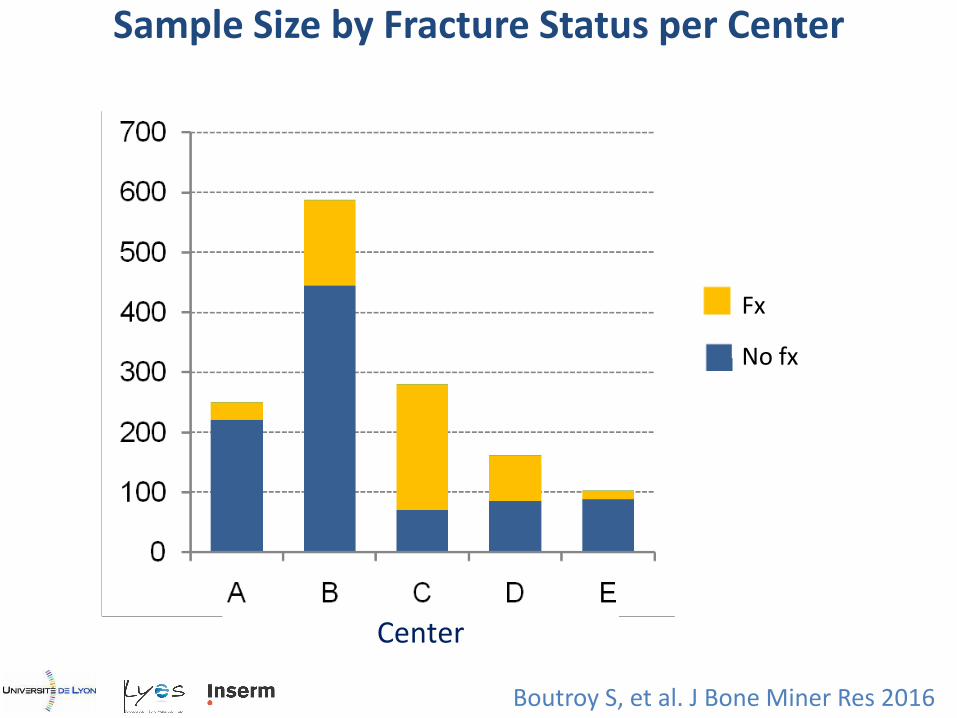
Center
Fx
No fx
Sample Size by Fracture Status per Center
Boutroy S, et al. J Bone Miner Res 2016
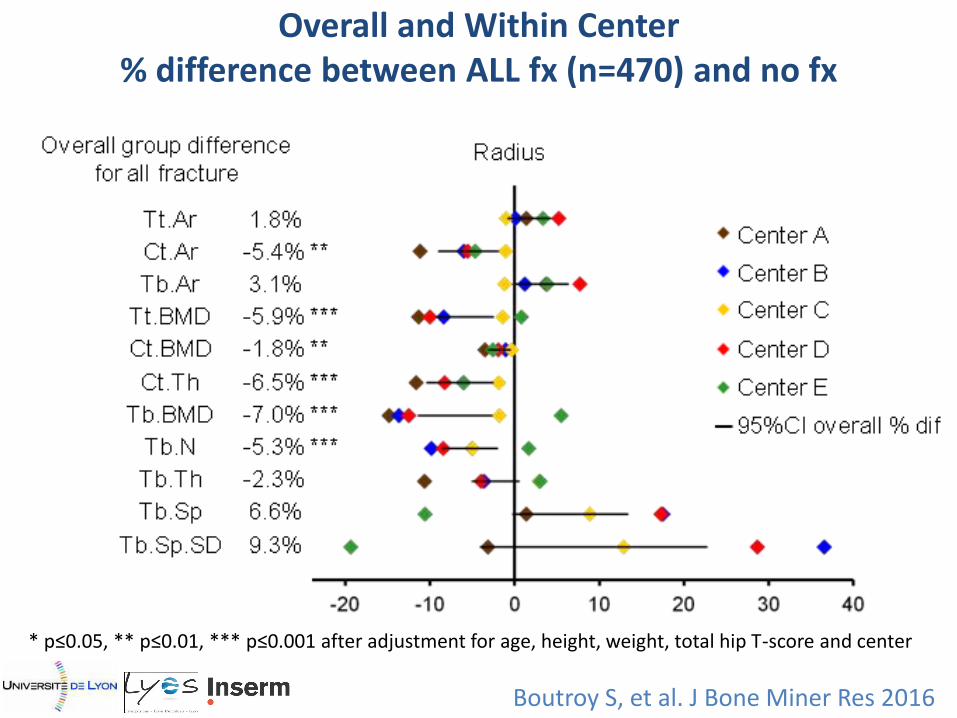
Overall and Within Center % difference between ALL fx (n=470) and no fx
* p≤0.05, ** p≤0.01, *** p≤0.001 after adjustment for age, height, weight, total hip T-score and center
Boutroy S, et al. J Bone Miner Res 2016
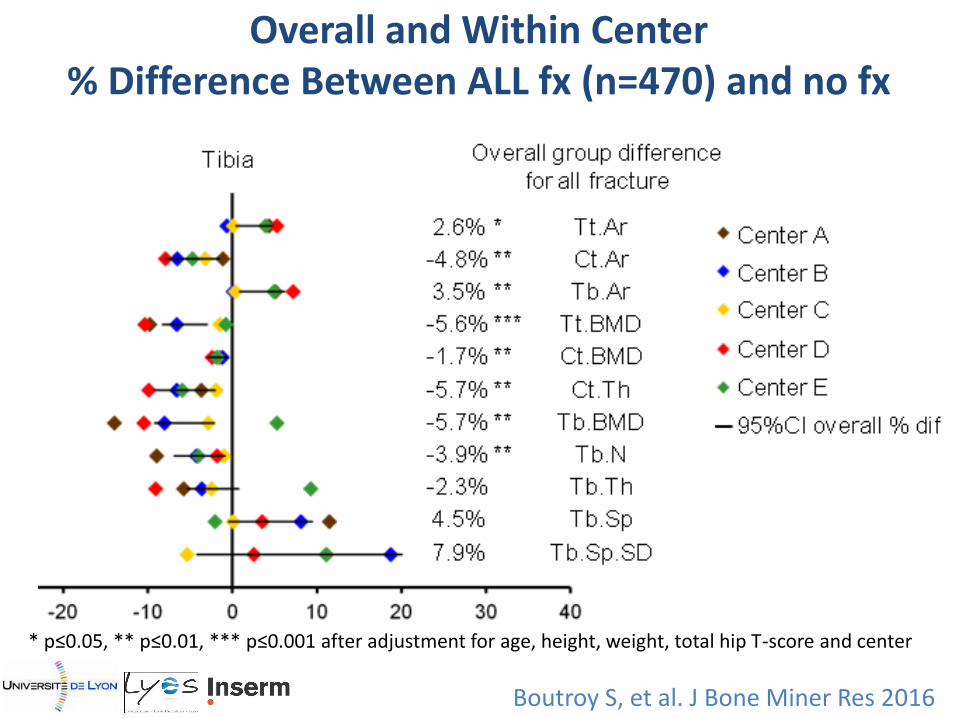
Overall and Within Center % Difference Between ALL fx (n=470) and no fx
* p≤0.05, ** p≤0.01, *** p≤0.001 after adjustment for age, height, weight, total hip T-score and center
Boutroy S, et al. J Bone Miner Res 2016
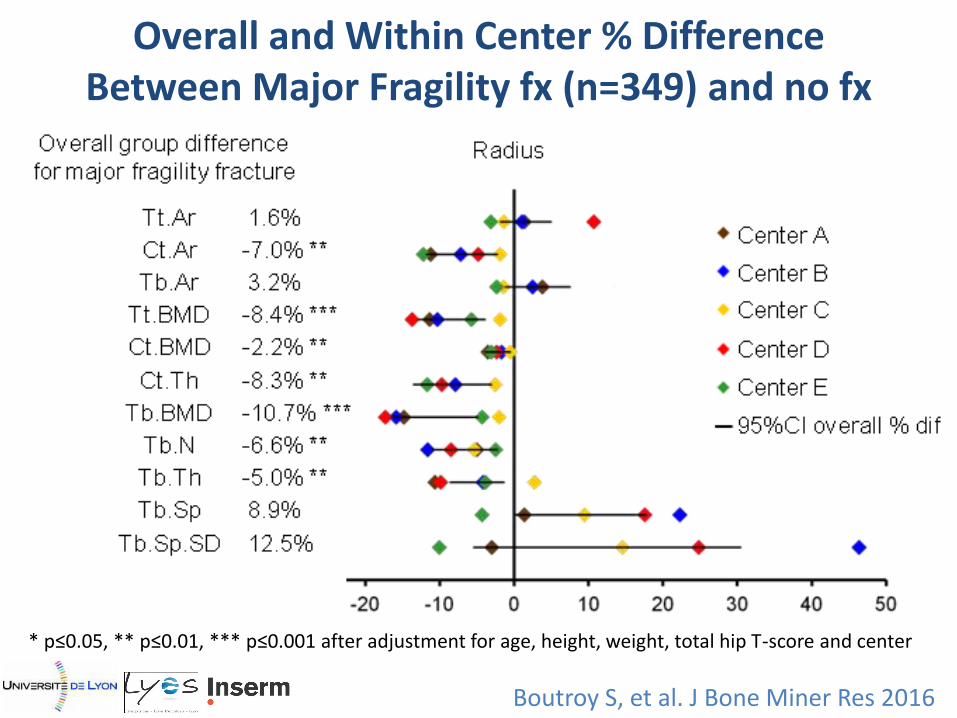
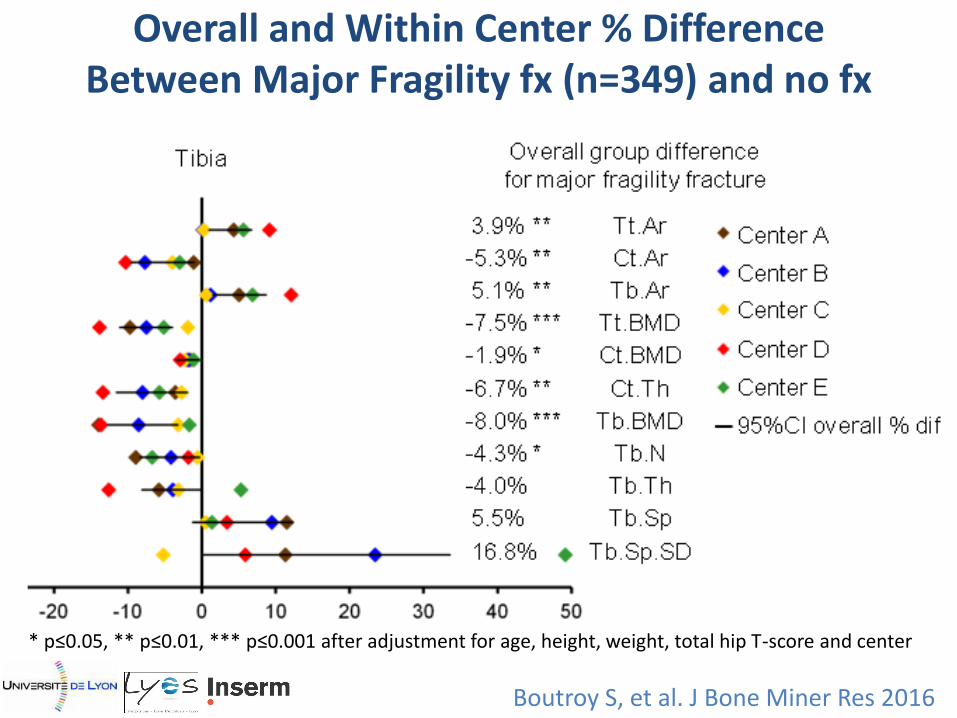
Overall and Within Center % Difference Between Major Fragility fx (n=349) and no fx
* p≤0.05, ** p≤0.01, *** p≤0.001 after adjustment for age, height, weight, total hip T-score and center
Boutroy S, et al. J Bone Miner Res 2016
Boutroy S, et al. J Bone Miner Res 2016
Overall and Within Center % Difference Between Major Fragility fx (n=349) and no fx
* p≤0.05, ** p≤0.01, *** p≤0.001 after adjustment for age, height, weight, total hip T-score and center
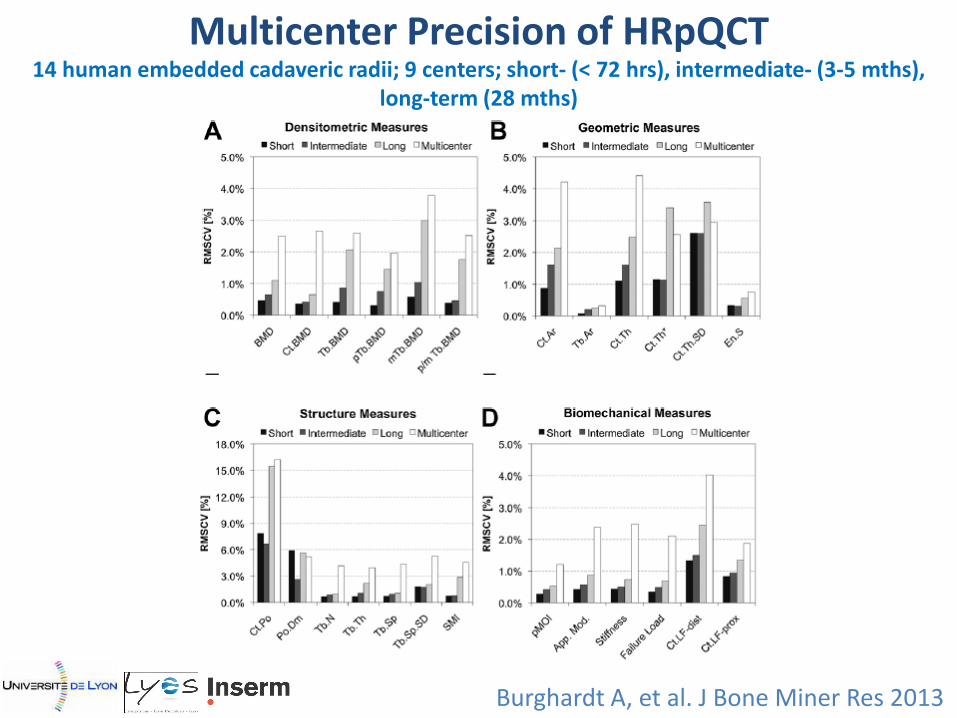
Burghardt A, et al. J Bone Miner Res 2013
Multicenter Precision of HRpQCT 14 human embedded cadaveric radii; 9 centers; short- (< 72 hrs), intermediate- (3-5 mths),
long-term (28 mths)
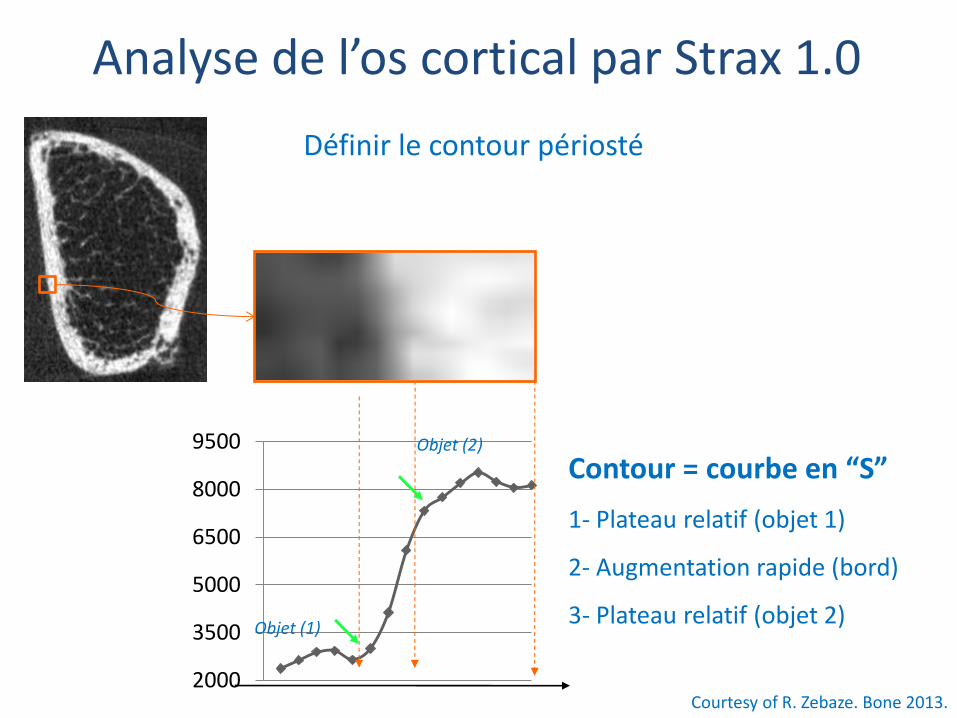
2000
3500
5000
6500
8000
9500
Objet (1)
Objet (2)
Contour = courbe en “S”
1- Plateau relatif (objet 1)
2- Augmentation rapide (bord)
3- Plateau relatif (objet 2)
Définir le contour périosté
Courtesy of R. Zebaze. Bone 2013.
Analyse de l’os cortical par Strax 1.0
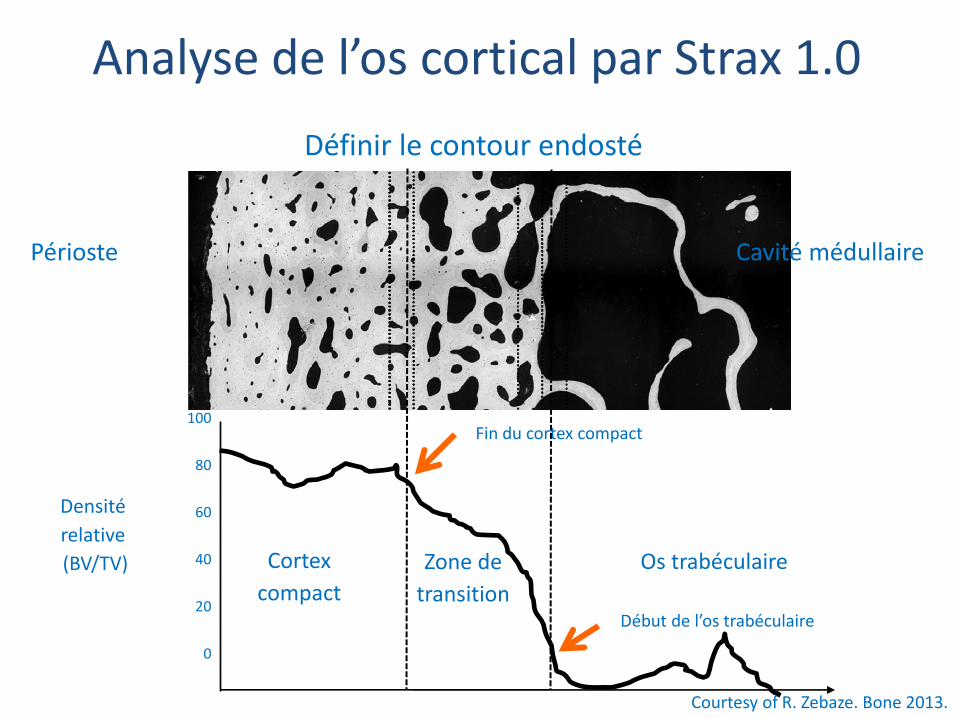
Définir le contour endosté
Courtesy of R. Zebaze. Bone 2013.
Densité
relative
(BV/TV)
Périoste
Zone de
transition
Cortex
compact
Os trabéculaire
100
80
60
40
20
0
Fin du cortex compact
Début de l’os trabéculaire
Cavité médullaire
Analyse de l’os cortical par Strax 1.0
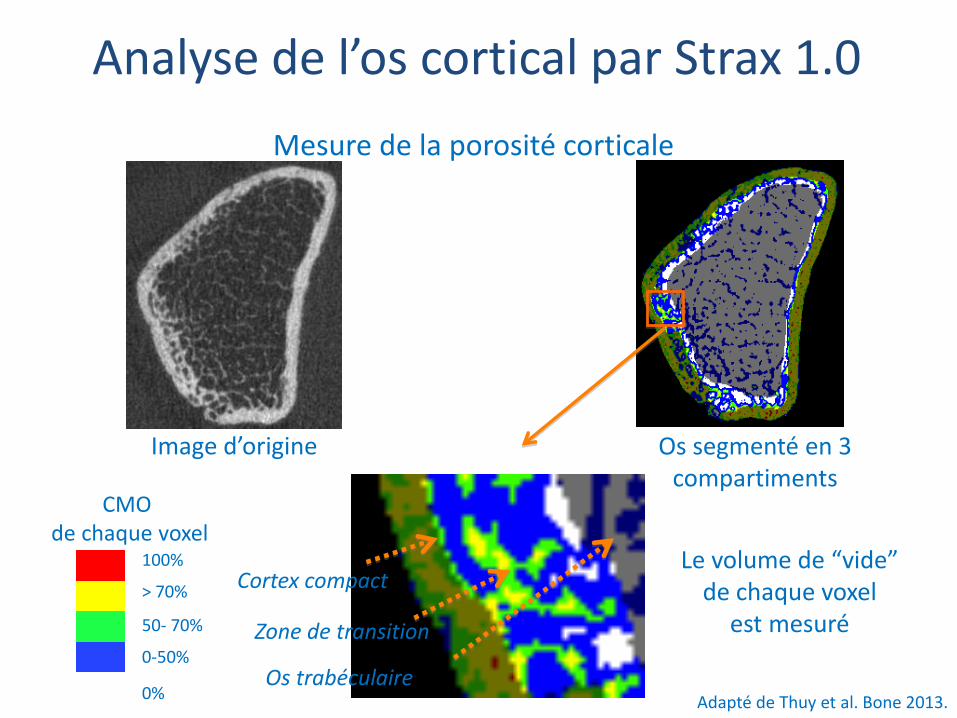
Cortex compact
Zone de transition
Os trabéculaire
Image d’origine
Le volume de “vide” de chaque voxel
est mesuré
Os segmenté en 3 compartiments
100%
> 70%
50- 70%
0-50%
0%
CMO de chaque voxel
Adapté de Thuy et al. Bone 2013.
Mesure de la porosité corticale
Analyse de l’os cortical par Strax 1.0
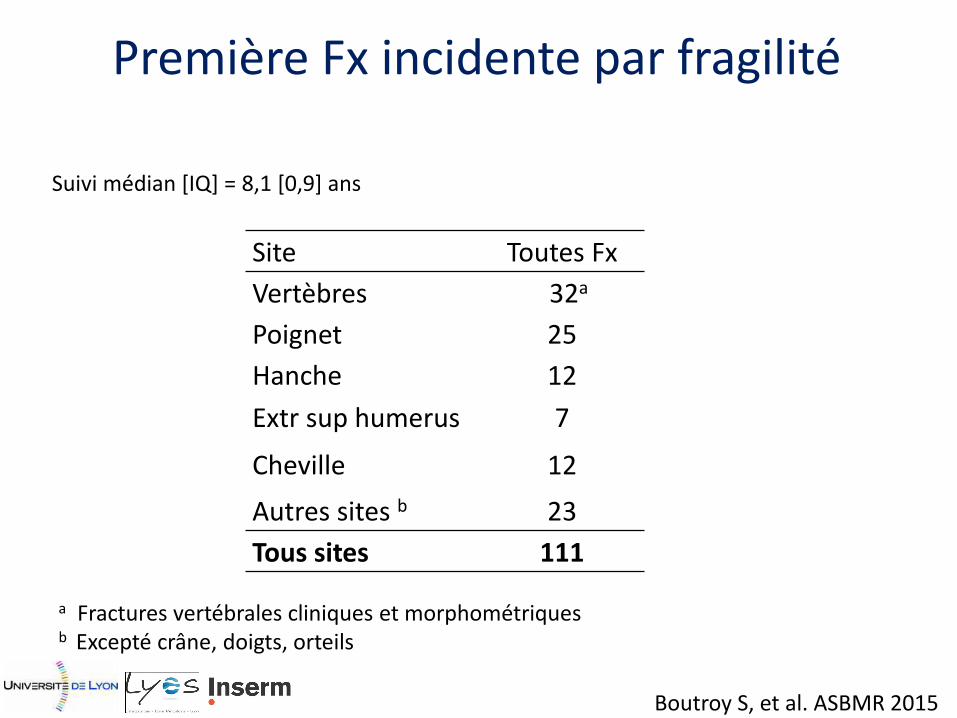
Première Fx incidente par fragilité
Site Toutes Fx
Vertèbres 32a
Poignet 25
Hanche 12
Extr sup humerus 7
Cheville 12
Autres sites b 23
Tous sites 111
a Fractures vertébrales cliniques et morphométriques b Excepté crâne, doigts, orteils
Suivi médian [IQ] = 8,1 [0,9] ans
Boutroy S, et al. ASBMR 2015
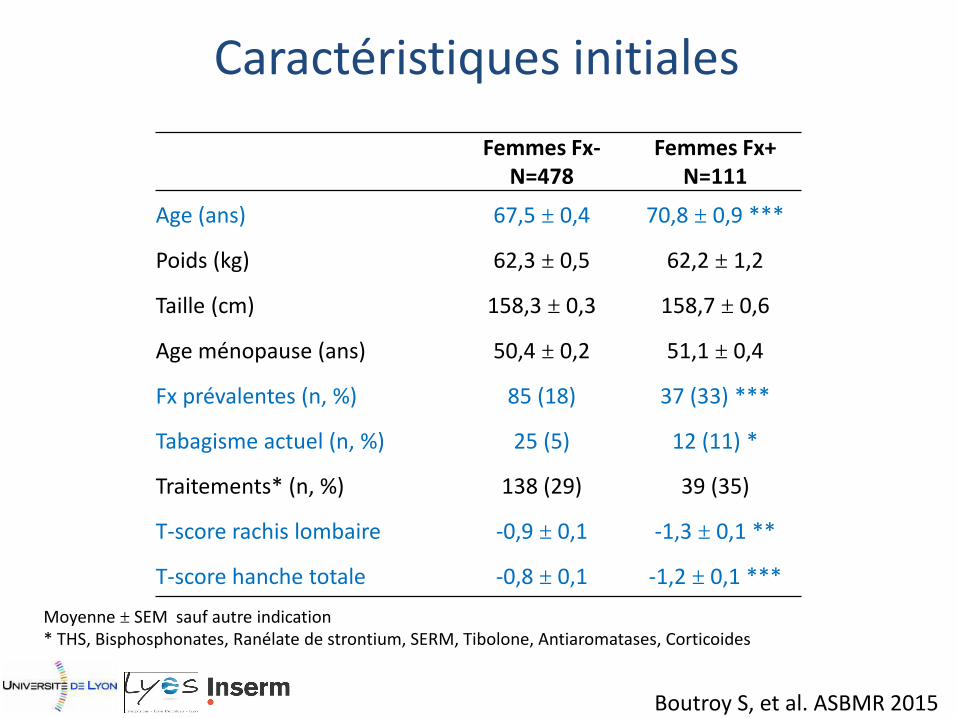
Caractéristiques initiales
Moyenne ± SEM sauf autre indication * THS, Bisphosphonates, Ranélate de strontium, SERM, Tibolone, Antiaromatases, Corticoides
Femmes Fx- N=478
Femmes Fx+ N=111
Age (ans) 67,5 ± 0,4 70,8 ± 0,9 ***
Poids (kg) 62,3 ± 0,5 62,2 ± 1,2
Taille (cm) 158,3 ± 0,3 158,7 ± 0,6
Age ménopause (ans) 50,4 ± 0,2 51,1 ± 0,4
Fx prévalentes (n, %) 85 (18) 37 (33) ***
Tabagisme actuel (n, %) 25 (5) 12 (11) *
Traitements* (n, %) 138 (29) 39 (35)
T-score rachis lombaire -0,9 ± 0,1 -1,3 ± 0,1 **
T-score hanche totale -0,8 ± 0,1 -1,2 ± 0,1 ***
Boutroy S, et al. ASBMR 2015
0
20
40
60
80
100
Total Compact Outer TZ Inner TZ
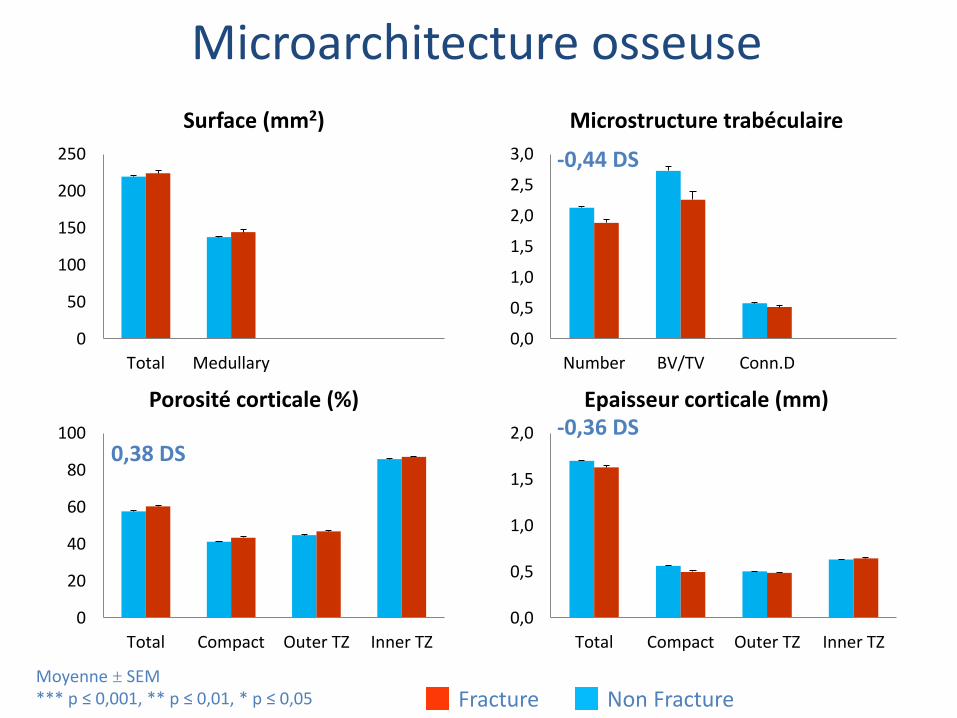
Porosité corticale (%)
Microarchitecture osseuse
0,0
0,5
1,0
1,5
2,0
Total Compact Outer TZ Inner TZ
Epaisseur corticale (mm)
***
*** **
***
** **
***
Moyenne ± SEM *** p ≤ 0,001, ** p ≤ 0,01, * p ≤ 0,05
0
50
100
150
200
250
Total Medullary
Surface (mm2)
0,0
0,5
1,0
1,5
2,0
2,5
3,0
Number BV/TV Conn.D
Microstructure trabéculaire
Fracture Non Fracture
***
**
**
0,38 DS -0,36 DS
-0,44 DS
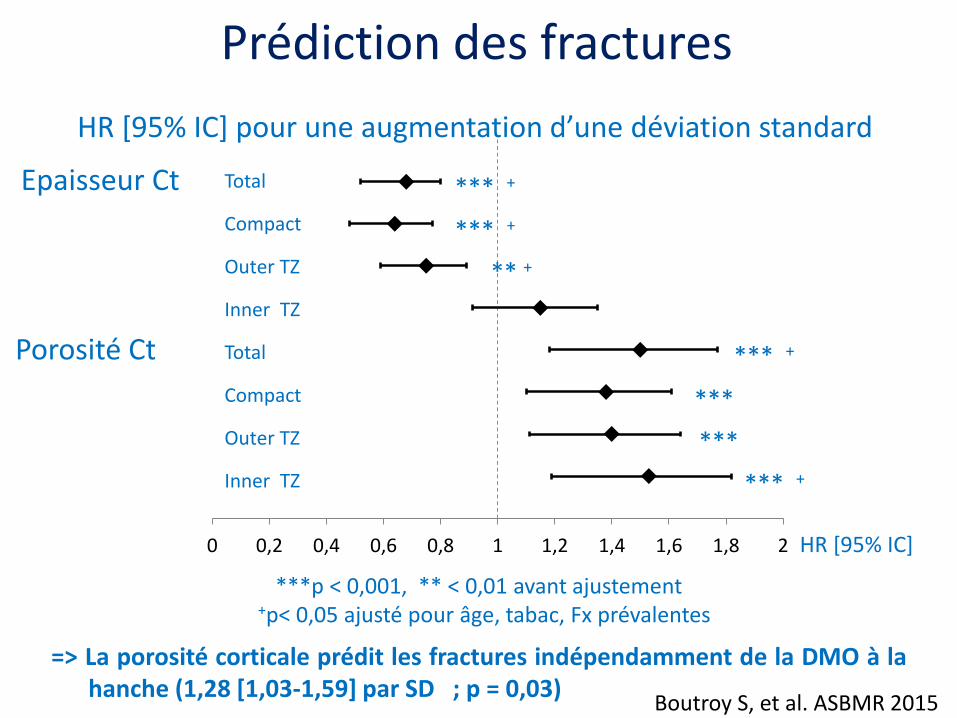
0 0,2 0,4 0,6 0,8 1 1,2 1,4 1,6 1,8 2
Porosité Ct
HR [95% IC] pour une augmentation d’une déviation standard
Epaisseur Ct Total
Compact
Outer TZ
Inner TZ
Total
Compact
Outer TZ
Inner TZ
***p < 0,001, ** < 0,01 avant ajustement +p< 0,05 ajusté pour âge, tabac, Fx prévalentes
HR [95% IC]
** +
*** +
Prédiction des fractures
*** +
*** +
*** +
***
***
=> La porosité corticale prédit les fractures indépendamment de la DMO à la hanche (1,28 [1,03-1,59] par SD ; p = 0,03)
Boutroy S, et al. ASBMR 2015
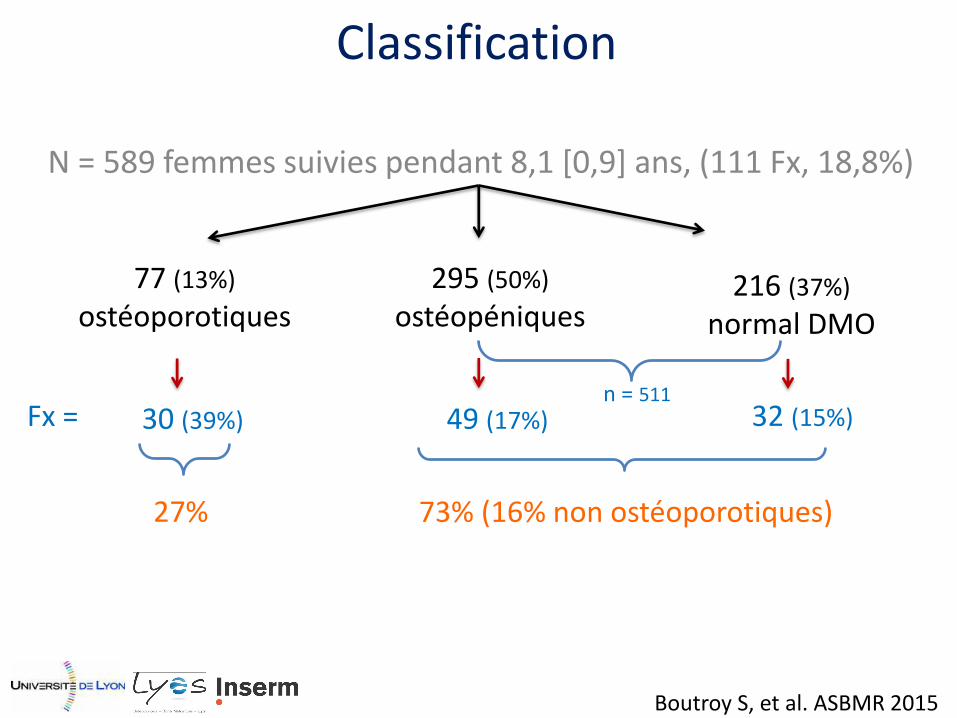
N = 589 femmes suivies pendant 8,1 [0,9] ans, (111 Fx, 18,8%)
77 (13%)
ostéoporotiques 295 (50%)
ostéopéniques 216 (37%)
normal DMO
Fx = 49 (17%)
30 (39%) 32 (15%)
27%
73% (16% non ostéoporotiques)
n = 511
Classification
Boutroy S, et al. ASBMR 2015
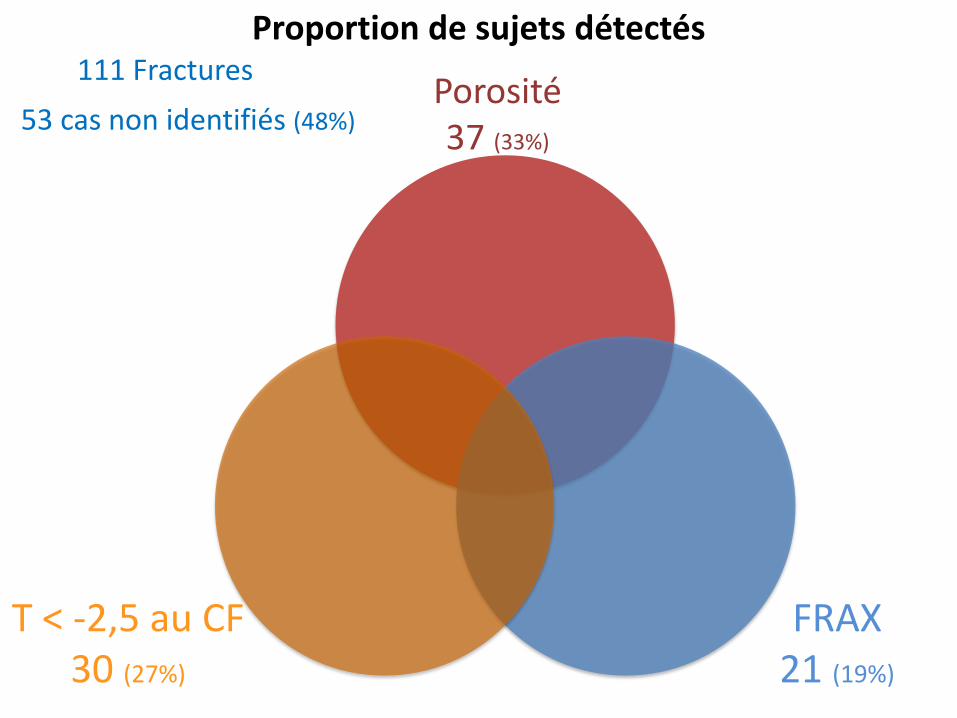
T < -2,5 au CF 30 (27%)
111 Fractures
FRAX 21 (19%)
Porosité 37 (33%)
53 cas non identifiés (48%)
Proportion de sujets détectés
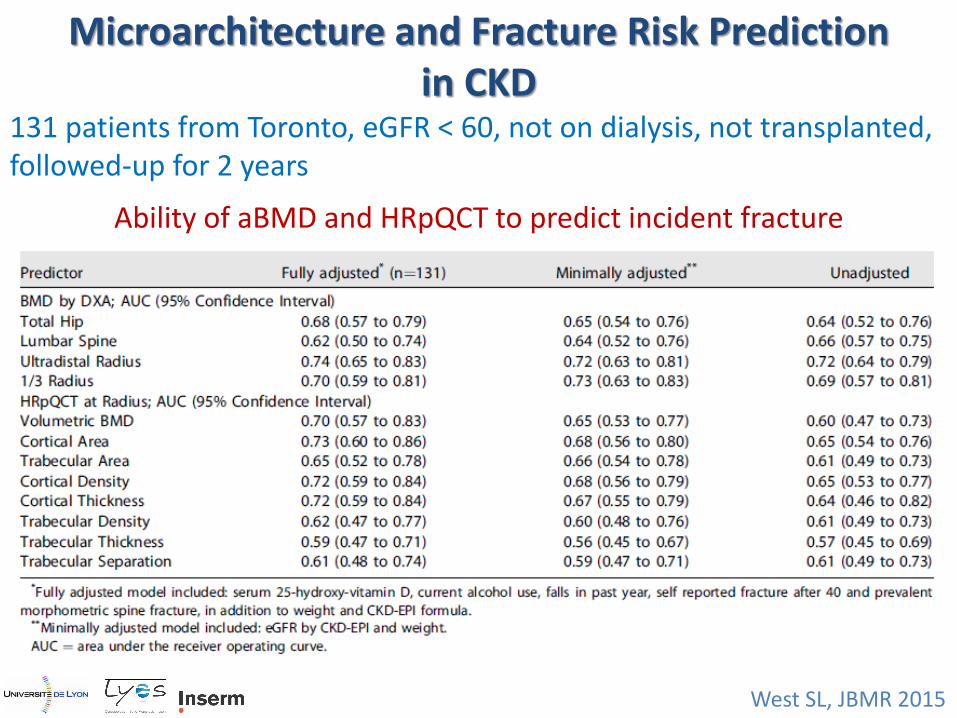
West SL, JBMR 2015
Microarchitecture and Fracture Risk Prediction in CKD
131 patients from Toronto, eGFR < 60, not on dialysis, not transplanted, followed-up for 2 years
Ability of aBMD and HRpQCT to predict incident fracture
Perspective
Avec l’imagerie, Se et Sp ne seront jamais > 65-70% en population générale Place de l’âge dans un dépistage de masse La place des nouvelles imageries est dans les populations spécifiques