Embed Size (px)
Citation preview

Réunion Annuelle Bourgogne / Franche-Comté« Les bonnes pratiques de prise en charge des Sarcomes
des Tissus Mous »
JY Blay
Avec tous les laboratoires pharmaceutiques et autres fabricant des médicaments destinés aux sarcomes (et aux autres cancers).
Recherche, honoraires, voyages professionnels
Diagnostic
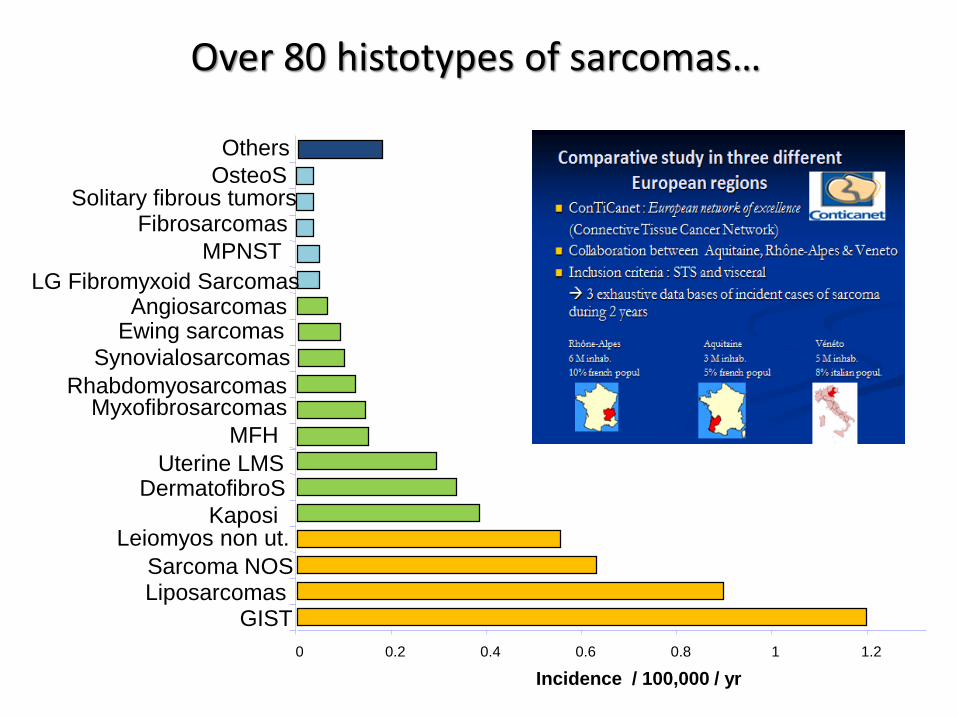
0 0.2 0.4 0.6 0.8 1 1.2 1.4
GISTLiposarcomasSarcoma NOS
Leiomyos non ut.Kaposi
DermatofibroSUterine LMS
MFH
MyxofibrosarcomasRhabdomyosarcomas
Synovialosarcomas
Ewing sarcomasAngiosarcomas
LG Fibromyxoid Sarcomas
MPNST
FibrosarcomasSolitary fibrous tumors
OsteoS
Incidence / 100,000 / yr
Others
Over 80 histotypes of sarcomas…
Besancon 18 1 18
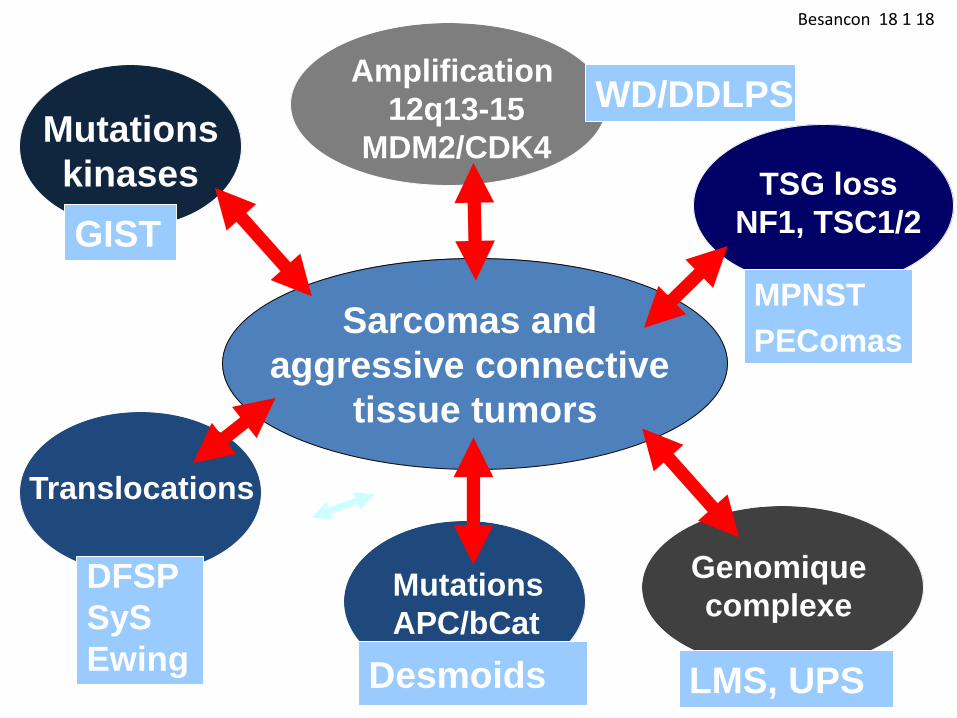
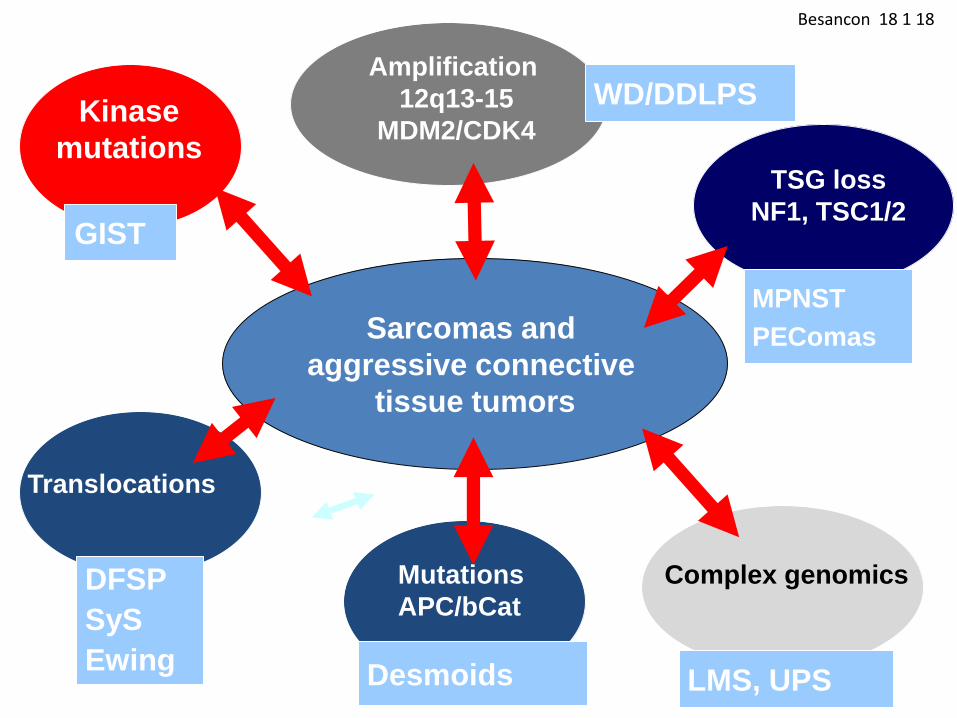
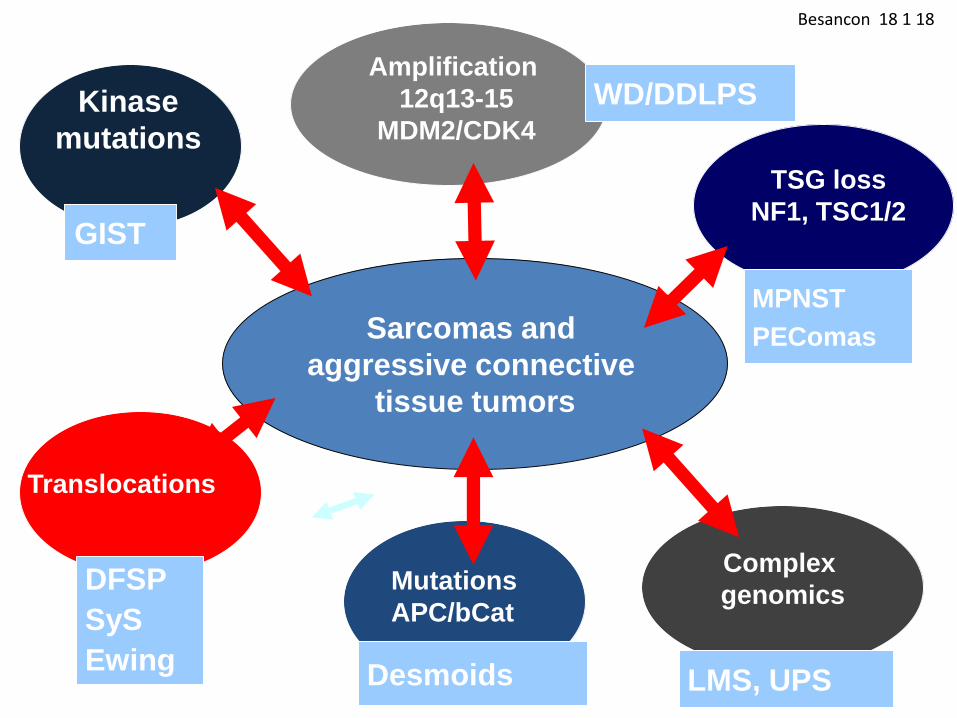
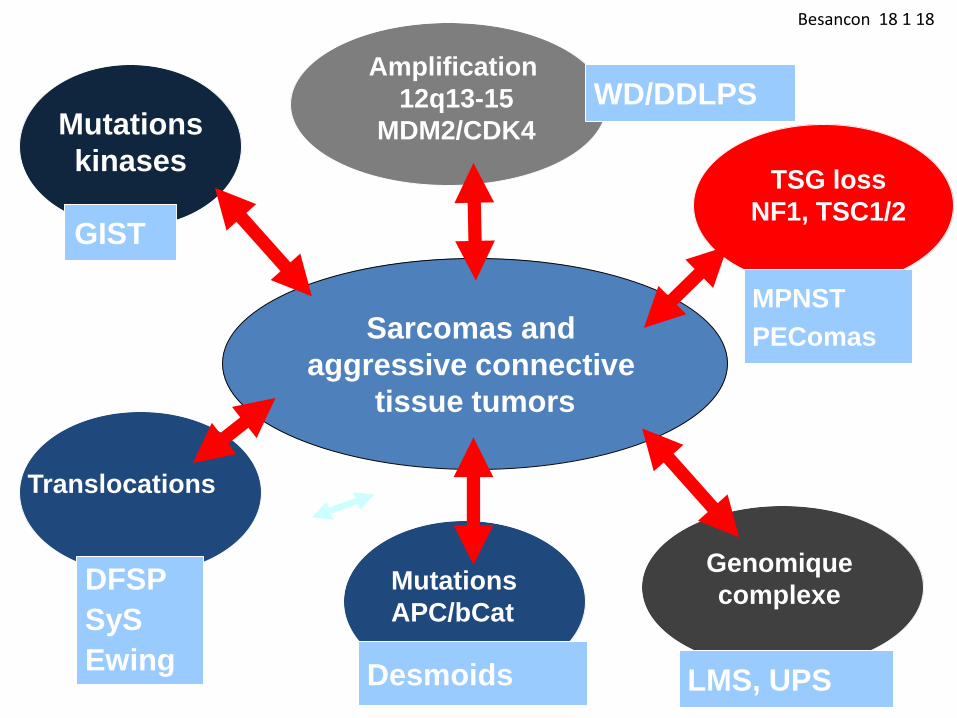
GIST
Sarcomas and
aggressive connective
tissue tumors
Mutations
kinases
G5
Ntl
Group
Translocations
DFSP
SyS
Ewing
Mutations
APC/bCat
Desmoids
WD/DDLPSAmplification
12q13-15
MDM2/CDK4
MPNST
PEComas
TSG loss
NF1, TSC1/2
Genomique
complexe
LMS, UPS
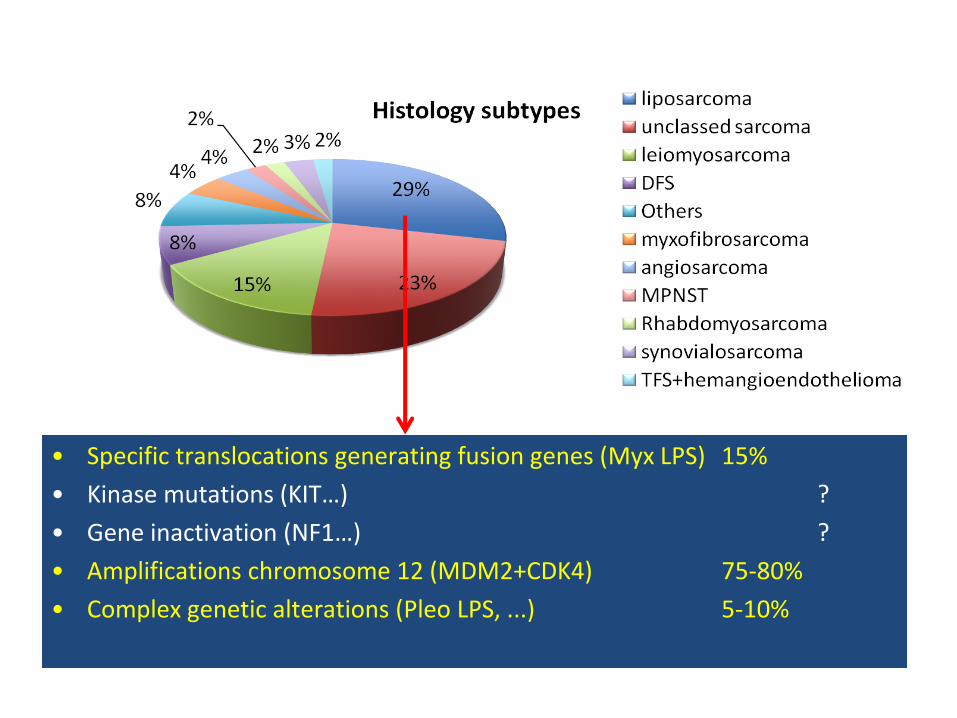
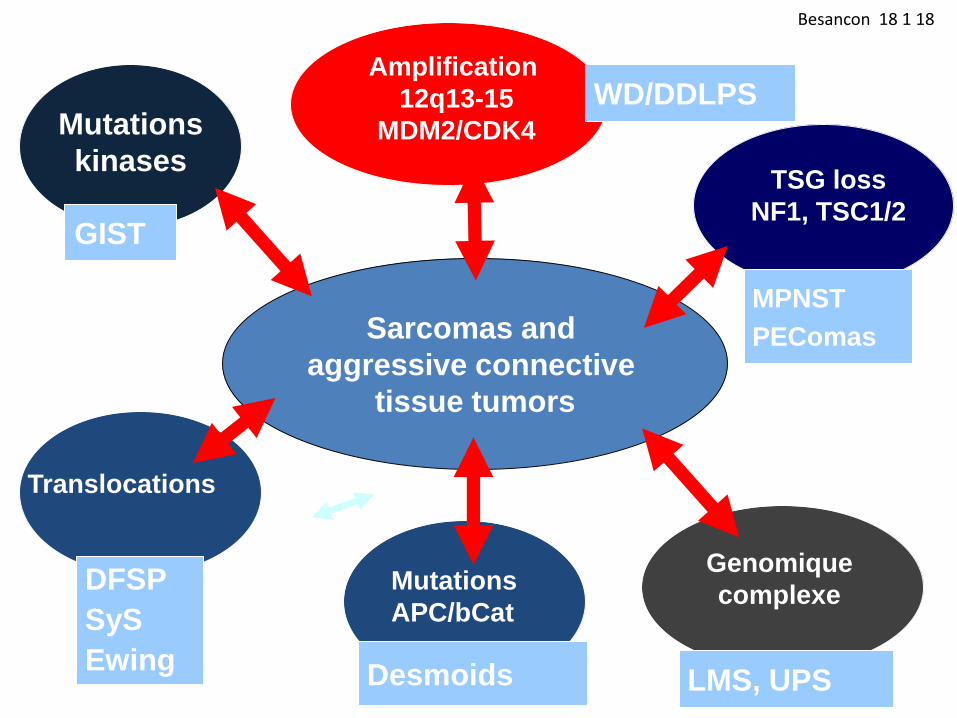
• Specific translocations generating fusion genes (Myx LPS) 15%
• Kinase mutations (KIT…) ?
• Gene inactivation (NF1…) ?
• Amplifications chromosome 12 (MDM2+CDK4) 75-80%
• Complex genetic alterations (Pleo LPS, ...) 5-10%
Ducimetière F et al. PLoS One 2011; 6: e20294.
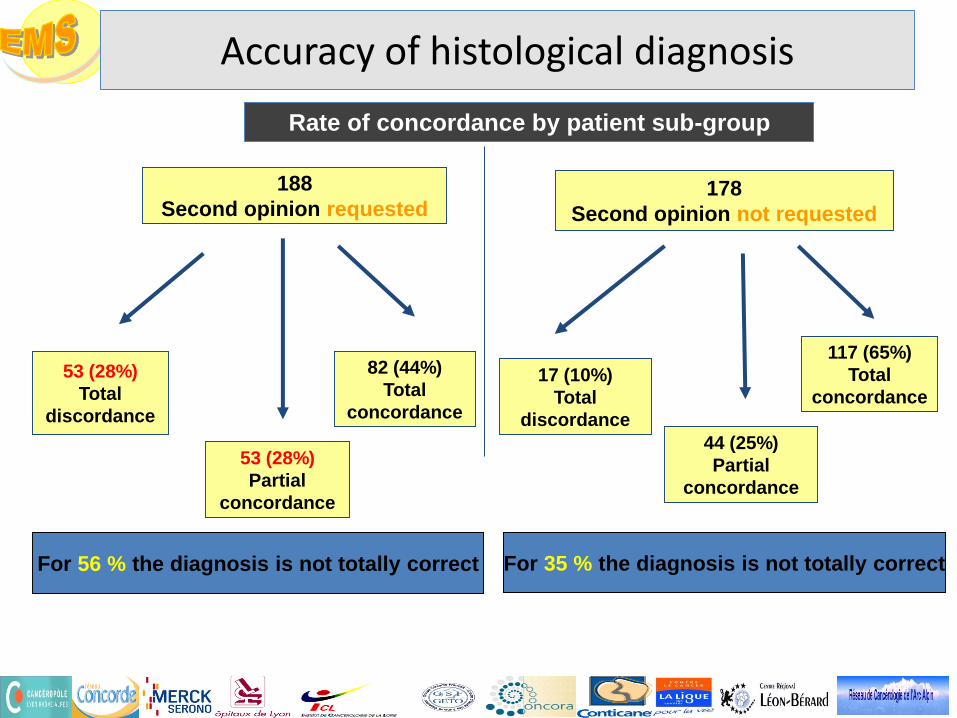
For 35 % the diagnosis is not totally correct
Rate of concordance by patient sub-group
188
Second opinion requested
53 (28%)
Total
discordance
53 (28%)
Partial
concordance
82 (44%)
Total
concordance
178
Second opinion not requested
17 (10%)
Total
discordance
44 (25%)
Partial
concordance
117 (65%)
Total
concordance
For 56 % the diagnosis is not totally correct
Accuracy of histological diagnosis
Ducimetière F, et al. PLoS One. 2011;6(8):e20294.
Cassier PA, etal. Br J Cancer. 2010 Jul 13;103(2):165-70.
Lurkin A, et al. BMC Cancer. 2010 Apr 19;10:150.
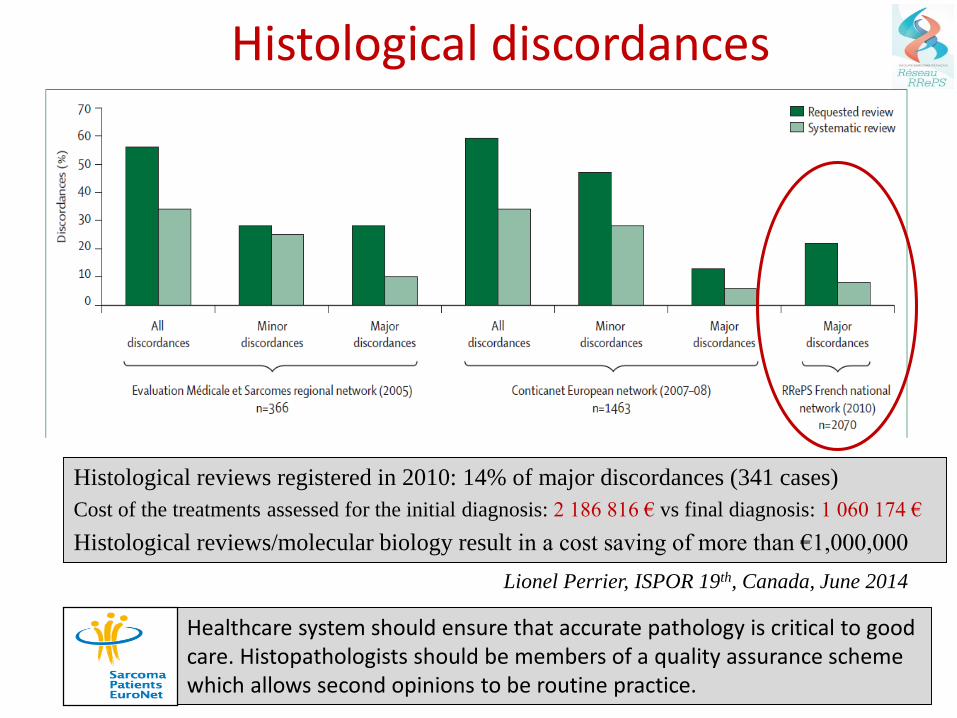
Histological discordances
Healthcare system should ensure that accurate pathology is critical to good care. Histopathologists should be members of a quality assurance scheme which allows second opinions to be routine practice.
Histological reviews registered in 2010: 14% of major discordances (341 cases)
Cost of the treatments assessed for the initial diagnosis: 2 186 816 € vs final diagnosis: 1 060 174 €
Histological reviews/molecular biology result in a cost saving of more than €1,000,000
Lionel Perrier, ISPOR 19th, Canada, June 2014

Prise en charge en phase localisée
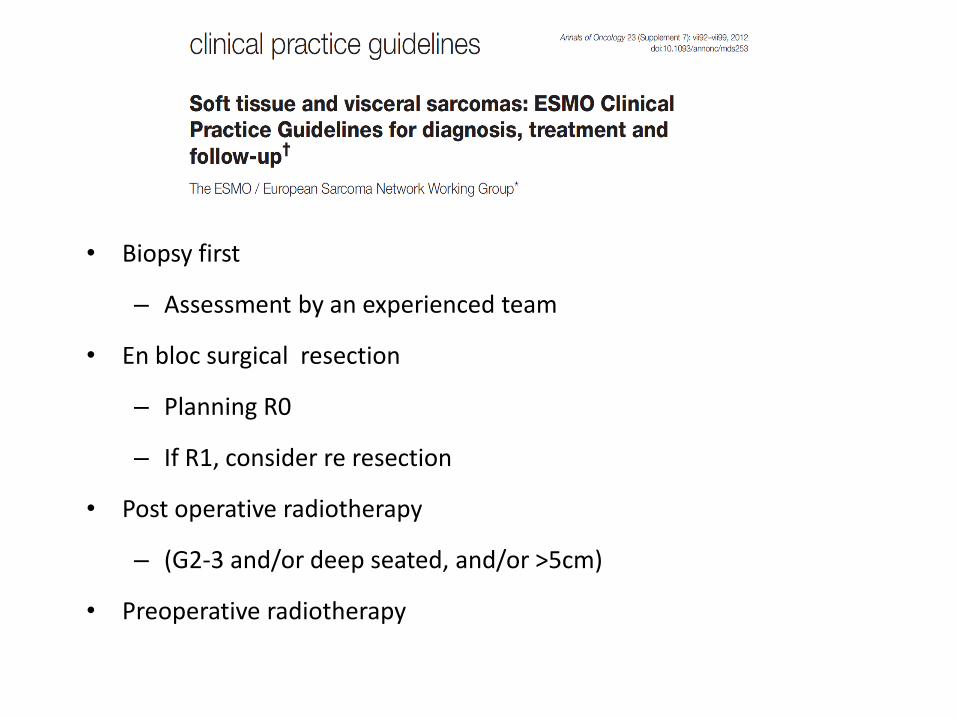
• Biopsy first
– Assessment by an experienced team
• En bloc surgical resection
– Planning R0
– If R1, consider re resection
• Post operative radiotherapy
– (G2-3 and/or deep seated, and/or >5cm)
• Preoperative radiotherapy
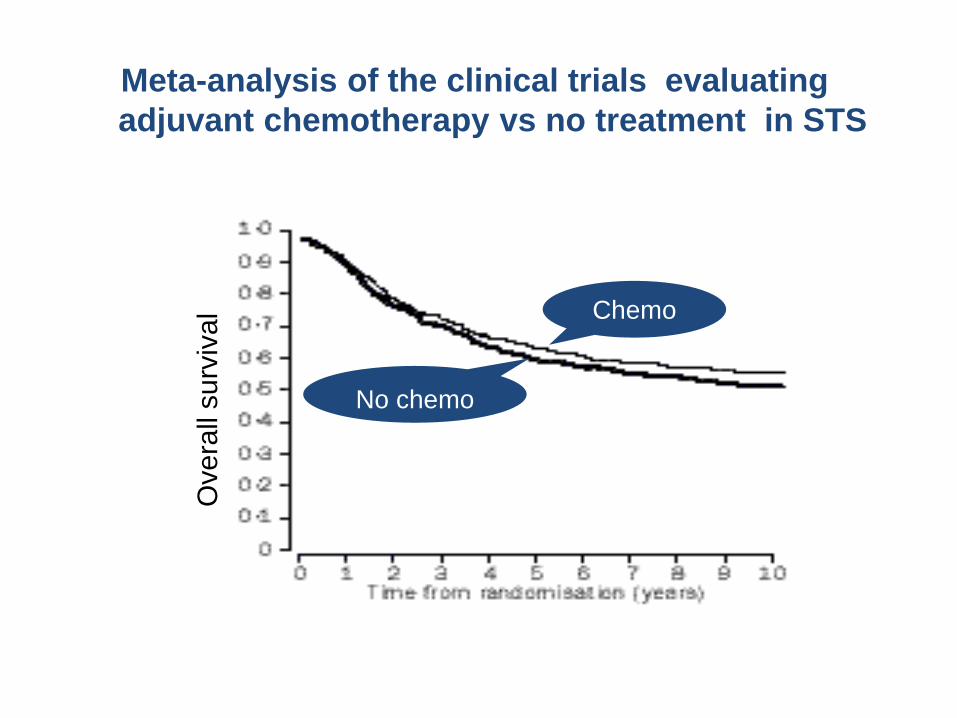
SMAC 1997, Lancet 350:1647-54
1568 patients in 14 randomized trials comparing chemotherapy vs 0
Ove
rall
su
rviv
al Chemo
No chemo
Meta-analysis of the clinical trials evaluating
adjuvant chemotherapy vs no treatment in STS
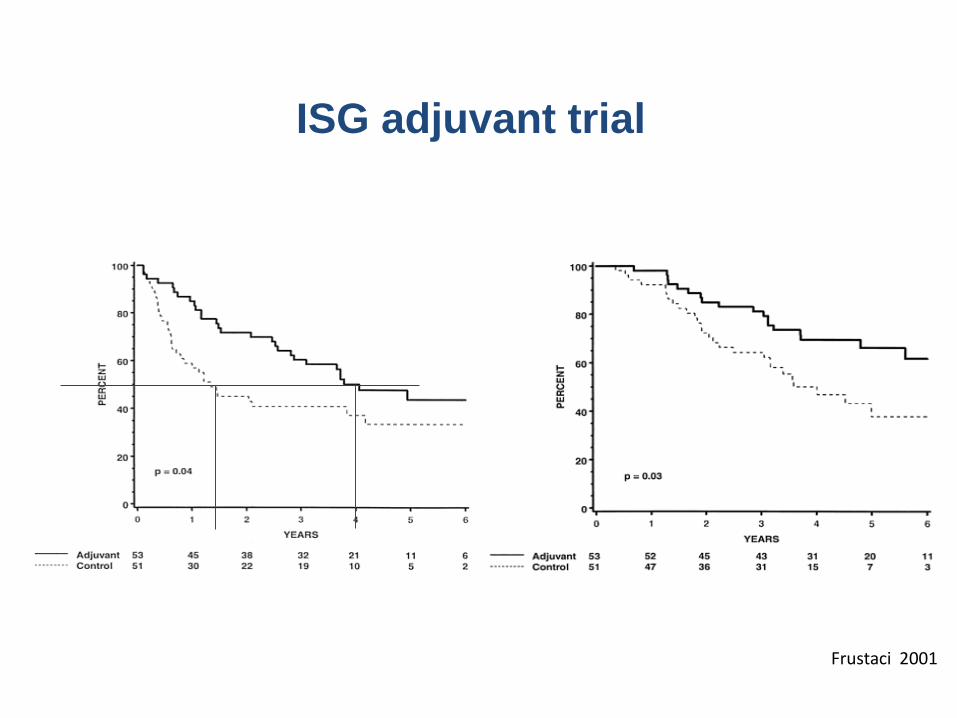
ISG adjuvant trial
DFS OS
Frustaci et al. JCO 2001; 19:1238Frustaci 2001
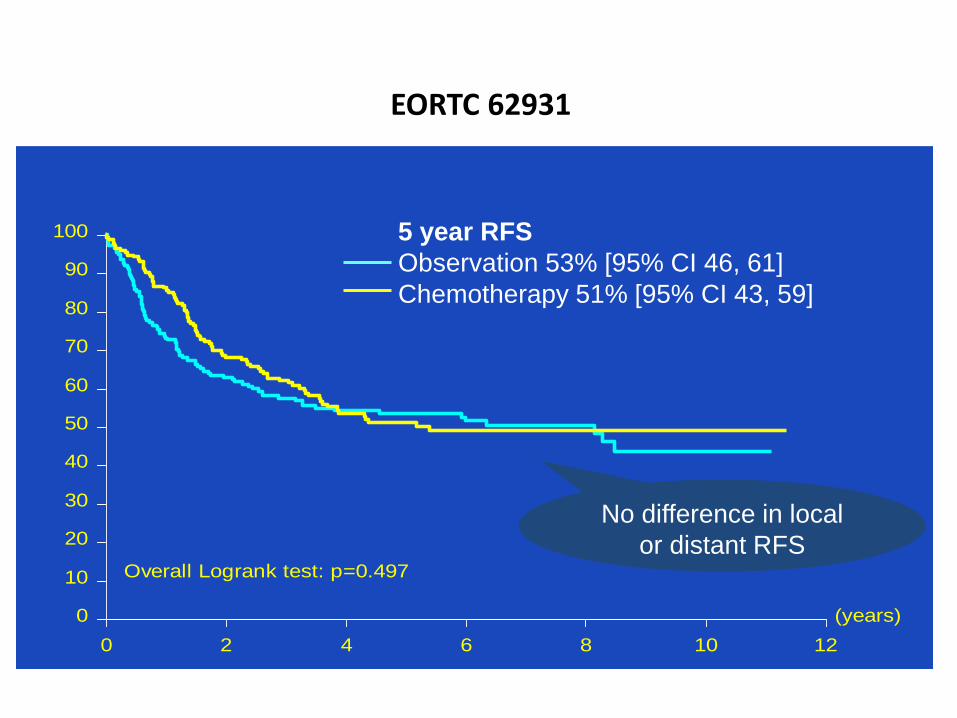
EORTC 62931
(years)
0 2 4 6 8 10 12
0
10
20
30
40
50
60
70
80
90
100
O N Number of patients at risk : TRT1
86 176 108 78 54 27 5
82 175 115 69 38 19 4
Observation
Adjuvant
Overall Logrank test: p=0.497
5 year RFS
Observation 53% [95% CI 46, 61]
Chemotherapy 51% [95% CI 43, 59]
No difference in local
or distant RFS
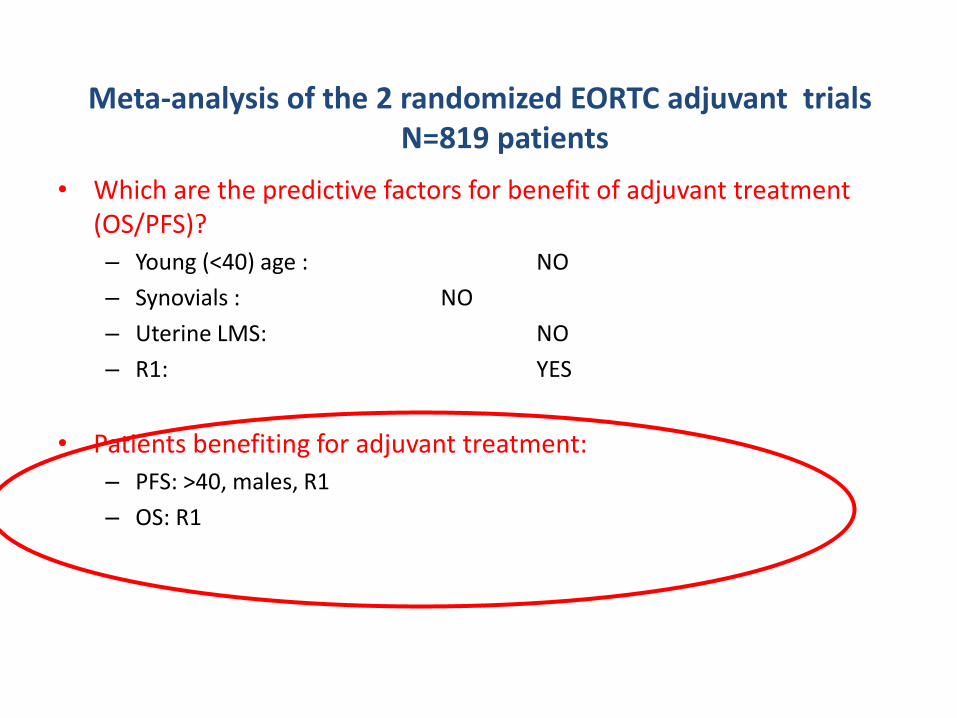
Meta-analysis of the 2 randomized EORTC adjuvant trialsN=819 patients
• Which are the predictive factors for benefit of adjuvant treatment (OS/PFS)?
– Young (<40) age : NO
– Synovials : NO
– Uterine LMS: NO
– R1: YES
• Patients benefiting for adjuvant treatment:
– PFS: >40, males, R1
– OS: R1
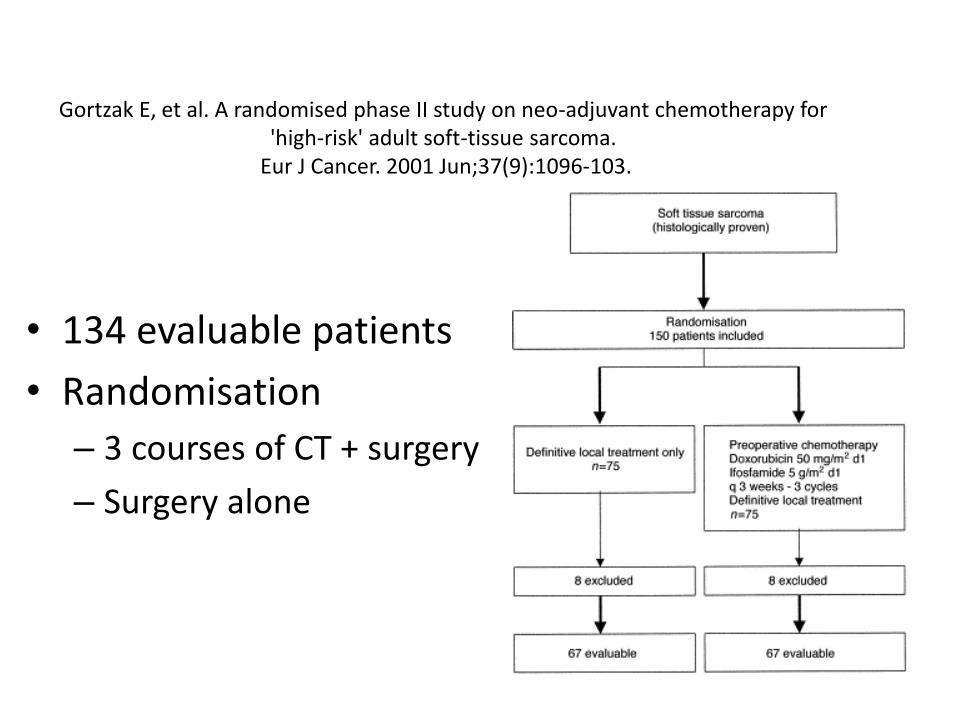
Gortzak E, et al. A randomised phase II study on neo-adjuvant chemotherapy for 'high-risk' adult soft-tissue sarcoma.
Eur J Cancer. 2001 Jun;37(9):1096-103.
• 134 evaluable patients
• Randomisation
– 3 courses of CT + surgery
– Surgery alone
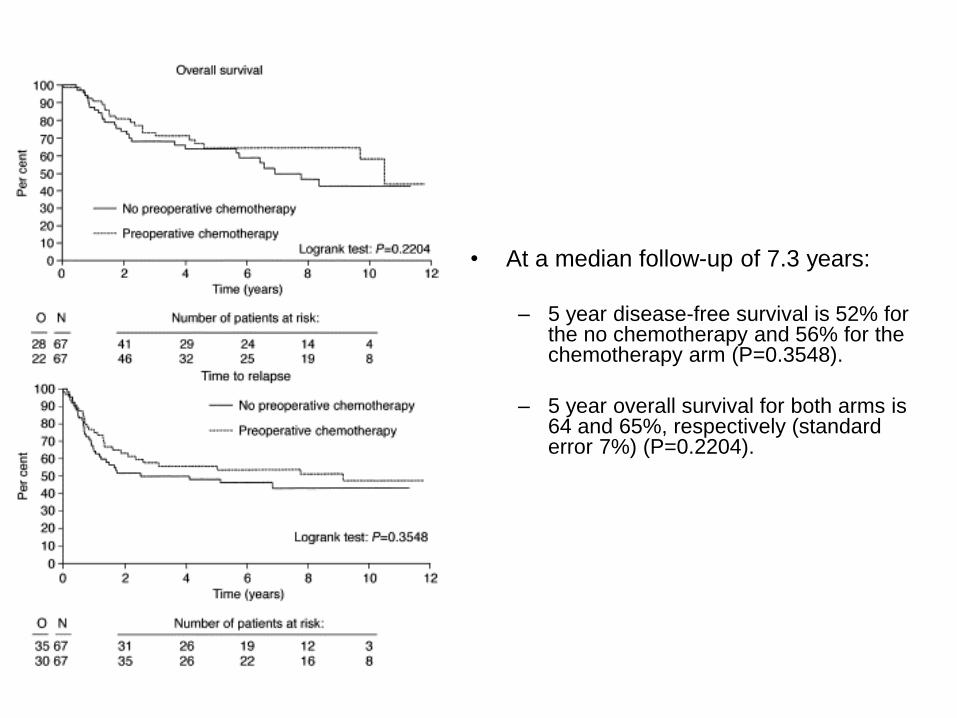
• At a median follow-up of 7.3 years:
– 5 year disease-free survival is 52% for the no chemotherapy and 56% for the chemotherapy arm (P=0.3548).
– 5 year overall survival for both arms is64 and 65%, respectively (standard error 7%) (P=0.2204).
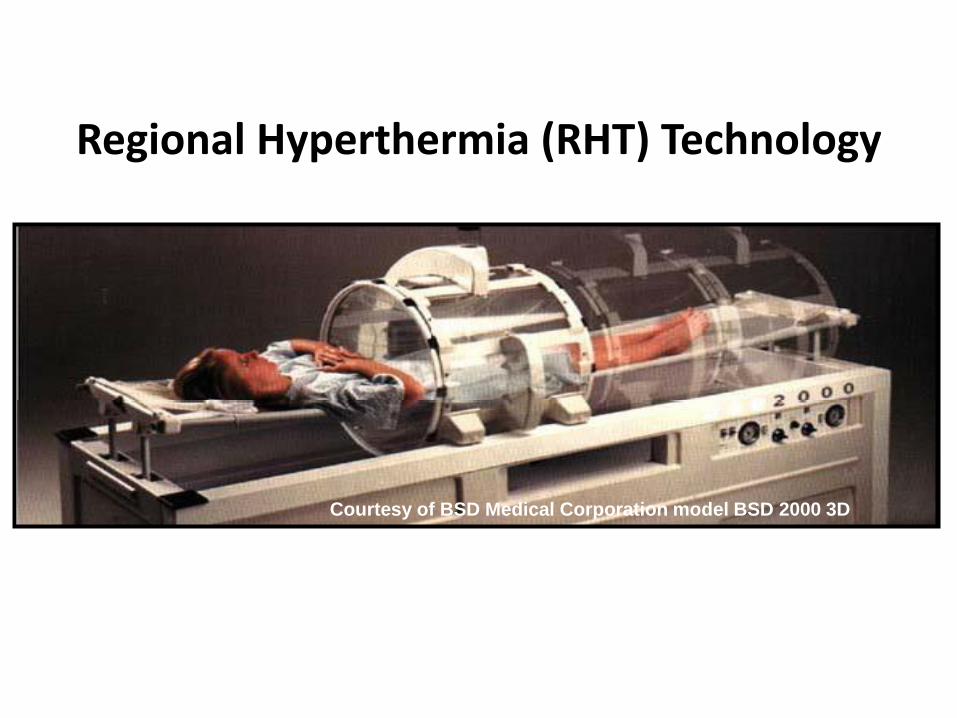
Regional Hyperthermia (RHT) Technology
Courtesy of BSD Medical Corporation model BSD 2000 3D
ESHO quality assurance guidelines for regional hyperthermia Lagendijk et al. Int J Hyperthermia 1998
R
A
D
I
A
T
I
O
N
Arm A
Arm B
EIA
EIA
RHT
R
R
A
D
I
A
T
I
O
N
Arm A
Arm B
EIA
EIA
RHT
R
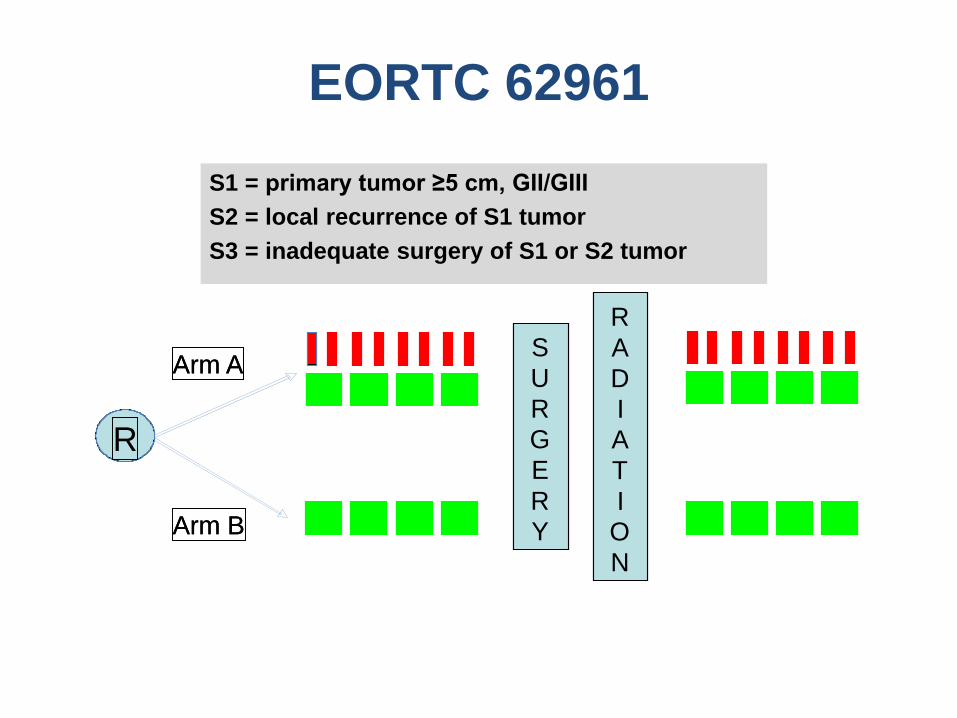
EORTC 62961
Risk
groups
Stratification: Center, Risk Group, Extremity, Non-Extremity
S
U
R
G
E
R
Y
S
U
R
G
E
R
Y
S1 = primary tumor ≥5 cm, GII/GIII
S2 = local recurrence of S1 tumor
S3 = inadequate surgery of S1 or S2 tumor
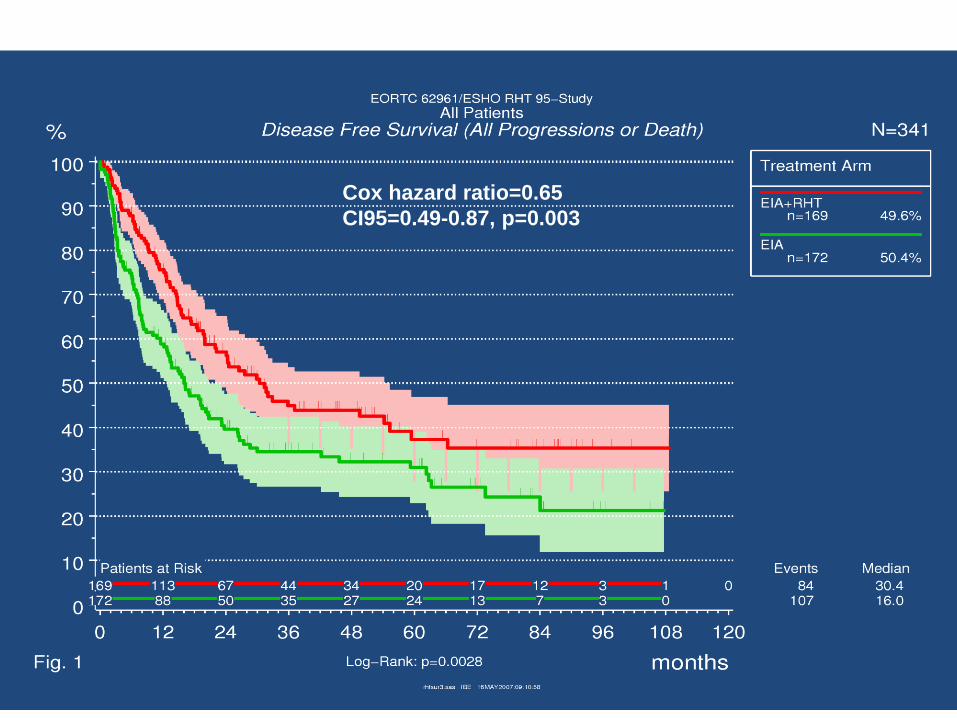
Cox hazard ratio=0.65
CI95=0.49-0.87, p=0.003
Impact of clinical practice guidelines (CPG’s) on survival for
sarcoma patients in first line treatment in Rhone-Alpes region
Olfa DERBEL1, Pierre Etienne HEUDEL1, Claire CROPET1, Gualter VAZ3, Pierre MEEUS1, Olivier COLLARD2, Guy DE LAROCHE2, Philippe THIESSE1, Anne-Valérie DECOUVELAERE1, Dominique
RANCHERE-VINCE1, Pierre BIRON1, François Noel GILLY7, Peter PAUWELS4, Fadila FARSI5, Dominic CELLIER6, Jean-Yves BLAY1, Isabelle RAY-COQUARD1
1Centre Léon Bérard, Lyon, France 2Institut de Cancérologie de la Loire, Saint-Priest en Jarez, France3Hôpital Edouard Herriot, Lyon, France4Cancéropôle Lyon Auvergne Rhône-Alpes, France5Réseau Espace Santé Cancer, Rhône-Alpes, France6Merck Serono, Lyon, France7Université Claude Bernard, Lyon, France
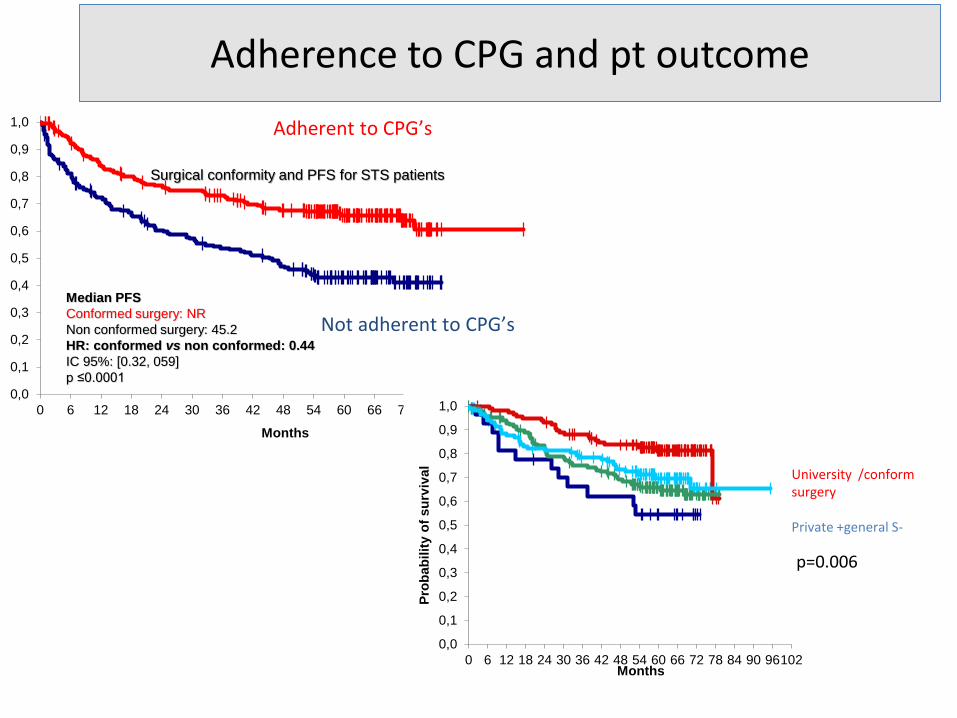
Adherence to CPG and pt outcome
Surgical conformity and PFS for STS patients
Median PFS
Conformed surgery: NR
Non conformed surgery: 45.2
HR: conformed vs non conformed: 0.44
IC 95%: [0.32, 059]
p ≤0.0001
0,0
0,1
0,2
0,3
0,4
0,5
0,6
0,7
0,8
0,9
1,0
0 6 12 18 24 30 36 42 48 54 60 66 72 78 84 90 96 102
Months
Adherent to CPG’s
Not adherent to CPG’s
0,0
0,1
0,2
0,3
0,4
0,5
0,6
0,7
0,8
0,9
1,0
0 6 12 18 24 30 36 42 48 54 60 66 72 78 84 90 96102
Pro
bab
ilit
y o
f su
rviv
al
Months
University /conformsurgery
Private +general S-
p=0.006
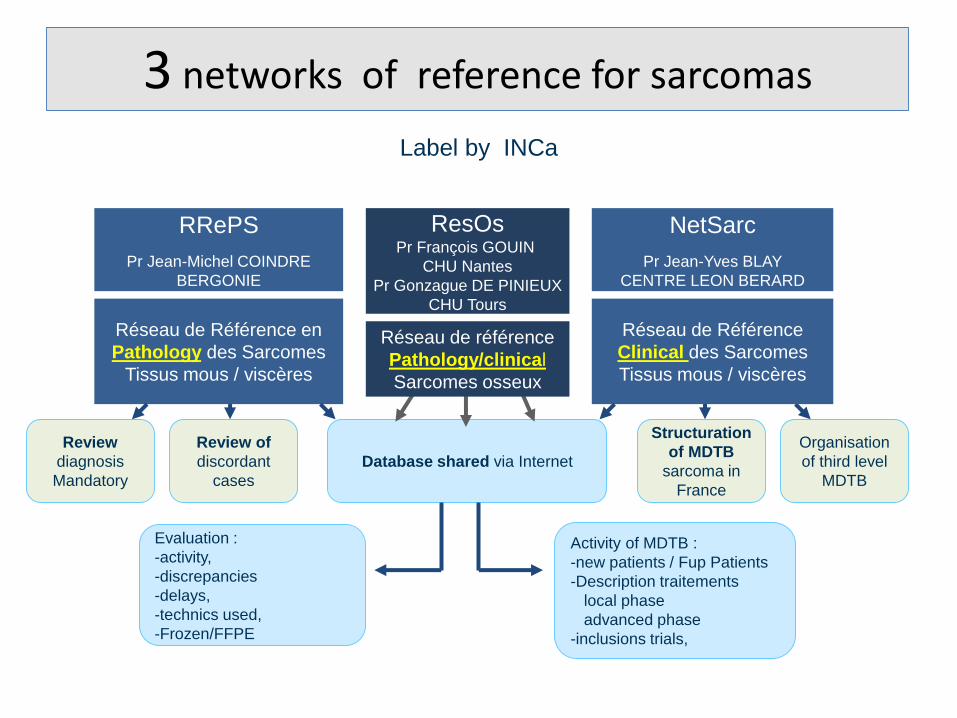
3 networks of reference for sarcomas
Label by INCa
Review
diagnosis
Mandatory
Review of
discordant
cases
Evaluation :
-activity,
-discrepancies
-delays,
-technics used,
-Frozen/FFPE
Database shared via Internet
Structuration
of MDTB
sarcoma in
France
Organisation
of third level
MDTB
Activity of MDTB :
-new patients / Fup Patients
-Description traitements
local phase
advanced phase
-inclusions trials,
Réseau de Référence en
Pathology des Sarcomes
Tissus mous / viscères
RRePS
Pr Jean-Michel COINDRE
BERGONIE
NetSarc
Pr Jean-Yves BLAY
CENTRE LEON BERARD
Réseau de Référence
Clinical des Sarcomes
Tissus mous / viscères
ResOsPr François GOUIN
CHU Nantes
Pr Gonzague DE PINIEUX
CHU Tours
Réseau de référence
Pathology/clinical
Sarcomes osseux
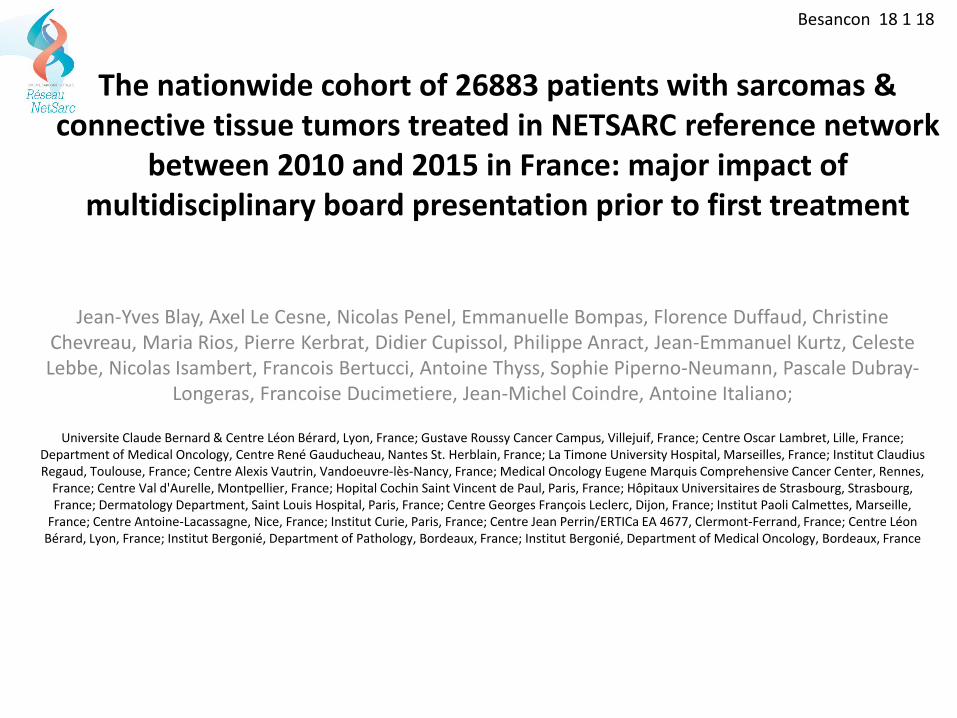
Besancon 18 1 18
Jean-Yves Blay, Axel Le Cesne, Nicolas Penel, Emmanuelle Bompas, Florence Duffaud, Christine Chevreau, Maria Rios, Pierre Kerbrat, Didier Cupissol, Philippe Anract, Jean-Emmanuel Kurtz, Celeste Lebbe, Nicolas Isambert, Francois Bertucci, Antoine Thyss, Sophie Piperno-Neumann, Pascale Dubray-
Longeras, Francoise Ducimetiere, Jean-Michel Coindre, Antoine Italiano;
Universite Claude Bernard & Centre Léon Bérard, Lyon, France; Gustave Roussy Cancer Campus, Villejuif, France; Centre Oscar Lambret, Lille, France; Department of Medical Oncology, Centre René Gauducheau, Nantes St. Herblain, France; La Timone University Hospital, Marseilles, France; Institut Claudius Regaud, Toulouse, France; Centre Alexis Vautrin, Vandoeuvre-lès-Nancy, France; Medical Oncology Eugene Marquis Comprehensive Cancer Center, Rennes,
France; Centre Val d'Aurelle, Montpellier, France; Hopital Cochin Saint Vincent de Paul, Paris, France; Hôpitaux Universitaires de Strasbourg, Strasbourg, France; Dermatology Department, Saint Louis Hospital, Paris, France; Centre Georges François Leclerc, Dijon, France; Institut Paoli Calmettes, Marseille,
France; Centre Antoine-Lacassagne, Nice, France; Institut Curie, Paris, France; Centre Jean Perrin/ERTICa EA 4677, Clermont-Ferrand, France; Centre Léon Bérard, Lyon, France; Institut Bergonié, Department of Pathology, Bordeaux, France; Institut Bergonié, Department of Medical Oncology, Bordeaux, France
The nationwide cohort of 26883 patients with sarcomas & connective tissue tumors treated in NETSARC reference network
between 2010 and 2015 in France: major impact of multidisciplinary board presentation prior to first treatment
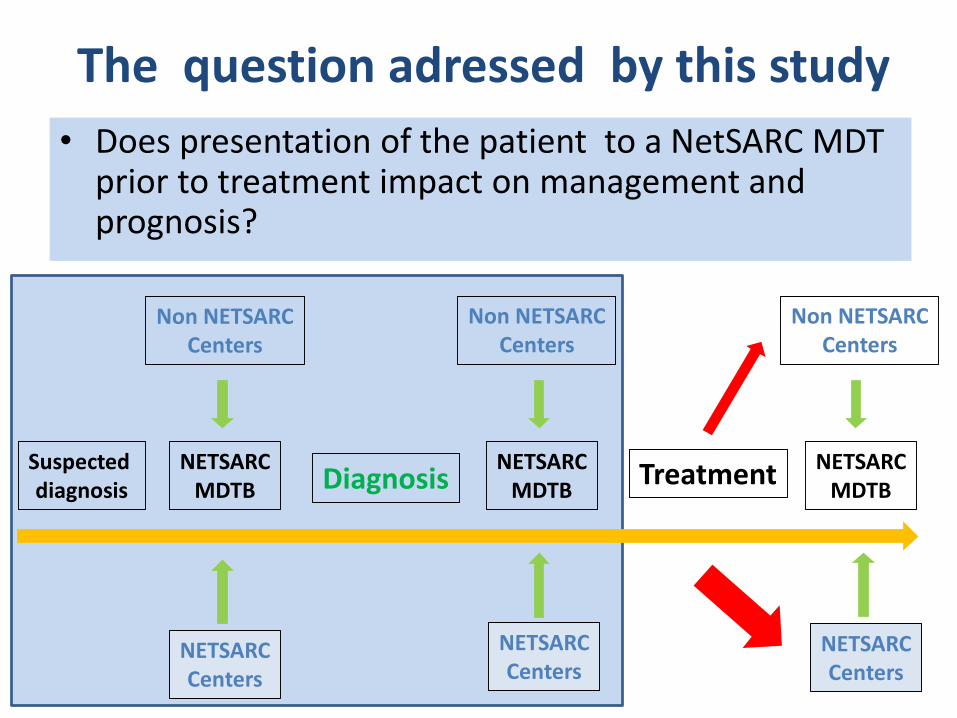
The question adressed by this study
• Does presentation of the patient to a NetSARC MDT prior to treatment impact on management and prognosis?
Suspecteddiagnosis Diagnosis
NETSARCMDTB
NETSARCMDTB
NETSARCMDTB
Treatment
NETSARCCenters
NETSARCCenters
NETSARCCenters
Non NETSARCCenters
Non NETSARCCenters
Non NETSARCCenters
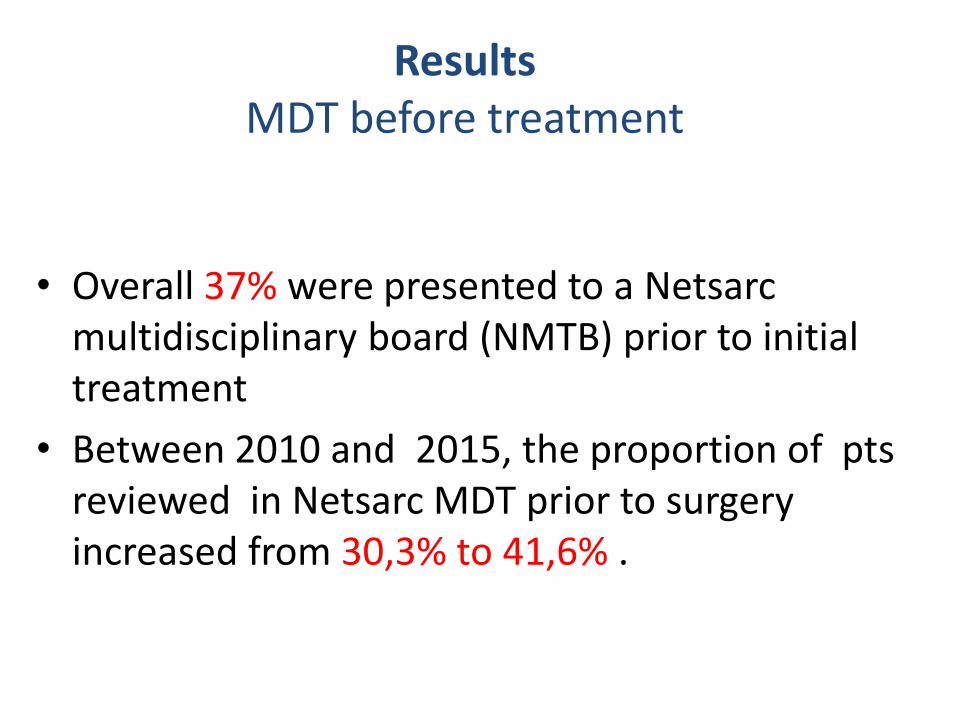
ResultsMDT before treatment
• Overall 37% were presented to a Netsarcmultidisciplinary board (NMTB) prior to initial treatment
• Between 2010 and 2015, the proportion of pts reviewed in Netsarc MDT prior to surgery increased from 30,3% to 41,6% .
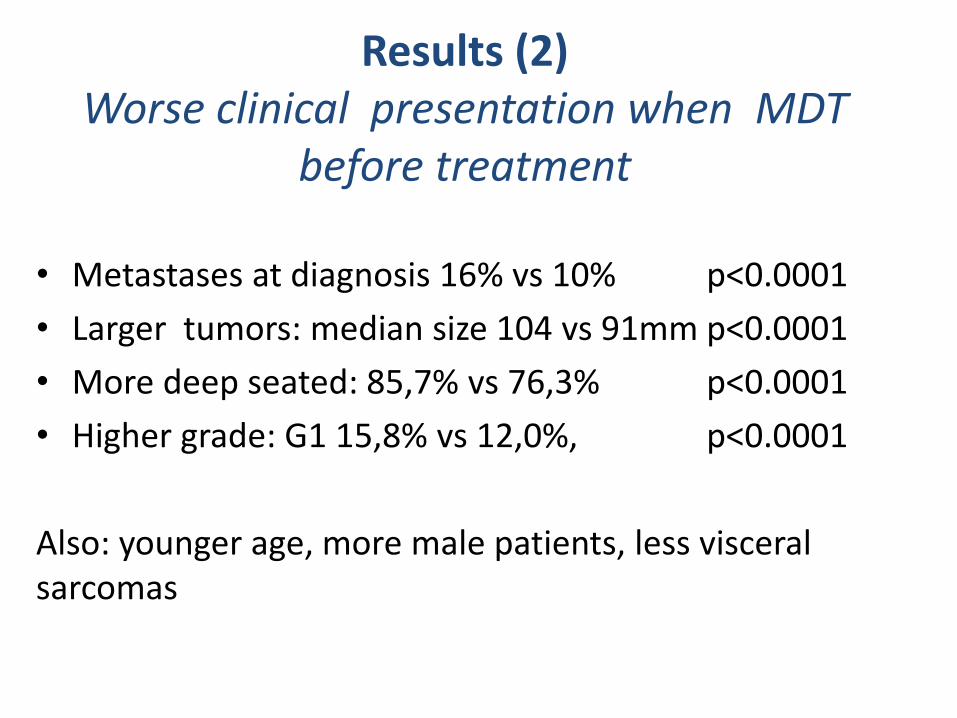
Results (2)Worse clinical presentation when MDT
before treatment
• Metastases at diagnosis 16% vs 10% p<0.0001
• Larger tumors: median size 104 vs 91mm p<0.0001
• More deep seated: 85,7% vs 76,3% p<0.0001
• Higher grade: G1 15,8% vs 12,0%, p<0.0001
Also: younger age, more male patients, less visceral sarcomas
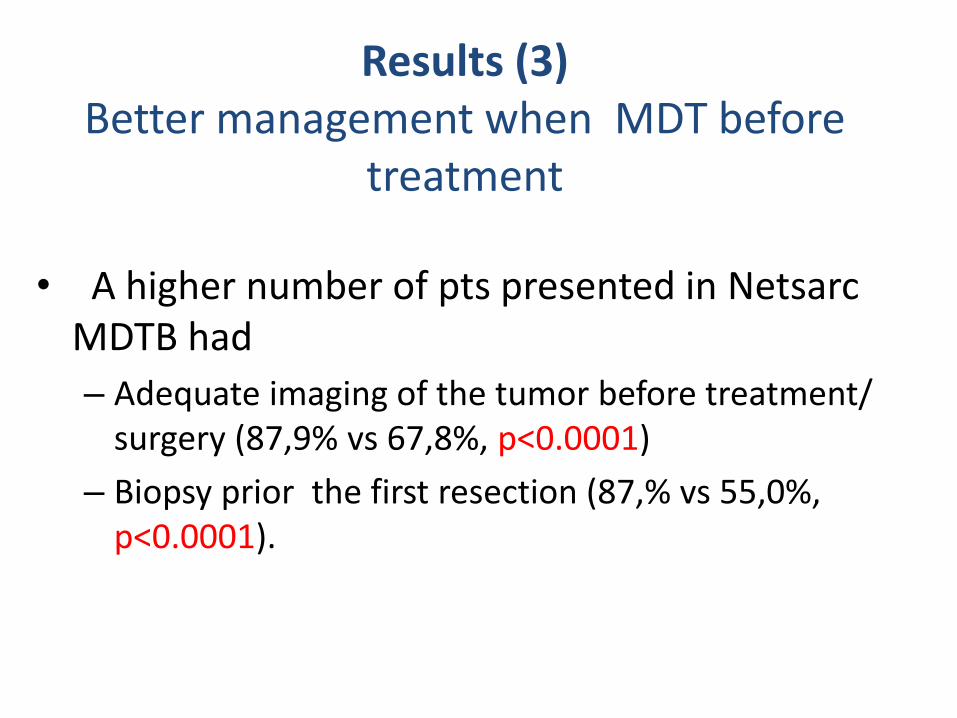
Results (3)Better management when MDT before
treatment
• A higher number of pts presented in NetsarcMDTB had
– Adequate imaging of the tumor before treatment/ surgery (87,9% vs 67,8%, p<0.0001)
– Biopsy prior the first resection (87,% vs 55,0%, p<0.0001).
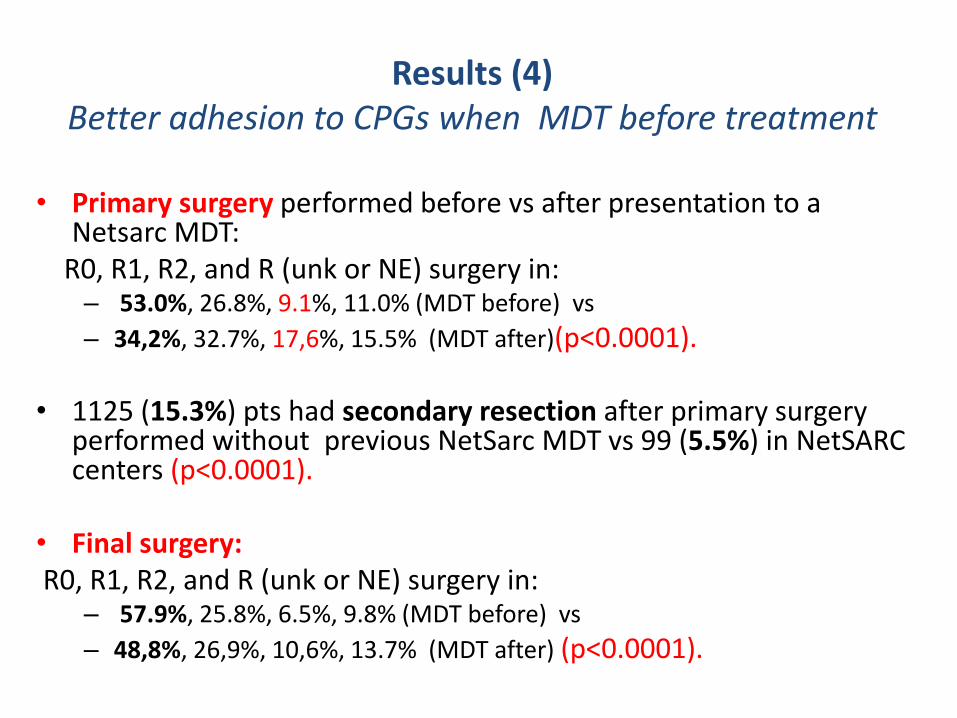
Results (4)Better adhesion to CPGs when MDT before treatment
• Primary surgery performed before vs after presentation to a Netsarc MDT:
R0, R1, R2, and R (unk or NE) surgery in:– 53.0%, 26.8%, 9.1%, 11.0% (MDT before) vs
– 34,2%, 32.7%, 17,6%, 15.5% (MDT after)(p<0.0001).
• 1125 (15.3%) pts had secondary resection after primary surgery performed without previous NetSarc MDT vs 99 (5.5%) in NetSARCcenters (p<0.0001).
• Final surgery:R0, R1, R2, and R (unk or NE) surgery in:
– 57.9%, 25.8%, 6.5%, 9.8% (MDT before) vs
– 48,8%, 26,9%, 10,6%, 13.7% (MDT after) (p<0.0001).
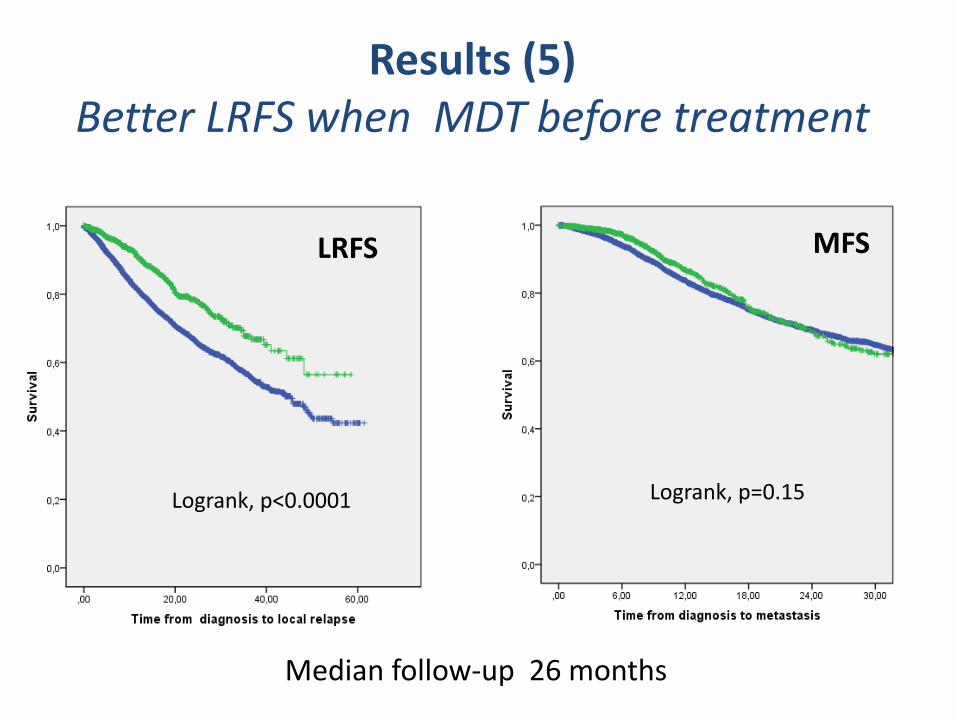
Median follow-up 26 months
Logrank, p<0.0001 Logrank, p=0.15
Results (5)Better LRFS when MDT before treatment
LRFS MFS
Besancon 18 1 18
Jean-Yves Blay, Eberhard Stoeckle, Antoine Italiano , R Rochwerger, Florence Duffaud,
Sylvie Bonvalot, Charles Honoré, Guy Decanter, Carlos Maynou, Philippe Anract, Gwenael Ferron,
Francois Guillemin, Francois Gouin, Maria Rios, Antonio Di Marco1, D. Cupissol, Pierre Meeus,
Jean-Michel Coindre, Isabelle Ray-Coquard1, Nicolas Penel, Axel Le Cesne
Universite Claude Bernard & Centre Léon Bérard, Lyon, France; Gustave Roussy Cancer Campus, Villejuif, France; Centre Oscar Lambret, Lille, France; Department of Medical Oncology, Centre René Gauducheau, Nantes St. Herblain, France; La Timone University Hospital, Marseilles, France; Institut Claudius Regaud, Toulouse, France; Centre Alexis Vautrin, Vandoeuvre-lès-Nancy, France; Medical Oncology Eugene Marquis Comprehensive Cancer Center, Rennes,
France; Centre Val d'Aurelle, Montpellier, France; Hopital Cochin Saint Vincent de Paul, Paris, France; Hôpitaux Universitaires de Strasbourg, Strasbourg, France; Dermatology Department, Saint Louis Hospital, Paris, France; Centre Georges François Leclerc, Dijon, France; Institut Paoli Calmettes, Marseille,
France; Centre Antoine-Lacassagne, Nice, France; Institut Curie, Paris, France; Centre Jean Perrin/ERTICa EA 4677, Clermont-Ferrand, France; Centre Léon Bérard, Lyon, France; Institut Bergonié, Department of Pathology, Bordeaux, France; Institut Bergonié, Department of Medical Oncology, Bordeaux, France
Better overall and progression free survival after surgery in expert sites for sarcoma patients: a nationwide study of FSG-
GETO/NETSARC
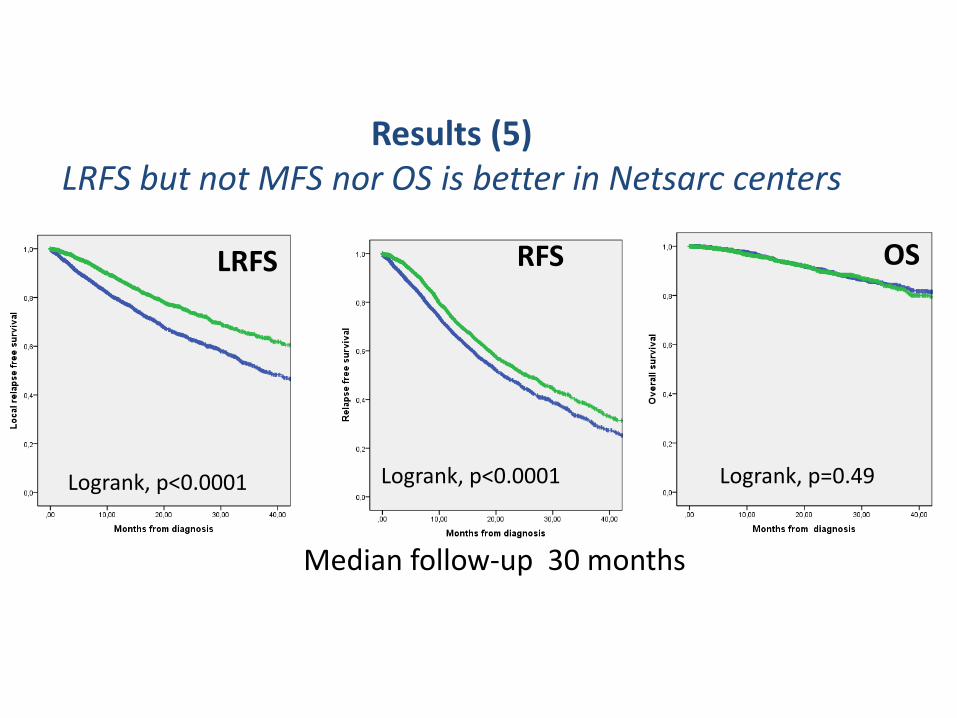
Median follow-up 30 months
Results (5)LRFS but not MFS nor OS is better in Netsarc centers
Logrank, p=0.43
LRFS
Logrank, p<0.0001
OSRFS OS
Logrank, p<0.0001 Logrank, p=0.49
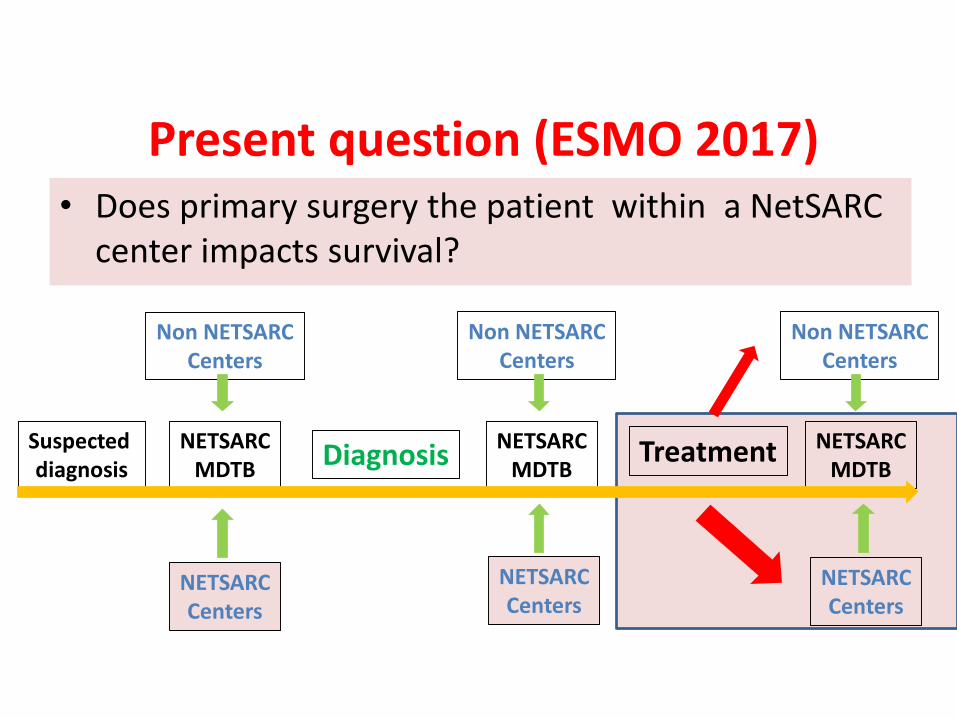
Present question (ESMO 2017)• Does primary surgery the patient within a NetSARC
center impacts survival?
Suspecteddiagnosis
DiagnosisNETSARC
MDTBNETSARC
MDTBNETSARC
MDTBTreatment
NETSARCCenters
NETSARCCenters
NETSARCCenters
Non NETSARCCenters
Non NETSARCCenters
Non NETSARCCenters
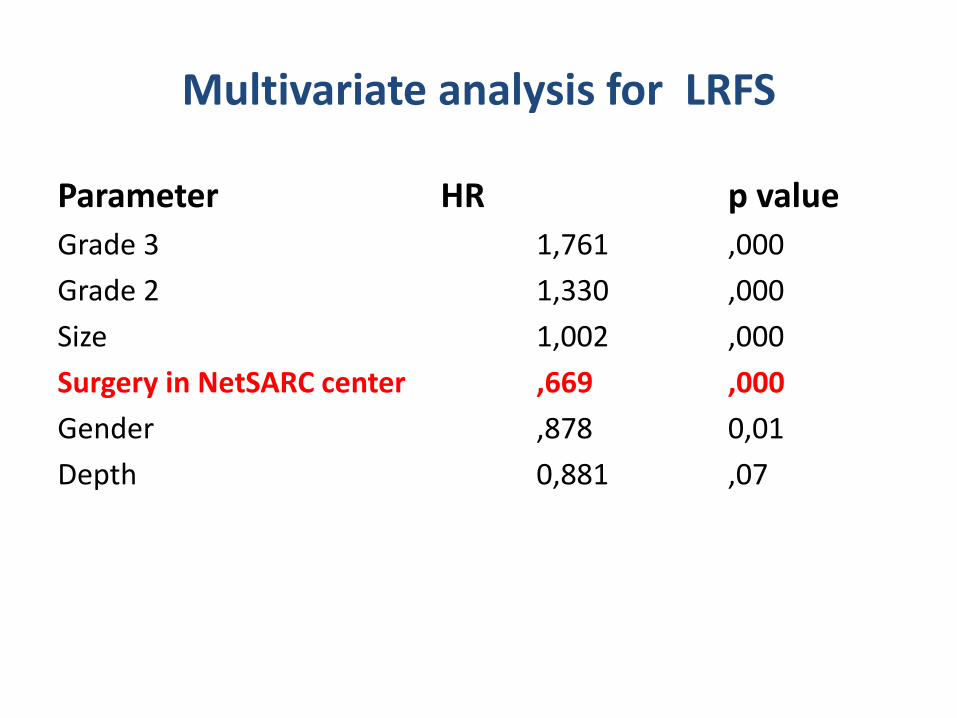
Multivariate analysis for LRFS
Parameter HR p value
Grade 3 1,761 ,000
Grade 2 1,330 ,000
Size 1,002 ,000
Surgery in NetSARC center ,669 ,000
Gender ,878 0,01
Depth 0,881 ,07
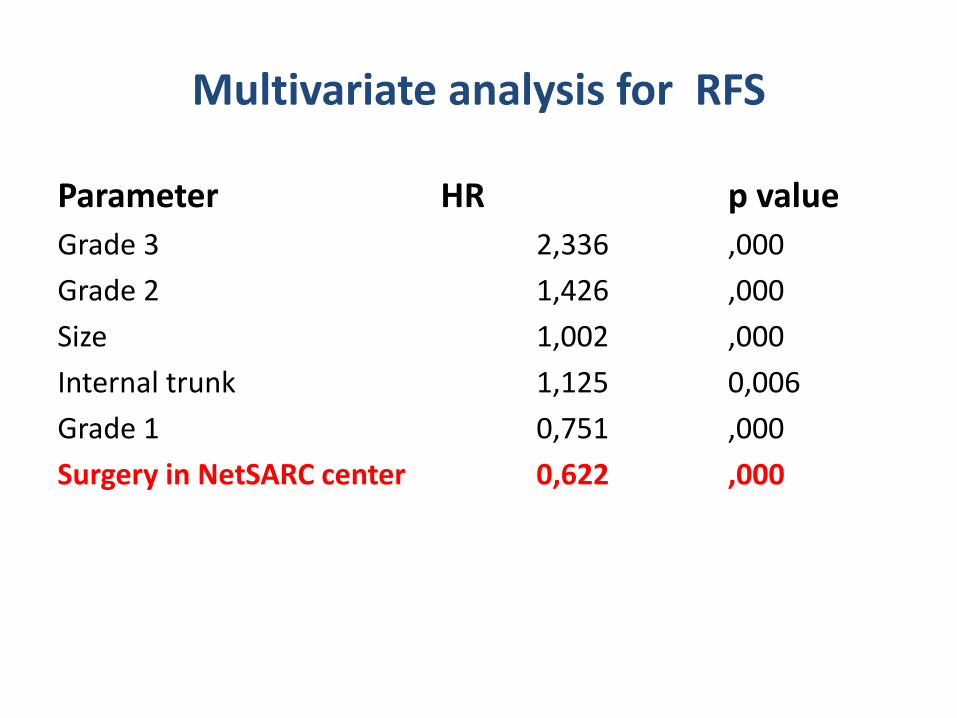
Multivariate analysis for RFS
Parameter HR p value
Grade 3 2,336 ,000
Grade 2 1,426 ,000
Size 1,002 ,000
Internal trunk 1,125 0,006
Grade 1 0,751 ,000
Surgery in NetSARC center 0,622 ,000
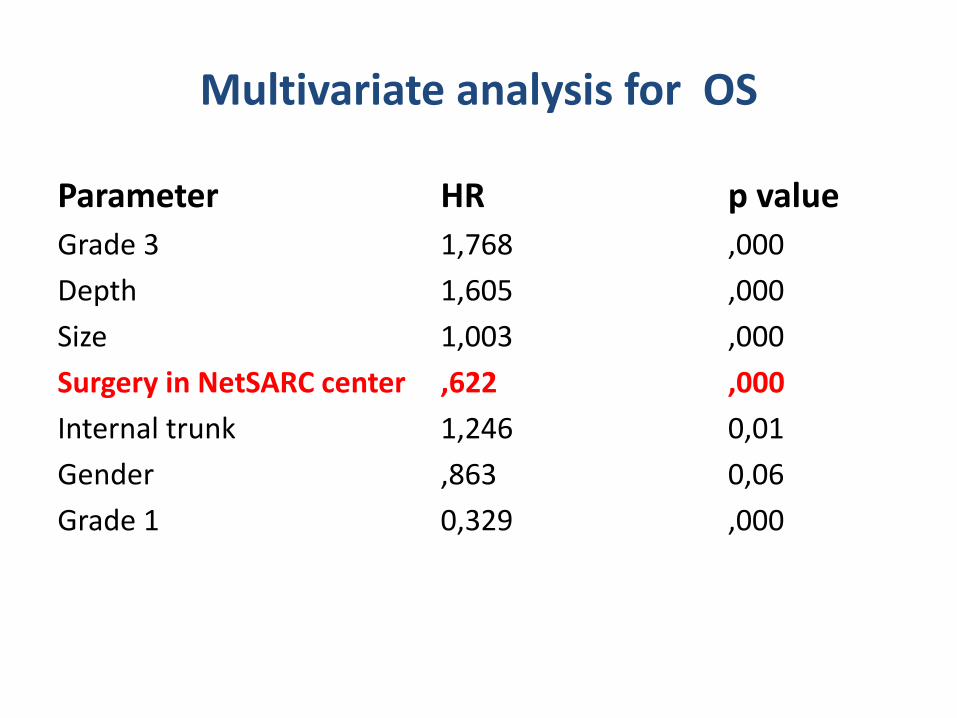
Multivariate analysis for OS
Parameter HR p value
Grade 3 1,768 ,000
Depth 1,605 ,000
Size 1,003 ,000
Surgery in NetSARC center ,622 ,000
Internal trunk 1,246 0,01
Gender ,863 0,06
Grade 1 0,329 ,000
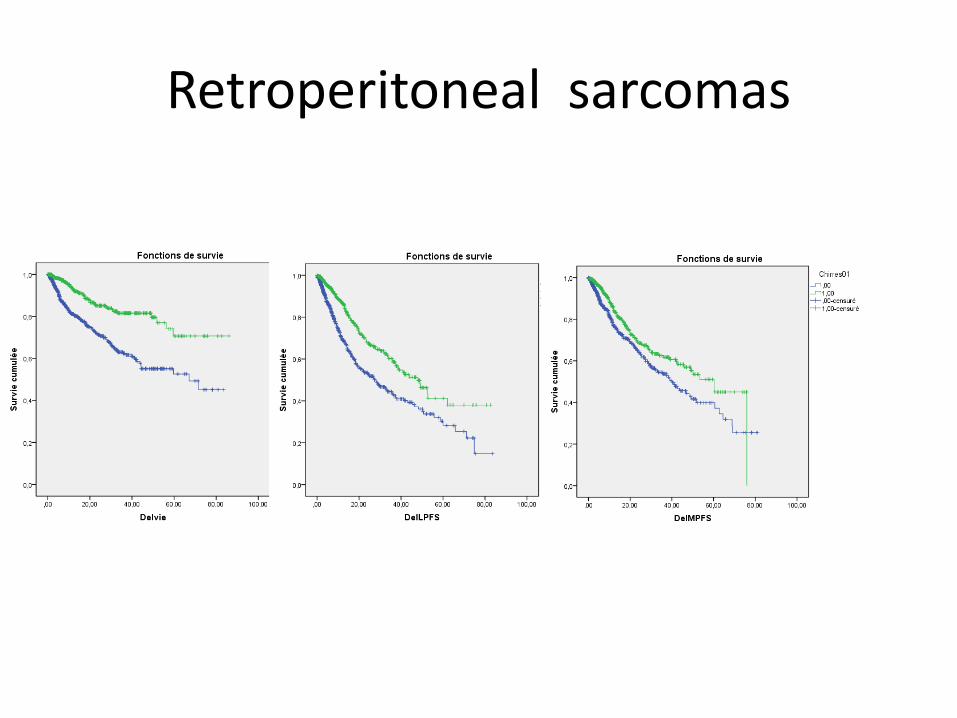
Retroperitoneal sarcomas
Traitements ciblés, traitements systemiques
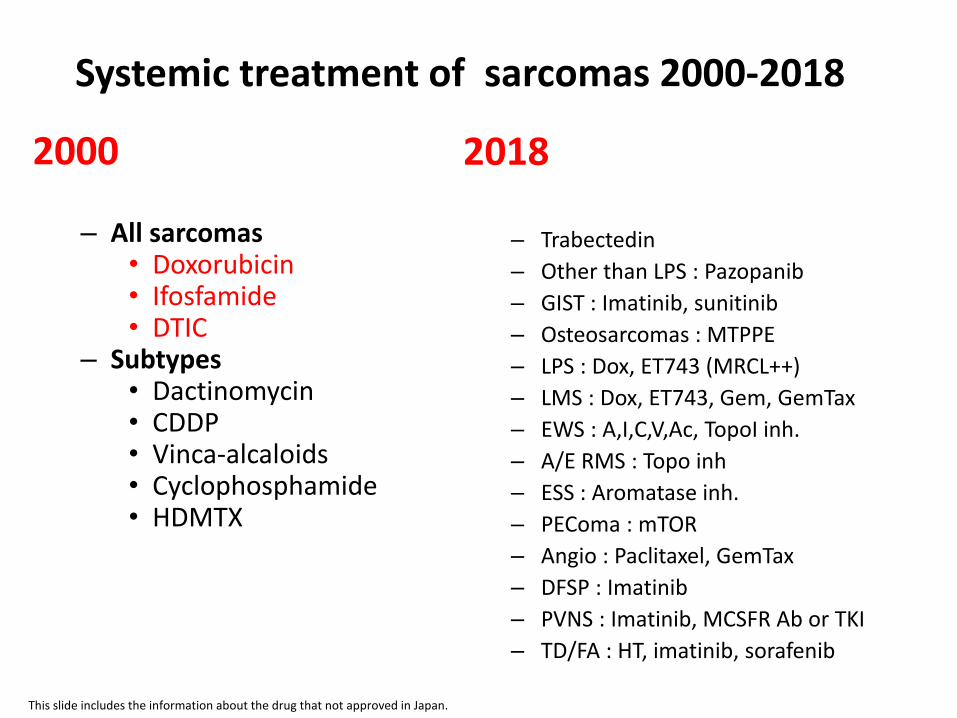
Systemic treatment of sarcomas 2000-2018
2000
– All sarcomas• Doxorubicin• Ifosfamide• DTIC
– Subtypes• Dactinomycin• CDDP• Vinca-alcaloids• Cyclophosphamide• HDMTX
2018
– Trabectedin
– Other than LPS : Pazopanib
– GIST : Imatinib, sunitinib
– Osteosarcomas : MTPPE
– LPS : Dox, ET743 (MRCL++)
– LMS : Dox, ET743, Gem, GemTax
– EWS : A,I,C,V,Ac, TopoI inh.
– A/E RMS : Topo inh
– ESS : Aromatase inh.
– PEComa : mTOR
– Angio : Paclitaxel, GemTax
– DFSP : Imatinib
– PVNS : Imatinib, MCSFR Ab or TKI
– TD/FA : HT, imatinib, sorafenib
This slide includes the information about the drug that not approved in Japan.
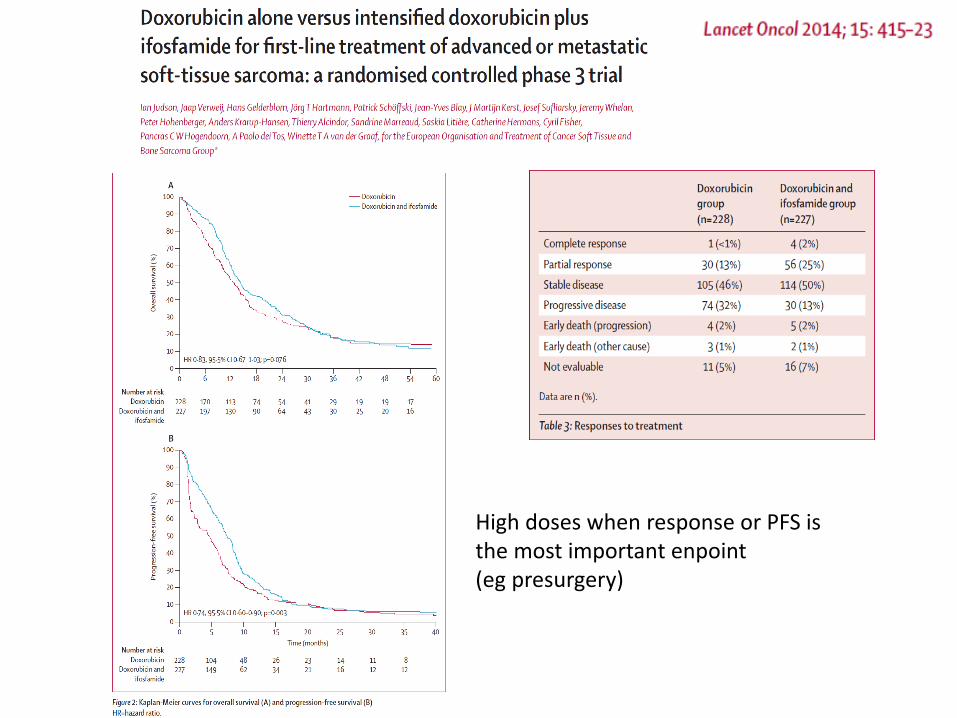
High doses when response or PFS is the most important enpoint (eg presurgery)
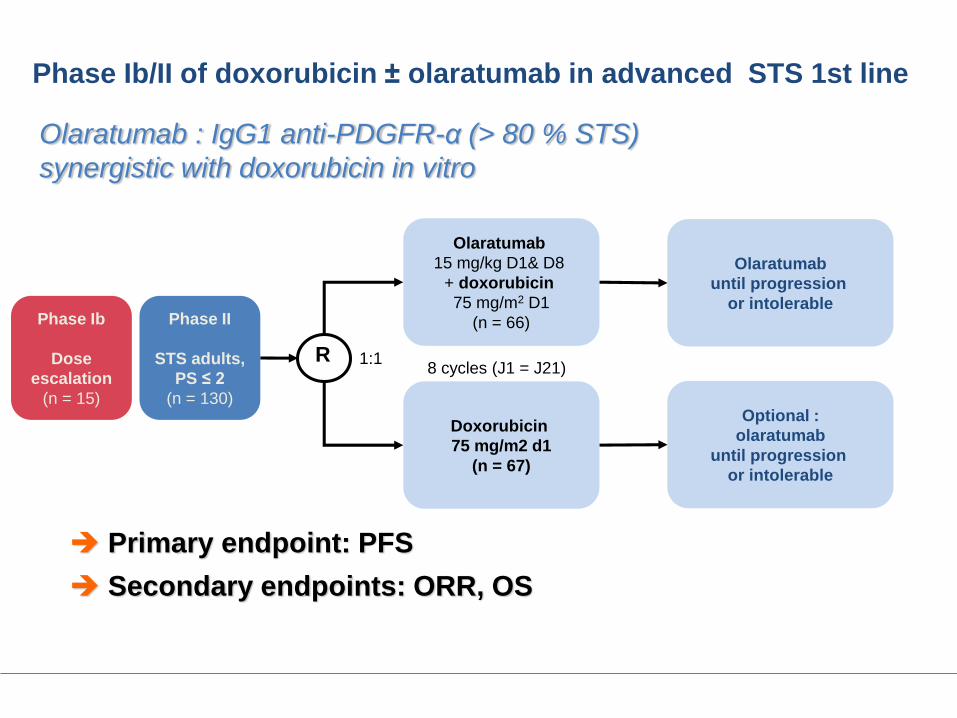
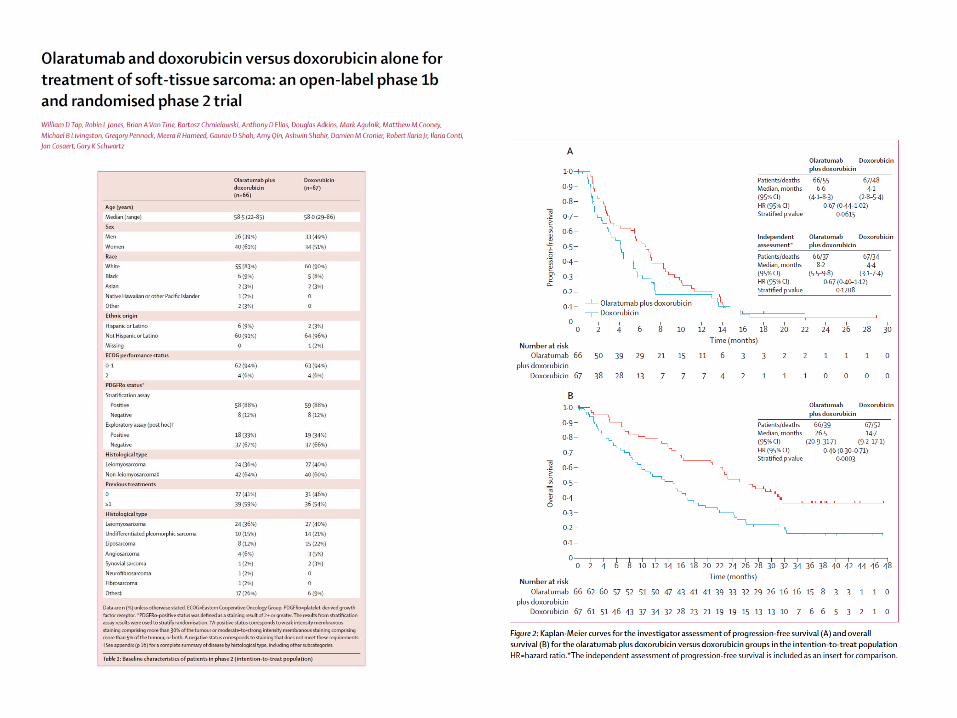
Phase Ib/II of doxorubicin ± olaratumab in advanced STS 1st line
Primary endpoint: PFS
Secondary endpoints: ORR, OS
Olaratumab : IgG1 anti-PDGFR-α (> 80 % STS)
synergistic with doxorubicin in vitro
Phase II
STS adults,
PS ≤ 2
(n = 130)
Doxorubicin
75 mg/m2 d1
(n = 67)
Optional :
olaratumab
until progression
or intolerable
Olaratumab
until progression
or intolerable
1:1
Olaratumab
15 mg/kg D1& D8
+ doxorubicin
75 mg/m2 D1
(n = 66)
R8 cycles (J1 = J21)
Phase Ib
Dose
escalation
(n = 15)
After failure of anthracyclins
Ifosfamide
Trabectedine
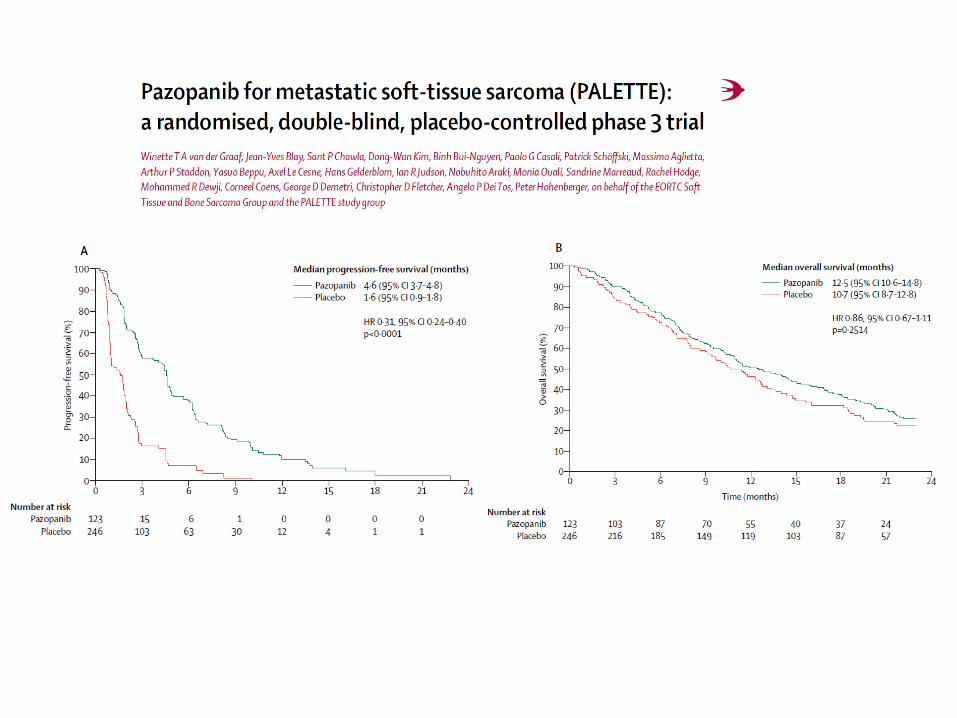
Pazopanib
Eribuline
Gemcitabine and Docetaxel
Dacarbazine and Gem
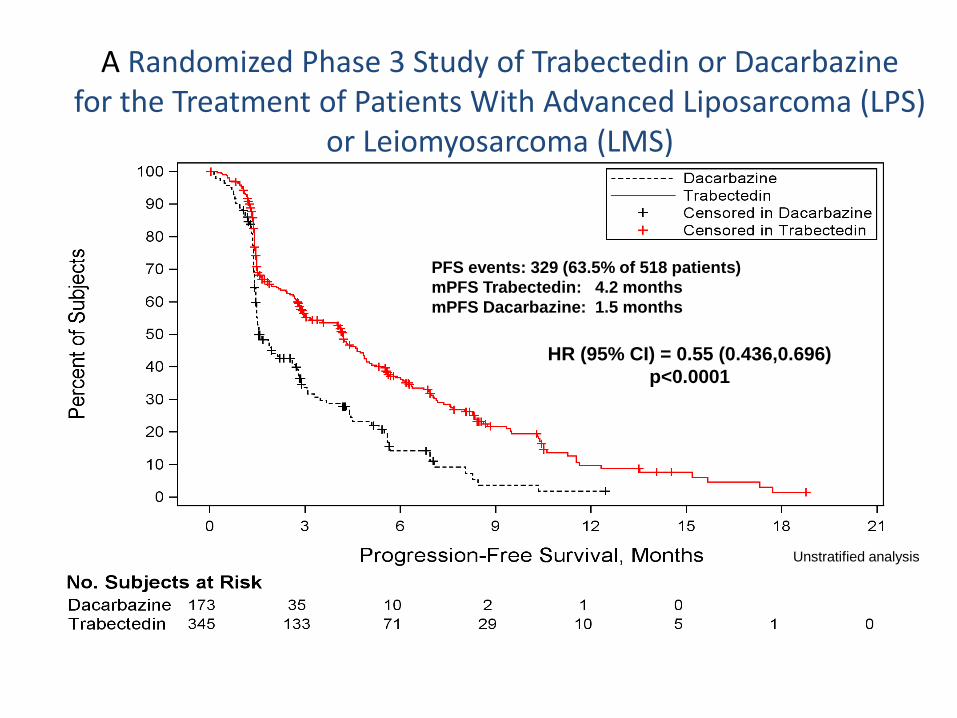
HR (95% CI) = 0.55 (0.436,0.696)
p<0.0001
PFS events: 329 (63.5% of 518 patients)
mPFS Trabectedin: 4.2 months
mPFS Dacarbazine: 1.5 months
Unstratified analysis
A Randomized Phase 3 Study of Trabectedin or Dacarbazine for the Treatment of Patients With Advanced Liposarcoma (LPS)
or Leiomyosarcoma (LMS)
CI, confidence interval
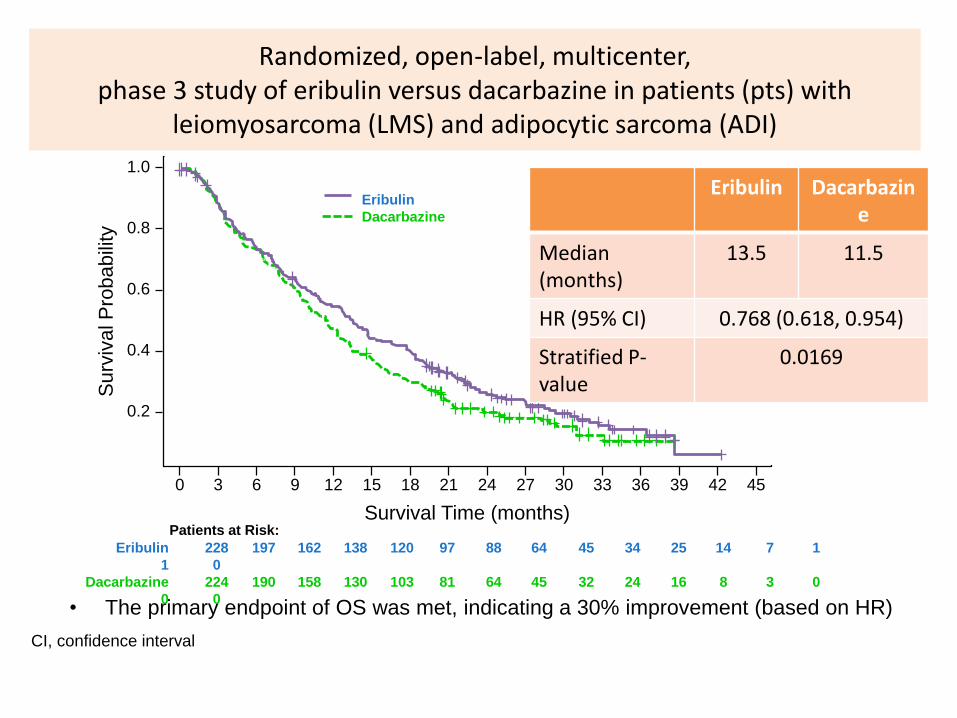
• The primary endpoint of OS was met, indicating a 30% improvement (based on HR)
Eribulin 228 197 162 138 120 97 88 64 45 34 25 14 7 1
1 0
Dacarbazine 224 190 158 130 103 81 64 45 32 24 16 8 3 0
0 0
Patients at Risk:
1.0
0.8
0.6
0.4
0.2
Surv
ival P
robabili
ty
0 3 6 9 12 15 21 24 27 30 33 36 39 42 4518
Survival Time (months)
Eribulin
Dacarbazine
Eribulin Dacarbazine
Median(months)
13.5 11.5
HR (95% CI) 0.768 (0.618, 0.954)
Stratified P-value
0.0169
Randomized, open-label, multicenter, phase 3 study of eribulin versus dacarbazine in patients (pts) with
leiomyosarcoma (LMS) and adipocytic sarcoma (ADI)
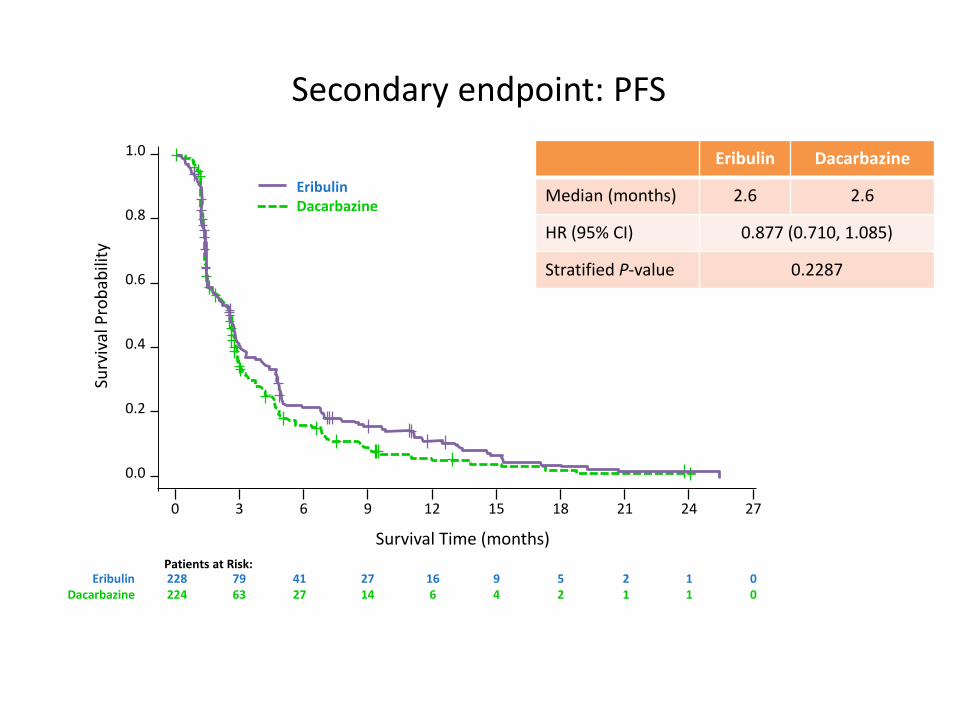
Secondary endpoint: PFS
Eribulin 228 79 41 27 16 9 5 2 1 0Dacarbazine 224 63 27 14 6 4 2 1 1 0
Patients at Risk:
1.0
0.8
0.6
0.4
0.2
Surv
ival
Pro
bab
ility
0 3 6 9 12 15 21 24 2718
Survival Time (months)
EribulinDacarbazine
0.0
Eribulin Dacarbazine
Median (months) 2.6 2.6
HR (95% CI) 0.877 (0.710, 1.085)
Stratified P-value 0.2287
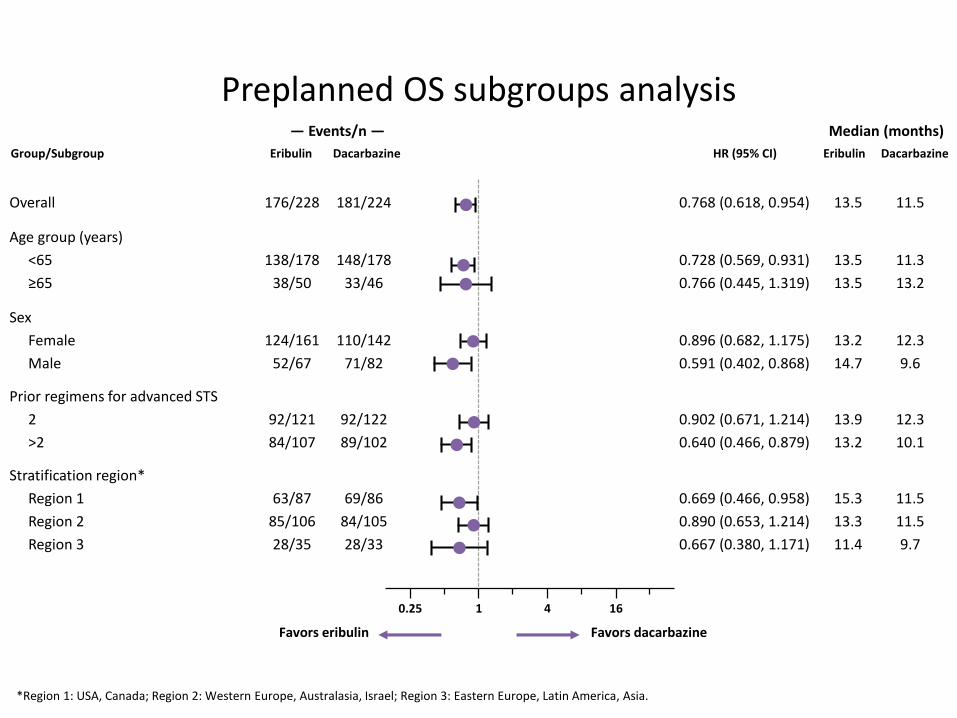
Preplanned OS subgroups analysis
*Region 1: USA, Canada; Region 2: Western Europe, Australasia, Israel; Region 3: Eastern Europe, Latin America, Asia.
Overall 176/228 181/224 0.768 (0.618, 0.954) 13.5 11.5
Age group (years)
<65
≥65
138/178
38/50
148/178
33/46
0.728 (0.569, 0.931)
0.766 (0.445, 1.319)
13.5
13.5
11.3
13.2
Sex
Female
Male
124/161
52/67
110/142
71/82
0.896 (0.682, 1.175)
0.591 (0.402, 0.868)
13.2
14.7
12.3
9.6
Prior regimens for advanced STS
2
>2
92/121
84/107
92/122
89/102
0.902 (0.671, 1.214)
0.640 (0.466, 0.879)
13.9
13.2
12.3
10.1
Stratification region*
Region 1
Region 2
Region 3
63/87
85/106
28/35
69/86
84/105
28/33
0.669 (0.466, 0.958)
0.890 (0.653, 1.214)
0.667 (0.380, 1.171)
15.3
13.3
11.4
11.5
11.5
9.7
Group/Subgroup Eribulin Dacarbazine
— Events/n —
Eribulin Dacarbazine
Median (months)
HR (95% CI)
0.25 1 4 16
Favors eribulin Favors dacarbazine
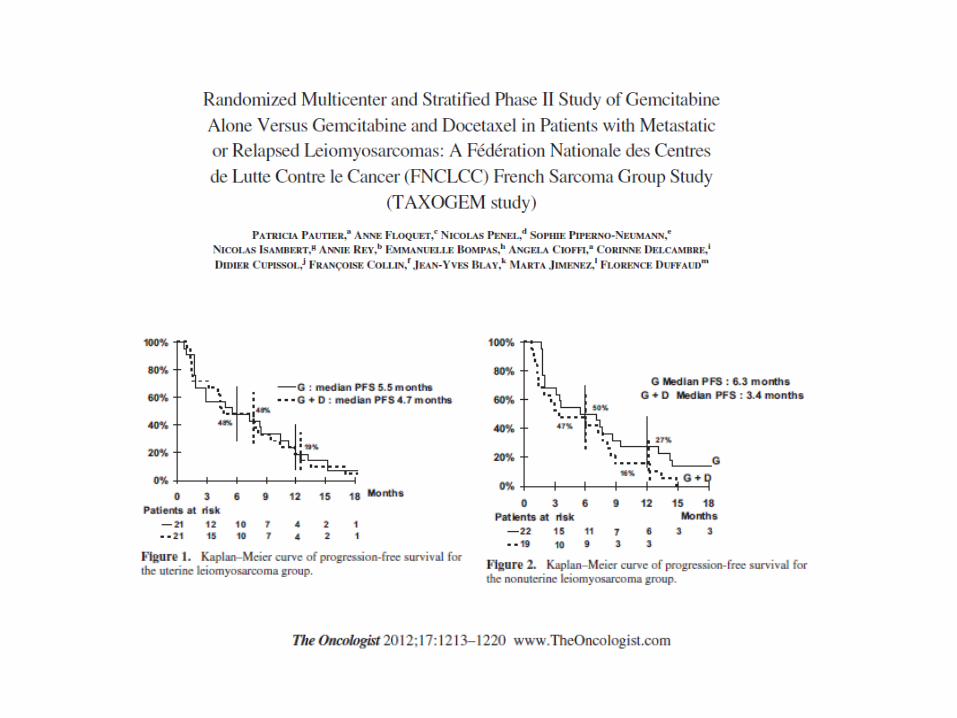
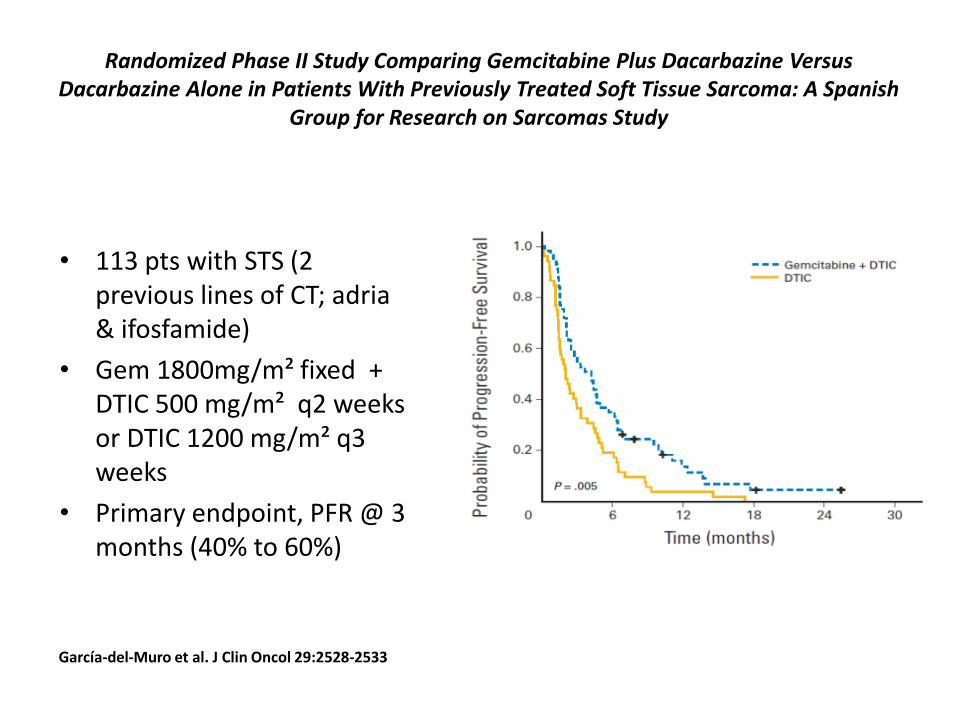
Randomized Phase II Study Comparing Gemcitabine Plus Dacarbazine Versus Dacarbazine Alone in Patients With Previously Treated Soft Tissue Sarcoma: A Spanish
Group for Research on Sarcomas Study
• 113 pts with STS (2 previous lines of CT; adria & ifosfamide)
• Gem 1800mg/m² fixed + DTIC 500 mg/m² q2 weeks or DTIC 1200 mg/m² q3 weeks
• Primary endpoint, PFR @ 3 months (40% to 60%)
García-del-Muro et al. J Clin Oncol 29:2528-2533
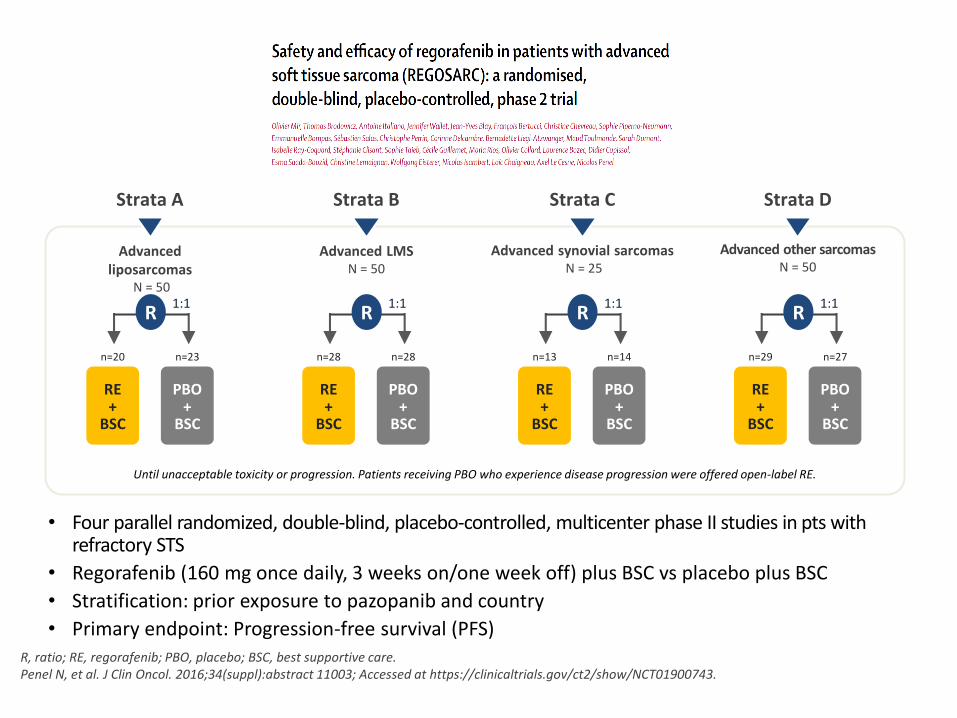
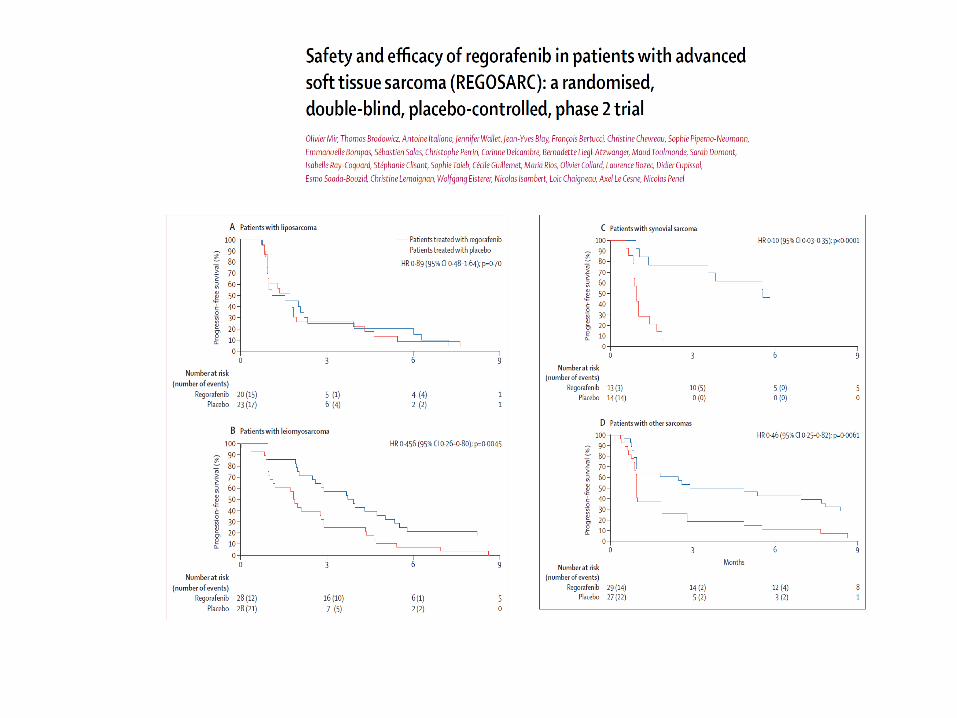
• Four parallel randomized, double-blind, placebo-controlled, multicenter phase II studies in pts with refractory STS
• Regorafenib (160 mg once daily, 3 weeks on/one week off) plus BSC vs placebo plus BSC
• Stratification: prior exposure to pazopanib and country
• Primary endpoint: Progression-free survival (PFS)
Advanced liposarcomas
N = 50
Advanced other sarcomasN = 50
Advanced synovial sarcomasN = 25
Advanced LMSN = 50
Until unacceptable toxicity or progression. Patients receiving PBO who experience disease progression were offered open-label RE.
R, ratio; RE, regorafenib; PBO, placebo; BSC, best supportive care.Penel N, et al. J Clin Oncol. 2016;34(suppl):abstract 11003; Accessed at https://clinicaltrials.gov/ct2/show/NCT01900743.
Strata A Strata B Strata C Strata D
RE+
BSC
PBO+
BSC
1:1
n=23n=20
R
RE+
BSC
PBO+
BSC
1:1
n=28n=28
R
RE+
BSC
PBO+
BSC
1:1
n=14n=13
R
RE+
BSC
PBO+
BSC
1:1
n=27n=29
R
Activity of cediranib in alveolar soft part sarcoma (ASPS)confirmed by CASPS (cediranib in ASPS), an international,randomised phase II trial
Ian Judson, James Morden, Michael Leahy, Vivek Bhadri, Quentin Campbell-Hewson, Ricardo Cubedo, Adam Dangoor, Ivo Hennig, Warren Joubert, Sarah Kernaghan, Antonio López Pousa, Beatrice Seddon, Claire Snowdon, Martin Tattersall, Christy Toms, Javier Martinez Trufero, Judith Bliss
This presentation is the intellectual property of the author/presenter. Contact them at [email protected] for permission to reprint and/or distribute
in partnership with
C2130/A12118
American Society of Clinical Oncology Annual Meeting, 2–6 June 2017
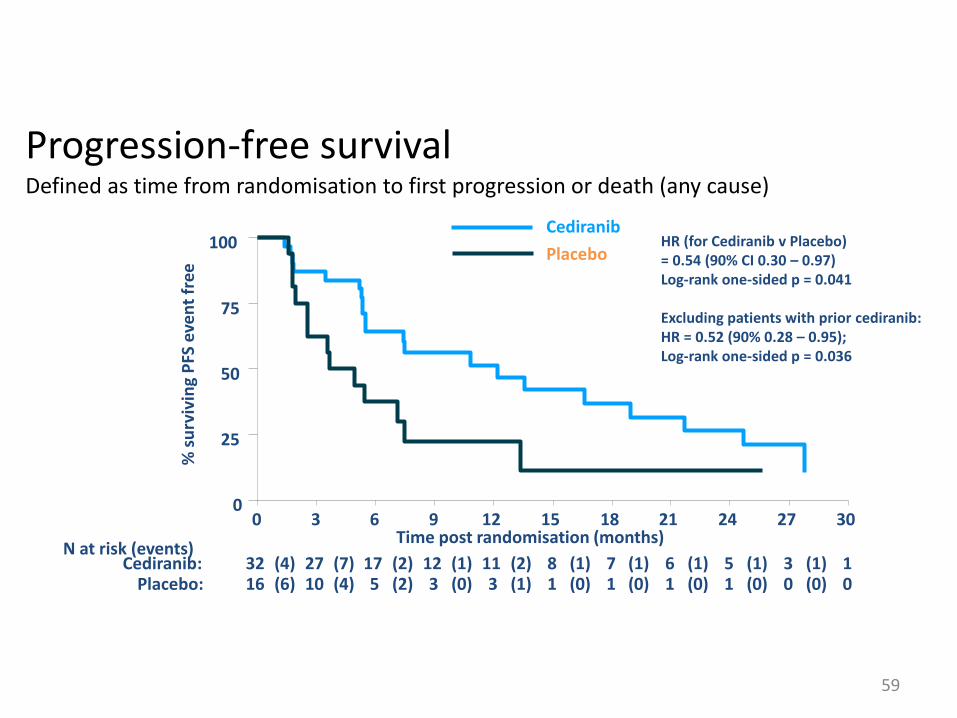
Progression-free survivalDefined as time from randomisation to first progression or death (any cause)
59
HR (for Cediranib v Placebo) = 0.54 (90% CI 0.30 – 0.97)Log-rank one-sided p = 0.041
Excluding patients with prior cediranib:HR = 0.52 (90% 0.28 – 0.95); Log-rank one-sided p = 0.036
0
25
50
75
100
% s
urv
ivin
g P
FS e
ven
t fr
ee
16 10(6) 5(4) 3(2) 3(0) 1(1) 1(0) 1(0) 1(0) 0(0) 0(0)Placebo: 32 27(4) 17(7) 12(2) 11(1) 8(2) 7(1) 6(1) 5(1) 3(1) 1(1)Cediranib:
N at risk (events)
0 3 6 9 12 15 18 21 24 27 30Time post randomisation (months)
Cediranib
Placebo
Besancon 18 1 18
GIST
Sarcomas and
aggressive connective
tissue tumors
Kinase
mutations
G5
Ntl
Group
Translocations
DFSP
SyS
Ewing
Mutations
APC/bCat
Desmoids
WD/DDLPSAmplification
12q13-15
MDM2/CDK4
MPNST
PEComas
TSG loss
NF1, TSC1/2
Complex genomics
LMS, UPS
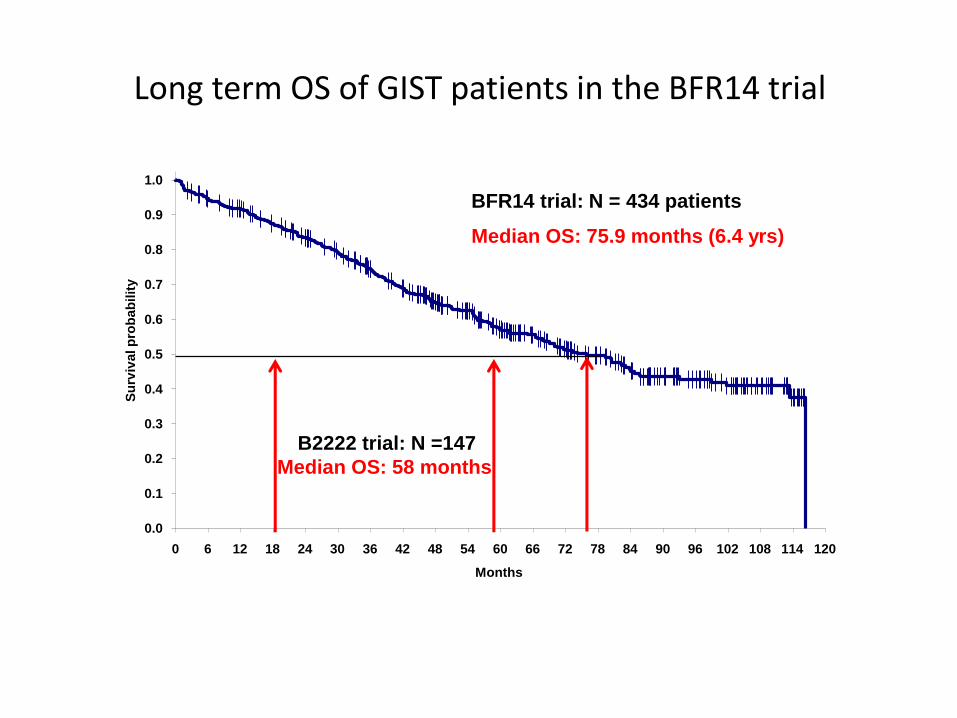
0.0
0.1
0.2
0.3
0.4
0.5
0.6
0.7
0.8
0.9
1.0
0 6 12 18 24 30 36 42 48 54 60 66 72 78 84 90 96 102 108 114 120
Months
Su
rviv
al p
rob
ab
ilit
y
BFR14 trial: N = 434 patients
Median OS: 75.9 months (6.4 yrs)
B2222 trial: N =147
Median OS: 58 months
Perol M et al., J Clin Oncol., 2012; 30: 2516-24; Blanke CD et al., J Clin Oncol., 2008; 26:620-25.
Long term OS of GIST patients in the BFR14 trial
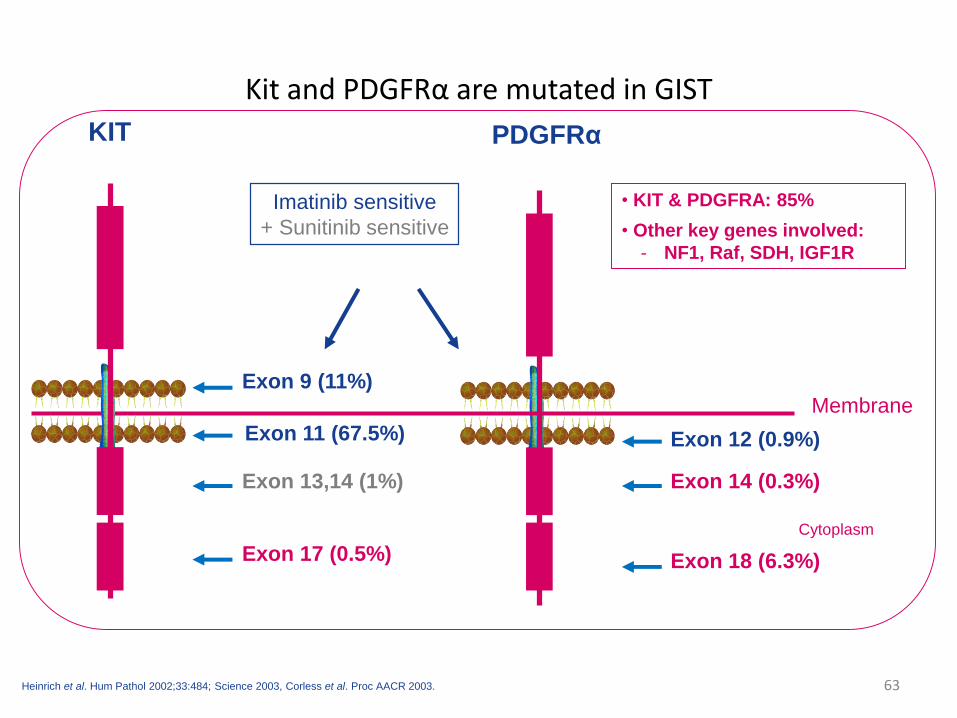
Kit and PDGFRα are mutated in GIST
63Heinrich et al. Hum Pathol 2002;33:484; Science 2003, Corless et al. Proc AACR 2003.
Membrane
Cytoplasm
Exon 11 (67.5%)
Exon 9 (11%)
Exon 13,14 (1%)
Exon 17 (0.5%)
Exon 12 (0.9%)
Exon 18 (6.3%)
KIT PDGFRα
• KIT & PDGFRA: 85%
• Other key genes involved:
- NF1, Raf, SDH, IGF1R
Exon 14 (0.3%)
Imatinib sensitive
+ Sunitinib sensitive
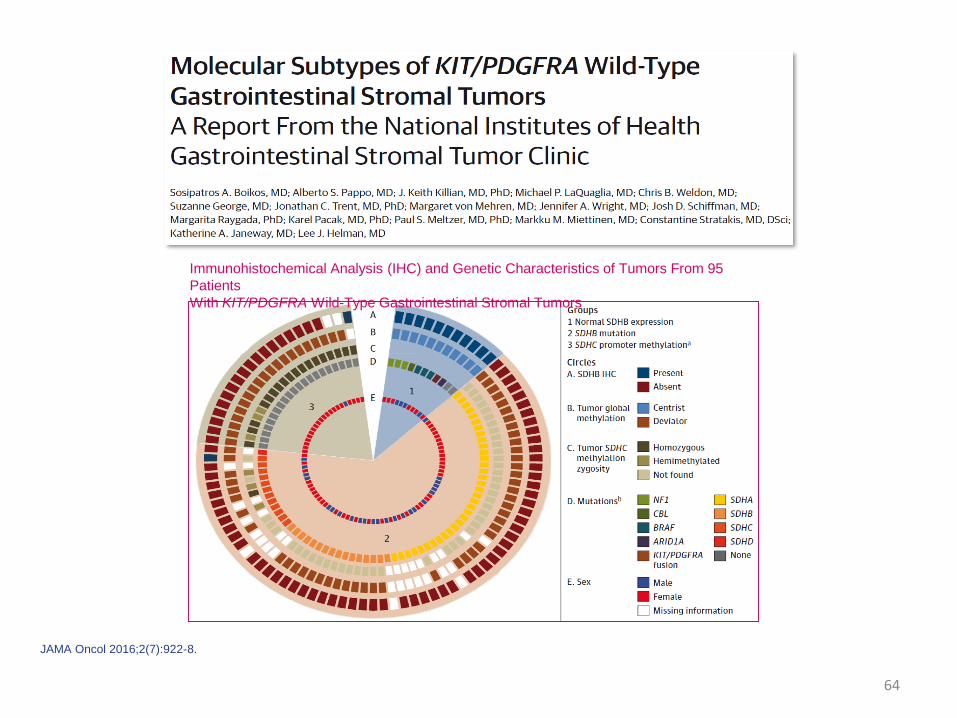
JAMA Oncol 2016;2(7):922-8.
64
Immunohistochemical Analysis (IHC) and Genetic Characteristics of Tumors From 95
Patients
With KIT/PDGFRA Wild-Type Gastrointestinal Stromal Tumors
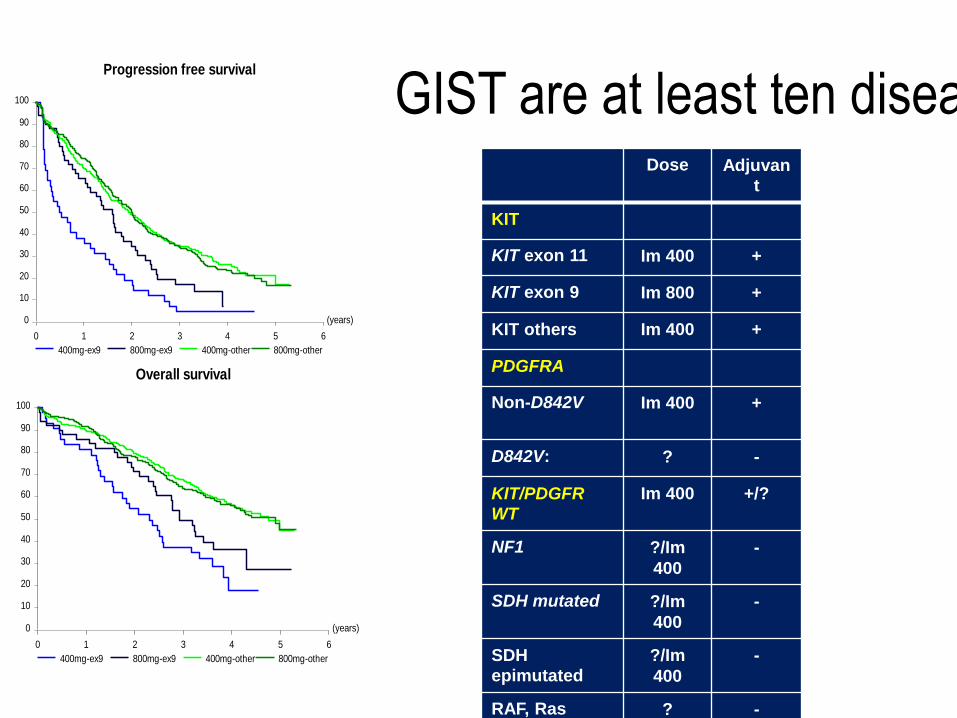
GIST are at least ten diseasesDose Adjuvan
t
KIT
KIT exon 11 Im 400 +
KIT exon 9 Im 800 +
KIT others Im 400 +
PDGFRA
Non-D842V Im 400 +
D842V: ? -
KIT/PDGFR
WT
Im 400 +/?
NF1 ?/Im
400
-
SDH mutated ?/Im
400
-
SDH
epimutated
?/Im
400
-
RAF, Ras ? -
(years)
0 1 2 3 4 5 6
0
10
20
30
40
50
60
70
80
90
100
400mg-ex9 800mg-ex9 400mg-other 800mg-other
Progression free survival
(years)
0 1 2 3 4 5 6
0
10
20
30
40
50
60
70
80
90
100
400mg-ex9 800mg-ex9 400mg-other 800mg-other
Overall survival
BFR14 trial
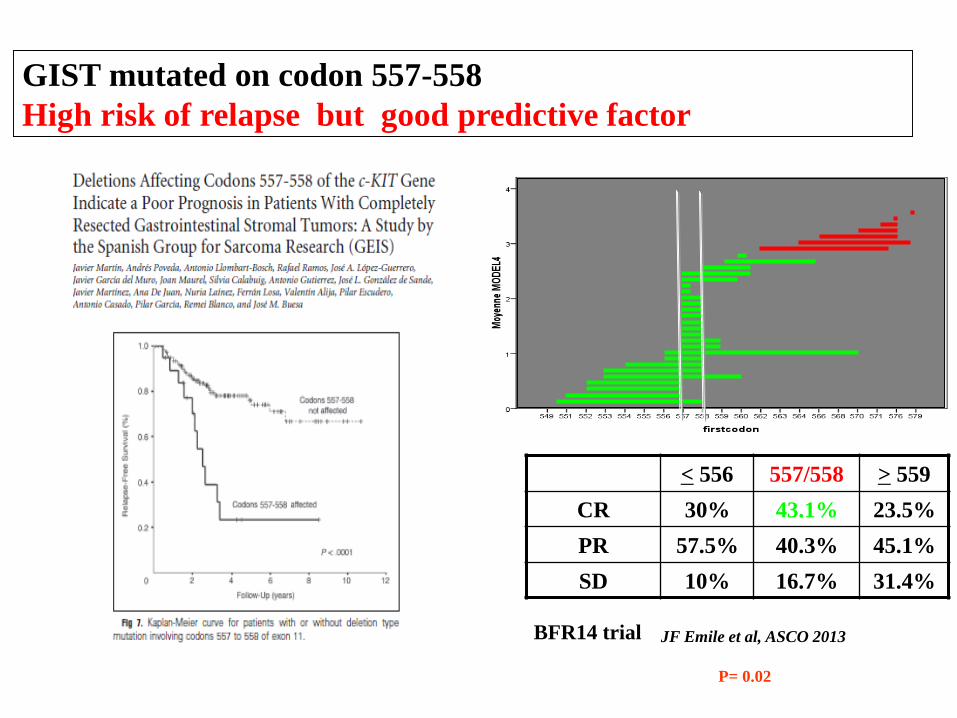
GIST mutated on codon 557-558
High risk of relapse but good predictive factor
< 556 557/558 > 559
CR 30% 43.1% 23.5%
PR 57.5% 40.3% 45.1%
SD 10% 16.7% 31.4%
JF Emile et al, ASCO 2013
P= 0.02
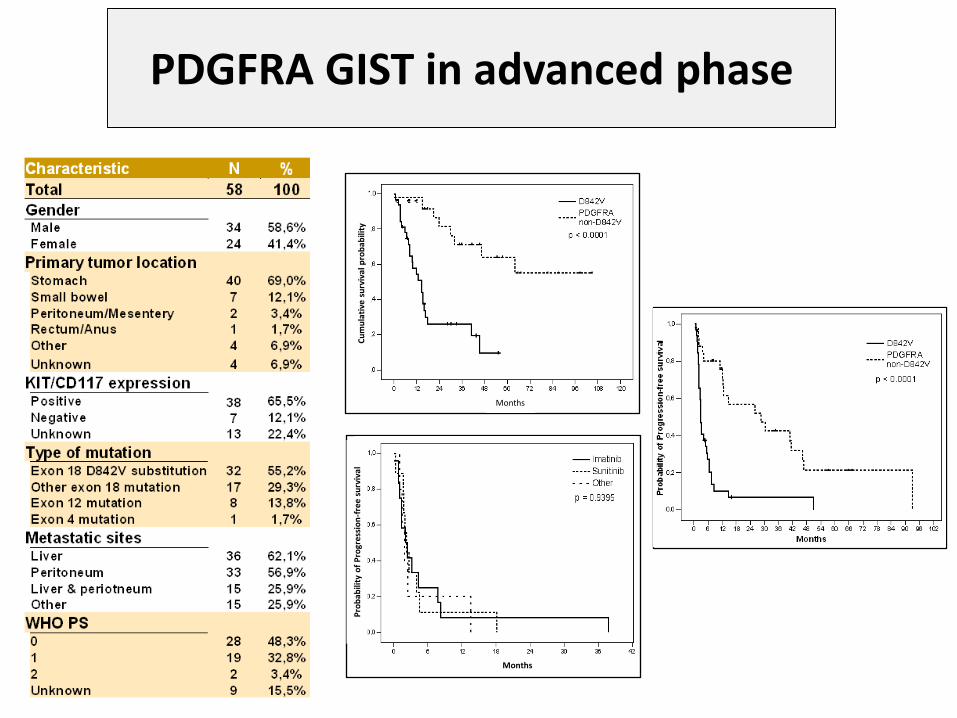
PDGFRA GIST in advanced phase
Months
Cu
mu
lati
ve s
urv
ival
pro
bab
ility
Months
Pro
bab
ility
of
Pro
gres
sio
n-f
ree
surv
ival
Cassier et al. Clin Cancer Res. 2012; 18: 4458-64.
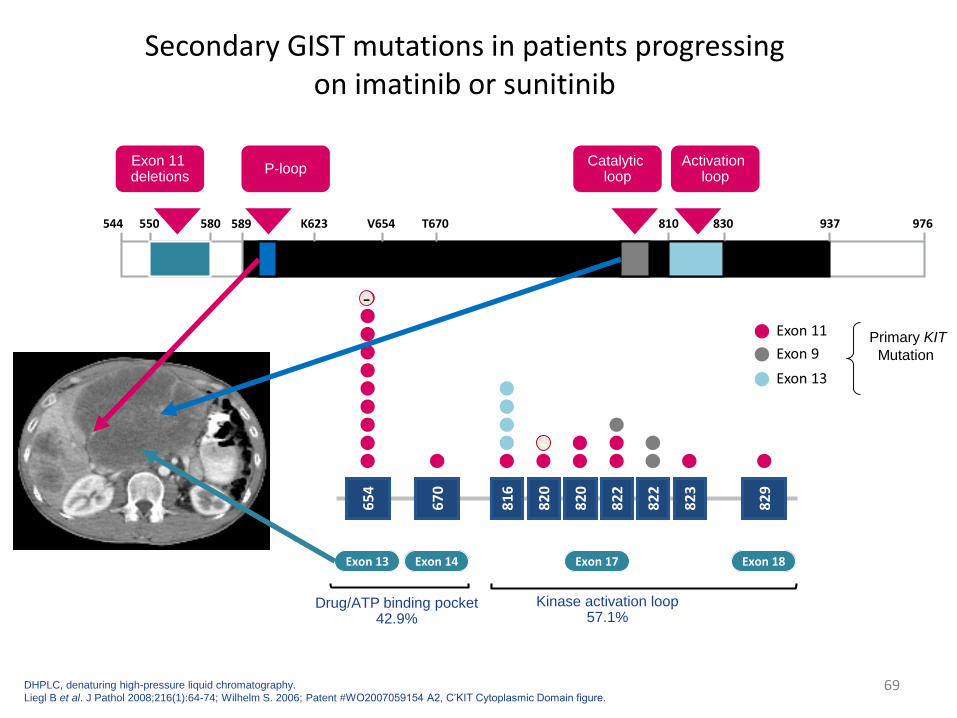
Secondary GIST mutations in patients progressingon imatinib or sunitinib
69
65
4
67
0
82
9
82
3
82
2
82
2
82
0
82
0
81
6
V T AD YNNDD
Exon 13 Exon 14 Exon 17 Exon 18
A I PH DKYYG
Drug/ATP binding pocket 42.9%
Kinase activation loop 57.1%
-
-Exon 11
Exon 9
Exon 13
544 550 580 589 976937
KIT Kinase Domain
V654 T670K623 810 830
Exon 11 deletions
P-loopActivation
loopCatalytic
loop
DHPLC, denaturing high-pressure liquid chromatography.
Liegl B et al. J Pathol 2008;216(1):64-74; Wilhelm S. 2006; Patent #WO2007059154 A2, C’KIT Cytoplasmic Domain figure.
Primary KIT
Mutation
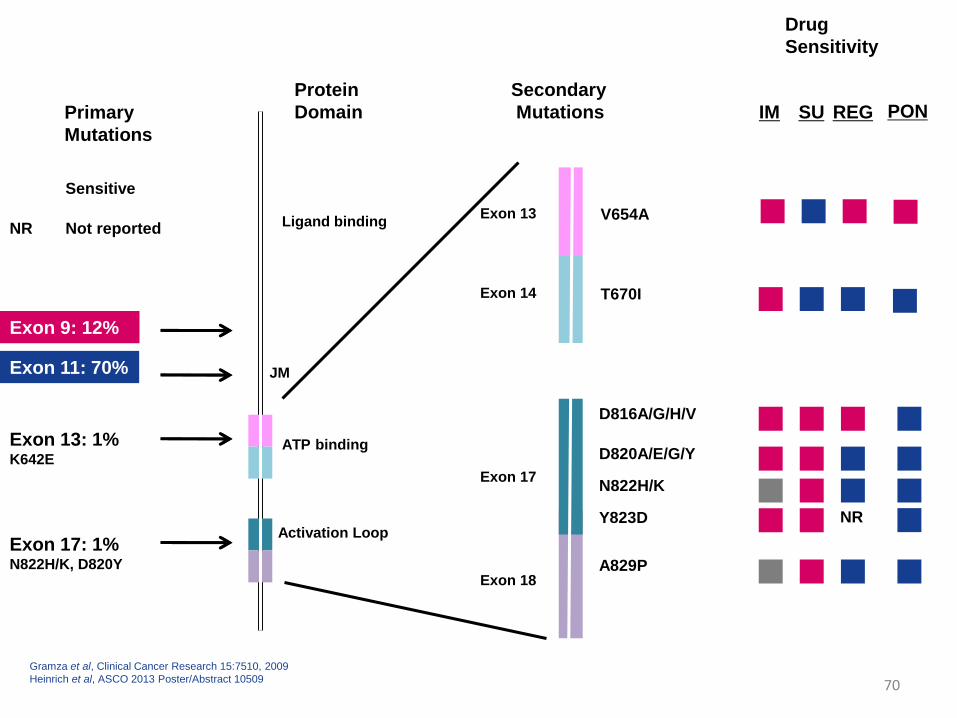
70
Primary
Mutations
Exon 13: 1%K642E
Exon 9: 12%
Exon 11: 70%
Exon 17: 1%N822H/K, D820Y
Protein
Domain
Ligand binding
JM
ATP binding
Activation Loop
Exon 13 V654A
T670I
D816A/G/H/V
D820A/E/G/Y
N822H/K
Y823D
IM SU
A829P
Secondary
Mutations
Drug
Sensitivity
Exon 14
Exon 17
Exon 18
Sensitive
REG
NR
NR Not reported
Gramza et al, Clinical Cancer Research 15:7510, 2009
Heinrich et al, ASCO 2013 Poster/Abstract 10509
PON
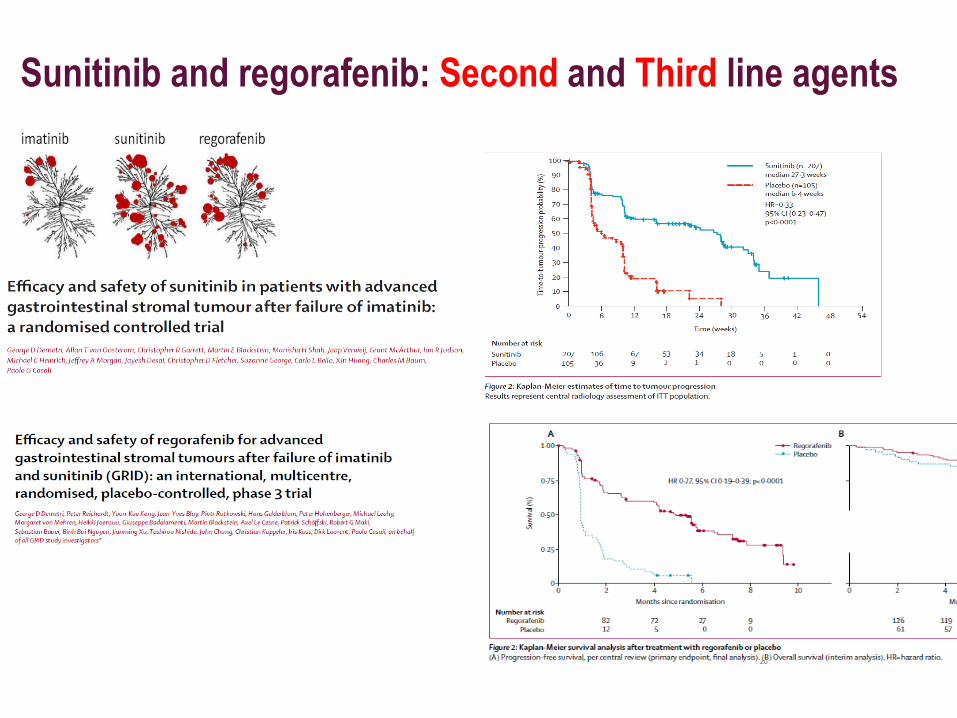
Sunitinib and regorafenib: Second and Third line agents
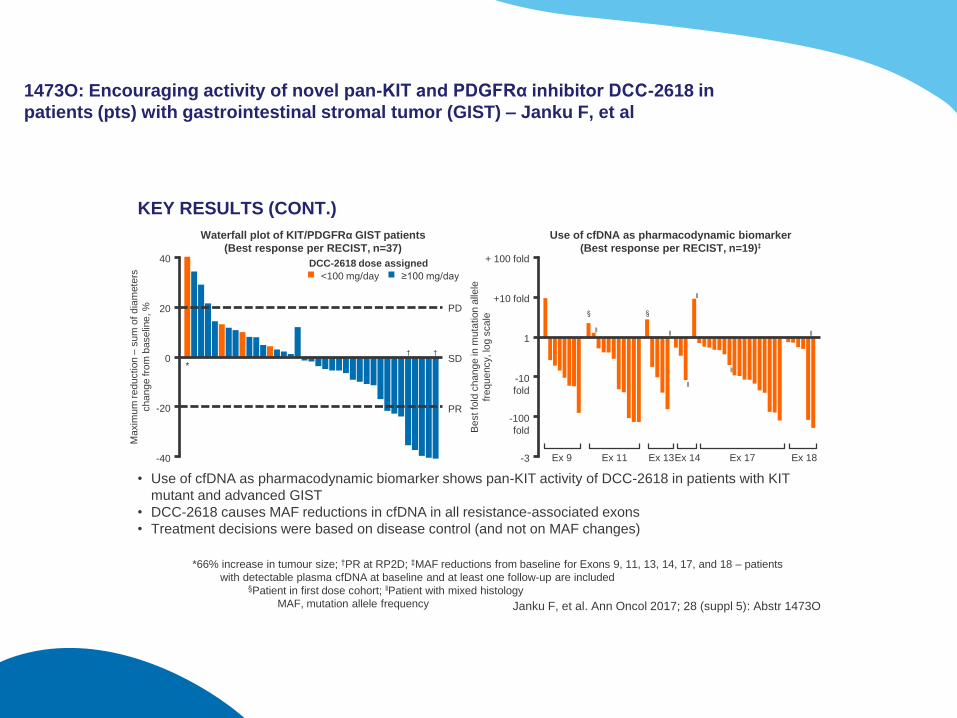
1473O: Encouraging activity of novel pan-KIT and PDGFRα inhibitor DCC-2618 in
patients (pts) with gastrointestinal stromal tumor (GIST) – Janku F, et al
KEY RESULTS (CONT.)
*66% increase in tumour size; †PR at RP2D; ‡MAF reductions from baseline for Exons 9, 11, 13, 14, 17, and 18 – patients
with detectable plasma cfDNA at baseline and at least one follow-up are included §Patient in first dose cohort; ‖Patient with mixed histology
MAF, mutation allele frequency
• Use of cfDNA as pharmacodynamic biomarker shows pan-KIT activity of DCC-2618 in patients with KIT
mutant and advanced GIST
• DCC-2618 causes MAF reductions in cfDNA in all resistance-associated exons
• Treatment decisions were based on disease control (and not on MAF changes)
≥100 mg/day
+ 100 fold
+10 fold
1
-10
fold
-3
Be
st fo
ld c
ha
ng
e in
mu
tation a
llele
fre
qu
ency, lo
g s
ca
le
Use of cfDNA as pharmacodynamic biomarker
(Best response per RECIST, n=19)‡
-100
fold
§ §
Ex 9 Ex 11 Ex 13Ex 14 Ex 17 Ex 18
40
20
0
-20
-40
Ma
xim
um
re
du
ction
–su
m o
f d
iam
ete
rs
ch
an
ge fro
m b
ase
line
, %
PR
PD
DCC-2618 dose assigned
<100 mg/day
SD† †
*
Waterfall plot of KIT/PDGFRα GIST patients
(Best response per RECIST, n=37)
‖‖
‖
‖
‖
‖
Janku F, et al. Ann Oncol 2017; 28 (suppl 5): Abstr 1473O
Besancon 18 1 18
GIST
Sarcomas and
aggressive connective
tissue tumors
Kinase
mutations
G5
Ntl
Group
Translocations
DFSP
SyS
Ewing
Mutations
APC/bCat
Desmoids
WD/DDLPSAmplification
12q13-15
MDM2/CDK4
MPNST
PEComas
TSG loss
NF1, TSC1/2
Complex
genomics
LMS, UPS
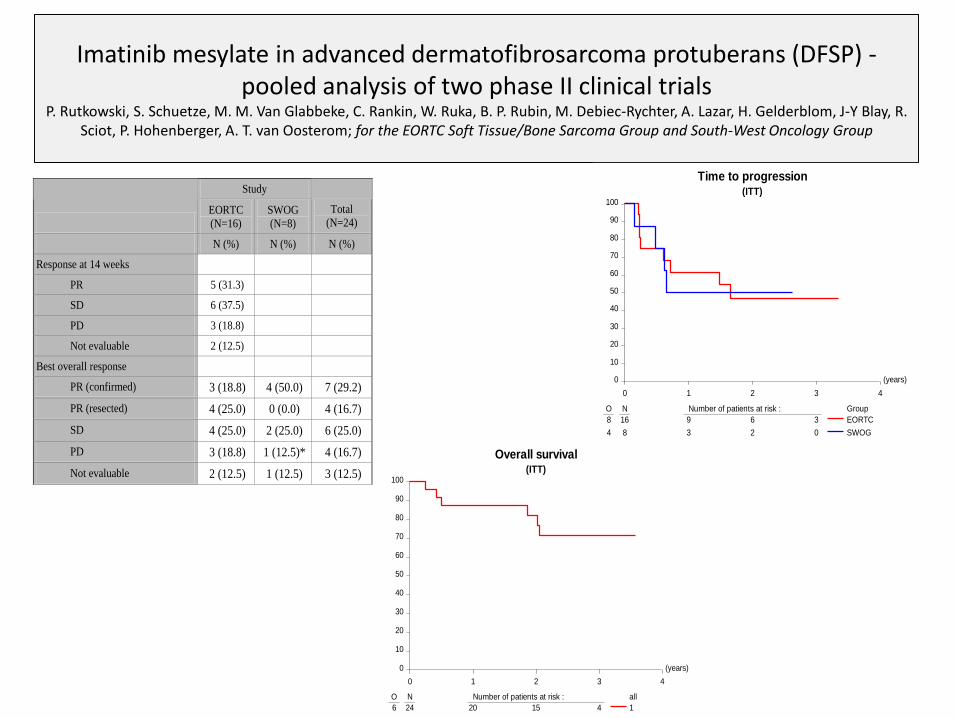
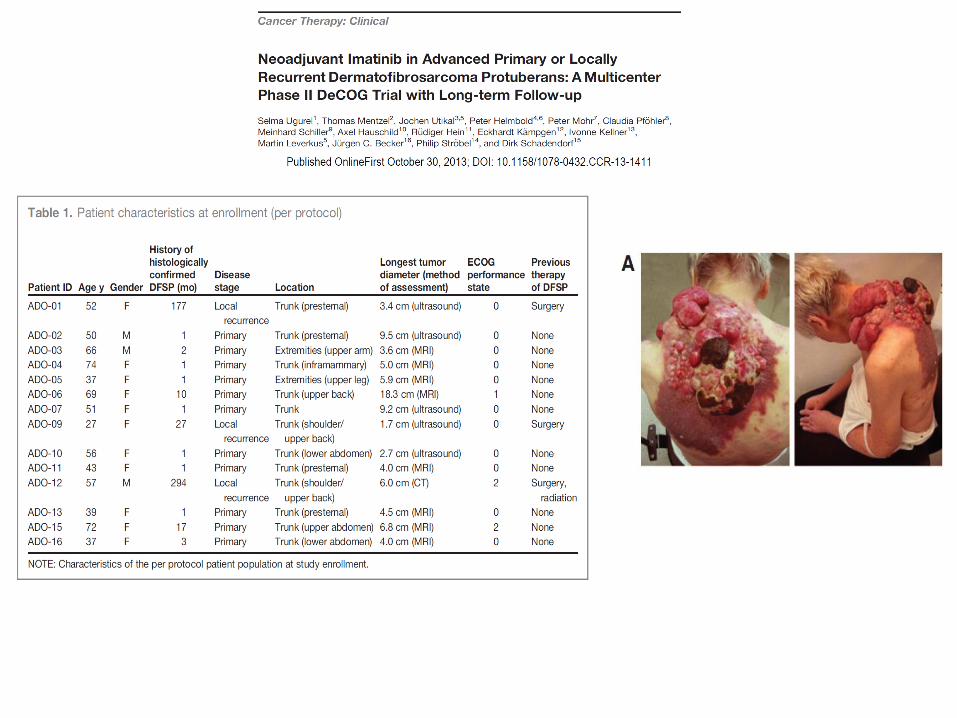
Imatinib mesylate in advanced dermatofibrosarcoma protuberans (DFSP) -pooled analysis of two phase II clinical trials
P. Rutkowski, S. Schuetze, M. M. Van Glabbeke, C. Rankin, W. Ruka, B. P. Rubin, M. Debiec-Rychter, A. Lazar, H. Gelderblom, J-Y Blay, R. Sciot, P. Hohenberger, A. T. van Oosterom; for the EORTC Soft Tissue/Bone Sarcoma Group and South-West Oncology Group
Study
EORTC
(N=16)
SWOG
(N=8)
Total
(N=24)
N (%) N (%) N (%)
Response at 14 weeks
PR 5 (31.3)
SD 6 (37.5)
PD 3 (18.8)
Not evaluable 2 (12.5)
Best overall response
PR (confirmed) 3 (18.8) 4 (50.0) 7 (29.2)
PR (resected) 4 (25.0) 0 (0.0) 4 (16.7)
SD 4 (25.0) 2 (25.0) 6 (25.0)
PD 3 (18.8) 1 (12.5)* 4 (16.7)
Not evaluable 2 (12.5) 1 (12.5) 3 (12.5)
(years)
0 1 2 3 4
0
10
20
30
40
50
60
70
80
90
100
O N Number of patients at risk : all
6 24 20 15 4 1
Overall survival(ITT)
(years)
0 1 2 3 4
0
10
20
30
40
50
60
70
80
90
100
O N Number of patients at risk : Group
8 16 9 6 3
4 8 3 2 0
EORTC
SWOG
Time to progression(ITT)
N=16, CR 7%, PR50%, SD 37%, PD 7%
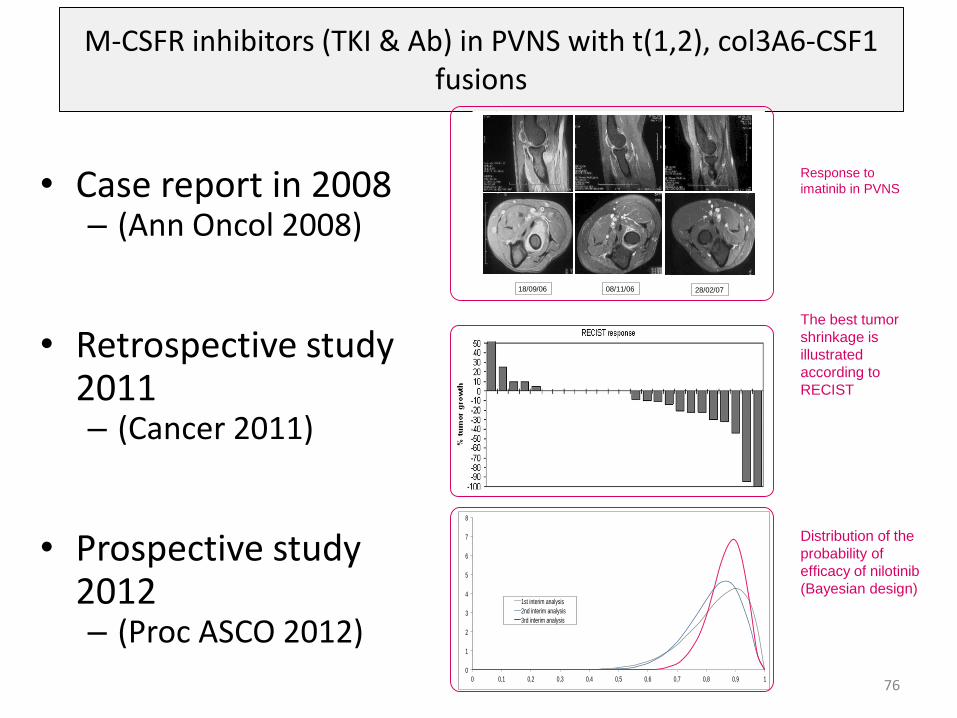
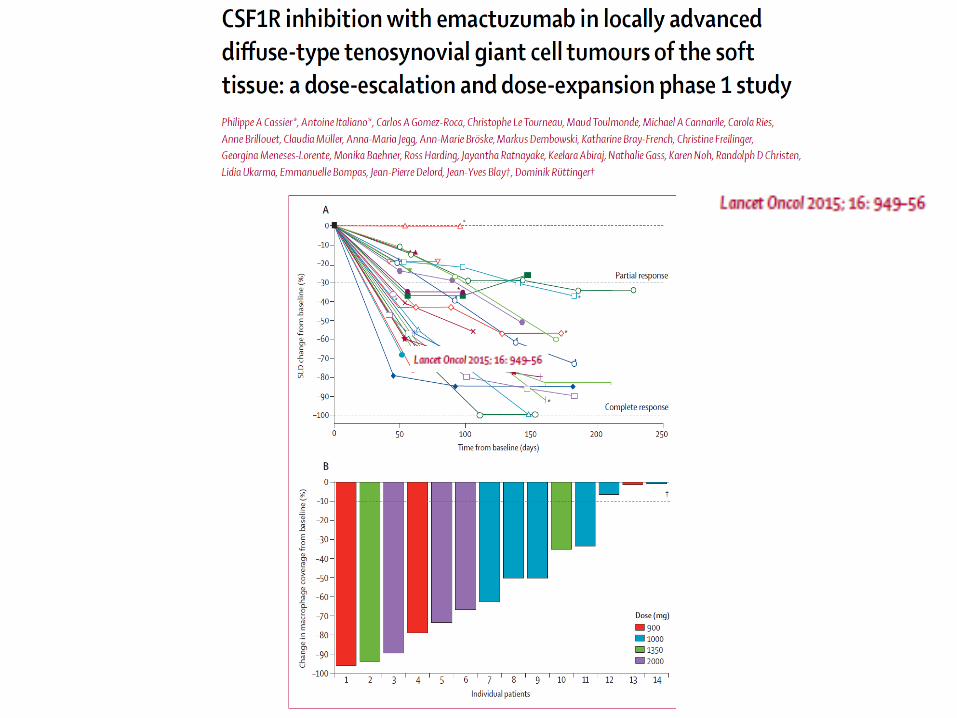
M-CSFR inhibitors (TKI & Ab) in PVNS with t(1,2), col3A6-CSF1 fusions
• Case report in 2008– (Ann Oncol 2008)
• Retrospective study2011– (Cancer 2011)
• Prospective study2012– (Proc ASCO 2012)
760
1
2
3
4
5
6
7
8
0 0,1 0,2 0,3 0,4 0,5 0,6 0,7 0,8 0,9 1
1st interim analysis
2nd interim analysis
3rd interim analysis
18/09/06 08/11/06 28/02/07
Figure: Response to imatinib in PVNS
The best tumor
shrinkage is
illustrated
according to
RECIST
Response to
imatinib in PVNS
Distribution of the
probability of
efficacy of nilotinib
(Bayesian design)
Besancon 18 1 18
GIST
Sarcomas and
aggressive connective
tissue tumors
Mutations
kinases
G5
Ntl
Group
Translocations
DFSP
SyS
Ewing
Mutations
APC/bCat
Desmoids
WD/DDLPSAmplification
12q13-15
MDM2/CDK4
MPNST
PEComas
TSG loss
NF1, TSC1/2
Genomique
complexe
LMS, UPS
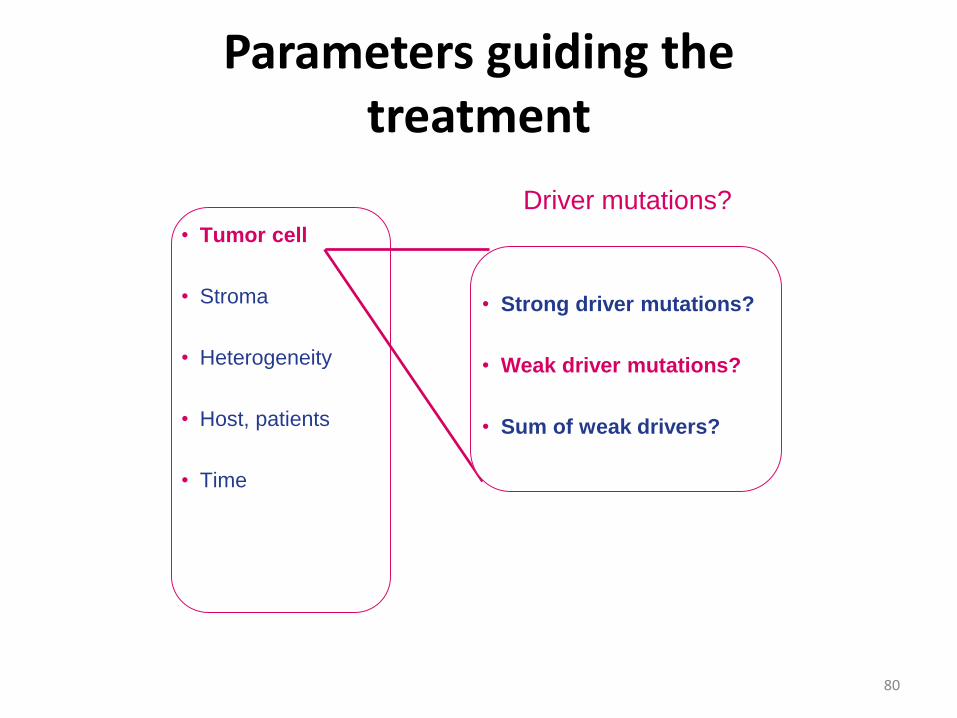
Parameters guiding the treatment
80
• Strong driver mutations?
• Weak driver mutations?
• Sum of weak drivers?
Driver mutations?
• Tumor cell
• Stroma
• Heterogeneity
• Host, patients
• Time
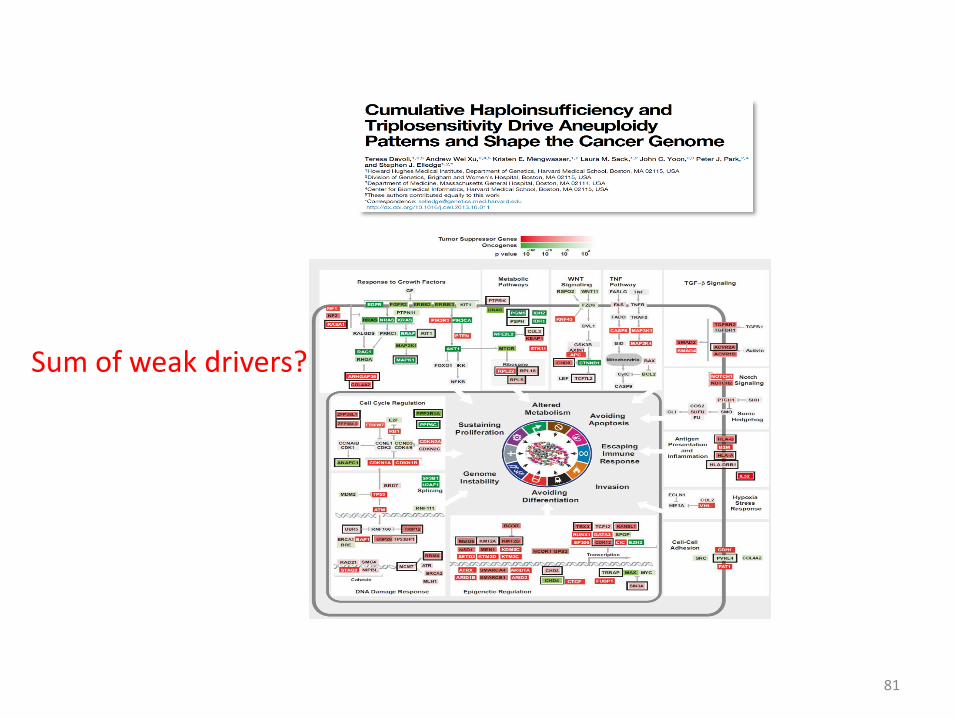
Sum of weak drivers?
81
Besancon 18 1 18
GIST
Sarcomas and
aggressive connective
tissue tumors
Mutations
kinases
G5
Ntl
Group
Translocations
DFSP
SyS
Ewing
Mutations
APC/bCat
Desmoids
WD/DDLPSAmplification
12q13-15
MDM2/CDK4
MPNST
PEComas
TSG loss
NF1, TSC1/2
Genomique
complexe
LMS, UPS
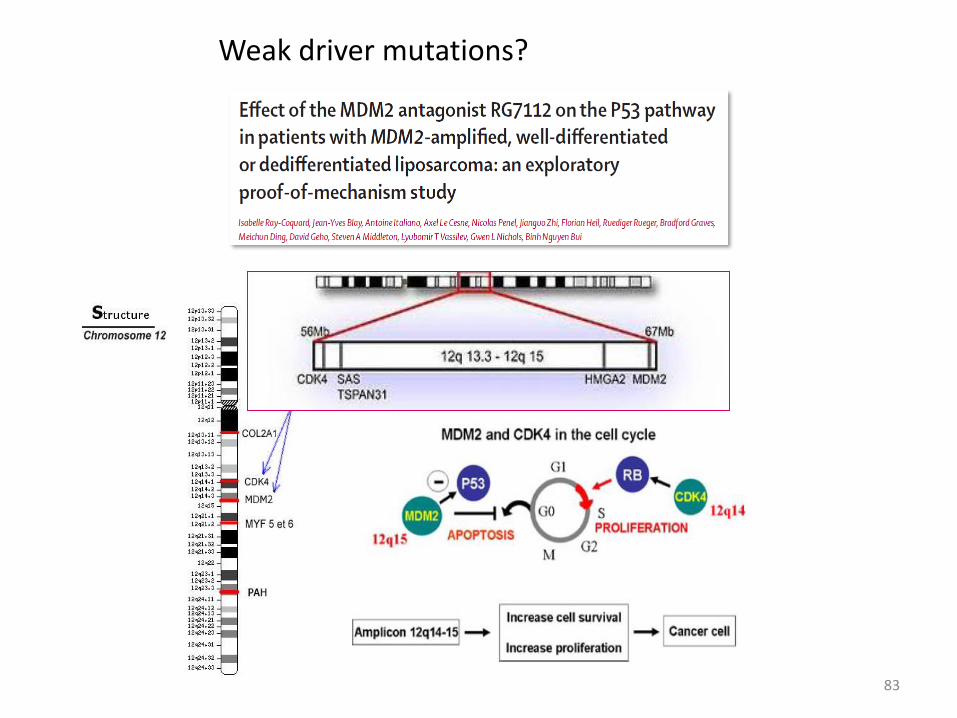
Weak driver mutations?
83
Phamacokinetic and pharmacodynamic data
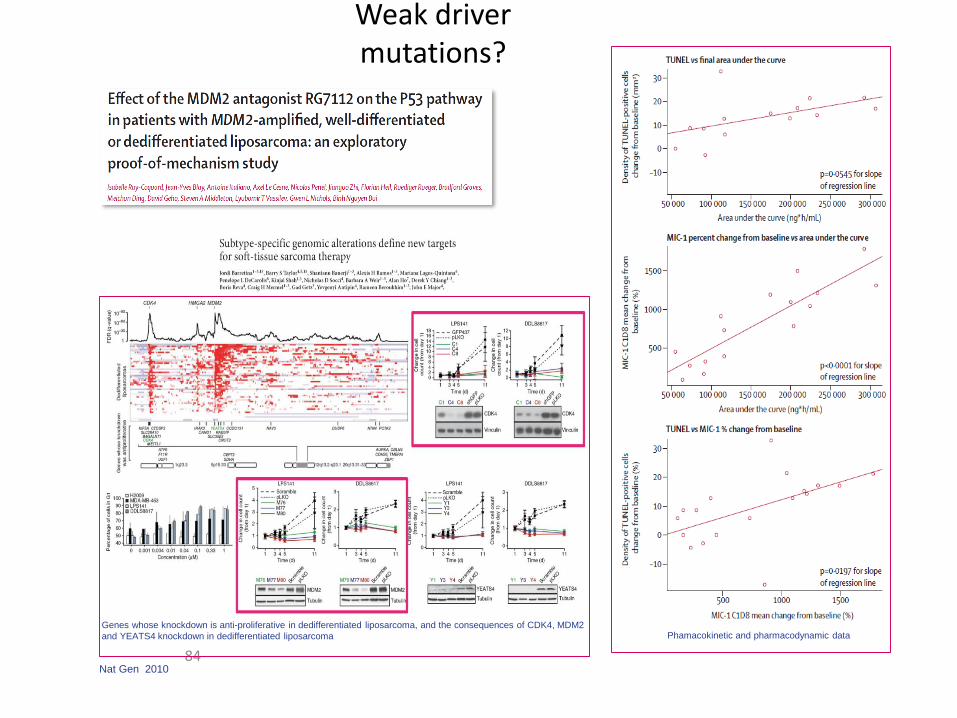
Weak driver mutations?
84
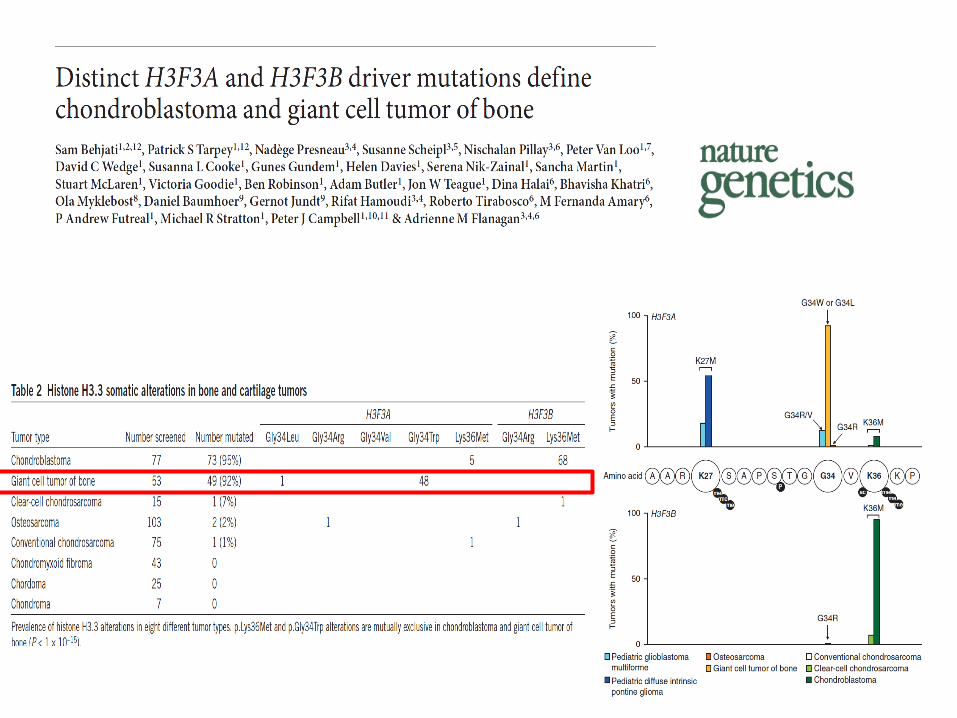
Genes whose knockdown is anti-proliferative in dedifferentiated liposarcoma, and the consequences of CDK4, MDM2
and YEATS4 knockdown in dedifferentiated liposarcoma
Nat Gen 2010
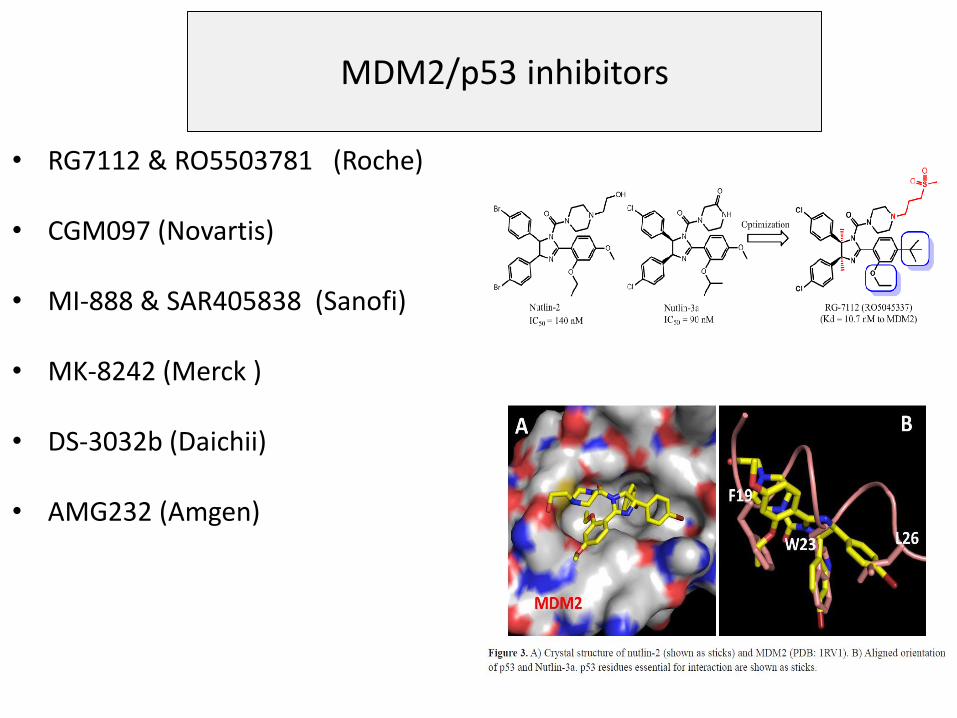
MDM2/p53 inhibitors
• RG7112 & RO5503781 (Roche)
• CGM097 (Novartis)
• MI-888 & SAR405838 (Sanofi)
• MK-8242 (Merck )
• DS-3032b (Daichii)
• AMG232 (Amgen)
Parameters guiding the treatment
89
• Tumor cell
• The stroma of the tumor
• Heterogeneity
• Host, patients
• Time
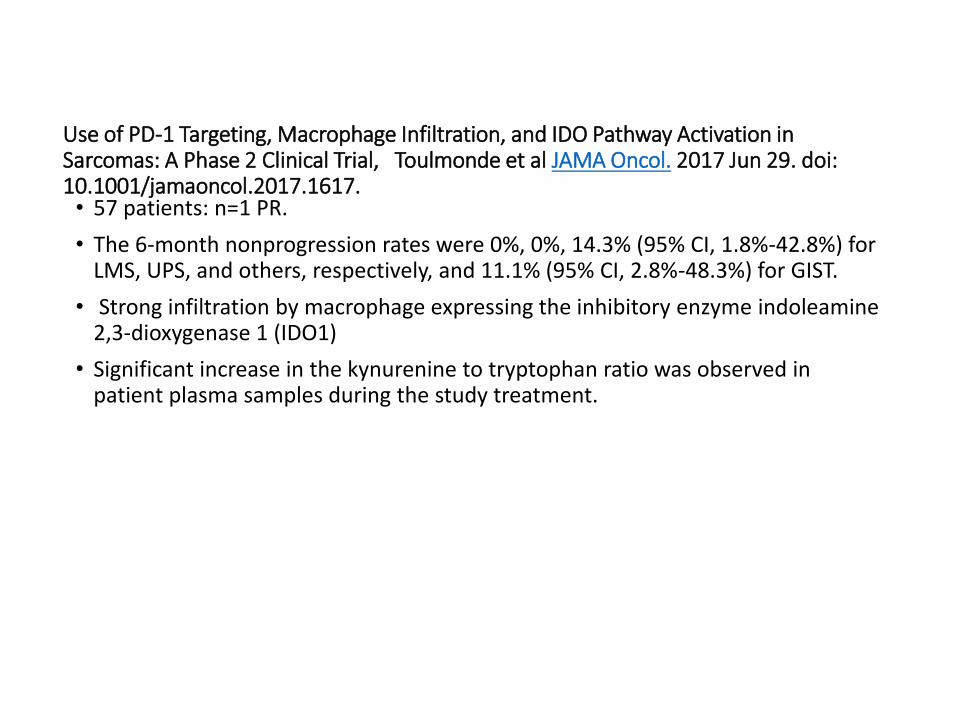
Use of PD-1 Targeting, Macrophage Infiltration, and IDO Pathway Activation in Sarcomas: A Phase 2 Clinical Trial, Toulmonde et al JAMA Oncol. 2017 Jun 29. doi: 10.1001/jamaoncol.2017.1617. • 57 patients: n=1 PR.
• The 6-month nonprogression rates were 0%, 0%, 14.3% (95% CI, 1.8%-42.8%) for LMS, UPS, and others, respectively, and 11.1% (95% CI, 2.8%-48.3%) for GIST.
• Strong infiltration by macrophage expressing the inhibitory enzyme indoleamine2,3-dioxygenase 1 (IDO1)
• Significant increase in the kynurenine to tryptophan ratio was observed in patient plasma samples during the study treatment.
KEY RESULTS
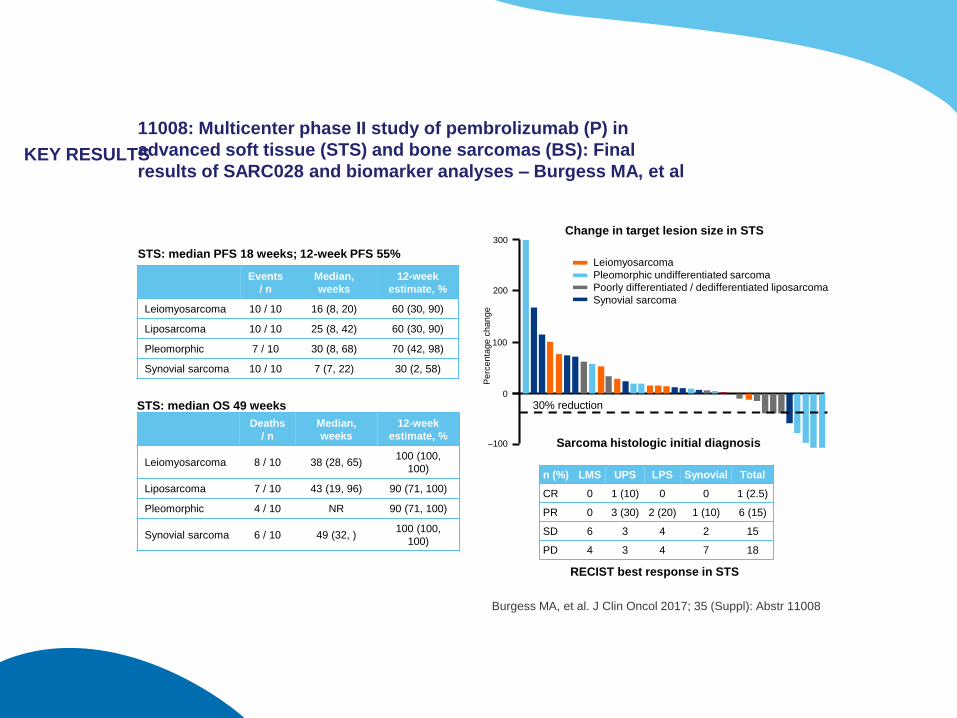
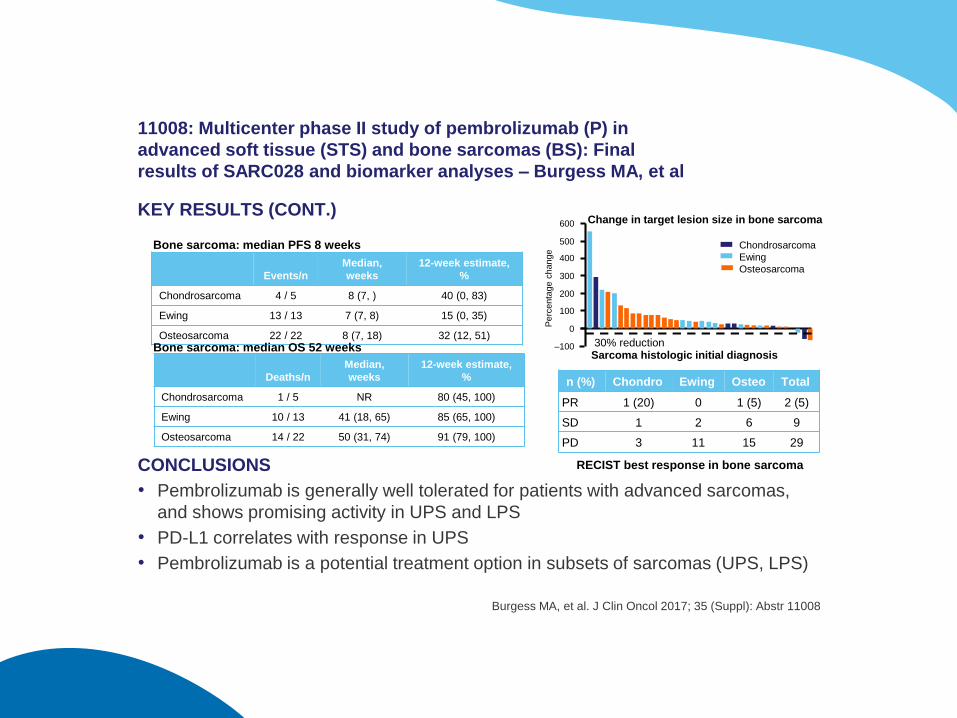
11008: Multicenter phase II study of pembrolizumab (P) in
advanced soft tissue (STS) and bone sarcomas (BS): Final
results of SARC028 and biomarker analyses – Burgess MA, et al
Burgess MA, et al. J Clin Oncol 2017; 35 (Suppl): Abstr 11008
Leiomyosarcoma
Pleomorphic undifferentiated sarcoma
Poorly differentiated / dedifferentiated liposarcoma
Synovial sarcoma
Pe
rce
nta
ge
ch
an
ge
300
200
100
0
–100
Change in target lesion size in STS
Sarcoma histologic initial diagnosis
30% reduction
n (%) LMS UPS LPS Synovial Total
CR 0 1 (10) 0 0 1 (2.5)
PR 0 3 (30) 2 (20) 1 (10) 6 (15)
SD 6 3 4 2 15
PD 4 3 4 7 18
Events
/ n
Median,
weeks
12-week
estimate, %
Leiomyosarcoma 10 / 10 16 (8, 20) 60 (30, 90)
Liposarcoma 10 / 10 25 (8, 42) 60 (30, 90)
Pleomorphic 7 / 10 30 (8, 68) 70 (42, 98)
Synovial sarcoma 10 / 10 7 (7, 22) 30 (2, 58)
Deaths
/ n
Median,
weeks
12-week
estimate, %
Leiomyosarcoma 8 / 10 38 (28, 65)100 (100,
100)
Liposarcoma 7 / 10 43 (19, 96) 90 (71, 100)
Pleomorphic 4 / 10 NR 90 (71, 100)
Synovial sarcoma 6 / 10 49 (32, )100 (100,
100)
RECIST best response in STS
STS: median PFS 18 weeks; 12-week PFS 55%
STS: median OS 49 weeks
KEY RESULTS (CONT.)
CONCLUSIONS
• Pembrolizumab is generally well tolerated for patients with advanced sarcomas,
and shows promising activity in UPS and LPS
• PD-L1 correlates with response in UPS
• Pembrolizumab is a potential treatment option in subsets of sarcomas (UPS, LPS)
11008: Multicenter phase II study of pembrolizumab (P) in
advanced soft tissue (STS) and bone sarcomas (BS): Final
results of SARC028 and biomarker analyses – Burgess MA, et al
Burgess MA, et al. J Clin Oncol 2017; 35 (Suppl): Abstr 11008
Pe
rce
nta
ge
ch
an
ge
600
400
200
0
500
300
100
–100
Chondrosarcoma
Ewing
Osteosarcoma
Change in target lesion size in bone sarcoma
Sarcoma histologic initial diagnosis30% reduction
n (%) Chondro Ewing Osteo Total
PR 1 (20) 0 1 (5) 2 (5)
SD 1 2 6 9
PD 3 11 15 29
RECIST best response in bone sarcoma
Events/n
Median,
weeks
12-week estimate,
%
Chondrosarcoma 4 / 5 8 (7, ) 40 (0, 83)
Ewing 13 / 13 7 (7, 8) 15 (0, 35)
Osteosarcoma 22 / 22 8 (7, 18) 32 (12, 51)
Deaths/n
Median,
weeks
12-week estimate,
%
Chondrosarcoma 1 / 5 NR 80 (45, 100)
Ewing 10 / 13 41 (18, 65) 85 (65, 100)
Osteosarcoma 14 / 22 50 (31, 74) 91 (79, 100)
Bone sarcoma: median PFS 8 weeks
Bone sarcoma: median OS 52 weeks
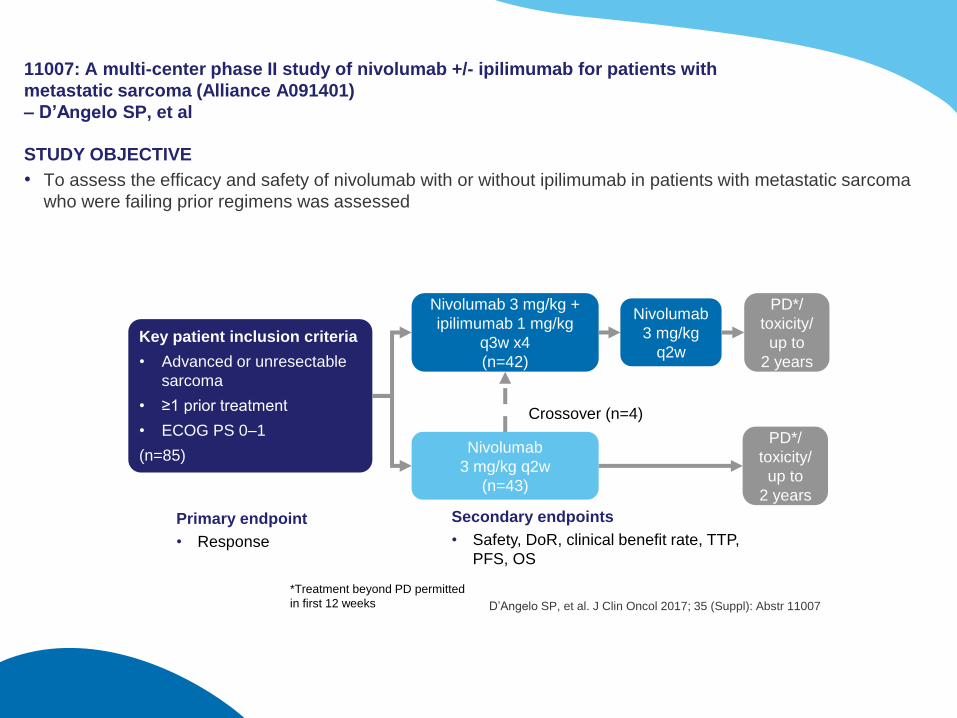
11007: A multi-center phase II study of nivolumab +/- ipilimumab for patients with
metastatic sarcoma (Alliance A091401)
– D’Angelo SP, et al
STUDY OBJECTIVE
• To assess the efficacy and safety of nivolumab with or without ipilimumab in patients with metastatic sarcoma
who were failing prior regimens was assessed
D’Angelo SP, et al. J Clin Oncol 2017; 35 (Suppl): Abstr 11007
Primary endpoint
• Response
Secondary endpoints
• Safety, DoR, clinical benefit rate, TTP,
PFS, OS
Nivolumab 3 mg/kg +
ipilimumab 1 mg/kg
q3w x4
(n=42)
Nivolumab
3 mg/kg q2w
(n=43)
Key patient inclusion criteria
• Advanced or unresectable
sarcoma
• ≥1 prior treatment
• ECOG PS 0–1
(n=85)PD*/
toxicity/
up to
2 years
PD*/
toxicity/
up to
2 years
Nivolumab
3 mg/kg
q2w
Crossover (n=4)
*Treatment beyond PD permitted
in first 12 weeks
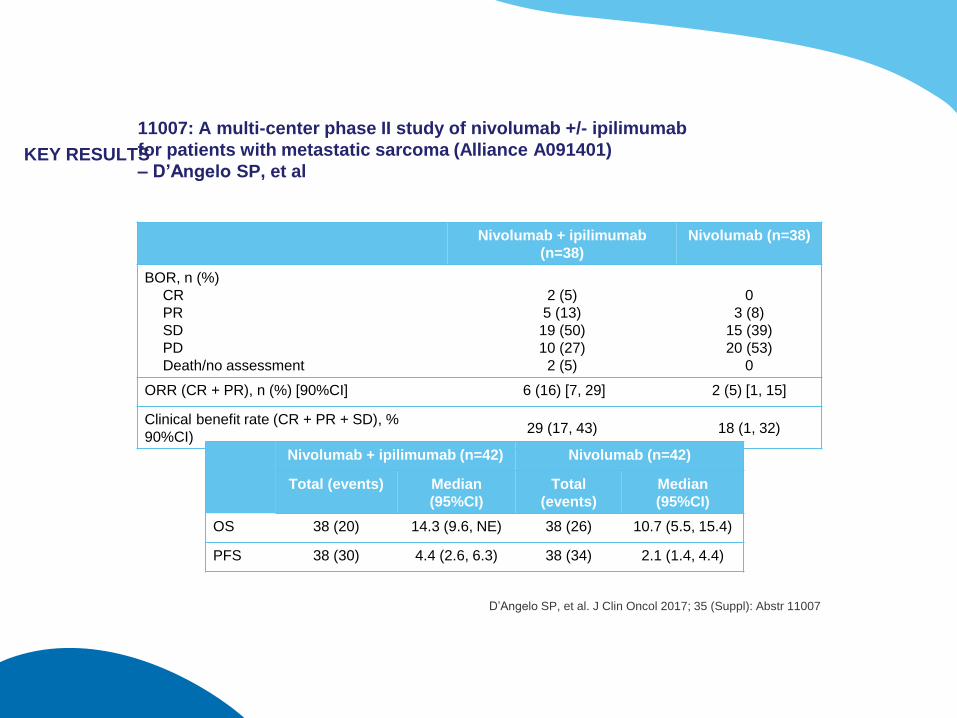
KEY RESULTS
11007: A multi-center phase II study of nivolumab +/- ipilimumab
for patients with metastatic sarcoma (Alliance A091401)
– D’Angelo SP, et al
D’Angelo SP, et al. J Clin Oncol 2017; 35 (Suppl): Abstr 11007
Nivolumab + ipilimumab
(n=38)
Nivolumab (n=38)
BOR, n (%)
CR
PR
SD
PD
Death/no assessment
2 (5)
5 (13)
19 (50)
10 (27)
2 (5)
0
3 (8)
15 (39)
20 (53)
0
ORR (CR + PR), n (%) [90%CI] 6 (16) [7, 29] 2 (5) [1, 15]
Clinical benefit rate (CR + PR + SD), %
90%CI) 29 (17, 43) 18 (1, 32)
Nivolumab + ipilimumab (n=42) Nivolumab (n=42)
Total (events) Median
(95%CI)
Total
(events)
Median
(95%CI)
OS 38 (20) 14.3 (9.6, NE) 38 (26) 10.7 (5.5, 15.4)
PFS 38 (30) 4.4 (2.6, 6.3) 38 (34) 2.1 (1.4, 4.4)
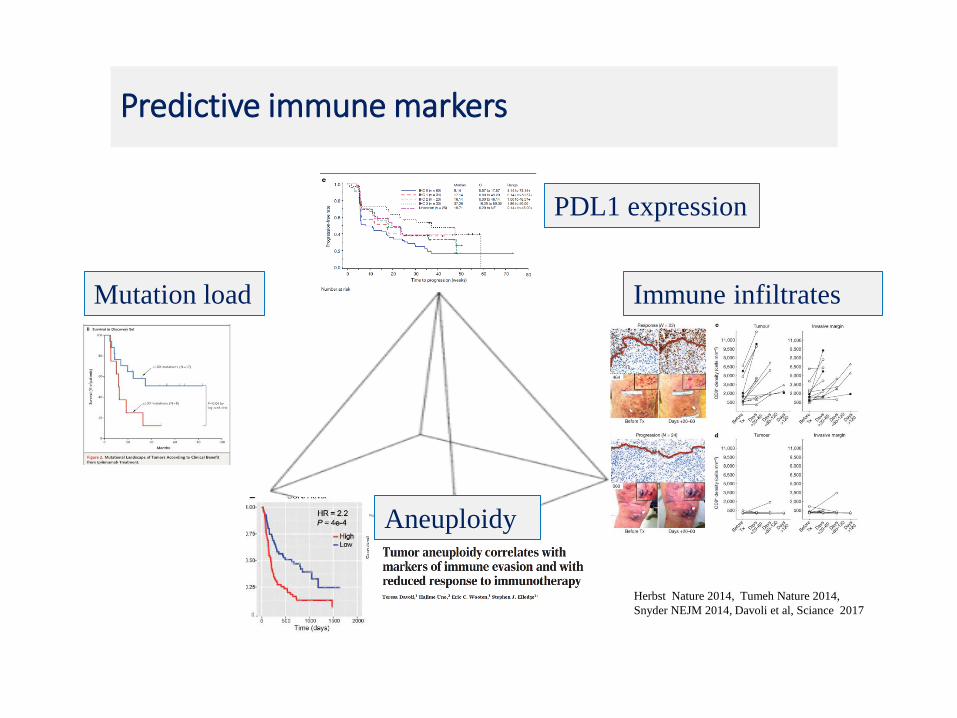
Predictive immune markers
Herbst Nature 2014, Tumeh Nature 2014,
Snyder NEJM 2014, Davoli et al, Sciance 2017
Mutation load
PDL1 expression
Immune infiltrates
Aneuploidy
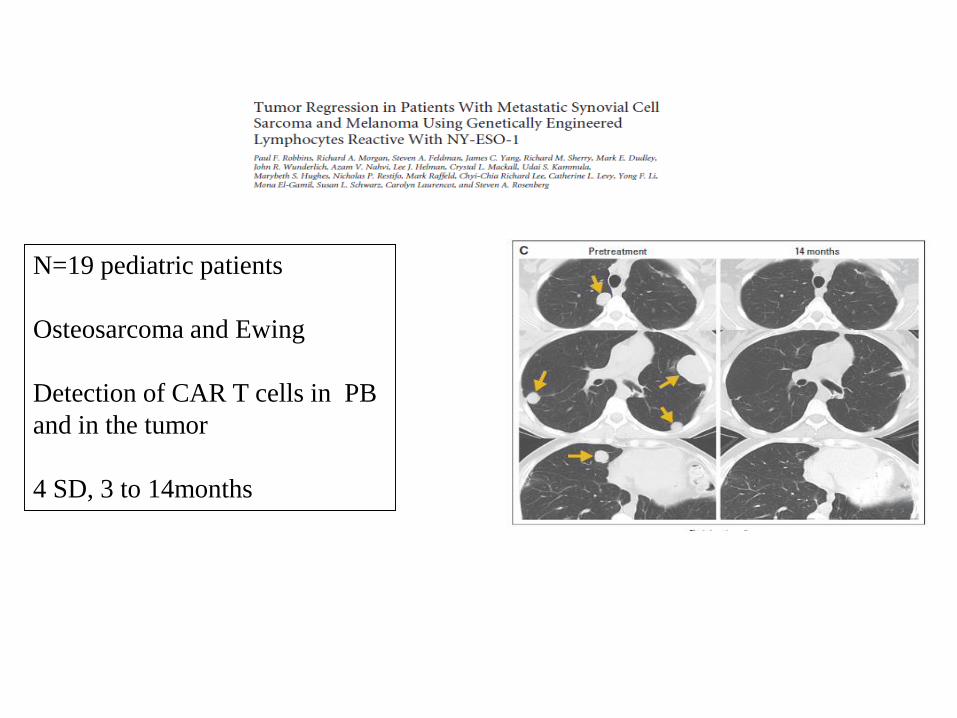
N=19 pediatric patients
Osteosarcoma and Ewing
Detection of CAR T cells in PB
and in the tumor
4 SD, 3 to 14months
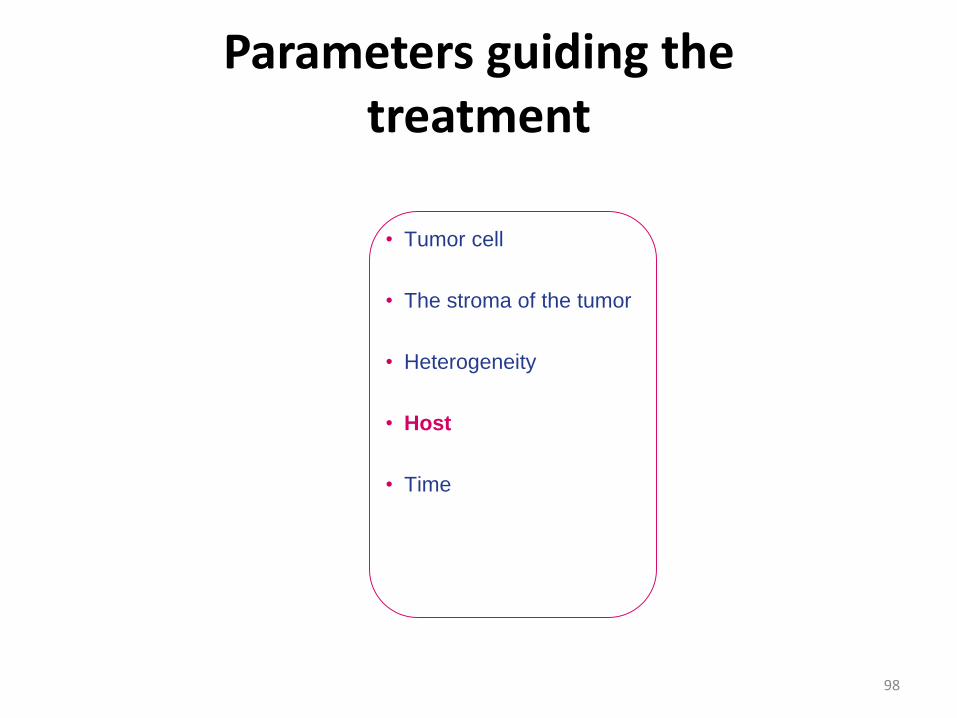
Parameters guiding the treatment
98
• Tumor cell
• The stroma of the tumor
• Heterogeneity
• Host
• Time
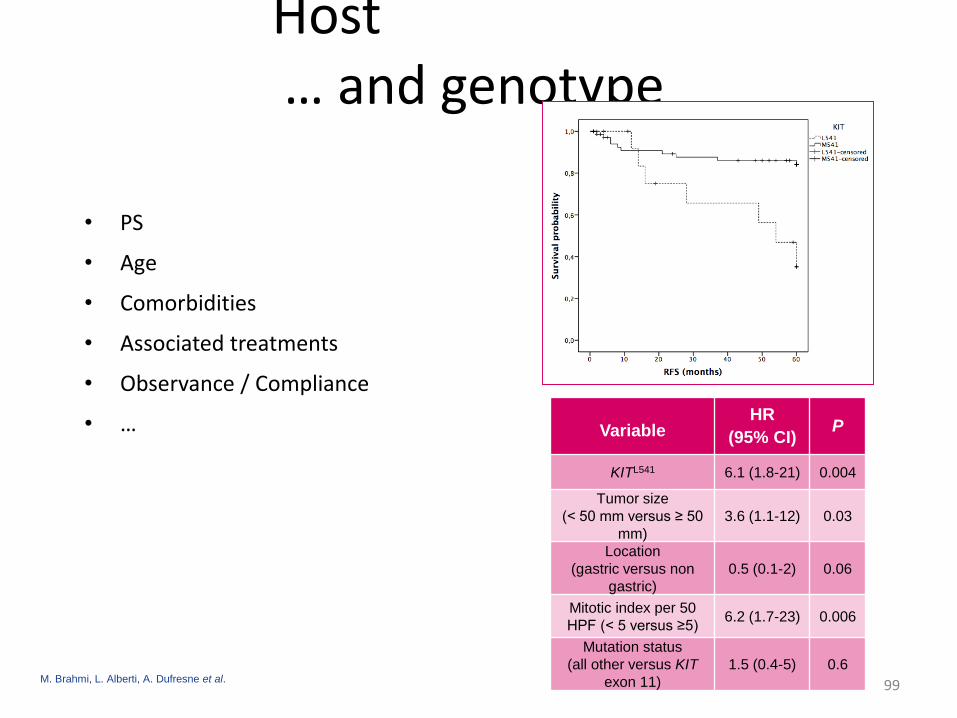
Host… and genotype
• PS
• Age
• Comorbidities
• Associated treatments
• Observance / Compliance
• …
99
VariableHR
(95% CI)P
KITL541 6.1 (1.8-21) 0.004
Tumor size
(< 50 mm versus ≥ 50
mm)
3.6 (1.1-12) 0.03
Location
(gastric versus non
gastric)
0.5 (0.1-2) 0.06
Mitotic index per 50
HPF (< 5 versus ≥5)6.2 (1.7-23) 0.006
Mutation status
(all other versus KIT
exon 11)
1.5 (0.4-5) 0.6M. Brahmi, L. Alberti, A. Dufresne et al.
100
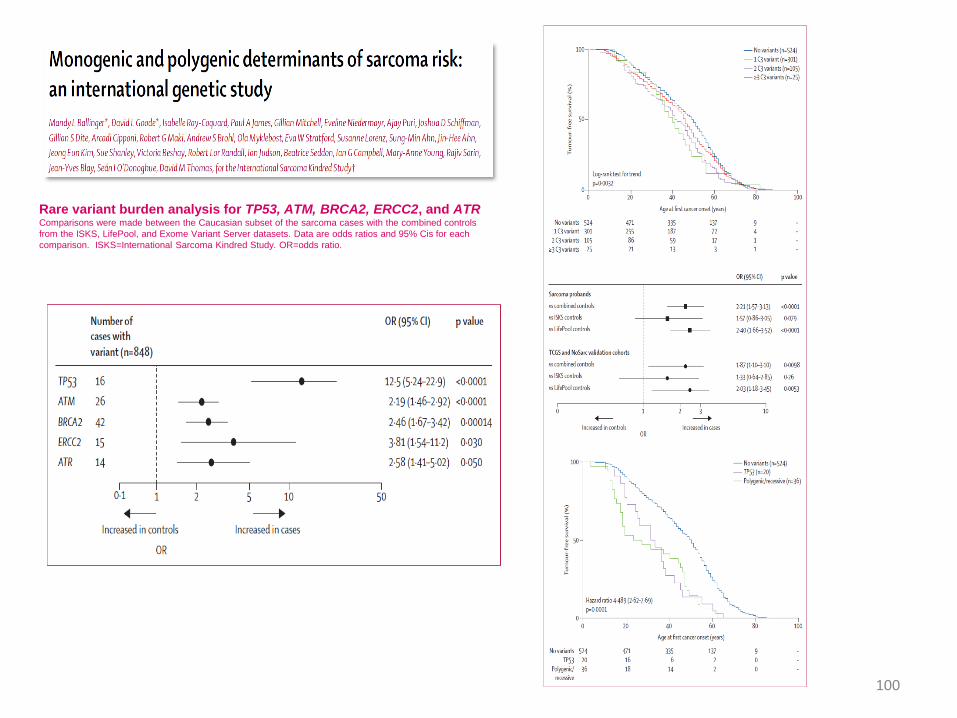
Rare variant burden analysis for TP53, ATM, BRCA2, ERCC2, and ATRComparisons were made between the Caucasian subset of the sarcoma cases with the combined controls
from the ISKS, LifePool, and Exome Variant Server datasets. Data are odds ratios and 95% Cis for each
comparison. ISKS=International Sarcoma Kindred Study. OR=odds ratio.
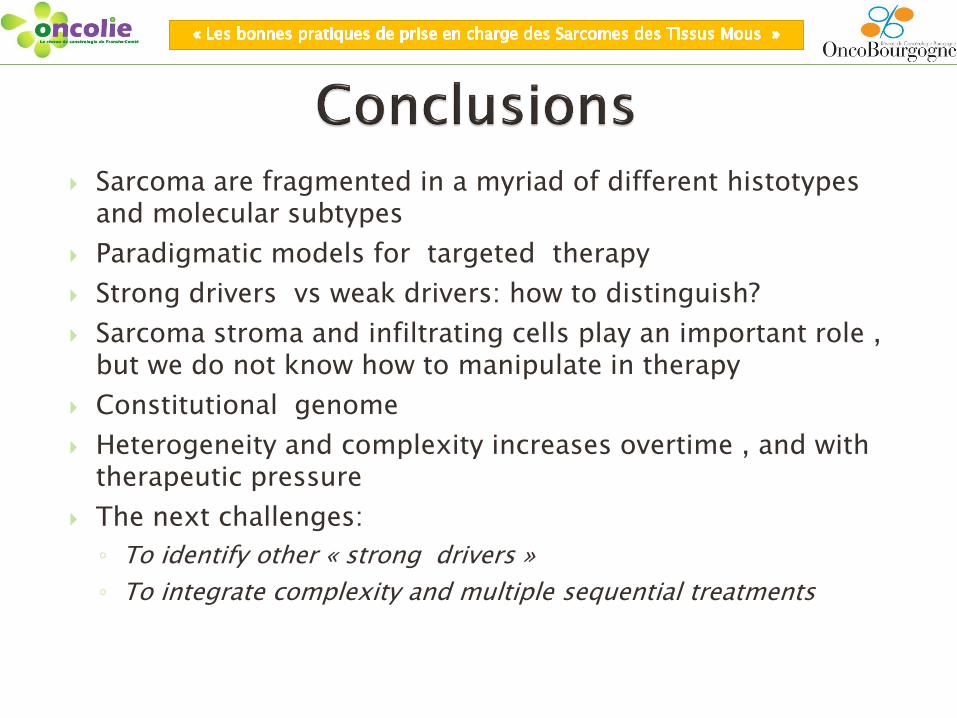
Sarcoma are fragmented in a myriad of different histotypesand molecular subtypes
Paradigmatic models for targeted therapy
Strong drivers vs weak drivers: how to distinguish?
Sarcoma stroma and infiltrating cells play an important role , but we do not know how to manipulate in therapy
Constitutional genome
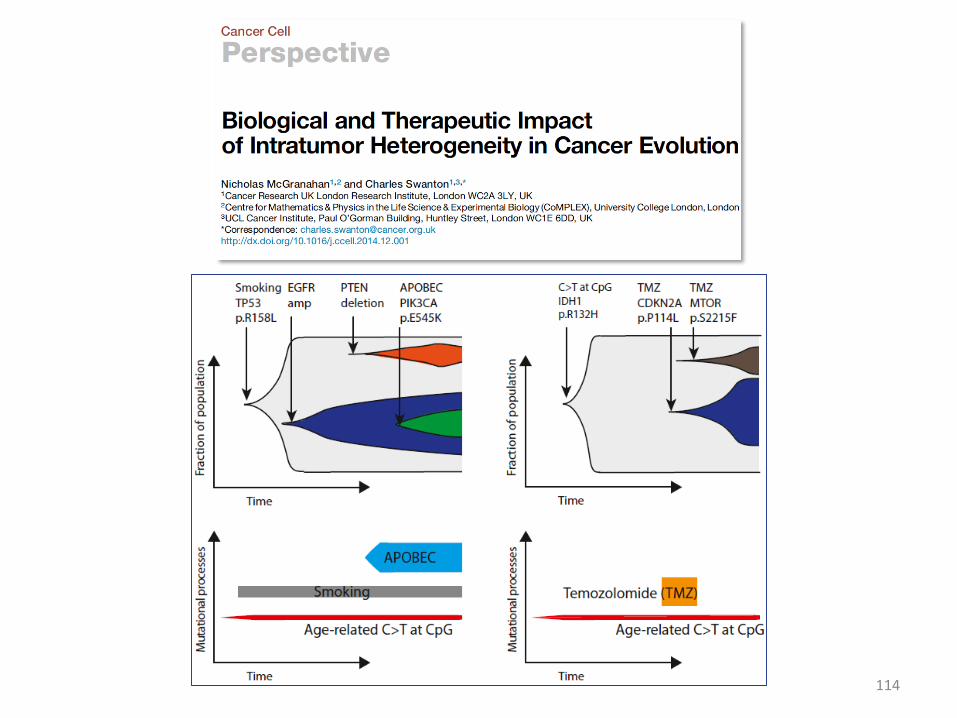
Heterogeneity and complexity increases overtime , and withtherapeutic pressure
The next challenges:
◦ To identify other « strong drivers »
◦ To integrate complexity and multiple sequential treatments

ERN
• The European Commission (EC) is supporting Member States in the development of European Reference Networks (ERNs) to link existing highly specialised healthcare providers across the European Union (EU).
• As expertise in rare or low prevalence complex diseases or conditions is scarce and dispersed, ERNs will facilitate timely access to care, both diagnosis and treatment, by centralising knowledge and experience, medical research and training, and resources for these diseases and conditions.
• The EC has been mandated to define the requirements for ERNs as specified in Article 12 of the Directive 2011/24/EU1 on patient’s rights in cross-border healthcare.
EURACANWhat are the objectives
• Improving the quality of care of patients withRare cancers in EU
• Guidelines
• Communication
• Patient pathways
• Expertise for all
• Cross border
• Research
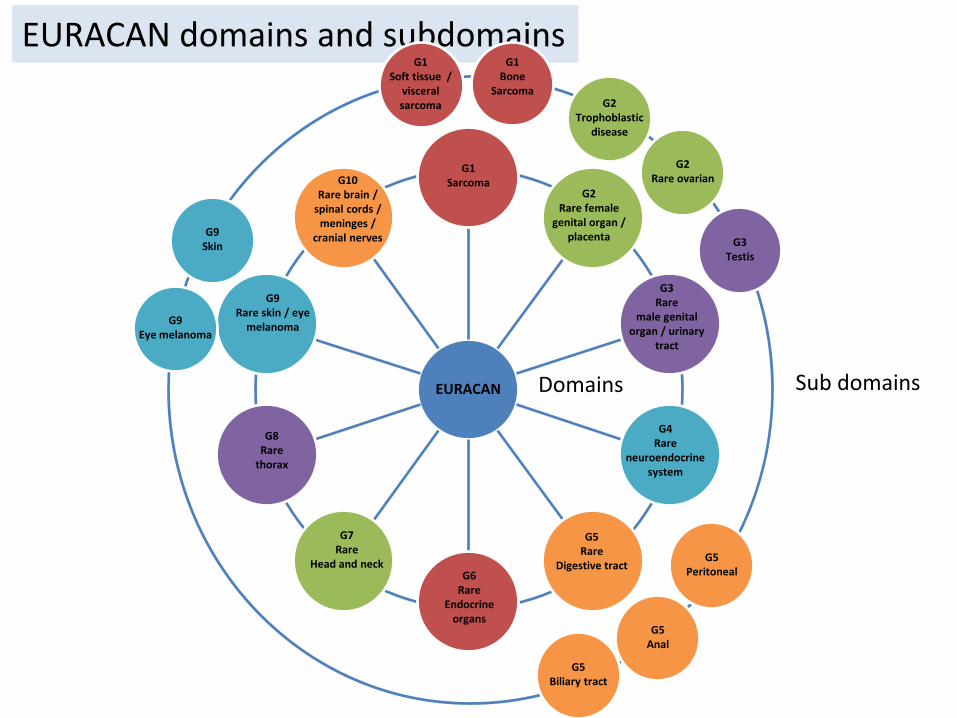
EURACAN domains and subdomains
EURACAN
G1 Sarcoma
G2Rare female
genital organ / placenta
G3Rare
male genital organ / urinary
tract
G4Rare
neuroendocrine system
G5Rare
Digestive tractG6
Rare Endocrine
organs
G7Rare
Head and neck
G8Rare
thorax
G9Rare skin / eye
melanoma
G10Rare brain /
spinal cords / meninges /
cranial nerves
G1 Soft tissue /
visceralsarcoma
G1 Bone
SarcomaG2
Trophoblastic disease
G2Rare ovarian
G3Testis
G5Peritoneal
G5Biliary tract
G5Anal
G9Skin
G9Eye melanoma
Domains Sub domains
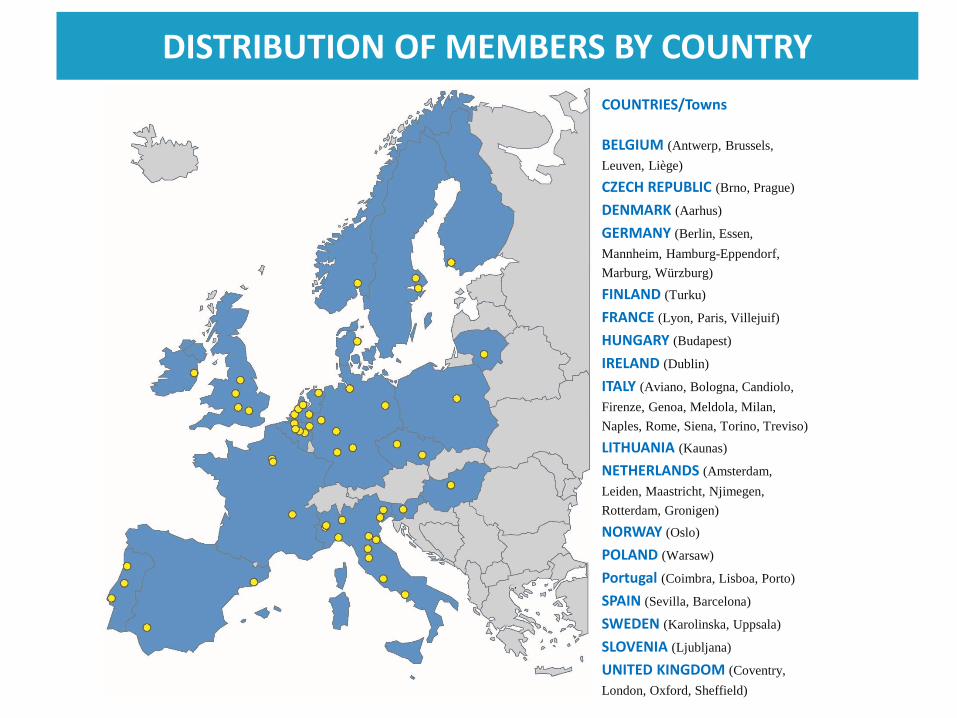
DISTRIBUTION OF MEMBERS BY COUNTRY
COUNTRIES/Towns
BELGIUM (Antwerp, Brussels,
Leuven, Liège)
CZECH REPUBLIC (Brno, Prague)
DENMARK (Aarhus)
GERMANY (Berlin, Essen,
Mannheim, Hamburg-Eppendorf,
Marburg, Würzburg)
FINLAND (Turku)
FRANCE (Lyon, Paris, Villejuif)
HUNGARY (Budapest)
IRELAND (Dublin)
ITALY (Aviano, Bologna, Candiolo,
Firenze, Genoa, Meldola, Milan,
Naples, Rome, Siena, Torino, Treviso)
LITHUANIA (Kaunas)
NETHERLANDS (Amsterdam,
Leiden, Maastricht, Njimegen,
Rotterdam, Gronigen)
NORWAY (Oslo)
POLAND (Warsaw)
Portugal (Coimbra, Lisboa, Porto)
SPAIN (Sevilla, Barcelona)
SWEDEN (Karolinska, Uppsala)
SLOVENIA (Ljubljana)
UNITED KINGDOM (Coventry,
London, Oxford, Sheffield)
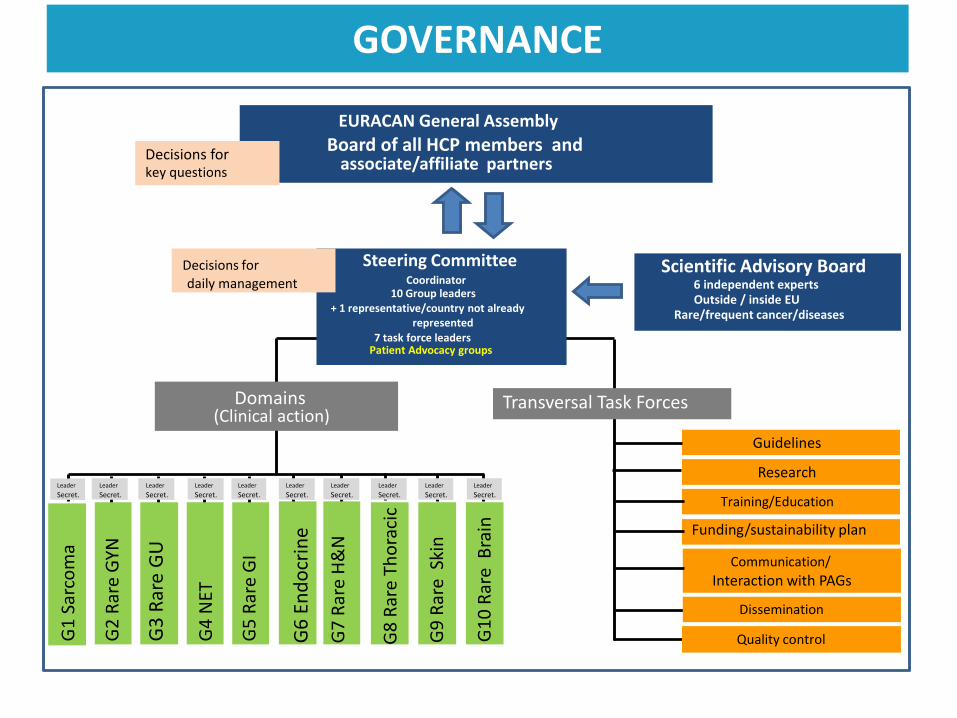
GOVERNANCE
EURACAN General Assembly
Board of all HCP members andassociate/affiliate partners
Domains(Clinical action)
Guidelines
Research
Training/Education
Funding/sustainability plan
Communication/
Interaction with PAGs
G1
Sar
com
a
G2
Rar
e G
YN
G3
Rar
e G
U
G4
NET
G5
Rar
e G
I
G6
En
do
crin
e
G7
Rar
e H
&N
G8
Rar
e Th
ora
cic
G9
Rar
e S
kin
G1
0 R
are
Bra
inLeader
Secret.Leader
Secret.Leader
Secret.Leader
Secret.Leader
Secret.Leader
Secret.Leader
Secret.Leader
Secret.Leader
Secret.Leader
Secret.
Transversal Task Forces
Steering CommitteeCoordinator
10 Group leaders+ 1 representative/country not already
represented7 task force leaders
Patient Advocacy groups
Scientific Advisory Board6 independent experts
Rare/frequent cancer/diseasesOutside / inside EU
Decisions for key questions
Decisions for daily management
Dissemination
Quality control
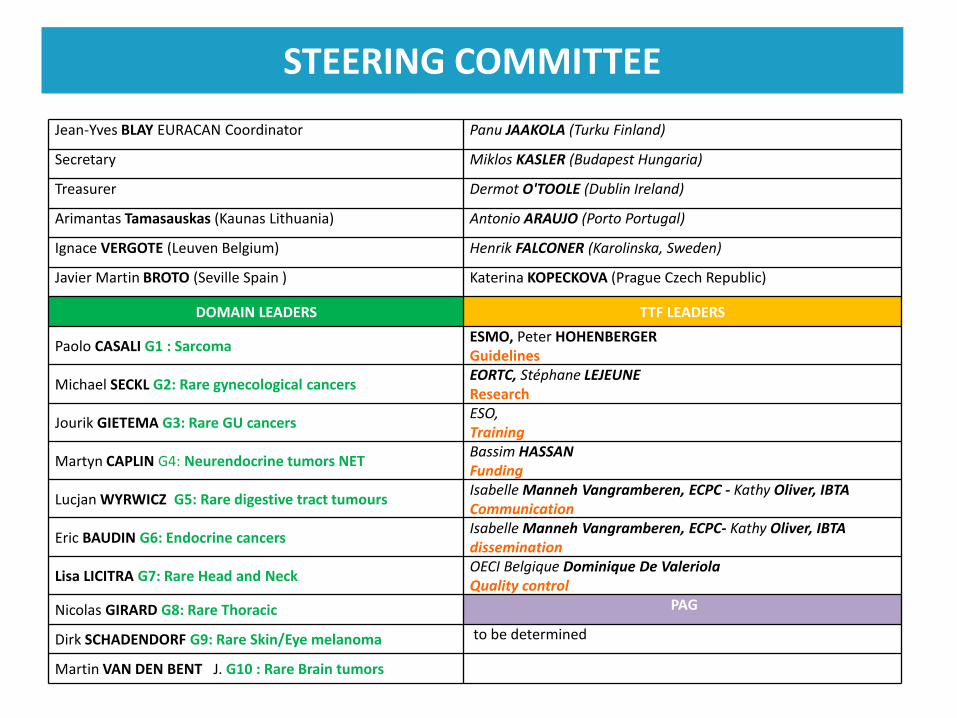
Jean-Yves BLAY EURACAN Coordinator Panu JAAKOLA (Turku Finland)
Secretary Miklos KASLER (Budapest Hungaria)
Treasurer Dermot O'TOOLE (Dublin Ireland)
Arimantas Tamasauskas (Kaunas Lithuania) Antonio ARAUJO (Porto Portugal)
Ignace VERGOTE (Leuven Belgium) Henrik FALCONER (Karolinska, Sweden)
Javier Martin BROTO (Seville Spain ) Katerina KOPECKOVA (Prague Czech Republic)
DOMAIN LEADERS TTF LEADERS
Paolo CASALI G1 : SarcomaESMO, Peter HOHENBERGERGuidelines
Michael SECKL G2: Rare gynecological cancersEORTC, Stéphane LEJEUNEResearch
Jourik GIETEMA G3: Rare GU cancersESO,Training
Martyn CAPLIN G4: Neurendocrine tumors NETBassim HASSANFunding
Lucjan WYRWICZ G5: Rare digestive tract tumoursIsabelle Manneh Vangramberen, ECPC - Kathy Oliver, IBTACommunication
Eric BAUDIN G6: Endocrine cancersIsabelle Manneh Vangramberen, ECPC- Kathy Oliver, IBTAdissemination
Lisa LICITRA G7: Rare Head and NeckOECI Belgique Dominique De ValeriolaQuality control
Nicolas GIRARD G8: Rare Thoracic PAG
Dirk SCHADENDORF G9: Rare Skin/Eye melanoma to be determined
Martin VAN DEN BENT J. G10 : Rare Brain tumors
STEERING COMMITTEE
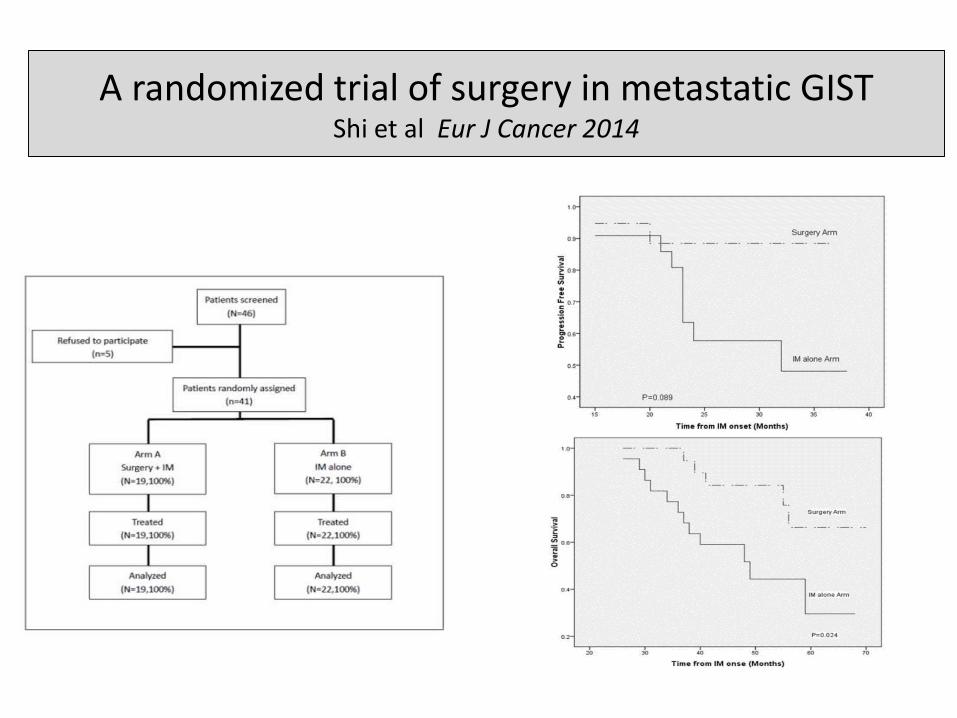
A randomized trial of surgery in metastatic GIST Shi et al Eur J Cancer 2014
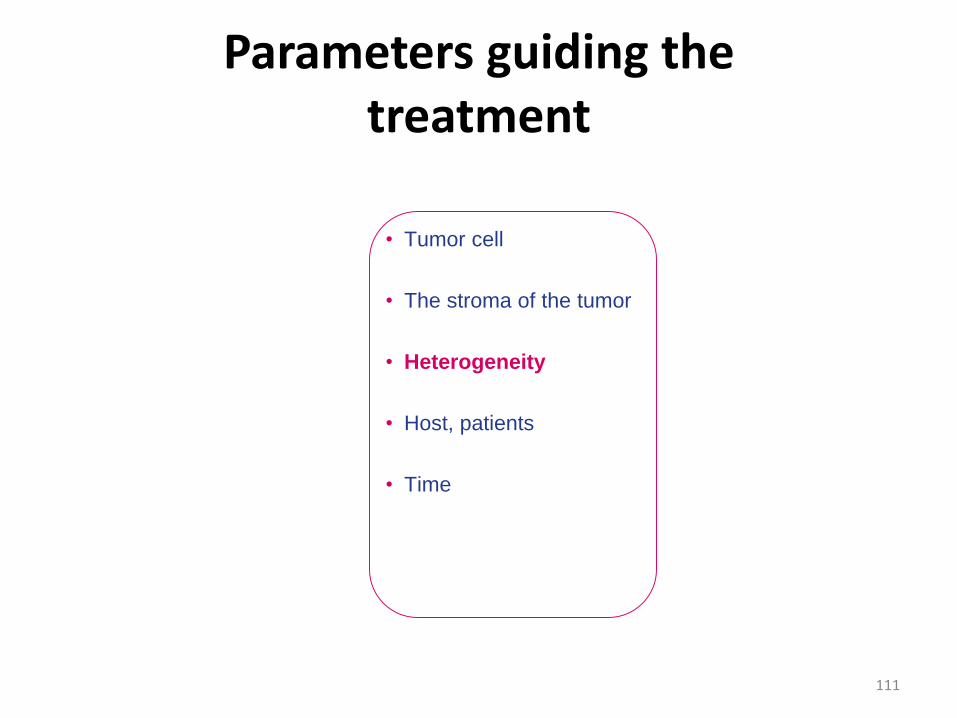
Parameters guiding the treatment
111
• Tumor cell
• The stroma of the tumor
• Heterogeneity
• Host, patients
• Time
112
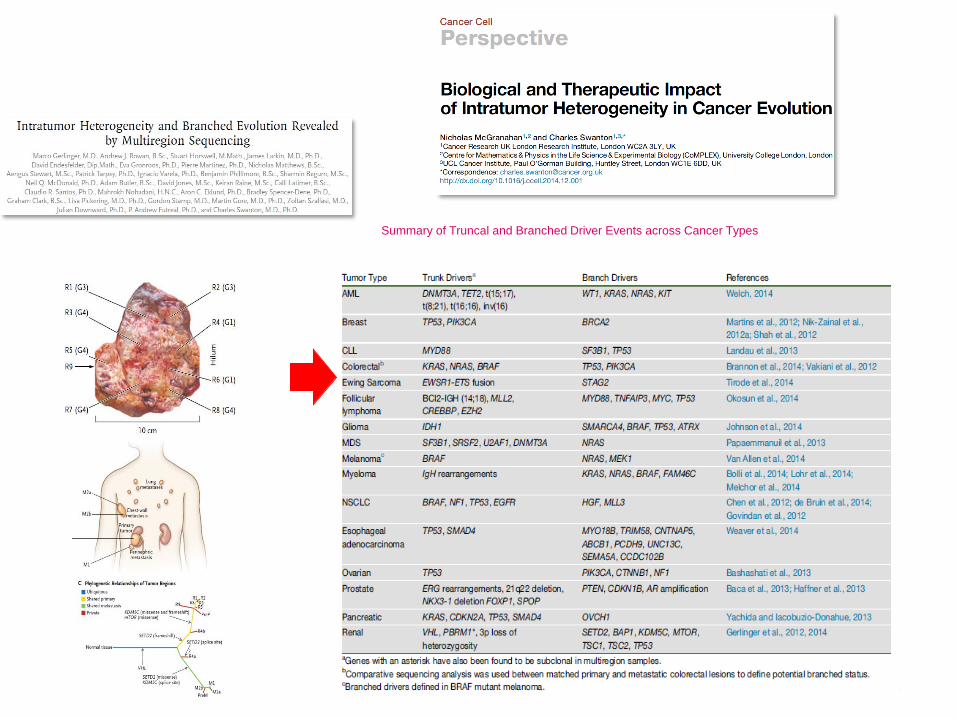
Summary of Truncal and Branched Driver Events across Cancer Types
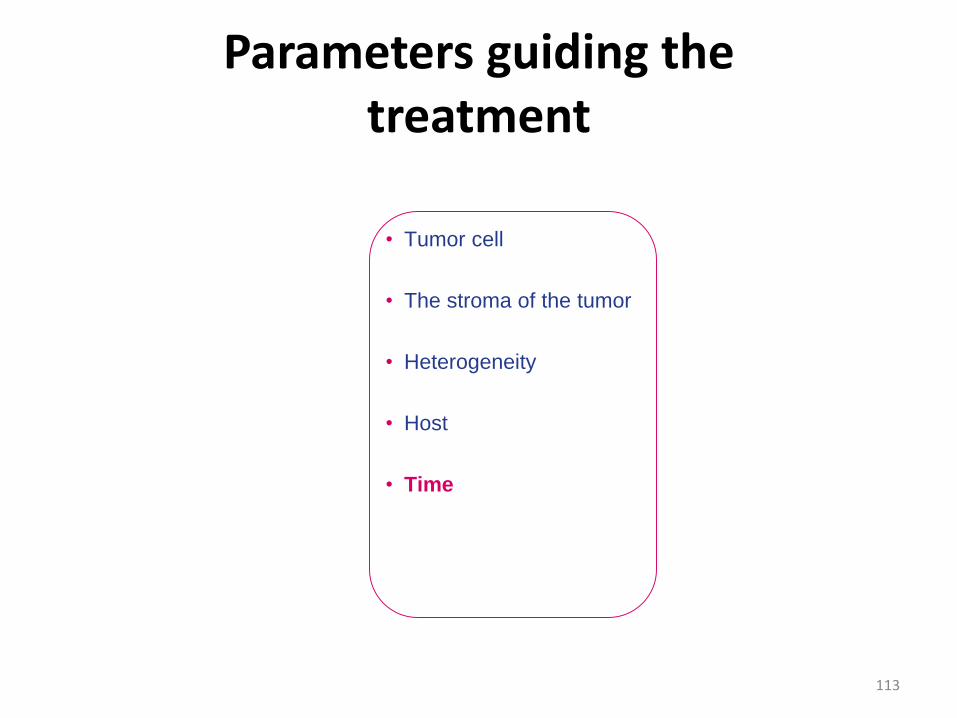
Parameters guiding the treatment
113
• Tumor cell
• The stroma of the tumor
• Heterogeneity
• Host
• Time
114
This slide includes the information about the drug that not approved in Japan.