Embed Size (px)
Citation preview
PROJET VOLTA-HYCOS VOLTA-HYCOS PROJECT
PROJET VOLTA-HYCOS VOLTA-HYCOS PROJECT
SEMINAIRE DE FORMATION SUR LES COURBES DE TARAGE
--------------------------TRAINING SESSION ON
CALIBRATION OF RATING CURVES--------------------------
Accra – 23 – 27 avril 2007
WMO / OMM
PROJET VOLTA-HYCOS VOLTA-HYCOS PROJECT
PROJET VOLTA-HYCOS VOLTA-HYCOS PROJECT
• .
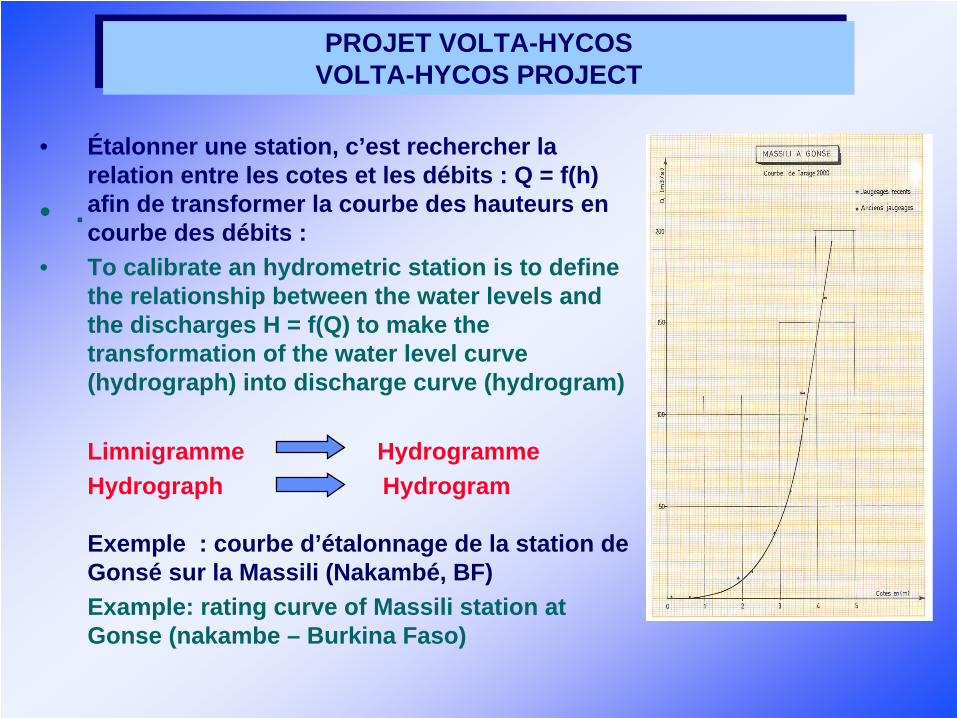
• Étalonner une station, c’est rechercher la relation entre les cotes et les débits : Q = f(h) afin de transformer la courbe des hauteurs en courbe des débits :
• To calibrate an hydrometric station is to define the relationship between the water levels and the discharges H = f(Q) to make the transformation of the water level curve (hydrograph) into discharge curve (hydrogram)
Limnigramme HydrogrammeHydrograph Hydrogram
Exemple : courbe d’étalonnage de la station de Gonsé sur la Massili (Nakambé, BF)Example: rating curve of Massili station at Gonse (nakambe – Burkina Faso)
PROJET VOLTA-HYCOS VOLTA-HYCOS PROJECT
PROJET VOLTA-HYCOS VOLTA-HYCOS PROJECT
• Pour définir cette relation, l’hydrologue dispose :• d’un ensemble d’informations sur le bief et la station hydrométrique,• de la chronique limnimétrique • de jaugeages en nombre et qualité variables.
• To define this relation, the hydrologist has:• A set of information about the reach and the hydrometric station,• The water levels time series,• Gauging in variable quantity and quality
La série des hauteurs ou chronique limnimétrique est caractérisée par sa période de validité et son intervalle de variation.
The water level time series are defined by the validity period and by its stage range.
PROJET VOLTA-HYCOS VOLTA-HYCOS PROJECT
PROJET VOLTA-HYCOS VOLTA-HYCOS PROJECT
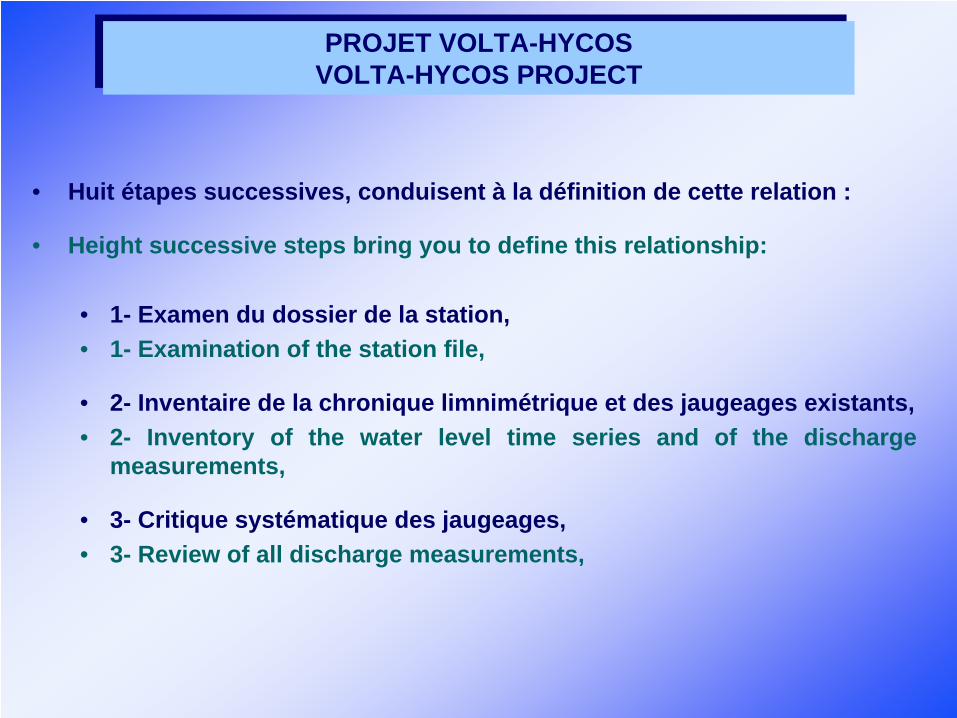
• Huit étapes successives, conduisent à la définition de cette relation :
• Height successive steps bring you to define this relationship:
• 1- Examen du dossier de la station,• 1- Examination of the station file,
• 2- Inventaire de la chronique limnimétrique et des jaugeages existants,• 2- Inventory of the water level time series and of the discharge
measurements,
• 3- Critique systématique des jaugeages,• 3- Review of all discharge measurements,
PROJET VOLTA-HYCOS VOLTA-HYCOS PROJECT
PROJET VOLTA-HYCOS VOLTA-HYCOS PROJECT
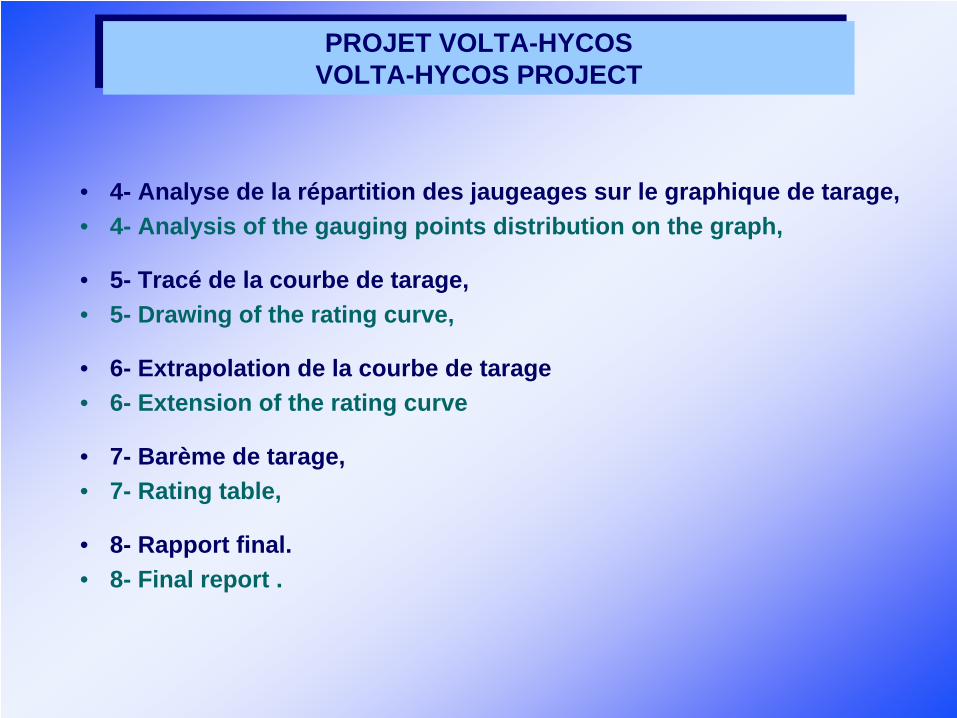
• 4- Analyse de la répartition des jaugeages sur le graphique de tarage, • 4- Analysis of the gauging points distribution on the graph,
• 5- Tracé de la courbe de tarage,• 5- Drawing of the rating curve,
• 6- Extrapolation de la courbe de tarage• 6- Extension of the rating curve
• 7- Barème de tarage, • 7- Rating table,
• 8- Rapport final.• 8- Final report .
PROJET VOLTA-HYCOS VOLTA-HYCOS PROJECT
PROJET VOLTA-HYCOS VOLTA-HYCOS PROJECT
• La définition du tarage d’une station hydrométrique est toujours la phase délicate du processus de calcul des débits et d’innombrables erreurs ont été faites parce qu’une ou plusieurs de ces étapes a été négligée.
• The calibration of a hydrometric station is always the tricky phase in the discharge calculation and a lot of errors rise if one or several of the steps are neglected.
PROJET VOLTA-HYCOS VOLTA-HYCOS PROJECT
PROJET VOLTA-HYCOS VOLTA-HYCOS PROJECT
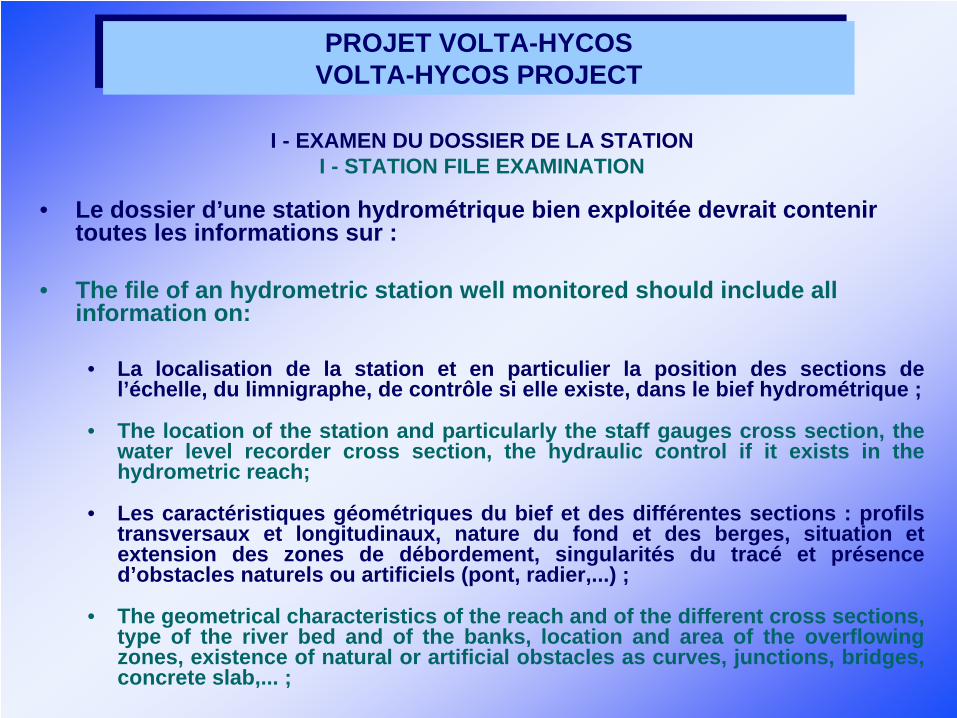
I - EXAMEN DU DOSSIER DE LA STATIONI - STATION FILE EXAMINATION
• Le dossier d’une station hydrométrique bien exploitée devrait contenir toutes les informations sur :
• The file of an hydrometric station well monitored should include all information on:
• La localisation de la station et en particulier la position des sections de l’échelle, du limnigraphe, de contrôle si elle existe, dans le bief hydrométrique ;
• The location of the station and particularly the staff gauges cross section, the water level recorder cross section, the hydraulic control if it exists in the hydrometric reach;
• Les caractéristiques géométriques du bief et des différentes sections : profils transversaux et longitudinaux, nature du fond et des berges, situation et extension des zones de débordement, singularités du tracé et présence d’obstacles naturels ou artificiels (pont, radier,...) ;
• The geometrical characteristics of the reach and of the different cross sections, type of the river bed and of the banks, location and area of the overflowing zones, existence of natural or artificial obstacles as curves, junctions, bridges, concrete slab,... ;
PROJET VOLTA-HYCOS VOLTA-HYCOS PROJECT
PROJET VOLTA-HYCOS VOLTA-HYCOS PROJECT
• Les équipements hydrométriques : échelle, limnigraphe, passerelle ou téléphérique de jaugeage,... ;
• The type of equipment: staff gauges, water level recorder, foot-bridge, cable-way,
• L’historique de la station : date de mise en service, destructions et réparations, événements rares (crues, arrêts de l’écoulement,...) ;
• History of the station: opening date, damages and repairs, scare events (floods, cease to flow);
• L’historique de la gestion, en particulier les changements d’observateurs et les rapports de visites des hydrométristes.
• The history of monitoring: observer changes, reports of the field teams.
L’examen du dossier doit conduire à une bonneconnaissance de la station .
The examination of the station file should allow a good knowledge of the station.
PROJET VOLTA-HYCOS VOLTA-HYCOS PROJECT
PROJET VOLTA-HYCOS VOLTA-HYCOS PROJECT
II - INVENTAIRE DES DONNÉESII – DATA INVENTORY
• Les données inventoriées sont la chronique limnimétrique et tous les jaugeages disponibles.
• This phase concerns the water level series and all the existing discharge measurements.
• La chronique limnimétrique est caractérisée par :• The water level time series is defined by:
• sa durée / the duration• son amplitude / the range of variation• sa continuité / the continuity• sa fidélité / the reliability• son homogénéité / the homogeneity
....
PROJET VOLTA-HYCOS VOLTA-HYCOS PROJECT
PROJET VOLTA-HYCOS VOLTA-HYCOS PROJECT
…. II - INVENTAIRE DES DONNÉESII – DATA INVENTORY
L’examen graphique des hauteurs et une bonne connaissance du dossier permet souvent de diviser la chronique limnimétrique en sous chroniques homogènes.A critical examination of the water level series and a good knowledge of the station file often allow splitting the single time series into homogeneous sub-series.
A chacune de ces sous chroniques correspond une courbe de tarage.Each time series related to a specific rating curve.
....
PROJET VOLTA-HYCOS VOLTA-HYCOS PROJECT
PROJET VOLTA-HYCOS VOLTA-HYCOS PROJECT
…. Les jaugeages / Gauging
• Un jaugeage est défini par un débit et la cote qui lui est associée.• A gauging is defined by a discharge value and an associated water
level (WL).
• La cote associée ha est celle qui a été lue sur l’échelle si la hauteur est restée stable pendant toute la durée de la mesure.
• The associated water level is the one read at the staff gauge, if the height remained steady during the duration of the gauging.
• Si ce n’est pas le cas, on utilise :• In a different case, we must use:
• soit la moyenne arithmétique des hauteurs observées au début et à la fin du jaugeage, si la variation est faible ;
• The arithmetic mean of the observed stages at the beginning and at the end of the gauging, if the stage variation is low;
PROJET VOLTA-HYCOS VOLTA-HYCOS PROJECT
PROJET VOLTA-HYCOS VOLTA-HYCOS PROJECT
…. Les jaugeages / Gauging
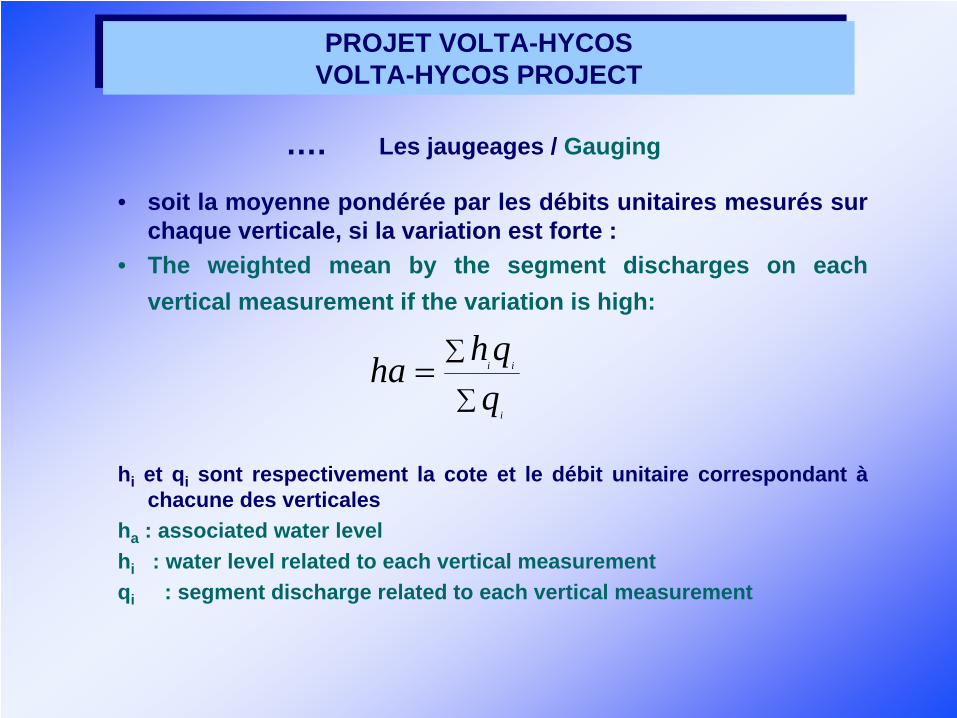
• soit la moyenne pondérée par les débits unitaires mesurés sur chaque verticale, si la variation est forte :
• The weighted mean by the segment discharges on each vertical measurement if the variation is high:
hi et qi sont respectivement la cote et le débit unitaire correspondant à chacune des verticales
ha : associated water levelhi : water level related to each vertical measurementqi : segment discharge related to each vertical measurement
∑
∑=
i
ii
qqhha
PROJET VOLTA-HYCOS VOLTA-HYCOS PROJECT
PROJET VOLTA-HYCOS VOLTA-HYCOS PROJECT
…. Les jaugeages / Gauging
TOUS les couples (ha, Q) doivent être répertoriés, y compris les jaugeages aux flotteurs, les estimations de débit basées sur des formules hydrauliques et les constats d’un arrêt de l’écoulement (qui ne correspondent pas à une cote nulle le plus souvent).
All the stage/discharge pairs have to be taken into account, including the discharge measurements by floats, the discharge estimation in using hydraulic formula as Manning’s formula, and the observation of cease to flow.
PROJET VOLTA-HYCOS VOLTA-HYCOS PROJECT
PROJET VOLTA-HYCOS VOLTA-HYCOS PROJECT
III - CRITIQUE DES JAUGEAGESIII - DISCHARGE MEASUREMENT ANALYSIS
Une critique des jaugeages, préalable à tout report sur le graphique de tarage, est indispensable.Each discharge measurement should be checked before being plotted on the graph.
• L’examen d’éléments tels que / the criticism of parameters as:• durée du jaugeage / the duration• nombre de verticales / number of verticals• technique et matériel utilisés / method & equipment used• section choisie / location of the gauging section• valeurs de la section mouillée, de la vitesse moyenne, de la largeur• values of the wetted area, mean velocity, width of the river, etc.
Sont souvent suffisant pour estimer la qualité de chaque jaugeage.Are generally good criteria to estimate the quality of a gauging.
PROJET VOLTA-HYCOS VOLTA-HYCOS PROJECT
PROJET VOLTA-HYCOS VOLTA-HYCOS PROJECT
III - CRITIQUE DES JAUGEAGESIII - DISCHARGE MEASUREMENT ANALYSIS
La précision d’un jaugeage dépend de celle de chacun de ces 2 termes :The accuracy of a gauging relates both to these 2 following terms:
• la hauteur associée est généralement déterminée avec une précision inférieure à 1 % (1 cm pour 1 m) ;
• The associated water level, generally known with a good precision (less than 1%);
• le débit est par contre rarement mesuré avec une précision inférieure à 5 % ; l’imprécision dépasse 10 % pour les jaugeages de très basses ou hautes eaux et peut atteindre 25, voire 50 % pour des mesurages partiels ou des estimations.
• the discharge, generally known with a precision of about 5% in the best cases, about 10% in case of very low water or high floods, and 25 to 50% in case of incomplete discharge measurements (floats or one and two point methods) or estimation by hydraulic formula.
PROJET VOLTA-HYCOS VOLTA-HYCOS PROJECT
PROJET VOLTA-HYCOS VOLTA-HYCOS PROJECT
…. III - CRITIQUE DES JAUGEAGESIII - DISCHARGE MEASUREMENT ANALYSIS
Lors de l’examen critique des jaugeages, deux listes sont établies :After this work, two lists should be established:• La première, chronologique, permet d’apprécier la répartition des
mesurages dans la période de la sous- chronique limnimétrique homogène ;• The first one, gauging time series, showing the measurement distribution for
each homogeneous sub-series;
• La seconde, classée suivant les hauteurs croissantes, montre la répartition des mesurages dans l’intervalle des hauteurs extrêmes ; elle permet aussi de rapprocher les jaugeages effectués à des hauteurs identiques ou voisines et de juger rapidement de la stabilité de la relation Q(h).
• the second one is an ascending order of magnitude of the water levels, and it shows the distribution of the measurements into the extreme water level range ; it allows also a quick comparison of discharges values for the same water level at different dates, and then to appreciate the stability of the stage/discharge relationship.
PROJET VOLTA-HYCOS VOLTA-HYCOS PROJECT
PROJET VOLTA-HYCOS VOLTA-HYCOS PROJECT
…. III - CRITIQUE DES JAUGEAGESIII - DISCHARGE MEASUREMENT ANALYSIS
Il est important de porter sur ces listes un maximum d’informations : date, cote associée, débit, section mouillée, vitesse moyenne, largeur, profondeur moyenne, mode opératoire, marque et numéro du moulinet utilisé, durée de la mesure, etc.These lists must contain a maximum of information as: date, water stage, discharge, wetted area, mean velocity, width, mean depth, method of measurement, trade mark and ID number of the current meter and propeller, duration of measurement, etc.
On y ajoutera une appréciation de la qualité.It is possible to add quality criteria on the measurement.
PROJET VOLTA-HYCOS VOLTA-HYCOS PROJECT
PROJET VOLTA-HYCOS VOLTA-HYCOS PROJECT
…. III - CRITIQUE DES JAUGEAGESIII - DISCHARGE MEASUREMENT ANALYSIS
RecommandationGénéralement cette critique est négligée. Ceci revient à considérer que tous les jaugeages ont a priori la même précision et donc le même poids sur le graphique de tarage, ce qui est inexact.
RecommandationIf this critical phase is neglected, this means that all the discharge measurements had the same precision and so the same weight on the graph, which is incorrect.
PROJET VOLTA-HYCOS VOLTA-HYCOS PROJECT
PROJET VOLTA-HYCOS VOLTA-HYCOS PROJECT
IV – ANALYSE DE LA DISTRIBUTION DES POINTSIV – ANALYSIS OF THE POINT DISTRIBUTION
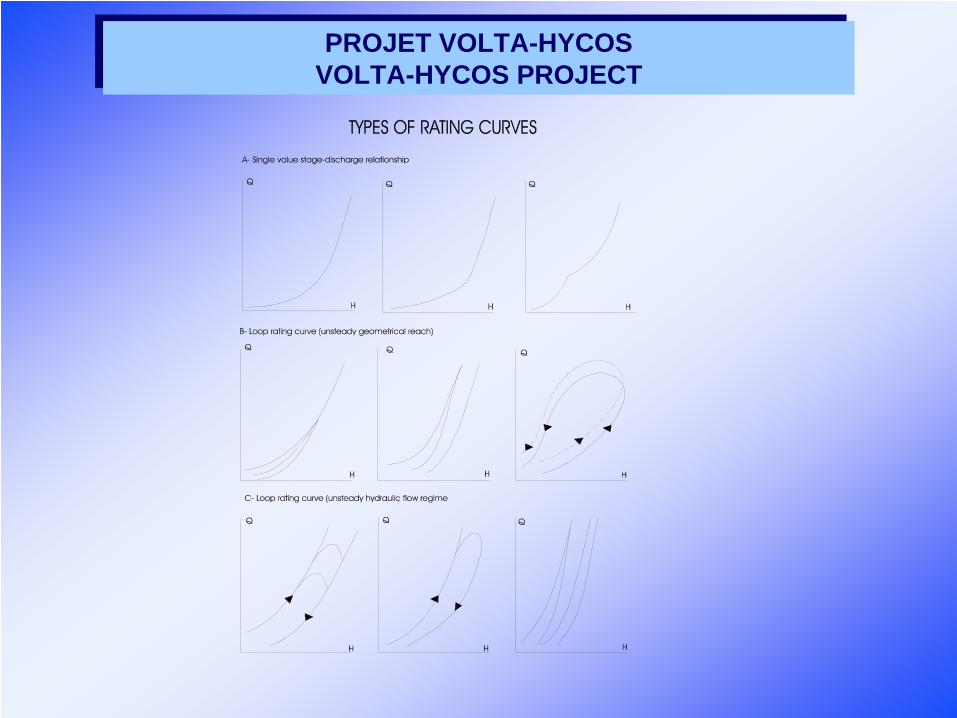
• Trois types principaux de courbes de tarage :• Three main types of rating curves:
• Les tarages univoques des stations à géométrie stable et contrôle hydraulique permanent,
• Single value stage-discharge relationship, for stations with a steady geometry reach and a steady hydraulic control;
• Les tarages non univoques des stations situées dans des biefs à géométrie variable +/- variable
• Loop rating curve (Hysteresis effect) for stations located in an unsteady geometrical reach of the river;
• Les tarages non univoques des stations situées dans des biefs à régime hydraulique non permanent.
• Loop rating curve for stations located in an unsteady hydraulic flow regime reach of the river.
PROJET VOLTA-HYCOS VOLTA-HYCOS PROJECT
PROJET VOLTA-HYCOS VOLTA-HYCOS PROJECT
PROJET VOLTA-HYCOS VOLTA-HYCOS PROJECT
PROJET VOLTA-HYCOS VOLTA-HYCOS PROJECT
IV – ANALYSE DE LA DISTRIBUTION DES POINTSIV – ANALYSIS OF THE POINT DISTRIBUTION
La courbe de tarage peut être tracée soit manuellement soit par un procédé automatique, pourvu que l’on respecte les règles suivantes :
• Coordonnées arithmétiques• Report de TOUS les jaugeages• Utilisation de symboles graphiques différents pour identifier
facilement les jaugeages appartenant à une même série (année par exemple) ou toute caractéristique permettant de guider l’analyse (décrue, sections de jaugeages différentes, même moulinet,…).
The rating curve graph can be drawn up by hand or by automatic process, respecting the following rules:
• Arithmetic coordinates• Plotting ALL the discharge measurements• Use of different graphic symbols to easily identify the measurements
belonging to a same time series (year for example) or any characteristic able to guide the analysis (flood or recession, different gauging cross sections, same current meter...).
PROJET VOLTA-HYCOS VOLTA-HYCOS PROJECT
PROJET VOLTA-HYCOS VOLTA-HYCOS PROJECT
IV – ANALYSE DE LA DISTRIBUTION DES POINTSIV – ANALYSIS OF THE POINT DISTRIBUTION
Examen de la répartition des points• Après report de tous les jaugeages, la phase d’analyse commence
réellement. • On recherche d’abord la raison des tendances systématiques, • Les points isolés sont analysés dans une seconde phase. • La non-univocité a pour cause l’instabilité géométrique du bief ou la
non-permanence du régime hydraulique ou encore les deux ensemble.
Point’s distribution check• The analysis phase really starts after plotting all points.
• First the systematic trends are checked, • The isolated points are checked in a second time. • A loop rating relationship is the effect of a high instability of the river
bed geometry or of an unsteady flow regime, or both of them.
PROJET VOLTA-HYCOS VOLTA-HYCOS PROJECT
PROJET VOLTA-HYCOS VOLTA-HYCOS PROJECT
IV – ANALYSE DE LA DISTRIBUTION DES POINTSIV – ANALYSIS OF THE POINT DISTRIBUTION
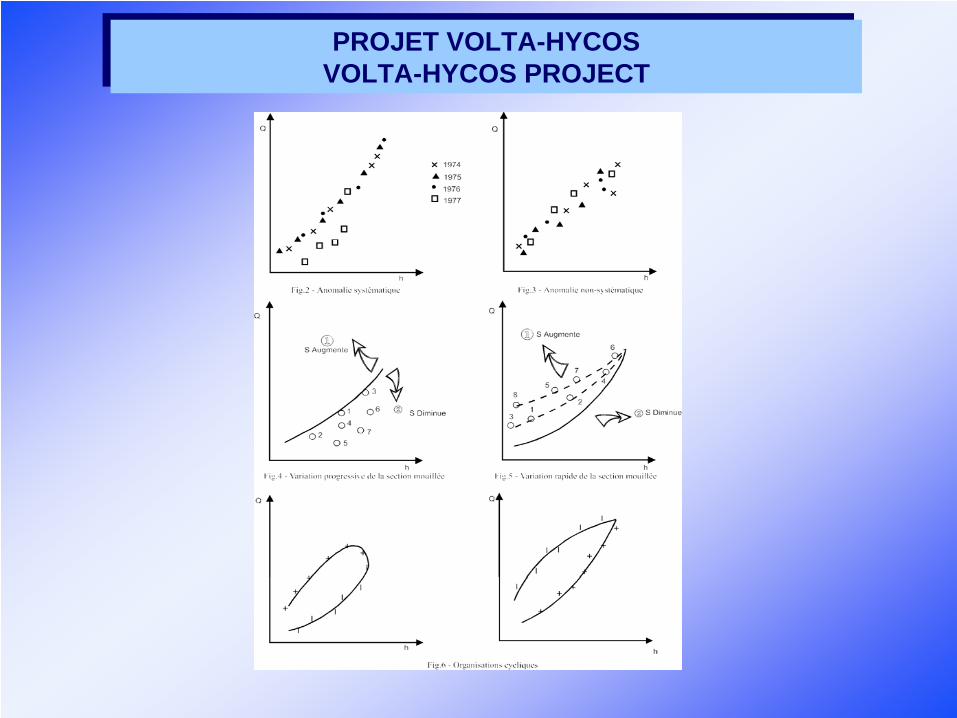
Instabilité géométrique• L’instabilité géométrique du bief hydrométrique peut être progressive,
envahissement par la végétation (figure 4), • Ou brutale, crues fortes ou interventions humaines (prélèvement de
graviers, construction de ponts...) (figure 5).
Geometric instability• The geometric instability of the channel can be graduated, e.g.. the
channel is filled by aquatic vegetation (figure 4),• Or it can be sudden in case of flash flood or of human effect e.g. bridge
construction (figure 5).
PROJET VOLTA-HYCOS VOLTA-HYCOS PROJECT
PROJET VOLTA-HYCOS VOLTA-HYCOS PROJECT
PROJET VOLTA-HYCOS VOLTA-HYCOS PROJECT
PROJET VOLTA-HYCOS VOLTA-HYCOS PROJECT
IV – ANALYSE DE LA DISTRIBUTION DES POINTSIV – ANALYSIS OF THE POINT DISTRIBUTION
Instabilité hydrauliqueLorsque la pente superficielle n’est pas la même en crue qu’en décrue pour une cote donnée, une organisation cyclique des points, en forme de « raquette », apparaît généralement de manière assez nette (figure 6).
Des méthodes spécifiques doivent être alors utilisées. La différence entre les débits en crue et en décrue peut atteindre 30 %.
Hydraulic instabilityIf the water surface slope is not the same during the flood and the recession time for a given stage, the gauging points are in a “loop shape” distribution on the graph.
Specific methods have to be used in this case; the deviations between the discharges during the rising limb of the hydrogram or the recession limb for a given stage can reach 30%.
PROJET VOLTA-HYCOS VOLTA-HYCOS PROJECT
PROJET VOLTA-HYCOS VOLTA-HYCOS PROJECT
IV – ANALYSE DE LA DISTRIBUTION DES POINTSIV – ANALYSIS OF THE POINT’S DISTRIBUTION
ConclusionLa phase d’analyse de la répartition des points de jaugeage sur le graphique de tarage est la plus importante. Si l’interprétation est exacte, les étapes suivantes - tracé de la courbe, extrapolation - ne présenteront plus aucune difficulté. L’étape d’analyse nécessite une bonne connaissance des lois de l’hydraulique.
ConclusionThe analysis of the point’s distribution on the graph is the most important. If the interpretation is right, the next steps – drawing the curve and curveextension will be very easy. The analysis phase required a good knowledge of hydraulics laws.
PROJET VOLTA-HYCOS VOLTA-HYCOS PROJECT
PROJET VOLTA-HYCOS VOLTA-HYCOS PROJECT
V – TRACE DE LA COURBEV – RATING CURVE DRAWING UP
Le tracé de la courbe de tarage est fait sur un graphique à grande échelle, en coordonnées arithmétiques. Il doit être :
• exact, c’est à dire qu’il respecte les conclusions de l’analyse effectuée antérieurement ;
• précis, c’est à dire qu’il permet de lire les débits avec une marge d’erreur minimale.
The drawing up must be done on a large scale graph, it has to be:• Exact, it means that it is in accordance with the analysis conclusion;• Accurate, it means that all the discharge values would be read with a
minimum of error.
PROJET VOLTA-HYCOS VOLTA-HYCOS PROJECT
PROJET VOLTA-HYCOS VOLTA-HYCOS PROJECT
PROJET VOLTA-HYCOS VOLTA-HYCOS PROJECT
PROJET VOLTA-HYCOS VOLTA-HYCOS PROJECT
V – TRACE DE LA COURBEV – RATING CURVE DRAWING UP
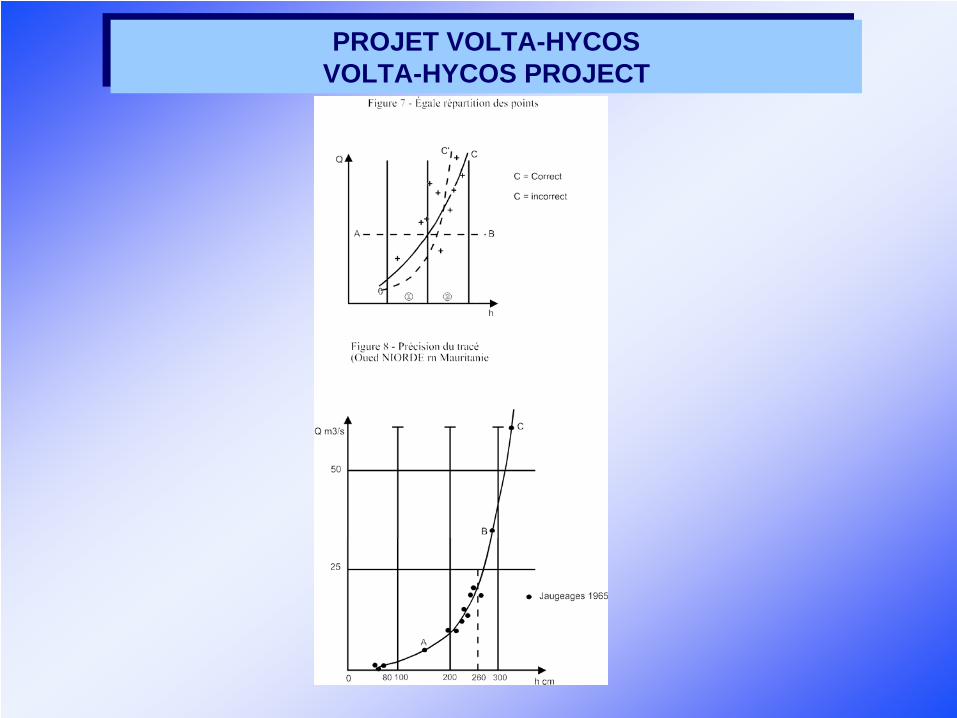
Deux règles doivent être respectées lors du tracé de la courbe :• l’égale répartition des points, de part et d’autre de la courbe ; de telle
manière que toutes les irrégularités du tracé soient prises en compte (figure 7) ;
• la minimisation des écarts à la courbe ; les écarts sont pris dans le sens vertical, c’est à dire suivant les débits.
La précision d’un tracé basé sur quelques points isolés n’est pas bonne.
Two rules have to be applied:• The equal point distribution on both sides of the curve in such a way that
all the unevenness of the drawing are taken into account (Fig.7); • The least deviation to the curve; the deviations are taken on the discharge
axe.
A drawing based just on few isolated points will not be very accurate.
PROJET VOLTA-HYCOS VOLTA-HYCOS PROJECT
PROJET VOLTA-HYCOS VOLTA-HYCOS PROJECT
VI– EXTRAPOLATION DE LA COURBE DE TARAGEVI – RATING CURVE EXTENSION
La relation Q/h doit être définie dans la totalité de l’intervalle de variation des hauteurs d’une chronique limnimétrique homogène. Cet intervalle, limité par les hauteurs minimale et maximale lues sur l’échelle, est désigné par intervalle de définition du tarage.En général, le nombre de jaugeages est insuffisant, ou bien la répartition est mauvaise, et la courbe de tarage est incomplète : elle doit donc être extrapolée à ses extrémités.
The stage/discharge relationship has to be defined for the totality of the water level variation range. This range of variation, defined by the minimum and the maximum water stage read on the staff gauge is called “defined interval of the calibration”.
Generally, the discharge measurements are not enough numerous or the distribution is not good, and an extension of the rating curve has to be done. The methods are not the same for low water level extension and for high water level extension.
PROJET VOLTA-HYCOS VOLTA-HYCOS PROJECT
PROJET VOLTA-HYCOS VOLTA-HYCOS PROJECT
VI– EXTRAPOLATION DE LA COURBE DE TARAGEVI – RATING CURVE EXTENSION
Section de référenceDans un cours d’eau naturel, la relation Q/h n’est pas spécifique de tout un bief mais seulement d’une section unique de ce bief : celle de l’échelle limnimétrique où sont observées les hauteurs. En conséquence, tous les paramètres géométriques et dynamiques se rapportent à la section de l’échelle.
Reference cross sectionIn a natural river, the stage/discharge relationship isn’t related to the totality of a reach, but only to the staff gauge cross section where the water levels are read. So, all the geometric and dynamic parameters relate to this cross section.
PROJET VOLTA-HYCOS VOLTA-HYCOS PROJECT
PROJET VOLTA-HYCOS VOLTA-HYCOS PROJECT
VI– EXTRAPOLATION DE LA COURBE DE TARAGE VI – RATING CURVE EXTENSION
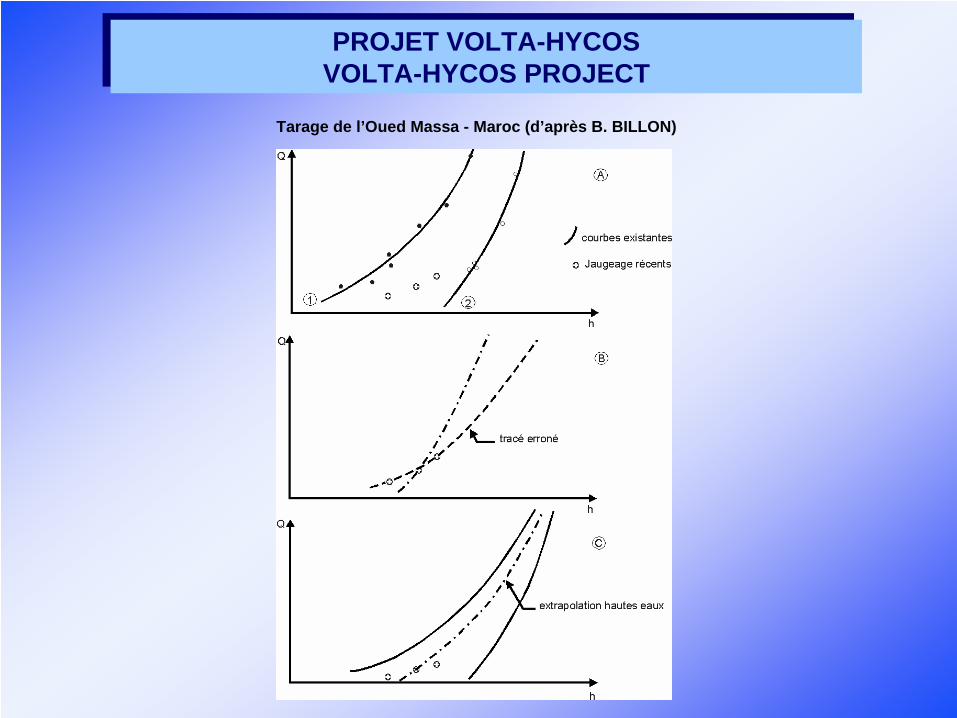
Tracé et extrapolationDans certaines stations à forte instabilité, le nombre de jaugeages permet seulement de définir quelques tronçons isolés de chacune des courbes. Il est essentiel dans ce cas, de s’appuyer sur l’allure générale de toutes les courbes, la seule prise en compte des jaugeages réalisés dans la période de validité, pouvant conduire à une erreur de tracé (fig. 9).
Drawing & extensionFor stations with high geometric instability, the small number of gauging allows only the definition of some segments of the rating curve. In this case it’s very convenient to use the previous rating curves shape to avoid some major errors in the drawing up of the new one
PROJET VOLTA-HYCOS VOLTA-HYCOS PROJECT
PROJET VOLTA-HYCOS VOLTA-HYCOS PROJECT
Tarage de l’Oued Massa - Maroc (d’après B. BILLON)
PROJET VOLTA-HYCOS VOLTA-HYCOS PROJECT
PROJET VOLTA-HYCOS VOLTA-HYCOS PROJECT
VI– EXTRAPOLATION DE LA COURBE DE TARAGE VI – RATING CURVE EXTENSION
RemarquesExtrapoler une courbe, c’est d’abord s’interroger sur la continuité des conditions d’écoulement : comment varient la surface mouillée, la vitesse moyenne ou la pente superficielle lorsque le niveau s’élève au-dessus de la hauteur maximale jaugée ? Les méthodes d’extrapolation ne s’appliquent qu’aux stations à profil transversal stable, du moins dans la période de validité du tarage.
RemarksExtend a rating curve is first answer to some questions about the flow conditions: how vary the wetted cross section, the mean velocity, the water surface slope when the water level increase over the maximum measured water level? The extension methods are applicable only to steady cross sections, at least during the validity period of the calibration.
PROJET VOLTA-HYCOS VOLTA-HYCOS PROJECT
PROJET VOLTA-HYCOS VOLTA-HYCOS PROJECT
VI– EXTRAPOLATION DE LA COURBE DE TARAGE VI – RATING CURVE EXTENSION
Extrapolation logarithmique / Logarithmic methodMéthode universellement utilisée, n’est applicable que dans les sections de profil transversal très régulier.This method is the most applied, but it can be applied only in the very regular cross sections.
Principe de la méthode / PrincipleSi la courbe de tarage, est de type exponentiel, elle admet pour expression mathématique la formule :
Q = a (h - ho)n avech = hauteur à l’échelle pour le débit Q ;
ho = hauteur à l’échelle pour le débit Qo ; a et n sont des constantes si le lit est très stable et le profil en travers régulier.a & n are constant if the river bed is steady and the cross section regular
PROJET VOLTA-HYCOS VOLTA-HYCOS PROJECT
PROJET VOLTA-HYCOS VOLTA-HYCOS PROJECT
VI– EXTRAPOLATION DE LA COURBE DE TARAGE VI – RATING CURVE EXTENSION
Extrapolation logarithmique / Logarithmic method
Le procédé le plus simple, pour vérifier qu’il en est ainsi dans la section considérée, consiste à reporter les jaugeages sur un papier à échelles logarithmiques et à constater l’alignement des points.Si l’alignement des points vers le haut est correct, on peut prolonger la droite jusqu’à la cote maximale observée.
The easier way to carry out this method is to plot all the gauging on a logarithmic coordinates graph, and the points should be aligned.
If the points are well aligned in the upper part, it is possible to extend the line to the maximum observed water level.
PROJET VOLTA-HYCOS VOLTA-HYCOS PROJECT
PROJET VOLTA-HYCOS VOLTA-HYCOS PROJECT
VI– EXTRAPOLATION DE LA COURBE DE TARAGEVI – RATING CURVE EXTENSION
Extrapolation logarithmique / Logarithmic methodContraintes d’utilisation
• relation Q/h univoque, de type exponentiel;• jaugeages existants jusqu’à une cote suffisamment élevée ;• profil en travers sans discontinuité de forme ;• contrôle aval permanent entre moyennes et hautes eaux.
Constraints:• Single value stage/discharge relationship of exponential type, • Numerous gauging up to a sufficient water level, • Regular shape cross section in the part of the water level extension,• Steady hydraulic control from medium to high water levels.
PROJET VOLTA-HYCOS VOLTA-HYCOS PROJECT
PROJET VOLTA-HYCOS VOLTA-HYCOS PROJECT
VI– EXTRAPOLATION DE LA COURBE DE TARAGEVI – RATING CURVE EXTENSION
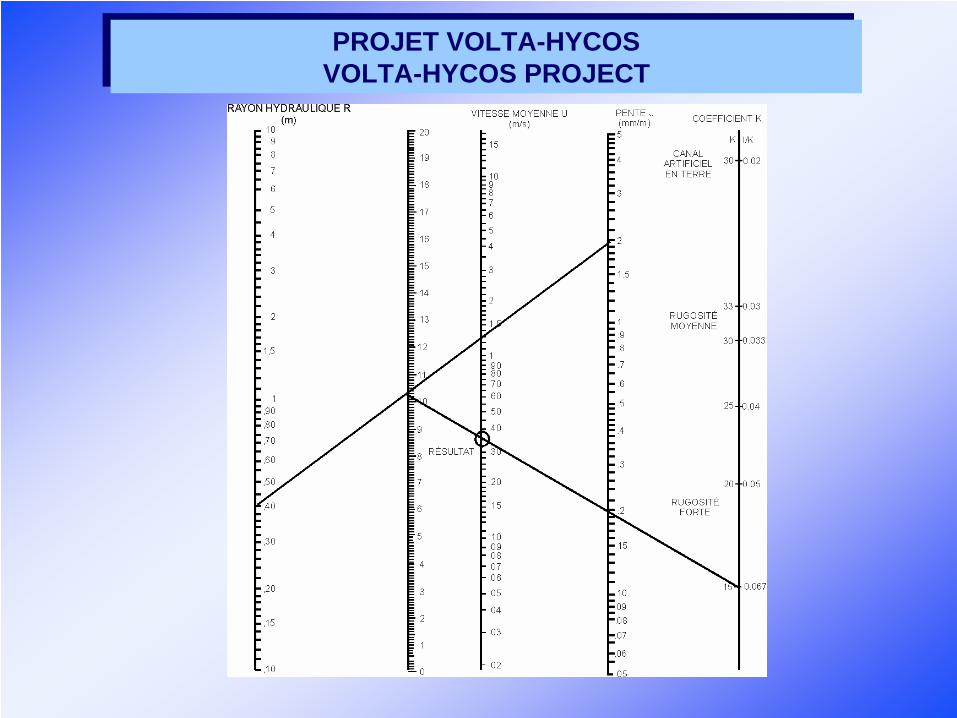
Méthode de Stevens / Stevens method
Cette méthode utilise la formule de CHEZY et n’est donc applicable qu’aux écoulements pseudo-uniformes.
This method applied the Chezy’s formula or the Manning’s formula, so it can be applied only for the uniform flow.
Principe de la méthodeSTEVENS écrit la formule de CHEZY sous la forme Q/SR 1/2 = CJ ½
Où : SR 1/2 est le facteur géométrique et CJ1/2 le facteur de pente.
PrincipleSTEVENS wrote the Chezy’s formula as: Q/A*R1/2 = C*S1/2
Where : A*R1/2 is a geometric factor & C*S1/2 is a slope factor
PROJET VOLTA-HYCOS VOLTA-HYCOS PROJECT
PROJET VOLTA-HYCOS VOLTA-HYCOS PROJECT
VI– EXTRAPOLATION DE LA COURBE DE TARAGEVI – RATING CURVE EXTENSION
Méthode de Stevens / Stevens method
Dans les limites d’application de la formule de CHEZY, les deux termes de l’équation varient très peu.Q/SR1/2 = constante signifie que la fonction Q = f (SR1/2) est représentée, dans un système d’axes rectangulaires, par une droite qui passe par l’origine.
La formule de CHEZY peut être remplacée par la formule de STRICKLER :Q/SR2/3 = KJ1/2 = constante
In the limits of use of the Chezy’s formula, the two terms of the above equation don’t varied a lot.Q/A*R1/2 = constant means that the function Q = f(A*R1/2) is a line starting from the origin in a rectangular coordinates graph.
The Chezy’s formula can be replaced by the Manning’s formula:Q/A*R2/3 = K*S1/2 = constant
PROJET VOLTA-HYCOS VOLTA-HYCOS PROJECT
PROJET VOLTA-HYCOS VOLTA-HYCOS PROJECT
VI– EXTRAPOLATION DE LA COURBE DE TARAGEVI – RATING CURVE EXTENSION
Méthode de Stevens / Stevens method
Contraintes d’utilisationOutre la stricte limitation liée à la nécessaire pseudo-uniformité de l’écoulement, la méthode de STEVENS n’est applicable que :
• si le profil est stable : SR1/2 ne doit pas varier entre crue et décrue ;• si l’on dispose d’un nombre suffisant de jaugeages correctement alignés.
Constraints
Besides the uniform flow conditions, the STEVENS method is applied only if :• The cross section is stable: A*R1/2 cannot vary during the flood or the
recession phase• Numerous gauging are available in a correct line.
PROJET VOLTA-HYCOS VOLTA-HYCOS PROJECT
PROJET VOLTA-HYCOS VOLTA-HYCOS PROJECT
VI– EXTRAPOLATION DE LA COURBE DE TARAGEVI – RATING CURVE EXTENSION
Méthode surface mouillée et vitesse moyenne / Slope - area methodCette méthode est applicable aux sections de forme irrégulière.
Principe de la méthodeL’extrapolation de la courbe Q(h) est faite en considérant séparément les deux composantes du débit :
• la surface mouillée S, de dimension L2 (longueur au carré) ;• la vitesse moyenne d’écoulement U, de dimension LT-1,.
This method is applicable to the irregular shape cross sections.Principle
The extension of the rating curve is done in taking into account separately the two terms of the discharge:
• The wetted area A, which is known with a good precision if a cross section levelling is available
• The mean velocity for which the increase related to the water level is lower than the one of the discharge.
PROJET VOLTA-HYCOS VOLTA-HYCOS PROJECT
PROJET VOLTA-HYCOS VOLTA-HYCOS PROJECT
VI– EXTRAPOLATION DE LA COURBE DE TARAGEVI – RATING CURVE EXTENSION
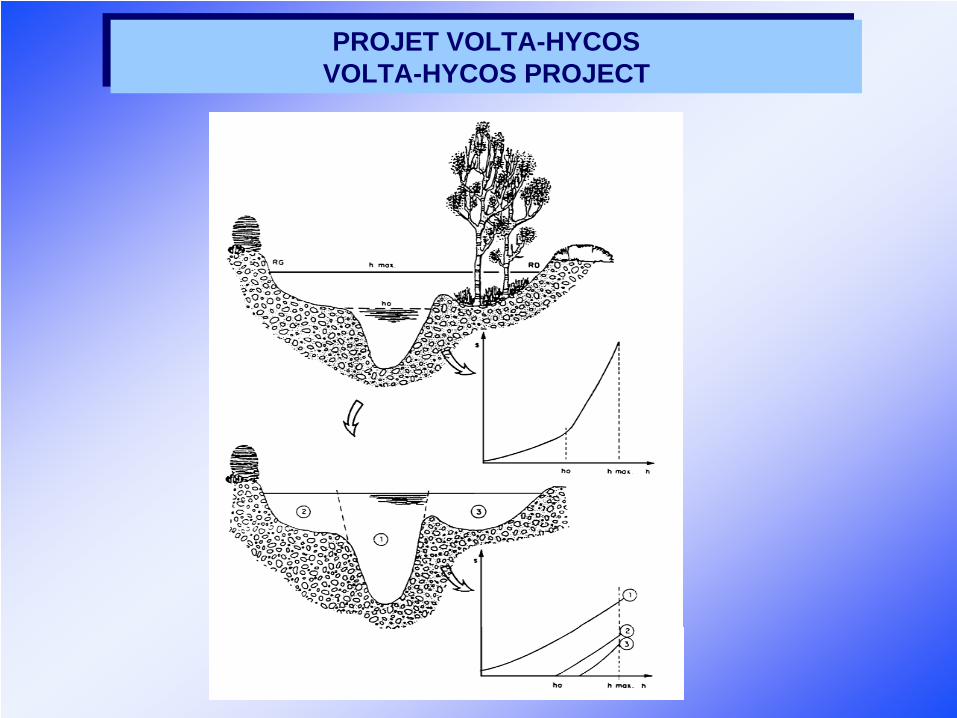
Méthode surface mouillée et vitesse moyenne / Slope - area methodL’extrapolation de la courbe se résume donc, dans cette méthode, à celle de la courbe U(h). La section transversale considérée est la section de l’échelle.Pour les sections irrégulières il est nécessaire de décomposer la section transversale en sous-sections, homogènes quant aux conditions d’écoulement. L’extrapolation de la courbe U(h) peut être facilitée par l’application de la formule de STRICKLER pour le calcul de la vitesse maximale.
The extension of the rating curve is limited in this method to the extension of the stage/velocity curve.For the irregular shape cross sections, the cross section has to be broken down in homogeneous sub-cross sections. For each of them a stage/area curve and a stage/velocity curve have to be drawn.The extension of the stage/velocity curve can be easier by the use of the Manning’s formula for the calculation of the maximum velocity.
PROJET VOLTA-HYCOS VOLTA-HYCOS PROJECT
PROJET VOLTA-HYCOS VOLTA-HYCOS PROJECT
PROJET VOLTA-HYCOS VOLTA-HYCOS PROJECT
PROJET VOLTA-HYCOS VOLTA-HYCOS PROJECT
PROJET VOLTA-HYCOS VOLTA-HYCOS PROJECT
PROJET VOLTA-HYCOS VOLTA-HYCOS PROJECT
VI– EXTRAPOLATION DE LA COURBE DE TARAGEVI – RATING CURVE EXTENSION
Basses eaux / Low water levels
L’extrapolation de la courbe de tarage « vers le bas », est une opération toujours difficile, pour deux raisons, qui sont les suivantes :
• la très mauvaise sensibilité des sections naturelles quand les niveaux sont faibles ;
• la très grande instabilité des tarages de basses eaux, influencés par toute variation du profil, aussi minime soit elle.
The extension of the rating curve for the low water levels is always quit difficult for at least two reasons:
• the very bad sensibility of the natural cross sections for low discharges• the high instability of the calibration for low water levels, because of the
high sensibility to any change in the geometry of the section as small as it could be.
PROJET VOLTA-HYCOS VOLTA-HYCOS PROJECT
PROJET VOLTA-HYCOS VOLTA-HYCOS PROJECT
VI– EXTRAPOLATION DE LA COURBE DE TARAGEVI – RATING CURVE EXTENSION
Basses eaux / Low water levelsA ces deux inconvénients, s’ajoute le plus souvent une nette insuffisance des jaugeages :
• en quantité, parce que le mesurage des faibles débits est considéré par les hydrométristes comme un travail routinier et peu important, voire inutile ;
• en qualité, parce qu’en fait les conditions de jaugeage sont très mauvaises : sections mouillées importantes à géométrie irrégulière, vitesses d’écoulements très faibles.
At these two disadvantages, will be add very often a lack of measurements:
• in quantity because the measurement of low water levels is often neglected by the hydrologists,
• in quality because the measurement conditions are quit difficult, wide cross sections with changes in the geometry, low velocities, etc.
PROJET VOLTA-HYCOS VOLTA-HYCOS PROJECT
PROJET VOLTA-HYCOS VOLTA-HYCOS PROJECT
VI– EXTRAPOLATION DE LA COURBE DE TARAGEVI – RATING CURVE EXTENSION
Basses eaux / Low water levels• Cas des cours d’eau non pérennes
• Le débit s’annule au moins une fois dans la période de validité du tarage : la hauteur ho au moment de l’arrêt de l’écoulement, associée au débit nul, est l’abscisse du point-origine de la courbe de tarage.
• Dans de nombreuses stations la hauteur ho est différente de zéro
• Case of non perennial flow• If during the validity period of the rating curve calibration the discharge
comes equal to 0, the stage H0 associated to this null discharge should be the origin point of the rating curve.
• It has to be noted that the value of H0 is very often different from 0.• Knowing the ending point of the curve, the extension below the last
gauging point is generally easy, in accordance with the shape (curvature) to avoid any discontinuity.
PROJET VOLTA-HYCOS VOLTA-HYCOS PROJECT
PROJET VOLTA-HYCOS VOLTA-HYCOS PROJECT
VI– EXTRAPOLATION DE LA COURBE DE TARAGEVI – RATING CURVE EXTENSION
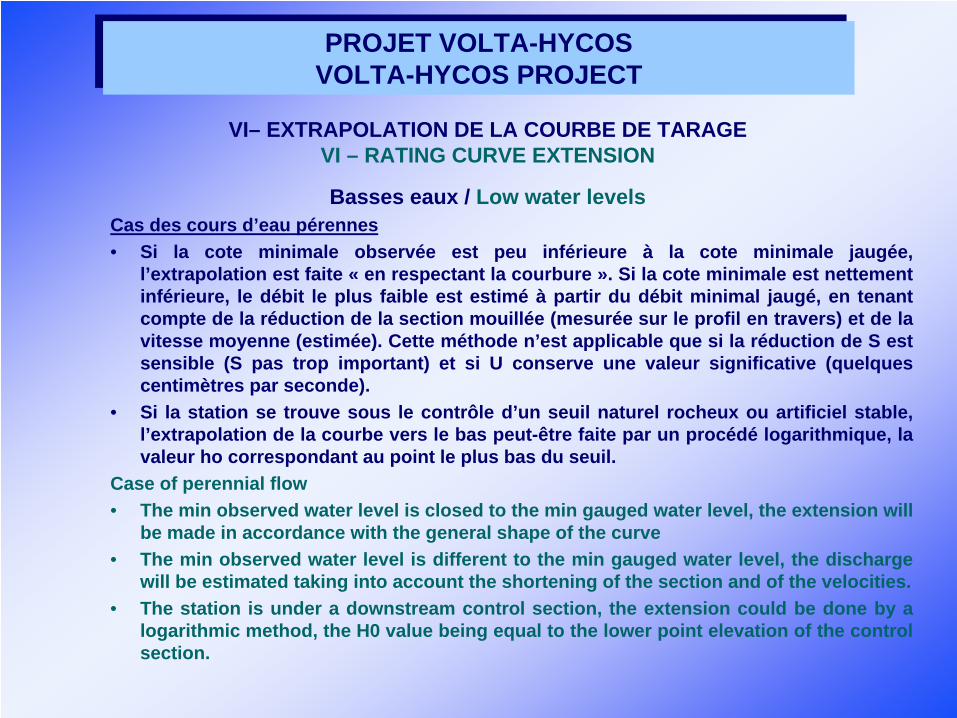
Basses eaux / Low water levelsCas des cours d’eau pérennes• Si la cote minimale observée est peu inférieure à la cote minimale jaugée,
l’extrapolation est faite « en respectant la courbure ». Si la cote minimale est nettement inférieure, le débit le plus faible est estimé à partir du débit minimal jaugé, en tenant compte de la réduction de la section mouillée (mesurée sur le profil en travers) et de la vitesse moyenne (estimée). Cette méthode n’est applicable que si la réduction de S est sensible (S pas trop important) et si U conserve une valeur significative (quelques centimètres par seconde).
• Si la station se trouve sous le contrôle d’un seuil naturel rocheux ou artificiel stable, l’extrapolation de la courbe vers le bas peut-être faite par un procédé logarithmique, la valeur ho correspondant au point le plus bas du seuil.
Case of perennial flow• The min observed water level is closed to the min gauged water level, the extension will
be made in accordance with the general shape of the curve • The min observed water level is different to the min gauged water level, the discharge
will be estimated taking into account the shortening of the section and of the velocities. • The station is under a downstream control section, the extension could be done by a
logarithmic method, the H0 value being equal to the lower point elevation of the control section.
PROJET VOLTA-HYCOS VOLTA-HYCOS PROJECT
PROJET VOLTA-HYCOS VOLTA-HYCOS PROJECT
VI– EXTRAPOLATION DE LA COURBE DE TARAGE VI – RATING CURVE EXTENSION
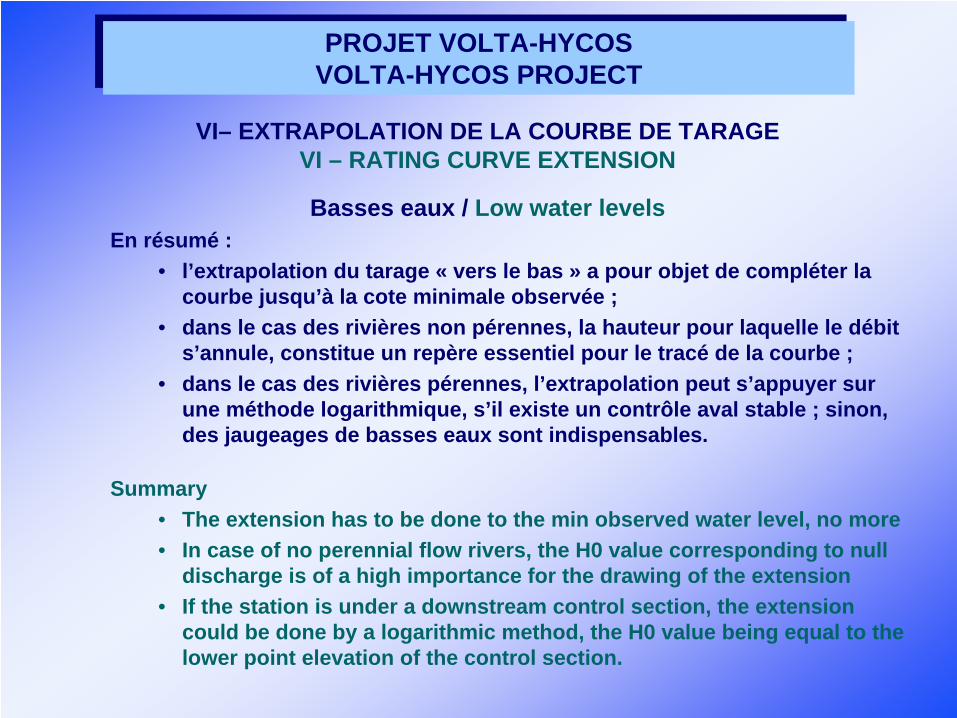
Basses eaux / Low water levelsEn résumé :
• l’extrapolation du tarage « vers le bas » a pour objet de compléter la courbe jusqu’à la cote minimale observée ;
• dans le cas des rivières non pérennes, la hauteur pour laquelle le débit s’annule, constitue un repère essentiel pour le tracé de la courbe ;
• dans le cas des rivières pérennes, l’extrapolation peut s’appuyer sur une méthode logarithmique, s’il existe un contrôle aval stable ; sinon, des jaugeages de basses eaux sont indispensables.
Summary• The extension has to be done to the min observed water level, no more• In case of no perennial flow rivers, the H0 value corresponding to null
discharge is of a high importance for the drawing of the extension• If the station is under a downstream control section, the extension
could be done by a logarithmic method, the H0 value being equal to the lower point elevation of the control section.
PROJET VOLTA-HYCOS VOLTA-HYCOS PROJECT
PROJET VOLTA-HYCOS VOLTA-HYCOS PROJECT
TRACE DE LA COURBE DE TARAGERATING CURVE CALIBRATION
C’EST FINI !! THAT’S ALL FOLK’S!!