Embed Size (px)
Citation preview
8/3/2019 Siddhartha Final 2007
http://slidepdf.com/reader/full/siddhartha-final-2007 1/29
Automobile (Four Wheeler) Subject: - Statistics
H.L. Institute of
Commerce
Section: - 2nd
Group: - 201-210
8/3/2019 Siddhartha Final 2007
http://slidepdf.com/reader/full/siddhartha-final-2007 2/29
2
Automobile (Four Wheeler)
Subject: - Statistics
H.L. Institute of Commerce
Section: - 2nd
Group: - 201-210
Name Roll No.
Siddhartha Mistry 201
Nisarg Modh 202
Sejal Modhwadia 203
Aesha Modi 204
Darshil Modi 205
Deep Modi 206
Naiya Modi 207
Nilesh Modi 208
Surbhi Modi 209
Darshil Mody 210
8/3/2019 Siddhartha Final 2007
http://slidepdf.com/reader/full/siddhartha-final-2007 3/29
3
Acknowledgement
We owe a great many thanks to a great many people who helped and supported
me during the Making of this Project.
Our deepest thanks to Mr.Dinesh Barot, the Guide of the project for guiding and
correcting various documents of mine with attention and care. He has taken pain
to go through the project and make necessary correction as and when needed.
We would also thank our Institution and our faculty members without whom this
project would have been a distant reality. We also extend our heartfelt thanks to
our family and well wishers.
And Last but not the least to Mr. Bill Gates for making Microsoft Office starting
from word to excel and spelling checks and Find and replace, without which this
project report would have taken days to complete.
Thanking You,
Group: 201-210.
8/3/2019 Siddhartha Final 2007
http://slidepdf.com/reader/full/siddhartha-final-2007 4/29
4
Index:
Sr.
No.
Particulars Page No.
1. Introduction 5
2. Scope of the sector in India 6
3 Automobile Industry’s Contribution to Emplyment
Generation and India’s GDP
7
4. Growth of the Sector in India 8
5 Acknowledgement 3
6 Major Player in Sector 9
7 Market Share 9
8 Maruti Suzuki India Limited 11
8/3/2019 Siddhartha Final 2007
http://slidepdf.com/reader/full/siddhartha-final-2007 5/29
5
9 TATA Motors 11
10 Ashok Leyland 12
11 Mahindra& Mahindra 13
12 Analysis Of Sales 14
13 Analysis of Profit 15
14 Correlation Regression 16
15 Conclusion 27
8/3/2019 Siddhartha Final 2007
http://slidepdf.com/reader/full/siddhartha-final-2007 6/29
6
Introduction:-
Only three decades back, Indian car buyers had just two models to choose from. Both were
local reproductions of European models that had disappeared from the western markets soon
after World War II. Irrespective of market demand, manufacturing capacity was restricted
through government licenses, and buyers had to wait several months after paying cash up
front to get delivery. Imports were discouraged through very high duties, which remain high
even now, and foreign-made cars were prized possessions of only the most affluent.
The early 1900s saw many automobile manufacturing companies coming into existence in
a number of European countries and the United States. The first mass produced automobile
in the United States was the curved-dash Oldsmobile. It was a three-horsepower machine and
sold 5,000 units by 1904. The economics of the US car market was disrupted by the arrival of
Henry Ford and his Model T car. The Model T was the world's first mass produced vehicle-
a million units were sold by 1920- a space of 10 years.
The introduction of a tiny hatchback in 1983 by Maruti Suzuki, jointly promoted by the
Indian government and Japanese small car manufacturer Suzuki, was in many ways a
defining moment in the development of the Indian automobile industry. Though very small,
the Maruti 800, as it was called, was modern and much more reliable than its competitors.
After a relatively slow start, the car endeared itself to the growing Indian middle class andremained the best seller for the next two decades. Until recently, it was the most
inexpensively produced car in the world, and today remains popular in the semi-urban and
rural markets of India.
More significantly, Maruti Suzuki introduced more efficient manufacturing practices and
developed a number of local component suppliers. This industrial eco-system with vastly
improved capabilities eased the entry of several foreign car manufacturers, after industrial
licensing was abandoned in the 1990s. The growth of component suppliers also enabled
select domestic automobile firms, with no prior experience in car manufacturing, to add
passenger vehicles to their product range. Though several foreign manufacturers have
struggled to expand their foothold, the growing purchasing power of the middle class
continues to attract new entrants to the Indian passenger car markers.
8/3/2019 Siddhartha Final 2007
http://slidepdf.com/reader/full/siddhartha-final-2007 7/29
7
Scope of the sector in India:-
The Indian automobile industry is going through a phase of rapid change and high growth.
With new projects coming up on a regular basis, the industry is undergoing technological
change. The major players are expanding their plants and focusing on mass customization, mass
production, etc.
Indian car industry has undergone tremendous change in recent times in terms of innovative
designs, concepts and technology. The efforts of the car manufacturers in India also started
reflecting in the sales figures. In 2009, the festive season brought cheers in the car market for
major players like Honda Siel Cars India (HSCI), General Motors India (GMI) and Hyundai
India boosting their sales records. The trend is still ticking in the same spirit and the year 2010 is
also expected to yield good results for the automobile industry in India with touching 10 to 12%
growth.
Early 2000 however saw globalization of Indian auto industry. Several policy changes were
introduced with focus on boosting the auto exports. A Core Group on Automotive Research and
Development (CAR) was established in 2003 for encouraging R&D activities. Foreign
manufactures started looking at India for sourcing auto components. The buyers started ruling
the market due to the availability of choices in the form of models, price points and brands. A
vibrant economy meant an increase in the GDP and per capita income. These factors turned out
to be significant contributors in pushing up the domestic demand. The vast geographic spread of
India attracted foreign investments. The marquee brands from all over the world started courting
Indian consumers aggressively. The mature markets in the developed countries paled in
comparison to the sheer numbers and the growth phase of the Indian auto industry.
8/3/2019 Siddhartha Final 2007
http://slidepdf.com/reader/full/siddhartha-final-2007 8/29
8
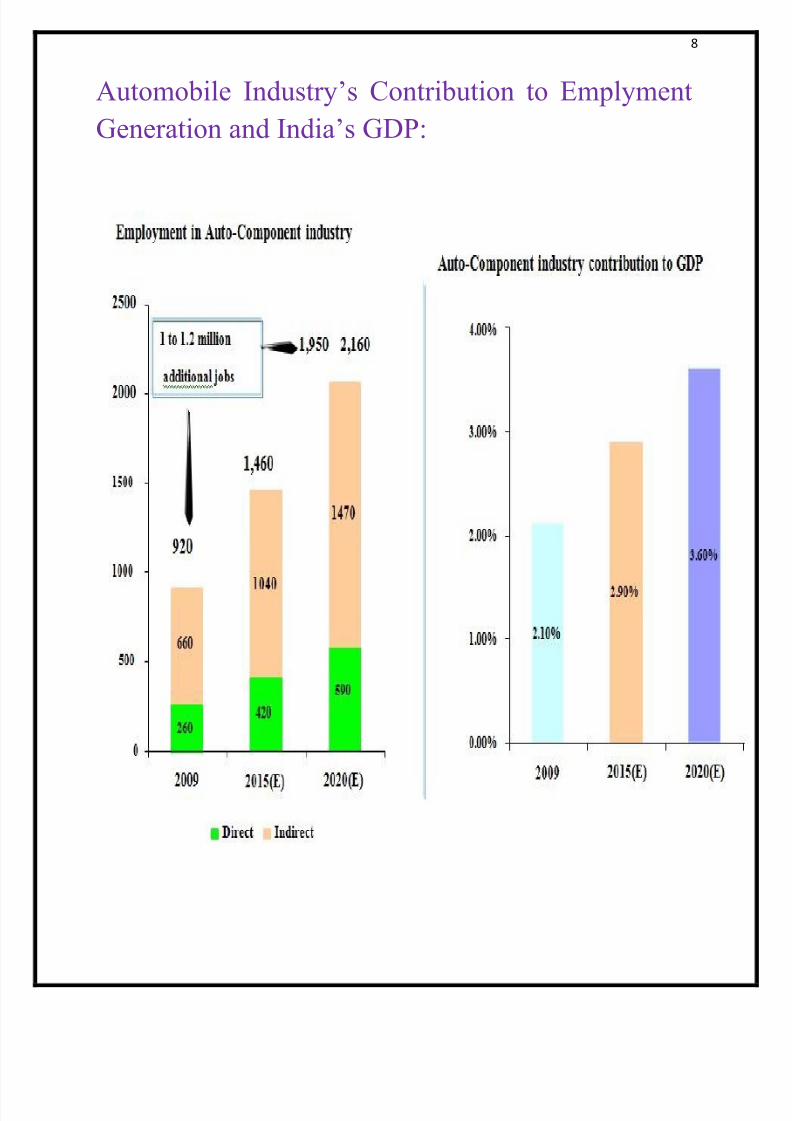
Automobile Industry’s Contribution to Emplyment
Generation and India’s GDP:
8/3/2019 Siddhartha Final 2007
http://slidepdf.com/reader/full/siddhartha-final-2007 9/29
9
Growth of the Sector in India.
At present the industry is enjoying a growth rate of 14-17% per annum, with
domestic sales growth at 12.8%. The growth rate is predicted to double by 2015.
As it is seen, the total sales of passenger vehicles - cars, utility vehicles and multi-
utility vehicles - in the year 2005 reached the mark of 1.06 million. The current
growth rate indicates that by 2012 India will overtake Germany and Japan in sales
volumes.
Financing schemes have become an important factor in the growth of automobile
sales. More and more financial schemes are coming up with easy instalment plans
to lure the customers.
Apart from domestic production, the industry is consistently focusing on the
automobile exports. The auto component segment is contributing a lot in the export
arena. The liberalized policies of the government are now making the companies
go for more and more exports.
8/3/2019 Siddhartha Final 2007
http://slidepdf.com/reader/full/siddhartha-final-2007 10/29
10
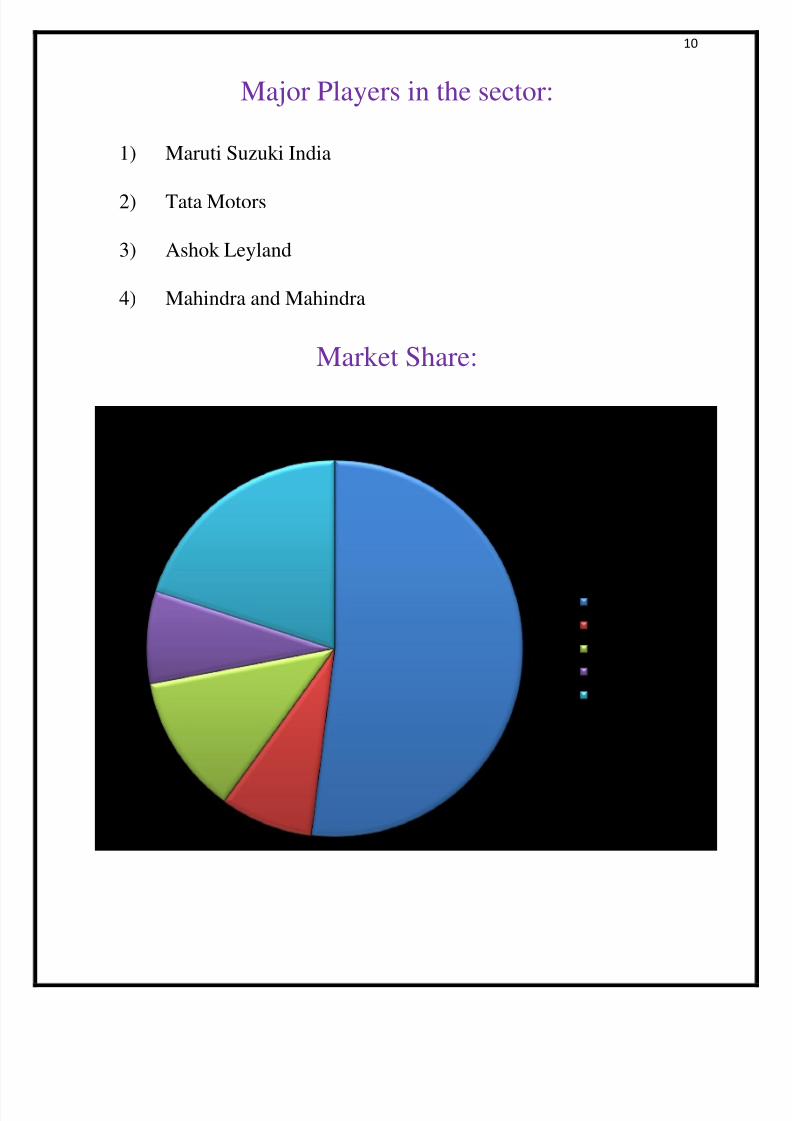
Major Players in the sector:
1) Maruti Suzuki India
2) Tata Motors
3) Ashok Leyland
4) Mahindra and Mahindra
Market Share:
Market Share %
Maruti Suzuki
Ashok Leyland
Tata Motors
Mahindra &Mahindra
Others
8/3/2019 Siddhartha Final 2007
http://slidepdf.com/reader/full/siddhartha-final-2007 11/29
11
Maruti Suzuki India Limited:
Maruti Suzuki India Limited (MSIL, formerly
known as Maruti Udyog Limited) is a
subsidiary of Suzuki Motor Corporation,
Japan. MSIL has been the leader of the Indian car market for over two and a half
decades. The company has two manufacturing facilities located at Gurgaon and
Manesar, south of New Delhi, India. Both the facilities have a combined capability
to produce over a 1.2 million (1,200,000) vehicles annually.
The company plans to expand its manufacturing capacity to 1.75 million by 2013.
The company offers a wide range of cars across different segments. It offers 15
brands and over 150 variants - Maruti 800, people movers, Omni and Eeco,
international brands Alto, Alto-K10, A-star, WagonR, Swift, Ritz and Estilo, off-
roader Gypsy, SUV Grand Vitara, sedans SX4, Swift DZire and Kizashi. In an
environment friendly initiative, in August 2010 Maruti Suzuki introduced factory
fitted CNG option on 5 models across vehicle segments. These include Eeco, Alto,
Estilo Wagon-R and SX4.
In fiscal 2009-10 Maruti Suzuki became the only Indian company to manufacture
and sell One Million cars in a year.
Maruti Suzuki's revenue has grown consistently over the years.
8/3/2019 Siddhartha Final 2007
http://slidepdf.com/reader/full/siddhartha-final-2007 12/29
12
Tata Motors:
Tata Motors Limited is India’s largest
automobile company, with consolidated
revenues of Rs.1, 23,133 cores (USD 27 billion)
in 2010-11. It is the leader in commercial
vehicles in each segment, and among the top
three in passenger vehicles with winning products in the compact, midsize car and
utility vehicle segments. The Company is the world's fourth largest truck
manufacturer, and the world's third largest bus manufacturer.
The Company's over 25,000 employees are guided by the vision to be "best in the
manner in which we operate, best in the products we deliver, and best in our value
system and ethics."
Tata Motors also distributes and markets Fiat branded cars in India.
8/3/2019 Siddhartha Final 2007
http://slidepdf.com/reader/full/siddhartha-final-2007 13/29
13
Ashok Leyland:
The origin of Ashok Leyland can be
traced to the urge for self-reliance, felt
by independent India. Pandit
Jawaharlal Nehru, India's first Prime
Minister persuaded Mr. Raghunandan Saran, an industrialist, to enter automotive
manufacture. In 1948, Ashok Motors was set up in what was then Madras, for the
assembly of Austin Cars. The Company's destiny and name changed soon with
equity participation by British Leyland and Ashok Leyland commenced
manufacture of commercial vehicles in 1955
Access to international technology enabled the Company to set a tradition to be
first with technology. Be it full air brakes, power steering or rear engine busses,
Ashok Leyland pioneered all these concepts. Responding to the operating
conditions and practices in the country, the Company made its vehicles strong,
over-engineering them with extra metallic muscles. "Designing durable products
that make economic sense to the consumer, using appropriate technology", became
the design philosophy of the Company, which in turn has moulded consumer
attitudes and the brand personality.
The blueprint prepared for the future reflected the global ambitions of the
company, captured in four words: Global Standards, Global Markets. This was at a
time when liberalisation and globalisation were not yet in the air. Ashok Leyland
embarked on a major product and process upgradation to match world-class
standards of technology.
8/3/2019 Siddhartha Final 2007
http://slidepdf.com/reader/full/siddhartha-final-2007 14/29
14
Mahindra & Mahindra ltd:
Founded in 1945 as a steel trading company,
we entered automotive manufacturing in
1947 to bring the iconic Willys Jeep onto
Indian roads. Over the years, we’ve
diversified into many new businesses in order to better meet the needs of our
customers. We follow a unique business model of creating empowered companies
that enjoy the best of entrepreneurial independence and Group-wide synergies.
This principle has led our growth into a US $12.5 billion multinational group with
more than 137,000 employees in over 100 countries across the globe.
Today, their operations span 18 key industries that form the foundation of every
modern economy: aerospace, aftermarket, agribusiness, automotive, components,
construction equipment, consulting services, defense, energy, farm equipment,
finance and insurance, industrial equipment, information technology, leisure and
hospitality, logistics, real estate, retail, and two wheelers.
Their federated structure enables each business to chart its own future and
simultaneously leverage synergies across the entire Group’s competencies. In this
way, the diversity of our expertise allows us to bring our customers the best in
many fields.
8/3/2019 Siddhartha Final 2007
http://slidepdf.com/reader/full/siddhartha-final-2007 15/29
15
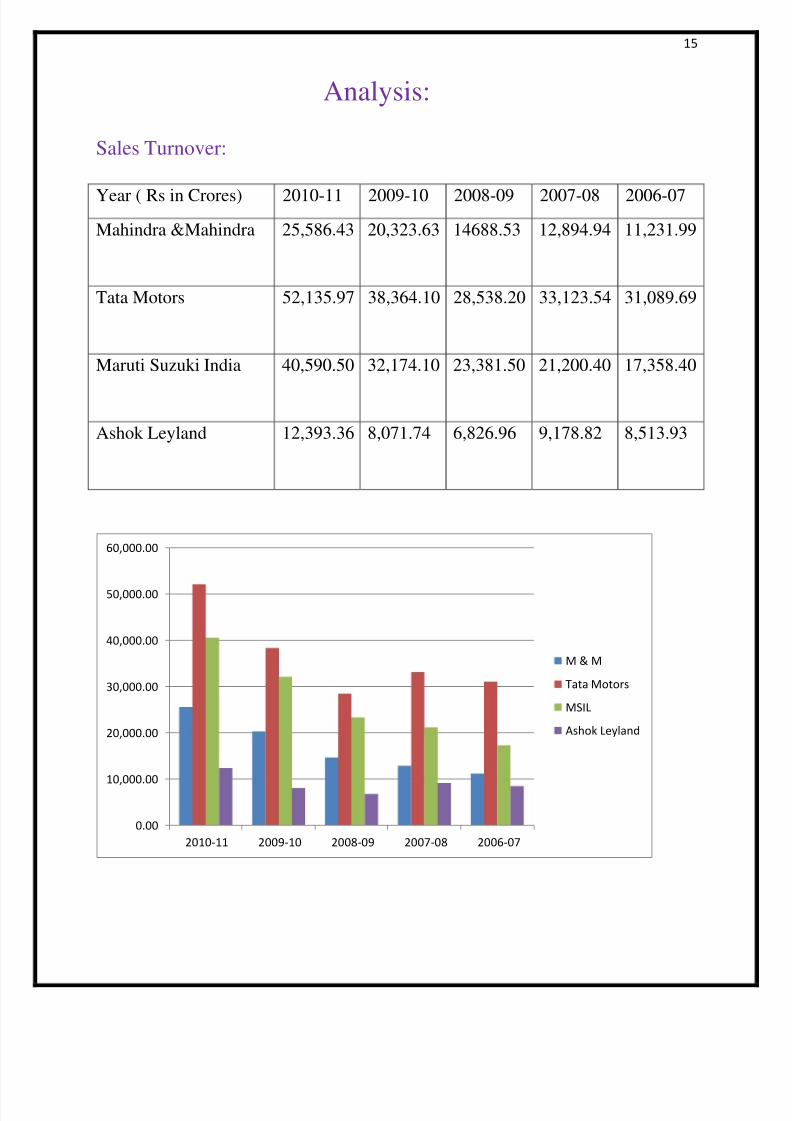
Analysis:
Sales Turnover:
Year ( Rs in Crores) 2010-11 2009-10 2008-09 2007-08 2006-07
Mahindra &Mahindra 25,586.43 20,323.63 14688.53 12,894.94 11,231.99
Tata Motors 52,135.97 38,364.10 28,538.20 33,123.54 31,089.69
Maruti Suzuki India 40,590.50 32,174.10 23,381.50 21,200.40 17,358.40
Ashok Leyland 12,393.36 8,071.74 6,826.96 9,178.82 8,513.93
0.00
10,000.00
20,000.00
30,000.00
40,000.00
50,000.00
60,000.00
2010-11 2009-10 2008-09 2007-08 2006-07
M & M
Tata Motors
MSIL
Ashok Leyland
8/3/2019 Siddhartha Final 2007
http://slidepdf.com/reader/full/siddhartha-final-2007 16/29
16
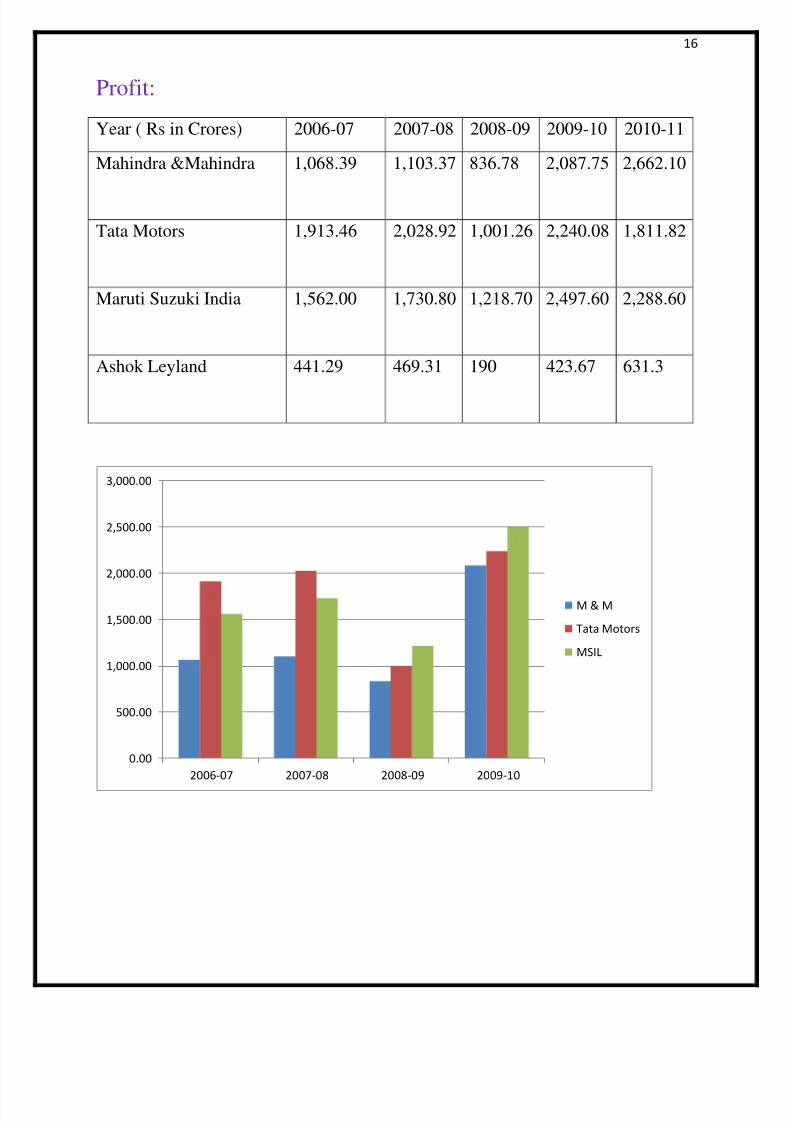
Profit:
Year ( Rs in Crores) 2006-07 2007-08 2008-09 2009-10 2010-11
Mahindra &Mahindra 1,068.39 1,103.37 836.78 2,087.75 2,662.10
Tata Motors 1,913.46 2,028.92 1,001.26 2,240.08 1,811.82
Maruti Suzuki India 1,562.00 1,730.80 1,218.70 2,497.60 2,288.60
Ashok Leyland 441.29 469.31 190 423.67 631.3
0.00
500.00
1,000.00
1,500.00
2,000.00
2,500.00
3,000.00
2006-07 2007-08 2008-09 2009-10
M & M
Tata Motors
MSIL
8/3/2019 Siddhartha Final 2007
http://slidepdf.com/reader/full/siddhartha-final-2007 17/29
17
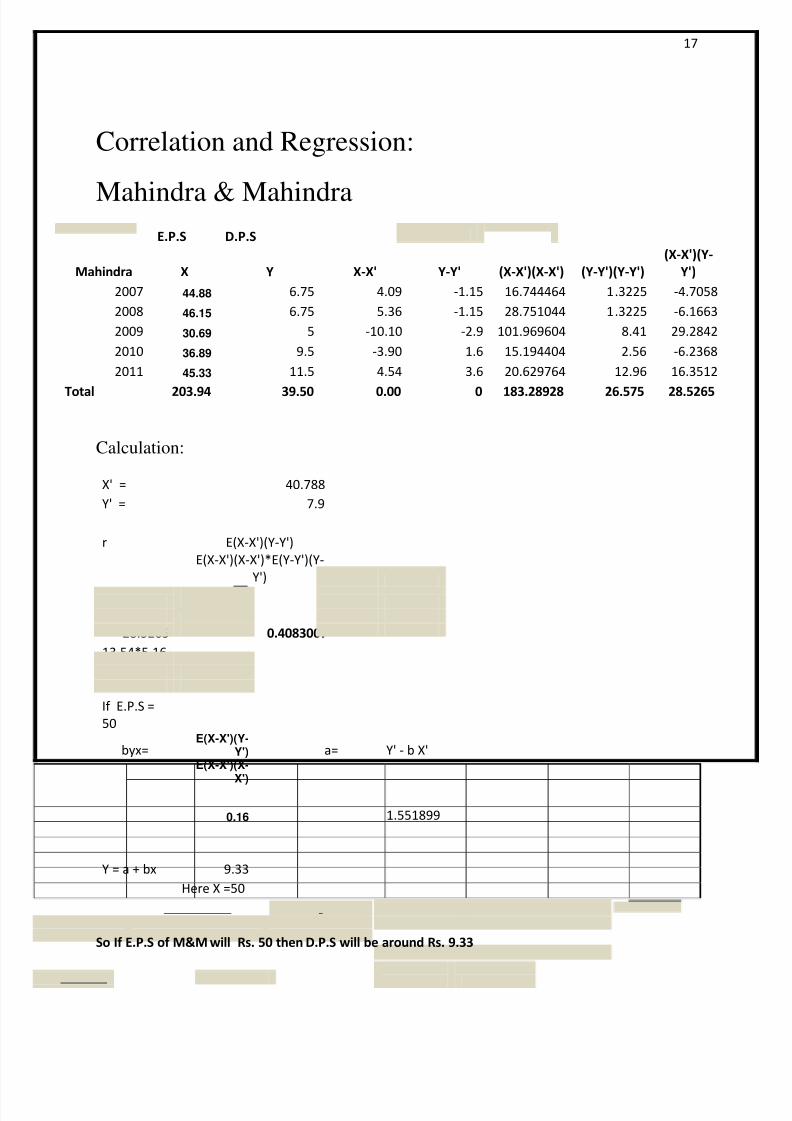
Correlation and Regression:
Mahindra & Mahindra
Mahindra
E.P.S D.P.S
X Y X-X' Y-Y' (X-X')(X-X') (Y-Y')(Y-Y')
(X-X')(Y-
Y')
2007 44.88 6.75 4.09 -1.15 16.744464 1.3225 -4.7058
2008 46.15 6.75 5.36 -1.15 28.751044 1.3225 -6.1663
2009 30.69 5 -10.10 -2.9 101.969604 8.41 29.2842
2010 36.89 9.5 -3.90 1.6 15.194404 2.56 -6.2368
2011 45.33 11.5 4.54 3.6 20.629764 12.96 16.3512
Total 203.94 39.50 0.00 0 183.28928 26.575 28.5265
Calculation:
X' = 40.788
Y' = 7.9
r E(X-X')(Y-Y')
E(X-X')(X-X')*E(Y-Y')(Y-
Y')
28.5265 0.4083007
13.54*5.16
If E.P.S =
50
byx=E(X-X')(Y-
Y') a= Y' - b X'E(X-X')(X-
X')
0.16 1.551899
Y = a + bx 9.33
Here X =50
So If E.P.S of M&M will Rs. 50 then D.P.S will be around Rs. 9.33
8/3/2019 Siddhartha Final 2007
http://slidepdf.com/reader/full/siddhartha-final-2007 18/29
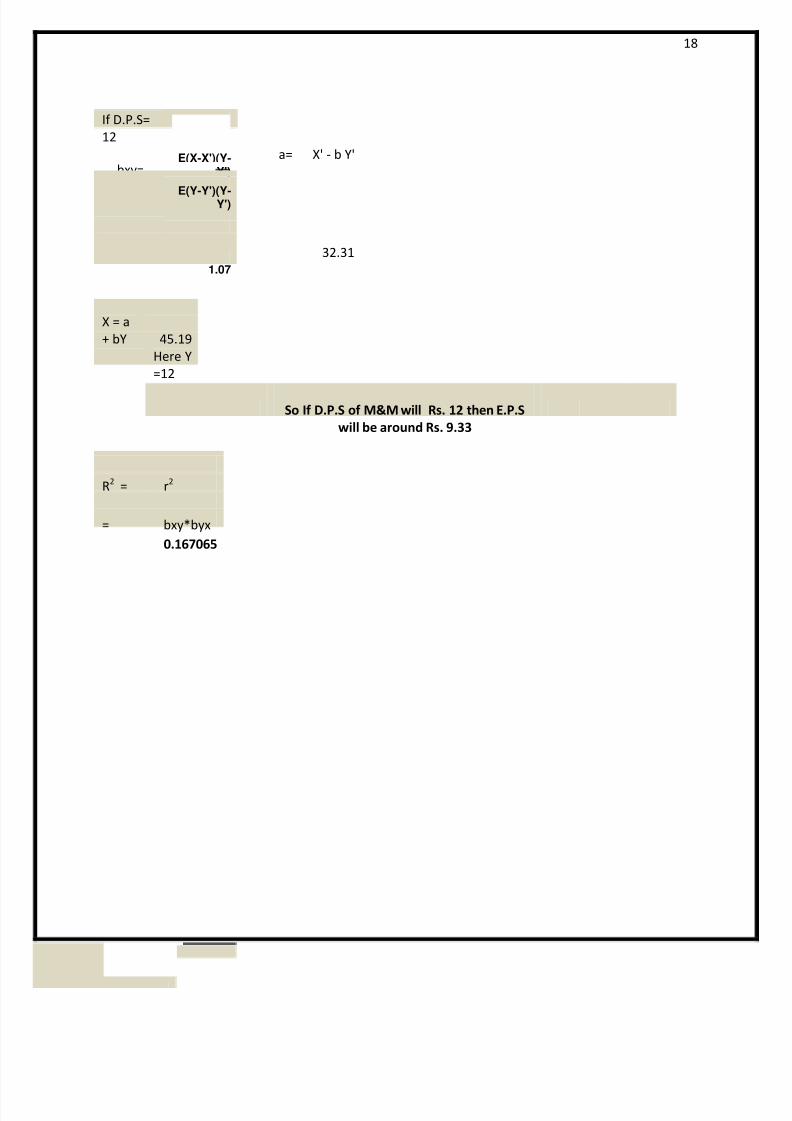
18
If D.P.S=
12
bxy=E(X-X')(Y-
Y')
a= X' - b Y'
E(Y-Y')(Y-Y')
1.07
32.31
X = a
+ bY 45.19
Here Y
=12
So If D.P.S of M&M will Rs. 12 then E.P.S
will be around Rs. 9.33
R2
= r2
= bxy*byx
0.167065
8/3/2019 Siddhartha Final 2007
http://slidepdf.com/reader/full/siddhartha-final-2007 19/29
19
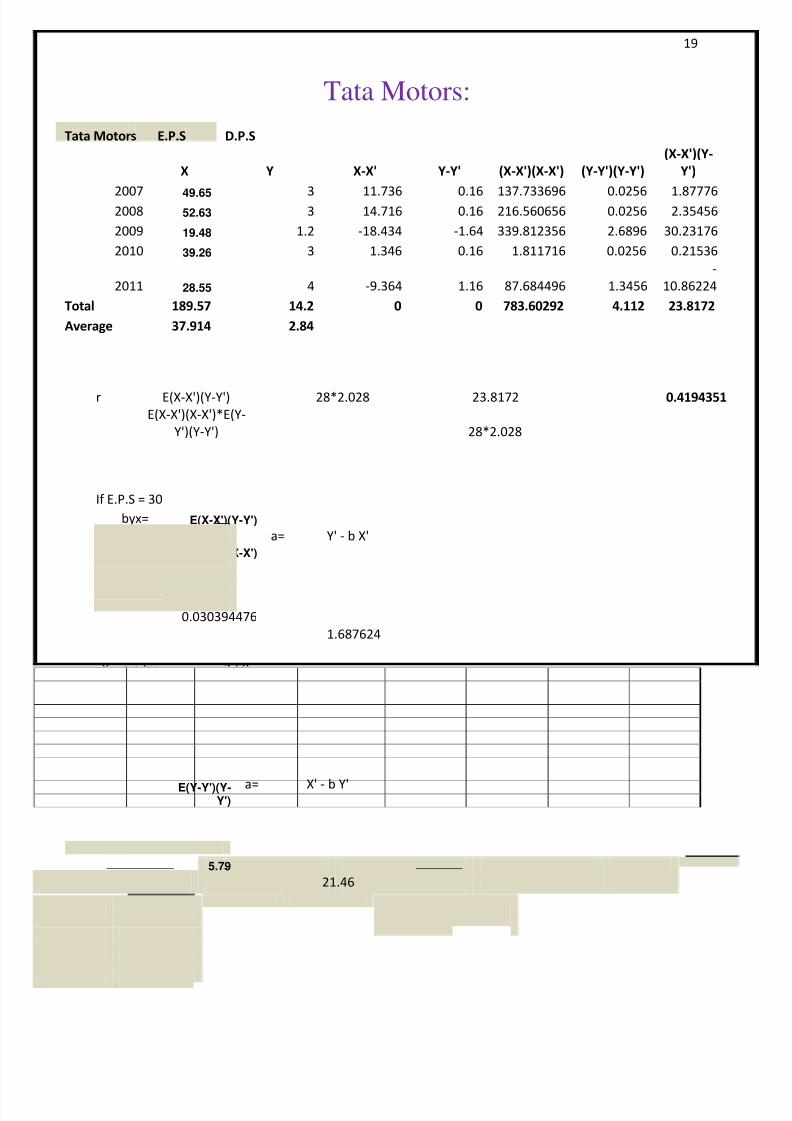
Tata Motors:
Tata Motors E.P.S D.P.S
X Y X-X' Y-Y' (X-X')(X-X') (Y-Y')(Y-Y')
(X-X')(Y-
Y')
2007 49.65 3 11.736 0.16 137.733696 0.0256 1.877762008 52.63 3 14.716 0.16 216.560656 0.0256 2.35456
2009 19.48 1.2 -18.434 -1.64 339.812356 2.6896 30.23176
2010 39.26 3 1.346 0.16 1.811716 0.0256 0.21536
2011 28.55 4 -9.364 1.16 87.684496 1.3456
-
10.86224
Total 189.57 14.2 0 0 783.60292 4.112 23.8172
Average 37.914 2.84
r E(X-X')(Y-Y') 28*2.028 23.8172 0.4194351
E(X-X')(X-X')*E(Y-
Y')(Y-Y') 28*2.028
If E.P.S = 30
byx= E(X-X')(Y-Y')
E(X-X')(X-X')
a= Y' - b X'
0.030394476
1.687624
Y = a + bx 2.60
Here X =30
So If E.P.S of Tata Motors will Rs. 30 then D.P.S will be around Rs. 2.60
If D.P.S=
5
bxy=E(X-X')(Y-
Y')
E(Y-Y')(Y-Y')
a= X' - b Y'
5.79
21.46
8/3/2019 Siddhartha Final 2007
http://slidepdf.com/reader/full/siddhartha-final-2007 20/29
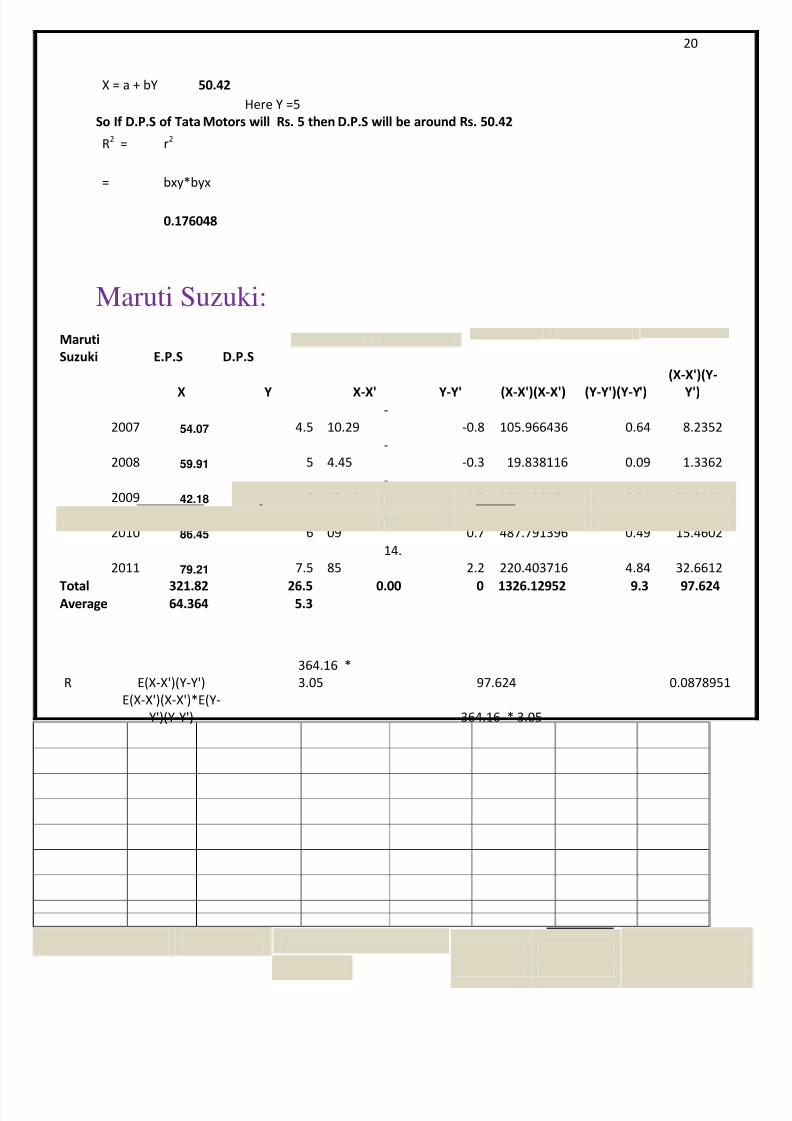
20
X = a + bY 50.42
Here Y =5
So If D.P.S of Tata Motors will Rs. 5 then D.P.S will be around Rs. 50.42
Maruti Suzuki:
Maruti
Suzuki E.P.S D.P.S
X Y X-X' Y-Y' (X-X')(X-X') (Y-Y')(Y-Y')
(X-X')(Y-
Y')
2007 54.07 4.5
-
10.29 -0.8 105.966436 0.64 8.2352
2008 59.91 5
-
4.45 -0.3 19.838116 0.09 1.3362
2009 42.18 3.5
-
22.18 -1.8 492.129856 3.24 39.9312
2010 86.45 6
22.
09 0.7 487.791396 0.49 15.4602
2011 79.21 7.5
14.
85 2.2 220.403716 4.84 32.6612
Total 321.82 26.5 0.00 0 1326.12952 9.3 97.624Average 64.364 5.3
If E.P.S =85
byx= E(X-X')(Y-Y')
E(X-X')(X-X')
a= Y' - b X'
0.073615736
R2
= r2
= bxy*byx
0.176048
R E(X-X')(Y-Y')
364.16 *
3.05 97.624 0.0878951
E(X-X')(X-X')*E(Y-
Y')(Y-Y') 364.16 * 3.05
8/3/2019 Siddhartha Final 2007
http://slidepdf.com/reader/full/siddhartha-final-2007 21/29
21
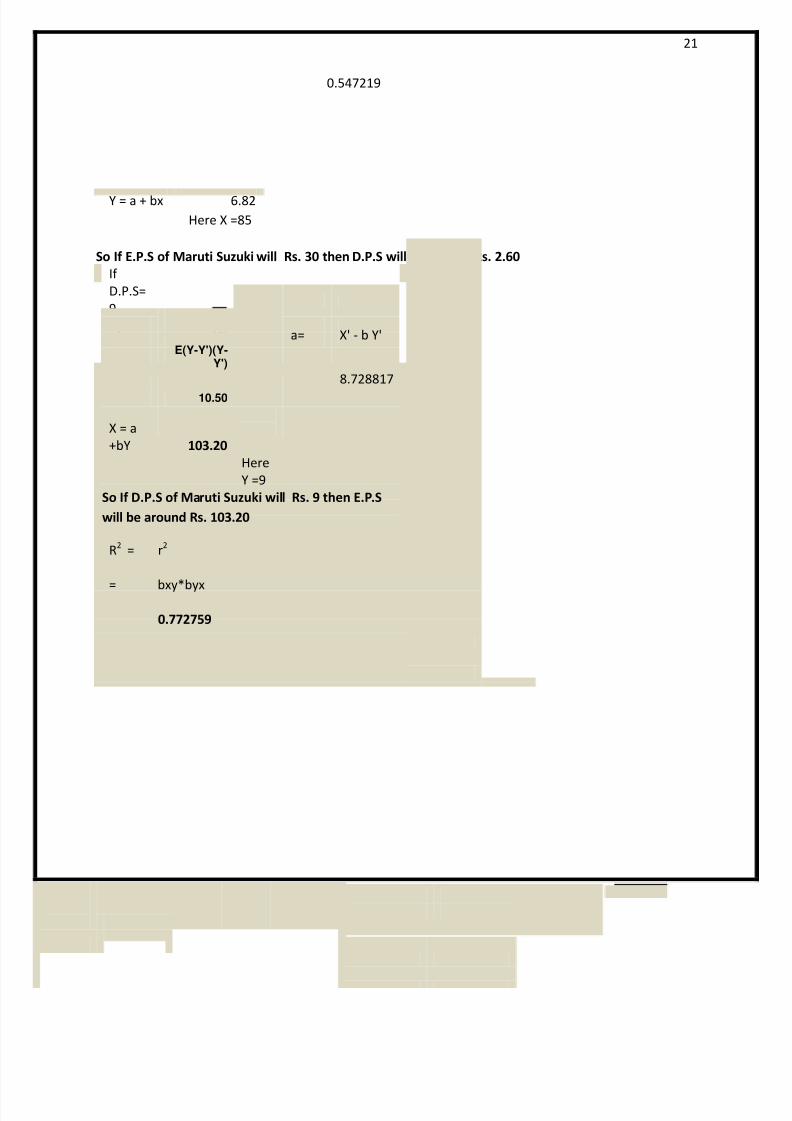
0.547219
Y = a + bx 6.82
Here X =85
So If E.P.S of Maruti Suzuki will Rs. 30 then D.P.S will be around Rs. 2.60
If
D.P.S=
9
bxy=E(X-X')(Y-
Y') a= X' - b Y'E(Y-Y')(Y-
Y')
8.728817
10.50
X = a
+bY 103.20
Here
Y =9
So If D.P.S of Maruti Suzuki will Rs. 9 then E.P.S
will be around Rs. 103.20
R2
= r2
= bxy*byx
0.772759
8/3/2019 Siddhartha Final 2007
http://slidepdf.com/reader/full/siddhartha-final-2007 22/29
22
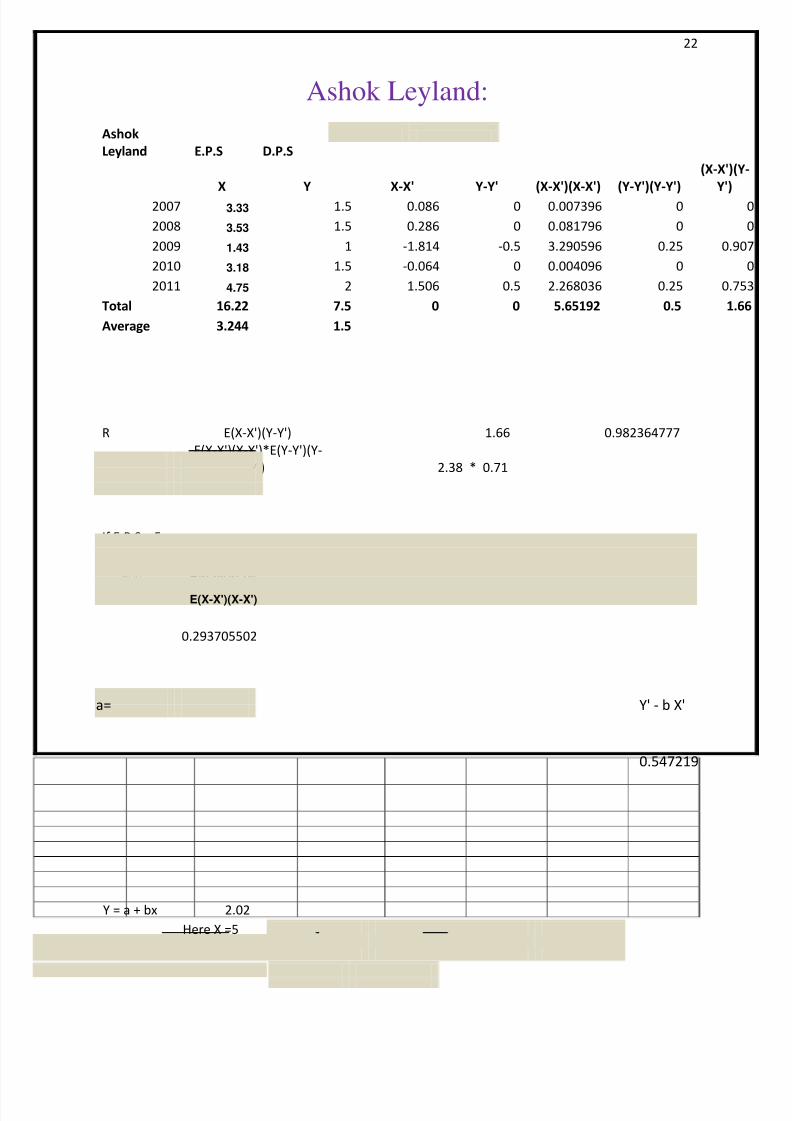
Ashok Leyland:
Ashok
Leyland E.P.S D.P.S
X Y X-X' Y-Y' (X-X')(X-X') (Y-Y')(Y-Y')
(X-X')(Y
Y')
2007 3.33 1.5 0.086 0 0.007396 0
2008 3.53 1.5 0.286 0 0.081796 0
2009 1.43 1 -1.814 -0.5 3.290596 0.25 0.90
2010 3.18 1.5 -0.064 0 0.004096 0
2011 4.75 2 1.506 0.5 2.268036 0.25 0.75
Total 16.22 7.5 0 0 5.65192 0.5 1.6
Average 3.244 1.5
R E(X-X')(Y-Y') 1.66 0.982364777
E(X-X')(X-X')*E(Y-Y')(Y-
Y') 2.38 * 0.71
If E.P.S = 5
byx= E(X-X')(Y-Y')
E(X-X')(X-X')
0.293705502
a= Y' - b X'
0.547219
Y = a + bx 2.02
Here X =5
8/3/2019 Siddhartha Final 2007
http://slidepdf.com/reader/full/siddhartha-final-2007 23/29
23
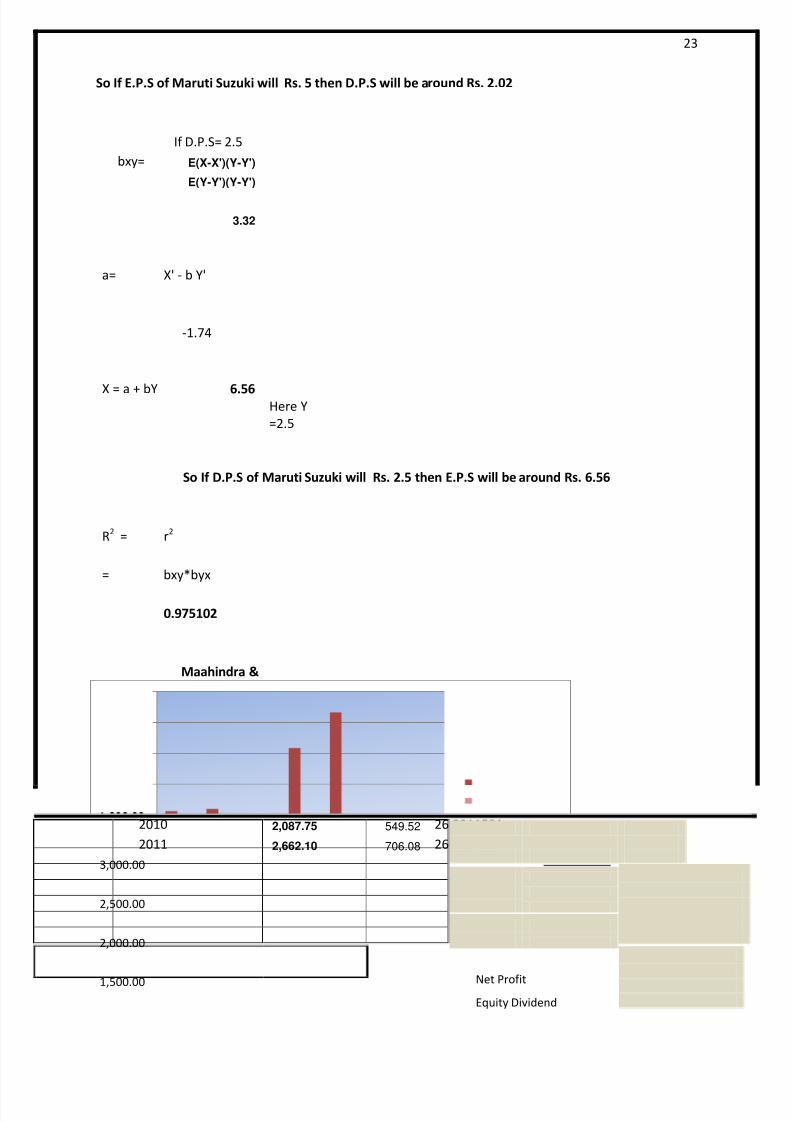
So If E.P.S of Maruti Suzuki will Rs. 5 then D.P.S will be around Rs. 2.02
If D.P.S= 2.5
bxy= E(X-X')(Y-Y')
E(Y-Y')(Y-Y')
3.32
a= X' - b Y'
-1.74
X = a + bY 6.56Here Y
=2.5
So If D.P.S of Maruti Suzuki will Rs. 2.5 then E.P.S will be around Rs. 6.56
R2
= r2
= bxy*byx
0.975102
Maahindra &
Mahindra
Net Profit
Equity
Dividend %
2007 1,068.39 282.23 26.4163835
2008 1,103.37 282.61 25.61334822009 836.78 278.83 33.3217811
2010 2,087.75 549.52 26.3211591
2011 2,662.10 706.08 26.5234214
1,500.00
2,000.00
2,500.00
3,000.00
Net Profit
Equity Dividend
8/3/2019 Siddhartha Final 2007
http://slidepdf.com/reader/full/siddhartha-final-2007 24/29
24
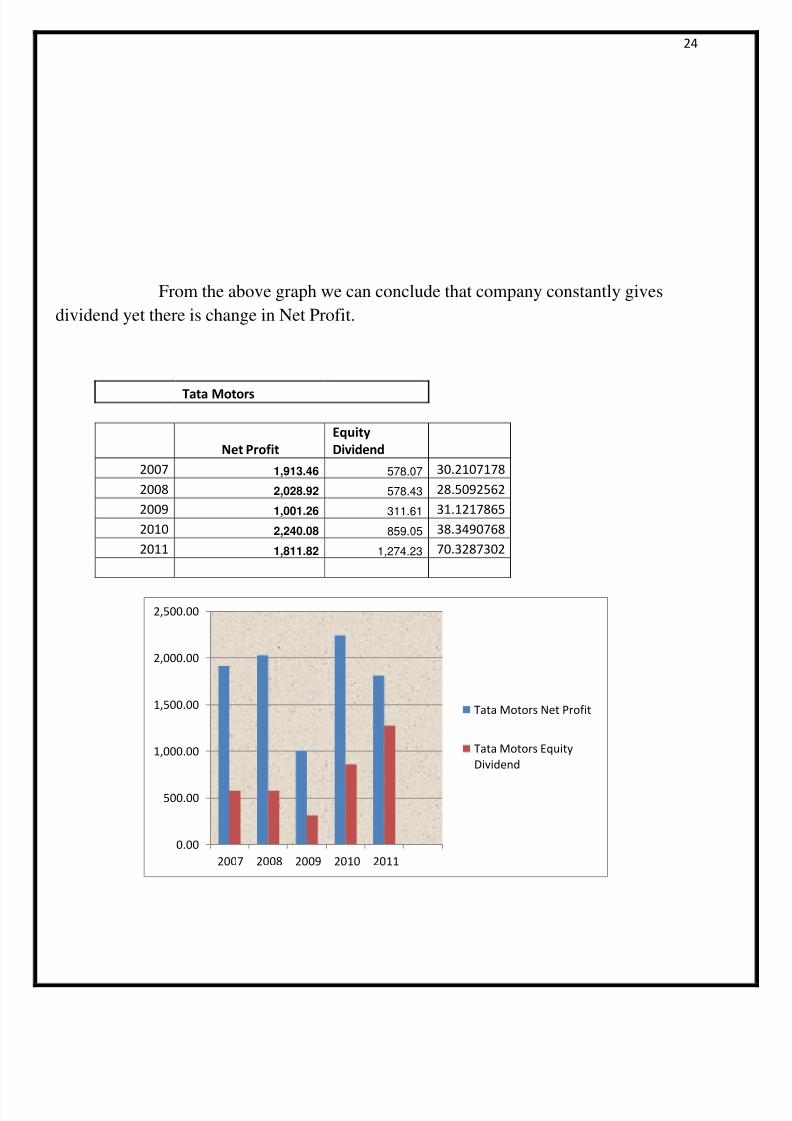
From the above graph we can conclude that company constantly gives
dividend yet there is change in Net Profit.
Tata Motors
Net Profit
Equity
Dividend
2007 1,913.46 578.07 30.2107178
2008 2,028.92 578.43 28.5092562
2009 1,001.26 311.61 31.1217865
2010 2,240.08 859.05 38.3490768
2011 1,811.82 1,274.23 70.3287302
0.00
500.00
1,000.00
1,500.00
2,000.00
2,500.00
2007 2008 2009 2010 2011
Tata Motors Net Profit
Tata Motors Equity
Dividend
8/3/2019 Siddhartha Final 2007
http://slidepdf.com/reader/full/siddhartha-final-2007 25/29
25
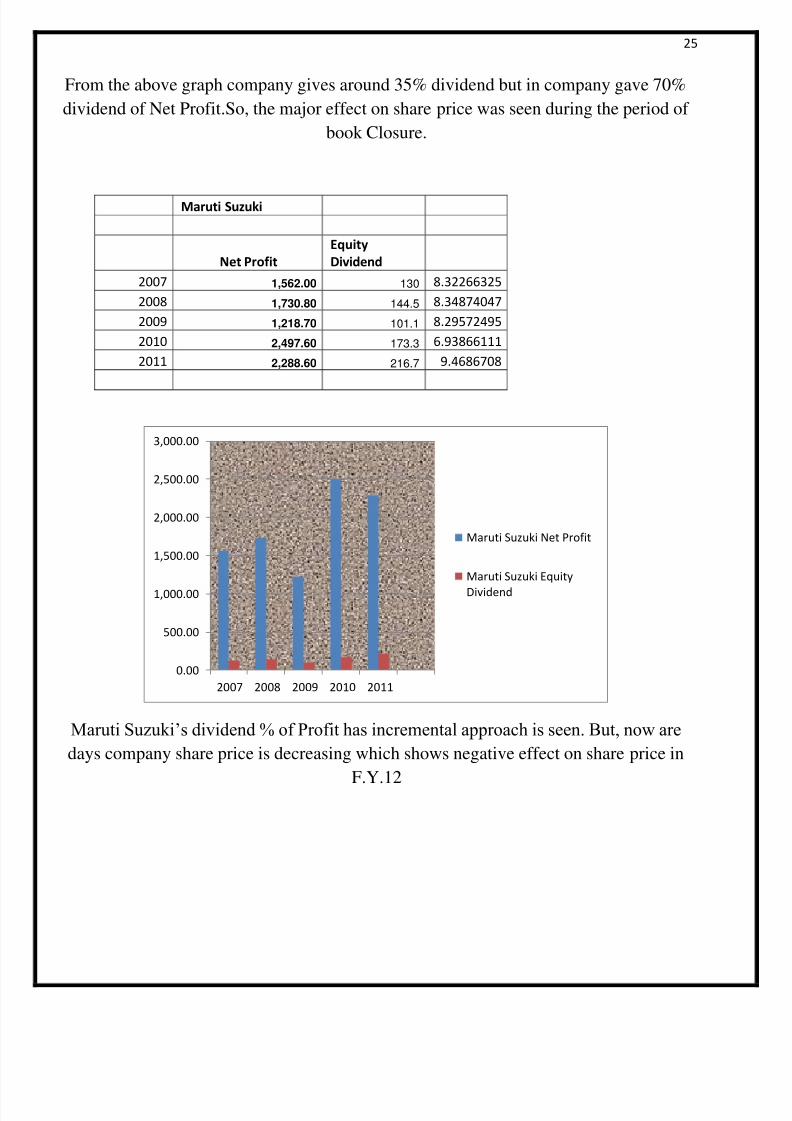
From the above graph company gives around 35% dividend but in company gave 70%
dividend of Net Profit.So, the major effect on share price was seen during the period of
book Closure.
Maruti Suzuki
Net Profit
Equity
Dividend
2007 1,562.00 130 8.32266325
2008 1,730.80 144.5 8.34874047
2009 1,218.70 101.1 8.29572495
2010 2,497.60 173.3 6.93866111
2011 2,288.60 216.7 9.4686708
Maruti Suzuki’s dividend % of Profit has incremental approach is seen. But, now are
days company share price is decreasing which shows negative effect on share price in
F.Y.12
0.00
500.00
1,000.00
1,500.00
2,000.00
2,500.00
3,000.00
2007 2008 2009 2010 2011
Maruti Suzuki Net Profit
Maruti Suzuki Equity
Dividend
8/3/2019 Siddhartha Final 2007
http://slidepdf.com/reader/full/siddhartha-final-2007 26/29
26
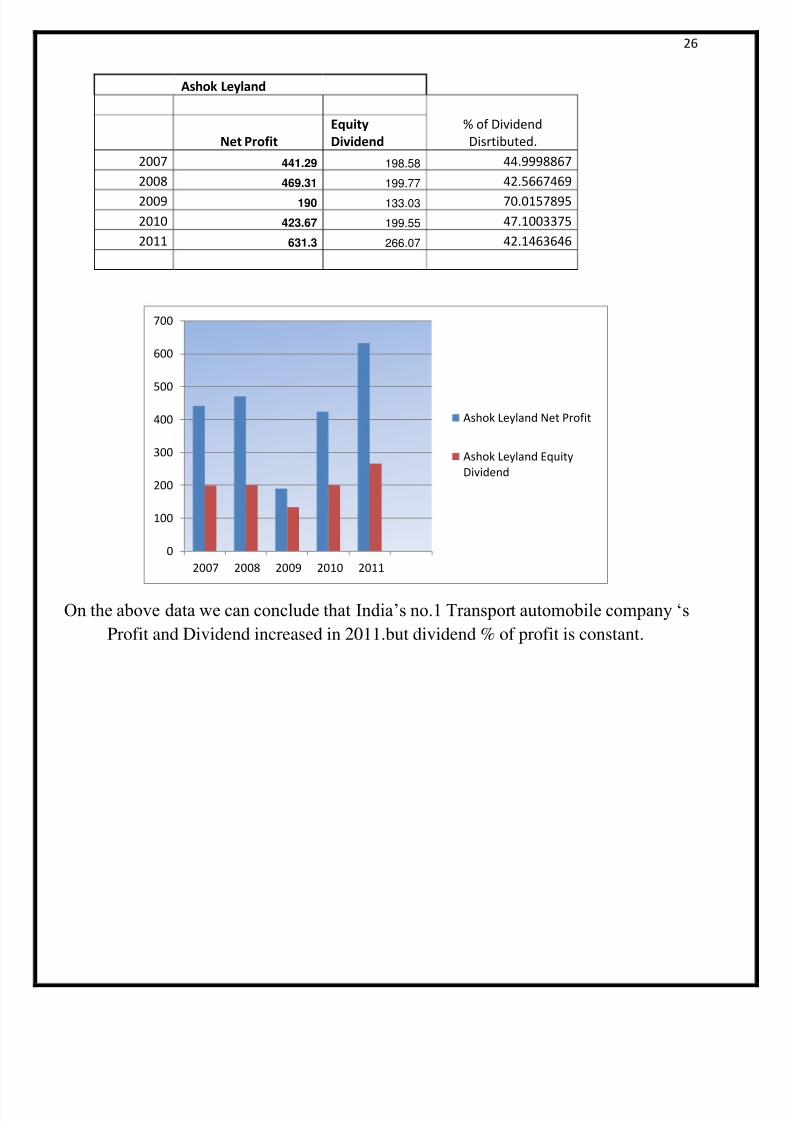
Ashok Leyland
% of Dividend
Disrtibuted.Net Profit
Equity
Dividend
2007 441.29 198.58 44.9998867
2008 469.31 199.77 42.5667469
2009 190 133.03 70.0157895
2010 423.67 199.55 47.1003375
2011 631.3 266.07 42.1463646
On the above data we can conclude that India’s no.1 Transport automobile company ‘s
Profit and Dividend increased in 2011.but dividend % of profit is constant.
0
100
200
300
400
500
600
700
2007 2008 2009 2010 2011
Ashok Leyland Net Profit
Ashok Leyland Equity
Dividend
8/3/2019 Siddhartha Final 2007
http://slidepdf.com/reader/full/siddhartha-final-2007 27/29
27
Conclusion:
Infrastructure Deficit
Talent Crunch
Scaling-Up the industry
Access to World-class Technology and Quality Practices
Remaining cost competitive
Access to and availability of cost-effective capital
Trade Policy
As Indian Automobile Sector is Continuously growing but as compare toWorld market our growth is restricted. Our Automobile sector is with middleclass . The Technology and interior is not much competitive. One interesting
thing that Gujarat is becoming Auto Hub as TATA ,Ford, Mercedes,NISSAN, MARUTI SUZUKI,VolksWagon welcomed by GujaratGovernment.So, its good strategy to welcome the World Auto mobileCompany for the development on our country.
8/3/2019 Siddhartha Final 2007
http://slidepdf.com/reader/full/siddhartha-final-2007 28/29
28
Bibliography:
Reference
http://www.rbi.org.in
Central statistical organisation
Economic Times
Indiatimes.com

8/3/2019 Siddhartha Final 2007
http://slidepdf.com/reader/full/siddhartha-final-2007 29/29
29

![DOSSIER 10 9 WiRES Annex - moodle.adaptland.it · [628 final 28.02.2005]. 0 Communication from [627 final 28 2006] 0 Decision 1639/2006/EC 24 Framework Programme(2007 2013). 0 Communication](https://img.pdfslide.fr/doc/110x75/5f4cff979584e561884169d3/dossier-10-9-wires-annex-628-final-28022005-0-communication-from-627-final.jpg)