Embed Size (px)
Citation preview
JEAN-PHILIPPE PARENT
STABILITÉ DE LA HIÉRARCHIE SOCIALE CHEZ
LES PORCS FEMELLES EN CROISSANCE ET LES
TRUIES GESTANTES
Mémoire présenté
à la Faculté des études supérieures et postdoctorales de l’Université Laval dans le cadre du programme de Maîtrise en sciences animales
pour l’obtention du grade de Maître ès sciences (M.Sc.)
DÉPARTEMENT DES SCIENCES ANIMALES
FACULTÉ DES SCIENCES DE L’AGRICULTURE ET DE L’ALIMENTATION UNIVERSITÉ LAVAL
QUÉBEC
2012
© Jean-Philippe Parent, 2012
i
Résumé
Des résultats conflictuels entre différentes méthodes pour mesurer la hiérarchie sociale chez
le porc et entre les répétitions de ces méthodes pourraient être causés par un manque de
stabilité de la hiérarchie. Cinq méthodes ont été comparées chez huit groupes de huit
femelles en croissance et huit groupes de six truies gestantes: test de groupe à une et à deux
auges, temps à la mangeoire pour le test de groupe à une et à deux auges et test dyadique.
La stabilité temporelle a été comparée pour les cinq méthodes aux semaines 1, 6 et 11 et 5,
9, 13 après le mélange pour les femelles en croissance et les truies, respectivement. Une
concordance entre les méthodes et une stabilité dans le temps plus élevées ont été observées
chez les truies comparativement aux femelles en croissance. Ces résultats suggèrent que les
femelles ont une hiérarchie plus stable lors de la gestation que lors de la croissance.
ii
Abstract
Conflicting results between methods to measure social hierarchy in pigs and between
repetitions of these methods could be caused by a lack of stability in the hierarchy. Five
methods have been compared for eight groups of eight growing females and eight groups of
six pregnant sows: group test with one and two troughs, total trough time in the group test
with one and two troughs and dyadic test. Temporal stability was compared for the five
methods at weeks 1, 6 and 11 and 5, 9, 13 after mixing for growing females and sows,
respectively. A higher concordance between methods and temporal stability was obtained
for sows compared to growing females. These results suggest that females have a more
stable hierarchy during gestation than during growth.
iii
Avant-Propos
Mes premiers remerciements vont à Renée Bergeron, ma directrice de maîtrise qui a cru en
mes capacités à accomplir ce projet. À toutes les fois où j’ai eu la chance de passer du
temps avec elle, je me suis retrouvé en présence d’une personne à l’esprit scientifique
remarquable.
Je tiens aussi à remercier Marie-Christine Meunier-Salaün qui m’a permis de réaliser mon
projet en m’offrant des installations disponibles en France. C’est aussi grâce à cette
collaboration que le volet « truie » a été ajouté à ce projet, un apport sans lequel mon projet
me semblerait incomplet maintenant.
Un merci tout particulier à Elsa. Elle m’a encouragé à présenter au meeting régional de
l’ISAE. Ce fut la poussée qui me donna la motivation de terminer ma maîtrise. Je dois aussi
la remercier pour son apport et son support constant et ce même dans les moments où je me
sentais le plus seul.
Je me dois de remercier Anne Marie de Passillé et Jeff Rushen pour m’avoir encouragé à
terminer cette maîtrise et pour leurs conseils pour mes présentations et mes discussions.
Je me dois aussi de remercier le personnel de soutien du centre de Saint-Gilles avec un
merci tout particulier à Carole Guérin et Michel Lefebvre.
Un remerciement tout particulier est destiné à ma famille, qui m’a toujours supporté et à
toujours été fière de moi. J’espère simplement avoir mérité leur fierté.
J’ai rédigé l’article inséré dans ce mémoire en tant qu’auteur principal. Les co-auteurs sont
les chercheurs ayant été impliqués dans mon travail de recherche et dans son analyse.
L’article faisant l’objet du Chapitre 2 sera soumis ultérieurement pour publication dans le
« Journal of Applied Animal Behaviour Science ».

iv
À ma famille, sans qui je ne serais qui je suis
v
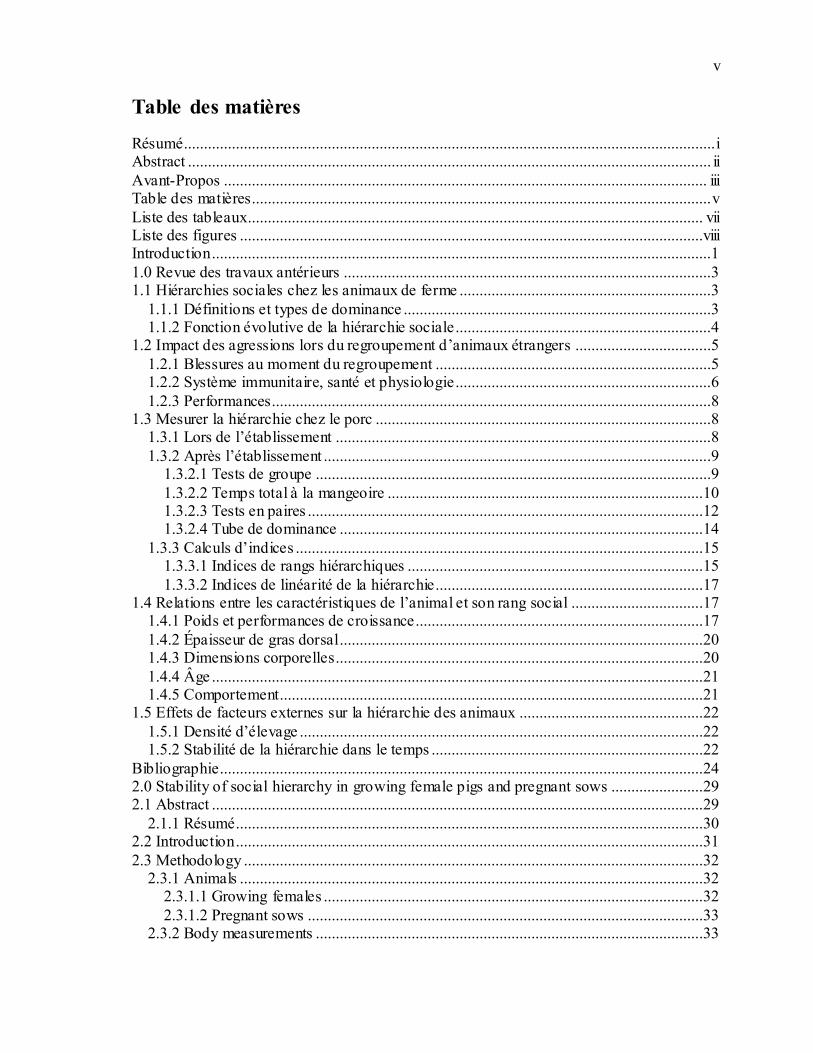
Table des matières
Résumé..................................................................................................................................... i Abstract ................................................................................................................................... ii
Avant-Propos ......................................................................................................................... iii Table des matières................................................................................................................... v
Liste des tableaux.................................................................................................................. vii Liste des figures ....................................................................................................................viii Introduction .............................................................................................................................1
1.0 Revue des travaux antérieurs ............................................................................................3 1.1 Hiérarchies sociales chez les animaux de ferme ...............................................................3
1.1.1 Définitions et types de dominance .............................................................................3 1.1.2 Fonction évolutive de la hiérarchie sociale................................................................4
1.2 Impact des agressions lors du regroupement d’animaux étrangers ..................................5
1.2.1 Blessures au moment du regroupement .....................................................................5 1.2.2 Système immunitaire, santé et physiologie................................................................6
1.2.3 Performances..............................................................................................................8 1.3 Mesurer la hiérarchie chez le porc ....................................................................................8
1.3.1 Lors de l’établissement ..............................................................................................8
1.3.2 Après l’établissement .................................................................................................9 1.3.2.1 Tests de groupe ...................................................................................................9
1.3.2.2 Temps total à la mangeoire ...............................................................................10 1.3.2.3 Tests en paires ...................................................................................................12 1.3.2.4 Tube de dominance ...........................................................................................14
1.3.3 Calculs d’indices ......................................................................................................15 1.3.3.1 Indices de rangs hiérarchiques ..........................................................................15
1.3.3.2 Indices de linéarité de la hiérarchie...................................................................17 1.4 Relations entre les caractéristiques de l’animal et son rang social .................................17
1.4.1 Poids et performances de croissance........................................................................17
1.4.2 Épaisseur de gras dorsal ...........................................................................................20 1.4.3 Dimensions corporelles............................................................................................20
1.4.4 Âge ...........................................................................................................................21 1.4.5 Comportement..........................................................................................................21
1.5 Effets de facteurs externes sur la hiérarchie des animaux ..............................................22
1.5.1 Densité d’élevage .....................................................................................................22 1.5.2 Stabilité de la hiérarchie dans le temps ....................................................................22
Bibliographie.........................................................................................................................24 2.0 Stability of social hierarchy in growing female pigs and pregnant sows .......................29 2.1 Abstract ...........................................................................................................................29
2.1.1 Résumé.....................................................................................................................30 2.2 Introduction .....................................................................................................................31
2.3 Methodology ...................................................................................................................32 2.3.1 Animals ....................................................................................................................32
2.3.1.1 Growing females ...............................................................................................32
2.3.1.2 Pregnant sows ...................................................................................................33 2.3.2 Body measurements .................................................................................................33
vi
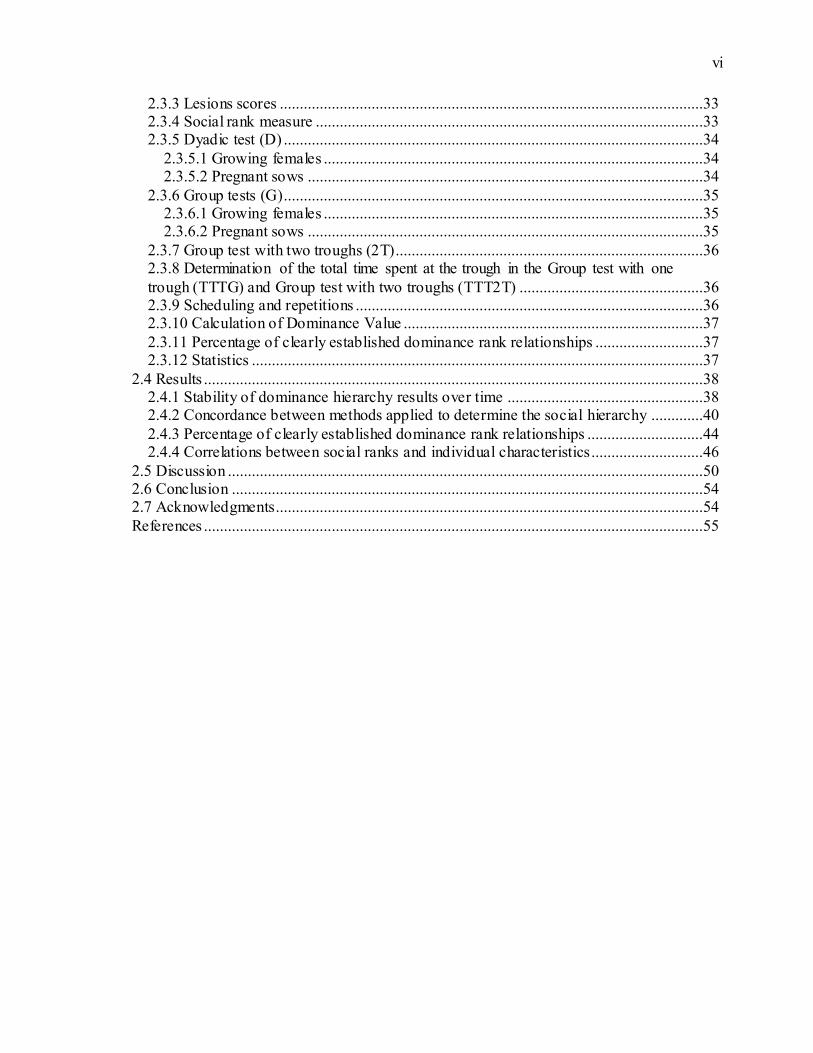
2.3.3 Lesions scores ..........................................................................................................33 2.3.4 Social rank measure .................................................................................................33 2.3.5 Dyadic test (D) .........................................................................................................34
2.3.5.1 Growing females ...............................................................................................34 2.3.5.2 Pregnant sows ...................................................................................................34
2.3.6 Group tests (G).........................................................................................................35 2.3.6.1 Growing females ...............................................................................................35 2.3.6.2 Pregnant sows ...................................................................................................35
2.3.7 Group test with two troughs (2T).............................................................................36 2.3.8 Determination of the total time spent at the trough in the Group test with one
trough (TTTG) and Group test with two troughs (TTT2T) ..............................................36 2.3.9 Scheduling and repetitions .......................................................................................36 2.3.10 Calculation of Dominance Value ...........................................................................37
2.3.11 Percentage of clearly established dominance rank relationships ...........................37 2.3.12 Statistics .................................................................................................................37
2.4 Results .............................................................................................................................38 2.4.1 Stability of dominance hierarchy results over time .................................................38 2.4.2 Concordance between methods applied to determine the social hierarchy .............40
2.4.3 Percentage of clearly established dominance rank relationships .............................44 2.4.4 Correlations between social ranks and individual characteristics............................46
2.5 Discussion .......................................................................................................................50 2.6 Conclusion ......................................................................................................................54 2.7 Acknowledgments...........................................................................................................54
References .............................................................................................................................55
vii
Liste des tableaux
Tableau 1.1 : Éthogramme des comportements de test de groupe........................................12 Tableau 1.2 : Indices de rang hiérarchique d’un animal en test de groupe ...........................16
Tableau 1.3 : Indices de linéarité ..........................................................................................17 Table 2.1 : Ethogram of aggressive behaviours measured during social rank tests .............35
Table 2.2 Average rank differences between each pair of repetitions of the five methods applied to determine the social hierarchy in growing females and pregnant sows (Kruskall-Wallis test) (Mean ± SD) ......................................................................................................39
Table 2.3 Spearman correlations between the social ranks obtained in growing females and pregnant sows for each pair of repetitions and for each of the five methods applied to
determine the social hierarchy ..............................................................................................40 Table 2.4 Spearman correlations between social ranks obtained in growing females and pregnant sows for each pair of methods and for each of the three repetitions......................44
Table 2.5 Percentage of dyads that have interacted in the G and 2T tests for growing females and pregnant sows (Mean ± SD) over three repetitions ..........................................45
Table 2.6 Percentage of clearly established dominance rank relationships in the G and 2T tests for growing females and pregnant sows (Mean ± SD) over three repetitions ..............45 Table 2.7 Spearman correlations between social ranks obtained with each of the five
methods and individual characteristics of growing females over three repetitions. .............48 Table 2.8 Spearman correlations between social ranks obtained with each of the five
methods and individual characteristics of pregnant sows over three repetitions. .................49
viii
Liste des figures
Figure 1.1 : Types de hiérarchies (Craig, 1986) .....................................................................4 Figure 2.1 Social rank differences obtained between each pair of methods used to determine
social hierarchy (Repetition 1) in growing females and pregnant sows (Mean ± SD) .........41 Figure 2.2 Social rank differences obtained between each pair of methods used to determine
social hierarchy (Repetition 2) in growing females and pregnant sows (Mean ± SD) .........42 Figure 2.3 Social rank differences obtained between each pair of methods used to determine social hierarchy (Repetition 3) in growing females and pregnant sows (Mean ± SD) .........43
Figure 2.4 Average number of body injuries in growing females and pregnant sows recorded after all tests for each repetition (average ± SD; NS P > 0.05)..............................47
1
Introduction
Dans l’industrie porcine, le mélange des animaux est une pratique courante et il résulte
généralement en une augmentation de l’agression associée à l’établissement de la hiérarchie
de dominance (Meese et Ewbank, 1973). Cette organisation sociale a pour avantage de
diminuer les risques de blessures, puisque la majorité des conflits sont résolus par des
menaces et des évitements plutôt que par des combats (Beilharz et Cox, 1967). La
hiérarchie de dominance chez les groupes de porcs et de truies a aussi d’autres impacts. Des
études précédentes ont démontré qu’elle affectait le gain de poids (Tan et Shackleton, 1990;
Hicks et al., 1998), l’apport alimentaire (Hansen et al., 1982; Hsia et Wood-Gush, 1984;
Place et al., 1995; Levasseur et al., 1996), le patron alimentaire (Place et al., 1995;
Levasseur et al., 1996) et le comportement sexuel (Pedersen et al., 1993).
Plusieurs méthodes ont été utilisées pour déterminer le rang social individuel dans un
groupe de porcs, sans établir de consensus pour une seule méthode (Craig, 1986). Par
exemple, le test de groupe (Beilharz et Cox, 1967; Blackshaw et al., 1996), le test en paires
(Brouns et Edwards, 1994; de Jonge et al., 1996) ainsi que le temps total à la mangeoire (de
Jonge et al., 1996; O’Connell et Beattie, 1999) ont été utilisés pour déterminer le rang
social. Peu d’études ont investigué la concordance entre les résultats obtenus par différentes
méthodes, ainsi que leur stabilité dans le temps et les résultats rapportés dans la littérature
ne pointent pas tous dans la même direction. Meese et Ewbank (1972) ont trouvé que
lorsqu’on répétait un test de groupe à 24 heures d’intervalle pour des groupes de porcs
ayant entre 10 et 30 semaines d’âges, les résultats n’étaient pas stables, suggérant que le
rang social des porcs peut changer sans raison apparente. Par contre, Place et al. (1995) ont
trouvé que chez des groupes de porcs en croissance testés avec le test de groupe à trois
reprises, à trois semaines d’intervalle, les résultats étaient significativement corrélés entre
les répétitions. Lafrance (2010) a étudié les corrélations entre les rangs obtenus par des tests
paires et par des tests de groupe et a démontré que très peu des ces corrélations étaient
significatives. Pour leur part, de Jonge et al. (1996) ont testé des paires de cochettes à deux
reprises à 40 semaines d’intervalle et n’ont trouvé qu’une seule différence pour l’ensemble
des paires testées. Enfin, Brouns et Edwards (1994) ont trouvé une corrélation positive et
2
significative entre les rangs assignés lors d’un test de groupe et d’un test en paires chez des
truies.
Le rang social peut être affecté par les caractéristiques individuelles des animaux, mais les
études sont contradictoires sur ce point. Des études ont trouvé une corrélation entre le rang
social et le poids vif (Beilharz et Cox, 1967; O’Connell et Beattie, 1999) alors que d’autres
n’ont trouvé aucune corrélation entre ces paramètres (Meese et Ewbank, 1973; Fraser,
1974, Nielsen et al., 1995; Place et al., 1995; Heo et al., 2005).
Le but de ce présent travail est de vérifier, dans une seule et même expérience, la
concordance et la stabilité dans le temps de cinq méthodes pour mesurer le rang social,
appliquées à des groupes de porcs femelles et de truies en gestation. L’hypothèse est que
les truies gestantes, plus âgées et plus matures, auront une hiérarchie sociale plus stable
dans le temps que les porcs femelles en croissance.
3
1.0 Revue des travaux antérieurs
1.1 Hiérarchies sociales chez les animaux de ferme
Au cours du processus de domestication, les animaux de ferme ont été sélectionnés pour
plusieurs traits. Un des traits de sélection à la base du processus de domestication a été la
sociabilité des animaux, par souci de pouvoir les garder en groupes dans un espace restreint
(Price, 2002). Price (1984) a énuméré trois caractéristiques du comportement social
favorisant la domestication : des groupes sociaux de taille importante, la cohabitation des
mâles et des femelles, et la formation d’une hiérarchie sociale. Le phénomène de hiérarchie
sociale a en effet été démontré pour l’ensemble des animaux de ferme (Guhl, 1962).
1.1.1 Définitions et types de dominance
Selon Drews (1993), la dominance serait un attribut du patron répété d’interactions
agonistiques entre deux individus, caractérisé par un résultat constant en faveur du même
individu de la paire ainsi qu’une réponse d’évitement par défaut chez le perdant plutôt
qu’une escalade des hostilités. L’animal gagnant a un statut de dominant, tandis que le
perdant a un statut de subordonné. La hiérarchie de dominance se forme donc à travers une
suite de rencontres successives entre des paires d’individus du groupe social (Chase et al.,
2003).
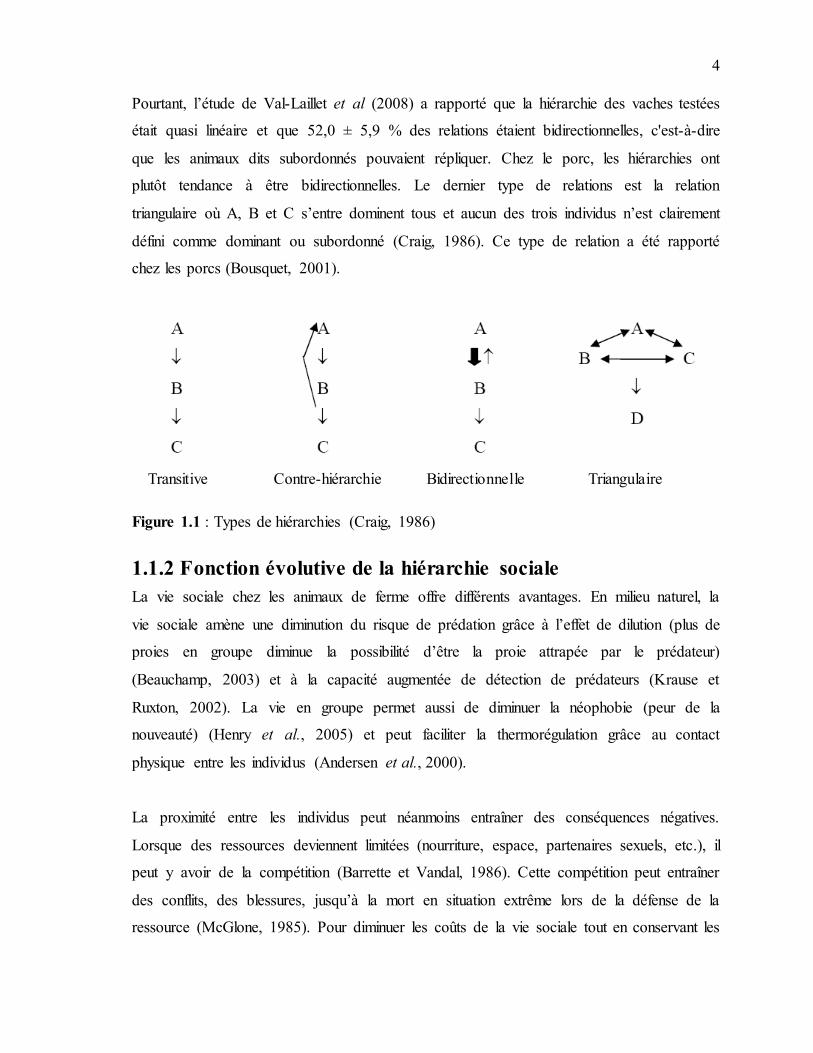
Il y a plusieurs types de liens dans les hiérarchies sociales (Figure 1.1). Les relations
peuvent être linéaires ou transitives lorsqu’elles sont bout à bout (A domine B et B domine
C donc A domine C), ce qui est généralement rapporté chez les animaux de rente comme
les volailles (Chase et al., 2003), les bovins (Schein et Fohrman, 1955) et les porcs (Craig,
1986). Les relations contre-hiérarchiques sont les relations où A domine B et B domine C,
mais C domine A (Appleby, 1982). Les relations bidirectionnelles sont caractérisées par
des interactions agressives entre A et B, où le titre de dominance est obtenu par A grâce à
son plus grand nombre de victoires (Craig, 1986). Chez la poule (Chase et al., 2003) et la
vache (Schein et Fohrman, 1955), les hiérarchies ont tendance à être unidirectionnelles, i.e.
les animaux subordonnés ne répliquent pas lors de menaces ou d’attaques par un dominant.
4
Pourtant, l’étude de Val-Laillet et al (2008) a rapporté que la hiérarchie des vaches testées
était quasi linéaire et que 52,0 ± 5,9 % des relations étaient bidirectionnelles, c'est-à-dire
que les animaux dits subordonnés pouvaient répliquer. Chez le porc, les hiérarchies ont
plutôt tendance à être bidirectionnelles. Le dernier type de relations est la relation
triangulaire où A, B et C s’entre dominent tous et aucun des trois individus n’est clairement
défini comme dominant ou subordonné (Craig, 1986). Ce type de relation a été rapporté
chez les porcs (Bousquet, 2001).
Transitive Contre-hiérarchie Bidirectionnelle Triangulaire
Figure 1.1 : Types de hiérarchies (Craig, 1986)
1.1.2 Fonction évolutive de la hiérarchie sociale
La vie sociale chez les animaux de ferme offre différents avantages. En milieu naturel, la
vie sociale amène une diminution du risque de prédation grâce à l’effet de dilution (plus de
proies en groupe diminue la possibilité d’être la proie attrapée par le prédateur)
(Beauchamp, 2003) et à la capacité augmentée de détection de prédateurs (Krause et
Ruxton, 2002). La vie en groupe permet aussi de diminuer la néophobie (peur de la
nouveauté) (Henry et al., 2005) et peut faciliter la thermorégulation grâce au contact
physique entre les individus (Andersen et al., 2000).
La proximité entre les individus peut néanmoins entraîner des conséquences négatives.
Lorsque des ressources deviennent limitées (nourriture, espace, partenaires sexuels, etc.), il
peut y avoir de la compétition (Barrette et Vandal, 1986). Cette compétition peut entraîner
des conflits, des blessures, jusqu’à la mort en situation extrême lors de la défense de la
ressource (McGlone, 1985). Pour diminuer les coûts de la vie sociale tout en conservant les
5
avantages, les individus ont intérêt à trouver une méthode pour réduire les conflits et les
agressions.
L’existence d’une structure hiérarchique au sein des groupes sociaux peut minimiser les
conséquences d’une telle compétition (Estevez et al., 2007). Une hiérarchie de dominance
se fonde sur des menaces et des évitements plutôt que sur des combats lorsque l’accès à une
ressource devient limité (Lindberg, 2001). Les animaux subordonnés évitent les conflits
avec les animaux dominants puisqu’ils risquent de se blesser et de perdre. Les dominants,
quant à eux, n’ont pas à se battre à chaque fois qu’ils veulent déplacer un animal (Fournier
et Fiesta-Bianchet, 1995).
1.2 Impact des agressions lors du regroupement d’animaux
étrangers
1.2.1 Blessures au moment du regroupement
Les comportements agressifs sont un problème de bien-être majeur en productions
animales. Une meilleure compréhension de la hiérarchie permettrait d’améliorer la gestion
d’élevage, en diminuant les effets négatifs résultant des agressions entres les individus
(Kondo et Hurnik, 1990).
En milieu semi-naturel, les rencontres entre les porcelets d’une même portée et d’autres
individus ont lieu environ 10 jours après la naissance, lorsque le nid a été abandonné et que
la truie et sa portée rejoignent le groupe des autres femelles (Jensen et Yngvesson, 1998).
L’agression observée chez les jeunes est associée au jeu : les simulacres d’interactions et de
combats contribuent à la construction d’un comportement agressif adulte (Petersen et al.,
1989).
Dans les élevages commerciaux de porcs, les mélanges répétés d’animaux non familiers
associés à la constitution de groupes d’animaux au sevrage (4 semaines de vie), en début de
la phase d’engraissement (9 semaines de vie) ou en début de gestation, entraînent
l’établissement de nouvelles hiérarchies dans les groupes constitués (Fraser et Rushen,
6
1987) avec pour conséquence un potentiel élevé de blessures suite aux agressions qui
s’ensuivent (Puppe et al., 2008). Un niveau élevé d’agression, comme celui observé lors du
regroupement de porcs, peut aussi mener à des difficultés d’accès à l’aliment, à l’eau et au
lieu de repos, ainsi qu’à une réduction du temps de repos (Andersen, 2008). Les
regroupements réalisés au moment du transport peuvent aussi générer des combats à
l’origine de lésions corporelles visibles sur la carcasse. Les dommages observés ne sont pas
nécessairement suffisants pour déclasser la carcasse, mais ils peuvent tout de même
engendrer des conséquences par une dépréciation économique (Warriss et Brown, 1985).
Par ailleurs, les combats lors des regroupements peu de temps avant l’abattage entraînent
une accumulation d’acide lactique au niveau du muscle menant à une chute rapide du pH
après l’abattage et à une augmentation de la probabilité de produire de la viande pâle, molle
et exsudative dite PSE (Pale Soft Exudative) (Fernandez et al., 1994). De plus, Lundstroem
et al. (1987) ont déterminé que le mélange des animaux et les agressions qui en découlent
mènent à un épuisement des réserves de glycogène, un pH qui demeure élevé après
l’abattage, et à une plus grande incidence de viande foncée, dure et sèche dite DFD (Dark,
Firm and Dry) pour le jambon.
1.2.2 Système immunitaire, santé et physiologie
Plus que par les simples blessures, les regroupements peuvent aussi affecter la santé des
porcs. En effet, Meese et Ewbank (1972) ont trouvé que le stress associé au regroupement
prédispose les porcs aux maladies, aux infections, voire à la mort de l’animal. Hessing et al.
(1994) ont montré que les porcs subordonnés avait un taux significativement plus élevé de
mortalité et de morbidité que les dominants lors d’une infection au virus de la maladie
d’Aujeszky (ADV) (mortalité : 21,6 % comparativement à 6,3 %; morbidité : 70,3 %
comparativement à 32,0 %). de Groot et al., (2001) ont rapporté une diminution de la
réponse immunitaire à un vaccin viral suite au regroupement de porcs. Le statut
hiérarchique de l’animal peut également conditionner la réponse immunitaire des porcs.
Une prolifération plus faible des lymphocytes ex vivo a été observée après une vaccination
chez des animaux dominants qui ont été mélangés comparativement à des animaux
dominants d’un groupe stable, tandis qu’aucune différence n’est apparue chez les porcs
intermédiaires et subordonnés. Sutherland et al. (2007) ont démontré que lors d’une
7
infection avec le virus du syndrome reproductif et respiratoire porcin (PRRS), le rang social
a eu un effet sur la réponse immunitaire. Les dominants ont montré une concentration
sanguine de globules blancs significativement plus élevée que les subordonnés (2,9 x 10⁷
cellules / ml comparativement à 2,6 x 10⁷ cellules / ml), un pourcentage de macrophages de
classes 1 et 2 plus élevé (44,2 % comparativement à 23,3 %) et une cytotoxicité des cellules
natural killers inférieure (70,0 % comparativement à 87,0 %).
Tuchscherer et al. (1998) ont montré que le rang social avait un effet sur la prolifération des
lymphocytes en réponse à différents mitogènes, tels que la concavanaline A (ConA, la
phytohémaglutinine (PHA), et le pokeweed (PWM). Les porcs dominants ont montré une
prolifération de leurs lymphocytes significativement plus élevée que les subordonnés. De
plus, la prolifération de lymphocytes en réponse au mitogène pokeweed (PWM) est apparue
significativement plus élevée chez les porcs de rangs intermédiaires que chez les dominants
et les subordonnés (Morrow-Tesch et al., 1994). Tuchscherer et al. (1998) ont aussi trouvé
que, suite au mélange, la prolifération des lymphocytes en réponse aux mitogènes ainsi que
la concentration totale d’IgG sérique étaient plus élevées chez les animaux dominants que
chez les subordonnés. Sutherland et al. (2007) ont montré que les dominants avaient un
pourcentage de lymphocytes significativement supérieur et moins de macrophages de classe
5 que les subordonnés (% lymphocytes : 68,0 % comparativement à 64,5 % ; macrophages
classe 5 : 10,5 % comparativement à 10,9 %).
Hicks et al. (1998) ont démontré que le statut social déterminé lors du mélange post-
sevrage avait un effet sur la concentration de globulines sériques qui était plus basse chez
les animaux dominants que chez les animaux de statuts sociaux intermédiaire et
subordonné. Ils ont aussi démontré que la concentration de cortisol plasmatique était plus
élevé chez les animaux de statuts social subordonné que chez les animaux intermédiaires,
mais qu’il n’y avait pas de différences significatives entre la concentration des animaux
dominant et des animaux ou subordonnés ou intermédiaires. Par contre, Tuchscherer et al.
(1998) ont trouvé que la diminution de la concentration de cortisol et de phosphatase
alcaline ainsi que l’augmentation des concentrations de glucose et de protéines totales suite
au mélange sont indépendantes du rang social des animaux.
8
1.2.3 Performances
Les regroupements peuvent aussi affecter les performances des animaux, par une réduction
de la prise alimentaire et du gain moyen quotidien (Stookey et Gonyou, 1994), de la
conversion alimentaire (Ewbank, 1976) et de la croissance (Graves et al, 1978). Les
performances diminuées des animaux peuvent entrainer un apport additionnel en nourriture
et en travail ainsi que des dépenses plus élevées associées à une durée prolongée
d’engraissement (Tan et al., 1991).
Le mélange d’animaux non familiers et les agressions consécutives au mélange peuvent
aussi mener à une diminution du succès reproducteur (Mendl et al., 1992). Ceci se traduit
par la réduction du taux de conception et de la taille de la portée suite au stress du
regroupement au moment de l’implantation embryonnaire (Van der Lende et al., 1993), et
par une diminution de la taille de portée (-0,6 porcelets) chez des truies regroupées lors du
sevrage comparativement à des truies regroupées quatre semaines après (Danske Slagterier,
1995). Bokma (1990) a également rapporté un taux de retour en chaleur doublé lorsque les
truies sont introduites entre un et huit jours après la fécondation comparativement à des
animaux témoins. Le comportement reproducteur est également affecté par le statut
hiérarchique. Pedersen (1993) a décrit moins de comportements sociaux chez les truies
subordonnées, ce qui expliquerait une détection de l’œstrus plus difficile chez ces animaux.
Arey et Edwards (1998) ont trouvé que le regroupement entraîne des problèmes de
reproduction. Par contre, Den Hartog et al. (1996) n’ont trouvé aucune différence entre la
taille de portée et le taux de reproduction chez des truies élevées en groupe
comparativement à des truies élevées en isolement. Cependant, d’autres études sur la truie
n’ont pas trouvé de relation entre l’agression lors du mélange et le succès reproducteur
(Jarvis et al., 2006; Kongsted, 2006).
1.3 Mesurer la hiérarchie chez le porc
1.3.1 Lors de l’établissement
Les interactions lors du regroupement ont été utilisées par McGlone (1986) pour déterminer
le rang social de porcs. Dans son étude, les porcs étaient logés par groupes de quatre. Un
9
des porcs était enlevé du groupe et un nouveau qui n’avait jamais rencontré les autres était
ajouté. Les animaux n’étaient pas mis à jeun avant le test. Un observateur enregistrait
ensuite la durée des attaques données et reçues pour chacun des quatre porcs du groupe.
L’enregistrement des données se faisait pendant les 8 heures suivant le regroupement.
Cette méthode pour déterminer le rang hiérarchique a l’avantage d’examiner
l’établissement de la hiérarchie. De plus, puisque les animaux ne sont pas mis à jeun, le
niveau d’agression n’est pas artificiellement gonflé par la faim (Lindberg, 2001).
Calculer le rang social d’un animal lors de l’établissement de la hiérarchie amène
cependant un problème de logistique : puisque la hiérarchie n’est pas établie, le rang social
d’un porc a le temps et la possibilité de changer si le test est fait avant la fin de
l’établissement qui peut prendre jusqu’à 48 h (Meese et Ewbank, 1973; Olesen et al. 1996).
1.3.2 Après l’établissement
La hiérarchie s’exprime toujours même une fois qu’elle est établie; par contre, son
expression est plus subtile et fonctionne sur des principes d’évitement (Jensen, 1982/83).
Les tests pour déterminer la hiérarchie consistent à mesurer les interactions agonistiques et
l’accès à la mangeoire d’un groupe d’animaux. Les comportements agressifs associés à la
hiérarchie sont plus fréquents lorsque les animaux sont mis en compétition pour une
ressource alimentaire (Duncan et Wood-Gush, 1971). Il est donc pratique commune de
mettre à jeun les animaux et de leur offrir une ressource alimentaire limitée (Ewbank et
Bryant, 1972; Graves et al., 1978) et défendable (Schnebel et Griswold, 1983; Fraser et al.,
1995) pour les tester.
1.3.2.1 Tests de groupe
Typiquement, les porcs sont testés dans leur propre enclos. Le test de groupe a été réalisé
dans des groupes d’animaux dont la taille variait entre 5 (Beilharz et Cox, 1967) et 16
(Stookey et Gonyou, 1994). Cependant, Pedersen et al. (1993) ont utilisé un test dont les
caractéristiques sont celles d’un test de groupe alors que les groupes n’étaient formés que
de deux truies. Les animaux sont mis à jeun pour une durée de 12 h (Beilharz et Cox, 1967)
à 18 h avant le test (O’Connell et Beattie, 1999) ou à « un moment la veille du test » sans
10
être plus précis (Blackshaw et al., 1996). Suite à ce jeûne, les animaux se font compétition
pour s’alimenter dans une mangeoire à accès unique. La fin du test peut être déterminée par
le temps écoulé, soit de 15 min (O’Connell et Beattie, 1999), 20 min (Hansen et al., 1982),
30 min (Beilharz et Cox, 1967; Tan et Shackleton, 1990; Lafrance, 2010), ou 4 h (Bornett
et al., 2000), ou par la cessation des tentatives d’accès à la mangeoire, signalant un manque
d’appétit (Blackshaw et al., 1996). Tout le long du test, les interactions agressives (voir
Tableau 1.1) ainsi que l’identité de l’agresseur et de l’agressé sont enregistrées.
Le test de groupe a comme avantages de ne pas isoler les animaux lors du test, permettant
ainsi de reproduire une situation naturelle où des comportements sociaux plus complexes
comme la coopération et les alliances sociales sont exprimés (Craig, 1986; Lindberg, 2001).
Il peut être fait de façon plus rapide que le test en paires lorsque la taille du groupe est
importante. En effet, le test de groupe peut avoir une durée fixe (Blackshaw et al., 1996)
tandis que pour le test en paires, le nombre de paires à tester augmente exponentiellement
avec l’augmentation du nombre d’animaux dans le groupe, ce qui augmente la durée du test
(Craig, 1986).
Les tests de groupe ont par contre des défauts. Il est parfois difficile d’observer l’ensemble
des animaux à la fois. On peut ainsi perdre de l’information ou manquer des interactions
plus subtiles comme les évitements (Jensen, 1980).
1.3.2.2 Temps total à la mangeoire
Lors du test de groupe, une autre mesure que le comportement agressif peut être utilisée
pour déterminer le rang d’un animal : le temps total pendant lequel un animal occupe la
mangeoire. La mesure est appelée temps total à la mangeoire. Cette mesure a été adaptée de
De Jonge et al. (1996) et O’Connell et Beattie (1999) par Lafrance (2010). Le temps passé
à la mangeoire pour chaque individu est mesuré lors de tests de groupe de 30 min. Cette
valeur individuelle est un indicateur du rang social. Les animaux passant le plus de temps à
la mangeoire seraient les plus dominants (De Jonge et al., 1996; O’Connell et Beattie,
1999; Lafrance, 2010). O’Connell et Beattie (1999) ont aussi regardé le temps moyen à la
mangeoire et la fréquence de combats suite au déplacement d’un individu de la mangeoire.
11
Cependant, ils n’ont pu utiliser ces autres mesures dans leur analyse, puisque ce ne sont pas
tous les animaux qui ont réussi à accéder à la mangeoire lors du test.
O’Connell et Beattie (1999) ont rapporté, chez des porcs en croissance logés dans des
environnements pauvres en stimulations, que le temps passé à la mangeoire lors de tests de
compétition alimentaire était positivement corrélé à la fréquence des combats durant les
confrontations sociales (r = 0,18; P < 0,05) et négativement corrélé avec le score de
dominance (un score plus élevé pour un animal plus dominant) (r = -0,23; P < 0,005). Lors
de la même expérience, mais dans un environnement enrichi, les auteurs ont démontré une
corrélation positive entre la fréquence des combats durant les confrontations sociales lors
de test de compétition alimentaire et le temps passé à la mangeoire (r = 0,15; P < 0,05),
mais il n’y a pas eu de corrélation entre le score de dominance et le temps à la mangeoire.
McGlone (1986) pour sa part, n’a pas trouvé de corrélation significative lorsqu’il a
investigué la relation entre la valeur de dominance et le temps passé à la mangeoire
(r = 0,058).
12
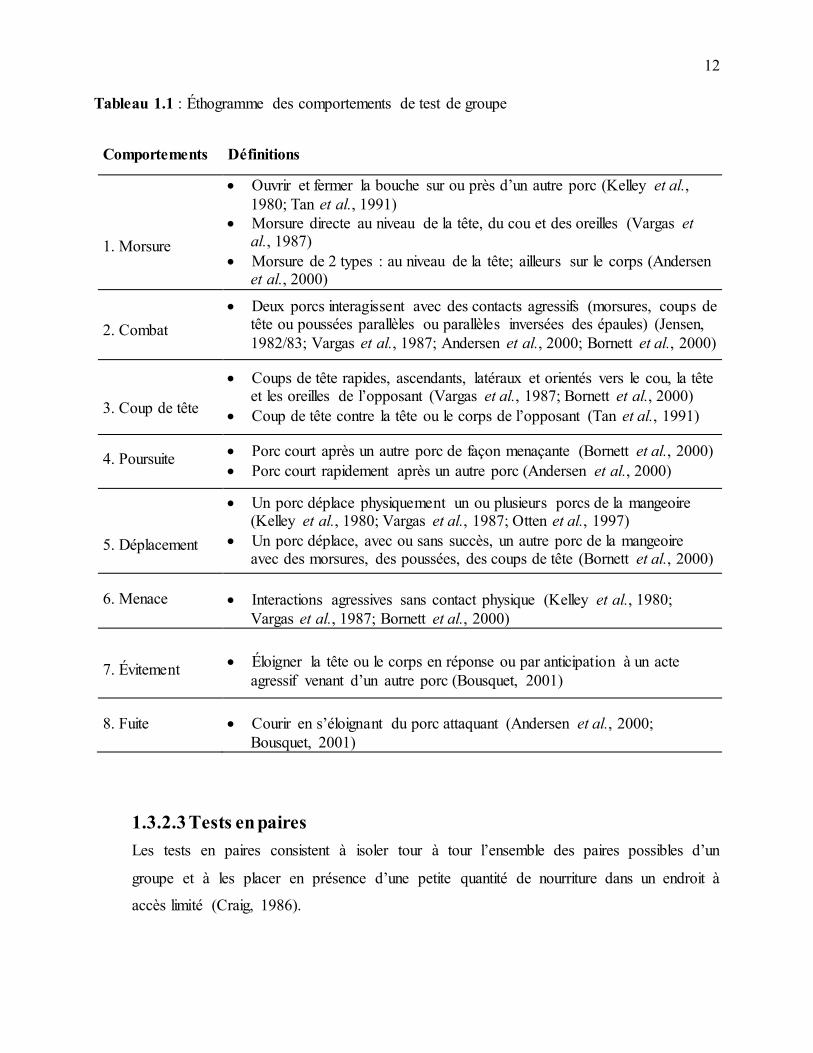
Tableau 1.1 : Éthogramme des comportements de test de groupe
Comportements Définitions
1. Morsure
Ouvrir et fermer la bouche sur ou près d’un autre porc (Kelley et al.,
1980; Tan et al., 1991)
Morsure directe au niveau de la tête, du cou et des oreilles (Vargas et al., 1987)
Morsure de 2 types : au niveau de la tête; ailleurs sur le corps (Andersen et al., 2000)
2. Combat
Deux porcs interagissent avec des contacts agressifs (morsures, coups de tête ou poussées parallèles ou parallèles inversées des épaules) (Jensen,
1982/83; Vargas et al., 1987; Andersen et al., 2000; Bornett et al., 2000)
3. Coup de tête
Coups de tête rapides, ascendants, latéraux et orientés vers le cou, la tête et les oreilles de l’opposant (Vargas et al., 1987; Bornett et al., 2000)
Coup de tête contre la tête ou le corps de l’opposant (Tan et al., 1991)
4. Poursuite Porc court après un autre porc de façon menaçante (Bornett et al., 2000)
Porc court rapidement après un autre porc (Andersen et al., 2000)
5. Déplacement
Un porc déplace physiquement un ou plusieurs porcs de la mangeoire (Kelley et al., 1980; Vargas et al., 1987; Otten et al., 1997)
Un porc déplace, avec ou sans succès, un autre porc de la mangeoire avec des morsures, des poussées, des coups de tête (Bornett et al., 2000)
6. Menace Interactions agressives sans contact physique (Kelley et al., 1980;
Vargas et al., 1987; Bornett et al., 2000)
7. Évitement Éloigner la tête ou le corps en réponse ou par anticipation à un acte
agressif venant d’un autre porc (Bousquet, 2001)
8. Fuite Courir en s’éloignant du porc attaquant (Andersen et al., 2000;
Bousquet, 2001)
1.3.2.3 Tests en paires
Les tests en paires consistent à isoler tour à tour l’ensemble des paires possibles d’un
groupe et à les placer en présence d’une petite quantité de nourriture dans un endroit à
accès limité (Craig, 1986).
13
La méthodologie des tests en paires varie selon les auteurs, tant sur la composition des
paires testées que sur le déroulement ou la localisation du test. Ainsi, Brouns et Edwards
(1994) ont fait un test en paires chez des truies dans un parc expérimental où se trouvait une
mangeoire avec 100 g de nourriture habituelle. L’observateur enregistrait l’ensemble des
comportements agressifs et des déplacements de la mangeoire. Deux ordres hiérarchiques
étaient établis : l’ordre de dominance et l’ordre à la mangeoire. Pour l’ordre de dominance,
le dominant était l’animal qui avait donné au moins deux actes agressifs de plus qu’il en
avait reçues. Pour l’ordre à la mangeoire, le vainqueur était l’animal qui avait déplacé
l’autre animal, gagnant ainsi accès à la nourriture. Le perdant était l’animal déplacé et qui
n’avait pas accès à l’aliment. Pour confirmer le résultat, le test était répété en donnant un
accès prioritaire au perdant du test précédent.
Le test réalisé par De Jonge et al. (1996) avait lieu dans le parc habituel des truies. La
nourriture (200 g) était mise dans l’une des deux mangeoires. L’observateur enregistrait le
temps passé à la mangeoire. Le test durait environ 4 min, soit le temps nécessaire pour
manger 200 g. Le vainqueur était le premier animal qui passait plus de 85 % du temps à la
mangeoire pendant quatre tests consécutifs. Le perdant était l’animal qui passait moins de
15 % à la mangeoire. Le test avait lieu à 30 – 31 semaines d’âge. Il était répété à 70
semaines d’âge pour confirmer les résultats. Dans leur cas, il n’y eut qu’un seul
changement de rang social qui ne semblait pas être la conséquence d’un changement
d’ordre hiérarchique, mais bien causé par une préférence pour une mangeoire particulière
développée chez une paire de truies.
Le test en paires a ses avantages. Il permet d’avoir des données pour l’ensemble des
animaux et ainsi de connaître la relation entre toutes les paires d’animaux. Dans les petits
groupes, il peut accélérer le processus de détermination de la hiérarchie sociale (Craig,
1986). De plus, il permet d’éviter l’impact psychologique que peut avoir un environnement
plus familier pour l’un des individus puisqu’il a lieu dans un environnement neutre.
Le test en paires a par contre ses limites. Par sa conception, les animaux isolés se trouvent
hors du contexte des interactions sociales de l’ensemble du groupe social (Chase et al.,
14
2003). De plus, le test est hautement artificiel (Craig, 1986), par le fait d’amener les
animaux dans un environnement nouveau. Cette situation est anxiogène le plus souvent, ce
qui peut affecter les animaux testés dans leurs réponses au test. Cette limitation peut
toutefois être évitée en permettant une période d’accoutumance au nouvel environnement.
Une autre solution a été amenée par De Jonge et al. (1996), qui ont fait le test dans le parc
habituel des animaux. Le test en paires nécessite aussi plus de manipulations par l’homme,
ce qui peut causer de la peur chez le porc et ainsi conditionner la suite du test. Enfin, le test
ne peut pas tenir compte des relations sociales plus complexes comme les alliances, par
exemple lorsque A domine B seulement en présence de C, mêmes si elles sont rares selon
Craig (1986) et Bousquet (2001). En présence de grands groupes, le test en paires peut
nécessiter plus de temps que le test de groupe. En effet, pour un groupe de 8 animaux, on
doit faire 28 paires pour avoir l’ensemble des interactions. Si on estime le temps d’effectuer
le test pour une paire à 5 min (expérience personnelle), il faut 2 h 10 min pour compléter le
test contre 30 à 60 min pour un test en groupe.
1.3.2.4 Tube de dominance
Le test du tube de dominance a été développé chez la souris par Lindzey et al. (1961). Le
test consiste à placer deux animaux aux extrémités d’un corridor étroit. L’animal qui force
l’autre à reculer est considéré comme dominant. Székely et al. (1982/83) ont adapté ce test
pour déterminer le rang social de porcelets.
Ce test a comme avantage de ne pas mettre à jeun les animaux, diminuant ainsi le risque de
réactions extrêmes engendrées par une trop forte motivation.
Par contre, le test du tube de dominance est tout de même stressant et nécessite un
déplacement dans un environnement étranger. De plus, comme pour le test en paires, la
totalité des paires doivent être testées, nécessitant un temps considérable pour de grands
groupes.
15
1.3.3 Calculs d’indices
1.3.3.1 Indices de rangs hiérarchiques
La détermination du statut hiérarchique s’appuie sur les comportements agonistiques et le
comportement alimentaire dans le cas d’une compétition alimentaire ou plus généralement
pour l’accès à une ressource qui est limitée.
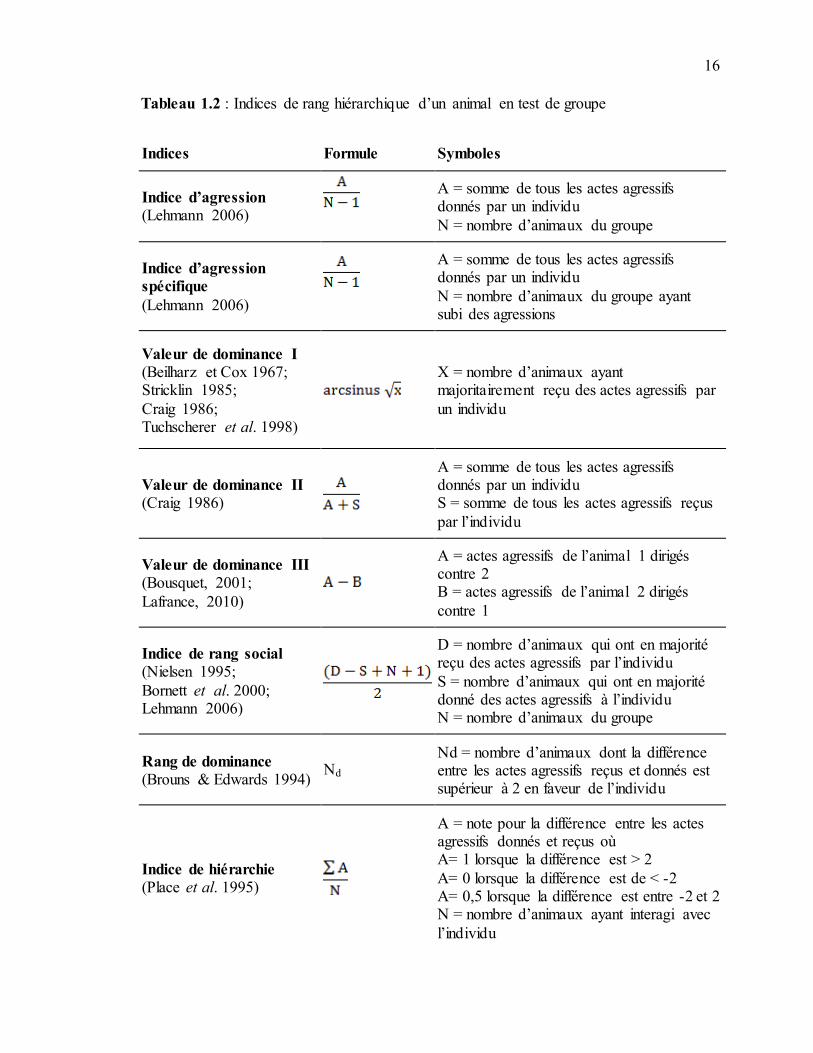
A partir des données obtenues de différents types de tests, le statut est caractérisé par un
indice dont le calcul peut différer selon les auteurs, comme l’illustre le Tableau 1.2.
Une fois les indices ou mesures de rang calculés, le statut de « dominant » ou de
« subordonné » peut être attribué de différentes manières. Il peut être associé à la valeur
proprement dite de l’indice ou du rang de l’animal. Il peut aussi être attribué en comparant
la valeur de l’indice ou du rang de l’animal à un seuil défini. Dans l’étude de Place et al.
(1995), avec un rang déterminé suite à un test de groupe, le seuil a été fixé sur la base d’une
courbe de Gauss après vérification de la distribution normale des données, l’indice variant
entre 0 et 1. Pour un indice plus grand ou égal à 0,75, l’animal a été considéré dominant. Si
l’index était plus petit ou égal à 0,25, l’animal était considéré comme subordonné. Entre ces
deux valeurs, les animaux étaient considérés comme intermédiaires.
Dans l’étude de Bousquet (2001), une méthode pour calculer le pourcentage de relations
clairement définies a été utilisée. Si la différence entre les actes agressifs et les actes de
subordination était plus grande ou égale à 3, le gagnant se voyait attribuer un score de 1,
tandis que le perdant recevait un score de 0. Il s’agissait donc d’une relation clairement
établie. Si l’indice était plus petit ou égal à 2, chacun des animaux se voyait attribuer un
score de 0,5, signe d’une relation qui n’était pas clairement établie. Le nombre de relations
clairement établies était ensuite divisé par le nombre maximal théorique de relations dans le
groupe (N * (N-1) / 2 où N = nombre d’animaux dans le groupe) puis multiplié par 100.
16
Tableau 1.2 : Indices de rang hiérarchique d’un animal en test de groupe
Indices Formule Symboles
Indice d’agression
(Lehmann 2006)
A = somme de tous les actes agressifs donnés par un individu
N = nombre d’animaux du groupe
Indice d’agression
spécifique
(Lehmann 2006)
A = somme de tous les actes agressifs donnés par un individu
N = nombre d’animaux du groupe ayant subi des agressions
Valeur de dominance I
(Beilharz et Cox 1967; Stricklin 1985;
Craig 1986; Tuchscherer et al. 1998)
X = nombre d’animaux ayant majoritairement reçu des actes agressifs par
un individu
Valeur de dominance II
(Craig 1986)
A = somme de tous les actes agressifs donnés par un individu S = somme de tous les actes agressifs reçus
par l’individu
Valeur de dominance III
(Bousquet, 2001;
Lafrance, 2010)
A = actes agressifs de l’animal 1 dirigés contre 2 B = actes agressifs de l’animal 2 dirigés
contre 1
Indice de rang social
(Nielsen 1995;
Bornett et al. 2000; Lehmann 2006)
D = nombre d’animaux qui ont en majorité reçu des actes agressifs par l’individu
S = nombre d’animaux qui ont en majorité donné des actes agressifs à l’individu N = nombre d’animaux du groupe
Rang de dominance (Brouns & Edwards 1994)
Nd Nd = nombre d’animaux dont la différence entre les actes agressifs reçus et donnés est supérieur à 2 en faveur de l’individu
Indice de hiérarchie
(Place et al. 1995)
A = note pour la différence entre les actes agressifs donnés et reçus où A= 1 lorsque la différence est > 2
A= 0 lorsque la différence est de < -2 A= 0,5 lorsque la différence est entre -2 et 2 N = nombre d’animaux ayant interagi avec
l’individu
17
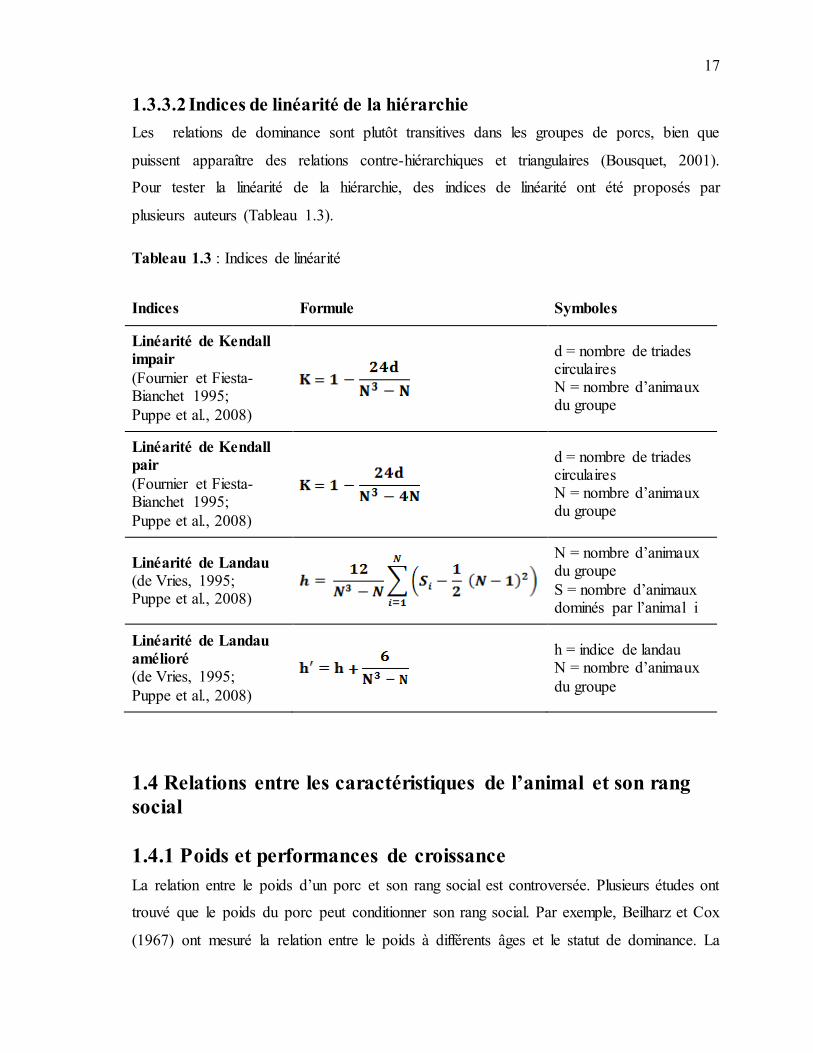
1.3.3.2 Indices de linéarité de la hiérarchie
Les relations de dominance sont plutôt transitives dans les groupes de porcs, bien que
puissent apparaître des relations contre-hiérarchiques et triangulaires (Bousquet, 2001).
Pour tester la linéarité de la hiérarchie, des indices de linéarité ont été proposés par
plusieurs auteurs (Tableau 1.3).
Tableau 1.3 : Indices de linéarité
Indices Formule Symboles
Linéarité de Kendall
impair
(Fournier et Fiesta-Bianchet 1995;
Puppe et al., 2008)
d = nombre de triades circulaires N = nombre d’animaux du groupe
Linéarité de Kendall
pair
(Fournier et Fiesta-Bianchet 1995;
Puppe et al., 2008)
d = nombre de triades circulaires N = nombre d’animaux du groupe
Linéarité de Landau
(de Vries, 1995; Puppe et al., 2008)
N = nombre d’animaux du groupe
S = nombre d’animaux dominés par l’animal i
Linéarité de Landau
amélioré
(de Vries, 1995;
Puppe et al., 2008)
h = indice de landau N = nombre d’animaux
du groupe
1.4 Relations entre les caractéristiques de l’animal et son rang
social
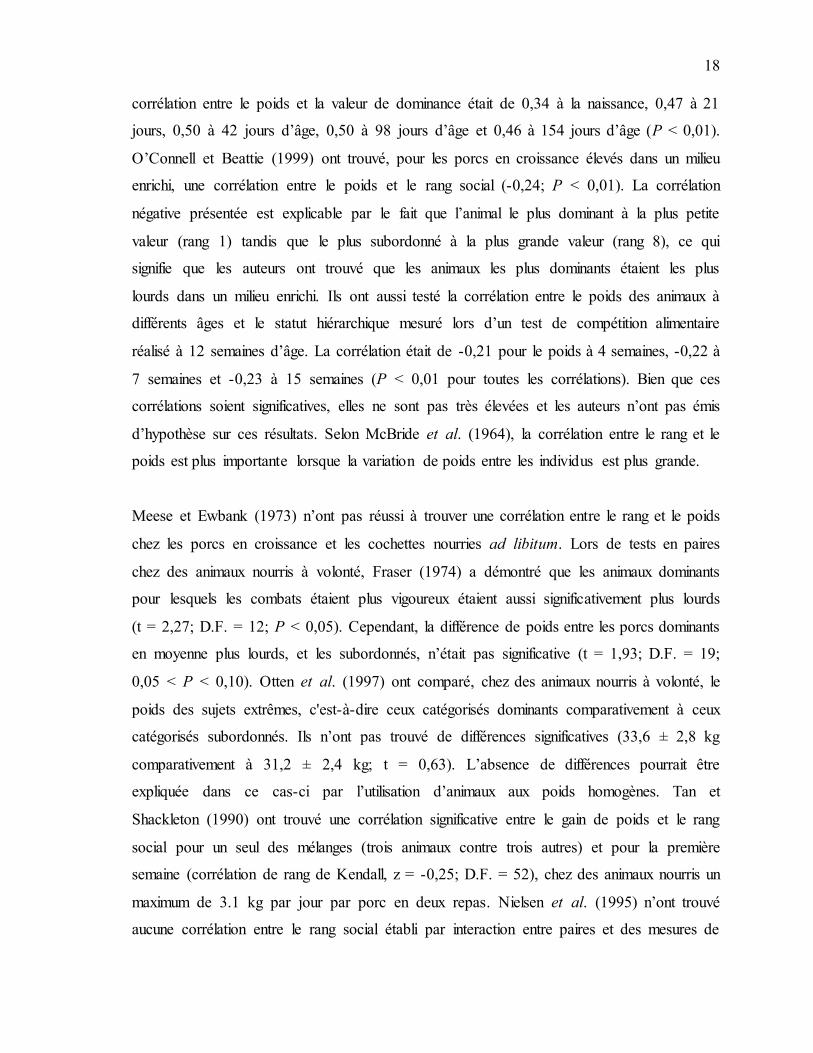
1.4.1 Poids et performances de croissance
La relation entre le poids d’un porc et son rang social est controversée. Plusieurs études ont
trouvé que le poids du porc peut conditionner son rang social. Par exemple, Beilharz et Cox
(1967) ont mesuré la relation entre le poids à différents âges et le statut de dominance. La
18
corrélation entre le poids et la valeur de dominance était de 0,34 à la naissance, 0,47 à 21
jours, 0,50 à 42 jours d’âge, 0,50 à 98 jours d’âge et 0,46 à 154 jours d’âge (P < 0,01).
O’Connell et Beattie (1999) ont trouvé, pour les porcs en croissance élevés dans un milieu
enrichi, une corrélation entre le poids et le rang social (-0,24; P < 0,01). La corrélation
négative présentée est explicable par le fait que l’animal le plus dominant à la plus petite
valeur (rang 1) tandis que le plus subordonné à la plus grande valeur (rang 8), ce qui
signifie que les auteurs ont trouvé que les animaux les plus dominants étaient les plus
lourds dans un milieu enrichi. Ils ont aussi testé la corrélation entre le poids des animaux à
différents âges et le statut hiérarchique mesuré lors d’un test de compétition alimentaire
réalisé à 12 semaines d’âge. La corrélation était de -0,21 pour le poids à 4 semaines, -0,22 à
7 semaines et -0,23 à 15 semaines (P < 0,01 pour toutes les corrélations). Bien que ces
corrélations soient significatives, elles ne sont pas très élevées et les auteurs n’ont pas émis
d’hypothèse sur ces résultats. Selon McBride et al. (1964), la corrélation entre le rang et le
poids est plus importante lorsque la variation de poids entre les individus est plus grande.
Meese et Ewbank (1973) n’ont pas réussi à trouver une corrélation entre le rang et le poids
chez les porcs en croissance et les cochettes nourries ad libitum. Lors de tests en paires
chez des animaux nourris à volonté, Fraser (1974) a démontré que les animaux dominants
pour lesquels les combats étaient plus vigoureux étaient aussi significativement plus lourds
(t = 2,27; D.F. = 12; P < 0,05). Cependant, la différence de poids entre les porcs dominants
en moyenne plus lourds, et les subordonnés, n’était pas significative (t = 1,93; D.F. = 19;
0,05 < P < 0,10). Otten et al. (1997) ont comparé, chez des animaux nourris à volonté, le
poids des sujets extrêmes, c'est-à-dire ceux catégorisés dominants comparativement à ceux
catégorisés subordonnés. Ils n’ont pas trouvé de différences significatives (33,6 ± 2,8 kg
comparativement à 31,2 ± 2,4 kg; t = 0,63). L’absence de différences pourrait être
expliquée dans ce cas-ci par l’utilisation d’animaux aux poids homogènes. Tan et
Shackleton (1990) ont trouvé une corrélation significative entre le gain de poids et le rang
social pour un seul des mélanges (trois animaux contre trois autres) et pour la première
semaine (corrélation de rang de Kendall, z = -0,25; D.F. = 52), chez des animaux nourris un
maximum de 3.1 kg par jour par porc en deux repas. Nielsen et al. (1995) n’ont trouvé
aucune corrélation entre le rang social établi par interaction entre paires et des mesures de
19
production, telles que la prise alimentaire quotidienne, le gain moyen quotidien et le taux
de conversion alimentaire chez des animaux nourris à volonté. Aucune relation n’a été
trouvée entre la dominance et le taux de croissance (Blackshaw et al., 1994; 1997) et le
poids (r = 0,05, P < 0,10) (Place et al., 1995) chez des animaux nourris à volonté, et entre la
dominance et le gain de poids chez des animaux restreints (Brouns et Edwards, 1994). La
seule relation trouvée par Brouns et Edwards (1994) est que chez les truies nourries à même
le sol, les plus subordonnées avaient un gain de poids vif significativement inférieur à celui
des plus dominantes (28,3 kg et 22,4 kg comparativement 46,3 kg et 44,9 kg; P < 0,03).
Aucune différence n’a été observée chez les truies nourries ad libitum. Heo et al. (2005)
n’ont pas trouvé de différence entre le poids (SEM 1,1) ou le GMQ (SEM 0,06) des
animaux dominants et celui des intermédiaires et des subordonnés.
La relation semble plus claire chez le porcelet. Hicks et al. (1998) ont trouvé que les
dominants (Dom) étaient significativement plus lourds que les intermédiaires (Int) et
subordonnés (Sub) et ce, que ce soit au sevrage (moyenne ± écart type; Dom = 7,8 ± 0,26
kg; Int = 6,8 ± 0,26 kg; Sub = 6,9 ± 0,26 kg; P < 0,02) ou à la fin de l’expérience, 20 jours
plus tard (Dom = 12,0 ± 0,39 kg; Int = 10,4 ± 0,39 kg; Sub = 10,4 ± 0,39 kg; P < 0,004). Ils
ont aussi démontré que le GMQ était significativement supérieur (P < 0,03) chez les
dominants (0,40 ± 0,02 kg) que chez les intermédiaires (0,31 ± 0,02 kg) et les subordonnés
(0,35 ± 0,02 kg). Hessing et al. (1994) ont rapporté chez les porcelets une relation positive
et significative entre le poids à la naissance et le statut social déterminé par le test de paires
(rpearson = 0,47; P < 0,01). Ils ont aussi montré que le poids à la naissance était responsable
de 22 % de la variation du statut social d’un individu (r2 = 0,221; P < 0,05). Hicks et al.
(1998) ont démontré que le statut social déterminé lors du mélange post-sevrage avait un
effet sur le poids corporel et le changement de poids. Les porcs dominants étaient plus
lourds que les porcs intermédiaires et subordonnés au sevrage.
Hansen et al. (1982) ont trouvé une corrélation négative entre le rang social et l’activité
alimentaire de r = -0,41 (P < 0,0001) dans le cas d’une situation de forte compétition chez
le porc. Dans ce cas-ci, les rangs étaient déterminés lors d’un test de groupe. Hsia et Wood-
Gush (1984) ont démontré que les porcs dominants mangeaient plus que les subordonnés
20
dans des tests de paires pendant 30 min lors de l’introduction d’un animal affamé (0,86 kg
comparativement à 0,55 kg). Ils ont aussi trouvé dans cette situation que les dominants
mangeaient significativement plus que les subordonnés (P < 0,005). Place et al. (1995) ont
étudié l’impact du rang social sur l’expression du comportement alimentaire des porcs en
croissance. Ils ont trouvé que les porcs dominants font des repas 30 % plus petits, plus
nombreux (+ 2) et 20 % plus longs comparativement aux subordonnés. De plus ils ingèrent
plus d’aliment par jour (+ 100 g) et ingèrent à une vitesse plus lente (2 g/min). Le même
type de résultats a été rapporté par Levasseur et al. (1996), dans une étude comparant des
animaux nourris à volonté à des animaux rationnés. En situation ad libitum, les
subordonnés faisaient 12 % moins de repas et ingéraient 33 % plus d’aliment par repas que
les dominants. La situation s’inversait dans les groupes de porcs rationnés : les dominants
faisaient 35 % moins de repas et ingéraient 31 % plus d’aliment par repas.
1.4.2 Épaisseur de gras dorsal
Beilharz et Cox (1967) ont trouvé une corrélation positive de r = 0,34 (P < 0,01) entre
l’épaisseur de gras dorsal et le rang social. Ils ont obtenu une corrélation positive de r =
0,46 (P < 0.01) entre le poids et le rang social. La corrélation entre le rang social et
l’épaisseur de gras dorsal serait donc expliquée par la corrélation entre le poids et
l’épaisseur de gras dorsal.
1.4.3 Dimensions corporelles
Selon Brouns et Edwards (1994), il n’y a pas de lien clair entre les dimensions corporelles
et le rang social. Par contre, chez la vache laitière, les animaux dominants sont plus grands
(Arave et Albright, 1975). Il est important de noter que les dimensions ainsi que le poids
d’un animal peuvent être la cause, mais il est possible qu’elles soient la conséquence du
rang social, comme chez le cerf élaphe (Appleby, 1982) et chez le saumon atlantique
(Huntingford et al, 1990).
21
1.4.4 Âge
Peu d’études ont cherché à voir le lien entre l’âge et la dominance. Brouns et Edwards
(1994) ont trouvé une corrélation entre la parité et le rang social déterminé lors d’un test en
paires dans trois groupes de truies sur quatre, bien qu’ils n’aient pas indiqué pas la valeur
du coefficient. Ils ont expliqué l’absence de corrélation dans le quatrième groupe entre la
parité et le rang social déterminé lors d’un test en paires par une plus grande homogénéité
des parités. Par contre, il n’y avait pas eu de corrélation entre la parité et le rang social
déterminé par un test en groupe pour les mêmes groupes de truies.
1.4.5 Comportement
Le comportement sexuel d’une truie est affecté par son rang social. Pedersen et al. (1993)
ont démontré que les truies dominantes, comparativement aux subordonnées, passaient
significativement plus de temps à proximité du verrat lorsqu’il se trouvait dans la cage
adjacente, passaient plus de temps debout et en position de reproduction lors de l’œstrus, et
se sauvaient moins lors du test de réceptivité (0 % contre 40 %).
Blackshaw et al. (1994) ont trouvé que le rang social (établi lors d’un test de groupe) d’un
porc était positivement mais faiblement corrélé au leadership d’un animal (r = 0,140; P <
0,05), défini ici comme la volonté d’un porc à emprunter, parmi les premiers, un corridor
entre deux espaces. Blackshaw et al. (1997) n’ont pas trouvé de corrélation entre le rang
social et la latence à toucher un nouvel objet chez le porc.
Lors de situations de regroupement, les animaux qui sont dominants ou subordonnés après
l’établissement de la hiérarchie décrivent des profils de réponses différents dans le cas
d’une réintroduction dans leurs groupes après une période d’absence. Ainsi Otten et al.
(2002) ont étudié l’effet des expériences de victoire ou de défaite chez des porcs dominants
retirés du groupe puis réintroduits. Les porcs subissant une majorité de défaites lors de la
réintroduction montraient des concentrations d’adrénaline et de noradrénaline plasmatiques
plus basses que ceux ayant une majorité de victoires (P < 0,01 et P < 0,01). Les animaux
subissant plus de défaites montraient aussi moins de locomotion (F(1,11) = 4,95; P < 0,05),
passaient plus de temps couchés (F(19,209) = 1,88; P < 0,05) et faisaient moins
22
d’exploration (F(1,10) = 13,70; P < 0,01). Selon Otten et al. (2002), les animaux ayant été
dominants et qui subissent des défaites démontreraient plus de comportements de
soumission et de stimulation hormonale, potentiellement liés à une détresse.
1.5 Effets de facteurs externes sur la hiérarchie des animaux
1.5.1 Densité d’élevage
En situation de densité élevée, les animaux subordonnés éprouvent des problèmes à
exprimer les comportements de soumission qui réduiraient les comportements agressifs des
dominants (Turner et al., 2000). Ils ont aussi plus de difficultés à fuir les animaux
dominants. Les animaux dominants éprouvent aussi certaines difficultés lorsque la densité
est élevée. Il leur est plus difficile de bien se positionner pour combattre, c'est-à-dire
épaule-à-épaule (Lindberg, 2001). Lorsque la densité est plus faible, les animaux ont moins
de lésions cutanées puisque les comportements de menace, de fuite et d’évitement sont
privilégiés (Turner et al., 2000).
1.5.2 Stabilité de la hiérarchie dans le temps
Wilson (1975) a suggéré que la formation d’une hiérarchie linéaire impliquait un ordre
social stable. Pourtant, peu d’études se sont intéressées à la stabilité de la hiérarchie. Meese
et Ewbank (1972) ont trouvé qu’elle pouvait subir de fréquentes altérations chez des
groupes de mâles castrés et femelles entre 10 et 30 semaines. En 24 h, les animaux peuvent
changer de rang et ce, sans raison apparente. Pour quatre groupes de huit porcs, il y a eu
deux animaux qui ont changé de rang dans le premier groupe, trois dans le deuxième et
quatre dans le troisième et quatrième. La corrélation entre les résultats pris à 24 h
d’intervalle était de 0,98, 0,93, 0,86 et 0,83 (P < 0,05) pour les quatre groupes
respectivement. Les changements semblent affecter principalement les animaux
intermédiaires et subordonnées. Les animaux les plus dominants semblent davantage à
l’abri des modifications de l’ordre social. De Jonge et al. (1996) ont regardé la hiérarchie
établie par des tests en paires à 30 et 70 semaines chez des cochettes. Ils n’ont trouvé
qu’une seule différence temporelle, c'est-à-dire une seule paire d’animaux dont le rang
social a changé, pour l’ensemble des résultats. Place et al. (1995) ont démontré une certaine
23
stabilité de la hiérarchie chez des groupes de porcs en croissance-finition, soumis à trois
tests de compétition alimentaire dans leur parc de croissance, le premier réalisé une
semaine après l’entrée dans le bâtiment d’engraissement. En effet, les résultats décrivent
une corrélation de 0,57 (P < 0,001) entre les premiers et deuxièmes tests (trois semaines
plus tard) et une corrélation de 0,55 (P < 0,001) entre les premiers et troisièmes tests (six
semaines plus tard). La répétabilité du test de tube de dominance s’est aussi montrée très
élevée chez les porcelets. En effet, la corrélation entre deux répétitions à 24 h de différence
s’est située entre 0,68 et 0,98 (Székely et al (1982/83).
24
Bibliographie
Andersen, I. L., Andenæs, H., Bøe, K.E., Jensen, P., Bakken, M., 2000. The effects of weight asymmetry and resource distribution on aggression in groups of unacquainted
pigs. Applied Animal Behaviour Science 68, 107-120. Andersen, H. M.-L., Jorgensen, E., Dybkjaer, L., Jorgensen, B., 2008. The ear skin
temperature as an indicator of the thermal comfort of pigs. Applied Animal Behaviour Science 113, 43-56.
Appleby, M.C. 1982. The consequences and causes of high social rank in Red Stags.
Behaviour, 80, 259-273. Arave, C.W., Albright, J.L. 1975. Social rank and physiological traits of dairy cows as
influenced by charging group membership. Journal of Dairy Science, 59, 5, 974-981. Arey, D. S., Edwards, S.A., 1998. Factors influencing aggression between sows after mixing
and the consequences for welfare and production. Livestock Production Science 56,
61-70. Barrette, C. & Vandal, D., 1986. Social rank, dominance, antler size, and access to food in
snow-bound wild woodland caribou. Behaviour 97, 118-146. Beauchamp, G., 2003. Group-size effects on vigilance: a search for mechanisms. Behavioral
Process 63, 111–121.
Beilharz, R. G., Cox, D.F., 1967. Social dominance in swine. Animal Behaviour 15, 117-122.
Blackshaw, J. K., Thomas, F.J., Blackshaw, A.W., 1994. The relationship of dominance, forced and voluntary leadership and growth rate in weaned pigs. Applied Animal Behaviour Science 41, 263-268.
Blackshaw, J. K., Thomas, F.J., Lee, J.-A.,1997. The effect of a fixed or free toy on the growth rate and aggressive behaviour of weaned pigs and the influence of hierarchy
on initial investigation of the toys. Applied Animal Behaviour Science 53, 203-212. Bokma, S., 1990. Housing and management of dry sows in group in practice: partly slatted
systems. Proceedings of an International Symposium on Electronic Identification in
Pig Production. RASE, Stoneleigh, UK, pp. 37–45. Bornett, H. L. I., Morgan, C.A., Lawrence, A.B., Mann, J., 2000. The effect of group
housing on feeding patterns and social behaviour of previously individually housed growing pigs. Applied Animal Behaviour Science 70, 127-141.
Bousquet, C. 2001. Étude des relations de dominance-subordination chez le porc
domestique en croissance : élaboration d’un index de hiérarchie et d’une méthode de classement. Rapport de stage de Maîtrise de Biologie Cellulaire et Physique, Option
Physiologie animale, 1-25. Brouns, F., Edwards, S.A., 1994. Social rank and feeding behaviour of group-housed sows
fed competitively or ad libitum. Applied Animal Behaviour Science 39, 225-235.
Chase, I.D., Tovey, C., Murch, P., 2003. Two’s company, three’s a crowd: differences in dominance relationships in isolated versus socially embedded pairs of fish.
Behaviour 140, 1193–1217. Craig, J. V., 1986. Measuring social behavior: social dominance. Journal of Animal Science
62, 1120-1129.
Danske Slagterier, 1995. Transfer strategy. In: Annual Report, The National Committee for Pig Breeding, Health and Production. Danske Slagterier, Copenhagen, p. 16.
25
de Groot, J., Ruis, M.A.W., Scholten, J.W., Koolhaas, J.M., Boersma, W.J.A., 2001. Long-term effects of social stress on antiviral immunity in pigs. Physiology and Behavior 73, 145-158.
de Jonge, F. H., Bokkers, E.A.M., Schouten, W.G.P., Helmond, F.A., 1996. Rearing piglets in a poor environment: developmental aspects of social stress in pigs. Physiology and
Behavior 60, 389-396. de Vries, H., 1995. An improved test of linearity in dominance hierarchies containing
unknown or tied relationships. Animal Behaviour, 50, 1375–1389.
Den Hartog, L.A., Vermeer, H.M., Swinkels, J.W.G.M., Verdoes, N., Backus, G.B.C., 1996. Applied research on new pig housing systems. Proceedings of the 47th Annual
Meeting of the European Society of Animal Production, Lillehammer. Drews, C. 1993. The concept and definition of dominance in Animal Behaviour. Behaviour,
125, 283-313.
Duncan, I.J.H., Wood-Gush, D.G.M. 1971. Frustration and aggression in the domestic fowl. Animal Behaviour, 19, 500-504
Estevez, I., Andersen, I.-L. Naevdal, E. 2007. Group size, density and social dynamics in farm animals. Applied Animal Behaviour Science, 103, 185-204.
Ewbank, R., Bryant, M.J., 1972. Aggressive behaviour amongst groups pf domesticated pigs
kept at various stocking rates. Animal Behaviour 22, 473-480. Ewbank, R., 1976. Social hierarchy in suckling and fattening pigs: a review. Livestock
Production Science 3, 363-372. Fernandez, X., Forslid, A., Tornberg, E. 1994. The Effect of High post-mortem temperature
on the development of Pale, Soft and Exudative pork: Interaction with Ultimate pH.
Meat Science, 37, 133-147. Fournier, F., Festa-Bianchet, M. 1995. Social dominance in adult female mountain goats.
Animal Behaviour, 49, 1449-1459.
Fraser, D., 1974. The behaviour of growing pigs during experimental social encounters. Journal of Agricultural Science 82, 147–163.
Fraser, D., Rushen, J., 1987. Aggressive Behavior. The Veterinary clinics of North America : Food Animal Practice 3, 285-305.
Fraser, D., Kramer, D.L., Pajor, E.A., Weary, D.M. 1995. Conflict and cooperation:
sociobiological principles and the behavior of pigs. Applied Animal Behaviour Science 44, 139-157.
Graves, H. B., Graves, K.L., Sherritt, G.W., 1978. Social behavior and growth of pigs following mixing during the growing-finishing period. Applied Animal Ethology 4, 169-180.
Guhl, A. M., 1962. The social environment and behaviour. In: The Behaviour of Domestic Animals (Ed. by E. S. E. Hafez), pp. 96-108. Baltimore: Williams and Williams.
Hansen, L. L., Hagelsø, A.M., Madsen, A., 1982. Behavioural results and performance of bacon pigs fed ad libitum from one or several self-feeders. Applied Animal Ethology 8, 307-333.
Henry, S., Hemery, D., Richard, M.-A., Hausberger, M., 2005. Human–mare relationships and behaviour of foals toward humans. Applied Animal Behaviour Science 93, 341–
362. Heo, J., Kattesh, H.G., Roberts, M.P., Morrow, J.L., Dailey, J.W., Saxton, M.A., 2005.
Hepatic corticosteroid-binding globulin (CBG) messenger RNA expression and
26
plasma CBG concentrations in young pigs in response to heat and social stress. Journal of Animal Science 83, 208-215.
Hessing, M. J. C., Scheepens, C.J.M., Schouten, W.G.P., Tielen, M.J.M., Wiepkema, P.R.,
1994. Social rank and disease susceptibility in pigs. Veterinary Immunology and Immunopathology 43, 373-387.
Hicks, T.A., McGlone, J.J., Whisnant, C.S., Kattesh, H.G., Norman, R.L., 1998. Behavioral, endocrine, immune, and performance measures for pigs exposed to acute stress. Journal of Animals Science 76, 474-483.
Hsia, L. C., Wood-Gush, D.G.M., 1983/84. The temporal patterns of food intake and allelomimetic feeding by pigs at different ages. Applied Animal Ethology 11, 271-
282. Huntingford, F.A., Metcalfe, N.B., Thorpe, J.E., Graham, W.D., Adams, C.E. 1990. Social
dominance and body size in Atlantic salmon parr, salmo salar L. Journal of Fish
Biology, 36, 877-881. Jarvis, S., Moinard, C., Robson, S.K., Baxter, E., Ormandy, E., Douglas, A.J., Seckl, J.R.,
Russell, J.A., Lawrence, A.B., 2006. Programming the offspring of the pig by
prenatal social stress: Neuroendocrine activity and behavior. Hormones and Behavior 49, 68-80.
Jensen, P., 1980. An ethogram of social interaction patterns in group-housed dry sows. Applied Animal Ethology 6, 341-350.
Jensen, P., 1982/83. An analysis of agonistic interaction patterns in group-housed dry sows - Aggression regulation through an "avoidance order". Applied Animal Ethology 9, 47-61.
Jensen, P., Yngvesson, J., 1998. Aggression between unacquainted pigs -- sequential assessment and effects of familiarity and weight. Applied Animal Behaviour Science 58, 49-61.
Kelley, K. W., McGlone, J.J., Gaskins, C.T., 1980. Porcine aggression: measurement and effects of crowding and fasting. Journal of Animal Science 50, 336-341.
Kondo, S., Hurnik, J.F., 1990. Stabilization of social hierarchy in dairy cows. Applied Animal Behaviour Science 27, 287-297.
Kongsted, A.G., 2006. Relation between reproduction performance and indicators of feed
intake, fear and social stress in commercial herds with group-housed non-lactating sows. Livestock Science 101, 45-56.
Krause, J., Ruxton, G.D., 2002. Living in groups. In: Oxford Series in Ecology and Evolution. Oxford University Press, Oxford, 210 pp.
Lafrance, J. 2010. Effet de la hiérarchie sociale sur le comportement alimentaire du porc
dans un contexte d’antibiothérapie administrée par l’aliment. Master thesis, Université Laval.
Lehman, K., Kallweit, E., Ellendorf, F. 2006. Social hierarchy in exercised and untrained group-housed horses – A brief report. Applied Animal Behaviour Science, 96, 343-347.
Levasseur, P., Courboulay, V., Meunier-Salaün, M.C., Trespeuch, P., Le Denmat, M., 1996. Alimentation automatisée des porcs en finition. Journées Recherche Porcine France
28, 439-444. Lindberg, A.C., 2001. Group life. In: Keeling, L.J. and Gonyou H.W (eds.), Social
Behaviour in Farm Animals. CAB International, pp. 37-58.
27
Lindzey, G., Winston, H. and Manosevitz, M., 1961. Social dominance in inbred mouse strains. Nature, 191, 474-476.
Lundstroem, K., Malmfoers, B., Malmfoers, G., Stern, S. 1987. Meat quality in boars and
gilts after immediate slaughter or lairage for two hours. Swedish Journal of Agricultural Research, 17, 51-56.
McBride, G., James, J.W. and Hodgens, N., 1964. Social behaviour of domestic animals. IV. Growing pigs. Animal Production, 6, 129-139.
McGlone, J.J., 1985. A quantitative ethogram of aggressive and submissive behaviours in
recently regrouped pigs. Journal of Animal Science, 61, 559–565. McGlone, J. J., 1986. Influence of resources on pig aggression and dominance. Behavioural
Processes 12, 135-144. Meese, G.B., Ewbank, R., 1972. A note on instability of the dominance hierarchy and
variations in level of aggression within groups of fattening pigs. Animal Production
14, 359-362. Meese, G. B., Ewbank, R., 1973. The establishment and nature of the dominance hierarchy
in the domesticated pig. Animal Behaviour 21, 326-334. Mendl, M., Zanella, A.J., Broom, D.M., 1992. Physiological and reproductive correlates of
behavioural strategies in female domestic pigs. Animal Behaviour 44, 1107-1121.
Morrow-Tesch, J. L., McGlone, J.J., Salak-Johnson, J.L., 1994. Heat and social stress effects on pig immune measures. Journal of Animal Science 72, 2599-2609.
Nielsen, B.L., Lawrence, A.B., Whittemore, C.T., 1995. Effect of group size on feeding behaviour, social behaviour, and performance of growing pigs using single-space feeders. Livestock Production Science 44, 73-85.
O’Connell, N.E., Beattie, V.E., 1999. Influence of environmental enrichment on aggressive behaviour and dominance relationship in growing pigs. Animal Welfare 8, 269-279.
Olesen, L.S., Nygaard, C.M., Friend, T.H., Bushong, D., Knabe, D.A., Vestergaard, K.S.,
Vaughan, R.K., 1996. Effect of partitioning pens on aggressive behavior of pigs regrouped at weaning. Applied Animal Behaviour Science 46, 167-174.
Otten, W., Puppe, B., Stabenow, B., Kanitz, E., Schön, P.C., Brüssow, K.P., Nürnberg, G.,1997. Agonistic interactions and physiological reactions of top- and bottom-ranking pigs confronted with a familiar and an unfamiliar group: Preliminary results.
Applied Animal Behaviour Science 55, 79-90. Otten, W., Puppe, B., Kanitz, E., Schön, P.C., Stabenow, B., 2002. Physiological and
behavioral effects of different success during social confrontation in pigs with prior dominance experience. Physiology and Behavior 75, 127-133.
Pedersen, L.J., Rojkittikhun, T., Einarsson, S., Edgvist, L.-E., 1993. Postweaning grouped
sows: effects of aggression on hormonal patterns and oestrous behavior. Applied Animal Behaviour Science 38, 25-39.
Petersen, H.V., Vestergaard, K. and Jensen, P., 1989. Integration of piglets into social groups of free-ranging domestic pigs. Applied Animal Behaviour Science 23, 223-236.
Place, G., Labroue, F., Meunier-Salaün, M.-C., 1995. Incidence du statut social sur le comportement alimentaire de porcs en croissance dans un système de distribution
individuelle informatisée. Journées Recherche Porcine en France 27, 183-188. Price, E.O. 1984. Behavioral aspects of animals domestication. The Quarterly review of
Biology. 59,1-32.
28
Price, E. O. 2002. Pre-adaptations for Domestication. In Price, E.O., Animal domestication and behavior.CAB International, pp. 21-30.
Puppe, B., Langbein, J. Bauer, J. Hoy, S., 2008. A comparative view on social hierarchy
formation at different stages of pig production using sociometric measures. Livestock Science 113, 155-162.
Schein, M.W., Fohrman, M.H., 1955. Social dominance relationships in a herd of dairy cattle. British Journal Animal Behaviour 3, 45–55.
Schnebel, E.M., Griswold, J.G., 1983. Agonistic interactions during competition for
different resources in captive European wild pigs (Sus scrofa). Applied Animal Ethology 10, 291-300.
Stookey, J.M., Gonyou, H.W., 1994. The effects of regrouping on behavioral and production parameters in finishing swine. Journal of Animal Science 72, 2804-2811.
Stricklin, W.R., Krautz-Scanavy, C.C., Greger, D.L. 1985. Determination of dominance-
subordinance relationships among beef heifers in a dominance tube. Applied Animal Behaviour Science, 14, 111-116.
Sutherland, M.A., Niekamp, S.R., Johnson, R.W., Van Alstine, W.G., Salak-Johnson, J.L. 2007. Heat and social rank impact behavior and physiology of PRRS-virus-infected pigs. Physiology and Behavior 90, 73–81.
Székely, S., Orbán, E., Kurucz, I., Sárváry, J., 1982/1983. Tube dominance in piglets: structure and stability of dominance order. Applied Animal Ethology 9, 279-288.
Tan, S.S.L., Shackleton, D.M., 1990. Effects of mixing unfamiliar individuals and of azaperone on the social behaviour of finishing pigs. Applied Animal Behaviour Science 26, 157-168.
Tan, S.S.L., Shackleton, D.M., Beames, R.M., 1991. The effect of mixing unfamiliar individuals on the growth and production of finishing pigs. Animal Production 52, 201-206.
Tuchscherer, M., Puppe, B., Tuchscherer, A., Kanitz, E., 1998. Effects of social status after mixing on immune, metabolic and endocrine responses in pigs. Physiology and
Behavior 64, 353-360. Turner, S.P., Ewen, M., Rooke, J.A., Edwards, S.A., 2000. The effect of space allowance on
performance, aggression and immune competence of growing pigs housed on straw
deep-litter at different group sizes. Livestock Production Science 66, 47-55. Val-Laillet, D., de Passillé, A.M., Rushen, J., von Keyserlingk, M.A.G., 2008. The concept
of social dominance and the social distribution of feeding-related displacements between cows. Applied Animal Behaviour Science 111, 158-172.
Vargas, J.V., Craig, J.V., Hines, R.H., 1987. Effects of feeding systems on social and
feeding behavior and performance of finishing pigs. Journal of animal science 65 , 2, 463-474.
Van der Lende, T., Soede, N.M., Kemp, B.V. 1993. Embryo mortality and prolificacy in the pig. In: Cole, D.J.A., Wiseman, J., Varley, M.A. (Eds.), Principles of Pig Science. Nottingham University Press, pp. 297–317.
Warriss, P., Brown, S.N., 1985. The physiological responses to fighting in pigs and consequences for meat quality. Journal of the Science of Food and Agriculture 36,
87–92. Wilson, E.O., 1975. Sociobiology: The New Synthesis. The Belknap Press of Harvard
University Press, Cambridge, MA.
29
2.0 Stability of social hierarchy in growing female pigs and
pregnant sows
Jean-Philippe Parenta*, Marie-Christine Meunier-Salaünb, Elsa Vasseurc and Renée Bergerond a Département des sciences animales, Université Laval, Québec, Qc, Canada, G1K 7P4, [email protected] b Agro Campus Ouest INRA-UMR SENAH, Saint-Gilles, 35590, France,
c PARC-Agassiz, Agriculture and Agri-Food Canada, Agassiz, BC, Canada, V0M 1A0
d Université de Guelph-Campus d’Alfred, Alfred, ON, Canada, K0B 1A0
2.1 Abstract
Conflicting results between dominance tests and repetitions of these tests over time in pigs
may be related with the lack of stability of their social hierarchy. The objectives of this
study were to compare five methods to measure social hierarchy and to examine the
stability of test results over time in groups of growing females and pregnant sows. Three
dominance tests based on food competition were performed on groups of growing and
pregnant females: group test with one trough (G), group test with two troughs (2T) and
dyadic test (D). Two measures of time spent at the feeder (total trough time) were also done
during the group tests with one (TTTG) and two troughs (TTT2T). Tests and time at feeder
measurements were performed at three different times (Rep 1, Rep 2, Rep 3) during the
growing and pregnancy period. Eight groups of eight growing Pietrain x Large White
females were tested at week 1 (Rep 1; weight, Mean±SD: 39.5±5.6 kg), week 6 (Rep 2;
66.4±8.1 kg) and week 11 after mixing (Rep 3; 95.9±10.3 kg), while eight groups of six
Large White x Landrace pregnant sows were tested at week 5 (Rep 1; weight, Mean±SD:
239±33 kg), week 9 (Rep 2; 255±32 kg) and week 13 after mixing (Rep 3; 271±32kg). The
concordance of the five methods was higher for pregnant sows (average rank difference
ranging between 0.53 ± 0.10 and 1.43 ± 0.19; rspearman ranging between 0.36 and 0.86) than
for growing females (average rank difference ranging between 1.30 ± 0.16 and 3.13 ± 0.26;
rspearman ranging between -0.33 and 0.68). The temporal stability of the results of the five
methods was higher for pregnant sows (average rank difference ranging between 0.34 ±
0.07 and 1.18 ± 0.20; rspearman ranging between 0.46 and 0.89) than for growing females
30
(average rank difference ranging between 1.20 ± 0.19 and 2.28 ± 0.19; rspearman ranging
between 0.20 and 0.65). These results suggest that females have a more stable hierarchy
over time during pregnancy than during the growing period, and that the social hierarchy is
not clearly established in groups of younger females.
2.1.1 Résumé
Des résultats conflictuels entre les tests de dominance et les répétitions de ces tests à travers
le temps chez les porcs pourraient être causés par un manque de stabilité de la hiérarchie
sociale. Les objectifs de la présente étude étaient de comparer cinq méthodes pour mesurer
la hiérarchie sociale et d’examiner la stabilité des résultats des méthodes à travers le temps
chez les femelles en croissance et les truies gestantes. Trois tests de dominance basés sur la
compétition alimentaire ont été faits sur des femelles en croissance et gestantes : test de
groupe à une auge (G), test de groupe à deux auges (2T) et le test en paires (D). Deux
mesures du temps passé à la mangeoire ont été faites lors du test de groupe à une (TTTG) et
deux auges (TTT2T). Les cinq méthodes ont été répétées à trois reprises (Rép 1, Rép 2 et
Rép 3) durant la croissance et la gestation. Huit groupes de huit femelles en croissance
Pietrain x Large White ont été testés lors de la première (Rép 1; poids, moyenne ± ÉT :
39,5 ± 5,6 kg), sixième (Rép 2; poids : 66,4 ± 8,1 kg) et onzième semaine (Rép 3 : 95,9 ±
10,3 kg) suite au mélange. Huit groupes de six truies gestantes Large White x Landrace ont
été testés lors de la cinquième (Rép 1; poids, moyenne ± ÉT : 239 ± 33 kg), neuvième (Rép
2; poids: 255 ± 32 kg) et treizième semaine (Rép 3; poids: 271 ± 32 kg) suite au mélange.
La concordance entre les cinq méthodes était plus élevée pour les truies gestantes
(différence de rang entre 0,53 ± 0,10 et 1,43 ± 0,19; rspearman entre 0,36 et 0,86) que pour les
femelles en croissances (différence de rang entre 1,30 ± 0,16 et 3,13 ± 0,26; rspearman entre -
0,33 et 0,68). La stabilité temporelle des cinq méthodes était plus élevée pour les truies
gestantes (différence de rang entre 0,34 ± 0,07 et 1,18 ± 0,20; rspearman entre 0,46 et 0,89)
que pour les femelles en croissances (différence de rang entre 1,20 ± 0,19 et 2,28 ± 0,19;
rspearman entre 0,20 et 0,65). Ces résultats suggèrent que les femelles ont une hiérarchie
sociale plus stable à travers le temps durant la gestation que lors de la croissance et que la
hiérarchie sociale n’est pas clairement établie chez les groupes de jeunes femelles.
31
2.2 Introduction
Mixing animals is commonly practiced in pig production, but it leads to an increase in
aggression that is associated to the establishment of a dominance hierarchy (Meese and
Ewbank, 1973). The advantage of this social organization is that the risk of injuries is
reduced because most conflicts are resolved by threats and avoidance rather than by
fighting (Beilharz and Cox, 1967). The dominance hierarchy in groups of pigs and sows
also has other impacts. Studies have shown that dominance affects weight gain (Tan and
Shackleton, 1990; Hicks et al., 1998), feed intake (Hansen et al., 1982; Hsia and Wood-
Gush, 1984; Place et al., 1995; Levasseur et al., 1996), feeding pattern (Place et al., 1995;
Levasseur et al., 1996) and sexual behaviour (Pedersen et al., 1993).
Many methods have been used to determine individual social ranks in groups of pigs
without any agreement on a single one (Craig, 1986). For instance, group tests (Beilharz
and Cox, 1967; Blackshaw et al., 1996), dyadic tests (Brouns and Edwards, 1994; de Jonge
et al., 1996) and the total time spent at the trough (de Jonge et al., 1996; O’Connell and
Beattie, 1999) have been used to determine social ranks in groups that have been together
for some time. However, few studies have looked at the concordance of results obtained
with various methods and their stability over time. Meese and Ewbank (1972) found that
when they were repeating group tests at a 24 h-interval on groups of pigs between 10 to 30
weeks of age, results were not stable suggesting that social rank in pigs may change
without apparent reason. Place et al. (1995) found that in groups of pigs submitted to a
group test three times at three-week intervals during the growing period, results were
significantly correlated between repetitions (rspearman=0.57; P < 0.001 between rep1 and
rep2; rspearman=0.55; P < 0.001 between rep1 and rep3). Lafrance (2010) looked at
correlations between the group test, the dyadic test and the total time spent at the trough in
groups of growing pigs and only obtained 3 significant correlations out of the 27 possible
comparisons between tests. de Jonge et al. (1996) submitted a group of gilts to a dyadic test
twice at a 40-week interval and found that only one pair of animals changed rank among all
pairs that were tested. Brouns and Edwards (1994) found a positive and significant
correlation between ranks assigned in group test and in dyadic test for sows.
32
Social rank can be affected by individual characteristics, but results are contradictory. A
few studies have found a correlation between social rank and weight (Beilharz and Cox,
1967; O’Connell and Beattie, 1999), while others have found no correlations (Meese and
Ewbank, 1973; Fraser, 1974; Nielsen et al., 1995; Place et al., 1995; Heo et al., 2005).
The aim of the present study was to verify whether female pigs differ in the stability of
their social hierarchy according their physiological state and age. The hypothesis was that
pregnant sows, being older and more mature, will show a more stable hierarchy than
growing females. The first objective was to analyze concordance between five commonly
used methods to measure social ranks in pigs. The second objective was to evaluate, in both
growing females and pregnant sows, the stability of the social hierarchy over time by
repeating the same tests over several weeks.
2.3 Methodology
2.3.1 Animals
The experiment took place at the experimental farm of INRA St-Gilles (France) and was
performed according to current French legislation on experimental animal care
(authorization to experiment on living animals No. 04749 approved by the French Ministry
of Agriculture).
2.3.1.1 Growing females
Eight groups of eight Pietrain x Large White growing females (average weight ± SD: 39.6
± 4.2 kg, average age ± SD: 79 ± 3.3 d) were kept in pens (2.7 m by 2.4 m, full concrete
flooring, partly bedded with straw) equipped with individual troughs. The growing females
were fed a standard diet ad libitum (9.24 MJ/kg net energy and 172 g of protein per kg),
with fresh feed being offered twice a day at 8:00 and 15:00 h, and they had ad libitum
access to water.
33
2.3.1.2 Pregnant sows
Eight groups of six Large White x Landrace pregnant sows (average weight ± SD = 239 ±
22 kg, average age ± SD 794 ± 320 d) were kept in pens (3.7 m by 4.9 m, full concrete
flooring, straw bedding in the resting area) equipped with six individual lock-in feeding
stalls. Pregnant sows were fed a standard diet for pregnancy (2.9 kg/day, 8.84 MJ/kg net
energy and 133 g of protein per kg) twice a day at 8:00 and 15:00 h and had ad libitum
access to water.
2.3.2 Body measurements
Experimental animals were weighed and their body conformation measured with a
homemade measuring stick, the week before the social rank tests. The height at the
shoulder, the width of the shoulders and the length (distance between the ears to the base of
the tail) were measured. Pregnant sows’ back fat depth (BFD) was also measured
ultrasonically at 65 mm on both sides of the dorsal mid line at the last rib level the week
before the tests (Sonolayer SAL-32B, Toshiba, Tokyo, Japan).
2.3.3 Lesions scores
Right after the last test of the week, apparent lesions or scratches that were bright red were
counted on the entire body. A lesion score was given to every individual by summing the
number of scratches and lesions on the body of each animal.
2.3.4 Social rank measure
Growing females were fasted for 16 h before each test to ensure a high motivation for food.
Pregnant sows did not need to be fasted because they were already restricted-fed and were
strongly motivated for food. Three social rank tests were done: a dyadic test (D), a group
test with one trough (G), and a group test with two troughs (2T).
34
2.3.5 Dyadic test (D)
2.3.5.1 Growing females
The dyadic tests took place between all possible pairs of animals (number of tests:
N*(N-1) /2, where N is the number of animals in a group). Growing females were moved
from their home pen to a test pen, which was adjacent to the home pen or located one pen
further. The test pen had a similar dimension and was visually isolated from the home pen.
The entire group was moved to the test pen 10 min prior to the tests to allow habituation to
the novel environment. After the habituation period, all growing females were moved back
to their home pen. The first pair was then brought to the test pen. The sound of food falling
in a metal scoop was used to catch the growing females’ attention. Once the two animals
were near the individual feeding space, approximately 100 g of the standard diet were
dropped in the trough. The first part of the test ended when one of the two animals
displaced the other from the trough. The animal that had gained access to the food the
longest and that was not displaced was considered as the winner. After 10 consecutive sec
of eating, the remaining food was vacuumed by the observer using a common portable
vacuum cleaner, to prevent reduction in feeding motivation. Approximately 100 g of food
was then offered to the loser in the same trough. If the winner displaced the loser again, the
winner was confirmed. If the winner did not displace the loser, the dyad was considered
equal. After the second part of the test, both animals were returned to their pen and a new
pair was tested. Half of all possible pairs were tested on the first day and the other half on
the second day. There were two restrictions to the randomization of the order of testing: all
individuals were tested for the first time against other individuals that were also being
tested for the first time, and no animal could be tested twice in a row.
2.3.5.2 Pregnant sows
The dyadic tests took place between all possible pairs of pregnant sows in their home pen.
All pregnant sows were locked in their individual feeding stalls, which were used as
waiting areas. The pregnant sows were then released or locked in as necessary. An
individual feeder was introduced into the pen. The first pair of pregnant sows was then
released and tested using the same procedure as described for the growing animals.
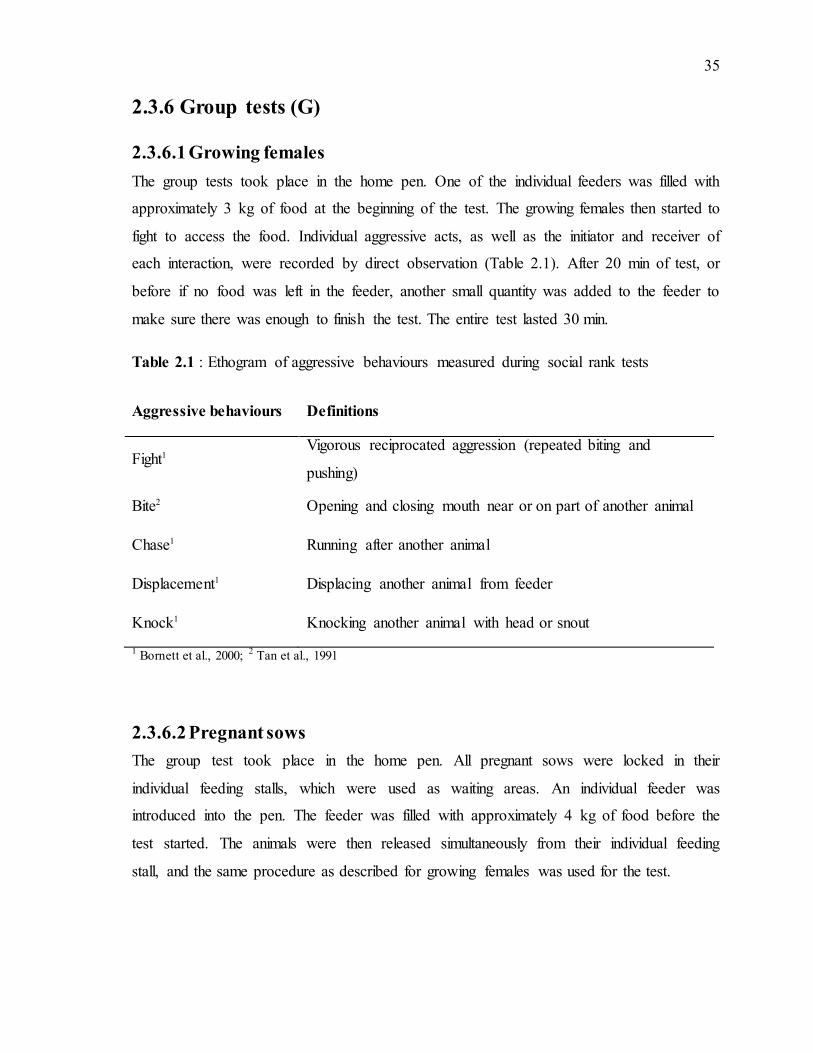
35
2.3.6 Group tests (G)
2.3.6.1 Growing females
The group tests took place in the home pen. One of the individual feeders was filled with
approximately 3 kg of food at the beginning of the test. The growing females then started to
fight to access the food. Individual aggressive acts, as well as the initiator and receiver of
each interaction, were recorded by direct observation (Table 2.1). After 20 min of test, or
before if no food was left in the feeder, another small quantity was added to the feeder to
make sure there was enough to finish the test. The entire test lasted 30 min.
Table 2.1 : Ethogram of aggressive behaviours measured during social rank tests
Aggressive behaviours Definitions
Fight1 Vigorous reciprocated aggression (repeated biting and
pushing)
Bite2 Opening and closing mouth near or on part of another animal
Chase1 Running after another animal
Displacement1 Displacing another animal from feeder
Knock1 Knocking another animal with head or snout
1 Bornett et al., 2000;
2 Tan et al., 1991
2.3.6.2 Pregnant sows
The group test took place in the home pen. All pregnant sows were locked in their
individual feeding stalls, which were used as waiting areas. An individual feeder was
introduced into the pen. The feeder was filled with approximately 4 kg of food before the
test started. The animals were then released simultaneously from their individual feeding
stall, and the same procedure as described for growing females was used for the test.
36
2.3.7 Group test with two troughs (2T)
The group tests with two individual feeders took place in the home pen. The procedure was
similar to the group test with one feeder, for both growing females and pregnant sows,
except that two feeders were used instead of one, each filled with the same quantity of food
(3 kg for growing females, 4 kg for pregnant sows).
2.3.8 Determination of the total time spent at the trough in the
Group test with one trough (TTTG) and Group test with two
troughs (TTT2T)
Both tests carried out on growing females were videotaped via a camera (Panasonic PC25-
2230P dsVision, Brest, France) located above the pen and connected to a recorder
(Panasonic AG-TL500E VHS PAL, Panasonic, Osaka, Japan), to measure the time spent at
the feeder for each animal. The same procedure was used for the pregnant sows with two
cameras located near the ceiling.
2.3.9 Scheduling and repetitions
All three tests were done on the same weeks. The first test (either G or 2T) was done on
Monday, the second (2T if previous test was G or G if previous test was 2T) on Tuesday
and the third (D) on Thursday and Friday. This schedule was repeated three times during
the experiment, on weeks 1, 6 and 11 for growing females, and weeks 5, 9 and 13 for
pregnant sows; in both cases, mixing occurred on week 0. Growing females were tested on
these dates because they had to leave for the slaughterhouse on week 12. Sows were tested
on week 5 to avoid problem with uterine implantation and on week 13 because they were
getting too close to farrowing. A similar interval between repetitions between sows and
growing females was established. Average weight (±SD) of growing females was 39.5 ±
4.2, 66.6 ± 6.4 and 96.2 ± 7.6, respectively for repetition 1, 2 and 3; and pregnant sows
weighed on average 239 ± 22, 255 ± 20 and 271 ± 19 at repetition 1, 2, and 3, respectively.
37
2.3.10 Calculation of Dominance Value
A rank for every animal within the group was calculated with the Dominance Value: DV =
A / ( A + S ) where A is the number of aggressive interactions initiated and S the number of
aggressive interactions received (Craig, 1986).
2.3.11 Percentage of clearly established dominance rank
relationships
The percentage of clearly established dominance rank relationships was also determined in
G and 2T tests (Bousquet, 2001). The number of aggressive interactions delivered by one
animal to another was subtracted by the number of aggressive interactions received by the
same animal. When the differences were ≥ 3, the winner was given a coefficient of 1 and
the loser, 0; the dominance rank relationship was then considered clearly established. When
the differences were ≤ 2, a coefficient of 0.5 was attributed to both individuals and the
dominance rank relationship was not considered established. The percentage of clearly
established dominance rank relationships was then calculated by dividing the number of
dominance relationships established by the theoretical numbers of dyads in a group (N (N-
1)/2 where N = number of animals in a group) and then by multiplying it per 100.
2.3.12 Statistics
Statistical analyses were done using the SAS statistical package, version 9.2 (SAS 2010,
Institute Inc., Cary, NC). Differences in the social rank obtained between tests and
repetitions were analyzed by a Kruskal-Wallis procedure (PROC NPAR1WAY). The
difference between the ranks obtained in each pair of tests for the same repetition was used
to calculate the rank difference of an animal. The same procedure was used to calculate the
rank difference when comparing repetitions of the same test. Spearman correlations were
used (PROC CORR) to test the link between the ranks of the different tests and between
ranks and body measurements.
38
2.4 Results
2.4.1 Stability of dominance hierarchy results over time
The average rank differences between each pair of repetitions of the same methods were
always significantly lower for pregnant sows than for growing females, except for the
average rank differences between repetition 1 and 2 of the D test (Table 2.2).
Furthermore, the average rank differences between each pair of repetitions did not differ
significantly within the five methods applied in growing females and pregnant sows except
for the D test (Table 2.2).
The correlations between the social ranks obtained for each pair of repetitions and for each
of the five methods were all significant for growing and pregnant females (Table 2.3), but
correlation coefficients were consistently higher for mature pregnant sows than for growing
females, whatever the pair of repetitions and the test. In growing females, the correlation
coefficients were numerically lower between repetitions for the G and 2T tests (between
0.20 and 0.38), compared to coefficient obtained with the other methods (between 0.44 and
0.65). In pregnant sows, the correlations were numerically lower between repetitions for the
G test (between 0.46 and 0.62) compared to the other methods (between 0.61 and 0.93).
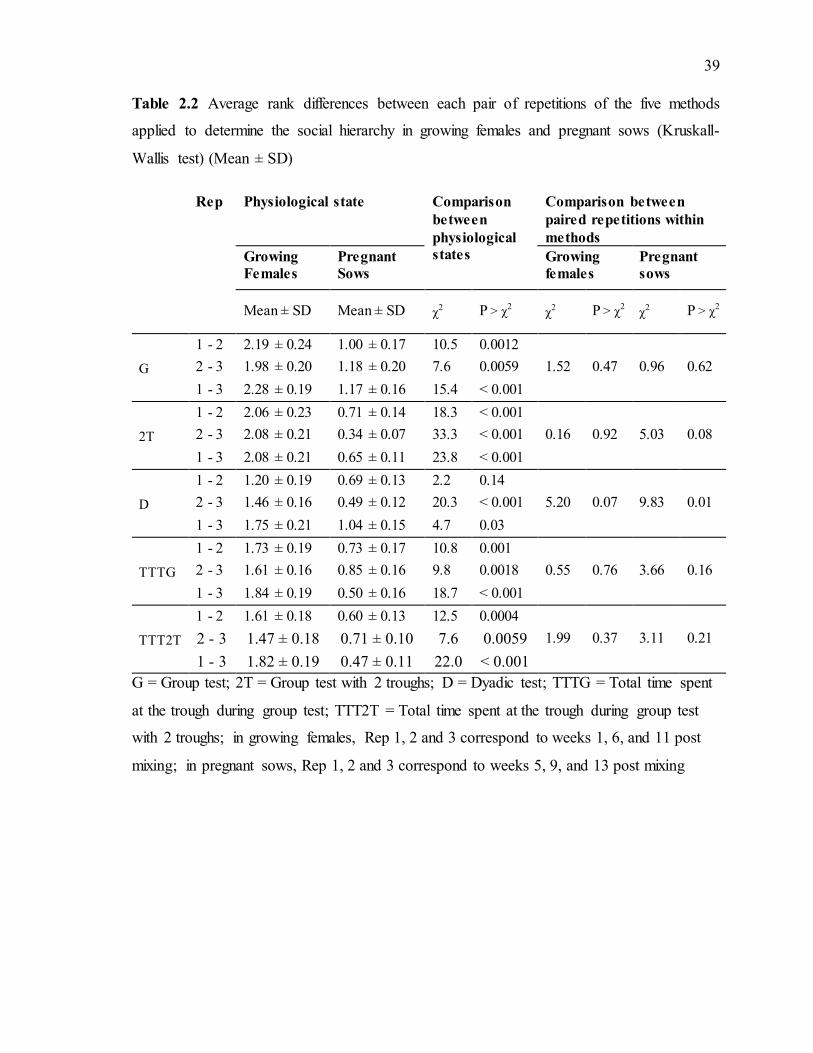
39
Table 2.2 Average rank differences between each pair of repetitions of the five methods
applied to determine the social hierarchy in growing females and pregnant sows (Kruskall-
Wallis test) (Mean ± SD)
Rep Physiological state Comparison
between
physiological
states
Comparison between
paired repetitions within
methods
Growing
Females
Pregnant
Sows
Growing
females
Pregnant
sows
Mean ± SD Mean ± SD χ2 P > χ
2 χ
2 P > χ
2 χ
2 P > χ
2
G
1 - 2 2.19 ± 0.24 1.00 ± 0.17 10.5 0.0012
1.52 0.47 0.96 0.62 2 - 3 1.98 ± 0.20 1.18 ± 0.20 7.6 0.0059
1 - 3 2.28 ± 0.19 1.17 ± 0.16 15.4 < 0.001
2T
1 - 2 2.06 ± 0.23 0.71 ± 0.14 18.3 < 0.001
0.16 0.92 5.03 0.08 2 - 3 2.08 ± 0.21 0.34 ± 0.07 33.3 < 0.001
1 - 3 2.08 ± 0.21 0.65 ± 0.11 23.8 < 0.001
D
1 - 2 1.20 ± 0.19 0.69 ± 0.13 2.2 0.14
5.20 0.07 9.83 0.01 2 - 3 1.46 ± 0.16 0.49 ± 0.12 20.3 < 0.001
1 - 3 1.75 ± 0.21 1.04 ± 0.15 4.7 0.03
TTTG
1 - 2 1.73 ± 0.19 0.73 ± 0.17 10.8 0.001
0.55 0.76 3.66 0.16 2 - 3 1.61 ± 0.16 0.85 ± 0.16 9.8 0.0018
1 - 3 1.84 ± 0.19 0.50 ± 0.16 18.7 < 0.001
TTT2T
1 - 2 1.61 ± 0.18 0.60 ± 0.13 12.5 0.0004
1.99 0.37 3.11 0.21 2 - 3 1.47 ± 0.18 0.71 ± 0.10 7.6 0.0059
1 - 3 1.82 ± 0.19 0.47 ± 0.11 22.0 < 0.001
G = Group test; 2T = Group test with 2 troughs; D = Dyadic test; TTTG = Total time spent
at the trough during group test; TTT2T = Total time spent at the trough during group test
with 2 troughs; in growing females, Rep 1, 2 and 3 correspond to weeks 1, 6, and 11 post
mixing; in pregnant sows, Rep 1, 2 and 3 correspond to weeks 5, 9, and 13 post mixing
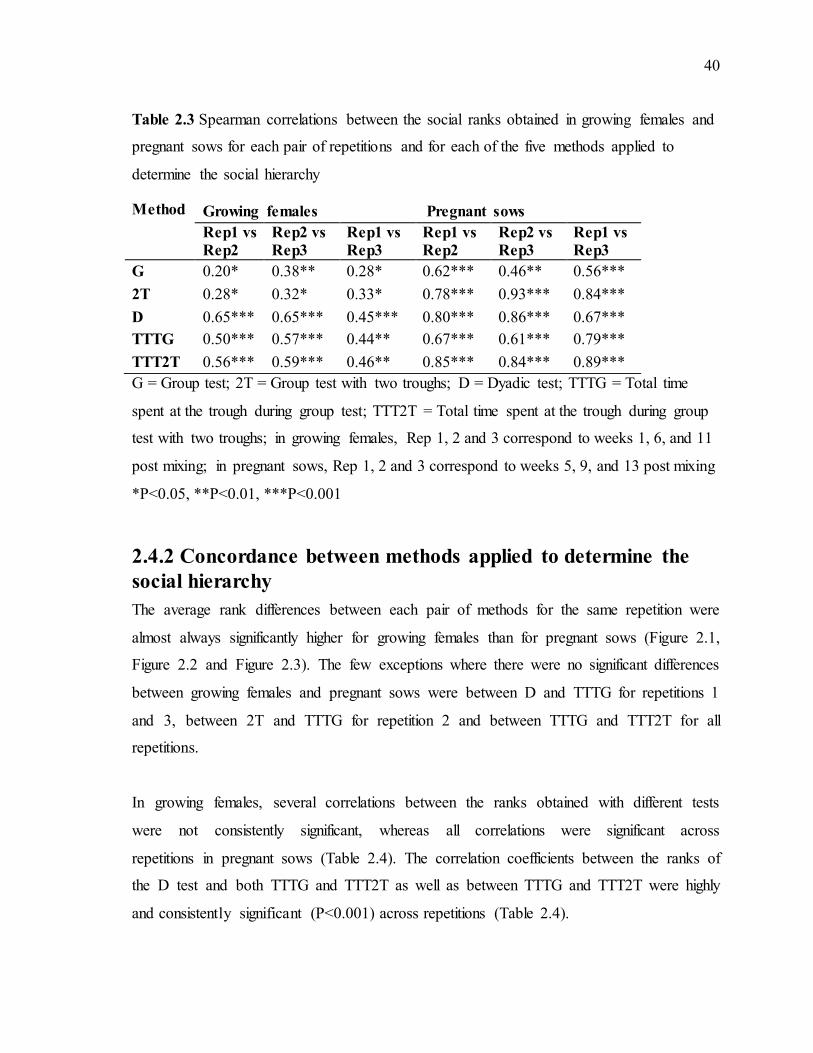
40
Table 2.3 Spearman correlations between the social ranks obtained in growing females and
pregnant sows for each pair of repetitions and for each of the five methods applied to
determine the social hierarchy
Method Growing females Pregnant sows
Rep1 vs
Rep2
Rep2 vs
Rep3
Rep1 vs
Rep3
Rep1 vs
Rep2
Rep2 vs
Rep3
Rep1 vs
Rep3
G 0.20* 0.38** 0.28* 0.62*** 0.46** 0.56***
2T 0.28* 0.32* 0.33* 0.78*** 0.93*** 0.84***
D 0.65*** 0.65*** 0.45*** 0.80*** 0.86*** 0.67***
TTTG 0.50*** 0.57*** 0.44** 0.67*** 0.61*** 0.79***
TTT2T 0.56*** 0.59*** 0.46** 0.85*** 0.84*** 0.89***
G = Group test; 2T = Group test with two troughs; D = Dyadic test; TTTG = Total time
spent at the trough during group test; TTT2T = Total time spent at the trough during group
test with two troughs; in growing females, Rep 1, 2 and 3 correspond to weeks 1, 6, and 11
post mixing; in pregnant sows, Rep 1, 2 and 3 correspond to weeks 5, 9, and 13 post mixing
*P<0.05, **P<0.01, ***P<0.001
2.4.2 Concordance between methods applied to determine the
social hierarchy
The average rank differences between each pair of methods for the same repetition were
almost always significantly higher for growing females than for pregnant sows (Figure 2.1,
Figure 2.2 and Figure 2.3). The few exceptions where there were no significant differences
between growing females and pregnant sows were between D and TTTG for repetitions 1
and 3, between 2T and TTTG for repetition 2 and between TTTG and TTT2T for all
repetitions.
In growing females, several correlations between the ranks obtained with different tests
were not consistently significant, whereas all correlations were significant across
repetitions in pregnant sows (Table 2.4). The correlation coefficients between the ranks of
the D test and both TTTG and TTT2T as well as between TTTG and TTT2T were highly
and consistently significant (P<0.001) across repetitions (Table 2.4).
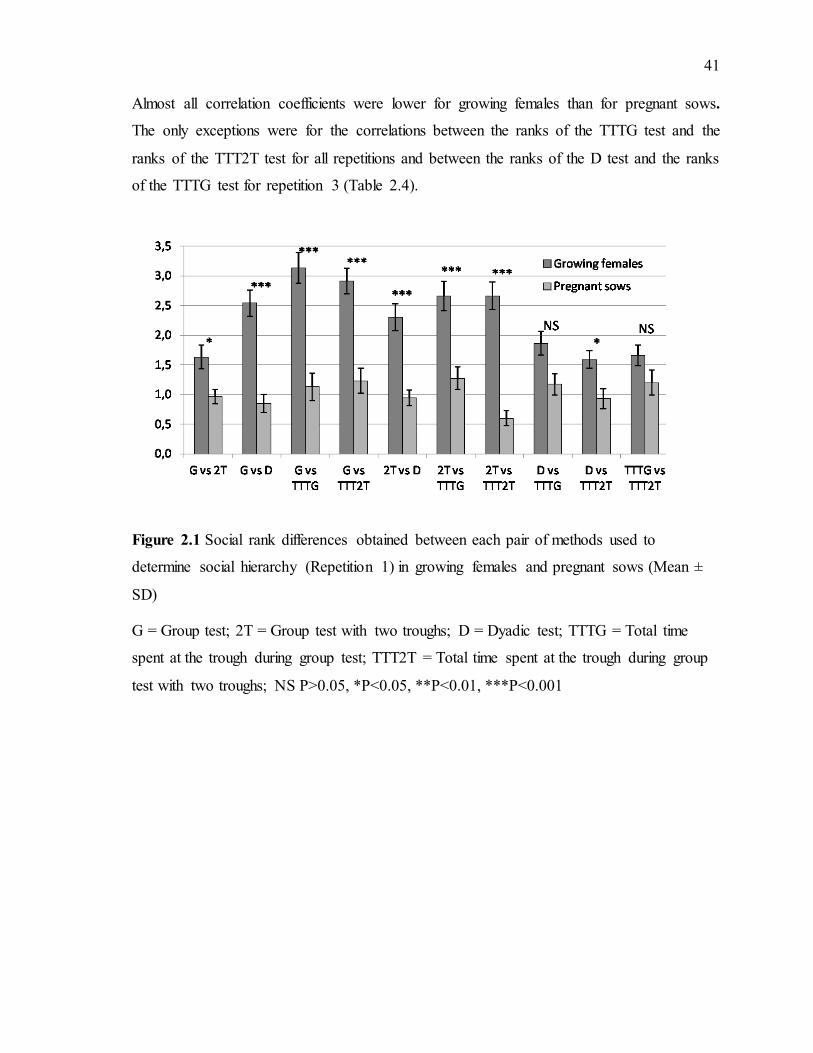
41
Almost all correlation coefficients were lower for growing females than for pregnant sows.
The only exceptions were for the correlations between the ranks of the TTTG test and the
ranks of the TTT2T test for all repetitions and between the ranks of the D test and the ranks
of the TTTG test for repetition 3 (Table 2.4).
Figure 2.1 Social rank differences obtained between each pair of methods used to
determine social hierarchy (Repetition 1) in growing females and pregnant sows (Mean ±
SD)
G = Group test; 2T = Group test with two troughs; D = Dyadic test; TTTG = Total time
spent at the trough during group test; TTT2T = Total time spent at the trough during group
test with two troughs; NS P>0.05, *P<0.05, **P<0.01, ***P<0.001
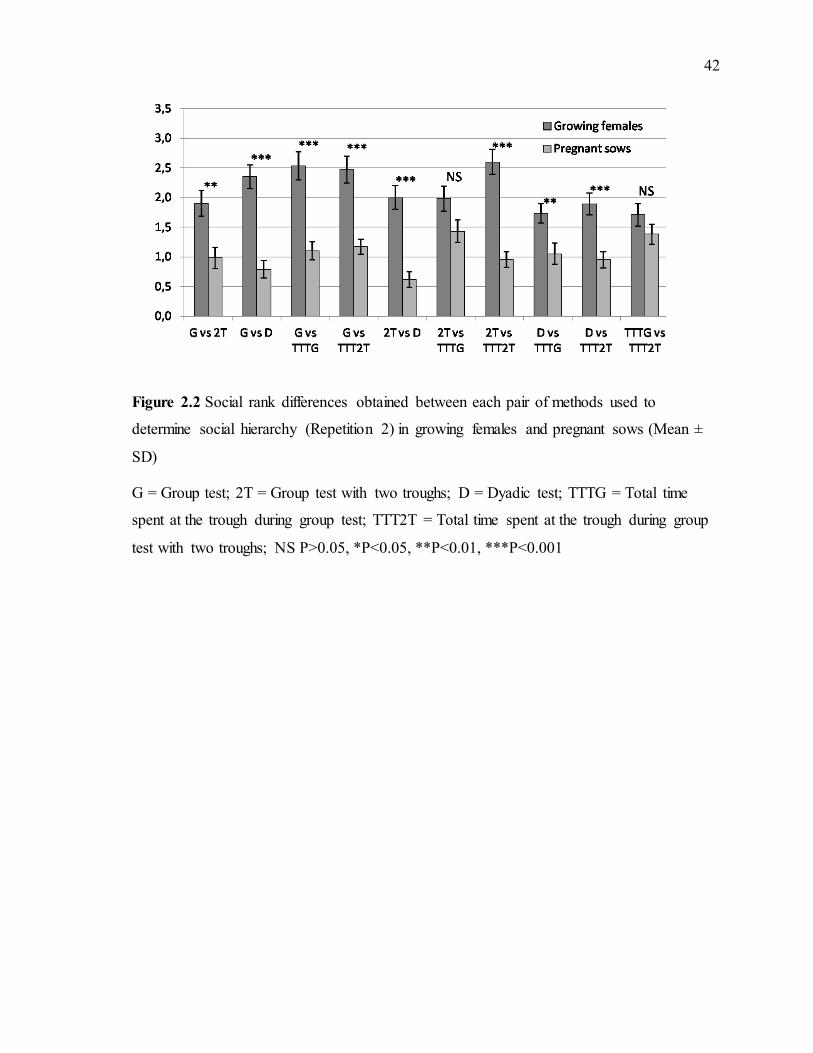
42
Figure 2.2 Social rank differences obtained between each pair of methods used to
determine social hierarchy (Repetition 2) in growing females and pregnant sows (Mean ±
SD)
G = Group test; 2T = Group test with two troughs; D = Dyadic test; TTTG = Total time
spent at the trough during group test; TTT2T = Total time spent at the trough during group
test with two troughs; NS P>0.05, *P<0.05, **P<0.01, ***P<0.001
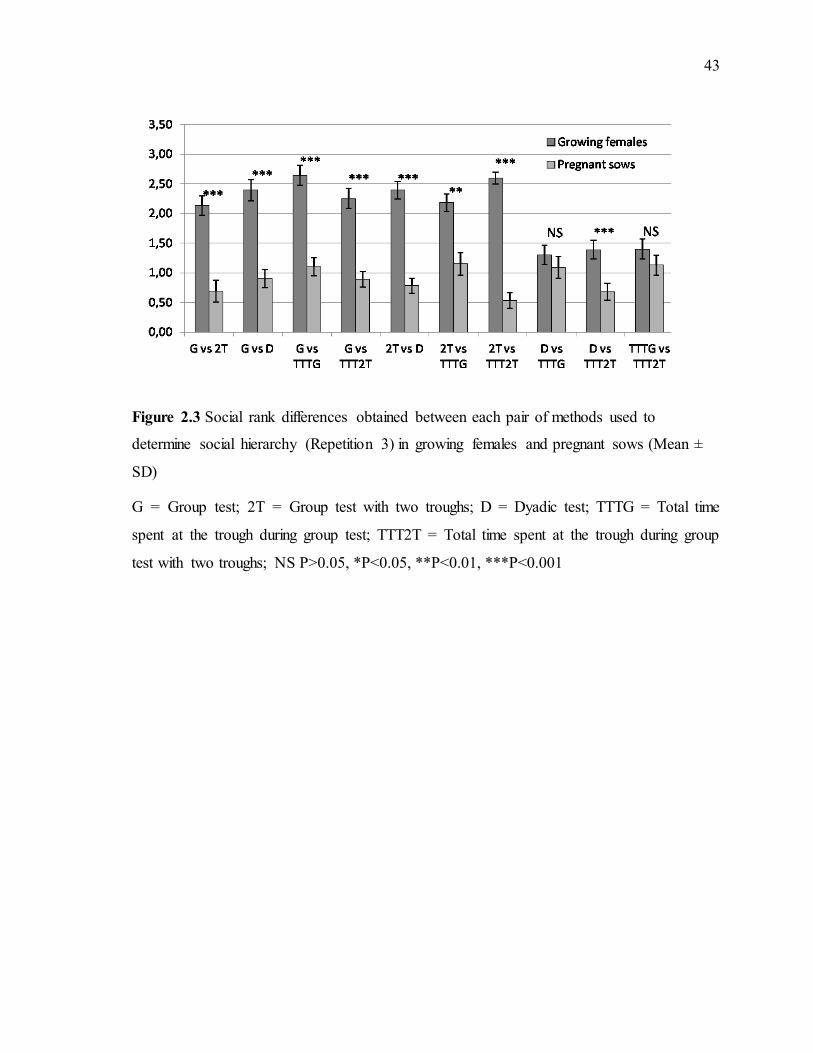
43
Figure 2.3 Social rank differences obtained between each pair of methods used to
determine social hierarchy (Repetition 3) in growing females and pregnant sows (Mean ±
SD)
G = Group test; 2T = Group test with two troughs; D = Dyadic test; TTTG = Total time
spent at the trough during group test; TTT2T = Total time spent at the trough during group
test with two troughs; NS P>0.05, *P<0.05, **P<0.01, ***P<0.001
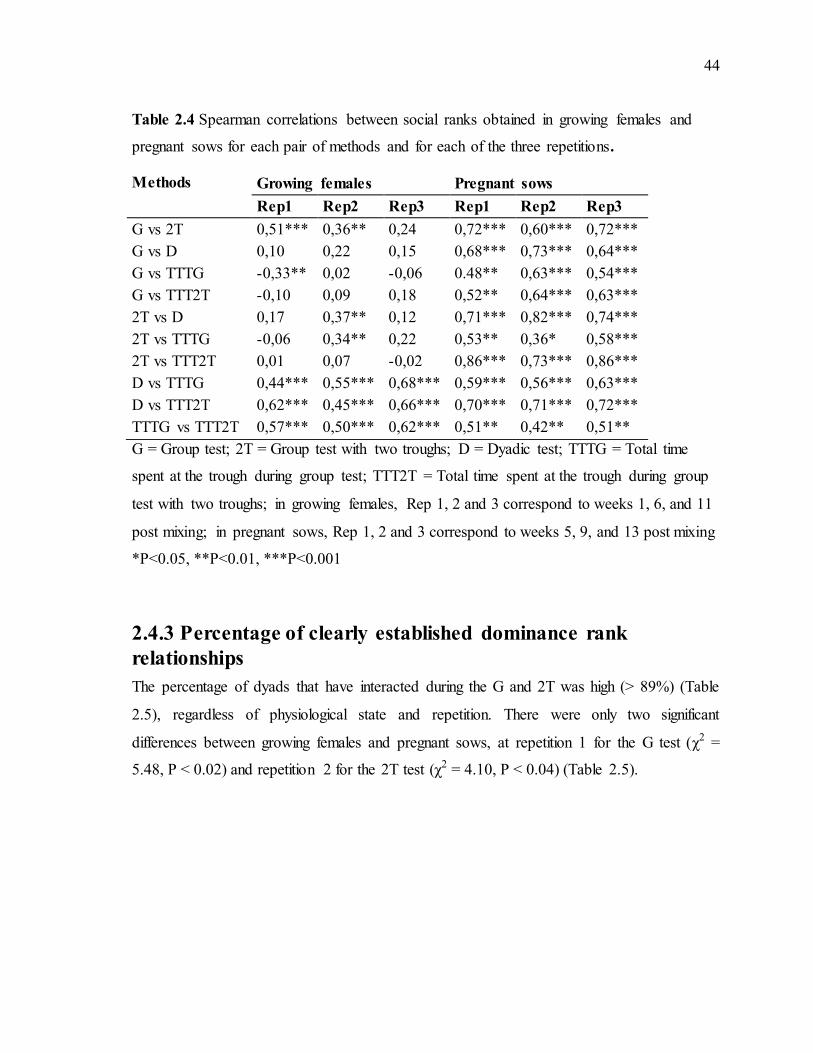
44
Table 2.4 Spearman correlations between social ranks obtained in growing females and
pregnant sows for each pair of methods and for each of the three repetitions.
Methods Growing females Pregnant sows
Rep1 Rep2 Rep3 Rep1 Rep2 Rep3
G vs 2T 0,51*** 0,36** 0,24 0,72*** 0,60*** 0,72***
G vs D 0,10 0,22 0,15 0,68*** 0,73*** 0,64***
G vs TTTG -0,33** 0,02 -0,06 0.48** 0,63*** 0,54***
G vs TTT2T -0,10 0,09 0,18 0,52** 0,64*** 0,63***
2T vs D 0,17 0,37** 0,12 0,71*** 0,82*** 0,74***
2T vs TTTG -0,06 0,34** 0,22 0,53** 0,36* 0,58***
2T vs TTT2T 0,01 0,07 -0,02 0,86*** 0,73*** 0,86***
D vs TTTG 0,44*** 0,55*** 0,68*** 0,59*** 0,56*** 0,63***
D vs TTT2T 0,62*** 0,45*** 0,66*** 0,70*** 0,71*** 0,72***
TTTG vs TTT2T 0,57*** 0,50*** 0,62*** 0,51** 0,42** 0,51**
G = Group test; 2T = Group test with two troughs; D = Dyadic test; TTTG = Total time
spent at the trough during group test; TTT2T = Total time spent at the trough during group
test with two troughs; in growing females, Rep 1, 2 and 3 correspond to weeks 1, 6, and 11
post mixing; in pregnant sows, Rep 1, 2 and 3 correspond to weeks 5, 9, and 13 post mixing
*P<0.05, **P<0.01, ***P<0.001
2.4.3 Percentage of clearly established dominance rank
relationships
The percentage of dyads that have interacted during the G and 2T was high (> 89%) (Table
2.5), regardless of physiological state and repetition. There were only two significant
differences between growing females and pregnant sows, at repetition 1 for the G test (χ2 =
5.48, P < 0.02) and repetition 2 for the 2T test (χ2 = 4.10, P < 0.04) (Table 2.5).
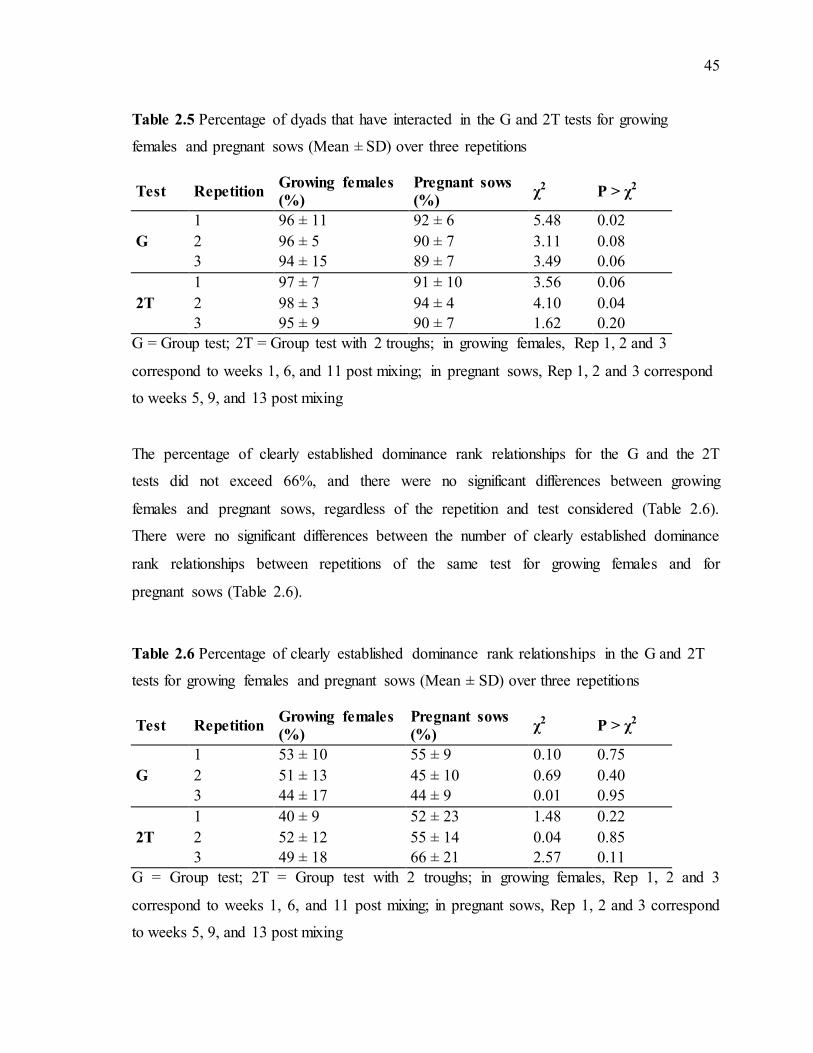
45
Table 2.5 Percentage of dyads that have interacted in the G and 2T tests for growing
females and pregnant sows (Mean ± SD) over three repetitions
Test Repetition Growing females
(%)
Pregnant sows
(%) χ2 P > χ2
G
1 96 ± 11 92 ± 6 5.48 0.02
2 96 ± 5 90 ± 7 3.11 0.08
3 94 ± 15 89 ± 7 3.49 0.06
2T
1 97 ± 7 91 ± 10 3.56 0.06
2 98 ± 3 94 ± 4 4.10 0.04
3 95 ± 9 90 ± 7 1.62 0.20
G = Group test; 2T = Group test with 2 troughs; in growing females, Rep 1, 2 and 3
correspond to weeks 1, 6, and 11 post mixing; in pregnant sows, Rep 1, 2 and 3 correspond
to weeks 5, 9, and 13 post mixing
The percentage of clearly established dominance rank relationships for the G and the 2T
tests did not exceed 66%, and there were no significant differences between growing
females and pregnant sows, regardless of the repetition and test considered (Table 2.6).
There were no significant differences between the number of clearly established dominance
rank relationships between repetitions of the same test for growing females and for
pregnant sows (Table 2.6).
Table 2.6 Percentage of clearly established dominance rank relationships in the G and 2T
tests for growing females and pregnant sows (Mean ± SD) over three repetitions
Test Repetition Growing females
(%)
Pregnant sows
(%) χ2 P > χ2
G
1 53 ± 10 55 ± 9 0.10 0.75
2 51 ± 13 45 ± 10 0.69 0.40
3 44 ± 17 44 ± 9 0.01 0.95
2T
1 40 ± 9 52 ± 23 1.48 0.22
2 52 ± 12 55 ± 14 0.04 0.85
3 49 ± 18 66 ± 21 2.57 0.11
G = Group test; 2T = Group test with 2 troughs; in growing females, Rep 1, 2 and 3
correspond to weeks 1, 6, and 11 post mixing; in pregnant sows, Rep 1, 2 and 3 correspond
to weeks 5, 9, and 13 post mixing
46
2.4.4 Correlations between social ranks and individual
characteristics
Both growing females and pregnant sows showed a significant decrease in the number of
injuries over time, with values above 25 in the first repetition while the level reached less
20 in the following two repetitions (Figure 2.4). There were no differences between the
average number of injuries between growing females and pregnant sows for any repetition
(growing females mean ± SD vs pregnant sows mean ± SD; Rep 1; 29.9 ± 4.0 vs 32.4 ±
6.3; Rep 2; 16.5 ± 1.9 vs 14.9 ± 1.7; Rep 3; 13.7 ± 1.5 vs 15.4 ± 2.0).
The correlation coefficients between the social ranks and the individual conformation
characteristics never exceeded the -0.5 to 0.5 range for growing females (Table 2.7) and for
pregnant sows (Table 2.8). Significant correlations were limited and concerned mainly the
weight, the width or injury criteria in both growing females and pregnant sows.
In growing females, body weight was only significantly correlated with the social ranks
obtained in the 2T test and the D test for repetition 1, the ranks obtained with the D test for
repetition 2 and the ranks obtained with the D test and TTTG test and the TTT2T test for
repetition 3. In all of these cases, the correlations were negative except for the TTTG and
the TTT2T for repetition 3. Body length was only significantly correlated with the social
ranks obtained with the 2T test for repetition 1. The correlations between shoulder height
and social ranks were never significant. Shoulder width was only significantly correlated
with the ranks obtained with the 2T test for repetition 1 and with the ranks of the D test and
TTTG test for repetition 2. The correlations between age and social ranks were only
significant for the D test for repetitions 2 and 3. The total number of injuries on a growing
female was only significantly correlated with social ranks obtained with the 2T test and D
test for repetition 2.
In pregnant sows, body weight was only significantly correlated with the social ranks
obtained with the TTT2T test for repetition 3. Body length was only significantly correlated
with the social ranks obtained with the G test, the 2T test and D test for repetition 3. The
shoulder width was only significantly correlated with the social ranks obtained with the 2T
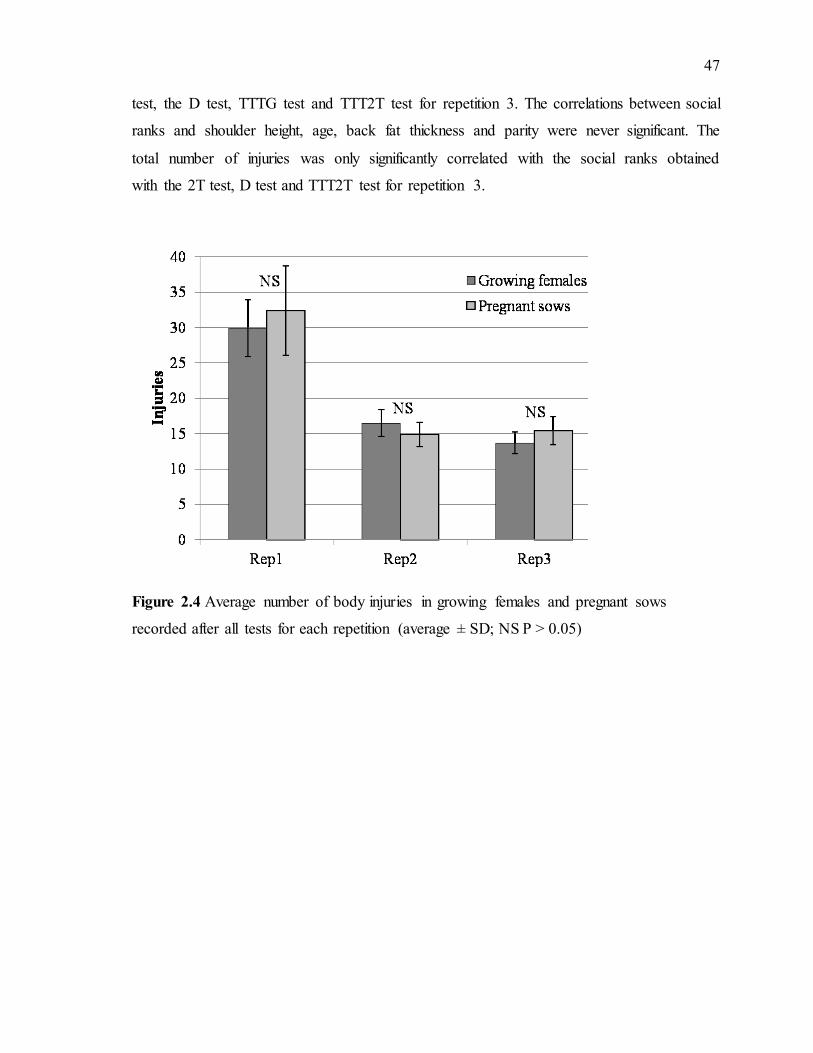
47
test, the D test, TTTG test and TTT2T test for repetition 3. The correlations between social
ranks and shoulder height, age, back fat thickness and parity were never significant. The
total number of injuries was only significantly correlated with the social ranks obtained
with the 2T test, D test and TTT2T test for repetition 3.
Figure 2.4 Average number of body injuries in growing females and pregnant sows
recorded after all tests for each repetition (average ± SD; NS P > 0.05)
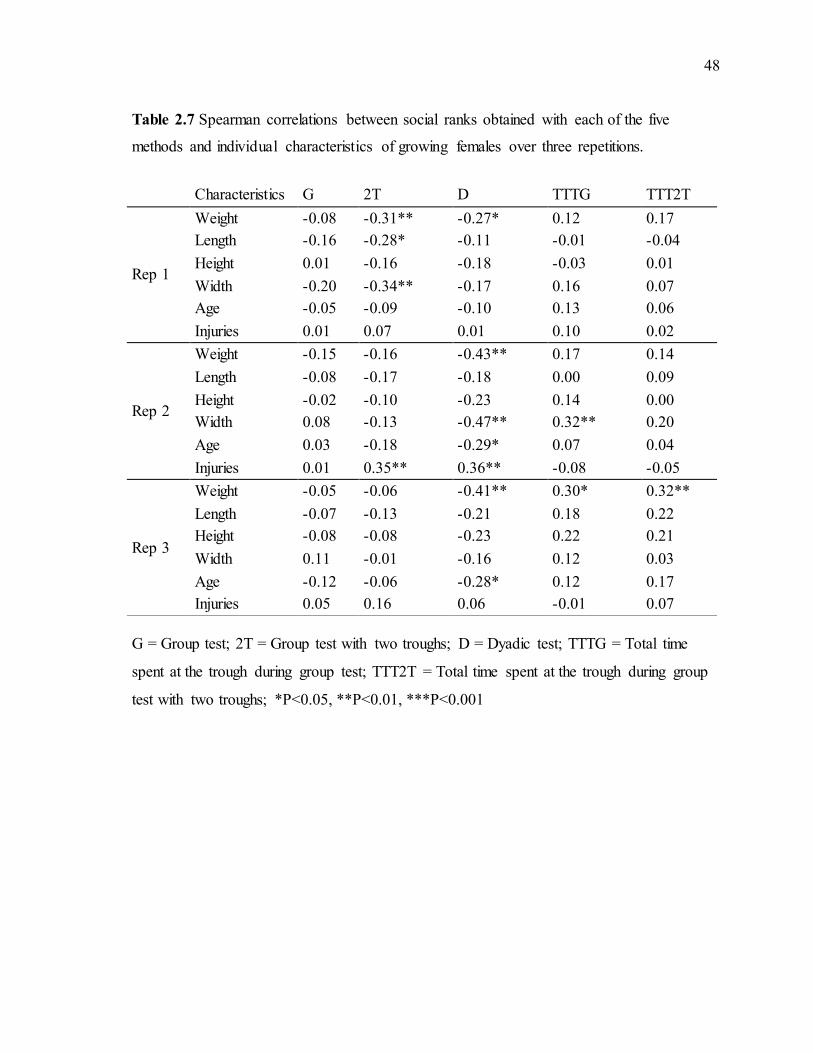
48
Table 2.7 Spearman correlations between social ranks obtained with each of the five
methods and individual characteristics of growing females over three repetitions.
G = Group test; 2T = Group test with two troughs; D = Dyadic test; TTTG = Total time
spent at the trough during group test; TTT2T = Total time spent at the trough during group
test with two troughs; *P<0.05, **P<0.01, ***P<0.001
Characteristics G 2T D TTTG TTT2T
Rep 1
Weight -0.08 -0.31** -0.27* 0.12 0.17
Length -0.16 -0.28* -0.11 -0.01 -0.04
Height 0.01 -0.16 -0.18 -0.03 0.01
Width -0.20 -0.34** -0.17 0.16 0.07
Age -0.05 -0.09 -0.10 0.13 0.06
Injuries 0.01 0.07 0.01 0.10 0.02
Rep 2
Weight -0.15 -0.16 -0.43** 0.17 0.14
Length -0.08 -0.17 -0.18 0.00 0.09
Height -0.02 -0.10 -0.23 0.14 0.00
Width 0.08 -0.13 -0.47** 0.32** 0.20
Age 0.03 -0.18 -0.29* 0.07 0.04
Injuries 0.01 0.35** 0.36** -0.08 -0.05
Rep 3
Weight -0.05 -0.06 -0.41** 0.30* 0.32**
Length -0.07 -0.13 -0.21 0.18 0.22
Height -0.08 -0.08 -0.23 0.22 0.21
Width 0.11 -0.01 -0.16 0.12 0.03
Age -0.12 -0.06 -0.28* 0.12 0.17
Injuries 0.05 0.16 0.06 -0.01 0.07
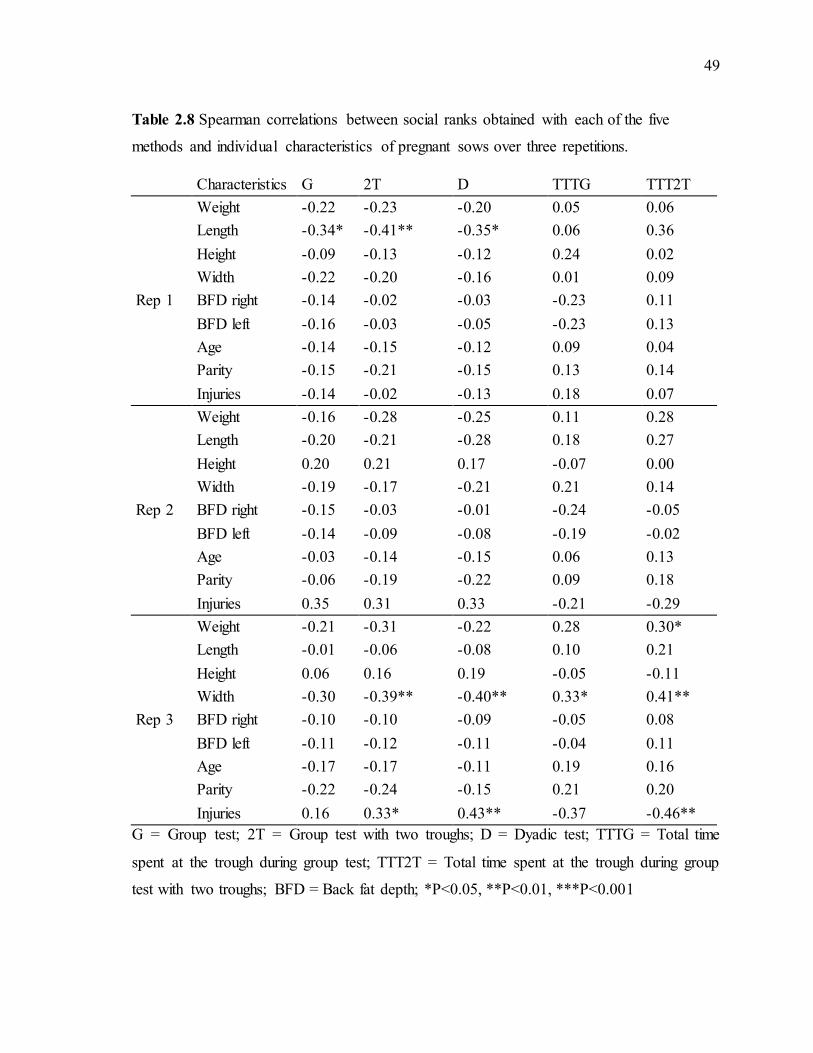
49
Table 2.8 Spearman correlations between social ranks obtained with each of the five
methods and individual characteristics of pregnant sows over three repetitions.
Characteristics G 2T D TTTG TTT2T
Rep 1
Weight -0.22 -0.23 -0.20 0.05 0.06
Length -0.34* -0.41** -0.35* 0.06 0.36
Height -0.09 -0.13 -0.12 0.24 0.02
Width -0.22 -0.20 -0.16 0.01 0.09
BFD right -0.14 -0.02 -0.03 -0.23 0.11
BFD left -0.16 -0.03 -0.05 -0.23 0.13
Age -0.14 -0.15 -0.12 0.09 0.04
Parity -0.15 -0.21 -0.15 0.13 0.14
Injuries -0.14 -0.02 -0.13 0.18 0.07
Rep 2
Weight -0.16 -0.28 -0.25 0.11 0.28
Length -0.20 -0.21 -0.28 0.18 0.27
Height 0.20 0.21 0.17 -0.07 0.00
Width -0.19 -0.17 -0.21 0.21 0.14
BFD right -0.15 -0.03 -0.01 -0.24 -0.05
BFD left -0.14 -0.09 -0.08 -0.19 -0.02
Age -0.03 -0.14 -0.15 0.06 0.13
Parity -0.06 -0.19 -0.22 0.09 0.18
Injuries 0.35 0.31 0.33 -0.21 -0.29
Rep 3
Weight -0.21 -0.31 -0.22 0.28 0.30*
Length -0.01 -0.06 -0.08 0.10 0.21
Height 0.06 0.16 0.19 -0.05 -0.11
Width -0.30 -0.39** -0.40** 0.33* 0.41**
BFD right -0.10 -0.10 -0.09 -0.05 0.08
BFD left -0.11 -0.12 -0.11 -0.04 0.11
Age -0.17 -0.17 -0.11 0.19 0.16
Parity -0.22 -0.24 -0.15 0.21 0.20
Injuries 0.16 0.33* 0.43** -0.37 -0.46**
G = Group test; 2T = Group test with two troughs; D = Dyadic test; TTTG = Total time
spent at the trough during group test; TTT2T = Total time spent at the trough during group
test with two troughs; BFD = Back fat depth; *P<0.05, **P<0.01, ***P<0.001
50
2.5 Discussion
The results indicate that the five different methods used to measure the social hierarchy in
pigs were more consistent over time and concordant between methods for pregnant sows
than for growing females. This supports our initial hypothesis that sows have a more stable
hierarchy than growing females.
The correlation coefficients between repetitions of social rank measurements obtained for
growing females were lower than those reported by Meese and Ewbank (1972) and Place et
al. (1995), but longer intervals between repetitions (5 weeks) were used in the present
experiment compared to the previous studies (24h for Meese and Ewbank (1972), and 3
weeks for Place et al. (1995)). It could be argued that sows had more time to habituate to
their group because the test started at week 5, while tests for growing females started on
week 1. However, when Rep1 for pregnant sows (week 5) was compared with Rep 2 for
growing females (week 6) or when Rep 2 for pregnant sows (week 11) was compared with
Rep 3 for growing females (week 13), the majority of correlations were still higher for
sows than for growing females. The differences in social rank between repetitions of the
same method were smaller for pregnant sows than for growing females, indicating a higher
consistency over time for pregnant sows than for growing females. There was no
improvement in the consistency over time as the females grew older. Indeed, correlation
coefficients between repetition 2 and 3 were not consistently higher than between 1 and 2,
and average rank differences remained the same. In growing females, the higher
consistency over time for the D test, as indicated by the numerically higher correlation
coefficients between pairs of repetitions, could potentially be explained by the nature of the
D test, which forces interactions between all possible pairs of animals. This may increase
accuracy of the D test compared to the other methods in which several interactions between
animals were missing. Although the percentage of dyads that interacted in the G and 2T test
was on average near 100 % for both growing and mature females, it was not always
possible to clearly determine the outcome of these interactions, as indicated by the
percentages of clearly established dominance rank relationships ranging from 40 to 66%.
The range of percentages of clearly established dominance rank relationships in the G test
51
was similar to the range obtained by Bousquet (2001) (from 28.8 % to 53.3 %) and was
higher than the range obtained by Lafrance (2010) (from 15.1 % to 37.8 %) for groups of
growing pigs. Also, the percentage of clearly established dominance rank relationships in G
and 2T tests was not significantly different between growing females and mature pregnant
sows, suggesting that age differences observed in the concordance between the D test and
other methods were not due to differences in D test accuracy between growing and
pregnant females.
The concordance between the ranks obtained with different methods for the same repetition
was higher for pregnant sows than for growing females. Brouns and Edwards (1994)
reported similar correlation coefficients between social ranks measured with the dyadic test
and a group test in floor fed sows. Low correlation coefficients between test results in
growing pigs were also reported by Lafrance (2010).
This lower concordance between methods observed in growing females could be explained
in several ways. First, it can be argued that the methods used to measure social hierarchy
might be inappropriate for growing animals. Indeed, younger pigs might be more scared by
human presence, handling, or the novel environment than more mature animals (Craig
1986). This may have been especially true with the dyadic test, in which pigs were
separated from their group and placed in a novel environment. However, if such had been
the case, there would have been an improvement in result consistency over time, as
growing females habituated to the handler and the test situation.
A second possible explanation might be that the social hierarchy is less stable in younger
animals. The main difference between growing females and pregnant sows was their age
and their physiological state. Lindberg (2001) reported more social organization instability
in young pigs. Székely et al. (1982/83) also found a high level of instability in piglets’
hierarchy in some of their groups (average rank differences between 1.0 and 1.5). The
average rank differences between repetitions of methods for growing females in the present
experiment were higher than those reported by Székely et al. (1982/83), indicating an even
greater social instability after weaning. The lack of improvement in the stability over time
of test (repetition 1 vs 2 vs 3) would indicate that even at slaughter age, growing females
52
may not be old enough to form a stable hierarchy. Meese and Ewbank (1972, 1973)
reported that frequent social order changes may happen in pigs as old as 30 weeks,
especially in animals of intermediate rank.
A third explanation would be that pigs form a hierarchy based on “winner and loser effects”
as originally described by Landau, 1951 a, b. According to this theory, an animal’s decision
to engage in a combat would be determined by its assessment of its opponent’s fighting
abilities, also termed “resource-holding power” (RHP), as well as its own abilities. Winning
a fight or having an opponent retreat from an aggressive act would increase the animal’s
RHP (winner effect), thus increasing its probability of winning the next encounter, while
losing a fight or retreating from an aggressive act would decrease it (loser effect)
(Dugatkin, 1996). Ewbank and Meese (1974) and Meese and Baldwin (1975) showed
respectively that sight and smell had little to no effect on the establishment of a social
hierarchy. This is in accordance with Bonabeau et al. (1999) who suggested that individual
recognition is not a necessity for hierarchy establishment in a social order based on the
winner and loser effects. According to the model developed by Dugatkin’s (1997), the loser
effect alone creates hierarchies where the most dominant animal is easily identifiable and
the rest of the animals’ social ranks remain unclear, while the winner effect alone creates
hierarchies where a social rank can be assigned unambiguously to most animals. It may be
hypothesised that somehow, growing females show a stronger loser effect and, as they
grow older, the winner effect becomes more important. This could potentially explain the
more stable dominance relationships between pregnant sows and the lack of stability in
growing females, since the loser effect creates a situation where social ranks are not clearly
defined. The loser effect could also explain the low level of clearly established dominance
rank relationships in the G and 2T tests for the growing females.
The correlations between ranks and individual characteristics were for the most part not
significant. None of the individual characteristics measured in this experiment stands out to
be used as a reliable indicator to predict the rank of an animal, which is consistent with the
results of some previous studies (Meese and Ewbank 1973, Fraser 1974, Brouns and
Edwards 1994, Heo et al. 2005). There does not seem to be a consistent correlation between
53
rank and body weight. There were significant correlations between social rank measured
with the D test and weight for all 3 repetitions in growing females, but they were all quite
low. Some correlations were even negative, which is surprising because we would have
expected a positive correlation between size and social rank, as reported by Beilharz and
Cox (1967) and O’Connell and Beattie (1999). These correlations were never significant
for pregnant sows. A potential explanation for the lack of correlation between weight and
social rank is that animals are grouped according to their weight. McBride et al. (1964)
came to the conclusion that the correlation between rank and weight is more important
when there is more weight variation within the group. Brouns and Edwards (1994) noted
that a lack of correlation between weight and dominance happened when weight variation
was low. The weight variation in this experiment ranged between 10 and 12 %.
Experiments in which a significant link between weight and dominance was not found
shared a similar weight variation (Meese and Ewbank, 1973; 20%; Fraser, 1974; 0.2%; Heo
et al., 2005; 4%). The correlations obtained between the BFD and the social ranks, from
-0.24 to 0.13, although not significant, are lower in value than the positive correlation
obtained by Beilharz and Cox (1967) (r = 0.34). The lack of correlation between parity and
dominance was consistent with the results from Brouns and Edwards (1994), who found
that parity was not correlated to dominance in groups where the variation in parity was
small without clearly mentioning it. As for parity, a lack of correlation between age and
dominance has also been reported by Brouns and Edwards (1994). Again, this might be due
to the small age variation between individuals, similarly to weight and parity (Brouns and
Edwards, 1994).
54
2.6 Conclusion
The five methods used to measure social rank were found to be more strongly correlated
and to give more consistent results over time for pregnant sows than for growing females.
These results support our hypothesis that pregnant sows, being older and more mature,
show a more stable hierarchy than growing females. This suggests that the social hierarchy
in growing females is unstable throughout the growing period, or that the tests commonly
used are not appropriate for younger animals. Individual physical characteristics measured
in this experiment were poorly correlated with social rank in both growing females and
pregnant sows, most likely because there was little variation between animals in terms of
physical characteristics. Further experiments using young gilts and following them to
adulthood could help determine at what age the social hierarchy starts to become more
stable.
2.7 Acknowledgments
We would like to thank the Fonds Québécois de Recherche sur la Nature et les
Technologies (FQRNT, Québec, Canada) for their financial support. We would also like to
thank Carole Guérin and Michel Lefèbvre (UMR-SENAH, St-Gilles, France) for their
technical support and UMR-SENAH swine husbandry staff (St-Gilles, France) for their
help with the animals.
55
References
Beilharz, R. G., Cox, D.F., 1967. Social dominance in swine. Animal Behaviour 15, 117-122.
Blackshaw, J. K., Thomas, F.J., Lee, J.-A.,1997. The effect of a fixed or free toy on the growth rate and aggressive behaviour of weaned pigs and the influence of hierarchy
on initial inverstigation of the toys. Applied Animal Behaviour Science 53, 203-212.
Bonabeau, E., Theraulaz, G., Deneubourg, J.-L., 1999. Dominance orders in animal
societies : the self-organization hypothesis revisited. Bulletin of Mathematical Biology 61, 727-757.
Bornett, H. L. I., Morgan, C.A., Lawrence, A.B., Mann, J., 2000. The effect of group housing on feeding patterns and social behaviour of previously individually housed growing pigs. Applied Animal Behaviour Science 70, 127-141.
Bousquet,C. 2001. Étude des relations de dominance-subordination chez le porc domestique en croissance : élaboration d’un index de hiérarchie et d’une méthode
de classement. Rapport de stage de Maîtrise de Biologie Cellulaire et Physique, Option Physiologie animale, 1-25.
Brouns, F., Edwards, S.A., 1994. Social rank and feeding behaviour of group-housed sows
fed competitively or ad libitum. Applied Animal Behaviour Science 39, 225-235. Craig, J. V., 1986. Measuring social behavior: social dominance. Journal of Animal
Science 62, 1120-1129. de Jonge, F. H., Bokkers, E.A.M., Schouten, W.G.P., Helmond, F.A., 1996. Rearing piglets
in a poor environment: developmental aspects of social stress in pigs. Physiology
and Behavior 60, 389-396. Dugatkin, L.A., 1997. Winner and loser effects and the structure of dominance hierarchies.
Behavioral Ecology 8, 583-587 Ewbank, R., Meese, G.B., 1974. Individual recognition and the dominance hierarchy in the
domesticated pig. The role of sight. Animal Behaviour 22, 473-480.
Fraser, D., 1974. The behaviour of growing pigs during experimental social encounters. Journal of Agricultural Science 82, 147–163.
Hansen, L. L., Hagelsø, A.M., Madsen, A., 1982. Behavioural results and performance of bacon pigs fed ad libitum from one or several self-feeders. Applied Animal Ethology 8, 307-333.
Heo, J., Kattesh, H.G., Roberts, M.P., Morrow, J.L., Dailey, J.W., Saxton, M.A., 2005. Hepatic corticosteroid-binding globulin (CBG) messenger RNA expression and
plasma CBG concentrations in young pigs in response to heat and social stress. Journal of Animal Science 83, 208-215.
Hicks, T.A., McGlone, J.J., Whisnant, C.S., Kattesh, H.G., Norman, R.L., 1998.
Behavioral, endocrine, immune, and performance measures for pigs exposed to acute stress. Journal of Animals Science 76, 474-483.
Hsia, L. C., Wood-Gush, D.G.M., 1983/84. The temporal patterns of food intake and allelomimetic feeding by pigs at different ages. Applied Animal Ethology 11, 271-282.
56
Lafrance, J. 2010. Effet de la hiérarchie sociale sur le comportement alimentaire du porc dans un contexte d’antibiothérapie administrée par l’aliment. Master thesis, Université Laval
Landau, HG. 1951 a. On dominance relations and the structure of animal societies: I. Effects of inherent characteristics. Bulletin of Mathematical Biophysics, 13: 1-19.
Landau, HG. 1951 b. On dominance relations and the structure of animal societies: II. Some effects of possible social causes. Bulletin of Mathematical Biophysics, 13: 245-262.
Levasseur, P., Courboulay, V., Meunier-Salaün, M.C., Trespeuch, P., Le Denmat, M., 1996. Alimentation automatisée des porcs en finition. Journées Recherche Porcine
France 28, 439-444. Lindberg, A.C., 2001. Group life. In: Keeling, L.J. and Gonyou H.W (eds.), Social
Behaviour in Farm Animals. CAB International, pp. 37-58.
McBride, G., James, J.W. and Hodgens, N., 1964. Social behaviour of domestic animals. IV. Growing pigs. Animal Production, 6, 129-139.
Meese, G.B., Ewbank, R., 1972. A note on instability of the dominance hierarchy and variations in level of aggression within groups of fattening pigs. Animal Production 14, 359-362.
Meese, G. B., Ewbank, R., 1973. The establishment and nature of the dominance hierarchy in the domesticated pig. Animal Behaviour 21, 326-334.
Meese, G.B., Baldwin, B.A., 1975. The effects of ablation of the olfactory bulbs on aggressive behaviour in pigs. Applied Animal Ethology 1, 251-262.
Nielsen, B.L., Lawrence, A.B., Whittemore, C.T., 1995. Effect of group size on feeding
behaviour, social behaviour, and performance of growing pigs using single-space feeders. Livestock Production Science 44, 73-85.
O’Connell, N.E., Beattie, V.E., 1999. Influence of environmental enrichment on aggressive
behaviour and dominance relationship in growing pigs. Animal Welfare 8, 269-279. Pedersen, L.J., Rojkittikhun, T., Einarsson, S., Edgvist, L.-E., 1993. Postweaning grouped
sows: effects of aggression on hormonal patterns and oestrous behavior. Applied Animal Behaviour Science 38, 25-39.
Place, G., Labroue, F., Meunier-Salaün, M.-C., 1995. Incidence du statut social sur le
comportement alimentaire de porcs en croissance dans un système de distribution individuelle informatisée. Journées Recherche Porcine en France 27, 183-188.
Székely, S., Orbán, E., Kurucz, I., Sárváry, J., 1982/1983. Tube dominance in piglets: structure and stability of dominance order. Applied Animal Ethology 9, 279-288.
Tan, S.S.L., Shackleton, D.M., 1990. Effects of Mixing Unfamiliar Individuals and of
Azaperone on the Social Behaviour of Finishing Pigs. Applied Animal Behaviour Science 26, 157-168.
Tan, S.S.L., Shackleton, D.M., Beames, R.M., 1991. The effect of mixing unfamiliar individuals on the growth and production of finishing pigs. Animal Production 52, 201-206.