Embed Size (px)
Citation preview
Stature estimation from complete long bones in the Middle Pleistocene humans from the Sima de los Huesos, Sierra de Atapuerca (Spain)
]ose-Miguel Carretero a,b", Laura Rodriguez a, Rebeca Garcia-Gonzalez a , ]uan-Luis Arsuaga b,c,
Asier Gomez-Olivencia d , Carlos Lorenzo b,e , Alejandro Bonmati b,c, Ana Gracia b, f, Ignacio Martinez b, f,
Rolf Quam b,g,h
a Laboratorio de Evoluci6n Humana, Dpto. de Ciencias Hist6ricas y Geografia, Universidad de Burgos, Edificio I+D+~ Plaza Misael Bafiuelos sin, 09001 Burgos, Spain b Centro UCM-JSOII de Investigaci6n sobre Evoluci6n y Comportamiento Humanos, Avda. Monforte de Lemos, 5, 28029 Madrid, Spain C Departamento de Paleontologfa, Facultad de Ciencias Geol6gicas, Universidad Complutense de Madrid, Ciudad Universitaria sin, 28040 Madrid, Spain d Leverhulme Centre for Human Evolutionary Studies, Department of Biological Anthropology, University of Cambridge, Cambridge CB2 3Dl, UK e Institut de Paleoecoiogia Humana i Evoluci6 Social-Area de Prehistoria, Facultat de Lletres, Universitat Ravira i Virgil~ Plar;a Imperial Tarraco 1,43005 Tarragona, Spain fDepartamento de Geologfa, Universidad de AicalG, Edificio de Ciencias, Campus Universitario, 28871 AlcalG de Henares, Spain g Department of Anthropology, Binghamton University (SUNY), Binghamton, NY 13902-6000, USA h Division of Anthropology, American Museum of Natuml History, Central Park West at 79th St, New York, NY 10024, USA
Keywords: Body size Limb bones Fossil humans Homo heidelbergensis Spain European hominins
Introduction
ABSTRACT
Systematic excavations at the site of the Sima de los Huesos (SH) in the Sierra de Atapuerca (8urgos, Spain) have allowed us to reconstruct 27 complete long bones of the human species Homo heidelbergensis. The SH sample is used here, together with a sample of 39 complete Homo neanderthalensis long bones and 17 complete early Homo sapiens (Skhul/Qafzeh) long bones, to compare the stature of these three different human species. Stature is estimated for each bone using race- and sex-independent regression formulae, yielding an average stature for each bone within each taxon. The mean length of each long bone from SH is significantly greater (p < 0.05) than the corresponding mean values in the Neandertal sample. The stature has been calculated for male and female specimens separately, averaging both means to calculate a general mean. This general mean stature for the entire sample of long bones is 163.6 cm for the SH hominins, 160.6 cm for Neandertals and 177.4 cm for early modern humans. Despite some overlap in the ranges of variation, all mean values in the SH sample (whether considering isolated bones, the upper or lower limb, males or females or more complete individuals) are larger than those of Neandertals. Given the strong relationship between long bone length and stature, we conclude that SH hominins represent a slightly taller population or species than the Neandertals. However, compared with living European Mediterranean populations, neither the Sima de los Huesos hominins nor the Neandertals should be considered 'short' people. In fact, the average stature within the genus Homo seems to have changed little over the course of the last two million years, since the appearance of Homo ergaster in East Africa. It is only with the emergence of H. sapiens, whose earliest representatives were 'very tall', that a significant increase in stature can be documented.
Researchers have long appreciated the significant relationship between body size and an animal's overall adaptive strategy and life history (see for example Damuth and MacFadden, 1990 and references therein). One measure of size that is especially important for human evolutionary studies is stature. The estimation of
adult stature from skeletal remains is part of the reconstruction of the individual's physique during life, provides an indication of size, and clearly influences body mass. Despite a long history of investigation, stature estimation in fossil hominins is plagued by numerous methodological issues. In palaeoanthropology, stature must be estimated from preserved skeletal elements whose correlation with stature is variable (i.e., thorax, long or short bones, upper or lower limbs, etc.). In addition, the sexual attribution of the fossil specimens in order to use sex-specific formulae and the fact that very often we must work with fragmentary and incomplete specimens further complicates the estimation of stature in fossil
human species. Choosing the statistical estimator and the reference population or sample from which to derive the parameters are two of the main problems in estimating stature from skeletal remains.
The lengths of the limb long bones are highly correlated with stature, especially the weight bearing bones of the lower limbs, and many regression equations have been proposed to estimate stature using the limb bones (e.g., Pearson, 1898; Dupertuis and Hadden, 1951 ; Trotter and Gleser, 1952, 1958; Olivier, 1963; Trotter, 1970; Olivier et al., 1978; Feldesman and Fountain, 1996 among others). However, the relationship between stature and long bone length may differ among populations and, as a consequence, populationspecific regression equations are often used for individuals from different populations. For example, many attempts at stature reconstruction from fossil human long bone specimens generally involve the use of regression analysis based on the Trotter and Gleser equations (Trinkaus, 1983; Vandermeersch and Trinkaus, 1995; Ruff et al., 1997; Carretero et al., 1997, 1999; Rosenberg et al., 2006).
To combat these problems, researchers derived alternate procedures involving the use of reference populations that are more similar in size to the fossil specimens (Lovejoy and Heiple, 1970; McHenry, 1974, 1991, 1992; Olivier, 1976; Trinkaus, 1981, 1983; Leakey and Walker, 1985; Geissmann, 1986; Ruff and Walker, 1993; Ruff et al., 1997). These studies suggest that stature estimations for fossil hominins should be based on equations derived from modern populations with similar body proportions. Preference for a particular regression model should be based on biological factors, and the decision to utilize a particular reference sample should also be based on the most relevant biological context. Nevertheless, the recovery of fossil specimens with clearly distinct body size and proportions further complicates attempts at stature reconstruction.
This is in direct contradiction to the arguments made by many others that 'racial' affinity, sex or body proportions need not be taken into consideration when estimating stature in fossil hominins. For example, Feldesman and Lundy (1988), Feldesman et al. (1990), Feldesman and Fountain (1996) among others, argue that a 'generic' (i.e., average global) ratio provides the most accurate predictor of stature when 'racial' affinity is unknown, as is the case for fossil hominins, where there is no way of knowing if the reference sample is representative of the population from which the target specimen is drawn.
Whichever reference population(s) approach is preferred, results clearly vary depending on the model type regression and statistical technique used (Olivier, 1976; Feldesman and Lundy, 1988; jungers, 1988; Feldesman et al., 1990; Aiello, 1992; Konigsberg et al., 1998; Hens et al., 2000; Porter, 2002; Raxter et al., 2006). Indeed, for some authors the choice of reference sample is considered a purely statistical issue (Kendall and Stuart, 1967). Due to the difficulties inherent in these methodological issues and the impossibility of making a final recommendation broadly applicable to all palaeoanthropological contexts, we cannot rule out, and we explore, stature estimations based on mixed-sex and multi-racial regression formulae.
Our objective in the present study is to estimate a mean stature of Homo heidelbergensis using a sample of complete upper and lower limb long bones from the Sima de los Huesos (SH) site in the Sierra de Atapuerca and to compare the results with samples of complete Homo neanderthalensis and early Homo sapiens (EMH) (Skhul/Qafzeh) long bones. More limited comparisons are also drawn with other Pleistocene Homo fossils from Asia and Africa.
Material and methods
The Sima de los Huesos site in the Sierra de Atapuerca (Burgos, Spain) (Arsuaga et al., 1997b) contains an accumulation of Middle
Pleistocene human fossils considered to represent the evolutionary ancestors of the Neandertals. The remains from the site are wellpreserved. A minimum of 28 humans (Bermudez de Castro et al., 2004), fragmented and scattered, have been recovered from a mud-breccia laying stratigraphically below a jumble of bones of the Middle Pleistocene cave bear (Ursus deningeJi; Garcia et al., 1997). The collection has significantly increased the fossil record of post cranial remains of H. heidelbergensis and provides an unprecedented opportunity to study intra-population variation (Arsuaga et al., 1991, 1993, 1995, 1997a, 1999; Martinez and Arsuaga, 1997; Carretero et al., 1997; 2004; Lorenzo et al., 1998; Gomez-Olivencia et al. , 2007; Martinez et al., 2008; Gracia et al., 2009). The most recent attempts to date the site have suggested a minimum age of 530 ka (thousands of years ago) (Bischoff et al., 2007).
One of the most significant aspects of the SH collection is that entire human bodies appear to have been deposited at the site, and it is likely that all of the bones recovered to date were originally complete (Arsuaga et al., 1997b). During the last 20 years, systematic excavations at the SH site and diligent restoration of the specimens have made it possible to reconstruct 27 complete or virtually complete adult long bones from upper and lower limbs that can be used to estimate stature in H. heidelbergensis (Table 1). Fourteen of
Table 1 Maximum length and estimated height (cm) from complete Homo heidelbergensis long bones from Sima de los Huesos sorted into groups by sex and bone (n = 27).
Side Maximum length Height'-
SH male specimens (N _ 21) Humerus Humerus 11 R 34.2 177.0
Humerus X R 31.8 165.9 Humerus XV L 34.2 177.0
Radius Radius 11 L 24.2 166.2 Radius IV L 25.7 171.8 Radius V R 25.7 171.8 Radius VI R 24.5 167.3 Radius VII R 25.6 171.5 Radius XI L 25.0 169.2
Ulna Ulna VII R 27.5 173.6 Ulna XIIb R (25.6) 164.8
Femur Femur XC L 45.8 170.0 Femur XII L 45.0 167.8 Femur XIII R 45.0 167.8
Tibiad Tibia III L 37.8 171.7 Tibia VI R 35.6 164.5 Tibia XI R 35.1 162.8 Tibia XII R 36.8 168.4 AT-848 R 37.8 171.7
Fibulae Fibula I L 34.6 (35.1) 162.3 Fibula III L 33.7 (35.7) 164.5
SH female specimens (N = 6) Radius Radius I R 22.2 158.6
Radius X L 22.1 158.2 Ulna Ulna VIIIb L (24.4) 159.3 Tibiad Tibia I R 33.6 157.9
Tibia IV R 32.5 154.3 Fibulae Fibula 11 L 32.3 (32.7) 153.7
a Sj0vold (1990) weighted lines of organic correlation formulae for all ethnic groups independent of sex (see Table 5).
b Estimated maximum length in parentheses. Ulna VIII lacks the distal styloid process, whose length has been estimated at 3 mm. Ulna XII lacks the distal epiphysis.
C The previous estimate of the maximum length of the then incomplete Femur X was 47.5 cm (Arsuaga et aI. , 1999). Today it is a complete bone (see below and also Bonmati et aI. , 2010 ).
d Tibia length used in Sj0vold formulae and given here is M1 = Total Length of Martin and Saller (1957): from the top of the lateral proximal condyle to the tip of distal malleolus (proximal spines are not included).
e PreselVed maximum length and estimated maximum length in parentheses. Fibula I lacks the tip of the distallateral malleolus, whose length has been estimated as 5 mm. Fibula 11 lacks the apex of the head or proximal styloid process, whose length has been estimated at 4 mm. Fibula III lacks the proximal epiphysis and 20 mm have been added to the preselVed length.
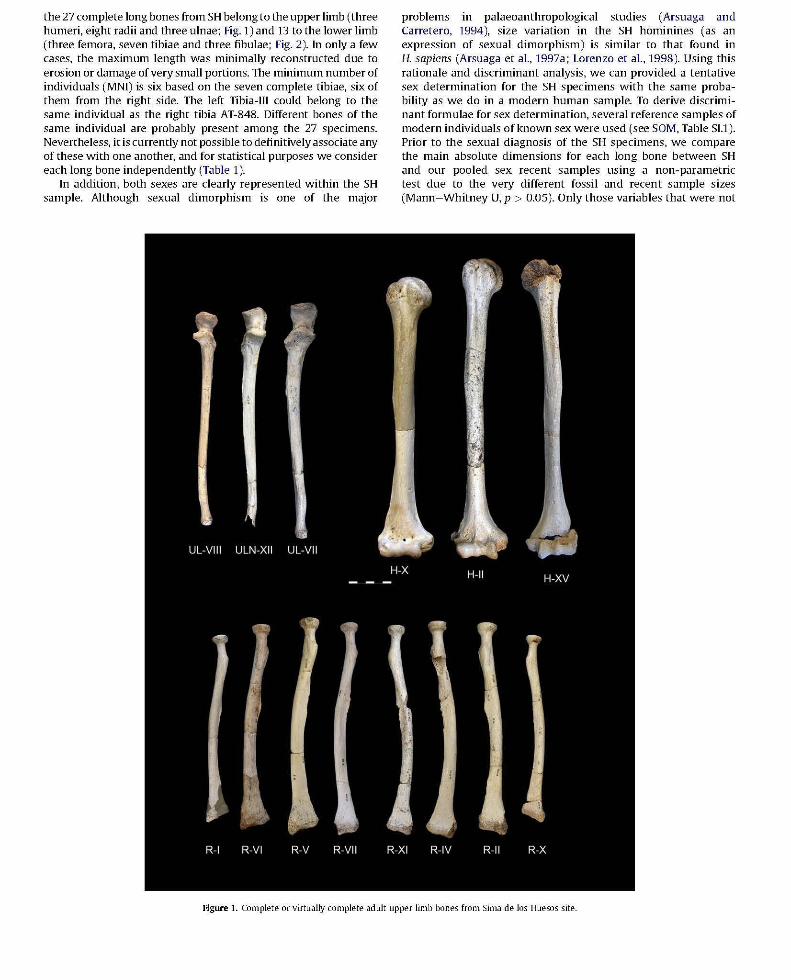
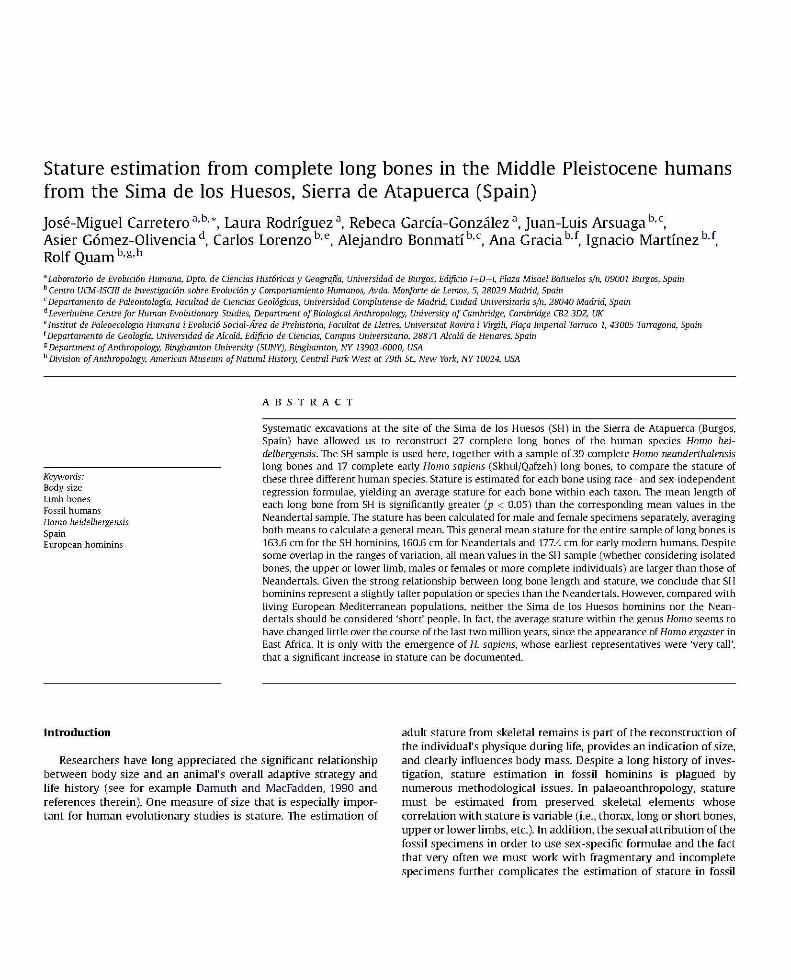
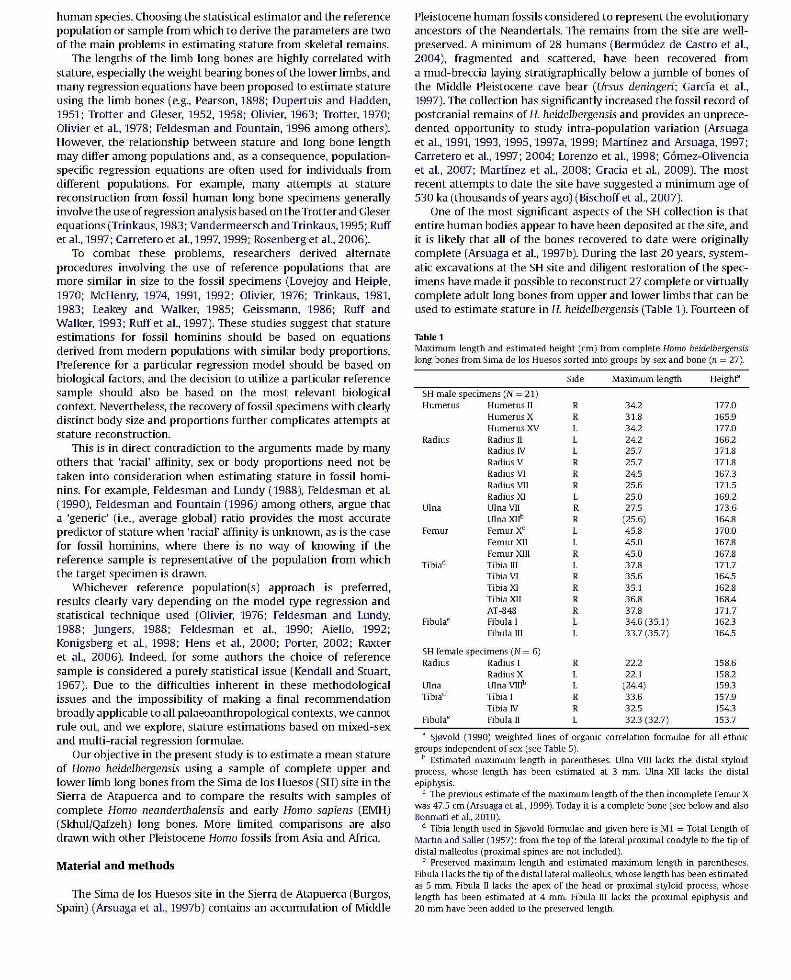
the 27 complete long bones from SH belong to the upper limb (three humeri, eight radii and three ulnae; Fig. 1) and 13 to the lower limb (three femora, seven tibiae and three fibulae; Fig. 2). In only a few cases, the maximum length was minimally reconstructed due to erosion or damage of very small portions. The minimum number of individuals (MNI) is six based on the seven complete tibiae, six of them from the right side. The left Tibia-Ill could belong to the same individual as the right tibia AT-848. Different bones of the same individual are probably present among the 27 specimens. Nevertheless, it is currently not possible to definitively associate any of these with one another, and for statistical purposes we consider each long bone independently (Table 1).
In addition, both sexes are clearly represented within the SH sample. Although sexual dimorphism is one of the major
problems in palaeoanthropological studies (Arsuaga and Carretero, 1994), size variation in the SH hominines (as an expression of sexual dimorphism) is similar to that found in H. sapiens (Arsuaga et al., 1997a; Lorenzo et al., 1998 ). Using this rationale and discriminant analysis, we can provided a tentative sex determination for the SH specimens with the same probability as we do in a modern human sample. To derive discriminant formulae for sex determination, several reference samples of modern individuals of known sex were used (see SOM, Table 51.1). Prior to the sexual diagnosis of the SH specimens, we compare the main absolute dimensions for each long bone between SH and our pooled sex recent samples using a non-parametric test due to the very different fossil and recent sample sizes (Mann-Whitney U, p > 0.05). Only those variables that were not
Figure 1. Complete or virtually complete adult upper limb bones from Sima de los Huesos site.
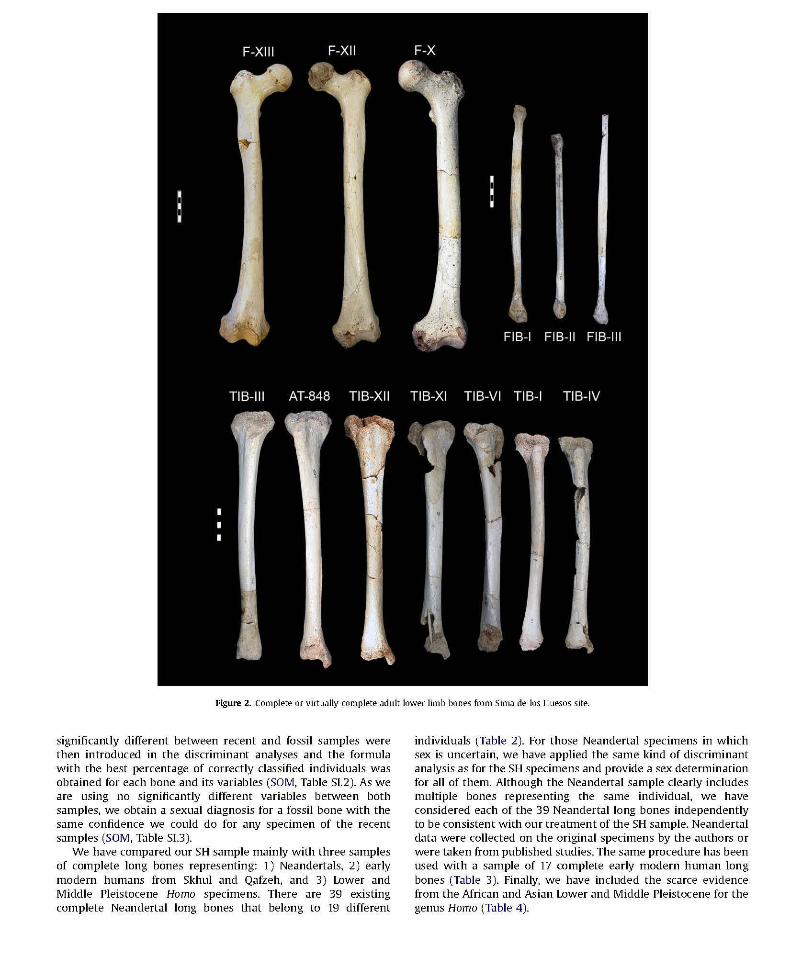
Figure 2. Complete or virtually complete adult lower limb bones from Sima de los Huesos site.
significantly different between recent and fossil samples were then introduced in the discriminant analyses and the formula with the best percentage of correctly classified individuals was obtained for each bone and its variables (SOM, Table 51.2). As we are using no significantly different variables between both samples, we obtain a sexual diagnosis for a fossil bone with the same confidence we could do for any specimen of the recent samples (SOM, Table SI.3).
We have compared our SH sample mainly with three samples of complete long bones representing: 1) Neandertals, 2) early modern humans from Skhul and Qafzeh, and 3) Lower and Middle Pleistocene Homo specimens. There are 39 existing complete Neandertal long bones that belong to 19 different
individuals (Table 2). For those Neandertal specimens in which sex is uncertain, we have applied the same kind of discriminant analysis as for the SH specimens and provide a sex determination for all of them. Although the Neandertal sample clearly includes multiple bones representing the same individual, we have considered each of the 39 Neandertallong bones independently to be consistent with our treatment of the SH sample. Neandertal data were collected on the original specimens by the authors or were taken from published studies. The same procedure has been used with a sample of 17 complete early modern human long bones (Table 3). Finally, we have included the scarce evidence from the African and Asian Lower and Middle Pleistocene for the genus Homo (Table 4 ).
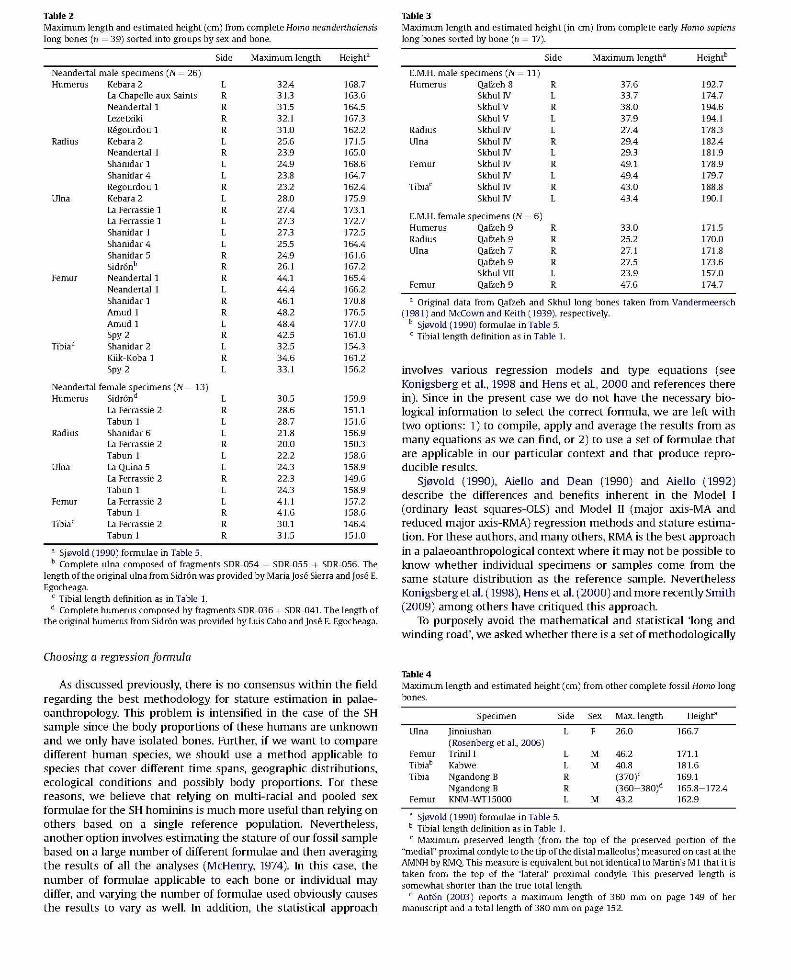
Table 2 Maximum length and estimated height (cm) from complete Homo neanderthalensis long bones (n = 39) sorted into groups by sex and bone.
Neandertal male specimens (N _ 26) Humerus Kebara 2
Radius
Ulna
Femur
La Chapelle aux Saints Neandertal 1 Lezetxiki Regourdou 1 Kebara 2 Neandertal 1 Shanidar 1 Shanidar 4 Regourdou 1 Kebara 2 La Ferrassie 1 La Ferrassie 1 Shanidar 1 Shanidar 4 Shanidar 5 Sidr6nb
Neandertal 1 Neandertal 1 Shanidar 1 Amud 1 Amud 1 Spy 2 Shanidar 2
Side
L R R R R L R L L R L R L L L R R R L R R L R L
Kiik-Koba 1 R Spy 2 L
Neandertal female specimens (N = 13) Humerus Sidr6nd L
Radius
Ulna
Femur
La Ferrassie 2 R Tabun 1 L Shanidar 6 La Ferrassie 2 Tabun 1 La Quina 5 La Ferrassie 2 Tabun 1 La Ferrassie 2 Tabun 1 La Ferrassie 2 Tabun 1
L R L L R L L R R R
a Sj0vold (1990) formulae in Table 5.
Maximum length
32.4 31.3 31.5 32.1 31.0 25.6 23.9 24.9 23.8 23.2 28.0 27.4 27.3 27.3 25.5 24.9 26.1 44.1 44.4 46.1 48.2 48.4 42.5 32.5 34.6 33.1
30.5 28.6 28.7 21.8 20.0 22.2 24.3 22.3 24.3 41.1 41.6 30.1 31.5
Heighe
168.7 163.6 164.5 167.3 162.2 171.5 165.0 168.6 164.7 162.4 175.9 173.1 172.7 172.5 164.4 161.6 167.2 165.4 166.2 170.8 176.5 177.0 161.0 154.3 161.2 156.2
159.9 151.1 151.6 156.9 150.3 158.6 158.9 149.6 158.9 157.2 158.6 146.4 151.0
b Complete ulna composed of fragments SDR-054 + SDR-055 + SDR-056. The length of the original ulna from Sidr6n was provided by MariaJose Sierra and Jose E. Egocheaga.
C Tibial length definition as in Table 1. d Complete humerus composed by fragments SDR-036 + SDR-041. The length of
the original humerus from Sidr6n was provided by Luis Cabo and Jose E. Egocheaga.
Choosing a regression fonnula
As discussed previously, there is no consensus within the field regarding the best methodology for stature estimation in palaeoanthropology. This problem is intensified in the case of the SH sample since the body proportions of these humans are unknown and we only have isolated bones. Further, if we want to compare different human species, we should use a method applicable to species that cover different time spans, geographic distributions, ecological conditions and possibly body proportions. For these reasons, we believe that relying on multi-racial and pooled sex formulae for the SH hominins is much more useful than relying on others based on a single reference population. Nevertheless, another option involves estimating the stature of our fossil sample based on a large number of different formulae and then averaging the results of all the analyses (McHenry, 1974). In this case, the number of formulae applicable to each bone or individual may differ, and varying the number of formulae used obviously causes the results to vary as well. In addition, the statistical approach
Table 3 Maximum length and estimated height (in cm) from complete early Homo sapiens long bones sorted by bone (n = 17).
Side
E.M.H. male specimens (N _ 11) Humerus Qafleh 8 R
Skhul IV L SkhulV R Skhul V L
Radius Ulna
Femur
Skhul IV Skhul IV Skhul IV Skhul IV Skhul IV Skhul IV Skhul IV
E.M.H. female specimens (N = 6) Humerus Qafleh 9 Radius Qafleh 9 Ulna Qafleh 7
Qafleh 9 Skhul VII
Femur Qafleh 9
L R L R L R L
R R R R L R
Maximum lengtha
37.6 33.7 38.0 37.9 27.4 29.4 29.3 49.1 49.4 43.0 43.4
33.0 25.2 27.1 27.5 23.9 47.6
Heightb
192.7 174.7 194.6 194.1 178.3 182.4 181.9 178.9 179.7 188.8 190.1
171.5 170.0 171.8 173.6 157.0 174.7
a Original data from Qafzeh and Skhullong bones taken from Vandermeersch (1981) and McCown and Keith (1939), respectively.
b Sj0vold (1990) formulae in Table 5. C Tibial length definition as in Table 1.
involves various regression models and type equations (see Konigsberg et al., 1998 and Hens et al., 2000 and references there in). Since in the present case we do not have the necessary biological information to select the correct formula, we are left with two options: 1) to compile, apply and average the results from as many equations as we can find, or 2) to use a set of formulae that are applicable in our particular context and that produce reproducible results.
Sj0vold (1990), Aiello and Dean (1990) and Aiello (1992) describe the differences and benefits inherent in the Model I (ordinary least squares-OLS) and Model 11 (major axis-MA and reduced major axis-RMA) regression methods and stature estimation. For these authors, and many others, RMA is the best approach in a palaeoanthropological context where it may not be possible to know whether individual specimens or samples come from the same stature distribution as the reference sample. Nevertheless Konigsberg et al. (1998), Hens et al. (2000) and more recently Smith (2009) among others have critiqued this approach.
To purposely avoid the mathematical and statistical 'long and winding road', we asked whether there is a set of methodologically
Table 4 Maximum length and estimated height (cm) from other complete fossil Homo long bones.
Ulna
Femur Tibiab
Tibia
Femur
Specimen
Jinniushan (Rosenberg et aI. , 2006 ) Trinil I Kabwe Ngandong B Ngandong B KNM-WT15000
Side
L
L L R R L
a Sj0vold (1990) formulae in Table 5. b Tibial length definition as in Table 1.
Sex
F
M M
M
Max.length
26.0
46.2 40.8 (370)C (360-380)d 43.2
Heighta
166.7
171.1 181.6 169.1 165.8-172.4 162.9
C Maximum preselVed length (from the top of the preselVed portion of the "medial" proximal condyle to the tip of the distal malleolus) measured on cast at the AMNH by RMQ This measure is equivalent but not identical to Martin's Ml that it is taken from the top of the 'lateral' proximal condyle. This preserved length is somewhat shorter than the true total length.
d Ant6n (2003) reports a maximum length of 360 mm on page 149 of her manuscript and a total length of 380 mm on page 152.
homogeneous formulae that is applicable to our particular situation. That is, a set offormulae applicable to all the long bones of the body, to different human species (fossil and recent), based on large samples of individuals and that are independent of race, body proportions and sex, that facilitate both stature estimation and its comparison between different human species, and whose results are reasonable.
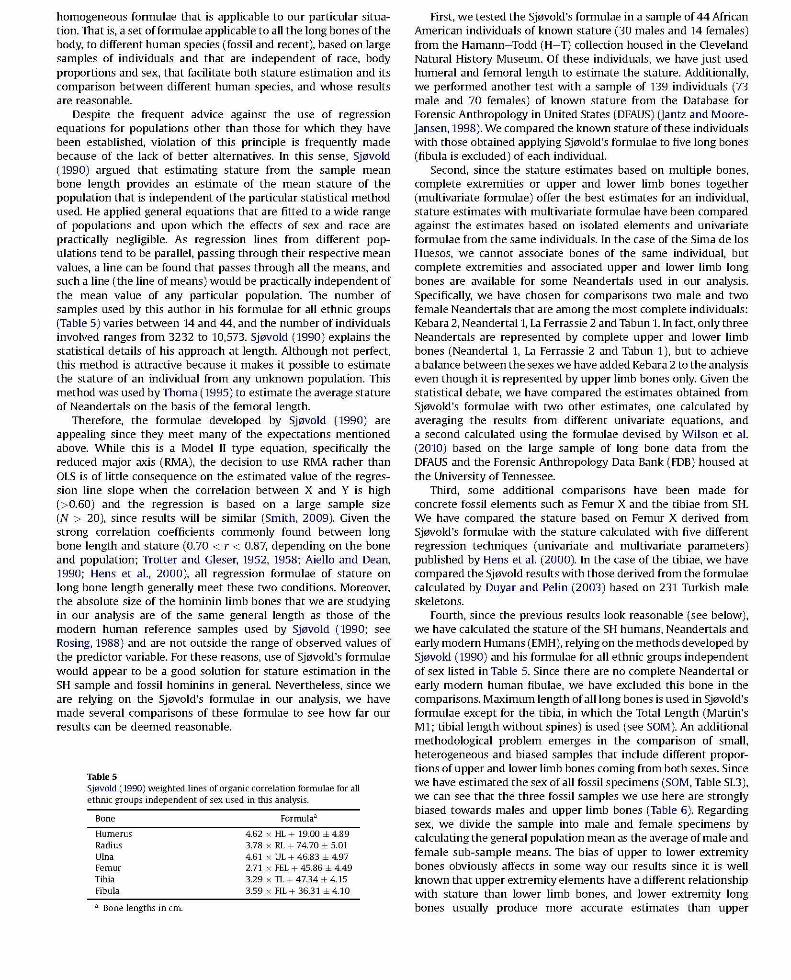
Despite the frequent advice against the use of regression equations for populations other than those for which they have been established, violation of this principle is frequently made because of the lack of better alternatives. In this sense, Sj0vold (1990) argued that estimating stature from the sample mean bone length provides an estimate of the mean stature of the population that is independent of the particular statistical method used. He applied general equations that are fitted to a wide range of populations and upon which the effects of sex and race are practically negligible. As regression lines from different populations tend to be parallel, passing through their respective mean values, a line can be found that passes through all the means, and such a line (the line of means) would be practically independent of the mean value of any particular population. The number of samples used by this author in his formulae for all ethnic groups (Table 5) varies between 14 and 44, and the number of individuals involved ranges from 3232 to 10,573. Sj0vold (1990) explains the statistical details of his approach at length. Although not perfect, this method is attractive because it makes it possible to estimate the stature of an individual from any unknown population. This method was used by Thoma (1995) to estimate the average stature of Neandertals on the basis of the femoral length.
Therefore, the formulae developed by Sj0vold (1990) are appealing since they meet many of the expectations mentioned above. While this is a Model 11 type equation, specifically the reduced major axis (RMA), the decision to use RMA rather than OLS is of little consequence on the estimated value of the regression line slope when the correlation between X and Y is high (>0.60) and the regression is based on a large sample size (N > 20), since results will be similar (Smith, 2009). Given the strong correlation coefficients commonly found between long bone length and stature (0.70 < r < 0.87, depending on the bone and population; Trotter and Gleser, 1952, 1958; Aiello and Dean, 1990; Hens et al., 2000 ), all regression formulae of stature on long bone length generally meet these two conditions. Moreover, the absolute size of the hominin limb bones that we are studying in our analysis are of the same general length as those of the modern human reference samples used by Sj0vold (1990; see Rasing, 1988) and are not outside the range of observed values of the predictor variable. For these reasons, use of Sj0vold's formulae would appear to be a good solution for stature estimation in the SH sample and fossil hominins in general. Nevertheless, since we are relying on the Sj0vold's formulae in our analysis, we have made several comparisons of these formulae to see how far our results can be deemed reasonable.
Table 5 Sj0vold (1990 ) weighted lines of organic correlation formulae for all ethnic groups independent of sex used in this analysis.
Bone
Humerus Radius Ulna Femur Tibia Fibula
a Bone lengths in cm.
Formulaa
4.62 x HL + 19.00 ± 4.89 3.78 x RL + 74.70 ± 5.01 4.61 x UL + 46.83 ± 4.97 2.71 x FEL + 45.86 ± 4.49 3.29 x TL+ 47.34 ± 4.15 3.59 x FIL+36.31 ±4.10
First, we tested the Sj0vold's formulae in a sample of 44 African American individuals of known stature (30 males and 14 females) from the Hamann-Todd (H-T) collection housed in the Cleveland Natural History Museum. Of these individuals, we have just used humeral and femoral length to estimate the stature. Additionally, we performed another test with a sample of 139 individuals (73 male and 70 females) of known stature from the Database for Forensic Anthropology in United States (DFAUS) Uantz and Moorejansen, 1998). We compared the known stature of these individuals with those obtained applying Sj0Vold's formulae to five long bones (fibula is excluded) of each individual.
Second, since the stature estimates based on multiple bones, complete extremities or upper and lower limb bones together (multivariate formulae) offer the best estimates for an individual, stature estimates with multivariate formulae have been compared against the estimates based on isolated elements and univariate formulae from the same individuals. In the case of the Sima de los Huesos, we cannot associate bones of the same individual, but complete extremities and associated upper and lower limb long bones are available for some Neandertals used in our analysis. Specifically, we have chosen for comparisons two male and two female Neandertals that are among the most complete individuals: Kebara 2, Neandertal1, La Ferrassie 2 and Tabun 1. In fact, only three Neandertals are represented by complete upper and lower limb bones (Neandertal 1, La Ferrassie 2 and Tabun 1), but to achieve a balance between the sexes we have added Kebara 2 to the analysis even though it is represented by upper limb bones only. Given the statistical debate, we have compared the estimates obtained from Sj0Vold's formulae with two other estimates, one calculated by averaging the results from different univariate equations, and a second calculated using the formulae devised by Wilson et al. (2010) based on the large sample of long bone data from the DFAUS and the Forensic Anthropology Data Bank (FDB) housed at the University of Tennessee.
Third, some additional comparisons have been made for concrete fossil elements such as Femur X and the tibiae from SH. We have compared the stature based on Femur X derived from Sj0Vold's formulae with the stature calculated with five different regression techniques (univariate and multivariate parameters) published by Hens et al. (2000). In the case of the tibiae, we have compared the Sj0vold results with those derived from the formulae calculated by Duyar and Pelin (2003) based on 231 Turkish male skeletons.
Fourth, since the previous results look reasonable (see below), we have calculated the stature of the SH humans, Neandertals and early modern Humans (EMH), relying on the methods developed by Sj0vold (1990) and his formulae for all ethnic groups independent of sex listed in Table 5. Since there are no complete Neandertal or early modern human fibulae, we have excluded this bone in the comparisons. Maximum length of all long bones is used in Sj0vold's formulae except for the tibia, in which the Total Length (Martin's M1; tibial length without spines) is used (see SOM ). An additional methodological problem emerges in the comparison of small, heterogeneous and biased samples that include different proportions of upper and lower limb bones coming from both sexes. Since we have estimated the sex of all fossil specimens (SOM, Table SI.3), we can see that the three fossil samples we use here are strongly biased towards males and upper limb bones (Table 6). Regarding sex, we divide the sample into male and female specimens by calculating the general population mean as the average of male and female sub-sample means. The bias of upper to lower extremity bones obviously affects in some way our results since it is well known that upper extremity elements have a different relationship with stature than lower limb bones, and lower extremity long bones usually produce more accurate estimates than upper
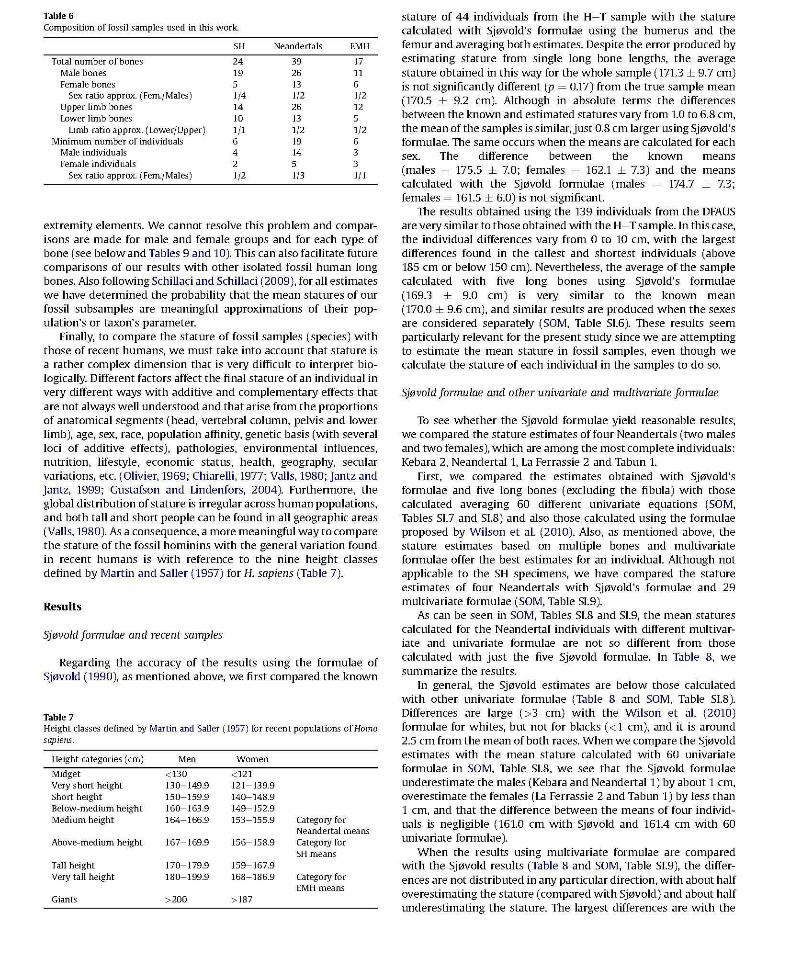
Table 6 Composition of fossil samples used in this work.
SH Neandertals EMH
Total number of bones 24 39 17 Male bones 19 26 11 Female bones 5 13 6
Sex ratio approx. (Fem.fMales) 1/4 1/2 1/2 Upper limb bones 14 26 12 Lower limb bones 10 13 5
Limb ratio approx. (Lower/Upper) 1/1 1/2 1/2 Minimum number of individuals 6 19 6
Male individuals 4 14 3 Female individuals 2 5 3
Sex ratio approx. (Fem.fMales) 1/2 1/3 1/1
extremity elements. We cannot resolve this problem and comparisons are made for male and female groups and for each type of bone (see below and Tables 9 and 10). This can also facilitate future comparisons of our results with other isolated fossil human long bones. Also following Schillaci and Schillaci (2009), for all estimates we have determined the probability that the mean statures of our fossil subsamples are meaningful approximations of their population's or taxon's parameter.
Finally, to compare the stature of fossil samples (species) with those of recent humans, we must take into account that stature is a rather complex dimension that is very difficult to interpret biologically. Different factors affect the final stature of an individual in very different ways with additive and complementary effects that are not always well understood and that arise from the proportions of anatomical segments (head, vertebral column, pelvis and lower limb), age, sex, race, population affinity, genetic basis (with several loci of additive effects), pathologies, environmental influences, nutrition, lifestyle, economic status, health, geography, secular variations, etc. (Olivier, 1969; Chiarelli, 1977; Valls, 1980; Jantz and Jantz, 1999; Gustafson and Lindenfors, 2004). Furthermore, the global distribution of stature is irregular across human populations, and both tall and short people can be found in all geographic areas (Valls, 1980). As a consequence, a more meaningful way to compare the stature of the fossil hominins with the general variation found in recent humans is with reference to the nine height classes defined by Martin and Sailer (1957) for H. sapiens (Table 7).
Results
Sj0vold formulae and recent samples
Regarding the accuracy of the results using the formulae of Sj0vold (1990), as mentioned above, we first compared the known
Table 7 Height classes defined by Martin and Saller (1957) for recent populations of Homo sapiens.
Height categories (cm) Men Women
Midget <130 <121 Very short height 130-149.9 121-139.9 Short height 150-159.9 140-148.9 Below-medium height 160-163.9 149-152.9 Medium height 164-166.9 153-155.9 CategOlY for
Neandertal means Above-medium height 167-169.9 156-158.9 CategOlY for
SH means Tall height 170-179.9 159-167.9 Very tall height 180-199.9 168-186.9 CategOlY for
EMH means Giants >200 >187
stature of 44 individuals from the H-T sample with the stature calculated with Sj0vold's formulae using the humerus and the femur and averaging both estimates. Despite the error produced by estimating stature from single long bone lengths, the average stature obtained in this way for the whole sample (171.3 ± 9.7 cm) is not significantly different (p = 0.17) from the true sample mean (170.5 ± 9.2 cm). Although in absolute terms the differences between the known and estimated statures vary from 1.0 to 6.8 cm, the mean of the samples is similar,just 0.8 cm larger using Sj0vold's formulae. The same occurs when the means are calculated for each sex. The difference between the known means (males = 175.5 ± 7.0; females = 162.1 ± 7.3) and the means calculated with the Sj0vold formulae (males = 174.7 ± 7.3; females = 161.5 ± 6.0) is not significant.
The results obtained using the 139 individuals from the DFAUS are very similar to those obtained with the H-T sample. In this case, the individual differences vary from 0 to 10 cm, with the largest differences found in the tallest and shortest individuals (above 185 cm or below 150 cm). Nevertheless, the average of the sample calculated with five long bones using Sj0vold's formulae (169.3 ± 9.0 cm) is very similar to the known mean (170.0 ± 9.6 cm), and similar results are produced when the sexes are considered separately (SOM, Table 51.6). These results seem particularly relevant for the present study since we are attempting to estimate the mean stature in fossil samples, even though we calculate the stature of each individual in the samples to do so.
Sj0vold formulae and other univariate and multivariate formulae
To see whether the Sj0vold formulae yield reasonable results, we compared the stature estimates offour Neandertals (two males and two females), which are among the most complete individuals: Kebara 2, Neandertal 1, La Ferrassie 2 and Tabun 1.
First, we compared the estimates obtained with Sj0vold's formulae and five long bones (excluding the fibula) with those calculated averaging 60 different univariate equations (SOM, Tables 51.7 and 51.8) and also those calculated using the formulae proposed by Wilson et al. (2010). Also, as mentioned above, the stature estimates based on multiple bones and multivariate formulae offer the best estimates for an individual. Although not applicable to the SH specimens, we have compared the stature estimates of four Neandertals with Sj0vold's formulae and 29 multivariate formulae (SOM, Table 51.9).
As can be seen in SOM, Tables 51.8 and 51.9, the mean statures calculated for the Neandertal individuals with different multivariate and univariate formulae are not so different from those calculated with just the five Sj0vold formulae. In Table 8, we summarize the results.
In general, the Sj0vold estimates are below those calculated with other univariate formulae (Table 8 and SOM, Table 51.8). Differences are large (>3 cm) with the Wilson et al. (2010) formulae for whites, but not for blacks «1 cm), and it is around 2.5 cm from the mean of both races. When we compare the Sj0vold estimates with the mean stature calculated with 60 univariate formulae in SO M, Table 51.8, we see that the Sj0vold formulae underestimate the males (Kebara and Neandertal 1) by about 1 cm, overestimate the females (La Ferrassie 2 and Tabun 1) by less than 1 cm, and that the difference between the means of four individuals is negligible (161.0 cm with Sj0vold and 161.4 cm with 60 univariate formulae).
When the results using multivariate formulae are compared with the Sj0vold results (Table 8 and SOM, Table 51.9), the differences are not distributed in any particular direction, with about half overestimating the stature (compared with Sj0vold) and about half underestimating the stature. The largest differences are with the
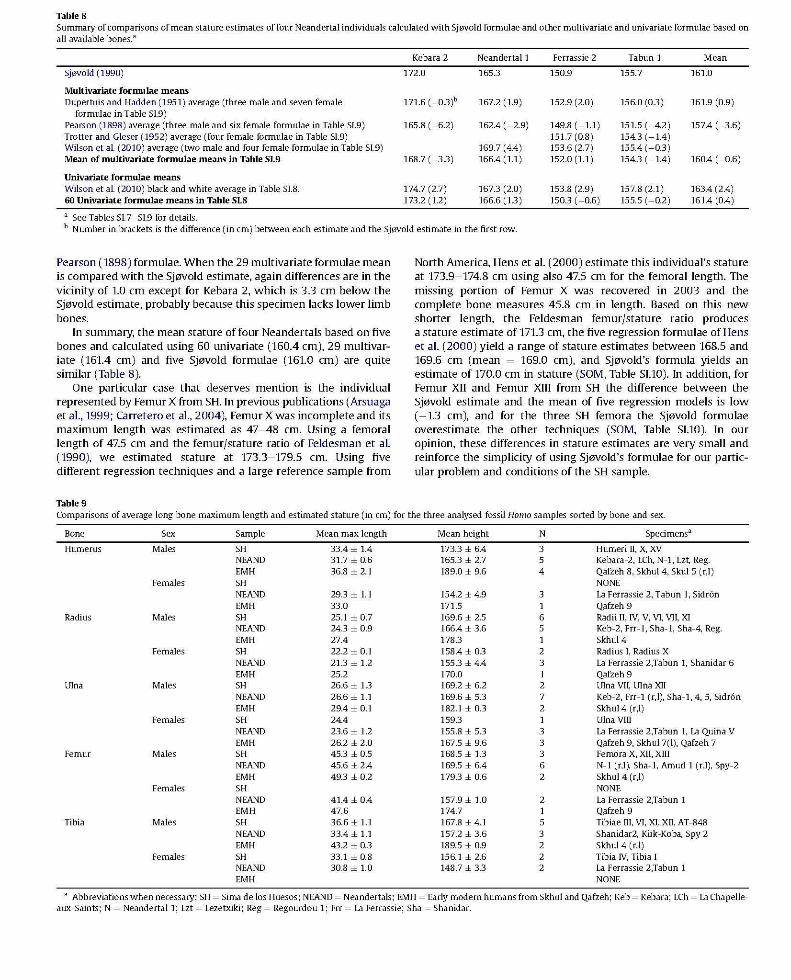
Table 8 Summary of comparisons of mean stature estimates of four Neandertal individuals calculated with Sj0vold formulae and other multivariate and univariate formulae based on all available bones.a
Kebara 2 Neandertall Ferrassie 2 Tabun 1 Mean
Sj0vold (1990) 172.0 165.3 150.9 155.7 161.0
Multivariate formulae means Dupertuis and Hadden (1951) average (three male and seven female 171.6 (_O.3)b 167.2 (1.9) 152.9 (2.0) 156.0 (0.3) 161.9 (0.9)
formulae in Table S1.9) Pearson (1898) average (three male and six female formulae in Table S1.9) 165.8 (-6.2) 162.4 (-2.9) 149.8 (-1.1) 151.5 (-4.2) 157.4 (-3.6) Trotter and Gleser (1952) average (four female formulae in Table S1.9) 151.7 (0.8) 154.3 (-1.4) Wilson et al. (2010) average (two male and four female formulae in Table S1.9) 169.7 (4.4 ) 153.6 (2.7) 155.4 (-0.3) Mean of multivariate formulae means in Table SI.9 168.7 (-3.3) 166.4 (1.1 ) 152.0 (1.1) 154.3 (-1.4) 160.4 (-0.6)
Univariate formulae means Wilson et al. (2010) black and white average in Table S1.8. 174.7 (2.7) 167.3 (2.0) 153.8 (2.9) 157.8 (2.1) 163.4 (2.4) 60 Univariate formulae means in Table SI.8 173.2 (1.2) 166.6 (1.3) 150.3 (-0.6) 155.5 (-0.2) 161.4 (0.4)
a See Tables S1.7-S1.9 for details. b Number in brackets is the difference (in cm) between each estimate and the Sj0vold estimate in the first row.
Pearson (1898) formulae. When the 29 multivariate formulae mean is compared with the Sj0vold estimate, again differences are in the vicinity of 1.0 cm except for Kebara 2, which is 3.3 cm below the Sj0vold estimate, probably because this specimen lacks lower limb bones.
In summary, the mean stature of four Neandertals based on five bones and calculated using 60 univariate (160.4 cm), 29 multivariate (161.4 cm) and five Sj0vold formulae (161.0 cm) are quite similar (Table 8).
One particular case that deserves mention is the individual represented by Femur X from SH. In previous publications (Arsuaga et al., 1999; Carretero et al., 2004), Femur X was incomplete and its maximum length was estimated as 47-48 cm. Using a femoral length of 47.5 cm and the femur/stature ratio of Feldesman et al. (1990), we estimated stature at 173.3-179.5 cm. Using five different regression techniques and a large reference sample from
Table 9
North America, Hens et al. (2000) estimate this individual's stature at 173.9-174.8 cm using also 47.5 cm for the femoral length. The missing portion of Femur X was recovered in 2003 and the complete bone measures 45.8 cm in length. Based on this new shorter length, the Feldesman femur/stature ratio produces a stature estimate of 171.3 cm, the five regression formulae of Hens et al. (2000) yield a range of stature estimates between 168.5 and 169.6 cm (mean = 169.0 cm), and Sj0vold's formula yields an estimate of 170.0 cm in stature (SOM, Table 51.10). In addition, for Femur XII and Femur XIII from SH the difference between the Sj0vold estimate and the mean of five regression models is low (-1.3 cm), and for the three SH femora the Sj0vold formulae overestimate the other techniques (SOM, Table 51.10). In our opinion, these differences in stature estimates are very small and reinforce the simplicity of using Sj0vold's formulae for our particular problem and conditions of the SH sample.
Comparisons of average long bone maximum length and estimated stature (in cm) for the three analysed fossil Homo samples sorted by bone and sex.
Bone Sex Sample Mean max length Mean height N Specimensa
Humerus Males SH 33.4 ± 1.4 173.3 ± 6.4 3 Humeri II, X, "XV NFAND 31.7 ± 0.6 165.3 ± 2.7 5 Kebara-2, LCh, N-l, Lzt Reg. EMH 36.8 ± 2.1 189.0 ± 9.6 4 Qafzeh 8, Skhul4, Skul 5 (r,l)
Females SH NONE NEAND 29.3 ± 1.1 154.2 ± 4.9 3 La Ferrassie 2, Tabun 1, Sidr6n EMH 33.0 171.5 Qafzeh 9
Radius Males SH 25.1 ± 0.7 169.6 ± 2.5 6 Radii II, IV, V, VI, VII, XI NEAND 24.3 ± 0.9 166.4 ± 3.6 5 Keb-2, Frr-l , Sha-1, Sha-4, Reg. EMH 27.4 178.3 Skhul4
Females SH 22.2 ± 0.1 158.4±0.3 2 Radius I, Radius X NEAND 21.3 ± 1.2 155.3±4.4 3 La Ferrassie 2,Tabun 1, Shanidar 6 EMH 25.2 170.0 Qafzeh 9
Ulna Males SH 26.6 ± 1.3 169.2 ± 6.2 2 Ulna VII, Ulna XII NEAND 26.6 ± 1.1 169.6 ± 5.3 7 Keb-2, Frr-l (r,l) , Sha-l , 4,5, Sidr6n EMH 29.4 ± 0.1 182.1 ± 0.3 2 Skhul4 (r,l)
Females SH 24.4 159.3 Ulna VIII NEAND 23.6 ± 1.2 155.8 ± 5.3 3 La Ferrassie 2,Tabun 1, La Quina V EMH 26.2 ± 2.0 167.5 ± 9.6 3 Qafzeh 9, Skhul 7(1), Qafzeh 7
Femur Males SH 45.3 ± 0.5 168.5 ± 1.3 3 Femora X, XII, XIII NEAND 45.6 ± 2.4 169.5 ± 6.4 6 N-l (r,l), Sha-1, Amud 1 (r,l) , Spy-2 EMH 49.3 ± 0.2 179.3 ± 0.6 2 Skhul4 (r,l)
Females SH NONE NFAND 41.4±0.4 157.9 ± 1.0 2 La Ferrassie 2,Tabun 1 EMH 47.6 174.7 Qafzeh 9
Tibia Males SH 36.6 ± 1.1 167.8 ± 4.1 5 Tibiae Ill , VI, XI, XII, AT -848 NFAND 33.4 ± 1.1 157.2 ± 3.6 3 Shanidar2, Kiik-Koba, Spy 2 EMH 43.2 ± 0.3 189.5 ± 0.9 2 Skhul4 (r,l)
Females SH 33.1 ± 0.8 156.1 ± 2.6 2 Tibia IV, Tibia I NFAND 30.8 ± 1.0 148.7 ± 3.3 2 La Ferrassie 2,Tabun 1 EMH NONE
a Abbreviations when necessary: SH = Sima de los Huesos; NFAND = Neandertals; EMH = Early modern humans from Skhul and Qafzeh; Keb = Kebara; LCh = La Chapelleaux-Saints; N = Neandertall; Lzt = Lezetxiki; Reg = Regourdou 1; Frr = La Ferrassie; Sha = Shanidar.
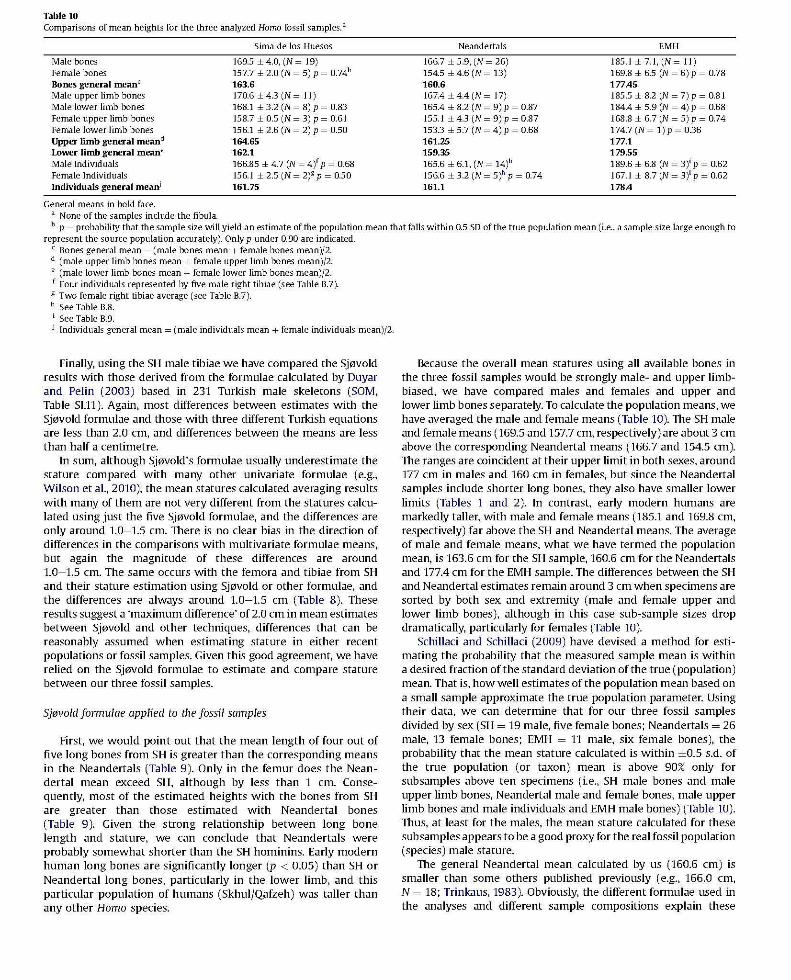
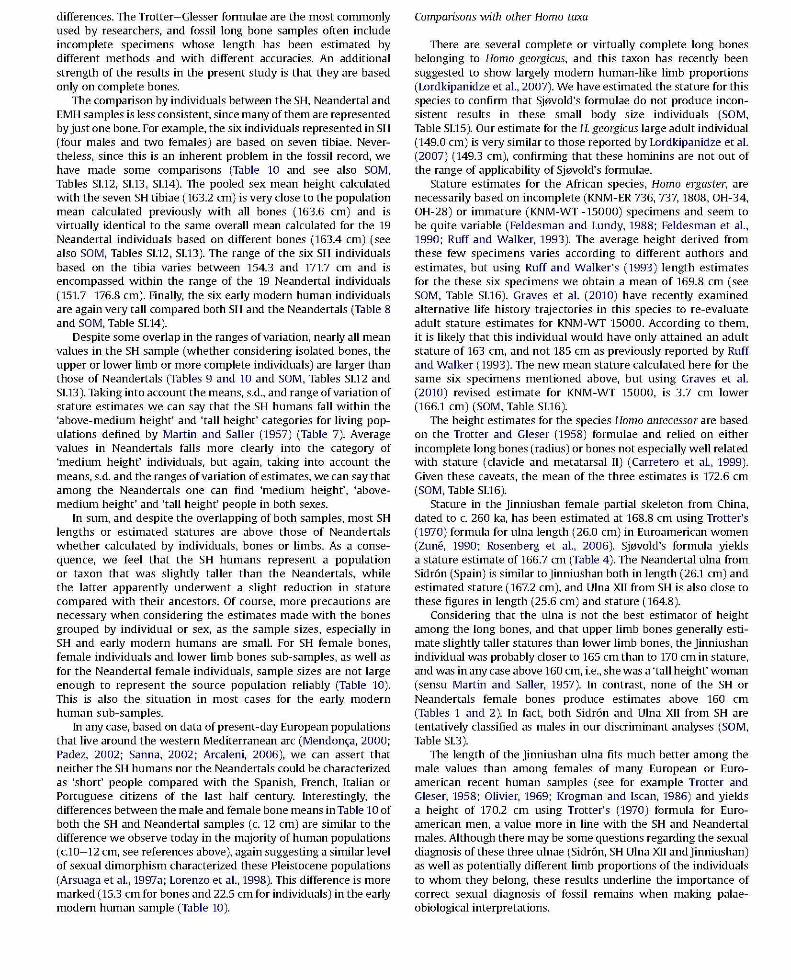
Table 10 Comparisons of mean heights for the three analyzed Homo fossil samples. a
Male bones Female bones Bones general meanc
Male upper limb bones Male lower limb bones Female upper limb bones Female lower limb bones Upper limb general meand
Lower limb general meane
Male Individuals Female Individuals Individuals general meanl
General means in bold face. a None of the samples include the fibula.
Sima de los Huesos
169.5 ± 4.0, (N _ 19) 157.7 ± 2.0 (N = 5) P = 0.74b
163.6 170.6 ± 4.3 (N = 11) 168.1 ± 3.2 (N = 8) P = 0.83 158.7 ± 0.5 (N = 3) P = 0.61 156.1 ± 2.6 (N = 2) P = 0.50 164.65 162.1 166.85 ± 4.7 (N = 4l p = 0.68 156.1 ± 2.5 (N = 2)& P = 0.50 161.75
Neandertals
166.7 ± 5.9, (N _ 26) 154.5 ± 4.6 (N = 13) 160.6 167.4 ± 4.4 (N = 17) 165.4 ± 8.2 (N = 9) P = 0.87 155.1 ± 4.3 (N = 9)p = 0.87 153.3 ± 5.7 (N = 4) P = 0.68 161.25 159.35 165.6 ± 6.1 , (N = 14)h 156.6 ± 3.2 (N = 5)h P = 0.74 161.1
EMH
185.1 ± 7.1, (N _ 11) 169.8 ± 6.5 (N = 6)p = 0.78 In.45 185.5 ± 8.2 (N = 7)p = 0.81 184.4 ± 5.9 (N = 4)p = 0.68 168.8 ± 6.7 (N = 5)p = 0.74 174.7 (N= 1)p = 0.36 In.l 179.55 189.6 ± 6.8 (N = 3)i P = 0.62 167.1 ± 8.7 (N = 3)i P = 0.62 178.4
b p = probability that the sample size will yield an estimate of the population mean that falls within 0.5 SD of the true population mean (i.e. , a sample size large enough to represent the source population accurately). Only p under 0.90 are indicated.
C Bones general mean = (male bones mean + female bones mean)f2. d (male upper limb bones mean + female upper limb bones mean)/2. e (male lower limb bones mean + female lower limb bones mean)/2. f Four individuals represented by five male right tibiae (see Table B.7). & Two female right tibiae average (see Table B.7). h See Table B.8. i See Table B.9. J Individuals general mean = (male individuals mean + female individuals mean)/2.
Finally, using the SH male tibiae we have compared the Sj0vold results with those derived from the formulae calculated by Duyar and Pelin (2003) based in 231 Turkish male skeletons (SOM, Table 51.11). Again, most differences between estimates with the Sj0vold formulae and those with three different Turkish equations are less than 2.0 cm, and differences between the means are less than half a centimetre.
In sum, although Sj0vold's formulae usually underestimate the stature compared with many other univariate formulae (e.g., Wilson et al., 2010), the mean statures calculated averaging results with many of them are not very different from the statures calculated using just the five Sj0vold formulae, and the differences are only around 1.0-1.5 cm. There is no clear bias in the direction of differences in the comparisons with multivariate formulae means, but again the magnitude of these differences are around 1.0-1.5 cm. The same occurs with the femora and tibiae from SH and their stature estimation using Sj0vold or other formulae, and the differences are always around 1.0-1.5 cm (Table 8 ). These results suggest a 'maximum difference' of 2.0 cm in mean estimates between Sj0vold and other techniques, differences that can be reasonably assumed when estimating stature in either recent populations or fossil samples. Given this good agreement, we have relied on the Sj0vold formulae to estimate and compare stature between our three fossil samples.
Sj0vold formulae applied to the fossil samples
First, we would point out that the mean length of four out of five long bones from SH is greater than the corresponding means in the Neandertals (Table 9 ). Only in the femur does the Neandertal mean exceed SH, although by less than 1 cm. Consequently, most of the estimated heights with the bones from SH are greater than those estimated with Neandertal bones (Table 9 ). Given the strong relationship between long bone length and stature, we can conclude that Neandertals were probably somewhat shorter than the SH hominins. Early modern human long bones are significantly longer (p < 0.05) than SH or Neandertal long bones, particularly in the lower limb, and this particular population of humans (Skhul/Qafzeh) was taller than any other Homo species.
Because the overall mean statures using all available bones in the three fossil samples would be strongly male- and upper limbbiased, we have compared males and females and upper and lower limb bones separately. To calculate the population means, we have averaged the male and female means (Table 10). The SH male and female means (169.5 and 157.7 cm, respectively) are about 3 cm above the corresponding Neandertal means (166.7 and 154.5 cm). The ranges are coincident at their upper limit in both sexes, around 177 cm in males and 160 cm in females, but since the Neandertal samples include shorter long bones, they also have smaller lower limits (Tables 1 and 2). In contrast, early modern humans are markedly taller, with male and female means (185.1 and 169.8 cm, respectively) far above the SH and Neandertal means. The average of male and female means, what we have termed the population mean, is 163.6 cm for the SH sample, 160.6 cm for the Neandertals and 177.4 cm for the EMH sample. The differences between the SH and Neandertal estimates remain around 3 cm when specimens are sorted by both sex and extremity (male and female upper and lower limb bones), although in this case sub-sample sizes drop dramatically, particularly for females (Table 10).
Schillaci and Schillaci (2009) have devised a method for estimating the probability that the measured sample mean is within a desired fraction of the standard deviation of the true (population) mean. That is, how well estimates of the population mean based on a small sample approximate the true population parameter. Using their data, we can determine that for our three fossil samples divided by sex (SH = 19 male, five female bones; Neandertals = 26 male, 13 female bones; EMH = 11 male, six female bones), the probability that the mean stature calculated is within ±0.5 s.d. of the true population (or taxon) mean is above 90% only for subsamples above ten specimens (i.e., SH male bones and male upper limb bones, Neandertal male and female bones, male upper limb bones and male individuals and EMH male bones) (Table 10). Thus, at least for the males, the mean stature calculated for these subsamples appears to be a good proxy for the real fossil population (species) male stature.
The general Neandertal mean calculated by us (160.6 cm) is smaller than some others published previously (e.g., 166.0 cm, N = 18; Trinkaus, 1983 ). Obviously, the different formulae used in the analyses and different sample compositions explain these
differences. The Trotter-Glesser formulae are the most commonly used by researchers, and fossil long bone samples often include incomplete specimens whose length has been estimated by different methods and with different accuracies. An additional strength of the results in the present study is that they are based only on complete bones.
The comparison by individuals between the SH, Neandertal and EMH samples is less consistent, since many of them are represented by just one bone. For example, the six individuals represented in SH (four males and two females) are based on seven tibiae. Nevertheless, since this is an inherent problem in the fossil record, we have made some comparisons (Table 10 and see also SOM, Tables S1.12, S1.13, SI.14). The pooled sex mean height calculated with the seven SH tibiae (163.2 cm) is very close to the population mean calculated previously with all bones (163.6 cm) and is virtually identical to the same overall mean calculated for the 19 Neandertal individuals based on different bones (163.4 cm) (see also SO M, Tables S1.12, SI.13). The range of the six SH individuals based on the tibia varies between 154.3 and 171.7 cm and is encompassed within the range of the 19 Neandertal individuals (151.7-176.8 cm). Finally, the six early modern human individuals are again very tall compared both SH and the Neandertals (Table 8 and SO M, Table 51.14).
Despite some overlap in the ranges of variation, nearly all mean values in the SH sample (whether considering isolated bones, the upper or lower limb or more complete individuals) are larger than those of Neandertals (Tables 9 and 10 and SOM, Tables SI.12 and SI.13). Taking into account the means, s.d., and range of variation of stature estimates we can say that the SH humans fall within the 'above-medium height' and 'tall height' categories for living populations defined by Martin and Sailer (1957) (Table 7). Average values in Neandertals falls more clearly into the category of 'medium height' individuals, but again, taking into account the means, s.d. and the ranges of variation of estimates, we can say that among the Neandertals one can find 'medium height', 'abovemedium height' and 'tall height' people in both sexes.
In sum, and despite the overlapping of both samples, most SH lengths or estimated statures are above those of Neandertals whether calculated by individuals, bones or limbs. As a consequence, we feel that the SH humans represent a population or taxon that was slightly taller than the Neandertals, while the latter apparently underwent a slight reduction in stature compared with their ancestors. Of course, more precautions are necessary when considering the estimates made with the bones grouped by individual or sex, as the sample sizes, especially in SH and early modern humans are small. For SH female bones, female individuals and lower limb bones sub-samples, as well as for the Neandertal female individuals, sample sizes are not large enough to represent the source population reliably (Table 10). This is also the situation in most cases for the early modern human sub-samples.
In any case, based on data of present-day European populations that live around the western Mediterranean arc (Mendon<;:a, 2000; Padez, 2002; Sanna, 2002; Arcaleni, 2006 ), we can assert that neither the SH humans nor the Neandertals could be characterized as 'short' people compared with the Spanish, French, Italian or Portuguese citizens of the last half century. Interestingly, the differences between the male and female bone means in Table 10 of both the SH and Neandertal samples (c. 12 cm) are similar to the difference we observe today in the majority of human populations (c.1O-12 cm, see references above), again suggesting a similar level of sexual dimorphism characterized these Pleistocene populations (Arsuaga et al., 1997a; Lorenzo et al., 1998). This difference is more marked (15.3 cm for bones and 22.5 cm for individuals) in the early modern human sample (Table 10 ).
Comparisons with other Homo taxa
There are several complete or virtually complete long bones belonging to Homo georgicus, and this taxon has recently been suggested to show largely modern human-like limb proportions (Lordkipanidze et al., 2007). We have estimated the stature for this species to confirm that Sj0vold's formulae do not produce inconsistent results in these small body size individuals (SOM, Table SI.15). Our estimate for the H. georgicus large adult individual (149.0 cm) is very similar to those reported by Lordkipanidze et al. (2007) (149.3 cm), confirming that these hominins are not out of the range of applicability of Sj0vold's formulae.
Stature estimates for the African species, Homo ergaster, are necessarily based on incomplete (KNM-ER 736, 737, 1808, OH-34, OH-28) or immature (KNM-WT -15000) specimens and seem to be quite variable (Feldesman and Lundy, 1988; Feldesman et al., 1990; Ruff and Walker, 1993 ). The average height derived from these few specimens varies according to different authors and estimates, but using Ruff and Walker's (1993) length estimates for the these six specimens we obtain a mean of 169.8 cm (see SOM, Table SI.16). Graves et al. (2010) have recently examined alternative life history trajectories in this species to re-evaluate adult stature estimates for KNM-WT 15000. According to them, it is likely that this individual would have only attained an adult stature of 163 cm, and not 185 cm as previously reported by Ruff and Walker (1993). The new mean stature calculated here for the same six specimens mentioned above, but using Graves et al. (2010) revised estimate for KNM-WT 15000, is 3.7 cm lower (166.1 cm) (sOM, Table 51.16).
The height estimates for the species Homo antecessor are based on the Trotter and Gleser (1958) formulae and relied on either incomplete long bones (radius) or bones not especially well related with stature (clavicle and metatarsal 11) (Carretero et al., 1999). Given these caveats, the mean of the three estimates is 172.6 cm (sOM, Table 51.16).
Stature in the jinniushan female partial skeleton from China, dated to c. 260 ka, has been estimated at 168.8 cm using Trotter's (1970) formula for ulna length (26.0 cm) in Euroamerican women (Zune, 1990; Rosenberg et al., 2006). Sj0vold's formula yields a stature estimate of 166.7 cm (Table 4 ). The Neandertal ulna from Sidron (Spain) is similar to jinniushan both in length (26.1 cm) and estimated stature (167.2 cm), and Ulna XII from SH is also close to these figures in length (25.6 cm) and stature (164.8).
Considering that the ulna is not the best estimator of height among the long bones, and that upper limb bones generally estimate slightly taller statures than lower limb bones, the jinniushan individual was probably closer to 165 cm than to 170 cm in stature, and was in any case above 160 cm, i.e., she was a 'tall height' woman (sensu Martin and Sailer, 1957 ). In contrast, none of the SH or Neandertals female bones produce estimates above 160 cm (Tables 1 and 2 ). In fact, both Sidron and Ulna XII from SH are tentatively classified as males in our discriminant analyses (SOM, Table 51.3).
The length of the jinniushan ulna fits much better among the male values than among females of many European or Euroamerican recent human samples (see for example Trotter and Gleser, 1958; Olivier, 1969; Krogman and Iscan, 1986) and yields a height of 170.2 cm using Trotter's (1970) formula for Euroamerican men, a value more in line with the SH and Neandertal males. Although there may be some questions regarding the sexual diagnosis of these three ulnae (Sidron, SH Ulna XII andjinniushan) as well as potentially different limb proportions of the individuals to whom they belong, these results underline the importance of correct sexual diagnosis of fossil remains when making palaeobiological interpretations.
Continuing in Asia, only the left Femur I from Trinil is a complete bone. The height estimated with Feldesman et al. (1990) formulae for this femur of Homo erectus is 172.8 cm while the Sj0vold formula yields a stature estimate of 171.1 cm (Table 4 ), that it is again close to the average of SH male bones (169.5 cm; Table 10 ). Given the scarcity of postcranial fossils in Asia, we have included Tibia B from Ngandong in our comparative analysis (Santa-Luca, 1980; Anton, 2003 ). Although the specimen lacks most of the proximal epiphysis, the maximum preserved length (370 mm) is nearly equivalent, albeit a little bit shorter, to the total length (Ml) used in Sjovold's formula (Table 4 ). With this tibial length a stature of 169.1 cm is estimated with the Sjovold formula (Table 4 ). Applying the general formula and the formula for medium size tibiae of Duyar and Pelin (2003) reported in SO M, Table 51.11, we obtain heights of 169.2 and 171.6 cm, respectively.
Another important complete fossil long bone, in this case from the Middle Pleistocene of Africa, is the tibia from Kabwe, Zambia (Pycraft et al., 1928), which seems to be the only postcranial bone from the site that can be clearly associated with the skull (Pearson, 2001 ; Trinkaus, 2009 ). Based on a length of 40.8 cm (Ml in Trinkaus, 2009), we obtain a stature estimate of 181.2 cm with Sj0vold's formula, much more in line with the values found among early modern humans than with the Middle Pleistocene SH hominins or the Neandertals. Trinkaus (2009) also reported a tall stature for the Kabwe tibia relying on the formulae of Trotter and Gleser (1958) for AfroAmerican and EuroAmerican male individuals (178.9 cm and 184.4 cm, respectively), a height that is comparable only with Amud 1 among the Neandertals (SOM, Table 51.13).
It should be noted that Kabwe is among the longest human tibiae in the fossil record, even when compared with many recent human sample means (Pycraft et al., 1928; Trinkaus, 2009). Although tentative, this great length might be taken to suggest a high crural index. If so, the stature may be overestimated regardless of the formula used, since high brachial and crural indices can lead to overestimation of the stature when based on distallimb segments (Formicola, 2003 ). In any case, as noted also by others (Kennedy, 1984; Stringer et al., 1998; Trinkaus, 2009), the Kabwe tibia derives from a single Middle Pleistocene individual that is probably among the tallest of the known specimens of archaic Homo from the Pleistocene. As with any other biological and metric parameter, some degree of normal variation in stature must be expected, i.e., short and tall individuals certainly exist in all populations; Kabwe,jinniushan and Amud 1 may have been tall for their respective populations (or species). Thus, presently we know very little about body size and shape in African Middle Pleistocene humans.
Finally, as has been already shown by many authors, the stature estimates of early modern humans from the Middle East are clearly tall (general mean for the 17 available complete long bones is 177.4 cm, and for the six represented individuals is 178.4 cm; Table 10). Although variation is large (and striking), all these early H. sapiens were 'very tall height' people by recent human standards (Martin and Sailer, 1957 ), and much more compared with other fossil Homo species (SOM, Table 51.14).
Discussion
Some of the most widely discussed aspects of hominin postcranial morphology are related to differences in body size, shape and proportions between the different species which comprise our genus. The African species, H. ergaster, appears to have undergone a 'body revolution' consisting of, among other things, a significant increase in stature and the acquisition of human-like limb proportions around 1.8 Ma (millions of years ago). Recently, Graves et al. (2010) have suggested a more gradual increase in stature from
early hominins to modern humans, and argue that H. ergaster may not be the 'great leap forward' previously envisioned.
Although the African and Asian Middle Pleistocene fossil record of complete long bones (and postcranial remains in general) is extremely scarce, the results from the present study suggest that individuals that can be classified as above-medium and tall people (sensu Martin and Sailer, 1957; see Tables 7 and 9) were common in Africa, Asia and Europe during this period.
Our results also show that the SH humans were a slightly taller population (or species) than the Neandertals, who probably reduced their stature slightly compared with their ancestors. Nevertheless, even more relevant is the suggestion that since the emergence of H. ergaster the stature of different Homo species seems to have changed little over the course of nearly two million years, until the appearance of H. sapiens (Tables 9 and 10).
We have proposed elsewhere, based on the pelvic remains from SH (Arsuaga et al. , 1999; Carretero et al., 2004), a model of human body evolution in which during the Pleistocene all archaic Homo taxa shared a large, absolutely wide and robust body. This primitive biotype was present not only in colder climates, as predicted by the cylindrical thermoregulatory model proposed by Ruff (1991, 1994), but also in temperate and/or tropical Asia and Africa. Subsequent discoveries in Asia (Rosenberg et al., 2006) and Africa (Grine et al., 1995; Simpson et al., 2008; and see; Trinkaus, 2009 ) support this view. Apparently, this primitive biotype only changed around 200 ka with the emergence of H. sapiens and its slender, narrower, and lighter body (=derived biotype).
As we have shown here, 'medium height' and 'above-medium height' people seem to characterize the primitive Homo biotype, while a 'very tall' body characterizes the derived biotype. The heights proposed for all fossil human species, except early H. sapiens, seem to average around 165-170 cm, although tall individuals exist within all samples (e.g., Amud 1, Kabwe and jinniushan). It is only the first H. sapiens that are consistently and dramatically taller. Therefore, the evolution of stature (and perhaps also body size and shape) in humans seems to have been characterized by a long period of stasis during which the primitive body plan shared by the different Homo species varied rather little in stature throughout the Pleistocene, until the rapid appearance 200 ka of a new species with a new biotype, the 'light' H. sapiens.
On the other hand, some limb proportions (i.e., brachial and/or crural indices) might have followed a pattern more consistent with Alien's rule and ecogeographical variation in humans (Holliday, 1997a, 1999, 2006; Holliday and Ruff, 1997; but see; Walker et al., 2011 ), as suggested by the long absolute length of the Kabwe tibia or the limb proportions of the H. ergaster KNM-WT 15000 individual (Ruff and Walker, 1993 ). This underlines the mosaic nature of the evolutionary process. The SH evidence suggests limb proportions in these European Middle Pleistocene humans that were very similar to temperate European recent populations (Carretero et al., 2005 ). However, there are currently no definitive associations between limb elements within the SH collection, and very little postcranial evidence is known in Africa and Asia during this period to demonstrate a latitudinal gradient pattern.
In any case, the height gain and increased limb lengths in H. sapiens are real and require a convincing palaeobiological and evolutionary explanation. We must consider the tall stature of early H. sapiens within the more general framework of evolution of body size and shape, and as part of the derived full body bauplan of our species that involves not only increasing height and limb lengths, but decreasing absolute body breadth, body weight and skeletal (bone) robusticity.
We have described the wide pelvis of archaic Homo as 'obstetrica�ly wasteful' (Arsuaga et al., 1999) and have suggested that the size of the pelvis is influenced primarily by biomechanical rather
than obstetric factors (but see Berge, 1998 ). The biomechanical restrictions associated with such a wide pelvis would have been compensated for with a long femoral neck (Arsuaga et al. , 1995), iliac flaring (Arsuaga et al. , 1999; 2006; Bonmati et al., 2010), thick cortical bone and different cross sectional properties of long bones (Rodriguez et al., 2007) and heavy musculature. Increases in body mass generate greater stresses in the pelvic region and more power is required to move the body, i.e., more muscles and therefore more energy. Total energy requirements of these archaic humans were very high (Holliday and Falsetti, 1995; Leonard and Robertson, 1997; Trinkaus and Rhoads, 1999; Sorensen and Leonard, 2001 ; Aiello and Key, 2002 ; Aiello and Wells, 2002; Franciscus and Churchill, 2002; Leonard and Ulijaszek, 2002 ; Steegmann et al., 2002 ; Churchill, 2006; Steudel-Numbers, 2006; Weinstein, 2008; Gamez-Olivencia et al., 2009), and were a crucial factor for their survival, making them subject to the forces of natural selection.
The increased height and lower limb length, and the narrow pelvis characteristic of early H. sapiens, may have been favoured by natural selection for thermal, obstetrical, nutritional or mechanical reasons (Ruff, 1995; Holliday, 1997b; Berge, 1998; Tague, 2000 ; Porter, 2002; Churchill, 2006; Weaver, 2009; Weaver and Hublin, 2009 ). However, in our opinion, the most important selective factor is an increase in energetic efficiency. Longer lower limbs result in substantial savings in locomotor costs (Kramer and Eck, 2000; Steudel-Numbers and Tilkens, 2004; Steudel-Numbers et al., 2007) and increased speed, and were very likely to be favoured by natural selection. The taller stature and decrease in general robusticity compared with that of other archaic humans, such as the Neanderthals, would have reduced both the power necessary to move the body and the total energy cost for H. sapiens. The cost to travel a given distance has been estimated to have been around 30% greater for Neanderthals than for anatomically modern humans (Holliday and Falsetti, 1995), and the Neandertals share with the rest of archaic humans the primitive biotype. We are 'lighter' and energetically 'cheaper' than other human species, which was an important advantage in the ecological competition produced in Europe during the late Upper Pleistocene with other intelligent, albeit more expensive, human species such as the Neandertals. The tall stature of these early H. sapiens seems to have remained constant for much of the Upper Pleistocene since it also characterized European Upper Pal eo lithic populations prior to the Last Glacial Maximum (Holliday, 1997a; Formicola and Giannecchini, 1999). The decrease in absolute brain size of H. sapiens observed over the last 35,000 years has been parallelled by a general decrease in body size (Ruff et al., 1993 ; 1997).
Conclusions
Due to the methodological difficulties involved in the estimation of stature in fossil humans (bone type, body proportions, sex, statistical technique, etc.) and the lack of consensus on a valid method broadly applicable in all cases, the formulae proposed by Sj0vold (1990) meet some requirements that in our opinion make them most appropriate: i) there is an equation for each long bone of the body, ii) they apply to any bone regardless of the body proportions of the population from which they came, and iii) they apply to any bone independently of the sex determination of the specimen.
The general stature (male mean + female meanj2) with the 24 (fibulae not included) complete long bones from SH (163.6 cm) is only about 3 cm higher that the general mean of 39 complete Neanderthal bones (160.6 cm), and these differences are nearly constant in all comparisons, whether by long bone, upper or lower limb or individuals (Tables 8 and 9). Although the differences between the two samples are not significant, it is likely that the SH
hominins were somewhat taller on average than the Neandertals since the SH humans had, on average, longer limb bones than the Neandertals.
The SH male and female means fall under the category of ' abovemedium height' and 'tall height' individuals defined by Martin and Sailer (1957) for recent H. sapiens. The same average in Neanderthals falls more clearly into the category of 'medium height' individuals. However, in both samples 'tall' individuals, (i.e., above 170 cm for men and 160 cm for women) can be found.
In light of our results, it seems that Lower and Middle Pleistocene humans from Africa, Asia, and Europe were characterized by heights in the range of Medium and Above-Medium individuals, although tall individuals are found in all three geographical areas. During the Upper Pleistocene, Neanderthals reduced only slightly their height in relation to their ancestors such as the people from Sima de los Huesos.
As noted previously by others, it was the first H. sapiens individuals who had a radically different stature from earlier humans (177.4 cm average of both sexes). In our view, this tall stature is part of a derived 'light' and less expensive biotype in this species. During contact in Europe in the Late Pleistocene between two very intelligent human species, the less expensive biotype of H. sapiens, was a crucial advantage in its ecological competition with H. neanderthalensis.
Acknowledgements
We thank the Atapuerca Research and Excavation Team for their work in the field. We have benefitted from the discussions with our colleagues from the Centro Mixto UCM-ISCIII of Madrid and from the Laboratorio de Evolucian Humana (LE.H.) at the University of Burgos. We thank Osbjorn Pearson, John Kappelman and anonymous reviewers for their valuable comments and suggestions. Elena Santos helped with CT scanning of some specimens. Thanks to Maria Cruz Ortega for the restoration of some of the original fossils. We are grateful to the following persons and institutions for providing access to the skeletal collections in their care: Eugenia Cunha and Ana Luisa Santos (Instituto de Antropologia of the Coimbra University), Alexandra Maf(;:al (Museu Bocage, Museu Nacional de Histaria Natural, Lisboa), Jakov Radovtic (Croatian Natural History Museum), Bruce Latimer, Yohannes Haile-Selassie and Lyman Jellema (Cleveland Natural History Museum), Alain Froment, Philippe Mennecier, and Aurelie Fort (Musee de L'Homme de Paris), Chris Stringer and Rob Kruszynski (Natural History Museum, London), Dominique Grimaud-Herve (Departement de Prehistoire, Museum National d'Histoire Naturelle) and Marta Negro and Belen Castillo (Museo de Burgos). We thank Luis Cabo, Maria Jose Sierra and Jose E. Egocheaga for providing us the length of the original specimens from Sidran. Our colleagues from the Mercyhurst Archaeological Institute Dennis Dirkmaart and Luis Cabo (Department of Applied Forensic Sciences) helped with access to the Database for Forensic Anthropology in United States. This research was supported by the Ministerio de Educacian y Ciencia Project No. CG12009 12703-C03-03, and by the Junta de Castilla y Lean Project No. BU005A09. Funds for the fieldwork are also provided by the Junta de Castilla y Lean and the Fundacian Atapuerca. Laura Rodriguez has a predoctoral grant from the Fundacion Atapuerca. Asier Gamez-Olivecia has a post doctoral fellowship of the Ministerio of Educacian (Programa Nacional de Movilidad de Recursos Humanos del Plan Nacional de I+D+I, 2008-2011).
Appendix. Supplementary material
Supplementary data related to this article can be found online at doi : 1 O.l 016/j .jhevoI.2011.11.004.
References
Aiello, Le, 1992. Allometly and the analysis of the size and shape in human evolution. J. Hum. Evol. 22, ]27-]47.
Aiello, Le, Dean, e, 1990. An Introduction to Human Evolutionary Anatomy. Academic Press, San Diego.
Aiello, Le, Key, e, 2002. Energetic conseq uences of being a Homo erecrus female. Am J Hum. BioI. 14, 55 ] - 565.
Aiello, Le, Wells, J eK., 2002. Energetics and the evolution of the genus Homo. Annu. Rev. Anthropol. 31, 323-338.
Ant6n, s.e, 2003. Natural history of Homo ereaus. Vearbk. Phys. Anthropol. 46, ]26- 170.
Arcaleni, E. , 2006. Sec ula r trend and regional difference in the s tature of Italians, 1854- 1980. Eco n. Hum. Bioi. 4, 24-38.
Arsuaga, J.L. Bonmati, A, Carre tero, j.M., 2006. A new reconstr uction of pe lvis I (Homo /! eide/bergensis) from the Sima de los Huesos (Atapuerca). Am. J. Phys. Anthropol., 59. Su ppl. 42.
Arsuaga, ~.L, Carr~tero, J.M., 1994. Multivariate analysis of the sexual dimorphism of the hIp bone Ifl a modern human population and in early hominids. Am. J. Phys. Anthropol. 93, 241 - 257.
Arsuaga, j.L, Carretero, J.M., Martinez, I., Gracia, A, ]991 Cranial remains and long bones from Atapuerca!lbeas (Spain). j. Hum. Evol. 20, ]9] - 230.
Arsuaga, j.L, Martinez, I., Gracia, A, (arretero, j.M., ]995. Cranial and postcranial remains at the Sima de los Huesos (Sierra de Atapuerca) and human evolution during the Middle Pleistocene. In: Bermlidez de Castro, j.M., Arsuaga, J,L, Carbonell, E (Eds.), Human Evolution in Europe and the Atapuerca Evidence. Junta de Castilla y Leon, Medina del campo, pp. 283-304.
Arsuaga, j.L, Martinez, I., Gracia, A., carretero, j.M., carbonell, E., 1993. Three new human skulls from the Sima de los Huesos Middle Pleistocene site in Sierra de Atapuerca, Spain. Nature 362. 534- 537.
Arsuaga, j.L, Martinez, I., Gracia , A., carretero, j.M., Lorenzo, e, Garcia, N., Ortega, A.l., 1997a. Sima de los Huesos (Sierra de Atapuerca, Spain). The site. j. Hum. Evol. 33, 109- 127.
Arsuaga, JL, Marti nez, I., Gracia,A., Lorenzo, C, 1997b. The Sima de los Huesosc rania (Sie rra de Atapuerca, Spain). A comparative study. j. Hum. Evol. 33, 219- 281.
Arsuaga,JL, lorenzo, e, Ca rrete ro,j.M., Gracia, A , Martinez, L, Garda, N., Bermtidez de (astro, J,M., Carbo nell, E, 1999. A complete human pelvis fr om the Midd le Ple istocene of Spa in. Nature 399, 255-258.
Berge, e, 1998. Heterochronic processes in human evolution: an ontogenetic analysis of the homi nid pelvis. Am. J. Phys. Anthropol. 105,441-459.
Bermlidez de Castro, A., Martinon-Torres, M., Lozano, M., Sarmiento, S., Muela, A., 2004. Paleodemography of the Atapuerca-Sima de los Huesos hominin sample: a revision and new approaches to the paleodemography of the European Middle Pleistocene population. j. Anthropo!. Res. 60, 5- 26.
BischotT. J,L, Williams, R.8., Rosenbauer, Rj., Aramburu, A, Arsuaga, J.L, Garcia, N., Cuenca-Besc6s, G., 2007. High-resolution U-series dates from the Sima de los Huesos hominids yields 600+- 66 kyrs: implications for the evolution of the early Neanderthal lineage. j. Archaeo!. Sel. 34, 763-770.
Bonmati, A, G6mez-Olivencia, A, Arsuaga, j.L, Carretero, J.M., Gracia, A, Martinez, 1. , Lorenzo, e, Bermtidez de castro, j.M., Carbonell, E., 2010. Lower back and pelvis from anaged human individual from the Sima de los Huesos site (Spain ). Proc. Nul. Acad. Sei. 107, ]8386-18391
carretero, J.M., Arsuaga, J,L , Ma rtinez, L, Quam. R, Lorenzo, e, Gracia, A, Ortega Martinez, A.l ., 2004. Los humanos de la Sima de los Huesos (Sie rra de Atap~erca) y la evoluci6n del cuerpo en e l genero Homo. In: Baquedano, E. ( Ed.~ Mlscelanea en Homenaje a Emi liano Aguirre. Museo Arqueol6gico Regional. Aleol l,) de Henares, Madrid, pp. 120- 135.
Colrretero, JM., lorenzo, e, Arsuolgol , j.L, 1997. aolvicles, sColpulole and humeri from the Sima de los Huesos site (Sierrol de Atolpuercol, Spolin ). j. Hum. Evol. 33, 357-408.
Carretero. J M., lorenzo, e, Arsuaga, j.L, 1999. Axial and appendicu lar ske leton of Homo antecessor. J. Hum. Evo!. 37, 459-499.
Carretero, j.M., Rodriguez, L, Garcia, R, Gomez, A, Arsuaga, j.L, 2005. Upper limb long bones from Sima de los Huesos site (Sierra de Atapuerca, Burgos, Spain) (Abstracn Am. J. Phys. Anthropol. 126, 84.
Chiarelli, 8., 1977. On the secular trend of stature: a body-constitution interpretation. Cun. Anthropol. 18, 524- 526.
Churchill, S.E .. 2006. Bioenergetic perspectives on Neanderthal thermoregulatory and activity budgets. In : Hublin, H , Harvati, K., Harrison, T. (Eds.), Neanderthals Revisited: New Approaches and Perspectives. Springer, Dordrecht (Netherlands), pp. 113- 134.
Damuth, j., MacFadden, BJ, 1990. Body Size in Mammalian Paleobiology. Estimation and ~iologicallmplications. umbridge University Press, cambridge.
DupertUlS, ew., Hadden, lA ., ]951 On the reconstruction of stature from long bones. Am. J. Phys. Anthropol 9, 15- 54.
Duyar, I., Pelin, e, 2003. Body he ight estimoltion based on tibiol length in diffe rent stolture groups. Am. j. Phys. Anth ropol. 122, 23- 27.
Feldesman, M.R, Fountain, R.L, 1996. Rolce specific olnd the femur/stature ratio. Am. j. Phys. Anthropol. 100, 207 - 224.
Feldesman, M.R., Klec kner, j.G., Lundy, j.K., 1990. Femur/stolture roltio olnd estimates of stature in Mid- and Late-Ple istocene fossil hominids. Am. j. Phys. Anthropol. 83,359- 372.
Feldesman, M.R, Lundy, J,K, 1988. Stature estimates for some African PlioPleistocene fossi ls hominids. J. Hum. Evo!. 17, 583-596.
Formicola, V" 2003. More is not always better: Trotter and Gleser's equations and stature estimates of Upper Paleolithic European samples. J. Hum Evol. 45, 239-244.
Formicola, V., Giannecchini, M., 1999. Evolutionary trends of stature in Upper Palaeolithic and Mesolithic Europe. j. Hum. Evo!. 36, 319- 333.
Franciscus, R.G., Churchill, S.£., 2002. The costal skeleton of Shanidar 3 and a re.lppraisal of Neandertal thoracic morphology. J. Hum. Evo!. 42, 303-356.
Garciol, N., Arsu<Iga, j.L, Torres, T., 1997. The carnivore remai ns from the Simol de los Huesos Middle Pleistocene site (Sierra de Atapuerca, Spain). j. Hum. Evol33, 155- 174.
Geissmann, T., 1986. Estimoltion of Austra lopithecine stolture from long bones:A.L288-1 olS ol test Colse. Foliol Prima tol. 47, 119- 127.
G6mez-Olivenciol, A., carretero, j.M., Arsuaga, J,L, Rodriguez, L, Golrdol-Gonz.i lez, R, Molrtinez, 1.,2007. Metric .lOO morphological study ofu pper cervicol l spine from the Si ma de los Huesossite (Sierrol deAtolpuerca, Burgos, Spain).J. Hum. Evol. 53, 6--25.
G6mez-Olivencia, A, Eaves-johnson, KL, Franciscus, R.c. , (arretero, j. M., Arsuaga, j.L, 2009. Kebara 2: new insights regarding the most complete Neandertal thorax. J. Hum. Evol. 57, 75- 90.
Gracia, A, Arsuaga, j.L, Martinez, I., Lorenzo, C, Carretero, j.M., Bermtidez de Castro, j.M., Carbonell, E., 2009. Craniosynostosis in the Middle Pleistocene human Cranium 14 from the Sima de los Huesos, Atapuerca, Spain. Proc. Natl. Acad. Sci. 106, 6573-6578.
Graves, KR, Lupo, AC, McCarthy, RC, Wescott D.j., Cunningam, D.L, 2010. Just how strapping was KNM-WT 150007 j. Hum. Evo!. 59, 542- 554.
Grine, EE., Jungers, W.L, Tobias, P.V., Pearson, O.M., 1995. Fossil Homo femur from Berg Aukas, northern Namibia. Am. j. Phys. Anthropol. 97, 151 - 185.
Gustafson, A, Undenfors, P., 2004. Human size evolution: no evolutionary allometric relationship between male and female stature. J, Hum. Evo!. 47, 253-266.
Hens, S.M., Konigsberg, LW., jungers, WL, 2000. Estimating stature in fossil hominids: which regression model and reference sample to use. j. Hum. Evol 38,767-784.
HollidolY, T.W., 1997.1. Body proportions in late Ple isLOcene Europe olnd modern humoln origins. j. Hum. Evol 32,423-447.
HollidolY, T.W, 1997b. Posterolnioll evidence of cold adaptation in Europeoln Neandertals. Am. j. Phys. Anthropol. 104, 245 - 258.
HollidolY, T.W, 1999. Brolchiollolnd cruroll indices of European lol te Upper Polleolithic olnd Mesolithic humolns. j. Hum. Evol. 36, 549-566.
HollidolY, TW., 2006. Body proportions. In: Trinkaus, E, SVObodol, j. (Eds.), Early Modern Human Evolution in Centrol l Europe: The People of Dolni Vestonice and Pavlov. Oxford University Press, Oxford.
Holliday, T.W., Falsetti, A, 1995. Lower limb length of European early modern humans in relation to mobility and climate. j. Hum. Evol. 29, 141- 153.
Holliday, T.W, Ruff, CB., 1997. Ecogeographica l patterning and stature prediction in fossil hominids. Am. J. Phys. Anthropo1. 103, 137- 140. Comment on M.R Feldesman and RL Fountain, Am. j. Phys. Anthropo1. (1996) 100:207- 224.
Janrz, Rj., Moore-Jansen, P.H., 1998. Database for Forensic Anthropology in the United States, 1962-1991 [Computer File]. ICPSR Version. University of Tennessee, Dept of Anthropology [producer]. Knoxville, TN. Ann Arbor, MI: Interuniversity Consortium for Political and Social Research [distributor].
Janrz, LM., Jantz, KL, 1999. Secular trend in long bone length and proportion in United States, 1800-1970. Am. J. Phys. Anthropol. 110, 57-67.
jungers, W.L, 1988. Lucy's length: stature reconstruction in Austra/opithecus afarensis (A.L288-1) with implicoltions for other small-bodied hominids. Am. j. Phys. Anthropol 76, 227-231.
Kendolll, M.G., Stuolr t A, 1967. Advolnced Theory of Statistics. Griffin, London. Kennedy, G.£., 1984. The emergence of Homo sapiens: the post crolnioll evidence.
Moln 19, 94-110. Konigsberg, LW., Hens, 5.M., joln tz, LM., jungers, W L, 1998. Stolture estimoltion olnd
collibroltion: Bolyesioln olnd milXimum likelihood perspectives in physicoll olnthropology. Veolrb. Phys. Anthropol. 41, 65- 92.
Krolmer, P.A , Eck, G.G., 2000. Locomotor energetics and leg length in homi nid bipedollity. j. Hum. Evol. 38, 651-666.
Krogman, W.M .. Iscan, MY. 1986. The Human Skeleto n in Forensic Medicine second ed. Charles CThomas, Springfield. '
Leakey, R., Walker, A, 1985. Further hominids from the Plio-Pleistocene of Koobi Fora, Kenya. Am. j. Phys. Anthropol. 67, 135- 163.
Leonard, W.R, Robertson, M.L, 1997. Comparative primate energetics and hominid evolution. Am. j. Phys. Anthropo!. 102, 265 - 281.
Leonard, W.K, Ulijaszek, S.j., 2002. Energetics and evolution: an emerging research domain. Am. j. Hum. BioI. 14, 547- 550.
Lordkipanidze, D., Jashashvili, T., Vekua, A, Ponce De Le6n, MS, Zollikofer, CP.E., Rightmire, G.P., Pontzer, H , Ferring, R, Oms, 0., Tappen, M., Bukhsianidze, M., Agusti, j., Kahlke, R , Kiladze, G., Martinez-Navarro, 8., Mouskhelishvili, A , Nioradze, M., Rook, L, 2007. Postcranial evidence from early Homo from Dmanisi, Georgia. Nature 449, 305- 310.
Lore~zo, C, carretero, j.M., Arsuaga, J.L, Gracia, A, Martinez, I., 1998. IntrapopulatlOna l body size volriation and cranial capacity variation in Middle Pleistocene humolns: the Simol de los Huesos Solmple (Sie rra de A£olpuerca, Spain). Am. j. Phys. Anthropol. 106, 19-33.
Lovejoy, CO., Heiple, K.G., 1970. A reconstruction of the femur of Auslralopirherus africanus. Am j. Phys. Anthropo l. 32, 33-40.
Molr~n, R, Solller, K., 1957. Lehrbuc h de r Anthropologie. GUStolV Fischer., Stuttgolrt Molrbnez, I., Ars tJ.lgol, j.L, 1997. The temporal bones from Simol de los Huesos Middle
Pleistocene s ite (Sier rol de Atolpuercol, Spain). A phylogene tic olpproolCh. j. Hum. Evo l. 33, 283-318.
Martinez, I., Arsuaga, J.L, Quam, R, Carretero, J.M., Gracia, A., Rodriguez, L, 2008. Human hyoid bones from the middle Pleistocene site of the Sima de los Huesos (Sierra de Atapuerca, Spain). J. Hum. Evol. 54, 118-124.
McCown, T.O., Keith, A, 1939. The Stone Age of Mount Carmel. The Fossil Human Remains from the Levalloiso-Mousterian, Remains from the Levalloiso-Mousterian. Clarendon Press, Oxford.
McHenry, H.M., 1974. How large were the Australopithecines? Am. J. Phys. Anthropol. 40, 329-340.
McHenry, HM., 1991. Femorallenghts and stature in Plio-Pleistocene hominids. Am J. Phys. Anthropol. 85, 149-158.
McHenry, H.M., 1992. Body size and proportions in early hominids. Am J. Phys. Anthropol. 87, 407-431.
Mendon\a, M.Cd., 2000. Estimation of height from length of long bones in a Portuguese adult population. Am. J. Phys. Anthropol. 112, 39-48.
Olivier, G., 1963. L'estimation de la stature par les os longs des membres, vol. 4. Bull. Mem. Soc. Anthropol. Paris 433-449.
Olivier, G., 1969. Practical Anthropology. Charles CThomas, Springfield, Illinois, USA Olivier, G. , 1976. The stature of Australopithecines. J. Hum. Evol. 5, 529-534. Olivier, G., Aaron, C , Fully, G., Tissier, G., 1978. New estimations of stature and
cranial capacity in modern man. J. Hum. Evol. 7, 513-518. Padez, C, 2002. Stature and stature distribution in Portuguese male adults
1904-1998: the role of environmental factors. Am. J. Hum. BioI. 14, 39-49. Pearson, K, 1898. Oata for the problem of evolution in man. Ill. On the magnitude of
certain coefficients of correlation in man. Proc. Roy. Sac. 66, 23-32. Pearson, O.M., 2001. Postcranial remains and the origin of modern humans. Evol.
Anthropol. 9, 229-247. Porter, AM.W. , 2002. Estimation of body size and physique from hominin skeletal
remains. HOMO 53, 17-38. Pycraft, w.P., Smith, G.E., Yearsley, M., Carter, J.T. , Smith, RA, Hopwood, AT.,
Bate, O.MA, Swinton, W.E., 1928. Rhodesian Man and Associated Remains. British Museum (Natural History), London.
Raxter, M.H., Auerbach, B.M., Ruff, CB., 2006. Revision of the fully technique for estimating statures. Am. J. Phys. Anthropol. 130, 374-384.
Rodriguez, L, Carretero, J.M., Arsuaga, J.L, Garcia-Gonzalez, R , G6mez-Olivencia, A , Martinez, I., 2007. Analisis estatico de la diafisis del Femur X de la Sima de los Huesos (Sierra de Atapuerca, Burgos, Espana). XXIII Jornadas de la Saciedad Espanola de Paleontologia. Libro de Resumenes. Instituto Geologico y Minero y la Universidad de Granada, Caravaca de la Cruz. Murcia.
Rosenberg, KR, Zune, L, Ruff, CB., 2006. Body size, body proportions and encephalization in a Middle Pleistocene archaic human from northern China. Proc. Natl. Acad. Sei. 103, 3552-3556.
Rosing, EW. , 1988. Koperhohenrekonstruktion aus skelettma~en. In: Knu~mann, R (Ed.), Anthropologie. Handbuch der vergleichenden Anthropologie des Menschen. Fischer, Stuttgart Bergrilndet von Rudolf Martin.
Ruff, CB., 1991. Climate and body shape in hominid evolution.J. Hum. Evol. 21, 81-105. Ruff, CB., 1994. Morphological adaptation to climate in modern and fossil hominids.
Am. J. Phys. Anthrop. 37 (S19), 65-107. Ruff, CB. , 1995. Biomechanics of the hip and birth in early Homo. Am. J. Phys.
Anthropol. 98, 527-574. Ruff, CB., Trinkaus, E. , Holliday, T.W., 1997. Body mass and encephalization in
Pleistocene Homo. Nature 387, 173-176. Ruff, CB., Trinkaus, E., Walker, A, Larsen, CS., 1993. Postcranial robusticity in Homo. I:
temporal trends and mechanical interpretation. Am.J. Phys. Anthropol. 91, 21-53. Ruff, CB. , Walker, A, 1993. Body shape and body size. In: Walker, A., Leakey, R
(Eds.), The Narikotome Homo erectus Skeleton. HalVard University Press, Harvard.
Sanna, E. , 2002. 11 secular trend in Italia. Antropol 3, 23-49. Santa-Luca, AP., 1980. The Ngandong Fossil Hominids: A Comparative Study ofa Far
Eastern Homo erectus Group, vol. 78. Yale Univ. Publ. Athropol. 1-175. Schillaci, M.A., Sehillaci, M.E. , 2009. Estimating the probability that the sample
mean is within a desired fraction of the standard deviation of the true mean. J. Hum. Evol. 56, 134-138.
Simpson, S.W., Quade, J. , Levin, N.E., Butler, R, Oupont-Nivet, G. , Everett, M., Semaw, S. , 2008. A female Homo erectus pelvis from Gona, Ethiopia. Seience 322, 1089-1092.
Sj0vold, T. , 1990. Estimation of stature from long bones utilizing the line of organic correlation. Hum. Evol. 5, 431--447.
Smith, R.j. , 2009. Use and misuse of the reduced MaAxis for line-fitting. Am J. Phys. Anthropol. 140, 476-486.
Sarensen, M.V., Leonard, W.R, 2001. Neandertal energetics and foraging efficiency. J. Hum. Evol. 40, 483-495.
Steegmann, AT.j., Cerny, EJ., Holliday, T.W., 2002. Neandertal cold adaptation: physiological and energetic factors. Am. J. Hum BioI. 14, 566-583.
Steudel-Numbers, KL, 2006. Energetics inHomo erectus and other early hominines: the consequences of increased lower-limb length. J. Hum. Evol. 51, 445-453.
Steudel-Numbers, KL, Tilkens, M.j., 2004. The effect of lower limb length on the energetic cost of locomotion: implications for fossil hominines. J. Hum. Evol. 47, 95-109.
Steudel-Numbers, KL , Weaver, T.O., Wall-Schemer, CM., 2007. The evolution of human running: effects of changes in lower-limb length on locomotor economy. J. Hum. Evol. 53, 191-196.
Stringer, CB., Trinkaus, E. , Roberts, M.B., Parfitt, SA, Macphail, RI. , 1998. The Middle Pleistocene human tibia from Boxgrove. J. Hum. Evol. 34, 509-547.
Tague, RG., 2000. 00 big females have big pelves? Am. J. Phys. Anthropol. 112, 377-393.
Thoma, A, 1995. The average stature of Neandertals. Z. Morph. Anthrop 80, 195-198.
Trinkaus, E., 1981. Neanderthal limb proportions and cold adaptations. In: Stringer, C (Ed.), Aspects of Human Evolution. Taylor and Francis, London, pp. 187-224.
Trinkaus, E., 1983. The Shanidar Neandertals. Academic Press, New York. Trinkaus, E., 2009. The human tibia from Broken Hill, Kabwe, Zambia. PaleoAnthrop.
2009, 145-165. Trinkaus, E., Rhoads, M.L, 1999. Neandertal knees: power lifters in the Pleistocene?
J. Hum. Evol. 37, 833-859. Trotter, M., 1970. Estimation of stature from intact limb bones. In: Stewart, T.O. (Ed.),
Personal Identification in Mass Disasters. National Museum of Natural History, Washington, O.e. pp. 71-84.
Trotter, M., Gleser, G., 1952. Estimation of stature from long bones of American whites and negroes. Am. J. Phys. Anthropol. 10, 463-514.
Trotter, M., Gleser, G. , 1958. A revaluation of estimation of stature based on measurementes of stature taken during life and of long bones after death. Am. J. Phys. Anthropol. 16, 19-123.
Valls, A, 1980. Introduccion a la Antropologia. Labor Universitaria, Barcelona. Vandermeersch, B., 1981. Les hommes fossiles de Qafzeh (Israel). CNRS, Paris. Vandermeersch, B., Trinkaus, E. , 1995. The postcranial remains of the Regourdou 1
Neandertal: the shoulder and arm remains. J. Hum. Evol. 28, 439-476. Walker, M.j., Ortega, J. , Parmova, K, L6pez, M.Y., Trinkaus, E., 2011. Morphology,
body proportions, and postcranial hypertrophy of a female Neandertal from the Sima de las Palomas, southeastern Spain. Proc. Natl. Acad. Sei. 108, 10087-10091.
Weaver, T.O. , 2009. Out of Africa: modern human origins special feature: the meaning of Neanderthal skeletal morphology. Proc. Natl. Acad. Sci. 106, 16028-16033.
Weaver, T.O., Hublin, j.J. , 2009. Neandertal birth canal shape and the evolution of human childbirth. Proc. Natl. Acad. Sei. 106, 8151-8156.
Weinstein, KJ. , 2008. Thoracic morphology in Near Eastern Neandertals and early modern humans compared with recent modern humans from high and low altitudes. J. Hum Evol. 54, 287-295.
Wilson, R.j. , Herrmann, N.P. , Meadows-Jantz, L, 2010. Evaluation of stature estimation from the database for forensic anthropology. J. Forensic Sei. 55, 684-689.
Zune, L, 1990. La decouverte de l'homme fossile de Jing-Niu-Shan: Premiere etude. L'Anthropologie 94, 899-902.


![Segmentation of the Optic Nerve Head Based on … › open-access › segmentation-of-the...above [7-9], for the estimation of the distribution of hemoglobin in normal and glaucomatous](https://img.pdfslide.fr/doc/110x75/5f0d99477e708231d43b2691/segmentation-of-the-optic-nerve-head-based-on-a-open-access-a-segmentation-of-the.jpg)


![BOTTOM-MOUNTED ARRAY SHAPE ESTIMATION USING …analyses of the data in SWellEX-96 during which two horizontal linear array (HLA) collected the radiated noise of the R/V Sproul [5]](https://img.pdfslide.fr/doc/110x75/60dea25978f36d4e9f242112/bottom-mounted-array-shape-estimation-using-analyses-of-the-data-in-swellex-96-during.jpg)

![Cost Estimation Across Heterogeneous SQL-Based Big Data ... · architecture (See Figure 1): Teradata: The master engine in the entire architecture is the Teradata Database [ 2]. It](https://img.pdfslide.fr/doc/110x75/5f62ae0bcb16555ce5004b88/cost-estimation-across-heterogeneous-sql-based-big-data-architecture-see-figure.jpg)