Embed Size (px)
Citation preview
Structural Changes in Entorhinal Cortex in Mild Cognitive Impairment and Alzheimer’s Disease:
An MRI Study
Noor Jehan Kabani
CONSORTIUM COGNITION ET VIEILLISSEMENTCONSORTIUM COGNITION ET VIEILLISSEMENT
Traitement des troubles cognitifs dans les maladies Traitement des troubles cognitifs dans les maladies neurodégénérativesneurodégénératives
Structural Basis of Dementia
Cognitive changes have a neural basis.
Magnetic resonance imaging is a non-invasive
way of studying the neural substrate.
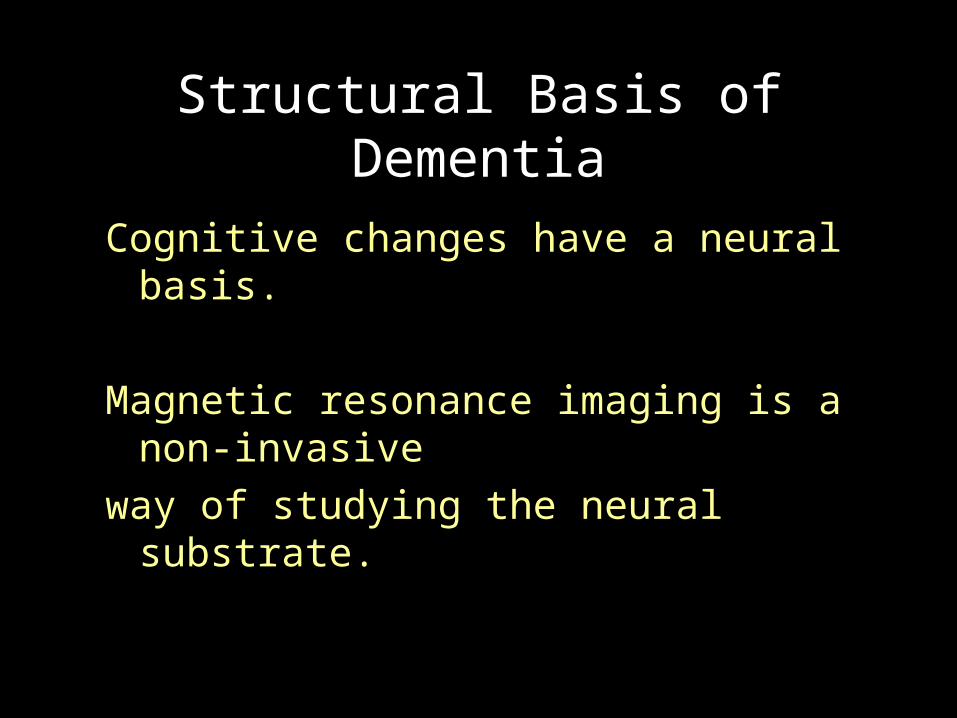
Pathology of AD
Hierarchical Disease Progression
• Medial Temporal Lobe (Entorhinal Cortex (35); Hippocampus (27))• Anterior Temporal Cortex (38)• Inferior Temporal Cortex (20)• Middle Temporal Cortex (21)• Polymodal Association Areas
(23, 22, 39,10) • Unimodal Areas (44)• Primary or Sensory Areas (4, 18, 17)• All neocortical areas
Modified from E.Gomez
Amyloid Deposits - Neurofibrillary Tangles
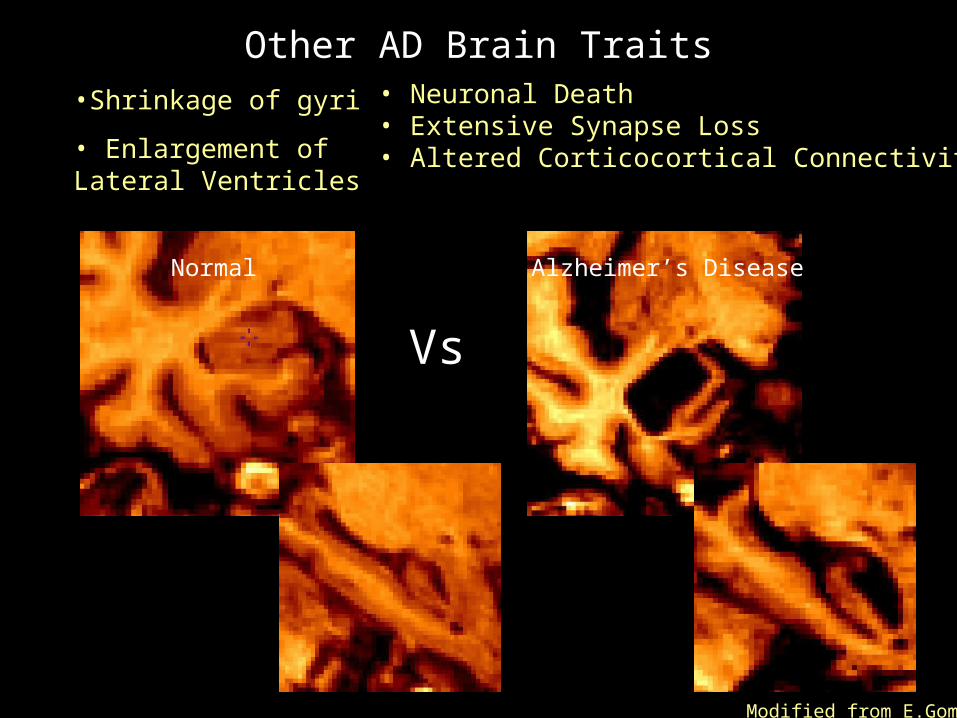
•Shrinkage of gyri
• Enlargement of Lateral Ventricles
• Neuronal Death• Extensive Synapse Loss• Altered Corticocortical Connectivity
Normal Alzheimer’s Disease
Vs
Modified from E.Gomez
Other AD Brain Traits

MRI measures taken to study structural changes in AD
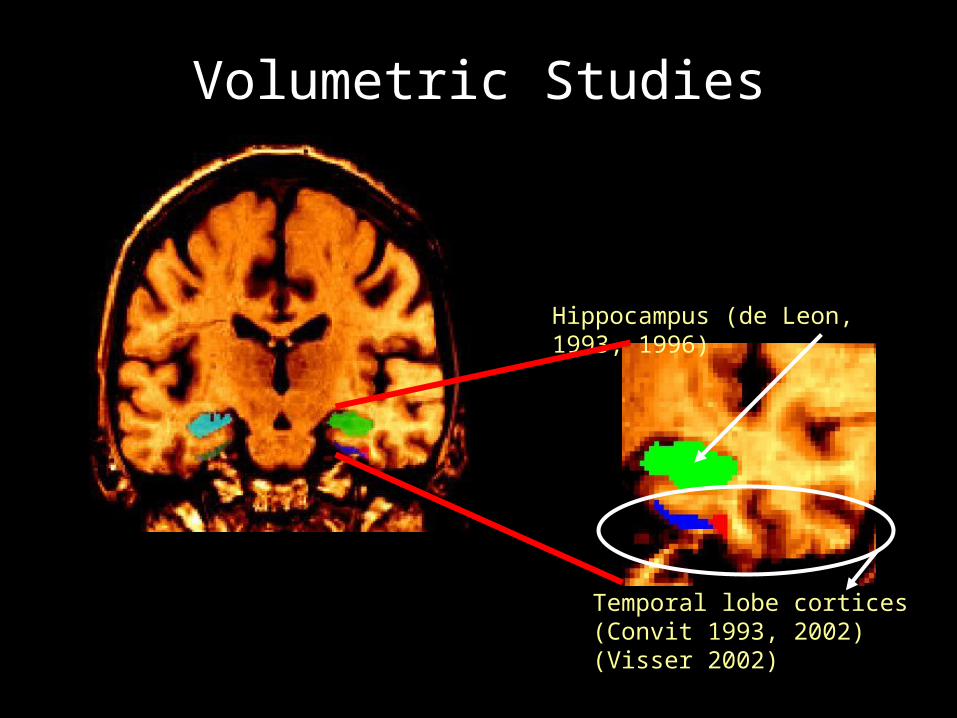
Volumetric Studies
Hippocampus (de Leon, 1993, 1996)
Temporal lobe cortices(Convit 1993, 2002)(Visser 2002)
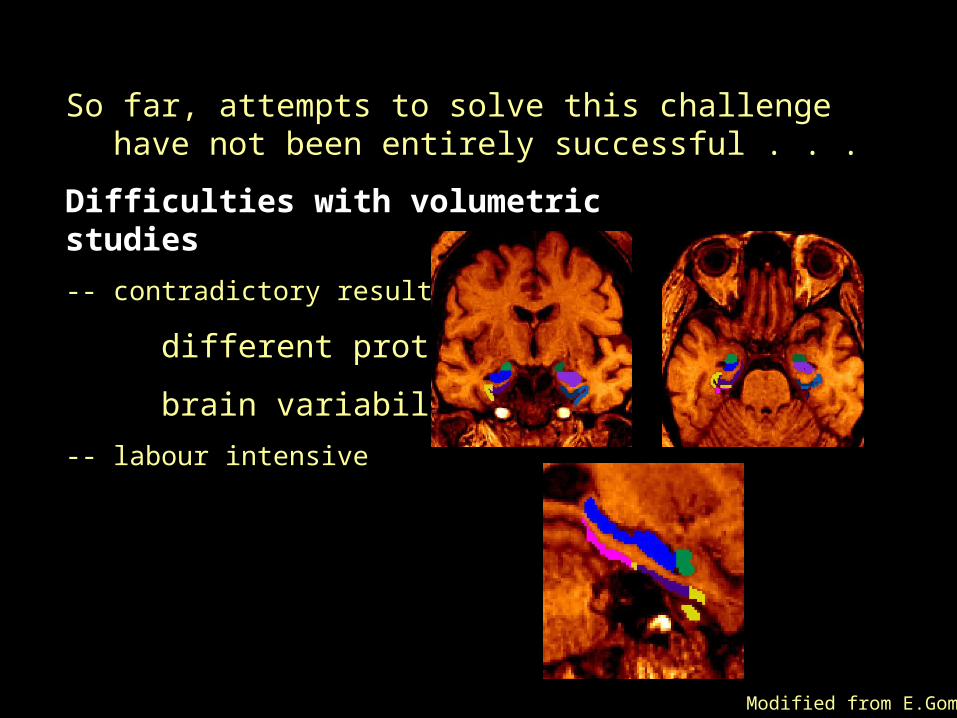
So far, attempts to solve this challenge have not been entirely successful . . .
Difficulties with volumetric studies
-- contradictory results
different protocols
brain variability
-- labour intensive
Modified from E.Gomez
A major weakness
volumetric studies depend upon gross morphologicalchanges at the macroscopic level
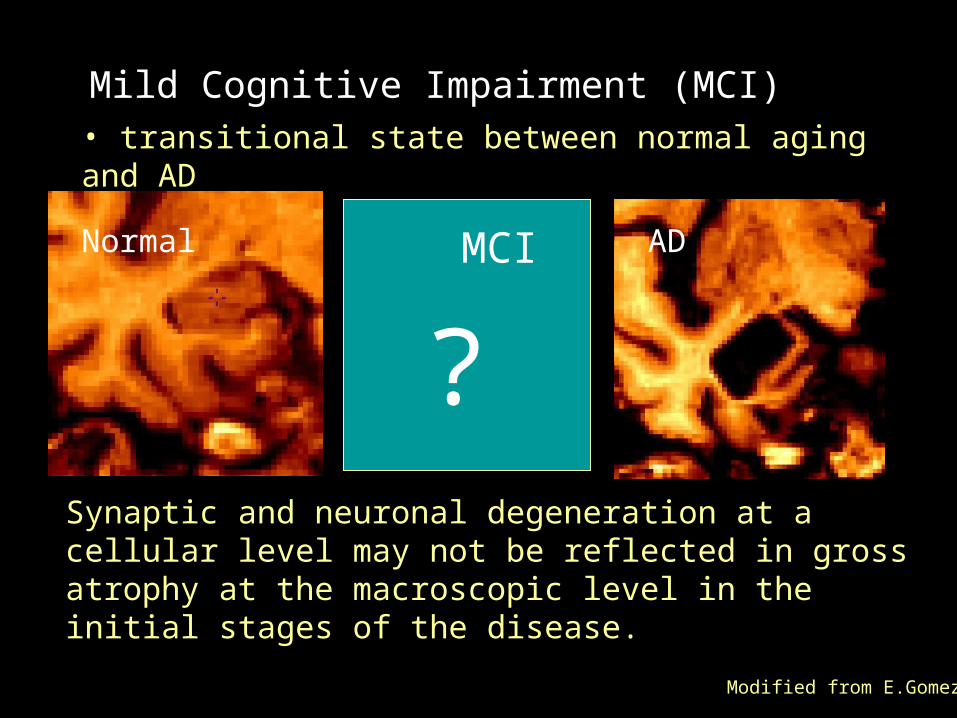
Mild Cognitive Impairment (MCI)• transitional state between normal aging and AD
MCINormal AD
?
Modified from E.Gomez
Synaptic and neuronal degeneration at a cellular level may not be reflected in gross atrophy at the macroscopic level in the initial stages of the disease.
Rationale For This Study
Atrophic changes are not always observed in MCI subjects and even MCI subjects with no medial temporal lobe atrophy may develop AD
Our Approach
A different structural imaging parameter
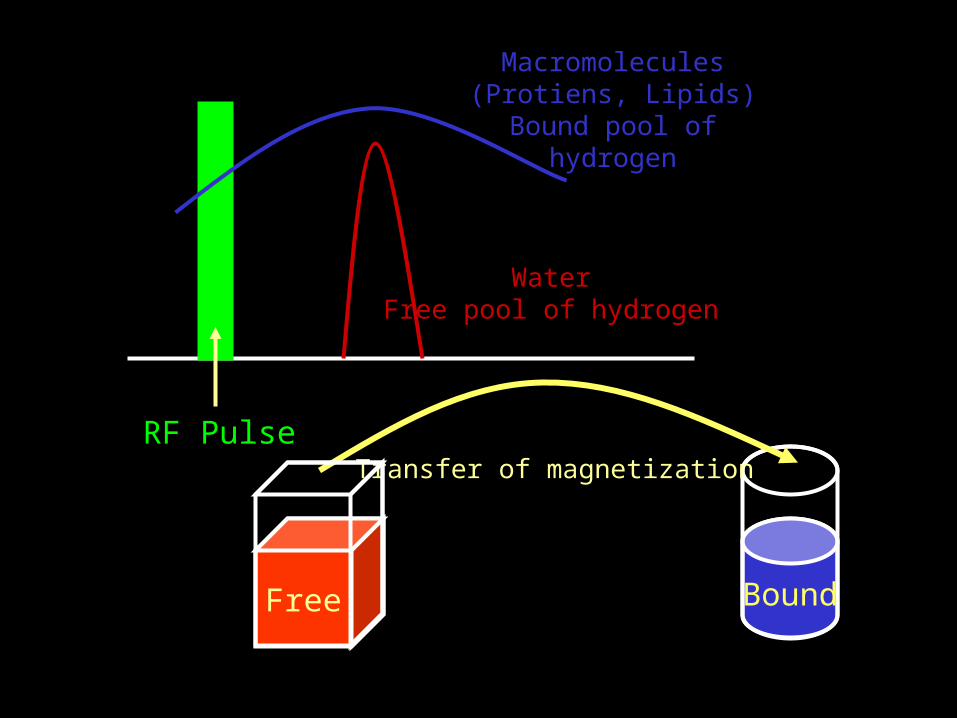
MRI Magnetization Transfer (MT) (Wolff and Balaban, 1989)
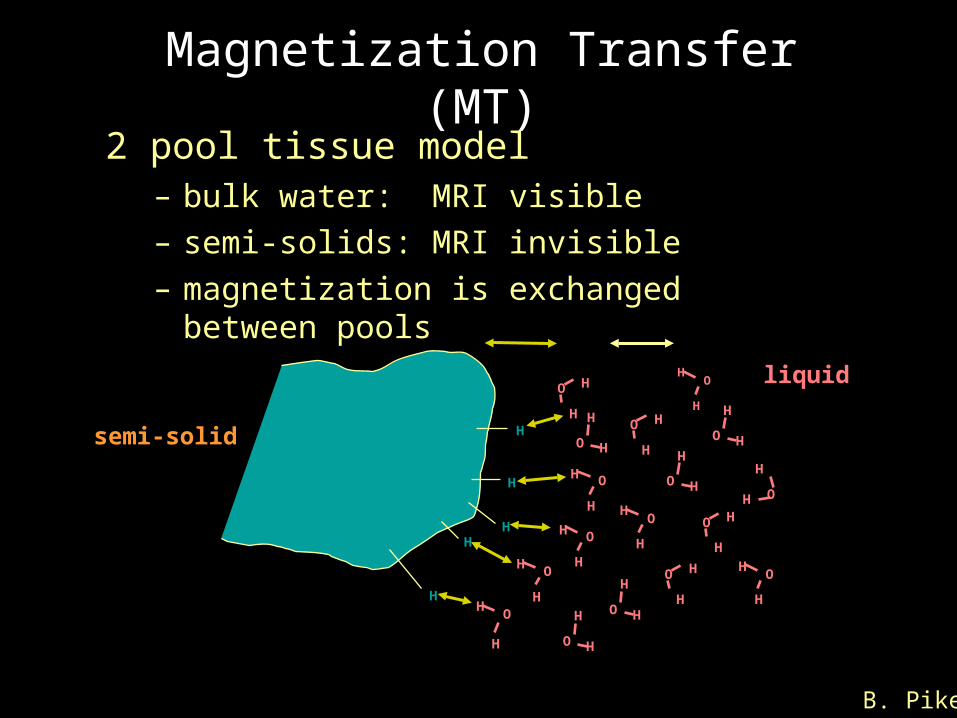
Magnetization Transfer (MT)2 pool tissue model
– bulk water: MRI visible
– semi-solids: MRI invisible
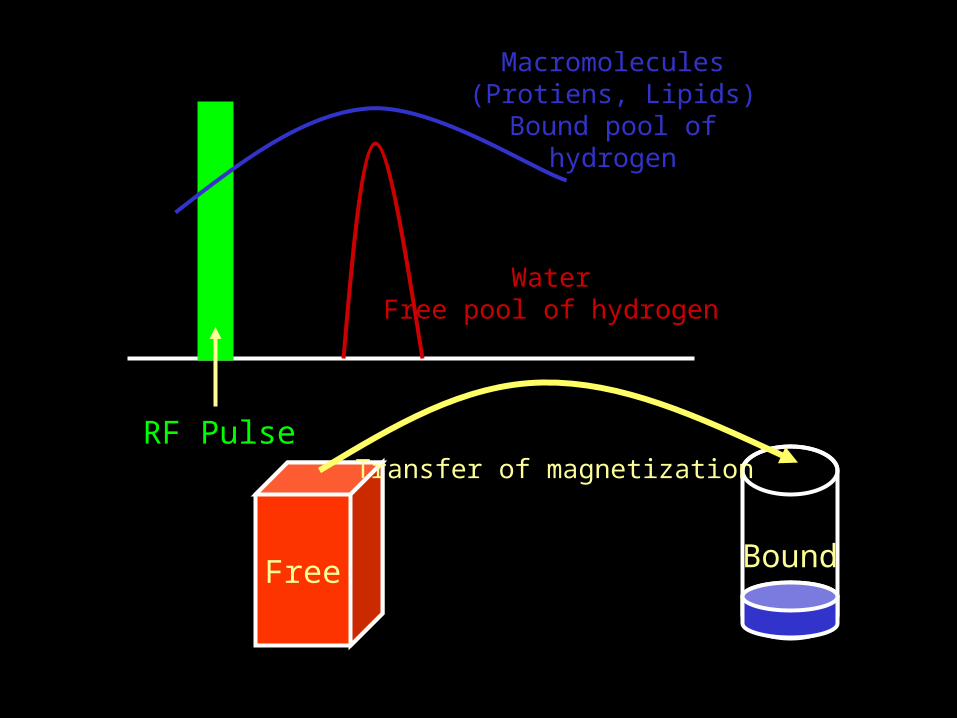
– magnetization is exchanged between pools
H
H
O
semi-solid
liquid
H
H
O
H
H
O
H
H
O
H
H
O
H
H
O
H
H
O
H
H
O H
H
O
H
H
O
H
H
O
H
H
O
H
H
O
H
H
O
H
H
O
H
H
O
H
H
O
H
HH
H
H
B. Pike
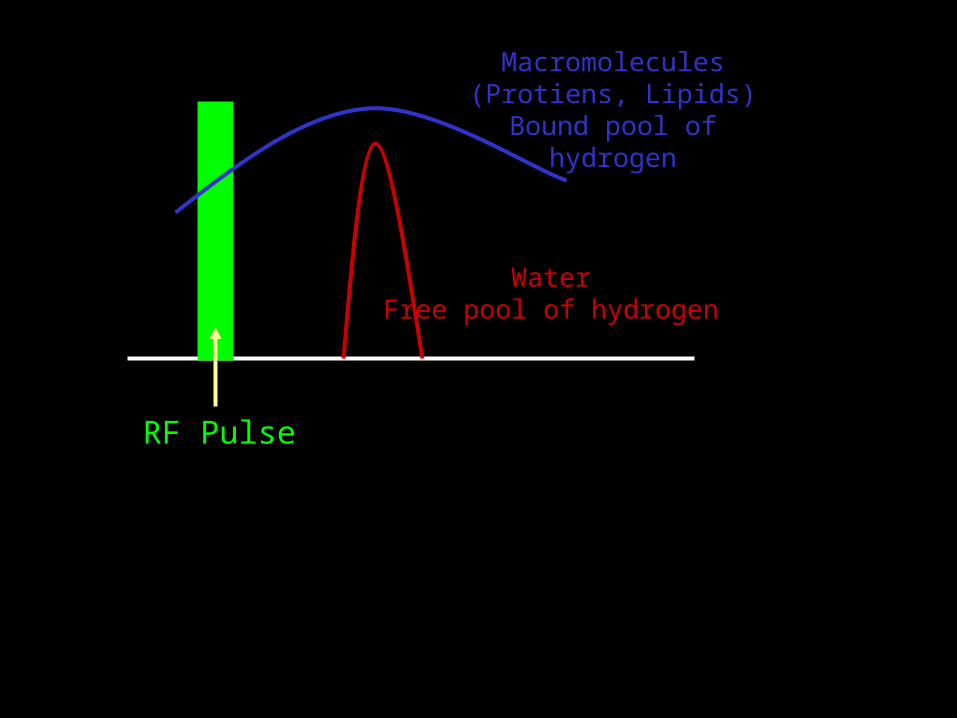
Macromolecules(Protiens, Lipids)
Bound pool of hydrogen
WaterFree pool of hydrogen
RF Pulse
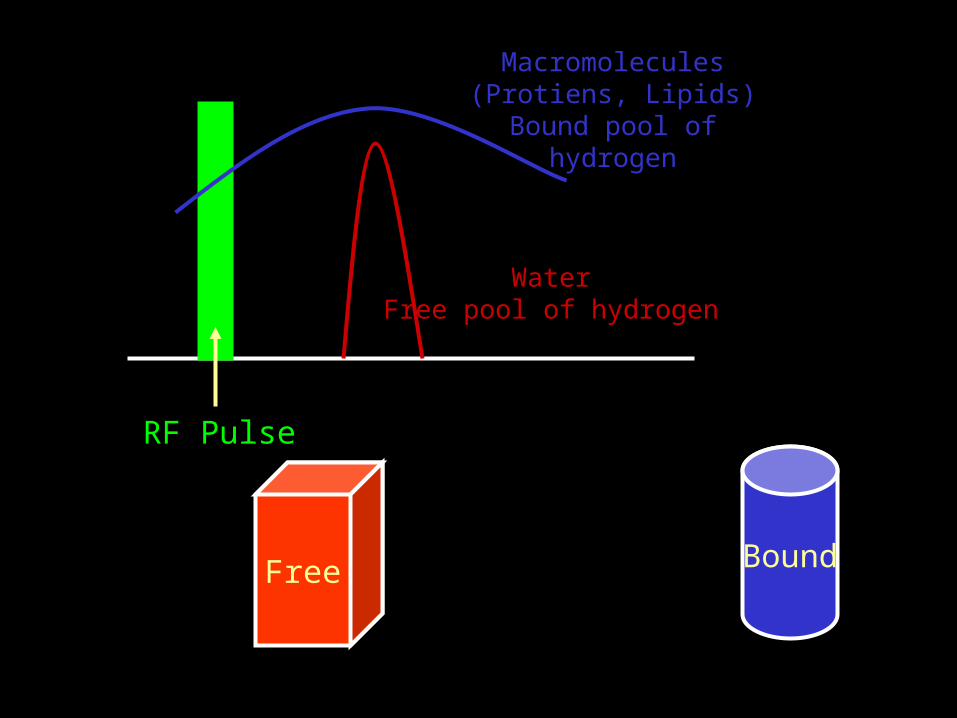
Macromolecules(Protiens, Lipids)
Bound pool of hydrogen
WaterFree pool of hydrogen
RF Pulse
BoundFree
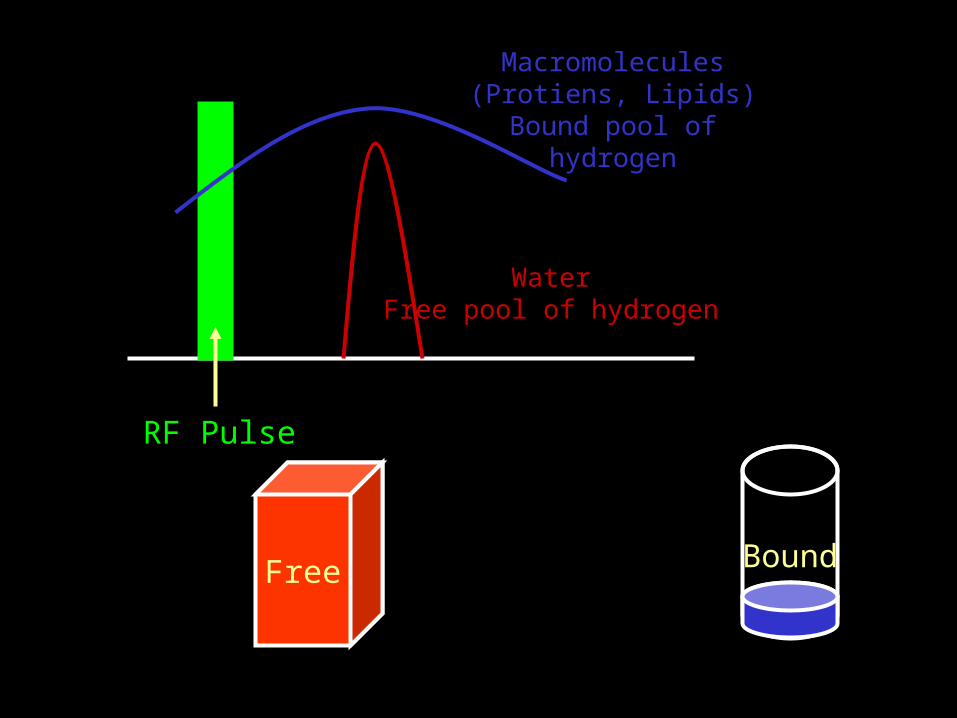
Macromolecules(Protiens, Lipids)
Bound pool of hydrogen
WaterFree pool of hydrogen
RF Pulse
BoundFree
Macromolecules(Protiens, Lipids)
Bound pool of hydrogen
WaterFree pool of hydrogen
RF Pulse
BoundFree
Transfer of magnetization
Macromolecules(Protiens, Lipids)
Bound pool of hydrogen
WaterFree pool of hydrogen
RF Pulse
Bound
Transfer of magnetization
Free
What does MT measurement yield?
MT allows one to indirectly study changes in myelin, protien matrices and cell membranes of the brain that are otherwise not visible using conventional MRI
METHODS
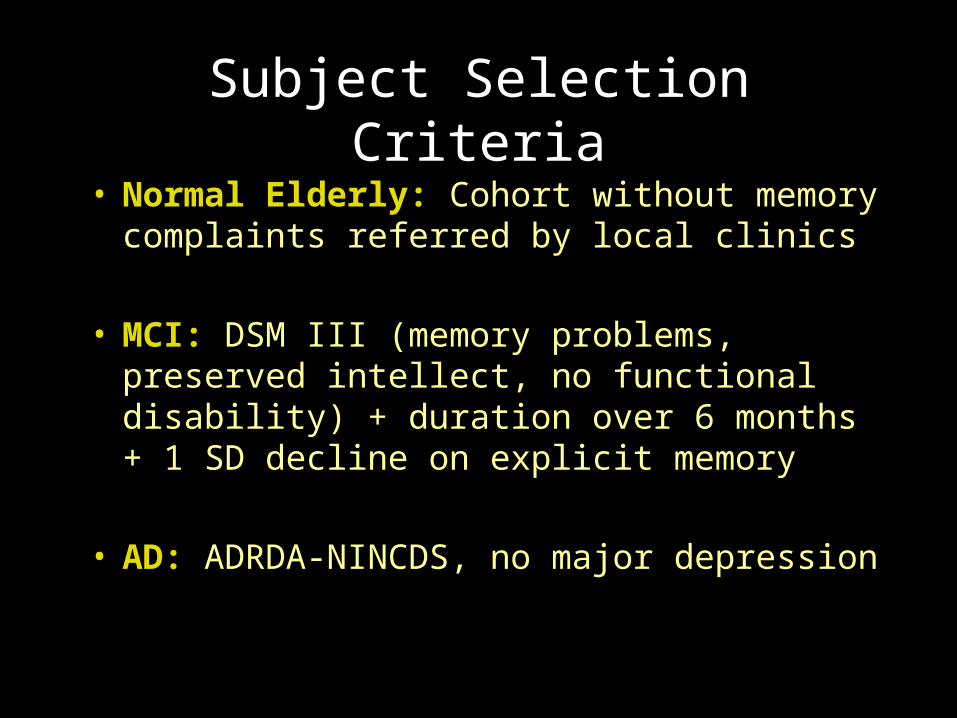
Subject Selection Criteria
• Normal Elderly: Cohort without memory complaints referred by local clinics
• MCI: DSM III (memory problems, preserved intellect, no functional disability) + duration over 6 months + 1 SD decline on explicit memory
• AD: ADRDA-NINCDS, no major depression
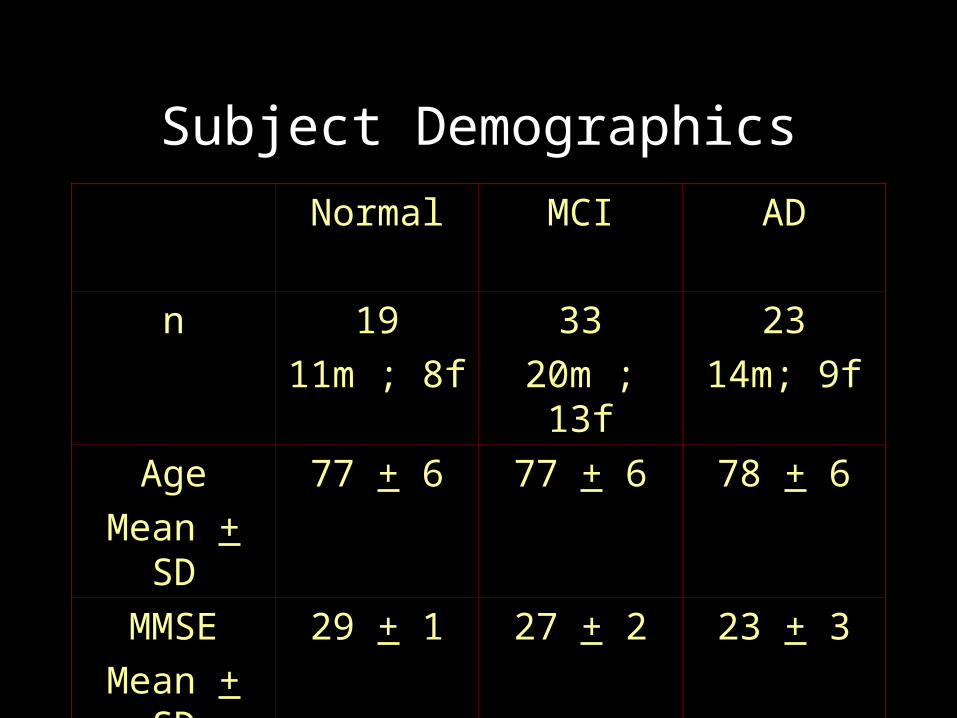
Subject Demographics
Normal MCI AD
n 19
11m ; 8f
33
20m ; 13f
23
14m; 9f
Age
Mean + SD
77 + 6 77 + 6 78 + 6
MMSE
Mean + SD
29 + 1 27 + 2 23 + 3
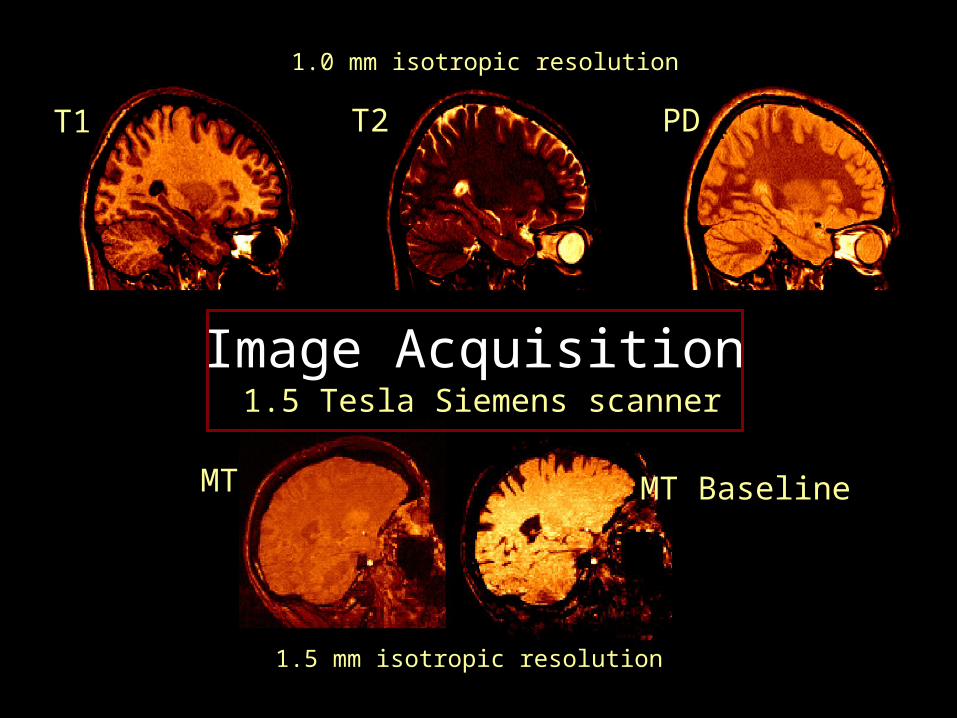
Image Acquisition
T1 T2 PD
1.5 Tesla Siemens scanner
MT MT Baseline
1.5 mm isotropic resolution
1.0 mm isotropic resolution

Image Analysis
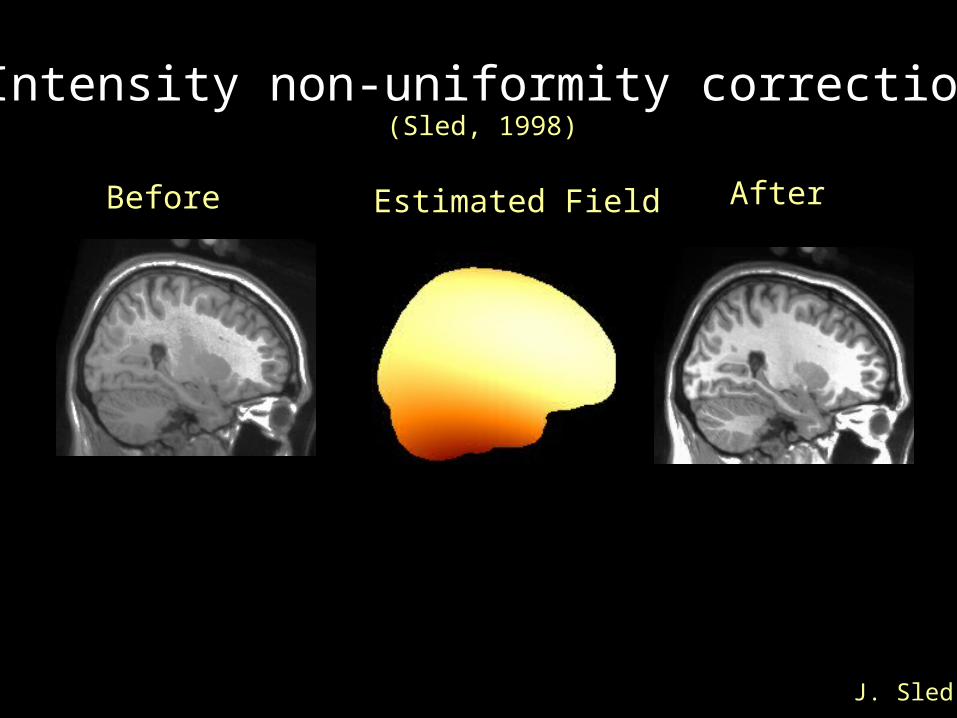
Before AfterEstimated Field
Intensity non-uniformity correction
J. Sled
(Sled, 1998)
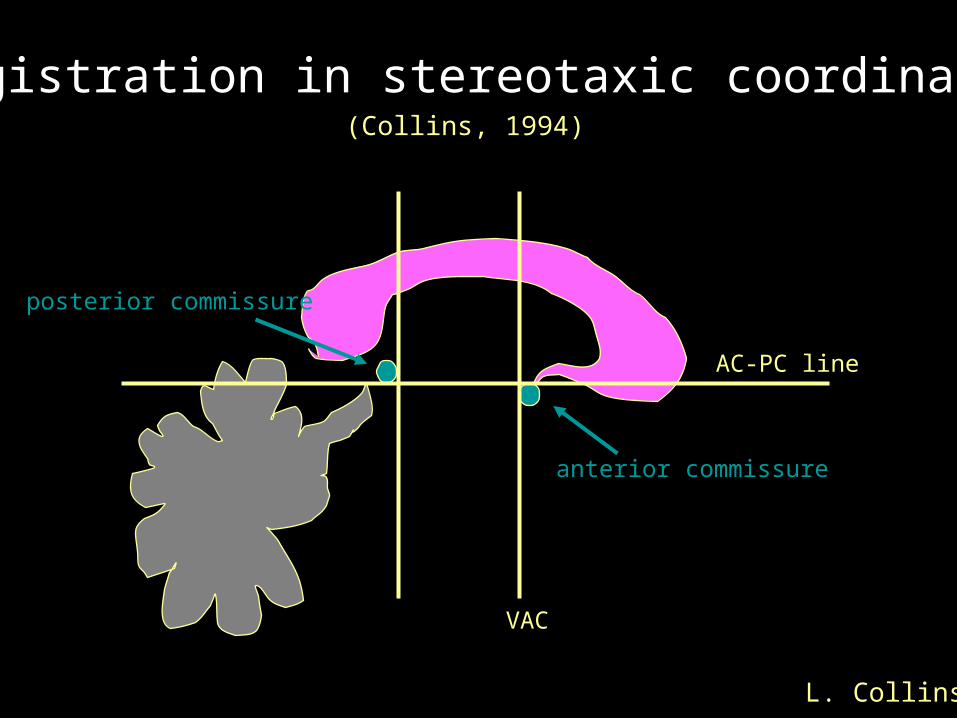
anterior commissure
AC-PC line
posterior commissure
VAC
Registration in stereotaxic coordinates(Collins, 1994)
L. Collins
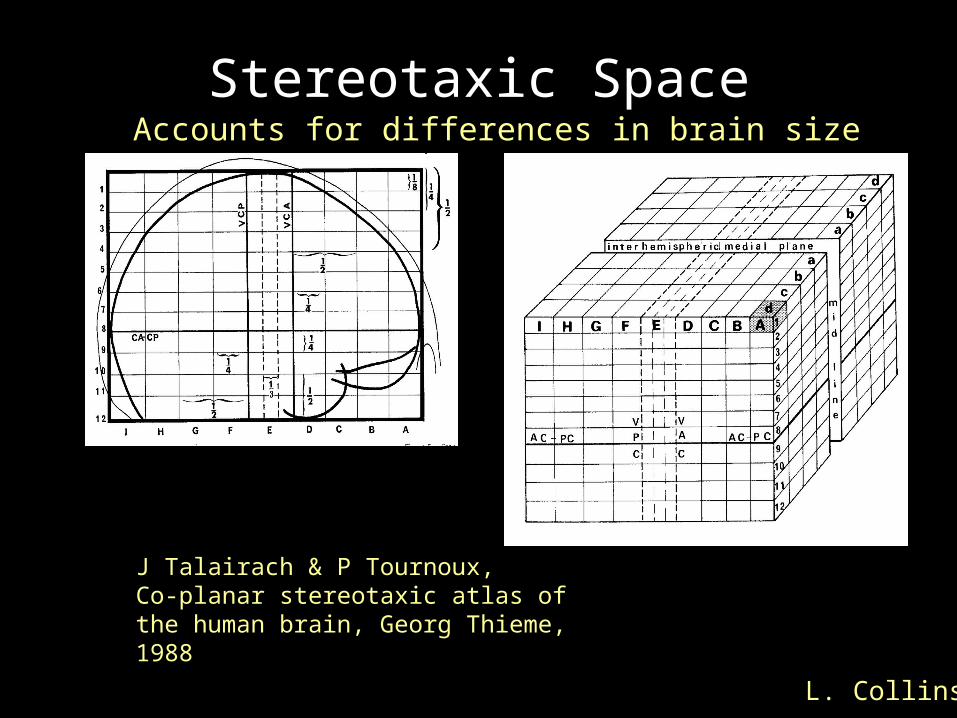
Stereotaxic Space
J Talairach & P Tournoux, Co-planar stereotaxic atlas of the human brain, Georg Thieme, 1988
L. Collins
Accounts for differences in brain size
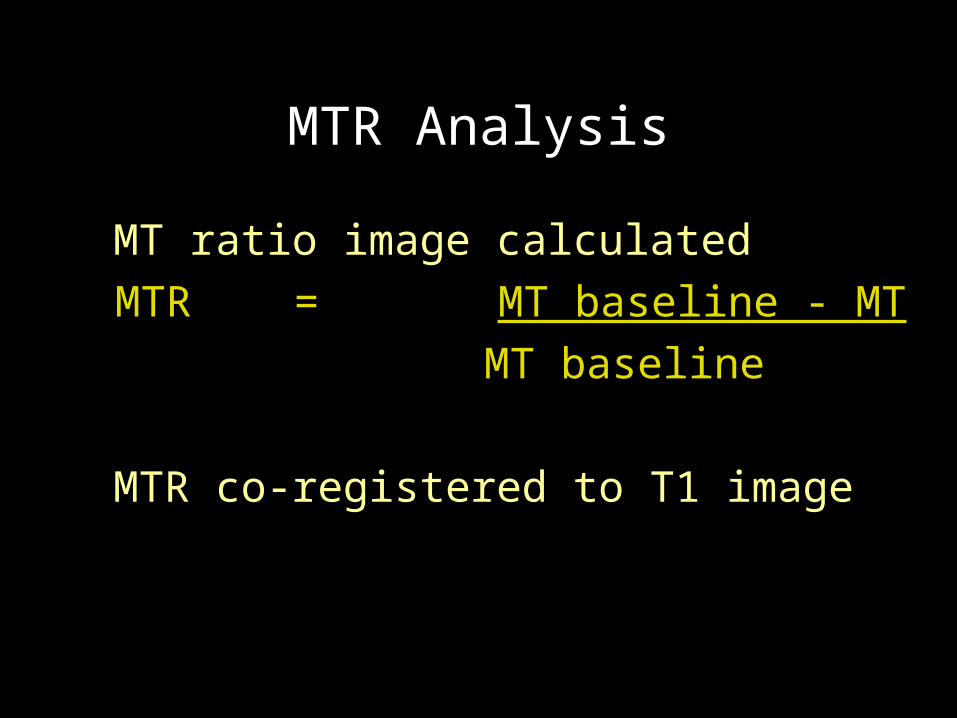
MTR Analysis
MT ratio image calculated
MTR = MT baseline - MT
MT baseline
MTR co-registered to T1 image
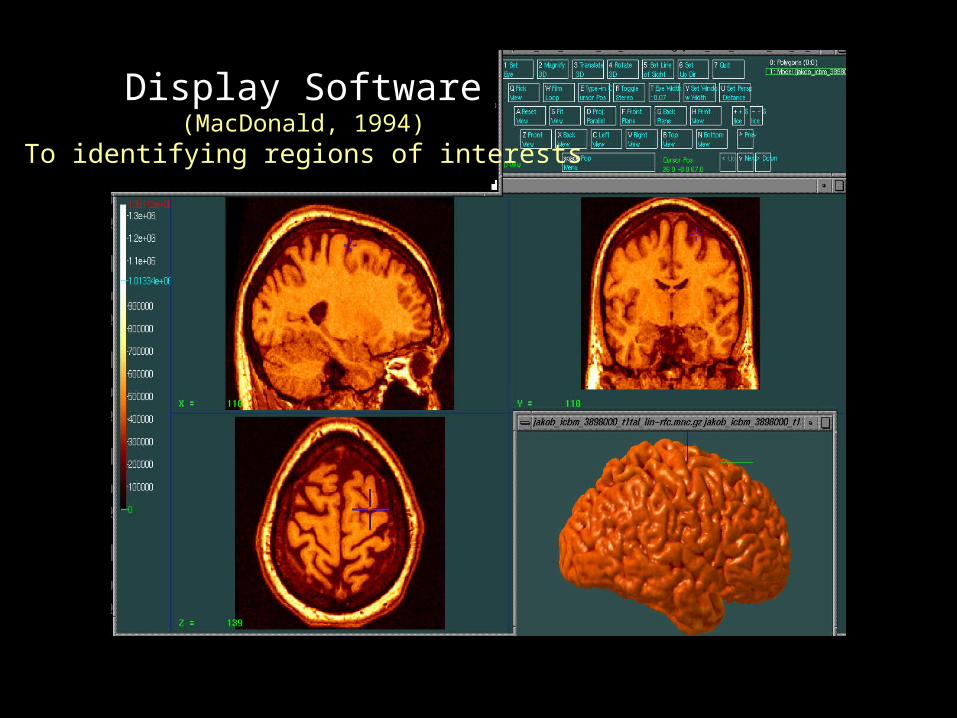
Display Software(MacDonald, 1994)
To identifying regions of interests
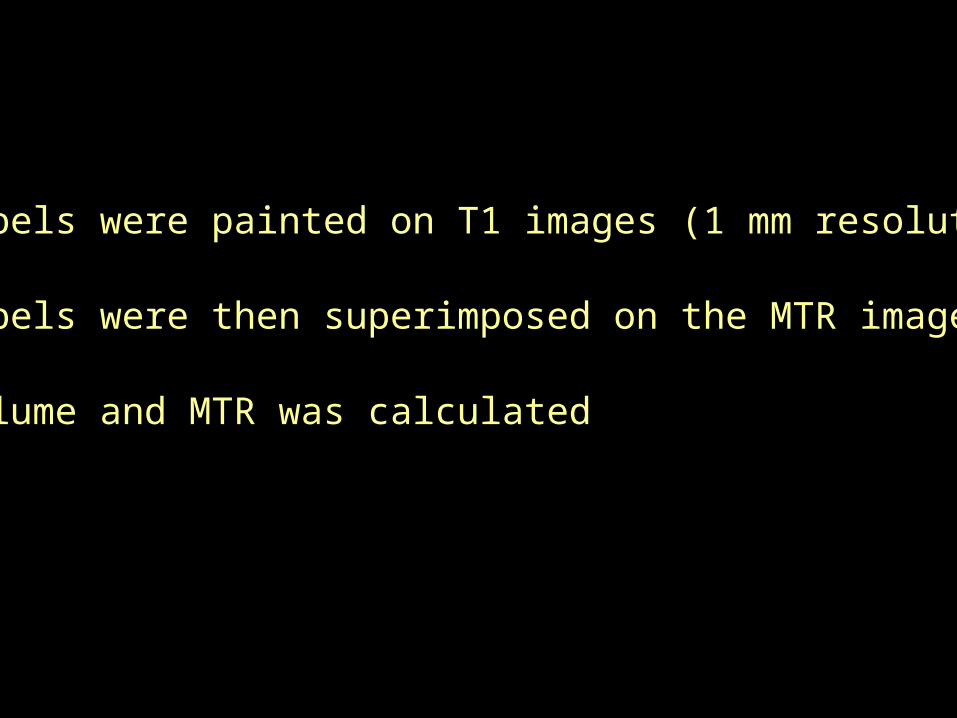
•Labels were painted on T1 images (1 mm resolution)
•Labels were then superimposed on the MTR images
•Volume and MTR was calculated

RESULTSPART 1
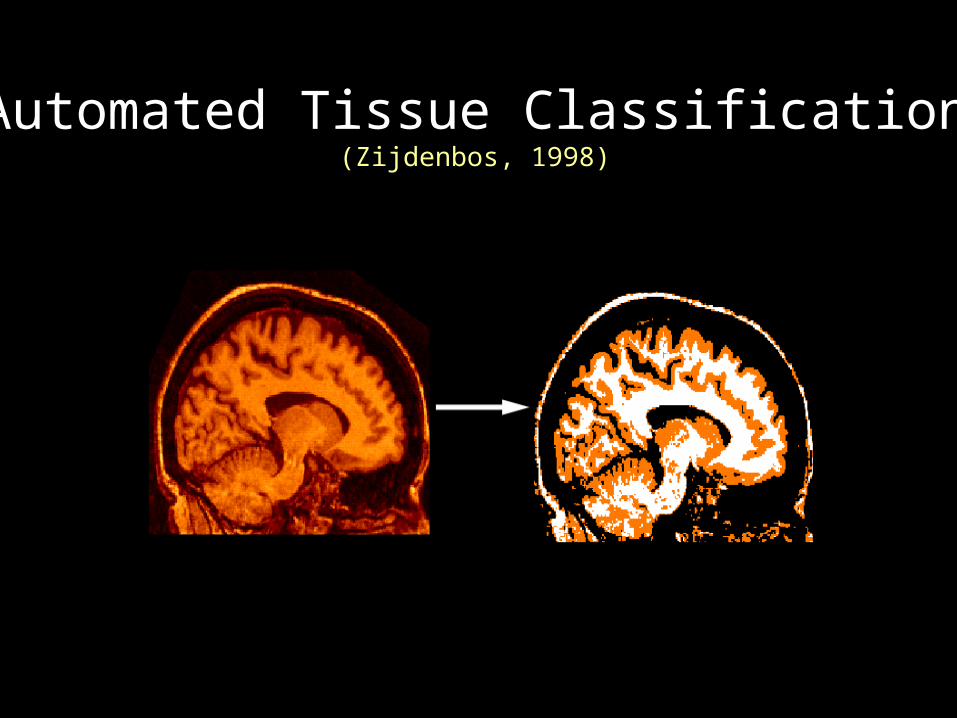
Automated Tissue Classification(Zijdenbos, 1998)
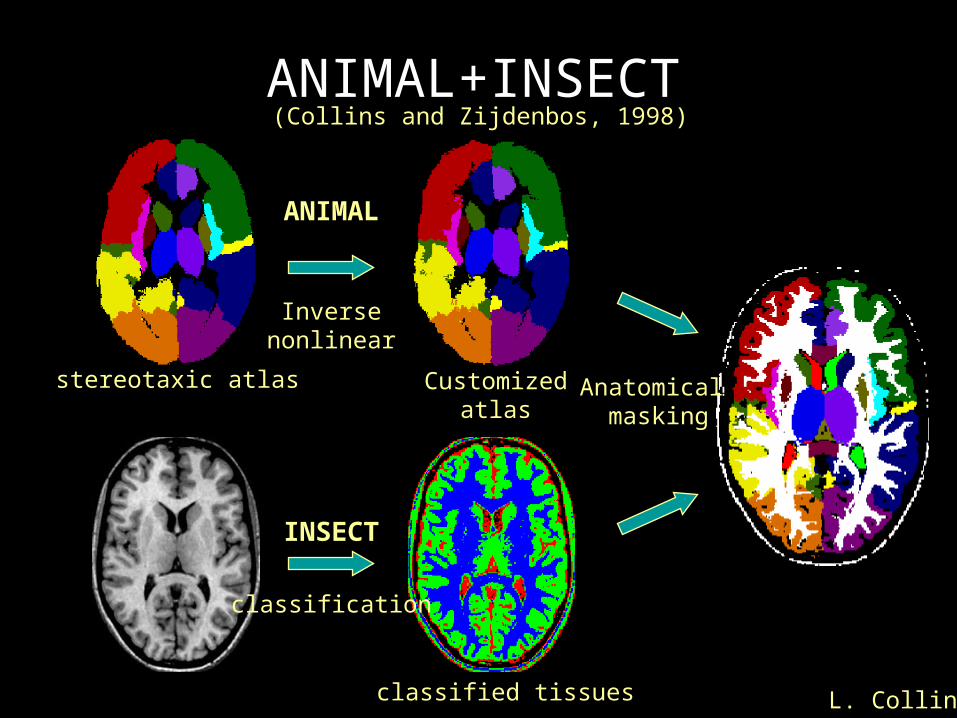
ANIMAL+INSECT
ANIMAL
INSECT
Inversenonlinear
classification
Anatomical masking
Customizedatlas
stereotaxic atlas
classified tissues L. Collins
(Collins and Zijdenbos, 1998)
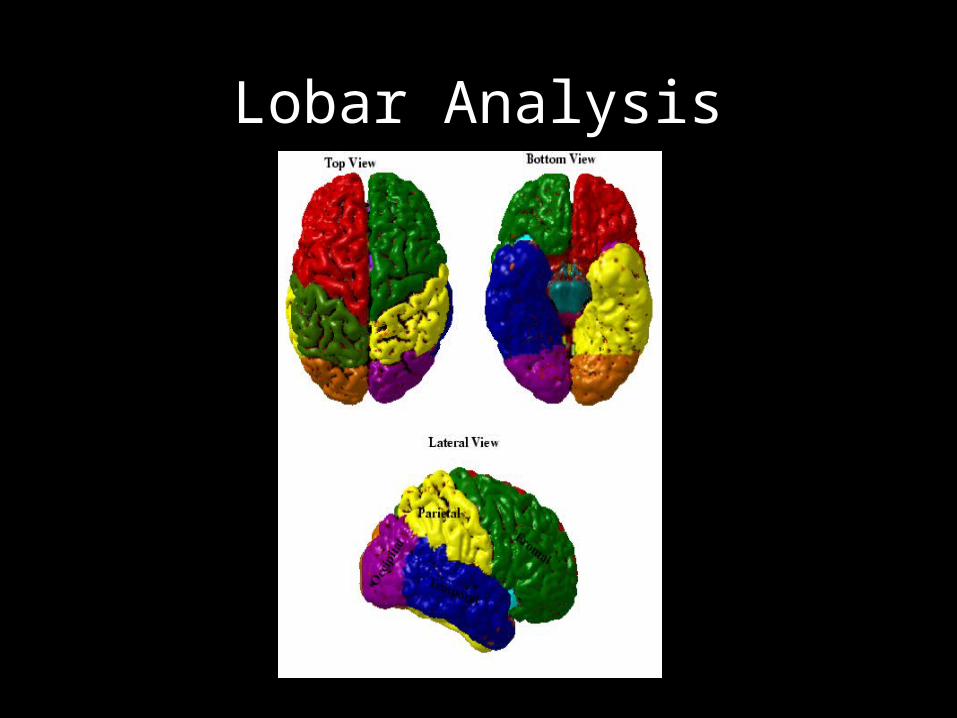
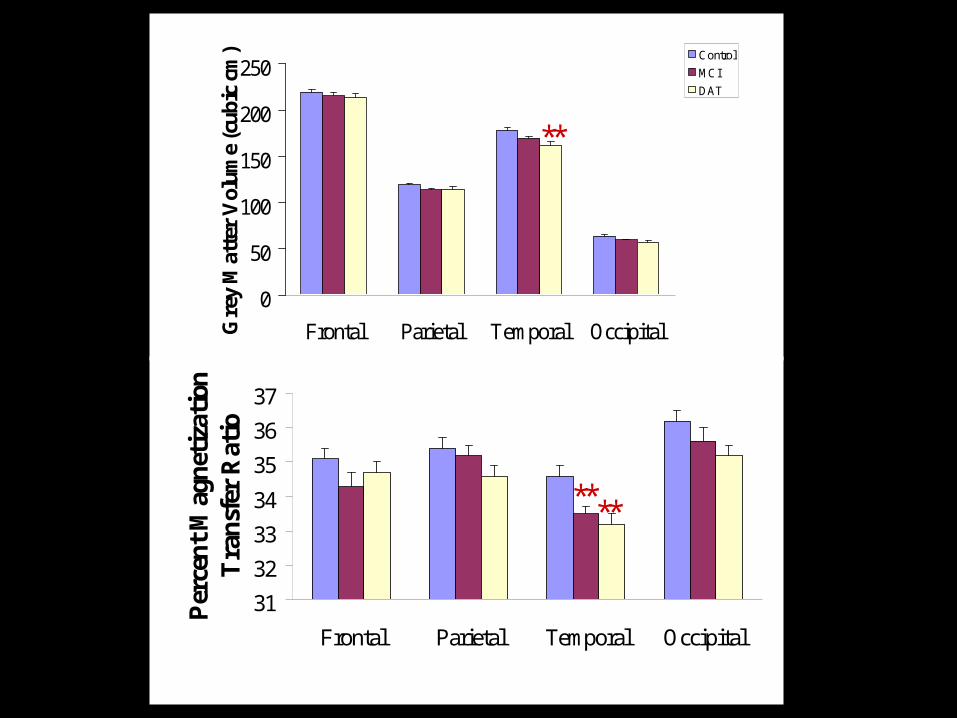
Lobar Analysis
0
50
100
150
200
250
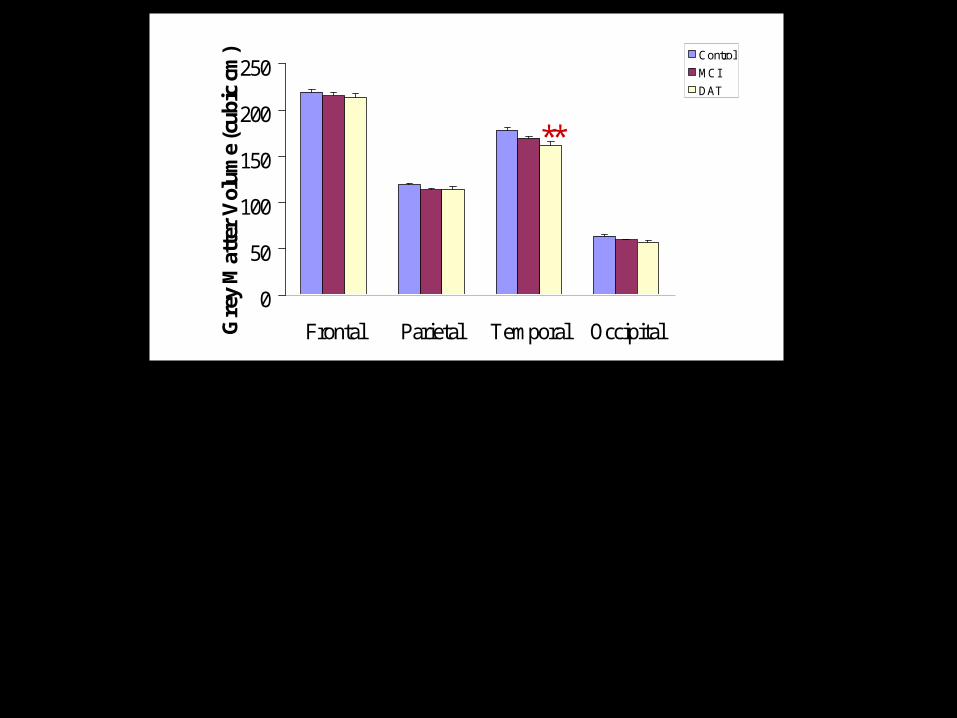
Frontal Parietal Temporal OccipitalGre
y M
atte
r V
olum
e (c
ubic
cm
) Control
MCI
DAT
**
0
50
100
150
200
250
Frontal Parietal Temporal OccipitalGre
y M
atte
r V
olum
e (c
ubic
cm
) Control
MCI
DAT
31
32
33
34
35
36
37
Frontal Parietal Temporal Occipital
Per
cen
t M
agn
etiz
atio
n
Tra
nsf
er R
atio
**
****

RESULTS
PART 2
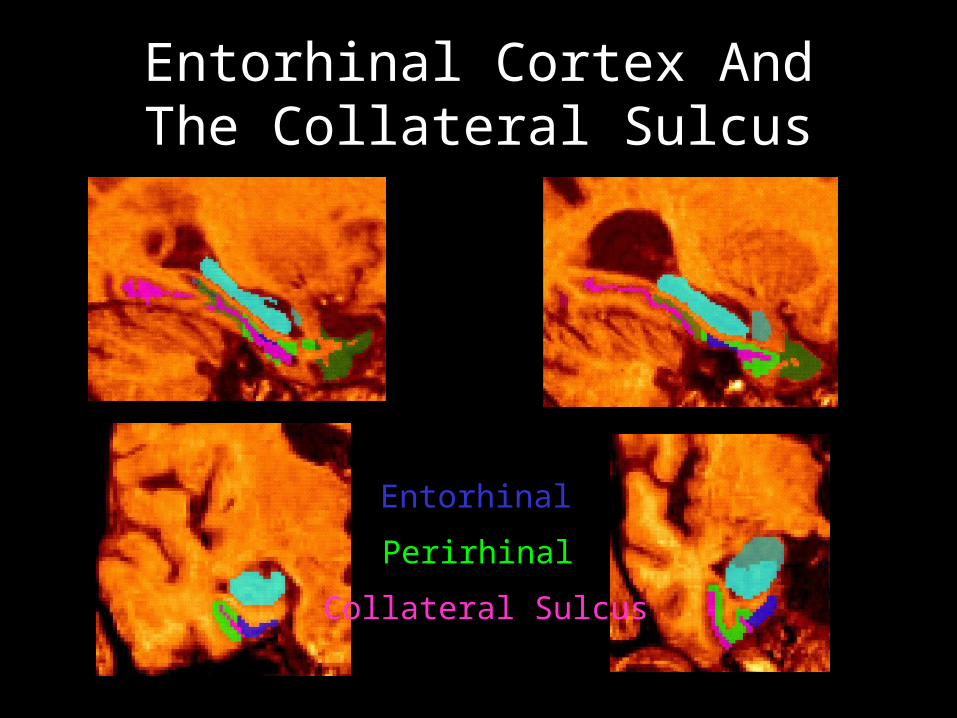
Entorhinal Cortex And The Collateral Sulcus
Entorhinal
Perirhinal
Collateral Sulcus
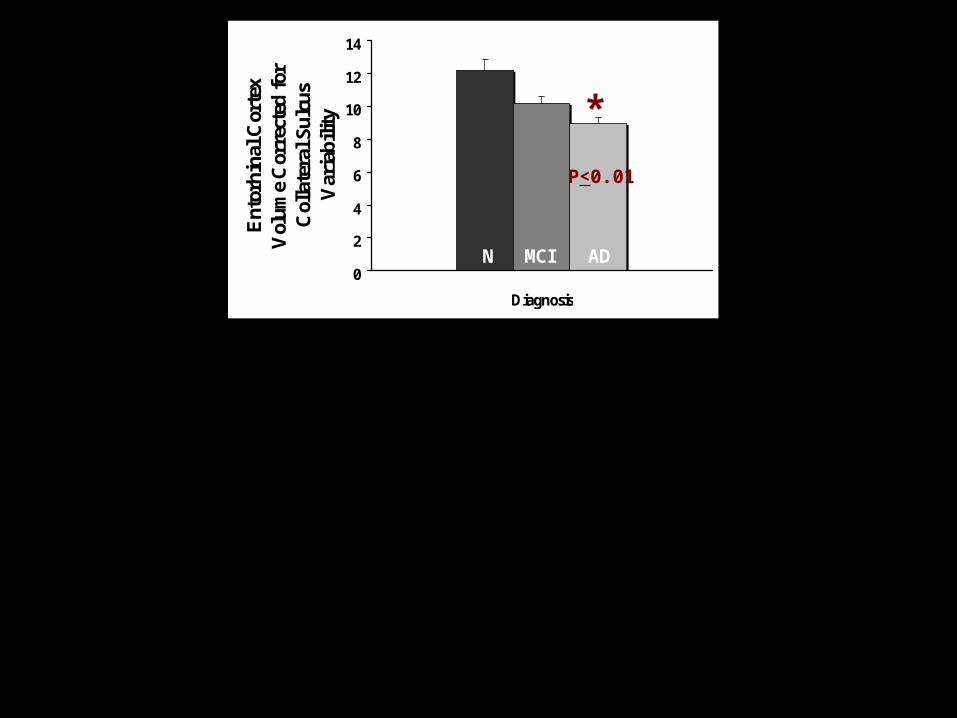
0
2
4
6
8
10
12
14
Diagnosis
Ent
orhi
nal C
orte
xV
olum
e C
orre
cted
for
C
olla
tera
l Sul
cus
Var
iabi
lity
P<0.01
*
N MCI AD
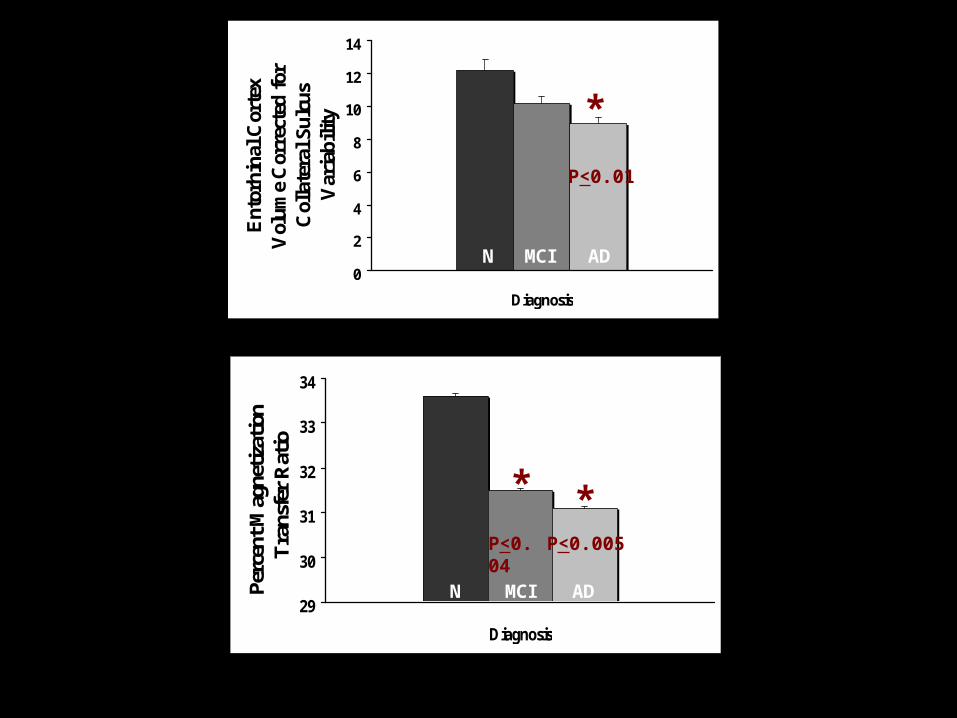
29
30
31
32
33
34
Diagnosis
Perc
ent M
agne
tizat
ion
Tra
nsfe
r R
atio
0
2
4
6
8
10
12
14
Diagnosis
Ent
orhi
nal C
orte
xV
olum
e C
orre
cted
for
C
olla
tera
l Sul
cus
Var
iabi
lity
P<0.01
P<0.04 P<0.005
* *
*
N MCI AD
N MCI AD
N MCI AD
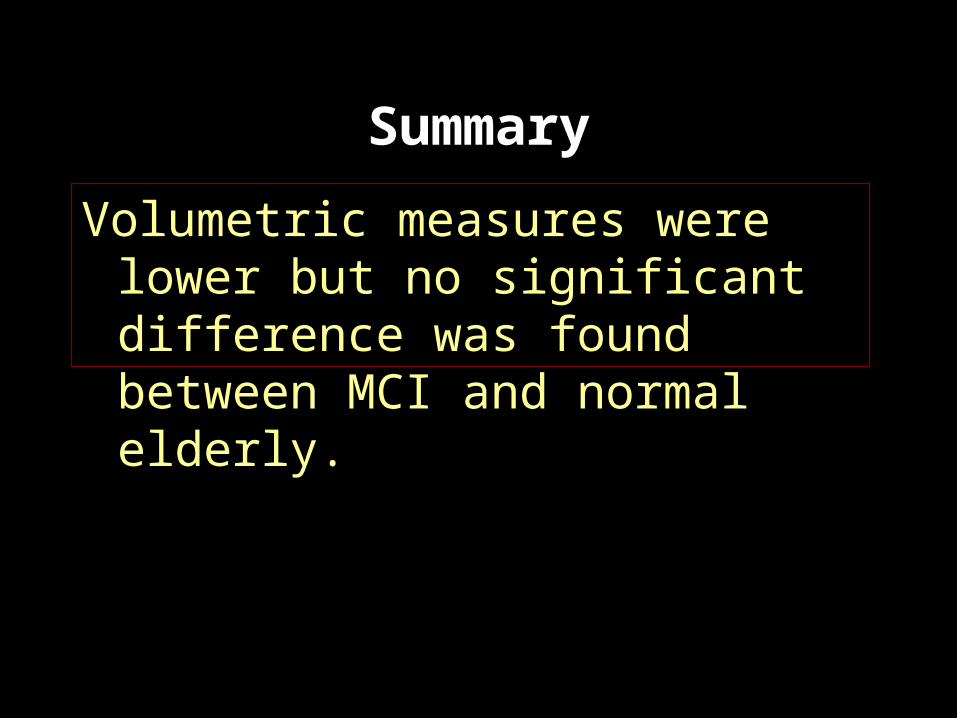
Summary
Volumetric measures were lower but no significant difference was found between MCI and normal elderly.
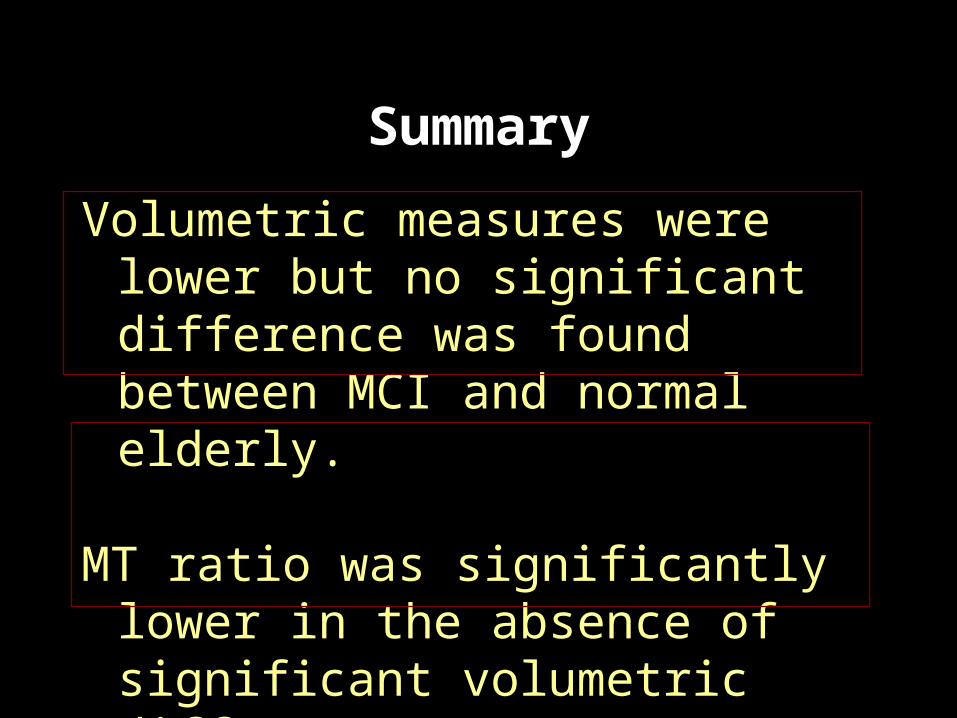
Summary
Volumetric measures were lower but no significant difference was found between MCI and normal elderly.
MT ratio was significantly lower in the absence of significant volumetric differences.
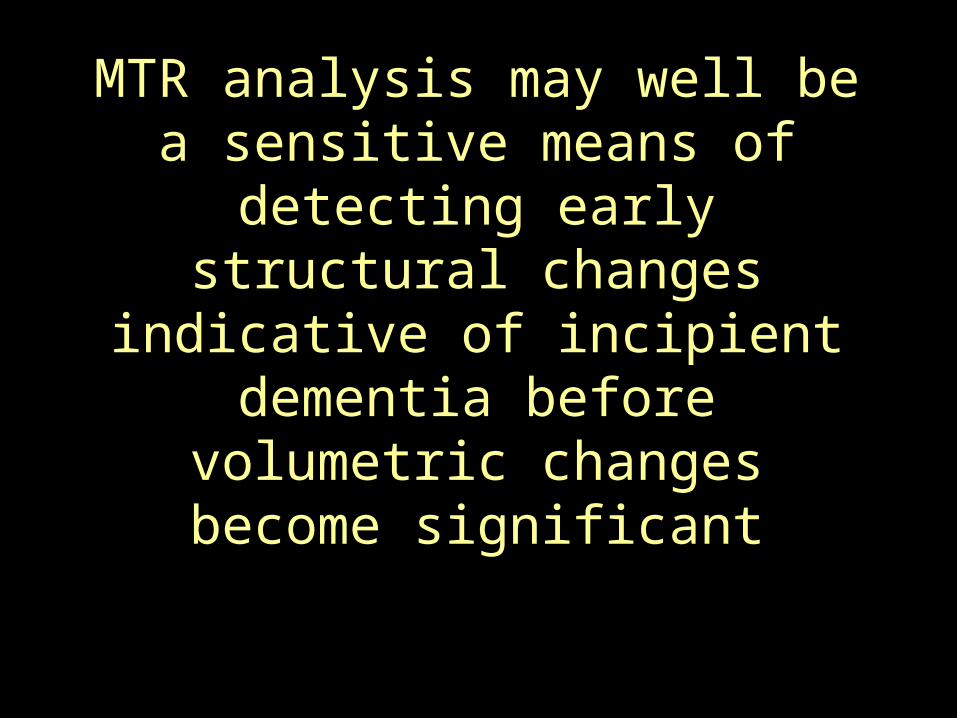
MTR analysis may well be a sensitive means of detecting early
structural changes indicative of incipient dementia before volumetric
changes become significant
Acknowledgements
• Consortium cognition et vieillissement (VRQ)
• Brain Imaging Center - Montreal Neurological Institute
• Geriatric unit of the Jewish General Hospital - Montreal
• Memory Clinic of the Jewish General Hospital - Montreal
• Alzheimer Society Research Foundation of Canada
• Canadian Institutes for Health Research
• Anita Shuper • Kate Hanratty • Adrienne Dorr• Anita Kar• Cinzia Gaudelli• Kathy De Sousa• John Sled• Howard Chertkow• Shelly Solomon