Embed Size (px)
Citation preview
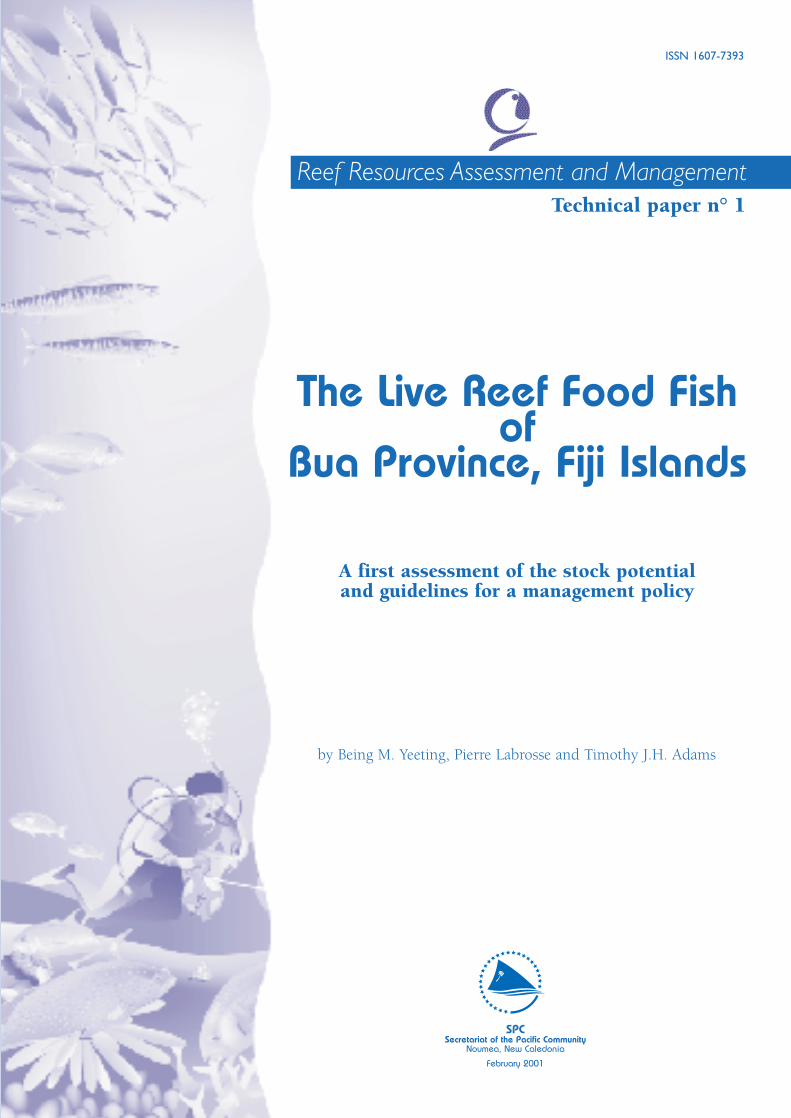
Reef Resources Assessment and ManagementTechnical paper n° 1
SPCSecretariat of the Pacific Community
Noumea, New Caledonia
February 2001
The Live Reef Food Fish of
Bua Province, Fiji Islands
A first assessment of the stock potential and guidelines for a management policy
by Being M. Yeeting, Pierre Labrosse and Timothy J.H. Adams
ISSN 1607-7393
The Live Reef Food Fish of
Bua Province, Fiji IslandsA first assessment of the stock potentialand guidelines for a management policy
ISSN 1607-7393
Reef Resources Assessment and Management
by Being M. Yeeting, Pierre Labrosse and Timothy J.H. Adams
Secretariat of the Pacific CommunityNOUMEA
NEW CALEDONIAFebruary 2001
Technical Paper no.1
ii
©Copyright Secretariat of the Pacific Community 2001
Original edition: English
Secretariat of the Pacific Community Cataloguing-in-publication data
The live reef foodfish of Bua Province, Fiji Islands: a first assessment of the stock potential andguidelines for a management policy/Being Yeeting, Pierre Labrosse & Timothy J.H. Adams.
(Reef Resources and Management Technical Paper/Secretariat of the Pacific Community; 1)
1. Coral reef fishes – Fiji. 2. Marine Resources development – Fiji. 3. Fish populations – Fiji. 4.Fisheries Management – Fiji1. Title 2. Secretariat of the Pacific Community 3. Series 4. Labrosse, Pierre 5. Adams Timothy J.H.
639.2099611 AACR2
ISBN 982-203-760.0ISSN 1607-7393
Prepared for publication and printed at SPC Headquarters, Noumea, New Caledonia, 2001Fish illustrations on page 4 were reproduced from the FAO Species Catalogues
Page
TABLES v
FIGURES vi
ABBREVIATIONS vii
ACKNOWLEDGMENTS ix
EXECUTIVE SUMMARY xi
RÉSUMÉ xiii
INTRODUCTION 1Background 1Fiji fisheries legislation 2The LRF operation target area, Bua Province 3The live reef fish company and its plan 3Target species 4
OBJECTIVES AND TERMS OF REFERENCE 5
METHOD 6Field methods 6
Informal interviews 6Field surveys 6
Underwater visual census (UVC) 6Line intercept transects 7
The sampling design 8
RESULTS 9Fishing activities 9Fish sales (local retailing) 9Spawning aggregations and sites 10Underwater visual census (fish transects) 11
Numbers of fish seen 11Mean lengths and weights of main species 12Fish density, biomass and stocks 13Coral cover 14
CONTENTS
iii

iv
FINDINGS AND RECOMMENDATIONS 15General findings 15Proposed management policy guidelines 16The licence agreement 17The monitoring programme 18
Data collection programme 18Resource assessment 19
REFERENCES 20
APPENDICES 23
Page
1 Spawning periods and sites obtained from fishermen interviewed 10
2 LRFF species seen on the transects 11
3 Overall mean density and biomass of selected species for the total Bua Province fishing area 13
4 Densities and biomass of Plectropomus areolatus on the inner reefs and the barrier reefs 14
TABLES
v
vi
Page
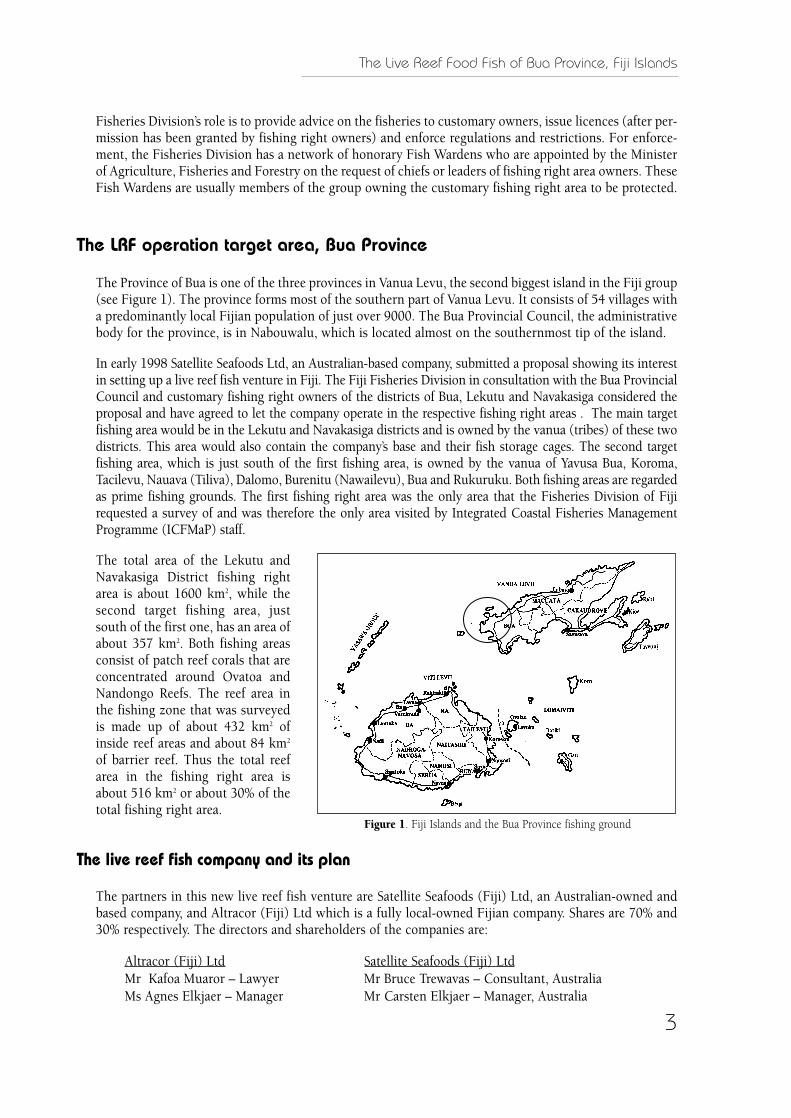
1 Fiji Islands and the Bua Province fishing ground 3
2 The main important LRFF species for Fiji 4
3 The sampling stations 8
4a The sampling design to estimate and compare density and biomass of LRFF species on barrier and inner reef areas of the Bua fishing area 8
4b The sampling design to estimate and compare density and biomass of LRFF species in deep and shallow reef areas of the Bua fishing area 9
5 Possible spawning aggregation areas 11
6 The a) mean lengths and b) mean weights of three LRFF species on the barrier and inner reef areas of Bua 12
7 Length frequency distributions of Plectropomus areolatuson the inner and barrier reefs of Bua 12
8 Mean length of LRFF species from the deep and shallow stations in Bua 13
9 Bottom type of inner reef stations and barrier reef stations in Bua 14
FIGURES
SPC Secretariat of the Pacific CommunityCDF Commodity Development FrameworkLRF Live reef fishLRFF Live reef food fishTNC The Nature ConservancyPNG Papua New GuineaICFMaP Integrated Coastal Fisheries Management Programme TORs Terms of ReferenceUVC Underwater visual census
ABBREVIATIONS
vii

ix
I would like to express a big thank you to the Fiji Fisheries Division for all the assistan-ce and support they provided on my field trips to Fiji to conduct the study. I owe spe-cial thanks to the Live Reef Fish Project officer, Indar Dev Raj, and the Manager ofInshore Fishery, Apolosi Turaganivalu, for arranging logistics; Apisai Sesewa for hisassistance in the diving work; the senior officers, Malakai Tuiloa and Esaroma Ledua, theDirector, Maciu Lagibalavu, and Iliavi Tuwai, Fisheries Officer, for their comments andsupport. I am also grateful to Tevita Bukabuka of Galoa Island and his family for theirhospitality during our stay with them on Galoa, and the two local UVC trainees, PenioniBolatini and Veresa Taqasi, for their enthusiasm to work with us. Without your help, wewould not have completed the work in the given short time.
Thank you.
Being M. Yeeting
Copies of the MOU and data collection forms are available upon request from:The Reef Fishery Assessment and Management Section,
Coastal Fisheries Programme,Secretariat of the Pacific Community,
Noumea, New Caledonia.(contact: http://www.spc.int, e-mail: [email protected], or fax: 687 263 818)
ACKNOWLEDGMENTS

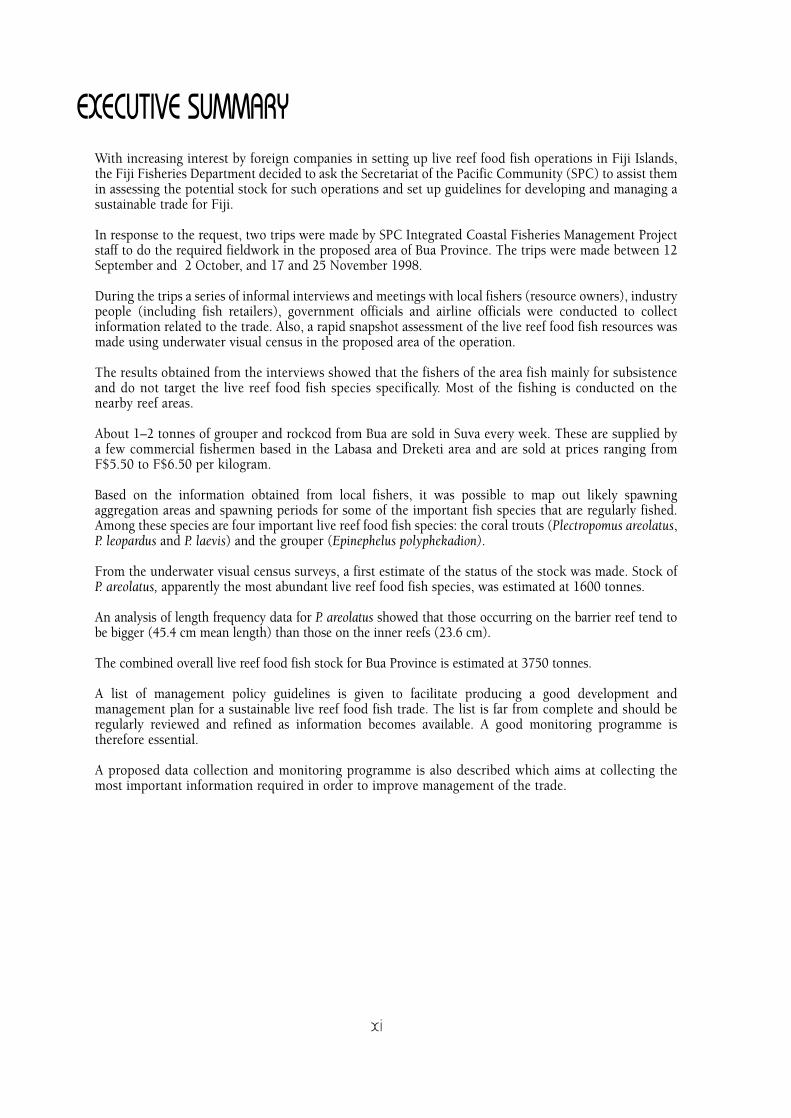
With increasing interest by foreign companies in setting up live reef food fish operations in Fiji Islands,the Fiji Fisheries Department decided to ask the Secretariat of the Pacific Community (SPC) to assist themin assessing the potential stock for such operations and set up guidelines for developing and managing asustainable trade for Fiji.
In response to the request, two trips were made by SPC Integrated Coastal Fisheries Management Projectstaff to do the required fieldwork in the proposed area of Bua Province. The trips were made between 12September and 2 October, and 17 and 25 November 1998.
During the trips a series of informal interviews and meetings with local fishers (resource owners), industrypeople (including fish retailers), government officials and airline officials were conducted to collectinformation related to the trade. Also, a rapid snapshot assessment of the live reef food fish resources wasmade using underwater visual census in the proposed area of the operation.
The results obtained from the interviews showed that the fishers of the area fish mainly for subsistenceand do not target the live reef food fish species specifically. Most of the fishing is conducted on thenearby reef areas.
About 1–2 tonnes of grouper and rockcod from Bua are sold in Suva every week. These are supplied bya few commercial fishermen based in the Labasa and Dreketi area and are sold at prices ranging fromF$5.50 to F$6.50 per kilogram.
Based on the information obtained from local fishers, it was possible to map out likely spawningaggregation areas and spawning periods for some of the important fish species that are regularly fished.Among these species are four important live reef food fish species: the coral trouts (Plectropomus areolatus,P. leopardus and P. laevis) and the grouper (Epinephelus polyphekadion).
From the underwater visual census surveys, a first estimate of the status of the stock was made. Stock ofP. areolatus, apparently the most abundant live reef food fish species, was estimated at 1600 tonnes.
An analysis of length frequency data for P. areolatus showed that those occurring on the barrier reef tend tobe bigger (45.4 cm mean length) than those on the inner reefs (23.6 cm).
The combined overall live reef food fish stock for Bua Province is estimated at 3750 tonnes.
A list of management policy guidelines is given to facilitate producing a good development andmanagement plan for a sustainable live reef food fish trade. The list is far from complete and should beregularly reviewed and refined as information becomes available. A good monitoring programme istherefore essential.
A proposed data collection and monitoring programme is also described which aims at collecting themost important information required in order to improve management of the trade.
EXECUTIVE SUMMARY
xi

RÉSUMÉ
xiii
Devant l’intérêt croissant manifesté par des entreprises étrangères pour le lancement aux Îles Fidji de lapêche de poissons de récif vivants destinés à la restauration, le ministère des Pêches fidjien a demandé auSecrétariat général de la Communauté du Pacifique (CPS) de l’aider à évaluer le potentiel d’exploitationdu stock et à établir des directives en vue de la création et de la gestion d’un commerce durable pour Fidji.
En réponse à cette demande, les agents de la CPS affectés au Projet de gestion intégrée des ressourcescôtières se sont rendus sur place, dans la province de Bua, pour effectuer deux missions d’enquête du 12septembre au 2 octobre et du 17 au 25 novembre 1998.
Au cours de ces missions, ils se sont entretenus de façon informelle avec des pêcheurs locaux (proprié-taires de la ressource), des professionnels (notamment des marchands de poissons), des fonctionnaires etdes représentants des compagnies aériennes, afin de recueillir des informations sur cette filière. Ils ontfait aussi une évaluation rapide des ressources en poissons de récif vivants par comptage visuel sous-marin, dans la zone d’exploitation proposée.
D’après les renseignements recueillis au cours de ces entrevues, les pêcheurs de cette zone pratiquentsurtout une pêche vivrière et ne ciblent pas particulièrement les espèces de poissons de récif vivants pourla restauration. Les efforts de pêche se concentrent dans les zones récifales voisines.
Une à deux tonnes de loches et de mérous de Bua sont vendues chaque semaine à Suva. Elles sontfournies par quelques pêcheurs commerciaux de la région de Labasa et de Dreketi, et se vendent entre5,50 et 6,50 dollars fidjiens le kilo.
Grâce aux renseignements obtenus auprès de pêcheurs locaux, il a été possible de déterminer les zonesprobables de concentration de reproducteurs et les saisons de frai de certaines des espèces intéressantes quisont régulièrement pêchées. Parmi elles figurent quatre espèces prisées par les restaurateurs : les saumonées(Plectropomus areolatus, P. leopardus et P. laevis) et la loche crasseuse (Epinephelus polyphekadion).
Une première estimation de l’état du stock a pu être faite d’après les comptages visuels sous-marins. Lestock de P. areolatus, apparemment l’espèce la plus abondante de poissons de récif réclamés par la filière,a été estimé à 1600 tonnes.
D’après l’analyse des données sur les fréquences de taille de P. areolatus, les saumonées présentes sur labarrière récifale sont généralement plus grandes (45,4 cm de longueur moyenne) que celles évoluant àproximité des pâtés coralliens du lagon (23,6 cm).
L’ensemble du stock de poissons de récif vivants de la province de Bua est estimé à 3750 t.
Il a été remis une liste de principes d’une bonne politique de gestion afin de faciliter l’élaboration d’un plande développement et de gestion propre à assurer un commerce durable de poissons de récif vivants. Cetteliste est loin d’être exhaustive et devra être régulièrement revue et affinée au fur et à mesure que l’on ensaura davantage sur la ressource. Il est donc essentiel de disposer d’un programme d’observation fiable.
Il est aussi proposé un système de collecte de données et de surveillance des prises qui permettra derecueillir les principales données requises pour améliorer la gestion de ce commerce.

The Live Reef Food Fish of Bua Province, Fiji Islands
Introduction
Background
All fish-eating communities would unquestionably agree that the best quality and best tasting fish arethose you eat almost straight after catching them. Presumably, this was also the observation of the foodconscious Chinese, resulting in the extreme form of keeping fish alive until moments before cooking it.Such popular custom in China saw the birth of the live fish trade, which was traditionally limited tocultured freshwater and marine species caught in local waters but has now expanded to wild caughtmarine fish as the preferred species.
In Hong Kong, with its increasing wealthy population, the demand has been ever increasing. As stocksfrom Chinese sources became depleted, live fish operators began to extend their activities outwards tomore remote and isolated reefs and islands. First into the neighboring Asian countries and then into thePacific, starting with Palau in the mid-1980s, then Papua New Guinea (PNG), Solomon Islands, MarshallIslands, Kiribati and recently Fiji.
With the high prices the Asian markets are willing to pay, live reef fish trade is becoming an increasinglyattractive venture for the Pacific countries and territories. It is very much seen as an opportunity to addvalue to and maximise returns from their marine resources. Unfortunately the evidence from Asiadocumented in Johannes and Riepen (1995) has brought up cause for concern. One of the major concernswas the use of cyanide to stun targeted fish species in order to facilitate capturing them. Johannes andRiepen gave a detailed description of this method in their report:
… a diver chases a large fish into one of the holes in the coral reef below him. Armed with aquart-sized plastic bottle, he squirts a milky fluid (sodium cyanide) into the hole. He awaits acouple of minutes, then rips away the live coral from around the hole. As he works, small fisharound him gradually lose their equilibrium, swim in crazy loops, then sink, quivering to thebottom.
The diver pushes his way into the hole and, after a minute or so, emerges with his quarry, nowstunned by the milky fluid. He forces a large hook attached to a rope through the fish’s thicklips, tows it to the surface, and drops it into a tank of seawater in a waiting skiff.
Cyanide fishing, as it is commonly called, has been shown to kill not only small fish species but alsocoral as described in a 1997 study on the effects of cyanide on corals conducted at One-Tree Island byRoss Jones. In areas where cyanide has been used it leaves a trail of dead barren corals. It has thereforebeen labeled as a destructive fishing method and has been banned. Unfortunately, with the highdemand and prices for live reef fish in the Hong Kong market, some companies are still using it inorder to increase catches. Pacific Island nations with little experience or awareness of this destructivefishing method are in danger of entering what appears to be an attractive trade and doing harm to theirreef resources. In addition the lack of management policies, regulations and legislation to address thetrade has made them potential targets for greedy operators who only want to make money and givelittle consideration to long-term sustainability of the resource. Such has been the case in the recent pastand despite the warnings and available information documenting the dangers of the trade provided byregional and environmental organisations (FFA, SPC, TNC etc.), some Pacific countries have stillopted to go into the trade without precautionary measures set in place.
1
The Live Reef Food Fish of Bua Province, Fiji Islands
2
In the late 1990s Fiji got into the live reef food fish (LRFF) trade. With interest shown by some overseasLRFF companies it was identified as a potential income-generating project by the Fiji FisheriesDepartment under their Commodity Development Framework (CDF) programme in 1998. Withpreliminary arrangements being negotiated for one overseas LRFF operator to start, Fiji, unlike the othercountries in the Pacific, has taken a very wise move by seriously looking at the management andregulatory issues relating to this fishery based on experiences and lessons learned from other countries.The primary aim is to set up an LRFF industry that is sustainable in the long term. The Fiji Fisheriestherefore decided that the first step was to know about the potential and the extent of their LRFF resourceand to set up a management structure in the form of policies, regulations and legislation for the trade.
In August of 1998, the Secretariat of the Pacific Community (SPC) received a letter of request for assistancefrom the Ministry of Foreign Affairs and External Trade in Fiji on behalf of the Fiji Fisheries Department.The request was for assistance in setting up guidelines for a live reef fish trade management policy for theBua Province of Vanua Levu, which has been allocated as the first area for a live reef fish operation.
In order to provide realistic and practical management guidelines, we felt that: (1) some understanding ofthe current legislation pertaining to the ownership and use rights of fisheries resources was required; (2)a general view of the importance of the fisheries resources to the local community should also beconsidered; and (3) information relating directly to the fisheries resources should be acquired both fromlocal fishermen and from independent surveys.
The limitations of such a short study must be understood. The methods employed are ‘quick and dirty’,with the aim of providing a snapshot view of the fisheries resource present especially in a fishery whereno previous information has been recorded. The results should therefore be taken as preliminary estimatesto be refined as more information becomes available. To this effect, a monitoring programme is importantfor the fisheries to provide the needed information for better management of the resources in the future.A recommended monitoring programme is outlined in this report.
Fiji fisheries legislation
Management of the live reef fish trade would require some forms of regulative measure and legislation toensure long-term sustainability. The laws relating to Fiji’s marine resources can be found in Chapters 158,158A and 149 in the Laws of Fiji. These have been summarised and discussed by Richards et al. (1994)and Fong (1994). For the purpose of this study we shall look at the laws that set the basis for customaryfishing areas and how these laws are put into practice.
The laws relating to the marine resources of Fiji are cited as the Fisheries Act which makes provision forthe regulation of fishing. The Fisheries Act recognises Fijian people’s customary right to fish in traditionalfishing grounds (qoliqoli), which are generally from the outer edge of the reef to the shore. All Fijians havethe right to fish in their qoliqoli for their own consumption. The Act also allows Fijians to decide whichcommercial fishermen shall be allowed to fish in their fishing right areas and to impose restrictions onthem. Access for commercial fishers to fish in the fishing right areas is often granted on payment of a feeto the customary owners.
The customary fishing rights law is administered jointly by the Native Lands and Fisheries Commission,Provincial Councils and Fisheries Division. The Native Lands and Fisheries Commission is responsible forsettling and marking out boundaries of fishing areas while Provincial Councils decide, in consultation withthe customary fishing right owners, which commercial fishers will be allowed to fish in the customary areas.
The Live Reef Food Fish of Bua Province, Fiji Islands
Fisheries Division’s role is to provide advice on the fisheries to customary owners, issue licences (after per-mission has been granted by fishing right owners) and enforce regulations and restrictions. For enforce-ment, the Fisheries Division has a network of honorary Fish Wardens who are appointed by the Ministerof Agriculture, Fisheries and Forestry on the request of chiefs or leaders of fishing right area owners. TheseFish Wardens are usually members of the group owning the customary fishing right area to be protected.
The LRF operation target area, Bua Province
The Province of Bua is one of the three provinces in Vanua Levu, the second biggest island in the Fiji group(see Figure 1). The province forms most of the southern part of Vanua Levu. It consists of 54 villages witha predominantly local Fijian population of just over 9000. The Bua Provincial Council, the administrativebody for the province, is in Nabouwalu, which is located almost on the southernmost tip of the island.
In early 1998 Satellite Seafoods Ltd, an Australian-based company, submitted a proposal showing its interestin setting up a live reef fish venture in Fiji. The Fiji Fisheries Division in consultation with the Bua ProvincialCouncil and customary fishing right owners of the districts of Bua, Lekutu and Navakasiga considered theproposal and have agreed to let the company operate in the respective fishing right areas . The main targetfishing area would be in the Lekutu and Navakasiga districts and is owned by the vanua (tribes) of these twodistricts. This area would also contain the company’s base and their fish storage cages. The second targetfishing area, which is just south of the first fishing area, is owned by the vanua of Yavusa Bua, Koroma,Tacilevu, Nauava (Tiliva), Dalomo, Burenitu (Nawailevu), Bua and Rukuruku. Both fishing areas are regardedas prime fishing grounds. The first fishing right area was the only area that the Fisheries Division of Fijirequested a survey of and was therefore the only area visited by Integrated Coastal Fisheries ManagementProgramme (ICFMaP) staff.
The total area of the Lekutu andNavakasiga District fishing rightarea is about 1600 km2, while thesecond target fishing area, justsouth of the first one, has an area ofabout 357 km2. Both fishing areasconsist of patch reef corals that areconcentrated around Ovatoa andNandongo Reefs. The reef area inthe fishing zone that was surveyedis made up of about 432 km2 ofinside reef areas and about 84 km2
of barrier reef. Thus the total reefarea in the fishing right area isabout 516 km2 or about 30% of thetotal fishing right area.
The live reef fish company and its plan
The partners in this new live reef fish venture are Satellite Seafoods (Fiji) Ltd, an Australian-owned andbased company, and Altracor (Fiji) Ltd which is a fully local-owned Fijian company. Shares are 70% and30% respectively. The directors and shareholders of the companies are:
Altracor (Fiji) Ltd Satellite Seafoods (Fiji) LtdMr Kafoa Muaror – Lawyer Mr Bruce Trewavas – Consultant, AustraliaMs Agnes Elkjaer – Manager Mr Carsten Elkjaer – Manager, Australia
3
Figure 1. Fiji Islands and the Bua Province fishing ground
The Live Reef Food Fish of Bua Province, Fiji Islands
4
The company plans to use local fishermen and their existing boats for catching fish, and will provideassistance in modifying boats and training fishermen to catch and maintain the fish alive. The companywill set up about 20–25 fish cages, of 4 m x 4 m x 6 m (depth), each with a capacity of 500 kg of live fish.A live fish transport vessel (F/V Crested Tern) capable of holding up to 4 tonnes of live fish, would bebrought in from Australia to collect the live fish from the fish cages and transport it to a main holdingfacility in Vanua Levu. The live fish would then be shipped overseas using a live fish carrier vessel. YongShing Fishery Co., based in Hong Kong, has already met with the company representatives to indicate itsinterest in transporting the fish on its vessel Yong Sheng Lai 18. The company is hoping to export aminimum of 10 tonnes of live fish each shipment, which will include coral trout species, groupers, rockcods and the humphead wrasse.
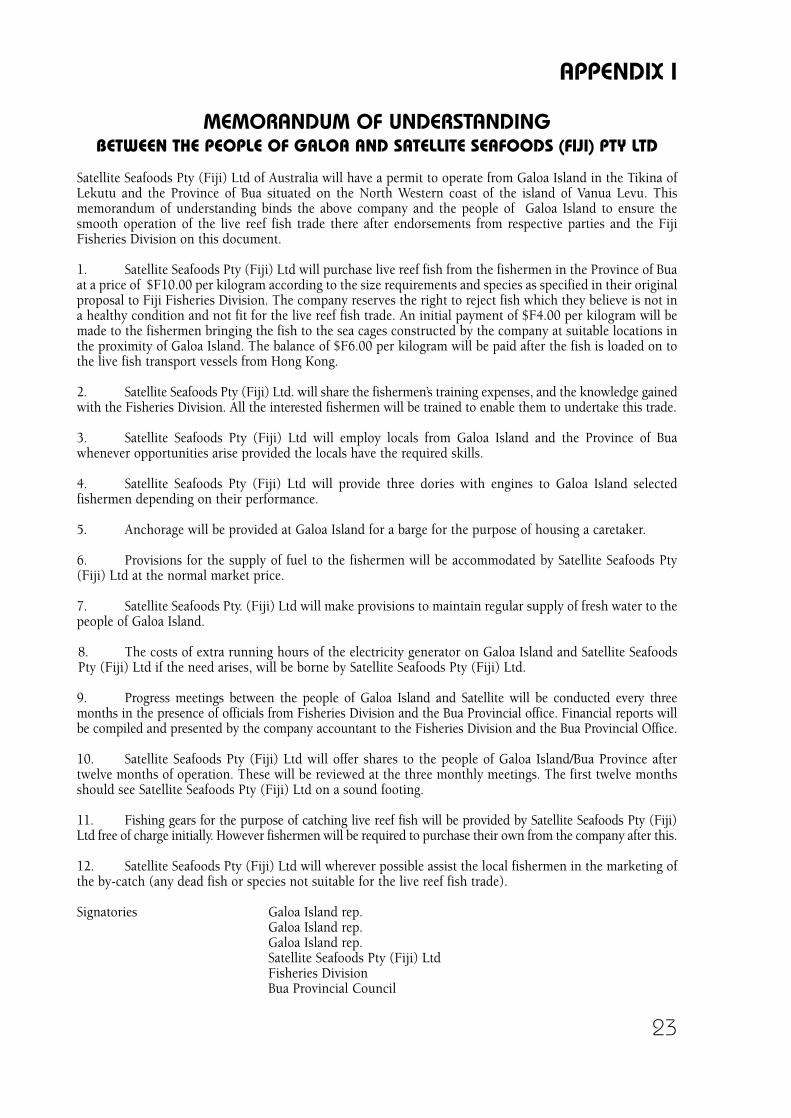
A memorandum of understanding between the people of Galoa in the District of Lekutu and SatelliteSeafoods (Fiji) Ltd has been drawn up. This outlines the payment procedures, training and otherassistance that the company will provide and what the people of Galoa are required to do (Appendix 1).
Target species
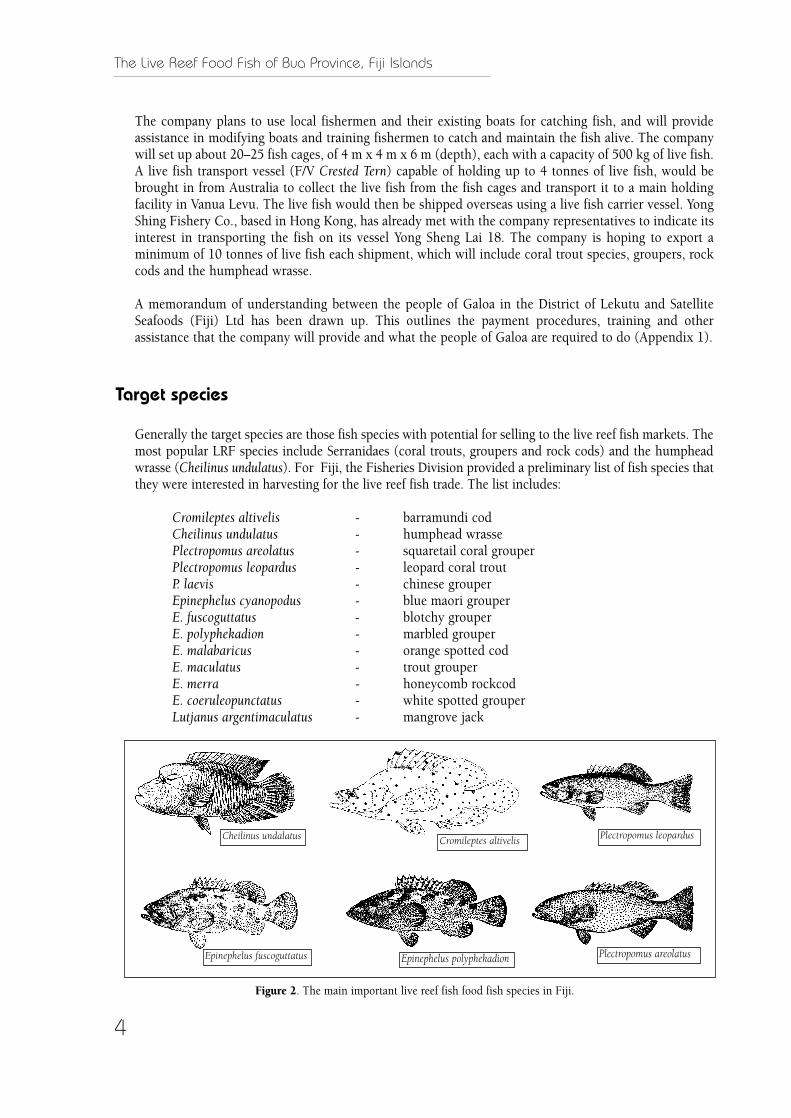
Generally the target species are those fish species with potential for selling to the live reef fish markets. Themost popular LRF species include Serranidaes (coral trouts, groupers and rock cods) and the humpheadwrasse (Cheilinus undulatus). For Fiji, the Fisheries Division provided a preliminary list of fish species thatthey were interested in harvesting for the live reef fish trade. The list includes:
Cromileptes altivelis - barramundi cod Cheilinus undulatus - humphead wrassePlectropomus areolatus - squaretail coral grouperPlectropomus leopardus - leopard coral troutP. laevis - chinese grouperEpinephelus cyanopodus - blue maori grouperE. fuscoguttatus - blotchy grouperE. polyphekadion - marbled grouperE. malabaricus - orange spotted codE. maculatus - trout grouperE. merra - honeycomb rockcodE. coeruleopunctatus - white spotted grouperLutjanus argentimaculatus - mangrove jack
Cheilinus undalatus Cromileptes altivelis
Epinephelus fuscoguttatus Epinephelus polyphekadion Plectropomus areolatus
Plectropomus leopardus
Figure 2. The main important live reef fish food fish species in Fiji.
The Live Reef Food Fish of Bua Province, Fiji Islands
OBJECTIVES AND TERMS OF REFERENCE
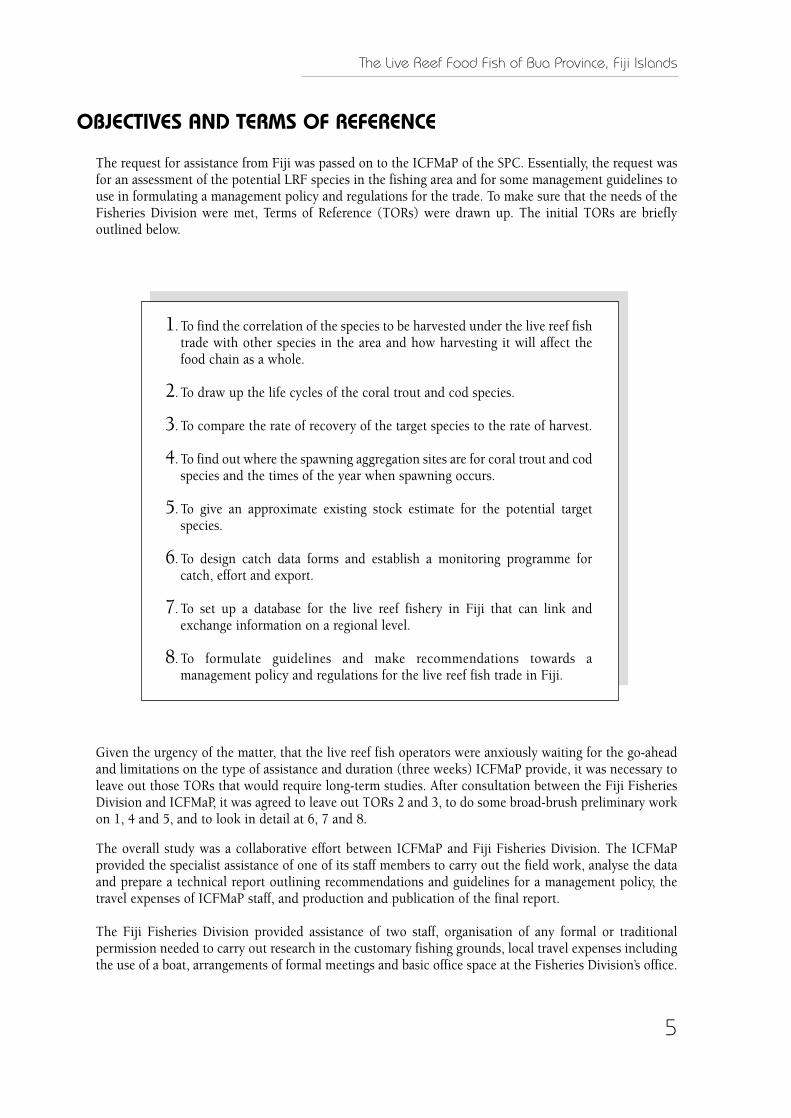
The request for assistance from Fiji was passed on to the ICFMaP of the SPC. Essentially, the request wasfor an assessment of the potential LRF species in the fishing area and for some management guidelines touse in formulating a management policy and regulations for the trade. To make sure that the needs of theFisheries Division were met, Terms of Reference (TORs) were drawn up. The initial TORs are brieflyoutlined below.
1. To find the correlation of the species to be harvested under the live reef fishtrade with other species in the area and how harvesting it will affect thefood chain as a whole.
2. To draw up the life cycles of the coral trout and cod species.
3. To compare the rate of recovery of the target species to the rate of harvest.
4. To find out where the spawning aggregation sites are for coral trout and codspecies and the times of the year when spawning occurs.
5. To give an approximate existing stock estimate for the potential targetspecies.
6. To design catch data forms and establish a monitoring programme forcatch, effort and export.
7. To set up a database for the live reef fishery in Fiji that can link andexchange information on a regional level.
8. To formulate guidelines and make recommendations towards amanagement policy and regulations for the live reef fish trade in Fiji.
Given the urgency of the matter, that the live reef fish operators were anxiously waiting for the go-aheadand limitations on the type of assistance and duration (three weeks) ICFMaP provide, it was necessary toleave out those TORs that would require long-term studies. After consultation between the Fiji FisheriesDivision and ICFMaP, it was agreed to leave out TORs 2 and 3, to do some broad-brush preliminary workon 1, 4 and 5, and to look in detail at 6, 7 and 8.
The overall study was a collaborative effort between ICFMaP and Fiji Fisheries Division. The ICFMaPprovided the specialist assistance of one of its staff members to carry out the field work, analyse the dataand prepare a technical report outlining recommendations and guidelines for a management policy, thetravel expenses of ICFMaP staff, and production and publication of the final report.
The Fiji Fisheries Division provided assistance of two staff, organisation of any formal or traditionalpermission needed to carry out research in the customary fishing grounds, local travel expenses includingthe use of a boat, arrangements of formal meetings and basic office space at the Fisheries Division’s office.
5
The Live Reef Food Fish of Bua Province, Fiji Islands
6
METHOD
Field methods
A visit was made to the Bua fishing area from 12 September to 2 October and then from 17 to 25November 1998 to complete all the required fieldwork. The fieldwork conducted in the target area inclu-ded informal interviews with local fishermen in the area and fish retailers in Suva and fish surveys usingunderwater visual census (UVC).
Informal interviews
The usefulness of traditional information obtained from local fishermen in guiding fisheries research hasbeen demonstrated by several researchers (Johannes 1981, 1987; Ruddle et al. 1992). The lack of baseli-ne information on fishing activities in the Bua Province therefore made it appropriate to conduct informalinterviews, to collect basic local information that could be useful in the preliminary assessment of the livereef fish potential.
Fishermen from two villages (Galoa and Tavea) in the Bua Province were interviewed on an informal basiswith the help of the local fisheries project officer who acted as a translator. Fishermen were asked basicquestions relating to fishing activities, fishing seasons, spawning seasons and spawning grounds for diffe-rent species but with emphasis on the live reef fish target species. Questions were chosen carefully in ordernot to lead fishermen. Maps and fish charts were used as much as possible to facilitate locating fishinggrounds and to make sure the correct species were talked about.
In addition to the interviews with local fishermen, fish shops in Suva were also visited and the managers orowners were interviewed in order to get an idea of the importance and value of the LRF target species on thelocal market. Particular attention was paid to those fish dealers purchasing fish from the Bua Province.
A list of the standard questions asked of fishermen and fish dealers is given in Appendix II.
Field surveys
Underwater visual census (UVC)
UVC is an inexpensive technique for providing rapid estimates of relative abundance, biomass and leng-th frequency distributions of reef fish. It involves the counting and estimation of fish sizes observedunderwater by divers on a given transect. It has been used extensively in reef fish studies of populationdynamics, ecology and management (Thresher and Gunn 1986; Cappo and Brown 1996) as well as in stu-dies to describe the effects of fishing on shallow water demersal reef fish (Russ 1985; Kulbicki 1988;Samoilys 1988; Russ and Alcala 1989; Ayling and Ayling 1992; Watson and Ormond 1994; Samoilys et al.1995; Jennings and Polunin 1996). Samoilys (1992) and Samoilys and Carlos (1992) discuss the advan-tages and disadvantages of this method.
In this study the method was chosen because it enabled us to get a rapid assessment of the area in thelimited time available, it was non-destructive and it was simple to use, requiring a minimum of manpo-wer and simple equipment. Because of this simplicity the Fiji Fisheries could use the method to resurveythe area to monitor the fisheries through time.
For the study 50 m x 5 m strip transects were used. Sampling stations were selected randomly in both theinner reef and barrier reef areas but with sampling designed to look at the effects of depth (less than orequal to 10 m = shallow; greater than 10 m = deep) in both reef areas.
The Live Reef Food Fish of Bua Province, Fiji Islands
Densities and mean length of fish were estimated from the UVC surveys. From these biomasses were thencalculated using length–weight relationships for the same species in New Caledonia (Letourneur et al.1998). Where no such relationship existed, then the one for the closest species was used. Stocks were thenestimated for the reef areas.
The accuracy of visual underwater fish size estimation is of great importance. It has been shown that suchestimates can be improved with practice (QDPI; 1995; Samoilys (ed.) 1997). Time was therefore spent onpractice trials.
An array of fish models of known sizes were tied on a string and placed underwater. Observers were thenasked to estimate the sizes and compare their estimates with the actual known lengths. The exercisewas repeated until each diver’s estimates were consistently close to the known sizes. The exercise wascompulsory for all observers who would be estimating fish sizes underwater.
With estimated mean sizes of the different targeted species known from the surveys, estimated meanweights (W) in grams of fish were calculated from the length–weight relationship:
W = aLb (1
L is the length in centimetres of fish from the transects and the values of a and b are estimated by ordinaryleast squares regression through a log transformation of the above equation to get the linear relationship:
Ln W = ln a + b ln L (2
Published values of a and b for the same species (or, where not available, the closest relation, mainlyderived from New Caledonia) were used. (Letourneur et al. 1998). With values of W known and densitiescalculated from the transects, it was possible to calculate the mean biomass (B) standardised to kg/1000m2
for the different target species observed by using the relationship:
B = DW (3
where D = density = number of fish per 1000 m2
From the biomass estimates above, first estimates of the stock of each species for the area surveyed canbe calculated from the equation:
S = Ba where B = biomass a = total reef area in the fishing right area
Line intercept transects
To measure coral cover, a line intercept transect technique similar to that described by English et al.(1994) was used. A 20 m line intercept transect was done along with the 50 m fish transects to get an ideaof bottom coral cover in the transect stations.
Substrate categorisation also followed that described in the English et al. (1994) survey manual wherecorals are grouped simply into acropora or non-acropora as either branching, encrusting, digitate,massive, submassive or tabulate and soft corals.
7
The Live Reef Food Fish of Bua Province, Fiji Islands
8
The densities of adult fish have beencorrelated with reef-habitat characteristicssuch as height (Thresher 1983), size (Warnerand Hoffman 1980), depth (Thresher 1983)and coral cover (Bell and Galzin 1984; Bell etal. 1985) to name a few. Depth and coralcover were therefore considered in thesampling design to measure their effects onthe distribution and density of the targetedfish species in the fishing area. The depthmargin chosen was 10 metres, thus all areassurveyed shallower or equal to 10 metres areregarded as the shallow sites and thosedeeper than 10 metres are the deep sites. Ofthe eight inner reef stations, four wereconsidered deep and four were shallow. Inthe barrier reef stations, three were deep andtwo were shallow. This gave us seven deepstations and six shallow stations.
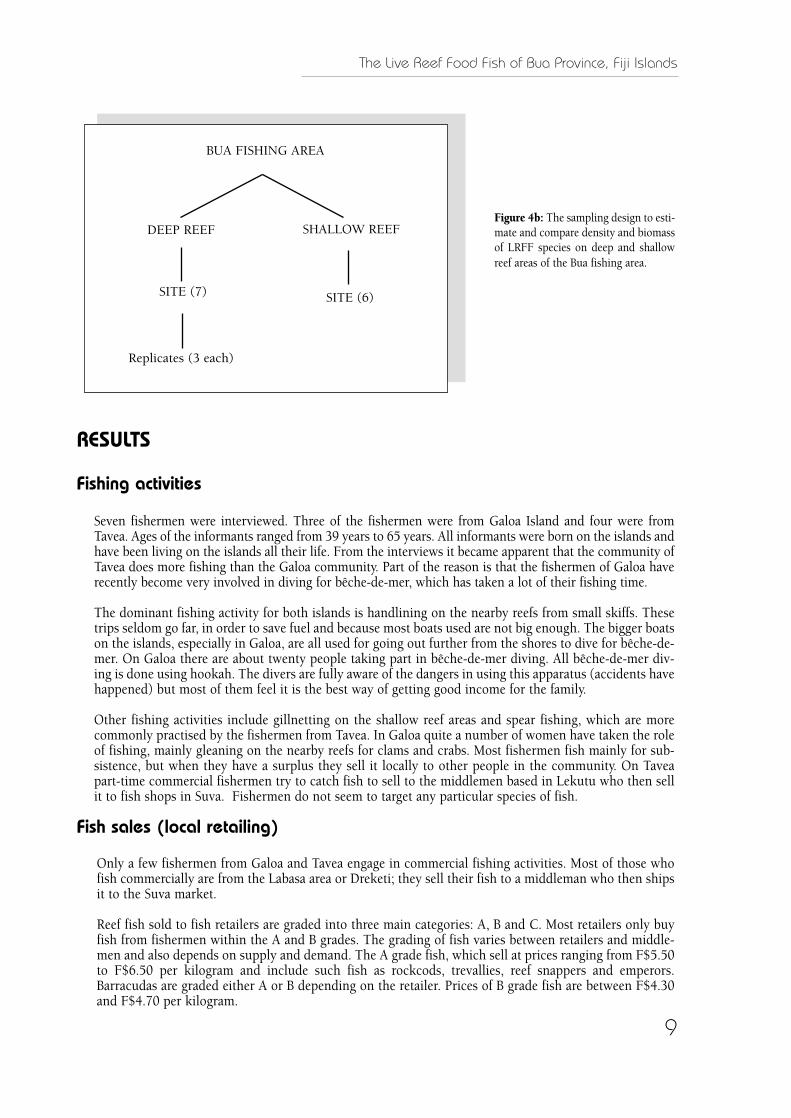
The study therefore considered two mainsampling designs. The first design (Figure 4a)aimed to estimate and compare the densitiesof important LRFF species on the barrier reefarea and the inner reef area and the seconddesign (Figure 4b) aimed to estimate stocksin shallow and deep reef areas.
The sampling design
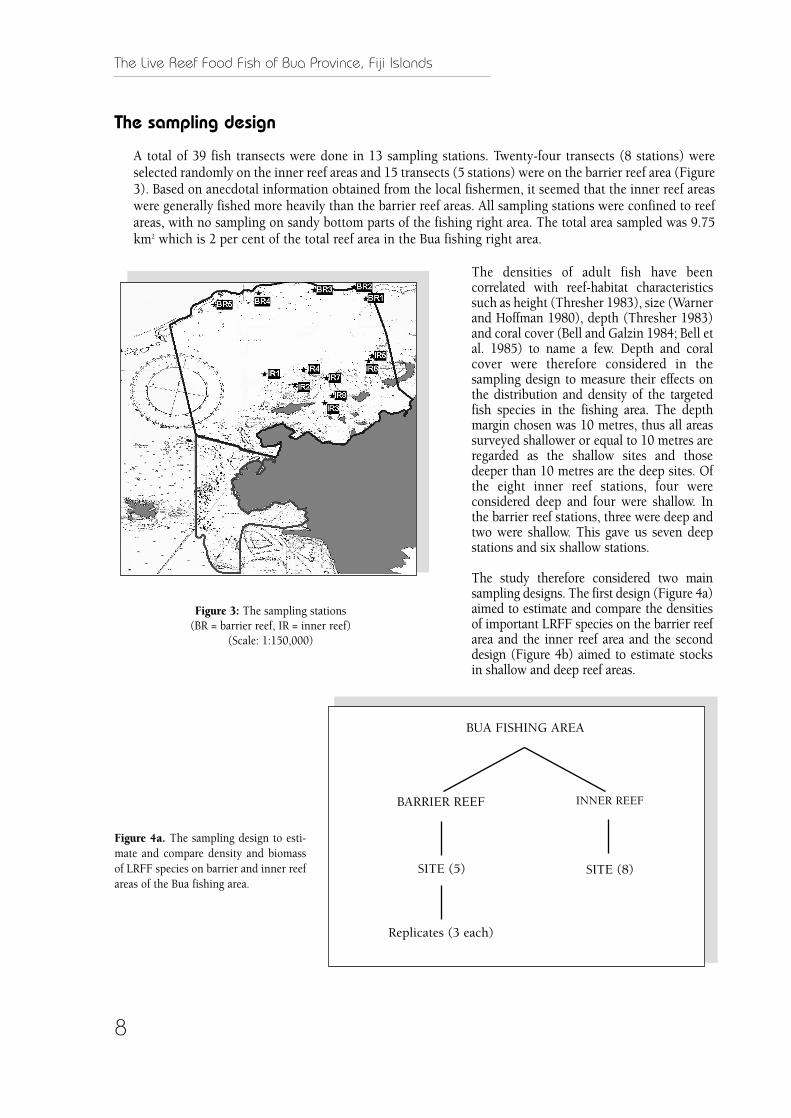
A total of 39 fish transects were done in 13 sampling stations. Twenty-four transects (8 stations) wereselected randomly on the inner reef areas and 15 transects (5 stations) were on the barrier reef area (Figure3). Based on anecdotal information obtained from the local fishermen, it seemed that the inner reef areaswere generally fished more heavily than the barrier reef areas. All sampling stations were confined to reefareas, with no sampling on sandy bottom parts of the fishing right area. The total area sampled was 9.75km2 which is 2 per cent of the total reef area in the Bua fishing right area.
Figure 3: The sampling stations (BR = barrier reef, IR = inner reef)
(Scale: 1:150,000)
BUA FISHING AREA
BARRIER REEF
SITE (5)
INNER REEF
SITE (8)
Replicates (3 each)
Figure 4a. The sampling design to esti-mate and compare density and biomassof LRFF species on barrier and inner reefareas of the Bua fishing area.
The Live Reef Food Fish of Bua Province, Fiji Islands
BUA FISHING AREA
DEEP REEF
SITE (7)
SHALLOW REEF
SITE (6)
Replicates (3 each)
Figure 4b: The sampling design to esti-mate and compare density and biomassof LRFF species on deep and shallowreef areas of the Bua fishing area.
RESULTS
Fishing activities
Seven fishermen were interviewed. Three of the fishermen were from Galoa Island and four were fromTavea. Ages of the informants ranged from 39 years to 65 years. All informants were born on the islands andhave been living on the islands all their life. From the interviews it became apparent that the community ofTavea does more fishing than the Galoa community. Part of the reason is that the fishermen of Galoa haverecently become very involved in diving for bêche-de-mer, which has taken a lot of their fishing time.
The dominant fishing activity for both islands is handlining on the nearby reefs from small skiffs. Thesetrips seldom go far, in order to save fuel and because most boats used are not big enough. The bigger boatson the islands, especially in Galoa, are all used for going out further from the shores to dive for bêche-de-mer. On Galoa there are about twenty people taking part in bêche-de-mer diving. All bêche-de-mer div-ing is done using hookah. The divers are fully aware of the dangers in using this apparatus (accidents havehappened) but most of them feel it is the best way of getting good income for the family.
Other fishing activities include gillnetting on the shallow reef areas and spear fishing, which are morecommonly practised by the fishermen from Tavea. In Galoa quite a number of women have taken the roleof fishing, mainly gleaning on the nearby reefs for clams and crabs. Most fishermen fish mainly for sub-sistence, but when they have a surplus they sell it locally to other people in the community. On Taveapart-time commercial fishermen try to catch fish to sell to the middlemen based in Lekutu who then sellit to fish shops in Suva. Fishermen do not seem to target any particular species of fish.
Fish sales (local retailing)
Only a few fishermen from Galoa and Tavea engage in commercial fishing activities. Most of those whofish commercially are from the Labasa area or Dreketi; they sell their fish to a middleman who then shipsit to the Suva market.
Reef fish sold to fish retailers are graded into three main categories: A, B and C. Most retailers only buyfish from fishermen within the A and B grades. The grading of fish varies between retailers and middle-men and also depends on supply and demand. The A grade fish, which sell at prices ranging from F$5.50to F$6.50 per kilogram and include such fish as rockcods, trevallies, reef snappers and emperors.Barracudas are graded either A or B depending on the retailer. Prices of B grade fish are between F$4.30and F$4.70 per kilogram.
9
The Live Reef Food Fish of Bua Province, Fiji Islands
10
Retailers in Suva who buy fish from the Bua area claim that they are not getting enough fish and thereforehave to supplement their supply by buying New Zealand imported fish such as mullets, ling and snappers.Also, people are becoming more health conscious and this is causing a general increasing preference offish over meat.
The total amount of fish coming from Bua and sold in the Suva market was estimated at 7–8 tonnzs perweek. Of this only about 20–30% were species of interest to the LRFF trade.
Spawning aggregations and sites
Although fishermen interviewed claim that they are not fully aware of spawning seasons of fish species,the information they provided in relation to the quantities of particular fish at different times of the yearsuggested strongly that spawning seasons and aggregations do exist.
Most of the fishermen interviewed (all except for one) said that they have come across big schools of donu(Plectropomus areolatus, P. laevis and P. leopardus) while out fishing. Table 1 summarises the fishermen’sobservations.
Table 1: Spawning periods and sites obtained from fishermen interviewed
Fish species Spawning period Spawning aggregation sites
Plectropomus areolatus October–December Ovatoa Reef passageDecember–January Barrier ReefSeptember–December Nauqina Reef (pass connected to Tevoro Pass)
December Ovatoa Reef passageSeptember Marovo Reef? Yanganga Island reef edgeMarch Nauqina Reef (pass connecting Tevoro Pass
to Nandongo Reef)
Plectropomus leopardus March Nauqina Reef (pass joining to Barier Reef)? Barrier ReefNo season
Plectropomus laevis October–December OvatoaMarch Nauqina Reef (pass connected to Tevoro Pass)
Epinephelus polyphekadion July Ovatoa Reef passageSeptember–December Nauqina Reef (pass joining to Barrier Reef)
Valamugil seheli November– April Around Ovatoa Reef
Liza vaigiensis November – April Around Ovatoa Reef
Siganids November–December Around mangrove areasDecember–January ?
November–January butReef edges around Nandongo Reef andOvatoa Reefs
mainly in January Ovatoa Reef
Cheilinus undulatus ? Ovatoa Reef
Lutjanus gibbus ? Northern parts of Nandongo Reef andaround rocks at Ovatoa Reef
Fish species Spawning period Spawning aggregation sites
Underwater visual census (fish transects)
A total of 39 fish transects were done in 13 sampling stations; 24 transects (8 stations) on inner reefs and15 transects (5 stations) on the barrier reef area. This gives a total sampling area of 9.75 km2 (2% of thetotal reef area in the fishing area).
Numbers of fish seen
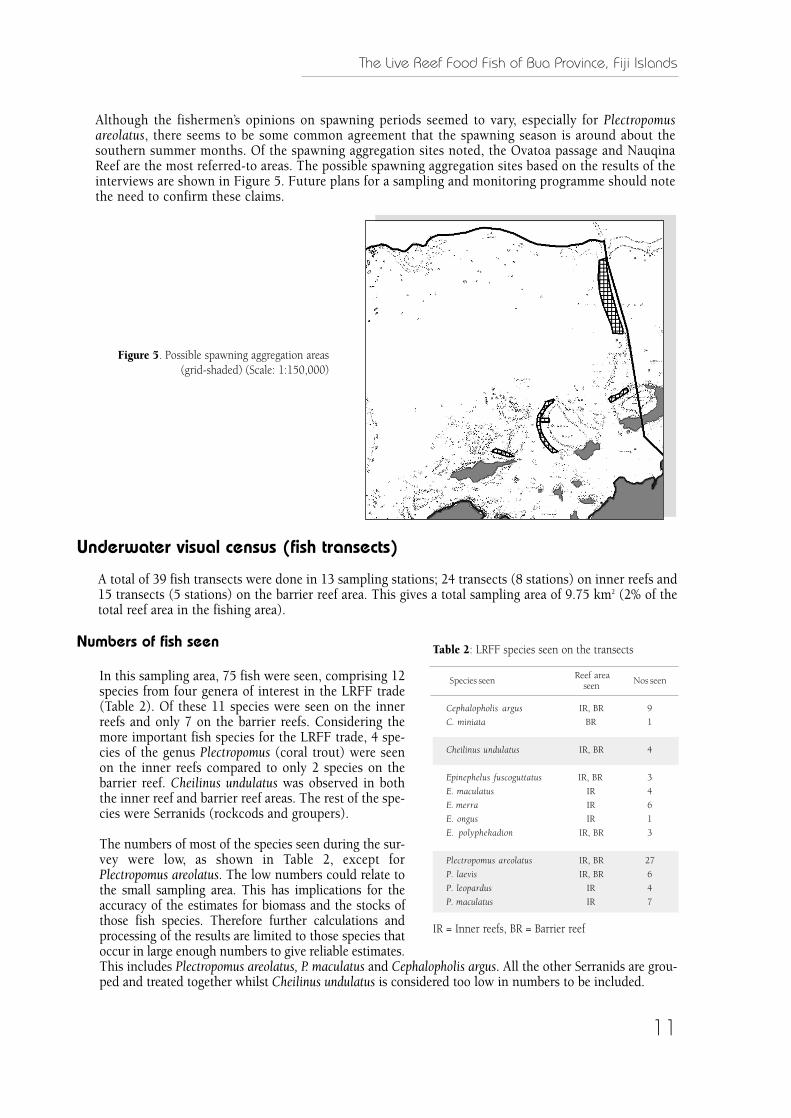
In this sampling area, 75 fish were seen, comprising 12species from four genera of interest in the LRFF trade(Table 2). Of these 11 species were seen on the innerreefs and only 7 on the barrier reefs. Considering themore important fish species for the LRFF trade, 4 spe-cies of the genus Plectropomus (coral trout) were seenon the inner reefs compared to only 2 species on thebarrier reef. Cheilinus undulatus was observed in boththe inner reef and barrier reef areas. The rest of the spe-cies were Serranids (rockcods and groupers).
The numbers of most of the species seen during the sur-vey were low, as shown in Table 2, except forPlectropomus areolatus. The low numbers could relate tothe small sampling area. This has implications for theaccuracy of the estimates for biomass and the stocks ofthose fish species. Therefore further calculations andprocessing of the results are limited to those species thatoccur in large enough numbers to give reliable estimates.This includes Plectropomus areolatus, P. maculatus and Cephalopholis argus. All the other Serranids are grou-ped and treated together whilst Cheilinus undulatus is considered too low in numbers to be included.
The Live Reef Food Fish of Bua Province, Fiji Islands
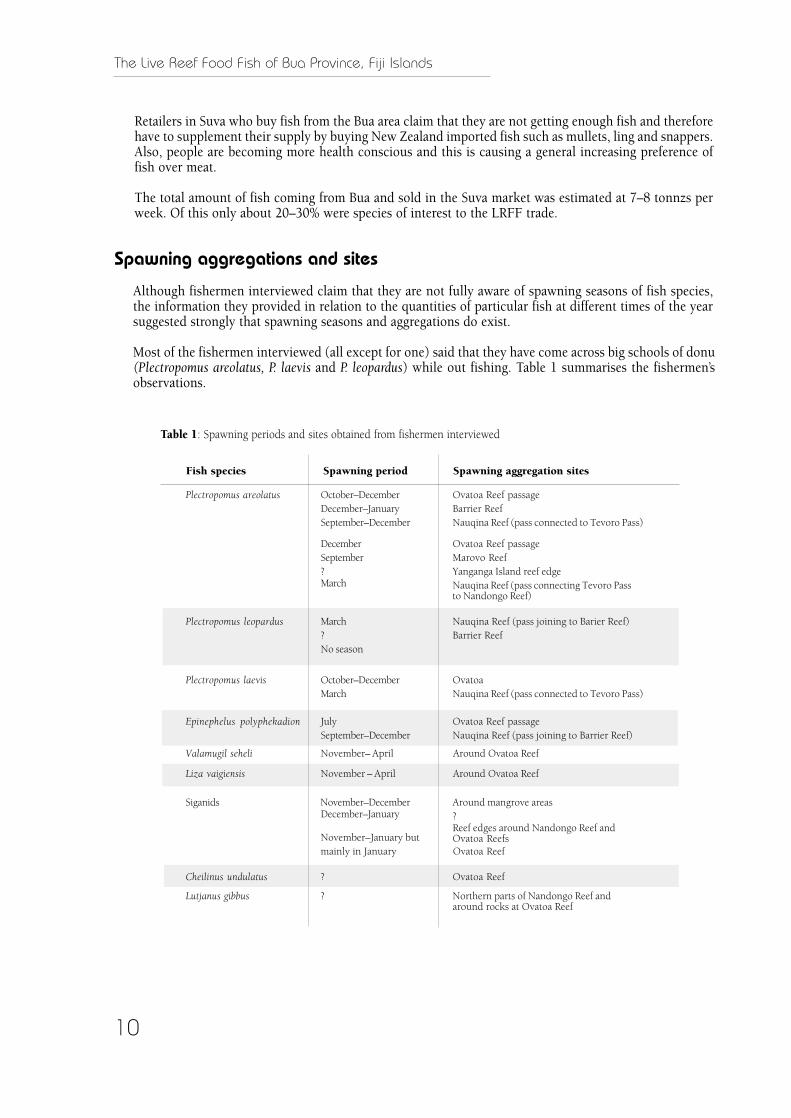
Although the fishermen’s opinions on spawning periods seemed to vary, especially for Plectropomusareolatus, there seems to be some common agreement that the spawning season is around about thesouthern summer months. Of the spawning aggregation sites noted, the Ovatoa passage and NauqinaReef are the most referred-to areas. The possible spawning aggregation sites based on the results of theinterviews are shown in Figure 5. Future plans for a sampling and monitoring programme should notethe need to confirm these claims.
Figure 5. Possible spawning aggregation areas (grid-shaded) (Scale: 1:150,000)
11
Species seen Reef area
seenNos seen
Cephalopholis argus IR, BR 9
C. miniata BR 1
Cheilinus undulatus IR, BR 4
Epinephelus fuscoguttatus IR, BR 3
E. maculatus IR 4
E. merra IR 6
E. ongus IR 1
E. polyphekadion IR, BR 3
Plectropomus areolatus IR, BR 27
P. laevis IR, BR 6
P. leopardus IR 4
P. maculatus IR 7
IR = Inner reefs, BR = Barrier reef
Table 2: LRFF species seen on the transects
The Live Reef Food Fish of Bua Province, Fiji Islands
12
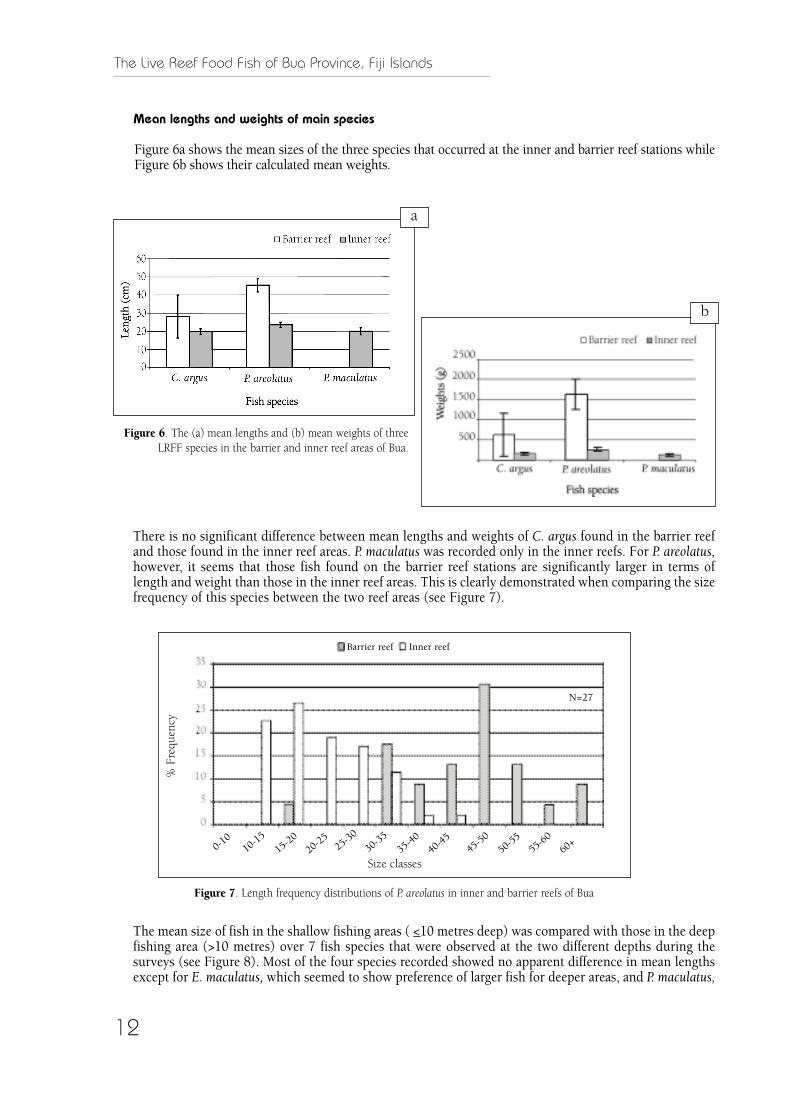
Mean lengths and weights of main species
Figure 6a shows the mean sizes of the three species that occurred at the inner and barrier reef stations whileFigure 6b shows their calculated mean weights.
a
b
Figure 6. The (a) mean lengths and (b) mean weights of threeLRFF species in the barrier and inner reef areas of Bua.
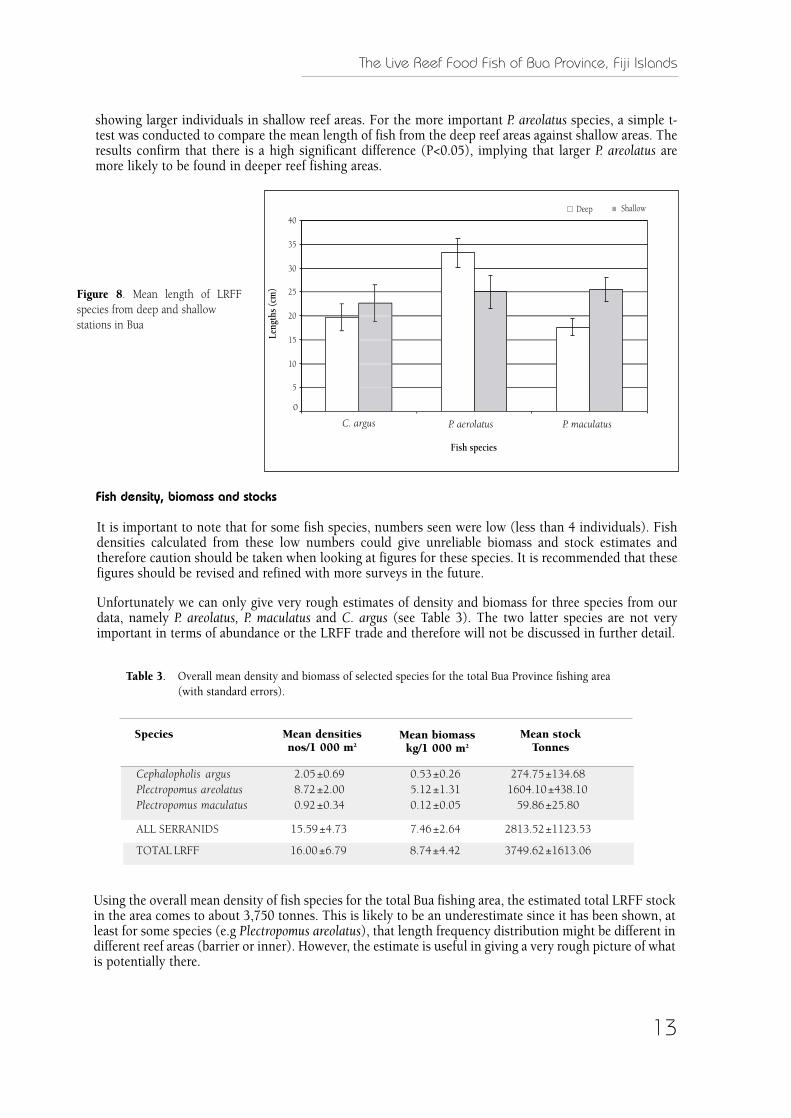
There is no significant difference between mean lengths and weights of C. argus found in the barrier reefand those found in the inner reef areas. P. maculatus was recorded only in the inner reefs. For P. areolatus,however, it seems that those fish found on the barrier reef stations are significantly larger in terms oflength and weight than those in the inner reef areas. This is clearly demonstrated when comparing the sizefrequency of this species between the two reef areas (see Figure 7).
Figure 7. Length frequency distributions of P. areolatus in inner and barrier reefs of Bua
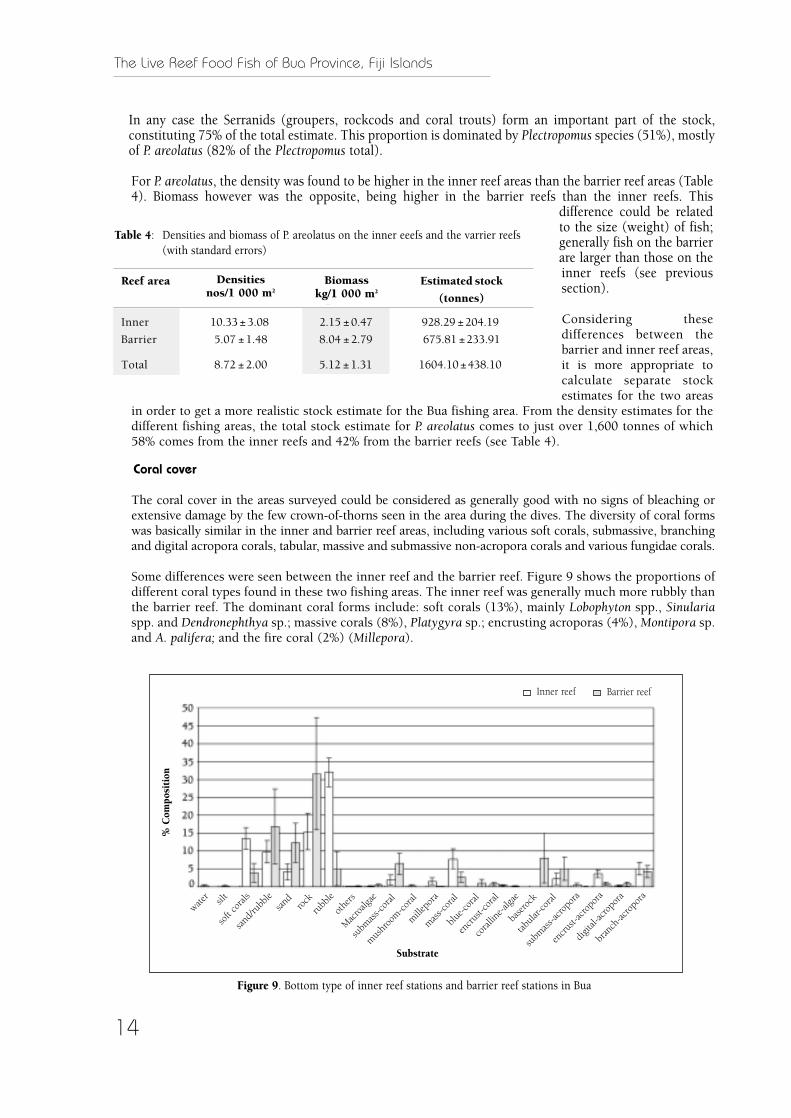
The mean size of fish in the shallow fishing areas ( <10 metres deep) was compared with those in the deepfishing area (>10 metres) over 7 fish species that were observed at the two different depths during thesurveys (see Figure 8). Most of the four species recorded showed no apparent difference in mean lengthsexcept for E. maculatus, which seemed to show preference of larger fish for deeper areas, and P. maculatus,
0-1010-15
15-2020-25
25-30
30-3535-40
40-4545-50
50-5555-60
60+
% F
requ
ency
Size classes
Barrier reef Inner reef
N=27
The Live Reef Food Fish of Bua Province, Fiji Islands
showing larger individuals in shallow reef areas. For the more important P. areolatus species, a simple t-test was conducted to compare the mean length of fish from the deep reef areas against shallow areas. Theresults confirm that there is a high significant difference (P<0.05), implying that larger P. areolatus aremore likely to be found in deeper reef fishing areas.
5
10
15
20
25
30
35
40Deep Shallow
C. argus P. aerolatus P. maculatus
0
Fish species
Leng
ths
(cm
)Figure 8. Mean length of LRFFspecies from deep and shallow stations in Bua
Fish density, biomass and stocks
It is important to note that for some fish species, numbers seen were low (less than 4 individuals). Fishdensities calculated from these low numbers could give unreliable biomass and stock estimates andtherefore caution should be taken when looking at figures for these species. It is recommended that thesefigures should be revised and refined with more surveys in the future.
Unfortunately we can only give very rough estimates of density and biomass for three species from ourdata, namely P. areolatus, P. maculatus and C. argus (see Table 3). The two latter species are not veryimportant in terms of abundance or the LRFF trade and therefore will not be discussed in further detail.
Species Mean density Mean biomass Mean stocknos/1000m2 kg/1000m2 Tonnes
Cephalopholis argus 2.05 ± 0.69 0.53 ± 0.26 274.75 ± 134.68Plectropomus areolatus 8.72 ± 2.00 5.12 ± 1.31 1604.10 ± 438.10Plectropomus maculatus 0.92 ± 0.34 0.12 ± 0.05 59.86 ± 25.80
ALL SERRANIDS 15.59 ± 4.73 7.46 ± 2.64 2813.52 ± 1123.53
TOTAL LRFF 16.00 ± 6.79 8.74 ± 4.42 3749.62 ± 1613.06
Table 3. Overall mean density and biomass of selected species for the total Bua Province fishing area(with standard errors).
Using the overall mean density of fish species for the total Bua fishing area, the estimated total LRFF stockin the area comes to about 3,750 tonnes. This is likely to be an underestimate since it has been shown, atleast for some species (e.g Plectropomus areolatus), that length frequency distribution might be different indifferent reef areas (barrier or inner). However, the estimate is useful in giving a very rough picture of whatis potentially there.
13
Mean densitiesnos/1 000 m2
Mean biomasskg/1 000 m2
Species Mean stockTonnes
The Live Reef Food Fish of Bua Province, Fiji Islands
In any case the Serranids (groupers, rockcods and coral trouts) form an important part of the stock,constituting 75% of the total estimate. This proportion is dominated by Plectropomus species (51%), mostlyof P. areolatus (82% of the Plectropomus total).
For P. areolatus, the density was found to be higher in the inner reef areas than the barrier reef areas (Table4). Biomass however was the opposite, being higher in the barrier reefs than the inner reefs. This
difference could be relatedto the size (weight) of fish;generally fish on the barrierare larger than those on theinner reefs (see previoussection).
Considering thesedifferences between thebarrier and inner reef areas,it is more appropriate tocalculate separate stockestimates for the two areas
in order to get a more realistic stock estimate for the Bua fishing area. From the density estimates for thedifferent fishing areas, the total stock estimate for P. areolatus comes to just over 1,600 tonnes of which58% comes from the inner reefs and 42% from the barrier reefs (see Table 4).
Coral cover
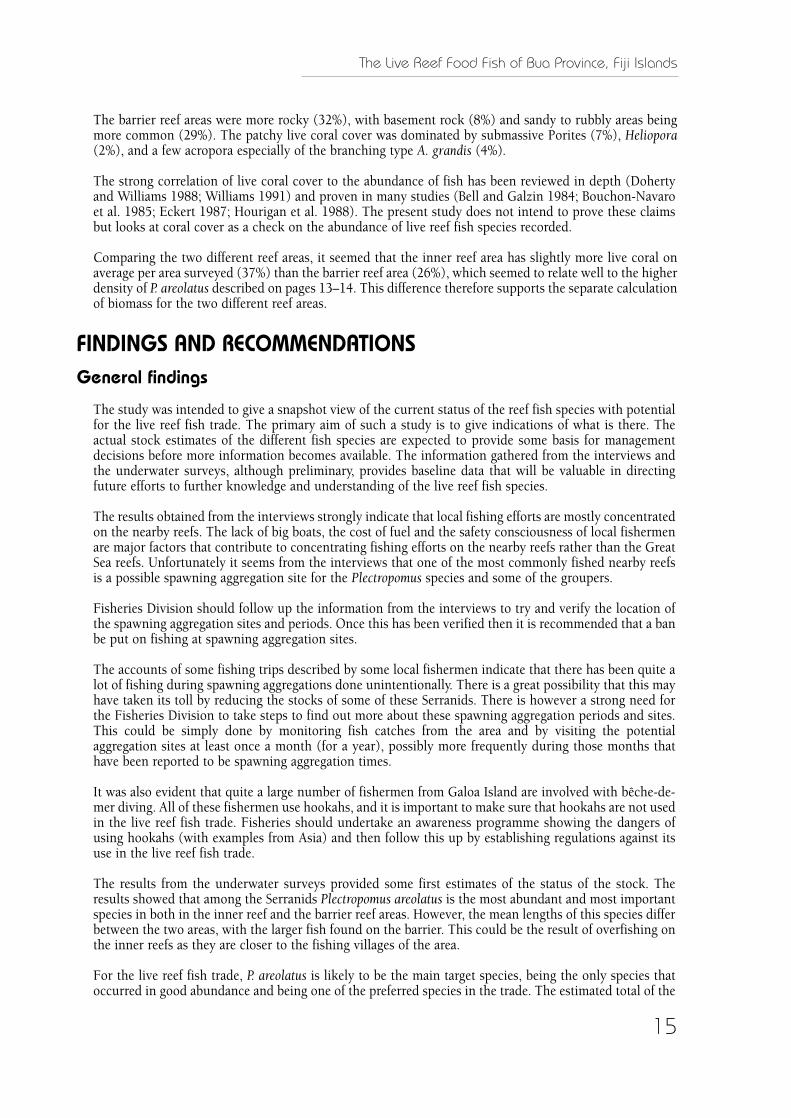
The coral cover in the areas surveyed could be considered as generally good with no signs of bleaching orextensive damage by the few crown-of-thorns seen in the area during the dives. The diversity of coral formswas basically similar in the inner and barrier reef areas, including various soft corals, submassive, branchingand digital acropora corals, tabular, massive and submassive non-acropora corals and various fungidae corals.
Some differences were seen between the inner reef and the barrier reef. Figure 9 shows the proportions ofdifferent coral types found in these two fishing areas. The inner reef was generally much more rubbly thanthe barrier reef. The dominant coral forms include: soft corals (13%), mainly Lobophyton spp., Sinulariaspp. and Dendronephthya sp.; massive corals (8%), Platygyra sp.; encrusting acroporas (4%), Montipora sp.and A. palifera; and the fire coral (2%) (Millepora).
14
Reef area Densities Biomass Estimated stock
(nos/1000m2) (kg/1000m2) (tonnes)
Inner 10.33 ± 3.08 2.15 ± 0.47 928.29 ± 204.19
Barrier 5.07 ± 1.48 8.04 ± 2.79 675.81 ± 233.91
Total 8.72 ± 2.00 5.12 ± 1.31 1604.10 ± 438.10
Table 4: Densities and biomass of P. areolatus on the inner eeefs and the varrier reefs(with standard errors)
water
silt
soft
cora
ls
sand
/rubb
lesa
nd rock
rubb
le
othe
rs
Mac
roalg
ae
subm
ass-c
oral
mus
hroo
m-co
ral
mill
epor
a
mas
s-cor
al
blue
-cora
l
encr
ust-c
oral
cora
lline
-alga
e
base
rock
tabul
ar-co
ral
subm
ass-a
cropo
ra
encr
ust-a
cropo
ra
digit
al-ac
ropo
ra
bran
ch-ac
ropo
ra
Barrier reefInner reef
% C
ompo
siti
on
Substrate
Figure 9. Bottom type of inner reef stations and barrier reef stations in Bua
Densitiesnos/1 000 m2
Biomasskg/1 000 m2
The Live Reef Food Fish of Bua Province, Fiji Islands
The barrier reef areas were more rocky (32%), with basement rock (8%) and sandy to rubbly areas beingmore common (29%). The patchy live coral cover was dominated by submassive Porites (7%), Heliopora(2%), and a few acropora especially of the branching type A. grandis (4%).
The strong correlation of live coral cover to the abundance of fish has been reviewed in depth (Dohertyand Williams 1988; Williams 1991) and proven in many studies (Bell and Galzin 1984; Bouchon-Navaroet al. 1985; Eckert 1987; Hourigan et al. 1988). The present study does not intend to prove these claimsbut looks at coral cover as a check on the abundance of live reef fish species recorded.
Comparing the two different reef areas, it seemed that the inner reef area has slightly more live coral onaverage per area surveyed (37%) than the barrier reef area (26%), which seemed to relate well to the higherdensity of P. areolatus described on pages 13–14. This difference therefore supports the separate calculationof biomass for the two different reef areas.
FINDINGS AND RECOMMENDATIONSGeneral findings
The study was intended to give a snapshot view of the current status of the reef fish species with potentialfor the live reef fish trade. The primary aim of such a study is to give indications of what is there. Theactual stock estimates of the different fish species are expected to provide some basis for managementdecisions before more information becomes available. The information gathered from the interviews andthe underwater surveys, although preliminary, provides baseline data that will be valuable in directingfuture efforts to further knowledge and understanding of the live reef fish species.
The results obtained from the interviews strongly indicate that local fishing efforts are mostly concentratedon the nearby reefs. The lack of big boats, the cost of fuel and the safety consciousness of local fishermenare major factors that contribute to concentrating fishing efforts on the nearby reefs rather than the GreatSea reefs. Unfortunately it seems from the interviews that one of the most commonly fished nearby reefsis a possible spawning aggregation site for the Plectropomus species and some of the groupers.
Fisheries Division should follow up the information from the interviews to try and verify the location ofthe spawning aggregation sites and periods. Once this has been verified then it is recommended that a banbe put on fishing at spawning aggregation sites.
The accounts of some fishing trips described by some local fishermen indicate that there has been quite alot of fishing during spawning aggregations done unintentionally. There is a great possibility that this mayhave taken its toll by reducing the stocks of some of these Serranids. There is however a strong need forthe Fisheries Division to take steps to find out more about these spawning aggregation periods and sites.This could be simply done by monitoring fish catches from the area and by visiting the potentialaggregation sites at least once a month (for a year), possibly more frequently during those months thathave been reported to be spawning aggregation times.
It was also evident that quite a large number of fishermen from Galoa Island are involved with bêche-de-mer diving. All of these fishermen use hookahs, and it is important to make sure that hookahs are not usedin the live reef fish trade. Fisheries should undertake an awareness programme showing the dangers ofusing hookahs (with examples from Asia) and then follow this up by establishing regulations against itsuse in the live reef fish trade.
The results from the underwater surveys provided some first estimates of the status of the stock. Theresults showed that among the Serranids Plectropomus areolatus is the most abundant and most importantspecies in both in the inner reef and the barrier reef areas. However, the mean lengths of this species differbetween the two areas, with the larger fish found on the barrier. This could be the result of overfishing onthe inner reefs as they are closer to the fishing villages of the area.
For the live reef fish trade, P. areolatus is likely to be the main target species, being the only species thatoccurred in good abundance and being one of the preferred species in the trade. The estimated total of the
15
The Live Reef Food Fish of Bua Province, Fiji Islands
16
species for the whole fishing area is just over 1,600 tonnes. This is equivalent to a wholesale value ofUS$56 million in the Hong Kong market (based on 1994 prices in Johannes and Riepen 1995). Themaximum sustainable yield for the area was difficult to estimate with the information available but isexpected to be much less. This lack of information calls for a monitoring programme.
The size of this fish is an important factor to consider in the live reef food fish trade. The mean length ofP. areolatus in the inner reef areas is about 23.6 cm compared to 45.4 cm on the barrier reefs. This equatesto weights of 0.26 kg and 1.6 kg respectively. With the preferred weights of fish in the LRFF market beingbetween 0.8 and 1.5 kg, the best area to fish would be the barrier reef.
For the inner reefs the smaller coral trouts should be investigated further. Considering the small size ofthe fish and the possibility that spawning aggregation areas are located in the inner reefs, then suspendingfishing for coral trout species and imposing size limits for subsistence fishing are a possible managementoption as a start. Once the spawning periods and sites have been worked out then these areas should bemarked and set up as marine reserves where fishing is banned.
The valuable Cheilinus undulatus was seen in very low numbers. Although our survey results would needto be verified by more surveys, the very low numbers should be noted and a total ban on fishing for thisspecies should be considered as a precautionary approach before more information and survey results areavailable. Such a ban should go in line with efforts to start research into the ecology and biology of thefish species.
The numbers of other Serranids and other fish species counted on the transects were too low to givereliable estimates. The general low density could be a result of underestimation relating to the samplingmethod used; the width of the transect was fixed at 5 metres and therefore with limited time the samplingarea was very small in relation to the total fishing area. This could be improved by doing a lot moretransects in the future and possibly by adopting a transect method of unfixed widths which would enablesurveying of more extensive areas.
This new industry should be carefully monitored and controlled. Information and experience from SouthEast Asia should be used to avoid repeating mistakes and to make the industry a sustainable one.
There is a strong need to set up management regulations backed up by specific legislation for the trade.The legal framework already exists under the Fisheries Act for the imposition of specific legislation andregulations for better management of a live reef fish trade operation. The legislation and regulations wouldneed to be carefully worded in order to be effective as a management measure for the live reef fish trade.
The customary fishing rights law provides an effective local framework for keeping control of fishingactivities in the fishing area and for enforcing regulations; a small council made up of all the differentparties involved should be formed and empowered to protect the interest of the resource owners. Acoordinated plan for enforcing regulations, together with an outline of the different responsibilities,should be established to ensure that enforcement efforts are well supported from the community levelright through to the government.
Proposed management policy guidelines
1 The government regulatory agencies should recognise the live reef fishery as a distinctive fishery andtherefore should:
(a) License it separately from other fishing activities.(b) Have carefully worded contracts between the company and the government and resource owners, to
ensure environmentally and economically sound operations.(c) Establish a catch and export monitoring programme with companies being responsible for
maintaining record sheets and logs of catch–effort data and submitting them regularly to the relevantgovernment agency.
(d) Ban transshipment of live reef fish at sea; require all live reef fish transport vessels to clear from arecognised port or airport where they can be checked and monitored before departing for Hong Kong.
The Live Reef Food Fish of Bua Province, Fiji Islands
(e) Consider placing spawning aggregation sites of target species off limits to commercial fishing, or closecommercial fishing entirely during spawning seasons.
(f) Ban the possession, use, storage and/or transportation of any explosives or noxious substances(including sodium cyanide) on all fishing boats, fish transport vessels and LRF operators’ facilities.
(g) Ban the possession, use, storage and/or transportation of compressed air (scuba and hookah) on livereef fishing boats and fish transport vessels.
(h) Provide advice and awareness materials to local fishermen and communities concerning the problemsassociated with live reef fishing and how to minimise them.
(i) Provide advice to resource owners or local entrepreneurs who wish to enter into a formal agreementwith a live reef fish export company to strengthen their ability to negotiate with foreign dealers.
(j) Restrict fishing for live reef fish to locals only to maximise benefits to the local community and toencourage the idea of resource owners taking care of their own resource.
(k) Ban the export of the fingerlings of live reef fish, and place size limits on adult target fish species.(l) Place an export ban on wild-caught Cheilinus undulatus (Maori wrasse/napoleon fish) until a full
stock assessment in the fishing right area has been completed.(m) Consider an environmental impact assessment (EIA) for each live reef export operation, the costs of
the EIA to be borne by the LRF operator.(n) Establish an annual underwater visual census monitoring programme that would be coordinated and
carried out by the Fisheries Agency with assistance provided by local divers who have been trainedin using the method. The costs of fuel and hire of survey equipment where necessary should borneby the LRF operator.
2 The government should ensure that an incoming company provides as much detail as possible aboutits intended operation in its initial proposal. The details of the plan should include as a minimum:
(a) A detailed description of the proposed operation.(b) Ownership, control and management of the operation/company.(c) Target species.(d) How fishermen would hired, used and paid.(e) A summary of negotiations with the customary owners and any agreements or terms reached.(f) Fishing methods, equipment and treatments to be used.(g) Infrastructure (existing and proposed).(h) Human resource requirements, noting clearly where foreigners or non-citizens would be required,
what they would be doing and for how long.(i) Training components (a detailed plan), stating clearly where locals would be trained, what training
they would get, and reasons.(j) Fish storage, processing and transportation mechanisms.(k) The proposed market.(l) Operational budget.
The licence agreement
The live reef fishing licence agreement should be carefully worded and should be in line with the presentfisheries laws and regulations as well as encompassing the customary ownership laws. At the minimumthe licence should be awarded along the following rules and conditions. Any non-compliance with theseconditions should result in suspension and loss of the licence.
(a) Licences should be issued for specific locations or areas for a maximum of one year, renewable uponreview.
(b) One operator per designated area is permitted.(c) The LRF company should endeavor to resolve customary ownership rights and compensation issues
before the licence is awarded. The applicant must produce a signed agreement with the recognisedcustomary owners in which the terms of access and usage are explicitly set out. Any terms of theagreement must not conflict with national or provincial laws or policies and must be endorsed by therespective provincial authorities in the presence of an authorised Fisheries Licensing Officer(s) beforea licence can be issued.
17
The Live Reef Food Fish of Bua Province, Fiji Islands
18
(d) Where foreign vessels are used, the foreign crewmembers should be limited to a minimum requiredto operate the vessel and maintain the fish.
(e) Foreigners or non-citizens should not be involved in the actual capturing process except for trainingpurposes.
(f) LRF transport vessels should not be allowed to do any fishing. (g) Fish should not be delivered or transshipped to another vessel without prior written permission.(h) The size of the LRF transport vessel and the number of holding pens should be limited in relation to
the proposed and agreed production target.(i) The licensee must permit a fisheries officer to board the vessel at any time and provide
accommodation for the officer free of charge while the vessel is operating under license.(j) Export of live reef fish should be done only from designated ports or airports.(k) The use, storage and/or transportation of scuba or hookah equipment should not be permitted.(l) The use, storage and/or transportation of any explosives or noxious substances (including sodium
cyanide) for the purpose of killing, stunning, disabling or taking of fish should not be permitted.(m) Licensees must maintain a detailed daily record of catches or purchases as required by Fisheries in a
prepared record form. The records should be submitted every month. The Fisheries Division wouldtreat these data with strict confidentiality.
(n) The vessel, its owners, operators and crew must protect the coral reefs from damage at all times duringthe fishing and vessel operation.
(o) With the LRF trade being considered as a limited-entry fishery then it is only appropriate to imposefees for access to the resources as a licence condition.
To go with the management regulations and enforcement, a good monitoring programme is essential tomake sure that the companies are continuously in compliance with the rules as well as to collect basicinformation that will be valuable for the future management and development of the industry. Amonitoring programme is proposed below. The actual forms could be obtained from the Reef FisheryAssessment and Management Section of the SPC Coastal Fisheries Programme.
The monitoring programme
Data collection programme
A data collection system was therefore proposed which involves most of the players in the fishery. Datacollection is made a requirement and responsibility of the LRFF company. The Fisheries Division ishowever the main authority, taking charge of regular monthly record submissions by the company,collecting biological information on fish that died during the handling stages, processing and analysingthe data and reviewing management decisions and options.
The proposed data collection programme consists of four sheets to be filled in as described below.
1. Fishing data sheet. To be filled in by the fishermen as they go out on a fishing trip. It basically detailsinformation on the fishing effort, fishing conditions, fishing location(s) and fish catches (species, lengthand weight). These are to be handed in to the LRFF company site manager on arrival at the LRFF holdingcage site after the trip.
2. Catch summary form. To be filled in by the LRFF company site manager when stocking the holdingcages. It records the number and weight of fish put into the holding cages by species and also records thespecies, number and weight of fish that are dead at this stage of handling. The dead fish are to be keptaside for further data collection. Dead fish later found in the holding fish cages should also be recordedon this form.
3. Biological data sheet (dead fish). This is to be filled by the Fisheries officer in charge of the LRFFindustry. It collects biological information on the dead fish collected during handling. The data sheetrecords species, length, weight, sex, maturity stage, gonad weight and stomach content. The Fisheriesofficer is expected to be responsible for this, but we anticipate problems keeping dead fish frozen untilthe Fisheries officer visits the holding cage station rather than selling the fish fresh. The ideal solution isto train someone on site on how to handle the fish, sex, measure, weigh and gut. We therefore proposethat the Fisheries officer organise with the site manager to have the dead fish measured, weighed, sexed
The Live Reef Food Fish of Bua Province, Fiji Islands
(gonads should also be weighed), and gutted. The guts can then be frozen in a sealed plastic bag properlylabelled for later identification.
4. Export data sheet. This is the final sheet to be filled in before the live fish are exported overseas. It is tobe filled by the LRFF company site manager, and is basically a record of the species, numbers and weightof fish exported live overseas.
The data sheets have been designed for filling in with the minimum effort. The sheets to be filled in by thesite manager are records that they would need to keep for themselves anyway. Coding the data is a deskjob for the Fisheries officer, a list of codes used is provided. The SPC Reef Fishery Assessment andManagement Section would continue to provide assistance where required to get the monitoringprogramme off the ground, especially in data analysis. All information would be kept confidential.
Resource assessment
Resource assessment forms the second part of the monitoring programme and is basically the FisheriesDivision’s responsibility. The purpose of the assessment work is to observe the long-term impact of theindustry on the reef fish stocks, check regularly for signs of destructive fishing methods such as ‘cyanide-fishing’, and build up information on spawning seasons and spawning aggregation sites. It is recommendedthat field assessment should be done twice a year for the first two to three years and then once a year afterthat.
The fieldwork would involve using the underwater visual census (UVC) method. The method used shouldbe consistent for every sampling done. Some training on the UVC method used was given to the localvillage divers and Fisheries personnel involved in the study. The SPC Reef Fishery Assessment andManagement Section could however provide further training on an improved version of this method thatwould be standardised as a package (field method and analysis tools) throughout the region for possiblecomparison with other areas.
19
The Live Reef Food Fish of Bua Province, Fiji Islands
20
REFERENCESAyling, A.M. and Ayling, A.L. (1992). Bramble Reef replenishment area – baseline survey. Report to the Great
Barrier Reef Marine Park Authority. 22 p.
Bell, J.D. and Galzin, R. (1984). Influence of live coral cover on coral-reef fish communities. Mar. Ecol. Prog.Ser. 15:265–274.
Bell, J.D., Harmelin-Vivien, M.L., and GALZIN, R. (1985). Large scale spatial variation in abundance of but-terflyfishes (Chaetodontidae) on Polynesian reefs. Proceedings 5th International Coral Reef Symposium5:421–426.
Bouchon-Navaro, Y., Bouchon, C. and Harmelin-Vivien, M. L. (1985). Impact of coral degradation on a chae-todontid fish assemblage (Moorea, French Polynesia). Proceedings 5th International Coral ReefSymposium, Tahiti 5:427–432.
Cappo, M. and Brown, I.W. (1996). Evaluation of sampling methods for reef fish populations of commercialand recreational interest. CRC Reef Research Centre, Tech. Rep. No. 6, Townsville 72 p.
Doherty, P.J. and Williams, D.McB. (1988). The replenishment of coral reef fish populations. Oceanographyand Marine Biology Annual Review 26:487–551.
Eckert, G.J., (1987). Estimates of adult and juvenile mortality for labrid fishes at One Tree Reef, Great BarrierReef. Mar. Biol. 95:167–171.
English, S., Wilkinson, C. and Baker, V. (1994). Survey manual for tropical marine resources.ASEAN–Australia Marine Science Project: Living Coastal Resources. Australian Institute of MarineScience, Townsville. 368 p.
Fong, G.M. (1994). Case study of a traditional marine management system, Sasa Village, Macuata Province,Fiji. FAO Field Report. RAS/92/TO5. No. 94/1. FAO, Rome. 85 p.
Hourigan, T.F., Tricas, T.C. and Reese, E.S. (1988). Coral reef fishes as indicators of environmental stress incoral reef. In: D.F. Soule and G.S. Kleppel (eds), Marine organisms as indicators. Springer-Verlag, NewYork. 107–136.
Jennings, S. and Polunin, N.V.C. (1996). Effects of fishing effort and catch rate upon the structure and bio-mass of Fijian reef fish communities. J. Appl. Ecol. 33:400–412.
Johannes, R.E. (1981). Words of the lagoon: fishing and marine lore in the Palau district of Micronesia.University of California Press, Berkeley. 245 p.
Johannes, R.E. (1987). Traditional beliefs and fisheries management in Oceania. Naga, the ICLARM Quarterly,October 1987:5.
Johannes, R.E. and Riepen, M. (1995). Environmental, economic, and social implications of the live reef fishtrade in Asia and the Western Pacific. Report to the Forum Fisheries Agency and the Nature Conservancy.81 p.
Jones, R.J. (1997). Effects of cyanide on coral. SPC Live Reef Fish Information Bulletin No. 3:3–8.
Kulbicki, M. (1988). Correlation between catch data from bottom longlines and fish censuses in the SWlagoon of New Caledonia. Proceedings 6th International Coral Reef Symposium, Australia 2:305–312.
Letourneur, Y., Kulbicki, M. and Labrosse, P. (1998). Length–weight relationship of fishes from coral reefs andlagoons of New Caledonia – an update. Naga, the ICLARM Quarterly 21(4):39–46.
The Live Reef Food Fish of Bua Province, Fiji Islands
Queensland Department of Primary Industries (QDPI). (1995). Application of underwater visual census toassessing coral reef fish stocks in the Tropical Pacific. Project No. 9304. Final Project Report.
Richards, A., Lagibalavu, M., Sharma, S. and Swamy, K. (1994). Fiji fisheries resource profiles. FFA ReportNo. 94/4. 166 p.
Ruddle, K., Hvding, E. and Johannes, R.E. (1992). Marine resources management in the context of customa-ry tenure Marine Resource Economics 5:351–363.
Russ, G.R. and Alcala, A.C. (1989). Effects of intense fishing pressure on an assemblage of coral reef fishes.Mar. Ecol. Prog. Ser. 56:13–27.
Russ, G.R. (1985). Effects of protective management on coral reef fishes in the Central Philippines.Proceedings 5th International Coral Reef Symposium, Tahiti 4:219–224.
Samoilys, M.A. and Carlos, G. (1992). Development of an underwater visual census method for assessing shal-low water reef fish stocks in the south-west Pacific. ACIAR Project PN8545. Final Report, April 1992. 100 p.
Samoilys, M.A. (1988). Abundance and species richness of coral reef fish on the Kenyan coast: the effects ofprotective management and fishing. Proceedings 6th International Coral Reef Symposium, Australia2:261–266.
Samoilys, M.A. (1992). Review of the underwater visual census method developed by the DPI/ACIAR project:visual assessment of reef fish stocks. Conference and Workshop Series QC92006. Department of PrimaryIndustries, Queensland. 55 p.
Samoilys, M. (ed) (1997). Manual for assessing fish stocks on Pacific coral reefs. Training series QE97009.Department of Primary Industries, Queensland. 78 p.
Thresher, R.E. (1983). Environmental correlates of the distribution of planktivorous fishes in the One TreeReef lagoon. Mar. Ecol. Prog. Ser. 10:137–145.
Thresher, R.E. and Gunn, J.S. (1986). Comparative analysis of visual census techniques for highly mobile reefassociated piscivores (Carangidae). Environ. Biol. Fishes 17(2):93–116.
Warner, R.R. and Hoffman, S.G. (1980). Population density and the economics of territorial defense in a coralreef fish. Ecology 61:722–780.
Watson, M. and Ormond, R.F.G. (1994). Effect of an artisanal fishery on the fish and urchin populations of aKenyan coral reef. Mar. Ecol. Prog. Ser. 109:115–129.
Williams, D.McB. (1991). Patterns and processes in the distribution of coral reef fishes. In: P.F. Sale (ed), Theecology of fishes on coral reefs. Academic Press Inc., Sydney.
21

23
MEMORANDUM OF UNDERSTANDINGBETWEEN THE PEOPLE OF GALOA AND SATELLITE SEAFOODS (FIJI) PTY LTD
Satellite Seafoods Pty (Fiji) Ltd of Australia will have a permit to operate from Galoa Island in the Tikina ofLekutu and the Province of Bua situated on the North Western coast of the island of Vanua Levu. Thismemorandum of understanding binds the above company and the people of Galoa Island to ensure thesmooth operation of the live reef fish trade there after endorsements from respective parties and the FijiFisheries Division on this document.
1. Satellite Seafoods Pty (Fiji) Ltd will purchase live reef fish from the fishermen in the Province of Buaat a price of $F10.00 per kilogram according to the size requirements and species as specified in their originalproposal to Fiji Fisheries Division. The company reserves the right to reject fish which they believe is not ina healthy condition and not fit for the live reef fish trade. An initial payment of $F4.00 per kilogram will bemade to the fishermen bringing the fish to the sea cages constructed by the company at suitable locations inthe proximity of Galoa Island. The balance of $F6.00 per kilogram will be paid after the fish is loaded on tothe live fish transport vessels from Hong Kong.
2. Satellite Seafoods Pty (Fiji) Ltd. will share the fishermen’s training expenses, and the knowledge gainedwith the Fisheries Division. All the interested fishermen will be trained to enable them to undertake this trade.
3. Satellite Seafoods Pty (Fiji) Ltd will employ locals from Galoa Island and the Province of Buawhenever opportunities arise provided the locals have the required skills.
4. Satellite Seafoods Pty (Fiji) Ltd will provide three dories with engines to Galoa Island selectedfishermen depending on their performance.
5. Anchorage will be provided at Galoa Island for a barge for the purpose of housing a caretaker.
6. Provisions for the supply of fuel to the fishermen will be accommodated by Satellite Seafoods Pty(Fiji) Ltd at the normal market price.
7. Satellite Seafoods Pty. (Fiji) Ltd will make provisions to maintain regular supply of fresh water to thepeople of Galoa Island.
8. The costs of extra running hours of the electricity generator on Galoa Island and Satellite SeafoodsPty (Fiji) Ltd if the need arises, will be borne by Satellite Seafoods Pty (Fiji) Ltd.
9. Progress meetings between the people of Galoa Island and Satellite will be conducted every threemonths in the presence of officials from Fisheries Division and the Bua Provincial office. Financial reports willbe compiled and presented by the company accountant to the Fisheries Division and the Bua Provincial Office.
10. Satellite Seafoods Pty (Fiji) Ltd will offer shares to the people of Galoa Island/Bua Province aftertwelve months of operation. These will be reviewed at the three monthly meetings. The first twelve monthsshould see Satellite Seafoods Pty (Fiji) Ltd on a sound footing.
11. Fishing gears for the purpose of catching live reef fish will be provided by Satellite Seafoods Pty (Fiji)Ltd free of charge initially. However fishermen will be required to purchase their own from the company after this.
12. Satellite Seafoods Pty (Fiji) Ltd will wherever possible assist the local fishermen in the marketing ofthe by-catch (any dead fish or species not suitable for the live reef fish trade).
Signatories Galoa Island rep.Galoa Island rep.Galoa Island rep.Satellite Seafoods Pty (Fiji) LtdFisheries DivisionBua Provincial Council
APPENDIX I
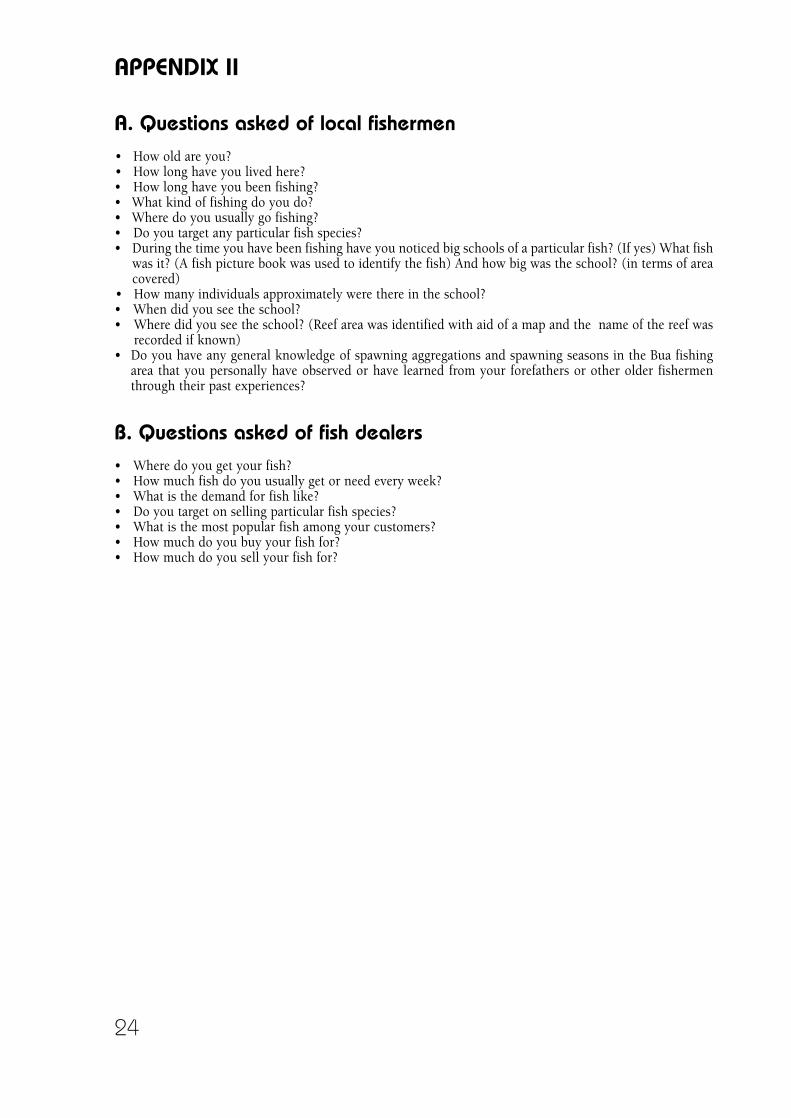
A. Questions asked of local fishermen• How old are you?• How long have you lived here?• How long have you been fishing?• What kind of fishing do you do?• Where do you usually go fishing?• Do you target any particular fish species?• During the time you have been fishing have you noticed big schools of a particular fish? (If yes) What fish
was it? (A fish picture book was used to identify the fish) And how big was the school? (in terms of areacovered)
• How many individuals approximately were there in the school? • When did you see the school? • Where did you see the school? (Reef area was identified with aid of a map and the name of the reef was
recorded if known) • Do you have any general knowledge of spawning aggregations and spawning seasons in the Bua fishing
area that you personally have observed or have learned from your forefathers or other older fishermenthrough their past experiences?
B. Questions asked of fish dealers• Where do you get your fish?• How much fish do you usually get or need every week?• What is the demand for fish like? • Do you target on selling particular fish species?• What is the most popular fish among your customers?• How much do you buy your fish for?• How much do you sell your fish for?
APPENDIX II
24
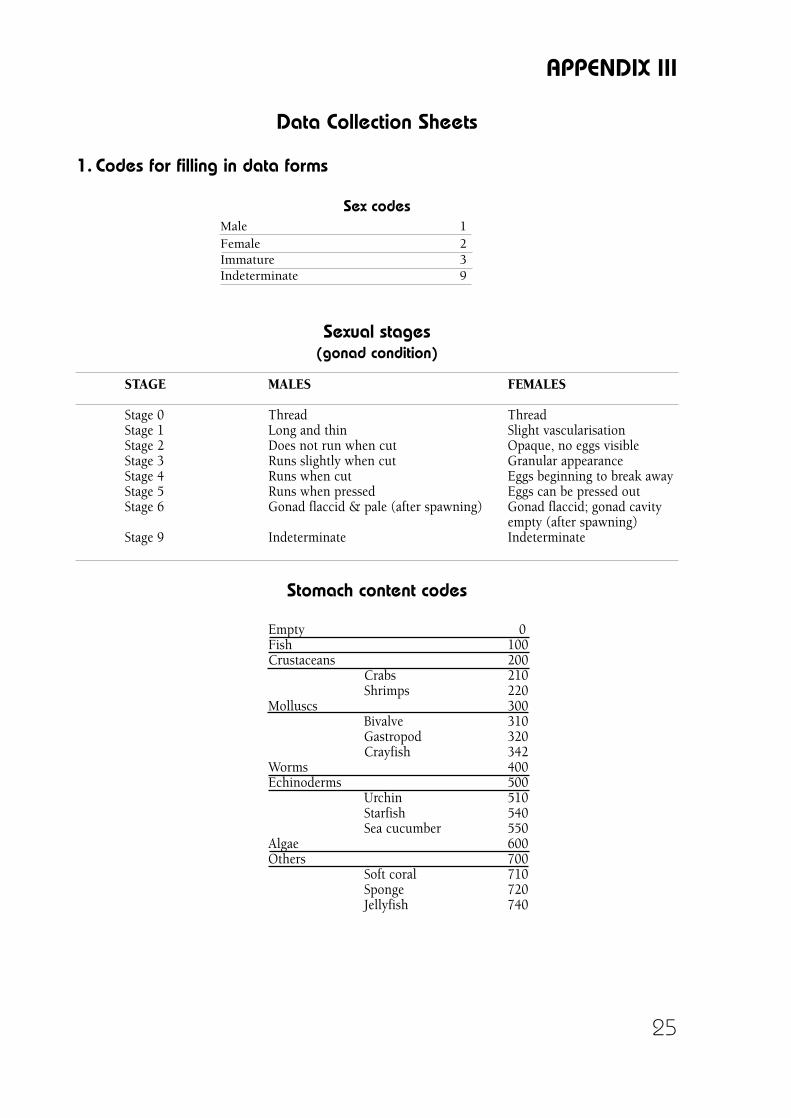
25
Data Collection Sheets
1. Codes for filling in data forms
Sex codesMale 1Female 2Immature 3Indeterminate 9
Sexual stages(gonad condition)
STAGE MALES FEMALES
Stage 0 Thread ThreadStage 1 Long and thin Slight vascularisationStage 2 Does not run when cut Opaque, no eggs visibleStage 3 Runs slightly when cut Granular appearanceStage 4 Runs when cut Eggs beginning to break awayStage 5 Runs when pressed Eggs can be pressed outStage 6 Gonad flaccid & pale (after spawning) Gonad flaccid; gonad cavity
empty (after spawning)Stage 9 Indeterminate Indeterminate
Stomach content codes
Empty 0Fish 100Crustaceans 200
Crabs 210Shrimps 220
Molluscs 300Bivalve 310Gastropod 320Crayfish 342
Worms 400Echinoderms 500
Urchin 510Starfish 540Sea cucumber 550
Algae 600Others 700
Soft coral 710Sponge 720Jellyfish 740
APPENDIX III
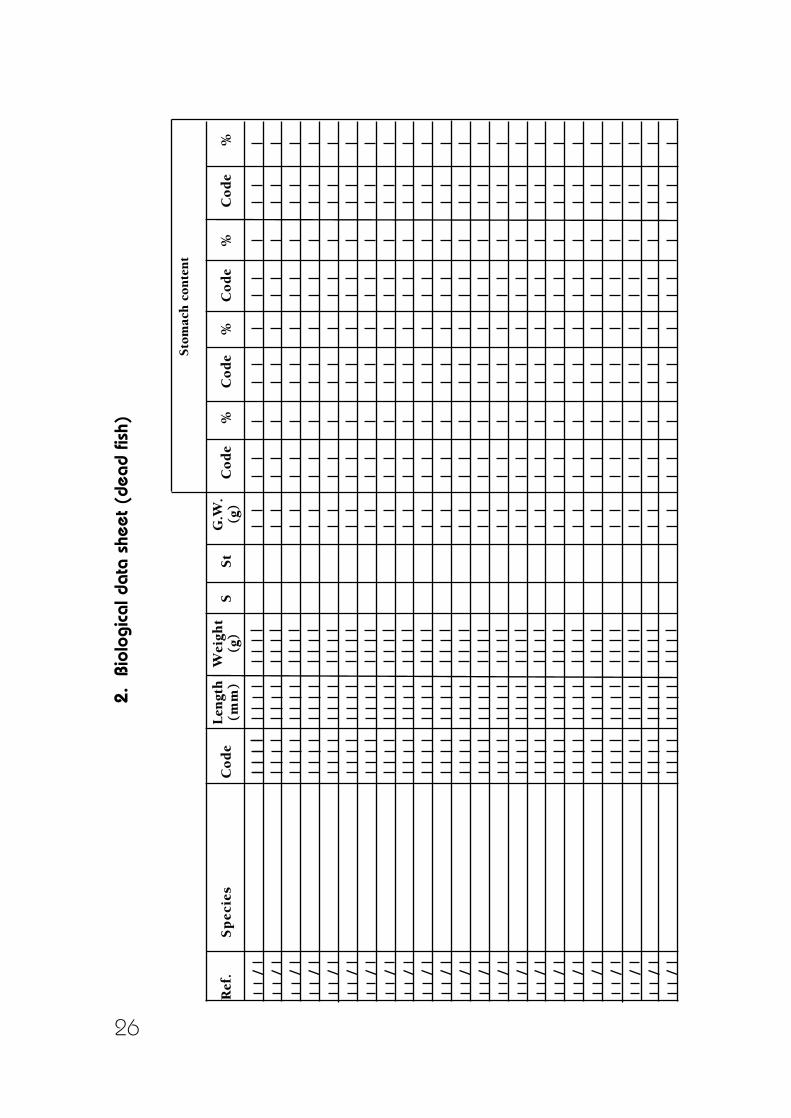
2.
Biol
ogic
al d
ata
shee
t (de
ad fi
sh)
Ref
.S
pec
ies
Co
de
Len
gth
(mm
)W
eigh
t(g
)S
St
G.W
.(g
)C
od
e%
Co
de
%C
od
e%
Co
de
%
Sto
mac
h c
onte
nt
Sto
mac
h c
onte
nt
26
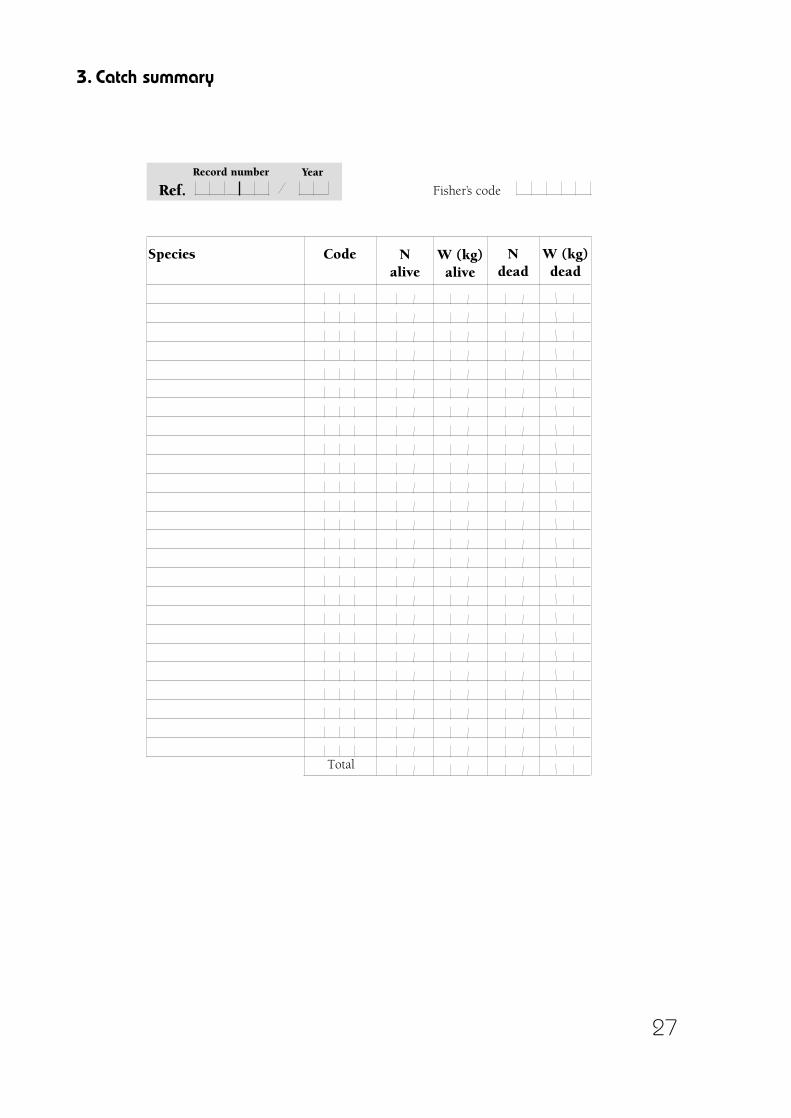
27
3. Catch summary
Species
Ref.Record number Year
Fisher’s code
Code Nalive
W (kg)alive
Ndead
W (kg)dead
Total
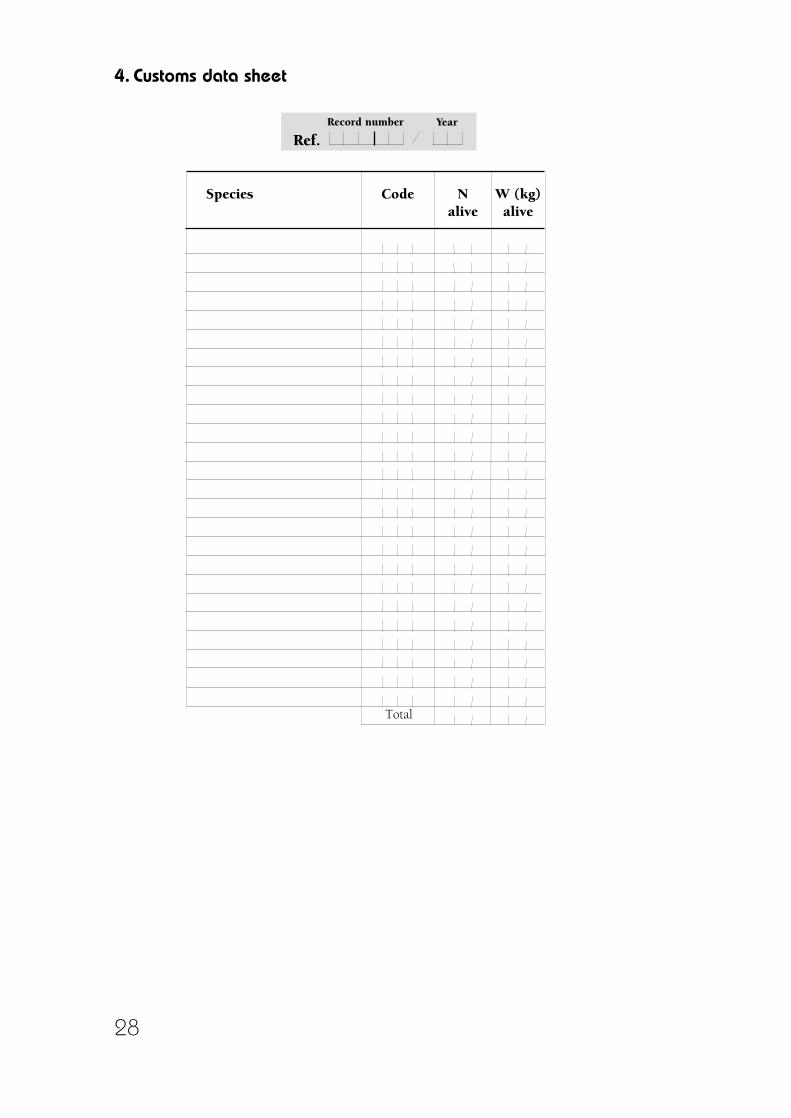
Species
Ref.Record number Year
Code Nalive
W (kg)alive
Total
4. Customs data sheet
28
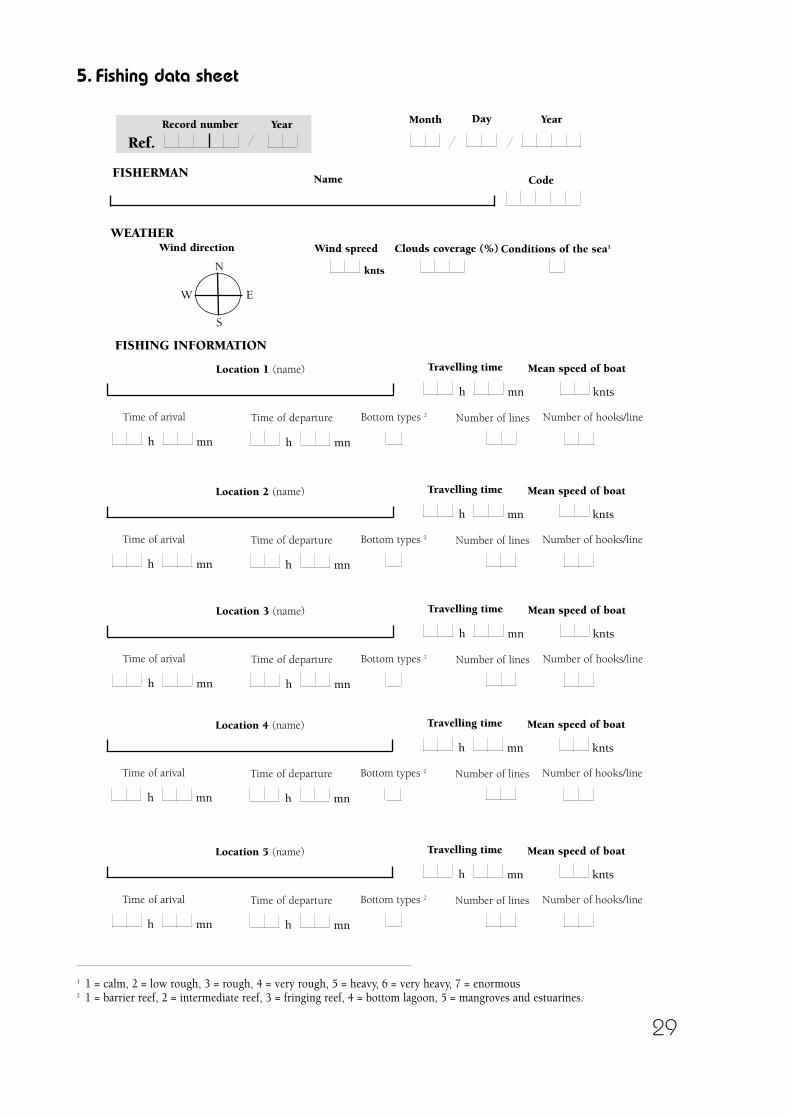
29
5. Fishing data sheet
Ref.Record number Year
FISHERMAN
YearMonth Day
Name Code
WEATHERWind direction
N
EW
S
Wind spreed Conditions of the sea1Clouds coverage (%)
knts
FISHING INFORMATION
Location 1 (name)
h mn knts
Travelling time Mean speed of boat
h mn
Time of arival
h mn
Time of departure Number of lines Number of hooks/lineBottom types 2
Location 2 (name)
h mn knts
Travelling time Mean speed of boat
h mn
Time of arival
h mn
Time of departure Number of lines Number of hooks/lineBottom types 2
Location 4 (name)
h mn knts
Travelling time Mean speed of boat
h mn
Time of arival
h mn
Time of departure Number of lines Number of hooks/lineBottom types 2
Location 5 (name)
h mn knts
Travelling time Mean speed of boat
h mn
Time of arival
h mn
Time of departure Number of lines Number of hooks/lineBottom types 2
Location 3 (name)
h mn knts
Travelling time Mean speed of boat
h mn
Time of arival
h mn
Time of departure Number of lines Number of hooks/lineBottom types 2
1 1 = calm, 2 = low rough, 3 = rough, 4 = very rough, 5 = heavy, 6 = very heavy, 7 = enormous2 1 = barrier reef, 2 = intermediate reef, 3 = fringing reef, 4 = bottom lagoon, 5 = mangroves and estuarines.
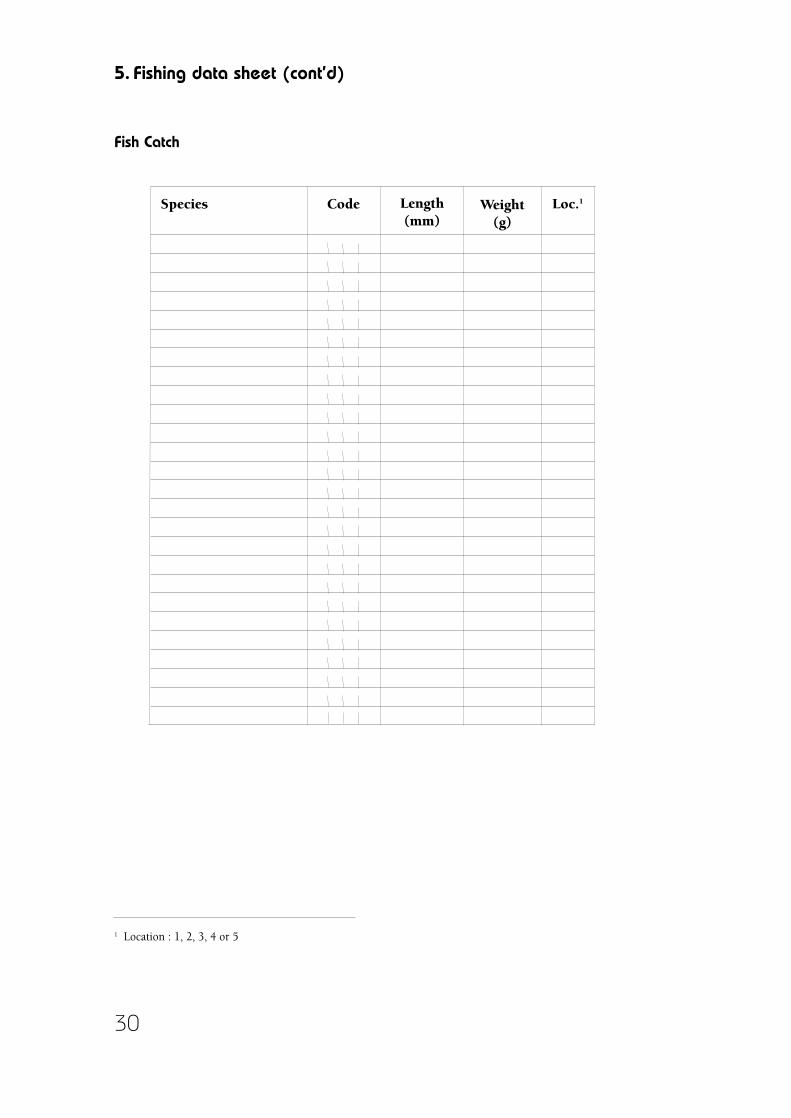
Species Code Length(mm)
Weight(g)
Loc.1
1 Location : 1, 2, 3, 4 or 5
5. Fishing data sheet (cont’d)
Fish Catch
30


![ireef-doc429[1] - fewslinux.free.frfewslinux.free.fr/FSP/RGT/DTU13_2_P1.pdf.pdf · Généré par i-Reef - Edition S144 - juin 2006 Document : P11-212-1 (DTU 13.2) (septembre 1992)](https://img.pdfslide.fr/doc/110x75/5a78e6607f8b9a9d218b4a53/ireef-doc4291-par-i-reef-edition-s144-juin-2006-document-p11-212-1-dtu.jpg)