Embed Size (px)
Citation preview
PHYSICAL REVIE%' B VOLUME SO, NUMBER 23 15 DECEMBER 1994-I
Thermal relaxatien ef Ag(111)
Laurent J. Lewis'Departement de Physique et Groupe de Recherche en Physique et Technologie des Couches Minces, Universite de Montreal,
Case Postale 6128, Succursale Centre Vil-le, Montreal, Quebec, Canada IISCSJ7(Received 15 July 1994)
We present the results of an exnbedded-atom-xnethod molecular-dynamics simulation of the ther-mal relaxation of Ag(11].). Contrary to recent medium-energy ion-scattering experiments [P. Statiriset al. , Phys. Rev. Lett. 72, 3574 (1994)], which find that a change in the sign of the surface relax-ation takes place upon heating above 750 K (from contraction to expansion), we find the surfacelayer to relax inmards at all temperatures. The calculated mean-square amplitudes of vibration,on the other hand, agree quite mell mith experiment. The xnodel, in addition, shoms evidence ofpremelting at a temperature of about 1000 K.
Crystalline surfaces, because they have a syxnmetrywhich is reduced compared to the bulk, are expectedto be strongly anharmonic, and this should be manifestin such quantities as mean-square amplitudes of vibra-tion, phonon line shapes, and thermal expansion. In-deed, an anomalous thermal expansion has been directlyobserved on some metallic surfaces, viz. Ni(100) (Ref. 1)and Pb(110),2 while other properties can be interpretedin terms of enhanced anharmonicity. Surfaces, in addi-tion, sufFer from an asymmetry of the restoring forces,which causes them to relax from their bulk crystallineconfiguration. Most metallic surfaces relax inwards atlow temperature. In view of the large thermal expan-sion coeKcient that some of them exhibit, therefore, itmay very well be that a crossover from a contractionat low texnperatures to an expansion at high tempera-tures (i.e., a change in the sign of the relaxation) willtake place —a behavior predicted several years ago byAllen and de Wette (for noble gases). 4 While some sur-faces are known to relax outwards, an "inwards-outwardstransition" has been observed only recently, on the (ill)surface of Ag, by Statiris, Lu, and Gustafsson (SLG),s
using medium-energy ion scattering (MEIS): For this sys-texn, the first interlayer spacing is found to contract byabout —2.5% (compared to the bulk value) at tempera-tures up to about 670 K; at this point, a dramatic in-crease takes place, and at 750 K, the contraction turnsinto an expansion, reaching a value of +10% at 1150 K.Hints of such a behavior existed for Ni(100), which ex-hibits a thermal expansion 20 times the bulk value attemperatures close to melting, ~ while an ion backscat-tering study finds it to contract by —3.2% at low temper-ature (390 K). A strength of MEIS is that it providesalmost direct inforxnation about the interlayer separa-tion compared to other techniques, such as low-energyelectron diffraction, elastic He scattering, and electronenergy-loss spectroscopy.
In the hope of understanding a little better the physicsof the Ag(ill) surface, and possibly providing informa-tion that cannot be afforded by experiment, we have car-ried out a detailed inolecular-dynamics (MD) study ofthis surface, using the embedded-atom method (EAM)to model the interactions between the atoms. This fol-
lows from our previous MD study of the Ni(100) andNi(110) surfaces, 9 which quite accurately reproduced theobserved anharmonic efFects, including thermal expan-sion. In contrast to this, we find here the EAM results tobe in disagreement with SLG's observation of a changein sign of the relaxation of the surface. Our calculationsreveal that the surface layer, at all temperatures, relaxesinwards, the displacement varying between about —1.4%(of the bulk value) at 200 K to a little less than 0 at1100 K. These results, as well as our data for the mean-square amplitudes of vibration (MSAV's), are discussedin the present paper. First, however, we give details ofthe calculations.
In order to model the Ag(111) surface, slabs were con-structed consisting of a series of fcc(111) layers perpen-dicular to the z axis. Size effects were assessed by consid-ering two difFerent slabs: the first consisted of 12 layerseach with 48 atoms (total 576), while the second had 18layers each with 192 atoms (total 3456). We found thethermal relaxation of the first few layers to be virtuallyindependent of the size, while the statistical accuracy ofthe MSAV's is greatly improved in the larger system.We will, therefore, only discuss the results for the 3456-particle system in what follows. As mentioned above,the interactions between Ag atoms were modeled withinthe framework of the HAM, using the paraxnetrizationproposed by Adams, Foiles, and Wolfer (AFW). io
Periodic boundary conditions were employed in thez and y directions, while the surface was let free inthe z direction. However, in order to mimic a (semi-infinite) bulk crystal, the atoms in the bottom two layersof the slab were held fixed in their ideal bulk positions,with a temperature-dependent lattice parameter a deter-mined from an independent series of constant-pressureruns. This procedure is used routinely in MD calcula-tions; while the layers neighboring the rigid simulatedbulk may be perturbed by its presence, the effect on thesurface will be small if the slab is suKciently thick.
The surface calculations were carried out in the canon-ical ensemble, using a Nose therxnostat to control thetemperature. Seven different temperatures were inves-tigated in the range 200—1100 K (Ag melts at 1170 Kin the EAM, i compared to 1234 K in real life). The
0163-1829/94/50(23)/17693(4)/$06. 00 50 17 693 1994 The American Physical Society
17 694 BRIEF REPORTS
4.20
4.16
4.12
408 ~~-,
'~ s
400 800 1200T t'K)
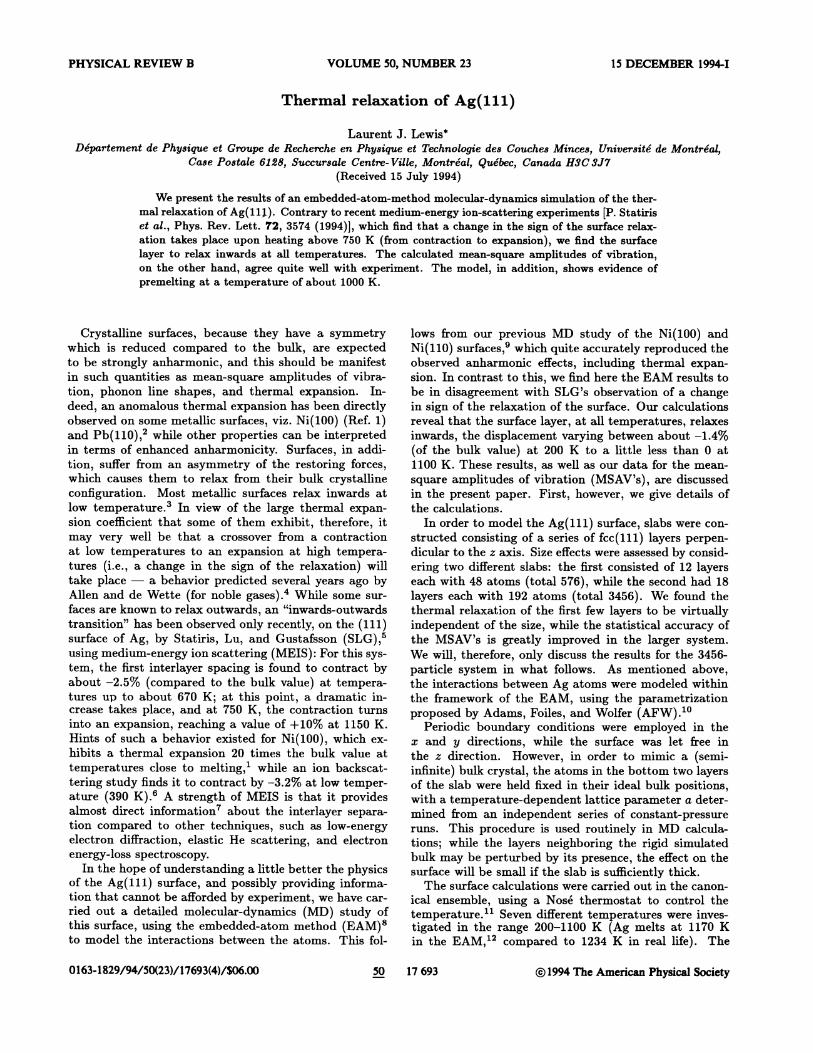
FIG. 1. (a) Lattice parameter a as a function of temperaturefor the MD-RAM model (solid circles) and from experiment (opencircles, Ref. 13). (b) Corresponding thermal expansion coefficients,air = (1/a)do/dT
timestep was in all cases set to 3.0 fs which, we find,leads to an excellent conservation of energy. At each tem-perature, the system was first equilibrated during 40000time steps (120 ps), then statistics accumulated duringan additional 30000 time steps (90 ps).
In order to assess the accuracy of EAM in describingthe thermal behavior of silver, we have calculated thebulk linear thermal expansion coefficient. The results areshown in Fig. l. In panel (a), we give the temperature de-pendence of the lattice parameter (full circles), and com-pare it to experiment (open circles —Ref. 13). Evidently,EAM overestimates a slightly (and systematically); thisis due to the EAM-fitting procedure, which uses the mea-sured room temperature lattice parameter to fix the valueof a at zero temperature. Most important for our pur-poses, the slope of a appears to be well reproduced byEAM. This is more clearly visible in Fig. 1(b), where we
plot the thermal expansion coefficient n~ = (1/a)da/dT.Calculated and measured values agree to within about10%%uo at all temperatures, except the lowest: since ourcalculation is purely classical, quantum effects, which areimportant below the Debye temperature (215 K for Ag),are not accounted for. Our calculation, of course, alsoneglects the electronic contribution.
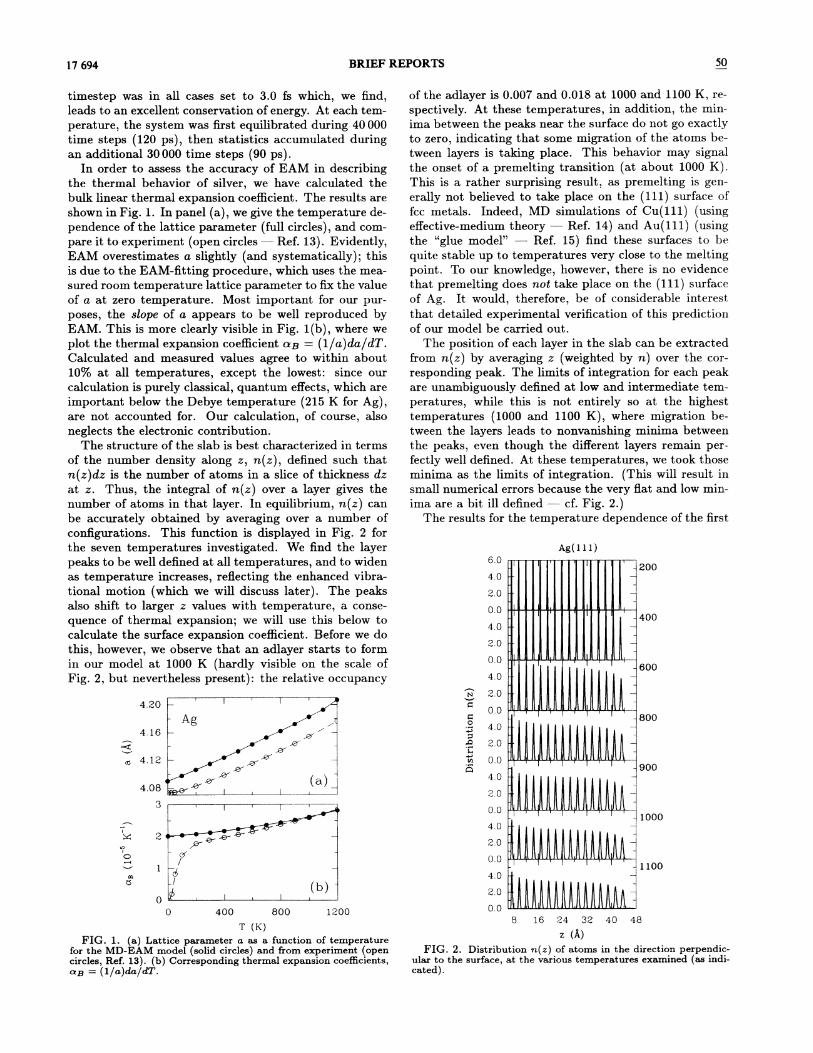
The structure of the slab is best characterized in termsof the number density along z, n(z), defined such thatn(z)dz is the number of atoms in a slice of thickness dzat z. Thus, the integral of n(z) over a layer gives thenumber of atoms in that layer. In equilibrium, n(z) canbe accurately obtained by averaging over a number ofconfigurations. This function is displayed in Fig. 2 forthe seven temperatures investigated. We find the layerpeaks to be well defined at all temperatures, and to widenas temperature increases, re8ecting the enhanced vibra-tional motion (which we will discuss later). The peaksalso shift to larger z values with temperature, a conse-quence of thermal expansion; we will use this below tocalculate the surface expansion coeKcient. Before we dothis, however, we observe that an adlayer starts to formin our model at 1000 K (hardly visible on the scale ofFig. 2, but nevertheless present): the relative occupancy
Ag(111)
—2004.0--2,0
Q QI I t s, I
—4004,0
2.0I.
—600402.0
0 Q, ,l . I, ii, I I, i s i, ili i i iI I ! Il, l,'il ! I I i J L
4 Q
P, , O4
0 Q, JIIhlIIJ IItiIiliiis I! II! Is!!LJIIJL
!2.0
0 o, ii i i i i ii I i ilI i~li li i i I II [il i li!- 1000
2.0
0 Q, II I I I I J l L i i i i I J l & I J i i ! l l J i I IJL
— 11004.0
, I'll, iil~ll!I i II,IIIIII'!l8 16 24 32 40 48. (A)
FIG. 2. Distribution n(z) of atoms in the direction perpendic-ular to the surface, at the various temperatures examined (as indi-cated).
I, III, i I I i I IL lit
of the adlayer is 0.007 and 0.018 at 1000 and 1100 K, re-spectively. At these temperatures, in addition, the min-
ima between. the peaks near the surface do not go exactlyto zero, indicating that some migration of the atoms be-tween layers is taking place. This behavior may signalthe onset of a premelting transition (at about 1000 K).This is a rather surprising result, as premelting is gen-erally not believed to take place on the (ill) surface offcc metals. Indeed, MD simulations of Cu(ill) (usingefFective-medium theory —Ref. 14) and Au(ill) (usingthe "glue model" —Ref. 15) find these surfaces to bequite stable up to temperatures very close to the meltingpoint. To our knowledge, however, there is no evidencethat premelting does not take place on the (ill) surfaceof Ag. It would, therefore, be of considerable interestthat detailed experimental verification of this predictionof our model be carried out.
The position. of each layer in the slab can be extractedfrom n(z) by averaging z (weighted by n) over the cor-responding peak. The limits of integration for each peakare unambiguously defined at low and intermediate tem-peratures, while this is not entirely so at the highesttemperatures (1000 and 1100 K), where migration be-tween the layers leads to nonvanishing minima betweenthe peaks, even though the different layers remain per-fectly well defined. At these temperatures, we took thoseminima as the limits of integration. (This will result insmall numerical errors because the very Hat and low min-ima are a bit ill defined —cf. Fig. 2.)
The results for the temperature dependence of the first
50 BRIEF REPORTS 17 695
2(b)
~34
o —1QP
0
400T (K)
800 1200
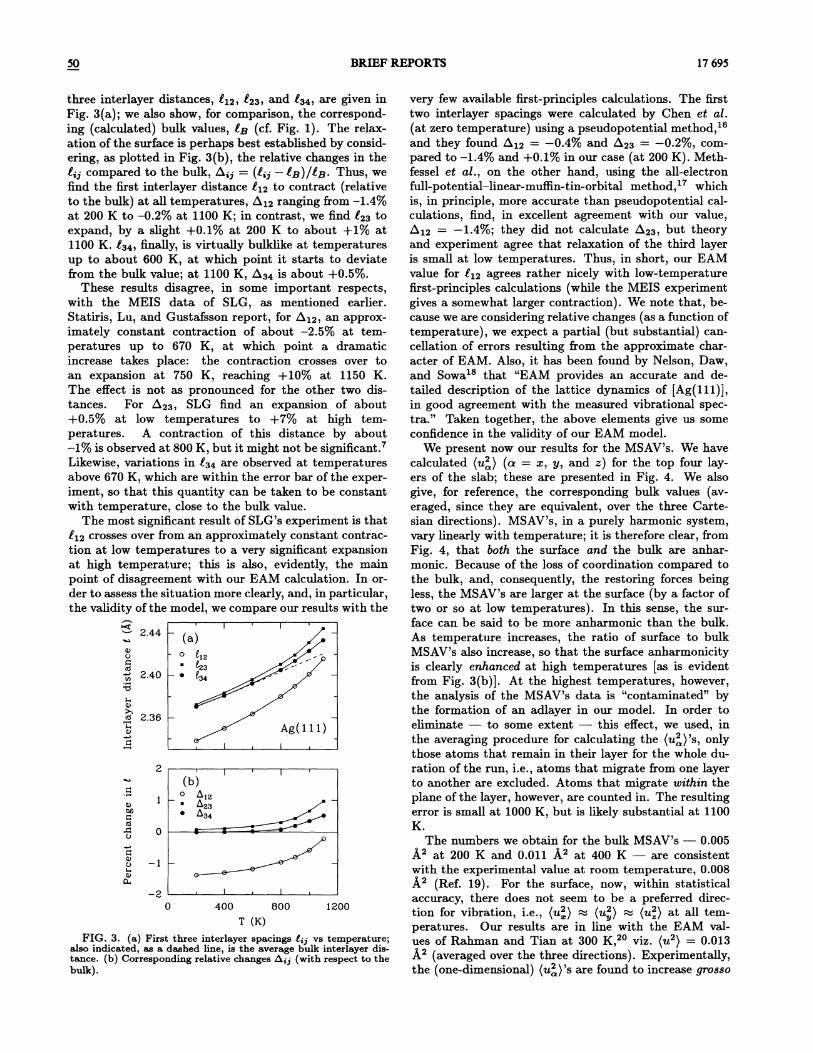
FIG. 3. (a) First three interlayer spacings E,z vs temperature;also indicated, as a dashed line, is the average bulk interlayer dis-tance. (b) Corresponding relative changes A;z (with respect to thebulk).
three interlayer distances, Zq2, 823 and 834 are given inFig. 3(a); we also show, for comparison, the correspond-ing (calculated) bulk values, E~ (cf. Fig. 1). The relax-ation of the surface is perhaps best established by consid-ering, as plotted in Fig. 3(b), the relative changes in the8;z compared to the bulk, b„.z
——(l;z —I~)/I~. Thus, wefind the first interlayer distance E&2 to contract (relativeto the bulk) at all temperatures, b, qz ranging from —1.4%%uo
at 200 K to —0.2%%up at 1100 K; in contrast, we find 823 toexpand, by a slight +0.1% at 200 K to about +1% at1100 K. 834 finally, is virtually bulklike at temperaturesup to about 600 K, at which point it starts to deviatefrom the bulk value; at 1100 K, 634 is about +0.5%%uo.
These results disagree, in some important respects,with the MEIS data of SLG, as mentioned earlier.Statiris, Lu, and Gustafsson report, for Lq2, an approx-imately constant contraction of about —2.5% at tem-peratures up to 670 K, at which point a dramaticincrease takes place: the contraction crosses over toan expansion at 750 K, reaching +10% at 1150 K.The effect is not as pronounced for the other two dis-tances. For 623, SLG find an expansion of about+0.5'%%up at low temperatures to +7'%%up at high tem-peratures. A contraction of this distance by about—1% is observed at 800 K, but it might not be significant.Likewise, variations in 834 are observed at temperaturesabove 670 K, which are within the error bar of the exper-iment, so that this quantity can be taken to be constantwith temperature, close to the bulk value.
The most significant result of SLG's experiment is thatEq2 crosses over &om an approximately constant contrac-tion at low temperatures to a very significant expansionat high temperature; this is also, evidently, the mainpoint of disagreement with our EAM calculation. In or-der to assess the situation more clearly, and, in particular,the validity of the model, we compare our results with the
II
II
I
2.44~a
O 0t
2.40 —~~~
2.36—
very few available first-principles calculations. The firsttwo interlayer spacings were calculated by Chen et al.(at zero temperature) using a pseudopotential method, M
and they found b, q2 = —0.4% and A2s ———0.2%, com-pared to —1.4% and +0.1% in our case (at 200 K). Meth-fessel et al. , on the other hand, using the all-electronfull-potential —linear-muKn-tin-orbital method, ~7 whichis, in principle, more accurate than pseudopotential cal-culations, find, in excellent agreement with our value,b, lz ———1.4%; they did not calculate b,2s, but theoryand experiment agree that relaxation of the third layeris small at low temperatures. Thus, in short, our EAMvalue for Zq2 agrees rather nicely with low-temperaturefirst-principles calculations (while the MEIS experimentgives a somewhat larger contraction). We note that, be-cause we are considering relative changes (as a function oftemperature), we expect a partial (but substantial) can-cellation of errors resulting &om the approximate char-acter of EAM. Also, it has been found by Nelson, Daw,and Sowa that "EAM provides an accurate and de-tailed description of the lattice dynamics of [Ag(111)],in good agreement with the measured vibrational spec-tra." Taken together, the above elements give us someconfidence in the validity of our EAM model.
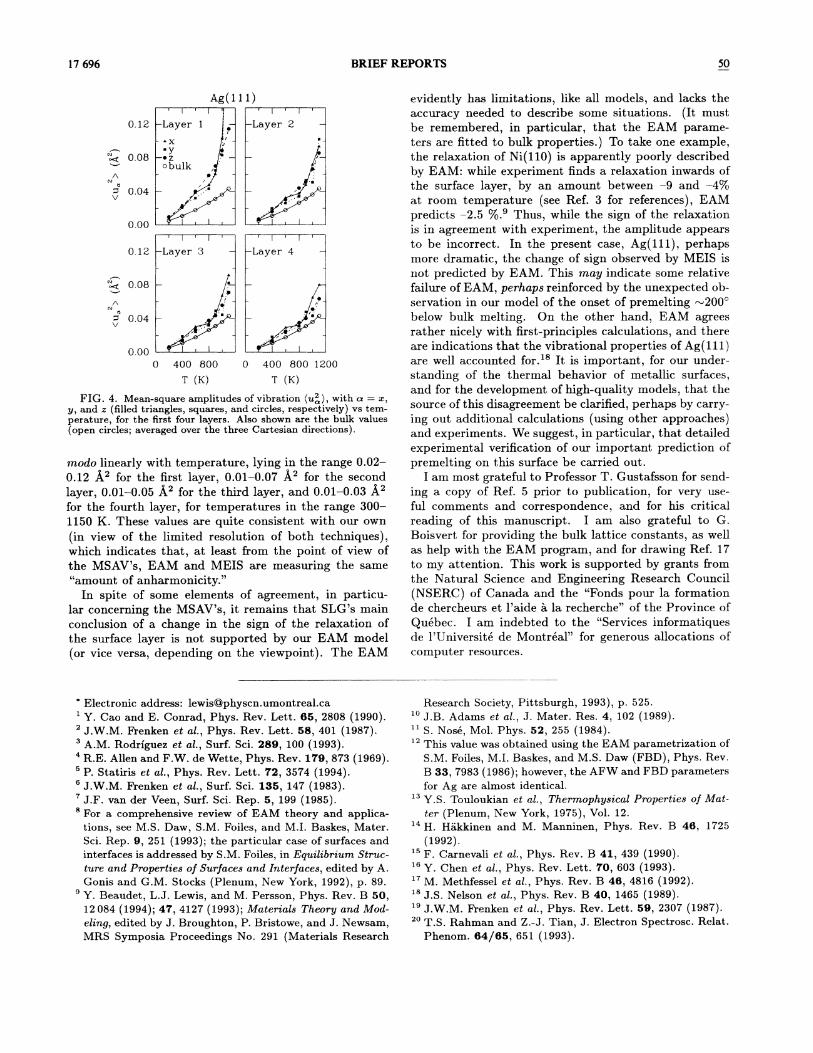
We present now our results for the MSAV's. We havecalculated (u2) (cr = x, y, and z) for the top four lay-ers of the slab; these are presented in Fig. 4. We alsogive, for reference, the corresponding bulk values (av-eraged, since they are equivalent, over the three Carte-sian directions). MSAV's, in a purely harmonic system,vary linearly with temperature; it is therefore clear, &omFig. 4, that both the surface and the bulk are anhar-monic. Because of the loss of coordination compared tothe bulk, and, consequently, the restoring forces beingless, the MSAV's are larger at the surface (by a factor oftwo or so at low temperatures). In this sense, the sur-face can be said to be more anharrnonic than the bulk.As temperature increases, the ratio of surface to bulkMSAV's also increase, so that the surface anharmonicityis clearly enhanced at high temperatures [as is evidentfrom Fig. 3(b)]. At the highest temperatures, however,the analysis of the MSAV's data is "contaminated" bythe formation of an adlayer in our model. In order toeliminate —to some extent —this effect, we used, inthe averaging procedure for calculating the (u )'s, onlythose atoms that remain in their layer for the whole du-ration of the run, i.e., atoms that migrate &om one layerto another are excluded. Atoms that migrate within theplane of the layer, however, are counted in. The resultingerror is small at 1000 K, but is likely substantial at 1100K.
The numbers we obtain for the bulk MSAV's —0.005A.2 at 200 K and 0.011 A2 at 400 K —are consistentwith the experimental value at room temperature, 0.008
(Ref. 19). For the surface, now, within statisticalaccuracy, there does not seem to be a preferred direc-tion for vibration, i.e., (u ) (u2) (u2) at all tem-peratures. Our results are in line with the EAM val-ues of Rahman and Tian at 300 K,2P viz. (u2) = 0.013A.2 (averaged over the three directions). Experimentally,the (one-dimensional) (u )'s are found to increase grosso
17 696 BRIEF REPORTS
Ag(111)I
II
I II
0.12 -Layer 1
II
II
I
-Layer 2
0.08 —~0
0.04V
0.00I
II
I
0.12 -Layer 3I
lI
I
—Layer 4
0.08
0.04V
0.000 400 800 0 400 800 1200
T (K) T (K)
FIG. 4. Mean-square amplitudes of vibration (us~), with a = z,y, and z (filled triangles, squares, and circles, respectively) vs tem-perature, for the 6rst four layers. Also shown are the bulk values(open circles; averaged over the three Cartesian directions).
modo linearly with temperature, lying in the range 0.02—0.12 Az for the first layer, 0.01—0.07 A2 for the secondlayer, 0.01—0.05 A.2 for the third layer, and 0.01—0.03 Az
for the fourth layer, for temperatures in the range 300—1150 K. These values are quite consistent with our own
(in view of the limited resolution of both techniques),which indicates that, at least &om the point of view ofthe MSAV's, EAM and MEIS are measuring the same"amount of anharmonicity. "
In spite of some elements of agreement, in particu-lar concerning the MSAV's, it remains that SLG's mainconclusion of a change in the sign of the relaxation ofthe surface layer is not supported by our EAM model(or vice versa, depending on the viewpoint). The EAM
evidently has limitations, like all models, and lacks theaccuracy needed to describe some situations. (It mustbe remembered, in particular, that the EAM parame-ters are fitted to bulk properties. ) To take one example,the relaxation of Ni(110) is apparently poorly describedby EAM: while experiment 6nds a relaxation inwards ofthe surface layer, by an amount between —9 and —4%at room temperature (see Ref. 3 for references), EAMpredicts —2.5 %. Thus, while the sign of the relaxationis in agreement with experiment, the amplitude appearsto be incorrect. In the present case, Ag(111), perhapsmore dramatic, the change of sign observed by MEIS isnot predicted by EAM. This may indicate some relativefailure of EAM, perhaps reinforced by the unexpected ob-servation in our model of the onset of premelting 200'below bulk melting. On the other hand, EAM agreesrather nicely with 6rst-principles calculations, and thereare indications that the vibrational properties of Ag(111)are well accounted for. It is important, for our under-standing of the thermal behavior of metallic surfaces,and for the development of high-quality models, that thesource of this disagreemeat be clarified, perhaps by carry-ing out additional calculations (using other approaches)and experiments. We suggest, in particular, that detailedexperimental verification of our important prediction ofpremelting on this surface be carried out.
I am most grateful to Professor T. Gustafsson for send-ing a copy of Ref. 5 prior to publication, for very use-ful comments and correspondence, and for his criticalreading of this manuscript. I am also grateful to G.Boisvert for providing the bulk lattice constants, as wellas help with the EAM program, and for drawing Ref. 17to my attention. This work is supported by grants &omthe Natural Science and Engineering Research Council(NSERC) of Canada and the "Fonds pour la formationde chercheurs et 1'aide a la recherche" of the Province ofQuebec. I am indebted to the "Services informatiquesde 1'Universite de Montreal" for generous allocations ofcomputer resources.
' Electronic address: lewisphyscn. umontreal. caY. Cao and E. Conrad, Phys. Rev. Lett. 65, 2808 (1990).J.W.M. Frenken et al. , Phys. Rev. Lett. 58, 401 (1987).A.M. Rodriguez et aL, Surf. Sci. 289, 100 (1993).R.E. Allen and F.W. de Wette, Phys. Rev. 179, 873 (1969).P. Statiris et al. , Phys. Rev. Lett. 72, 3574 (1994).J.W.M. Frenken et aL, Surf. Sci. 185, 147 (1983).J.F. van der Veen, Surf. Sci. Rep. 5, 199 (1985).For a comprehensive review of EAM theory and applica-tions, see M.S. Daw, S.M. Foiles, and M.I. Baskes, Mater.Sci. Rep. 9, 251 (1993); the particular case of surfaces andinterfaces is addressed by S.M. Foiles, in Equilibrium Struc-ture and Properties of Surfaces and Interfaces, edited by A.Gonis and G.M. Stocks (Plenum, New York, 1992), p. 89.Y. Beaudet, L.J. Lewis, and M. Persson, Phys. Rev. B 50,12 084 (1994); 47, 4127 (1993);Materials Theory and Mod-
eling, edited by J. Broughton, P. Bristowe, and 3. Newsam,MRS Symposia Proceedings No. 291 (Materials Research
Research Society, Pittsburgh, 1993), p. 525.J.B. Adams et al , 3. Mater. Re. s. 4, 102 (1989)."S.Nose, Mol. Phys. 52, 255 (1984).This value was obtained using the EAM parametrization ofS.M. Foiles, M.I. Baskes, and M.S. Daw (FBD), Phys. Rev.B 33, 7983 (1986); however, the AFW and FBD parametersfor Ag are almost identical.Y.S. Touloukian ct al. , Therrnophysica/ Properties of Matter (Plenum, New York, 1975), Vol. 12.H. Hakkinen and M. Manninen, Phys. Rev. B 46, 1725(1992).F. Carnevali et aL, Phys. Rev. B 41, 439 (1990).Y. Chen et aL, Phys. Rev. Lett. 70, 603 (1993).M. Methfessel et al. , Phys. Rev. B 46, 4816 (1992).3.S. Nelson et al , Phys. Rev. B 40, 14. 65 (1989).J.W.M. Frenken et al. , Phys. Rev. Lett. 59, 2307 (1987).T.S. Rahman and Z.-3. Tian, 3. Electron Spectrosc. Relat.Phenom. 64/65, 651 (1993).