Embed Size (px)
Citation preview
UNIVERSITÉ DU QUÉBEC À MONTRÉAL
LES ISOTOPES DES FAMILLES U & Th:
UN REGARD SUR LA DYNAMIQUE SÉDIMENTAIRE DE LA BAIE DE
BAFFIN ET DU NORD-OUEST DE LA MER DU LABRADOR
AU COURS DU DERNIER CYCLE GLACIAIRE
THÈSE
PRÉSENTÉE
COMME EXIGENCE PARTIELLE
DU DOCTORAT EN SCIENCES DE LA TERRE ET DE L'ATMOSPHÈRE
PAR
LAURENCE NUTTIN
MAI 2014
UNIVERSITÉ DU QUÉBEC À MONTRÉAL Service des bibliothèques
Avertissement
La diffusion de cette thèse se fait dans le respect des droits de son auteur, qui a signé le formulaire Autorisation de reproduire et de diffuser un travail de recherche de cycles supérieurs (SDU-522 - Rév.01-2006). Cette autorisation stipule que «conformément à l'article 11 du Règlement no 8 des études de cycles supérieurs, [l 'auteur] concède à l'Université du Québec à Montréal une licence non exclusive d'utilisation et de publication de la totalité ou d'une partie importante de [son] travail de recherche pour des fins pédagogiques et non commerciales. Plus précisément, [l 'auteur] autorise l'Université du Québec à Montréal à reproduire, diffuser, prêter, distribuer ou vendre des copies de [son] travail de recherche à des fins non commerciales sur quelque support que ce soit, y compris l'Internet. Cette licence et cette autorisation n'entraînent pas une renonciation de [la] part [de l'auteur] à [ses] droits moraux ni à [ses] droits de propriété intellectuelle. Sauf entente contraire, [l 'auteur] conserve la liberté de diffuser et de commercialiser ou non ce travail dont [il] possède un exemplaire.»

1-
AVANT-PROPOS
La thèse présentée dans ce document est intitulée « Les isotopes des familles U & Th:
un regard sur la dynamique sédimentaire de la baie de Baffin et du nord-ouest de la
mer du Labrador au cours du dernier cycle glaciaire ». Elle a été rédigée sous la
forme de deux chapitres majeurs, en langue anglaise, chacun correspondant à un
article à soumettre dans une revue scientifique pour publication. Les chapitres sont
encadrés par une introduction et une conclusion générale, en accord avec les
directives de l'Université du Québec à Montréal. Le choix du sujet est directement
issu d'un des thèmes d'étude du centre de recherche du GEOTOP sur les variabilités
passées de l' océan et du climat.
Les deux chapitres traitent des résultats de 1' analyse de sédiments marins profonds
provenant de deux zones spécifiques : la mer du Labrador et la baie de Baffm, deux
bassins océaniques de l'Atlantique du Nord-Ouest. Les deux projets se concentrent
plus spécifiquement sur les isotopes de l ' uranium (U), du thorium (Th) et du
protactinium (Pa), et intègrent ceux-ci dans une approche multi-paramètres, i.e.
alliant les données isotopiques recueillies à d'autres propriétés sédimentologiques
(physiques, minéralogiques, géochimiques). L'entièreté des manipulations et des
mesures analytiques présentées dans ce document (à l'exception des mesures d' âges
radiocarbones) ont été réalisées dans les différents laboratoires du GEOTOP, et sous
l'encadrement des chercheurs qui en sont responsables. L'analyse statistique de
l'ensemble des données, la composition des figures, l'interprétation des résultats et la
rédaction des articles furent réalisées sous la supervision et les conseils du Professeur
Claude Hillaire-Marcel, directeur de cette thèse de doctorat.
Le premier chapitre correspond à un article qui a été soumis dans la revue Marine
Geology, ayant pour titre "U- and Th-series isotopes in deep Baffin Bay
lV
sediments: tracers of detrital sources and of contrasted glacial/ interglacial
sedimentary processes", avec Claude Hillaire-Marcel comme co-auteur. Cet article
traite de la distribution des isotopes de l'U et du Th dans une séquence sédimentaire
provenant de la plaine abyssale centrale de la baie de Baffm et s'étalant
temporellement sur les derniers ~ 115 ka (i.e. , le dernier cycle glaciawe ), afm de
retracer les processus et flux géochimiques et sédimentaires de la zone étudiée. Les
inventaires de 230Th en excès permettent d'étudier la dynamique particulaire en
relation avec la dynamique des calottes de glace de la région, la circulation océanique
dans la baie et les conditions climatiques associées.
Le deuxième chapitre, intitulé "U, Th and Pa insights into sedimentological and
paleoceanographic changes off Hudson Strait (Labrador Sea) during the fast ~37 ka
with special attention to methodological issues", correspond à un article qui a été
soumis dans la revue Quaternary Science Reviews et inclut Jenny Maccali et Claude
Hillaire-Marcel comme co-auteurs. Le sujet concerne l'étude d' une séquence
sédimentaire provenant d'un site localisé à proximité de 1 'embouchure du détroit
d'Hudson et enregistrant deux évènements de Heinrich récents (H2 et Hl). La
dynamique particulaire depuis le glaciaire tardif (i.e., les ~37 derniers ka) est
essentiellement évaluée à travers l'étude des variations du 230Th et du 231 Pa en excès
enregistrées dans la colonne sédimentaire. Elle est mise en relation avec les épisodes
de fonte de la calotte glaciaire des Laurentides, la circulation méridienne de
renversement de 1' océan Atlantique et les variations abruptes du climat associées.
Une attention particulière est portée aux processus et flux géochimiques et
sédimentaires, pour notamment en déduire les incertitudes potentielles sur
l'estimation de ces traceurs.
Enfm, un article intitulé "Authigenic, detrital and diagenetic minerais in the Laguna
Potrok Aike sediment sequence" a également été réalisé pendant la durée du doctorat
(voir Annexe A). Celui-ci a été publié dans la revue Quaternary Science Reviews en
v
2013, avec comme co-autems Pierre Francus, Michel Preda, Bassam Ghaleb et
Claude Hillaire-Marcel. Bien que sa rédaction ait permis d' acquérir les bases
géochimiques fondamentales à la bonne complétion de cette thèse, il n'est pas repris
comme chapitre à part entière pour assurer l'homogénéité du document final.
REMERCIEMENTS
A l' issue de ces années de recherche, je tiens tout d'abord à remercier mon directeur
de thèse, Claude Hillaire-Marcel. Je le remercie de m'avoir accordé sa confiance,
d'avoir partagé son expérience de par ses différentes interventions, de son soutien et
de m'avoir offert l'opportunité d'être son auxiliaire d'enseignement à deux reprises
dans son cours de géochimie isotopique.
Cette thèse n'aurait jamais pu être réalisée sans l' aide de Bassam Ghaleb, chercheur
au GEOTOP en géochimie isotopique, et éminent spécialiste des isotopes radioactifs.
Je le remercie chaleureusement pour m'avoir patiemment enseigné tout ce qu' il fallait
savoir sur les analyses chimiques nécessaires à l'isolement de l'uranium et du
thorium, et sur l'utilisation des instruments de mesure. Merci pour ta patience, tes
échanges stimulants, ton aide en tout temps, ta gentillesse, tes conseils, ton soutien,
ton écoute, et ton amitié.
Je voudrais également remercier l'ensemble de l'équipe PASADO pour les
recherches que j ' ai réalisées avec eux sur le lac Potrok Aike. Je remercie en
particulier et chaleureusement mon co-directeur sur ce projet, Pierre Francus, pour
son soutien et son encadrement scientifique. Bien que ce projet ne fasse plus partie
intégrante de ma thèse, il restera le sujet de mon tout premier article scientifique
publié.
Je remercie tous les étudiants et le personnel du GEOTOP que j'ai côtoyés pendant
toutes ces années au centre de recherche. Je remercie Elisabeth Lindsay, Nicole
Turcot et Josée Savard pour leur aide précieuse dans les tâches administratives, ainsi
que Sandrine Solignac, André Poirier, Jean-François Hélie, Julien Gogot, Agnieska
Adamowicz, Maryse Henri et Michel Preda pour leur aide dans les analyses de
laboratoire et leur disponibilité pour développer et valider mes connaissances
Vll
scientifiques. Merci également à Christelle Not et François De Vleeschouwer pour
leurs conseils et relectures.
Je tiens à consacrer quelques modestes lignes de cette section pour d'énormes
remerciements à Jenny Maccali, véritable mentor dans la dernière ligne droite. Merci
mille fois pour ton gros coup de main dans les périlleuses analyses de protactinium.
Merci d'avoir supporté mon stress, le planning ambitieux que je t'ai imposé l'été
dernier, merci de m'avoir guidée, soutenue, écoutée et parfois réconfmiée aussi.
Merci à Olivia Gibb pour sa joie de vivre et à Jean-Baptiste Plouhinec pour ses
longues soirées à disserter sur la science. Merci à Quentin Simon pour son hwnour
(ou pas ... ), son écoute, ses discussions scientifiques, sa visite du CEREGE. J'aurai
mis le temps à réaliser ton départ mais ta présence m'aura bien manqué dans les
derniers mois. Merci à Nicolas Van Nieuwenhove pour son expérience et à Audrey
Limoges, avec qui j'ai pu notamment partager l'expérience d'organiser les congrès
étudiants du GEOTOP, et la conférence Goldschmidt de juillet 2012. Enfm, merci à
tous pour votre amitié.
Merci à Nathalie Fagel, ma directrice de maîtrise, pour m'avoir introduite dans la
recherche en paléo et sur le projet PASADO qui m'a fait entrer au GEOTOP.
Merci à Méli et ses parents pour m'avoir si chaleureusement accueillie au Québec.
Puis, une petite note pour mes amis belges rencontrés à Montréal. Sans vous, les
années passées ici n'auraient pas été aussi géniales. Les expériences vécues ensemble
icitte là nous souderont pour longtemps encore. Merci à Céline & Renaud (the frrst
team; merci Céline pour tous tes conseils de lointaine collègue Ph.D.), à Cécile,
Raph, Cath & Loïc, les disparus Isa & Fx, Sandra, l' assimilée, Thylla & Gauthier.
Vlll
Merci à mes amis en Belgique (avec un spécial à Pauline) pour leur soutien, la
décompression à chacun de mes retours, leurs petites attentions, leurs vacances
passées chez nous, et pour leur fidélité!
Je remercie chaleureusement tous les membres de ma famille . Merci d' avoir supporté
mon absence, de m'avoir changé les idées en me rendant visite et de m' avoir
conseillée lorsque j ' en avais besoin.
Et fmalement « fast but not !east », je remercie Dimitri ... en commençant par sa
famille, qui l'a laissé prutir avec moi. En soulignant également son adaptation
exemplaire aux conditions climatiques impitoyables du Québec. Merci Dimitri, fort
que tu es même si tu l' es un peu moins, de m'avoir accompagnée (endurée?) pendant
ces années à Montréal, de m'avoir soutenue de manière inconditionnelle, écoutée,
consolée, encouragée, et d'avoir partagé cette fantastique expérience avec moi. Merci
d'avoir tenu le coup aussi bien durant les longs hivers de tempêtes de neige et pluies
verglaçantes, que durant les étés ensoleillés de chaleur accablante Ge sais à quel
point les nimbostratus de notre beau ciel belge t'ont manqué, merci d'avoir tenu le
coup!). Enfm, merci d'avoir fait une croix sur nos merveilleuses frites belges et le
reste!
Finalement, la thèse c'est comme une boîte de chocolats, on ne sait jamais sur quoi
on va tomber ...
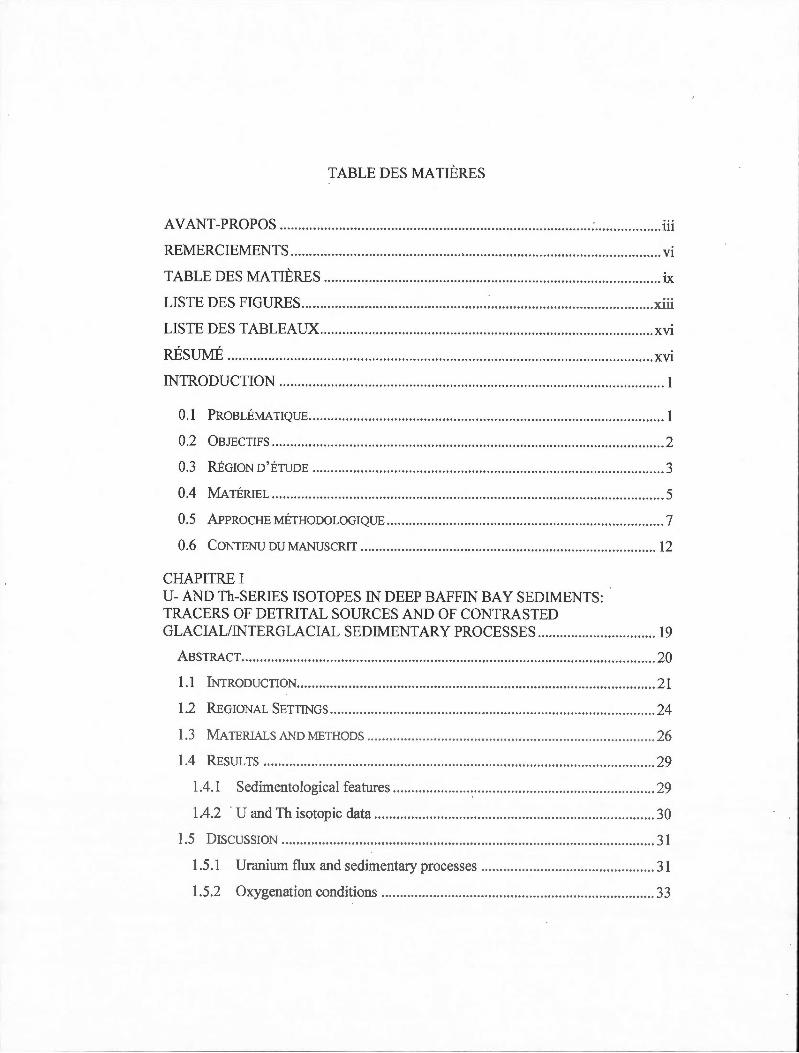
TABLE DES MATIÈRES
AVANT-PROPOS ......... .. ......... ...... .... ... ... ... ........ .... .. .. .... .. ... ..... ... .. .......... : ... .. ..... ........ iii
REMERCIEMENTS .......... ...... ..... ....... ... ... ...... .. .... , ..... .. ... .. ..... ....... ..... ... ... ... ............... vi
TABLE DES MATIÈRES .... ........ ..... .. ............... ................ .. .......... ..... .... .. .... ... ........... ix
LISTE DES FIGURES .. ... .. .. .. ..... .... ......... ... ... ......... ... ...... .. .... ... ..... .... ..... .... ...... ... ... ... xiii
LISTE DES TABLEAUX ....... ..... ............................... ................. .. ..... ...... ........ ..... .. .. xvi
RÉSUMÉ .... ........ ......... ... ... .... .. .. ......... ... ........ ....... .. .... .... ... ............. ... .... ..... .. .. ..... .. ... . xvi
INTRODUCTION ...... ..... ....... .... ..... .. ....... ......... .......... ..... ... .................... ...... .......... .. ... 1
0.1 PROBLÉMATIQUE .. .. ... .. ... ....... . . ... ....... . .. ... . .... ...... ........ .. ....... .. .. . .................. . ....... !
0.2 OBJECTIFS ....................... . .... . .. ............. ................. ... . .. .. ... ... ... ......... ..... . . ............ 2
0.3 RÉGION D'ÉTUDE ......... .. .. ... .... . .. . .... .... ... ....... ...... .. ..... .. .......... . ... . .. .. . .... ... . . ... . .. .. . 3
0.4 MA TÉ RIEL .......... . ...................................... . .... . .. . .. ...... ......... . .. ......... ... ..... ... . . ..... . 5
0.5 APPROCHE MÉTHODOLOGIQUE .. . ...... ... .. . ... ... .... .. .... ............. .. ..... .. ... ... ... ... . ......... 7
0.6 CONTENU DU MANUSCRIT .................................... .. .... ... . ................. . .. ............ . . 12
CHAPITRE I U- AND Th-SERIES ISOTOPES IN DEEP BAFFIN BA Y SEDIMENTS: TRACERS OF DETRIT AL SOURCES AND OF CONTRASTED GLACIALIINTERGLACIAL SEDIMENT ARY PROCESSES .. ..... ...... ...... ..... ..... .. . 19
ABSTRACT .... .. .... .... ... .. .... . .... . .. ............................................. . .... ... . ... . .. ... ..... ··········· · · 20
1.1 INTRODUCTION ... .. . ............ . .. . .... . .. . .. ...... ......... . ..... . .. ...... .. . ..... .. ... ... .... .. . .. . . ... . .. .. 21
1.2 REGIONAL SETTINGS ................. . . ... ... .... . .. .. .. ... .... ... .......... . ..... . .. .... . .... ... ...... .. ... 24
1.3 MA TE RIALS AND METHODS .... . ... ......... . . .................. .... ... ... . .. . . .... . .... ................. 26
1.4 RE SUL TS . . ............. ..... . .. .. . ...... ..... ........... ... . ...... .. ............ .. ... ... ... .... . ...... ..... ....... 29
1.4.1 Sedimentological features ·· ··· ········ ········:······· ···· ···· ······ ··· ··· ······ ····· ··· ········ 29
1 .4.2 · U and Th isotopie data ...... .. ...... ...... .. ......... .. .. ... .... ....... ..... .... .. ... .... .. ... .... 30
1.5 DISCUSSION ................................ . ..... .. ........... .. ... .. .... ..... .. . ...... ......... ....... ... ... ... 31
1.5.1 Uranium flux and sedimentary processes ............................................... 31
1. 5.2 Oxygenation conditions .. .... ......... ......... ......... ... ... ..... .. ...... ....... ...... .. ..... .. 3 3
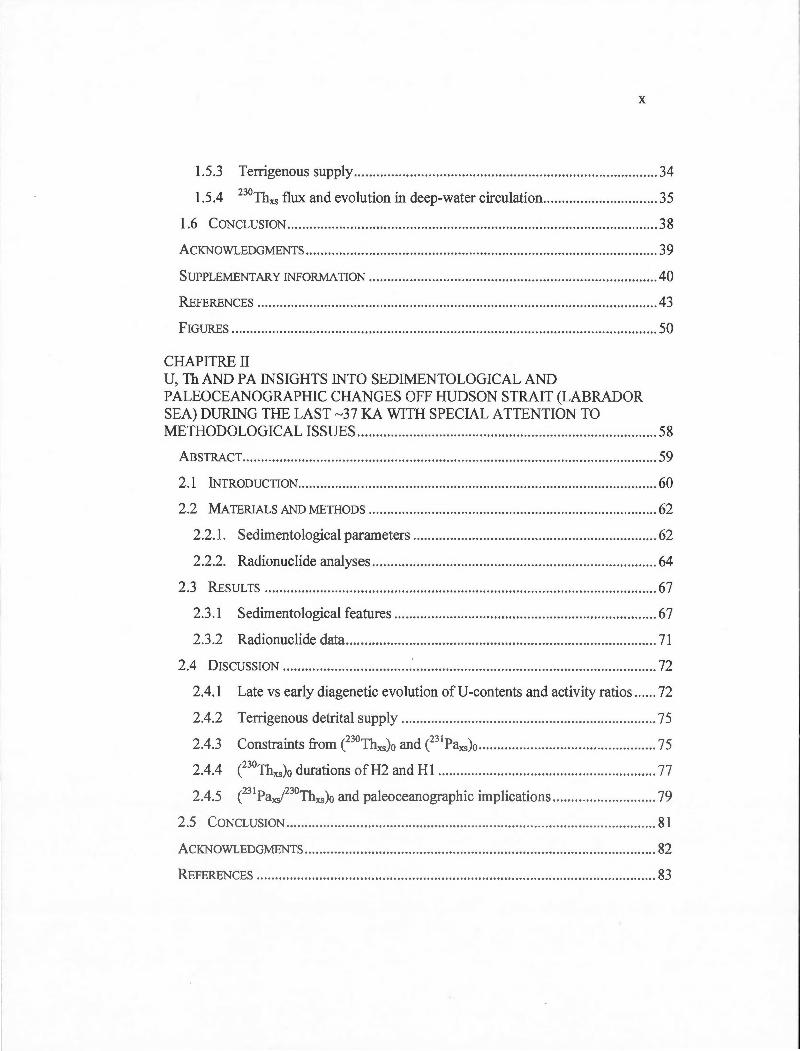
x
1.5.3 Terrigenous supply ......... ... .. ...... .. .... ..... ...... .. ... ............ .... ....... ....... .. ........ 34
1.5.4 230Thxs flux and evolution in deep-water circulation .......... ..... ..... ... .... .. .. 35
1.6 CONCLUS ION .. ..... .. ... ... .. ... .. .. ...... .. .. .... .. ... ... ... .. ... .. ........ .. ... ........ ...... ...... .......... . 38
ACKNOWLEDGMENTS ... .... ..... ... ............. ....... ........ ..... ............ ..... ....... ... ...... .. .... ..... ... 39
SUPPLEMENTARY INFORMATION ......... .. ....... .. ... .... .. .. .. .. .. ... .. .. ... ..... .... ... ......... ... .. ... .. 40
REFERENCES .. ..... ..... ...... .. ...... ...... ..... ..... ... ..... ... ... ...... ......... .... ................ .. ......... ...... 4 3
FIGURES ..... ....... ... ......... ... .... .... .... . , ... .... .... ........ ... ... ..... ...... ....... .......... .. ....... ........ .... 50
CHAPITRE II U, Th AND PA INSIGHTS INTO SEDIMENTOLOGICAL AND PALEOCEANOGRAPHIC CHANGES OFF HUDSON STRAIT (LABRADOR SEA) DURING THE LAST ~37 KA WITH SPECIAL ATTENTION TO METHODOLOGICAL ISSUES ..... .. ..... .... .... ... .... ... .... ....... .. .. ... ...... .... ... .. ........... .. .... . 58
ABSTRACT .. ...... ..... ... ...... ... ......... .... ... ...... ........ ...... ..... ........ ... .. .. ... ... ...... .. .... .. ... .... ... . 59
2.1 INTRODUCTION .. .... ... ..... ....... .... .... ... .. .. ....... .. .... .... ..... .............. .. ........ ..... .... .... .. 60
2.2 MA TE RIALS AND METHODS ....... .. .. ........ .. .............. ........... .. ........... ........... .. ...... 62
2.2.1. Sedimentological parameters .... .. ........ .... .. .. ......... ... .. .... .... .. .. ... ............... 62
2.2.2. Radionuclide analyses ...... ..... ...... ..... .... .......... .............. ........... .. ... .... .. .... . 64
2.3 RESULTS ········ ···· ·· ······ ······ ··· ····· ···· ·········· ········· ········· ·· ··· ····· ··· ······ ··· ··· ······ ·· ··· ···· 67
2.3 .1 Sedimentological features ......... .. .. .. ................ .. .... .. .. .. .............. .......... .. .. 67
2.3 .2 Radionuclide data .. ... ... .. .... ..... ... ..... ..... ... .... .... ......... ...... ..... ......... ... ... .... .. 71
2.4 DISCUSSION ..... .... .... ...... ...... .. ........ · .... .. .. ....... ....... .... ....... ...... .. .. ...... .... ...... .. .. .. . 72
2.4.1 Late vs earl y diagenetic evolution of U-contents and activity ratios ...... 72
2.4.2 Terrigenous detrital supply .. .. .... .. ....... .. ... ............ ..... .............. ... .... .. ....... 75
2.4.3 Constraints from CZ30Thxs)o and CZ31 Paxs)o .. ... .... ....... .... .... ........................ 75
2.4.4 CZ30Thxs)o durations ofH2 and Hl ... ........... ........... .. ............... ...... .. .... ..... 77
2.4.5 CZ31 Paxi30Thxs)o and paleoceanographic implications ............................ 79
2.5 CONCLUSION ... ..................................................................... .............. .. .... ....... . 81
ACKNOWLEDGMENTS .......................... ............................. ............. ... ............... .... ..... 82
REFERENCES ............................. .. ................................. .......... .... ........... ......... ... ....... 83
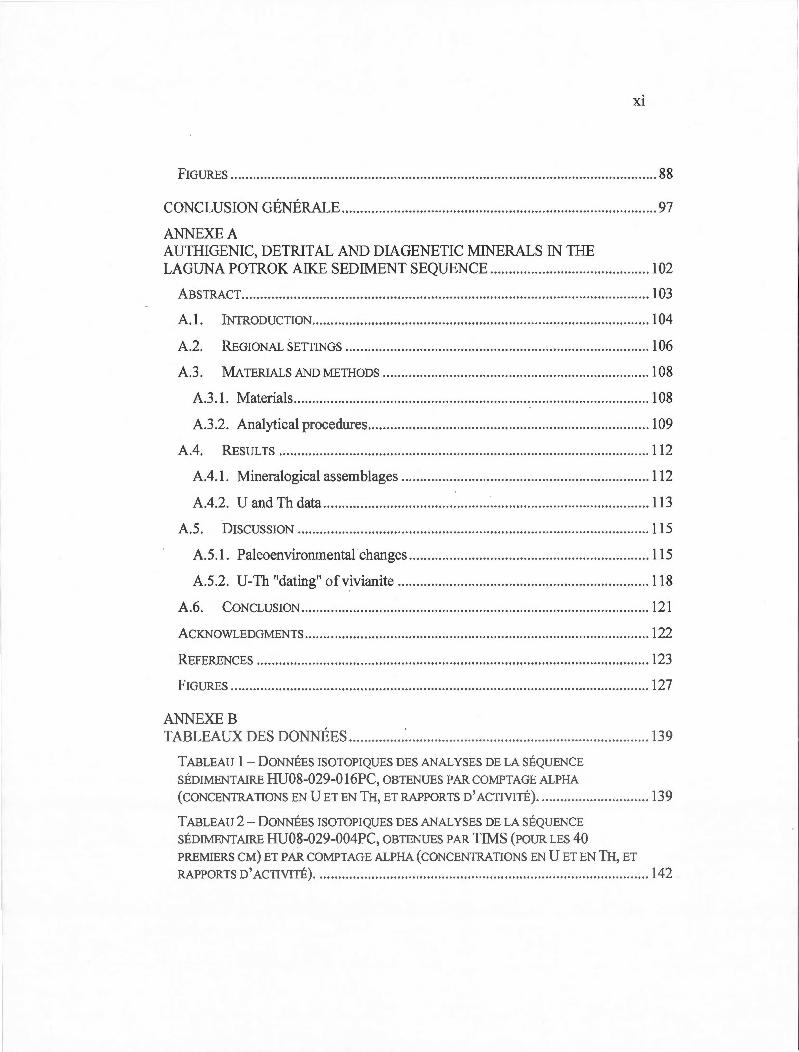
Xl
FIGURES ............... ............ ... ..... .... .. ... ......... ...................... ........................................ 88
CONCLUSION GÉNÉRALE ..... .... .. ..................................................... ... .................. 97
ANNEXE A AUTHIGENIC, DETRITAL AND DIAGENETIC MINERALS IN THE LAGUNA POTROK AIKE SEDIMENT SEQUENCE ........................................... 102
ABSTRACT ................................ .......... ..... .. ................ .. .. .. ......................... ........... ... 1 03
A.1 . INTRODUCTION .... .. .. ............ ...... .. .. .. .................. .. ............. .. ................. .. ..... 104
A.2. REGIONAL SETTINGS .. .. ............. ...... ........ .. ........ .. ....................................... 106
AJ . MATERIALS AND METHODS .... ........ ............ .. ................ .................. ... .... .. ... 108
A.3.1 . Materials .... .... ..... .... ...... ...... ............. .... .. .................. ................. ... .......... 108
A.3 .2. Analytical procedures ......... .... .. .. ........ ....... ... .. ... .. .. ................ .......... ...... 109
A.4. RESULTS ..... ... .. ..... ................. .................................................................... 112
A.4.1. Mineralogical assemblages .. .................. .... .... .. ..................................... 112
A.4.2. U and Th data ................................ .............. ...... ........................... .. ....... 113
A .S . DISCUSSION ............ ... ...... ....... .. ................................ ..................... ...... .... .. 115
A.5.1 . Paleoenvironmental changes .................... .. ........................................... 115
A.5 .2. U-Th "dating" ofvivianite ................ .... .................................... .. .......... 118
A.6. CONCLUSION ... ........ ..... .... ...... .. ... ..... ... .. .............. ... .... ... ... ............. ....... ...... 121
ACKNOWLEDGMENTS .. ..... .. ............ ..... .... ... .. .. .... .. .. ...... ... .. ....... .............. .... ..... .... ... 122
REFERENCES ............. .. .................................... ... .... .. ... .. ............ .... ............ ... ..... ... .. 123
FIGURES ......... ..... ....... ...... ...... .... ..... .. .... ..... ............................................................ 127
ANNEXEB TABLEAUX DES DONNÉES ............... ~ ....................................... ......... ................. 139
TABLEAU 1 -DONNÉES ISOTOPIQUES DES ANALYSES DE LA SÉQUENCE SÉDIMENTAIRE HU08-029-0 16PC, OBTENUES PAR COMPTAGE ALPHA (CONCENTRATIONS EN U ET EN TH, ET RAPPORTS D'ACTIVITÉ) ......... ..... .. .............. 139
TABLEAU 2- DONNÉES ISOTOPIQUES DES ANALYSES DE LA SÉQUENCE SÉDIMENTAIRE HU08-029-004PC, OBTENUES PAR TIMS (POUR LES 40 PREM1ERS CM) ET PAR COMPTAGE ALPHA (CONCENTRATIONS EN U ET EN TH, ET RAPPORTS D'ACTIVITÉ) ......... ........ ........ ................................... ............................. . 142
Xli
TABLEAU 3 - DONNÉES ISOTOPIQUES DES ANALYSES DE LA SÉQUENCE
SÉDIMENTAIRE HU08-029-004PC, OBTENUES AU MC-ICP-MS ... ..... .. ... ... ............ 146
TABLEAU 4- DONNÉES DE MINÉRALOGIE DE LA SÉQUENCE SÉDIMENT AIRE
HU08-029-004PC, OBTENUES PAR LA TECHNIQUE DE DIFFRACTION AUX
RAYONS X (ABONDANCES RELATIVES EN%) ..... . . . ... .. .. .. . ..... .. ........................... .. . . .. 148
TABLEAU 5 - DONNÉES DE CARBONE (CARBONE TOTAL -C-, CARBONE
ORGANIQUE -CoRa-, CARBONE INORGANIQUE -C!NoRo-) DE LA SÉQUENCE
SÉDIMENTAIRE HU08-029-004PC (EN% DU POIDS SEC DU SÉDIMENT TOTAL) . ..... 157
BIBLIOGRAPHIE .... .. ... .. ....... ............ ...... .. .. .. ......... ... ................................... ..... .... .. 165
LISTE DES FIGURES
Figure Page
0.1 Carte de localisation des sites de prélèvement des séquences sédimentaires HU08-029-004PC et HU08-029-016PC en mer du Labrador et en baie de Baffm .. .. .. ... ... ... ....... ....... .... ........... ...... ... ..... ............... 14
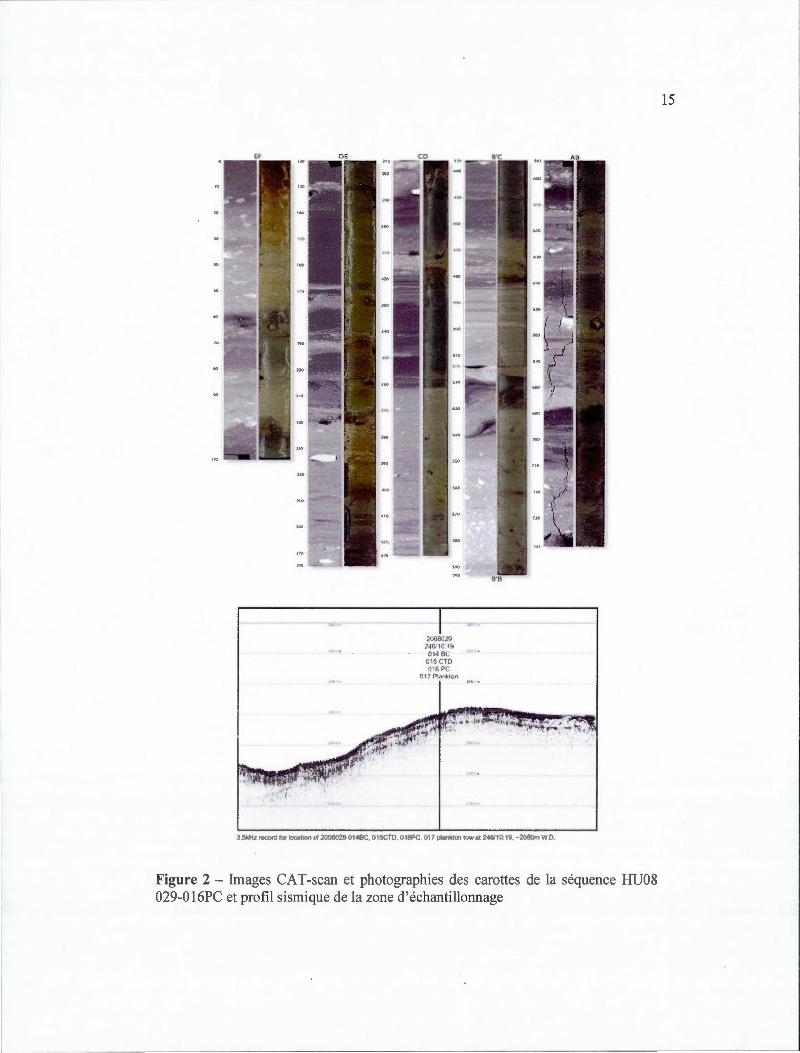
0.2 Images CAT-scan et photographies des carottes de la séquence HU08-029-016PC et profil sismique de la zone d'échantillonnage ..... ... ...... .......... .. 15
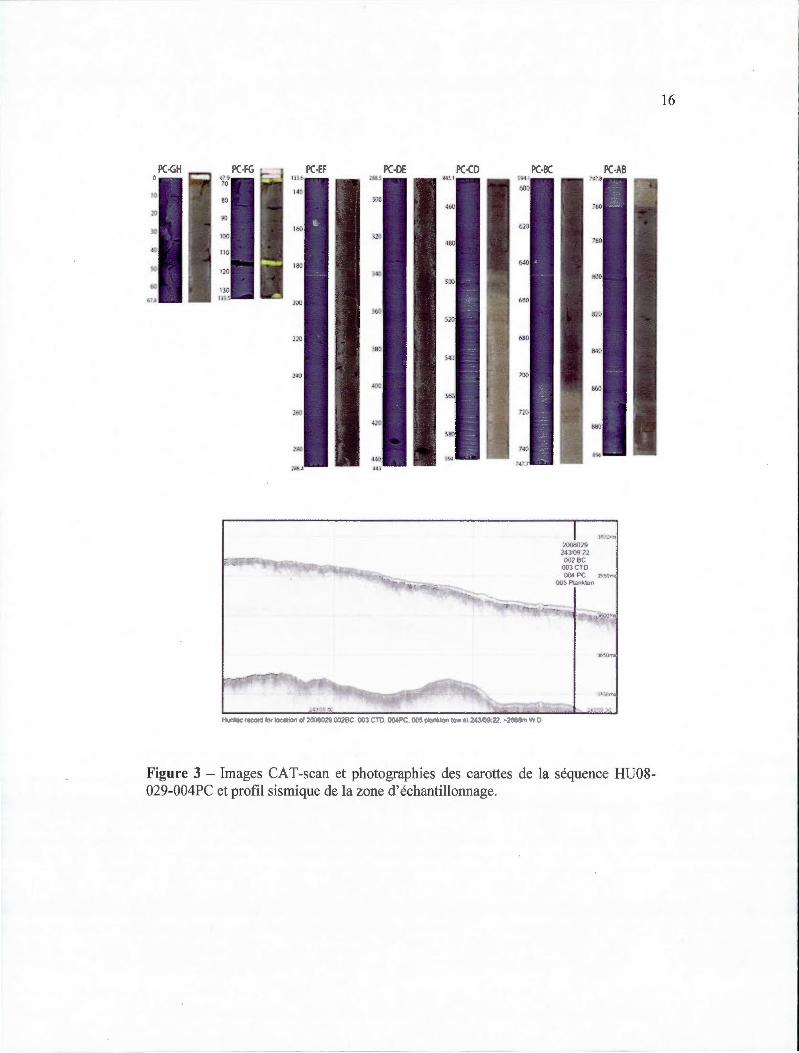
0.3 Images CAT-scan et photographies des carottes de la séquence HU08-029-004PC et profil sismique de la zone d'échantillonnage ... ..... ..... ..... .. .. .... 16
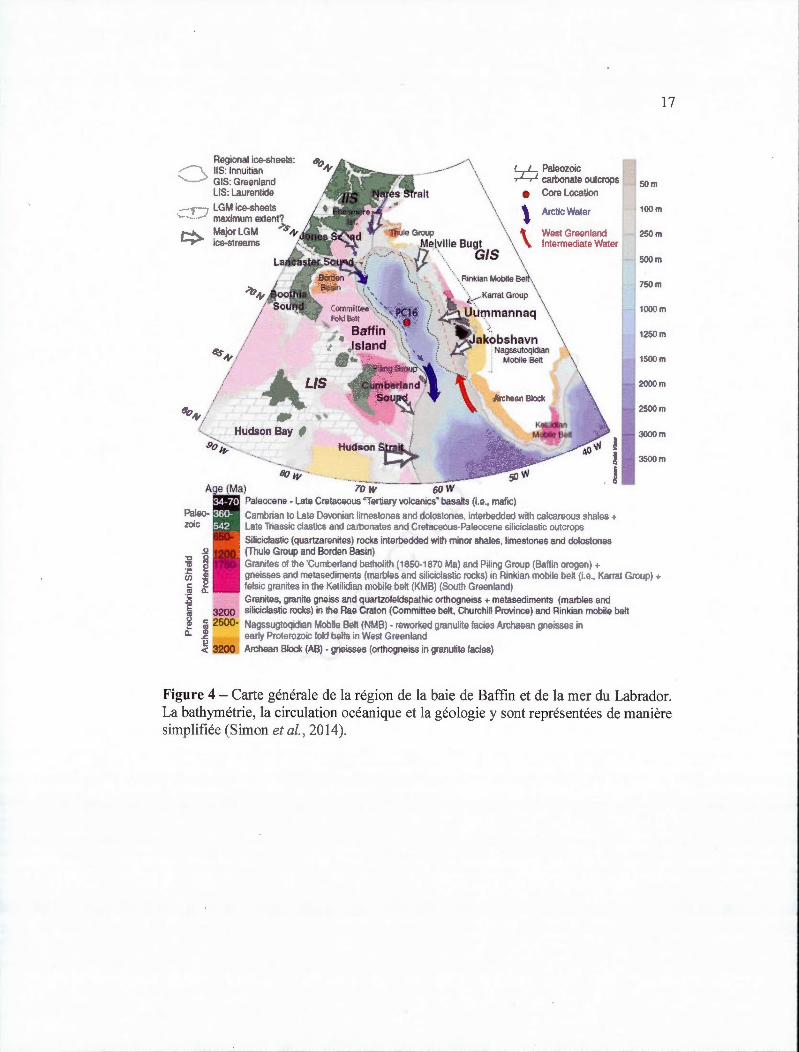
0.4 Carte générale de la région de la baie de Baffm et de la mer du Labrador-bathymétrie, circulation océanique et géologie ... ...... ... ..... .... ..... ... ................ . 17
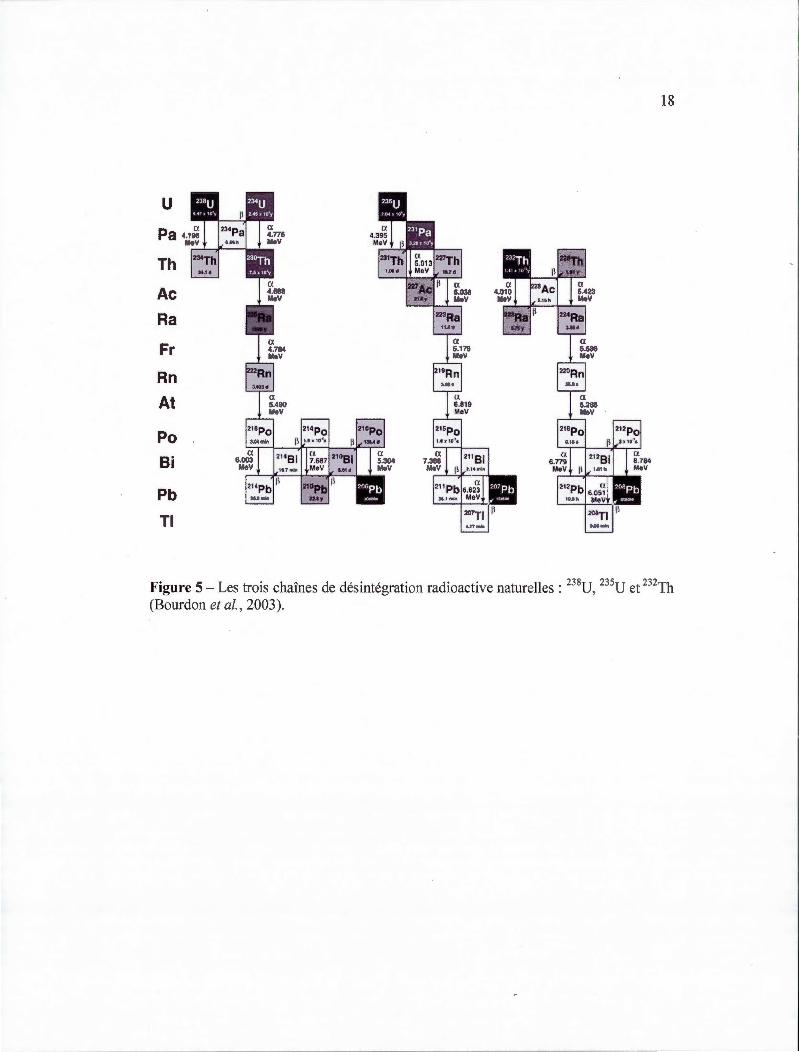
0.5 Les trois chaînes de désintégration radioactive naturelles ... .. ...... .. .. ... ... ......... 18
1.1 Location map of core HU2008-029-0 16PC in Baffm Bay ................. ......... .. . 50
1.2 Age-depth mo del of core HU2008-029-0 16PC ................. ... ... ............ ......... .. 51
1.3 Geochemical properties and isotopie ratios vs age ....... .................................. 52
1.4 U and Th data in the study sequence vs age .. ..... ..... ...... ..... .. .. ..... ... .. ... ... ...... .. 53
1.5 Sedirnentological, mineralogical and geochemical properties plotted vs . h . . . 1 f 230Th 54 age w1t mt ha ex cess o ...................... .. ....................... ... ... ................. .
1.6 The in v en tory of (F230Thxs)M in the sediment colurnn ........ ... .. .. ....... ........ .... .. 55
l.S 1 CZ 30Thxs)o activity ( dpm.g- 1; ± 1 o) plotted VS age ................. ....... .... ................. 56
l.S2 Fraction in dry weight bulk sediment (dw%) of total carbon and organic carbon ..... .......... ....... ......... ....... ........................................... ..... .... ................... 57
2.1 Location map of core HU08-029-004PC in the Labrador Sea .. .. ................... 88
2.2 Age depth mode! of core HU08-029-004PC ... ... ... .. .... ..... .... .......... ........... .. .. . 89
2.3 Mineralogical abundance vs core depth and age ....... ............. ..... ................... 90
2.4 Sedimentological parameters vs age ....... .... ....... .... .. .. ... .. .... ......... ....... .... .... .. .. 91
2.5 U-, Th- and Pa-concentrations, mass and activity ratios vs age .................... . 92
2.6 230Th- and 231Pa-concentrations and activity ratios, and CZ30Thxs)o in v en tory vs age ....... .... .. ....... .. .. ................ ...................................................... 93
XlV
2.S 1 Analytical uncertainties for 230Th and 23 1Pa .. .. ......... ................................. ... ... 94
2.S2 Changes in 234U/238U activity ratios and sulfur content vs depth in the 90-013-013 sediment sequence (Greenland continental slope) .. ............... .... ... ... 95
2.S3 Fraction in dry weight bulk sediment ( dw%) of total carbon and organic carbon .. .. ... ...... ........ .... ... ... .............. ....... .......... ........ ... .... .. .... ..... ... ................. . 96
A.l Location, bathymetry and description of Laguna Potrok Aike .. ...... .... ....... .. 127
A.2 Photographs of vivianite samples .. .... ........ ............ ... .... .... ... .. ..... ... ..... .. ........ 128
AJ Evolution of the mineralogy according to X-ray patterns of the <63 )lill fraction in 10 rn steps for the Laguna Potrok Aike sediment sequence ... ..... 129
A.4 Semi-quantitative mineral abundances vs. age and composite depth for major minerais with lithostratigraphy ... .... ........ .... ... ..... ... ......... .... ...... .......... 130
A.S Results from PCA on the five main mineralogical assemblages (fraction <63 )lill) . .. ...... ... ... .. ........... .. ... .... .... .. .... .. .............. .... ............. ........... ......... .. .. 131
A.6 Scores of PC1 (left) and PC2 (right) of the five main mineralogical assemblages (fraction <63 )lm) plotted vs ages ........ ....... .. ........ .......... .... ... .. 132
A.7 Mineralogical data for the fraction <2 )lill .... .... ................ ... .. ........ ....... ... ... .. 133
A.8 XRD spectra obtained from the four vivianite samp1es V1 to V4 .... ............ 134
A.9 One of the SEM-EDS spectra from a vivianite-rich region of concretion vs .................... ...... .. .. .... ... ... ... ... ... .. ........ .. ................ ........ ... ... ....... ... ............ 135
LISTE DES TABLEAUX
Tableau Page
A.l Mean (± la) of the semi-quantitative relative abundance (%) and measured d-spacing (Â) reflection intensity for bulk ( <63 J.!m) and clay ( <2 J.!m) fraction minerals over the entire sequence ... ...................... ..... ....... 136
A.2 U-Th concentrations and activity ratios ofvivianite samples .... .......... ........ 137
A.3 Estimates of authigenic vs. detrital V-fractions in the studied samples . ...... 138
B.l Données isotopiques des analyses de la séquence sédimentaire HU08-029-016PC, obtenues par comptage alpha .. .......... ..... ................. ........... ....... l39
B.2 Données isotopiques des analyses de la séquence sédimentaire HU08-029-004PC, obtenues par TIMS (pour les 40 premiers cm) et par comptage alpha ..... ...... .. ................ ....... ...... ................................................. .. 142
B.3 Données isotopiques des analyses de la séquence sédimentaire HU08-029-004PC, obtenues au MC-ICP-MS ................... ..................... ................. 146
BA Données de minéralogie de la séquence sédimentaire HU08-029-004PC, obtenues par la technique de diffraction aux rayons X (abondances relatives en o/o) .... .............. ......... ... .. .. ........ .... ........... .. ............. ... ... ................ 148
B.5 Données de carbone (carbone total -C-, carbone organique -Corg-, carbone inorganique -Cnorg-) de la séquence sédimentaire HU08-029-004PC (en % du poids sec du sédiment total) .. ........ ...................... ... .... .. ............. .......... 157
RÉSUMÉ
L'océan Atlantique Nord joue un rôle essentiel au niveau du climat et de la circulation océanique globale. Dans cette perspective, la baie de Baffm et la mer du Labrador comportent plusieurs caractéristiques intéressantes :
(i) elles constituent des bassins de transition de masses d' eau entre l'océan Arctique et l'Atlantique Nord,
(ii) elles participent à la circulation méridienne de renversement atlantique en contribuant à la formation des eaux profondes froides , et,
(iii) leur localisation, aux marges des anciennes calottes glaciaires nordaméricaines et de la calotte groenlandaise, permet d'étudier l' impact de la dynamique des calottes de glace sur la circulation océanique et, indirectement, sur le climat.
Les sédiments de ces bassins sont donc susceptibles d'avoir enregistré des informations petiinentes pour 1' étude de 1' évolution paléoclimatique/paléocéanographique de la région .
Cette thèse porte sur l'application des isotopes de trois éléments chimiques de la famille des actinides, l'uranium (U), le thorium (Th) et le protactinium (Pa), à l'étude de deux séquences sédimentaires provenant de bassins océaniques de l'Atlantique du Nord-Ouest et couvrant le dernier cycle glaciaire. L'approche multi-paramètres appliquée associe ce volet isotopique à des informations sédimentologiques complémentaires (i.e., données physiques, minéralogiques et géochimiques). La première carotte sédimentaire provient de la plaine abyssale centrale de la baie de Baffm. La seconde a été prélevée en mer du Labrador, à environ 180 km à l' est de l' embouchure du détroit d'Hudson. La thèse est donc divisée en deux chapitres majeurs portant chacun sur une de ces régions. Les données relatives aux isotopes des actinides U, Th et Pa sont utilisées comme traceurs des processus et flux géochimiques dans Je sédiment, et de la dynamique particulaire propre aux sites étudiés. Les deux sujets abordés contribuent dès lors à l' effort de recherche visant à mieux comprendre le comportement, l' évolution et l'interaction des systèmes océan, atmosphère, cryosphère dans l'Hémisphère Nord au cours du Quaternaire récent.
Le premier chapitre porte sur l ' analyse de la séquence sédimentaire provenant de la baie de Baffm. Les 7.41 rn de sédiment récupérés s'étendent temporellement sur 1' entièreté du dernier cycle glaciaire, depuis le stade isotopique 5 d jusqu'à aujourd'hui (les demi ers ~ 115 ka). La baie de Baffm constitue une zone de transition des masses d'eau atlantiques et arctiques, en plus d'avoir été fortement influencée par
x vu
la dynamique des grandes calottes de glace de l' Amérique du Nord et du Groenland durant les glaciations du Quaternaire. Réalisées à intervalles de ~ 1.6 ka, les mesures de concentrations et de rapports isotopiques en U et en Th combinées à d'autres paramètres sédimentologiques mettent en évidence les processus et flux géochimiques et sédimentaires complexes relatifs au site étudié. De plus, les profils de 230Th en excès permettent de retracer l' évolution de la dynamique particulaire dans le bassin. Les résultats mettent en évidence deux conditions océanographiques différentes comprenant une nette transition entre la dernière période glaciaire et l' interglaciaire actuel. Une remobilisation importante des particules sur les pentes continentales, avec focalisation vers la plaine abyssale, semble avoir été active durant la dernière période glaciaire. En revanche, durant l'Holocène, un déficit en 230Th par rapport à la production dans la colonne d'eau sus-jacente s'observe et semble démontrer un renforcement de la ventilation des masses d' eau en zone profonde, témoignant de la mise en place de la circulation océanique actuelle.
Le deuxième chapitre de cette thèse se concentre sur la séquence sédimentaire de 8.95 rn de long prélevée dans le nord-ouest de la mer du Labrador. Cette région océanique tient un rôle essentiel dans la formation des eaux intermédiaires et profondes froides participant à la boucle de circulation de renversement méridienne atlantique. Sa proximité avec le détroit d'Hudson en fait également une zone privilégiée pour étudier les épisodes de fonte de la calotte de glace des Laurentides. Les données isotopiques en U, Th et Pa sont intégrées dans une approche multi-paramètres et utilisées pour caractériser les processus et flux géochimiques et sédimentaires en relation avec les variations cryosphériques, océaniques et climatiques passées. La dynamique pmiiculaire depuis le glaciaire tardif (i.e. , les ~37 derniers ka) est évaluée à travers 1' étude des variations des excès en 230Th et 231 Pa enregistrés dans la colonne sédimentaire. Le mode et le temps de dépôt des décharges carbonatées identifiées comme se rapportant aux évènements de Heinrich H2 et Hl sont évalués à l' aide d'inventaires du 230Th en excès. Des processus géochimiques et flux particulaires variables et complexes sont par ailleurs observés pour ce site localisé en zone de marge continentale. Cette variabilité, associée aux limitations méthodologiques rencontrées, pose des incertitudes quant à l' estimation précise des excès en 23 1Pa et en 230Th dans ces conditions environnementales particulières. Certains intervalles, notamment la fm de la période glaciaire et de l'Holocène, montrent des valeurs de flux d'excès de 230Th excédant la valeur théorique du flux provenant de la colonne d'eau sus-jacente, indiquant probablement une augmentation de l'advection ou des processus de redistribution sédimentaire. Enfin, les valeurs des rappmis des excès initiaux de 23 1Pa sur 230Th généralement inférieures à la valeur de production ve1iicale de la colonne d' eau suggèrent une exportation du 23 1Pa vers le sud par advection.
Mots clés : Paléocéanographie; Quaternaire récent; Traceurs isotopiques; Sédimentation; Séries de l 'V et du Th.
INTRODUCTION
0.1 Problématique
· L'océan est un acteur majeur du climat. Il joue un rôle essentiel dans les mécanismes
qui le gouvernent, en interagissant avec l'atmosphère par le biais d'échanges
d'énergie et de matière. L'étude des changements dans la circulation océanique est
donc fondamentale pour mieux comprendre la dynamique des fluctuations
climatiques millénaires et glaciaires-interglaciaires du Quaternaire (Broecker et
Denton, 1989). Une des composantes majeures de la circulation océanique actuelle et
passée est la convection des masses d'eau intermédiaires et profondes aux hautes
latitudes (Broecker, 1991). En Atlantique Nord, ces mouvements s'opèrent dans la
mer du Groenland, de Norvège et du Labrador. Les masses d'eau engendrées
participent ensuite à la ventilation de l'océan mondial (Broecker, 1987; Broecker,
1991 ). La baie de Baffm et la mer du Labrador font partie intégrante de ce système
(Fig. 1). Elles sont le lieu de formation et de passage des masses d'eau qui
contribuent de manière essentielle à la circulation méridienne de renversement en
Atlantique (Atlantic Meridional Overturning Circulation, AMOC; Fig. 1; Broecker,
1987).
Ces deux bassins ont également constitué l' un des exutoires des eaux de fonte des
grandes calottes glaciaires d'Amérique du Nord (calottes inuitienne, groenlandaise et
laurentidienne), c'est-à-dire un lien entre ces calottes et l'océan Atlantique (Dyke et
al. , 2002). Leurs sédiments sont donc susceptibles d'avoir enregistré les épisodes de
fonte de ces masses de glace et leur étude a notamment déjà permis d'acquérir de
l'information sur les évènements qui y sont associés (e.g., évènements de Heinrich,
Dryas récent, évènement 8.2 cal ka; e.g. , Andrews et Tedesco, 1992; Andrews, 1998;
Barber et al. , 1999; Broecker et al. , 2010; Lewis et al., 2012). La découverte des
événements de Heinrich en Atlantique Nord (Heinrich, 1988) a par exemple mis en
2
évidence que la fonte de la calotte de glace des Laurentides aurait rapidement libéré
de grandes quantités d'eau douce dans l'océan Atlantique, et ce essentiellement à
travers le détroit d'Hudson (Andrews et Tedesco, 1992; Andrews et Maclean, 2003;
Hemming et al., 1998). Ces évènements ont depuis motivé de nombreuses recherches
sur leurs conséquences pour l'environnement, non seulement à une échelle régionale,
mais également mondiale (voir Hemming, 2004 pour une revue de la littérature).
Les fluctuations climatiques abruptes de la fm du Pléistocène et de l'Holocène
paraissent clairement liées aux variations dans la circulation océanique ( e.g., Bond et
Lotti, 1995; Bond et al., 1993). Cependant, les mécanismes à l'origine de ces
variations océaniques et climatiques ne font pas encore l'objet d' un consensus dans la
communauté scientifique et de nombreuses questions subsistent encore quant aux
conséquences de ces phénomènes. s 'il est généralement établi que les déversements
d'eau douce auraient affaibli l 'AMOC (e.g., Clarke et al., 2009), la compréhension de
l'ensemble des processus par lesquels ces événements ont mené à cette perturbation
demeure partielle (e.g., Hillaire-Marcel et al., 2001 ; Lynch-Stieglitz et al., 2007;
Mc Manus et al., 2004 ). Connaître davantage les mécanismes de transport et les types
de dépôts sédimentaires associés à ces épisodes, ainsi que leurs durées précises
respectives, permettrait de mieux cerner les processus impliqués.
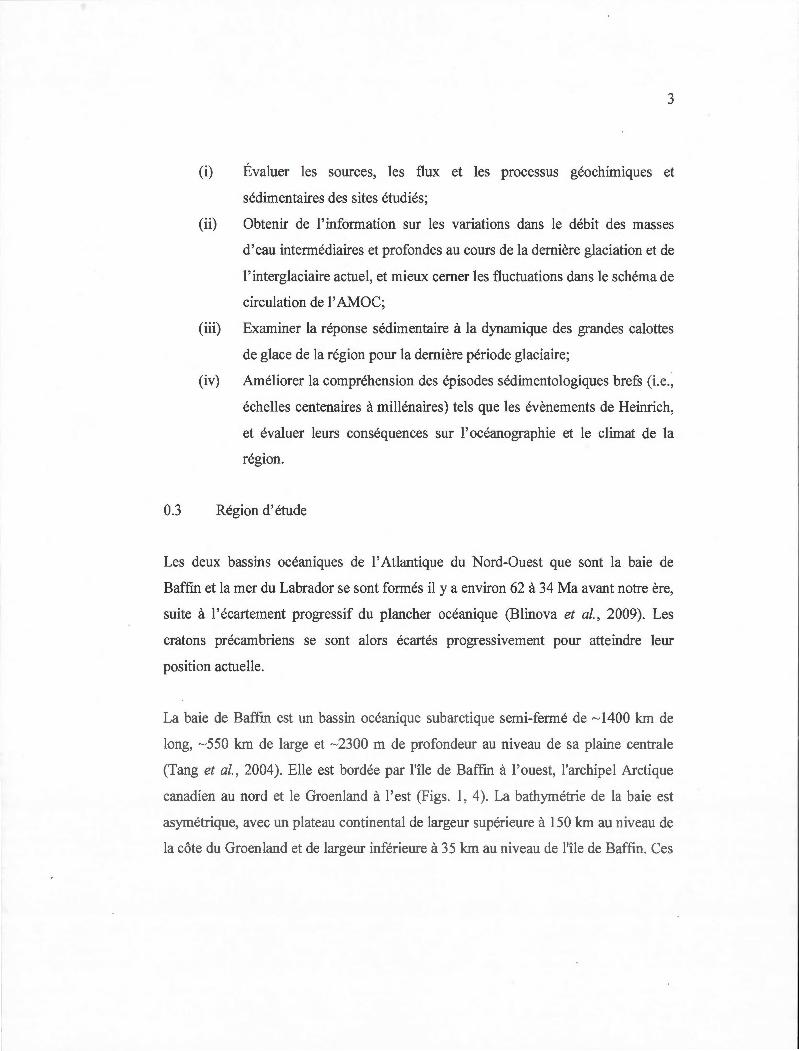
0.2 Objectifs
Étudier précisément la dynamique océanique passée des bassins de 1' Atlantique du
Nord-Ouest durant le Quaternaire récent est essentiel pour la compréhension de
l'océanographie de la région. Cela permet d'interpréter davantage son influence sur la
circulation globale et de mieux cerner les fluctuations climatiques millénaires et
glaciaires-interglaciaires du Quaternaire, leurs causes et leurs conséquences. Dès lors,
les principaux objectifs de cette thèse sont les suivants :
1 1
(i)
3
Évaluer les sources, les flux et les processus géochimiques et
sédimentaires des sites étudiés;
(ii) Obtenir de l'information sur les variations dans le débit des masses
d ' eau intermédiaires et profondes au cours de la dernière glaciation et de
l'interglaciaire actuel, et mieux cerner les fluctuations dans le schéma de
circulation de l' AMOC;
(iii) Examiner la réponse sédimentaire à la dynamique des grandes calottes
de glace de la région pour la dernière période glaciaire;
(iv) Améliorer la compréhension des épisodes sédimentologiques brefs (i.e. ,
échelles centenaires à millénaires) tels que les évènements de Heinrich,
et évaluer leurs conséquences sur l' océanographie et le climat de la
région.
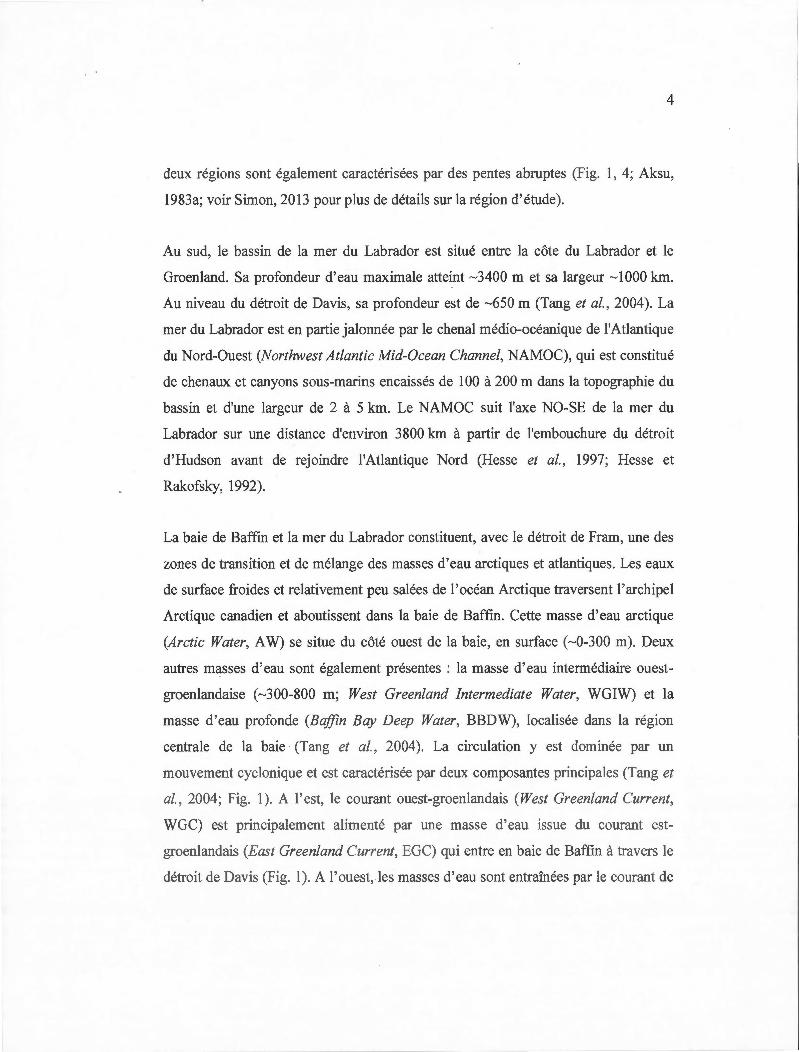
0.3 Région d'étude
Les deux bassins océaniques de l' Atlantique du Nord-Ouest que sont la baie de
Baffm et la mer du Labrador se sont f01més il y a environ 62 à 34 Ma avant notre ère,
suite à 1' écartement progressif du plancher océanique (Blinova et al., 2009). Les
cratons précambriens se sont alors écartés progressivement pour atteindre leur
position actuelle.
La baie de Baffin est tm bassin océanique subarctique semi-fermé de~ 1400 km de
long, ~550 km de large et ~2300 m de profondeur au niveau de sa plaine centrale
(Tang et al. , 2004). Elle est bordée par l'île de Baffm à l' ouest, l'archipel Arctique
canadien au nord et le Groenland à l'est (Figs. 1, 4). La bathymétrie de la baie est
asymétrique, avec un plateau continental de largeur supérieure à 150 km au niveau de
la côte du Groenland et de largeur inférieure à 35 km au niveau de l'île de Baffin. Ces
4
deux régions sont également caractérisées par des pentes abruptes (Fig. 1, 4; Aksu,
1983a; voir Simon, 2013 pour plus de détails sur la région d'étude).
Au sud, le bassin de la mer du Labrador est situé entre la côte du Labrador et le
Groenland. Sa profondeur d'eau maximale atteint ~3400 rn et sa largeur ~1000 km.
Au niveau du détroit de Davis, sa profondeur est de ~650 rn (Tang et al. , 2004). La
mer du Labrador est en partie jalonnée par le chenal médio-océanique de l'Atlantique
du Nord-Ouest (Northwest Atlantic Mid-Ocean Channel, NAMOC), qui est constitué
de chenaux et canyons sous-marins encaissés de 100 à 200 rn dans la topographie du
bassin et d'une largeur de 2 à 5 km. Le NAMOC suit l'axe NO-SE de la mer du
Labrador sur une distance d'environ 3800 km à partir de l'embouchure du détroit
d'Hudson avant de rejoindre l'Atlantique Nord (Hesse et al., 1997; Hesse et
Rakofsky, 1992).
La baie de Baffm et la mer du Labrador constituent, avec le détroit de Fram, une des
zones de transition et de mélange des masses d'eau arctiques et atlantiques. Les eaux
de surface froides et relativement peu salées de l'océan Arctique traversent l'archipel
Arctique canadien et aboutissent dans la baie de Baffm. Cette masse d'eau arctique
(Arctic Water, AW) se situe du côté ouest de la baie, en surface (~0-300 rn). Deux
autres masses d'eau sont également présentes : la masse d'eau intennédiaire ouest
groenlandaise (~300-800 rn; West Green/and Intermediate Water, WGIW) et la
masse d'eau profonde (Baffin Bay Deep Water, BBDW), localisée dans la région
centrale de la baie (Tang et al. , 2004). La circulation y est dominée par un
mouvement cyclonique et est caractérisée par deux composantes principales (Tang et
al. , 2004; Fig. 1). A l'est, le courant ouest-groenlandais (West Green/and Current,
WGC) est principalement alimenté par une masse d'eau issue du courant est
groenlandais (East Green/and Current, EGC) qui entre en baie de Baffm à travers le
détroit de Davis (Fig. 1 ). A l' ouest, les masses d'eau sont entraînées par le courant de
5
l'île de Baffm (Baffin Island Current, BIC) s'écoulant vers le sud, et transitant
ensuite dans la mer du Labrador via le détroit de Davis (Davis Strait Overflow, DSO;
Tang et al., 2004).
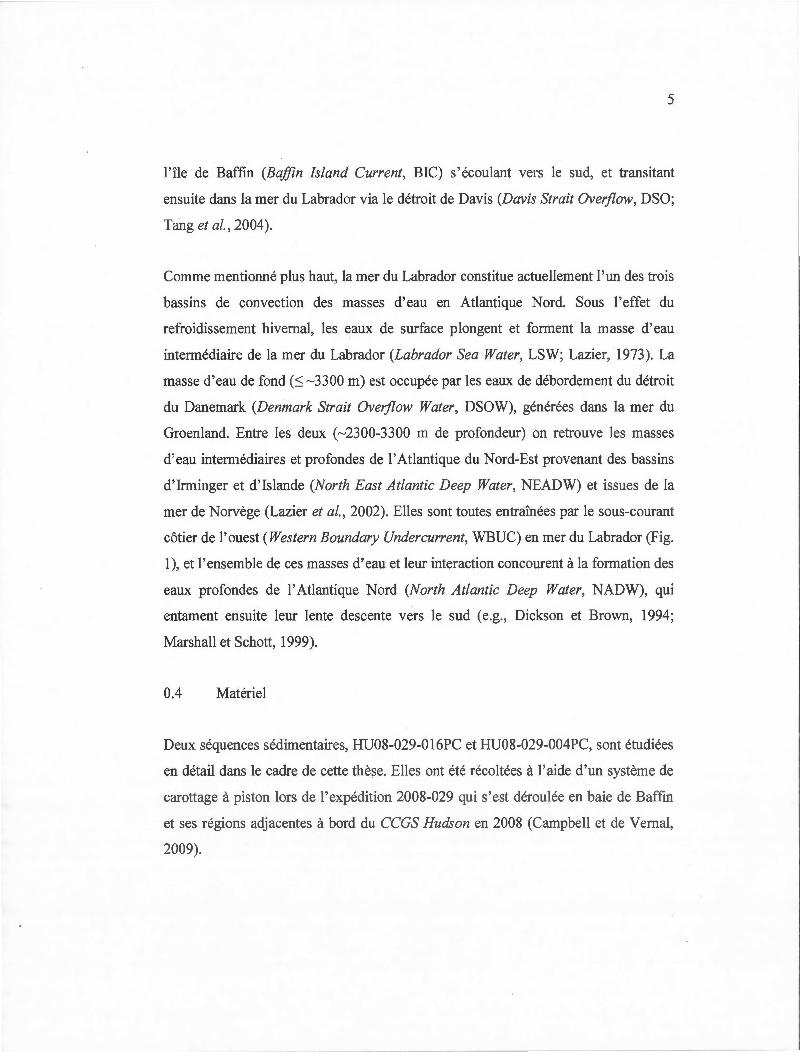
Comme mentionné plus haut, la mer du Labrador constitue actuellement l' un des trois
bassins de convection des masses d'eau en Atlantique Nord. Sous l' effet du
refroidissement hivernal, les eaux de surface plongent et forment la masse d'eau
intermédiaire de la mer du Labrador (Labrador Sea Water, LSW; Lazier, 1973). La
masse d'eau de fond (:S ~3300 rn) est occupée par les eaux de débordement du détroit
du Danemark (Denmark Strait Overjlow Water, DSOW), générées dans la mer du
Groenland. Entre les deux (~2300-3300 rn de profondeur) on retrouve les masses
d'eau intermédiaires et profondes de l'Atlantique du Nord-Est provenant des bassins
d' Irminger et d' Islande (North East Atlantic Deep Water, NEADW) et issues de la
mer de Norvège (Lazier et al. , 2002). Elles sont toutes entraînées par le sous-courant
côtier de l' ouest (Western Boundary Undercurrent, WBUC) en mer du Labrador (Fig.
1), et l' ensemble de ces masses d' eau et leur interaction concourent à la f01mation des
eaux profondes de l'Atlantique Nord (North Atlantic Deep Water , NADW), qui
entament ensuite leur lente descente vers le sud ( e.g. , Dickson et Brown, 1994;
rviarshall et Schott, 1999).
0.4 rviatériel
Deux séquences sédimentaires, HU08-029-016PC et HU08-029-004PC, sont étudiées
en détail dans le cadre de cette thèse. Elles ont été récoltées à l'aide d'un système de
carottage à piston lors de l'expédition 2008-029 qui s'est déroulée en baie de Baffm
et ses régions adjacentes à bord du CCGS Hudson en 2008 (Campbell et de Vernal,
2009).
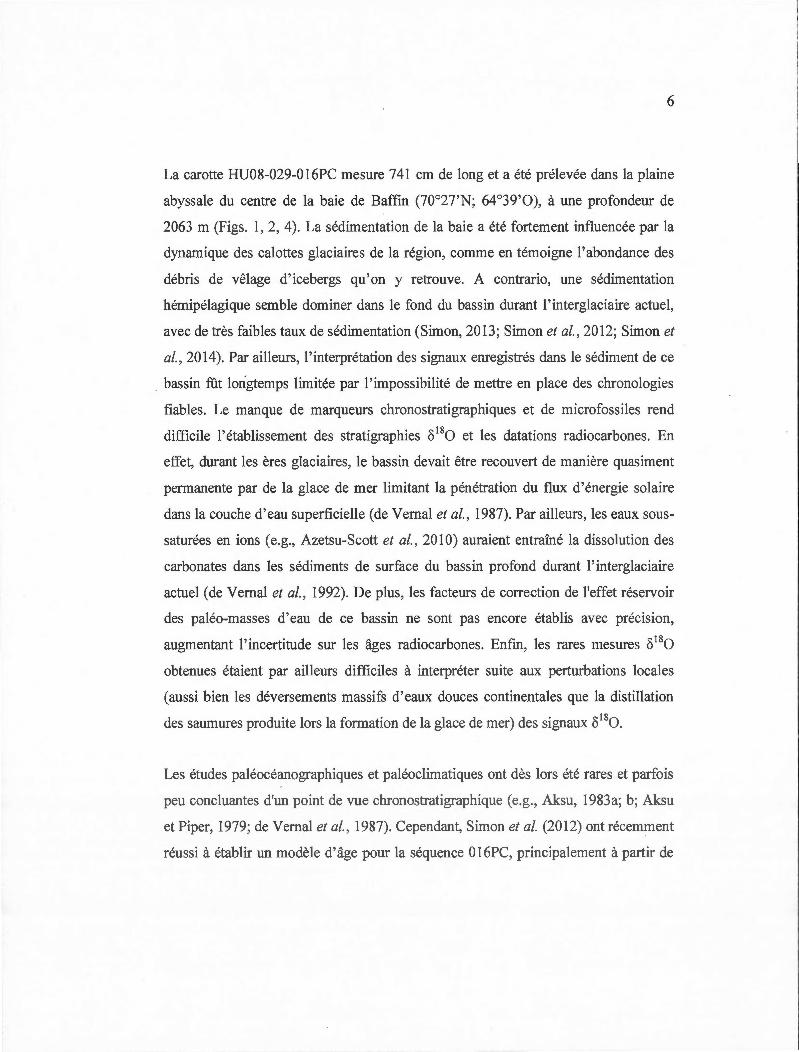
6
La carotte HU08-029-016PC mesure 741 cm de long et a été prélevée dans la plaine
abyssale du centre de la baie de Baffm (70°27'N; 64°39'0), à une profondeur de
2063 rn (Figs. 1, 2, 4). La sédimentation de la baie a été fortement influencée par la
dynamique des calottes glaciaires de la région, comme en témoigne l' abondance des
débris de vêlage d' icebergs qu ' on y retrouve. A contrario, une sédimentation
hémipélagique semble dominer dans le fond du bassin durant l' interglaciaire actuel,
avec de très faibles taux de sédimentation (Simon, 2013 ; Simon et al., 2012; Simon et
al. , 2014 ). Par ailleurs, l' interprétation des signaux enregistrés dans le sédiment de ce
. bassin fût longtemps limitée par l' impossibilité de mettre en place des chronologies
fiables. Le manque de marqueurs chronostratigraphiques et de microfossiles rend
difficile l'établissement des stratigraphies o180 et les datations radiocarbones. En
effet, durant les ères glaciaires, le bassin devait être recouvert de manière quasiment
permanente par de la glace de mer limitant la pénétration du flux d'énergie solaire
dans la couche d'eau superficielle (de Vernal et al. , 1987). Par ailleurs, les eaux sous
saturées en ions ( e.g. , Azetsu-Scott et al., 201 0) auraient entraîné la dissolution des
carbonates dans les sédiments de surface du bassin profond durant l' interglaciaire
actuel (de Vernal et al. , 1992). De plus, les facteurs de correction de l'effet réservoir
des paléo-masses d'eau de ce bassin ne sont pas encore établis avec précision,
augmentant l'incertitude sur les âges radiocarbones. Enfm, les rares mesures o180
obtenues étaient par ailleurs difficiles à interpréter suite aux perturbations locales
(aussi bien les déversements massifs d'eaux douces continentales que la distillation
des saumures produite lors la formation de la glace de mer) des signaux 8180.
Les études paléocéanographiques et paléoclimatiques ont dès lors été rares et parfois
peu concluantes d'un point de vue chronostratigraphique (e.g. , Aksu, 1983a; b; Aksu
et Piper, 1979; de Vernal et al. , 1987). Cependant, Simon et al. (2012) ont récemment
réussi à établir un modèle d'âge pour la séquence 016PC, principalement à partir de
7
données paléomagnétiques. Ils ont déduit un âge basal de - 115 ka et une vitesse de
sédimentation moyenne d'environ 6.5 cm.ka-1•
La carotte de sédiment HU08-029-004PC mesure 895 cm de long et a été prélevée à
2674 rn de profondeur en mer du Labrador (61 °27'N; 58°2'0) à - 180 km de
l' embouchure du détroit d'Hudson (Figs. 1, 3). Les sédiments sont généralement
constitués d' un mélange d'argiles et de limons gris foncés incorporant
occasionnellement des débris plus grossiers provenant de délestages par les icebergs.
Cette matrice sédimentaire alterne avec des horizons bruns relativement épais
Qusqu'à 100 cm) laminés et sableux typiques d'évènements sédimentologiques brefs
associés aux évènements de Heinrich (e.g. , Broecker et al. , 1992; Heinrich, 1988). La
chronologie de la séquence, réalisée à partir de dates radiocarbones, a été construite
par Gibb et al. (2014). Elle a livré un âge basal de - 36.6 cal ka BP et un taux de
sédimentation moyen de - 24.4 cm.ka-1, bien que ce dernier soit très variable dans la
séquence.
0.5 Approche méthodologique
Cette thèse traite plus spécifiquement de l'utilisation des isotopes de trois éléments
chimiques de la famille des actinides (i.e. , uranium (U), thorium (Th) et protactinium
(Pa)) dans l' étude des séquences sédimentaires marines précitées. Les isotopes de l'U,
du Th et du Pa présentent diverses possibilités d'application et sont utilisés ici comme
traceurs de la dynamique géochirnique et sédimentaire en mil ieu océanique.
Les déséquilibres des séries de désintégration de l'U et du Th font référence au
fractionnement des isotopes de ces séries ayant lieu dans la nature au cours des
différents processus géologiques (Fig. 5; e.g., Bourdon et al. , 2003; Cochran, 1992).
Ils sont dus aux différences de propriétés physico-chimiques de ces isotopes : un
8
fractionnement peut se produire en fonction de leurs valences et affmités chimiques
respectives (cf. Cheng et al., 1998). Dans l'environnement aquatique, le
fractionnement des isotopes des séries de l'U et du Th est principalement dû aux
différences de solubilité ( e.g., Cochran et Masqué, 2003; Henderson et Anderson,
2003). Les différents nucléides peuvent donc être classés en deux groupes : ceux qui
restent dissous de manière stable dans l'eau ( e.g., isotopes de 1 'U, du radium -Ra-), et
ceux qui s'associent avec des particules et qui sont par conséquent soustraits de la
colonne d'eau par adsorption ou co-précipitation (e.g., isotopes du Th, du Pa, du
plomb -Pb-; Cochran, 1992). Ces comportements physico-chimiques différents
mènent à des déséquilibres radioactifs dans les différentes phases de l'environnement
océanique. Enfm, grâce à leur désintégration radioactive ils peuvent servir d'outils
géochronologiques et fournir des inf01mations sur les rendements et les échelles de
temps de processus dynamiques induisant un fractionnement (e.g., circulation des
masses d'eau, productivité, sédimentation; e.g., Henderson et Anderson, 2003).
L'U parvient à l' océan principalement par les rivières, l'eau de ruissellement et les
eaux souterraines. Son temps de séjour océanique est estimé à ~500 ka (Faure et
Mensing, 2005). La concentration en uranium peut être raisonnablement considérée
comme uniforme et constante dans l' océan (3,123 ±0,107 ng.g-1 pour une salinité de
35 ; e.g., Not et al., 2012) au cours de la période étudiée (~ 115 ka), et en négligeant
les ~3 % de variation de concentration liées aux fluctuations glaciaires-interglaciaires
de la masse océanique. Le comportement de l'U dans le milieu océanique est régi
principalement par les conditions d'oxydoréduction, le processus de recul alpha
engendrant par surcroît un déséquilibre entre 234U et son ascendant 238U. Dans la
colonne d'eau en condition oxydante, l'U est en solution sous la forme d'ions
uranyles (U022+) en un état hexavalent (+VI). La soustraction de l'U de la colonne
d'eau s'effectue principalement par:
9
(i) précipitation dans les sédiments lors de sa réduction en sa fonne
tétravalente (+IV) sous l' effet de conditions réductrices (e.g. , Gariepy et
al. , 1994),
(ii) inclusion dans les minéraux authigènes ( e.g., transfonnation des ions
uranyles Uül+ en complexes carbonatés U02(C03) 3 4
- et co-précipitation
avec les carbonates de calcium biogéniques) ou,
(iii) lors de la fonnation d'oxydes (i.e. , oxydes de fer ou de manganèse -Mn-;
e.g. , Cochran, 1992; Faure et Mensing, 2005; Henderson et Anderson,
2003).
La désintégration radioactive des isotopes de l'uranium (i.e., 234U et 235U
respectivement) présents sous f01me dissoute dans la colonne d'eau produit les
radionucléides 230Th et 23 1Pa. Les périodes radioactives (t112) correspondantes sont les
suivantes :
• t 112e30Th) = 75690 ± 230 ans; Cheng et al. , 2000;
• t 112e3 1Pa) = 32760 ± 220 ans; Cheng et al. , 1998;
• t112e4U) = 245250 ± 490 ans; Cheng et al. , 2000;
• t 112e 35U) = 7.0381 ± 0.0096 108 ans ; Begemann et al., 2001.
Comme le 230Th et le 231 Pa sont produits de manière unifonne, les flux de ces
radionucléides produits dans la colonne d'eau sont sensiblement constants (François,
2007) :
10
où le symbole {3 correspond au taux de production, À est la constante de
désintégration et A l'activité de l'élément considéré.
Contrairement aux isotopes de l' uranium, ceux du Pa et du Th sont très réactifs. Ils
ont tendance à s'adsorber à la surface des particules organiques ou minérales
présentes dans la colonne d'eau et sont par conséquent enfouis avec celles-ci dans le
sédiment. Il s'agit du processus décrit sous le nom de "scavenging'' (Anderson et al.,
1983b ). Dès lors, en supposant que toute la quantité de radio-isotopes produits dans la
colonne d'eau se trouve enfouie dans le site sous-jacent, les sédiments marins
présentent une activité 230Th et 231 Pa des sédiments récents en excès (i.e. , activités
non soutenues par la désintégration de l' uranium du sédiment) avec un rapport
théorique de l'excès de 23 1Pa sur celui du 230Th de ~0.092 , avant décroissance
radioactive de ces excès.
Au-delà de ces propriétés assez voisines, des différences peuvent s'observer entre le
Pa et le Th qu ' il est possible d'exploiter. Tout d'abord, le thorium est un peu plus
réactif que le protactinium. L'extrême réactivité du 230Th avec les particules permet
de 1 ' utiliser comme outil de normalisation des flux particulaires ( e.g., François et al.,
2004) et géochimiques (e.g., 231 Pa; François, 2007; Hoffmann et al., 2013) et comme
traceur des flux sédimentaires comme le ''focusing" et le "winnowing", i.e. processus
syn- ou post-sédimentaires de redistribution particulaire par les courants profonds
( e.g., François et al., 1993; François et al., 2004 ). Le temps de séjour du 230Th dans
les masses d'eau profondes est de l'ordre de 30 ans alors que celui du 23 1Pa est de
~200 ans (Yu et al., 1996). Ensuite, la distribution de ces radionucléides est
notamment influencée par leurs différentes affinités chimiques en fonction de la
composition des particules qui sédimentent (Chase et al. , 2002). Le Pa a davantage
d'affmité avec l'opale et les oxydes de Mn que le Th qui a plus d'affmité avec les
carbonates.
11
Etant donné son temps de séjour plus élevé, le 231Pa produit a plus de chance que le 230Th d'être exporté latéralement vers des régions de "scavenging'' plus intense, i.e.
où le flux en particules et/ou l'affmité avec les particules augmentent sa soustraction
de la colonne d'eau. Le processus de transport par diffusion suivi d'un "scavenging''
plus important dans des régions de plus faibles concentration en 23 1Pa est connu sous
le nom de "boundary scavenging'' (Anderson et al., 1983a). Dès lors, des rapports
d'excès de 231Pa sur 230Th plus élevés s' observent généralement dans les sédiments
des marges continentales, tandis que de plus faibles valeurs se retrouvent dans les
sédiments de l'océan ouvert (e.g. , Chase et al. , 2003 ; Kumar et al., 1993). Ces effets
s'observent par exemple claiTement dans les sédiments du bassin du Pacifique, de
l'Atlantique équatorial et des latitudes tropicales pour lesquels la productivité est plus
abondante (e.g., Chase et al. , 2003; Yu et al. , 2001; Kumar et ai. , 1993). Cependant,
dans l'océan Atlantique, il a été montré que cet effet n'est pas le processus dominant
contrôlant la répartition des radio-isotopes de 230Th et de 231Pa. En effet, les études de
modélisation et paléocéanographiques (e.g., Marchal et al., 2000; Yu et al. , 1996)
semblent indiquer que les rapports e31Pax/30Thxs)o enregistrés dans les sédiments de
l'océan Atlantique poun·aient plutôt refléter les changements passés dans le débit de la
circulation intermédiaire et profonde. Le 231 Pa serait exporté latéralement par
advection plutôt que par diffusion car le temps moyen de séjour du 23 1Pa dans les
masses d'eau profondes est équivalent au temps de séjour des masses d'eau
intermédiaires et profondes dans l'Atlantique avant leur transit vers l'océan Austral
(i .e., ~20Q ans). Normalisé au 230Thx5, les mesures de 23 1Pax; dans les séquences
sédimentaires peuvent donc donner des informations sur le processus de
"scavenging", le flux de particules et le transport régional par les masses d'eau.
12
0.6 Contenu du manuscrit
La thèse se décline en deux chapitres maJeurs écrits en langue anglaise, chacun
correspondant à un article en voie de soumission dans une revue scientifique pour
publication. Ils portent tous deux sur l' analyse d'une séquence sédimentaire et la
méthodologie appliquée dans les deux cas est similaire.
Le chapitre 1 concerne la séquence sédimentaire de la baie de Baffm, s'étalant sur la
quasi entièreté du dernier cycle glaciaire. A travers une analyse multi-paramètres
basée principalement sur les isotopes de l'U et du Th le long de cette séquence, nous
déterminons les processus et les flux géochirniques et sédimentaires du sédiment
profond du bassin. De plus, à l'aide des données sur le 230Th en excès nous en
caractérisons la dynamique particulaire des derniers ~ 115 ka, afin de dépeindre la
dynamique océanique et climatique de la région. Les résultats obtenus aident à mieux
cerner les processus sédimentaires internes au bassin et le rôle de la baie dans le
schéma de circulation océanique régionale en regard de son lien avec la mer du
Labrador à travers le détroit de Davis.
Le chapitre II porte .sur la séquence sédimentaire de la mer du Labrador, s'étalant sur
les derniers ~37 cal ka BP. Les isotopes de l'U, du Th et du Pa ont été mesurés
régulièrement dans cette séquence et les données ont été combinées à d'autres
données physiques, minéralogiques et géochirniques. Les informations recueillies
permettent d 'évaluer les processus et flux géochimiques et sédimentaires au site
étudié. Les vitesses de dépôts des apports massifs en carbonates détritiques recensés
(H2 et Hl) sont estimées à l'aide des inventaires de 230Th en excès selon la même
procédure que celle appliquée par Veiga-Pires et Hillaire-Marcel (1999). Proche du
détroit d 'Hudson, ces informations deviennent cruciales car elles permettent de
retracer avec précision la dynamique de la calotte de glace des Laurentides. De plus,
13
les budgets des isotopes radiogéniques 23 1Pa sur 230Th en excès dans les sédiments
sont évalués et permettent d'obtenir de l' information sur la dynamique particulaire du
bassin, ainsi que sur les fluctuations des courants de la région depuis la fm de la
période glaciaire, en lien avec les épisodes de fonte de la calotte des Laurentides.
En fm, nous dressons les limitations méthodologiques quant à 1' estimation de ces
excès pour un site localisé en zone de marges continentales.
Finalement, nous achevons ce manuscrit par une conclusion générale dans laquelle
sont présentés un résumé des retombées de nos recherches, ainsi que les perspectives
scientifiques qui en découlent.
DSO
Sites de Cllrottage • (61 "27'N, 58"2W:
2674 m de prof. d'eau)
Distribution schématique des allleurements cart>onatés paléoZolques et protéozolques (d'après Andrews et al .. 1998: Hulbe et al.. 2004)
D Marges des calottes de glace au dernier maximum glaciaire
. (d'après Dyke et al .. 2002)
').\)~ ~ s l! a .. .. .. ~
14
Bathymétrie
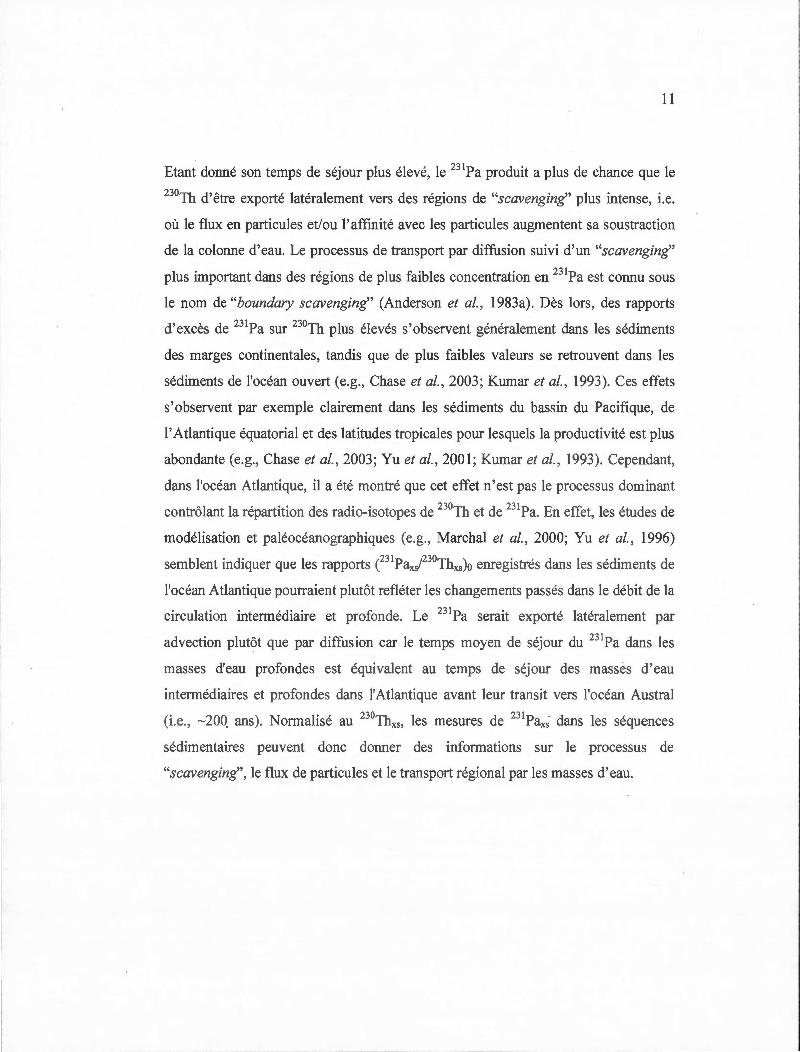
Figure 1 - Carte de localisation des sites de prélèvement des séquences sédimentaires HU08-029-004PC et HU08~029-016PC en mer du Labrador et en baie de Baffm, et représentant : la bathymétrie de la région, l' extension des calottes de glace au dernier maximum glaciaire, les zones d'affleurement des carbonates détritiques ainsi que leurs principales zones de sortie vers 1' océan Atlantique, et en fm, une illustration schématique des composantes de la circulation de renversement méridienne Atlantique avec les courants profonds (traits continus) et intermédiaires (traits pointillés) et les acronymes des principales masses d'eau concernées (WGC - Western Greenland Current; BIC - Baffm Island Current; DSO - Davis Strait Overflow; LC - Labrador Current; EGC -East Greenland Current; WBUC - Western Boundary Undercurrent; NEADW - Northeast Atlantic Deep Water; LSW- Labrador Sea Water; DSOW -Denmark Strait Overflow Water; NADW- North Atlantic Deep Water).
246110 19 014 BC
015CTD 016 PC
017 Plc,nkton
35kHz reoord lot lo<obon ol2008029 014BC. 015CTD. 016PC. 017 planklon -al 246110 19, -2060m WO
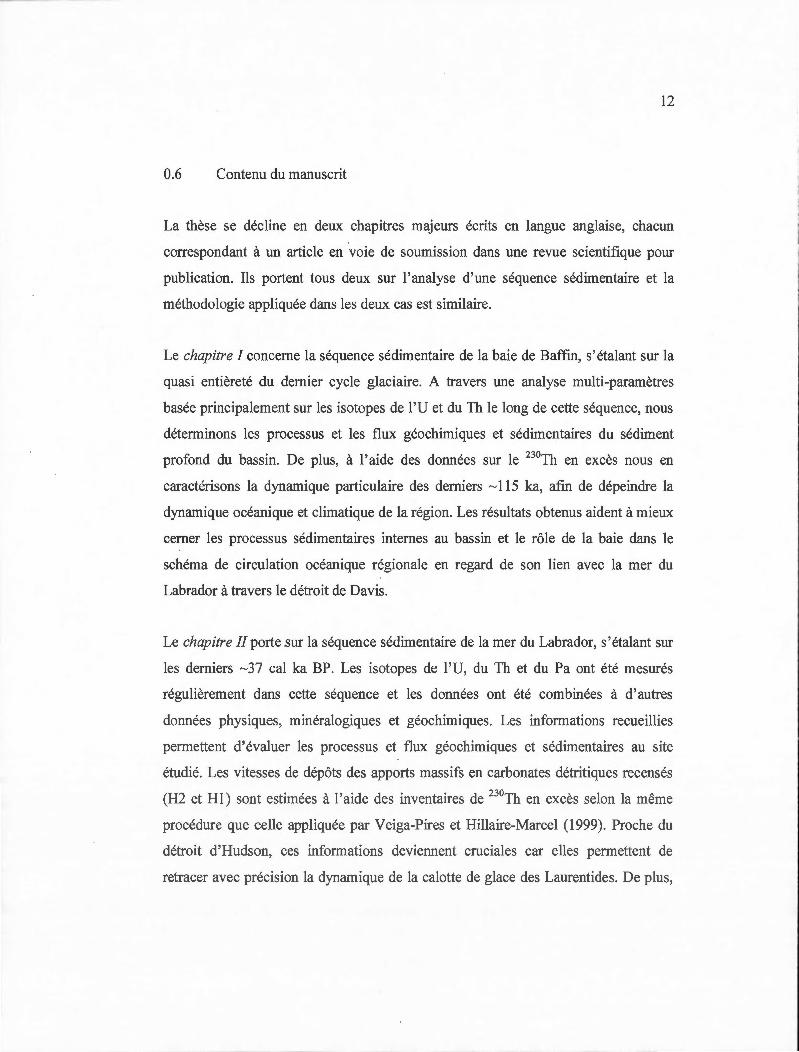
Figure 2 - Images CA T -scan et photographies des carottes de la séquence HU08 029-016PC et profil sismique de la zone d'échantillonnage
15
PC-DE PC-CD PC-BC PC-AB
. ,,
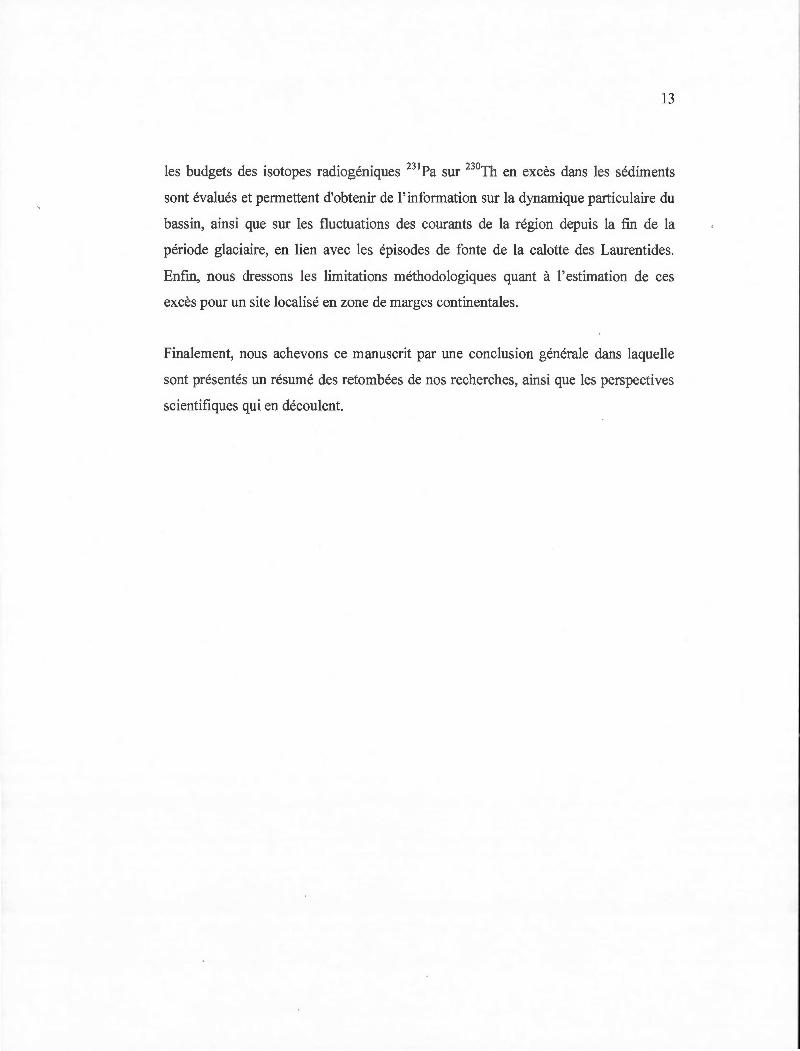
Figure 3 - Images CA T-scan et photographies des carottes de la séquence HU08-029-004PC et profil sismique de la zone d' échantillonnage.
16
Regional ice-sheets: /\ liS: lnnuitian ~ GIS: Greenland
LIS: Laurentide
.... "?·····, LGM ice-sheets ··--··-...... -· maximum extent?
,.....,..__ Major LGM >s -1r ~ ice-streams
60W
L..,..L, Paleozoic -rL-r-1 carbonate outcrops
e Core Location
\ Arctic Water
\ West Greenland lntermediate Water
Paleocene - Late Cretaceous "Tertiary volcanics" basa~s (i.e., matie)
zoic Cambrian to Late Devonian limestones and dolostones. 1nterbedded with calcareous shales + Late Triassic clastics and carbonates and Cretaceous-Paleocene sliiciclastic outcrops Slliciclastic (quartzarenites) rocks interbedded with minor shales. limestones and dolostones (Thule Group and Borden Basin) Granites of the 'Cumberland batholrth (1850-1870 Ma) and Piling Group (Baffin orogen) +
17
SOm
100m
250m
500m
750m
1000m
1250m
1500m
2000m
2500m
3000m
3500m
, ~ "1: (/) c .!'!! l5 E
gneisses and metasediments (marbles and siliciclastic rocks) m Rinkian mobile be~ (i.e .. Karrat Group)+ felsic granites in the Ketilidlan mobile bett (KMB) (South Greenland)
~ a:
Granites. granite gneiss and quartzofeldspathic orthogneiss + metasediments (marbles and siliciclastic rocks) in the Rae Craton (Committee belt. Churchill Province) and Rinkian mobile bell
Nagssugtoqidian Mobile Belt (NMB)- reworked granulite facies Archaean gneisses in early Proterozoic lold belts in West Greenland Archean Block (AB) - gneisses (orthogneiss in granulite facies)
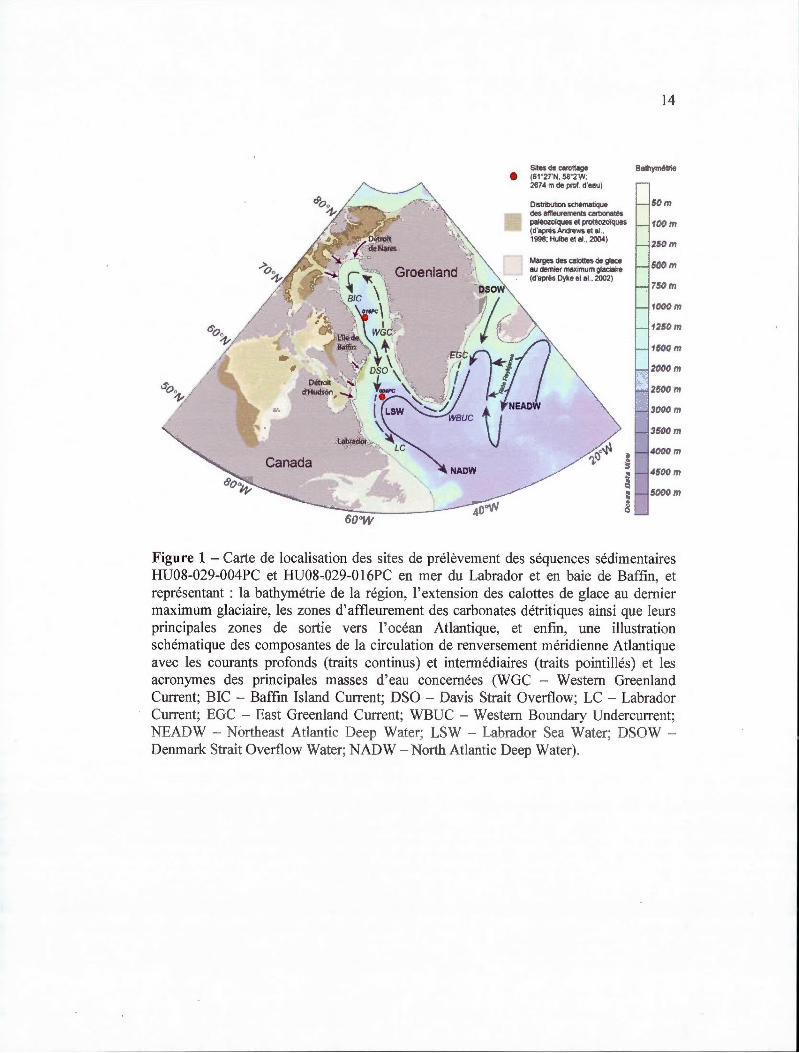
Figure 4 - Carte générale de la région de la baie de Baffm et de la mer du Labrador. La bathymétrie, la circulation océanique et la géologie y sont représentées de manière simplifiée (Simon et al. , 2014).
u
Th
Ac Ra
Fr
Rn At
Po
Bi
Pb
Tl
18
Figure 5- Les trois chaînes de désintégration radioactive naturelles : 238U, 235U et 232Th (Bourdon et al., 2003).
CHAPITRE 1
U- AND Th-SERIES ISOTOPES IN DEEP BAFFIN BAY
SEDIMENTS: TRACERS OF DETRITAL SOURCES AND
OF CONTRASTED GLACIAL/INTERGLACIAL
SEDIMENTARY PROCESSES
Laurence Nuttin 1 and Claude Hillaire-Marcel 1
1GEOTOP, Université du Québec à Montréal, C.P. 8888, Suce. Centre-Ville, Montréal, QC, H3C 3P8, Canada
Keywords: Baffm Bay, marine sediments, U- and Th-series isotopes, 230Th-excess, late Quatemary, last glacial cycle, detrital sources, sedimentary processes
Article soumis dans la revue scientifique Marine Geology.
20
Abstract
Uranium- (U) and thorium- (Th) series have been used to document the sedimentary
sources, processes and fluxes of the last ~ 115 ka in central Baffm Bay, a major
gateway between the Arctic Ocean and the North Atlantic Ocean, which has been fed
throughout the last ice age by sediments and meltwaters from the no1theastern
Laurentide lee Sheet, the Innuitian lee Sheet and the western Greenland lee Sheet.
Measurements have been made with a ~ 1.6 ka time resolution in sedimentary core
HU2008-029-016PC (70°27'N, 64°39'W; 2063 rn water depth). The Jack of
correlation between V-concentration, 234UP8U activity ratio (e34U/238U)AR), organic
carbon and redox sensitive elements suggests minimum early diagenetic U-uptake if
any, likely due to very low organic matter sedimentary fluxes. Throughout the last
glaciation, U- and Th-concentrations and mass ratio, as well as e34UP8U)AR, do not
show either any unequivocal linkage with detrital dolomitic carbonate and/or detrital
silicate fluxes. Data rather suggest sedimentary supplies with singular U- and Th
series signatures linked to specifie glacial margin/ice streaming events. Large initial
excesses in 230Th (e30Thxs)o), we11 above the production from dissolved-U decay in
the overlying water column, are observed throughout the last glacial interval in
response to sediment focusing and high-sedimentation rates in the deepest part of the
Bay. During this interval, high-frequency fluctuations in e30Thxs)o indicate either a
similar variability in sedimentation rates, not captured by the age mode] used, and/or
grain size or mineralogical-dependent 230Thxs-scavenging rates. In the much lower
sedimentation rate Holocene core-top section, the e30Thxs)0-inventory falls below
production in the overlying water column, despite evidence for sorne primary
productivity revival as suggested by the higher organic carbon content. 230Thxs-losses
through lateral advection via Baffm Bay water-masses overflowing through Davis
Strait might acc01mt for this pattern, painting to ocean circulation drastically differing
from that of the glacial interval.
21
1.1 Introduction
Freshwater and sea ice exports from the Arctic Ocean have a strong impact on the
North Atlantic oceanic circulation hence on the climatic system. Baffin Bay is one of
the main communication pathways between the Arctic and the North Atlantic,
notably through the Labrador Sea where water mass convections occur, contributing
to the global oceanic circulation. During glacial periods, Baffin Bay constituted one
of the major outlets of surrounding ice-sheets (the north eastern Lauren ti de Ice-Sheet,
the Innuitian Ice-Sheet and the Greenland Ice-Sheet; Fig. 1 ). Glacial-time
sedimentation rates in Baffm Bay have always been seen as highly-variable (Aksu
and Piper, 1979; 1987; Aksu and Hiscott, 1989; Hiscott et al., 1989). Sources,
transport, depositional mechanisms and supply-rates of sedimentary particles were
considerably shaped by instabilities along ice-sheet margins (Aksu and Piper, 1987;
Parnell et al., 2007; Simon et al., 2014). The sediments from the glacial intervals
encompâss debris flow deposits and turbidites linked to meltwater pulses and smges
along these glacier margins. In opposition, interglacial sediments consist of thin
layers of hemipelagic material (Aksu and Piper, 1979; 1987).
Earlier paleoceanographic investigations in Baffin Bay ( e.g., Aksu and Hiscott, 1989;
Arthur et al., 1989) were limited due to weakly-constrained chronological
stratigraphie interpretations of late Pleistocene sequences. Firstly, the low primary
productivity that prevailed during glacial intervals with a permanent sea ice cover (de
Vernal et al., 1987) resulted in scarce bio genie carbonates usable for the setting of 180-stratigraphies and unconstrained apparent 14C-ages of carbonate ions in Baffm
Bay paleo-waters. Secondly, low calcite saturation levels, at least during the present
interglacial (e.g., Azetsu-Scott et al. , 2010), are responsib1e for the dissolution of
biogenic carbonates (see also de Vernal et al., 1992). Thirdly, local changes in sea
ice/brine distillation processes in combination with variable fluxes and isotopie
---- - -l
22
compositions of continental meltwater (Hillaire-Marcel and de Vernal, 2008)
hampered any stratigraphie interpretation of the very few 8180 values obtained on
scarce planktic foraminifers from deep Baffm Bay cores (Hillaire-Marcel et al. ,
1989).
More recently, Simon et al. (2012) proposed a new chronostratigraphic framework
covering the late Pleistocene based on magnetic paleointensity measurements in the
very core used in this study (i.e., HU2008-029-0 16PC; ~ 7.4 rn long; Figs. 1, 2). The
core chronology (Fig. 2) was constructed through correlation of the relative
paleointensity (RPI) profile with regional and global RPI reference curves. Average .
time incertitude for the ~22-75 ka interval is ~ 1.4 ka (±2cr) while a hu·ger incertitude
of ~2.2 ka (±2cr) has been proposed for the ~ 75-115 ka interval. Two geomagnetic
excursions (i.e. , the Laschamp and the Norwegian-Greenland Sea excursions) support
the correlations. Mm·eover, measurements of 210Pb performed on the trigger core
(Steinhauer, 2012), the relative calcite percentages correlated to a nearby well-dated
box core from Baffin Bay (core JCR175-BC06; from Andrews and Eberl, 2011 ) and
three radiocarbon ages from the deglacial section (see Simon et al. , 2012 for details)
complete the age model. Their study also indicated a mean sedimentation rate of ~6 . 5
cm.ka·1 for the last ~115 ka but varying from less than ~3 cm.ka·1 in the Holocene
section up to - 67 cm.ka·1 during the deglacial.
Here, we use the above chronostratigraphy to document U- and Th-series isotope
behavior in the sediment, and confront sedimentary processes and sedimentation rates
inferred from sedimentological and paleomagnetic data to information from these
isotopes, especially from the ex cess-230Th e30Thxs; i.e., the 230Th produced from the
decay of 234U in the water column). Ultimately, our objective is to retrieve
information on sedimentary processes, particle sources (from U and Th data), and
l 1
23
their fluxes (from 230Thxs values), with inferences on ice-sheet and water mass
instabilities relating to the last ~ 115 ka climatic fluctuations .
U- and Th-concentrations and isotopie ratios were determined at 16 to 8 cm intervals
on bulk sediment samples, i.e., with a mean resolution of ~ 1 to 2 ka, based on the
age-model of Simon et al. (2012; Fig. 2). Other data including grain size
measurements, calcite vs . dolomite abundances, a few redox-sensitive element
measurements (sulfur, manganese and iron), and organic carbon (Corg) contents, are
used to complement information on particle sources, their transport mechanisms, and
on geochemical and sedimentary processes of importance for the documenting of U
and Th-geochemistry in the sedimentary sequence ( e.g., Henderson and Anderson,
2003). Further information on sedimentological features , paleomagnetic data and
mineralogical abundances of the study sequence can be found in Simon et al. (20 12;
2014) and in Simon (2013).
24
1.2 Regional Settings
Baffm Bay is a small subarctic ocean basin ( ~ 1400 km long, ~550 km wide and
~2300 rn deep in its central plain) bordered by Baffm Island, the Canadian Arctic
Archipelago and Greenland (Fig. 1; Tang et al., 2004). The bathymetry of the bay is
asymmetric, with a continental shelf exceeding 150 km off the western Greenland
coast, and of less than 35 km off the eastern Baffin Island; the slopes from both parts
are steep (Fig. 1; Aksu, 1983). Baffin Bay is connected to the A retie Ocean through
channels of the Canadian Arctic Archipelago, and to Labrador Sea through Davis
Strait. Sin ce around 9 cal ka BP, wh en Nares Strait opened (Fig. 1; England, 1999;
En gland et al. , 2006; Jennings et al., 2011 ), the retreat of continental ice in the
Canadian Arctic permitted Arctic waters to be evacuated through the archipelago and
the bay. This Arctic-North Atlantic connection through Baffm Bay radically impacted
oceanographie conditions in the bay itself, as weil as in the Labrador Sea, thus
contributing to the progressive inception of the modem circulation system. Today the
circulation in the bay is predominantly cyclonic. It is dominated by the northward
flowing Western Greenland Current, which is supplied by an inflow from the East
Greenland Current, and by the southward-flowing Baffm Current, a large contributor
to the Labrador Current (Tang et al., 2004).
A particular feature of Baffin Bay sedirnentary records is the abundance of detrital
carbonate-rich layers. Quatemary glaciations led to the erosion of Paleozoic
carbonates along northem Baffm Bay ice-margins (Fig. 1; Andrews et al., 1998;
Dyke et al., 2002; Hulbe et al. , 2004). There, ice streaming and melting events led to
the discharge of glacially-eroded detrital carbonates into the bay (Andrews et al.,
1998). They represent an important part of the total accumulated sediment. They
contain more dolomite than calcite, in contrast with the carbonate layers observed in
the Labrador Sea and the North Atlantic (Andrews, 1993; Andrews et al., 1998). lee
25
streaming was particularly active in Lancaster, Jones and Smith sounds, located at the
northem part of the bay (Dyke et al., 2002). lee rafting, currents and slope
sedimentological processes then spread these detrital carbonates throughout the
central and eastern areas of the bay (Andrews and Eberl, 2011).
26
1.3 Materials and methods
The 741 cm-long sediment sequence HU2008-029-016PC (hereafter 016PC) was
retrieved from a water depth of 2063 rn in the abyssal plain of the central part of
Baffm Bay (70°27'N, 64°39'W; Fig. 1; Campbell and de Vernal, 2009).
Wet bulk-density profiles were measured onboard by gamma ray attenuation using a
GEOTEK™ Multisensor Core Logger with a cm-scale downcore resolution . Once
split lengthwise, the sections were visually described for structure, texture and color
(Campbell and de Vernal, 2009), then scanned at high resolution (~0.1-1 mm) using a
computerized coaxial tomography (CA T -scan) technique to acquire 3D X-ray images
(St-Onge and Long, 2009).
Grain size analyses were performed on ~ 1 g of bulk-sediment using a Beckman
Coulter™ LS 13320 laser diffraction grain size analyzer (see Simon et al. , 20 12).
Grain size distribution and statistical parameters were then calculated using the
Gradistat™ software (Blott and Pye, 2001 ). Microgeochemical variations of iron
(Fe), sulfur (S) and manganese (Mn) (in counts per second; eps) were determined by
micro X-ray fluorescence (~-tXRF) spectrometry on the u-channels sampled for
magnetic property measurements, using an ITRAX™ core scanner equipped with a
Mo-tube (Croudace et al., 2006; Simon et al., 2014). For each element, the number of
counts acquired for a given depth interval was normalized by the total number of
counts (in thousand counts per second; kcps). Qualitative and semi-quantitative
(±la::::: 5%) analyses ofmineralogical assemblages were made by Simon et al. (2014)
through X-ray diffraction (XRD) following procedures described in Last (2001),
Moore and Reynolds (1997) and Thorez (2003).
- ,
27
Total carbon- (C) content, inorganic carbon (Cinorg) and organic carbon (Corg) were
analyzed on the bulk-fraction at 8 cm-intervals and reported in percentage vs dry
sediment weight ( dw% ). Aliquots of ~9 mg were analyzed for the ir total C-content
using an NC 2500TM elemental analyzer (Carlo-Erba™). Aliquots were then
fumigated for ~24 hours with vapors of 12M HCI to dissolve the Cnorg and measure
the residual Corg-content (Hélie, 2009). Values of Cinorg were fmally estimated by
subtracting the Corg values from the total C values. However, this dissolution
procedure may have not removed ali the fraction of the Cinorg (dolomite can be
refractory to leaching) or might be slightly biased by the dissolution of other HCl
leachable compounds, both resulting in minor anomalies in Corg-estimations. An
intemal precision ofO.l% (±lcr) was nonetheless estimated based on severa! analyses
of Labrador Sea sediment samples from the analogue coulometer technique (see Fig.
S2). Assuming that the Cinorg content are representative of calcite and dolomite
abundances, estimates of their respective dry weight percentages within the sediment
were calculated based on X-ray diffraction scans (Last, 2001; Moore and Reynolds,
1997; Thorez, 2003).
U and Th separation and extraction were performed following analytical procedures
described in Lally (1992). Sampling was made at 8 cm intervals in the upper 424 cm
of the sequence (i.e., the frrst ~65 cal ka BP; Simon et al., 2012) and at 16 cm below
(i.e. , from ~65 to ~115 cal ka BP). Bulk-sediment sub-samples of about 1 g were
heated at ~550°C for ~2 hours to eliminate organic matter and facilitate further
treatrnents. A 232U-228Th spike was added to the samples prior to a HC1/HN03/HF
acid digestion. U and Th were isolated from other elements by ion exchange
chromatography. A Dowex™ AGI X8 anion exchange resin was then used in
combination with ultra-pure H20 and 8M HCI, to separate U and Th respectively. Th
was purified to remove any residual constituents, and U was separated from Fe, with
a U/TEV A resin. Finally, U and Th were electrodeposited in monoatomic layers on
28
silver disks from which their activity was measured using an Ortec™ alpha counter
(see Vallières, 1997 or Veiga-Pires, 1998 for a detailed description of the
methodology). Analytical uncertainty based on counting statistics is better than 3%
(±1cr) for ali isotopes. Note that ali absolute concentrations, activity values, activity
ratios and statistical compilations are reported hereafter with a ± 1 cr standard
deviation .
29
1.4 Results
1.4.1 Sedimentological features
As described by Simon et al. (2014), the sediment of 016PC is mostly composed of
fme particles (Fig. 5). Silt (2 )lm-63 )lm) is the most important fraction and amounts
to 48 ±11 dw% (dry sediment weight percent; ±la) on an average, followed by the
clay fraction (<2 1-J.ffi) with a mean content of 29 ±9 dw%, then by sand (63 ~-J.m-2
mm; 19 ±12 dw%) and gravel (>2 mm; 3 ±7%). The coarser fraction profiles,
strongly influenced in such a setting by ice-rafting history, show relatively large
variations (standard deviation;:::; 70%).
The Corg-content is low throughout the core with values varying between 0.1 and 0.7
dw% (Fig. 3 ). Moreover, values in the upper half of the sequence are slightly higher
than in the bottom half. Three intervals dated respectively at - 37.9-34.9, - 11.9-10.85
and :S0.6 cal ka BP, depict relatively higher Corg values. However, if the value from
the core top sediment dated :S0.6 cal ka BP likely represents true Corg concentrations
relating to enhanced late Holocene biogenic production or to Corg preservation, those
observed deeper do.wncore might be an analytical artifact due to incomplete
dissolution of dolomite during sample treatment for Corg estimations (cf. material and
methods; Figs. 3, 5). Carbonate contents (Fig. 5) indicate highly variable mnounts of
detrital dolomite in the glacial sediment (-0.5 to -29 dw%), with a mean content of
14 ±9 dw%, vs 5 ±4 dw% of detrital calcite. The similarity of the dolomite and calcite
abundance profiles. indicates that the calcite essentially originates from terrigenous
supplies (Fig. 5), i.e. , it was also linked to the erosion of carbonate-rich bedrocks by
glaciers, rather to synsedimentary biogenic production.
30
As illustrated (Fig. 3), Fe- and S-contents (in cps.kcps- 1; cf. material and methods)
display nearly identical profiles, but differ from the Mn-content profile. Mn-contents
do not vary much below the Holocene section, but then, increases abruptly.
1.4.2 U and Th isotopie data
Uranium concentration varies quite importantly downcore, between 0.93 ±0.02 and
2.61 ±0.04 )lg.g-1 (Fig. 4), with a major peak at ~44.2 cal ka BP. Thorium
concentrations are relatively high throughout the sequence (~4.33 ±0.07 )lg.g- 1; Fig.
4). Three intervals yielded remarkably high Th-contents: 50.95 ±0.48 )lg.g- 1 at ~71
cal ka BP, 31.28 ±0.28 )lg.g-1 at ~51.1 cal ka BP, and 35.74 ±0.33 )lg.g-1 at ~46.2 cal
ka BP (U and Th measurements from these samples were duplicated). The (U/Th)
mass ratio depicts relatively low values ( compared to the mean crustal mass ratio
equal to ~0.3) and large variations with respective minimum and maximum values of
0.03 ±0.001 and 0.25 ±0.01. Throughout the sequence, the sediment generally depicts
a slight deficit in 234U VS 238U with a mean 234U/238U activity ratio ce34U/238U)AR) of
0.96 ±0.05. However, this activity ratio is relatively variable throughout the glacial
section, varying between 0.83 ±0.02 and 1.11 ±0.03, values respectively observed at
~ 109 and ~71 cal ka BP (Fig. 3).
Estimated initial 230Thxs activities (see the Supplementary information section for
details on calculations) are extremely variable (0.95 dpm.g- 1 on an average with a
standard deviation of 0.94; Fig. 5). A few samples yielded relatively high values,
especially in the Holocene section (up to 4.55 ±0.22 dpm.i 1) , and at ~71 cal ka BP
(5.50 ±0.18 dpm.g-1).
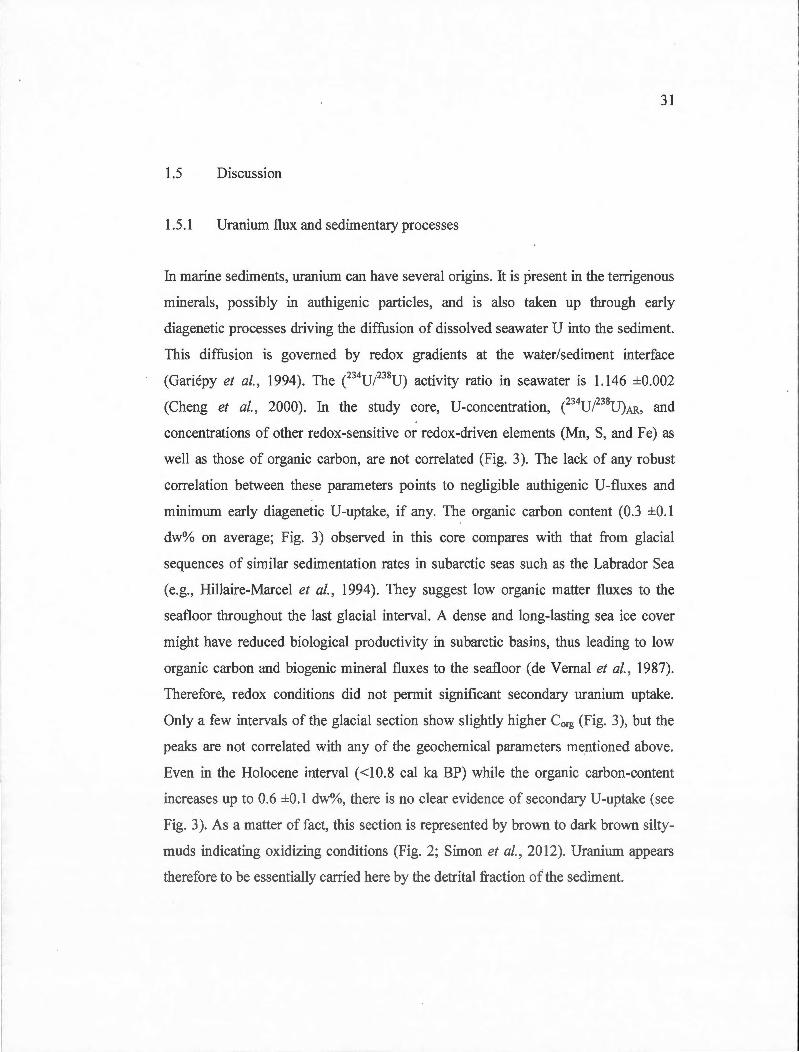
31
1.5 Discussion
1.5.1 Uranium flux and sedimentary processes
In marine sediments, uranium can have severa] origins. lt is present in the terrigenous
minerais, possibly in authigenic particles, and is also taken up through early
diagenetic processes driving the diffusion of dissolved seawater U into the sediment.
This diffusion is governed by redox gradients at the water/sediment interface
(Gariépy et al., 1994 ). The e34U/238U) activity ratio in seawater is 1.146 ±0.002
(Cheng et al., 2000). In the study core, U-concentration, CZ34UP 8U)AR, and
concentrations of other redox-sensitive or redox-driven elements (Mn, S, and Fe) as
weB as those of organic carbon, are not correlated (Fig. 3). The lack of any robust
correlation between these parameters points to negligible authigenic U-fluxes and
minimum early diagenetic U-uptake, if any. The organic carbon content (0.3 ±0.1
dw% on average; Fig. 3) observed in this core compares with that from glacial
sequences of similar sedimentation rates in subarctic seas such as the Labrador Sea
(e.g., Hillaire-Marcel et al., 1994). They suggest low organic matter fluxes to the
seafloor throughout the last glacial interval. A dense and long-lasting sea ice caver
might have reduced biological productivity in subarctic basins, thus leading to low
organic carbon and biogenic mineral fluxes to the seafloor (de Vernal et al., 1987).
Therefore, redox conditions did not permit significant secondary uranium uptake.
Only a few intervals of the glacial section show slightly higher Corg (Fig. 3), but the
peaks are not correlated with any of the geochemical parameters mentioned above.
Even in the Holocene interval (<10.8 cal ka BP) while the organic carbon-content
increases up to 0.6 ±0.1 dw%, there is no clear evidence of secondary U-uptake (see
Fig. 3). As a matter of fact, this section is represented by brown to dark brown silty
muds indicating oxidizing conditions (Fig. 2; Simon et al., 2012). Uranium appears
therefore to be essentia11y carried here by the detrital fraction of the sediment.
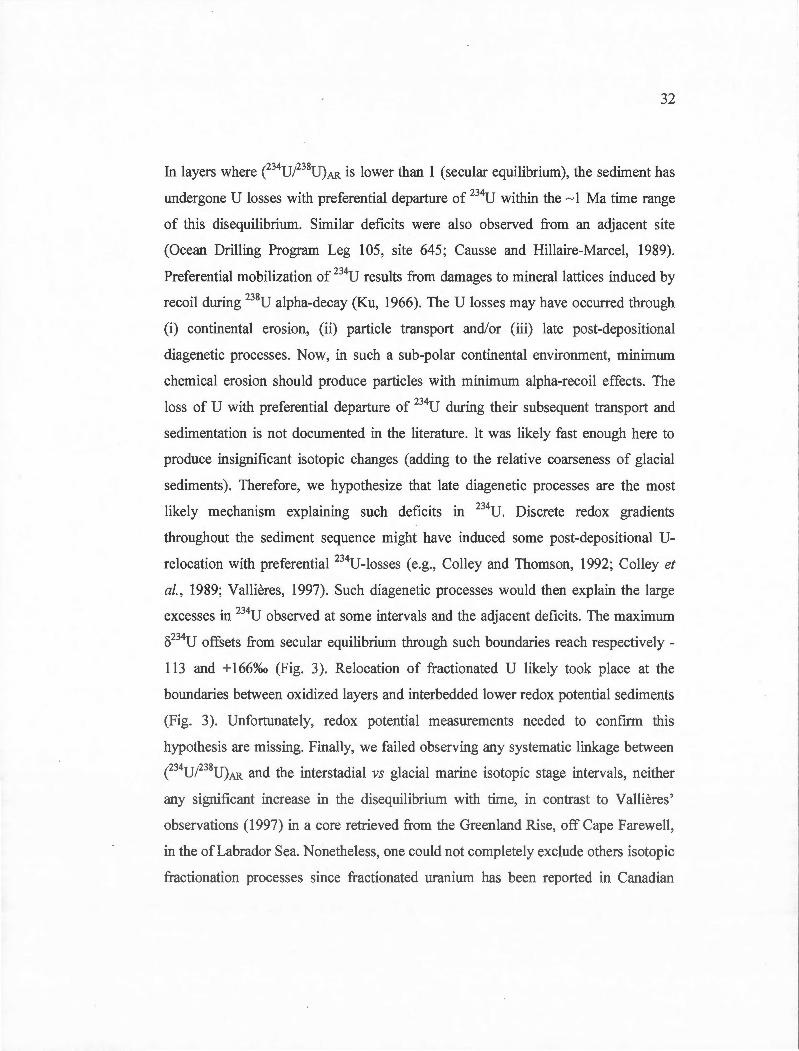
32
ln layers where CZ34UP38U)AR is lower than 1 (secular equilibrium), the sediment has
undergone U losses with preferential departure of 234U within the ~ 1 Ma time range
of this disequilibrium. Similar deficits were also observed from an adjacent site
(Ocean Drilling Program Leg 105, site 645; Causse and Hillaire-Marcel, 1989).
Preferential mobilization of 234U results from damages to mineral lattices induced by
recoil during 238U alpha-decay (Ku, 1966). The U losses may have occurred through
(i) continental erosion, (ii) particle transport and/or (iii) late post-depositional
diagenetic processes. Now, in such a sub-polar continental environment, minimum
chemical erosion should produce particles with minimum alpha-recoil effects . The
loss of U with preferential depa.tture of 234U during their subsequent transpmi and
sedimentation is not documented in the literature. It was likely fast enough here to
produce insignificant isotopie changes (adding to the relative coarseness of glacial
sediments) . Therefore, we hypothesize that late diagenetic processes are the most
likely mechanism explaining such deficits in 234U. Discrete redox gradients
throughout the sediment sequence might have induced sorne post-depositional U
relocation with preferential 234U-losses ( e.g., Colley and Thomson, 1992; Colley et
al. , 1989; Vallières, 1997). Such diagenetic processes would then ex plain the large
excesses in 234U observed at sorne intervals and the adjacent deficits. The maximum
8234U offsets from seculru· equilibrium through such boundaries reach respectively -
113 and +166%o (Fig. 3). Relocation of fractionated U likely took place at the
boundaries between oxidized layers and interbedded lower redox potential sediments
(Fig. 3). Unfortunately, redox potential measurements needed to confmn this
hypothesis are missing. Finally, we failed observing any systematic linkage between
CZ34UP38U)AR and the interstadial vs glacial marine isotopie stage intervals, neither
any significant increase in the disequilibrium with time, in contrast to Vallières'
observations (1997) in a core retrieved from the Greenland Rise, off Cape Farewell,
in the of Labrador Sea. Nonetheless, one could not completely exclude others isotopie
fractionation processes since fractionated uranium has been reported in Canadian
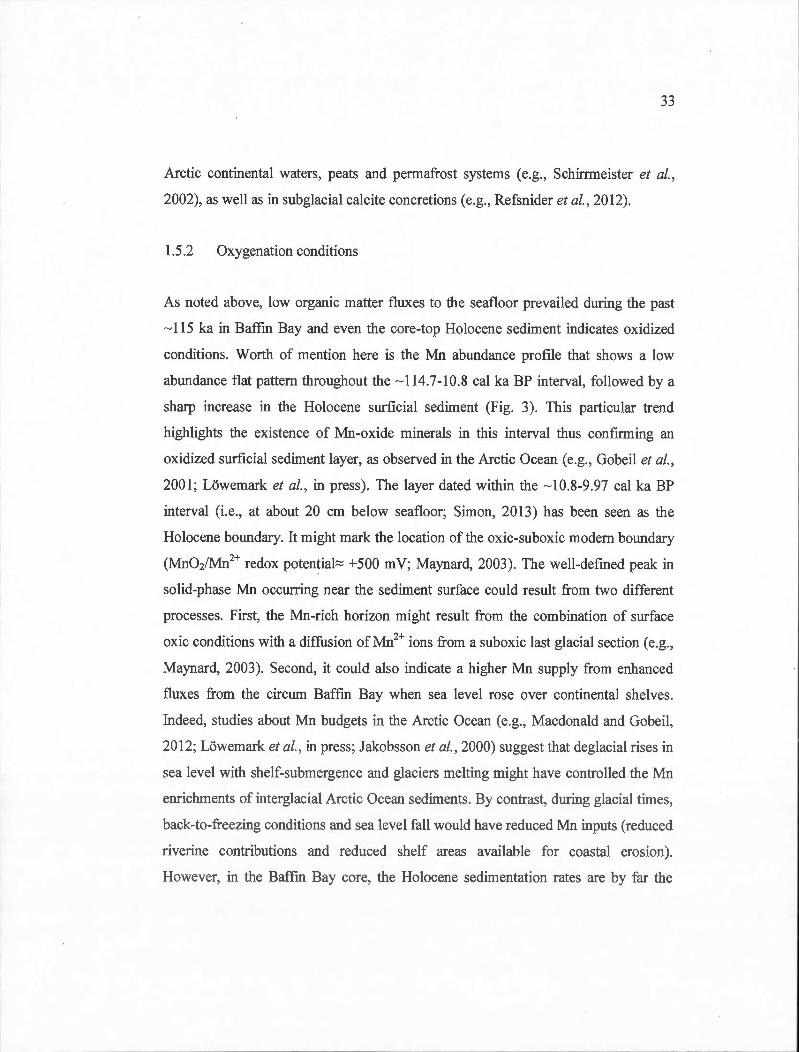
33
Arctic continental waters, peats and permafrost systems ( e.g., Schirrmeister et al.,
2002), as well as in subglacial calcite concretions (e.g. , Refsnider et al., 2012).
1.5.2 Oxygenation conditions
As noted above, low organic matter fluxes to the seafloor prevailed during the past
- 115 ka in Baffm Bay and even the core-top Holocene sediment indicates oxidized
conditions. Worth of mention here is the Mn abundance profile that shows a low
abundance flat pattern throughout the - 114.7-10.8 cal ka BP interval, followed by a
sharp increase in the Holocene surficial sediment (Fig. 3). This patticular trend
highlights the existence of Mn-oxide minerais in this interval thus confuming an
oxidized surficial sediment layer, as observed in the Arctic Ocean (e.g. , Gobeil et al.,
2001; Lôwemark et al., in press). The layer dated within the - 10.8-9.97 cal ka BP
interval (i .e., at about 20 cm below seafloor; Simon, 2013) has been seen as the
Holocene boundary. It might mark the location of the oxic-suboxic modem boundary
(Mn02/Mn2+ redox potential~ +500 mV; Maynard, 2003). The well-defmed peak in
solid-phase Mn occurring near the sediment surface could result from two different
processes. First, the Mn-rich horizon might result from the combination of surface
oxic conditions with a diffusion of Mn2+ ions from a suboxic last glacial section ( e.g.,
Maynard, 2003). Second, it could also indicate a higher Mn supply from enhanced
fluxes from the circum Baffm Bay when sea leve! rose over continental shelves.
Indeed, studies about Mn budgets in the Arctic Ocean (e.g. , Macdonald and Gobeil,
2012; Lôwemark et al. , in press; Jakobsson et al., 2000) suggest that deglacial rises in
sea level with shelf-submergence and glaciers melting might have controlled the Mn
enrichments of interglacial Arctic Ocean sediments. By contrast, during glacial times,
back-to-freezing conditions and sea leve! fall would have reduced Mn inputs (reduced
riverine contributions and reduced shelf areas available for coastal erosion).
However, in the Baffm Bay core, the Holocene sedimentation rates are by far the
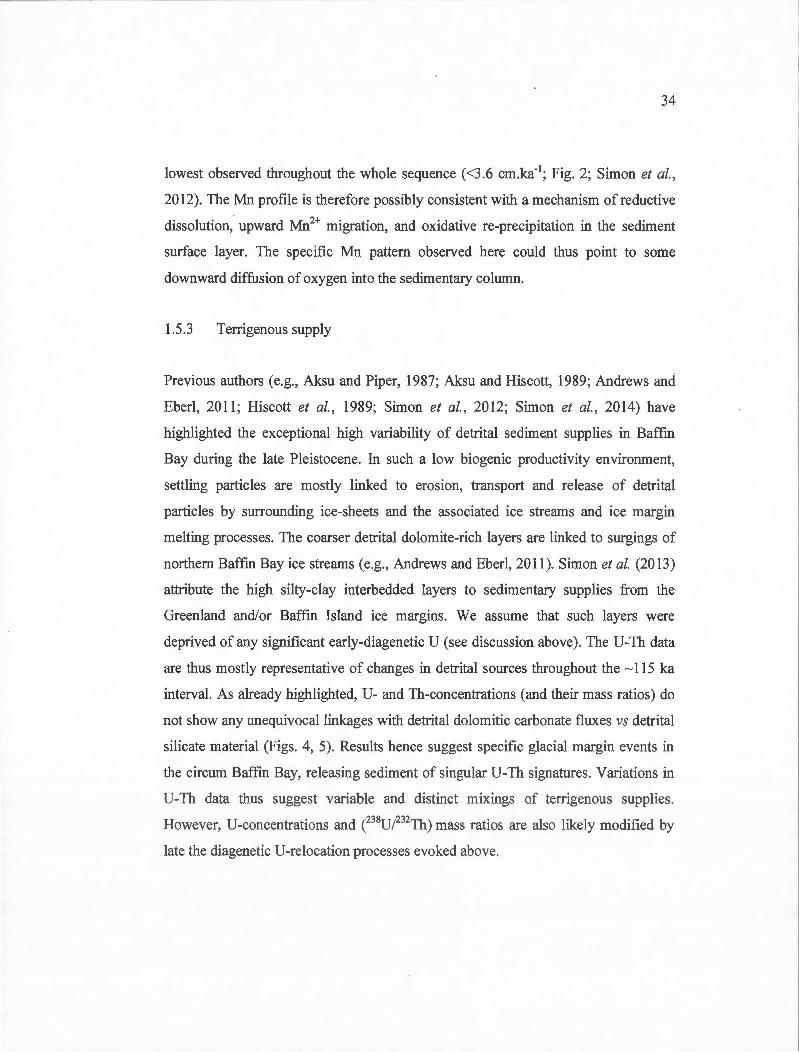
34
lowest observed throughout the whole sequence (<3.6 cm.ka-1; Fig. 2; Simon et al. ,
2012). The Mn profile is therefore possibly consistent with a mechanism ofreductive
dissolution, upward Mn2+ migration, and oxidative re-precipitation in the sediment
surface layer. The specifie Mn pattern observed here could thus point to sorne
downward diffusion of oxygen into the sedimentary colwnn.
1.5.3 Terrigenous supply
Previous authors (e.g. , Aksu and Piper, 1987; Aksu and Hiscott, 1989; Andrews and
Eberl, 2011 ; Hiscott et al. , 1989; Simon et al. , 2012; Simon et al., 2014) have
highlighted the exceptional high variability of den-ital sediment supplies in Baffm
Bay during the late Pleistocene. ln such a low biogenic productivity environment,
settling particles are mostly linked to erosion, transport and release of detrital
particles by surrounding ice-sheets and the associated ice streams and ice mm-gin
melting processes. The coarser detrital dolomite-rich layers are linked to surgings of
northern Baffm Bay ice streams (e.g. , Andrews and Eberl, 2011). Simon et al. (2013)
attribute the high silty-clay interbedded layers to sedimentary supplies from the
Greenland and/or Baffin Island ice margins . We asswne that such layers were
deprived of any significant early-diagenetic V (see discussion above). The V-Th data
are thus mostly representative of changes in detrital sources throughout the ~ 115 ka
interval. As already highlighted, V- and Th-concentrations (and their mass ratios) do
not show any unequivocallinkages with detrital dolomitic carbonate fluxes vs detrital
silicate material (Figs. 4, 5). Results bence suggest specifie glacial margin events in
the circum Baffm Bay, releasing sediment of singular V-Th signatures . Variations in
V-Th data thus suggest variable and distinct mixings of terrigenous supplies.
However, V-concentrations and e8VP 32Th) mass ratios are also likely modified by
late the diagenetic V-relocation processes evoked above.
35
The three peaks that depicted much higher 232Th-concentration (<31 11g.g-1; Fig. 4)
match similarly peaking values reported in sediments from the nearby ODP site 645
(Causse and Hillaire-Marcel, 1989). Such high concentrations might have been
carried by clays inherited from paleosoils and/or shales from suiTounding lands (e.g.,
paleosoils developed over Precambrian metamorphic rocks outcropping in Greenland
and Baffin Island; MacLean, 1985).
1.5.4 230Thxs flux and evolution in deep-water circulation
The production rate of 230Thxs in the water column is nearly constant but for the - 3%
change in V-concentration and salinity between glacials and interglacials (e.g.,
Schmidt and Spero, 2008 ; see also Not et al. , 2012). ln the modem ocean, it amounts
to - 2.67 10-5 dpm.cm-3.ka-1 (Suman and Bacon, 1989). Using this value, the
theoretical 230Thxs vertical accwnulation flux (F230Thxs)v calculated for the 2063 rn
water depth of 016PC site is - 5.5 dpm.cm-2.ka- 1 (see the Supplementary information
section; Fig. 5). Within the above 3% uncertainty range and neglecting
glaciaVinterglacial changes in sea level thus variations in the water depth at the site,
this value thus represents the 230Thxs flux at the seafloor strictly linked to U-decay in
the overlying water colwnn. lt has been used to estimate deviations of measured
e30Thxs)o fluxes in the sediment samples, i.e., (F230Thxs)M, and to compare the
cumulative inventory of measured e30Thxs)o in the sedimentary column, i.e., ,2](F 230Thxs)M], to that of (F230Thxs)v, i.e., I[(F230Thxs)v] (see the Supplementary
information section for more details on calculations). Note that the overall uncertainty
of initial 230Thxs estimates is better than ±10% as documented in the supplementary
material section.
The large variations in the e30Thxs)o are possibly linked to short-term, large amplitude
changes in the sedimentation rate, which would not be captured in the age model,
36
and/or to grain size or mineralogical-dependent 230Thxs-scavenging rates. During the
last glacial period, sediment focusing toward the central abyssal plain is evidenced by
the sedimentary 230Thxs-values, well above the vertical production of this isotope in
the overlying water column (i.e., ~5 . 5 dpm.cm·2.ka-1; Figs. 5, 6). Only rare layers of
this interval show fluxes below this vertical "230Thxs-rain" component. The 230Thxs
inventory illustrated Fig. 6 suggests a ~30% excess over vertical 230Thxs production,
on an average, for the ~ 114.7-15 cal ka BP time interval, th us indicating a net lateral
input of sediment from the basin margins (Fig. 6). This area has been characterized
by frequent turbidites and debris flows (Aksu and Piper, 1979; 1987; Aksu and
Hiscott, 1989; Simon et al. , 2012). The subsequent settling of particles in the deep
basin is likely to increase the 230Thxs-sediment inventory above the vertical 230Thxs
production (e.g., François et al. , 2004). A detailed examination allows differentiating
se veral intervals: ~ 114.7-71 and ~40 . 1-15 cal ka BP, which depict a very high ex cess
in 230Thxs (with a ratio between the estimated 230Thxs flux and the vertical production
exceeding 1.3), vs the ~ 71-40.1 cal ka BP interval, where it is slightly lower (Fig. 6).
Higher ratios suggest enhanced sediment focusing whereas, the lower one points to
reduced instabilities along Baffin Bay slopes. The interval between ~ 31.6 and ~ 15 cal
ka BP yielded initial 230Thxs activities exceeding the last glacial mean value ( 1.45
±0.44 dpm.g-1 vs 0.94 ±0.93 dpm.g" 1; Fig. 5). This corresponding layer is rich in clay
size lithogenic particles, which were related to the maximum extend and/or activity of
the Uummannaq ice stream and margin (Fig. 2; Simon et al. , 2014). Assuming a
relatively constant sedimentation rate throughout this interval (Simon et al. , 20 12), a
higher 230Th scavenging efficiency of these clay-size patiicles might be evoked (Figs.
2, 5; Chase et al., 2002). Above this layer, the 230Thxs inventory ratio decreases
suggestmg a progressive diminution in sediment focusing and/or grain-size
coarsening (Fig. 6). Note that near the late glacial maximum stricto sensu, a layer of
lower inventory ratio, thus of reduced sediment focusing (at ~2 1.7 cal ka BP; Fig. 6).
37
Very low initial 230Thxs activities, close to zero, are observed in the overlying section,
from ~15 to ~10.8 cal ka BP, during the deglacial interval (Fig. 5). This episode is
also associated with the coarser-grain particles and the highest sedimentation rates of
the sequence (Figs. 2, 5; Simon et al., 2014). Dilution of the 230Thxs signal by greater
amounts of sinking material and/or coarser grain size, during ice retreat over
surrounding lands (e.g., England, 1999; Jennings et al., 2011; Knutz et al., 2011; 6 Cofaigh et al., 2013), might be seen as responsible for these low initial 230Thxs·
Significant amounts of terrigenous supplies of this interval consist of .detrital
dolomitic carbonates, presumably linked to iceberg calving from the ice streams of
the northeastern Laurentide and southeastern Innuitian ice sheet margins (Andrews
and Eberl, 2011; Simon, 2013). A 230Thxs-inventory ratio of ~ 1 , as illustrated Fig. 6,
then marks the transition towards the Holocene interval.
The ( 30Thxs)o of the Holocene core-top section (<10.8 cal ka BP here) suggests a
drastically distinct oceanographie regime (Figs. 5, 6). The low accumulation-rate
Holocene sediments recorded sedimentary 230Thx5-fluxes below the vertical "230Th
rain". The inventory ratio of ~0.6 of this interval is consistent with a complete stop of
sediment focusing in the deep central Baffm Bay seafloor (Figs. 5, 6). On the
contrary, 230Thxs-advection outside the deep Baffm Bay through Davis Strait, likely
occurred, as suggested by high 230Thxs values observed in the Holocene section of a
cored raised SW of Davis Strait, in the western Labrador Sea (Nuttin et al. , in prep.).
Nonetheless, the high 230Thxs absolute values of this interval, in a context of low but
fmer particle fluxes , might also relate to high Mn-oxide precipitation rates (Roy
Barman et al. , 2005).
38
1.6 Conclusion
Baffm Bay is an oceanic basin where sedimentation has been largely controlled by
detrital inputs from sunounding glaciers during most of its recent geological past.
Here, U and Th data spanning the last ~ 115 ka gave sorne insights into the uneven
sedimentation rates and complex detrital inputs from the Innuitian, Greenland and
Laurentide ice sheets, of the interval, until the inception of interglacial conditions
sorne ~ 10.8 cal ka BP, led to mu ch distinct sedimentary pro cesses and cunents.
The lack of conelation between U-concentration, ( 34UP38U)AR, organic carbon
content and concentrations of redox -sensitive elements has been se en as an indication
for reduced authigenic and early diagenetic U-fluxes, probably relating to low organic
matter fluxes from a low productivity environment. Anomalies in CZ34U/238U)AR led us
to consider the occunence of sorne late diagenetic U-mobility along discrete redox
gradients in the sedimentary sequence. Moreover, U- and Th-concentrations and mass
ratio are highly variable and, together with ( 34UP38U)AR, do not show any
unequivocal linkage with detrital dolomitic carbonate fluxes or silicate material as
one might have expected. Results thus suggested linkage with glacial margin events
releasing material of singular U-Th signatures.
During the glacial period, surplus of supported 230Th fluxes point toward sediment
focusing in the deep Baffin Bay, in contrast with the Holocene interval, when it has
been exported toward the Labrador Sea, through Davis Strait.
39
Acknowledgments
This study is part of the Canadian contribution to the Past4Future project. Funding
from Ministère du Développement Économique, de l'Innovation et de l'Exportation
(MDEIE), the Natural Sciences and Engineering Research Council of Canada
(NSERC), The Fonds de la Recherche du Québec sur la Natme et les Technologies
(FRQNT) and the Canadian Fondation for Innovation (CFI) is acknowledged. We
owe special thanks to GEOTOP members, and especially to Bassam Ghaleb, for their
help for U- and Th-series analyses and complementary measurements.
40
Supplementary information
The excess of 230Th CZ30Thxs) generally relates to the fraction of 230Th scavenged in
the overlying water column (i.e., not supported by 234U-decay in sediment).
Assuming in frrst approximation that the sediment is deprived of any significant
early-diagenetic uranium and that the CZ34UP38U)AR of detrital particles are near
secular equilibrium, the initial 230Thxs activities may be estimated using the following
equation (Ivanovich et al., 1992; Hillaire-Marcel, 2009):
where CZ30Th)0 represents the initial 230Th ( dpm.g-1 ), À stands for the dis integration
constants (time unif 1) , t is the time spanned since the deposition of the sediment (ka)
estimated from the age mode! of Simon et al. (2012), and ( 34U/238U) represent the
mean activity ratio measured on bulk-sediment (see Fig. S 1). Assuming a low rate
la te diagenetic U -mobility ( estimated here :::; 6% on an average for the glacial
interval), the overall uncertainty on the estimated initial excesses in 230Th should be
better than 1 0%.
At the time scale of the processes investigated here, the loss in 238U by decay is
negligible. Therefore, one may postulate that (238U)0~ (238U)1. The 230Th linked to
detrital minerais is then estimated form the following equation (Ivanovich et al.,
1992):
41
The e30Thxs)o, thus the 230Th ensuing in princip le from the decay of dissolved-234U,
then scavenged in the water column by sinking patiicles, is then calculated by
subtracting the 230Th linked to detrital minerais from 230Th-values (i.e., equations ( 1 )
(2)). In this approach, 230Th and 234U in detrital minerais are considered in secular
equilibrium with their parent isotopes. This assumption is acceptable when detrital
sediments originate from physical erosion by glaciers, as generally observed in tills,
but it is rarely valid when patiicles originate from chemical erosion in soils and more
complex erosional processes ( e.g., Vallières et al., 1993).
The measured e30Thxs)o fluxes in the sediment Satnples (F230Thxs)M, the inventory of
measured e30Thxs)o fluxes in the sediment column I[(F230Thxs)M], and the inventory
of vertical accumulation flux I[(F230Thxs)v], might then evaluated as follows:
(F230Thxs)v = 2063 * 0.00267 = 5.5 dpm.cm·2.ka·'
where SR is the sedimentation rate (cm.ka-1) , SS is the sediment sample thickness in
cm, Pi is the density of the sediment (g of dry sediment. cm -3 of humid sediment), t is
the age (ka), I[(F230Thxs)M] and I[(F230Thxs)v] the inventories of measured and
theoretical initial excesses in e30Th)0, respectively, for a given interval (i). Fluxes
compared in this way allow to weight the 230Thxs vs variations in the sedimentation
rate and, to a lesser extent, by changes in the bulk density of the sediment, whereas
inventories provide immediate information on sedimentary processes responsible for
42
variations in 230Thxs accumulation rates ( e.g., François et al. , 2004; Not and Hillaire
Marcel, 2010).
43
References
Aksu, A. E. (1983), Short-period geomagnetic excursion recorded in Pleistocene sediments of Baffm Bay and Davis Strait., Geological Society of America, 11 , 537-541.
Aksu, A. E. , and D. J. W. Piper (1979), Baffin Bay in the past 100,000 yr, Geology, 7, 245-248.
Aksu, A. E., and D. J. W. Piper (1987), Late Quatemary sedimentation in Baffm Bay, C anadian Journal of Earth Sciences, 24, 183 3-1846.
Aksu, A. E., and R. N. Hiscott (1989), Slides and debris flows on the high-latitude continental slopes of Baffm Bay, Geology, 17, 885-888.
Andrews, J. T. (1993), Changes in the silt- and clay-size mineralogy of sediments at Ocean Drilling Program site 645B, Baffm Bay, Canadian Journal Earth Sciences, 30, 2448-2452.
Andrews, J. T., and D. D. Eberl (2011), Surface (sea floor) and near-smface (box cores) sediment mineral ogy in Baffm Bay as a key to sediment provenance and ice sheet variations, Canadian Journal Earth Sciences, 48, 1307- 1328.
Andrews, J. T., M. E. Kirby, A. Aksu, D. C. Barber, and D. Meese (1998), Late Quaternary detrita1 carbonate (DC-) layers in Baffm Bay marine sediments (67°-740N): correlation with Heinrich events in the North Atlantic?, Quaternary Science Reviews, 17, 1125-1137.
Arthur, M. A., S. P. Srivastava, M. Kaminski, R. Jarrard, and J. Osier (1989), Seismic stratigraphy and history of deep circulation and sediment drift development in Baffin Bay and the Labrador Sea, in Proceedings of the Ocean Drilling Pro gram, Scientific Results, 105: College Station, TX (Ocean Drilling Program), edited by S. P. Srivastava, M. Arthur and B. Clement, et al. , pp. 957-988.
Azetsu-Scott, K., A. Clarke, K. Falkner, J . Hamilton, P. Jones, C. Lee, B. Petrie, S. Prinsenberg, M. Starr, and P. Yeats (2010), Calcium carbonate saturation states in the waters of the Canadian Arctic Archipe1ago and the Labrador Sea, Journal of Geophysical Reasearch, 115, C 11 021 .
44
Blott, S. J., and K. Pye (2001), GRADISTAT: a grain size distribution and statistics package for the analysis of unconsolidated sediments, Earth Surf Process. Landforms, 26, 1237-1248.
Campbell, D. C., and A. de Vernal (2009), Marine geology and paleoceanography of Baffin Bay and adjacent areas. Nain, NL to halifaz, NS, August 28-September 23, 2008. Cruise report of CCGS Hudson Expedition 2008029, Geological Survay of Canada, Open File 5989, Natural Resources Canada, 2010 pages.
Causse, C., and C. Hillaire-Marcel (1989), Thorium and uranium isotopes in upper Pleistocene sediments of ODP sites 645 (Baffm Bay), 646, and 647 (Labrador Sea), Proceedings of the Ocean Drilling Program, Scientific Results, 105, 551 -560.
Chase, Z., R. F. Anderson, M. Q. Fleisher, and K. P.W. (2002), The influence of particle composition and particle flux on scavenging of Th, Pa and Be in the ocean, Earth and Planetary Science Letters, 204, 215-229.
Cheng, H., R. L. Edwards, J. Hoff, C. D. Gallup, D. A. Richards, and Y. Asmerom (2000), The half-lives of uranium-234 and thorium-230, Chemical Geology, 169, 17-33 .
Colley, S., and J. Thomson ( 1992), Behaviour and mobility of U series radionuclides in Madeira Abyssal Plain turbidites over the past 750,000 years, Marine Geology, 109, 141-158.
Colley, S., J. Thomson, and J. Toole (1989), Uranium relocations and derivation of quasi-isochrons for a turbidite/pelagic sequence in the Northeast Atlantic, Geochimica et Cosmochimica Acta, 53, 1223-1234.
Croudace, 1. W., A. Rindby, and R. G. Rothwell (2006), ITRAX: description and evaluation of a new multi-function X-ray core scanner, Geological Society, 267(1), 51-63.
de Vernal, A., C. Hillaire-Marcel, A. Aksu, and J. P. Mudie (1 987), Palynostratigraphy and chronostratigraphy of Baffin Bay deep sea cores: Climatostratigraphic implications, P alaeogeography, P alaeoclimatology, Palaeoecology, 61 , 97-105.
de Vernal, A., G. Bilodeau, C. Hillaire-Marcel, and N. Kassou (1992), Quantitative assessment of carbonate dissolution in marine sediments from foraminifer linings vs. shell ratios: example from Davis Strait, NW North Atlantic, Geology, 20, 527-530.
45
Dyke, A. S., J. T. Andrews, P. U. Clark, J.H. England, G. H. Miller, J. Shawe, and J. J. Veillette (2002), The Laurentide and Innuitian ice sheets during the Last Glacial Maximum, Quaternary Science Reviews, 21, 9-31.
England, J. (1999), Coalescent Greenland and Innuitian ice during the Last Glacial Maximum: revising the Quaternary of the Canadian High Arctic, Quaternary Science Reviews, 18 421-456.
England, J. , N. Atkinson, J. Bednarski, A. S. Dyke, D. A. Hodgson, and C. 6 Cofaigh (2006), The Innuitian lee Sheet: configuration, dynamics and chronology, Quaternary Science Reviews, 25, 689-703.
François, R. , M. Frank, M. M. Rutgers van der Loeff, and M. P. Bacon (2004), 230Th normalisation: An essential tool for interpreting sedimentary fluxes during the late Quaternary, Paleogeography, 19(1).
Gariépy, C., B. Ghaleb, C. Hillaire-Marcel, A. Mucci, and S. Vallières (1994), Early diagenetic processes in Labrador Sea sediments: uranium-isotope geochemistry, Canadian Journal of Earth Sciences, 31(1), 28-37.
Gobeil, C., B. Sundby, R. W. MacDonald, and J. N. Smith (2001), Recent changein orgnaic carbon flux to Arctic Ocean depp basins: Evidence from acd volatile sulfide, manganese and rhenium discord in sediments, Geophysical Research Letters, 28(9), 1743-1746.
Hélie, J.-F. (2009), Elemental and stable isotopie approaches for studying the organic and 627 inorganic carbon components in natural samples. In Deep-Sea to Coastal Zones: Methods Techniques for Studying Paleoenvironments, !OP Conference Series: Earth and Environmental Science, 5, 012006.
Henderson, G. M. , and R. F. Anderson (2003), The U-seriés Toolbox for Paleoceanography, Mineralogical Society of America, 52(1), 493-531.
Hillaire-Marcel, C. (2009), The U-series dating of (biogenic) carbonates, !OP Conference Series: Earth and Environmental Science, 5(1), 012008.
Hillaire-Marcel, C., and A. de Vernal (2008), Stable isotope clue to episodic sea ice formation in the glacial North Atlantic, Earth and Planetary Science Letters, 268, 143-150.
Hillaire-Marcel, C., A. de Vernal, A. E. Aksu, and S. Macko (1989), High-resolution isotopie and micropaleontological studies of upper Pleistocene sediments at ODP Site
46
645 , Baffin Bay, Proceedings of the Ocean Drilling Pro gram, Scientific Results , 105, 599-616.
Hillaire-Marcel, C., A . de Vernal, M. Lucotte, A. Mucci, G. Bilodeau, A. Rochon, S. Vallières, and G. Wu (1994), Productivité et flux de carbone dans la mer du Labrador au cours des derniers 40 000 ans, Canadian Journal Earth Sciences, 31(1), 139-158.
Hiscott, R. N., A. E. Aksu, and O. B. Nielsen (1989), Provenance and dispersal patterns, Pliocene-Pleistocene section at site 645, Baffm Bay, Proceedings of the Ocean Drilling Program, Scientific Results, 105, 31 -52.
Hulbe, C. L., D. R. MacAyeal, G. H. Denton, J. Kleman, and T. V. Lowell (2004), Catastrophic ice shelf breakup as the source of Heinrich event icebergs, Paleoceanography, 19, PA1004.
Ivanovich, M., A. G. Latham, and T. -L. Ku (1992), Uranium-series disequilibrium applications in geochronology, in Uranium-series Disequilibrium: applications to earth, marine and environmental sciences, edited by M. Ivanovich and R. S. Hrumon, Oxford science publications.
Jakobsson, M ., R. L0vlie, H. Al-Hanbali, E. Arnold, J. Backman, and M. Mërth (2000), Manganese and color cycles in Arctic Ocean sediments constrain Pleisocene chronology, Geology, 28(1), 23-26.
Jennings, A. E. , C. Sheldon, T. M. Cronin, P. Francus, J. Stoner, and J. T. Andrews (2011), The Holocene history ofNares Strait: Transition from glacial bay to ArcticAtlantic throughflow, Oceanography, 24, 26-41.
Knutz, P. C., M.-A. Sicre, H. Ebbesen, S. Christiansen, and A. Kuijpers (2011), Multiple-stage deglacial retreat of the southern Greenland lee Sheet linked with Irminger Current warm water transport, Paleoceanography, 26, 1-18.
Ku, T. -L. (1966), Uranium-series disequilibrium in deep sea sediments, 157 pp, Columbia University, New York.
Lally, A. E. (1992), Chemical procedures, in Uranium series disequilibrium: Applications to Earth, Marine, and Environmental Sciences, edited by M. Ivanovich and R. S. Harmon, pp. 95-126, Clarendon Press, Oxford.
Last, W. M. (2001), Mineralogy analysis of lake sediments, in Tracking Environmental Change Using Lake Sediments, edited by W. M. Last and J. P. Smol, pp. 143- 187, Kluwer Academie Publishers, Dordrecht, The Netherlands.
47
Lowemark, 1., C. Marz, M. O'regan, and R. Gyllenkreutz (in press), Arctic Ocean Mn-stratigraphy: synthesis and interbasin comparison, Quaternary Science Reviews.
Macdonald, R. W., and C. Gobeil (2012), Manganese sources and sinks in the Arctic Ocean with reference to periodic enrichments in basin sediments, Aquatic Geochemistry, 18, 565-591.
MacLean, B. (1985), Geology of the Baffm Island Shelf, in Quaternary Envrionments: Eastern Canadian Arctic, Baffm Bay and Western Greenland, edited by J. T. Andrews, pp. 154-177, Allen and Un win, Boston.
Maynard, J. B. (2003), Manganiferous sediments, rocks, and ores, in Sediments, Diagenesis, and Sedimentary Rocks: Treatise on Geochemistry, edited by F. T. Mackenzie, pp. 289-308, Elsevier-Pergamon, Oxford.
Moore, D. M., and J. C. Reynolds (1997), X-Ray Diffraction and the Identification and Analysis of Clay Minerais, Oxford University Press, New York.
Not, C., and C. Hillaire-Marcel (2010), Time constraints from 230Th and 231Pa data in late Quaternary, low sedimentation rate sequences from the Arctic Ocean : an example from the northern Mendeleev Ridge, Quaternary Science Reviews, 29(25-26), 3665- 3675.
Not, C., K. Brown, B. Ghaleb, and C. Hillaire-Marcel (2012), Conservative behavior of uranium vs. salinity in Arctic sea ice and brine, Marine Chemistry, 130-131 , 33-39.
Nuttin, L., J. Maccali, and C. Hillaire-Marcel (in prep.), U, Th and Pa insights into sedimentological and paleoceanographic changes off Hudson Strait (Labrador Sea) during the last ~37 ka with special attention to methodological issues.
6 Cofaigh, C., J. A. Dowdeswell, A. E. Jennings, K. A. Hogan, A. Kilfeather, J. F. Hiemstra, R. Noormets, J. Evans, D. J. McCarthy, J. T. Andrews, J. M. Lloyd, and M. Moros (2013), An extensive and dynamic ice sheet on the West Greenland shelf during the last glacial cycle, Geology, 41 (2), 219- 222.
Parnell, J., S. Bowden, J. T. Andrews, and C. Taylor (2007), Biomarker determination as a provenance tool for detrital carbonate events (Heinrich events?): Fingerprinting Quaternary glacial sources into Baffin Bay, Earth and Planetary Science Letters, 257 71-82.
Refsnider, K. A., G. H. Miller, C. Hillaire-Marcel, M. L. Fogel, B. Ghaleb, and R. Bowden (20 12), Subglacial carbonates constrain basal conditions and oxygen isotopie
48
composition of the Laurentide lee Sheet over Arctic Canada, Geology, 40(2), 135-138.
Roy-Barman, M., C. Jeandel, M. Souhaut, M. Rutgers van der Loeff, I. Voege, Leblond. N., and R. Freydier (2005), The influence of particle composition on thorium scavenging in the NE Atlantic ocean (POMME experiment), Earth and P lanetary Science Letters, 240, 681- 693.
Schmidt, M. W. , and H. J. Spero (2008), North Altantic salinity oscillations linked to changes in atmospheric and ocean circulation over the last glacial cycle, PAGES News, 16(1), 23-25 .
Simon, Q. (2013), Propriétés magnétiques, minéralogiques et sédimentologiques des sédiments profonds de la baie de Baffm: Chronologie et dynamique des glaciers ouest groenlandais, innuitiens et laurentidiens au cours de la dernière glaciation, 163 pp, Université du Québec à Mçmtréal, Montréal (QC), Canada.
Simon, Q., G. St-Onge, and C. Hillaire-Marcel (2012), Late Quatemary chronostratigraphic framework of deep Baffm Bay glaciomarine sediments fi·om high-resolution paleomagnetic data, Geochemistry, Geophysics, Geosystems, 13 , 1-24.
Simon, Q., C. Hillaire-Marcel, G. St-Onge., and J. T. Andrews (2014), NOiih-eastem Laurentide, western Greenland and southem Innuitian ice stream dynamics during the last glacial cycle, Journal ofQuaternary Science, 29, 14-26.
St-Onge, G. , and B. F. Long (2009), CAT-scan analysis of sedimentary sequences: an ultrahigh-resolution paleoclimatic tool, Engineering Geology, 103, 127- 133 .
Steinhauer, S. (2012), Postglacial paleoceanography of central Baffin Bay from palynological tracers, Université du Québec à Montréal, Montréal.
Suman, D. 0., and M. P. Bacon (1989), Variations in Holocene sedimentation in the North American Basin determined from 230Th measurements, Deep Sea Research Part A. Oceanographie Research Papers, 36, 869-878.
Tang, C. C. L., C. K. Ross, T. Yao, B. Petrie, B. M. DeTracey, andE. Dunlap (2004), The circulation, water masses and sea-ice of Baffm Bay, Progress in Oceanography, 63, 183-228.
Thorez, J. (2003), L'argile, minéral pluriel, Bulletin de la Société Royale des Sciences de Liège, 72, 19-70.
49
Vallières, S. (1997), Flux d'manium et excès de 230Th dans les sédiments de la Mer du Labrador - Relation avec les conditions paléocéanographiques et la paléoproductivité du bassin, 144 pp, Université du Québec à Montréal, Montréal (QC), Canada.
Vallières, S., C. Hillaire-Marcel, and B. Ghaleb (1993), Disequilibrium of U-Th in overbmden deposits in the St. Lawrence Lowlands, Quebec, Canadian Journal Earth Sciences, 30(8), 1730-1740.
Veiga-Pires, C. C. (1998), Flux de thorium-230 et flux sédimentaires dans l'Atlantique du Nord Ouest au coms des derniers 40 ka en relation avec les variations du climat, environment sciences thesis, 169 pp, Université du Québec à Montréal, Montréal.
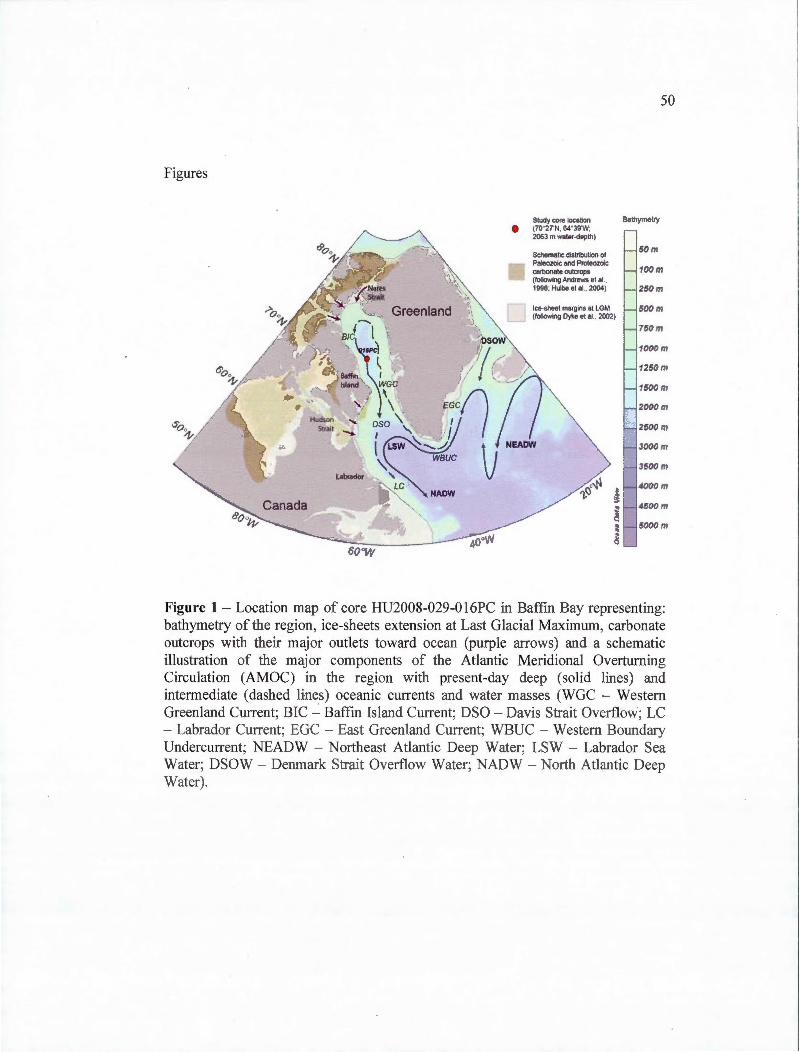
Figures
Green land
Study core IO<Otion • (70"27'N, 64"39'W;
2063 m water-depth)
Schemali<: distribution of Paleozolc and Proteozoic carbonate outcrops (foilowing Andrews et al., f 998; Hulbe et at., 2004)
50
Bathymetry
1000m
1250m
16oom
Figure 1- Location map of core HU2008-029-016PC in Baffm Bay representing: bathymetry of the region, ice-sheets extension at Last Glacial Maximum, carbonate outcrops with their major outlets toward ocean (purple anows) and a schematic illustration of the major components of the Atlantic Meridional Overturning Circulation (AMOC) in the region with present-day deep (solid !ines) and intermediate (dashed !ines) oceanic currents and water masses (WGC - Western Greenland Current; BIC ....:. Baffm Island Cunent; DSO - Davis Strait Overflow; LC -Labrador Cunent; EGC - East Greenland Cunent; WBUC - Western Boundary Undercun·ent; NEADW - Northeast Atlantic Deep Water; LSW - Labrador Sea Water; DSOW - Denmark Strait Overflow Water; NADW- North Atlantic Deep Water).
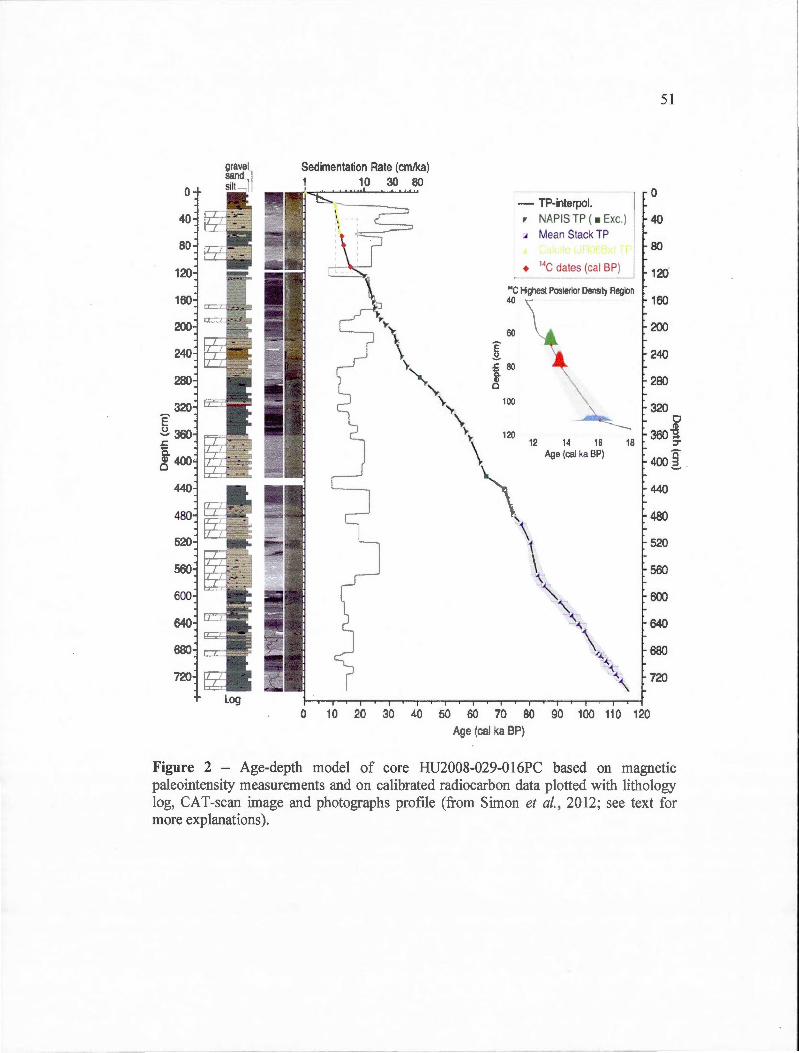
0
40
80
120
160
200
240
280
320 Ê ~ 360 .c a. ~ 400
440
480
520
560
600
640
680
720
Log
51
Sedimentation Rate (cm/ka) 1 1 30 80
0 - TP-interpol. ~ NAPIS TP ( • Exc.) 40
I
.J Mean Stack TP
• 14C dates (cal BP)
"C Hrghest Posterior DenSity Region 40
60
~ 80 a. Gl 0
100
0 10 20 30 40 50 60 70 80 90 100 110 120 Age (cal ka BP)
80
120"
160
200
240
280
320 0 tl)
360~ ::r n-
400 2..
440
480
520
560
600
640
680
720
Figure 2 - Age-depth model of core HU2008-029-01 6PC based on magnetic paleointensity measurements and on calibrated radiocarbon data plotted with lithology log, CAT-scan image and photographs profile (from Simon et al., 2012; see text for more explanations).
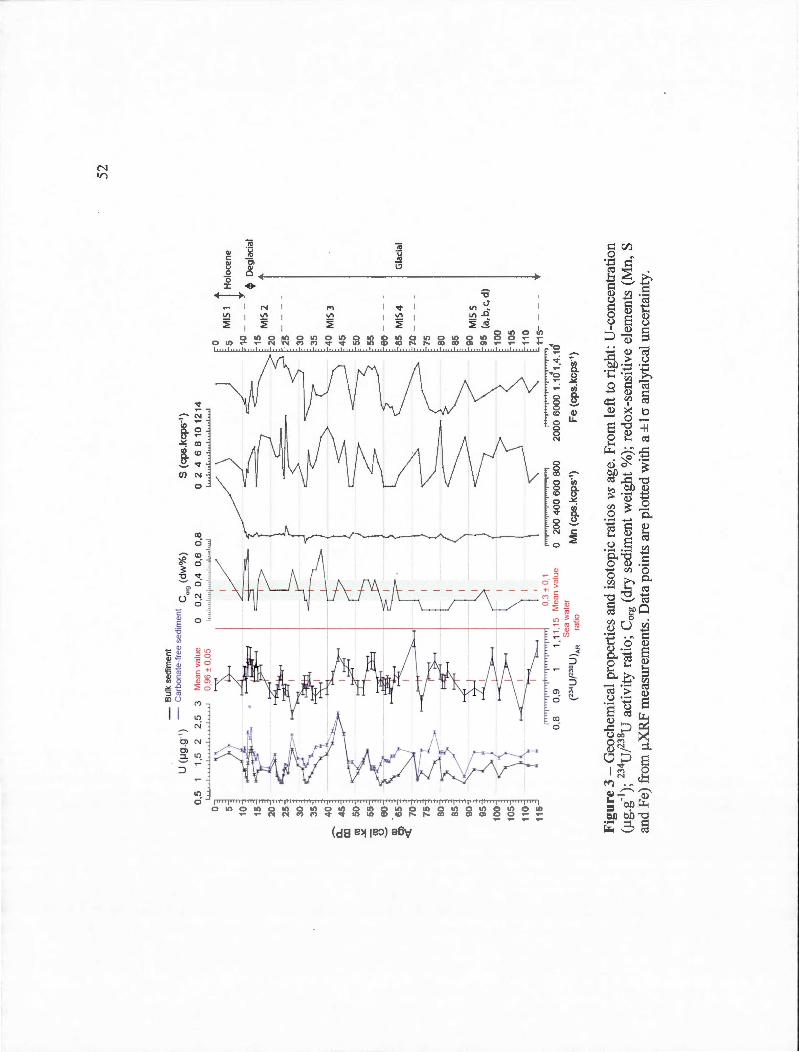
-B
ulk
sedi
me
nt
U (
IJg
.g·'
) -
Car
bona
te-f
ree
sedi
men
t C
(d
w%
) ""'
S
(cp
s.k
cps·
')
0,5
1
1,5
2
2,5
3
Mea
n va
lue
0 0
,2
0,4
0
,6
0,8
0
2 4
68
10
12
14
0 5 10
15
20
25
30
35
40
fu "j
co
50
= 55
co ~
60
~
65
<
( 70
75
80
85
90
95
100
105
110
115
1 1
11
1 '·
1 1
1 '·
1!
11
. 1
11
'·
1 !
1 0
,96
± 0
,05
[,.!
. 1 '"
'l'
.... ·
.!!!
,,
,], "'
~; 0 -M~ ~ 1
H
olo
cen
e
0.3
± 0
,1
0,8
0
,9
1 1
,11.
15
Me
an
valu
e
(2
34
Uf2
3"U
) S
ea w
ater
A
R
ralto
15
MIS
2
20
25
30
35
40
MIS
3
1;~ 55
60 -
~
Deg
laci
al
65
MIS
4
1 G
laci
al
70---
75
80
85
90
MIS
5
95
(a, b
, c, d
) 10
0
105
110
,.., ..,,
,..,..,.
,...,..,
...,....
, ,,..
...,, ..
..,~ 1"
1 s-
o 2
00
40
0 6
00
80
0
20
00
60
00
1.1
041,
4.1
Ô
Mn
(cp
s.kc
ps·
')
Fe
(cp
s.kc
ps·
')
Fig
ure 3
-G
eoch
emic
al p
rope
rtie
s an
d is
otop
ie r
atio
s vs
age
. F
rom
lef
t to
rig
ht:
V-c
once
ntra
tion
(/
lg.g
-1 );
234 UP
38U
act
ivit
y ra
tio;
Cor
g (d
ry s
edim
ent
wei
ght
%);
red
ox-s
ensi
tive
ele
men
ts (
Mn
, S
and
Fe)
fro
m !
lXR
F m
easu
rem
ents
. D
ata
poin
ts a
re p
lott
ed w
ith
a ±
la a
naly
tica
l un
cert
aint
y.
52
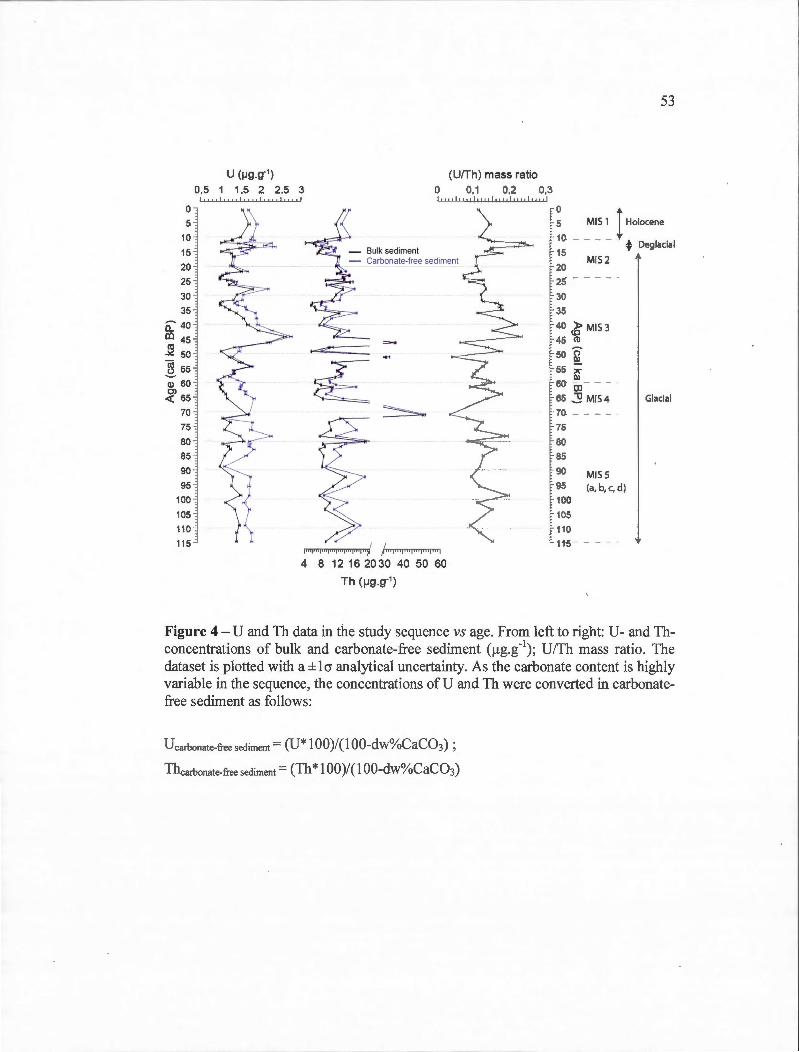
u (~g .g-' ) (UfTh) mass ratio 0,5 1 1 ,5 2 2,5 3 0 0.1 0,2 0,3
1 ~ 1 15
20 25
30
35
iL 40 co 45 co
.>&. 50
ri 55
t :: j ::1 :~ 1
100
~~q 115
'''" ' ''" ' " ' ''"" ' ''"''" "
4 8 12 16 20 30 40 50 60
Th (~g .g- 1 )
0 5 10
15
20 2!>
30
35
MIS 1
MIS 2
40 ~MIS3 45 CD
50 ô Ill
55 ;: Ill
60 OJ
65 ~ MIS4 70
75
80 85
90 MIS S
53
1 Holocene
~ Deglacial
Glacia l
95 (a, b, c, d) 100
105 11 0 115
Figure 4- U and Th data in the study sequence vs age. From left to right: U- and Thconcentrations of bulk and carbonate-fi-ee sediment ()lg.g-1
) ; U/Th mass ratio. The dataset is plotted with a ± 1 a analytical uncertainty. As the carbonate content is highly variable in the sequence, the concentrations of U and Th were converted in carbonatefi-ee sediment as follows:
Ucarbonate-rree sediment= (U* 100)/(1 OO-dw%CaC03) ;
Thcarbonate-free sediment= (Th* l OO)/(lOO-dw%CaC03)
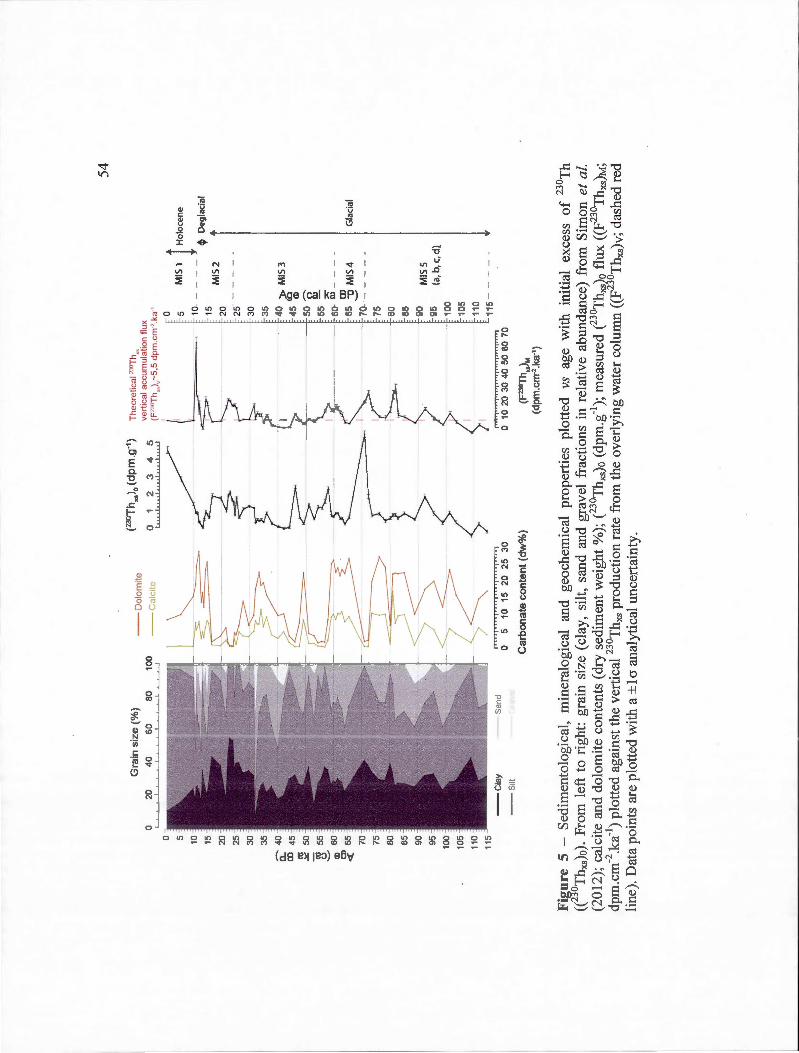
Gra
in s
ize
(%
) 2
0 4
0 6
0 8
0
0 5 10
15
20
25
30
35
a:-4o
Il
l 45
co .><:
50
ri 55
(1)
60
;f 6
5 70
75
80
85
90
95
100
105
110
115
--
Cla
y S
and
--
SIIt
10
0
--D
olo
mit
e
--C
alc
ite
f' 1
11
fl
T
J T
j
TT
TT
rl T
"T-,
-TT
TT
'fT
TT
"T
l
0 5
10
15
20
25
30
(23D
Th
• .)o
(dp
m.g
-')
01
23
45
Ca
rbo
na
te c
on
ten
t ( d
w%
)
The
oret
ical
>30
Th.,
ve
rtic
al a
ccum
ulat
ion
flux
(F'"
'Th,
_)v -
5,5
dp
m.c
m-2
.ka
·•
1 0 5
MIS
1 1 Hol
ocen
e
l"•
'f''
"f'
'"f
'"'f
""
l'"
'JT
TTTJ
0 10
20
30 4
0 5
0 6
0 7
0
(F""
'Th .
. ).,
(dpm
.cm
·2.k
a·')
10.
--
--
15
~
Deg
laci
al
20
25
30
35
MIS
2
40
)>
MIS
3
45
cg
50
ô D
l 5
5
- ;:<
;'
60-
Dl
--
-w
6
5 ,
2! M
IS 4
1
Gla
cia
l
70
-
75
80
85
90
MIS
S
95
(a
,b,c
,dl
10
0
105
110
115
-
54
Fi~ure
5 -
Sed
imen
tolo
gica
l, m
iner
alog
ical
an
d ge
oche
mic
al
prop
erti
es
plot
ted
vs
age
wit
h in
itia
l ex
cess
o
f 23
0 Th
ce
0 Thx
s)o)
. F
rom
lef
t to
rig
ht:
grai
n si
ze (
clay
, si
lt,
sand
and
gra
ve!
frac
tion
s in
rel
ativ
e ab
unda
nce)
fro
m S
imon
et
al.
(201
2);
cal
cite
and
dol
omit
e co
nten
ts (
dry
sedi
men
t w
eigh
t %
); e30
Thx
s)o
(dpm
.g-L
); m
easu
red e3
0 Thx
s)o f
lux
((F
230 T
hxs
)M;
dpm
.cm
·2.k
a-1 )
plot
ted
agai
nst
the
vert
ical
230 T
hxs
prod
ucti
on r
ate
from
the
ove
rlyi
ng w
ater
col
umn
((F
230 T
hxs)
v; d
ashe
d re
d li
ne).
Dat
a po
ints
are
plo
tted
wit
h a
±la
ana
lyti
cal
unce
rtai
nty
.
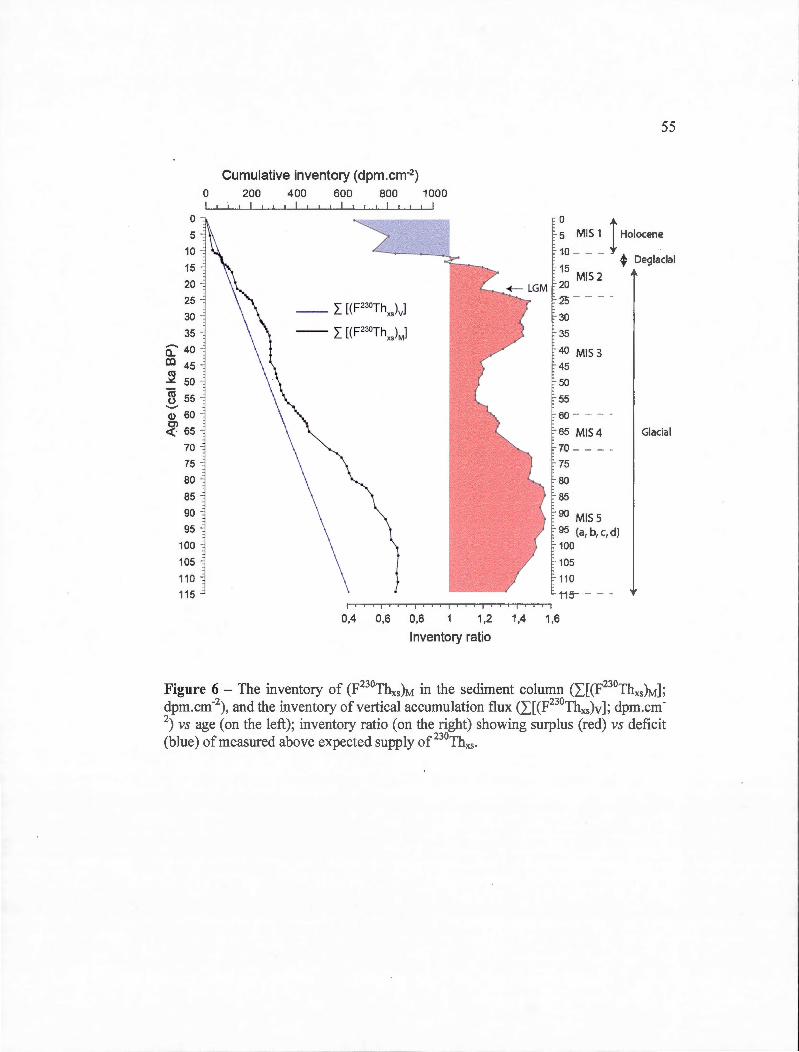
55
Cumulative inventory (dpm.cm-2 )
0 200 400 600 800 1000
0
5
10
15
20
~ MIS 1 1 Holocene
10 - - - - . ~ Deglacial
15 MIS2
20
25
30
20 ----
30 -- 2: [(F23oTh.,)vl
35 -- 2: [(F230Th.,)M] 35
0:: 40 40 MIS 3 co 45 45 rn ~ 50 50
~ 55 55 '-' Q) 60 60 Ol -<· 65 65 MIS4 Glacial
70 7..0 ---
75 75
80 80
85 85
90 90 MIS 5 95 95 (a, b, c, d )
100 100
105 105
110 110
115 115- - - -
0.4 0,6 0 ,8 1,2 1.4 1,6
lnventory ratio
Figure 6 - The inventory of (F230Thxs)M in the sediment colurnn (I[(F230Thxs)M]; dpm.cm-2
) , and the inventory of vertical accumulation flux 0](F230Thxs)v]; dpm.cm· 2
) vs age (on the left); inventory ratio (on the right) showing surplus (red) vs deficit (blue) of measured above expected supply of 230Thxs·
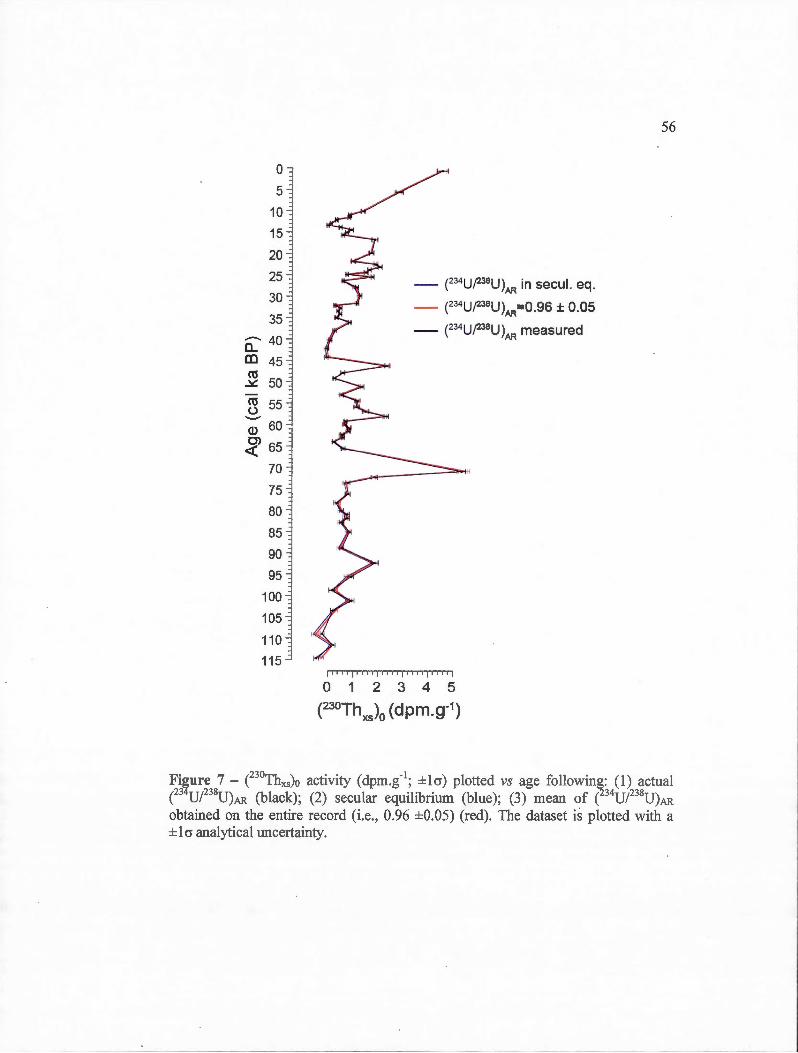
0
5
10
15
20
25
30
35
..-. 40 a.. co 45
~ 50
~ 55 --(1) 60
~ 65
70
75
80
85
90
95
100
105
110
115
- e34 UJ238U)AR in secul. eq.
- e34 UJ238U)AR=0.96 ± 0.05
- e34 UJ238 U)AR measured
[ il 1 lji lllj 1 ll lj lllljilll [
0 1 2 3 4 5
(230Thxs)o (dpm.g-1)
56
Fi~ure 7 - e30Thxs)o activity (dpm.g" 1; ±1cr) p1otted VS age following: (1) actual e3 UP38U)AR (black); (2) secular equilibrium (blue); (3) mean of (234UP38U)AR
obtained on the entire record (i.e., 0.96 ±0.05) (red). The dataset is plotted with a ± 1 cr analytica1 uncertainty.
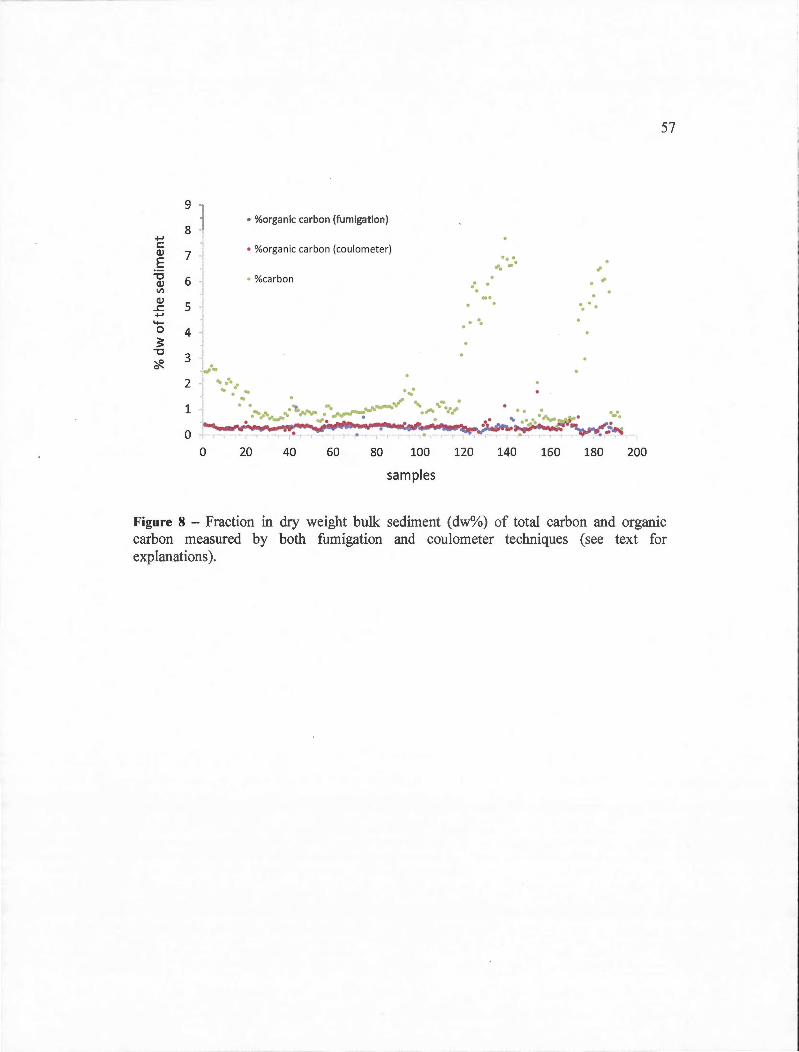
9 "
8 -; ..... c Q) 7 E ~ 6 Vl
~ 5 ..... 4
3 ' . ., ..
• %organic carbon (fumigation)
• %organic carbon (coulometer)
• %carbon
2 ..... , -. .. •.:
.... ... . ·.
... ......
1 ... • • ... w-..,....., ' .. -.. • J .... , .. ,.,... .,..,. • ~ .~. ..# • '. · .. :,.,_
0 ........... ~_.._ ,,_-_...;.·~-. 4 .• ~~ .... :-~"'"·-..~-0 20 40 60 80 100 120 140 160
sam pies
, ,
.. . .
180
57
200
Figure 8 - Fraction in chy weight bulk sediment (dw%) of total carbon and organic carbon measured by both fumigation and coulometer techniques (see text for explanations ).
CHAPITRE II
U, Th AND Pa INSIGHTS INTO SEDIMENTOLOGICAL
AND PALEOCEANOGRAPHIC CHANGES OFF HUDSON
STRAIT (LABRADOR SEA) DURING THE LAST ~37 KA
WITH SPECIAL ATTENTION TO METHODOLOGICAL
ISSUES
Laurence Nuttin1, Jenny Maccali 1 and Claude Hillaire-Marcel 1
1GEOTOP, Université du Québec à Montréal, C.P. 8888, Suce. Centre-Ville, Montréal, QC, H3C 3P8, Canada
Keywords: Labrador Sea, marine sediments, U- and Th-series isotopes, paleoceanography, late Quatemary, Laurentide lee Sheet, Hudson Strait, Heinrich
events, sedimentary processes, 231Pa and 230Th excess calculation
Article soumis dans la revue scientifique Quaternary Science Reviews.
59
Abstract
A ~9m-long sediment core spanning the last ~37 ka has been raised from the lower
Labrador continental slope, off the Hudson Strait shelf edge. It has been analyzed for
its U, Th and Pa isotope contents, along with current sedimentological parameters, as
a means to retrieve information about sedimentological changes in response to
northeastem Laurentide lee Sheet (LIS) margin instabilities. The sequence yielded a
high-resolution record of subglacial detrital carbonate pulses from Hudson Stt·ait
assigned to "Heinrich events" H2 and Hl , whereas HO was missing. Large variations
in bulk sediment U- and Th-contents as weil as in 234UP 8U activity ratio are
observed throughout the sequence, Jeading to large uncertainties when calculating
excesses in 231 Pa and 230Th (231Paxs and 230Thxs) over their supported and in-growth
fractions (i.e. , illherited from detrital minerais and produced from authigenic and
diagenetic U-uptake). In particular, 234U excesses or deficits vs 238U (-
115%o<8234U<+ 126%o) are observed throughout the sequence, suggesting occasional
U-uptake from the water column and/or sorne Iate diagenetic mobility along discrete
redox gradients, despite the overall Iow and little variable organic carbon content (0.3
±0.1 %) observed. The above uncertainties in 231 Paxs and 230Thxs estimates and the
large variability in geochemical and sedimentary fluxes off the northeastem LIS
margin, lead us to downgrade the potential paleoceanographic information yielded by
these isotopes in such a setting. Nonetheless, the H2 and HI layers are highlighted by
very low initial ex cesses in both 230Thxs and 231 Paxs, indicating the ir extt·emely fast
deposition. Throughout most of the sedimentary sequence, the calculated initial 230Thxs fluxes are nearly in balance with 230Th production in the overlying water
column. Exceptions are the H2 layer, an interval su?ceedmg Hl, and the post-glacial
sediment. The estimated initial CZ31 Pax/30Thxs) ratios are generally lower than their
production rate in the water column (i.e., 0.092), indicating nearly continuous
preferential export orZ31Paxs over the last ~37 cal ka BP, thus the persistence of sorne
deep currents throughout the interval.
60
2.1 Introduction
Deep-water convection in subarctic seas is a key component of the Nmih Atlantic
climate system as it regulates ventilation and heat-exchange rates with the atmosphere
( e.g. , Broecker, 1991 ). In this respect, the Labrador Sea constitutes a transitional
basin between the Arctic and the North Atlantic. Freshwater fluxes , either from the
Arctic Ocean or from surrounding ice sheets, notably the Laurentide lee Sheet (LIS),
have tightly controlled convection in this basin (Labrador Sea Water- LSW; Lazier,
1973; Hillaire-Marcel et al., 2001). Major melting events from the northeastem LIS
margin have been associated with abrupt climate/ocean instabilities, in particular
most of the millennial-scale Heinrich (H) events which resulted in the deposition of
recognizable layers throughout the North Atlantic sea floor, based on theit·
sedimentological and geochemical specifie features (Hemming, 2004, Rashid et al.,
2012, and references herein). Sedimentary processes and fluxes in the Labrador Sea
have accordingly undergone significant changes, essentially driven by the sporadic
release of large amounts of terrigenous material from the LIS (e.g., Andrews et al. ,
1994), and/or through changes in the oceanographie regime ( e.g., Wu and Hillaire
Marcel, 1994), as weil as due to variations in primary productivity (e.g. , Hillaire
Marcel et al. , 1994b).
Here, based principally on measurement of isotopes of uranium e34U, 238U), thorium
(230Th, 232Th) and protactinium e31 Pa) in a ~9 rn-long core (HU08-029-004PC) raised
from the lower continental slope off the Hudson Strait outlet, we intend to document
changes in terrigenous fluxes and sedimentary dynamics off the northeastem LIS
meltwater route during the last ~37 cal ka BP. Initial excesses in 230Th and 231Pa
[e30Thxs)o and e31Paxs)o], i.e. , the fractions of these isotopes unsupported by parent
isotopes in the sediment at the time of their deposition, have been estimated using a
calibrated 14C-chronology of the sedimentary sequence (Gibb et al., 2014) to carry
back in time 230Th and 231Pa activities, and calculate their post-depositional in situ
61
production (e.g., Anderson et al., 1990; Veiga-Pires and Hillaire-Marcel, 1999). U-,
Th- and Pa-concentrations and activity ratios were measured with a centennial to
millennial resolution due to the highly variable sedimentation rates at the site (Gibb et
al., 2014 ). In order to link U, Th and Pa isotopes and sediment properties, CA T -scan
images have been used to document sedimentological features and complemented by
measurements of the coarse fraction content (used as proxy for IRD abundance), of
organic and inorganic carbon concentrations (Corg and Cinorg), and semi-quantitative
mineralogical analyses of the bu1k sediment. Based on micropaleontological data and
transfer function reconstruction of paleo-sea surface conditions, Gibb et al. (2014)
identified three distinct climatostratigraphic intervals: a glacial interval when
productivity was practically nil ( ~36.6-12.2 cal ka BP), a deglacial interval
characterized by low salinity conditions due to the transit of huge amounts of
meltwater (~12 .2- 8.3 cal ka BP) and the post-glacial, when productivity rose rapidly
to full interglacial values (::S ~8.3 cal ka BP). Gibb et al. (20 14) highlighted the fact
that if the site did record major meltwater pulses linked to H3 (?), H2, H 1 and the
fmal drainage of Lake Agassiz, it did not record the Y ounger Dryas nor the HO event
(see Andrews et al. , 1994, Hillaire-Marcel et al., 1994a, Pearce et al., 2013, for
information on the HO event in the Labrador Sea). Building on Gibb and others' work
(20 14 ), we in tend to further document here detrital sediment sources and fluxes as
weil as sedimentary processes, in the western most area of Labrador Sea, based on U
and Th-series isotopes . In a context of continental slope processes and at the
emplacement of the LIS margin, these tracers could provide information about the
past ice-sheet dynamics as well as about the variability of deep currents (e.g., Veiga
Pires and Hillaire-Marcel, 1999; Yu et al. , 1996).
62
2.2 Materials and methods
The 895 cm-long core HU08-029-004PC (henceforth 004PC) was retrieved from a
water depth of 267 4 rn on the lower Labrador continental slope, approximately 180
km seaward from the Hudson Strait shelf edge (61 °27'N, 58°2'W; Fig. 1; Campbell
and de Vernal, 2009).
2.2 .1. Sedimentological parameters
Once core sections were split lengthwise, the sediment was visually examined for its
structure, texture and co lor. Sections were then scanned at high resolution ( ~0.1 - 1
mm) by computerized coaxial tomography (CAT-scan) technique to acquire 30 X
rays images (St-Onge and Long, 2009). CA T-scan gives a view on the internai
structure of the sediment cores, especially specifie features such as IRD. Core
sections were also photographed at 500 dpi (dots per inch) using a high resolution
Smartcube™ Smart Camera Image Scanner (SmartCIS) .
Qualitative and semi-quantitative (±1cr ~ 5%) analyses of mineralogica1 assemblages
were made using X-ray diffraction (XRD) following procedures described in Last
(2001), Moore and Reynolds (1997) and Thorez (2003). A homogeneous powder of
the < 63 )lill bulk fraction was scanned using a Siemens 05000™ diffractometer,
with a CoKa1, 2 X-radiations (/,= 1.76896) and a Si detecter, between 2° and 50° 28
angles. Qualitative and semi-quantitative estim ates were based on peak identifications
and relative intensity measurements of their X-ray patterns using the Diffracplus
EV A TM software.
Total carbon- (C) content, inorganic carbon (Cinorg) and organic carbon (Corg) were
analyzed on the bulk-fraction at 8 cm-intervals and reported in percentage vs dry
sediment weight ( dw%; Fig. S3). Aliquots of ~9 mg were analyzed for their total C-
63
content using an NC 2500TM elemental analyzer (Carlo-Erba™). Aliquots were then
fumigated for ~24 hours with vapors of 12M HCl to dissolve carbonate minerais and
measure the residual Corg-content (Hélie, 2009). Values of Cinorg were finally
estimated by subtracting the Corg values from the total C values. However, this
dissolution procedure may have not removed ail the fraction of the Cnorg (dolomite
can be partly refractory to acid treatment) or might be slightly biased by the
dissolution of HCl-leachable compounds, both resulting in minor anomalies in Corg
estimations. An internai precision of 0.1% (± la) was nonetheless estimated based on
duplicated analyses from the analogue coulometer technique (see Fig. S3). Assuming
that the Cinorg content is representative of calcite and dolomite abundances (based on
X-ray diffraction scans; Last, 2001; Moore and Reynolds, 1997; Thorez, 2003),
estimates of their respective dry weight percentages within the sediment were
calculated.
The core chronology was established by Gibb et al. (2014) and constrained by
radiocarbon C4C) dates obtained from hand-picked planktic foraminifera
Neogloboquadrina pachyderma sinistral from the dw% > 106 Jlm sediment fraction
(Fig. 2). Accelerator mass spectrometry (AMS) measurements were made at the
Lawrence Livermore National Laboratory and at the National Ocean Sciences AMS
Facility. Radiocarbon ages were calculated using the Libby half-life of 5568 years
and normalized to a o13C-value of -25%o. A marine reservoir correction of 400 years
was applied (~R=O; see a discussion in the supplementary material of Hillaire-Marcel
et al. , 2007), and the ages were converted to calibrated years using Oxcal 4.2
(Ramsey, 2008) and the Marine09 calibration curve (Reirner et al. , 2009). The p
sequence madel in OxCal was selected for estirnating the probability of each age.
This madel is based on a Bayesian approach taking into account the probability
distribution of calibrated ages, the sample depths and changes in deposition rates (see
Gibb et al., 2014, for more details). Three 14C ages depict in particular an age interval
of 8441-8179 cal ka BP for the 85-36 cm layer, with an average value of 8327 cal ka
64
BP, deposited during the final drainage of Lake Agassiz (e.g., Lewis et al., 2012;
Barber et al., 1999; Hillaire-MaTcel et al., 2007), although the sediment does not
show here a significant increase in detrital carbonates in contrary to what is generally
observed (e.g., Hillaire-Marcel et al., 2007; Nicholl et al. , 2012). Linear interpolation
between each modelled age were used to calculate the sedimentation rates and the
age-depth relationship, which was finally used to plot proxy data against age as well
as to carry back in time radioactive disequilibria in the U-series isotopes. The
modeled results provide a basal age of ~36.6 cal ka BP. Sedimentation rate is hence
~24.4 cm/ka on average but depicts large variations downcore (see Fig. 2).
2.2.2. Radionuclide analyses
Several techniques were combined for the measurement of actinides. 238U, 234U, 232Th
and 230Th separation and extraction were performed following analytical procedures
described in Lally (1992). Sampling was made at 12 cm intervals from bottom up to a
depth of 140 cm depth downcore, then at 8 cm to 4 cm intervals, above, where
sedimentation rate revealed much lower based on the calibrated 14C-chronology.
Samples from the upper 40 cm interval were measured by Thermal Ionization Mass
Spectrometry (TIMS; VG-Sector™ single collector) whereas below, dowcore, they
were measured by alpha-emission spectrometry (using Ortec™ alpha counter).
For 238U, 234U, 230Th and 232Th measurements, bulk sediment aliquots of ~0.2 g
(TIMS) and ~ 1 g (alpha counting) were heated at ~ssooc for ~2 hours to oxide
organic matter and facilitate further treatments. A 233U-236U-229Th (TIMS) or 232U-
228Th (alpha counter) spike was added to the samples prior to HN03/HF/HC1 acid
digestion. U and Th were then isolated from other constituents by ion exchange
chromatography using resin columns. A Dowex AG 1 X8 200-400 mesh anion
exchange resin was used in combination with ultra-pure H20 and 8M HCl to separate
U and Th. Th was then purified to remove any residual constituents, and U was
65
separated from Fe with a U/TEV A res in. Finally, for alpha counting, U and Th were
electrodeposited as monoatomic layers on silver disks from which their activity was
measured using an Ortec™ alpha counter (see Vallières, 1997 or Veiga-Pires, 1998
for a detailed description of the methodology) or directly measured by TIMS. The
analytical uncertainty is better than 3% (±1cr) for ali isotopes e38U, 234U, 232Th and 230Th) with the alpha counting measurements, and better than 0.5% (± 1cr), with TIMS
measurements.
A total of 46 sediment samples of ~0.5 g distributed throughout the sequence were
also analyzed for their 231 Pa vs 230Th concentrations. Prior to HN03/HF/HCl/HCl04
ac id digestions (as above ), known amount of 233Pa, 236U and 229Th spikes were added
to the samples. Isotopes were extracted from the sediment samples by anion exchange
chromatography with the Dowex AG 1 X8 200-400 mesh resin following analytical
procedures in Choi et al. (2001 ). 231Pa and 230Th were measured on a multi-collector
inductively coupled plasma mass spectrometer (MC-ICP-MS; Nu II™ instrument),
respectively by peak jumping at masses 231 and 233 , and at masses 229 and 230, on a
filtered ion counter. The filter allows to significantly reduced tailing from 232Th
which is particularly important for 230Th measurements as 232Th is much more
abundant than 230Th. Monitoring 232Th tailing at mass 230.5 allowed us to estimate
that the tailing contribution from 232Th was actually smaller than the uncertainty on 230Th measurements and was hence considered negligible. Mass fractionation was
monitored on the 238U/235U ratio from an intern solution of HU-1. Certified reference
material NBL-117, U500 and UO 10 were analyzed daily for the ir 238U/235U ratio and
corrected for fractionation using an exponentiallaw. Corrections using the intern HU-
1 solution gave deviations from the certified values less than 2%o. Internai errors for
Pa measurements were less than 1% except for samples with relatively low
concentrations where the error could be as high as 2-4%. Internai errors for Th
measurements were less than 1%. Blanks were under 2 fg and 260 fg for Pa and Th,
respectively. Reproducibility uncertainty is ~6.1% for 231Pa and ~3% for 230Th (both
66
in ±lcr) calculated from replicate measurements of an internai sedimentary standard
(see Fig. Sl).
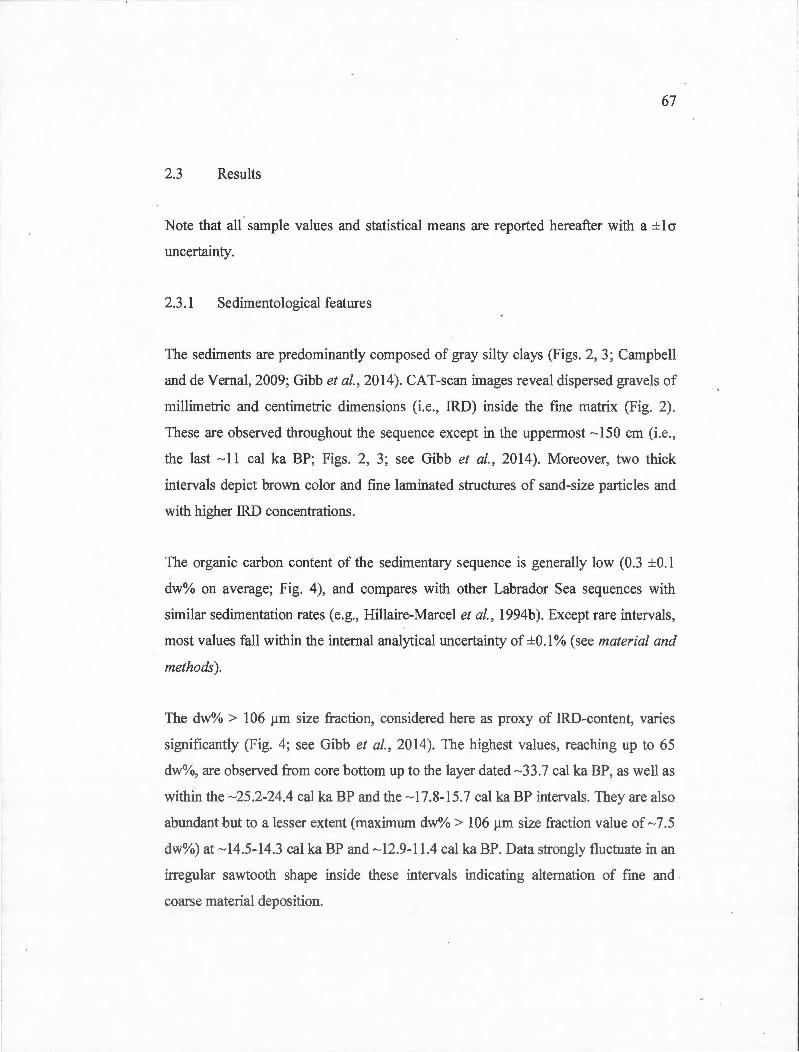
67
2.3 Results
Note that ail sample values and statistical means are reported hereafter with a ± lcr
uncertainty.
2.3 .1 Sedimentological features
The sediments are predominantly composed of gray silty clays (Figs. 2, 3; Campbell
and de Vernal, 2009; Gibb et al., 2014). CAT-scan images reveal dispersed gravels of
millimetric and centimetric dimensions (i.e., IRD) inside the fme matrix (Fig. 2).
These are observed throughout the sequence except in the uppermost - 150 cm (i.e. ,
the last - 11 cal ka BP; Figs. 2, 3; see Gibb et al. , 2014). Moreover, two thick
intervals depict brown color and fine laminated structures of sand-size pmticles and
with higher IRD concentrations.
The organic carbon content of the sedimentary sequence is generally low (0.3 ±0.1
dw% on average; Fig. 4 ), and compares with other Labrador Sea sequences with
similar sedimentation rates (e.g. , Hillaire-Marcel et al., 1994b). Except rare intervals,
most values fall within the internai analytical uncertainty of ±0.1% (see material and
methods).
The dw% > 106 Il ffi size fraction, considered here as pro x y of IRD-content, varies
significantly (Fig. 4; see Gibb et al., 2014). The highest values, reaching up to 65
dw%, are observed from core bottom up to the layer dated -33.7 cal ka BP, as weil as
within the -25.2-24.4 cal ka BP and the - 17.8-15.7 cal ka BP intervals. They are also
abundant but to a lesser extent (maximum dw% > 106 !lill size fraction value of - 7.5
dw%) at -14.5-14.3 cal ka BP and -12.9-11.4 cal ka BP. Data strongly fluctuate in an
irregular sawtooth shape inside these intervals indicating alternation of fme and
coarse material deposition.
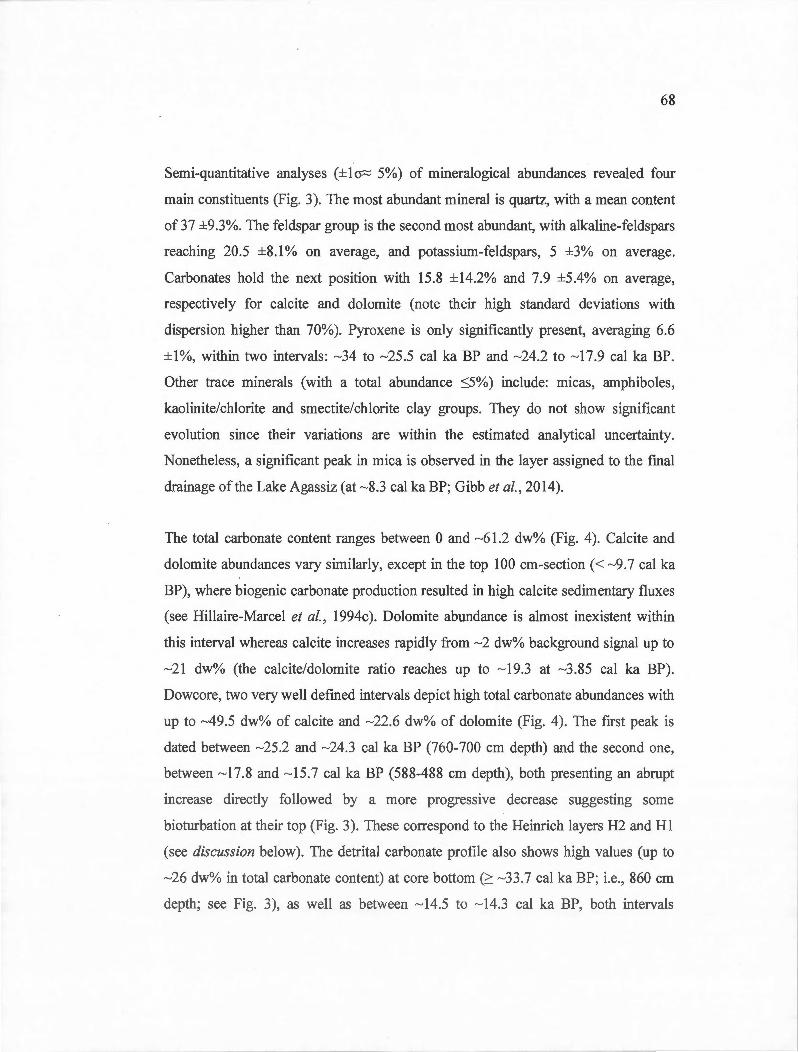
68
Semi-quantitative analyses (±la~ 5%) of mineralogical abundances revealed four
main constituents (Fig. 3). The most abundant mineral is quartz, with a mean content
of37 ±9.3%. The feldspar group is the second most abundant, with alkaline-feldspars
reaching 20.5 ±8.1% on average, and potassium-feldspars , 5 ±3% on average.
Carbonates hold the next position with 15.8 ±14.2% and 7.9 ±5.4% on average,
respectively for calcite and dolomite (note their high standard deviations with
dispersion higher than 70%). Pyroxene is only significantly present, averaging 6.6
±1%, within two intervals: ~34 to ~25.5 cal ka BP and ~24.2 to ~17.9 cal ka BP.
Other trace minerais (with a total abundance :S5%) include: micas, amphiboles,
kaolinite/chlorite and smectite/chlorite clay groups. They do not show significant
evolution since their variations are within the estimated analytical uncertainty.
Nonetheless, a significant peak in mica is observed in the layer assigned to the fmal
drainage of the Lake Agassiz (at ~8.3 cal ka BP; Gibb et al., 2014).
The total carbonate content ranges between 0 and ~61.2 dw% (Fig. 4). Calcite and
dolomite abundances vary similarly, except in the top 100 cm-section(< ~9.7 cal ka
BP), where biogenic carbonate production resulted in high calcite sedimentary fluxes
(see Hillaire-Marcel et al., 1994c). Dolomite abundance is almost inexistent within
this interval whereas calcite increases rapidly from ~2 dw% background signal up to
~21 dw% (the calcite/dolomite ratio reaches up to ~ 19 . 3 at ~3.85 cal ka BP).
Dowcore, two very weil defmed intervals depict high total carbonate abundances with
up to ~49 . 5 dw% of calcite and ~22.6 dw% of dolomite (Fig. 4). The first peak is
dated between ~25.2 and ~24.3 cal ka BP (760-700 cm depth) and the second one,
between ~17.8 and ~15.7 cal ka BP (588-488 cm depth), both presenting an abmpt
increase directly followed by a more progressive decrease suggesting sorne
bioturbation at their top (Fig. 3). These correspond to the Heinrich layers H2 and Hl
(see discussion below). The detrital carbonate profile also shows high values (up to
~26 dw% in total carbonate content) at core bottom (2: ~33.7 cal ka BP; i.e. , 860 cm
depth; see Fig. 3), as weil as between ~ 14.5 to ~ 14.3 cal ka BP, both intervals
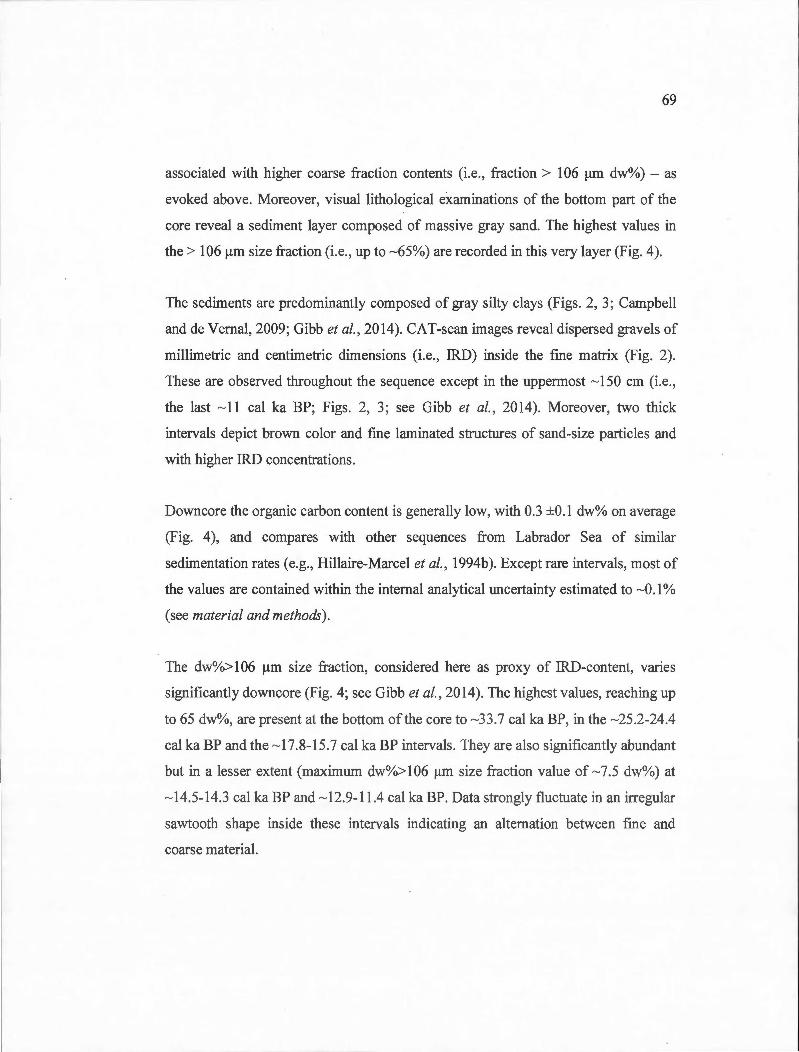
69
associated with higher coarse fraction contents (i .e., fi·action > 106 11m dw%)- as
evoked above. Moreover, visua1 lithological eX.aminations of the bottom part of the
core reveal a sediment layer composed of massive gray sand. The highest values in
the > 106 ).lm size fraction (i.e. , up to ~65%) are recorded in this very layer (Fig. 4).
The sediments are predominant! y composed of gray silty ela ys (Figs. 2, 3; Campbell
and de Vernal, 2009; Gibb et al., 2014). CAT-scan images reveal dispersed gravels of
millimetric and centimetric dimensions (i.e. , IRD) inside the fme matrix (Fig. 2).
These are observed throughout the sequence except in the uppermost ~ 150 cm (i.e.,
the last ~11 cal ka BP; Figs. 2, 3; see Gibb et al., 2014). Moreover, two thick
intervals depict brown color and fme laminated structures of sand-size pmticles and
with higher IRD concentrations.
Downcore the organic carbon content is generally low, with 0.3 ±0.1 dw% on average
(Fig. 4), and compares with other sequences from Labrador Sea of similm·
sedimentation rates (e.g., Hillaire-Marcel et al., 1994b). Except rare intervals, most of
the values are contained within the internai analytical uncertainty estimated to ~0 . 1 %
(see material and methods).
The dw%> 106 ).lm size fraction, considered here as proxy of IRD-content, varies
significantly downcore (Fig. 4; see Gibb et al., 2014). The highest values, reaching up
to 65 dw%, are present at the bottom of the core to ~33.7 cal ka BP, in the ~25.2 -24.4
cal ka BP and the ~ 17.8-15.7 cal ka BP intervals. They are also significantly abundant
but in a lesser extent (maximum dw%> 106 11m size fraction value of~ 7.5 dw%) at
~ 14.5-14.3 cal ka BP and ~ 12.9-11.4 cal ka BP. Data strongly fluctuate in an irregulm·
sawtooth shape inside these intervals indicating an alternation between fme and
coarse material.
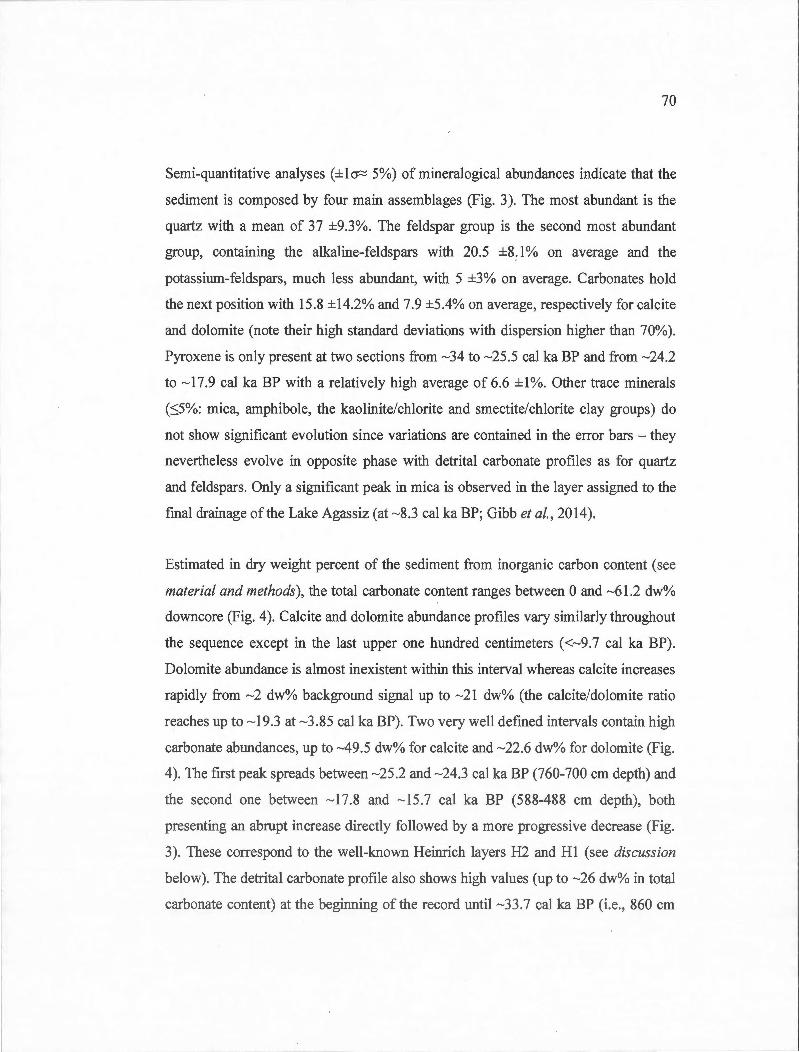
70
Semi-quantitative analyses (± la::::: 5%) of mineralogical abundances indicate that the
sediment is composed by four main assemblages (Fig. 3). The most abundant is the
quartz with a mean of 37 ±9.3%. The feldspar group is the second most abundant
group, containing the alkaline-feldspars with 20.5 ±8.1% on average and the
potassium-feldspars, much less abundant, with 5 ±3% on average. Carbonates hold
the next position with 15 .8 ± 14.2% and 7.9 ±5.4% on average, respectively for calcite
and dolomite (note their high standard deviations with dispersion higher than 70%).
Pyroxene is only present at two sections from ~34 to ~25 . 5 cal ka BP and from ~24 .2
to ~ 17.9 cal ka BP with a relatively high average of 6.6 ± 1%. Other trace minerais
(~5% : mica, amphibole, the kaolinite/chlorite and smectite/chlorite clay groups) do
not show significant evolution since variations are contained in the error bars - they
nevertheless evolve in opposite phase with detrital carbonate profiles as for quartz
and feldspars . Only a significant peak in mica is observed in the layer assigned to the
fmal drainage of the Lake Agassiz (at ~8.3 cal ka BP; Gibb et al., 2014).
Estimated in dry weight percent of the sediment from inorganic carbon content (see
material and methods) , the total carbonate content ranges between 0 and ~61.2 dw%
downcore (Fig. 4). Calcite and dolomite abundance profiles vary similarly throughout
the sequence except in the last upper one hundred centimeters (<~9.7 cal ka BP).
Dolomite abundance is almost inexistent within this interval whereas calcite increases
rapidly from ~2 dw% background signal up to ~21 dw% (the calcite/dolomite ratio
reaches up to ~19.3 at ~3 .85 cal ka BP). Two very well defmed intervals contain high
carbonate abundances, up to ~49.5 dw% for calcite and ~22.6 dw% for dolomite (Fig.
4). The first peak spreads between ~25 .2 and ~24.3 cal ka BP (760-700 cm depth) and
the second one between ~ 17.8 and ~ 15.7 cal ka BP (588-488 cm depth), both
presenting an abrupt increase directly followed by a more progressive decrease (Fig.
3). These correspond to the well-known Heinrich layers H2 and Hl (see discussion
below). The detrital carbonate profile also shows high values (up to ~26 dw% in total
carbonate content) at the beginning of the record until ~33.7 cal ka BP (i.e. , 860 cm
71
depth; see Fig. 3) and a little peak between ~14.5 to ~ 14.3 cal ka BP, bath associated
with higher dw%> 106 )!ID values - as evoked above. Moreover, visual lithological
examinations of the bottom part of the core reveal a sediment layer composed of
massive gray sand. The highest values in dw%> 106 )!rn size fraction (i.e. , up to
~65%) are recorded in this interval (Fig. 4).
2.3 .2 Radionuclide data
Downcore bulk sediment U concentrations vary from 0.71 ±0.004 ).!g.g- 1 to 2.23
±0.0 1 ).!g.g-1 and show generally high values throughout the glacial and de glacial
intervals (Fig. 5). Afterwards, the values decrease progressively ( except for a peak at
~ 12.2 cal ka BP), with minimum values recorded in the uppermost 8 cm. Bulk
sediment Th-concentrations also fluctuate considerably, between 2.86 ±0.06 ).!g.g- 1
and 9.14 ±0.18 ).!g.g-1, with a similar decreasing tend through time (Fig. 5). Note that
bath U- and Th-concentrations are low in the high detrital carbonate content intervals,
reflecting low amounts of U and Th in these detrital minerais (see Fig. 5). The
(U/Th)AR and U/Th mass ratios range 0.36 ±0.01 to 1.41 ±0.01 , and 0.12 ±0.003 to
0.48 ±0.01 (Fig. 5), respectively, whereas the e34UP38U)AR varies between 0.88 ±0.03
and 1.13 ±0.0 1 (Fig. 5). 230Th activities fluctuate significantly in the sequence, with
values ranging from 0.56 ±0.01 to 3.66 ±0.37 dpm.g- 1, and following a progressive
increase upward (Fig. 5). 231Pa activities range 0.013 ±0.001 to 0.365 ±0.022 dpm.g-1,
with a similarly increasing trend towards the post-glacial (Fig. 5). For bath isotopes,
extremely low contents are observed in the detrital carbonate layers.
72
2.4 Discussion
2.4.1 Late vs early diagenetic evolution ofU-contents and activity ratios
Redox conditions are known to be the main factor controlling the U behavior in the
marine environment in influencing its solubility. The remo val of U into anoxie (or
suboxic) sediments mostly depends on productivity-driven fluxes of particulate
organic matter to the seafloor, on the supply of oxygen linked to deep-water
ventilation and on sedimentation rates . The alpha-recoil effect is also an important
process to consider due to the disequilibrium it produces between 234U and 238U ( e.g.,
Cochran, 1992; Henderson and Anderson, 2003).
Throughout the study sequence, deficits or ex cesses in 234U ( over 238U) are observed.
In the glacial and deglacial intervals (i.e., ~36. 6-8.3 cal ka BP), 8234U offsets from
secular equilibrium reach as much as -115 and+ 74%o (Fig. 5). As a qui te general rule,
excesses in 234U over 238U are observed in sediments with high organic matter
contents. Under such conditions, strong redox gradients result in the diffusion and
precipitation of U below the water-sediment interface (e.g., Gariépy et al., 1994).
Here however, organic matter is far from abundant and thus unlikely to influence V
contents or e34UP38U)AR. One single layer, located just above the Heinrich 2 interval
(i.e., deposited during the Last Glacial Maximum -LGM- stricto sensu), shows sorne
correlation between V-concentrations, excesses in 234U vs 238U, and Corg contents.
Accordingly, elsewhere in the study sequence, deficits in 234U vs 238U might result
from loss of uranium with preferential 234U-leaching, either through the continental
cycling of carrier partiel es (in soils for example ), or during the ir transport ( e.g. , ela ys
from distal locations) and sedimentation. Now, in chemically poorly reactive sub
polar environments, chemical weathering might be seen as ineffective, although
Refsnider et al. (20 12) have reported very high 234U excesses in subglacial calcites,
leading to hypothesize 234U-depleted "reservoirs" in source rocks. Similarly, large
73
departures from 234U/238U equilibrium have been reported in high latitude peats and
permafrost systems (Schirrmeister et al. , 2002). Th us, sin ce sedimentary supplies
from such sources cannot be discarded, any unequivocal interpretations of U-isotope
behavior in the study core must be discarded. Moreover, one cannot discard either a
late diagenetic evolution in the sediment with 234U-enriched U displaced in relation
with discrete redox gradients (e.g. , Colley and Thomson, 1992; Thomson et al.,
1996). Su ch a pro cess was already suggested by Vallières (1997; Fig. S2) for a core
retrieved from the Greenland continental slope and in which (i) large deficits in 234U
vs 238U were recorded within oxidized sediments deposited during the glacial
intervals of MIS 2, 4 and 6, whereas (ii) strong excesses were observed in the
immediate under- and overlying reduced layers deposited during interstadials and
interglacials.
In core 004PC, the e34UF38U)AR are mostly low within the brown oxidized fast
deposited Heinrich layers, as weil as throughout the glacial sediments. The
corresponding sediment furthermore records very low Corg contents. In comparison,
e34UP 8U)AR are higher in deglacial to post-glacial sediments, and also depict a few
high values in the sediment immediately overlying H2- and Hl-layers (Fig. 5) . As a
matter of fact, at !east one of these intervals with high e34U/238U)AR, above H2, is
also characterized by a high organic carbon content (Fig. 4), which might have led to
sorne early diagenetic U-uptake from the water column. However, as already stated
above, the overall variability of e34UP8U)AR cannot permit to discard a late
diagenetic U-relocation in relation with discrete redox gradients.
In the post-glacial sedimentary section (i.e., ::; ~8.3 cal ka BP), the excesses in 234U
(with 8234U averaging ~+84%o) suggest uptake of marine U either through fluxes of
biogenic V-carriers, and/or due to early diagenetic diffusion from the deep-water
mass into the sediment. Using the 234UP38U activity ratio of 1.146 ±0.002 in seawater
(Cheng et al., 2000) and assuming the deposition of detrital partiel es with U isotopes
74
rn secular equilibrium, this U-flux would account for up to 50% of the total U
measured.
A significant and progressive increase in calcite abundance is observed during the last
~9 .7 cal ka BP (Figs. 3, 4; see also Gibb et al., 2014). It is likely of biogenic origin
since the dolomite abundance is almost nil in this interval. Previous studies based on
correlations between calcite and primary productivity indicators, mostly coccoliths,
also suggest this hypothesis (see Hillaire-Marcel et al. , 1994b; Veiga-Pires, 1998;
Vallières, 1997). However, authigenic U linked to the resulting micritic rain should
not have contributed to a significant part of the U-uptake in the core top sediment,
sin ce most biogenic minerais show very low amounts of authigenic uranium ( e.g., ~
4.92 ±0.01 ng.g- 1 in foraminifers from a Greenland Rise core; Hillaire-Marcel, 2009).
The C org content of the sediment is relatively low for the post-glacial sediments (~0.3
±0.05 dw% on average) . These might be the result of a near-complete oxidation of
the fresh organic matter, along with the drop of sedimentation rates also observed
(see also Hillaire-Marcel et al. , 1994b). The early diagenetic precipitation ofU would
have occurred or be still active below the core-top 4 cm, as this layer is characterized
by CZ34UP 8U)AR much closer to secular equilibrium. As a matter of fact, a transition
from brown (oxidized) to gray (reduced) coloris observed at a depth of ~ 7 cm (see
Gariépy et al., 1994 ).
Worth of mention is the fact that that the layer dated at ~8.3 cal ka BP and assigned to
the fmal Lake Agassiz drainage shows a relatively high calcite abundance (Fig. 3)
together with an excess of 234U over 238U. However, the absence of dolomite in this
layer, and the fact that nearly constant calcite percentages are also observed in the
under- and overlying sediments, lead us to assign this calcite to a more or less steady
biogenic carbonate production.
75
2.4.2 Terrigenous detrital supply
Based on U/Th activity and mass ratios, Vallières (1997) then Veiga-Pires (1998)
identified three different regional signatures of terrigenous detrital material in the
Labrador Sea: (i) the Reykjanes ridge, (ii) the Labrador continental slope, and (iii) the
Greenland continental slope (see Fig. 1). The distal supply would also be dependent
on the WBUC intensity carrying frne particles from the Reykjanes ridge (Fage! et al.,
1996; Hillaire-Marcel et al., 1994a; see also Veiga-Pires, 1998). In 004PC glacial and
deglacial sediments, large variations of U/Th activity and mass ratios are reported.
Assuming in a first approximation that e 34U/238U)AR are close to secular equilibrium
and since any significant early-diagenetic U-uptake might have only occurred in the
very core top sediment, these large amplitude variations mostly suggest changes in
terrigenous detrital sediment sources (Fig. 5).
The production rate of 230Th and 231 Pa in the water column is nearly constant but for
the ~3% change in V-concentration and salinity between glacial and interglacial
episodes (e.g., Schmidt and Spero, 2008; see also Not et al., 2012). The theoretical 230Thxs vertical flux, Fe30Ihxs)v, calculated for the 2674 rn water depth of 004PC site,
is ~7.14 dpm.cm-2.ka-1 (Fig. 5; cf. Suman and Bacon, 1989). Within the above ~3%
uncertainty range and neglecting glacial/interglacial changes in sea-level thus
variations in water depth at the site, this value hence represents the 230Ihxs flux at the
seafloor strictly linked to U-decay in the overlying water column. It has been used to
estimate deviations of measured initial ex cess of 230Th fluxes in the sediment samples
(i.e. , (F230Thxs)M; see Fig. 6).
To estimate initial excesses, measured values e30Th and 23 1Pa; dpm.i1) were
corrected from: (i) the supported component from U present in mineral lattices of
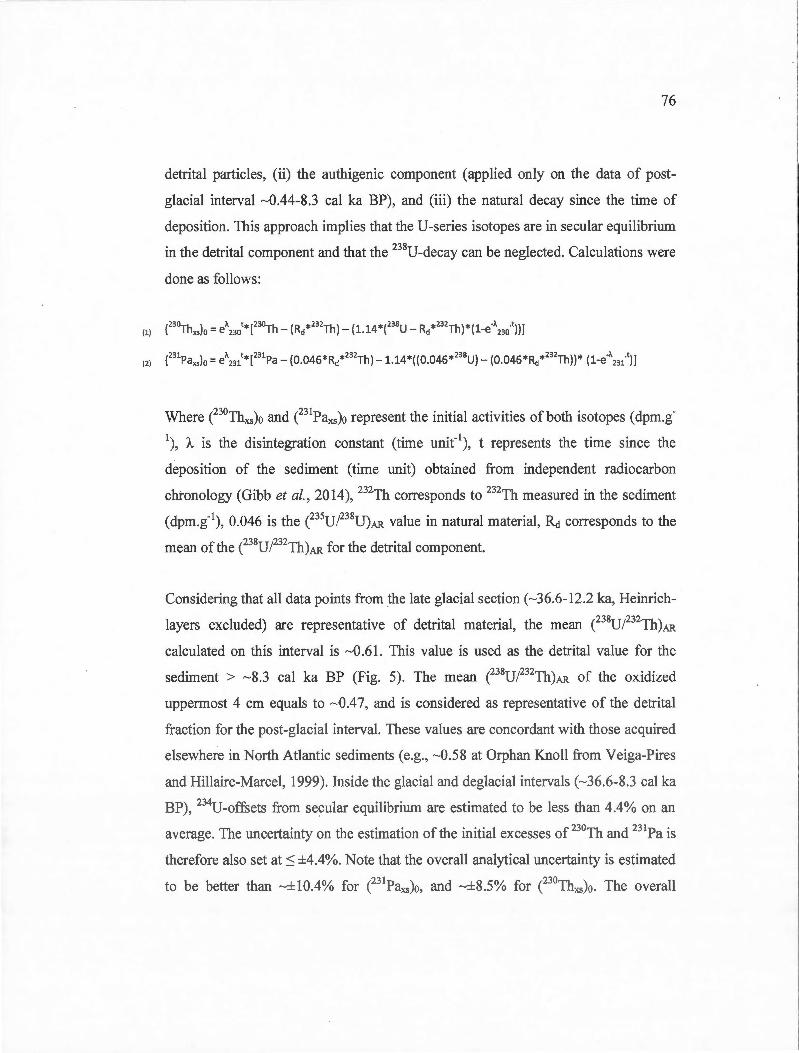
-- - - - ------ - ---.
76
detrital particles, (ii) the authigenic component (applied only on the data of post
glacial interval - 0.44-8.3 cal ka BP), and (iii) the natural decay since the time of
deposition. This approach implies that the 0-series isotopes are in secular equilibrium
in the detrital component and that the 2380 -decay can be neglected. Calculations were
done as follows :
Where CZ30Thxs)o and CZ31 Paxs)o represent the initial activities ofboth isotopes (dpm.g-
1), À is the disintegration constant (time unif1), t represents the time since the
deposition of the sediment (time unit) obtained from independent radiocarbon
chtonology (Gibb et al., 2014 ), 232Th corresponds to 232Th measured in the sediment
(dpm.g"1) , 0.046 is the (2350 P38U)AR value in natural material, RI corresponds to the
mean of the (2380P32Th)AR for the detrital component.
Considering that ali data points from the late glacial section (- 36.6-12.2 ka, Heinrich
layers excluded) are representative of detrital material, the mean e38U/232Th)AR
calculated on this interval is - 0.61. This value is used as the detrital value for the
sediment > - 8.3 cal ka BP (Fig. 5). The mean e38UP32Th)AR of the oxidized
uppermost 4 cm equals to - 0.47, and is considered as representative of the dett·ital
fraction for the post-glacial interval. These values are concordant with those acquired
elsewhere in North Atlantic sediments (e.g. , - 0.58 at Orphan Knoll from Veiga-Pires
and Hillaire-Marcel, 1999). Inside the glacial and deglacial intervals (- 36.6-8.3 cal ka
BP), 2340-offsets from secular equilibrium are estirnated to be Jess than 4.4% on an
average. The uncertainty on the estimation of the initial ex cesses of 230Th and 23 1 Pa is
therefore also set at S ±4.4%. Note that the overall analytical uncertainty is estimated
to be better than -±10.4% for CZ31Paxs)o, and -±8.5% for CZ30Thxs)o. The overall
77
analytical uncertainty for e31 Pax/30Thxs)o is th en estimated to be within a -± 10-13%
range.
Results plotted in Fig. 6 show that e30Thxs)o and e31 Paxs)o values are highly variable
and tend to increase upward in the sequence (Heinrich-layers excluded). Values are
especially high in the post-glacial interval, reaching up to 3.08 ±0.23 dpm.g-1 for
e30Thxs)o and 0.35 ±0.02 dpm.g- 1 for e31 Paxs)o. These calculations occasionally
yielded negative values. Either poor estimates of the age of the corresponding
sediments or changes in the mineralogical composition of the detrital fraction, th us in
its U/Th ratio, might be evoked. For such intervals, we have considered the excess as
null. The analytical errors, in addition to uncertainties about sedimentation rates,
adding the high variability of e34UP38U)AR and (U/Th) mass ratios, raise doubts about
any more precise assessment of the "supported" 230Th and 23 1Pa-fractions in such a
setting, and bence on any interpretation using these tracers.
2.4.4 e30Thxs)o durations ofH2 and Hl
At site 004PC, in the near proximity of the Hudson Strait streaming area, Heinrich
layers 2 and 1 are very weil documented (Fig. 3). Their boundaries have been
delimited based on the carbonate content, a composition markedly different of that in
the ambient glacial sediment that consists mostly of quartz and feldspars ( e.g.,
Andrews et al. , 20 12). During H-event intervals, the sedimentation rate has been
much higher than during glacial times as a whole. Their coarse fraction content is
high and also displays a strong iiTegular sawtooth pattern (see also Rashid et al.,
2003). Both layers present a laminated structure of sand-size particles altemating with
fmer particles and high concentration of gravels (especially at their bottom). They
also depict a characteristic brown color (Figs. 3, 4). Their calcite/dolomite ratio is
~2.5 on average, which is a characteristic value of detrital carbonates originating
from Hudson Bay area (e.g. , Andrews and Tedesco, 1992). Theil· isotopie
78
compositions are characterized by 234U/238U activity ratio <1 and by very low
e30Thxs)o and likewise (231Paxs)o values (Figs. 5, 6). Such low values indicate
extremely fast deposition (e.g. , François and Bacon, 1994). Immediately un~er- and
overlying the H2 and Hl layers, peaks in e30Thxs)o are observed as it was the case of
similar layers at Orphan Knoll (Veiga-Pires and Hillaire-Marcel, 1999). This feature,
possibly linked to the depositional process ofH-layers, is still unexplained.
At last, the layer dated older than ~33.7 cal ka BP seems more likely to have been
deposited during the H4-event rather than during H3, which has been dated at ~31 cal
ka BP (Hemming, 2004; see also Andrews et al. , 2014). This > ~33.7 cal ka BP layer
could be dated more precisely here.
The duration of the deposition of Heinrich layers might also be documented based on
e30Thxs)o inventories, using the e30Thxs)o constant flux approach (e.g., François and
Bacon, 1994; Veiga-Pires and Hillaire-Marcel, 1999). Time is estimated from
e30Thxs)o inventories vs a constant e0Thxs)o flux at sediment surface, thus neglecting
the dependence between 230Thxs and the particle composition and grain-size, as well
as with post-depositional mechanisms. Inventories of e30Thxs)o are calculated as
follows:
Where the inventory 1 (I; dpm.cm-2) for a given interval of a thickness ilXi is the
integral of the multiplication of the e30Thxs)o with p corresponding to the density of
the sediment (g of dry sediment per cubic cm ofhumid sediment).
The 230
Thxs flux at sediment surface may be set either based on vertical production in
the overlying water column ((F230Thxs)v) or from the mean effective e30Thxs)o flux
------------------------------------ ----------------------
79
measured ((F230Thxs)M). In the frrst case, using a (F230Thxs)v to the seafloor equals to
~7.14 dpm.cm-2.ka-\ estimated durations would be ~3.0 and ~3 . 5 ka for H2 and Hl ,
respectively, i.e. , much higher than those reported in the literature (Hemming, 2004).
Using the mean (F230Thxs)M throughout the glacial section (i.e., ~41 dpm.cm-2.ka-\
see Fig. 5), dmation estimates fall to 0.53 and 0.61 ka for H2 and Hl , respectively.
Comparatively, radiocarbon ages give durations of 0.70 and 1.57 ka for H2 and Hl ,
respectively. Accordingly, in a context of continental margin, where (F230Thxs)M
might be highly variable (Fig. 6), such calculations lead to unconstrained dmations.
Moreover, linkages between deep currents, grain size, mineralogical composition of
detrital fluxes , primary productivity, ali have impacts on 230Thxs fluxes ( e.g., Chase et
al., 2002). Furthermore, sorne uncertainties also raised from the difficulty to set an
upper limit for the H-layers due to bioturbation, as indicated by carbonate profiles,
CAT-scan images and visual examination. At last, anomalies evoked above such as
the high 230Thxs values immediately above and below H-layers boundaries, add to the
uncertainty. Here H2 and Hl were re-delimited on the 712-700 cm and 588-512 cm
intervals to mitigate these uncetiainties. However, these uncertainties lead to question
the representativeness of e30Thxs)o inventories assigned to Heinrich layers.
2.4 .5 e31Pax/30Thxs)o and paleoceanographic implications
Since dissolved U is reasonably homogeneously distributed in the seawater, 230Thxs
and 23 1Paxs (half-life 230Th = 75690 ±230 a; Cheng et al., 2000; half-life 231Pa = 32760
±220 a; Robert et al., 1969) are uniformly produced throughout the ocean at a
constant activity ratio of ~0 .092 (François, 2007). Strictly interpreted as
paleoceanographic signais, deviations of sedimentary CZ 31Pax/30Thxs)o ratio from the
production ratio might result from fluctuations in (i) particle flux, (ii) particle
composition CZ31 Paxs is more reactive with biogenic opal and Mn oxides while 230Thxs
appears to have more affinity with carbonates; Chase et al., 2002), and/or, (iii) lateral
advection of fractionated 23 1Paxs vs 230Thxs linked to WBUC transport, assuming that
80
this current was mostly responsible for off-balance ( 3 1Pax/30Thx5) 0-budgets
(François, 2007). It cannot be excluded that deviations of (231Pax/30Thxs)o from
theoretical value are produced by other mechanisms down-slope, such as particle
dependent scavenging rates.
In 004PC core, CZ3 1Pax/30Thxs)o values fall generally below the production ratio in
the water column (Fig. 6). Throughout the glacial interval, as the particle flux was
relatively high (2: 12 cm.ka- 1; Fig. 2) and the particle composition nearly constant
(Heinrich-layers excluded; see Fig. 3), such low values suggest that sorne 23 1Pa is
exported southward by advection. As illustrated Fig. 6, estimates of (F230Thxs)M and
(F230Thxs)v are not much different throughout most of the record. The only exceptions
are short time slices, following Hl and until ~8.3 cal ka BP, the late Holocene, and
surprisingly the H2 layer interval itself. These exceptions suggest sorne 230Thxs
advection or focusing. In the post-glacial sedimentary section (i.e. , :::; ~8.3 cal ka BP),
e31Pax/30Thxs)o values remain generally lower than the production ratio, whereas
overall increases in e30Thxs)o and e31Paxs)o values matching enhanced biogenic
carbonate production, suggest sorne role of the micritic rain in the 230Th and 23 1Pa
scavenging.
81
2.5 Conclusion
A large variability has been observed in U- and Th-series at the study site, in relation
_ with highly variable sedimentary fluxes. The Heinrich-layers H2 and Hl stand out
due to their high content in U and Th-poor detrital carbonates, as weil as their low
CZ30Thxs)o values in response to their fast deposition.
In the study core, redox conditions seem to have induced either sorne U -uptake from
the water column (Holocene) or sorne late diagenetic U-mobility along discrete redox
gradients. The high amplitude variations in e30Thxs)o, e31Paxs)o and accordingly
CZ31PaxJ230Thxs)o ratio suggest highly variable fluxes of these isotopes at sediment
surface. As a consequence, the use of e30Thxs)o inventories to put time constraints on
Heinrich-layer depositional intervals seems out of reach . Moreover, methodological
limitations make precise estimation of the supported vs ingrowth fractions of these
isotopes quite challenging. The most robust features to retain here are:
1) CZ31Pax/30Thxs)o values indicating a nearly continuous export of 231 Paxs VS
230Thxs·
2) (F230Thxs)M illustrating contrasted regimes with notably high advection or
focusing during the deglacial interval and the late Holocene, likely due to distinct
type of particulate fluxes (i.e., respectively mostly detrital vs biogeochemically
enhanced fluxes).
Finally, the high geochemical and sedimentary variability observed on the Labrador
Sea slopes yield to challenge any unequivocal use of U- and Th-series isotopes for
paleoceanographic reconstructions under such settings.
----------
82
Acknowledgments
This study is part of the Canadian contribution to the Past4Future project of the ih
Framework Program of the European Commission. Support is acknowledged from
MDEIE (Ministère du Développement Économique, de l' Innovation et de
l'Exportation) and FRQNT (Fonds de la Recherche du Québec sur la Nature et les
Technologies). Financial support from the Canadian Foundation for Climate and
Atmospheric Sciences (CFCAS), the Natural Resources Canada (NRCan), and the
Natural Sciences and Engineering Research Council of Canada (NSERC) is
acknowledged for the sampling expedition. Special thanks are due to Bassam Ghaleb
for his help in U- and Th-series analyses assistance and to Michel Preda for his help
to XRD measurements at the GEOTOP laboratories.
83
References
Anderson, R.F. , Lao, Y., Broecker, W.S., Trumbore, S.E., Hofmann, H.J., Wolfli, W., (1990), Boundary scavenging in the Pacifie Ocean: a comparison of 10Be and 23 1Pa, Earth and Planetary Science Letters, 96, 287- 304.
Andrews, J. T., O. Gibb, A. E. Jennings, and Q. Simon (2014), Variations in the provenance of sediment from ice sheets surrounding Baffin Bay during MIS 2 and 3 and export to the Labrador Shelf Sea: site HU2008029-0008 Davis Strait, Journal of Quaternary Science, 29, 3-13.
Andrews, J. T., D. C. Barber, A. E. Jenning, D. D. Eberl, B. MacClean, M. E. Kirby, and J. S. Stoner (2012), Varying sediment sources (Hudson Strait, Cumberland Sound, Baffm Bay) to the NW Labrador Sea slope between and during Heimich events 0 to 4, Journal of Quaternary Science, 1-1 O.
Andrews, J. T., K. Tedesco, W. M. Briggs, and L. W. Evans (1994), Sediments, sedimentation rates, and environments, SE Baffin Shelf and NW Labrador Sea 8 to 26 Ka, Canadian Journal Earth Sciences, 31 , 90- 103.
Andrews, J. T., and K. Tedesco (1992), Detrital carbonate-rich sediments, northwestem Labrador Sea: Implications for ice-sheet dynamics and iceberg rafting (Heinrich) events in the North Atlantic, Geology, 20, 1087-1090.
Barber, D. C., A. Dyke, C. Hillaire-Marcel, A. E. Jennings, J. T. Andrews, M. W. Kerwin, G. Bilodeau, R. McNeely, J. Southon, M. D. Morehead, and J.-M. Gagnonk (1999), Forcing of the cold event of 8,200 years ago by catastrophic drainage of Laurentide lakes, Nature 400, 344-348.
Broecker, W. S. (1991), The great conveyor belt, Oceanography, 4(2), 79-89.
Campbell, D. C., and A. de Vernal (2009), Marine geology and paleoceanography of Baffin Bay and adjacent areas. Nain, NL to halifaz, NS, August 28-September 23, 2008. Cruise report of CCGS Hudson Expedition 2008029, Geological Survay of Canada, Open File 5989, Natural Resomces Canada, 2010 pages.
Chase, Z., R. F. Anderson, M. Q. Fleisher, and K. P.W. (2002), The influence of particle composition and particle flux on scavenging of Th, Pa and Be in the ocean, Earth and Planetary Science Letters, 204, 215-229.
Cheng, H., R. L. Edwards, J. Hoff, C. D. Gallup, D. A. Richards, and Y. Asmerom (2000), The half-lives of uranium-234 and thorium-230, Chemical Geology, 169, 17-33.
84
Choi, M. S., R. Francois, K. Sims, M. P. Bacon, S. Brown-Leger, A. P. Fleer, L. Bali, D. Schneider, and S. Pi chat (200 1 ), Rapid determination of Th-230 and Pa-231 in seawater by desolvated micro-nebulization Inductively Coupled Plasma magnetic sector mass spectrometry, Marine Chemistry, 76, 99-112.
Cochran, J. K. (1992), The oceanic chemistry of the uranium- and thorium-series nuclides, in Uranium-series Disequilibrium: Application to Earth, Marine, and Environmental Sciences, edited by M. Ivanovich and R. S. Hannon, pp. 334-395, Clarendon Press, Oxford.
Colley, S., and J. Thomson (1992), Behaviour and mobility of U series radionuclides in Madeira Abyssal Plain turbidites over the past 750,000 years, Marine Geology, 109, 141-158.
Fagel, N ., C. Robert, and C. Hillaire-Marcel (1996), Clay mineral signature of the NW Atlantic Boundary Undercurrent, Marine Geology, 130(1-2), 19-28.
François, R. (2007), Paleoflux and Paleocirculation from Sediment 230Th and 231Pa/230Th, in Proxies in Late Cenozoic Paleoceanography, edited by C. HillaireMarcel and A. de V emal, pp. 681-716, Elsevier.
François, R., and M. P. Bacon (1994), Heinrich events m the N01th Atlantic: radiochemical evidence, Deep-Sea Research 1, 41 , 315-334.
Gariépy, C., B. Gha1eb, C. Hillaire-Marcel, A. Mucci, and S. Vallières (1994), Early diagenetic processes in Labrador Sea sediments: uranium-isotope geochemistry, Canadian Journal of Earth Sciences, 31(1), 28-37.
Gibb, 0., C. Hillaire-Marcel, and A. de Vernal (2014), Oceanographie regimes in the northwest Labrador Sea since Marine Isotope stage 3 based 1 on dinocyst and stable isotope proxy records, Quaternary Science Reviews, 92, p. 269-279.
Hélie, J.-F. (2009), Elemental and stable isotopie approaches for studying the organic and 627 inorganic carbon components in natural samples . In Deep-Sea to Coastal Zones: Methods Techniques for Studying Paleoenvironments, !OP Conference Series: Earth and Environmental Science, 5, 01 2006.
Hemming, S. R. (2004), Heinrich events: Massive late Pleistocene detritus layers of the North Atlantic and their global climate imprint, Review ofGeophysics, 42, 1-43.
Henderson, G. M., and R. F. Anderson (2003), The U-series Toolbox for Paleoceanography, Mineralogical Society of America, 52(1), 493-531.
85
Hillaire-Marcel, C. (2009), The U-series dating of (biogenic) carbonates, !OP Conference Series: Earth and Environmental Science, 5(1), 012008.
Hillaire-Marcel, C. , A. de Vernal, and D. J. W. Piper (2007), Lake Agassiz Final drainage event in the northwest North Atlantic, Geophysical Research Letters, 34, Ll5601.
Hillaire-Marcel, C., A. De Vernal, G. Bilodeau, and A. J. Weaver (2001), Absence of deep-water formation in the Labrador Sea during the last interglacial period, Nature, 410(6832), 1073-1077.
Hillaire-Marcel, C., A. de Vernal, G. Bilodeau, and G. Wu (1994a), Isotope stratigraphy, sedimentation rates, deep circulation, and carbonate events in the Labrador Sea during the last ~200 ka, Canadian Journal of Earth Sciences, 31 , 63-89.
Hillaire-Marcel, C., A. de Vernal, M. Lucotte, and A. Mucci (1994b), La mer du Labrador au cours du Quaternaire récent: Avant-propos., Revue canadienne des sciences de la Terre, 31 , 1-4.
Hillaire-Marcel, C., A. de Vernal, M. Lucotte, A. Mucci, G. Bilodeau, A. Rochon, S. Vallières, and G. Wu (1994c), Productivité et flux de carbone dans la mer du Labrador au cours des derniers 40 000 ans, Canadian Journal Earth Sciences, 31(1), 139-158.
Lally, A. E. (1992), Chemical procedures, in Uranium series disequilibrium: Applications to Earth, Marine, and Environmental Sciences, edited by M. Ivanovich and R. S. Harmon, pp. 95-126, Clarendon Press, Oxford.
Last, W. M. (2001), Mineralogy analysis of lake sediments, in Tracking Environmental Change Using Lake Sediments, edited by W. M. Last and J. P. Smol, pp. 143-187, Kluwer Academie Publishers, Dordrecht, The Netherlands.
Lazier, J. R. N. (1 973), The renewal of Labrador Sea Water, Deep Sea Research, 20(4), 341-353 .
Lewis, C. F. M., A. A. L. Miller, E. Levac, D. J. W. Piper, and G. V. Sonnichsen (2012), Lake Agassiz outburst age and routing by Labrador Current and the 8.2 cal ka cold event, Quaternary International, 260, 83-97.
Moore, D. M., and J. C. Reynolds (1997), X-Ray Diffraction and the Identification and Analysis of Clay Minerais, Oxford University Press, New York.
86
Nicholl, J. A. L., D. A. Hodell, B. D. A. Naafs, C. Hillaire-Marcel, J. E. T. Channell, and O. E. Romero (2012), A Laurentide outburst flooding event during the last interglacial period, Nature geoscience, 5, 901-904.
Not, C., K. Brown, B. Ghaleb, and C. Hillaire-Marcel (20 12), Conservative behavior of uranium vs. salinity in Arctic sea ice and brine, Marine Chemistry, 130-131, 33-39.
Pearce, C., M.-S. Seidenkrantz, A. Kuijpers, G. Massé, N. F. Reynisson, and S.M. Kristiansen (2013), Ocean lead at the termination of the Younger Dryas cold spell, Nature Communications, 4: 1664.
Ramsey, C. B. (2008), Deposition models for chronological records, Quaternary Science Reviews, 772(1), 42-60.
Rashid, H., R. Hesse, and D. J. W. Piper (2003), Origin of unusually thick Heinrich layers in ice-proximal regions of the northwest Labrador Sea, Earth and Planetary Science Letters, 208, 319-336.
Rashid, H. , F. Saint-Ange, D. C. Barber, M. E. Smith, and N. Devalia (2012), Fine scale sediment structure and geochemical signature between eastern and western North Atlantic during Heinrich events 1 and 2, Quaternary Science Reviews, 46, 136-150.
Refsnider, K. A. , G. H. Miller, C. Hillaire-Marcel, M. L. Fogel, B. Ghaleb, and R. Bowden (20 12), Subglacial carbonates constrain basal conditions and oxygen isotopie composition of the Laurentide lee Sheet over Arctic Canada, Geology, 40(2), 135-138.
Reimer, P. J. , M. G. L. Baillie, E. Bard, A. Bayliss, J . W. Beek, P. G. Blackwell, C. B. Ramsey, C.E. Buck, G. C. Burr, R. L. Edwards, M. Friedrich, P. M. Grootes, T. P. Guilderson, 1. Hajdas, T. J. Heaton, A. G. Hogg, K. A. Hughen, K. F. Kaiser, B. Kromer, F. G. McCormac, S. W. Manning, R. W. Reimer, D. A. Richards, J. R. Southon, S. Talamo, C. S. M. Turney, J. van der Plicht, and C. E. Weyhenmeyer (2009), lntCal09 and marine09 radiocarbon age calibration curves, 0-50,000 years cal BP, Radiocarbon, 51, 1111-1150.
Robert, J., C. F. Miranda, and R. Muxart (1969), Mesure de la période du protactinium-231 par microcalorimétrie, Radiochimical Acta, 11, 104-108.
Schirrmeister, L., D. Oezen, and M. A. Geyh (2002), 230Th/U Dating of Frozen Peat, Bol'shoy Lyakhovsky Island (Northern Siberia), Quaternary Research, 57, 253-258.
87
Schmidt, M. W., and H. J. Spero (2008), North Altantic salinity oscillations linked to changes in atmospheric and ocean circulation over the last glacial cycle, PAGES News, 16(1), 23-25.
St-Onge, G ., and B. F. Long (2009), CA T -scan analysis of sedimentary sequences: an ultrahigh-resolution paleoclimatic tool, Engineering Geology, 103, 127-133.
Suman, D. 0., and M. P. Bacon (1989), Variations in Holocene sedimentation in the North American Basin determined from 230Th measurements, Deep Sea Research Part A. Oceanographie Research Papers, 36, 869-878.
Thomson, J., N. C. Higgs, and S. Colley (1996), Diagenetic redistributions ofredoxsensitive elements in northeast Atlantic glacial!interglacial transition sediments, Earth and Planetary Science Letters, 139, 365-377.
Thorez, J. (2003), L'argile, minéral pluriel, Bulletin de la Société Royale des Sciences de Liège, 72, 19-70.
Vallières, S. (1997), Flux d'uranium et excès de 230Th dans les sédiments de la Mer du Labrador- Relation avec les conditions paléocéanographiques et la paléoproductivité du bassin, 144 pp, Université du Québec à Montréal, Montréal (QC), Canada.
Veiga-Pires, C . . C. (1998), Flux de thorium-230 et flux sédimentaires dans l'Atlantique du Nord Ouest au cours des derniers 40 ka en relation avec les variations du climat, environment sciences thesis, 169 pp, Université du Québec à Montréal, Montréal.
Veiga-Pires, C. C., and C. Hillaire-Marcel (1999), U and Th isotope constraints on the duration of Heinrich even.ts HO-H4 in the southeastem Labrador Sea, Paleoceanography, 14(2), 187-199.
Wu, G., and C. Hillaire-Marcel (1994), Accelerator mass spectrometry radiocarbon stratigraphies in deep Labrador Sea cores: paleoceanographic implications, Canadian Journal Earth Sciences, 31(1), 38-47.
Yu, E. F., R. Francois, and M. P. Bacon (1996), Similar rates ofmodem and lastglacial ocean thermohaline circulation inferred from radiochemical data, Nature, 379, 689-694.
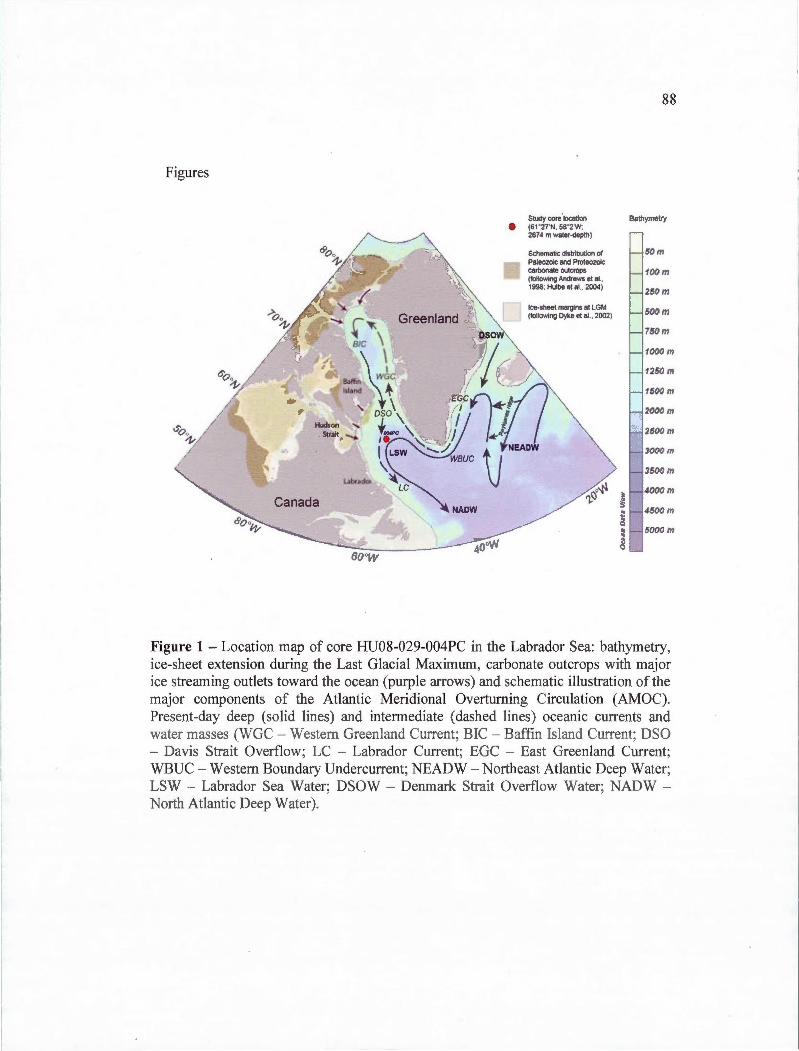
Figures
Greenland
Study core location • (61 "27'N. 58"2'W:
2674 m water-depth)
Schematic distribution of Paleozolc and Proteozolc carbonate outcrops (followtng Andraws et al .. 1998: Hulbe et al. . 2004)
88
Bathymetry
1000m
1500m
Figure 1 -Location map of core HU08-029-004PC in the Labrador Sea: bathymetry, ice-sheet extension during the Last Glacial Maximum, carbonate outcrops with major ice streaming outlets toward the ocean (purple arrows) and schematic illustration of the major components of the Atlantic Meridional Overtuming Circulation (AMOC). Present-day deep (solid !ines) and intermediate (dashed lines) oceanic currents and water mass s (WGC - Western Greenland Current; BIC - Baffm Island Current; DSO - Davis Strait Overflow; LC - Labrador Current; EGC - East Greenland Cunent; WBUC- Western Boundary Undercurrent; NEADW- Northeast Atlantic Deep Water; LSW- Labrador Sea Water; DSOW - Denmark Strait Overflow Water; NADWNorth Atlantic Deep Water).
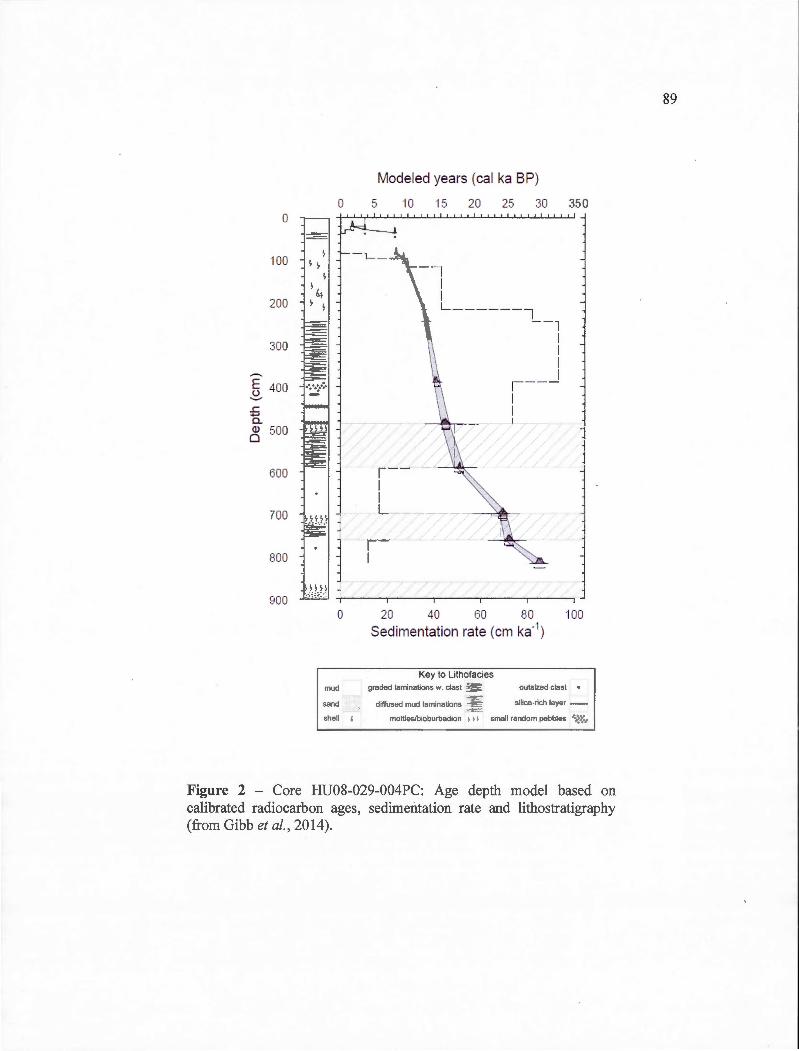
Modeled years (cal ka BP)
0 5 '10 15 20 25 30 350 0
100 ' ,, 1
--1
1 ~~ 1 1 200 1 \ L ______ l
---= --l - =
1 300 1
1 - 1 E 400 ~----
0 1 -.c; 1 ..... a. 1
Q) 500 0
1
~ j
600 ~--
1 1
1
700 1 1
1 ,-
j 800 1
900 0 20 40 60 80 100
Sedimentation rate (cm ka-1)
Key to Lithofacies
mud graded laminations w. dast !!E outslzed clast . sand diffused mud laminations ---:= sihca-rich layer -
shell ! mottleslbioburbadlon > > > small random pebbles '~::"v
Figure 2 - Core HU08-029-004PC: Age depth model based on calibrated radiocarbon ages, sedimentation rate and lithostratigraphy (from Gibb et al. , 2014).
89
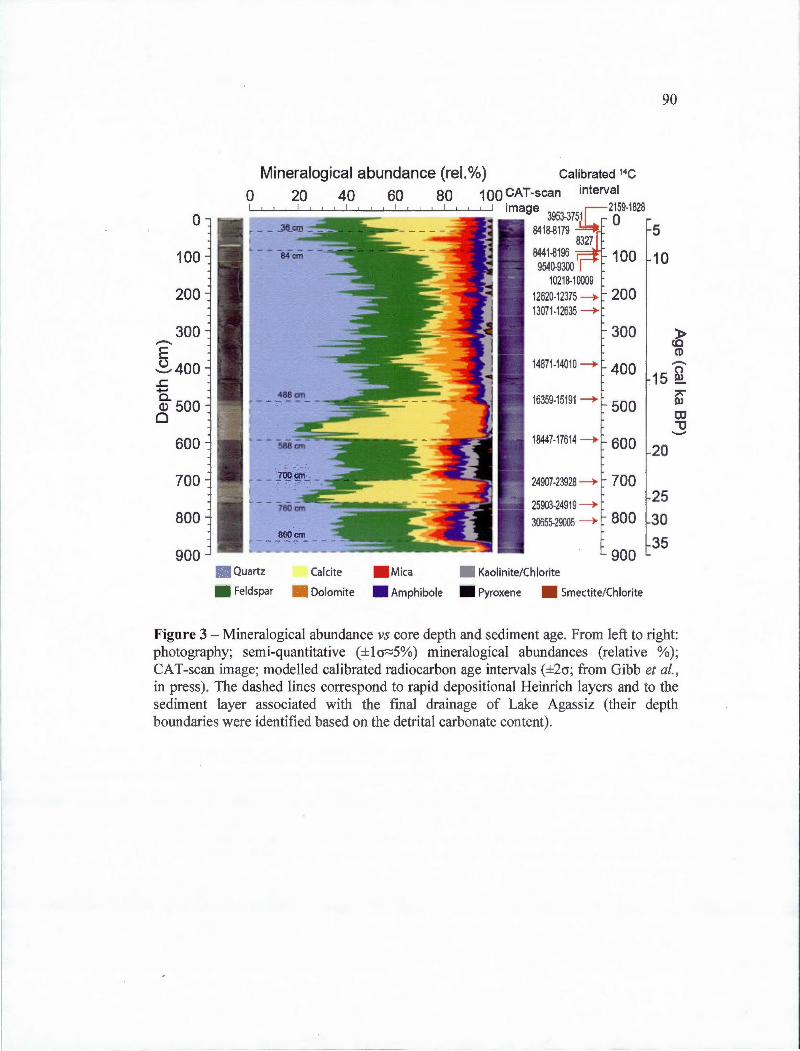
0
100
200
300 ..-. E ~400 .!:: ..... ar 5oo 0
600
700
800
900
90
Mineralogical abundance (rel.%) Calibrated 14C
0 20 40 60 80 1 00 CAT -scan interval 1 1 image
3953-
3751r-:2g9-1828
8418-8179 ~J 5
Ill Quartz
• Feldspar
Calcite
. Dolomite
. Mica
. Amphibole
8327 8441-8196
9540-9300 10218-10009
12620-12375 ---+ 13071-12635 ---+
14871-14010 ---+
16359-15191 ---+
18447-17614 ---+
24907-23928 ---+
25903-24919 ---+ 30655-29005 ---+
• Kaolinite/Chlorite
100
200
300
400
500
600
700
800
900
• Pyroxene • Smectite/Chlorite
10
~ CD -
15@ ;:rç-ru OJ "'U
20
25
30
35
Figure 3 - Mineraiogical abundance vs core depth and sediment age. From ieft to right: photography; semi-quantitative (±lcr~5%) mineralogical abundances (relative %); CAT-scan image; modelled calibrated radiocarbon age intervals (±2cr; from Gibb et al., in press). The dashed lines correspond to rapid depositional Heinrich layers and to the sediment layer associated with the fmal drainage of Lake Agassiz (their depth boundaries were identified based on the detrital carbonate content).
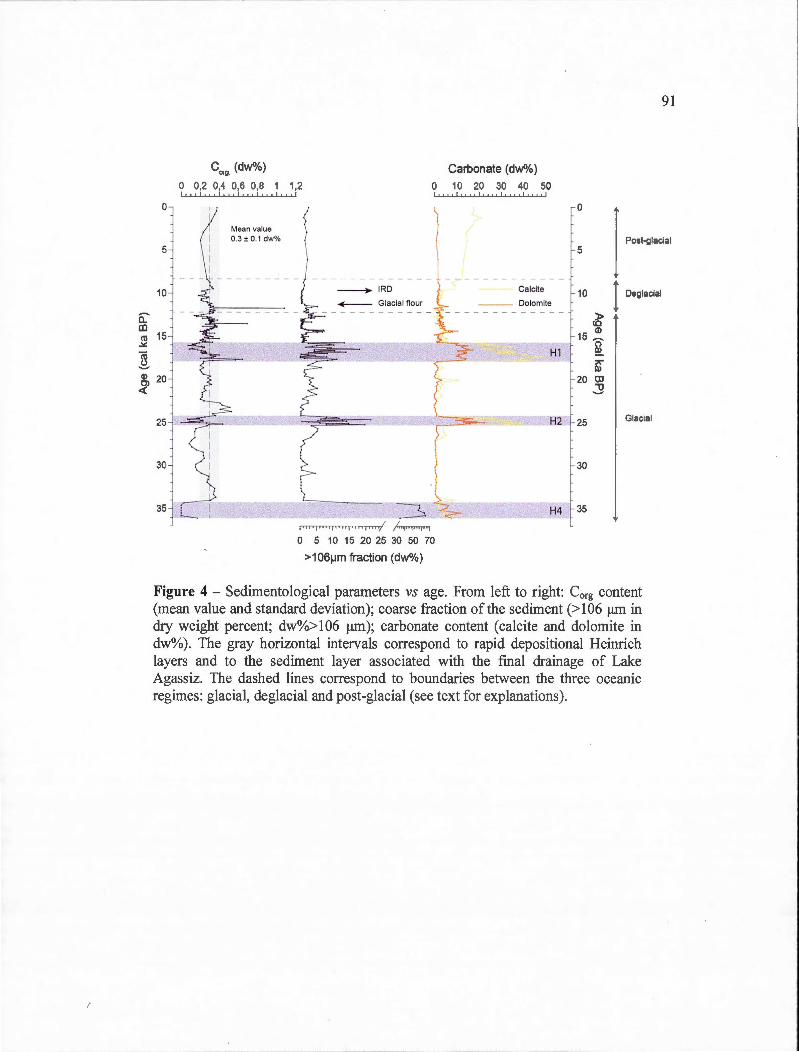
0
5
10
CL' co rn 15
.:.:. (Ü
~
c org (dw%)
0 0,2 0,4 0,6 0,8 1 1,2 1 1 " 1 " 1 1 1 Il 1 1 tl 1 Il 1 1 " • 1
Mean value 0.3 ± 0.1 dw%
91
Carbonate (dw%)
0 1 0 20 30 40 50 ,,,,, ,,, .. ! ,,,,,, , ,,,,,,, ,
0
1 Po" '''"" 5
I Deglacial Calcite 10 - IRD
~ Glacial flour -- Dolomite ------------ ~-------------
-\
Hl
~ 20 ( ~
25
30
35
r 1""1' 1~1 ·~•' 1CT'I •~• '.,, 1 •~• 'TT' 1~'' •CTJ'l
0 5 10 15 20 25 30 50 70
>1061-Jm fraction (dw%)
H2 25 Glacial
30
H4 35
Figure 4 - Sedimentological parameters vs age. From left to right: Corg content (mean value and standard deviation); coarse fraction of the sediment (> 106 J..tm in dry weight percent; dw%>106 J..tm); carbonate content (calcite and dolomite in dw%). The gray horizontal intervals correspond to rapid depositional Heinrich layers and to the sediment layer associated with the fmal drainage of Lake Agassiz. The dashed !ines correspond to boundaries between the three oceanic regimes: glacial, deglacial and post-glacial (see text for explanations).
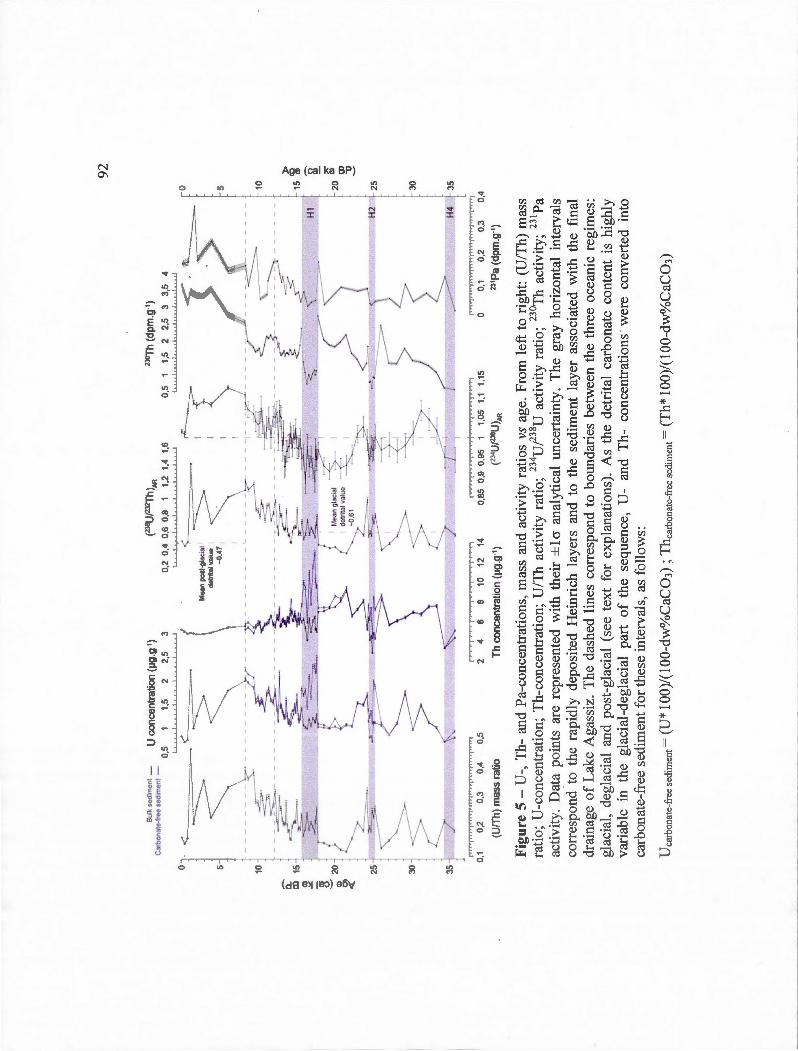
0 5 10
ii:'
ID
15
cu
-"" ~20
Q) 1f 25
30
35
Butk
sedo
men
t-
U c
once
ntra
tion
(IJ9-
!T1 )
C
arbo
nate
-free
sed
omen
t -
0,5
1 1,
5 2
2,5
3
-:::
;;::
==~-
c. -=
====
=--
(238
UP3
2'fh)
AR
0,2
0
,4
0,6
0,8
1
1.2
1,4
1,6
Mea
n po
st-g
laci
al
detr
ital v
alue
-o
.47
2 30'f
h (d
pm.g
·')
0.5
1 1,
5 2
2,5
3 3
,5
4
92
0 5 10
)>
15 c
g H
l ~
ô ~ ,.
20
Q) Ill
.:9
H2
1-25
30
H4
l-35
fTT
TT
J T
1 T
Tf
TT
0 T
l T
l l
T)T
TT
TJT
TT
Tf,.
,-T
rp
TT
Tl
11
11
11
""
11
"1
""
11
11
11
11
11
\ prrTJT'.--.T'~'i
1111
j1111
/11~
0.1
0,2
0
,3
0,4
0
,5
2 4
6 8
10
12
14
0.85
0
,9
0,9
5 1
1,05
1.
1 1,
15
0 0
,1
0.2
0,3
0.
4
(U/T
h) m
ass
ratio
T
h co
ncen
trat
ion
(IJg.
g·')
(2
34U
f238U
)AR
23'P
a (d
pm.g
·')
Fig
ure 5
-U
-, T
h-an
d P
a-co
ncen
trat
ions
, m
ass
and
act
ivit
y ra
tios
vs
age.
Fro
m l
eft
to r
ight
: (U
/Th
) m
ass
· u
· T
h
· U
/Th
·
· ·
234U
/238
U
· ·
· 23
üTh
. .
23Ip
ra
tio;
-c
once
ntra
tiOn
; -c
once
ntra
tiO
n;
acti
vity
rat
io;
acti
vity
rat
w;
acti
vity
; a
acti
vity
. D
ata
poin
ts a
re r
epre
sent
ed w
ith
thei
r ±
1cr
ana
lyti
cal
unce
rtai
nty.
Th
e gr
ay h
oriz
onta
l in
terv
als
corr
espo
nd t
o th
e ra
pidl
y de
posi
ted
Hei
nri
ch l
ayer
s an
d to
the
sed
imen
t la
yer
asso
ciat
ed w
ith
the
fina
l dr
aina
ge o
f L
ake
Ag
assi
z. T
he
dash
ed !
ines
cor
resp
ond
to b
ound
arie
s be
twee
n th
e th
ree
oce
anic
reg
imes
: gl
acia
l, d
egla
cial
and
pos
t-gl
acia
l (s
ee t
ext
for
expl
anat
ions
). A
s th
e de
trit
al c
arbo
nate
con
tent
is
high
ly
vari
able
in
th
e gl
acia
l-de
glac
ial
part
of
the
sequ
ence
, U
-an
d T
h-co
ncen
trat
ions
w
ere
conv
erte
d in
to
carb
onat
e-fr
ee s
edim
ent
for
thes
e in
terv
als,
as
foll
ows:
Dca
rbon
ate-
free
sedi
men
t= (
U*
1 00)
/(1
OO
-dw
%C
aC0
3) ;
Th
carb
onate
-free
sed
imen
t= (
Th*
1 O
O)/
(lO
O-d
wü/
oCaC
03)
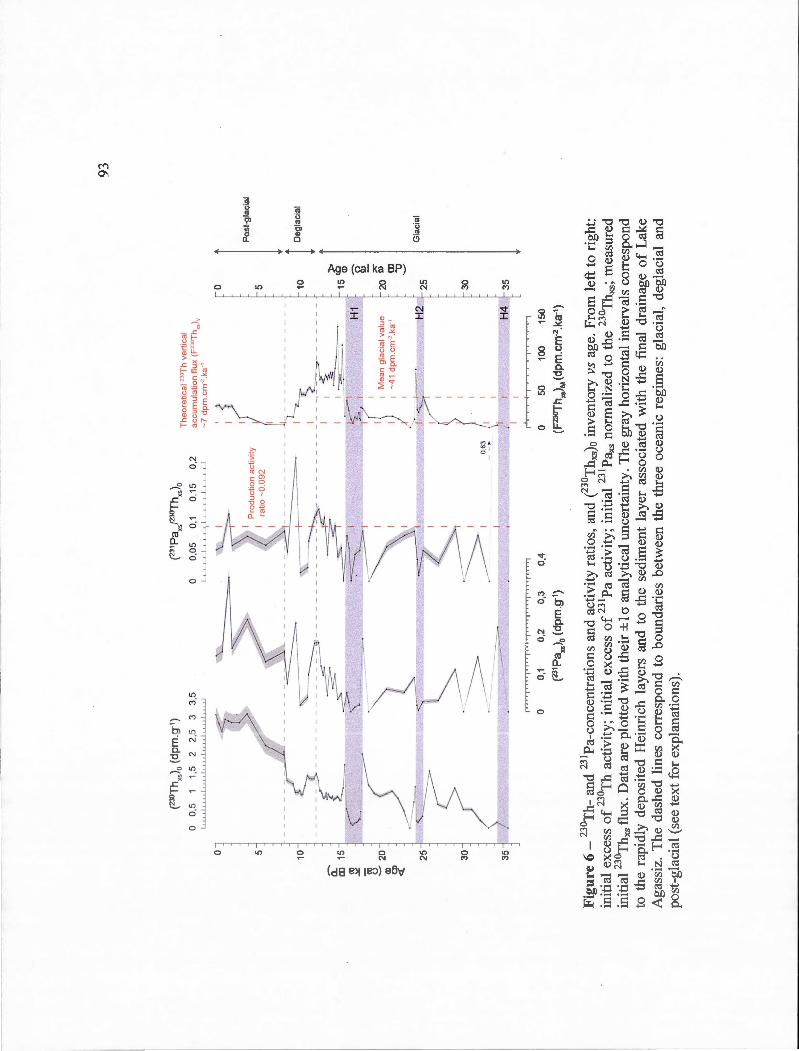
0 5 10
â:'
CI)
15
C
il ~
rn
u ~ 2
0
Q)
Cl
<(
25
30
35
(230
Thx
s)0
(dpm
.g· 1
)
0 0
,5
1 1,
5 2
2,5
3
3,5
(231 P
axsf2
30Th
xs>o
0 0
,05
0
,1
0,1
5 0
,2
1 1
1 1
1 1
1 1
1 ~
1 1
1 1
1 1
1 1
1 1
Pro
duct
1on
act
iv1ty
1
rat1
o -
0.0
92
0.63
-· rT
TT
Tfi
1 i
0 ji ii
lj
ll
iij
i 1 li ji j
j ij
i i ji
jii
j ij
0 0
,1
0,2
0
,3
(231
pax
.>o
(dpm
.g-1)
0,4
Th
eo
ret1c
al 2
'"T
h ve
rtic
al
acc
um
ula
tio
n f
lux
(F""
Th.,
)v
-7
dp
m.c
m·2
.ka
·1
1 <
5 0
1 '""' '"
"" 10
I Oe
gla
cia
l
)>
15 ~
H1
~ ô ~
:><"
M
ea
n g
laci
al
valu
e
~20 ~
-41
dp
m.c
m2.k
a 1
3 H
2 ·t
-2
5
J G
lac
ial
30
!t 1
~ 1
\t
1
1 1
H4
[
35
1
1
,-'r
-r-
0 5
0
100
150
(P30
Thxs
)M (
dpm
.cm
-2.k
a-1 )
Fig
ure 6
-23
0 Th-
and
231 P
a-co
ncen
trat
ions
and
act
ivit
y ra
tios
, an
d CZ
30T
hxs)o
inv
ento
ry V
S ag
e. F
rom
lef
t to
rig
ht:
init
ial
exce
ss o
f 23
0 Th
activ
ity;
ini
tial
exc
ess
of
231P
a ac
tivi
ty;
init
ial
231P
axs
norm
aliz
ed t
o th
e 23
0 Thx
s; m
easu
red
init
ial
230 T
hxs f
lux
_ Dat
a ar
e pl
otte
d w
ith
thei
r ±
la a
naly
tica
l un
cert
aint
y. T
he g
ray
hori
zont
al i
nter
vals
cor
resp
ond
to t
he r
apid
ly d
epos
ited
Hei
nric
h la
yers
and
to
the
sedi
men
t la
yer
asso
ciat
ed w
ith
the
fina
l dr
aina
ge o
f L
ake
Aga
s siz
_ T
he d
ashe
d li
nes
corr
espo
nd t
o bo
unda
ries
bet
wee
n th
e th
ree
ocea
nic
regi
mes
: gl
acia
l, d
egla
cial
and
po
st-g
laci
al (
see
text
for
exp
lana
tion
s).
93
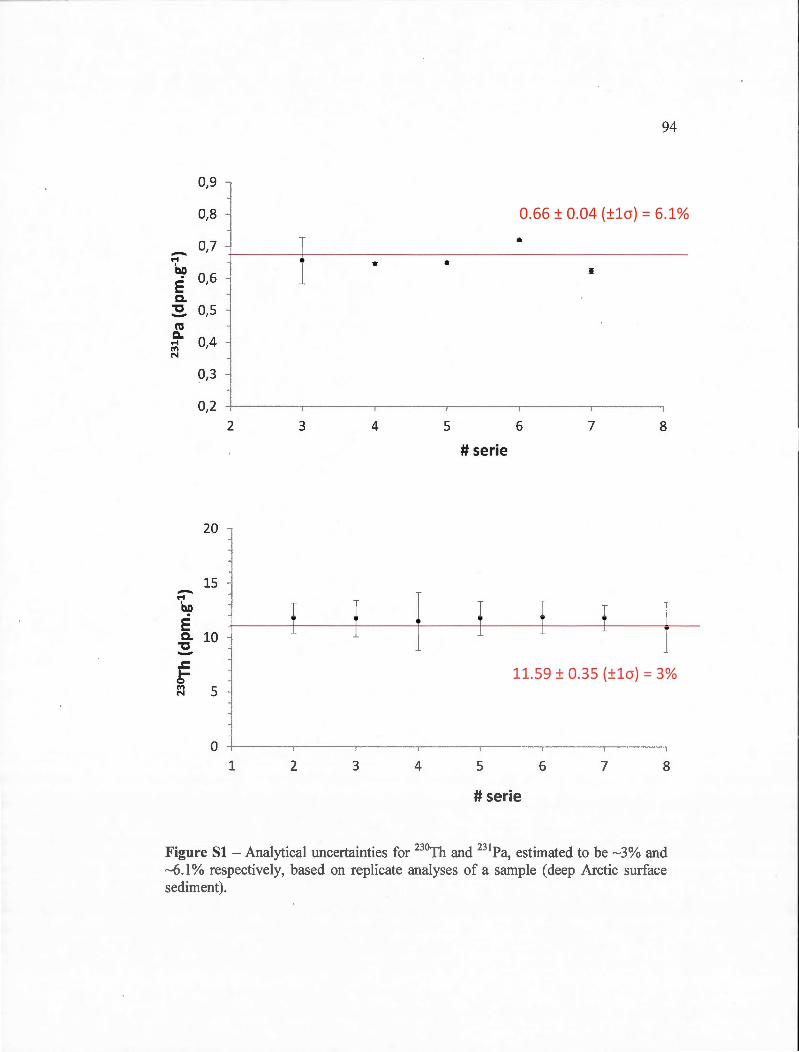
94
0,9
j 0,8 0.66 ± 0.04 (±1cr) = 6.1%
0,7 • -.-1 • • ~ 0,6 l[
E Q,
"tt 0,5 -ta c.. 0,4 .-1
"" N
0,3
0,2 2 3 4 5 6 7 8
#serie
20 i
15 -.-1
~ E
l Q, 10 "tt -.J:
11.59 ± 0.35 (±1cr) = 3% ~ 0
"" 5
1 N
0 --,
1 2 3 4 5 6 7 8
#serie
Figure Sl - Analytical uncertainties for 230Th and 231Pa, estimated to be ~3% and ~6.1% respective! y, based on replicate analyses of a sample ( deep Arctic surface sediment).
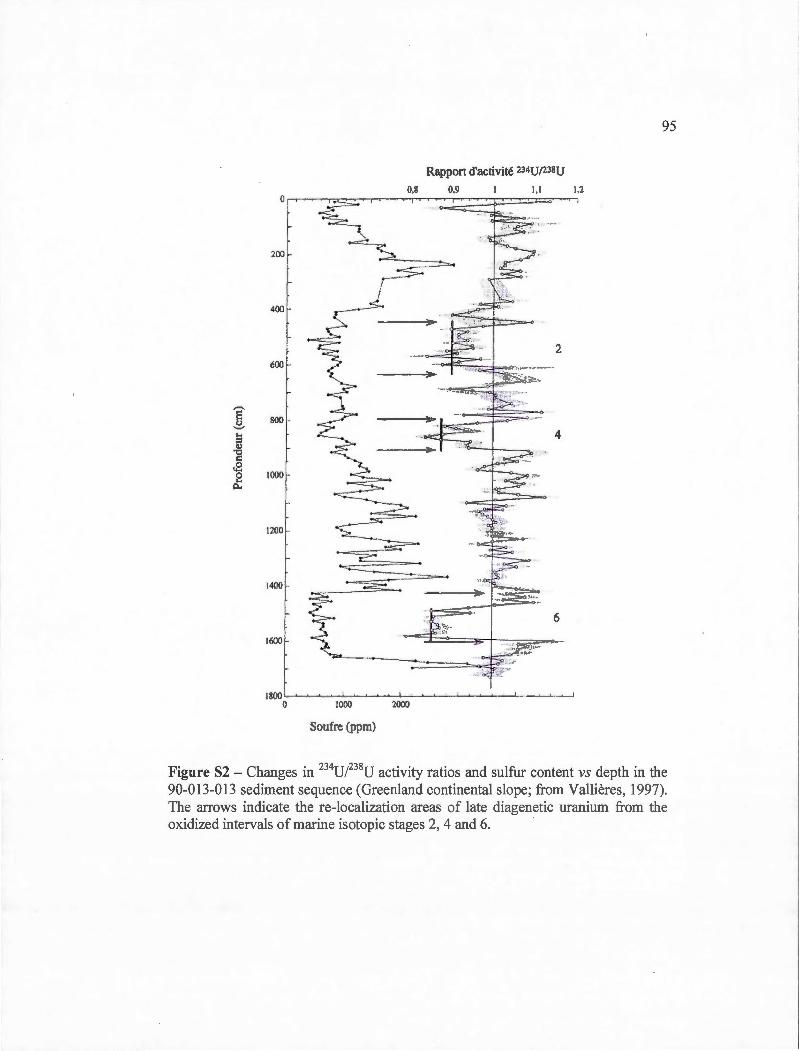
95
Rappon d'activité 234Uf23SU
400
2 600
s <.J 800 ._.. ... 4 ;::l Q)
"C c .8 e 1000 Q.,
1200
1400 -~ .
t 6
1600
-1800
0 1000 2000
Soufre (ppm)
Figure S2 -Changes in 234U/238U activity ratios and sulfur content vs depth in the 90-013-013 sediment sequence (Green land continental slope; from Vallières, 1997). The arrows indicate the re-localization areas of late diagenetic uranium from the oxidized intervals of marine isotopie stages 2, 4 and 6. ·
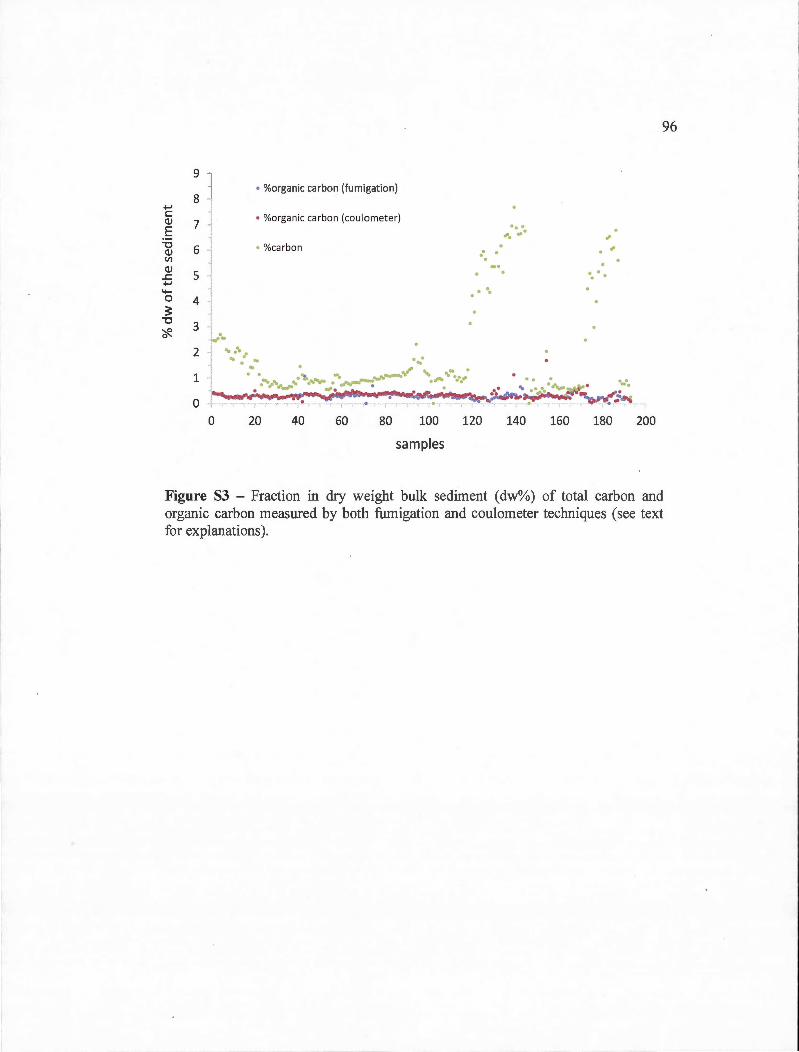
9
8 +-> c Cl) 7 E
"'0 6 Cl) V)
Cl)
5 ..c +-> ...... 0 4 ~
"'0 3
'*' 2
1
0
~
! • ,.,.
• %organic carbon (fumigation)
• %organic carbon (coulometer)
• %carbon
1 ~ ... , 1 .. • .. • ...
•·. . .. . · .
... '· ... ,
,
.. . .
... · .... , ... _ ...... ~ ..... ~..,.-"" '.,.. ... -... _,· . . . : .•.• • *"• .... • •• ' •••• ""-' ............................... ..,....% .• Ci'~~ .... ~--~-
0 20 40 60 80 100 120 140 160 180
sam pies
96
200
Figure S3 - Fraction in dry weight bulk sediment (dw%) of total carbon and organic carbon measured by both fumigation and coulometer techniques (see text for explanations ).
CONCLUSION GÉNÉRALE
La présente recherche s' est attardée à l'étude des sédiments profonds du Quaternaire
récent provenant de la baie de Baffm et de la mer du Labrador. L'objectif était
d'évaluer précisément la dynamique sédimentaire passée de ces deux bassins
océaniques localisés en zone de marges continentales, afin d'obtenir une information
originale en ce qui a trait à l'évolution de l'océanographie et de la dynamique
glaciaire de la région au cours du dernier cycle glaciaire. Pour y parvenir, nous avons
choisi d'utiliser les séries de l' U et du Th, plus particulièrement des isotopes de l'U,
du Th et du Pa, trois éléments chimiques de la famille des actinides. En effet, dans les
études sédimentologiques, leurs propriétés physico-chimiques intrinsèques offrent la
possibilité d'aborder les mécanismes de mobilisation géochimique ayant lieu dans le
sédiment, fournissant des infmmations essentielles sur les processus sédimentaires et
les conditions du milieu, mais également sur les flux particulaires entraînés par les
masses d'eau et les processus sédimentaires des marges océaniques. Les deux
chapitres développés ont mis en évidence que, lorsque combinés à une approche
multi-paramètres, ces isotopes pouvaient constituer de très bons outils pour acquérir
des informations sur les conditions environnementales passées. Il a été vu que leur
mise en application dépendait du milieu considéré, du type de matériel étudié, de la
période examinée et des objectifs poursuivis.
Le premier chapitre de cette thèse portait sur les sédiments provenant de la plaine
abyssale centrale de la baie de Baffin et datés des derniers ~ 11 5 ka. Les études
sédimentologiques de cette partie de la baie s'étaient vues restreintes jusque très
récemment (Simon et al., 2012), par le manque de marqueurs temporels. Pourtant, la
baie de Baffm constitue une région essentielle à intégrer dans la recherche en
paléoclimatologie/paléocéanographie étant donné sa localisation centrale par rapport
aux grandes masses de glace et son rôle de bassin de transition entre l 'océan Arctique
et Atlantique. Ici, une chronostratigraphie établie récemment par Simon et al. (2012)
98
a permis d'étudier pour la première fois en haute résolution le compotiement des
isotopes de l'U et du Th dans ce bassin, l'unique étude antérieure ayant dû rester très
partielle par manque d'information à ce sujet (voir Causse et Hillaire-Marcel, 1989).
Les compositions isotopiques en U et en Th permettent d' évaluer les sources, les flux
et les processus géochimiques et sédimentaires. Toutefois, 1 'interprétation des
signaux géochimiques en baie de Baffm s' est avérée peu aisée, principalement parce
que la dynamique sédimentaire est complexe. Les concentrations et rapports
d'activité U et Th ont mis en évidence des sources variées de sédiments détritiques,
probablement liées à des décharges locales spécifiques à la dynamique des . trois
calottes de glace entourant la baie. Les faibles contenus en carbone organique
enregistrés, l' absence de flux d'U diagénétique précoce et le signal de Mn rendent
compte d'une faible productivité biologique passée de la colonne d'eau et de la
persistance de conditions oxydantes dans les sédiments de surface, y compris durant
l'Holocène. Des micro-gradients rédox établis le long de la séquence pourraient
cependant avoir entraîné des remobilisations d'U diagénétiques tardives, générant
notarnrnent des incertitudes quant à l'estimation des valeurs du e30Thxs)o. Ces
données au sujet du e30Thxs)o semblent par ailleurs indiquer qu 'au flux particulaire
relativement abondant qui caractérise la période glaciaire se superpose des processus
de ''focusing", c'est-à-dire de redistribution sédimentaire syn- ou post-dépôt. A
l' opposé, durant l' interglaciaire actuel, une perte par advection du 230Thxs laisse croire
à une circulation de la masse d'eau profonde et à l'exportation partielle de 230Thxs,
s' effectuant très probablement à travers le courant de débordement du détroit de
Davis vers la mer du Labrador.
Le deuxième chapitre de cette thèse portait sur l'analyse d'une séquence sédimentaire
prélevée sur le bas du talus océanique du bassin du Labrador, proche de la sortie du
détroit d'Hudson, et datée des derniers ~3 7 cal ka BP. L'étude se focalisait sur deux
thèmes : (i) les processus sédimentaires régissant la mise en place des couches
99
relatives aux évènements de Heinrich H2 et Hl et, (ii), la circulation océanique dans
cette région de formation des eaux profondes froides, un des mécanismes majeurs de
la boucle de circulation méridienne de renversement caractérisant l'océan Atlantique
Nord.
L'utilisation des inventaires de e30Thxs)o s'était déjà révélée fructueuse pour estimer
les vitesses de dépôts des couches relatives aux évènements de Heinrich à un site
localisé plus au sud, à Orphan Knoll (Veiga-Pires et Hillaire-Marcel, 1999). Il
s'agissait ici d'explorer à l'aide des mêmes outils un site d'étude localisé plus près de
la sortie du détroit d'Hudson. Cette proximité permettait de recouvrir l'entièreté de
l'intervalle, incluant les particules fines provenant de l'eau de fonte sous-glaciaire et
le sédiment grossier largué par la fonte des icebergs. Cependant, des incertitudes ont
été mises en évidence, rendant 1 ' erreur sur 1 'estimation des vitesses de dépôt trop
large et donc peu fiable.
Ensuite, il s'agissait d'utiliser le rappm1 ( 31 Pax/30Thxs)o pour évaluer l'évolution du
débit des masses d'eau intermédiaires et profondes dans le bassin. Cependant, il a été
montré que les flux en sédiment y sont complexes suite à la localisation : (i) en zone
de marge continentale, proche du détroit d'Hudson, source majeure en icebergs et
eaux sous-glaciaires lors d'épisodes de fonte de la calotte de glace des Laurentides, et
(ii) en situation de confluence des différents courants en provenance de l'Atlantique
du Nord-Est et de la baie de Baffm. Des flux importants de ( 30Thxs)o ont été estimés
dans certains intervalles et suggèrent des processus d'advection ou de "focusing'.
Ceux-ci sont spécialement élevés durant la période de déglaciation pour laquelle des
flux détritiques massifs ont été reportés. Par ailleurs, le processus semble s'accélérer
durant la deuxième moitié de l'Holocène, mais est cette fois probablement lié à la
production de carbonates biogéniques. Par ailleurs, il a été montré que le sous-courant
côtier de l'ouest pouvait avoir été suffisamment puissant pour avoir exporté le 231Pa
hors du bassin durant la majorité de l'intervalle étudié.
100
De manière générale, l'étude des sédiments profonds de bassins océaniques localisés
en zone de marges continentales comporte des difficultés étant donné les flux
sédimentaires et géochimiques complexes y opérant. Les données isotopiques en U,
Th et Pa constituent des outils très puissants pour étudier la dynamique sédimentaire
et sont peu documentés dans les régions de hautes latitudes. La large variabilité des
sources et des flux, tant spatialement que temporellement, enregistrée dans les
séquences étudiées est fortement liée à la dynamique glaciaire spécifique opérant le
long des marges continentales. De plus, les remobilisations particulaires syn- et post
sédimentaires sont fréquentes le long des marges de ces bassins et peuvent induire de
nouveaux échanges géochimiques. La diffusion d'U à la suite de processus
diagénétiques précoces et tardifs semble également se produire dans les séquences
étudiées et peuvent influencer les signaux géochimiques originaux. Par ailleurs, des
processus de diagénèse précoce semblent opérer dans les sédiments superficiels de la
mer du Labrador, au contraire de la baie de Baffm. Cela s'expliquerait principalement
par une productivité primaire très différente pour ces deux bassins.
Une fois tous les processus bien identifiés et dans la mesure du possible quantifiés,
les excès initiaux de 231Pa et de 230Th peuvent être utilisés comme traceurs de la
dynamique géochimique et particulaire. Dans ce cadre, les résultats obtenus sur la
séquence prélevée en baie de Baffm ont montré deux situations océanographiques
contrastées entre la dernière période glaciaire et l' Holocène. En mer du Labrador par
contre, les données de CZ31Pa/230Thxs)o indiquent qu 'un courant profond fût
suffisamment puissant pour exporter le 231Pa de manière continue durant les derniers
- 37 cal ka BP.
Des mesures de plus hautes résolutions dans les sédiments des deux bassins
pourraient apporter des précisions supplémentaires . Cependant, des données d'autres
traceurs géochimiques, tel le béryllium, en baie de Baffm notamment, l'analyse de
métaux rédox-sensibles (e.g. , manganèse) en mer du Labrador, et des mesures des
101
gradients rédox lors des carottages, poWTaient s'avérer plus utiles pour compléter et
valider les interprétations présentées dans cette thèse.
En défmitive, en améliorant les connaissances et en démontrant 1' efficacité des
méthodes utilisées pour des problématiques spécifiques, ce travail contribue aux
recherches paléoclimatiques et paléocéanographiques actuelles, tout en concourant au
développement d'une base d'infmmation à portée plus globale.
ANNEXE A
AUTHIGENIC, DETRITAL AND DIAGENETIC MINERALS
IN THE LAGUNA POTROK AIKE SEDIMENT SEQUENCE
Laurence Nuttin 1'2
, Pierre Francus2'3
, Michel Preda\ Bassam Ghaleb 1
'2 and Claude Hillaire-Marcel 1
'2
1Université du Québec à Montréal CP. 8888, Suce. Centre-Ville, Montréal, QC, H3C 3P8, Canada
2GEOTOP Research Center C.P. 8888, Suce. Centre-Ville, Montréal, QC, H3C 3P8, Canada
3Institut National de la Recherche Scientifique - Centre Eau, Terre, Environnement 490 rue de la Couronne, Québec, QC, G lK 9Q9, Canada
Keywords: XRD, clays, U-Th measurements, vivianite, paleoclimat , late Quaternary, Argentina, ICDP-PASADO
Article publié dans Quaternary Science Reviews (20 13), 71, 109-118.
103
Abstract
The ~lOO rn-long Laguna Potrok Aike sediment sequence yielded a record spanning
the Last Glacial period to the Holocene. This paper presents and discusses two
aspects of the mineral ogy of the lake. The frrst aspect is based on a semi-quantitative
X-ray diffraction analysis of bulk and clay mineralogical assemblages. Minor
mineralogical changes are observed throughout the glacial section suggesting
relatively uniform sediment sources. The transition into the Holocene is characterized
by increasing fluxes of endogenic calcite thought to relate to lower lake levels. The
second aspect is based on analysis of uranium-series disequilibria in diagenetic
vivianite from the glacial section. U-series ages were expected to yield minimum ages
for the host-sediment. Unfortunately, very little authigenic U is present in vivianite
grains. The low primary productivity of the lake and thus low organic carbon fluxes
might have prevented the development of strong redox gradients at the water
sediment interface and thus reduced diagenetic U-uptake into the sediment. One
vivianite sample, at a 56.9 rn composite depth, yielded enough authigenic uranium to
calculate a 230Th-age of 29.4 ± 5.9 ka (± 2o). This age is younger than the one
indicated by the radiocarbon chronology. lt is thus concluded that a relatively late
diagenetic evolution of the U-Th system characterizes the recovered vivianite
minerais. The authigenic U displays a very high excess in 234U (over 238U) with an
activity ratio of 4.58 ± 0.58 (± 2o). It suggests that it originates from the transfer of
highly fractionated U from swTounding detrital minerais through very low V-content
pore waters.
104
A.l . Introduction
Laguna Potrok Aike (51 °58 ' S, 70°23' W in south-eastern Patagonia, Argentina) is
one of the older maars of the Pali Aike Volcanic Field (PA VF), which is the most
extensive maar field in South America. A ~200 km2 watershed contains a quasi
circular bowl-shaped crater ~5 km in diameter filled by a lake of ~ 100 rn depth and
~3.5 km width (Zolitschka et al., 2009). The crater was formed by an explosive
eruption of rising magma contacting ground water, meltwater from ground ice or
permafrost (Corbella, 2002; Figure 1 ). 40 Ar;39 Ar data of a basaltic clast from the
phreatomagmatic tephra outcropping on the eastern si de of the maar provided an age
of0.77 ± 0.24 Ma for the event (Zolitschka et al. , 2006; Figure 1). Seismic sm·veys
indicate an exceptionally thick lacustrine sediment infill (up to 370 rn in thickness)
likely underlain by volcanoclastic deposits (Anselmetti et al., 2009; Gebhardt et al.,
2011) which seemed to be protected from glacial erosion, deflation or desiccation
(Zolitschka et al., 2006). Therefore, Laguna Potrok Aike has the potential to preserve
a continuous and high-resolution late Quaternary sediment record suitable to extract a
long paleoenvironrnental reconstruction for the Southern Hemisphere (Anselmetti et
al. , 2009; Haberzettl et al., 2007; Zolitschka et al., 2006).
The Potrok Aike Maar Lake Sediment Archive Drilling Project (PASADO) was thus
undertaken within the framework of the International Continental Scientific Drilling
Program (ICDP). From the available material, a ~ 100 rn-long composite record from
the southern part of the lake was investigated using multiple tracers ( Ohlendorf et al.,
2011). Our contribution to this project is twofold. First, using semi-quantitative X-ray
diffraction analyses, we investigated mineralogical changes in arder to document
potential changes in sail hydrolysis conditions and in sediment sources through tirne,
since minerais might reflect weathering conditions in the watershed ( e.g., Cham ley,
2000; Last, 2001 ; Moore and Reynolds, 1997; Thorez, 2003 ; Velde, 1992). Second,
we analyzed U-series isotopes in authigenic and/or early diagenetic vivianite
105
[Fe3(P04) 2.8H20], present at severa! depths in the composite sequence. High uranium
concentrations were indeed reported in vivianite from similar settings (e.g., Lake
Baïkal; Fage! et al. , 2005). Here, the objective was to elaborate 230Th-ages for this
diagenetic mineral, as successfully done in a large array of diagenetic minerais from
East African Lakes by Goetz and Hillaire-Marcel (1992).
106
A.2. Regional settings
The lake is located at 113 rn above sea level(lake lev el in 2003 ; Ohlendorf et al. ,
2011) in the older western part of the PA VF, ~300 km east of the Andes, ~85 km
west of the city of Rio Gallegos and ~80 km north of the Strait of Magellan. The
PAVF consists ofPliocene (3.8 Ma) to Holocene (0.01 Ma) alkali-olivine basalts in a
back-arc type of volcanism (Corbella, 2002). Scoria cones and plateau lavas formed
during Late Miocene to Middle Pleistocene times are found in the catchment area
(Coronato et al. , this issue) as well as fine-grained molasse-type fluvial sandstones of
the Lower Miocene Santa Cruz formation. Furthermore, Pleistocene glaciations left
behind fluvioglacial deposits and tills dated between 1.2 and 0.8 Ma (Zolitschka et
al. , 2006). lt seems that glaciers did not reach the catchment area du ring the last few
glaciations (Coronato et al. , this issue; Mercer, 1976; Rabassa and Clapperton, 1990).
Laguna Potrok Aike is currently polymictic due to the strong southern hemispheric
westerly winds (mean annual wind speed of ~ 7.4 mis; Zolitschka et al. , 2006). This
setting prevents the development of any ice cover during the austral winter and
generates a non-stratified water column with oxygen-rich bottom waters. Today,
subsaline conditions induce low productivity. The mean annual temperature recorded
at the meteorological station of Rio Gallegos is 7.4°C (Zolitschka et al. , 2006). Air
masses passing over the Patagonian Andes produce a strong rainfall gradient from
west to east and trigger semi-arid conditions in the Laguna Potrok Aike region with
annual precipitation below 200 mm (Zolitschka et al. , 2006). However, precipitation
was highly variable during recent millennia and mainly related to northward and
southward shifts of the westerly winds (Zolitschka et al. , 2009). Today rainfalls are
more often associated with easterly winds whereas westerly winds deliver fewer
precipitations.
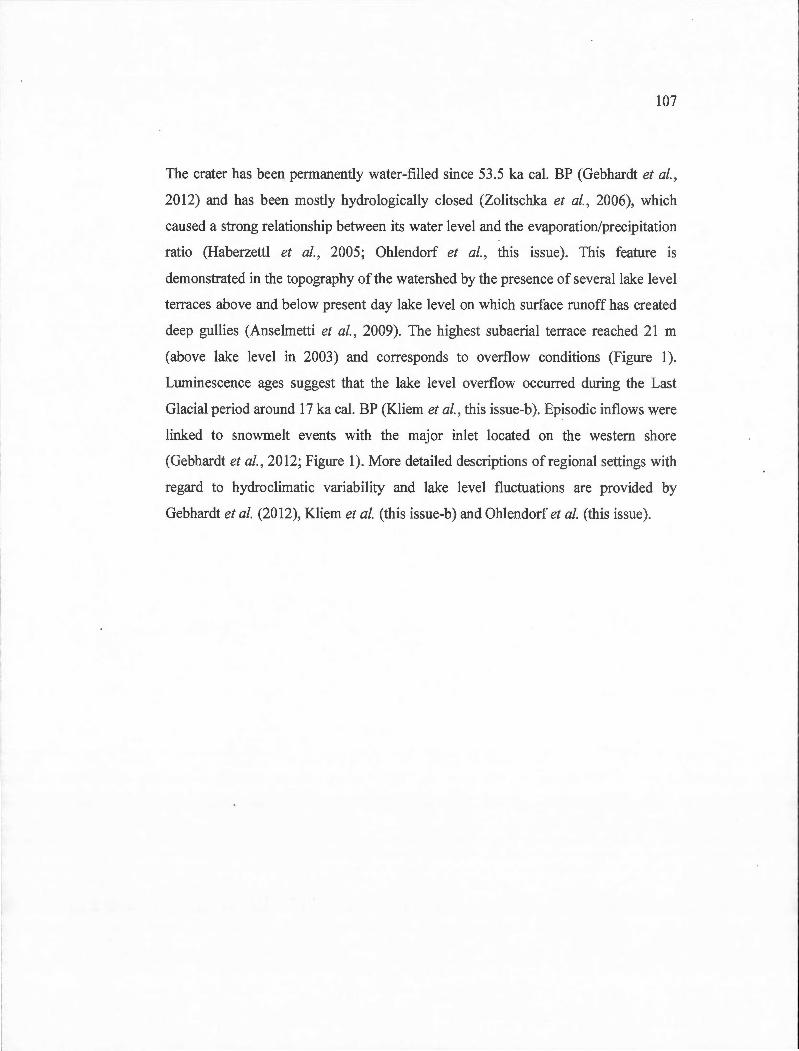
107
The crater has been permanently water-filled since 53 .5 ka cal. BP (Gebhardt et al.,
2012) and has been mostly hydrologically closed (Zolitschka et al. , 2006), which
caused a strong relationship between its water level and the evaporation/precipitation
ratio (Haberzettl et al., 2005; Ohlendorf et al. , this issue). This feature is
demonstrated in the topography of the watershed by the presence of severa! lake lev el
terraces above and below present day lake leve] on which surface runoff has created
deep gullies (Anselmetti et al. , 2009). The highest subaerial terrace reached 21 rn
(above lake leve] in 2003) and corresponds to overflow conditions (Figure 1).
Luminescence ages suggest that the lake leve] overflow occurred during the Last
Glacial period around 17 ka cal. BP (Kliem et al. , this issue-b ). Episodic inflows were
linked to snowmelt events with the major inlet located on the western shore
(Gebhardt et al. , 20 12; Figure 1 ). More detailed descriptions of regional settings with
regard to hydroclimatic variability and lake leve! fluctuations are provided by
Gebhardt et al. (2012), Kliem et al. (this issue-b) and Ohlendorf et al. (this issue).
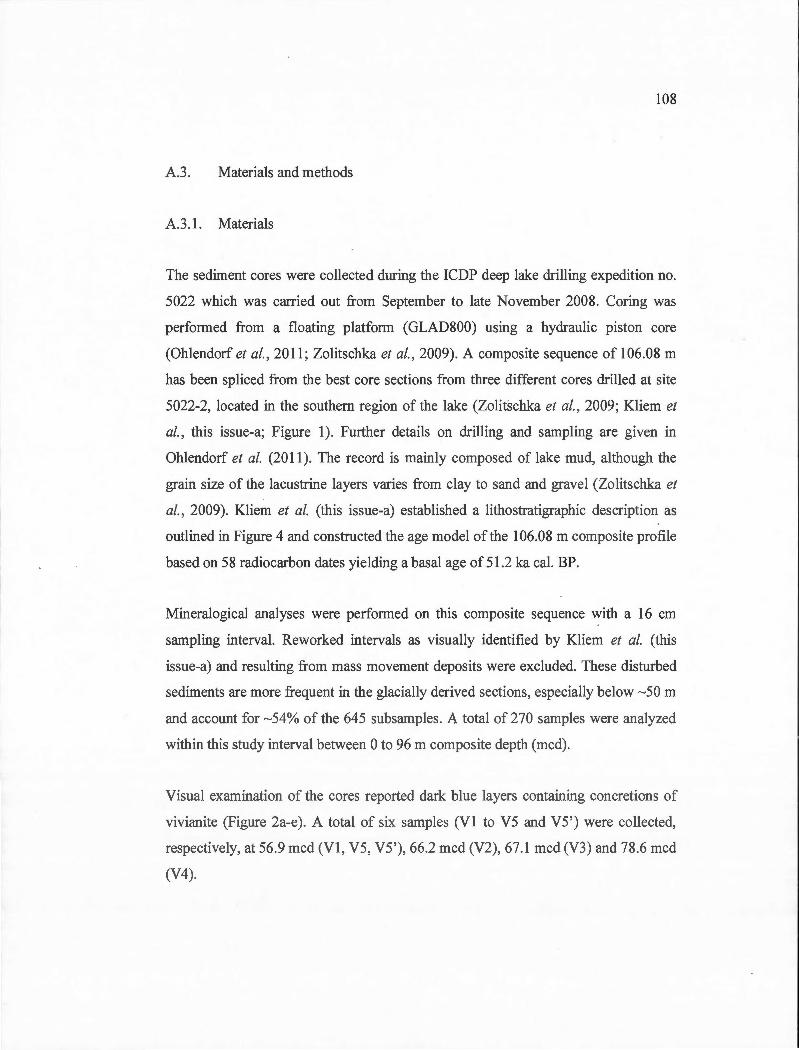
108
A.3. Materials and methods
AJ.l. Materials
The sediment cores were collected during the ICDP deep lake drilling expedition no.
5022 which was carried out from September to late November 2008. Coring was
performed from a floating p1atform (GLAD800) using a hydraulic piston core
(Ohlendorf et al., 2011; Zo1itschka et al., 2009). A composite sequence of 106.08 rn
has been spliced from the best core sections from three different cores drilled at site
5022-2, located in the southem region of the lake (Zolitschka et al., 2009; Kliem et
al., this issue-a; Figure 1). Further details on drilling and sampling are given in
Ohlendorf et al. (2011). The record is mainly composed of lake mud, although the
grain size of the lacustrine layers varies from clay to sand and gravel (Zolitschka et
al., 2009). Kliem et al. (this issue-a) established a lithostratigraphic description as
outlined in Figure 4 and constructed the age mode! of the 106.08 rn composite profile
based on 58 radiocarbon dates yielding a basal age of 51.2 ka cal. BP.
Mineralogica1 analyses were performed on this composite sequence with a 16 cm
sampling interval. Reworked intervals as visually identified by Kliem et al. (this
issue-a) and resulting from mass movement deposits were excluded. These disturbed
sediments are more frequent in the glacially derived sections, especially below ~50 rn
and account for ~54% of the 645 subsamples. A total of 270 samples were analyzed
within this study interval between 0 to 96 rn composite depth (mcd).
Visua1 examination of the cores reported dark blue layers containing concretions of
vivianite (Figure 2a-e). A total of six samples (Vl to V5 and V5') were collected,
respectively, at 56.9 mcd (Vl , V5, V5 ' ), 66.2 mcd (V2), 67.1 mcd (V3) and 78.6 mcd
(V4).
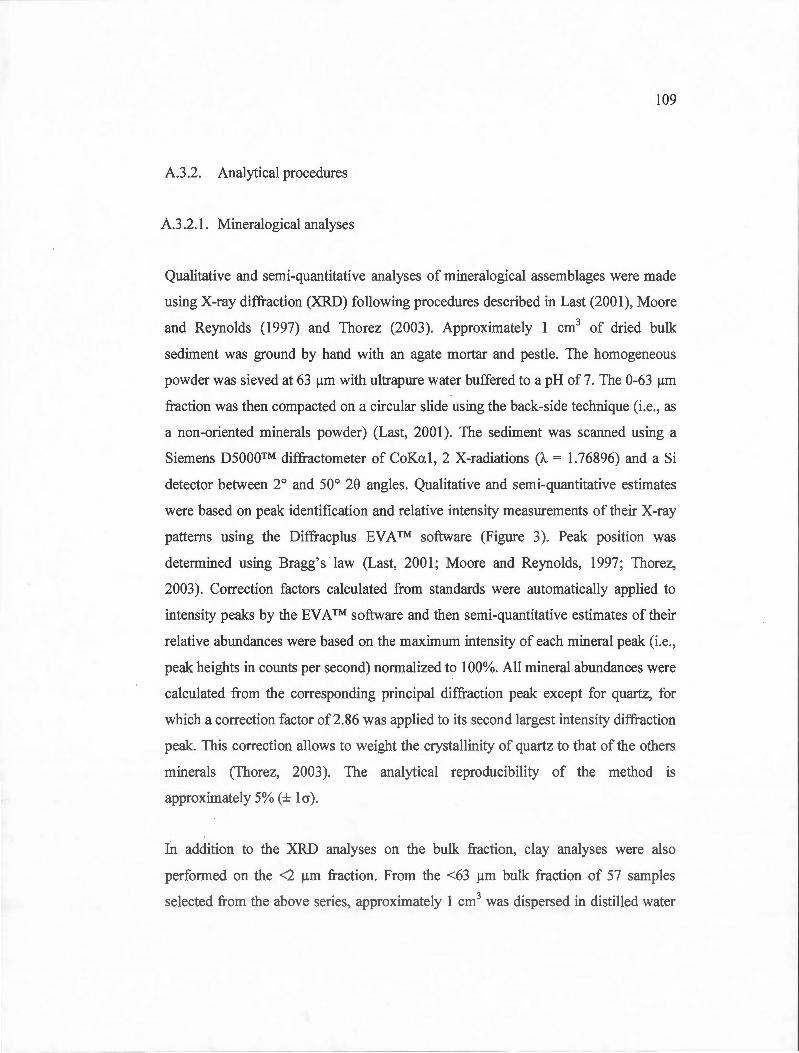
109
A.3.2. Analytical procedures
AJ .2.1. Mineralogical analyses
Qualitative and semi-quantitative analyses of mineralogical assemblages were made
using X-ray diffraction (XRD) following procedures described in Last (2001), Moore
and Reynolds (1997) and Thorez (2003). Approximately 1 cm3 of dried bulk
sediment was ground by hand with an agate mortar and pestle. The homogeneous
powder was sieved at 63 !lm with ultrapure water buffered to a pH of 7. The 0-63 !lm
fraction was then compacted on a circular slide using the back-side technique (i.e. , as
a non-oriented minerais powder) (Last, 2001). The sediment was scanned using a
Siemens DSOOO™ diffractometer of CoKa1, 2 X-radiations (À = 1.76896) and a Si
detector between 2° and 50° 28 angles. Qualitative and semi-quantitative estimates
were based on peak identification and relative intensity measurements of their X-ray
patterns using the Diffracplus EVATM software (Figure 3). Peak position was
determined using Bragg' s law (Last, 2001; Moore and Reynolds, 1997; Thorez,
2003). Correction factors calculated from standards were automatically applied to
intensity peaks by the EVA ™ software and then semi-quantitative estimates of their
relative abundances were based on the maximum intensity of each mineral peak (i.e. ,
peak heights in counts per second) normalized to 100%. Ali mineral abundances were
calculated from the corresponding principal diffraction peak except for quartz, for
which a correction factor of2.86 was applied toits second largest intensity diffraction
peak. This correction allows to weight the crystallinity of quartz to that of the others
minerais (Thorez, 2003). The analytical reproducibility of the method is
approximately 5% (± lcr).
Ill addition to the XRD analyses on the bulk fraction, clay analyses were also
performed on the <2 !lill fraction. From the <63 !lm bulk fraction of 57 samples
selected from the above series, approximately 1 cm3 was dispersed in distilled water
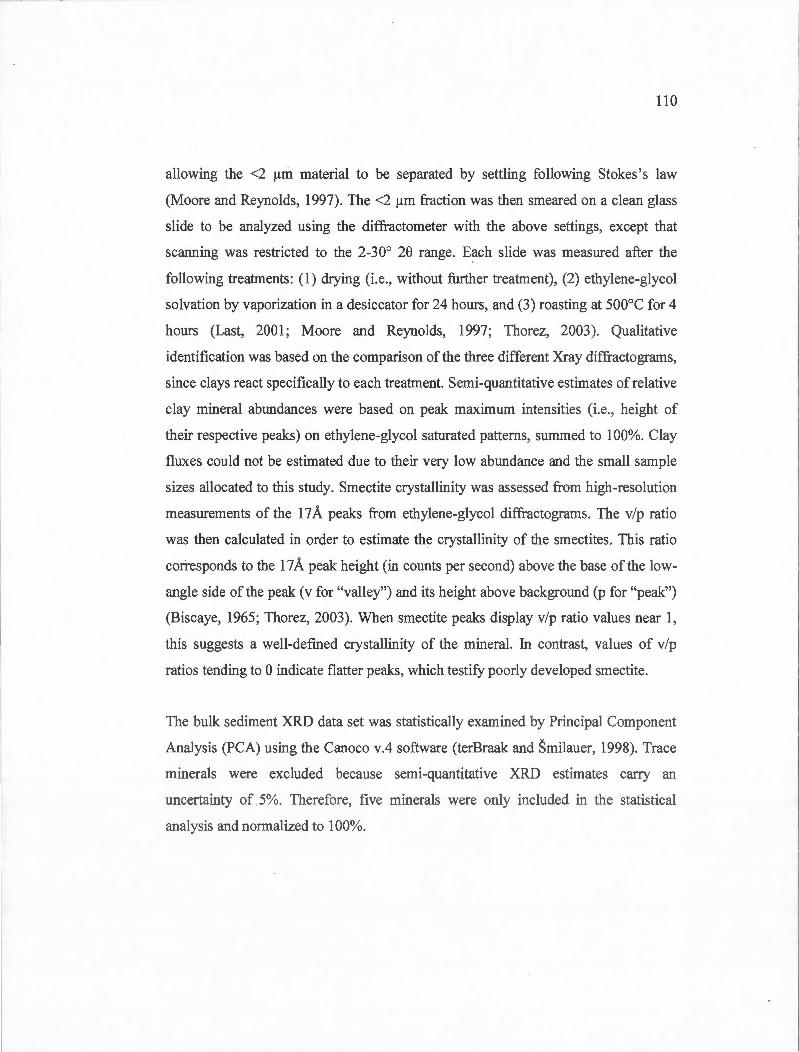
110
allowing the <2 f.lm materia1 to be separated by settling following Stokes 's law
(Moore and Reynolds, 1997). The <2 f.lm fraction was then smeared on a clean glass
slide to be analyzed using the diffractometer with the above settings, except that
scanning was restricted to the 2-30° 28 range. Each slide was measured after the
following treatments : (1) drying (i.e. , without further treatment), (2) ethylene-glycol
solvation by vaporization in a desiccator for 24 hours, and (3) roasting at 500°C for 4
hours (Last, 2001 ; Moore and Reynolds, 1997; Thorez, 2003). Qualitative
identification was based on the comparison of the three different Xray diffractograms,
since clays react specifically to each treatment. Semi-quantitative estimates of relative
clay mineral abundances were based on peak maximum intensities (i.e. , height of
their respective peaks) on ethylene-glycol saturated patterns, summed to 100%. Clay
fluxes could not be estimated due to their very low abundance and the small sample
sizes allocated to this study. Smectite crystallinity was assessed from high-resolution
measurements of the 17 A peaks from ethylene-glycol diffractograms. The v/p ratio
was then ca1culated in order to estimate the crystallinity of the smectites. This ratio
corresponds to the 17 A peak height (in counts per second) above the base of the law
angle side of the peak (v for "valley") and its height above background (p for "peak")
(Biscaye, 1965; Thorez, 2003). When smectite peaks display v/p ratio values near 1,
this suggests a well-defined crystallinity of the mineral. In contrast, values of v/p
ratios tending to 0 indicate flatter peaks, which testify poorly developed smectite.
The bulk sediment XRD data set was statistically examined by Principal Component
Analysis (PCA) using the Canoco v.4 software (terBraak and Smilauer, 1998). Trace
minerais were excluded because semi-quantitative XRD estimates carry an
uncertainty of . 5%. Therefore, five minerais were only included in the statistical
ana1ysis and normalized to 100%.
111
A.3.2.2. U and Th isotope analyses
Vivianite samples V1 to V4 were analyzed in bulk sediment samples (Table 2). The
cohesiveness of vivianite with the host sediment made its separation difficult,
resulting in U and Th isotope analyses on mixed detrital-authigenic samples.
Sample V5 is a centimetric concretion from 56.9 mcd (Figure 2c). It was
ultrasonicated for one hour to remove as much detrital material as possible from its
surface. From this concretion a few grains were hand-picked and analyzed separately.
These grains were referred to as sample V5' (Figure 2d) .
U and Th separation and extraction were perfonned following the analytical
procedures described in Edwards et al. ( 1987). Samples were analyzed on ~ 1 g of
material of the four vivianite-detrital samples (V1 to V4), the entire cleaned
concretion (V5), and ali of the selected grains hand-picked from V5 (V5'). The
samples were heated at 550°C for 2 hours to remove organic matter and facilitate
further treatments. A 233U-236U-229Th spike was added to the samples prior to
anHCI/HN03/HF acid digestion. After this step, samples were dissolved in a HN03
solution. Then, in order to concentrate U and Th, a Fe(OH)3 precipitate was created
by adding a solution of ammonium hydroxide until obtaining a pH between 7 and 9.
The precipitate was recovered by centrifugation and then dissolved in 6M HCl. U and
Th were then separated from other constituents by ion exchange chromatography
using res in columns. A Dowex AG 1 X8 anion exchange resin was used in
combination with ultra-pure H20 and 6M HCl to isolate U and Th respectively. In
order to remove any residual constituents, Th was purified using the same Dowex
AG 1 X8 anion exchange resin, and U using U/TEV A® resin. Finally, measurements
were performed using a Triton Plus™ thermal-ionisation mass spectrometer (TIMS)
in GEOTOP laboratories.
112
A.4. Results
A.4.1. Mineralogical assemblages
Bulk samples reveal that quartz accounts for the largest relative amount with an
average of 57 ± 9% (± la) (Table 1, Figure 3, 4). Feldspar is the second most
abundant mineral with 18 ± 6%, followed by the groups of smectite-chlorite and
kaolinite-chlorite each presenting an average value of 7 ± 5%. These clay minerais
cannot be distinguished in bulk samples because their peaks overlap. Calcite is a
distinct mineral in this sequence: nearly absent in the lower part of the core, it
increases in the upper 15 rn up to values as high as 42% (Figure 4). Trace quantities
(::S 5%) of others minerais, such as amphibole, mica, zeolite and pyroxene have also
been recorded. Cristobalite was observed with an average of 18 ± 7% in eight
samples above 40 mcd (Figure 4). Likewise, monohydrocalcite, the hydrated form of
calcite (CaC03.H20), was found in two intervals: between 9.7 and 9 mcd and
between 8.5 and 6 mcd (Figure 4). Results of the PCA perfonned on bulk samples are
reported in Figure 5. The two first principal components (i .e. , PCl and PC2) account
for 80.2% of the total variance. PCl shows an anti-correlation between calcite (0.91)
and quartz (-0.81) and to a lesser extent feldspar (-0.35). PC2 splits quartz (-0 .51) and
calcite (-0.41) from the clay minerais groups ofkaolinite-chlorite (0.87) and smectite
chlorite (0 .77) whereas the weight of feldspar is not significant ( -0.06). Another way
to report the results obtained from the PCA is to plot the scores of principal
components with depth (or time) in order to highlight synthetic variations throughout
the profile (Figure 6). Results of the two first principal components show a distinct
change at~ 12 ka cal. BP (i.e. , ~ 15 mcd) when calcite became the dominant mineral.
The analysis of the clay fraction ( < 2 )lm) led to the identification of four clay
species. These are smectite with an average of 41 ± 12% (± l a ) in relative abundance
of the total clay fraction, followed by chlorite contributing for 25 ± 8%, illite with 22
113
± 4%, and fmally kaolinite with 12 ± 3%. The histogram of cumulative percentages
of the clay fraction (Figure 7) shows that smectite increases in the upper 15 rn of the
core, whereas chlorite and illite tend to be more abundant in the underlying section.
Kaolinite displays a steady profile throughout the whole sequence except a sharp
increase at ~ 18 mcd ( ~26% ). Moreover, smectite is mainly well crystallised with a
v/p ratio average of 0.5 and a slight increase in the Holocene with values as high as
0.9 (Figure 7).
A.4.2. U and Th data
In order to confmn the visual identification of vivianite (Figure 2a-e), we petformed
complementary XRD and scanning electron-microscope energy-dispersive
spectroscopy (SEM-EDS) analyses on bulk vivianite (Vl to V4). XRD analyses
revealed the presence ofvivianite (d(001)=6.73 A) accounting for 1 to 3% in relative
abundance of bulk samples (Figure 8), and SEM-EDS measured high percentages of
Fe and Pin the grains (Figure 9).
The concentrations and activity ratios of U and Th obtained from the geochemical
analyses on the vivianite concretion (V5), the isolated grains (V5') and the four
vivianite-detrital samples (V 1 to V 4) are listed in Table 2. Contt·ary to expectations,
the vivianite samples do not show high U concentrations as recorded in the vivianite
from Lake Baikal (total U concentrations between 0.82 and 260 llg g- 1; Fage! et al.,
2005). U concentrations in the mixed detrital-authigenic samples are s1ightly above 1
llg g- 1 for samples V1 to V4. The ' cleaned' vivianite concretion (V5) and the selected
grains (V5') display much lower U concentrations, with values of 0.286 ± 0.001 and
0.213 ± 0.001 llg g-1 respective1y, thus indicating that most of the U present in the
mixed samples might be simply inherited with detrital fractions. In contrast, Th
concentrations are relatively high, with values averaging 5 IJ.g g- 1 for samples V1 to
114
V 4. The Th values for the concretion and the selected grains are much lower with
values around 1 !J.g i 1, still indicating sorne contamination by detrital material.
115
A.5. Discussion
A.5.1. Paleoenvironmental changes
Mineralogical abundances (Figure 4, 7) and principal component score plots (Figure
6) indicate a marked change at ~15 mcd which corresponds to ~12 ka cal. BP based
on the age-depth mode! (Kliem et al. , this issue-a). As already discussed in earlier
studies ( e.g., Haberzettl et al. , 2007; Zolitschka et al. , 2009), this change cotTesponds
to the transition from glacial to interglacial conditions. Calcite is consistently absent
or in very low quantities prior to 12 ka cal. BP whereas it is almost always present in
relatively large amounts after 12 ka cal. BP (Figure 4). As no carbonaceous rocks are
present in the watershed, the Ca2+ ions in the lake water mostly originate from the
weathering of basaltic rocks in the catchment area (Haberzettl et al. , 2005). These
authors also concluded that calcite precipitation occurred during phases of a low lake
leve! or lake leve! lowering when calcite saturation was reached in the water column.
Accordingly, no calcite precipitation occurred when the lake leve! was rising or was
high, reflecting the dilution of the water column. Cold temperatures of the glacial
period also prevented from calcite precipitation. Likewise, the geochemical approach
performed on the composite core PTA03/12+ 13 (Figure 1) by Haberzettl et al. (2007)
also showed that monohydrocalcite, a type of calcite precipitated by bacterial activity
at high salt concentrations, can be used as a lake leve! proxy, since it is linked to
enhanced Ca2+ concentration resulting from a reduced lake water volume. Renee, the
monohydrocalcite presence between 6 and 9.7 mcd indicates a pronounced low lake
level between 8.4 and 7.1 ka cal. BP. Moreover, seismic data (Anselrnetti et al., 2009;
Gebhardt ét al. , 2011) reveal that the lake lev el dropped to a depth of ~ 3 3 rn below
the lake leve! of 2003 during this interval. Low lake leve! phases might fo llow drier
and/or warmer climatic conditions. Other indicators point also to a low lake leve!
around this period (e.g. , Haberzettl et al. , 2007: geochemical data; Massaferro et al. ,
this issue: diatoms and chironomids; Wille et al. , 2007: pollen and diatoms ).
116
Quartz abundance decreased during the Holocene compared to the glacial period.
Quartz flux varied roughly proportionally to sedimentation rates (see age mode!
proposed by Kliem et al., this issue-a). The quartz polymorph cristobalite which is
present with relatively high percentages but in few samples only, is a mineral
frequently found in volcanic rocks . It is formed at atmospheric pressure, between
1470°C and its melting point 1627°C, but it can crystallize and persist in a metastable
state at lower temperatures (Downs and Palmer, 1994 ). The presence of cristobalite is
likely related to vo1canism in the region, brought to the lake after weathering since
basaltic deposits are present in the catchment area. Feldspars appear with relatively
higher concentrations in the glacial interval, as weil as both clay groups (kaolinite
chlorite and to a lesser extent smectite-chlorite). During the Late Glacial chlorite and
smectite constitute the two main clay groups in relative abundance, smectite being the
most abundant clay in the Laguna Potrok Aike sediments particularly in the Holocene
(Figure 7). Both originate from weathering of mafic rocks (smectite after an
additional degree of alteration) which are abundant in the catchment basin and
preferentially yield this type of clay (Chamley, 2000; Thorez, 2003). Smectite can
also derive from authigenesis processes. High v/p ratios indicate authigenetic
smectite, while low ratios point to pedogenetic-derived smectites (Thorez, 2003).
Hence, higher v/p values in the Holocene tend to indicate stronger authigenesis.
However, such higher Holocene v/p values might also relate to an increase in the
smectite abundance rather than to a change in its genetic origin (Figure 7). Since clay
fluxes cannot be estimated, it is difficult to assess if this relative increase of smectite
is due to increased hydrolysis in the watershed or to intensification of authigenic
processes in the water column Qr to both. Amphibole, zeolite, mica and pyroxene
concentrations are too low to provide a basis for any interpretation of their relative
variability.
Results from the PCA on the five main assemblages (Figure 5) highlight three distinct
mixing end-members: detrital (containing quartz and feldspar) , endogenic (composed
117
exclusively of calcite) and a third one containing the clays (smectite, chlorite and
kaolinite) ensuing from weathering processes. Feldspar is more associated to the PC!
axis than quartz, and tends towards the clay mineral end-member on PC2. This
behaviour characterizes an environment in which feldspar is subjected to more
intense chemical alteration than quartz.
PC 1 shows a relatively abundant detrital input in the glacial section of the sequence
(Figure 6). This detrital fraction is replaced by endogenic calcite after ~ 12 ka cal. BP.
The clays are also more abundant in the section deposited prior to ~ 12 ka cal. BP,
possibly indicating higher gelifraction and/or eolian supplies under periglacial
conditions (e.g., Basile et al. , 1997; Gaiero, 2007; Sugden et al., 2009).
For the past 16 ka in the PTA03/12+ 13 sequence, Haberzettl et al. (2007) suggested
wetter conditions from 16 to 8.7 ka cal. BP (ending Last Glacial to early Holocene)
interrupted by a dry and warm phase from 13 .1 to 1 1.4 ka cal. BP. Drier conditions
would prevail from 8.7 ka cal. BP until now. Mineralogical data confrrms this overall
pattern. The 13.1 to 11.4 ka cal. BP dry and warm period conesponds to a calcite
peak (Figure 4) possibly indicating a drier and/or warmer period. During the glacial
period, the slightly higher abundance of quartz, feldspars and clay groups might result
from an increase of gelifraction processes and/or higher eolian supplies in the
periglacial environment. Two intervals at ca. 50 and 46 ka cal. .BP within this glacial
period present higher smectite contents (Figure 7). The v/p ratio is stable in the earlier
interval (~50 ka cal. BP) and increases in the second (~46 ka cal. BP). Higher v/p
ratio might explain the increase of smectite content as an intensification of the
authigenic process. Both intervals also depict higher clay abundances according to the
PCA analysis (Figure 5, 6). Taken alone, these mineralogical variations are difficult
to interpret. However, they can be understood in the light of the biochemical proxies
collected by Hahn et al. (this issue) suggesting higher lake level and increased
productivity during these two tune intervals. Increased clay content would result from
118
more frequent snowmelt events in a warmer environment and in a more distal
location (due to higher lake level). Higher relative smectite abundance could be
explained as resulting from chemical alteration rather than from gelifraction, while
higher v/p could result from stronger authigenesis in a more productive lake.
A.5.2. U-Th "dating" ofvivianite
Vivianite is formed either by precipitation in the water column or by diagenetic
processes within the sediment. Well-oxygenated bottom waters tend to produce more
ferric hydroxides (since ferrous cations are more soluble than ferric cations) which
can co-precipitate with P released from pore waters by forming ferrosoferric
hydroxyphosphates at the water-sediment interface (Fage! et al. , 2005; Nriagu and
Dell, 1974; Taylor et al. , 2008). Any subsequent increase in reducing conditions will
then give rise to transformation of such complexes into vivianite. Such a diagenetic
process of precipitating vivianite seems to correspond to the polymictic conditions
prevailing in Laguna Potrok Aike rather than vivianite formation in the water column.
Low concentrations of U combined with high concentrations of Th indicate that the
vivianite from Laguna Potrok Aike does not contain much authigenic U (Table 2).
Most of the U found in sam pies V 1 to V 4 seems detritic in origin despite its slight
excess in 234U vs. 238U, which is likely due to sorne uptake of a highly fractionated
diagenetic U (see below). With their Th/U mass ratio of about 4, the U-carrying
detritic minerais that contaminate vivianite have values reported for volcanic rocks
from the area (Demant et al. , 2007). The less-contaminated concretion (VS) and the
selected vivianite grains (VS') yielded sorne authigenic U as indicated by their much
higher excess in 234U vs. 238U and lower 232Th content. Using the 238U/232Th ratio as
detrital index (Ludwig and Paces, 2002) and assuming that the mean isotopie
composition of V2 to V 4 provides a fair proxy of the isotopie composition of the
detrital contaminant e38UP32Th = 0.719 ± 0.008; 234U/232Th = 0.804 ± 0.010;
119
230Th/232Th = 0.889 ± 0.0 13), one may estimate the 230Th/234U and 234U/238U ratios
linked to the authigenic fraction of U present in sample VS (Table 3). VI and VS'
were not included in the calculation of the average detrital fraction because of their
slightly higher authigenic uranium. Unfortunately, the attempt to use the 238U/232Th
ratio to decipher the detrital vs. authigenic U-fractions results in too large
uncertainties to provide reliable interpretations. Thus VS seems to be the only sample
suitable to estimate a 230Th-age and an isotopie composition (234U/238U) of the
authigenic U-fraction. Values of 29.4 ± S.9 ka and 4.S8 ± O.S8 (± 2cr) are obtained.
The strong excess in 234U suggests that the highly-fractionated U has been transfeiTed
from suiTounding detrital minerais through a U-poor pore water medium. Such
relative enrichments in 234U recoiled from detrital grains are characteristic of low Eh
and U-depleted pore waters (e.g., Andrews and Kay, 1982). Noteworthy is the fact
th at the detrital cotTection made using data from V2 to V 4 bypasses the fa ct that these
contain a small fraction of authigenic U, as indicated by their excess in 234U vs. 238U.
Estimates of authigenic fractions in U-series isotopes are thus slightly lower than in
reality resulting consequently in an underestimated 230Th-age.
The low U content in the vivianite from Laguna Potrok Aike suggests reduced
diagenetic U-fluxes in the sediment. U-series analysis of vivianite grains from Lake
Jacques Cartier in eastem Canada (47°N, 71 °W) and from the Laptev Sea (76°N,
l2S 0 E) ( own unpublished data) yielded concentrations of authigenic U in the range of
th ose observed in the sediments of Laguna Potrok Aike (U total concentration values
between 0.80S and 1.649 )lg g- 1in three vivianite samples from Lake Jacques Cartier
and a value of 0.333± 0.002 )lg g-1 was obtained in the sample from the Laptev Sea).
Thus, the high U-content reported for vivianite from Lake Baikal by Fagel et al.
(200S) seems more an exception rather than a rule.
Nonetheless, the 230Th-age estirnate for the authigenic U in sample VS constitutes a
lower age limit for the embedding sediment due to both the diagenetic origin of the
120
carrier mineral and the fact that this age is an underestimation of the true vivianite
age, as discussed above. It is 11.7 ± 5.9 ka younger than the model-age estimated by
Kliem et al. (this issue-a). Assuming that the model-age stands strong, one may
further hypothesize: i) a relatively late diagenetic precipitation of the canier-vivianite,
ii) a more or less continuous growth of vivianite with decreasing precipitation rates
through time, iii) an open system with respect to U, allowing it to be continuously
trapped in vivianite with decreasing rates through time, or iv) a combination of the se
pro cesses.
121
A.6. Conclusion
The mineralogical study of Laguna Potrok Aike sediments confmns and supports the
paleoenvironmental reconstruction constructed by other members of the P ASADO
science team using other indicators. The low variability of mineralogical assemblages
within the glacial sequence suggests moderate environmental changes throughout this
interval (~ 51 to 12 ka cal. BP). The slightly higher bulk and clay mineralogical
abundance found during this period might correspond to a slight increase of
gelifraction processes and/or higher eolian supplies under periglacial conditions. The
shift in the precipitation/evaporation ratio at the Holocene-Last Glacial transition is
marked by the addition of an authigenic calcite component. lts fonnation is related to
lower lake levels, therefore probably to dryer and/or warmer Holocene climatic
conditions. A higher crystallinity of smectite is observed during this interval and
might correspond to sorne authigenic production or to a more effective hydrolysis in
soils or to both.
An attempt to date the only diagenetic mineral, vivianite, usmg V-series is not
conclusive. Low V-fluxes in the embedding sediment result in vivianite grains with
too low co-precipitated V . Moreover, the formation of vivianite seems to be a long
lasting process after burial and does not permit estimating precise and reliable
diagenetic precipitation ages.
122
Acknow1edgments
This research used samples and/or data provided by the International Continental
Scientific Drilling Program (ICDP) in the framework of the "Potrok Aike Maar Lake
Sediment Archive Drilling Project" (PASADO). Funding for drilling was provided by
the ICDP, the German Science Foundation (DFG), the Swiss National Funds (SNF),
the Natural Sciences and Engineering Research Council of Canada (NSERC), the
Swedish V etenskapsradet (VR) and the University of Brem en. Special
acknowledgments are due to the PASADO science team (http ://www.icdp
online.org/front content.php?idcat= 1494 ), to fmancial support from NSERC-Special
Research Opportunity for graduate scholarships to Laurence Nuttin and from FQRNT
for infrastructure support of GEOTOP laboratories. We particularly owe thanks to
Nathalie Fage! (Université de Liège) and one anonymous reviewer for their
constructive and helpful comments on an earlier version of this paper.
123
References
Andrews, J. N., and R. L. F. Kay (1982), 234UP38U activity ratios of dissolved uranium in groundwaters from a Jurassic Limestone aquifer in England, Earth and Planetary Science Letters, 57, 139-151.
Anselmetti, F. S., D. Aritztegui, M. De Batist, C. A. Gebhardt, T. Haberzettl, F. Niessen, C. Oh1endorf, and B. Zolitschka (2009), Environmental history of southem Patagonia unravelled by the seismic stratigraphy of Laguna PotrokAike, Sedimentology, 56, 873-892.
Basile, I. , F. E. Grousset, M. Revel, J. Robert Petit, P. E. Biscaye, and N. I. Barkov ( 1997), Patagonian origin of glacial dust deposited in East Antarctica (Vostok and Dome C) during glacial stages 2, 4 and 6, Earth and Planetary Science Letters, 146, 573-589.
Biscaye, P. E. (1965), Mineralogy and sedimentation of recent deep-sea clay in the Atlantic ocean and adjacent seas and oceans, Geological Society of America Bulletin, 76, 803-832.
Chamley, H. (2000), Bases de sédimentologie, second ed., 178 pp., Dunod, Paris.
Corbella, H. (2002), El campo volcano-tectonico de Pali Aike, Geologia y Recursos Naturales de Santa Cruz. Asociaciôn Geolôgica Argentina., I-18, 285-301.
Coronato, A., B. Ercolano, H. Corbella, and P. Tiberi (this issue), Glacial, fluvial and volcanic 1 landscape evolution in the Laguna PotrokAike maar area, southemmost patagonia, Argentina, Quaternary Science Reviews.
Demant, A. , M. Suarez, and R. De la Cruz (2007), Geochronology and petrochemistry of Late Cretaceous-(?)Paleogene volcanic sequences from the eastern central Patagonian Cordillera ( 45° -45°40'S), Revis ta Geol6gica de Chile, 34(1 ), 3-21.
Downs, R. T., and D. C. Palmer (1994), The pressure behavior of a.cristobalite, AmericanMineralogist, 79,9-14.
Edwards, R. L. , J. H. Chen, and G. J. Wasserburg (1987), 238U 234U 230Th 232Th systematics and the precise measurement of time over the past 500,000 years, Earth and Planetary Science Letters, 81 , 175-192.
Fage!, N., L. Y. Alleman, L. Granina, F. Hatert, E. Thamo-Bozso, R. Cloots, and L. André (2005), Vivianite formation and distribution in Lake Baïkal sediments, Global and Planetary Change, 46, 315-336.
124
Gaiero, D. M. (2007), Dust provenance in Antarctic ice during glacial periods: From where in southern South America?, Geophysical Research Letters, 34, L17707.
Gebhardt, A. C., M. De Batist, F. Niessen, F. S. Anselmetti, D. Ariztegui, T. Haberzettl, C. Kopsch, C. Ohlendorf, and B. Zolitschka (20 11), Deciphering lake and maar geometries from seismic refraction and reflection surveys in Laguna Potrok Aike (southern Patagonia, Argentina), Journal of Volcanology and Geothermal Research, 201, 357-363 .
Gebhardt, A. C., C. Ohlendorf, F. Niessen, M. De Batist, F. S. Anselmetti, D. Ariztegui, P. Kliem, S. Wastegard, and B. Zolitschka (2012), Seismic evidence of up to 200 rn lake-level change in Southem Patagonia since Marine Isotope Stage 4, Sedimentology, 59, 1087-1100.
Goetz, C., and C. Hillaire-Marcel (1992), U-series disequilibria in early diagenetic minerais from Lake Magadi sediments, Kenya: Dating potential, Geochimica et Cosmochimica A ct a, 56, 1331-1341.
Haberzettl, T., M. Fey, A. Lücke, N. Maidana, C. Mayr, C. Ohlendorf, F. Schabitz, G. H. Schleser, M. Wille, and B. Zolitschka (2005), Climatically induced lake level changes during the last two millennia as reflected in sediments of Laguna Potrok Aike, southern Patagonia (Santa Cruz, Argentina), Journal of Paleolimnology, 33, 283- 302.
Haberzettl, T., H. C01·bella, M. Fey, S. Janssen, A. Lücke,, C. Mayr, C. Ohlendorf, F. Schabitz, G.H. Schleser, M. Wille, S. Wulf and B. Zolitschka (2007), Lateglacial and Holocene wet-dry cycles in southern Patagonia: chronology, sedimentology and geochemistry of a lacustrine record from Laguna Potrok Aike, Argentina, The Holocene, 17, 297-310.
Hahn, A., P. Kliem, C. Ohlendorf, B. Zolitschka and P. Rosén (this issue), Climate induced changes as registered in inorganic and organic sediment components from Laguna Potrok Aike (Argentina) during the past 51 ka, Quaternary Science Reviews.
Kliem, P., D. Enters, A. Hahn, C. Ohlendorf, A. Lisé-Pronovost, G. St-Onge, S. Wastegârd, and B. Zolitschka (this issue-a), Lithology, radiocarbon chronology and sedimentological interpretation of the lacustrine record from Laguna Potrok Aike, southem Patagonia, Quaternary Science Reviews.
Kliem, P. , J. -P. Buylaert, A. Hahn, C. Mayr, A. Murray, C. Ohlendorf, D. Yeres, S. Wastegârd, and B. Zolitschka (this issue-b), Magnitude, geomorphologie response and climate links of lake level oscillations at Laguna Potrok Aike, Patagonian steppe (Argentina), Quaternary Science Reviews.
125
Last, W. M. (2001), Mineralogy analysis of lake sediments, in Tracking Environmental Change Using Lake Sediments, edited by W. M. Last and J. P. Smol, pp. 143-187, Kluwer Academie Publishers, Dordrecht, The Netherlands.
Ludwig, K. R., and J. B. Paces (2002), Uranium-dating of pedogenic silica and carbonate, Crater Flat, Nevada, Geochimica et Cosmochimica Acta, 66(3), 487-506.
Mercer, J. H. (1976), Glacial history of southernmost south America, Quaternary research, 6, 125-166.
Moore, D. M., and J. C. Reynolds (1997), X-Ray Diffraction and the Identification and Analysis of Clay Minerais, Oxford University Press, New York.
Nriagu, J. 0., and C.l. Dell (1974), Diagenetic formation of iron phosphate in recent lake sediments, American Mineralogist, 59, 934-946.
Ohlendorf, C., C. Gebhardt, A. Hahn, P. Kliem, B. Zolitschka, and t. P. s. team (2011), The PASADO core processing strategy - A proposed new protocol for sediment core treatment in multidisciplinary lake drilling projects, Sedimentary Geology, 239, 104-115.
Ohlendorf, C., M. Fey, C. Gebhardt, T. Haberzettl, A. Lücke, C. Mayr, F. Schabitz, M. Wille, and B. Zolitschka (this issue), Mechanisms of lake-leve! change at Laguna PotrokAike (Argentina) - Insights from hydrological balance calculations, Quaternary Science Reviews.
Rabassa, J. , and C. M. Clapperton (1990), Quatemary glaciations of the southem Andes, Quaternary Science Reviews, 9, 153- 174.
Sugden, D. E. , R. D. McCulloch, A. J.-M. Bory, and A. S. Hein (2009), Influence of Patagonian glaciers on Antarctic dust deposition during the last glacial period, Nature Geoscience, 2, 281-285.
Taylor, K. G., K. A. Hudson-Edwards, A. J. Bennett, and V. Vishnyakov (2008), Early diagenetic vivianite [Fe3(P04) 2 . 8H20 ] in a contarninated freshwater sediment and insights into zinc uptake: A 11-EXAFS, 11-XANES and Raman study, Applied Geochemistry, 23, 1623-1633.
terBraak, C. J. F., and P. Smilauer (1998), CANOCO Reference Manual and User's Guide to Canoco for Windows: Software for Canonical Community Ordination (version 4), 352 pp., Ithaca, NY, USA.
Thorez, J. (2003), L'argile, minéral pluriel, Bulletin de la Société Royale des Sciences de Liège, 72(1), 19-70.
l
126
Velde, B. (1992), Introduction to clay minerais: chemistry, origins, uses and environmental significance, 198 pp., Chapman & Hall, London.
Wille, M. , N.I. Maidana, F. Schabitz, M. Fey, T. Haberzettl, S. Janssen, A. Lücke, C. Mayr, C. Ohlendorf, G.H. Schleser and B. Zolitschka (2007), Vegetation and climate dynamics in southem South America: The microfossil record of Laguna Potrok Aike, Santa Cruz, Argentina, Review ofPalaeobotany and Palynology, 146, 234-246.
Zo1itschka, B., F. Anselmetti, D. Ariztegui, H. Corbella, P. Francus, C. Ohlendorf, F. Schabitz, and the PASADO Scientific Drilling Team (2009), The Laguna Potrok Aike Scientific Drilling Project PASADO (ICDP Expedition 5022), Scientific Drilling, 8, 29-34.
Zolitschka, B. , F. Schabitz, A. Lücke, G. Clifton, H. Corbella, B. Ercolano, T. Haberzettl, N.I. Maidana, C. Mayr, C. Ohlendorf, G. Oliva, M.M. Paez, G.H. Schleser, J. Soto, P. Tiberi and M. Wille (2006), Crater lakes of the Pali Aike Volcanic Field as key sites of paleoclimatic and paleoecological reconstructions in southem Patagonia, Argentina, Journal of South American Earth Sciences, 21 , 294-309.
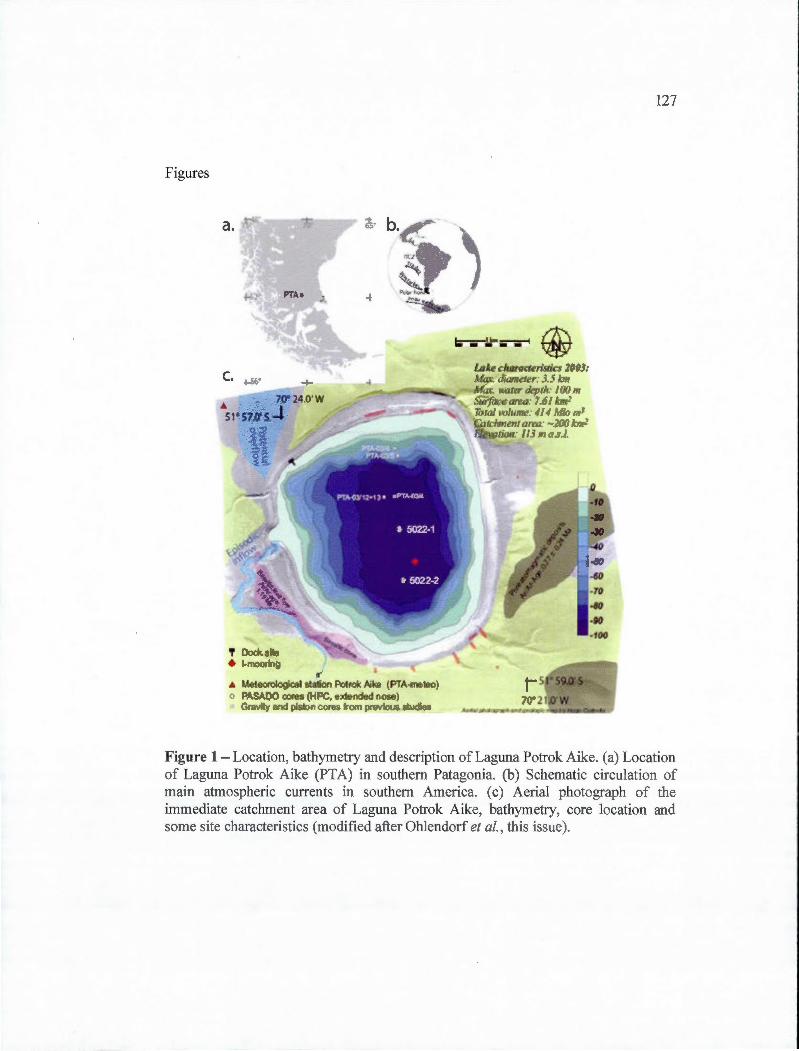
Figures
a. 6\ b.
c. ~
tr 4 leoroiOQ 1 èfiOn Petr ftJ (PTA lêO) o PASA!)O eor (HPC. exlended nOS$)
Gravi and plslon cores om pre lou$
127
Figure 1- Location, bathymetry and description ofLaguna Potrok Aike. (a) Location of Laguna Potrok Aike (PTA) in southern Patagonia. (b) Schematic circulation of main atrnospheric currents in sou them America. ( c) Aerial photograph of the immediate catchment area of Laguna Potrok Aike, bathymetry, core location and sorne site characteristics (modified after Ohlendorf et al. , this issue).
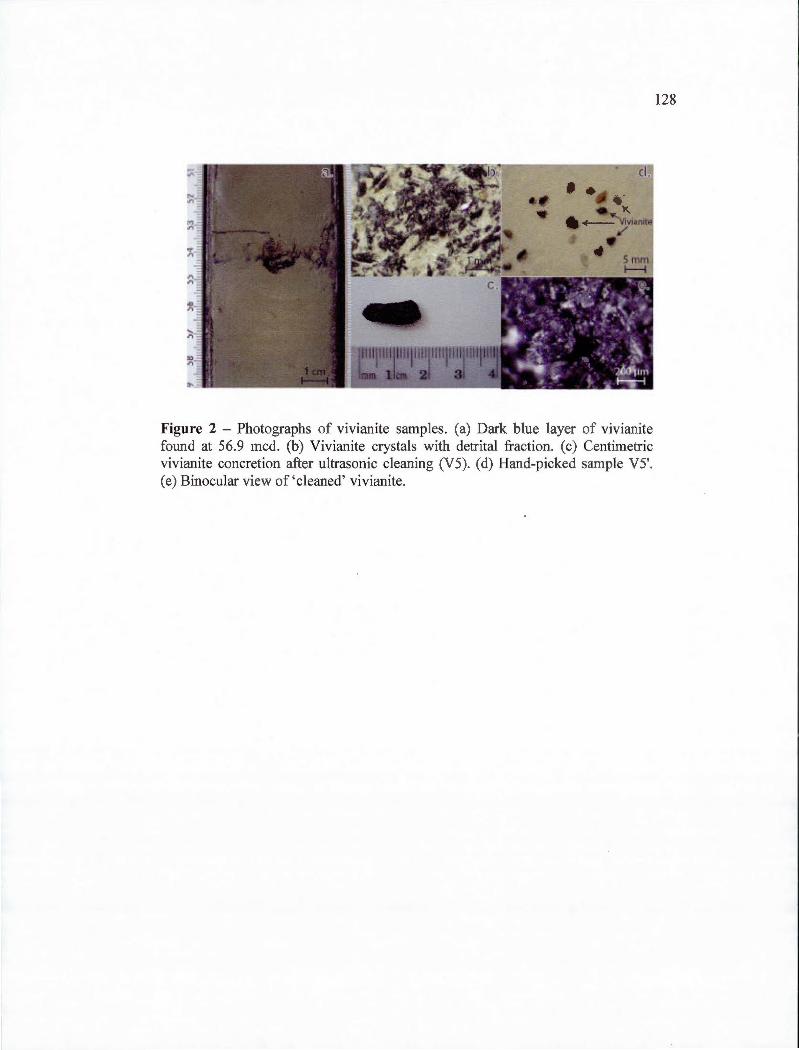
Figure 2 - Photographs of vivianite samples. (a) Dark blue layer of vivianite found at S6.9 mcd. (b) Vivianite crystals with detrital fraction. (c) Centimetric vivianite concretion after ultrasonic cleaning (VS). ( d) Hand-picked sample VS'. ( e) Binocular view of ' cleaned' vivianite.
128
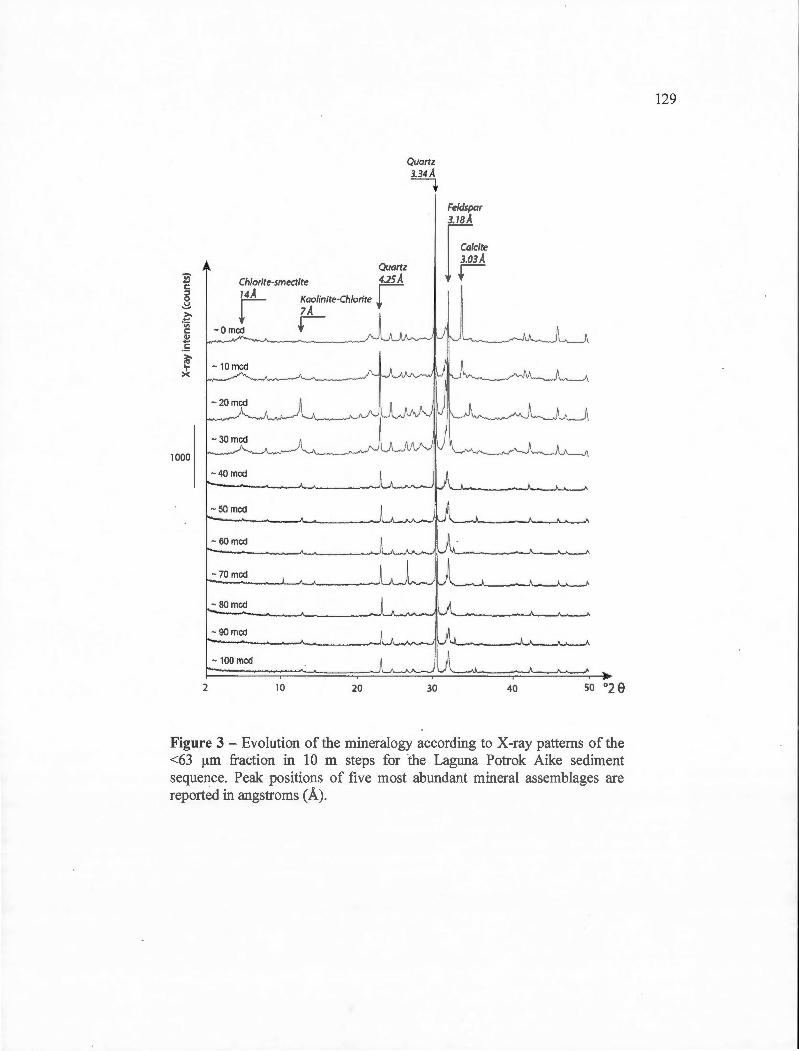
1000
2
Quartz
Chlorite-smectite 4.25 A
fiL Kao/inite-Chlorite r-t 1A
-Omcd t
-40 mcd
-50 mcd
-60 mcd
-70 mcd
-80 mcd
-90 mcd
- 100 mcd
10 20
Quartz 3.34A
t
30
Feldspar
lr3. 18 A/cite
3A
t
40
Figure 3- Evolution of the mineralogy according toX-ray patterns of the <63 !lill fraction in 10 rn steps for ·the Laguna Potrok Aike sediment sequence. Peak positions of five most abondant mineral assemblages are reported in angstroms (À).
129
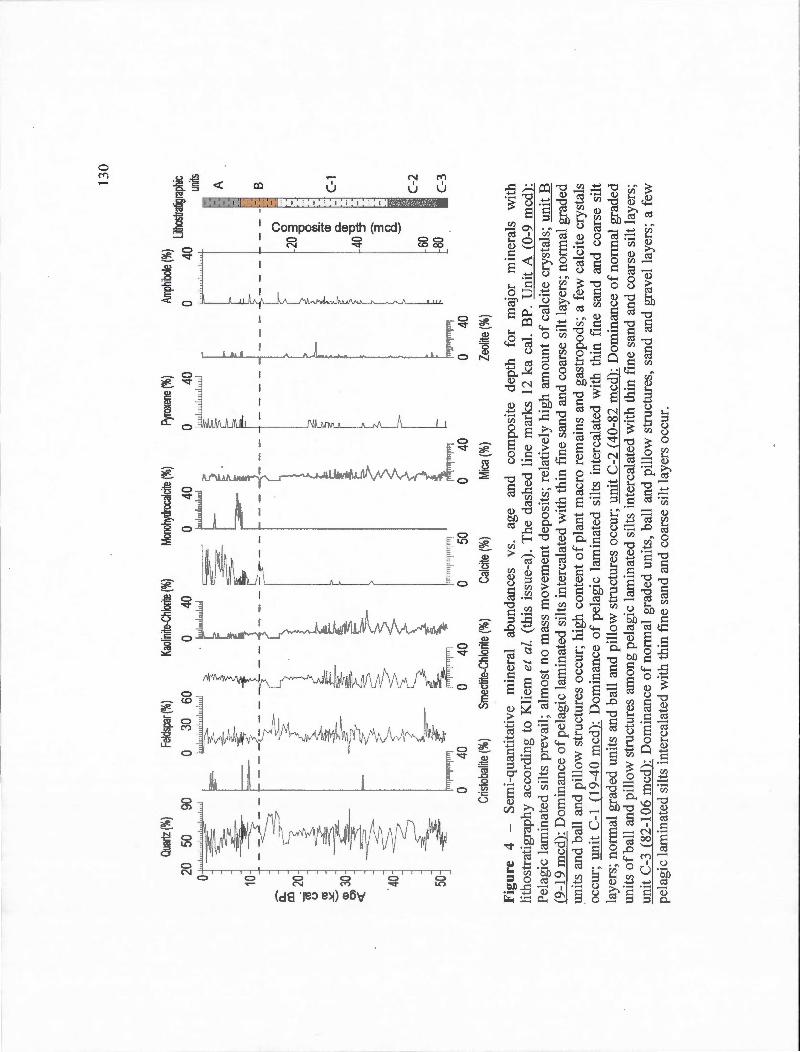
Quar
tz(%
} Fe
ldspa
r (%)
Ka
olinit
e.Chlo
rile (%
) Mo
nohy
droca
lcite
(%)
Pyrox
ene (
%)
20
50
90
0 30
60
0
40
0 40
0
40
o, .... , .....
. ,"'l!'J"
··, .. ,,
1 ·.w~,
·IIIII
I.WU
~
• r
?-=-
= L
~
~,J,
,.,.,d
.. ,l
"'L
' ';
[ ~ [
_
~ . è
~ ~
L~
.;if
~~[;,.
~
F=-~
<
s t__
L~
-10
j "
t --i -
--r --
r --i
~ 20
'1 11
1 ?
0 .:
;:;?
~ ?=
f,__
? \ ~ ~
--=~
J '
F
L -=
---F-
~
~
~
~
! i-
,.
~ f
! l
[
130
Amph
ibole
(%)
Litho
strati
graph
!c 0
40
umts
~
~ $ t' r ~ ( 7
0 0 20
3
"0
0 !!?.
ct
0..
CD
405:
_, A
-·
B
J C-
1
i30 -
i '4
0-1 3 ~
~
~
L~ Z_
ff-t t
~
t-î (
t t
~11]
~
60
80 3 g
-· C
-2
~
rrym
rnny
n~
I 50
~
.. ~ rm
fflfii
inm
m ~
,lJij'
Hlji
llljll
llJlll
T!
C-3
0 40
0
40
0 50
0
40
0 40
Cr
istob
alite
(%)
Smec
tite-C
hlorite
(o/o}
Ca
lcite
(%)
Mica
(%)
Zeol
ite(%
)
Fig
ure
4 -
Sem
i-qu
anti
tati
ve
min
eral
ab
unda
nces
vs
. ag
e an
d co
mpo
site
de
pth
for
maj
or
min
erai
s w
ith
lith
ostr
atig
raph
y ac
cord
ing
to K
liem
et
al.
(thi
s is
sue-
a).
The
das
hed
line
mar
ks 1
2 ka
caL
BP
. U
nit
A (
0-9
mcd
):
Pel
agie
lam
inat
ed s
ilts
pre
vai
l; a
lmos
t no
mas
s m
ovem
ent
depo
sits
; re
lati
vely
hig
h am
ount
of
calc
ite
crys
tals
; un
it B
(9
-19
mcd
): D
omin
ance
of p
elag
ie l
amin
ated
sil
ts i
nter
cala
ted
wit
h th
in f
ine
sand
and
coa
rse
silt
lay
ers;
nor
mal
gra
ded
unit
s an
d ba
li a
nd p
illo
w s
truc
ture
s oc
cur;
hig
h co
nten
t o
f pl
ant
mac
ro r
emai
ns a
nd g
astr
opod
s; a
few
cal
cite
cry
stal
s oc
cur;
uni
t C
-1 (
19-
40 m
cd):
Dom
inan
ce o
f pe
lagi
e la
min
ated
sil
ts i
nter
cala
ted
wit
h th
in f
ine
sand
and
coa
rse
silt
la
yers
; no
rmal
gra
ded
unit
s an
d ba
ll a
nd p
illo
w s
truc
ture
s oc
cur;
uni
t C
-2 (
40-8
2 m
cd):
Dom
inan
ce o
fno
rmal
gra
ded
unit
s o
fbal
l an
d pi
llow
str
uctu
res
amon
g pe
lagi
e la
min
ated
sil
ts i
nter
cala
ted
wit
h th
in f
ine
sand
and
coa
rse
silt
lay
ers;
un
it C
-3 (
82-1
06 m
cd):
Dom
inan
ce o
f no
rmal
gra
ded
unit
s, b
ali
and
pill
ow s
truc
ture
s, s
and
and
grav
e! l
ayer
s; a
few
pe
lagi
e la
min
ated
sil
ts i
nter
cala
ted
wit
h th
in f
ine
sand
and
coa
rse
silt
lay
ers
occu
r.
~---
----
----
----
----
----
----
----
----
----
----
----
----
----
----
----
----
----
----
----
----
----
----
----
----
----
----
----
----
----
----
----
----
----
----
----
----
----
----
----
----
----
----
----
----
----
----
----
----
----
----
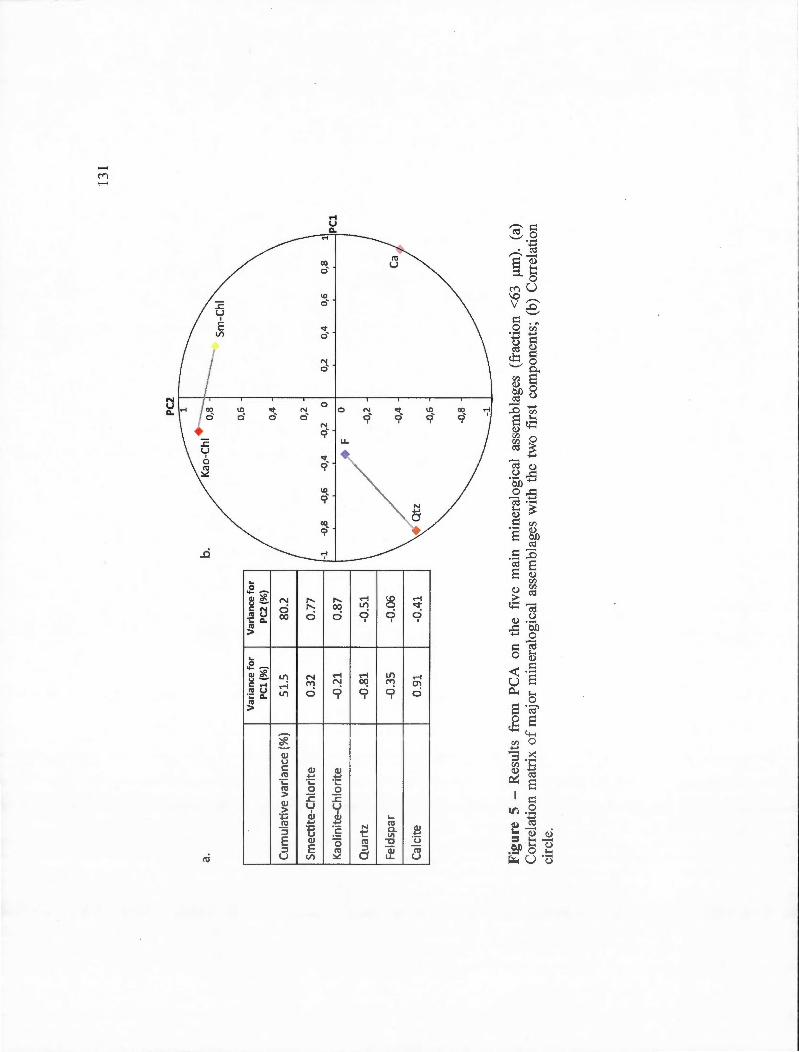
PC2
a.
b.
--.......
S
m-C
hi
0,6
Var
ianc
e fo
r V
aria
nce
for
PC
l (%
) P
C2(
%)
0,4
C
umu
lati
ve v
aria
nce
{%)
51.5
80
.2
Sm
ect
ite-
Ch
lori
te
0.32
0.
77
Kao
l inite
-Ch
lori
te
-0.2
1 0
.87
0,2
-0,2
0
1
0,2
0,4
0,6
1 1
1
0 F
Qua
rtz
-0.8
1 -0
.51
..(),
2
Fel
dsp
ar
-0.3
5 -0
.06
..(),
4
Cal
cite
0.
91
-0.4
1 --
-----
-------
-0,6
Fig
ure
5 -
Res
ults
fr
om P
CA
on
the
five
m
ain
min
eral
ogic
al a
ssem
blag
es (
frac
tion
<63
).l
m).
(a)
Cor
rela
tion
mat
rix
of
maj
or
min
eral
ogic
al a
ssem
blag
es w
ith
the
two
firs
t co
mpo
nent
s; (
b) C
orre
lati
on
circ
le.
131
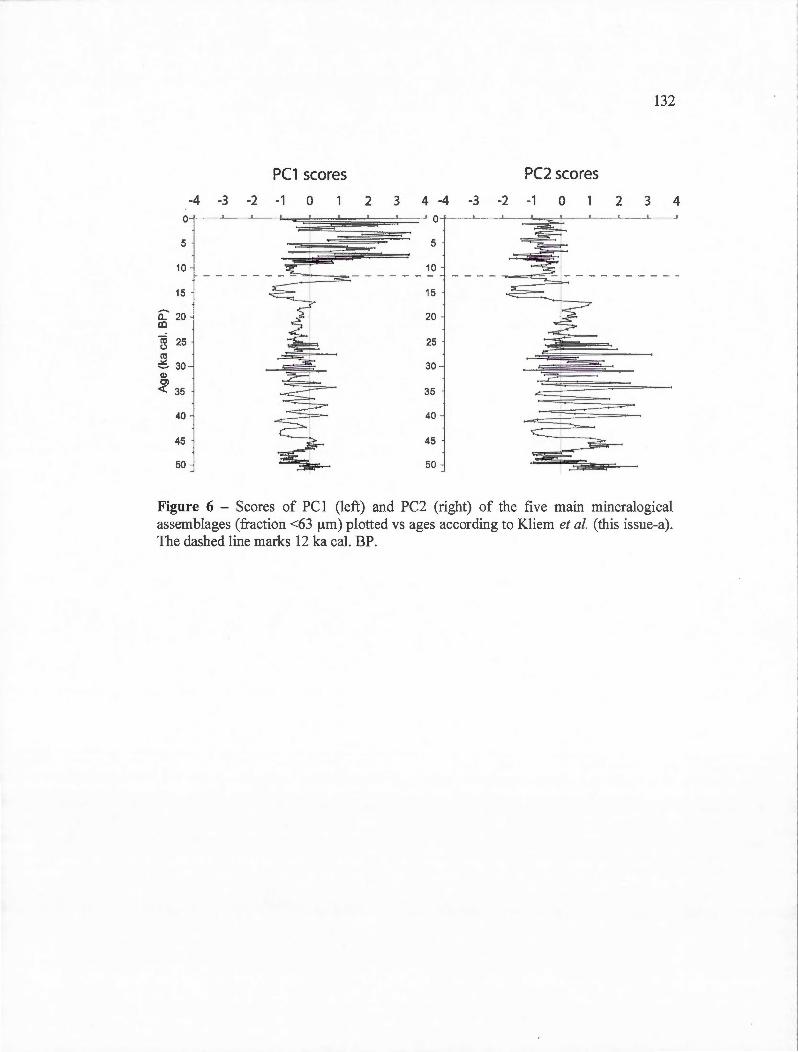
132
PC1 scores PC2 scores
-4 -3 -2 -1 0 2 3 4 -4 -3 -2 -1 0 2 3 4 0
5
10
15
~.:~~ -------~------ ~ ~ 15
EL 20 20 co rn 25 (.)
25 rn ~ 30 30 Q) Cl <t: 35 35
40 40
45 45
50 50
Figure 6 - Scores of PCI (left) and PC2 (right) of the five main mineralogical assemblages (fraction <63 IJ.m) plotted vs ages according to Kliem et al. (this issue-a). The dashed line marks 12 ka cal. BP.
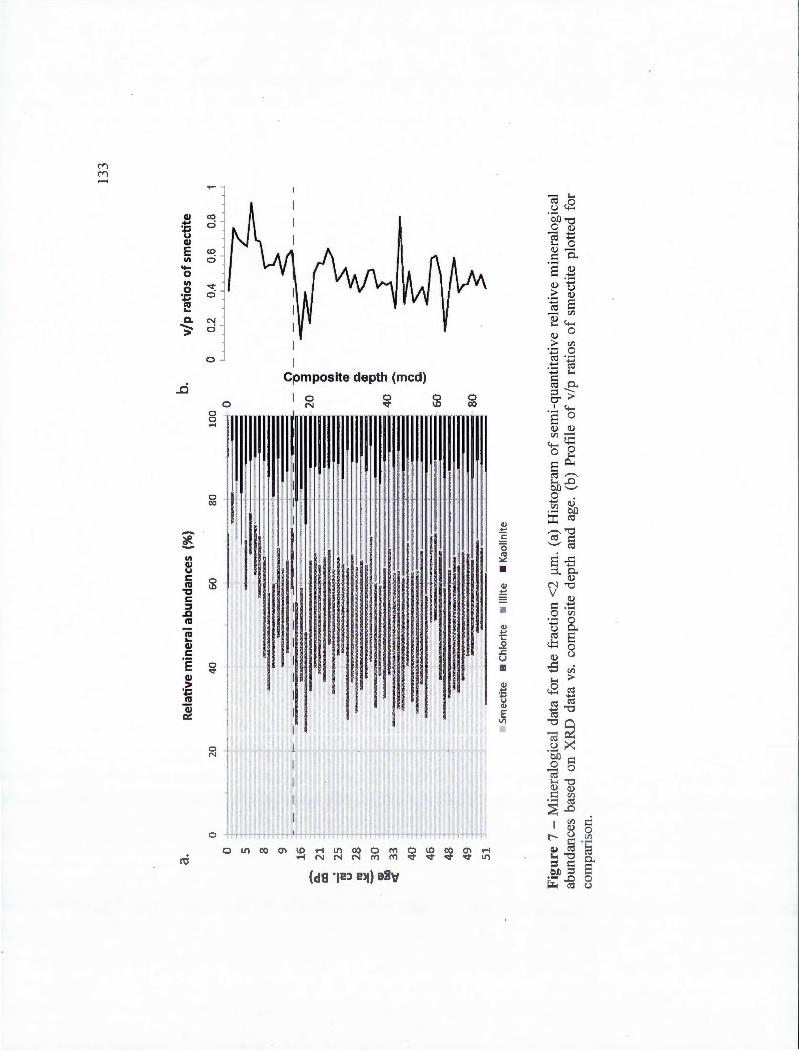
a. R
elat
ive
min
eral
ab
un
dan
ces
(%}
0 20
4
0 60
80
0
__,..
.. 5 8 9 16
D:
' 21
m
lU
25
u
lU
28
..:.
:: -;
30
ti
l)
<(
33
40
46
48
49
51
Sm
ect
ite
a
Ch
lori
te
• lll
ite
•
Ka
olin
ite
100
0
·-20
1-4
0
~ 6
0
.
80
b.
v/p
rat
ios
of
smec
tite
0 0.
2 0.
4 0.
6 1.
.....
_.__
_!_
_..._
,__J
1_
, J
--'-
.L
.1-
-L-1
0 -o-
3 't:J 0 Ill
:;:;
CD o.
CD
"C -:::r 3 0 o. -
0.8
• 1
Fig
ure
7-
Min
eral
ogic
al d
ata
for
the
frac
tion
<2
f.liD
. (a
) H
isto
gram
of
sem
i-qu
anti
tati
ve r
elat
ive
min
eral
ogic
al
abun
danc
es b
ased
on
XR
D d
ata
vs.
com
posi
te d
epth
and
age
. (b
) P
rofi
le o
f v/
p ra
tios
of
smec
tite
plo
tted
for
com
pari
son.
133
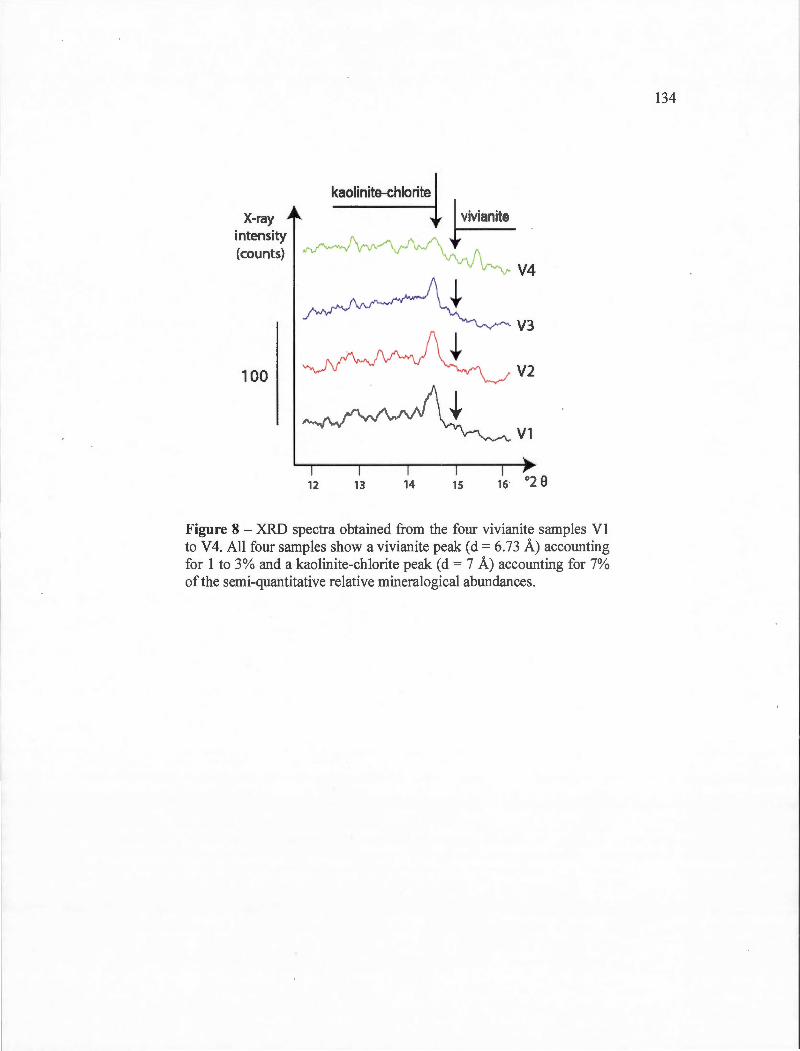
X-ray intensity (counts)
100
kaolinite-chlorite
V4
V3
V2
Vl
Figure 8 - XRD spectra obtained from the four vivianite samples Vl to V4. All four samples show a vivianite peak (d = 6.73 Â) accounting for 1 to 3% and a kaolinite-chlorite peak (d = 7 Â) accounting for 7% of the semi-quantitative relative mineralogical abundances.
134
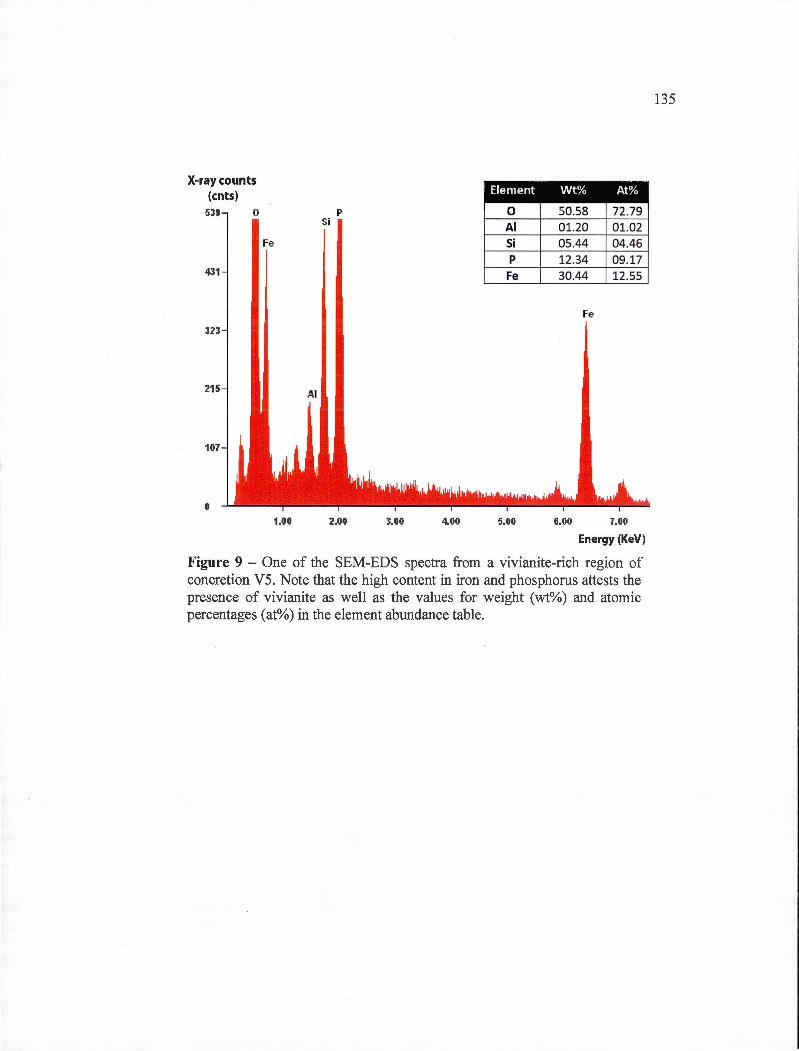
X-ray counts (cnts)
5 0
431
323
215
107
0
Fe
1.00
p Si
Al
2.()0 3.00 4.()0
Element Wt% At%
0 50.58 72.79 Al 01.20 01.02 Si 05.44 04.46 p 12.34 09.17
Fe 30.44 12.55
Fe
5.00 6.00 7.00
Energy (KeV)
Figure 9 - One of the SEM-EDS spectra from a vivianite-rich region of concretion VS. Note that the high content in iron and phosphorus attests the presence of vivianite as well as the values for weight (wt%) and atomic percentages (at%) in the element abundance table.
135
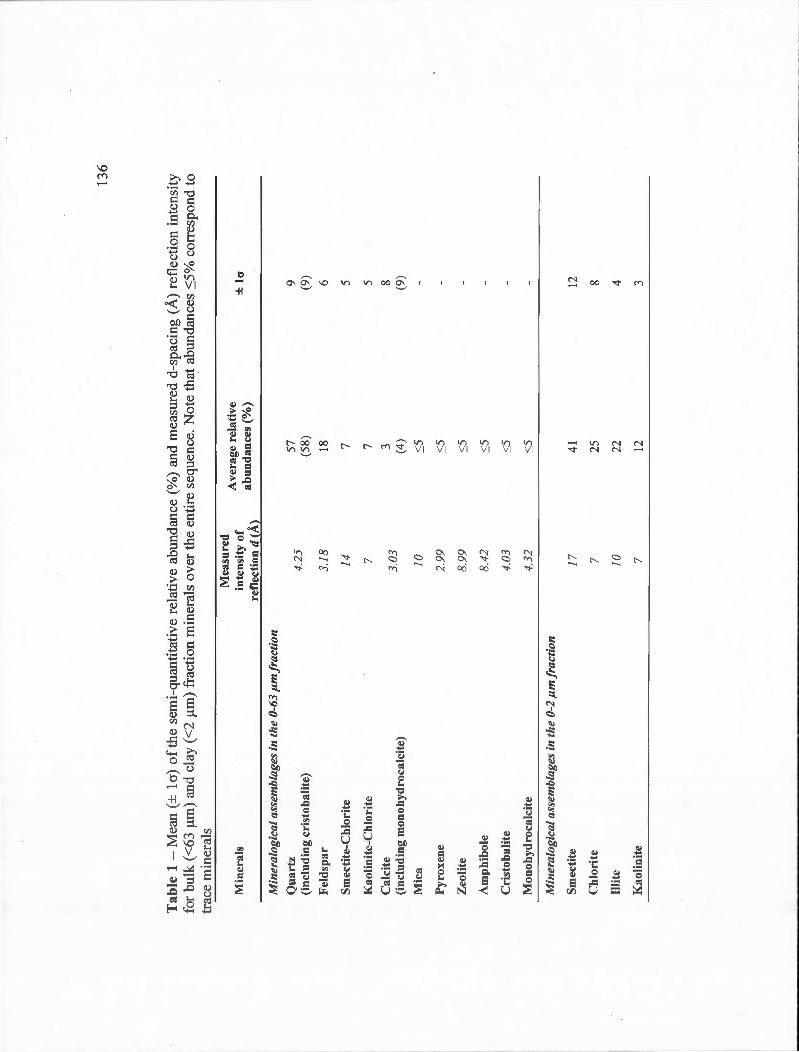
136
Tab
le 1
-M
ean
(± l
a)
ofth
e se
mi-
quan
tita
tive
rel
ativ
e ab
unda
nce
(%)
and
mea
sure
d d-
spac
ing
(Â)
refl
ecti
on i
nten
sity
fo
r bu
lk (
<63
)lil
l) a
nd c
lay
(<2
)lm
) fr
acti
on m
iner
ais
over
the
ent
ire
sequ
ence
. N
ote
that
abu
ndan
ces
:S5%
cor
resp
ond
to
trac
e m
iner
ais
· M
easu
red
Ave
rage
rel
ativ
e M
iner
ais
inte
nsit
y o
f re
flec
tion
d ~Â
} ab
un
dan
ces
(%)
Min
eral
ogic
al a
ssem
bla
ges
in th
e 0-
63 p
m fr
acti
on
Qu
artz
4.
25
57
(inc
lud
ing
cris
tob
alit
e)
(58)
F
eld
spar
3.18
18
Sm
ecti
te-C
hlor
ite
14
7
Kao
lini
te-C
blo
rite
7
7 C
alci
te
3.03
3
(inc
lud
ing
mon
ohyd
roca
lcit
e)
(4)
Mic
a 10
:S5
Py
roxe
ne
2.99
:S5
Zeo
lite
8.
99
:S5
Am
phi
bole
8.
42
:S5
Cri
sto
bali
te
4.03
:S5
Mo
no b
yd ro
ca Ic
i te
4.32
:S5
Min
eral
ogic
al a
ssem
blag
es in
th
e 0-
2 p
m fr
acti
on
Sm
ecti
te
17
41
Ch
io ri
te
7 25
Jlli
te
10
22
Ka
olin
ite
7 12
±la
9 (9) 6 5 5 8 (9)
12
8 4 3
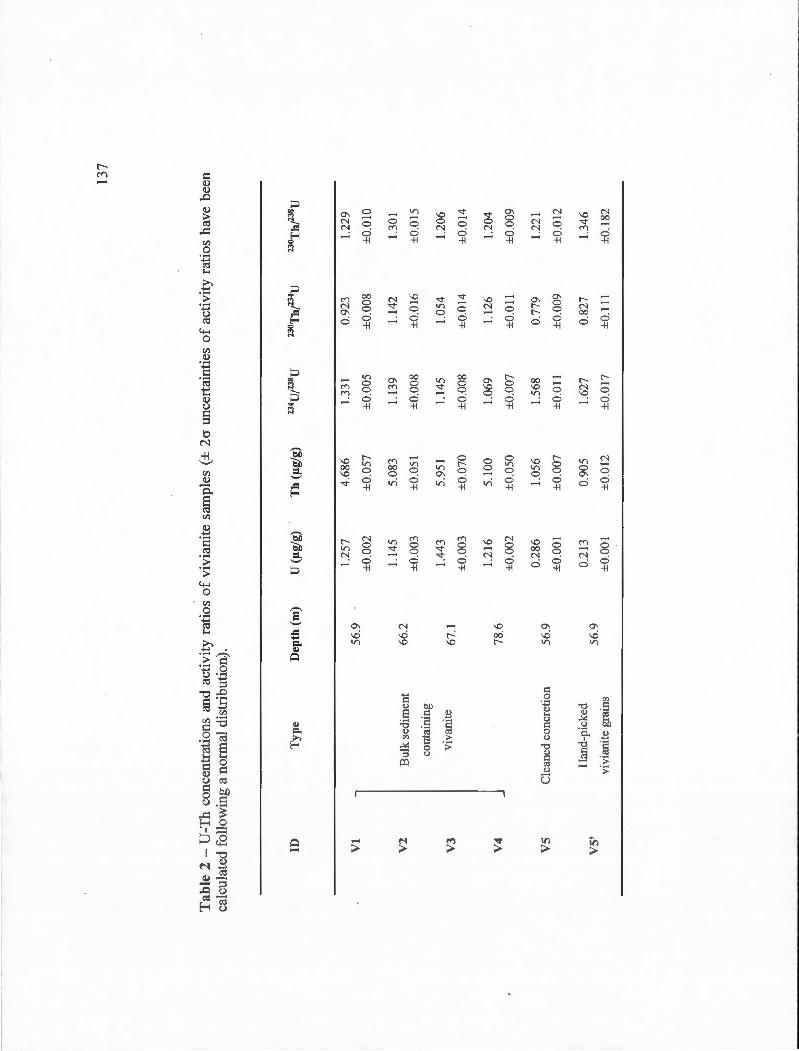
---
-~-
----------
-·-
--
--
137
Tab
le 2
-U
-Th
conc
entr
atio
ns a
nd a
ctiv
ity
rati
os o
f vi
vian
i te
sam
ples
(±
2o
unc
erta
inti
es o
f ac
tivi
ty r
atio
s ha
ve b
een
calc
ulat
ed f
ollo
win
g a
norm
al d
istr
ibut
ion)
.
ID
Ty
pe
Dep
th (
rn)
u (J
lg/g
) T
h (
Jlg/
g)
234u
p3su
23
oTbP
34U
no
Th/
238U
1.25
7 4
.686
1.
331
0.92
3 1.
229
Vl
-, 56
.9
±0.
002
±0.
057
±0.
005
±0.
008
±0.
010
1.14
5 5.
083
1.13
9 1.
142
1.30
1 V
2 1
Bu1
k se
dim
ent
66.2
±0
.003
±
0. 0
51
±0.
008
±0.
016
±0.
015
cont
aini
ng
vi v
anite
1.
443
5.95
1 1.
145
1.05
4 1.
206
V3
1 67
.1
±0.
003
±0
.070
±
0.00
8 ±
0.0
14
±0.
014
1.21
6 5.
100
1.06
9 1.
126
1.20
4 V
4 1
78.6
±
0.00
2 ±
0.0
50
±0.
007
±0 .
011
±
0.00
9
0.28
6 1.
056
1.5
68
0.77
9 1.
221
vs
Cle
aned
co
ncre
tion
56
.9
±0.
0 01
±0.
007
±0.
011
±0.
009
±0.
012
Ha n
d-p
icke
d 0.
213
0.
905
1.62
7 0.
827
1.34
6 V
S'
56.9
vi
vian
ite g
rain
s ±
0.00
1 ±
0.0
12
±0
.017
±
0.11
1 ±
0.1
82
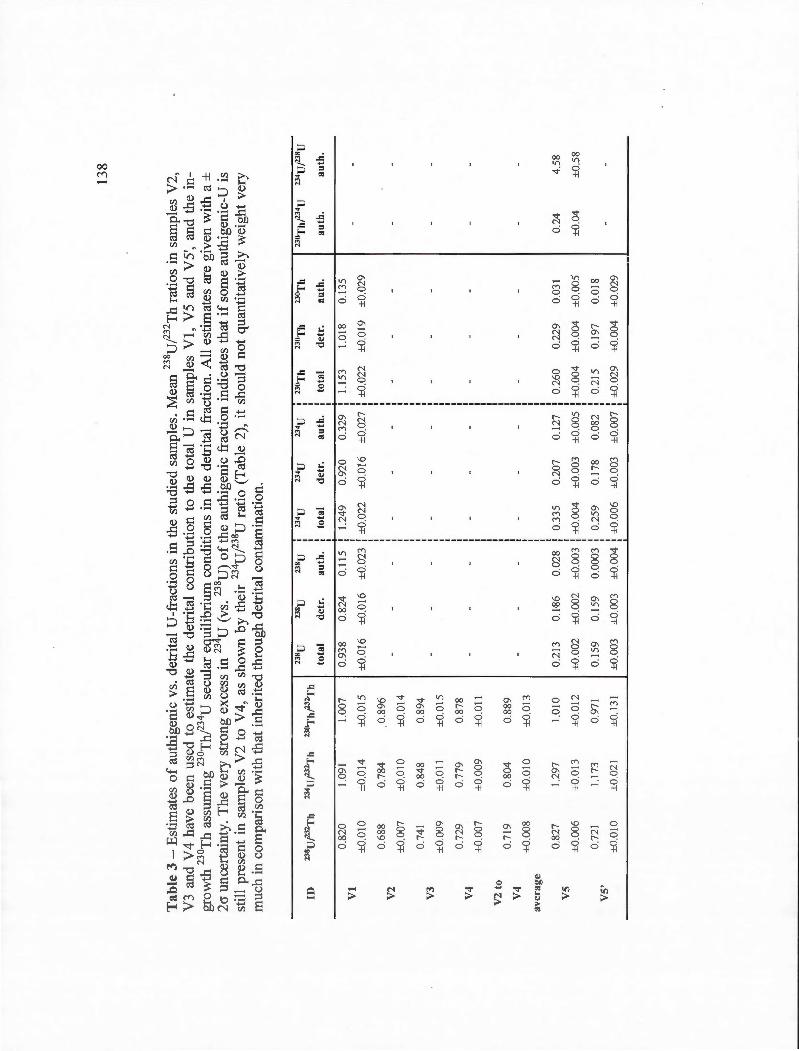
138
Tab
le 3
-E
stim
ates
of
auth
igen
ic v
s. d
etri
tal
V-f
ract
ions
in
the
stud
ied
sam
ple
s. M
ean
238 U
P32
Th
rati
os i
n sa
mpl
es V
2,
V3
and
V4
have
bee
n us
ed t
o es
tim
ate
the
detr
ital
con
trib
utio
n to
the
tot
al U
in
sam
ples
VI,
V5
and
V5'
, an
d th
e in
-gr
owth
230 T
h as
sum
ing
230 T
hP34
U s
ecul
ar e
3uil
ibri
um c
ondi
tion
s in
the
det
rita
l fr
acti
on. A
li es
tim
ates
are
giv
en w
ith
a±
2c
r un
cert
aint
y. T
he v
ery
stro
ng e
xces
s in
23 U
(vs
. 23
8 U)
of
the
auth
igen
ic f
ract
ion
indi
cate
s th
at i
f so
rne
auth
igen
ic-U
is
still
pre
sent
in
sam
ples
V2
to V
4,
as s
how
n by
the
ir 23
4 U/23
8 U r
atio
(T
able
2),
it s
hou
ld n
ot q
uant
itat
ive)
y w
eigh
t ve
ry
muc
h in
com
pari
son
wit
h th
at i
nher
ited
thr
ough
det
rita
l co
ntam
inat
ion.
zJsu
zJ
su
23su
1
134u
13
4u
234u
:
13
'7h
13
'7h
zJoT
h z3
o.r 11p
34
u
134u
123s
u zJsup3~
11 13
4U/2
32T
h 230ThP
3~
h 1
ID
1 1
tota
l d
etr.
au
th.
: to
tal
detr
. au
th.
: to
tal
detr
. au
th.
au th
. au
th.
1 1
0.8
20
1.09
1 1.
007
0.93
8 0.
824
0.11
5 :
1.24
9 0.
920
0.32
9 :
1.15
3 1.
018
0.
135
Vl
1 1
±0.0
10
±0.0
14
±0
.015
±
0.0
16
±0.
016
±0.
023
: ±
0.02
2 ±
0.0
16
±0.
027
: ±
0.0
22
±0.0
19
±0.
029
! !
0.6
88
0.78
4 0.
896
V2
±0.
007
±0.
010
±0.
014
0.74
1 0.
848
0.8
94
V3
±0
.009
±0
.011
±
0.0
15
0.72
9 0.
779
0.8
78
V4
±0
.007
±
0.00
9 ±
0.0
11
V2
to
0.7
19
0.80
4 0
.889
V
4 ±
0.00
8 ±0
.010
±
0.0
13
aver
age
0.8
27
1.29
7 1.
010
0
.213
0.
1-86
0.
028
: 0.
335
0.20
7 0.
127
: 0.
260
0.22
9 0.
031
1
0.24
4
.58
vs
1 1
±0.
006
±0.
013
±0.
012
±0
.002
±
0.0
02
±0.
003
: ±
0.00
4 ±
0.0
03
±0.
005
: ±
0.00
4 ±
0.00
4 ±
0.0
05
±0.
04
±0.
58
1 1
0.72
1 1.
173
0.97
1 0
. 159
0.
159
0.00
03
: 0.
259
0.1
78
0.08
2 :
0.2
15
0.19
7 0.
018
V
S'
1 1
1 1
±0.
010
±0
.02
1 ±
0.13
1 ±
0.00
3 ±
0.00
3 ±
0.00
4 !
±0.
006
±0
.003
±
0.00
7 !
±0
.029
±
0.00
4 ±
0.02
9
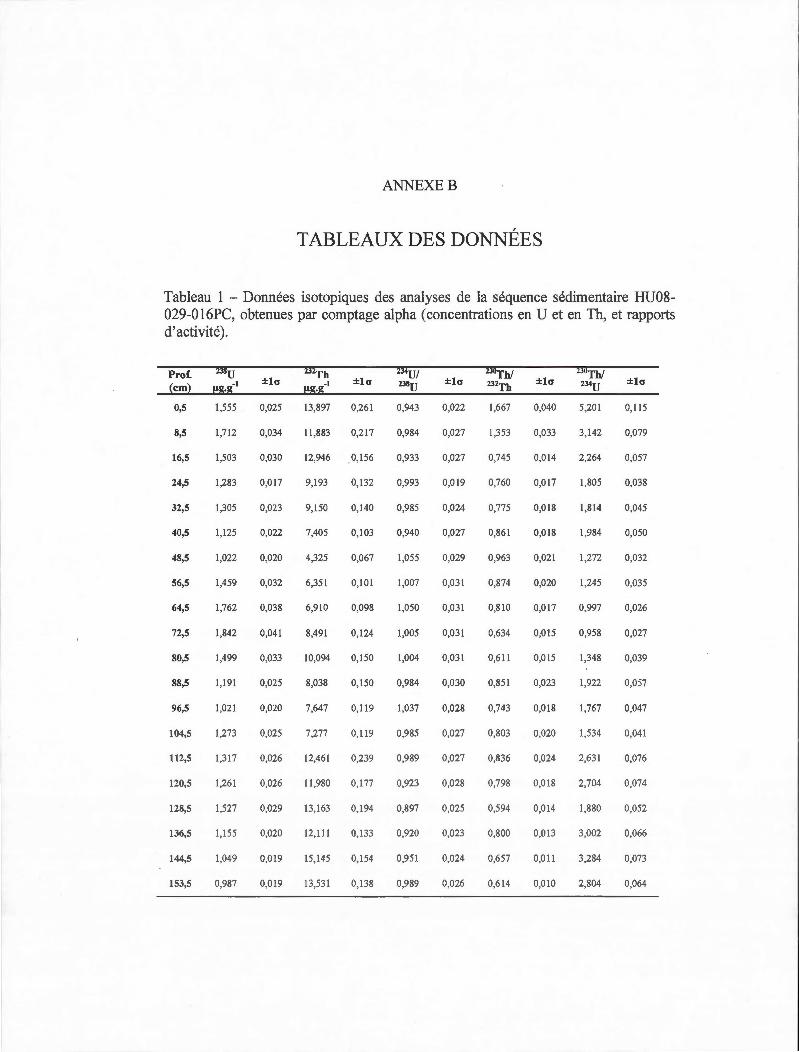
ANNEXE E
TABLEAUX DES DONNÉES
Tableau 1 - Données isotopiques des analyses de la séquence sédimentaire HU08-029-0 16PC, obtenues par comptage alpha (concentrations en U et en Th, et rapports d'activité).
Prof. 23Hu ±l o
232Th ±l o
n•u/ ±lu
ZJUTh/ ±lo
noT h/ ±lo
{cm2 I!:G·G-1 -1 zJsu 232T h 23-' u I!:G-G
0,5 1,555 O,Q25 13,897 0,261 0,943 0,022 1,667 0,040 5,201 0, 115
8,5 1,712 0,034 11 ,883 0,2 17 0,984 0,027 1,353 0,033 3,142 0,079
16,5 1,503 0,030 12,946 0,156 0,933 0,027 0,745 0,0 14 2,264 0,057
24,5 1,283 0,0 17 9,193 0,132 0,993 0,0 19 0,760 0,017 1,805 0,038
32,5 1,305 0,023 9,150 0,140 0,985 0,024 0,775 0,0 18 1,8 14 0,045
40,5 1,125 0,022 7,405 0,103 0,940 0,027 0,86 1 0,0 18 1,984 0,050
48,5 1,022 0,020 4,325 0,067 1,055 0,029 0,963 0,02 1 1,272 0,032
56,5 1,459 0,032 6,351 0,101 1,007 0,031 0,874 0,020 1,245 0,035
64,5 1,762 0,038 6,910 0,098 1,050 0,03 1 0,810 0,0 17 0,997 0,026
72,5 1,842 0,041 8,491 0,124 1,005 0,03 1 0,634 0;0 15 0,958 0,027
80,5 1,499 0,033 10,094 0,150 1,004 0,03 1 0,61 1 0,0 15 1,348 0,039
88,5 1,19 1 0,025 8,038 0,150 0,984 0,030 0,851 0,023 1,922 0,057
96,5 1,02 1 0,020 7,647 0,119 1,037 0,028 0,743 0,0 18 1,767 0,047
104,5 1.273 0.025 7.277 O.ll9 0,985 0,027 0,803 0,020 1,534 0,041
112,5 1,317 0,026 12,461 0,239 0,989 0,027 0,836 0,024 2,631 0,076
120,5 1,261 0,026 11 ,980 0,177 0,923 0,028 0,798 0,0 18 2,704 0,074
128,5 1,527 0,029 13,163 0,194 0,897 0,025 0,594 0,014 1,880 0,052
136,5 1,155 0,020 12,111 0,133 0,920 0,023 0,800 0,013 3,002 0,066
144,5 1,049 0,019 15, 145 0,154 0,951 0,024 0,657 0,011 3,284 0,073
153,5 0,987 0,019 13,531 0,138 0,989 0,026 0,614 0,010 2,804 0,064
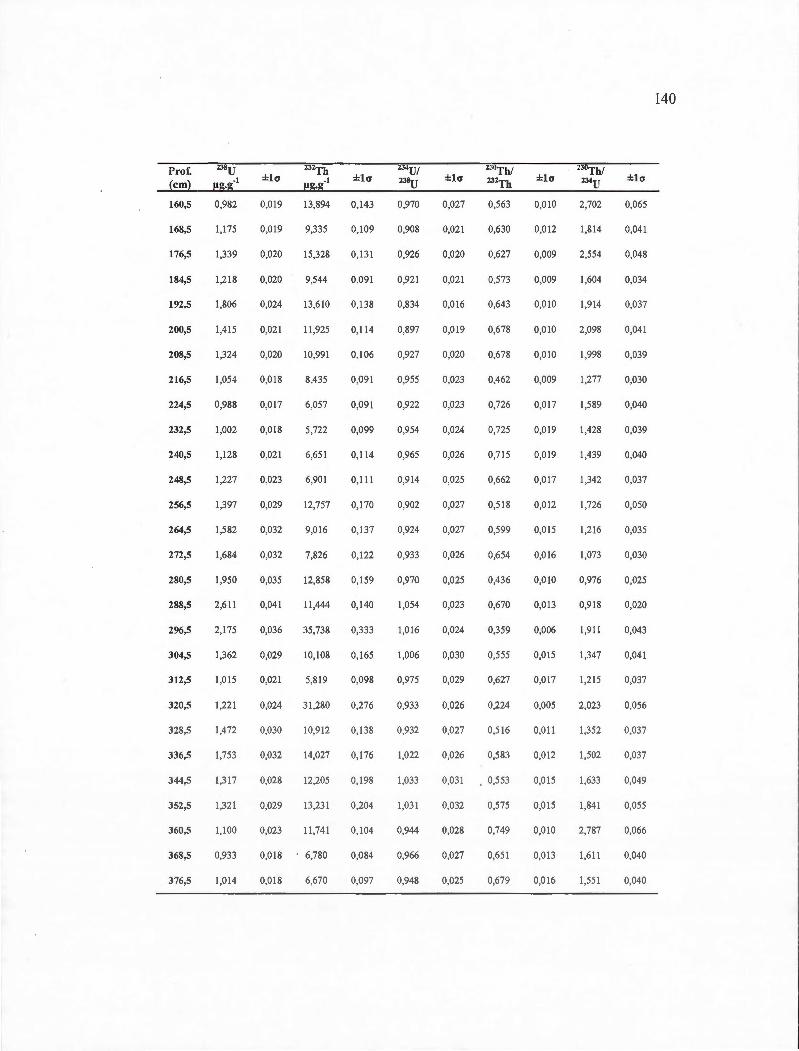
Prof. (cm)
160,5
168,5
176,5
184,5
192,5
200,5
208,5
216,5
224,5
232,5
240,5
248,5
256,5
264,5
272,5
280,5
288,5
296,5
304,5
312,5
320,5
328,5
336,5
344,5
352,5
360,5
368,5
376,5
0,982
1,175
1,339
1,218
1,806
1,415
1,324
1,054
0,988
1,002
1,128
1,227
1,397
1,582
1,684
1,950
2,6 11
2,175
1,362
1,0 15
1,221
1,472
1,753
1,317
1,321
1,100
0,933
1,014
±1G
0,0 19
0,019
0,020
0,020
0,024
0,021
0,020
0,018
0,017
0,018
0,021
0,023
0,029
0,032
0,032
0,035
0,041
0,036
0,029
0,02 1
0,024
O,ü30
0,032
0,028
0,029
0,023
0,018
0,018
±l<J
13,894 0,143 0,970
9,335 0,109 0,908
15,328 0,13 1 0,926
9,544 0,09 1 0,921
13,610 0,138 0,834
11,925 0,11 4 0,897
10,991 0,106 0,927
8,435 0,091 0,955
6,057 0,09 1 0,922
5,722 0,099 0,954
6,65 1 0,1 14 0,965
6,90 1 0,11 1 0,914
12,757 0,170 0,902
9,016 0,137 0,924
7,826 0,122 0,933
12,858 0,159 0,970
11 ,444 0,140 1,054
35,738 0,333 1,016
10,108 0,165 1,006
5,819 0,098 0,975
31 ,280 0,276 0,933
10,91 2 0,138 0.932
14,027 0,176 1,022
12,205 0,198 1,033
13,231 0,204 1,031
11,741 0,104 0,944
6,780 0,084 0,966
6,670 0,097 0,948
140
±1G ±l<J ±1G
0,027 0,563 0,0 10 2,702 0,065
0,02 1 0,630 0,0 12 1,814 0,041
0,020 0,627 0,009 2,554 0,048
0,021 0,573 0,009 1,604 0,034
0,016 0,643 0,0 10 1,9 14 0,037
0,0 19 0,678 0,0 10 2,098 0,041
0,020 0,678 0,010 1,998 0,039
0,023 0,462 0,009 1,277 O,ü30
0,023 0,726 0,017 1,589 0,040
0,024 0,725 0,0 19 1,428 0,039
0,026 0,7 15 0,0 19 1,439 0,040
0,025 0,662 0,0 17 1,342 0,037
0,027 0,5 18 0,0 12 1,726 0,050
0,027 0,599 0,0 15 1,216 0,035
0,026 0,654 0,0 16 1,073 0,030
0,025 0,436 0,0 10 0,976 0,025
0,023 0,670 0,013 0,9 18 0,020
0,024 0,359 0,006 1,9 11 0,043
O,ü30 0,555 0,0 15 1,347 0,04 1
0,029 0,627 0,0 17 1,215 0,037
0,026 0,224 0,005 2,023 0,056
0.027 0.5 16 0.011 1,352 0,037
0,026 0,583 0,012 1,502 0,037
0,03 1 . 0,553 0,0 15 1,633 0,049
0,032 0,575 0,01 5 1,841 0,055
0,028 0,749 0,010 2,787 0,066
0,027 0,651 0,01 3 1,611 0,040
0,025 0,679 0,016 1,55 1 0,040
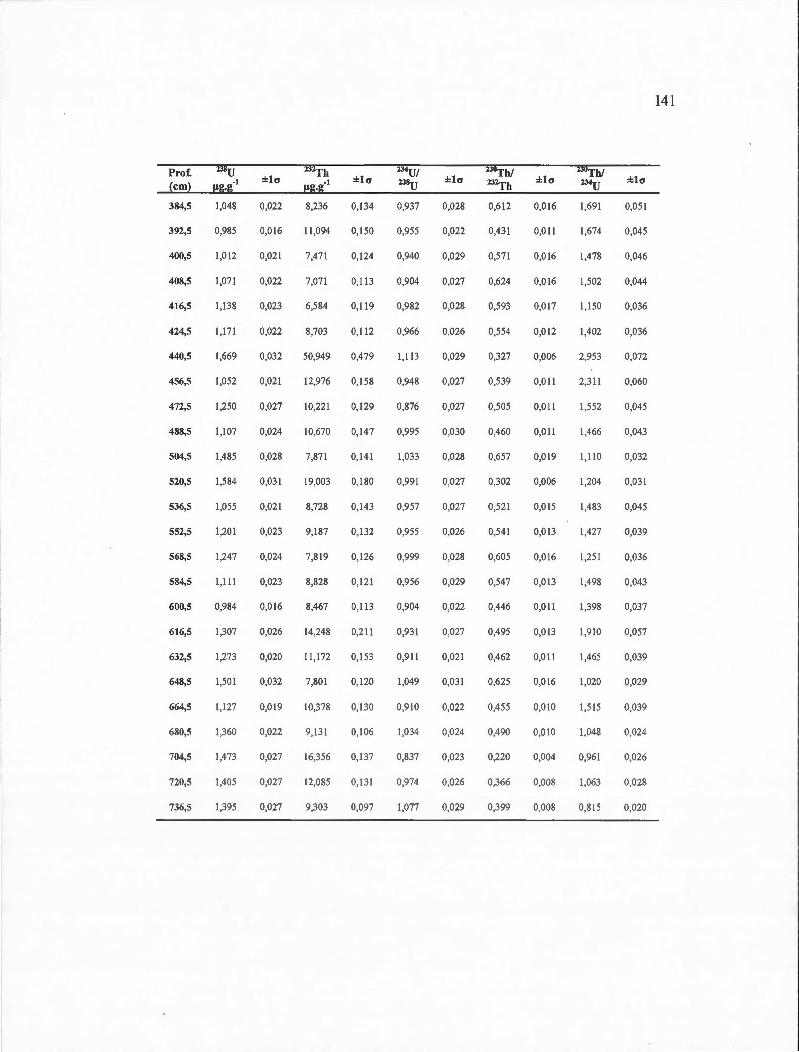
Prof. (cm)
384,5
392,5
400,5
408,5
416,5
424,5
440,5
456,5
472,5
488,5
504,5
520,5
536,5
552,5
568,5
584,5
600,5
616,5
632,5
648,5
664,5
680,5
704,5
720,5
736,5
1,048
0,985
1,0 12
1,071
1,138
1,171
1,669
1,052
1,250
1,107
1,485
1,584
1,055
1,20 1
1,247
1,111
0,984
1,307
1,273
1,50 1
1,127
1,360
1,473
1,405
1,395
±la
0,022
0,0 16
0,021
0,022
0,023
0,022
0,032
0,021
0,027
0,024
0,028
0,03 1
0,02 1
0,023
0,024
0,023
0,0 16
0,026
0,020
0,032
0,019
0,022
0,027
0,027
0,027
±la
8,236 0,134 0,937
11 ,094 0,150 0,955
7,471 0,124 0,940
7,071 0,1 13 0,904
6,584 0,11 9 0,982
8,703 0,11 2 0,966
50,949 0,479 1,113
12,976 0,158 0,948
10,22 1 0,129 0,876
10,670 0,147 0,995
7,87 1 0,14 1 1,033
19,003 0,180 0,991
8,728 0,143 0,957
9,187 0,132 0,955
7,819 0,126 0,999
8,828 0,121 0,956
8,467 0,11 3 0,904
14,248 0,2 11 0,931
11,172 0,153 0,9 11
7,80 1 0,120 1,049
10,378 0,1 30 0,910
9,131 0,106 1,034
16,356 0,137 0,837
12,085 0,131 0,974
9,303 0,097 1,077
141
±la ±la ±la
0,028 0,6 12 0,0 16 1,691 0,05 1
0,022 0,431 0,0 11 1,674 0,045
0,029 0,571 0,0 16 1,478 0,046
0,027 0,624 0,01 6 1,502 0,044
0,028 0,593 0,0 17 1, 150 0,036
0,026 0,554 0,0 12 1,402 0,036
0,029 0,327 0,006 2,953 0,072
0,027 0,539 0,0 11 2,311 0,060
0,027 0,505 0,011 1,552 0,045
0,030 0,460 0,0 11 1,466 0,043
0,028 0,657 0,0 19 1,110 0,032
0,027 0,302 0,006 1,204 0,031
0,027 0,52 1 0,015 1,483 0,045
0,026 0,54 1 0,0 13 1,427 0,039
0,028 0,605 0,0 16 1,251 0,036
0,029 0,547 0,013 1,498 0,043
0,022 0,446 0,0 11 1,398 0,037
0,027 0,495 0,0 13 1,9 10 0,057
0,02 1 0,462 0,0 11 1,465 0,039
0,03 1 0,625 0,016 1,020 0,029
0,022 0,455 0,0 10 1,5 15 0,039
0,024 0,490 0,010 1,048 0,024
0,023 0,220 0,004 0,961 0,026
0,026 0,366 0,008 1,063 0,028
0,029 0,399 0,008 0,815 0,020
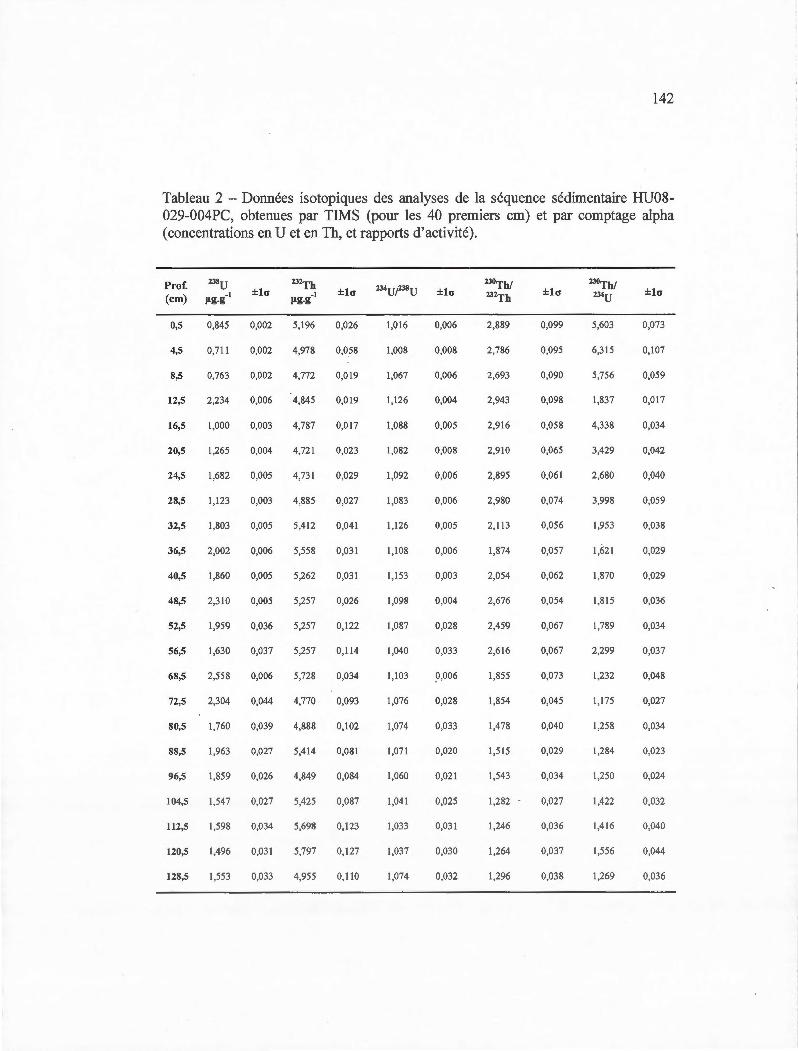
142
Tableau 2 - Données isotopiques des analyses de la séquence sédimentaire HU08-029-004PC, obtenues par TIMS (pour les 40 premiers cm) et par comptage alpha (concentrations en U et en Th, et rapports d' activité).
Prof. (cm)
0,5
4,5
8,5
12,5
16,5
20,5
24,5
28,5
32,5
36,5
40,5
48,5
52,5
56,5
68,5
72,5
80,5
88,5
96,5
104,5
112,5
120,5
128,5
0,845
0,7 11
0,763
2,234
1,000
1,265
1,682
1,123
1,803
2,002
1,860
2,310
1,959
1,630
2,558
2,304
1,760
1,963
1,859
1,547
1,598
1,496
1,553
±la
0,002 5,196
0,002 4,978
0,002 4,772
0,006 4,845
0,003 4,787
0,004 4,72 1
0,005 4,731
0,003 4,885
0,005 5,4 12
0,006 5,558
0,005 5,262
0,005 5,257
0,036 5,257
0,037 5,257
0,006 5,728
0,044 4,770
0,039 4,888
0,027 5,414
0,026 4,849
0,027 5,425
0,034 5,698
0,031 5,797
0,033 4,955
±la ±la ±la
0,026 1,016 0,006 2,889 0,099 5,603 0,073
0,058 1,008 0,008 2,786 0,095 6,315 0,107
0,0 19 1,067 0,006 2,693 0,090 5,756 0,059
0,019 1,126 0,004 2,943 0,098 1,837 0,017
0,0 17 1,088 0,005 2,9 16 0,058 4,338 0,034
0,023 1,082 0,008 2,910 0,065 3,429 0,042
0,029 1,092 0,006 2,895 0,061 2,680 0,040
0,027 1,083 0,006 2,980 0,074 3,998 0,059
0,041 1,126 0,005 2,113 0,056 1,953 0,038
0,031 1,108 0,006 1,874 0,057 1,621 0,029
0,031 1,153 0,003 2,054 0,062 1,870 0,029
0,026 1,098 0,004 2,676 0,054 1,815 0,036
0,122 1,087 0,028 2,459 0,067 1,789 0,034
0,11 4 1,040 0,033 2,616 0,067 2,299 0,037
0,034 1,103 0,006 1,855 0,073 1,232 0,048
0,093 1,076 0,028 1,854 0,045 1,175 0,027
0,102 1,074 0,033 1,478 0,040 1,258 0,034
0,081 1,071 0,020 1,5 15 0,029 1,284 0,023
0,084 1,060 0,021 1,543 0,034 1,250 0,024
0,087 1,041 0,025 1,282 0,027 1,422 0,032
0,123 1,033 0,031 1,246 0,036 1,4 16 0,040
0,127 1,037 O,D30 1,264 0,037 1,556 0,044
0,110 1,074 0,032 1,296 0,038 1,269 0,036
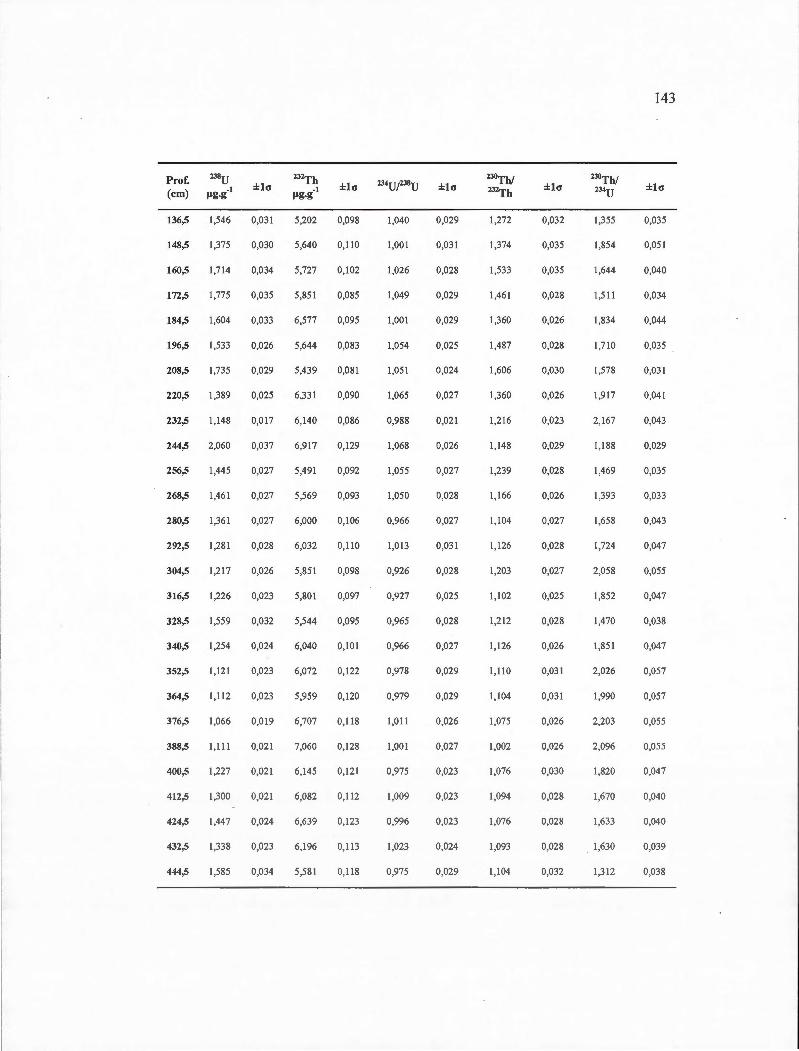
Prof. (cm)
136,5
148,5
160,5
172,5
184,5
196,5
208,5
220,5
232,5
244,5
256,5
268,5
280,5
292,5
304,5
316,5
328,5
340,5
352,5
364,5
376,5
388,5
400,5
412,5
424,5
432,5
444,5
1,546
1,375
1,7 14
1,775
1,604
1,533
1,735
1,389
1,148
2,060
1,445
1,46 1
1,36 1
1,281
1,217
1,226
1,559
1,254
1,12 1
1,112
1,066
1,111
1,227
1,300
1,447
1,338
1,585
±la
0,03 1
O,D30
0,034
0,035
0,033
0,026
0,029
0,025
0,017
0,037
0,027
0,027
0,027
0,028
0,026
0,023
0,032
0,024
0,023
0,023
0,019
0,021
0,021
0,021
0,024
0,023
0,034
±la
5,202 0,098 1,040 0,029
5,640 0,110 1,00 1 0,031
5,727 0,102 1,026 0,028
5,85 1 0,085 1,049 0,029
6,577 0,095 1,001 0,029
5,644 0,083 1,054 0,025
5,439 0,081 1,05 1 0,024
6,33 1 0,090 1,065 0,027
6,140 0,086 0,988 0,02 1
6,917 0,129 1,068 0,026
5,49 1 0,092 1,055 0,027
5,569 0,093 1,050 0,028
6,000 0,106 0,966 0,027
6,032 0,110 1,013 0,031
5,85 1 0,098 0,926 0,028
5,80 1 0,097 0,927 0,025
5,544 0,095 0,965 0,028
6,040 0,101 0,966 0,027
6,072 0,122 0,978 0,029
5,959 0,120 0,979 0,029
6,707 0,118 1,011 0,026
7,060 0,128 1,001 0,027
6,145 0,121 0,975 0,023
6,082 0,112 1,009 0,023
6,639 0,123 0,996 0,023
6,196 0,113 1,023 0,024
5,581 0,118 0,975 0,029
143
±la ±la
1,272 0,032 1,355 0,035
1,374 0,035 1,854 0,05 1
1,533 0,035 1,644 0,040
1,461 0,028 1,5 11 0,034
1,360 0,026 1,834 0,044
1,487 0,028 1,7 10 0,035
1,606 0,030 1,578 0,03 1
1,360 0,026 1,9 17 0,04 1
1,216 0,023 2,167 0,043
1,148 0,029 1, 188 0,029
1,239 0,028 1,469 O,D35
1,166 0,026 1,393 0,033
1,104 0,027 1,658 0,043
1,126 0,028 1,724 0,047
1,203 0,027 2,058 0,055
1,102 0,025 1,852 0,047
1,212 0,028 1,470 O,D38
1,126 0,026 1,85 1 0,047
1,11 0 0,03 1 2,026 0,057
1, 104 0,03 1 1,990 0,057
1,075 0,026 2,203 0,055
1,002 0,026 2,096 0,055
1,076 0,030 1,820 0,047
1,094 0,028 1,670 0,040
1,076 0,028 1,633 0,040
1,093 0,028 1,630 0,039
1,104 0,032 1,312 0,038
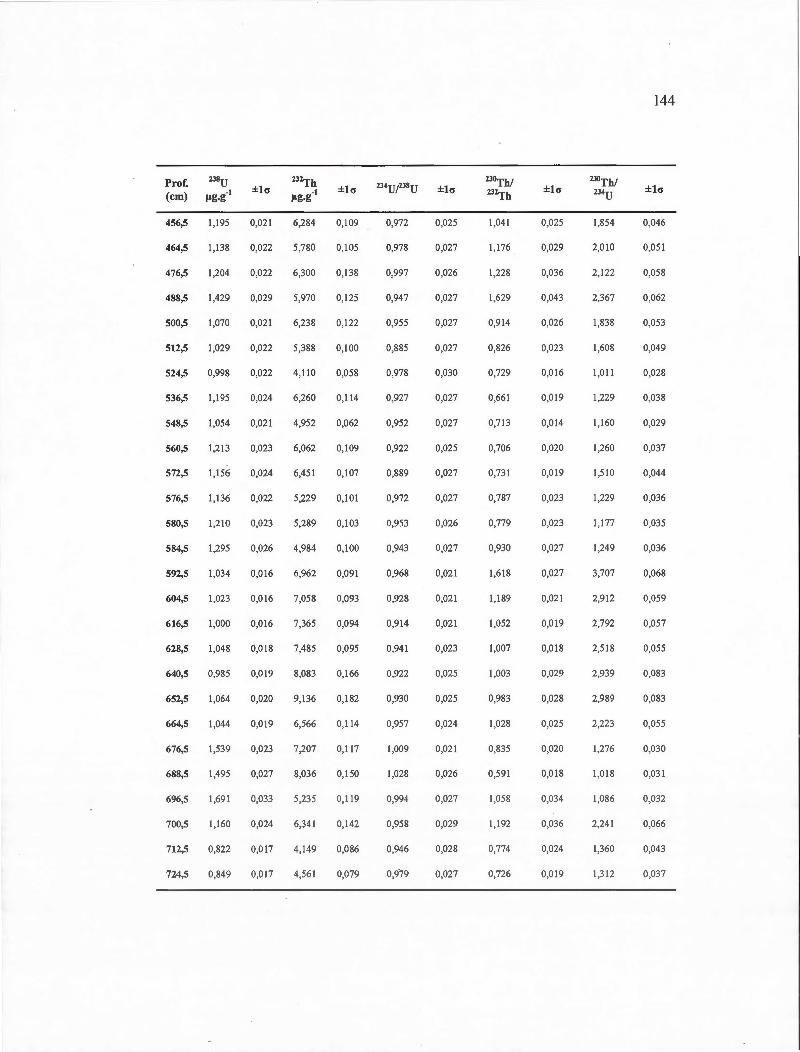
Prof. (cm)
456,5
464,5
476,5
488,5
500,5
512,5
524,5
536,5
548,5
560,5
572,5
576,5
580,5
584,5
592,5
604,5
616,5
628,5
640,5
652,5
664,5
676,5
688,5
696,5
700,5
712,5
724,5
238u - 1
" g.g
1,195
1,138
1,204
1,429
1,070
1,029
0,998
1,195
1,054
1,2 13
1,156
1,136
1,210
1,295
1,034
1,023
1,000
1,048
0,985
1,064
1,044
1,539
1,495
1,691
1,160
0,822
0,849
±la
0,021 6,284 0,109 0,972
0,022 5,780 0,105 0,978
0,022 6,300 0, 138 0,997
0,029 5,970 0,125 0,947
0,021 6,238 0,122 0,955
0,022 5,388 0,100 0,885
0,022 4, 110 0,058 0,978
0,024 6,260 0,114 0,927
0,021 4,952 0,062 0,952
0,023 6,062 0,109 0,922
0,024 6,451 0,107 0,889
0,022 5,229 0,101 0,972
0,023 5,289 0,103 0,953
0,026 4,984 0,100 0,943
0,01 6 6,962 0,091 0,968
0,016 7,058 0,093 0,928
0,016 7,365 0,094 0,914
0,01 8 7,485 O,ü95 0,94 1
0,019 8,083 0,166 0,922
0,020 9,136 0,182 0,930
0,019 6,566 0,114 0,957
0,023 7,207 0,11 7 1,009
0,027 8,036 0,150 1,028
0,033 5,235 0,119 0,994
0,024 6,341 0,142 0,958
0,017 4, 149 0,086 0,946
0,017 4,561 0,079 0,979
144
±la ±la ±la
0,025 1,041 0,025 1,854 0,046
0,027 1,176 0,029 2,010 0,051
0,026 1,228 0,036 2,122 0,058
0,027 1,629 0,043 2,367 0,062
0,027 0,9 14 0,026 1,838 0,053
0,027 0,826 0,023 1,608 0,049
0,030 0,729 0,016 1,0 11 0,028
0,027 0,66 1 0,0 19 1,229 0,038
0,027 0,713 0,014 1, 160 0,029
0,025 0,706 0,020 1,260 0,037
0,027 0,731 0,019 1,510 0,044
0,027 0,787 0,023 1,229 0,036
0,026 0,779 0,023 1,177 0,035
0,027 0,930 0,027 1,249 0,036
0,021 1.,6 18 0,027 3,707 0,068
0,02 1 1, 189 0,021 2,912 0,059
0,021 1,052 0,019 2,792 0,057
0,023 1,007 0,0 18 2,518 0,055
0,025 1,003 0,029 2,939 0,083
0,025 0,983 0,028 2,989 0,083
0,024 1,028 0,025 2,223 0,055
0,021 0,835 0,020 1,276 0,030
0,026 0,591 0,018 1,018 0,031
0,027 1,058 0,034 1,086 0,032
0,029 1,192 0,036 2,241 0,066
0,028 0,774 0,024 1,360 0,043
0,027 0,726 0,019 1,3 12 0,037
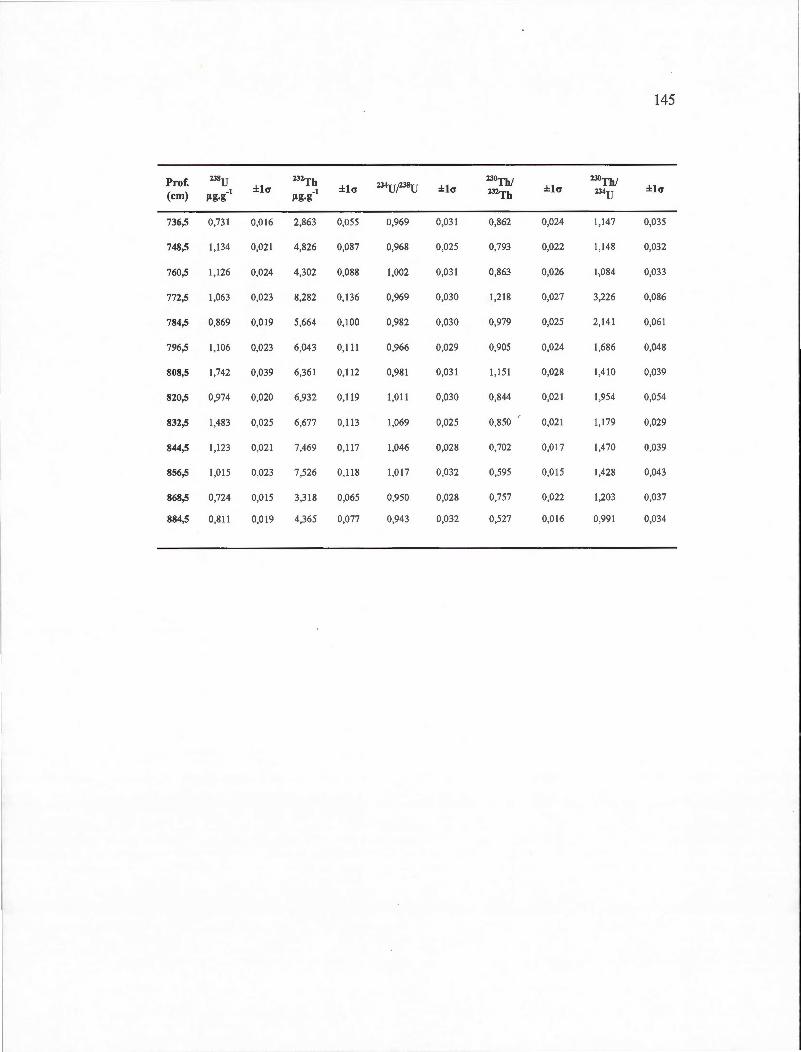
145
Prof. zJSu ±l<J
232Th ±l<J 234U/238U ±l<J
2JoTh/ ±l<J
230Th/ ±la
(cm) - 1 - 1 232Th 234u pg.g Jlg.g
736,5 0,73 1 0,016 2,863 0,055 0,969 0,031 0,862 0,024 1,147 0,035
748,5 1,134 0,021 4,826 0,087 0,968 0,025 0,793 0,022 1,148 0,032
760,5 1,126 0,024 4,302 0,088 1,002 0,031 0,863 0,026 1,084 0,033
772,5 1,063 0,023 8,282 0,136 0,969 0,030 1,218 0,027 3,226 0,086
784,5 0,869 0,019 5,664 0,100 0,982 0,030 0,979 0,025 2,141 0,061
796,5 1,106 0,023 6,043 0,111 0,966 0,029 0,905 0,024 1,686 0,048
808,5 1,742 0,039 6,36 1 0,11 2 0,98 1 0,03 1 1,151 0,028 1,410 0,039
820,5 0,974 0,020 6,932 0,119 1,011 0,030 0,844 0,021 1,954 0,054
832,5 1,483 O,ü25 6,677 0,113 1,069 0,025 0,850 0,021 1,179 0,029
844,5 1,123 0,021 7,469 0,117 1,046 0,028 0,702 0,017 1,470 0,039
856,5 1,015 0,023 7,526 0,11 8 1,017 0,032 0,595 0,0 15 1,428 0,043
868,5 0,724 0,015 3,3 18 0,065 0,950 0,028 0,757 0,022 1,203 0,037
884,5 0,81 1 0,0 19 4,365 0,077 0,943 0,032 0,527 0,0 16 0,991 0,034
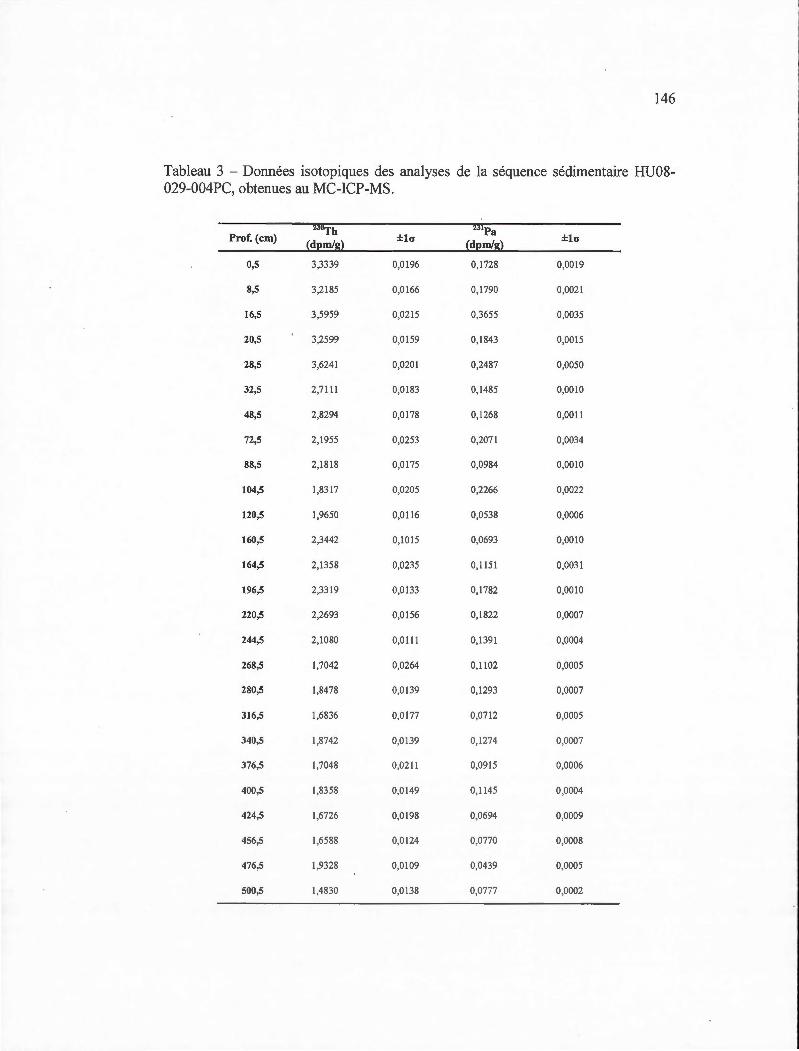
146
Tableau 3 - Données isotopiques des analyses de la séquence sédimentaire HUOS-029-004PC, obtenues au MC-ICP-MS.
Prof. (cm) 23oTh
±la 2Jip
3 ±la
{d(!mlg~ {d(!mlg~
0,5 3,3339 0,0 196 0,1728 0,0019
8,5 3,2185 0,0 166 0,1790 0,002 1
16,5 3,5959 0,0215 0,3655 0,0035
20,5 3,2599 0,0 159 0,1843 0,00 15
28,5 3,6241 0,020 1 0,2487 0,0050
32,5 2,7111 0,0183 0,1485 0,0010
48,5 2,8294 0,0 178 0,1268 0,00 11
72,5 2,1955 0,0253 0,2071 0,0034
88,5 2,1818 0,0175 0,0984 0,00 10
104,5 1,83 17 0,0205 0,2266 0,0022
120,5 1,9650 0,0 11 6 0,0538 0,0006
160,5 2,3442 0,1015 0,0693 0,0010
164,5 2,1358 0,0235 0,1 151 0,003 1
196,5 2,3319 0,0133 0,1782 0,0010
220,5 2,2693 0,0156 0,1822 0,0007
244,5 2,1080 0,01 11 0,1391 0,0004
268,5 1,7042 0,0264 0,1102 0,0005
280,5 1,8478 0,0139 0,1293 0,0007
316,5 1,6836 0,0177 0,0712 0,0005
340,5 1,8742 0,0139 0,1274 0,0007
376,5 1,7048 0,0211 0,0915 0,0006
400,5 1,8358 0,0149 0,1145 0,0004
424,5 1,6726 0,0198 0,0694 0,0009
456,5 1,6588 0,0124 0,0770 0,0008
476,5 1,9328 0,0109 0,0439 0,0005
500,5 1,4830 0,0138 0,0777 0,0002
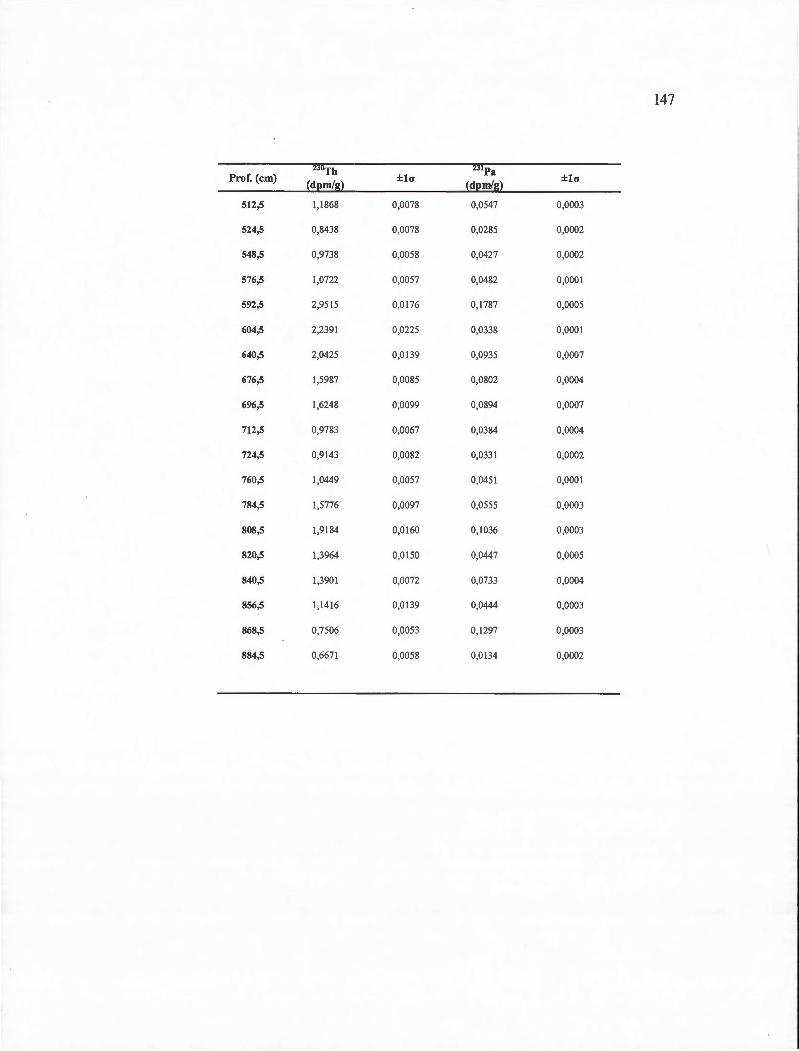
147
Prof. (cm) 23oTh
±la 2Jipa
±la (dprnlg) (dp rnlg)
512,5 1,1868 0,0078 0,0547 0,0003
524,5 0,8438 0,0078 0,0285 0,0002
548,5 0,9738 0,0058 0,0427 0,0002
576,5 1,0722 0,0057 0,0482 0,0001
592,5 2,95 15 0,0176 0,1787 0,0005
604,5 2,2391 0,0225 0,0338 0,0001
640,5 2,0425 0,0 139 0,0935 0,0007
676,5 1,5987 0,0085 0,0802 0,0004
696,5 1,6248 0,0099 0,0894 0,0007
712,5 0,9783 0,0067 0,0384 0,0004
724,5 0,9143 0,0082 0,033 1 0,0002
760,5 1,0449 0,0057 0,0451 0,000 1
784,5 1,5776 0,0097 0,0555 0,0003
808,5 1,9184 0,0160 0,1036 0,0003
820,5 1,3964 0,0150 0,0447 0,0005
840,5 1,3901 0,0072 0,0733 0,0004
856,5 1,14 16 0,0139 0,0444 0,0003
868,5 0,7506 0,0053 0,1297 0,0003
884,5 0,667 1 0,0058 0,0 134 0,0002
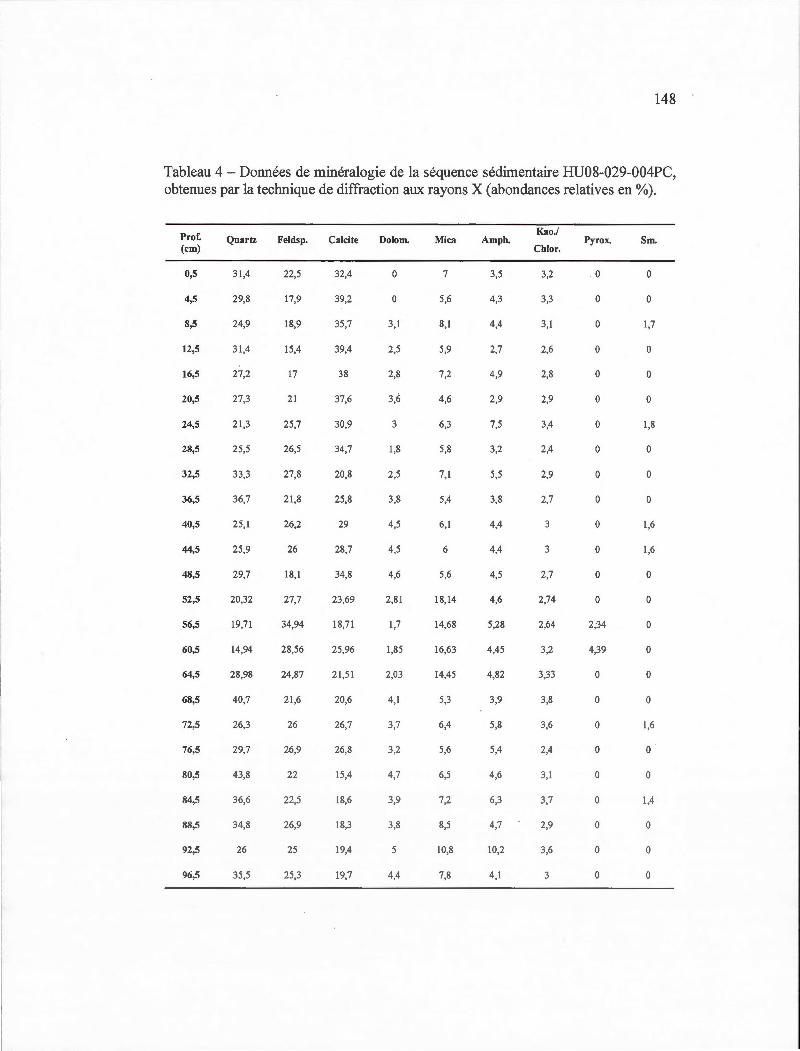
148
Tableau 4 - Données de minéralogie de la séquence sédimentaire HU08-029-004PC, obtenues par la technique de diffraction aux rayons X (abondances relatives en %).
Prof. (cm)
0,5
4,5
8,5
12,5
16,5
20,5
24,5
28,5
32,5
36,5
40,5
44,5
48,5
52,5
56,5
60,5
64,5
68,5
72,5
76,5
80,5
84,5
88,5
92,5
96,5
Quartz Feldsp. Calcite Dolom.
3 1,4 22,5 32,4 0
29,8 17,9 39,2 0
24,9 18,9 35,7 3,1
3 1,4 15,4 39,4 2,5
27,2 17 38 2,8
27,3 21 37,6 3,6
2 1,3 25,7 30,9 3
25,5 26,5 34,7 1,8
33,3 27,8 20,8 2,5
36,7 2 1,8 25,8 3,8
25,1 26,2 29 4,5
25,9 26 28,7 4,5
29,7 18, 1 34,8 4,6
20 ,32 27,7 23,69 2,8 1
19,71 34,94 18,7 1 1,7
14,94 28,56 25,96 1,85
28,98 24,87 2 1,5 1 2,03
40,7 21,6 20,6 4,1
26,3 26 26,7 3,7
29,7 26,9 26,8 3,2
43,8 22 15,4 4,7
36,6 22,5 18,6 3,9
34,8 26,9 18,3 3,8
26 25 19,4 5
35,5 25,3 19,7 4,4
Mica Am ph.
7 3,5
5,6 4,3
8,1 4,4
5,9 2,7
7,2 4,9
4,6 2,9
6,3 7,5
5,8 3,2
7,1 5,5
5,4 3,8
6,1 4,4
6 4,4
5,6 4,5
18,14 4,6
14,68 5,28
16,63 4,45
14,45 4,82
5,3 3,9
6,4 5,8
5,6 5,4
6,5 4,6
7,2 6,3
8,5 4,7
10,8 10,2
7,8 4,1
Ka o./
Ch lor.
3,2
3,3
3, 1
2,6
2,8
2,9
3,4
2,4
2,9
2,7
3
3
2,7
2,74
2,64
3,2
3,33
3,8
3,6
2,4
3,1
3,7
2,9
3,6
3
Pyrox. Sm.
0 0
0 0
0 1,7
0 0
0 0
0 0
0 1,8
0 0
0 0
0 0
0 1,6
0 1,6
0 0
0 0
2;34 0
4,39 0
0 0
0 0
0 1.6
0 0
0 0
0 1,4
0 0
0 0
0 0
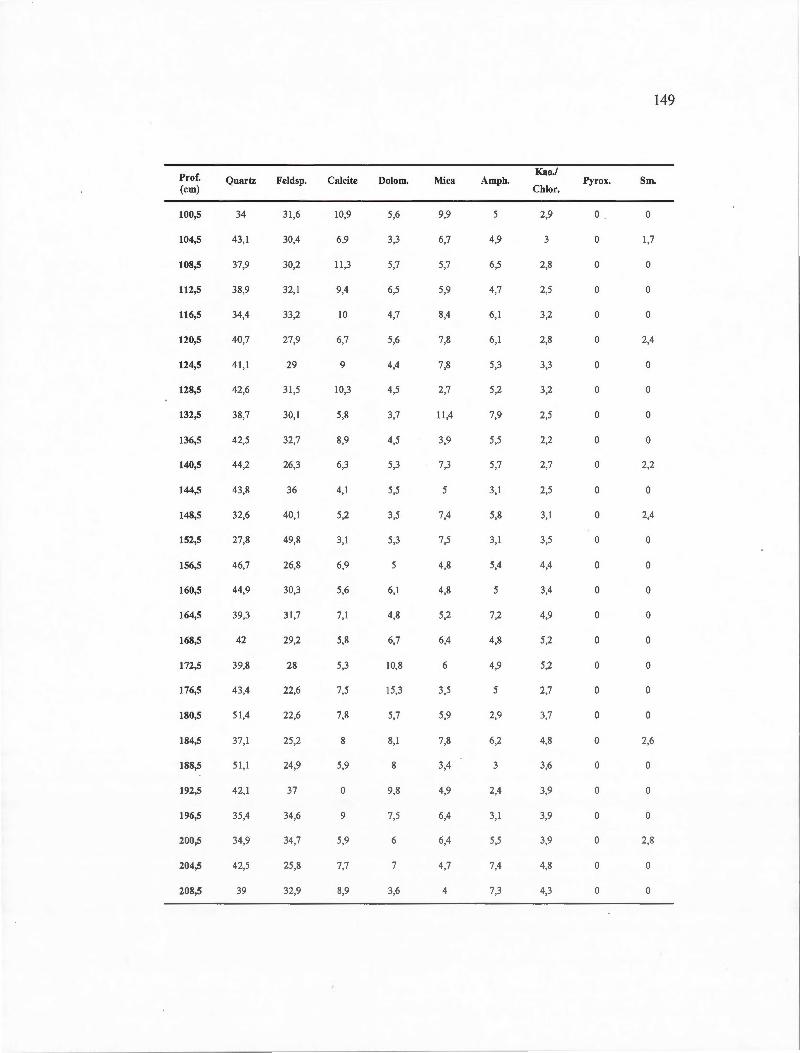
Prof. (cm)
100,5
104,5
108,5
112,5
116,5
120,5
124,5
128,5
132,5
136,5
140,5
144,5
148,5
152,5
156,5
160,5
164,5
168,5
172,5
176,5
180,5
184,5
188,5
192,5
196,5
200,5
204,5
208,5
Quartz Feldsp. Calcite Dolom.
34 31,6 10,9 5,6
43,1 30,4 6,9 3,3
37,9 30,2 11,3 5,7
38,9 32, 1 9,4 6,5
34,4 33,2 10 4,7
40,7 27,9 6,7 5,6
41 ,1 29 9 4,4
42,6 31,5 10,3 4,5
38,7 30,1 5,8 3,7
42,5 32,7 8,9 4,5
44,2 26,3 6,3 5,3
43,8 36 4,1 5,5
32,6 40,1 5,2 3,5
27,8 49,8 3,1 5,3
46,7 26,8 6,9
44,9 30,3 5,6 6, 1
39,3 31,7 7,1 4,8
42 29,2 5,8 6,7
39,8 28 5,3 10,8
43,4 22,6 7,5 15,3
5 1,4 22,6 7,8 5,7
37,1 25,2 8 8,1
51 ,1 24,9 5,9 8
42,1 37 0 9,8
35,4 34,6 9 7,5
34,9 34,7 5,9 6
42,5 25,8 7,7 7
39 32,9 8,9 3,6
Mica Amph.
9,9 5
6,7 4,9
5,7 6,5
5,9 4,7
8,4 6,1
7,8 6,1
7,8 5,3
2,7 5,2
11 ,4 7,9
3,9 5,5
7,3 5,7
5 3,1
7,4 5,8
7,5 3,1
4,8 5,4
4,8
5,2 7,2
6,4 4,8
6 4,9
3,5 5
5,9 2,9
7,8 6,2
3,4 3
4,9 2,4
6,4 3,1
6,4 5,5
4,7 7,4
4 7,3
Ka o./
Chlor.
2,9
3
2,8
2,5
3,2
2,8
3,3
3,2
2,5
2,2
2,7
2,5
3, 1
3,5
4,4
3,4
4,9
5,2
5,2
2,7
3,7
4,8
3,6
3,9
3,9
3,9
4,8
4,3
Pyrox.
0
0
0
0
0
0
0
0
0
0
0
0
0
0
0
0
0
0
0
0
0
0
0
0
0
0
0
0
149
Sm.
0
1,7
0
0
0
2,4
0
0
0
0
2,2
0
2,4
0
0
0
0
0
0
0
0
2,6
0
0
0
2,8
0
0
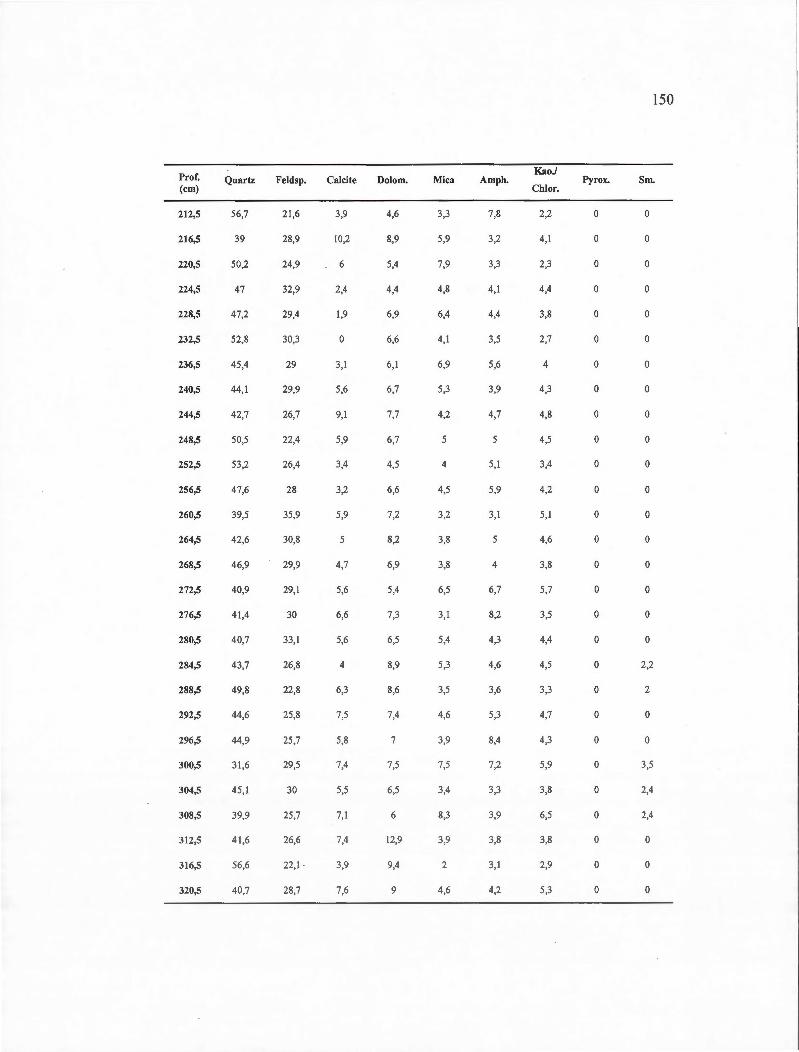
Prof. (cm)
212,5
216,5
220,5
224,5
228,5
232,5
236,5
240,5
244,5
248,5
252,5
256,5
260,5
264,5
268,5
272,5
276,5
280,5
284,5
288,5
292,5
296,5
300,5
304,5
308,5
312,5
316,5
320,5
Quartz Feldsp. Calcite Dolom.
56,7 21,6 3,9 4,6
39 28,9 1 0,2 8,9
50,2 24,9 6 5,4
47 32,9 2,4 4,4
47,2 29,4 1,9 6,9
52,8 30,3 0 6,6
45,4 29 3,1 6,1
44,1 29,9 5,6 6,7
42,7 26,7 9, 1 7,7
50,5 22,4 5,9 6,7
53,2 26,4 3,4 4,5
47,6 28 3,2 6,6
39,5 35,9 5,9 7,2
42,6 30,8 8,2
46,9 29,9 4,7 6,9
40,9 29,1 5,6 5,4
41 ,4 30 6,6 7,3
40,7 33,1 5,6 6,5
43,7 26,8 4 8,9
49,8 22,8 6,3 8,6
44,6 25,8 7,5 7,4
44,9 25,7 5,8 7
31 ,6 29,5 7,4 7,5
45,1 30 5,5 6,5
39,9 25,7 7,1 6
41,6 26,6 7,4 12,9
56,6 22,1· 3,9 9,4
40,7 28,7 7,6 9
Mica Amph.
3,3 7,8
5,9 3,2
7,9 3,3
4,8 4,1
6,4 4,4
4, 1 3,5
6,9 5,6
5,3 3,9
4,2 4,7
5
4 5,1
4,5 5,9
3,2 3,1
3,8 5
3,8 4
6,5 6,7
3,1 8,2
5,4 4,3
5,3 4,6
3,5 3,6
4 ,6 5,3
3,9 8,4
7,5 7,2
3,4 3,3
8,3 3,9
3,9 3,8
2 3,1
4,6 4,2
Ka o./
Chlor.
2,2
4,1
2,3
4,4
3,8
2,7
4
4,3
4,8
4,5
3,4
4,2
5,1
4,6
3,8
5,7
3,5
4,4
4,5
3,3
4,7
4,3
5,9
3,8
6,5
3,8
2,9
5,3
Pyrox.
0
0
0
0
0
0
0
0
0
0
0
0
0
0
0
0
0
0
0
0
0
0
0
0
0
0
0
0
l 150
Sm.
0
0
0
0
0
0
0
0
0
0
0
0
0
0
0
0
0
0
2,2
2
0
0
3,5
2,4
2,4
0
0
0
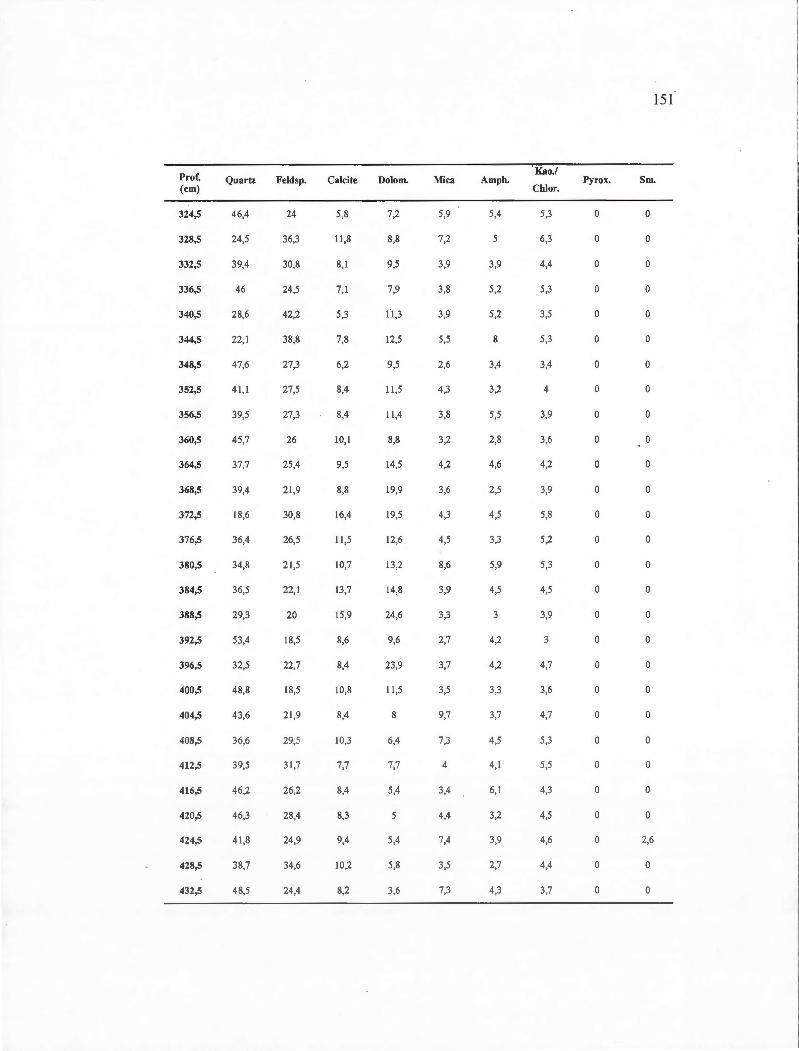
Pl'of. (cm)
324,5
328,5
332,5
336,5
340,5
344,5
348,5
352,5
356,5
360,5
364,5
368,5
372,5
376,5
380,5
384,5
388,5
392,5
396,5
400,5
404,5
408,5
412,5
416,5
420,5
424,5
428,5
432,5
Qual'tz Feldsp. Calcite Dolom.
46,4 24 5,8 7,2
24,5 36,3 Il ,8 8,8
39,4 30,8 8,1 9,5
46 24,5 7,1 7,9
28,6 42,2 5,3 11 ,3
22,1 38,8 7,8 12,5
47,6 27,3 6,2 9,5
4 1,1 27,5 8,4 11 ,5
39,5 27,3 8,4 Il ,4
45,7 26 10,1 8,8
37,7 25,4 9,5 14,5
39,4 21,9 8,8 19,9
18,6 30,8 16,4 19,5
36,4 26,5 11 ,5 12,6
34,8 21,5 10,7 13,2
36,5 22,1 13,7 14,8
29,3 20 15,9 24,6
53,4 18,5 8,6 9,6
32,5 22,7 8,4 23,9
48,8 18,5 10,8 11,5
43,6 21 ,9 8,4 8
36,6 29,5 10,3 6,4
39,5 31,7 7,7 7,7
46,2 26,2 8,4 5,4
46,3 28,4 8,3 5
4 1,8 24,9 9,4 5,4
38,7 34,6 10,2 5,8
48,5 24,4 8,2 3,6
Mica
5,9
7,2
3,9
3,8
3,9
5,5
2,6
4,3
3,8
3,2
4,2
3,6
4,3
4,5
8,6
3,9
3,3
2,7
3,7
3,5
9,7
7,3
4
3,4
4,4
7,4
3,5
7,3
Am ph.
5,4
5
3,9
5,2
5,2
8
3,4
3,2
5,5
2,8
4,6
2,5
4,5
3,3
5,9
4,5
3
4,2
4,2
3,3
3,7
4,5
4,1
6,1
3,2
3,9
2,7
4,3
' Kao./
Chlol'.
5,3
6,3
4,4
5,3
3,5
5,3
3,4
4
3,9
3,6
4,2
3,9
5,8
5,2
5,3
4,5
3,9
3
4,7
3,6
4,7
5,3
5,5
4,3
4,5
4,6
4,4
3,7
151
Pyi'OX. Sm.
0 0
0 0
0 0
0 0
0 0
0 0
0 0
0 0
0 0
0 0
0 0
0 0
0 0
0 0
0 0
0 0
0 0
0 0
0 0
0 0
0 0
0 0
0 0
0 0
0 0
0 2,6
0 0
0 0
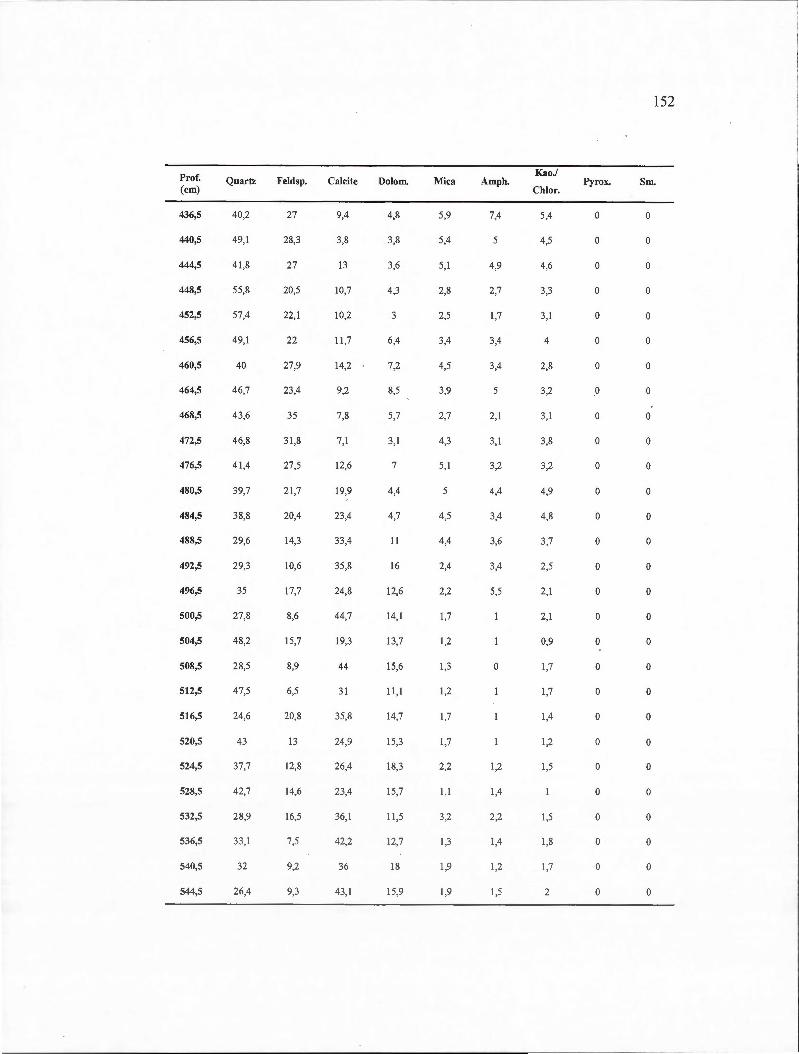
Prof. (cm)
436,5
440,5
444,5
448,5
452,5
456,5
460,5
464,5
468,5
472,5
476,5
480,5
484,5
488,5
492,5
496,5
500,5
504,5
508,5
512,5
516,5
520,5
524,5
528,5
532,5
536,5
540,5
544,5
Quartz
40,2
49,1
4 1,8
55,8
57,4
4 9,1
40
46,7
43,6
46,8
41 ,4
39,7
38,8
29,6
29,3
35
27,8
48,2
28,5
47,5
24,6
43
37,7
42,7
28,9
33,1
32
26,4
Feldsp. Calcite
27 9,4
28,3 3,8
27 13
20,5 10,7
22,1 10,2
22 11 ,7
27,9 14,2
23,4 9,2
35 7,8
3 1,8 7,1
27,5 12,6
21,7 19,9
20,4 23,4
14,3 33,4
10,6 35,8
17,7 24,8
8,6 44,7
15,7 19,3
8,9 44
6,5 31
20,8 35,8
13 24,9
12,8 26,4
14,6 23,4
16,5 36,1
7,5 42,2
9,2 36
9,3 43,1
Dolo m. Mica Am ph.
4 ,8 5,9 7,4
3,8 5,4
3,6 5,1 4,9
4 ,3 2,8 2,7
3 2,5 1,7
6,4 3,4 3,4
7,2 4,5 3,4
8,5 3,9
5,7 2,7 2,1
3,1 4,3 3,1
7 5,1 3,2
4,4 4,4
4,7 4,5 3,4
Il 4,4 3,6
16 2,4 3,4
12,6 2,2 5,5
14,1 1,7
13,7 1,2
15,6 1,3 0
11,1 1,2
14,7 1,7
15,3 1,7
18,3 2,2 1,2
15,7 1,1 1,4
11 ,5 3,2 2,2
12,7 1,3 1,4
18 1,9 1,2
15,9 1,9 1,5
Ka o./
Chlor.
5,4
4,5
4,6
3,3
3,1
4
2,8
3,2
3, 1
3,8
3,2
4,9
4,8
3,7
2,5
2,1
2,1
0,9
1,7
1,7
1,4
1,2
1,5
1,5
1,8
1,7
2
152
Pyrox. Sm.
0 0
0 0
0 0
0 0
0 0
0 0
0 0
0 0
0 0
0 0
0 0
0 0
0 0
0 0
0 0
0 0
0 0
0 0
0 0
0 0
0 0
0 0
0 0
0 0
0 0
0 0
0 0
0 0
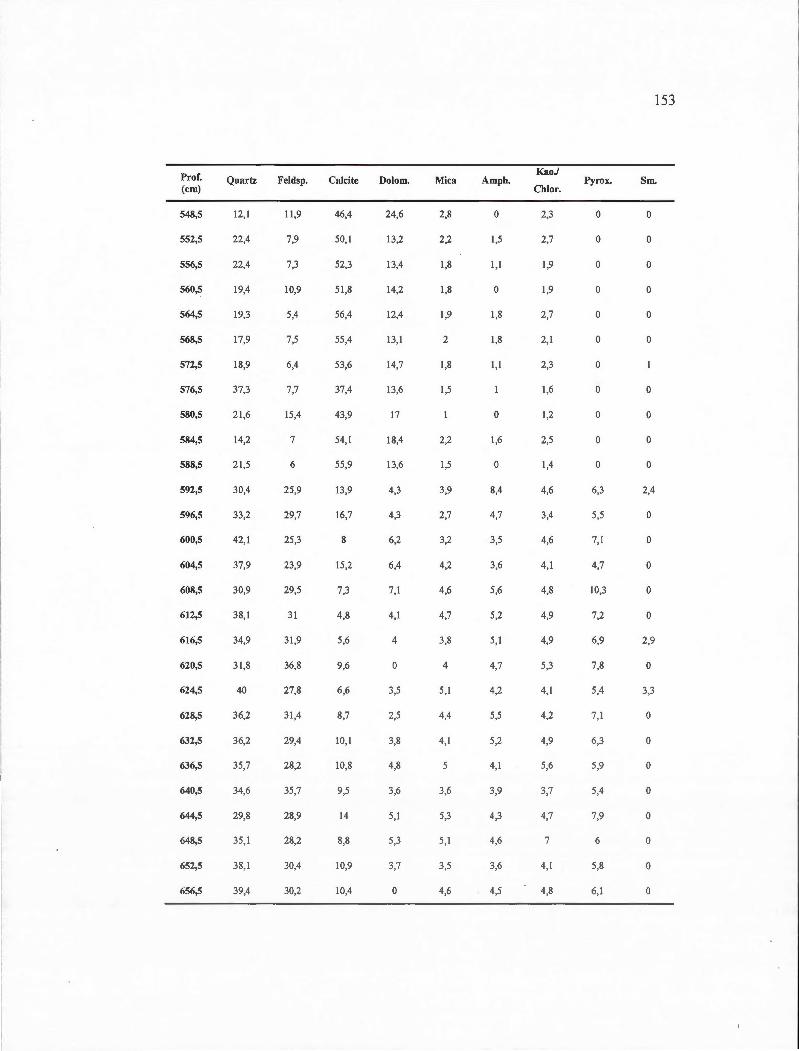
Prof. (cm)
548,5
552,5
556,5
560,5
564,5
568,5
572,5
576,5
580,5
584,5
588,5
592,5
596,5
600,5
604,5
608,5
612,5
616,5
620,5
624,5
628,5
632,5
636,5
640,5
644,5
648,5
652,5
656,5
Quartz Feldsp. Calcite Dolom.
12,1 11 ,9 46,4 24,6
22,4 7,9 50, 1 13,2
22,4 7,3 52,3 13,4
19,4 10,9 51,8 14,2
19,3 5,4 56,4 12,4
17,9 7,5 55,4 13,1
18,9 6,4 53,6 14,7
37,3 7,7 37,4 13,6
21 ,6 15,4 43 ,9 17
14,2 7 54,1 18,4
21 ,5 6 55,9 13,6
30,4 25,9 13,9 4,3
33,2 29,7 16,7 4,3
42,1 25 ,3 8 6,2
37,9 23,9 15,2 6,4
30,9 29,5 7,3 7,1
38,1 31 4,8 4,1
34,9 31 ,9 5,6 4
31 ,8 36,8 9,6 0
40 27,8 6,6 3,5
36,2 31 ,4 8,7 2,5
36,2 29,4 10,1 3,8
35,7 28,2 10,8 4,8
34,6 35,7 9,5 3,6
29,8 28,9 14 5, 1
35, 1 28,2 8,8 5,3
38,1 30,4 10,9 3,7
39,4 30,2 10,4 0
Mica Am ph.
2,8 0
2,2 1,5
1,8 1,1
1,8 0
1,9 1,8
2 1,8
1,8 1,1
1,5
0
2,2 1,6
1,5 0
3,9 8,4
2,7 4,7
3,2 3,5
4,2 3,6
4,6 5,6
4,7 5,2
3,8 5,1
4 4,7
5,1 4,2
4,4 5,5
4,1 5,2
4,1
3,6 3,9
5,3 4,3
5, 1 4,6
3,5 3,6
4,6 4,5
Ka o./
Chlor.
2,3
2,7
1,9
1,9
2,7
2,1
2,3
1,6
1,2
2,5
1,4
4,6
3,4
4,6
4,1
4,8
4,9
4,9
5,3
4, 1
4,2
4,9
5,6
3,7
4,7
7
4,1
4,8
Pyi'Ox.
0
0
0
0
0
0
0
0
0
0
0
6,3
5,5
7,1
4,7
10,3
7,2
6,9
7,8
5,4
7,1
6,3
5,9
5,4
7,9
6
5,8
6, 1
153
Sm.
0
0
0
0
0
0
0
0
0
0
2,4
0
0
0
0
0
2,9
0
3,3
0
0
0
0
0
0
0
0
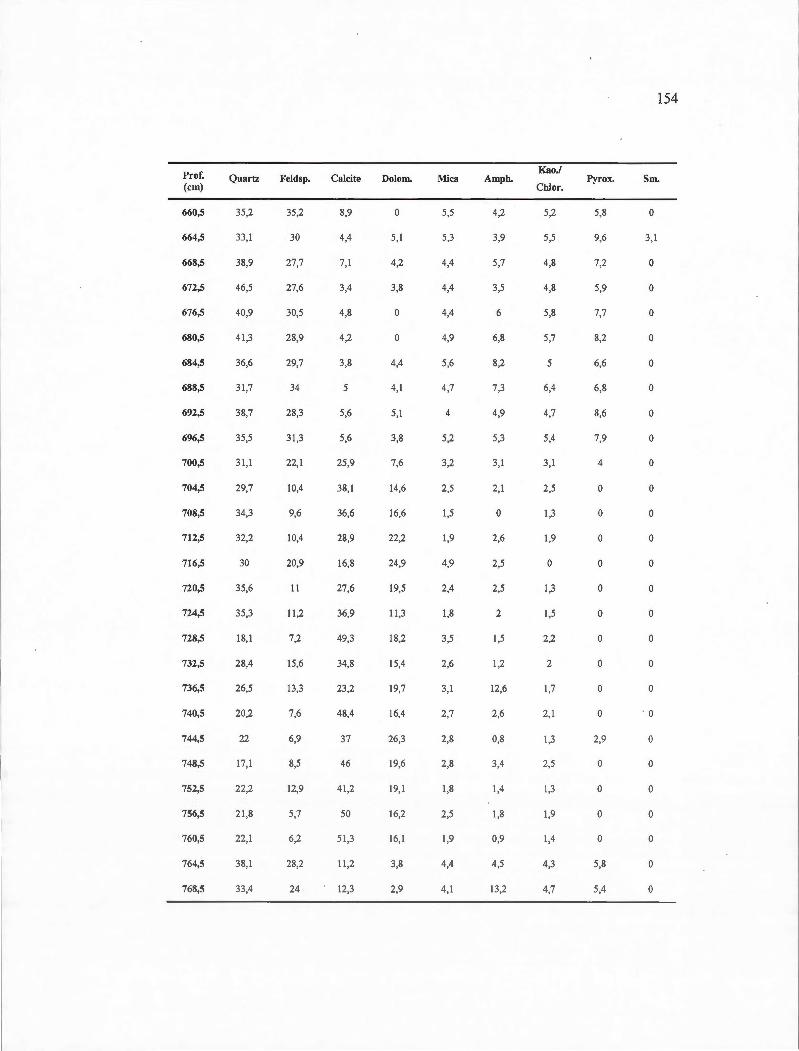
Prof. (cm)
660,5
664,5
668,5
672,5
676,5
680,5
684,5
688,5
692,5
696,5
700,5
704,5
708,5
712,5
716,5
720,5
724,5
728,5
732,5
736,5
740,5
744,5
748,5
752,5
756,5
760,5
764,5
768,5
Quartz Feldsp. Calcite Dolom.
35,2 35,2 8,9 0
33,1 30 4,4 5,1
38,9 27,7 7,1 4,2
46,5 27,6 3,4 3,8
40,9 30,5 4,8 0
41,3 28,9 4,2 0
36,6 29,7 3,8 4,4
31,7 34 5 4,1
38,7 28,3 5,6 5,1
35,5 31,3 5,6 3,8
31,1 22,1 25,9 7,6
29,7 10,4 38,1 14,6
34,3 9,6 36,6 16,6
32,2 10,4 28,9 22,2
30 20,9 16,8 24,9
35,6 1 1 27,6 19,5
35,3 11,2 36,9 11 ,3
18,1 7,2 49,3 18,2
28,4 15,6 34,8 15,4
26,5 13,3 23,2 19,7
20,2 7,6 48,4 16,4
22 6,9 37 26,3
17,1 8,5 46 19,6
22,2 12,9 41 ,2 19,1
21 ,8 5,7 50 16,2
22,1 6,2 51 ,3 16,1
38,1 28,2 11,2 3,8
33,4 24 12,3 2,9
Mica Amph.
5,5 4,2
5,3 3,9
4,4 5,7
4,4 3,5
4,4 6
4,9 6,8
5,6 8,2
4,7 7,3
4 4,9
5,2 5,3
3,2 3,1
2,5 2,1
1,5 0
1,9 2,6
4,9 2,5
2,4 2,5
1,8 2
3,5 1,5
2,6 1,2
3,1 12,6
2,7 2,6
2,8 0,8
2,8 3,4
1,8 1,4
2,5 1,8
1,9 0,9
4,4 4,5
4,1 13,2
Ka o./
Chlor.
5,2
5,5
4,8
4,8
5,8
5,7
5
6,4
4,7
5,4
3, 1
2,5
1,3
1,9
0
1,3
1,5
2,2
2
1,7
2,1
1,3
2,5
1,3
1,9
1,4
4,3
4,7
154
Pyrox. Sm.
5,8 0
9,6 3,1
7,2 0
5,9 0
7,7 0
8,2 0
6,6 0
6,8 0
8,6 0
7,9 0
4 0
0 0
0 0
0 0
0 0
0 0
0 0
0 0
0 0
0 0
0 · o
2,9 0
0 0
0 0
0 0
0 0
5,8 0
5,4 0
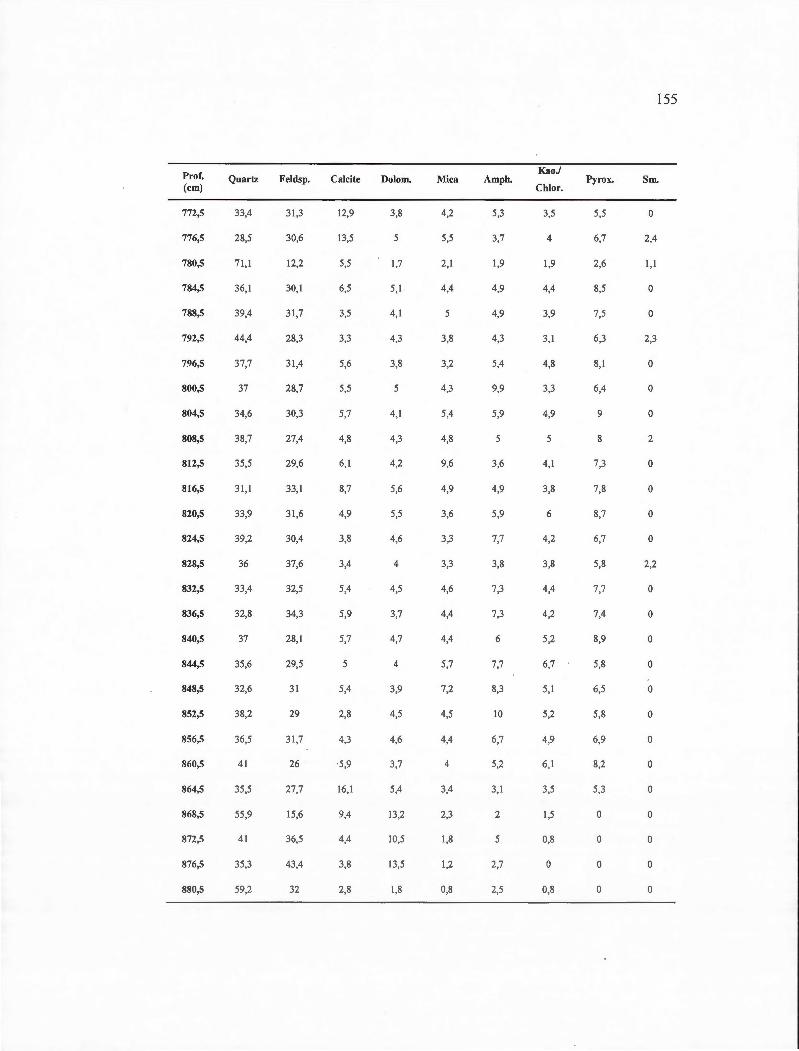
Prof. (cm)
772,5
776,5
780,5
784,5
788,5
792,5
796,5
800,5
804,5
808,5
812,5
816,5
820,5
824,5
828,5
832,5
836,5
840,5
844,5
848,5
852,5
856,5
860,5
864,5
868,5
872,5
876,5
880,5
Quartz Feldsp. Calcite Dolom.
33,4 31 ,3 12,9 3,8
28,5 30,6 13,5
71, 1 12,2 5,5 1,7
36,1 30,1 6,5 5,1
39,4 31,7 3,5 4,1
44,4 28,3 3,3 4,3
37,7 31 ,4 5,6 3,8
37 28,7 5,5
34,6 30,3 5,7 4,1
38,7 27,4 4,8 4,3
35,5 29,6 6,1 4,2
3 1,1 33,1 8,7 5,6
33,9 3 1,6 4,9 5,5
39,2 30,4 3,8 4,6
36 37,6 3,4 4
33,4 32,5 5,4 4,5
32,8 34,3 5,9 3,7
37 28,1 5,7 4,7
35,6 29,5 4
32,6 3 1 5,4 3,9
38,2 29 2,8 4,5
36,5 31 ,7 4,3 4,6
41 26 ·5,9 3,7
35,5 27,7 16,1 5,4
55,9 15,6 9,4 13,2
41 36,5 4,4 10,5
35,3 43,4 3,8 13,5
59,2 32 2,8 1,8
Mica
4,2
5,5
2, 1
4,4
5
3,8
3,2
4,3
5,4
4,8
9,6
4,9
3,6
3,3
3,3
4,6
4,4
4,4
5,7
7,2
4,5
4,4
4
3,4
2,3
1,8
1,2
0,8
Am ph.
5,3
3,7
1,9
4,9
4,9
4,3
5,4
9,9
5,9
3,6
4,9
5,9
7,7
3,8
7,3
7,3
6
7,7
8,3
10
6,7
5,2
3,1
2
5
2,7
2,5
Ka o./
Chlor.
3,5
4
1,9
4,4
3,9
3, 1
4,8
3,3
4,9
4,1
3,8
6
4,2
3,8
4,4
4,2
5,2
6,7
5,1
5,2
4,9
6,1
3,5
1,5
0,8
0
0,8
155
Pyrox. Sm.
5,5 0
6,7 2,4
2,6 1,1
8,5 0
7,5 0
6,3 2,3
8, 1 0
6,4 0
9 0
8 2
7,3 0
7,8 0
8,7 0
6,7 0
5,8 2,2
7,7 0
7,4 0
8,9 0
5,8 0
6,5 0
5,8 0
6,9 0
8,2 0
5,3 0
0 0
0 0
0 0
0 0
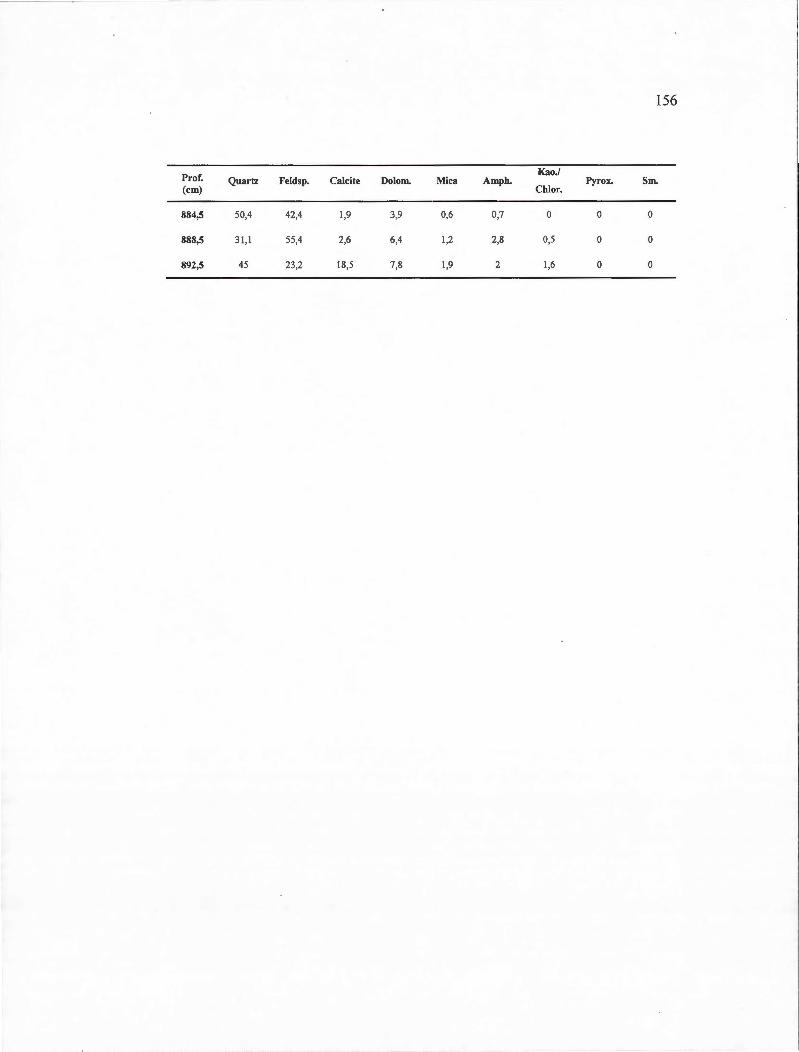
156
Prof. Ka o./
Quartz Feldsp. Calcite Dolo m. Mica Am ph. Py.-ox. Sm. (cm) C hlor.
884,5 50,4 42,4 1,9 3,9 0,6 0,7 0 0 0
888,5 3 1,1 55,4 2,6 6,4 1,2 2,8 0,5 0 0
892,5 45 23,2 18,5 7,8 1,9 2 1,6 0 0
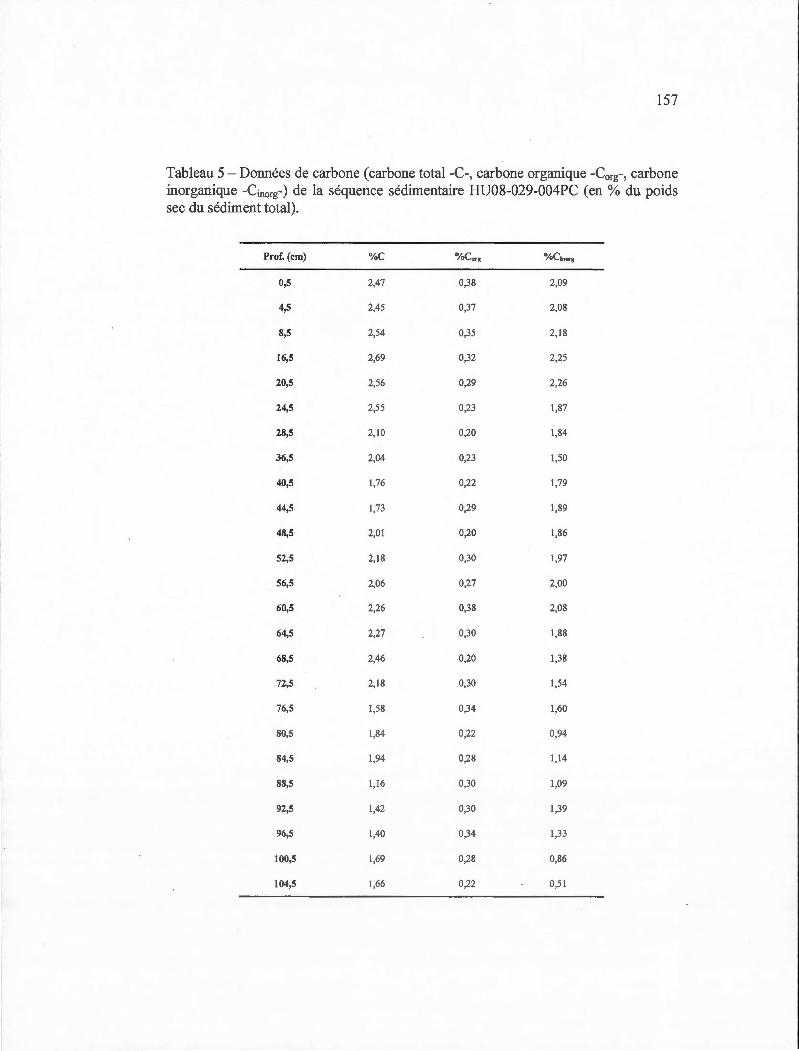
157
Tableau 5 - Données de carbone (carbone total -C-, carbone organique -Corg-, carbone inorganique -Cinord de la séquence sédimentaire HU08-029-004PC (en % du poids sec du sédiment total).
Prof. (cm) %C 0/oC org %C~n.,.g
0,5 2,47 0,38 2,09
4,5 2,45 0,37 2,08
8,5 2,54 0,35 2,18
16,5 2,69 0,32 2,25
20,5 2,56 0,29 2,26
24,5 2,55 0,23 1,87
28,5 2,10 0,20 1,84
36,5 2,04 0,23 1,50
40,5 1,76 0,22 1,79
44,5 1,73 0,29 1,89
48,5 2,0 1 0,20 1,86
52,5 2,18 0,30 1,97
56,5 2,06 0,27 2,00
60,5 2,26 0,38 2,08
64,5 2,27 0,30 1,88
68,5 2,46 0,20 1,38
72,5 2,18 0,30 1,54
76,5 1,58 0,34 1,60
80,5 1,84 0,22 0,94
84,5 1,94 0,28 1,14
88,5 1,16 0,30 1,09
92,5 1,42 0,30 1,39
96,5 1,40 0,34 1,33 r.
1
100,5 1,69 0,28 0,86
! 104,5 1,66 0,22 0,51
1
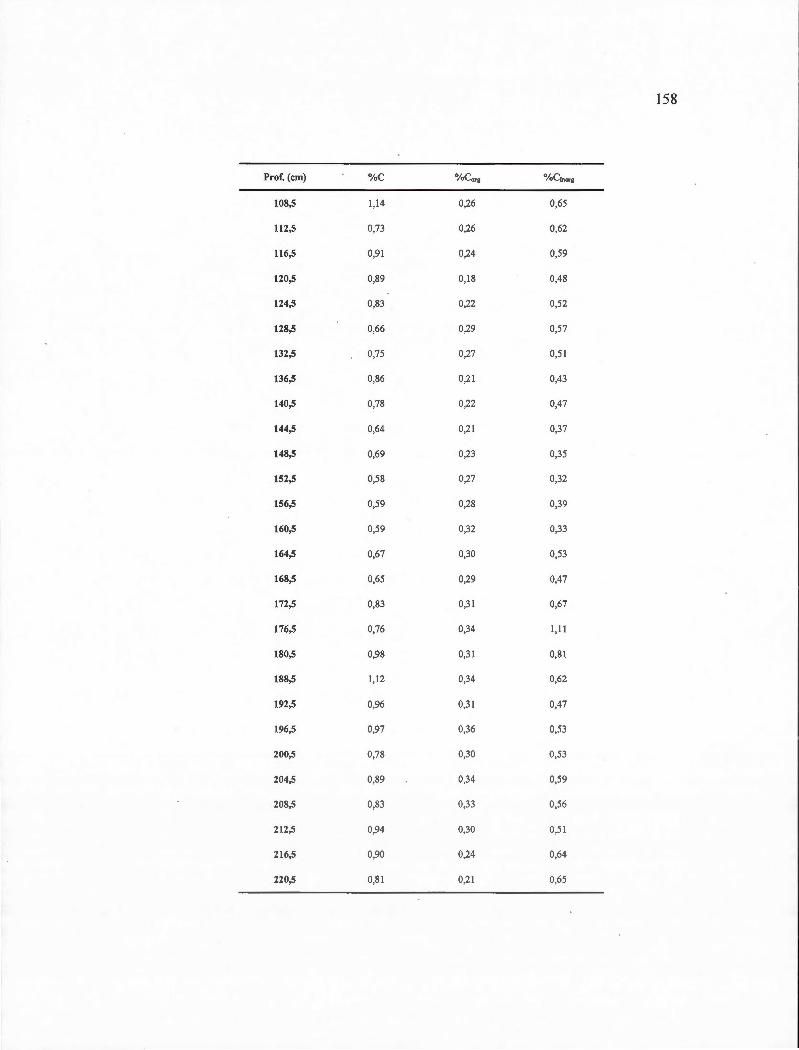
158
Prof. (cm) %C %C.,g 0/oCinorg
108,5 1,14 0,26 0,65
112,5 0,73 0,26 0,62
116,5 0,91 0,24 0,59
120,5 0,89 0,18 0,48
124,5 0,83 0,22 0,52
128,5 0,66 0,29 0,57
132,5 0,75 0,27 0,51
136,5 0,86 0,2 1 0,43
140,5 0,78 0,22 0,47
144,5 0,64 0,2 1 0,37
148,5 0,69 0,23 0,35
152,5 0,58 0,27 0,32
156,5 0,59 0,28 0,39
160,5 0,59 0,32 0,33
164,5 0,67 0,30 0,53
168,5 0,65 0,29 0,47
172,5 0,83 0,31 0,67
176,5 0,76 0,34 1,11
180,5 0,98 0,3 1 0,8 1
188,5 1,12 0,34 0,62
192,5 0,96 0,31 0,47
196,5 0,97 0,36 0,53
200,5 0,78 0,30 0,53
204,5 0,89 0,34 0,59
208,5 0,83 0,33 0,56
212,5 0,94 0,30 0,51
216,5 0,90 0,24 0,64
220,5 0,81 0,21 0,65
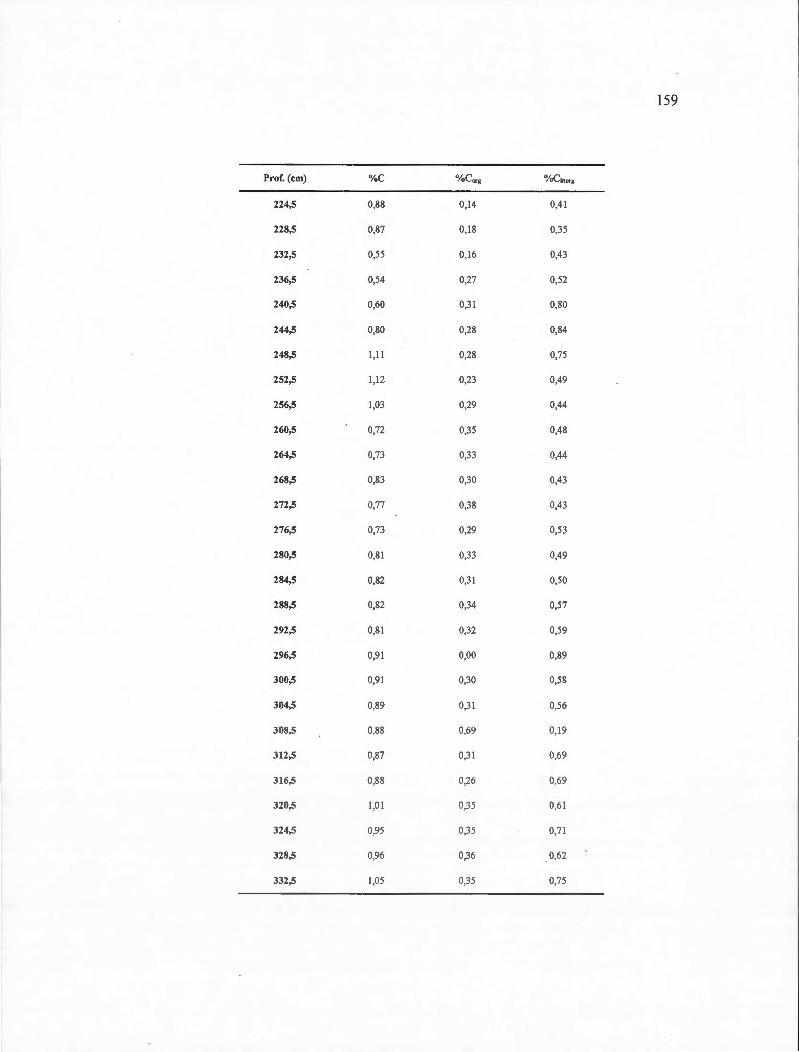
159
P.-of. (cm) %C 0/oCorg %C1n..-g
224,5 0,88 0,14 0,41
228,5 0,87 0,18 0,35
232,5 0,55 0,16 0,43
236,5 0,54 0,27 0,52
240,5 0,60 0,3 1 0,80
244,5 0,80 0,28 0,84
248,5 1,11 0,28 0,75
252,5 1,12 0,23 0,49
256,5 1,03 0,29 0,44
260,5 0,72 0,35 0,48
264,5 0,73 0,33 0,44
268,5 0,83 0,30 0,43
272,5 0,77 0,38 0,43
276,5 0,73 0,29 0,53
280,5 0,81 0,33 0,49
284,5 0,82 0,31 0,50
288,5 0,82 0,34 0,57
292,5 0,8 1 0,32 0,59
296,5 0,91 0,00 0,89
300,5 0,91 0,30 0,58
304,5 0,89 0,3 1 0,56
308,5 0,88 0.69 0,19
312,5 0,87 0,31 0,69
316,5 0,88 0,26 0,69
320,5 1,01 0,35 0,61
324,5 0,95 0,35 0,71
328,5 0,96 0,36 0,62
332,5 1,05 0,35 0,75
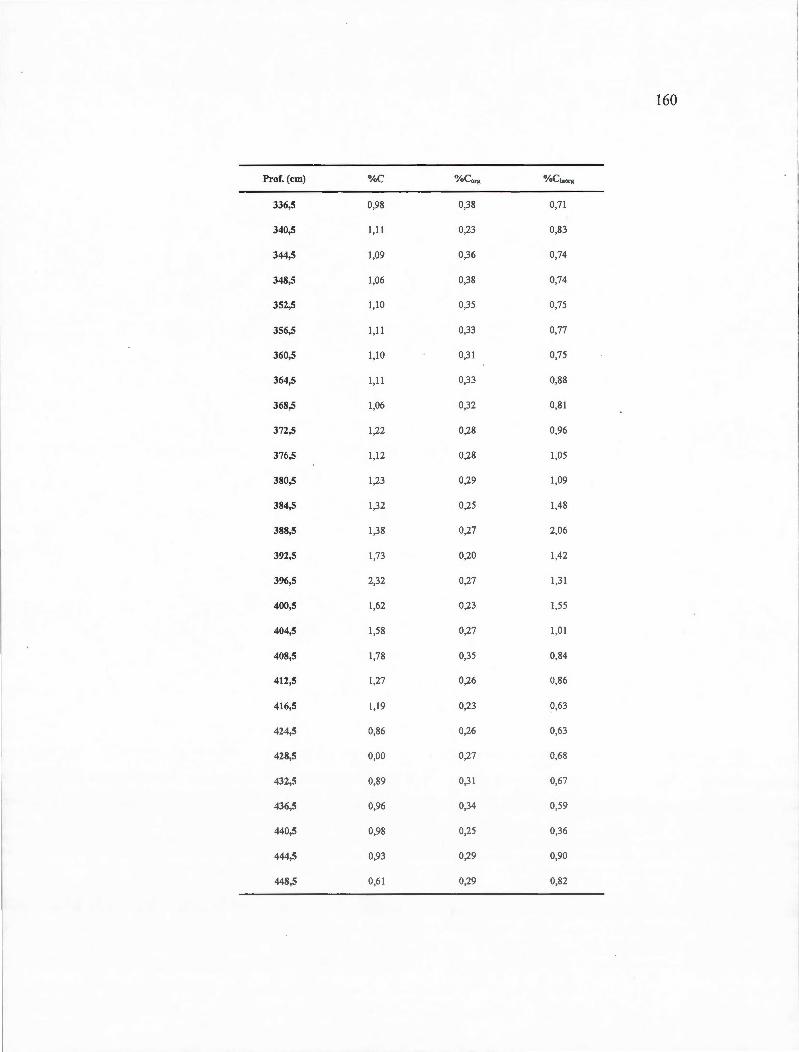
160
Prof. (cm) %C o/oC org o/oC inorg
336,5 0,98 0,38 0,7 1
340,5 1 ,Il 0,23 0,83
344,5 1,09 0,36 0,74
348,5 1,06 0,38 0,74
352,5 1,10 0,35 0,75
356,5 1,11 0,33 0,77
360,5 1,10 0,3 1 0,75
364,5 1 ,Il 0,33 0,88
368,5 1,06 0,32 0,8 1
372,5 1,22 0,28 0,96
376,5 1,12 0,28 1,05
380,5 1,23 0,29 1,09
384,5 1,32 0,25 1,48
388,5 1,38 0,27 2,06
392,5 1,73 0,20 1,42
396,5 2,32 0,27 1,3 1
400,5 1,62 0,23 1,55
404,5 1,58 0,27 1,0 1
408,5 1,78 0,35 0,84
412,5 1,27 0,26 0,86
416,5 1,19 0,23 0,63
424,5 0,86 0,26 0,63
428,5 0,00 0,27 0,68
432,5 0,89 0,3 1 0,67
436,5 0,96 0,34 0,59
440,5 0,98 0,25 0,36
444,5 0,93 0,29 0,90
448,5 0,61 0,29 0,82
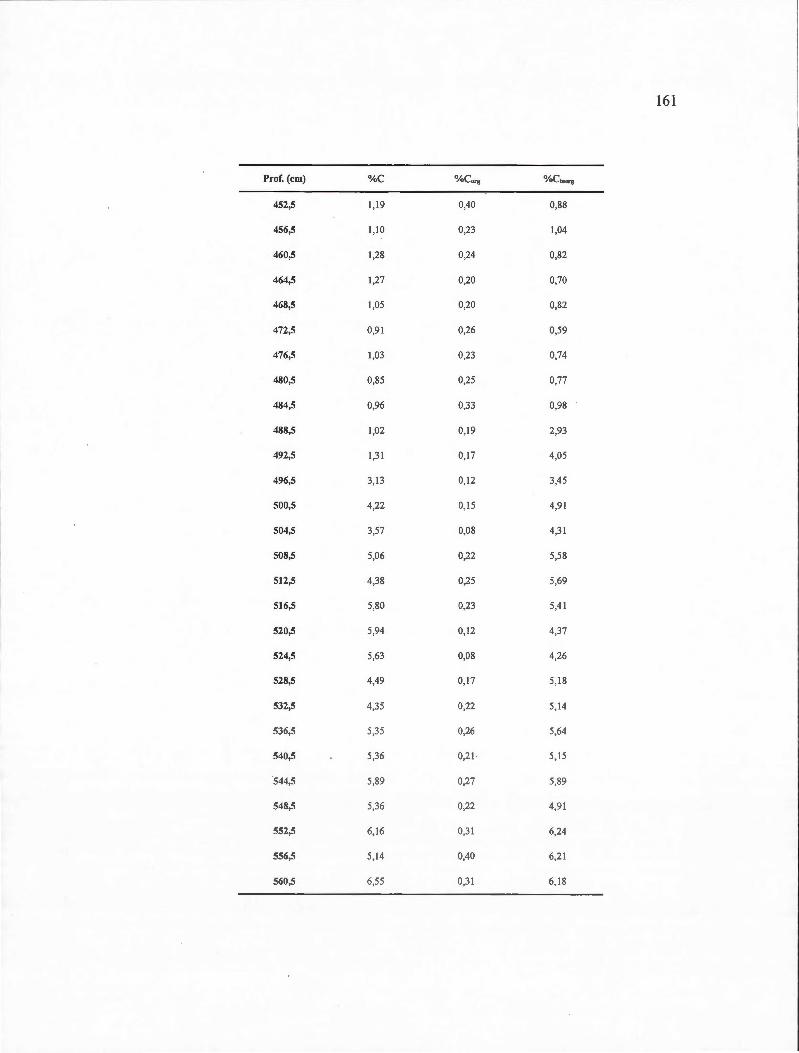
161
Prof. (cm) %C 0/oCorg 0/oCinorg
452,5 1,19 0,40 0,88
456,5 1,10 0,23 1,04
460,5 1,28 0,24 0,82
464,5 1,27 0,20 0,70
468,5 1,05 0,20 0,82
472,5 0,9 1 0,26 0,59
476,5 1,03 0,23 0,74
480,5 0,85 0,25 0,77
484,5 0,96 0,33 0,98
488,5 1,02 0,19 2,93
492,5 1,31 0,17 4,05
496,5 3, 13 0,12 3,45
500,5 4,22 0,15 4,9 1
504,5 3,57 0,08 4,3 1
508,5 5,06 0,22 5,58
512,5 4,38 0,25 5,69
516,5 5,80 0,23 5,4 1
520,5 5,94 0, 12 4,37
524,5 5,63 0,08 4,26
528,5 4,49 0,17 5, 18
532,5 4,35 0,22 5, 14
536,5 5,35 0.26 5,64
540,5 5,36 0,21 5,15
544,5 5,89 0,27 5,89
548,5 5,36 0,22 4,9 1
552,5 6,16 0,3 1 6,24
556,5 5,14 0,40 6,21
560,5 6,55 0,31 6,18
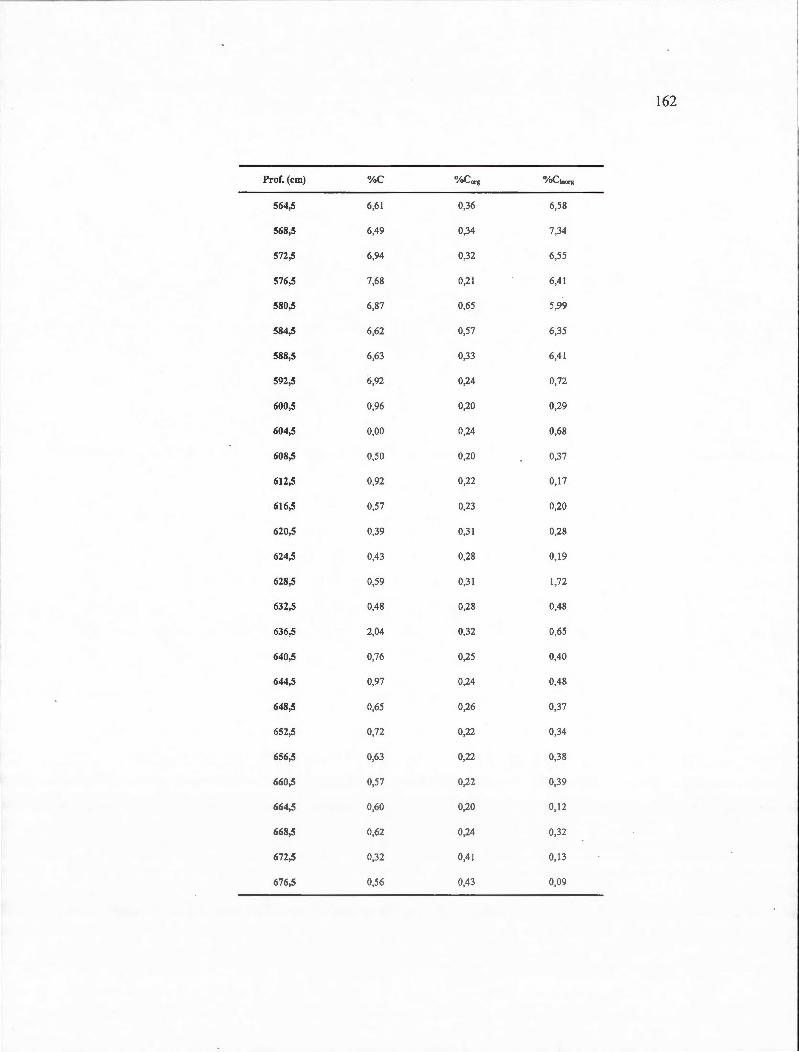
162
Prof. (cm) %C o/oCorg 0/oCinorg
564,5 6,6 1 0,36 6,58
568,5 6,49 0,34 7,34
572,5 6,94 0,32 6,55
576,5 7,68 0,21 6,41
580,5 6,87 0,65 5,99
584,5 6,62 0,57 6,35
588,5 6,63 0,33 6,41
592,5 6,92 0,24 0,72
600,5 0,96 0,20 0,29
604,5 0,00 0,24 0,68
608,5 0,50 0,20 0,37
612,5 0,92 0,22 0,17
616,5 0,57 0,23 0,20
620,5 0,39 0,3 1 0,28
624,5 0,43 0,28 0, 19
628,5 0,59 0,3 1 1,72
632,5 0,48 0,28 0,48
636,5 2,04 0,32 0,65
640,5 0,76 0,25 0,40
644,5 0,97 0,24 0,48
648,5 0,65 0,26 0,37
652,5 0,72 0,22 0,34
656,5 0,63 0,22 0,38
660,5 0,57 0,22 0,39
664,5 0,60 0,20 0,12
668,5 0,62 0,24 0,32
672,5 0,32 0,41 0,13
676,5 0,56 0,43 0,09
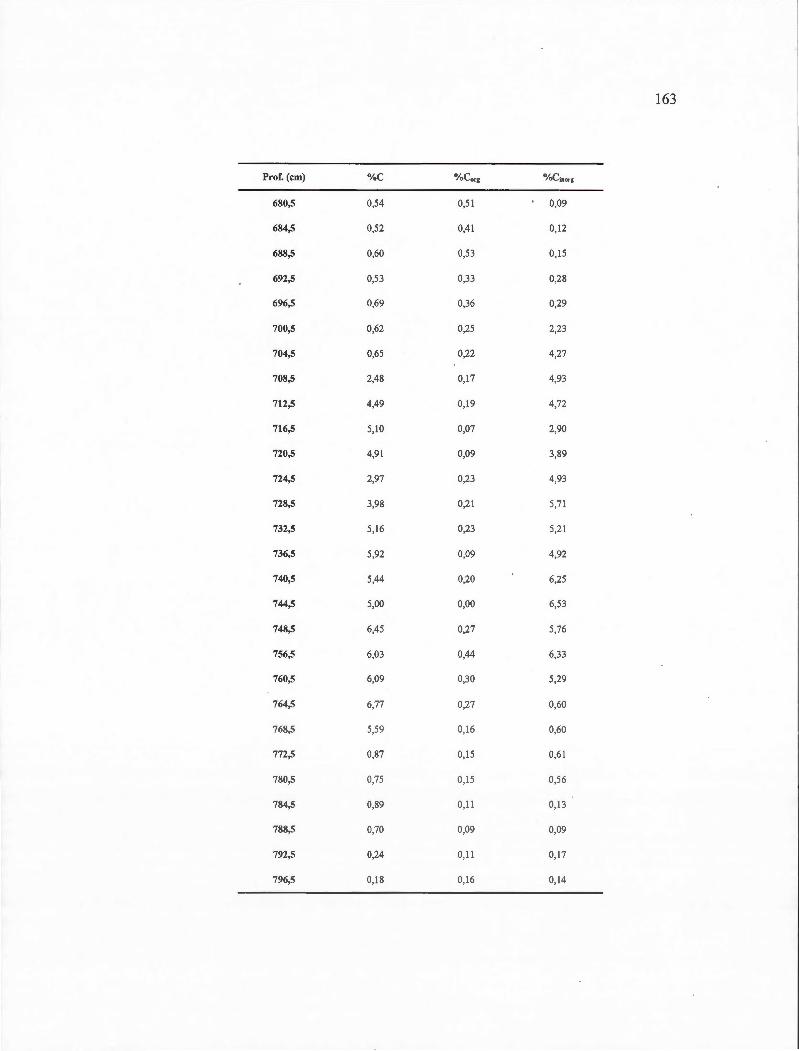
--------~-·- · ·-- -----·--- -----,
163
Prof. (cm) %C o/oCorg 0/ oCinorg
680,5 0,54 0,51 0,09
684,5 0,52 0,4 1 0, 12
688,5 0,60 0,53 0, 15
692,5 0,53 0,33 0,28
696,5 0,69 0,36 0,29
700,5 0,62 0,25 2,23
704,5 0,65 0,22 4,27
708,5 2,48 0,17 4,93
712,5 4,49 0,19 4,72
716,5 5,10 0,07 2,90
720,5 4,9 1 0,09 3,89
724,5 2,97 0,23 4,93
728,5 3,98 0,2 1 5,71
732,5 5,16 0,23 5,2 1
736,5 5,92 0,09 4,92
740,5 5,44 0,20 6,25
744,5 5,00 0,00 6,53
748,5 6,45 0,27 5,76
756,5 6,03 0,44 6,33
760,5 6,09 0,30 5,29
764,5 6,77 0,27 0,60
768,5 5,59 0,16 0,60
772,5 0,87 0,15 0,61
780,5 0,75 0,15 0,56
784,5 0,89 0, 11 0,13
788,5 0,70 0,09 0,09
792,5 0,24 0,11 0,17
796,5 0,18 0, 16 0,14
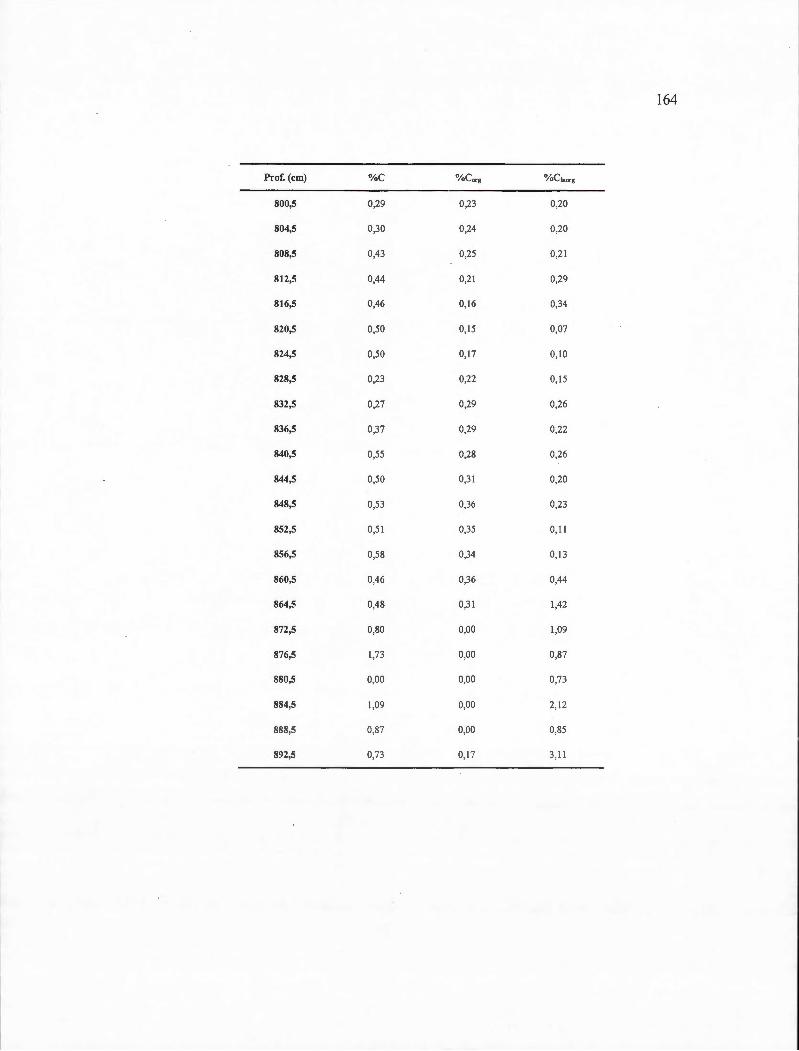
164
Prof. (cm) %C 0/oCorg 0/ oCinorg
800,5 0,29 0,23 0,20
804,5 0,30 0,24 0,20
808,5 0,43 0,25 0,2 1
812,5 0,44 0,21 0,29
816,5 0,46 0, 16 0,34
820,5 0,50 0,15 0,07
824,5 0,50 0,17 0,10
828,5 0,23 0,22 0, 15
832,5 0,27 0,29 0,26
836,5 0,37 0,29 0,22
840,5 0,55 0,28 0,26
844,5 0,50 0,31 0,20
848,5 0,53 0,36 0,23
852,5 0,51 0,35 0,11
856,5 0,58 0,34 0,13
860,5 0,46 0,36 0,44
864,5 0,48 0,31 1,42
872,5 0,80 0,00 1,09
876,5 1,73 0,00 0,87
880,5 0,00 0,00 0,73
884,5 1,09 0,00 2,12
888,5 0,87 0,00 0,85
892,5 0,73 0,1 7 3,11
BIBLIOGRAPHIE
Aksu, A. E. (1983a), Short-period geomagnetic excursion recorded in Pleistocene sediments of Baffm Bay and Davis Strait., Geological Society of America, 11, 537-541.
Aksu, A. E. (1983b ), Holocene and Pleistocene dissolution cycles in deep-sea cores ofBaffm Bay and Davis Strait: paleoceanographic implications, Marine Geology, 53 , 331-348.
Aksu, A. E., et D. J. W. Piper ( 1979), Baffm Bay in the past 1 00,000 yr, Geology, 7, 245-248.
Anderson, R. F., M. P. Bacon, et P. G. Brewer (1983a), Removal of 230Th and 23 1Pa at ocean margins, Earth and Planetary Science Letters, 66, 73 -90.
Anderson, R.F., M. P. Bacon, et P. G. Brewer (1983b),Removal oe 30Th and 23 1Pa from the open ocean, Earth and Planetary Science Letters, 62, 7-23.
Andrews, J. T. (1998), Abrupt changes (Heinrich events) in late Quatemary North Atlantic marine environments: a history and review of data and concepts, Journal of Quaternary Science, 13(1 ), 3-16.
Andrews, J. T., et K. Tedesco (1992), Detrital carbonate-rich sediments, northwestem Labrador Sea: Implications for ice-sheet dynamics and iceberg rafting (Heinrich) events in the North Atlantic, Geology, 20, 1087-1090.
Andrews, J. T. , et B. Maclean (2003), Hudson Strait ice streams: a review of stratigraphy, chronology and links with North Atlantic Heinrich events, Boreas, 32, 4-17.
Azetsu-Scott, K. , A. Clarke, K. Falkner, J. Hamilton, P. Jones, C. Lee, B. Petrie, S. Prinsenberg, M. Starr, et P. Yeats (20 1 0), Calcium carbonate saturation states in the waters of the Canadian Arctic Archipe1ago aqd the Labrador Sea, Journal of Geophysical Reasearch, 115, C 11021.
Barber, D. C., A. Dyke, C. Hillaire-Marcel, A. E. Jennings, J. T. Andrews, M. W. Kerwin, G. Bilodeau, R. McNeely, J. Southon, M. D. Morehead et J.-M. Gagnon (1999), Forcing of the cold event of 8,200 years ago by catastrophic drainage of Laurentide lakes, Nature 400, 344-348.
166
Begemann, F. , K. R. Ludwig, G. W. Lugmair, K. Min, L. E. Nyquist, P.J. Patchett, P. R. Renne, C.-Y. Shih, I. M. Villa, et R. J. Walker (2001), Call for an improved set of decay constants for geochronological use, Geochimica et Cosmochimica Acta, 65, 111-121.
Blinova, M., R. Thorsen, R. Mjelde, et J. I. Faleide (2009), Structure and evolution of the Bellsund Graben between Forlandsundet and Bellsund (Spitsbergen) based on marine seismic data, Norwegian Journal ofGeology, 89, 215-228.
Bond, G., et R. Lotti (1995), lc~berg discharges into the North Atlantic on millennial time scales during the Last Glaciation, Science, 267, 1005-101 O.
Bond, G., W. Broecker, S. Johnsen, J. McManus, L. Labeyries, J. Jouzel, et G. Bonani (1993), Correlations between climate records from North Atlantic sediments and Greenland ice, Nature, 365, 143-147.
Bourdon, B., S. Turner, G. M. Henderson, etC. C. Lundstrom (2003), Introduction to U-series Geochemistry, in Uranium-Series Geochemistry, edited by B. Bourdon, S. Turner, G. M. Henderson etC. C. Lundstrom, pp. 1-21.
Broecker, W. S. (1987), The biggest chill, Natural History, 96, 74-82.
Broecker, W. S. (1991), The great conveyor belt, Oceanography, 4(2), 79-89.
Broecker, W. S. , et G. H. Denton (1989), The role of ocean-atmosphere reorganizations in glacial cycles, Geochimica et Cosmochimica Acta, 53 , 2465-2501.
Broecker, W. S., G. Bond, M. Klas, E. Clark, et J. McManus (1992), Origin of the northem Atlantic's Heinrich events, Climate Dynamics, 6, 265-273.
Broecker, W. S., G. H. Denton, R. L. Edwards, H. Cheng, R. B. Ailey, et A. E. Putnam (20 1 0), Putting the Y ounger Dryas cold event into context, Quaternary Science Reviews, 29(9-1 0), 1078-1081.
Campbell, D. C., et A. de Vernal (2009), Marine geology and paleoceanography of Baffin Bay and adjacent areas. Nain, NL to halifaz, NS, August 28-September 23, 2008. Cruise report of CCGS Hudson Expedition 2008029, Geological Survay of Canada, Open File 5989, Natural Resources Canada, 2010 pages.
Causse, C., et C. Hillaire-Marcel (1989), Thorium and uranium isotopes in upper Pleistocene sediments of ODP sites 645 (Baffm Bay), 646, and 647 (Labrador Sea), Proceedings of the Ocean Drilling Program, Scientific Results, 105, 551-560.
167
Chase, Z., R. F. Anderson, M. Q. Fleisher, et K. P.W. (2002), The influence of particle composition and particle flux on scavenging of Th, Pa and Be in the ocean, Earth and Planetary Science Letters, 204, 215-229.
Chase, Z., R. F. Anderson, M. Q. Fleishera, et P. W. Kubik (2003), Scavenging of 230Th, 231Pa and 10Be in the Southern Ocean (SW Pacifie sector): the impmiance of particle flux, particle composition and advection, Deep-Sea Research Il, 50, 739-768.
Cheng, H., R. Lawrence Edwards, M. T. Murrell, et T. M. Benjamin (1998), Uranium-thorium-protactinium dating systematics, Geochimica et Cosmochimica Acta, 62(21 -22), 3437-3452.
Cheng, H., R. L. Edwards, J. Hoff, C. D. Gallup, D. A. Richards, et Y. Asmerom (2000), The half-lives of uranium-234 and thorium-230, Chemical Geology, 169, 17-33.
Clarke, G. K. C., A. B. G. Bush, et J. W. M. Bush (2009), Freshwater discharge, sediment transport, and modeled climate impacts of the fmal drainage of glacial Lake Agassiz, Journal ofClimate, 22, 2161-2180.
Cochran, J. K. (1992), The oceanic chemistry of the uranium- and thorium-series nuclides, in Uranium-series Disequilibrium: Application to Earth, Marine, and Environmental Sciences, edited by M. Ivanovich et R. S. Hannon, pp. 334-395, Clarendon Press, Oxford.
Cochran, J. K. , et P. Masqué (2003), Shüti-lived U/Th Series Radionuclides in the Ocean: Tracers for Scavenging Rates, Export Fluxes and Particle Dynamics, Reviews in Mineral ogy and Geochemistry, 52(1 ), 461-492.
de Vernal, A. , C. Hillaire-Marcel, A. Aksu, et J. P. Mudie (1987), Palynostratigraphy and chronostratigraphy of Baffin Bay deep sea cores: Climatostratigraphic implications, P alaeogeography, P alaeoclimatology, P alaeoecology, 61 , 97-105 .
de Vernal, A., G. Bilodeau, C. Hillaire-Marcel, et N. Kassou (1992), Quantitative assessment of carbonate dissolution in marine sediments from foraminifer linings vs. shell ratios: exarnple from Davis Strait, NW North Atlantic, Geology, 20, 527- 530.
Dickson, R. R., et J. Brown (1994), The production of North Atlantic Deep Water: Sources, rates, and pathways, Journal ofGeophysical Reasearch, 99, 12319-12341.
Dyke, A. S., J. T. Andrews, P. U. Clark, J. H. England, G. H. Miller, J. Shawe, et J. J. Veillette (2002), The Laurentide and Innuitian ice sheets during the Last Glacial Maximum, Quaternary Science Reviews, 21, 9-3 1.
168
Faure, G. , et T. M. Mensing (2005), Isotopes Princip/es and Applications, Third ed., 897 pp., John Wiley & Sons, Inc.
François, R. (2007), Paleoflux and Paleocirculation from Sediment 230Th and 23 1Pa/230Th, in Proxies in Late Cenozoic Paleoceanography, edited by C. HillaireMarcel et A. de Vernal, pp. 681 -716, Elsevier.
François, R. , Bacon M.P., ·et M. A. Altabet (1993), GlaciaVinterglacial changes in sediment rain rate in the SW Indian sector of Subantarctic waters as recorded by 230Th, 23 1Pa, U and 815N, Paleoceanography, 8, 611 -629.
François, R. , M. Frank, M. M. Rutgers van der Loeff, et M. P. Bacon (2004), 230Th normalisation: An essential tool for interpreting sedimentary fluxes during the late Quaternary, Paleogeography, 19(1 ).
Gariepy, C., B. Ghaleb, C. Hillaire-Marcel, A. Mucci, et S. Vallières (1994), Early diagenetic processes in Labrador Sea sediments: uranium-isotope geochemistry, Canadian Journal of Earth Sciences, 31 ( 1 ), 28-3 7.
Heinrich, H. (1988), Origin and consequences of cyclic ice rafting in the northeast Atlantic Ocean during the past 130,000 years, Quaternary Research, 29, 142-152.
Hemming, S. R. (2004), Heinrich events: Massive late Pleistocene detritus layers of the North Atlantic and their global climate imprint, Review ofGeophysics, 42, 1-43.
Hemming, S. R., W. S. Broecker, W. D. Sharp, G. C. Bond, R. H. Gwiazdaa, J.F. McManus, M. klas, et 1. Hajdas (1998), Provenance of Heinrich layers in core V28-82, northeastern Atlantic: 40 ArP9 Ar ages of ice-rafted hornblende, Pb isotopes in feldspar grains, and Nd-Sr-Pb isotopes in the fme sediment fraction, Earth and Planetary Science Letters, 164 317-333.
Henderson, G. M., et R. F. Anderson (2003), The U-series Toolbox for Paleoceanography, Mineralogical Society of America, 52(1 ), 493 -531.
Hesse, R. , et A. Rakofsky (1992), Deep-sea channeVsubmarine-yazoo system of the Labrador Sea: a new deep-water fac ies model (1 ), Bulletin of the American Association of Petroleum Geologists, 104, 680-707.
Hesse, R. , 1. Klaucke, W. B. F. Ryan, et D. J. W. Piper (1997), Ice-sheet sourced juxtaposed turbidite systems in Labrador Sea, Geoscience Canada, 24(1), 3-12.
Hillaire-Marcel, C., A. De Vernal, G. Bilodeau, et A. J. Weaver (2001), Absence of deep-water formation in the Labrador Sea during the last interglacial period, Nature, 410(6832), 1073-1077.
169
Hoffmann, S. S., J. F. McManus, W. B. Curry, et L. S. Brown-Leger (2013), Persistent export of 23 1Pa from the deep central Arctic Ocean over the past 35,000 years, Nature, 497, 603-607.
Kumar, N., R. Gwiazda, R. F. Anderson, et P. N. Froelich (1993), 23 1Pa/230Th ratios in sediments as a proxy for past changes in Southern Ocean Productivity, Nature, 362, 45-48.
Lazier, J., R. Hendry, A. Clarke, 1. Yashayaev, et P. Rhines (2002), Convection and restratification in the Labrador Sea, 1990-2000, Deep-Sea Research 1, 49, 1819-1835.
Lazier, J. R. N. (1973), The renewal of Labrador Sea Water, Deep Sea Research, 20(4), 341-353.
Lewis, C. F. M., A. A. L. Miller, E. Levac, D. J. W. Piper, et G. V. Sonnichsen (2012), Lake Agassiz outburst age and routing by Labrador Current and the 8.2 cal ka cold event, Quaternary International, 260, 83-97.
Lynch-Stieglitz, J., J.F. Adkins, W"B. , Curry, T. Dokken, l.R. , Hall , J.C. , Herguera, J. J.-M. Hirschi, E.V. Ivanova, C. Kissel, O. Marchel, T.M. Marchitto, LN. McCave, J.F. McManus, S. Mulitza, U. Ninnemann, F. Peeters, E.-F. Yu et R. Zahn (2007), Atlantic Meridional Overturning Circulation During the Last Glacial Maximum, Science, 316, 66-69.
Marchal, 0 ., R. François, T. F. Stocker, et F. Joos (2000), Ocean thermohaline circulation and sedimentary 23 1Pa/230Th ratio, Paleoceanography, 15, 625-641.
Marshall, J. , et F. Schott (1999), Open-ocean convection: obercation, theory, and models, Review ofGeophysics, 37, 1-64.
McManus, J. F., R. François, J.-M. Gherardi, L. D. Keigwin, et S. Brown-Leger (2004), Collapse and rapid resumption of Atlantic meridional circulation linked to deglacial climate changes, Nature, 428, 834-837.
Not, C., K. Brown, B. Ghaleb, etC. Hillaire-Marcel (2012), Conservative behavior of uranium vs. salinity in Arctic sea ice and brine, Marine Chemistry, 130-131 , 33-39.
Simon, Q. (2013), Propriétés magnétiques, minéralogiques et sédimentologiques des sédiments profonds de la baie de Baffin: Chronologie et dynamique des glaciers ouest groenlandais, innuitiens et laurentidiens au cours de la dernière glaciation, 163 pp, Université du Québec à Montréal, Montréal (QC), Canada.
Simon, Q., G. St-Onge, et C. Hillaire-Marcel (2012), Late Quaternary chronostratigraphic framework of deep Baffm Bay glaciomarine sediments from
170
high-resolution paleomagnetic data, Geochemistry, Geophysics, Geosystems, 13, 1-24.
Simon, Q., C. Hillaire-Marcel, G. St-Onge., et J. T. Andrews (2014), North-eastern Laurentide, western Greenland and southern Innuitian ice stream dynamics during the last glacial cycle, Journal ofQuaternary Science, 29, 14-26.
Tang, C. C. L., C. K. Ross, T. Yao, B. Petrie, B. M. DeTracey, etE. Dunlap (2004), The circulation, water masses and sea-ice of Baffm Bay, Progress in Oceanography, 63, 183-228.
Veiga-Pires, C. C., et C. Hillaire-Marcel (1999), U and Th isotope constraints on the duration of Heinrich events HO-H4 in the southeastern Labrador Sea, Paleoceanography, 14(2), 187-199.
Yu, E. F., R. Francois, et M. P. Bacon (1996), Similar rates of modern and last-glacial ocean thermohaline circulation inferred from radiochemical data, Nature, 379, 689-694.
Yu, E. F., R. François, M. P. Bacon, et A. P. Fleer (2001), Fluxes of 230Th and 23 1Pa to the deep sea: implications for the interpretation of excess 230Th and 23 1PaJ230Th profiles in sediments, Earth and Planetary Science Letters, 191 , 219-230.