Embed Size (px)
Citation preview
Prepared for 12th WCEE 2000 in Auckland, NZ 2660/6/A
VULNERABILITY INVESTIGATION OF ROMAN COLOSSEUM USING MICROTREMOR
Yutaka NAKAMURA1, E.Dilek GURLER2, Jun SAITA 3, Antonio ROVELLI4, Stefano DONATI5
SUMMERY
Preservation of monuments all around the world and increasing their stability against earthquakes is an important issue for many countries. For this purpose, there are many efforts for reinforcing or repairing the monuments, as well as accurate damage estimation for the future earthquakes. Among the other wonder of the world, with its huge size and ring shape Roman Colosseum is the most imposing monuments in Italy. It was built on the area that was previously occupied by the artificial lake and several times it has been destroyed by the earthquakes. The purpose of this study is to investigate the dynamic characteristics of Colosseum and identify the main damage mechanism to evaluate the risk of damage or collapse of various points of the structure. Among the other approaches, microtremor is the easiest and cheapest way to understand the characteristic features without causing any damage to the structure. Detailed measurements were performed at each floor and vulnerability indices called K-values which are simply derived from strains of ground and structure, proposed by Nakamura (1996, 1997) are calculated and weak points that may collapse during the earthquake are found. This analysis resulted that dynamic characteristics of Colosseum consists of two parts that can be named as inner and outer walls. From the preliminary analysis, predominant frequency and amplification factor for outer part are found as 1.5 Hz and 3, respectively. And the inner part has a value of 3Hz for the predominant frequency and 7-10 for amplification factor. Different mode shapes of the structure are also simulated. Relating with calculated K-values, maximum acceleration value that different points in Colosseum can accept is also calculated and proposed as a new index of earthquake resistance. The reliability of this new index is checked by relating with the damage on outer structure caused by 1349 Appennino Central Earthquake.
INTRODUCTION It is well known that, degree of damage during earthquakes strongly depends on dynamic characteristics of buildings as well as amplification of seismic waves. Because of this, behaviors before reinforcing or repairing them should be investigated in advance. The Colosseum, known also as the Flavian Amphitheatre (Figure 1), was built by the flavians in the middle of the broad valley, where Nero had sited the lake in the gardens of his Domus Aurea. It was the most imposing of all the monuments in the ancient Rome. According to the Italian earthquake catalog, there are several earthquakes (508, 801, 1349, 1703) caused huge damage in the city of Rome and affected the Colosseum (Funicello et.al., 1995; Mozco et. al, 1995). The purpose of the present study is to investigate the vulnerability characteristics of Roman Colosseum with a new technique that uses microtremor. Since, monumental structures are not suitable for laboratory experimentation and all works should be carried out directly on the buildings, in the present study microtremors are used for this purpose. Italy is seismically very active and has number of monuments that are affected by the earthquakes. With spectral analysis of microtremor records, predominant frequencies, amplification factors, vulnerable points and modal shapes could be determined. Information about Colosseum together with the brief formulation of the applied technique and results from the analysis are given in following sections.
1 System and Data Research Co., Ltd., 3-25-3 Fujimidai, Kunitachi-shi, Tokyo,Japan . E-mail: [email protected]
2 System and Data Research Co., Ltd., 3-25-3 Fujimidai, Kunitachi-shi, Tokyo,Japan 3 System and Data Research Co., Ltd., 3-25-3 Fujimidai, Kunitachi-shi, Tokyo,Japan 4 Istituto Nazionale Di Geifisica, Rome, ITALY
5 Istituto Nazionale Di Geifisica, Rome, ITALY
2
INFORMATION ABOUT COLOSSEUM
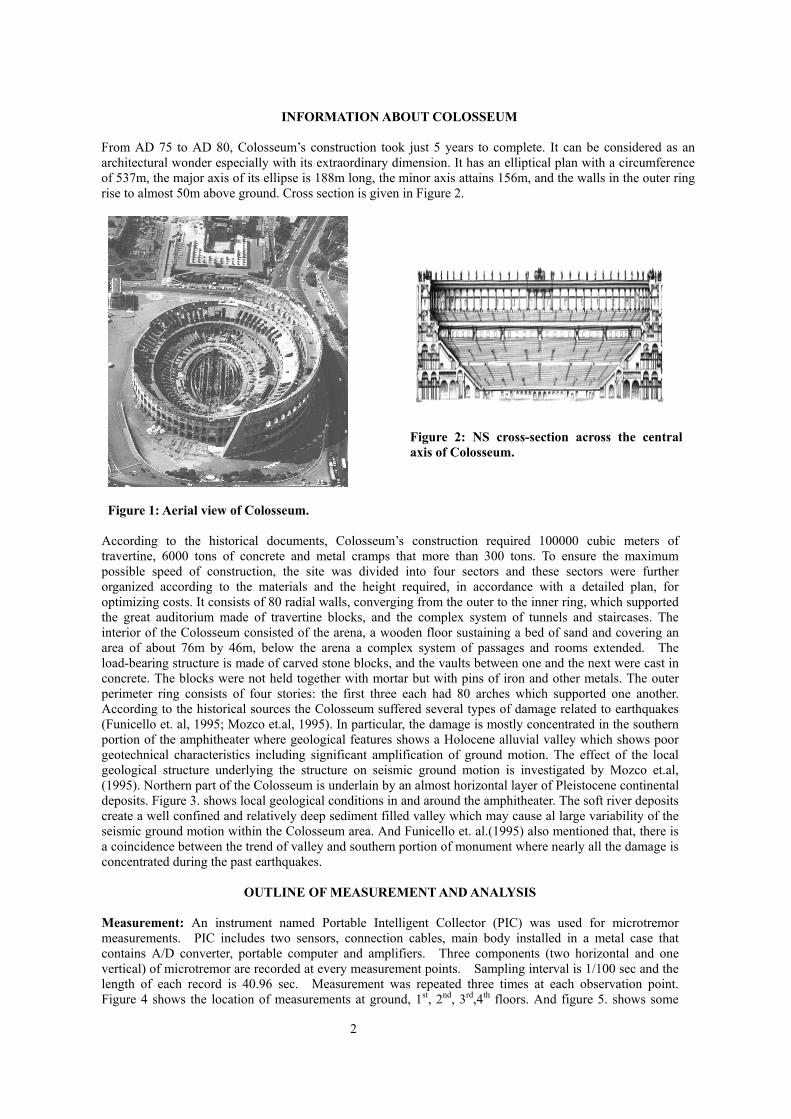
From AD 75 to AD 80, Colosseum’s construction took just 5 years to complete. It can be considered as an architectural wonder especially with its extraordinary dimension. It has an elliptical plan with a circumference of 537m, the major axis of its ellipse is 188m long, the minor axis attains 156m, and the walls in the outer ring rise to almost 50m above ground. Cross section is given in Figure 2.
Figure 1: Aerial view of Colosseum.
Figure 2: NS cross-section across the central axis of Colosseum.
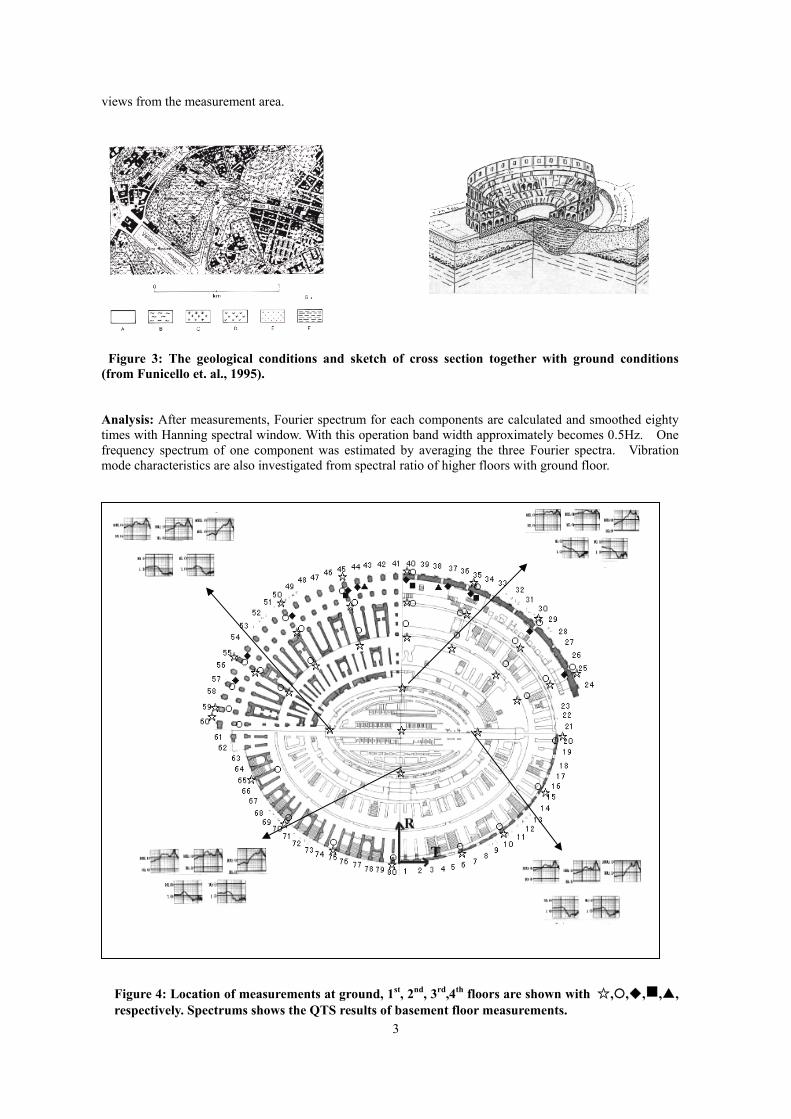
According to the historical documents, Colosseum’s construction required 100000 cubic meters of travertine, 6000 tons of concrete and metal cramps that more than 300 tons. To ensure the maximum possible speed of construction, the site was divided into four sectors and these sectors were further organized according to the materials and the height required, in accordance with a detailed plan, for optimizing costs. It consists of 80 radial walls, converging from the outer to the inner ring, which supported the great auditorium made of travertine blocks, and the complex system of tunnels and staircases. The interior of the Colosseum consisted of the arena, a wooden floor sustaining a bed of sand and covering an area of about 76m by 46m, below the arena a complex system of passages and rooms extended. The load-bearing structure is made of carved stone blocks, and the vaults between one and the next were cast in concrete. The blocks were not held together with mortar but with pins of iron and other metals. The outer perimeter ring consists of four stories: the first three each had 80 arches which supported one another. According to the historical sources the Colosseum suffered several types of damage related to earthquakes (Funicello et. al, 1995; Mozco et.al, 1995). In particular, the damage is mostly concentrated in the southern portion of the amphitheater where geological features shows a Holocene alluvial valley which shows poor geotechnical characteristics including significant amplification of ground motion. The effect of the local geological structure underlying the structure on seismic ground motion is investigated by Mozco et.al, (1995). Northern part of the Colosseum is underlain by an almost horizontal layer of Pleistocene continental deposits. Figure 3. shows local geological conditions in and around the amphitheater. The soft river deposits create a well confined and relatively deep sediment filled valley which may cause al large variability of the seismic ground motion within the Colosseum area. And Funicello et. al.(1995) also mentioned that, there is a coincidence between the trend of valley and southern portion of monument where nearly all the damage is concentrated during the past earthquakes.
OUTLINE OF MEASUREMENT AND ANALYSIS
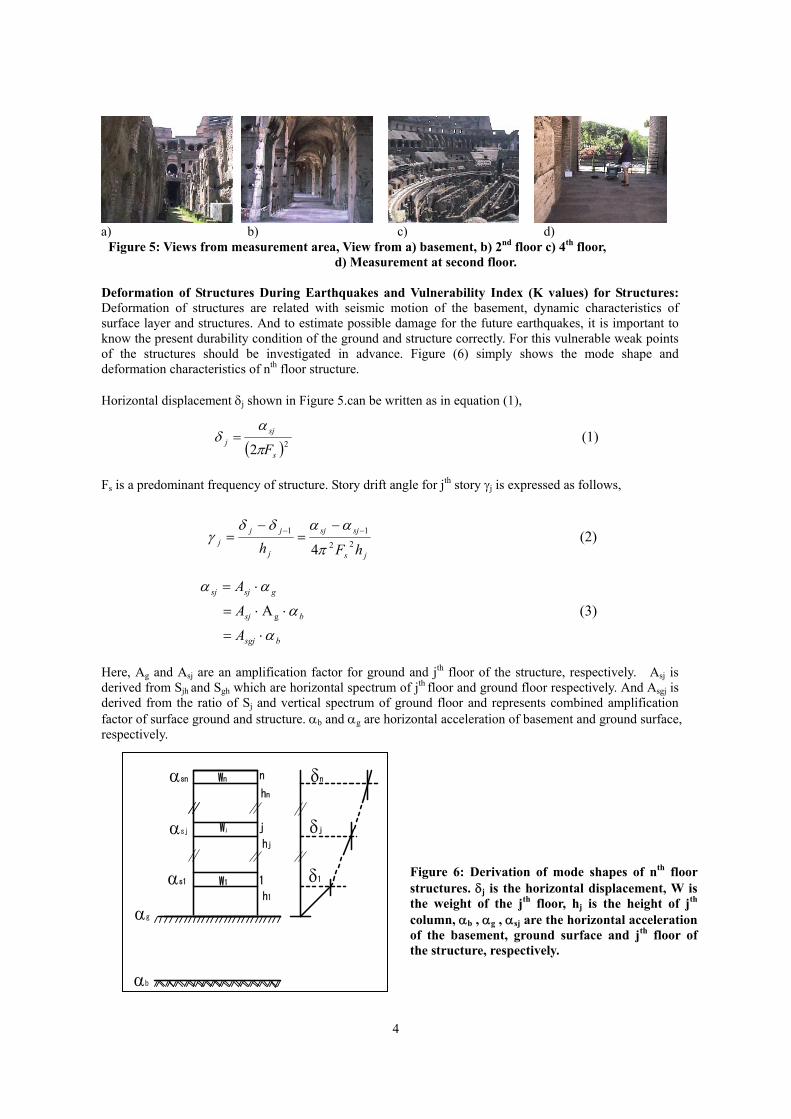
Measurement: An instrument named Portable Intelligent Collector (PIC) was used for microtremor measurements. PIC includes two sensors, connection cables, main body installed in a metal case that contains A/D converter, portable computer and amplifiers. Three components (two horizontal and one vertical) of microtremor are recorded at every measurement points. Sampling interval is 1/100 sec and the length of each record is 40.96 sec. Measurement was repeated three times at each observation point. Figure 4 shows the location of measurements at ground, 1st, 2nd, 3rd,4th floors. And figure 5. shows some
3
views from the measurement area.
Figure 3: The geological conditions and sketch of cross section together with ground conditions (from Funicello et. al., 1995).
Analysis: After measurements, Fourier spectrum for each components are calculated and smoothed eighty times with Hanning spectral window. With this operation band width approximately becomes 0.5Hz. One frequency spectrum of one component was estimated by averaging the three Fourier spectra. Vibration mode characteristics are also investigated from spectral ratio of higher floors with ground floor.
Figure 4: Location of measurements at ground, 1st, 2nd, 3rd,4th floors are shown with ☆, ,◆,g,▲, respectively. Spectrums shows the QTS results of basement floor measurements.
4
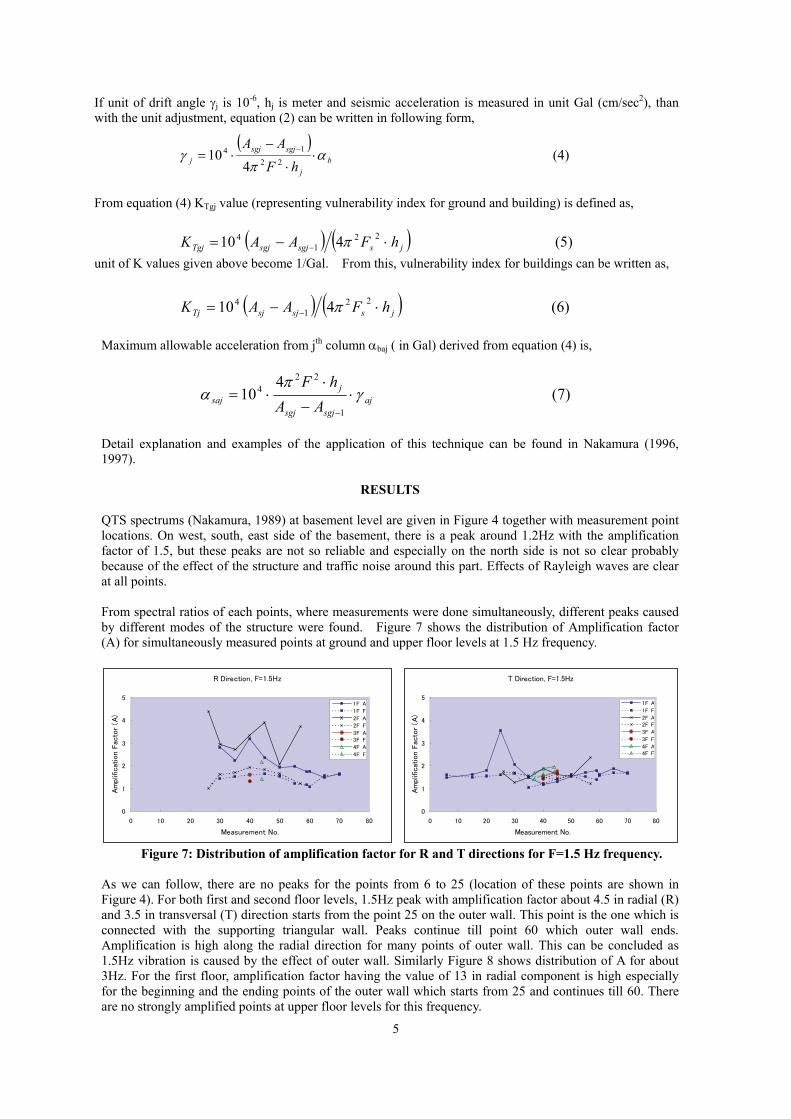
a) b) c) d) Figure 5: Views from measurement area, View from a) basement, b) 2nd floor c) 4th floor, d) Measurement at second floor.
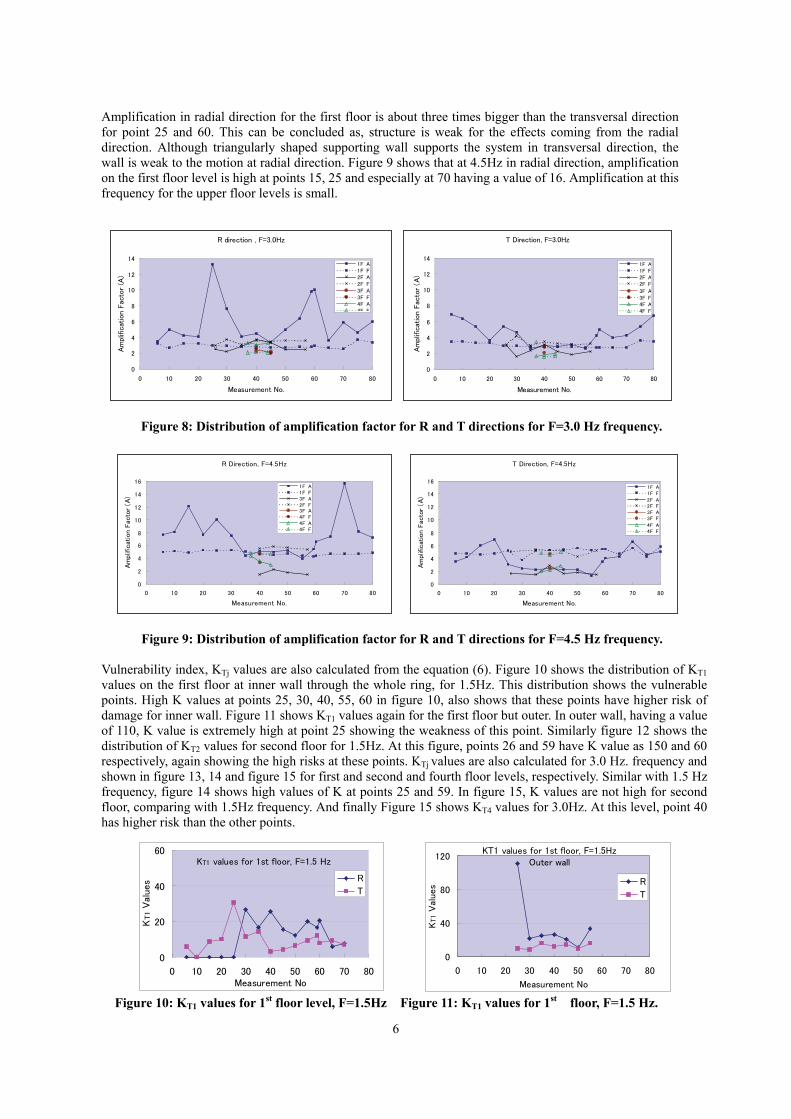
Deformation of Structures During Earthquakes and Vulnerability Index (K values) for Structures: Deformation of structures are related with seismic motion of the basement, dynamic characteristics of surface layer and structures. And to estimate possible damage for the future earthquakes, it is important to know the present durability condition of the ground and structure correctly. For this vulnerable weak points of the structures should be investigated in advance. Figure (6) simply shows the mode shape and deformation characteristics of nth floor structure.
Horizontal displacement δj shown in Figure 5.can be written as in equation (1),
Fs is a predominant frequency of structure. Story drift angle for jth story γj is expressed as follows,
Here, Ag and Asj are an amplification factor for ground and jth floor of the structure, respectively. Asj is derived from Sjh and Sgh which are horizontal spectrum of jth floor and ground floor respectively. And Asgj is derived from the ratio of Sj and vertical spectrum of ground floor and represents combined amplification factor of surface ground and structure. αb and αg are horizontal acceleration of basement and ground surface, respectively.
Figure 6: Derivation of mode shapes of nth floor structures. δj is the horizontal displacement, W is the weight of the jth floor, hj is the height of jth column, αb , αg , αsj are the horizontal acceleration of the basement, ground surface and jth floor of the structure, respectively.
( )(1)
2 2s
sjj Fπ
αδ =
(2) 4 22
11
js
sjsj
j
jjj hFh π
ααδδγ −− −
=−
=
(3) A
g
bsgj
bsj
gsjsj
A
A
A
α
α
αα
⋅=
⋅⋅=
⋅=
W1
Wj
Wn
1
j
n
h1
hj
hn
αg
αb
αs1
αsj
αsn
δ1
δj
δn
5
If unit of drift angle γj is 10-6, hj is meter and seismic acceleration is measured in unit Gal (cm/sec2), than with the unit adjustment, equation (2) can be written in following form,
From equation (4) KTgj value (representing vulnerability index for ground and building) is defined as,
unit of K values given above become 1/Gal. From this, vulnerability index for buildings can be written as,
Maximum allowable acceleration from jth column αbaj ( in Gal) derived from equation (4) is,
Detail explanation and examples of the application of this technique can be found in Nakamura (1996, 1997).
RESULTS
QTS spectrums (Nakamura, 1989) at basement level are given in Figure 4 together with measurement point locations. On west, south, east side of the basement, there is a peak around 1.2Hz with the amplification factor of 1.5, but these peaks are not so reliable and especially on the north side is not so clear probably because of the effect of the structure and traffic noise around this part. Effects of Rayleigh waves are clear at all points. From spectral ratios of each points, where measurements were done simultaneously, different peaks caused by different modes of the structure were found. Figure 7 shows the distribution of Amplification factor (A) for simultaneously measured points at ground and upper floor levels at 1.5 Hz frequency.
Figure 7: Distribution of amplification factor for R and T directions for F=1.5 Hz frequency. As we can follow, there are no peaks for the points from 6 to 25 (location of these points are shown in Figure 4). For both first and second floor levels, 1.5Hz peak with amplification factor about 4.5 in radial (R) and 3.5 in transversal (T) direction starts from the point 25 on the outer wall. This point is the one which is connected with the supporting triangular wall. Peaks continue till point 60 which outer wall ends. Amplification is high along the radial direction for many points of outer wall. This can be concluded as 1.5Hz vibration is caused by the effect of outer wall. Similarly Figure 8 shows distribution of A for about 3Hz. For the first floor, amplification factor having the value of 13 in radial component is high especially for the beginning and the ending points of the outer wall which starts from 25 and continues till 60. There are no strongly amplified points at upper floor levels for this frequency.
( )(4)
410 22
14b
j
sgjsgjj hF
AAα
πγ ⋅
⋅
−⋅= −
( ) ( ) (5) 410 221
4jssgjsgjTgj hFAAK ⋅−= − π
( ) ( ) (6) 410 221
4jssjsjTj hFAAK ⋅−= − π
(7) 4
101
224
ajsgjsgj
jsaj AA
hFγ
πα ⋅
−
⋅⋅=
−
R Direction, F=1.5Hz
0
1
2
3
4
5
0 10 20 30 40 50 60 70 80
Measurement No.
Am
plific
atio
n F
acto
r (A
)
1F A
1F F
2F A
2F F
3F A3F F
4F A
4F F
T Direction, F=1.5Hz
0
1
2
3
4
5
0 10 20 30 40 50 60 70 80
Measurement No.
Am
plific
atio
n F
acto
r (A
)
1F A
1F F
2F A2F F
3F A
3F F
4F A4F F
6
Amplification in radial direction for the first floor is about three times bigger than the transversal direction for point 25 and 60. This can be concluded as, structure is weak for the effects coming from the radial direction. Although triangularly shaped supporting wall supports the system in transversal direction, the wall is weak to the motion at radial direction. Figure 9 shows that at 4.5Hz in radial direction, amplification on the first floor level is high at points 15, 25 and especially at 70 having a value of 16. Amplification at this frequency for the upper floor levels is small.
Figure 8: Distribution of amplification factor for R and T directions for F=3.0 Hz frequency.
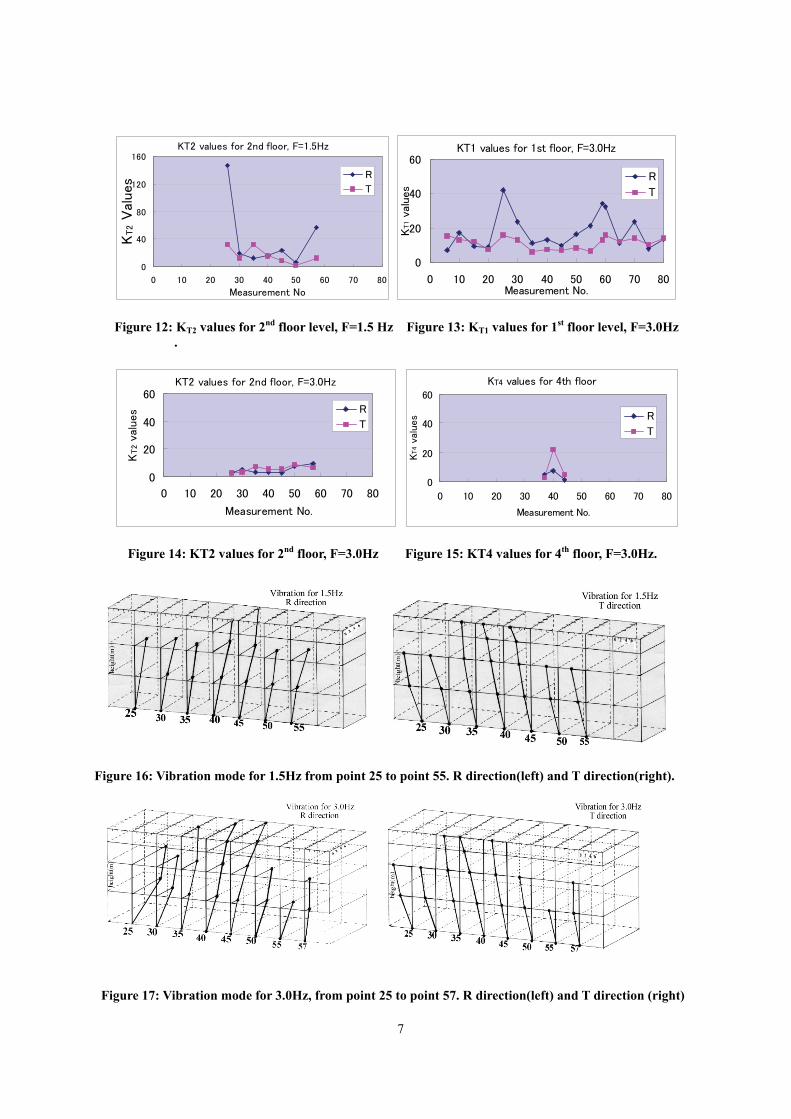
Figure 9: Distribution of amplification factor for R and T directions for F=4.5 Hz frequency. Vulnerability index, KTj values are also calculated from the equation (6). Figure 10 shows the distribution of KT1 values on the first floor at inner wall through the whole ring, for 1.5Hz. This distribution shows the vulnerable points. High K values at points 25, 30, 40, 55, 60 in figure 10, also shows that these points have higher risk of damage for inner wall. Figure 11 shows KT1 values again for the first floor but outer. In outer wall, having a value of 110, K value is extremely high at point 25 showing the weakness of this point. Similarly figure 12 shows the distribution of KT2 values for second floor for 1.5Hz. At this figure, points 26 and 59 have K value as 150 and 60 respectively, again showing the high risks at these points. KTj values are also calculated for 3.0 Hz. frequency and shown in figure 13, 14 and figure 15 for first and second and fourth floor levels, respectively. Similar with 1.5 Hz frequency, figure 14 shows high values of K at points 25 and 59. In figure 15, K values are not high for second floor, comparing with 1.5Hz frequency. And finally Figure 15 shows KT4 values for 3.0Hz. At this level, point 40 has higher risk than the other points.
Figure 10: KT1 values for 1st floor level, F=1.5Hz Figure 11: KT1 values for 1st floor, F=1.5 Hz.
R direction , F=3.0Hz
0
2
4
6
8
10
12
14
0 10 20 30 40 50 60 70 80
Measurement No.
Am
plific
atio
n Fac
tor
(A)
1F A1F F2F A2F F3F A3F F4F A4F F
T Direction, F=3.0Hz
0
2
4
6
8
10
12
14
0 10 20 30 40 50 60 70 80
Measurement No.
Am
plif
icat
ion F
acto
r (A
)
1F A1F F2F A2F F
3F A3F F4F A4F F
KT1 values for 1st floor, F=1.5HzOuter wall
0
40
80
120
0 10 20 30 40 50 60 70 80
Measurement No
KT1
Val
ues R
T
KT1 values for 1st floor, F=1.5 Hz
0
20
40
60
0 10 20 30 40 50 60 70 80Measurement No
KT1
Val
ues R
T
R Direction, F=4.5Hz
0
2
4
6
8
10
12
14
16
0 10 20 30 40 50 60 70 80
Measurement No.
Am
plific
atio
n F
acto
r (A
)
1F A1F F3F A2F F3F A4F F4F A4F F
T Direction, F=4.5Hz
0
2
4
6
8
10
12
14
16
0 10 20 30 40 50 60 70 80
Measurement No.
Am
plific
atio
n F
acto
r (A
)
1F A1F F
2F A2F F3F A3F F
4F A4F F
7
Figure 12: KT2 values for 2nd floor level, F=1.5 Hz Figure 13: KT1 values for 1st floor level, F=3.0Hz .
Figure 14: KT2 values for 2nd floor, F=3.0Hz Figure 15: KT4 values for 4th floor, F=3.0Hz.
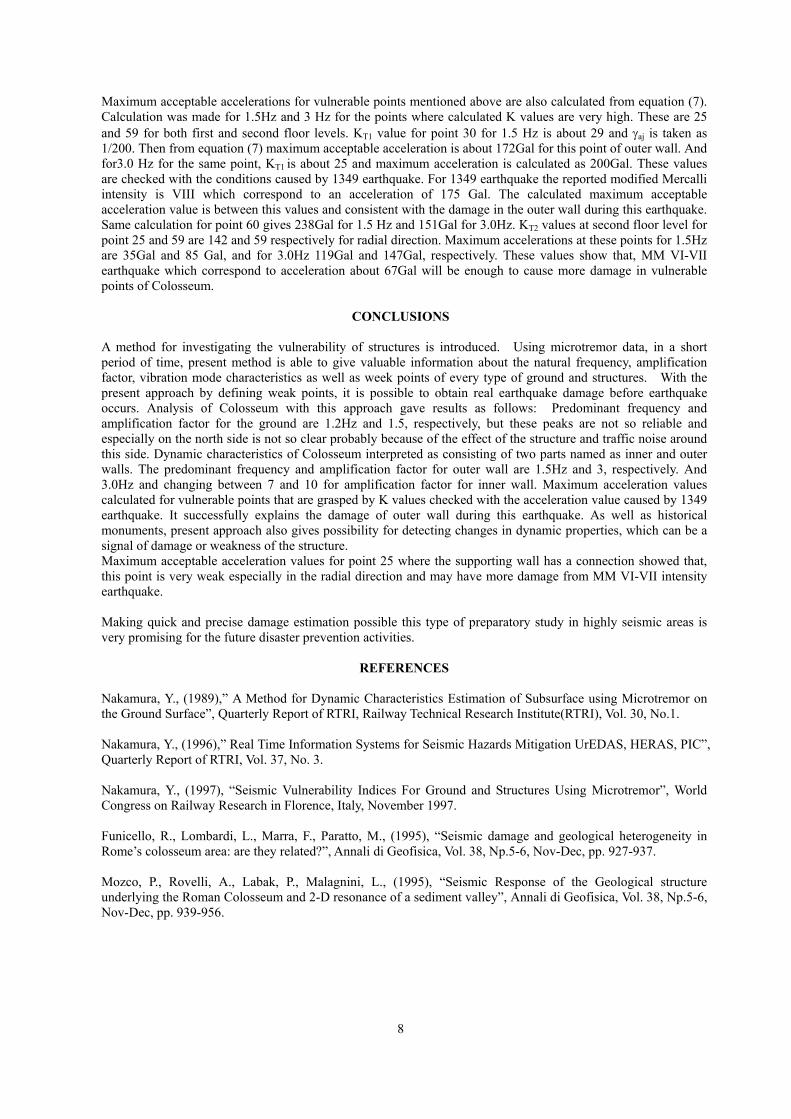
Figure 16: Vibration mode for 1.5Hz from point 25 to point 55. R direction(left) and T direction(right).
Figure 17: Vibration mode for 3.0Hz, from point 25 to point 57. R direction(left) and T direction (right)
KT2 values for 2nd floor, F=1.5Hz
0
40
80
120
160
0 10 20 30 40 50 60 70 80
Measurement No
KT2 V
alues R
T
KT1 values for 1st floor, F=3.0Hz
0
20
40
60
0 10 20 30 40 50 60 70 80Measurement No.
KT1 v
alues
R
T
KT2 values for 2nd floor, F=3.0Hz
0
20
40
60
0 10 20 30 40 50 60 70 80
Measurement No.
KT2 v
alues R
T
KT4 values for 4th floor
0
20
40
60
0 10 20 30 40 50 60 70 80
Measurement No.
KT4 v
alues R
T
8
Maximum acceptable accelerations for vulnerable points mentioned above are also calculated from equation (7). Calculation was made for 1.5Hz and 3 Hz for the points where calculated K values are very high. These are 25 and 59 for both first and second floor levels. KT1 value for point 30 for 1.5 Hz is about 29 and γaj is taken as 1/200. Then from equation (7) maximum acceptable acceleration is about 172Gal for this point of outer wall. And for3.0 Hz for the same point, KT1 is about 25 and maximum acceleration is calculated as 200Gal. These values are checked with the conditions caused by 1349 earthquake. For 1349 earthquake the reported modified Mercalli intensity is VIII which correspond to an acceleration of 175 Gal. The calculated maximum acceptable acceleration value is between this values and consistent with the damage in the outer wall during this earthquake. Same calculation for point 60 gives 238Gal for 1.5 Hz and 151Gal for 3.0Hz. KT2 values at second floor level for point 25 and 59 are 142 and 59 respectively for radial direction. Maximum accelerations at these points for 1.5Hz are 35Gal and 85 Gal, and for 3.0Hz 119Gal and 147Gal, respectively. These values show that, MM VI-VII earthquake which correspond to acceleration about 67Gal will be enough to cause more damage in vulnerable points of Colosseum.
CONCLUSIONS
A method for investigating the vulnerability of structures is introduced. Using microtremor data, in a short period of time, present method is able to give valuable information about the natural frequency, amplification factor, vibration mode characteristics as well as week points of every type of ground and structures. With the present approach by defining weak points, it is possible to obtain real earthquake damage before earthquake occurs. Analysis of Colosseum with this approach gave results as follows: Predominant frequency and amplification factor for the ground are 1.2Hz and 1.5, respectively, but these peaks are not so reliable and especially on the north side is not so clear probably because of the effect of the structure and traffic noise around this side. Dynamic characteristics of Colosseum interpreted as consisting of two parts named as inner and outer walls. The predominant frequency and amplification factor for outer wall are 1.5Hz and 3, respectively. And 3.0Hz and changing between 7 and 10 for amplification factor for inner wall. Maximum acceleration values calculated for vulnerable points that are grasped by K values checked with the acceleration value caused by 1349 earthquake. It successfully explains the damage of outer wall during this earthquake. As well as historical monuments, present approach also gives possibility for detecting changes in dynamic properties, which can be a signal of damage or weakness of the structure. Maximum acceptable acceleration values for point 25 where the supporting wall has a connection showed that, this point is very weak especially in the radial direction and may have more damage from MM VI-VII intensity earthquake. Making quick and precise damage estimation possible this type of preparatory study in highly seismic areas is very promising for the future disaster prevention activities.
REFERENCES
Nakamura, Y., (1989),” A Method for Dynamic Characteristics Estimation of Subsurface using Microtremor on the Ground Surface”, Quarterly Report of RTRI, Railway Technical Research Institute(RTRI), Vol. 30, No.1. Nakamura, Y., (1996),” Real Time Information Systems for Seismic Hazards Mitigation UrEDAS, HERAS, PIC”, Quarterly Report of RTRI, Vol. 37, No. 3. Nakamura, Y., (1997), “Seismic Vulnerability Indices For Ground and Structures Using Microtremor”, World Congress on Railway Research in Florence, Italy, November 1997. Funicello, R., Lombardi, L., Marra, F., Paratto, M., (1995), “Seismic damage and geological heterogeneity in Rome’s colosseum area: are they related?”, Annali di Geofisica, Vol. 38, Np.5-6, Nov-Dec, pp. 927-937. Mozco, P., Rovelli, A., Labak, P., Malagnini, L., (1995), “Seismic Response of the Geological structure underlying the Roman Colosseum and 2-D resonance of a sediment valley”, Annali di Geofisica, Vol. 38, Np.5-6, Nov-Dec, pp. 939-956.