UNIVERSITE BORDEAUX 1
Thèse soutenue le 13 janvier 2011 pour le
DOCTORAT DE L’UNIVERSITE DE BORDEAUX 1
MENTION : SCIENCES DE LA VIE ET DE LA SANTE
Spécialité : Biologie Végétale
Par
Matthieu BOURDON
L’endoréduplication dans le développement du
fruit de tomate : de la structure à la croissance
cellulaire
sous la direction de
Jean-Pierre RENAUDIN
Membres du jury :
DE ALMEIDA-ENGLER J. Rapporteur
TRAAS J. Rapporteur
BESSOULE J.-J. Examinateur
BROWN S. Examinateur
CHEVALIER C. Président du Jury
Résumé
RESUME
Le développement du fruit de tomate s’accompagne d’un phénomène d’endopolyploïdisation (amplification de l’ADN en l'absence de mitose) associé à la croissance cellulaire. Au stade vert mature huit niveaux de ploïdie sont présents (2C à 256C) dans le péricarpe. Une première partie du travail a porté sur l’étude de la distribution spatiale des niveaux de ploïdie dans ce tissu. Cet objectif a nécessité la mise au point d’une méthode originale de détermination de la ploïdie in situ reposant sur la technique de BAC-FISH. Nous avons montré que les cellules les plus polyploïdes se situent dans les assises internes du péricarpe, et qu’elles sont aussi les plus grandes. Ces cellules semblent déjà formées au moment de l’anthèse. Cette cartographie de la ploïdie associée à une analyse de la taille cellulaire a également montré que la taille finale des cellules ne dépend pas uniquement de leur niveau de ploïdie mais également de leur position dans le péricarpe. Enfin, nos résultats suggèrent que l’endopolyploïdisation précède la croissance cellulaire.
Dans une deuxième partie du travail, nous avons étudié la structure des noyaux en microscopie à fluorescence et électronique. L’endopolyploïdisation affecte profondément la taille et la forme des noyaux, qui acquièrent un volume important et une forme complexe avec de profondes invaginations. La taille du nucléole augmente avec celle du noyau, ce qui suggère une activité de transcription accrue. De plus, la présence de nombreuses mitochondries à proximité des noyaux polyploïdes suggère une forte activité métabolique en lien avec l’endopolyploïdisation. L’utilisation de la méthode BAC-FISH a permis également de montrer que la polyploïdie se faisait par endoreduplication avec la formation de chromosomes polytènes.
Dans une troisième partie nous avons cherché, en criblant une banque de mutants Micro-Tom, à identifier des lignées affectées dans l’endoreduplication afin d’étudier l’impact de ce phénomène sur la vitesse de croissance du fruit. Nous avons caractérisé plusieurs familles dont les niveaux moyens de ploïdie variaient par rapport à la lignée de référence. Une de ces familles présente un phénotype stable au cours de deux générations, avec une augmentation d’au moins 30 % de la ploïdie moyenne et une augmentation de la taille des cellules du péricarpe. Cependant cette famille présentant aussi un développement relativement parthénocarpique de ses fruits, sa caractérisation n’a pas pu être poursuivie dans le cadre de ce travail. Mots-clés : Tomate, endoréduplication, croissance cellulaire, structure du noyau ABSTRACT
Tomato fruit development includes massive endopolyploidisation events (DNA duplication in the absence of mitoses) within pericarp cells, in which 8 DNA levels from 2 C to 256 C are detected at mature green stage. The first part of this work dealt with the study of the spatial distribution of ploidy levels in pericarp. To achieve this purpose, a new method for in situ ploidy assessment was set up using a BAC-FISH protocol. The main results are 1/ the most polyploid cells are located in central mesocarp cell layers; 2/ the most polyploid cells are also the largest cells; 3/ these cells are likely to be already present in ovary at anthesis. Ploidy mapping has also shown that the final cell size does not depend only on ploidy level but also on cell location in pericarp, and that endopolyploidization is likely set up in tissues before cell expansion.
The structure of the polyploid nucleus was studied by using fluorescence microscopy and electron microscopy. Endopolyploidization profoundly modifies the size and shape of nuclei, which become much larger and acquire a complex shape with deep invaginations. Nucleolus size increases, which is likely related to transcriptional increase. Moreover, the presence of numerous mitochondria in the close vicinity of the nuclear membrane reinforces the hypothesis of increased nuclear and metabolic activity in polyploid cells. The BAC-FISH in situ method for ploidy assessment also revealed that endopolyploidization proceeded through polyteny.
In the last part of this work, we screened a tomato Micro-Tom tilling bank for mutants affected in endopolyploidization. The aim was to use tomato lines with distinct ploidy levels to check the influence of ploidy on fruit growth rate. Several mutant families were identified with moderately increased ploidy levels. One of these families exhibited transmissible phenotype through 2 generations, with ploidy increased by ca. 30 % and increased pericarp cell size. As these mutants had also a strongly pronounced parthenocarpic phenotype, their characterization could not be further advanced in the frame of this work. Keywords : Tomato, endoreduplication, cell growth, nuclei structure
Remerciements
Ce travail a été réalisé à l’Institut National de la recherche agronomique, dans
l’équipe Organogenèse du fruit et Endoréduplication au sein de l’UMR 619 Biologie
du fruit. A ce titre j’aimerais vivement remercier Christian Chevalier et Dominique
Rolin, pour avoir permis mon intégration au sein de leur équipe et laboratoire,
respectivement.
Je remercie aussi mon directeur de thèse, M. Jean-Pierre Renaudin, pour avoir
encadré cette thèse.
Je tiens aussi à remercier Mme J. De Almeida Engler et M. J. Traas, qui me
font l’honneur de juger ce travail en tant que rapporteurs ainsi que M. S. Brown, J.-J.
Bessoule et C. Chevalier en tant qu’examinateurs.
Je tiens enfin à remercier tout particulièrement Mlle N. Frangne et Mme C.
Cheniclet, pour leur encadrement actif de cette thèse et pour les modèles
scientifiques et humains qu’elles ont représentés pour moi durant cette thèse. Je les
remercie aussi chaleureusement ainsi que M. C. Chevalier pour l’aide inestimable
qu’ils ont pu m’apporter lors de la rédaction de ce manuscrit.
De même, je tiens à apporter mes plus grands remerciements à :
* Olivier Coriton, pour son enseignement en cytogénétique, sa participation
active dans nos nombreuses réflexions scientifiques et sa réactivité légendaire à
toutes nos questions…
* Spencer Brown, pour son aide inestimable en cytométrie/microscopie et son
approche si unique de la science et de la vie. Il reste à ce jour trop peu de
scientifiques aussi mordus que lui étant capables de vous transmettre et de vous
faire vivre sa passion en moins de 2 phrases…
* Ronan Piriou, ami, coloc, à qui revient l’immense mérite de m’avoir supporté,
porté et aidé à tous niveaux dans cette entreprise qui a connu des hauts mais aussi
bien des bas… Merci mille fois mon ami !
*Mireia Noguera, quien me ha ayudado a sobrellevar la soledad en la etapa de
redacción, consiguiendo siempre hacerme sonreír delante de mi ordenador… y
aportándome más, mucho más…
* El Tomate, el cual me ha permitido disminuir mi estrés durante la redacción y
además ver este fruto desde un punto de vista más divertido, sobre todo en los
peores momentos…
* Audrey Abot, pour les longs entretiens téléphoniques de vidage de sac et de
tête…
* Yoan Jacquemin, ami de toujours, pour tous les moments passés depuis le
premier jour sur les bancs de la Fac jusqu’au diplôme final.
* Stève de Bossoreille de Ribou et son indescriptible calme olympien sans qui
je n’aurais jamais connu Fela.
* Isaias, pour sa compagnie inestimable lors de la rédaction en tant que 2e
coloc’ et son remplacement effectif pour quasiment toutes mes tâches ménagères
durant cette période…
* Mes parents (Martine et Jean-Michel Bourdon) et mon petit frère (Alexandre
Bourdon) ; jamais je n’aurais pu réaliser ce travail sans leur soutien et leur confiance
indéfectibles.
* Mes collègues : Duyen Prodhomme et Lisa Boureau pour les interminables
discussions entreprises ; Je n’oublierais pas non plus Nicolas Viron et son côté pince
sans rire et pince tout court ; Antoine Monier, Calimero devant l’éternel ; Christian
Kappel, pour ces dégustations vins et fromage inoubliables ; les Fred pour leurs
insondables conneries ; Guillaume Ménard pour ces blagues douteuses à souhait et
ses changements de fond d’écran inopinés ; Mehdi Nafati et Thomas Guiraud pour
les moments les plus studieux entrecoupés de discussions tout aussi studieuses ;
Michel Hernould pour son inimitable Humour (oui oui avec un grand « H » !), Yves
Gibon pour son apport ineffable à la vie sociale du laboratoire via sa passion pour le
baby-foot et enfin encore Nathalie Frangne pour son soutien tant scientifique que
moral durant cette thèse et pour toutes nos digressions sans fin lors de nos
« pseudo » réunions scientifiques.
* Aux colocs successifs de l’inimitable « 46 rue Brémontier » : Julie, Bogdan,
Jérem’, Pierrot, Orane, Alex, Camille, Fanny et Théo.
* Enfin à tous mes amis de Bordeaux : Marine, Dimitri, Evelyne, Stéphane,
Camille, David, Thibaut, Aurel’, Cous’, Thierry, Sarah, Mathieu, et tous les autres…
Sommaire
Abréviations………………………………………………………………………………………………...p1
CHAPITRE 1 : INTRODUCTION……………………………………………….……….…...p2
PARTIE 1 : Influence des variations de ploïdie dans l’évolution………………….………...……….p3
1.1. Reproduction sexuée, ploïdie et cycle de vie ……………………………………….....………....p3
1.2. Reproduction sexuée, polyploïdisation et spéciation……………………………………..….…..p6
1.3. Cycle cellulaire, endopolyploïdisation et croissance…………………………………….……….p9
REFERENCES INTRODUCTION PARTIE 1……………………………………………………………...p15
PARTIE 2 : Chapitre d’ouvrage : Endoreduplication and growth of fleshy fruits…………….….p18
PARTIE 3 : Endopolyploïdisation : conséquences structurales et implications…………….…..p51
fonctionnelles
3.1. Endopolyploïdisation, différenciation, croissance et modalités d’action…………..………….p51
3.2. Influence de l’endopolyploïdisation sur l’expression génétique…………….…..…………..…..p53
3.2.1. Augmentation globale du niveau de transcription...................................................p53
via l’amplification fonctionnelle du génome.
3.2.2. Endopolyploïdie et régulation de l’expression génétique…………………..………….p54
3.2.3. Spatialisation du génome et expression génétique…………………………….………p56
3.3. Caractéristiques cellulaires de la cellule polyploïde………………………………………….…..p62
3.3.1. Organisation et différenciation de l’enveloppe …………………………………..……..p62
nucléaire lors de l’endopolyploïdisation
3.3.2. Organisation et évolution du cytoplasme en …………………………………….……..p64
relation avec l’endopolyploïdie
3.4. Objectifs du travail de thèse…………………………………………………..………………..…..p66
REFERENCES INTRODUCTION PARTIE 3……………………………………………….……………..p68
CHAPITRE 2 : RESULTATS………………………………………………………………….p74
PARTIE 1 : ARTICLE 1 :.............................................................................................................p75
In planta quantification of endoreduplication using Fluorescent In Situ Hybridization (FISH)
PARTIE 2 : ARTICLE 2……………………………………………………………………………...……..p109
Structural analysis of endopolyploid nuclei from tomato (Solanum lycopersicum) fruit cells
PARTIE 3 : CRIBLAGE DE LA BANQUE DE MUTANTS TILLING MICRO-TOM……………..…..p140
Recherche de mutants affectés dans l’endoréduplication
CHAPITRE 3 : DISCUSSION – CONCLUSION..............................................p165
1. Contexte et problématique……………………………………………………………..…………….p165
2. Implication de l’endopolyploïdisation dans la croissance cellulaire………..……………….p166
3. Amplification fonctionnelle du génome et profils d’expression……………………..………..p171
associés à l’endopolyploïdisation
4. Supra-organisation et ergonomie de la cellule endopolyploïde……………………...……….p172
5. CONCLUSION……………………………………………………………………………………..……p178
REFERENCES DISCUSSION – CONCLUSION……………………………………………..…......…..p179
ANNEXES : PRODUCTION SCIENTIFIQUE.......................................................p181
- 1 -
Abréviations
Acides nucléiques et nucléotides
ADN Acide désoxyribonucléique ADNg Acide désoxyribonucléique génomique ARN Acide ribonucléique ARNm Acide ribonucléique messager ARNr Acide ribonucléique ribosomal ARNt Acide ribonucléique de transfert ATP Adenosine 5’ triphosphate Kb, Mb kilobase, mégabase kDa, MDa Kilodalton, Mégadalton RNA Pol II RNA polymérase II TC Territoire chromosomique Unités
°C degré Celsius g accélération rpm round per minute s, min, h seconde, minute, heure EI Endoreduplication Index MCV : Mean C Value Divers
2-D , 3-D deux dimensions; troiss dimensions GFP Green Fluorescent Protein BY-2 lignée cellulaire de Tabac ayant pour origine le cultivar BY-2 (Bright Yellow
– 2) RE Réticulum Endoplasmique EMS Ethyl Methyl Sulfonate BSA Bovine Serum Albumin cv Cultivar DEPC Diethylpyrocarbonate DAPI 4’,6-diamino-2-phenylindole FISH Fluorescent in situ Hybridization SSC tampon ”saline-sodium citrate” TBS tampon “tris buffer sakine” NOR Nucleolar Organizing Regions DIOC6(3), Dihexyloxacarbocyanine iodide TEM Transmission Electron Microscopy
- 2 -
CHAPITRE 1 : INTRODUCTION
Chez les eucaryotes, la réplication de l’information génétique est assurée au
cours d’un cycle cellulaire aboutissant à 2 processus de division nucléaire: la mitose
et la méiose. Quel que soit le processus, le maintien conservatif de cette information
passe alors par l’alternance de phases de ploïdies distinctes n et 2n. En
conséquence, les eucaryotes ont développé au cours de l’évolution une tolérance
envers les changements de ploïdie (Gerstein and Otto 2009). Cette tolérance a sans
doute permis l’émergence d’autres évènements conduisant à des modifications de
ploïdie, pérennisés soit au sein d’organes ou de lignées cellulaires
(endopolyploïdisation), soit au sein d’organismes entiers (auto- et allo-
polyploïdisation). Ce faisant, les variations de ploïdie ont une importance non
négligeable dans l’histoire évolutive des eucaryotes, influençant la mise en place
d’un cycle de reproduction particulier, d’un phénotype ou d’un organe, voire
favorisant l’apparition de nouvelles espèces.
Nous développerons dans une première partie l’influence évolutive des
variations de ploïdie les plus représentatives chez les eucaryotes. Dans une
deuxième partie, nous insisterons sur une forme particulière de changement de
ploïdie, l’endopolyploïdisation, et sur le rôle qu’elle pourrait jouer au sein d’un organe
végétal particulier, à savoir le fruit. Nous ferons ensuite le point sur l’impact
moléculaire et cellulaire de ce phénomène, et nous terminerons cette introduction en
présentant les objectifs de ce travail, visant à mieux cerner le rôle de
l’endopolyploidisation au cours du développement du fruit de Tomate.
- 3 -
PARTIE 1 : Influence évolutive des variations de ploïdie
dans l’évolution
1.1. Reproduction sexuée, ploïdie et cycle de vie
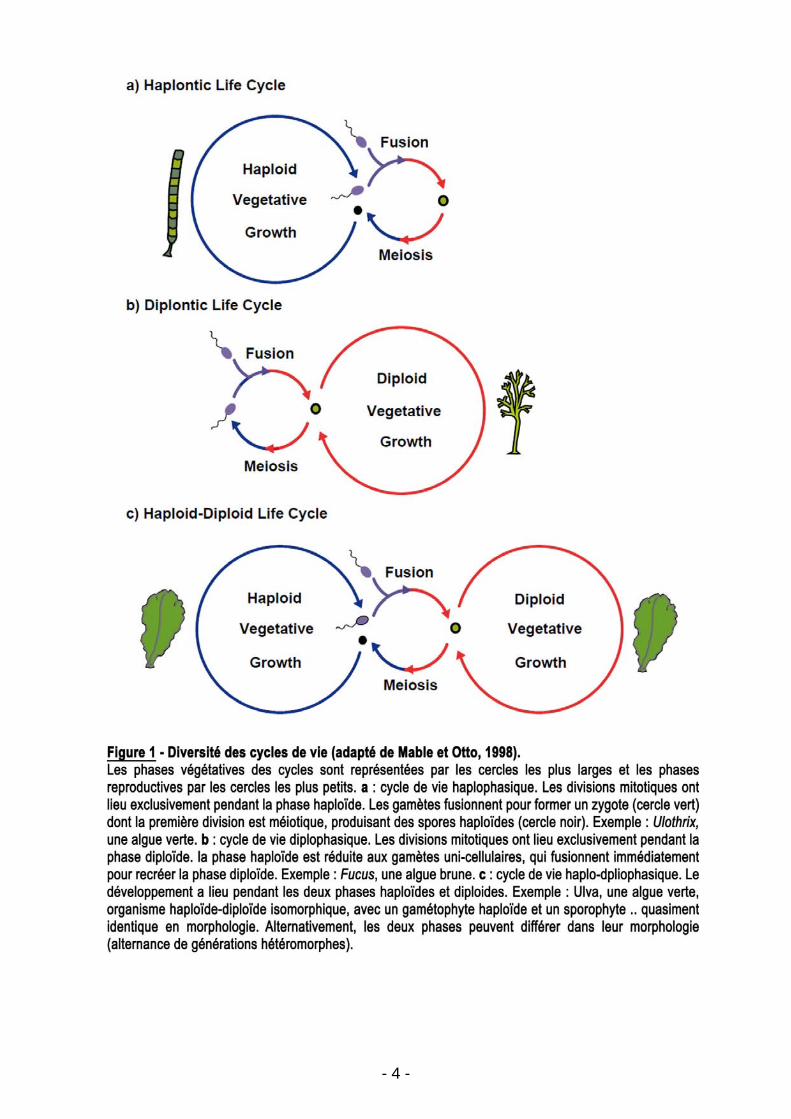
L’apparition de la méiose, et donc de la reproduction sexuée, outre la variabilité
génétique qu’elle apporte par le jeu des recombinaisons entre chromosomes, a
entraîné l’alternance de générations (cycles de vie) haploïdes et diploïdes (Mable
and Otto 1998) (Figure 1).
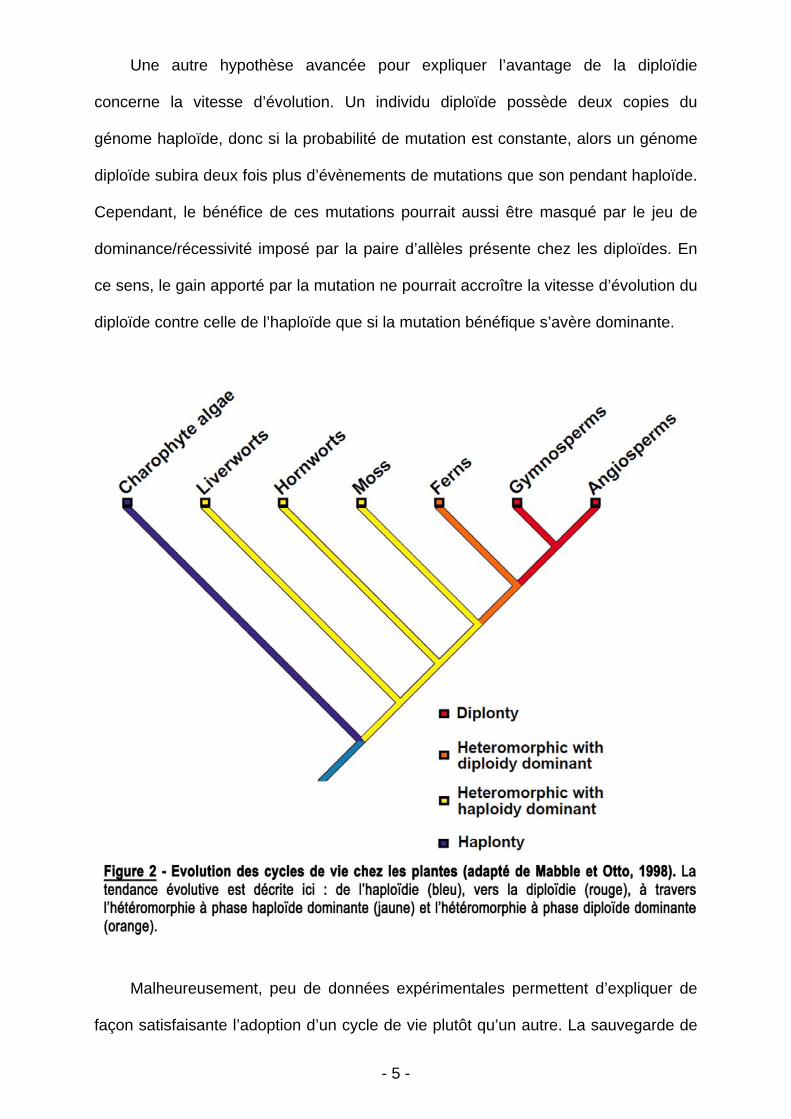
Chez les Embryophytes l’évolution tend vers une réduction de la durée de la
phase haploïde et une dominance de la phase diploïde (Figure 2). Une telle
observation suggère donc un avantage sélectif de la diploïdie envers l’haploïdie. En
effet, étant donné que la plupart des mutations affectant négativement la valeur
adaptative (fitness) sont partiellement récessives, et que l’apparition d’allèles
mutants dans une population est rare, alors il est improbable qu’un individu diploïde
provenant d’un croisement aléatoire porte les deux copies mutantes du même allèle.
A l’inverse, des individus haploïdes expriment chacune des mutations de leur
génome. De cette manière, des individus à phase diploïde dominante auraient une
meilleure valeur adaptative, et la génération diploïde serait sélectivement favorisée.
Cependant, la contrepartie à une telle « stratégie » évolutive, bénéfique pour la
survie de l’individu, est représentée par la fixation d’allèles mutants dans la
descendance. Par conséquent, les populations haploïdes tendent à porter moins de
mutations délétères dans leur génome et auraient alors une meilleure valeur
adaptative à l’équilibre que les populations diploïdes.
- 4 -
- 5 -
Une autre hypothèse avancée pour expliquer l’avantage de la diploïdie
concerne la vitesse d’évolution. Un individu diploïde possède deux copies du
génome haploïde, donc si la probabilité de mutation est constante, alors un génome
diploïde subira deux fois plus d’évènements de mutations que son pendant haploïde.
Cependant, le bénéfice de ces mutations pourrait aussi être masqué par le jeu de
dominance/récessivité imposé par la paire d’allèles présente chez les diploïdes. En
ce sens, le gain apporté par la mutation ne pourrait accroître la vitesse d’évolution du
diploïde contre celle de l’haploïde que si la mutation bénéfique s’avère dominante.
Malheureusement, peu de données expérimentales permettent d’expliquer de
façon satisfaisante l’adoption d’un cycle de vie plutôt qu’un autre. La sauvegarde de
- 6 -
cycles de vie très variés au cours de l’évolution des eucaryotes suggère qu’il n’existe
pas d’avantage évolutif définitif d’une phase chromosomique sur une autre. En
revanche, le large degré des variations observées suggère que la stratégie de cycle
de vie peut être vue comme un caractère variable encore soumis à des modifications
évolutives. Ce faisant, il offre l’opportunité pour une espèce donnée d’évoluer vers
une tendance plutôt qu’une autre en fonction de la pression sélective du milieu, la
tendance retenue étant la forme la plus à même d’assurer la survie de l’espèce au
sein de ce milieu.
1.2. Reproduction sexuée, polyploïdisation et spéciation
Outre l’alternance de phases haploïde et diploïde au cours du cycle de vie d’un
organisme, d’autres situations peuvent aboutir à l’apparition d’évènements de
polyploïdisation produisant des individus avec une ou plusieurs copies du ou des
génomes parentaux. Deux types de polyploïdisations sont distingués dans ce cadre :
l’autopolyploïdisation et l’allopolyploïdisation, selon qu’elles concernent le
rassemblement de génomes diploïdes semblables ou différents (hybridation intra- ou
inter-spécifique) (Otto 2007, Otto and Whitton 2000). Elles peuvent provenir d’une
non-réduction gamétique (erreur de déroulement de la méiose), d’un doublement
génomique (erreur de déroulement de la mitose) ou de polyspermie (plusieurs
gamètes mâles fécondant un ovule) (Gerstein and Otto 2009). Le mode de
polyploïdisation privilégié chez les plantes semble être la non-réduction gamétique,
alors qu’au sein du règne animal, ce mécanisme semble aussi dû à la polyspermie.
Cependant, chez les mammifères et les oiseaux, il semble moins toléré en raison de
problèmes d’empreintes génétiques et de développement placental. Chez les
plantes, la fréquence d’apparition de ce phénomène semble importante. Afin
d’estimer le nombre d’évènements de polyploïdisation ancestraux, le nombre de
chromosomes au sein de chaque espèce considérée a été mesuré et l’excès d’un
- 7 -
nombre pair de chromosomes par rapport aux nombres impairs est considéré
comme un bon indicateur d’évènements de polyploïdisation passés (Otto, 2007). En
effet, si l’on part du postulat que le nombre de chromosomes n d’un génome a autant
de chances d’être un chiffre pair ou impair, alors l’observation d’un excès de
nombres pairs dans un lot d’espèces donné reflète un nombre important
d’évènements de polyploïdisations. Selon ce critère, 42 % des fougères, 32 % des
monocotylédones et 18 % des dicotylédones auraient subi au moins un évènement
de polyploïdisation au cours de leur évolution.
L’apport évolutif de ces mécanismes reste, comme les variations des cycles de
vie évoquées plus haut, difficile à déterminer. On peut reprendre une partie des
arguments cités dans la partie précédente comme le masquage des mutations
délétères et l’augmentation de la vitesse d’évolution, cependant les contreparties
évoquées restent les mêmes. Ainsi, la vitesse d’évolution des polyploïdes serait
accrue seulement si les mutations bénéfiques y ayant lieu présentent un caractère
dominant.
On peut alors se demander pourquoi l’évolution semble avoir conservé autant
d’organismes présentant des évènements de polyploïdisation ? Tout d’abord par un
apport de nouveaux gènes et de nouveaux allèles, favorisant la variabilité génétique
et potentiellement le pouvoir adaptatif de l’individu néo-formé. Même si l’apport de
variabilité semble plus important dans le cas de l’allopolyploïdisation puisque
rassemblant des génomes d’espèces différentes, l’autopolyploïdisation n’est pas en
reste en termes de variabilité apportée en réalisant une combinaison complexe et
inédite d’allèles provenant des deux parents et favorisant ainsi l’hétérozygotie
(Osborn et al. 2003). Ensuite, le doublement du génome offre la potentialité de néo-
fonctionnalisation de gènes tout en conservant les fonctions d’origine. L’apparition de
- 8 -
nouvelles fonctions pourrait donc permettre une meilleure adaptation à
l’environnement via un spectre de réponses biologiques plus large.
Enfin, les polyploïdes nouvellement formés ont un génome plutôt instable et
subissent beaucoup de réarrangements chromosomiques (Wendel, 2000). En effet,
des recombinaisons non-homologues sont hautement probables entre chromosomes
homéologues (cas des allopolyploïdes). En altérant ainsi le contexte génomique de
certains gènes, ces réarrangements peuvent alors augmenter la variabilité génétique
de la lignée polyploïde nouvellement formée. On observe aussi une forte variation
dans l’expression génétique, souvent associée à la divergence des génomes
parentaux (et donc à l’allopolyploïdie). Inversement, une plus faible variation de
l’expression est attendue chez les autopolyploïdes (Galitski et al. 1999, Guo et al.
1996)
Ainsi, le rôle de la polyploïdisation dans l’évolution pourrait s’effectuer par la
néo-fonctionnalisation de gènes par duplication du génome, et par la variabilité
génétique apportée par l’allopolyploïdisation et l’autopolyploïdisation. Le potentiel
évolutif offert par ce phénomène, engendrant des lignées génétiquement différentes
de leurs géniteurs capables d’envahir de nouvelles niches écologiques serait alors à
l’origine de la réussite évolutive des polyploïdes. En ce sens, les évènements de
polyploïdisation sont considérés comme un mécanisme majeur dans la création de
nouvelles espèces, et plus particulièrement les évènements d’allopolyploïdisation
(Soltis and Soltis 2009).
Nous avons ainsi vu que le génome eucaryote recelait une certaine plasticité lui
permettant de gérer des doublements génomiques. Nous terminerons cette première
partie en abordant un mode de polyploïdisation dont l’impact adaptatif et/ou évolutif a
été moins discuté : l’endopolyploïdisation.
- 9 -
1.3. Cycle cellulaire, endopolyploïdisation et croissance
L’existence de l’endopolyploïdisation illustre la notion de flexibilité du cycle
nucléaire eucaryote. Ce phénomène consiste en l’augmentation locale du nombre de
copies d’un génome par cellule. Il résulte d’un arrêt programmé du cycle cellulaire
postérieurement à la phase de synthèse de l’ADN et antérieurement à la phase de
mitose, doublant ainsi la quantité d’ADN à chaque endocycle et conduisant donc à
l’apparition de plusieurs niveaux de ploïdie au sein d’un même organisme (Barow
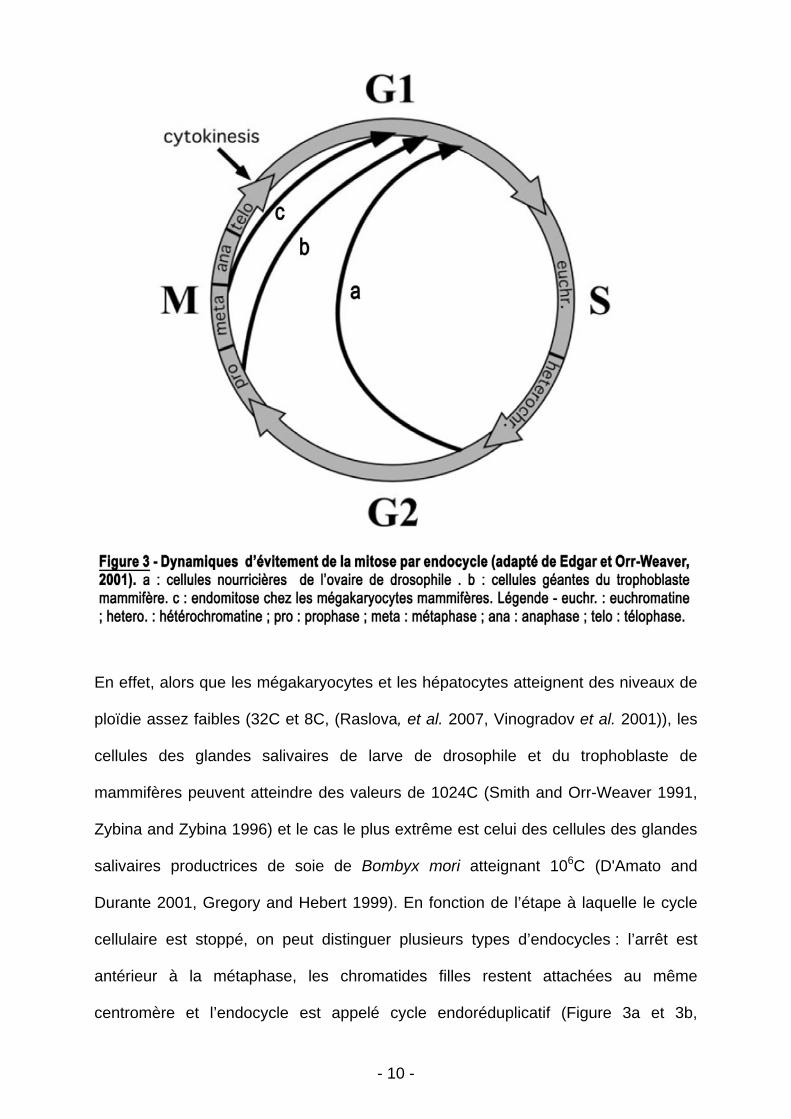
2006, Edgar and Orr-Weaver 2001, Joubès and Chevalier 2000) (Figure 3). Ce type
de polyploïdie ayant lieu au sein de tissus somatiques, elle est aussi appelée
polyploïdie terminale et serait fortement impliquée dans la croissance cellulaire et la
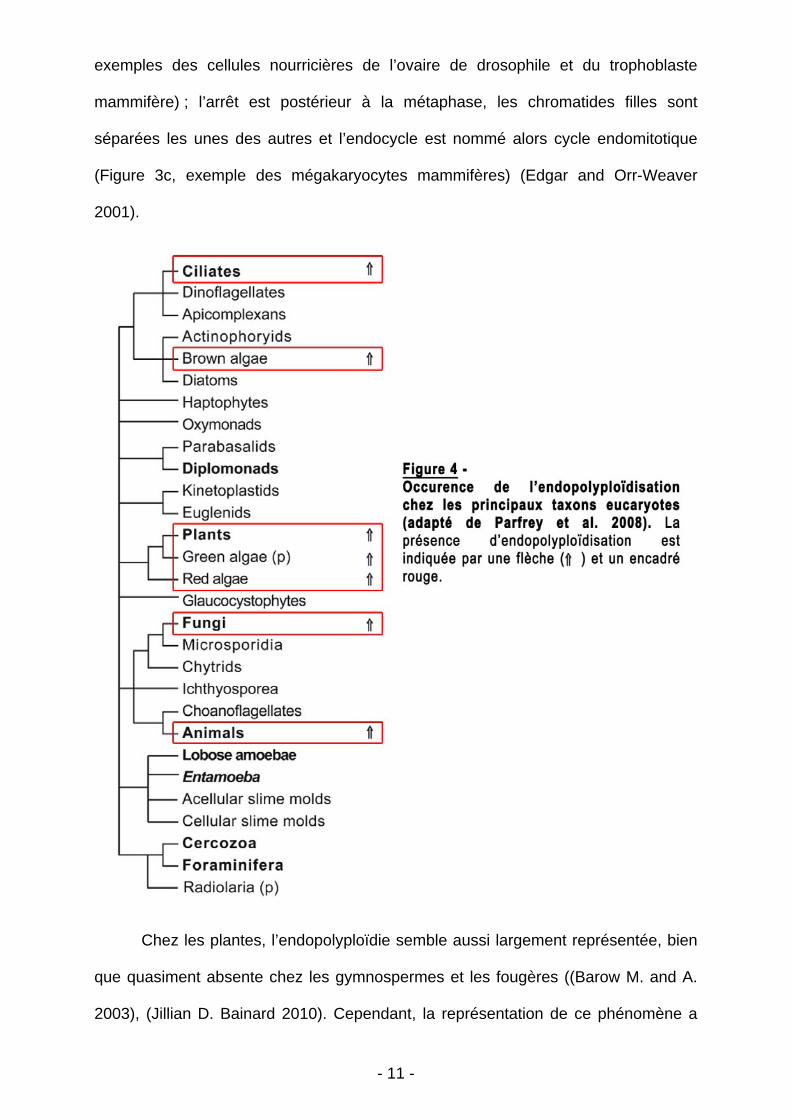
différenciation (Edgar and Orr-Weaver 2001, Hulskamp 2004). On la retrouve dans
de nombreux taxons pluricellulaires incluant les algues, les champignons, les plantes
et les animaux (Figure 4).
Chez les animaux, (Gregory and Hebert 1999) mentionnent la présence de
l’endopolyploïdisation dans chaque espèce animale testée avec une prévalence chez
les arthropodes. En effet, les insectes paraissent les plus concernés par ce
phénomène, avec les exemples bien connus des glandes salivaires et des cellules
nourricières des larves de drosophile et de Bombyx mori. Chez les mammifères, les
tissus et/ou cellules les plus étudiés ayant recours à ce mécanisme sont les
mégakaryocytes (précurseurs des plaquettes sanguines, (Raslova et al. 2007)), les
hépatocytes (cellules du foie (Lu et al. 2007)) et les cellules du trophoblaste (tissu
nourricier de l’embryon, (Varmuza et al. 1988)). Les degrés d’endopolyploïdisation
sont variables et dépendent de l’organisme et même du tissu considéré.
- 10 -
En effet, alors que les mégakaryocytes et les hépatocytes atteignent des niveaux de
ploïdie assez faibles (32C et 8C, (Raslova, et al. 2007, Vinogradov et al. 2001)), les
cellules des glandes salivaires de larve de drosophile et du trophoblaste de
mammifères peuvent atteindre des valeurs de 1024C (Smith and Orr-Weaver 1991,
Zybina and Zybina 1996) et le cas le plus extrême est celui des cellules des glandes
salivaires productrices de soie de Bombyx mori atteignant 106C (D'Amato and
Durante 2001, Gregory and Hebert 1999). En fonction de l’étape à laquelle le cycle
cellulaire est stoppé, on peut distinguer plusieurs types d’endocycles : l’arrêt est
antérieur à la métaphase, les chromatides filles restent attachées au même
centromère et l’endocycle est appelé cycle endoréduplicatif (Figure 3a et 3b,
- 11 -
exemples des cellules nourricières de l’ovaire de drosophile et du trophoblaste
mammifère) ; l’arrêt est postérieur à la métaphase, les chromatides filles sont
séparées les unes des autres et l’endocycle est nommé alors cycle endomitotique
(Figure 3c, exemple des mégakaryocytes mammifères) (Edgar and Orr-Weaver
2001).
Chez les plantes, l’endopolyploïdie semble aussi largement représentée, bien
que quasiment absente chez les gymnospermes et les fougères ((Barow M. and A.
2003), (Jillian D. Bainard 2010). Cependant, la représentation de ce phénomène a
- 12 -
été récemment étudiée au sein des Bryophytes (Mousses, Hépatiques et
Anthocérotes), groupe représentant les plantes les plus proches des premiers
Embryophytes, dans le but de mieux comprendre l’évolution de l’endopolyploïdie
(Jillian D. Bainard 2010). Les auteurs ont remarqué une forte présence de
l’endopolyploïdisation chez les mousses, excepté pour la famille des sphaignes, et
une quasi absence chez les Hépatiques. De cette étude, les auteurs ont alors conclu
que l’endopolyploïdie aurait probablement évolué de manière indépendante dans les
différents taxons végétaux, au vu des différences observées chez les Bryophytes
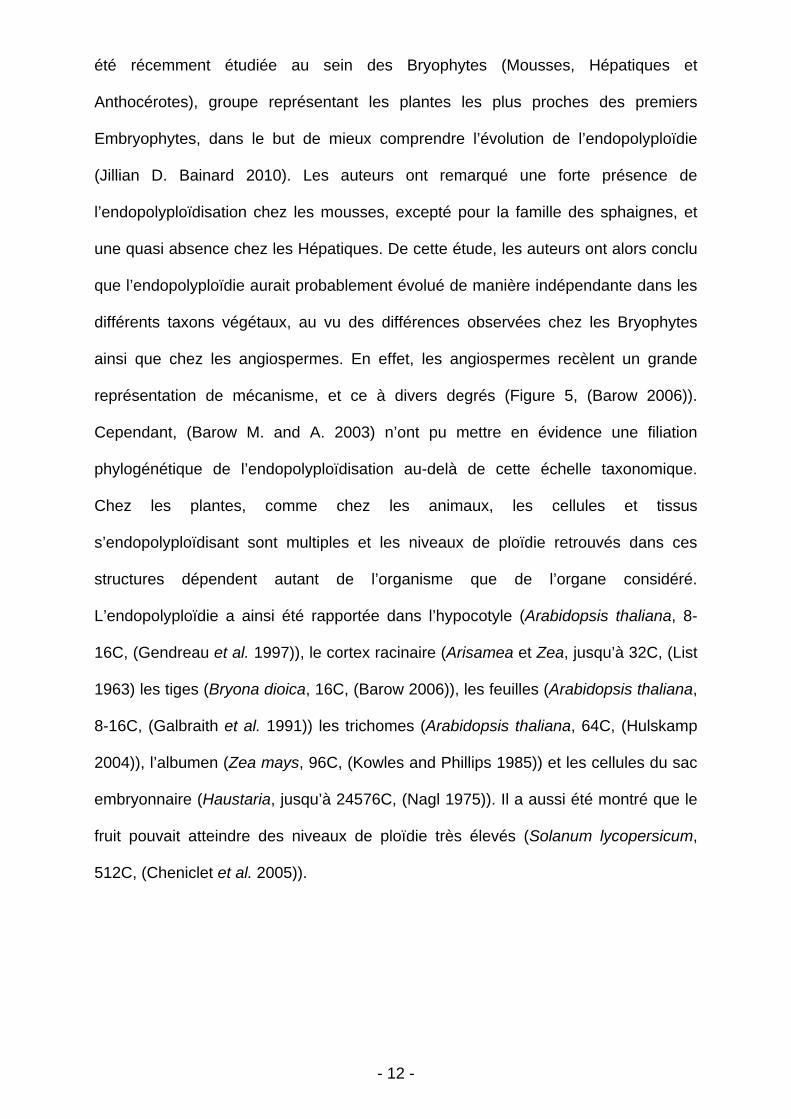
ainsi que chez les angiospermes. En effet, les angiospermes recèlent un grande
représentation de mécanisme, et ce à divers degrés (Figure 5, (Barow 2006)).
Cependant, (Barow M. and A. 2003) n’ont pu mettre en évidence une filiation
phylogénétique de l’endopolyploïdisation au-delà de cette échelle taxonomique.
Chez les plantes, comme chez les animaux, les cellules et tissus
s’endopolyploïdisant sont multiples et les niveaux de ploïdie retrouvés dans ces
structures dépendent autant de l’organisme que de l’organe considéré.
L’endopolyploïdie a ainsi été rapportée dans l’hypocotyle (Arabidopsis thaliana, 8-
16C, (Gendreau et al. 1997)), le cortex racinaire (Arisamea et Zea, jusqu’à 32C, (List
1963) les tiges (Bryona dioica, 16C, (Barow 2006)), les feuilles (Arabidopsis thaliana,
8-16C, (Galbraith et al. 1991)) les trichomes (Arabidopsis thaliana, 64C, (Hulskamp
2004)), l’albumen (Zea mays, 96C, (Kowles and Phillips 1985)) et les cellules du sac
embryonnaire (Haustaria, jusqu’à 24576C, (Nagl 1975)). Il a aussi été montré que le
fruit pouvait atteindre des niveaux de ploïdie très élevés (Solanum lycopersicum,
512C, (Cheniclet et al. 2005)).
- 13 -
D’un point de vue évolutif, la mise en évidence d’une corrélation négative entre
la taille du génome et la probabilité d’apparition de l’endopolyploïdie a conduit Nagl
(1975) à considérer l’endopolyploïdisation comme une alternative évolutive à
l’augmentation de la taille du génome. En effet, cet auteur émet l’hypothèse d’une
- 14 -
quantité minimale d’ADN nécessaire à certaines fonctions cellulaires. Cependant,
cette hypothèse a été récemment remise en cause en démontrant la faiblesse de la
corrélation citée plus haut sur un plus grand échantillonnage (Barow and Meister
2003). Ces auteurs mettent alors plutôt en avant une implication de
l’endopolyploïdisation dans la vitesse de croissance de l’organe considéré ou dans
l’accomplissement rapide d’un cycle de vie. Malgré tout, la corrélation négative
observée entre endopolyploïdisation et durée du cycle de vie s’est elle aussi révélée
assez faible (Barow and Meister 2003), indice que l’endopolyploïdisation aurait un
rôle plus étendu que l’accomplissement rapide d’un cycle de vie.
Nous émettrons alors une hypothèse plus générale. En effet, la fréquente
apparition de l’endopolyploïdie au sein des différents taxons eucaryotes suggère
qu’elle apporte une amélioration de la valeur adaptative (fitness) via l’amélioration de
la fonction de l’organe dans lequel elle a lieu. Contrairement aux variations de ploïdie
impliquant une variation constitutive de la taille du génome (cf parties précédentes),
l’impact de l’endopolyploïdie sur le phénotype sera plus localisé, étant restreinte à
certains organes ou types cellulaires. Cependant, les caractères mis en jeu ont
souvent un rôle important dans la valeur adaptative de l’individu (Gregory and Hebert
1999). Ces auteurs citent ainsi les exemples de la formation de cellules nourricières
chez l’embryon de nombreux arthropodes ou même celui du changement de
morphologie de la tête chez Daphnia – qui mime la tête d’un prédateur - faisant suite
à l’endopolyploïdisation. Chez la tomate et plusieurs autres angiospermes, la mise
en place de très hauts niveaux de ploïdie dans le fruit et son impact sur le
développement de l’organe ont alors sans doute permis l’amélioration de la valeur
adaptative de la plante via l’amélioration du rôle préexistant que jouait le fuit : la
protection de l’embryon en développement et sa dispersion dans l’environnement
(Bourdon, et al. 2010, Gillaspy, et al. 1993).
- 15 -
Cependant, l’implication de l’endopolyploïdie est restée moins étudiée dans le
développement du fruit que chez l’hypocotyle, la feuille et le trichome d’Arabidopsis
thaliana, ou l’albumen de certaines monocotylédones qui constituent les principaux
modèles d’études de ce phénomène chez les plantes.
REFERENCES INTRODUCTION PARTIE 1
Barow, M. (2006) Endopolyploidy in seed plants. BioEssays, 28, 271-281.
Barow, M. and Meister, A. (2003) Endopolyploidy in seed plants is differently
correlated to systematics, organ, life strategy and genome size. Plant Cell and
Environment, 26, 571-584.
Barow M. and A., M. (2003) Endopolyploidy in seed plants is differently correlated to
systematics, organ, life strategy and genome size. Plant, Cell & Environment,
26, 571-584.
Bourdon, M., Frangne, N., Mathieu-Rivet, E., Nafati, M., Cheniclet, C., Renaudin,
J.-P. and Chevalier, C. (2010) Endoreduplication and Growth of Fleshy
Fruits. In Progress in Botany 71, pp. 101-132.
Cheniclet, C., Rong, W.Y., Causse, M., Frangne, N., Bolling, L., Carde, J.-P. and
Renaudin, J.-P. (2005) Cell Expansion and Endoreduplication Show a Large
Genetic Variability in Pericarp and Contribute Strongly to Tomato Fruit Growth.
Plant Physiol., 139, 1984-1994.
D'Amato, F. and Durante, M. (2001) Polyploidy: John Wiley & Sons, Ltd.
Edgar, B.A. and Orr-Weaver, T.L. (2001) Endoreplication Cell Cycles: More for
Less. Cell, 105, 297-306.
Galbraith, D.W., Harkins, K.R. and Knapp, S. (1991) Systemic endopolyploidy in
Arabidopsis thaliana. Journal Name: Plant Physiology; (United States);
Journal Volume: 96:3, Medium: X; Size: Pages: 985-989.
Galitski, T., Saldanha, A.J., Styles, C.A., Lander, E.S. and Fink, G.R. (1999)
Ploidy Regulation of Gene Expression. Science, 285, 251-254.
Gendreau, E., Traas, J., Desnos, T., Grandjean, O., Caboche, M. and Hofte, H.
(1997) Cellular Basis of Hypocotyl Growth in Arabidopsis thaliana. Plant
Physiol., 114, 295-305.
Gerstein, A.C. and Otto, S.P. (2009) Ploidy and the Causes of Genomic Evolution.
Journal of Heredity.
- 16 -
Gillaspy, G., Bendavid, H. and Gruissem, W. (1993) FRUITS - A
DEVELOPMENTAL PERSPECTIVE. Plant Cell, 5, 1439-1451.
Gregory, T.R. and Hebert, P.D.N. (1999) The Modulation of DNA Content:
Proximate Causes and Ultimate Consequences. Genome Research, 9, 317-
324.
Guo, M., Davis, D. and Birchler, J.A. (1996) Dosage Effects on Gene Expression in
a Maize Ploidy Series. Genetics, 142, 1349-1355.
Hulskamp, M. (2004) Plant trichomes: a model for cell differentiation. Nat Rev Mol
Cell Biol, 5, 471-480.
Jillian D. Bainard, S.G.N. (2010) Endopolyploidy in Bryophytes: Widespread in
Mosses and Absent in Liverworts. Journal of Botany, 2010.
Joubès, J. and Chevalier, C. (2000) Endoreduplication in higher plants. Plant
Molecular Biology, 43, 735-745.
Kowles, R.V. and Phillips, R.L. (1985) DNA amplification patterns in maize
endosperm nuclei during kernel development. Proceedings of the National
Academy of Sciences of the United States of America, 82, 7010-7014.
List, A., Jr. (1963) Some Observations on DNA Content and Cell and Nuclear
Volume Growth in the Developing Xylem Cells of Certain Higher Plants.
American Journal of Botany, 50, 320-329.
Lu, P., Prost, S., Caldwell, H., Tugwood, J., Betton, G. and Harrison, D. (2007)
Microarray analysis of gene expression of mouse hepatocytes of different
ploidy. Mammalian Genome, 18, 617-626.
Nagl, W. (1975) DNA endoreduplication and polyteny understood as evolutionary
strategies. Nature, UK, 261, 614-615.
Osborn, T.C., Chris Pires, J., Birchler, J.A., Auger, D.L., Jeffery Chen, Z., Lee,
H.-S., Comai, L., Madlung, A., Doerge, R.W., Colot, V. and Martienssen,
R.A. (2003) Understanding mechanisms of novel gene expression in
polyploids. Trends in Genetics, 19, 141-147.
Otto, S.P. (2007) The Evolutionary Consequences of Polyploidy. Cell, 131, 452-462.
Otto, S.P. and Whitton, J. (2000) Polyploid incidence and evolution. Annual Review
of Genetics, 34, 401-437.
Raslova, H., Kauffmann, A., Sekkai, D., Ripoche, H., Larbret, F., Robert, T., Le
Roux, D.T., Kroemer, G., Debili, N., Dessen, P., Lazar, V. and
Vainchenker, W. (2007) Interrelation between polyploidization and
megakaryocyte differentiation: a gene profiling approach. Blood, 109, 3225-
3234.
- 17 -
Smith, A.V. and Orr-Weaver, T.L. (1991) The regulation of the cell cycle during
Drosophila embryogenesis: the transition to polyteny. Development, 112, 997-
1008.
Soltis, P.S. and Soltis, D.E. (2009) The role of hybridization in plant speciation.
Annual Review of Plant Biology, 60, 561-588.
Varmuza, S., Prideaux, V., Kothary, R. and Rossant, J. (1988) Polytene
chromosomes in mouse trophoblast giant cells. Development, 102, 127-134.
Vinogradov, A.E., Anatskaya, O.V. and Kudryavtsev, B.N. (2001) Relationship of
hepatocyte ploidy levels with body size and growth rate in mammals. Genome,
44, 350-360.
Zybina, E.V. and Zybina, T.G. (1996) Polytene chromosomes in mammalian cells.
International Review of Cytology - a Survey of Cell Biology, Vol 165, 165, 53-
119.

- 18 -
PARTIE 2 : Chapitre d’ouvrage : Endoreduplication and
growth of fleshy fruits
Endoreduplication and Growth of Fleshy Fruits
Matthieu Bourdon, Nathalie Frangne, Elodie Mathieu-Rivet, Mehdi Nafati,
Catherine Cheniclet, Jean-Pierre Renaudin, and Christian Chevalier
Contents
1 Introduction . . . . . . . . . . . . . . . . . . . . . . . . . . . . . . . . . . . . . . . . . . . . . . . . . . . . . . . . . . . . . . . . . . . . . . . . . . . . . . . 102
2 Fruit Development and Growth . . . . . . . . . . . . . . . . . . . . . . . . . . . . . . . . . . . . . . . . . . . . . . . . . . . . . . . . . . . 103
2.1 Carpel Morphogenesis and Fruit Set . . . . . . . . . . . . . . . . . . . . . . . . . . . . . . . . . . . . . . . . . . . . . . . . 103
2.2 Fruit Growth . . . . . . . . . . . . . . . . . . . . . . . . . . . . . . . . . . . . . . . . . . . . . . . . . . . . . . . . . . . . . . . . . . . . . . . . 104
2.3 Cell Division During Fruit Growth . . . . . . . . . . . . . . . . . . . . . . . . . . . . . . . . . . . . . . . . . . . . . . . . . 106
2.4 Cell Expansion During Fruit Growth . . . . . . . . . . . . . . . . . . . . . . . . . . . . . . . . . . . . . . . . . . . . . . . 108
3 Endopolyploidization . . . . . . . . . . . . . . . . . . . . . . . . . . . . . . . . . . . . . . . . . . . . . . . . . . . . . . . . . . . . . . . . . . . . . 109
3.1 Definitions . . . . . . . . . . . . . . . . . . . . . . . . . . . . . . . . . . . . . . . . . . . . . . . . . . . . . . . . . . . . . . . . . . . . . . . . . . 109
3.2 Occurrence of Endopolyploidization in Fruit Species . . . . . . . . . . . . . . . . . . . . . . . . . . . . . . 110
3.3 Cellular Aspects of Endoreduplication . . . . . . . . . . . . . . . . . . . . . . . . . . . . . . . . . . . . . . . . . . . . . . 112
4 Proposed Physiological Roles for Endoreduplication . . . . . . . . . . . . . . . . . . . . . . . . . . . . . . . . . . . . . 114
4.1 Endoreduplication and the Determination of Cell- and Organ Size . . . . . . . . . . . . . . . . . 114
4.2 Endoreduplication and Cell Differentiation . . . . . . . . . . . . . . . . . . . . . . . . . . . . . . . . . . . . . . . . . 116
4.3 Endoreduplication and Metabolism . . . . . . . . . . . . . . . . . . . . . . . . . . . . . . . . . . . . . . . . . . . . . . . . . 116
4.4 Endoreduplication in Response to Environmental Factors . . . . . . . . . . . . . . . . . . . . . . . . . . 117
4.5 Endoreduplication and Growth Rate . . . . . . . . . . . . . . . . . . . . . . . . . . . . . . . . . . . . . . . . . . . . . . . . 117
5 Molecular Control of Endoreduplication . . . . . . . . . . . . . . . . . . . . . . . . . . . . . . . . . . . . . . . . . . . . . . . . . . 118
5.1 The Canonical Cell Cycle . . . . . . . . . . . . . . . . . . . . . . . . . . . . . . . . . . . . . . . . . . . . . . . . . . . . . . . . . . . 118
5.2 The Endocycle . . . . . . . . . . . . . . . . . . . . . . . . . . . . . . . . . . . . . . . . . . . . . . . . . . . . . . . . . . . . . . . . . . . . . . 119
6 Concluding Remarks . . . . . . . . . . . . . . . . . . . . . . . . . . . . . . . . . . . . . . . . . . . . . . . . . . . . . . . . . . . . . . . . . . . . . . 125
References . . . . . . . . . . . . . . . . . . . . . . . . . . . . . . . . . . . . . . . . . . . . . . . . . . . . . . . . . . . . . . . . . . . . . . . . . . . . . . . . . . . . 126
Abstract The fruit is a specialized organ, which results from the development of
the ovary after successful flower pollination and fertilization, and provides a
suitable environment for seed maturation and seed dispersal mechanisms. Due to
M. Bourdon, E. Mathieu-Rivet, M. Nafati, C. Cheniclet and C. Chevalier ð*ÞINRA (Institut National de la Recherche Agronomique), UMR619 Biologie du Fruit, F-33883,
Villenave d’Ornon, France
e-maill: [email protected]
M. Bourdon, N. Frangne, E. Mathieu-Rivet, M. Nafati and J.-P. Renaudin
Universite de Bordeaux, UMR619 Biologie du Fruit, F-33883, Villenave d’Ornon, France
U. L€uttge et al. (eds.), Progress in Botany 71,DOI 10.1007/978-3-642-02167-1_4, # Springer‐Verlag Berlin Heidelberg 2010
101
their importance in human nutrition and their economic inference, fleshy fruit
species have been the subject of developmental studies, mostly devoted to ovary
formation, fruit set, and fruit maturation. The growth phase of the fruit has been
much less addressed, although the complex interplay between cell division and cell
expansion during this period is a crucial determinant of the final size, weight and
shape of fruits. This chapter aims at reviewing our current knowledge on fleshy fruit
development and addresses the cellular and molecular mechanisms involved in
their growth, with a special emphasis on the cell expansion associated process of
endoreduplication, with tomato fruit as the model species for fleshy fruits.
1 Introduction
The fruit is a plant organ specific to Angiosperms, which typically contains the
seeds. At the botanical level, most fruits develop from mature ovaries and, there-
fore, include carpel tissues in part or whole. Additionally, many species develop
mature fruit tissues from extracarpellary floral components, e.g., strawberry, pine-
apple, mulberry, and pome fruits (apple, pear), in which the receptacle, bracts,
calyx, and floral tube (the fused base of floral organs), respectively constitute the
majority of mature fruit tissue (Coombe 1976; Gillaspy et al. 1993; Nitsch 1953).
The fruit has evolved in Angiosperms to fulfill ovule and seed protection during
embryo development, and seed dispersal after maturation. This important physio-
logical function accounts for a significant part of the adaptive success of Angios-
perms. As such, the fruit has been under strong selective pressure, which accounts
for the very wide diversity of fruit size, form and composition, and of seed and fruit
dispersion mechanisms. These mechanisms range from the small, nondehiscent
akene dry fruit, dispersed by wind, to the large, fleshy, and juicy berry and drupe
fruits, which have to be eaten by animals, such as mammals or birds for seed
dispersion and germination. As an example, the Solanaceae family, which encom-
passes nearly 10,000 species, has very diverse types of fruits, with capsules, drupes,
pyrenes, berries, and several sorts of dehiscent noncapsular fruits occurring in more
than 90 genera (Knapp 2002).
According to common use, fruit refers to the fleshy, edible fruits, such as grape,
banana, tomato, citrus, cucurbits, pomes, stone fruit, and mango. These species are
subjected to major agricultural production, which rely on permanent selection and
improvement in yield and quality. Their common feature is tissues that accumulate
water and many organic compounds, such as sugars, organic acids, pigments, flavor
and aromas, and vitamins, which bestow their juiciness and attractiveness. Most
fundamental knowledge exists about the control of maturation of fleshy fruit
(Giovannoni 2001, 2004), and their postharvest handling (Brecht et al. 2003;
Soliva-Fortuny and Martin-Belloso 2003), and more recently, about the processes
involved in carpel morphogenesis and fruit set by using the model dry fruit of
102 M. Bourdon et al.
Arabidopsis thaliana (Ferrandiz 2002; Ferrandiz et al. 1999; Roeder and Yanofsky
2006). Surprisingly, in the past 50 years, only a few reviews have addressed the
molecular, cellular, and physiological events that control growth and differentiation
in fleshy fruits (Bollard 1970; Coombe 1976; Gillaspy et al. 1993; Nitsch 1953,
1965, 1970; Varga and Bruinsma 1986). However, this developmental phase
represents by far most of the total duration of fruit development, and is obviously
associated with many parameters determining fruit quality, such as fruit size, shape,
and composition.
Most recent studies on fleshy fruit growth have focused on tomato, Solanum
lycopersicum (Gillaspy et al. 1993; Giovannoni 2004; Srivastava and Handa 2005;
Tanksley 2004), a crop of the Solanaceae, which produces a multicarpellar
berry. This crop is of strong economical importance, and for which numerous
genetic (http://tgrc.ucdavis.edu/) and molecular (http://compbio.dfci.harvard.edu/
tgi/) resources have been developed. In tomato, high levels of endopolyploidy occur
in the course of fruit growth (Bergervoet et al. 1996; Bertin et al. 2007; Cheniclet
et al. 2005; Joubes et al. 1999). This review deals with the cellular and molecular
mechanisms involved in the growth of fleshy fruit, with a special emphasis on
endopolyploidy and tomato fruit development.
2 Fruit Development and Growth
2.1 Carpel Morphogenesis and Fruit Set
Fruits typically develop from pre-existing organs, such as carpels inside flowers.
The first phase of fruit development represents the morphogenesis and growth of
carpels and ovules, from flower initiation to the double fecundation occurring in
ovules (Gillaspy et al. 1993; Tanksley 2004). The ontogenic relationship between
carpel and leaf has been emphasized (Gillaspy et al. 1993) and the genetic network
responsible for carpel and ovule development has been thoroughly analyzed in
A. thaliana (Ferrandiz et al. 1999). In grape, tomato, and apple, carpels are formed
by ca. 17–20 rounds of cell divisions during this prebloom period, with virtually no
cell expansion (Coombe 1976; Ho 1992). These divisions occur in the L3 layer of
the floral meristem in a coordinated developmental pattern.
The number of cells formed in the ovary before anthesis is an important
determinant of the potential final size in many fruits. This explains why fruits
from early opening flowers are larger at maturity than those from later blooms
(Coombe 1976). In addition, in many species including tomato (Bohner and
Bangerth 1988a, 1988b; Frary et al. 2000; Tanksley 2004) and kiwi fruit
(Cruz-Castillo et al. 2002), ovary size at anthesis and mature fruit size are frequently
correlated positively. More work is needed to unravel the effect of internal cues,
Endoreduplication and Growth of Fleshy Fruits 103
e.g., sink effects (Ho 1992), and external ones, e.g., temperature (Bertin 2005;
Higashi et al. 1999) on this phenomenon.
2.2 Fruit Growth
Shortly before anthesis, growth usually stops in the ovary. The second phase of fruit
development, i.e., fruit growth, resumes only after pollination by compatible pollen
and then fertilization (i.e., at fruit set). A major issue for understanding fruit growth
is to decipher the signals and their mode of action, which simultaneously induce
corolla and stamen senescence and fruit set after pollination and fertilization.
Recent results in tomato suggest a function of abscisic acid (ABA) and ethylene
before fruit set, to keep the ovary in a temporally protected and dormant state
(Balbi and Lomax 2003; Vriezen et al. 2008).
The involvement of plant hormones in fruit set has long been postulated from the
efficiency of externally applied auxins or gibberellins to replace pollination and
fertilization in inducing fruit set and growth (Crane 1964; Nitsch 1965; Nitsch
1970; Vivian-Smith and Koltunow 1999). When the auxin signaling pathway is
altered, fruit set and development can occur without fertilization, i.e., parthenocarpy
(Carmi et al. 2003; Goetz et al. 2006; Goetz et al. 2007; Pandolfini et al. 2007; Wang
et al. 2005). Auxin action on fruit set may also be through gibberellic acid (GA)
synthesis (Serrani et al. 2008) and GA action (Martı et al. 2007). Fruit set has also
been related to the strong increase of sucrose import capacity in young tomato fruit
(Ho 1996; D’Aoust et al. 1999).
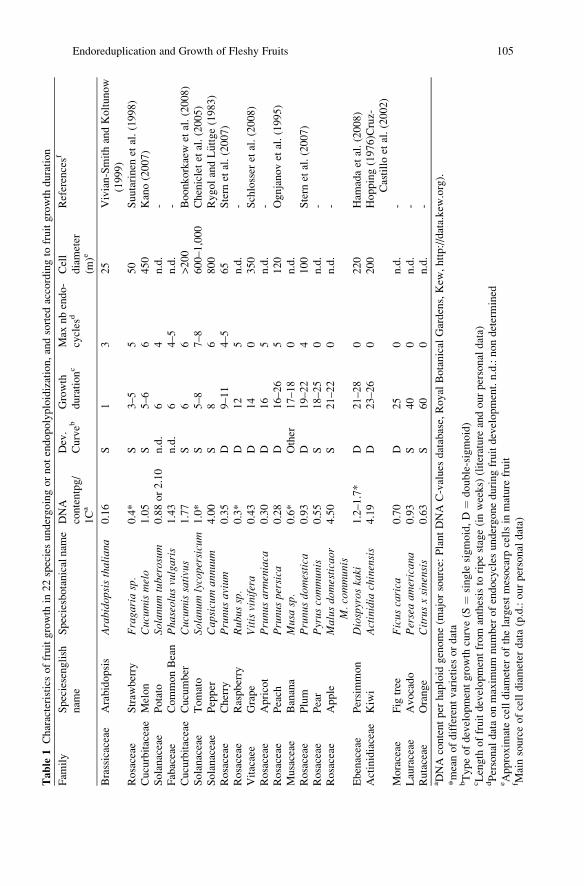
Fruit growth is by far the longest phase of fruit development. It ranges from 1week
forA. thaliana, 3–5weeks for strawberry, 5–8weeks for tomato, to 60weeks formany
citrus fruits with an average of 15 weeks for most fleshy fruits (Coombe 1976)
(Table 1). Two distinctive types of fruit growth curves have been reported on cumula-
tive and/or rate bases according to fruit species (Coombe 1976). Single S-shaped
(sigmoidal) growth curves occur in most species including tomato. In few-seeded-
fruit, such as stone fruit (drupes) and some berries, such as grape, growth curves fit a
double-sigmoid pattern, which involves two successive phases of growthwith physio-
logically distinct sink activity and a transition in between (DeJong and Goudriaan
1989). The type of growth curve for several fruit species is indicated in Table 1.
In general, fruit growth starts by a period of intense cell divisions. Then, before
the frequency of cell division declines, cells begin to enlarge rapidly; the final
period of fruit growth relies uniquely on cell expansion. As already pointed out
more than 50 years ago, “fruit growth curves do not indicate when the transition of
cell multiplication to cell enlargement occurs, so that, from the point of view of the
growth process, distinction between both is not considered to be important. The
important entity seems to be the organ rather than its constituents” (Nitsch 1953).
Thus, although they offer convenient data for phenological studies, most growth
curves are inadequate for the analysis of the components of growth (Coombe 1976).
104 M. Bourdon et al.
Table
1Characteristicsoffruitgrowth
in22speciesundergoingornotendopolyploidization,andsorted
accordingto
fruitgrowth
duration
Fam
ily
Speciesenglish
nam
e
Speciesbotanicalnam
eDNA
contentpg/
1Ca
Dev.
Curveb
Growth
durationc
Max
nbendo-
cycles
dCell
diameter
(m)e
Referencesf
Brassicaceae
Arabidopsis
Arabido
psisthaliana
0.16
S1
325
Vivian-SmithandKoltunow
(1999)
Rosaceae
Straw
berry
Fraga
riasp.
0.4*
S3–5
550
Suutarinen
etal.(1998)
Cucurbitaceae
Melon
Cucum
ismelo
1.05
S5–6
6450
Kano(2007)
Solanaceae
Potato
Solanu
mtuberosum
0.88or2.10
n.d.
64
n.d.
-
Fabaceae
CommonBean
Pha
seolus
vulgaris
1.43
n.d.
64–5
n.d.
-
Cucurbitaceae
Cucumber
Cucum
issativus
1.77
S6
6>200
Boonkorkaew
etal.(2008)
Solanaceae
Tomato
Solanu
mlycopersicum
1.0*
S5–8
7–8
600–1,000
Chenicletet
al.(2005)
Solanaceae
Pepper
Cap
sicum
annu
um4.00
S8
6800
RygolandL€ uttge(1983)
Rosaceae
Cherry
Prunu
savium
0.35
D9–11
4–5
65
Stern
etal.(2007)
Rosaceae
Raspberry
Rub
ussp.
0.3*
D12
5n.d.
-
Vitacaee
Grape
Vitisvinifera
0.43
D14
0350
Schlosser
etal.(2008)
Rosaceae
Apricot
Prunu
sarmeniaca
0.30
D16
5n.d.
-
Rosaceae
Peach
Prunu
spersica
0.28
D16–26
5120
Ognjanovet
al.(1995)
Musaceae
Banana
Musasp.
0.6*
Other
17–18
0n.d.
Rosaceae
Plum
Prunu
sdo
mestica
0.93
D19–22
4100
Stern
etal.(2007)
Rosaceae
Pear
Pyrus
commun
is0.55
S18–25
0n.d.
-
Rosaceae
Apple
Malus
domesticaor
M.commun
is4.50
S21–22
0n.d.
-
Ebenaceae
Persimmon
Diospyros
kaki
1.2–1.7*
D21–28
0220
Ham
adaet
al.(2008)
Actinidiaceae
Kiwi
Actinidia
chinensis
4.19
D23–26
0200
Hopping(1976)Cruz-
Castilloet
al.(2002)
Moraceae
Fig
tree
Ficus
carica
0.70
D25
0n.d.
-
Lauraceae
Avocado
Perseaam
erican
a0.93
S40
0n.d.
-
Rutaceae
Orange
Citrusxsinensis
0.63
S60
0n.d.
-aDNA
contentper
haploid
genome(m
ajorsource:
PlantDNA
C-values
database,Royal
Botanical
Gardens,Kew
,http://data.kew
.org).
*meanofdifferentvarieties
ordata
bTypeofdevelopmentgrowth
curve(S
¼single
sigmoid,D¼
double-sigmoid)
cLength
offruitdevelopmentfrom
anthesisto
ripestage(inweeks)
(literature
andourpersonal
data)
dPersonal
dataonmaxim
um
number
ofendocycles
undergoneduringfruitdevelopment.n.d.:nondetermined
eApproxim
atecelldiameter
ofthelargestmesocarp
cellsin
mature
fruit
f Mainsourceofcelldiameter
data(p.d.:ourpersonal
data)
Endoreduplication and Growth of Fleshy Fruits 105
Fruit growth relies on a spatially and temporally organized pattern of cell
division and of cell expansion. Remarkably, fleshy fruit tissues may have very
various ontogenic origins (Coombe 1976), although they all share similar charac-
teristics, with large, highly vacuolated cells with thin walls. In tomato, the ovary
wall has seemingly a simple organization at anthesis, with ca. 11 layers of small
isodiametric cells including two epidermal cell layers, and vascular bundles in the
central pericarp (Cheniclet et al. 2005). During fruit organogenesis and growth, the
fertilized ovary acquires a complex pattern of cells with various sizes and shapes,
and various metabolic differentiations (Cheniclet et al. 2005; Gillaspy et al. 1993;
Mohr and Stein 1969; Smith 1935) (Fig. 1a). How this spatio-temporal pattern of
development is related to gene expression, metabolic profiles and cellular charac-
teristics, such as endopolyploidy has only just started to be described (Lemaire-
Chamley et al. 2005). This apparent slow progress has been due to the difficulty in
correlating various cellular and molecular data at the level of given cell types in
three-dimensionally complex organs, such as fruits. How this complexity relates to
hormonal and nutritional regulation during fruit growth also remains largely ig-
nored. Many data have been reported on the kinetics of hormone content in various
fruit materials (reviewed in Gillaspy et al. 1993; Srivastava and Handa 2005), but
their use for a proper understanding of their action in relation to growth mechan-
isms remains rather elusive. Fruit growth requires the combined presence of several
growth-promoting plant hormones, such as auxin, gibberellins, cytokinins and
brassinosteroids (Cowan et al. 2005; Ozga et al. 2002; Srivastava and Handa
2005). Many of these hormones appear to originate from the developing seeds,
with a particular role for the endosperm in the secretion of these compounds.
2.3 Cell Division During Fruit Growth
Active cell division within the flesh is usually restricted to an initial period of
1–2 weeks after pollination and fertilization (e.g., cucurbits, tomato), 3 weeks in
apple, 4–7 weeks in Japanese pear, peach, and plum. Cell divisions do not occur in
the pericarp of Corynth grape, Rubus, or some Ribes species. However, divisions
continue in avocado and in strawberry throughout the life of the fruit (Coombe
1976; Crane 1964; Nitsch 1965). In tomato and as in many fleshy fruits, cell
divisions occur in various cells and with various division planes to allow fruit
growth, but they also occur in discrete cell layers with definite division planes for
specific purposes. This is the case for tomato, where the two epidermal cell layers of
the pericarp undergo anticlinal divisions, whereas the two subepidermal layers
undergo several rounds of periclinal divisions leading to an increase in the number
of pericarp cell layers to a varying extent according to the tomato line. These
various types of cell divisions are differently regulated because cell-layer
forming cell divisions occur only within 5–8 days post-anthesis in various tomato
lines (Cheniclet et al. 2005; Cong et al. 2002; Mazzucato et al. 1998), whereas
106 M. Bourdon et al.
a
4 8 16 32 64 128 256
DNA content (C-value)
Num
bero
f nuc
leib
c
d
10 µm
vb
ie
512
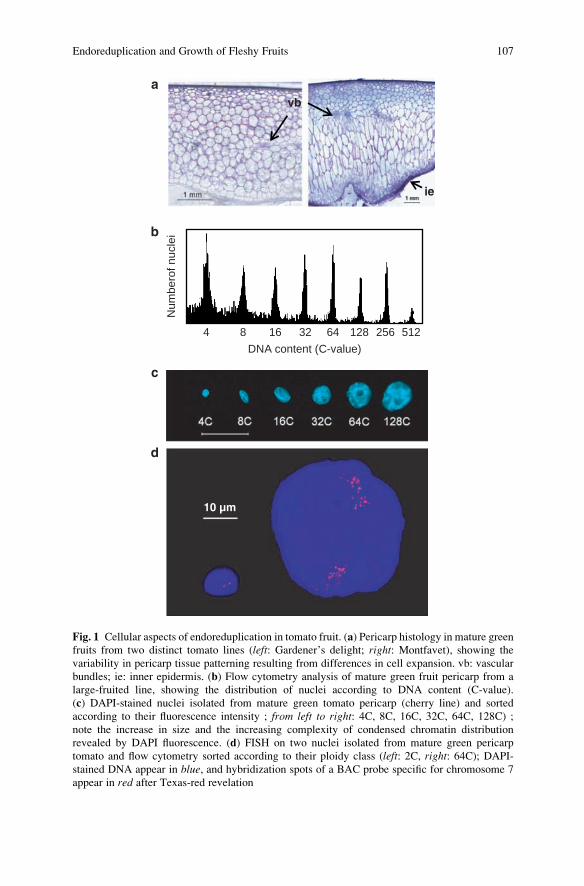
Fig. 1 Cellular aspects of endoreduplication in tomato fruit. (a) Pericarp histology in mature green
fruits from two distinct tomato lines (left: Gardener’s delight; right: Montfavet), showing the
variability in pericarp tissue patterning resulting from differences in cell expansion. vb: vascular
bundles; ie: inner epidermis. (b) Flow cytometry analysis of mature green fruit pericarp from a
large-fruited line, showing the distribution of nuclei according to DNA content (C-value).
(c) DAPI-stained nuclei isolated from mature green tomato pericarp (cherry line) and sorted
according to their fluorescence intensity ; from left to right: 4C, 8C, 16C, 32C, 64C, 128C) ;note the increase in size and the increasing complexity of condensed chromatin distribution
revealed by DAPI fluorescence. (d) FISH on two nuclei isolated from mature green pericarp
tomato and flow cytometry sorted according to their ploidy class (left: 2C, right: 64C); DAPI-stained DNA appear in blue, and hybridization spots of a BAC probe specific for chromosome 7
appear in red after Texas-red revelation
Endoreduplication and Growth of Fleshy Fruits 107
randomly-oriented cell divisions occur for longer periods up to 10–18 days post-
anthesis (Gillaspy et al. 1993; Tanksley 2004). Moreover, two different modified
genetic backgrounds affect cell divisions in tomato pericarp, excluding cell-layer
forming divisions (Cong et al. 2002; Jones et al. 2002). Commonly, tissues closest
to the ovules (e.g., placenta in tomato or fruit surface in strawberry) cease division
earlier than other tissues (Coombe 1976). All these data indicate spatially and
temporally complex regulation of cell divisions in growing fruit.
After anthesis, the locular cavities in fruit are usually filled as a result of intense
cell division activity from one or more of the locule surface areas (e.g., placenta in
tomato, septum in banana and grape, endodermis in banana and orange, and seed
aril in lychee). Cell expansion then contributes to the filling of the locule, which
behaves in concert with the neighboring flesh to form fruit pulp or, as in tomato, to
form a jelly-like tissue with distinct properties from the pericarp (Coombe 1976).
In conclusion, the fruit as a whole is composed of cells, which were present at
anthesis and of newly formed cells during fruit growth. The ratio between both kinds
of cells is a function of the number of doublings at these two phases. After anthesis,
80–97% of fruit cells in apple, strawberry, peach, apricot and tomato are produced,
whereas ca. 70% of fruit cells are formed before anthesis in cucumber and blueberry
(Cano-Medrano and Darnell 1997). Themodulation of cell division in fruit either pre-
or post-anthesis has repeatedly been associated with strong variations in fruit size.
As an illustration, strong differences in overall anticlinal, but not periclinal, cell
division in the pericarp are associated with varying levels of fw2.2 transcripts
corresponding to the major quantitative trait locus (QTL) for tomato fruit size,
which accounts for as much as a 30% difference in fruit fresh weight between
small-fruited and large-fruited tomatoes (Cong et al. 2002; Liu et al. 2003).
2.4 Cell Expansion During Fruit Growth
In eukaryotic cells, cell enlargement results from two processes: cell growth by
increase in cytoplasmic volume and cell expansion through vacuolation. Cell
growth by cytoplasmic volume increase may occur in all types of cells and
is responsible for moderate increases in cell volume, by less than tenfold
(Sugimoto-Shirasu and Roberts 2003). Cell expansion through vacuolation is a
specific property of plant cells because of their large vacuolar compartment, and
it leads to an increase in cell volume by more than one hundredfold (Sugimoto-
Shirasu and Roberts 2003). Cell expansion through vacuolation typically starts in
young organs, once cells have stop dividing, exit the cell cycle, and differentiate.
Some of the largest cells found in plants occur in the flesh of ripe fruit, with cell
length between 150 and 700 mm, and in some cases more than 1 mm. The volume of
cells in ovary wall is only ca. 10�3–10�2 nL at anthesis whereas it is in the range of
1–10 nL, up to 100 nL in mature fruit (Coombe 1976). Because cell volume may be
increased by 102–104 times during the growth of fleshy fruit, this phenomenon
108 M. Bourdon et al.
makes by far the greatest contribution to the total expansion of the fruit. Cell size
has been recognized as a critical component of fruit size in cucumber, blueberry,
and grape (Cano-Medrano and Darnell 1997).
When expressed on an arithmetic scale, cell expansion, by several orders of
magnitude, has often been considered to occur after the cell division phase in fleshy
fruit (Gillaspy et al. 1993). In fact, cell expansion starts in the very few days after fruit
set, concomitantly with cell division (Boonkorkaew et al. 2008; Cheniclet et al. 2005),
and it lasts for the entire period of fruit growth. However, whether initial cell growth
occurs through cytoplasmic growth while the cells are actively cycling in the mitotic
cycle remains poorly understood. The most intense cell growth phase then occurs
through dramatic increases in the vacuolar volume and vacuolation index of fruit cells.
Cell size is typically described by linear cell dimensions, e.g., diameter or perimeter
in fruit sections, which gives only an approximation of cell volume, and thus, requires
deeper sectional analyses to take cell shape into account. The absolutemeasurement of
cell size and shape in the growing grape fruit revealed that cell shape was irregular and
cell volumes in the innermesocarp of a grape berry exhibited a 14-fold range variation,
with polysigmoidal distribution and clusterings around specific cell size classes
(Gray et al. 1999). Obviously, more measurements of this type are required to fully
understand the patterning of fleshy parenchymatous fruit tissues.
In the course of fleshy fruit development, the extent of cell expansion is
influenced by cell wall behavior, turgor, and constraints imposed upon the flesh
by the extensibility of the skin. Auxin is generally considered responsible for cell
expansion during fruit growth, although this effect may not be direct but mediated
through ill-defined compounds mediating sink activity.
3 Endopolyploidization
3.1 Definitions
Polyploidy can be defined as the addition of a complete set of chromosomes to
one genome, which results from either sexual reproduction via 2n gametes or
somatic chromosome doubling. According to the mode of polyploidy formation,
allopolyploidy and autopolyploidy can be distinguished as originating respectively
from interspecific hybridization between divergent progenitor species, thus giving
rise to the presence of distinct subgenomes, and from intraspecific hybridization
(or self-fertilization) or somatic chromosome doubling, thus resulting in identical
subgenomes (Otto 2007). Related to autopolyploidy, endopolyploidy corresponds
to the occurrence of different ploidy levels within an organism.
Endopolyploidy can result from the generation of multinucleate cells originating
from acytokinetic mitosis, from nuclear fusion, from endomitosis, or from endor-
eduplication. Multinucleate cells in plants are found during the formation of the
Endoreduplication and Growth of Fleshy Fruits 109
syncitial female gametophyte (Yadegari and Drews 2004), in anther tapetum
(D’Amato 1984) and seed endosperm (Berger 2003), while nuclear fusion may
also contribute to polyploidization of the chalazal domain of the endosperm in
Arabidopsis (Baroux et al. 2004). Endomitosis corresponds to a doubling of the
chromosome number in nucleus. Chromosomes double and condense, sister chro-
matids separate normally, but return to the interphase state within an intact nuclear
envelope, thus generating nuclear endopolyploidy. Although endomitosis mainly
occurrs in animals, it is only rarely encountered in plants (D’Amato 1984).
Endoreduplication represents themost commonmode of cell endopolyploidization
in plants and is estimated to occur in over 90% of Angiosperms (Nagl 1976; D’Amato
1984). This process is an endonuclear chromosome duplication, which occurs in the
absence of any obvious condensation and decondensation steps leading to the produc-
tion of chromosomes with 2n chromatids without any change in chromosome number
(Joubes and Chevalier 2000; Edgar and Orr-Weaver 2001). As a consequence,
hypertrophying nuclei arise from successive cycles of DNA replication without
segregation of sister chromatids, and in extreme cases “giant” polytene chromosomes
are generated as observed for embryo suspensor cells of Phaseolus species (D’Amato
1984) or giant hair cells of Bryonia anthers (Barlow 1975).
3.2 Occurrence of Endopolyploidization in Fruit Species
As stated by D’Amato (1984), endopolyploidy is “of such a widespread occurrence
in plants, that it can be regarded as the rule rather than the exception.” A recent
survey performed on several vegetative organs of 54 seed plant species different in
term of genome size and belonging to two Gymnosperm and 14 Angiosperm
families by Barow and Meister (2003) indicated that endopolyploidy occurred in
33 species taken from ten different families. Though absent in Gymnosperms,
the frequent occurrence of endopolyploidy within Angiosperms seems restricted,
however, to certain phylogenetic groups (Barow 2006).
Though largely documented in vegetative organs (Barow and Meister 2003), the
occurrence of endopolyploidy in reproductive organs, especially in fruit tissues, and
its extent in different species has gained little attention so far. Endopolyploidization
was found in ovular tissues (antipodal cells, synergids, endosperm and embryo
suspensor cells) and in anther cells (anther hair, glandular hair and anther tapetal
cells), where endoreduplication seems to be the preferential way of polyploidiza-
tion (D’Amato 1984; Carvalheira 2000; Bauer and Birchler 2006).
More than 60 years ago, endopolyploidization was reported initially in cucumber
and other fruit materials (cited in Coombe 1976 and Barow 2006) and then in the
mesocarp parenchyma cells in apricot (Bradley and Crane 1955). However, in this
latter report the natural and/or physiological occurrence of the phenomenon in this
fruit could be questioned as these authors observed polysomaty (increase in chro-
mosome number according to endomitosis), after an auxin treatment and subsequent
110 M. Bourdon et al.
needle wounding of the fruit mesocarp. More recently, some reports described the
occurrence of endopolyploidization in the pericarp of Sorghum bicolor (Kladniket al. 2006), Ornithogalum umbellatum ovary epidermal cells (Kwiatkowska et al.
2007), and sugar-beet pericarp (up to 32C in diploid and to 16C in triploid and
tetraploid plants) (Lukaszewska and Sliwinska 2007). Most of the reports dealing
with endopolyploidy in fruit so far concerned tomato (Bergervoet et al. 1996; Bertin
et al. 2007; Cheniclet et al. 2005; Joubes et al. 1999) (Fig. 1b). On the contrary,
endopolyploidy has been reported neither for grape (Ojeda et al. 1999) nor for apple
(Harada et al. 2005).
To provide more data about the occurrence of endopolyploidization in fruits, we
initiated a large scale analysis of ploidy levels in fruit of different species, focusing
mainly on fleshy fruits. DNA content of nuclei isolated from whole ovaries at
anthesis and from pericarp of fully developed fruits were analyzed by flow cytometry,
and the maximum number of endocycles (corresponding to the number of DNA
duplications, cf. Sect. 5.2) made during fruit development was determined. These
data are presented in Table 1, together with additional parameters, such as the DNA
content per haploid genome, the average cell diameter in fruit flesh (available
data from the literature), and the type and duration of growth. The ordering of
phylogenetic families and species within the table is based on the duration of growth
accordingly.
From this table and additional data not shown, endopolyploidization in fruit
appears to be dependent in part from the phylogenetic position of species, as
observed for vegetative organs by Barow and Meister (2003). In some families
(e.g., Rutaceae), no endopolyploidization was observed, while in others, such as in
Brassicaceae, Cucurbitaceae, Fabaceae, and Solanaceae, most of the fruit species
displayed a high degree of endopolyploidization. According to Barow and Meister
(2003), a high frequency of endopolyploidization was also reported in vegetative
organs of these families. Amongst Rosaceae, pome fruits (apple, pear) do not
exhibit endopolyploidization, while stone fruits (Prunus sp.) as well as strawberryand raspberry undergo several rounds of DNA duplication.
Of the vegetative organs reported to display endopolyploidization, the number of
endocycles that cells undergo is predominantly, 2–3, less frequently 4 and rarely 5
(corresponding respectively to ploidy levels of 8C, 16C, 32C and 64C for diploid
species, where C is the DNA content of the unreplicated haploid genome of a
gamete). Higher ploidy levels appear to occur more frequently in fleshy fruits for
which 4–5 endocycles can often be observed (Table 1). In maize endosperm,
fertilization gives rise to 3C cells, which undergo up to 5 endocycles in the course
of development, resulting in a maximum ploidy level of 96C (Leiva-Neto et al.
2004). In fruits of Cucurbitaceae and Solanaceae, mesocarp cells commonly under-
go 6 endocycles, the highest ploidy levels for these cells being reached in tomato
where 8 endocycles (up to 512C) can be observed. This high level of endopoly-
ploidy in tomato and the numerous data reported on this process in this species
(Bergervoet et al. 1996; Joubes et al. 1999; Cheniclet et al. 2005) makes it an
outstanding model for studying endopolyploidization and its physiological role
during fruit development.
Endoreduplication and Growth of Fleshy Fruits 111
3.3 Cellular Aspects of Endoreduplication
3.3.1 Cell Size
Endopolyploidization and cell expansion often occur simultaneously in developing
organs, and high ploidy level have long been reported as associated with large cell
size (Joubes and Chevalier 2000; Sugimoto-Shirasu and Roberts 2003). An ultimate
demonstration of a direct correlation between ploidy level and size in single cells
requires simultaneous in situ determination of DNA ploidy level and size in
individual cells. This has been achieved only in a limited number of vegetative
tissues, such as leaf epidermis (Melaragno et al. 1993), hypocotyl (Gendreau et al.
1997), and symbiotic root nodules (Cebolla et al. 1999), and of floral tissues (Kudo
and Kimura 2002; Lee et al. 2004). In tomato, B€unger-Kibler and Bangerth (1982)
showed that the ploidy level in fruit pericarp cells increases from 4 to 10 days after
anthesis. At this stage, small cells localized around vascular bundles and hypoder-
mis display nuclei with a 4C level, while in the large parenchyma cells, the ploidy
level was between 16 and 32C, thus arguing for cell enlargement that is correlated
with DNA content. Subsequently, such an observation was also reported by
Bergervoet et al. (1996) and Joubes et al. (1999), while Cheniclet et al. (2005)
established clearly a direct correlation between mean cell size and mean C-level
during the development of tomato fruit pericarp.
3.3.2 Nuclear Size
Obviously as the nuclear DNA content undergoes exponential amplificationthrough endoreduplication, the nuclear volume is expected to increase accordingly.
In tomato fruit, an increase in nuclear size was observed in most pericarp cell-layers
in the course of development (up to 6-fold in diameter) (Bergervoet et al. 1996;
Joubes et al. 1999). Nuclei sorted by flow cytometry according to their DNA
content show a strong positive correlation between nuclear size and ploidy level
as far as the lower ploidy levels are concerned, but this correlation becomes weaker
for higher ploidy levels, due to a larger variation of nuclear sizes (Bourdon et al.
personal communication) (Fig. 1c). The heterogeneity in nuclear size of highly
polyploid nuclei suggests that the nuclear volume depends not only on its DNA
content, but also on other parameters, such as the amount and conformation of
nuclear proteins, RNA molecules, and the degree of chromatin condensation.
Therefore, one cannot deduce the precise ploidy level of a nucleus merely from
its relative volume in a given tissue. It is noteworthy that a positive relationship
between nuclear size and ploidy level has also been demonstrated in various
endoreduplicating plant tissues, such as metaxylem in maize roots, Aloe arborea(Agavaceae) and Zebrina pendula (Commelinaceae) (List 1963), endosperm in
S. bicolor (Kladnik et al. 2006), and in species encompassing a wide variation in
endopolyploidy (Barow 2006).
112 M. Bourdon et al.
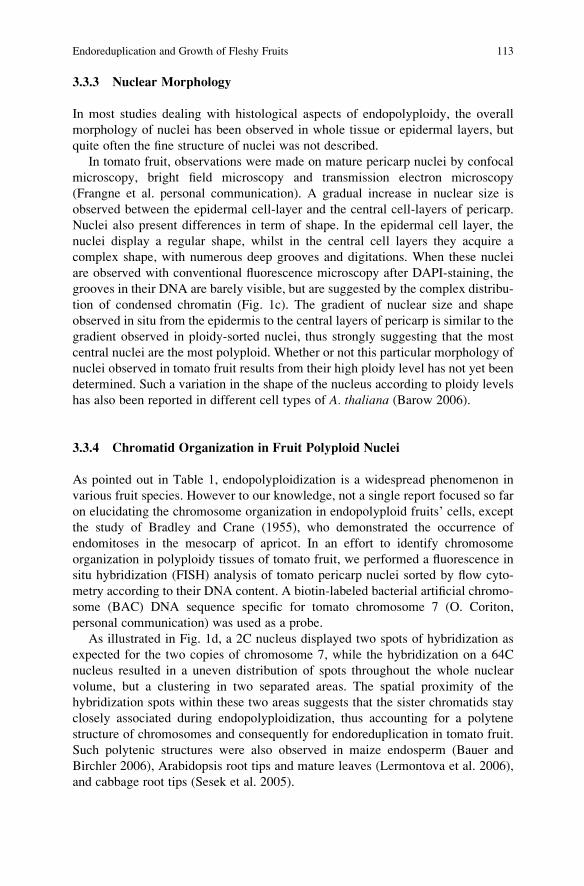
3.3.3 Nuclear Morphology
In most studies dealing with histological aspects of endopolyploidy, the overall
morphology of nuclei has been observed in whole tissue or epidermal layers, but
quite often the fine structure of nuclei was not described.
In tomato fruit, observations were made on mature pericarp nuclei by confocal
microscopy, bright field microscopy and transmission electron microscopy
(Frangne et al. personal communication). A gradual increase in nuclear size is
observed between the epidermal cell-layer and the central cell-layers of pericarp.
Nuclei also present differences in term of shape. In the epidermal cell layer, the
nuclei display a regular shape, whilst in the central cell layers they acquire a
complex shape, with numerous deep grooves and digitations. When these nuclei
are observed with conventional fluorescence microscopy after DAPI-staining, the
grooves in their DNA are barely visible, but are suggested by the complex distribu-
tion of condensed chromatin (Fig. 1c). The gradient of nuclear size and shape
observed in situ from the epidermis to the central layers of pericarp is similar to the
gradient observed in ploidy-sorted nuclei, thus strongly suggesting that the most
central nuclei are the most polyploid. Whether or not this particular morphology of
nuclei observed in tomato fruit results from their high ploidy level has not yet been
determined. Such a variation in the shape of the nucleus according to ploidy levels
has also been reported in different cell types of A. thaliana (Barow 2006).
3.3.4 Chromatid Organization in Fruit Polyploid Nuclei
As pointed out in Table 1, endopolyploidization is a widespread phenomenon in
various fruit species. However to our knowledge, not a single report focused so far
on elucidating the chromosome organization in endopolyploid fruits’ cells, except
the study of Bradley and Crane (1955), who demonstrated the occurrence of
endomitoses in the mesocarp of apricot. In an effort to identify chromosome
organization in polyploidy tissues of tomato fruit, we performed a fluorescence in
situ hybridization (FISH) analysis of tomato pericarp nuclei sorted by flow cyto-
metry according to their DNA content. A biotin-labeled bacterial artificial chromo-
some (BAC) DNA sequence specific for tomato chromosome 7 (O. Coriton,
personal communication) was used as a probe.
As illustrated in Fig. 1d, a 2C nucleus displayed two spots of hybridization as
expected for the two copies of chromosome 7, while the hybridization on a 64C
nucleus resulted in a uneven distribution of spots throughout the whole nuclear
volume, but a clustering in two separated areas. The spatial proximity of the
hybridization spots within these two areas suggests that the sister chromatids stay
closely associated during endopolyploidization, thus accounting for a polytene
structure of chromosomes and consequently for endoreduplication in tomato fruit.
Such polytenic structures were also observed in maize endosperm (Bauer and
Birchler 2006), Arabidopsis root tips and mature leaves (Lermontova et al. 2006),
and cabbage root tips (Sesek et al. 2005).
Endoreduplication and Growth of Fleshy Fruits 113
Even if polyteny seems to be widespread in various plant organs, differences in
chromatin organization can be observed between cell types during endoreduplica-
tion. These differences lie mainly in a more or less complete pairing of sister
chromatids and in the state of chromatin condensation. Sister chromatid pairing
can be observed along the entire length of chromosomes, such as for giant hair cells
in Bryona anthers (Barlow 1975) or just in part of them, such as the embryo
suspensor cells in Phaseolus coccineus (Nenno et al. 1994). Recently, Schubert
et al. (2006) provided evidence for a differential alignment of sister chromatids
pairing along Arabidopsis chromosome 1, and thus, for polyteny in Arabidopsis
vegetative tissues. In addition, the condensation state of centromeres in Arabidopsis
endoreduplicated cells was shown to be variable and cell type-dependent (Fang and
Spector 2005). Decondensation could also account for a greater range of chromatin
movement in endoreduplicated cells (Kato and Lam 2003). Hence, further investi-
gations are needed to determine the biological significance of chromosome and
chromatin organization in endoreduplicated cells.
Since endoreduplication appears to be the preferred mode of endopolyploidiza-
tion in most plant organs and notably in tomato fruit, we shall use this term from
here onwards.
4 Proposed Physiological Roles for Endoreduplication
4.1 Endoreduplication and the Determinationof Cell- and Organ Size
The frequent positive correlation between endoreduplication and cell size in
many different plant species, organs, and cell types (Joubes and Chevalier 2000;
Sugimoto-Shirasu and Roberts 2003; Kondorosi and Kondorosi 2004) is commonly
interpreted as endoreduplication as the driver for cell expansion. The successive
rounds of DNA synthesis during endoreduplication induce a consequent hypertro-
phy of the nucleus. This can influence the final size of the cell, which, therefore,
may adjust its cytoplasmic volume with respect to the DNA content of the nucleus
(according to the “karyoplasmic ratio” theory; Sugimoto-Shirasu and Roberts
2003). Cell expansion proceeds further through vacuolation, to adjust the size of
the vacuolar compartment in accordance with the cytoplasmic volume, and even to
increase the vacuolation index of the plant cell.
Cheniclet et al. (2005) provided evidence for such a positive correlation between
cell size and ploidy level in pericarp tissue during fruit development. However
insufficient comparison has been performed so far in other fruit species, and even in
tomato, opposing results were reported in two tomato isogenic lines differing by
fruit weight and sugar content QTLs (Bertin et al. 2003) and between large fruits of
114 M. Bourdon et al.
lines cultivated at different temperatures (Bertin 2005). To gain further insight
about the possible relationship between endoreduplication and cell size in fruit, we
collected data from the literature and performed additional measurements of cell
size in fully-grown fruit displaying or not displaying endopolyploidization
(Table 1). This analysis indicated no clear-cut relationship between these two
parameters. For example, nonendopolyploidizing fruits like kiwi, persimmon, and
grape display cell diameters of ca. 200 mm, 220 mm, and 350 mm respectively, while
smaller cell diameters are observed in endopolyploidizing fruits, such as the
Arabidopsis silique (25mm), strawberry (50mm), cherry (65mm), and peach
(120mm). Therefore the ability to develop large cells as measured by their
diameters, is not restricted to endopolyploidizing fruits. Nevertheless when endo-
polyploidizing fruits are compared, it also appears that the largest cells are present in
fruits that undergo the highest number of endocycles (diameters of 600–1,000 mm in
tomato, 800 mm in pepper, and 450 mm in melon), which suggests that endopoly-
ploidization might be necessary for plant cells to reach very large sizes.
However, various examples show that endoreduplication can occur in the
absence of dramatic cell expansion. For instance, Gendreau et al. (1998) reported
that a small cell size in some Arabidopsis mutants did not prevent the occurrence of
the same number of endocycles as in larger cells present in wild-type. Endoredu-
plication is, thus, obviously not the only parameter either signifying or favoring
cell expansion.
The mean level of endoreduplication of various plant organs has repeatedly been
found correlated with organ size, as exemplified in Arabidopsis leaves (Cookson
et al. 2006), pea cotyledons (Lemontey et al. 2000) and tomato fruit (Cheniclet et al.
2005). However, the function of endoreduplication in organ growth remains open to
various hypotheses. Organ growth can be considered as the result either of a given
balance of cell-based (autonomous) mechanisms relying on division, expansion,
and endoreduplication or according to the opposite, of organismal level of regula-
tion (Mizukami 2001; John and Qi 2008). In view of the organismal control, the
synthesis of cytoplasm is the primary process and DNA endoreduplication would
come second to maintain the karyoplasmic ratio (Cookson et al. 2006; John and Qi
2008). This latter parameter is difficult to estimate because of technical constraints,
although it is a common observation that fruits with endopolyploidy such as tomato
have larger protein contents linked to a larger cytoplasmic compartment, than fruits
without endopolyploidy, such as apple (Harada et al. 2005).
Although the correlation between cell size and endoreduplication is obvious,
which process triggers the other is still a matter of debate, as a kind of Chicken or
the egg causality dilemma. Since endoreduplication corresponds to successive
rounds of DNA duplication in the absence of mitosis as defined below (cf. Sect. 5),
it is therefore likely that a minimal cell size must be required to commit to the
following round of DNA replication, thus implying cell growth. However, once
DNA synthesis is completed, the doubling of the DNA quantity can in turn promote
cell growth, according to the “karyoplasmic ratio” theory (Sugimoto-Shirasu and
Roberts 2003).
Endoreduplication and Growth of Fleshy Fruits 115
4.2 Endoreduplication and Cell Differentiation
In the model plant Arabidopsis, the influence of endoreduplication in forming
large specialized cells was best characterized in epidermal cells of mature leaves
(Melaragno et al. 1993), during hypocotyl development in which the ploidy levels
vary according to light conditions (Gendreau et al. 1997), and in leaf single-celled
trichomes (Larkin et al. 2007). The growth of trichomes was shown to be dependent
on the succession of endocycles. The formation of a two-branched trichome cell
requires three rounds of endocycle, leading to a 16C DNA ploidy level. A supple-
mentary endocycle may eventually occur to give rise to the formation of a third
branch and 32C DNA content. Moreover, cell growth and differentiation of tri-
chomes is a genetically regulated process, since mutants affecting the nuclear
ploidy level impacts positively or negatively on trichome cell size.
As illustrated for trichomes, endoreduplication often occurs during the differen-
tiation of cells that are highly specialized in their morphology or metabolism. This
is the case for cells from tomato fruit pericarp and jelly-like locular tissues
(Cheniclet et al. 2005; Lemaire-Chamley et al. 2005; Chevalier 2007) as described
above, for symbiotic host cells during the formation of nitrogen-fixing root nodules
in legumes (Cebolla et al. 1999) and/or for the endosperm cells of maize kernels
(Kowles and Phillips 1985; Kowles et al. 1990).
4.3 Endoreduplication and Metabolism
There are instances where endoreduplication is linked to endogenous metabolism.
For example, nodule development on legume roots is initiated in response to interac-
tion with the symbiotic bacterium Sinorhizobium meliloti. During their differentiationprocess, symbiotic nodule cells, programmed to fix nitrogen, develop into very large
and highly endoreduplicated cells (Cebolla et al. 1999; Vinardell et al. 2003) and
display an important transcriptional activity that is remarkably specific to the nodule
(Mergaert et al. 2003). Also, in Zea mays, endosperm cells accumulate large amounts
of starch and storage proteins, concomitantly with multiple and successive endo-
cycles during seed development (Lopes and Larkins 1993).
Since a correlation exists between endoreduplication and cell differentiation-
specific metabolism, it is tempting to speculate that one role of endoreduplication
would be to modulate transcriptional activity by increasing the availability of DNA
templates for gene expression as the gene copy number is obviously multiplied, and
therefore, to modulate subsequent translational and metabolic activities. However,
this hypothesis has neither been convincingly demonstrated nor negated in plant
cells. For example, Leiva-Neto et al. (2004) showed that endoreduplication levels
did not clearly impact on the expression level of some endosperm-specific genes,
which led them to propose that endoreduplication in maize endosperm functions
primarily to provide a store of nitrogen and nucleotides during embryogenesis
and/or germination.
116 M. Bourdon et al.
4.4 Endoreduplication in Response to Environmental Factors
An important physiological role of endoreduplication might be in the adaptation to
adverse environmental factors, especially maintenance of growth under stress
conditions. For instance, amplification of DNA may provide a means to protect
the genome from DNA damaging conditions, such as uneven chromosome segre-
gation or UV damage. In Arabidopsis, the UV-B-insensitive 4 mutation (uvi4)promotes the progression of endoreduplication in hypocotyl and leaf development,
and confers an increased UV-B tolerance (Hase et al. 2006). Endoreduplication was
also demonstrated to be an adaptation factor in plant responses to high salt concen-
tration (Ceccarelli et al. 2006). Moreover, an increase in the extent of endoredupli-
cation reduced the impact of water deficit on epidermal cell size, leaf expansion rate
and final leaf size (Cookson et al. 2006), and facilitated growth at low temperatures
(Barow 2006), thus suggesting that an increase in DNA content can be of advantage
in a given environment.
4.5 Endoreduplication and Growth Rate
As described above (cf. Sect. 4.1) endoreduplication does not seem to be necessary
for cell expansion. However, it could participate in modulating the rate or organ
growth and/or cell expansion. We previously demonstrated a clear correlation
between mean ploidy level in fully developed pericarp and final fruit size and
weight, when 20 tomato lines displaying a large range in fruit weight were com-
pared (Cheniclet et al. 2005).
To investigate whether endoreduplication influences the fruit growth rate, we
recorded the time of anthesis (full bloom in the case of trees) and fruit maturity
(harvest time) for different fruit species and compared the determined length of
development with the extent of endoreduplication (Table 1). From this analysis, it
has been concluded that (1) in all species where fruit development lasts for a very
long period of time (over 17 weeks), endoreduplication does not occur in fruit
tissues; (2) in species displaying middle-length fruit development (10–16 weeks),
some fruits do not display endoreduplication (e.g., grape), while others undergo 4–5
endocycles (e.g., fruits of many Prunus sp.); (3) in fruits, which develop rapidly (in
less than 10 weeks) undergo several rounds of endocycle (3–8). Moreover, the
formation of cells of similar size, and even larger ones, takes far less time in
endopolyploidizing fruits than in nonendopolyploidizing fruits. Assuming that the
ovary cells display roughly similar sizes at anthesis in the different species, these
observations support the assertion that endoreduplication is likely to influence not
only the rate of fruit development but also the rate of cell expansion in species
exhibiting rapid fruit development. This would be consistent with the analysis of
Barow (2006), who suggested that endoreduplication contributes to a greater
extensive growth than in nonendopolyploid plants.
Endoreduplication and Growth of Fleshy Fruits 117
The rate of organ growth could be also under the influence of genome size. From
the data presented in Table 1, no obvious relationship between genome size and
length of fruit growth could be observed. For instance, pear and apple (nonendor-
eduplicating species) have respectively a small (C-value¼ 0.55 pg) and large (C-
value ¼ 4.50 pg) genome size and display similar fruit growth lengths of around 21
weeks. The same observation is also true for endoreduplicating species, such as
tomato (C-value¼ 1 pg) and pepper (C-value ¼ 4 pg), whose fruit both develops in
6–8 weeks. Thus, the positive correlation between genome size and life cycle
shown by Bennett (1972) may not be applicable if confined to fruit development,
at least in this range of genome size.
We also examined if the ability to exhibit endoreduplication was favored by a
small genome size, owing to the fact that a higher nuclear DNA content as a result
of autopolyploidy requires more time to replicate (Bennett 1972). From the 22
different fruit species analyzed in Table 1, it seems that the occurrence and extent of
endoreduplication is not related to genome size, since endopolyploidizing fruits
display genome sizes ranging from 0.16 to 4 pg and nonendopolyploidizing ones
from 0.43 to 4.50 pg.This result is in accordance with the findings of Barow and
Meister (2003) who observed only a low negative correlation between genome size
and endopolyploidization, which was contrary to a previous claim based on fewer
species (Nagl 1976).
5 Molecular Control of Endoreduplication
5.1 The Canonical Cell Cycle
The canonical eukaryotic cell cycle is composed of four distinct phases: an undif-
ferentiated DNA presynthetic phase with a 2C nuclear DNA content, termed the
G1 phase; the S-phase, during which DNA is synthesized, with a nuclear DNA
content intermediate between 2C and 4C; a second undifferentiated phase (DNA
postsynthetic phase) with a 4C nuclear DNA content, termed the G2 phase; and the
ultimate M-phase or mitosis. Mitotic cell division is the ultimate step in the cell
cycle, and leads to the transmission of the genetic information from one mother
cell to two daughter cells. The classical cell cycle thus involves the accurate
duplication of the chromosomal DNA stock in S-phase and its subsequent equal
segregation in each nascent cell as a result of mitosis.
The progression within the four phases of the plant cell cycle is regulated by a
class of conserved heterodimeric protein complexes consisting of a catalytic sub-
unit referred to as cyclin-dependent kinase (CDK) and a regulatory cyclin (CYC)
subunit whose association determines the activity of the complex, its stability, its
localization and substrate specificity (Inze and De Veylder 2006). The canonical
A-type CDK (CDKA; Joubes et al. 2000) harboring the PSTAIRE hallmark in the
cyclin-binding domain displays a pivotal role during the cell cycle as it participates
118 M. Bourdon et al.
in different CDKA/CYC complexes to trigger the specific phosphorylation of
numerous protein substrates at the boundaries between the G1 and the S phases,
and between the G2 and M phases, thus allowing the commitment to DNA replica-
tion and mitosis respectively. The availability and binding of the regulatory cyclin
subunit to a CDK partner is thus of prime importance for the regulation of the cell
cycle. However, other levels of complexity in the regulation occur at the posttrans-
lational level affecting the components of the CDK/CYC complexes. The kinase
activity of the complexes is dependent on the phosphorylation/dephosphorylation
status of the kinase itself, and also on the binding of CDK inhibitors and/or
recruitment of additional regulatory factors (Inze and De Veylder 2006).
5.2 The Endocycle
The endoreduplication cycle (endocycle) is made of the succession of S- and
undifferentiated G-phase without mitosis, thus accounting for the cessation of cell
division and the increase in ploidy level (Joubes and Chevalier 2000; Edgar and
Orr-Weaver 2001; Vlieghe et al. 2007). As a result, part of the molecular control
existing for the classical cell cycle regulation is conserved in the endocycle.
5.2.1 The Mitosis-to-Endoreduplication Transition
The commitment to endocycle and the consequent lack of mitosis has been pro-
posed to occur in the absence of a mitosis inducing factor (MIF) which normally
governs the passage through the G2-M transition. In addition, down-regulation of
M-phase-associated CDK activity is sufficient to drive cells into the endoreduplica-
tion cycle (Vlieghe et al. 2007). The M-phase CDKB1;1 activity is required to
prevent a premature entry in the endocycle. Hence, CDKB1;1 is the likely candi-
date kinase to be part of the MIF. Though the cyclin partner of CDKB1;1 inside
MIF still awaits a definite identification, convincing in planta functional analyses
highlighted the A-type cyclin CYCA2;3 to be the most appropriate candidate (Yu
et al. 2003; Imai et al. 2006).
5.2.2 Relicensing of Origins of Replication
The control of MIF activity cannot account solely for the progression within the
endocycle, since it requires the fluctuation in the activity of S-phase CDK between
DNA synthesis and the undifferentiated G-phase as to allow relicensing of origins of
replication. In eukaryotes, the initiation of DNA replication occurs only once during
each cell cycle from multiple sites throughout each chromosome (Kelly and Brown
2000). These origins of replication trigger the assembly of prereplication complex
(pre-RC) harboring several components, such as the ORC, CDC6, CDT1, and MCMs
proteins (Bryant and Francis 2008). During the cell cycle, the control of the G1-to-S
Endoreduplication and Growth of Fleshy Fruits 119
transition in plant cells is exerted through the retinoblastoma-related protein (RBR)
pathway (de Jager and Murray 1999; Gutierrez et al. 2002), where the hypopho-
sphorylated form of RBR binds to the E2F-DP dimeric transcription factor, thereby
repressing the E2F-responsive genes required for the commitment to the S-phase,
such as those encoding the pre-RC components. Interestingly, the ectopic expressions
of either CDC6 (Castellano et al. 2001) or CDT1 (Castellano et al. 2004), or E2Fa
with its dimerization partner DPa (De Veylder et al. 2002) are sufficient to trigger
extra endocycles, as well as the inhibition of RBR function, consistent with the
inhibitory function of RBR on E2F (Park et al. 2005). It is noteworthy that the
activation of DNA replication in all these transgenic plants results in extra endocycles
and also causes prolonged cell proliferation activity. These data illustrate the conser-
vation of molecular controls between the endocycle and the canonical cell cycle, but
more importantly the importance of regulating the CDK activity, including the
pivotal role of MIF at the onset of endoreduplication. It was thus proposed as a
quantitative model that the amount of CDK activity controls the differentiation – and
obviously the endoreduplication – status of a cell (De Veylder et al. 2007).
5.2.3 Regulation of CDK Activity in Endoreduplication During
Fruit Development
Among the potential mechanisms regulating the CDK activities in endoredupli-
cating tissues, three distinct mechanisms are proposed to be affecting the compo-
nents of the CDK/CYC complexes at the posttranslational level: (1) the WEE1
kinase regulates negatively the CDK activity by phosphorylation of residue Tyr15
before the commitment to mitosis as to ensure that DNA replication and repair on
damaged DNA have been completed; (2) the active CDKA/CYCD complexes may
be inhibited by specific CDK inhibitors, termed ICK/KRPs (for Interactor of cyclin-
dependent kinase/Kip-related protein); (3) loss of CDK activity occurs upon the
proteolytic destruction of the cyclin subunits via the ubiquitin proteasome pathway,
involving the activation of the anaphase-promoting complex (APC) through its
association with the CCS52.
Since endoreduplication plays such an important part during fruit development
(Chevalier 2007), the relative contribution of these different control mechanisms on
CDK activity has been addressed in tomato.
Role of WEE1
Homologues to WEE1 have been isolated from various plant species (Shimotohno
and Umeda 2007). While functional analyses performed in Schizosaccharomycespombe indicated that expression of the maize or Arabidopsis gene led to the inhibition
of cell division and significant cell enlargement (Sun et al. 1999; Sorrell et al. 2002),
Arabidopsis knock-out mutants for WEE1 grow perfectly well under nonstress con-
ditions (De Schutter et al. 2007). Neither cell division nor endoreduplication was
affected in these mutants, thus indicating thatWEE1 is not rate-limiting for cell cycle
120 M. Bourdon et al.
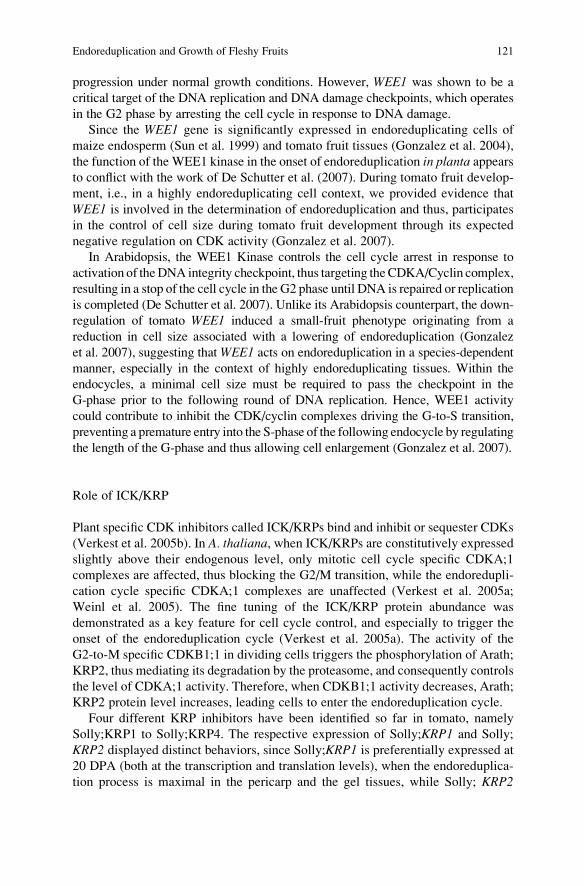
progression under normal growth conditions. However, WEE1 was shown to be a
critical target of the DNA replication and DNA damage checkpoints, which operates
in the G2 phase by arresting the cell cycle in response to DNA damage.
Since the WEE1 gene is significantly expressed in endoreduplicating cells of
maize endosperm (Sun et al. 1999) and tomato fruit tissues (Gonzalez et al. 2004),
the function of the WEE1 kinase in the onset of endoreduplication in planta appearsto conflict with the work of De Schutter et al. (2007). During tomato fruit develop-
ment, i.e., in a highly endoreduplicating cell context, we provided evidence that
WEE1 is involved in the determination of endoreduplication and thus, participates
in the control of cell size during tomato fruit development through its expected
negative regulation on CDK activity (Gonzalez et al. 2007).
In Arabidopsis, the WEE1 Kinase controls the cell cycle arrest in response to
activation of theDNA integrity checkpoint, thus targeting theCDKA/Cyclin complex,
resulting in a stop of the cell cycle in the G2 phase until DNA is repaired or replication
is completed (De Schutter et al. 2007). Unlike its Arabidopsis counterpart, the down-
regulation of tomato WEE1 induced a small-fruit phenotype originating from a
reduction in cell size associated with a lowering of endoreduplication (Gonzalez
et al. 2007), suggesting that WEE1 acts on endoreduplication in a species-dependent
manner, especially in the context of highly endoreduplicating tissues. Within the
endocycles, a minimal cell size must be required to pass the checkpoint in the
G-phase prior to the following round of DNA replication. Hence, WEE1 activity
could contribute to inhibit the CDK/cyclin complexes driving the G-to-S transition,
preventing a premature entry into the S-phase of the following endocycle by regulating
the length of the G-phase and thus allowing cell enlargement (Gonzalez et al. 2007).
Role of ICK/KRP
Plant specific CDK inhibitors called ICK/KRPs bind and inhibit or sequester CDKs
(Verkest et al. 2005b). In A. thaliana, when ICK/KRPs are constitutively expressedslightly above their endogenous level, only mitotic cell cycle specific CDKA;1
complexes are affected, thus blocking the G2/M transition, while the endoredupli-
cation cycle specific CDKA;1 complexes are unaffected (Verkest et al. 2005a;
Weinl et al. 2005). The fine tuning of the ICK/KRP protein abundance was
demonstrated as a key feature for cell cycle control, and especially to trigger the
onset of the endoreduplication cycle (Verkest et al. 2005a). The activity of the
G2-to-M specific CDKB1;1 in dividing cells triggers the phosphorylation of Arath;
KRP2, thus mediating its degradation by the proteasome, and consequently controls
the level of CDKA;1 activity. Therefore, when CDKB1;1 activity decreases, Arath;
KRP2 protein level increases, leading cells to enter the endoreduplication cycle.
Four different KRP inhibitors have been identified so far in tomato, namely
Solly;KRP1 to Solly;KRP4. The respective expression of Solly;KRP1 and Solly;
KRP2 displayed distinct behaviors, since Solly;KRP1 is preferentially expressed at
20 DPA (both at the transcription and translation levels), when the endoreduplica-
tion process is maximal in the pericarp and the gel tissues, while Solly; KRP2
Endoreduplication and Growth of Fleshy Fruits 121
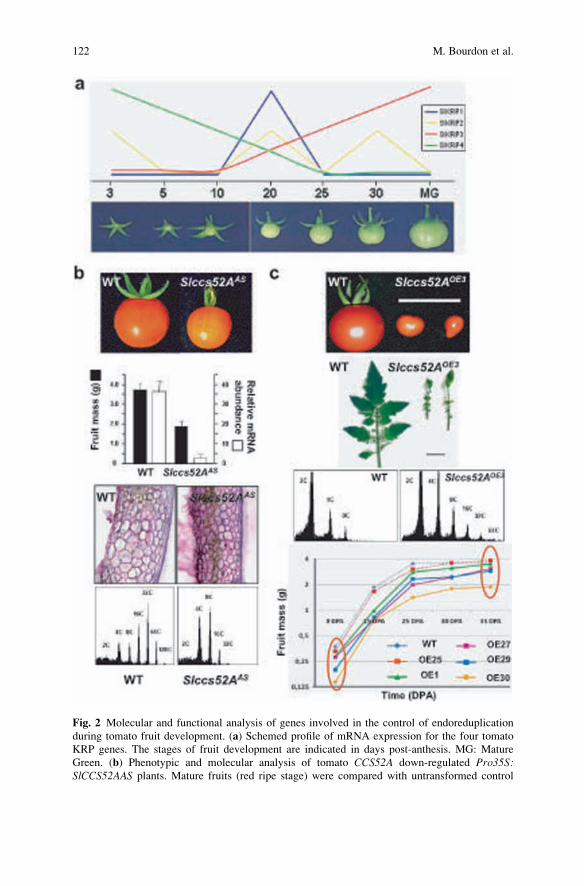
Fig. 2 Molecular and functional analysis of genes involved in the control of endoreduplication
during tomato fruit development. (a) Schemed profile of mRNA expression for the four tomato
KRP genes. The stages of fruit development are indicated in days post-anthesis. MG: Mature
Green. (b) Phenotypic and molecular analysis of tomato CCS52A down-regulated Pro35S:SlCCS52AAS plants. Mature fruits (red ripe stage) were compared with untransformed control
122 M. Bourdon et al.
expression peaks during fruit maturation (Bisbis et al. 2006). Using quantitative
PCR following reverse transcription (RT-qPCR), we showed that the four tomato
KRPs display unique expression profiles during tomato fruit development (Fig. 2a).
Interestingly, Solly;KRP4 is mostly expressed during the very early development of
the fruit, i.e., when cell divisions predominantly drive fruit growth, while the
expression of Solly;KRP3 increases at the latest stages of fruit development, i.e.,
when cell expansion predominantly accounts for fruit growth. These data suggest
that these KRPs may display distinct physiological and functional roles during the
cell cycle and eventually, during the endoreduplication cycle.
During tomato fruit development, the large and hypervacuolarized cells consti-
tuting the jelly-like (gel) locular tissue undergo multiple rounds of endoreduplica-
tion. Within this particular tissue, mitosis is arrested after 20 DPA and only
endoreduplication occurs until then concomitantly with a strong posttranslational
inhibitory regulation of the CDKA activity (Joubes et al. 1999). The origin of this
posttranslational regulatory mechanism resides in part in the accumulation of Solly;
KRP1, which accounts for the inhibition of CDK/CYC kinase activity during the
development of the gel tissue in tomato fruit (Bisbis et al. 2006).
Role of CCS52
The ubiquitin-dependent proteolysis of mitotic cyclins requires the involvement
of a specific E3-type ubiquitin ligase named the anaphase-promoting complex/
cyclosome (APC/C). In plants, the APC/C is activated by the CCS52A protein,
homologous to the mammalian CDH1 and Drosophila FZR, which binds to cyclins
to drive them towards the degradation process by the 26S proteasome (Capron et al.
2003). Like its eukaryotic counterparts, CCS52A was found to promote the onset
and progression of endoreduplication (Cebolla et al. 1999; Vinardell et al. 2003).
As far as the Arabidopsis CCS52A2 isoform is concerned, its transcriptional
activity is under the control of the atypical E2Fe/DEL1 factor, which acts as a
repressor of premature endocycle onset (Vlieghe et al. 2005; Lammens et al. 2008).
We have investigated the functional role of CCS52 genes during tomato fruit
development. Transgenic plants underexpressing SlCCS52A or SlCCS52B using the
Fig. 2 (continued) (WT) of the same age. Fruit mass measurements of 25 DPA-fruits harvested
from Slccs52AAS lines and WT. The corresponding transcript levels of 25 DPA-fruits were
measured by real-time PCR, and the relative abundance of mRNA was normalized to Slbtubulinand SleiF4A. Data are mean � standard deviation (n ¼ 3). The comparison of 25 DPA-pericarps
fromWT and Slccs52AAS fruits reveals an alteration in cell size induced by the down-regulation of
SlCCS52A, together with a shift towards lower DNA ploidy levels. (c) Phenotypic and molecular
analysis of Pro35S:SlCCS52AOE plants overexpressing tomato CCS52A. Mature fruits (red ripe
stage) and fully developed leaves from line Pro35S:SlCCS52AOE3 were compared with untrans-
formed control (WT). In line Pro35S:SlCCS52AOE3 DNA ploidy levels in leaves were shifted
towards greater levels as a result of CCS52A overexpression. The growth kinetics of fruits
harvested from WT plants and Pro35S:SlCCS52AOE plants (lines OE1, OE25, OE27, OE29 and
OE30) was established by measuring fruit mass daily up to 35 DPA
<
Endoreduplication and Growth of Fleshy Fruits 123
CaMV 35S promoter as a primary approach were generated. While the Pro35S:
SlCCS52BAS plants showed no evident phenotype at all, the Pro35S:SlCCS52AAS
plants displayed smaller fruits than wild-type plants (Fig. 2b). The ploidy level of
the Pro35S:SlCCS52AAS fruits was reduced and correlated with a decrease in mean
cell size and an increased cell number.
Gain-of-function transgenic tomato plants overexpressing SlCCS52A were also
generated. In the most extreme case, the phenotype of the Pro35S:SlCCS52AOE line
OE3 exhibited gross changes in leaf development and morphology (Fig. 2c). The
plant phenotype was characterized by the appearance of under-developed (small and
curly) leaves, resembling those of Arabidopsis plants overexpressing CDK inhibitors
(Wang et al. 2000; De Veylder et al. 2001; Schnittger et al. 2003), thus suggesting
that cell division was deeply impaired in these plants. Interestingly, the ploidy level in
these plants was increased towards high DNA levels. Five more SlCCS52A over-
expressing plants were analyzed for which the overall phenotypes were less affected
allowing subsequent analyses, especially fruit growth characteristics (Fig. 2c).
In accordance with the level of SlCCS52A expression, which was not significantly
different from that of WT, fruits from line OE25 did behave like WT. On the
contrary, the growth of fruits from the four other lines expressing greater levels of
SlCCS52A transcripts displayed a slower kinetics. However, fruits from these trans-
genic lines at 35 DPA tended to reach almost the same size as WT fruit.
To explain these data, the effects of a SlCSS52A overexpression during very
early fruit development are essentially, likely to affect the cell division process thus
leading to very small fruits. Thereafter, and in accordance with the functional
specificity of SlCSS52A in the control of endoreduplication, fruit growth is then
accelerated during the endoreduplication-driven cell expansion phase to recover an
optimum final fruit size close to that of WT. A kinetic study of the appearance of
highly polyploid nuclei during fruit growth in these Pro35S:SlCCS52AOE lines does
support strongly this hypothesis (Mathieu-Rivet et al. submitted).
The functional analysis of endoreduplication-promoting genes, such as WEE1and CCS52A thus demonstrates the physiological role of endoreduplication in
fleshy fruit growth, since a reduction in cell size originating from a decrease in
DNA ploidy levels impacts the whole fruit development and final fruit size.
We cannot make short work of the above stated causality dilemma, and whether
endoreduplication is as a driving regulator for cell expansion. Nonetheless WEE1is thought to control the endocycle G-phase length as to allow the sufficient cell
growth prior to commitment to the next nuclear DNA amplification, and accord-
ingly cell enlargement becomes determining for subsequent DNA reduplication.
At the organ level, manipulating endoreduplication through CCS52A overexpres-
sion highlights the function of endoreduplication as an ultimate driving force for
fruit growth, and even an enhancer of cell growth rate facilitating and/or accel-
erating fruit growth or bigger fruit size. As shown in our cytological analysis in
Table 1, endoreduplication is strong when fruit development is short and, there-
fore, endoreduplication is a way to get big fruits rapidly as supported by our
molecular data.
124 M. Bourdon et al.
6 Concluding Remarks
Fleshy fruit organogenesis represents an interesting plant system to study at the
molecular and functional level the regulation of cell division and cell expansion
processes, and especially, the interplay between the classical cell cycle and the
endoreduplication cycle. Among the different plant models, tomato is especially
well suited to address this question. Indeed, the final size of the fruit depends
upon both the cell number and cell size, which is strongly associated with endor-
eduplication. The originality of the tomato fruit model resides in the cellular and
structural diversity of tissues that compose the fruit, and very importantly final
cell size (cell diameter higher than 0.6 mm at the end of fruit development)
and ploidy levels (up to 512C in some genotypes) (Cheniclet et al. 2005). Such
levels of endopolyploidy represent values unmatched in other model plants, such
as Arabidopsis or maize where the maximum physiological ploidy is limited
respectively to 32C (epidermal cells of the hypocotyls) or 96C (seed endosperm).
Why such high levels of endopolyploidy in tomato represents a crucial
interrogation.
As reviewed in this chapter, several physiological traits have been attributed
to endoreduplication in plants, and as far as fleshy fruits are concerned, the
complete elucidation of the functional role of endoreduplication during their
growth still awaits us. As discussed herein, we believe that endoreduplication
facilitates the growth of fleshy fruits by driving an extended cell expansion
process. Obviously, it is also tempting to speculate that endoreduplication is
associated with cell differentiation and metabolic specialization cell in fruit cells
in the course of fleshy fruit development. The biochemical composition of fruit
is mainly determined during the growth period sustained by cell expansion:
starch, organic acids, secondary metabolites and aroma precursors accumulate
and thus contribute to the organoleptic and nutritional quality of fruit such as
tomato. These metabolic modifications during fruit growth originate from a
profound change in the cellular behavior and gene expression program of fruit
cells and are concomitant with endoreduplication as recently analyzed (e.g.,
Lemaire-Chamley et al. 2005; Mounet et al. 2009). However, the direct link
between endoreduplication and gene expression control still awaits a definitive
demonstration.
Acknowledgements Part of the research described in this chapter was supported by the 6th
Framework Program of the European Commission, within the European Solanaceae Integrated
project, EU-SOL (grant no. FOOD-CT-2006-016214), and by fundings from the Region Aquitaine.
M. B., E.M.-R. and M.N. were supported respectively by grants n�26855-2007, n�19061-2005 and
n�24220–2006 from the Ministere de l’Enseignement Superieur et de la Recherche (France).
We express our deepest thanks to Dr Theresa Barreneche and Dr Helene Christmann (Research
Unit 419 on Fruit Species, INRA Bordeaux, France), for having provided fruit samples of
25 varieties from the Prunus species and the corresponding data for bloom and maturity time.
The Prunus species are conserved in the Prunus, Castanea, Juglans Genetic Resources Centre of
INRA Bordeaux.
Endoreduplication and Growth of Fleshy Fruits 125
Dr Spencer Brown and Olivier Catrice (Plant Science Institute, UPR 2355, CNRS, Gif-sur-Yvette,
France) are acknowledged for flow cytometry sorting of tomato nuclei and helpful discussions, and
Dr Olivier Coriton (Plant Cytogenetics Plateform, INRA Le Rheu, France) for his precious help in
performing FISH analyses.
We acknowledge the excellent technical assistance from Valerie Rouyere. Part of the cytological
work was done on the Imaging Cytology facility (Plateau Technique Imagerie Cytologie, IFR103)
at INRA Bordeaux with the help of Martine Peypelut for confocal image acquisition of hybridized
nuclei.
References
Balbi V, Lomax TL (2003) Regulation of early tomato fruit development by the Diageotropicagene. Plant Physiol 131:186–197
BarlowPW(1975)The polytene nucleus of the giant cell ofBryonia anthers. Protoplasma83:339–349
Baroux C, Fransz P, Grossniklaus U (2004) Nuclear fusions contribute to polyploidization of the
gigantic nuclei in the chalazal endosperm of Arabidopsis. Planta 220:38–46
Barow M (2006) Endopolyploidy in seed plants. BioEssays 28:271–281
Barow M, Meister A (2003) Endopolyploidy in seed plants is differently correlated to systematics,
organ, life strategy and genome size. Plant Cell Environ 26:571–584
Bauer MJ, Birchler JA (2006) Organization of endoreduplicated chromosomes in the endosperm
of Zea mays L. Chromosoma 115:383–394
Bennett MD (1972) Nuclear DNA content and minimum generation time in herbaceous plants.
Proc R Soc Lond Ser B Biol Sci 181:109–135
Berger F (2003) Endosperm: the crossroad of seed development. Curr Opin Plant Biol 6: 42–50
Bergervoet JHW, Verhoeven HA, Gilissen LJW, Bino RJ (1996) High amounts of nuclear DNA in
tomato (Lycopersicon esculentum Mill.) pericarp. Plant Sci 116:141–145
Bertin N (2005) Analysis of the tomato fruit growth response to temperature and plant fruit
load in relation to cell division, cell expansion and DNA endoreduplication. Ann Bot
95:439–447
Bertin N, Borel C, Brunel B, Cheniclet C, Causse M (2003) Do genetic make-up and growth
manipulation affect tomato fruit size by cell number, or cell size and endoreduplication? Ann
Bot 92:415–424
Bertin N, Lecomte A, Brunel B, Fishman S, Genard M (2007) A model describing cell poly-
ploidization in tissues of growing fruit as related to cessation of cell proliferation. J Exp Bot
58:1903–1913
Bisbis B, Delmas F, Joubes J, Sicard A, Hernould M, Inze D, Mouras A, Chevalier C (2006)
Cyclin-Dependent Kinase Inhibitors are involved in endoreduplication during tomato fruit
development. J Biol Chem 281:7374–7383
Bohner J, Bangerth F (1988a) Cell number, cell size and hormone levels in semi-isogenic mutants
of Lycopersicon pimpinellifolium differing in frut size. Physiol Plant 72:316–320
Bohner J, Bangerth F (1988b) Effect of fruit-set sequence and defoliation on cell number, cell size
and hormone levels of tomato fruits (Lycopersicon esculentum Mill.) within a truss. Plant
Growth Regul 7:141–155
Bollard EG (1970) The physiology and nutrition of developing fruits. In: Hulme AC (ed) The
biochemistry of fruit and their products, vol 1. Academic, London, pp 387–425
Boonkorkaew P, Hikosaka S, Sugiyama N (2008) Effect of pollination on cell division, cell
enlargement, and endogenous hormones in fruit development in a gynoecious cucumber. Sci
Hortic 116:1–7
Bradley MV, Crane JC (1955) The effect of 2,4,5-trichlorophenoxyacetic acid on cell and nuclear
size and endopolyploidy in parenchyma of apricot fruits. Am J Bot 42:273–281
126 M. Bourdon et al.
Brecht JK, Chau KV, Fonseca SC, Oliveira FAR, Silva FM, Nunes MCN, Bender RJ (2003)
Maintaining optimal atmosphere conditions for fruits and vegetables throughout the posthar-
vest handling chain. Postharvest Biol Technol 27:87–101
Bryant JA, Francis D (2008) Initiation of DNA replication In: Bryant JA, Francis D (eds) The
eukaryotic cell cycle. Taylor and Francis, Abingdon, UK, pp 29–44
B€unger-Kibler S, Bangerth F (1982) Relationship between cell number, cell size and fruit size of
seeded fruits of tomato (Lycoperpsicon esculentum Mill.), and those induced parthenocarpi-
cally by the application of plant growth regulators. Plant Growth Regul 1:143–154
Cano-Medrano R, Darnell RL (1997) Cell number and cell size in parthenocarpic vs. pollinatedBlueberry (Vaccinium ashei) fruits. Ann Bot 80:419–425
Capron A, Okresz L, Genschik P (2003) First glance at the plant APC/C, a highly conserved
ubiquitin-protein ligase. Trends Plant Sci 8:83–89
Carmi N, Salts Y, Dedicova B, Shabtai S, Barg R (2003) Induction of parthenocarpy in tomato via
specific expression of the rolB gene in the ovary. Planta 217:726–735
Carvalheira GMG (2000) Plant polytene chromosomes. Genet Mol Biol 3:1043–1050
Castellano MM, del Pozo JC, Ramirez-Parra E, Brown S, Gutierrez C (2001) Expression and
stability of Arabidopsis CDC6 are associated with endoreduplication. Plant Cell 13:2671–2686
Castellano MM, Boniotti MB, Caro E, Schnittger A, Gutierrez C (2004) DNA replication
licensing affects cell proliferation or endoreplication in a cell type–specific manner. Plant
Cell 16:2380–2393
Cebolla A, Vinardell JM, Kiss E, Olah B, Roudier F, Kondorosi A, Kondorosi E (1999) The
mitotic inhibitor ccs52 is required for endoreduplication and ploidy-dependent cell enlarge-
ment in plants. EMBO J 18:4476–4484
Ceccarelli M, Sanantonio E, Marmottini F, Amzallag GN, Cionini PG (2006) Chromosome
endoreduplication as a factor of salt adaptation in Sorghum bicolor. Protoplasma 227:113–118
Cheniclet C, Rong WY, Causse M, Bolling L, Frangne N, Carde JP, Renaudin JP (2005) Cell
expansion and endoreduplication show a large genetic variability in pericarp and contribute
strongly to tomato fruit growth. Plant Physiol 139:1984–1994
Chevalier C (2007) Cell cycle control and fruit development. In: Inze D (ed) Cell cycle control and
plant development. Annual plant reviews, vol 32. Blackwell, Oxford, pp 269–293
Cong B, Liu J, Tanksley SD (2002) Natural alleles of a tomato QTL modulate fruit size through
heterochronic regulatory mutations. Proc Natl Acad Sci U S A 99:13606–13611
Cookson SJ, Radziejwoski A, Granier C (2006) Cell and leaf size plasticity in Arabidopsis: what isthe role of endoreduplication? Plant Cell Environ 29:1273–1283
Coombe B (1976) The development of fleshy fruits. Annu Rev Plant Physiol 27:507–528
Cowan AK, Taylor NJ, van Staden J (2005) Hormone homeostasis and induction of the small-fruit
phenotype in a “Hass” avocado. Plant Growth Regul 45:11–19
Crane JC (1964) Growth substances in fruit setting and development. Annu Rev Plant Physiol
15:303–326
Cruz-Castillo JG, Woolley DJ, Lawes GS (2002) Kiwifruit size and CPPU response are influenced
by the time of anthesis. Sci Hortic 95:23–30
D’Amato F (1984) Role of polyploidy in reproductive organs and tissues. In: Johri BM (ed)
Embryology of Angiosperms. Springer, New York, pp 519–566
D’Aoust MA, Yelle S, Nguyen-Quoc B (1999) Antisense inhibition of tomato fruit sucrose
synthase decreases fruit setting and the sucrose unloading capacity of young fruit. Plant Cell
11:2407–2418
De Schutter K, Joubes J, Cools T, Verkest A, Corellou F, Babiychuk E, Van Der Schueren E,
Beeckman T, Kushnir S, Inze D, De Veylder L (2007) Arabidopsis WEE1 kinase controls cell
cycle arrest in response to activation of the DNA integrity checkpoint. Plant Cell 19:211–25
De Veylder L, Beeckman T, Beemster GTS, Krols L, Terras F, Landrieu I, Van Der Schueren E,
Maes S, Naudits M, Inze D (2001) Functional analysis of cyclin-dependent kinase inhibitors of
Arabidopsis. Plant Cell 13:1–15
Endoreduplication and Growth of Fleshy Fruits 127
De Veylder L, Beeckman T, Beemster GTS, de Almeida Engler J, Ormenese S, Maes S, Naudts M,
Van Der Schueren E, Jaqmard A, Engler G, Inze D (2002) Control of proliferation, endor-
eduplication and differentiation by the Arabidopsis E2Fa-DPa transcription factor. EMBO J
21:1360–1368
De Veylder L, Beeckman T, Inze D (2007) The ins and outs of the plant cell cycle. Nat Rev Mol
Cell Biol 8:655–665
DeJong T, Goudriaan J (1989) Modeling peach fruit growth and carbohydrate requirements:
reevaluation of the double-sigmoid growth pattern. J Am Soc Hortic Sci 114:800–804
Edgar BA, Orr-Weaver TL (2001) Endoreplication cell cycles: more for less. Cell 105:297–306
Fang Y, Spector DL (2005) Centromere positioning and dynamics in living Arabidopsis plants.
Mol Biol Cell 16:5710–5718
Ferrandiz C (2002) Regulation of fruit dehiscence in Arabidopsis. J Exp Bot 53:2031–2038
Ferrandiz C, Pelaz S, Yanofsky MF (1999) Control of carpel and fruit development in Arabidopsis.Annu Rev Biochem 68:321–354
Frary A, Nesbitt TC, Frary A, Grandillo D, van der Knapp E, Cong B, Liu J, Meller J, Elber R,
Alpert KB, Tanksley SD (2000) fw2.2: a quantitative trait locus key to the evolution of tomato
fruit size. Science 289:85–88
Gendreau E, Traas J, Desnos T, Grandjean O, Caboche M, Hofte H (1997) Cellular basis of
hypocotyl growth in Arabidopsis thaliana. Plant Physiol 114:295–305
Gendreau E, Hofte H, Grandjean O, Brown S, Traas J (1998) Phytochrome controls the number of
endoreduplication cycles in the Arabidopsis thaliana hypocotyl. Plant J 13:221–230
Gillaspy G, Ben-David H, Gruissem W (1993) Fruits: a developmental perspective. Plant Cell
5:1439–1451
Giovannoni J (2001) Molecular biology of fruit maturation and ripening. Annu Rev Plant Physiol
Plant Mol Biol 52:725–749
Giovannoni J (2004) Genetic regulation of fruit development and ripening. Plant Cell 16:
S170–S180
Goetz M, Vivian-Smith A, Johnson SD, Koltunow AM (2006) Auxin response factor8 is a
negative regulator of fruit initiation in Arabidopsis. Plant Cell 18:1873–1886
Goetz M, Hooper LC, Johnson SD, Rodrigues JCM, Vivian-Smith A, Koltunow AM (2007)
Expression of aberrant forms of AUXIN RESPONSE FACTOR8 stimulates parthenocarpy
in Arabidopsis and tomato. Plant Physiol 145:351–366
Gonzalez N, Hernould M, Delmas F, Gevaudant F, Duffe P, Causse M, Mouras A, Chevalier C
(2004) Molecular characterization of a WEE1 gene homologue in tomato (Lycopersiconesculentum Mill.). Plant Mol Biol 56:849–861
Gonzalez N, Gevaudant F, Hernould CC, Mouras A (2007) The cell cycle-associated protein
kinase WEE1 regulates cell size in relation to endoreduplication in developing tomato fruit.
Plant J 51:642–655
Gray JD, Kolesik P, Hoj PB, Coombe BG (1999) Confocal measurement of the three-dimensional
size and shape of plant parenchyma cells in a developing fruit tissue. Plant J 19:229–236
Gutierrez C, Ramirez-Parra E, Mar Castellano M, del Pozo JC (2002) G1 to S transition: more than
a cell cycle engine switch. Curr Opin Plant Biol 5:480–486
Hamada K, Hasegawa K, Ogata T (2008) Strapping and a synthetic cytokinin promote cell
enlargement in ‘Hiratanenashi’ Japanese persimmon. Plant Growth Regul 54:225–230
Harada T, Kurahashi W, Yanai M,Wakasa Y, Satoh T (2005) Involvement of cell proliferation and
cell enlargement in increasing the fruit size of Malus species. Sci Hortic 105:447–456
Hase Y, Trung KH, Matsunaga T, Tanaka A (2006) A mutation in the uvi4 gene promotes
progression of endoreduplication and confers increased tolerance towards ultraviolet B light.
Plant J 46:317–326
Higashi K, Hosoya K, Ezura H (1999) Histological analysis of fruit development between two
melon (Cucumis melo L. reticulatus) genotypes setting a different size of fruit. J Exp Bot
50:1593–1597
128 M. Bourdon et al.
Ho L (1992) Fruit growth and sink strength. In Marshall C and Grace J (eds) Fruit and seed
production. Aspect of development, environmental physiology and ecology. Cambridge
University Press, Cambridge, pp 101–124
Ho LC (1996) The mechanism of assimilate partitioning and carbohydrate compartmentation in
fruit in relation to the quality and yield of tomato. J Exp Bot 47:1239–1243
Hopping ME (1976) Structure and development of fruit and seeds in chinese gooseberry (Actinidia
chinensis Planch.). N Z J Bot 14:63–68
Imai KK, Ohashi Y, Tsuge T, Yoshizumi T, Matsui M, Oka A, Aoyama T (2006) The A-type
cyclin CYCA2;3 is a key regulator of ploidy levels in Arabidopsis endoreduplication. Plant
Cell 18:382–396
Inze D, De Veylder L (2006) Cell cycle regulation in plant development. Annu Rev Genet
40:77–105
John PCL, Qi R (2008) Cell division and endoreduplication: doubtful engines of vegetative
growth. Trends Plant Sci 13:121–127
Jones B, Frasse P, Olmos E, Zegzouti H, Li ZG, Latche A, Pech JC, Bouzayen M (2002) Down-
regulation of DR12, an auxin-response-factor homolog, in the tomato results in a pleiotropic
phenotype including dark green and blotchy ripening fruit. Plant J 32:603–613
Joubes J, Chevalier C (2000) Endoreduplication in higher plants. Plant Mol Biol 43:737–747
Joubes J, Phan T-H, Just D, Rothan C, Bergounioux C, Raymond P, Chevalier C (1999) Molecular
and biochemical characterization of the involvement of Cyclin-dependent kinase CDKA
during the early development of tomato fruit. Plant Physiol 121:857–869
Joubes J, Chevalier C, Dudits D, Heberle-Bors E, Inze D, Umeda M, Renaudin J-P (2000) Cyclin-
dependent kinases related protein kinases in plants. Plant Mol Biol 43:607–621
Kano Y (2007) Comparison of Cell Size and Kind of Sugars Accumulated in Grape Berries vs
Melon Fruits. Environ Control Biol 45:95–101
Kato N, Lam E (2003) Chromatin of endoreduplicated pavement cells has greater range of
movement than that of diploid guard cells in Arabidopsis thaliana. J Cell Sci 116:2195–2201
Kelly TJ, Brown GW (2000) Regulation of chromosome replication. Annu Rev Biochem
69:829–880
Kladnik A, Chourey PS, Pring DR, Dermastia M (2006) Development of the endosperm of
Sorghum bicolor during the endoreduplication-associated growth phase. J Cereal Sci
43:209–215
Knapp S (2002) Tobacco to tomatoes: a phylogenetic perspective on fruit diversity in the
Solanaceae. J Exp Bot 53:2001–2022
Kondorosi E, Kondorosi A (2004) Endoreduplication and activation of the anaphase-promoting
complex during symbiotic cell development. FEBS Lett 567:152–157
Kowles RV, Phillips RL (1985) DNA amplification patterns in maize endosperm nuclei during
kernel development. Proc Natl Acad Sci USA 82:7010–7014
Kowles RV, Srienc F, Phillips RL (1990) Endoreduplication of nuclear DNA in the developing
maize endosperm. Dev Genet 11:125–132
Kudo N, Kimura Y (2002) Nuclear DNA endoreduplication during petal development in cabbage:
relationship between ploidy levels and cell size. J Exp Bot 53:1017–1023
Kwiatkowska M, Popłonska K, Kazmierczak A, Stepinski D, Rogala K, Polewczyk K (2007) Role
of DNA endoreduplication, lipotubuloids, and gibberellic acid in epidermal cell growth during
fruit development of Ornithogalum umbellatum. J Exp Bot 58:2023–2031
Lammens T, Boudolf V, Kheibarshekan L, Panagiotis Zalmas L, Gaamouche T, Maes S, Van-
straelen M, Kondorosi E, La Thangue NB, Govaerts W, Inze D, De Veylder L (2008) Atypical
E2F activity restrains APC/CCCS52A2 function obligatory for endocycle onset. Proc Nat Acad
Sci U S A 105:14721–14726
Larkin JC, Brown ML, Churchman ML (2007) Insights into he endocycle from trichome develop-
ment. In: Inze D (ed) Cell cycle control and plant development. Annual plant reviews, vol 32.
Blackwell, Oxford, pp 249–268
Endoreduplication and Growth of Fleshy Fruits 129
Lee HC, Chiou DW, Chen WH, Markhart AH, Chen YH, Lin TY (2004) Dynamics of cell growth
and endoreduplication during orchid flower development. Plant Sci 166:659–667
Leiva-Neto JT, Grafi G, Sabelli PA, Dante RA,Woo YM,Maddock S, Gordon-KammWJ, Larkins
BA (2004) A dominant negative mutant of Cyclin-Dependent Kinase A reduces endoredupli-
cation but not cell size or gene expression in maize endosperm. Plant Cell 16:1854–1869
Lemaire-Chamley M, Petit J, Garcia V, Just D, Baldet P, Germain V, Fagard M, Mouassite M,
Cheniclet C, Rothan C (2005) Changes in transcriptional profiles are associated with early fruit
tissue specialization in tomato. Plant Physiol 139:292–299
Lemontey C, Mousset-Declas C, Munier-Jolain N, Boutin JP (2000) Maternal genotype influences
pea seed size by controlling both mitotic activity during early embryogenesis and final
endoreduplication level/cotyledon cell size in mature seed. J Exp Bot 51:167–175
Lermontova I, Schubert V, Fuchs J, Klatte S, Macas J, Schubert I (2006) Loading of Arabidopsis
centromeric histone CENH3 occurs mainly during G2 and requires the presence of the histone
fold domain. Plant Cell 18:2443–2451
List A (1963) Some observations on DNA content and cell and nuclear volume growth in the
developing xylem cells of certain higher plants. Am J Bot 50:320–329
Liu J, Cong B, Tanksley SD (2003) Generation and analysis of an artificial gene dosage series in
tomato to study the mechanisms by which the cloned quantitative trait locus fw2.2 controls fruitsize. Plant Physiol 132:292–299
Lopes MA, Larkins BA (1993) Endosperm origin, development, and function. Plant Cell
5:1383–1399
Lukaszewska E, Sliwinska E (2007) Most organs of sugar-beet (Beta vulgaris L.) plants at the
vegetative and reproductive stages of development are polysomatic. Sexual Plant Reprod
20:99–107
Martı C, Orzaez D, Ellul P, Moreno V, Carbonell J, Granell A (2007) Silencing of DELLA induces
facultative parthenocarpy in tomato fruits. Plant J 52:865–876
Mazzucato A, Taddei AR, Soressi GP (1998) The parthenocarpic fruit (pat) mutant of tomato
(Lycopersicon esculentum Mill.) sets seedless fruits and has aberrant anther and ovule devel-
opment. Development 125:107–114
Melaragno JE, Mehrotra B, Coleman AW (1993) Relationship between endopolyploidy and cell
size in epidermal tissue of Arabidopsis. Plant Cell 5:1661–1668Mergaert P, Nikovics K, Kelemen Z, Maunoury N, Vaubert D, Kondorosi A, Kondorosi E (2003)
A novel family in Medicago truncatula consisting of more than 300 nodule-specific genes
coding for small, secreted polypeptides with conserved cysteine motifs. Plant Physiol
132:161–173
Mizukami Y (2001) A matter of size: developmental control of organ size in plants. Curr Opin
Plant Biol 4:533–539
Mohr WP, Stein M (1969) Fine structure of fruit development in tomato. Can J Plant Sci
49:549–553
Mounet F, Moing A, Garcia V, Petit J, Maucourt M, Deborde C, Bernillon S, Le Gall G,
Colquhoun I, Defernez M, Giraudel JL, Rolin D, Rothan C, Lemaire-Chamley M (2009)
Gene and metabolite regulatory network analysis of early developing fruit tissues highlights
new candidate genes for the control of tomato fruit composition and development. Plant
Physiol 149:1505–1528
Nagl W (1976) DNA endoreduplication and polyteny understood as evolutionary strategies.
Nature 261:614–645
Nenno M, Schumann K, Nagl W (1994) Detection of rRNA and phaseolin genes on polytene
chromosomes of Phaseolus coccineus by fluorescence in situ hybridization after pepsin pre-
treatment. Genome 37:1018–1021
Nitsch JP (1953) The physiology of fruit growth. Annu Rev Plant Physiol 4:199
Nitsch JP (1965) Physiology of flower and fruit development. In: Ruhland W (ed) Encyclopedia of
plant physiology. Springer, Berlin, Heidelberg, New York, pp 1537–1647
130 M. Bourdon et al.
Nitsch JP (1970) Hormonal factors in growth and development. In: Hulme AC (ed) The biochemi-
stry of fruits and their products 2. Academic, London, pp 427–472
Ognjanov V, Vujanic-Varga D, Misic PD, Veresbaranji I, Macet K, Tesovic Z, Krstic M, Petrovic
N (1995) Anatomical and biochemical studies of fruit development in peach. Sci Hort
64:33–48
Ojeda H, Deloire A, Carbonneau A, Ageorges A, Romieu C (1999) Berry development of grape-
vines: Relations between the growth of berries and their DNA content indicate cell multiplica-
tion and enlargement. Vitis 38:145–150
Otto SP (2007) The evolutionary consequences of polyploidy. Cell 131:452–462
Ozga JA, van Huizen R, Reinecke DM (2002) Hormone and seed-specific regulation of pea fruit
growth. Plant Physiol 128:1379–1389
Pandolfini T, Molesini B, Spena A (2007) Molecular dissection of the role of auxin in fruit
initiation. Trends Plant Sci 12:327–329
Park JA, Ahn JW, Kim YK, Kim SJ, Kim JK, Kim WT, Pai HS (2005) Retinoblastoma protein
regulates cell proliferation, differentiation, and endoreduplication in plants. Plant J 42:153–163
Roeder AHK, Yanofsky MF (2006) Fruit development in Arabidopsis. The Arabidopsis Book
52:1–50
Rygol J, L€uttge U (1983) Water-relation parameters of giant and normal cells of Capsicum
annuum pericarp. Plant Cell Environ 6:545–553
Schlosser J, Olsson N, Weis M, Reid K, Peng F, Lund S, Bowen P (2008) Cellular expansion and
gene expression in the developing grape (Vitis vinifera L.). Protoplasma 232:255–265
Schnittger A, Weinl C, Bouyer D, Schobinger U, H€ulskampM (2003) Misexpression of the cyclin-
dependent kinase inhibitor ICK1/KRP1 in single-celled Arabidopsis trichomes reduces endor-
eduplication and cell size and induces cell death. Plant Cell 15:303–315
Schubert V, Klatte M, Pecinka A, Meister A, Jasencakova Z, Schubert I (2006) Sister chromatids
are often incompletely aligned in meristematic and endopolyploid interphase nuclei of Arabi-
dopsis thaliana. Genetics 172:467–475
Serrani J, Ruiz-Rivero O, Fos M, Garcia-Martinez JM (2008) Auxin-induced fruit-set in tomato is
mediated in part by gibberellins. Plant J 56:922–934
Sesek P, Kump B, Bohanec B (2005) Interphase structure of endoreduplicated nuclei in diploid
and tetraploid Brassica oleracea L. Acta Biol Cracov Ser Bot 47:93–99
Shimotohno A, Umeda M (2007) CDK phosphorylation. In: Inze D (ed) Cell cycle control and
plant development, Annual Plant Reviews, vol 32. Blackwell, Oxford, pp 114–137
Smith O (1935) Pollination and life-history studies of the tomato (Lycopersicon esculentumMill.).
Cornell Univ Agric Exp Stn Mem 184:3–16
Soliva-Fortuny RC, Martin-Belloso O (2003) New advances in extending the shelf-life of fresh-cut
fruits: a review. Trends Food Sci Technol 14:341–353
Sorrell DA, Marchbank A, McMahon K, Dickinson JR, Rogers HJ, Francis D (2002) A WEE1
homologue from Arabidopsis thaliana. Planta 215:518–522
Srivastava A, Handa AK (2005) Hormonal regulation of tomato fruit development: a molecular
perspective. J Plant Growth Regul 24:67–82
Stern RA, Flaishman M, Applebaum S, Ben-Arie R (2007) Effect of synthetic auxins on fruit
development of ‘Bing’ cherry (Prunus avium L.). Sci Hortic 114:275–280
Sugimoto-Shirasu K, Roberts K (2003) “Big it up”: endoreduplication and cell-size control in
plants. Curr Opin Plant Biol 6:544–553
Sun Y, Dilkes BP, Zhang C, Dante RA, Carneiro NP, Lowe KS, JUNG R, Gordon-Kamm WJ,
Larkins BA (1999) Characterization of maize (Zea mays L.) Wee1 and its activity in develop-
ing endosperm. Proc Nat Acad Sci U S A 96:4180–4185
Suutarinen J, Anakainen L, Autio K (1998) Comparison of Light Microscopy and Spatially
Resolved Fourier Transform Infrared (FT-IR) Microscopy in the Examination of Cell Wall
Components of Strawberries. Lebensm Wiss Technol 31:595–601
Tanksley SD (2004) The genetic, developmental, and molecular bases of fruit size and shape
variation in tomato. Plant Cell 16:S181–S189
Endoreduplication and Growth of Fleshy Fruits 131
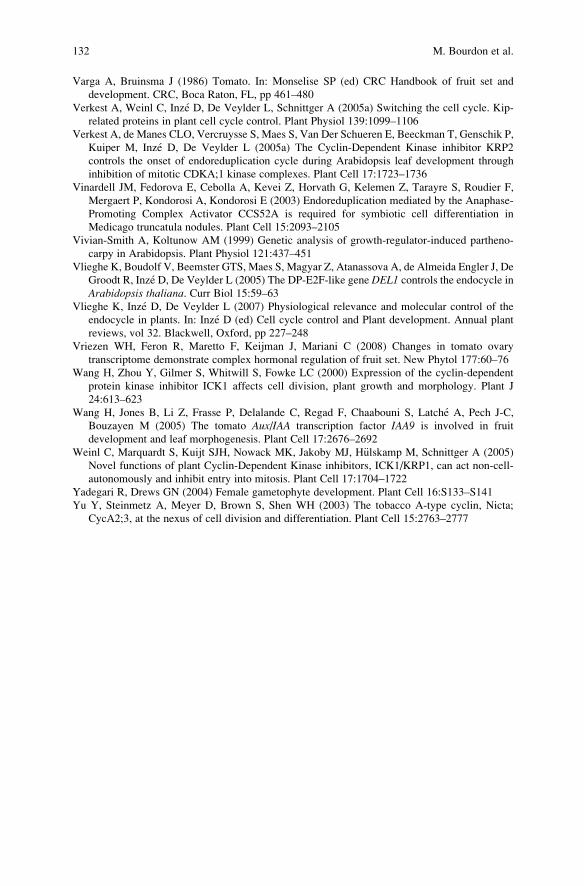
Varga A, Bruinsma J (1986) Tomato. In: Monselise SP (ed) CRC Handbook of fruit set and
development. CRC, Boca Raton, FL, pp 461–480
Verkest A, Weinl C, Inze D, De Veylder L, Schnittger A (2005a) Switching the cell cycle. Kip-
related proteins in plant cell cycle control. Plant Physiol 139:1099–1106
Verkest A, de Manes CLO, Vercruysse S, Maes S, Van Der Schueren E, Beeckman T, Genschik P,
Kuiper M, Inze D, De Veylder L (2005a) The Cyclin-Dependent Kinase inhibitor KRP2
controls the onset of endoreduplication cycle during Arabidopsis leaf development through
inhibition of mitotic CDKA;1 kinase complexes. Plant Cell 17:1723–1736
Vinardell JM, Fedorova E, Cebolla A, Kevei Z, Horvath G, Kelemen Z, Tarayre S, Roudier F,
Mergaert P, Kondorosi A, Kondorosi E (2003) Endoreduplication mediated by the Anaphase-
Promoting Complex Activator CCS52A is required for symbiotic cell differentiation in
Medicago truncatula nodules. Plant Cell 15:2093–2105
Vivian-Smith A, Koltunow AM (1999) Genetic analysis of growth-regulator-induced partheno-
carpy in Arabidopsis. Plant Physiol 121:437–451
Vlieghe K, Boudolf V, Beemster GTS, Maes S, Magyar Z, Atanassova A, de Almeida Engler J, De
Groodt R, Inze D, De Veylder L (2005) The DP-E2F-like gene DEL1 controls the endocycle inArabidopsis thaliana. Curr Biol 15:59–63
Vlieghe K, Inze D, De Veylder L (2007) Physiological relevance and molecular control of the
endocycle in plants. In: Inze D (ed) Cell cycle control and Plant development. Annual plant
reviews, vol 32. Blackwell, Oxford, pp 227–248
Vriezen WH, Feron R, Maretto F, Keijman J, Mariani C (2008) Changes in tomato ovary
transcriptome demonstrate complex hormonal regulation of fruit set. New Phytol 177:60–76
Wang H, Zhou Y, Gilmer S, Whitwill S, Fowke LC (2000) Expression of the cyclin-dependent
protein kinase inhibitor ICK1 affects cell division, plant growth and morphology. Plant J
24:613–623
Wang H, Jones B, Li Z, Frasse P, Delalande C, Regad F, Chaabouni S, Latche A, Pech J-C,
Bouzayen M (2005) The tomato Aux/IAA transcription factor IAA9 is involved in fruit
development and leaf morphogenesis. Plant Cell 17:2676–2692
Weinl C, Marquardt S, Kuijt SJH, Nowack MK, Jakoby MJ, H€ulskamp M, Schnittger A (2005)
Novel functions of plant Cyclin-Dependent Kinase inhibitors, ICK1/KRP1, can act non-cell-
autonomously and inhibit entry into mitosis. Plant Cell 17:1704–1722
Yadegari R, Drews GN (2004) Female gametophyte development. Plant Cell 16:S133–S141
Yu Y, Steinmetz A, Meyer D, Brown S, Shen WH (2003) The tobacco A-type cyclin, Nicta;
CycA2;3, at the nexus of cell division and differentiation. Plant Cell 15:2763–2777
132 M. Bourdon et al.
- 51 -
PARTIE 3 : Endopolyploïdisation : conséquences
structurales et implications fonctionnelles
3.1. Endopolyploïdisation, différenciation, croissance et modalités
d’action.
Nous avons mentionné lors des parties précédentes de cette introduction que
l’endopolyploïdisation se produit au cours de la croissance et de la différenciation
d’organes ou de lignées cellulaires particulières. Par conséquent, ce phénomène
peut être considéré comme partie intégrante du programme de développement.
Il n’est alors pas surprenant de constater que ce phénomène est régulé par les
mêmes signaux permettant le développement et la différenciation. En effet, dans
l’hypocotyle d’Arabidopsis, les gibbérellines régulent positivement
l’endopolyploïdisation et l’élongation cellulaire, avec des concentrations optimales
différentes (Gendreau et al. 1999). Chez les mégakaryocytes, précurseurs des
plaquettes sanguines, l’endopolyploïdisation et la différenciation sont régulées
positivement via l’action de la thrombopoïétine (Zimmet and Ravid 2000). De même,
l’induction du développement du fruit de tomate est soumise à une régulation
hormonale complexe faisant suite à la pollinisation (Vriezen et al. 2008) et certaines
de ces hormones (gibbérellines) sont à mêmes d’influer sur la ploïdie moyenne du
fruit (Serrani et al. 2007).
L’hypothèse évoquée dans (Bourdon et al. 2010) selon laquelle
l’endopolyploïdisation joue un rôle dans la différenciation cellulaire provient
majoritairement du constat de la mise en place de ce phénomène au sein de cellules
ou d’organes spécialisés (trichome, feuille, fruit). Dans ce cadre, il a été récemment
prouvé que l’endopolyploïdisation a un rôle actif dans le devenir cellulaire des
- 52 -
trichomes chez Arabidopsis (Bramsiepe et al. 2010). L’initiation et la différenciation
des trichomes chez des doubles mutants gl2-gl3 (codant des facteurs de
transcription promouvant l’initiation du trichome) a été partiellement restaurée via la
surexpression de CCS52, gène déterminant dans la régulation et la promotion de
l’endopolyploïdisation (Larson-Rabin et al. 2009, Mathieu-Rivet et al. 2010).
Nous avons aussi évoqué le lien entre endopolyploïdisation et croissance
cellulaire (Bourdon, et al. 2010), en mentionnant la théorie du rapport nucléo-
cytoplasmique arguant pour un équilibre entre quantité d’ADN et volume du
cytoplasme (Sugimoto-Shirasu and Roberts 2003). En augmentant la teneur en ADN,
l’endopolyploïdisation favoriserait la croissance subséquente du cytoplasme et donc
de la cellule. Les mécanismes sous-jacents à cette régulation nucléo-cytoplasmique
sont inconnus, mais une explication pourrait être constituée par le contrôle de la
biogenèse des ribosomes via l’endopolyploïdisation, et donc le nombre d’acteurs
disponibles pour la production de cytoplasme (Sugimoto-Shirasu and Roberts 2003).
Une autre hypothèse intéressante pour expliquer le rôle de
l’endopolyploïdisation dans le développement a été émise par (Anisimov 2005). La
cellule polyploïde y est vue comme un « endoclone oligomérique ». Les fonctions de
plusieurs cellules sont réunies au sein d’une seule à l’organisation unifiée via une
centralisation structurelle et fonctionnelle. Anisimov propose alors
l’endopolyploïdisation comme une simplification du fonctionnement de l’organe via la
centralisation de fonctions cellulaires équivalentes au sein de cellules dont
l’ergonomie et les relations avec son environnement cellulaire proche seraient de fait
optimisées. Cette hypothèse d’ergonomie serait donc en accord avec l’augmentation
de la vitesse de croissance suggérée plus haut, l’organe endopolyploïdisé contenant
des cellules à la fonctionnalité accrue. En ce sens, les avantages conférés par
- 53 -
l’oligomérisation du système cellulaire pourraient alors être considérés comme une
des caractéristiques de la stratégie de croissance liée à la polyploïdie.
Au vu des données évoquées dans les parties précédentes, nous assumons
que les rôles principaux de l’endopolyploïdisation consistent en une implication dans
les phénomènes de croissance et de différenciation cellulaire et que cette implication
passe alors probablement par une action sur le profil d’expression génétique. Nous
aborderons alors un peu plus en détail dans les prochaines parties l’implication de
l’endopolyploïdisation dans l’expression génétique et son organisation structurale à
l’échelle cellulaire et sub-cellulaire en relation avec l’hypothèse d’ergonomie citée ci-
dessus.
3.2. Influence de l’endopolyploïdisation sur l’expression génétique
Le lien entre endopolyploïdie et expression génétique peut être abordé sous
deux angles différents :
3.2.1. Augmentation globale du niveau de transcription via l’amplification
fonctionnelle du génome.
Cet aspect est lié au maintien du rapport nucléo-cytoplasmique. En effet, nous
avons mentionné dans la partie précédente (§ 3.1) que (Sugimoto-Shirasu and
Roberts 2003) proposent le maintien de ce rapport via un contrôle de la biogenèse
des ribosomes pour la production de cytoplasme. Or cette hypothèse ne semble
avoir de sens que si la quantité de transcrits à traduire suit l’augmentation du nombre
de ribosomes. Cette hypothèse d’augmentation du niveau global de la transcription
en corrélation directe avec le niveau de ploïdie a été émise depuis longtemps.
Cependant, peu de travaux l’ont confirmée. (Raslova et al. 2003) ont montré
l’expression de plusieurs loci dupliqués chez les mégakaryocytes. Cette observation,
- 54 -
par extrapolation, permet d’émettre l’hypothèse que si toutes les copies respectives
de chaque gène sont fonctionnelles lors du processus d’endopolyploïdisation, la
quantité globale de transcrits doit varier de façon proportionnelle au niveau de
ploïdie. (Guo et al. 1996) ont quant a eux abordé la question par des approches
quantitatives comparatives de lignées de Maïs haploïde, diploïde, triploïde et
tétraploïde. Ils ont ainsi montré par northern blot une constance des ratios des
quantité ARNr/ADNg, révélant l’amplification fonctionnelle des gènes codant les ARN
ribosomaux, en accord avec l’hypothèse précitée. Ensuite, ils ont aussi pu montrer
que la plupart des niveaux d’expression de 18 gènes candidats présentaient un
niveau de transcrits constant par unité de génome, correspondant donc à une
augmentation proportionnelle de la quantité de transcrits relativement au niveau de
ploïdie.
3.2.2. Endopolyploïdie et régulation de l’expression génétique.
Certains auteurs ont relevé le cas de gènes régulés positivement ou
négativement en fonction du niveau de ploïdie, ouvrant l’hypothèse de la régulation
spécifique de la transcription par la mise en place de la polyploïdie. Cet aspect,
quant à lui, semble plus relié à une implication de l’endopolyploïdie dans les
processus de différenciation, puisqu’influençant directement le profil d’expression
génétique en cours. La publication la plus représentative de ce type de régulation a
été publiée en 1999, chez la levure, par (Galitski et al. 1999) qui, utilisant une
approche par microarrays, ont démontré que certains gènes présentaient une
augmentation ou une diminution de leur niveau d’expression proportionnelle au
niveau de ploïdie. Dans ce cas, et contrairement aux exemples cités dans le
paragraphe précédent, certains gènes ne présentent plus un rapport constant
ARNm/ADN, mais une baisse ou une hausse de ce rapport proportionnelle à la
quantité d’ADN par cellule. Ce travail a aussi suggéré que ces variations spécifiques
- 55 -
d’expression génétique pouvaient expliquer la variation du phénotype avec le niveau
de ploïdie. Plus récemment, (Raslova et al. 2007), en utilisant le même type
d’approche, ont montré que la thrombopoïétine induisait chez des cellules animales
en cultures la mise en place de niveaux de ploïdie avec des profils d’expression
génétique spécifiques associés. De plus, les gènes dont l’expression variait en
fonction du niveau de ploïdie étaient pour la plupart impliqués dans la différenciation
indiquant que le phénomène d’endomitose chez les mégakaryocytes prend
directement part à leur différenciation terminale. En effet, dans cas, la
polyploïdisation promeut l’expression coordonnée de gènes impliqués dans la
production et le fonctionnement des plaquettes sanguines. En revanche, le même
type d’approche menée chez des hépatocytes se polyploïdisant avec l’âge (Lu et al.
2007), n’a pas montré d’implication de ce phénomène dans la différenciation de ces
cellules, les profils d’expression génétique semblant similaires quel que soit le niveau
de ploïdie. La ploïdie semble dans ce cas contribuer à une protection contre les
stress oxydatifs. La régulation du profil d’expression génétique via
l’endopolyploïdisation peut donc être dépendante du modèle considéré. On peut
alors émettre l’hypothèse que la mise en place de l’endopolyploïdisation dans un
organe au cours de l’évolution a pu tisser des liens d’interdépendance plus ou moins
forts avec le programme de développement et de différenciation au cours duquel elle
a lieu. En ce sens, chaque cas d’endopolyploïdisation pourrait avoir une influence
différente sur le profil d’expression génétique. Cependant, les mécanismes par
lesquels l’endopolyploïdisation peut influer sur le programme d’expression génétique
sont encore largement méconnus mais nous donnerons quelques pistes
d’investigation possibles dans le paragraphe suivant.
- 56 -
3.2.3. Spatialisation du génome et expression génétique.
La duplication du génome lors de l’endopolyploïdisation peut revêtir différentes
formes, résultant en différentes conformations chromosomiques, relevant
principalement chez les Eucaryotes de l’endomitose et de l’endoréduplication
(D'Amato 1984, Edgar and Orr-Weaver 2001). Dans le cas de l’endoréduplication, nous
avons évoqué dans (Bourdon, et al. 2010) que la condensation des chromosomes
pouvait être dépendante du type cellulaire. Chez la drosophile, l’état de condensation
des chromosomes polytènes semble provenir d’un alignement plus ou moins
important des chromatides filles conditionné par la phase de l’endocycle et le nombre
d’endocycles, respectivement (Dej and Spradling 1999). Même si l’étude descriptive
du mécanisme d’endopolyploïdisation a été réalisée chez plusieurs modèles
(D'Amato 1984, Therman 1995), peu d’informations sont disponibles quant aux
implications fonctionnelles des modes d’endopolyploïdisation et leurs niveaux de
condensation chromosomique. Nous pouvons cependant émettre un certain nombre
d’hypothèses grâce à certaines données concernant l’interaction entre chromatides
homologues et la spatialisation du génome.
Chez la drosophile, il a été reporté un appariement fréquent des chromosomes
homologues durant l’interphase. De plus ces interactions entre séquences
homologues semblent avoir une influence non négligeable dans l’expression de
certains loci, un processus nommé transvection (Duncan 2002, Tartof and Henikoff
1991). Lors de l’endoréduplication, les chromatides filles peuvent s’aligner sur toute
leur longueur et atteindre un haut de niveau de condensation. Récemment, (Hartl et
al. 2008) ont pu montrer que la surexpression de la condensine II promouvait le
désappariement de ces chromatides chez les chromosomes polytènes de drosophile.
Ces auteurs ont montré que ce désappariement régulait négativement le processus
de transvection, et donc la modulation de l’expression de gènes par appariement
- 57 -
homologue. Chez les plantes, ce processus de transvection n’a, à notre
connaissance, jamais été décrit. De plus, un état de condensation comparable aux
formes les plus condensées des chromosomes polytènes de drosophile n’a pu être
observé, malgré un alignement important des chromosomes polytènes de cellules
géantes d’anthères (Barlow 1975) ou de cellules de suspenseurs embryonnaires
(Carvalheira 2000). Cependant, une étude récente rapporte un appariement
différentiel des chromatides sœurs à différents loci le long du chromosome 1
d’Arabidopsis et le fait que cet appariement diminue avec le niveau de ploïdie
(Schubert et al. 2006). De plus, (Kato and Lam 2003), en utilisant un marquage in
vivo de la GFP à un locus donné, rapportent une plus grande dynamique des loci
taggés au sein des cellules endorédupliquées. Au vu de ces observations, la
compréhension des interactions entre chromatides homologues au sein de cellules
endopolyploïdisées semble importer pour appréhender la régulation de l’expression
génétique lors de la mise en place de ce mécanisme.
Certaines données récentes liées à la notion et à la signification biologique de
territoires chromosomiques peuvent permettre certaines hypothèses quant à
l’influence de la spatialisation du génome au sein de cellules polyploïdes. Les
chromosomes s’organisent dans le volume nucléaire en territoires définis et non
aléatoires (Cremer and Cremer 2006) (Cremer and Cremer 2010). Même si la notion
de territoire chromosomique est aujourd’hui largement acceptée, des différences
d’organisation fonctionnelle subsistent entre les auteurs, donnant lieu à plusieurs
modèles quelque peu différents. Ceci est principalement dû aux résolutions limitées
offertes par la microscopie optique et à la difficulté d’obtenir des données en trois
dimensions à l’aide de la microscopie électronique (Cremer and Cremer 2010). Trois
modèles ont émergé (Branco and Pombo 2007) :
- 58 -
1) Le modèle CT-IC (Chromosome Territories – Inter Chromosome domain ; Figure
6a et 6b) : il propose l’organisation en territoires chromosomiques où les gènes actifs
sont localisés à la périphérie de ces territoires (le domaine interchromosomique,
Figure 6a), devenant alors accessibles aux acteurs de la transcription et de
l’épissage. Le domaine interchromosomique est alors considéré comme un canal ou
les gènes sont transcrits et épissés. Cependant, suite à la démonstration de sites de
transcription actifs au cœur des territoires chromosomiques, ce modèle a évolué vers
une variante territoire chromosomique – domaine interchromatinien (Figure 6b).
L’explication théorique de ce modèle repose alors sur une organisation
ultrastructurale de la chromatine à 2 échelles (domaines de 1Mb eux-mêmes
composés de sous-domaines chromatiniens de 100 kb) (Figure 6b).
2) Le modèle « treillis » (lattice model ; Figure 6c) :
Ce modèle propose une organisation générale de la chromatine en un réseau
enchevêtré de fibres de 10 et 30 nanomètres dans les territoires chromosomiques.
Les canaux interchromatiniens évoqués dans le modèle CT-IC deviennent des zones
d’interactions plus ou moins prononcées aux frontières des territoires
chromosomiques. Il suggère que toutes les zones du maillage ainsi organisé restent
accessibles aux macromolécules par diffusion et que la condensation de la
chromatine en fibres de 30 nanomètres serait suffisante pour réguler l’activité de
gènes en limitant l’accessibilité de la machinerie transcriptionnelle à l’intérieur de la
fibre. Ainsi, ce modèle se passe d’une super-organisation en sous-domaines de 100
kb évoqué plus haut.
3) Le modèle réseau interchromatinien (ICN, Inter-Chromatin Network ; Figure 6c) :
Il laisse un peu de côté la notion de différences ultrastructurales entre chromatine
active et inactive pour se concentrer sur l’influence des processus de transcription
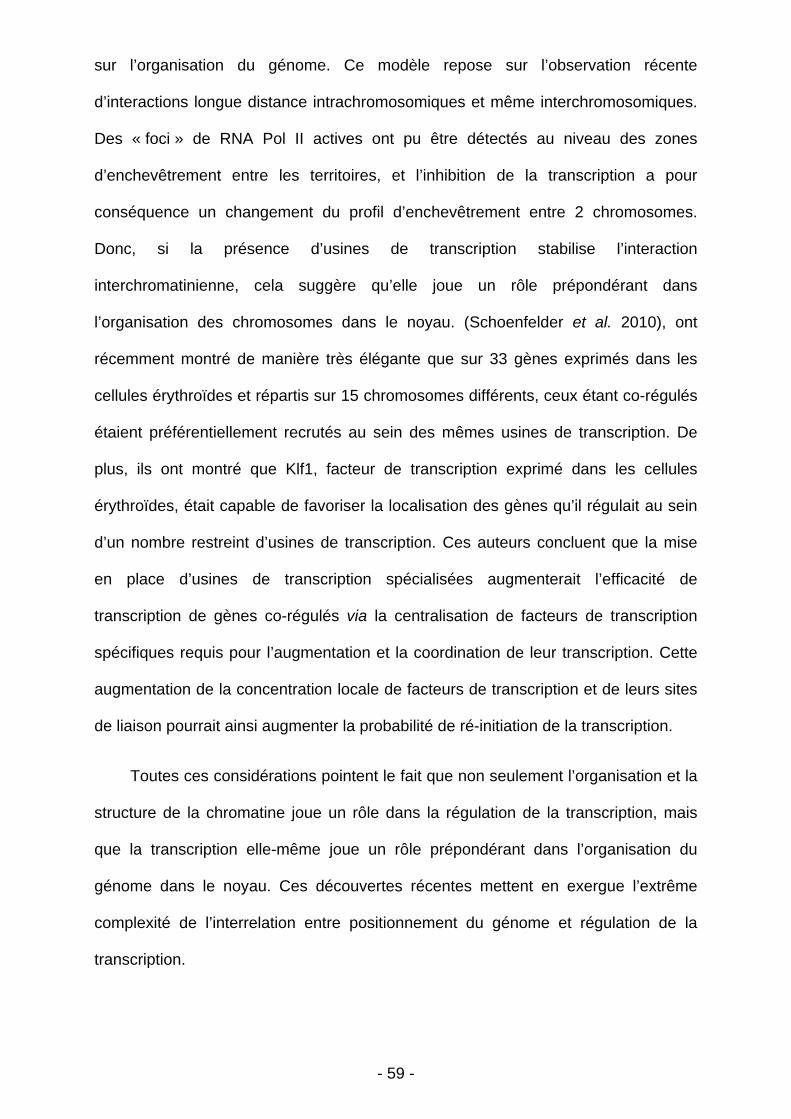
- 59 -
sur l’organisation du génome. Ce modèle repose sur l’observation récente
d’interactions longue distance intrachromosomiques et même interchromosomiques.
Des « foci » de RNA Pol II actives ont pu être détectés au niveau des zones
d’enchevêtrement entre les territoires, et l’inhibition de la transcription a pour
conséquence un changement du profil d’enchevêtrement entre 2 chromosomes.
Donc, si la présence d’usines de transcription stabilise l’interaction
interchromatinienne, cela suggère qu’elle joue un rôle prépondérant dans
l’organisation des chromosomes dans le noyau. (Schoenfelder et al. 2010), ont
récemment montré de manière très élégante que sur 33 gènes exprimés dans les
cellules érythroïdes et répartis sur 15 chromosomes différents, ceux étant co-régulés
étaient préférentiellement recrutés au sein des mêmes usines de transcription. De
plus, ils ont montré que Klf1, facteur de transcription exprimé dans les cellules
érythroïdes, était capable de favoriser la localisation des gènes qu’il régulait au sein
d’un nombre restreint d’usines de transcription. Ces auteurs concluent que la mise
en place d’usines de transcription spécialisées augmenterait l’efficacité de
transcription de gènes co-régulés via la centralisation de facteurs de transcription
spécifiques requis pour l’augmentation et la coordination de leur transcription. Cette
augmentation de la concentration locale de facteurs de transcription et de leurs sites
de liaison pourrait ainsi augmenter la probabilité de ré-initiation de la transcription.
Toutes ces considérations pointent le fait que non seulement l’organisation et la
structure de la chromatine joue un rôle dans la régulation de la transcription, mais
que la transcription elle-même joue un rôle prépondérant dans l’organisation du
génome dans le noyau. Ces découvertes récentes mettent en exergue l’extrême
complexité de l’interrelation entre positionnement du génome et régulation de la
transcription.
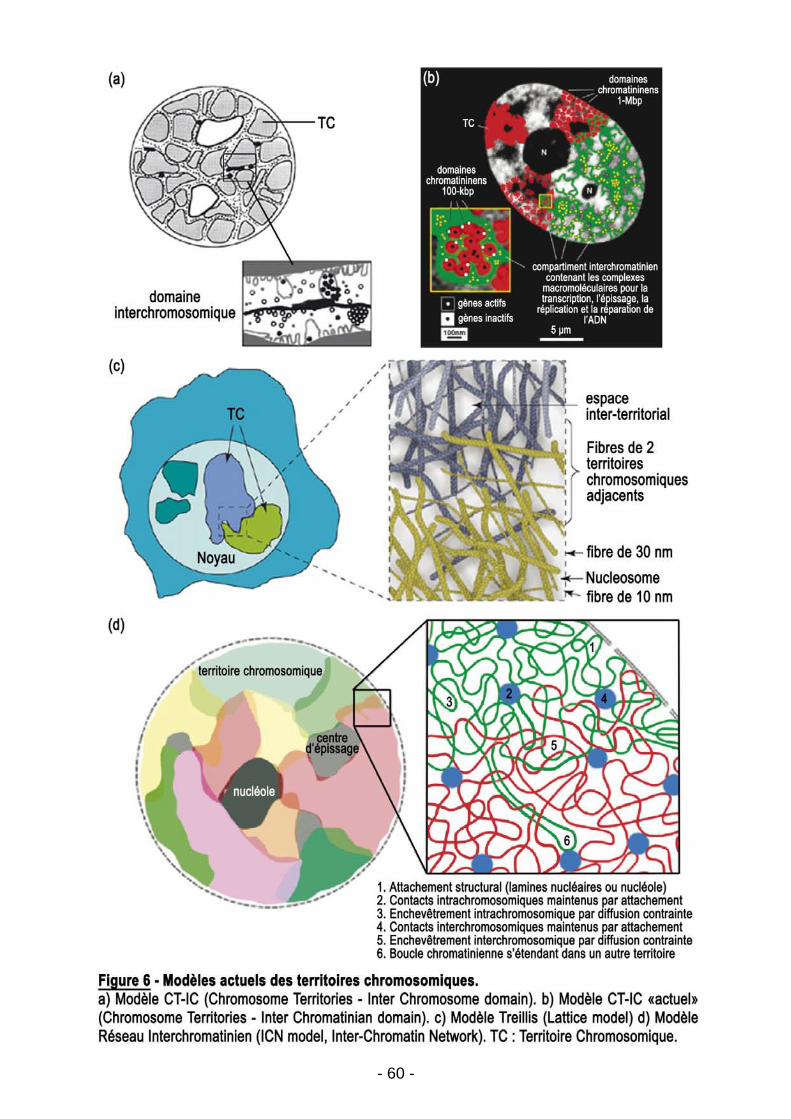
- 60 -
- 61 -
Partant de ce constat, l’endopolyploïdisation pourrait donc ne pas seulement
avoir un simple effet quantitatif sur la transcription, en relation directe avec le nombre
d’endocycles. L’endomitose, avec l’augmentation du nombre de chromosomes à
chaque endocycle, et l’endoréduplication, produisant des chromosomes polytènes,
pourraient avoir des impacts différents sur l’organisation chromosomique dans le
noyau et donc sur la régulation qualitative de la transcription. A priori, la structure
polytène présenterait un avantage au vu de l’hypothèse de centralisation des
fonctions émise par Anisimov (2005). En effet, si toutes les chromatides sœurs sont
proches dans l’espace, le recrutement d’un gène au sein d’une usine de transcription
semble plus facile à mettre en œuvre. Ainsi, récemment (Berr and Schubert 2007)
ont pu montrer que l’organisation en territoires chromosomiques était maintenu
durant le processus d’endoréduplication chez Arabidopsis. On peut alors se
demander si les gènes dupliqués sont recrutés au sein de « super-usines » de
transcription (cf. modèle ICN ci-dessus). L’existence de telles usines irait dans le
sens d’une centralisation des mécanismes de transcription et de leurs mécanismes
de régulation, pouvant ainsi améliorer l’ergonomie de fonctionnement du noyau.
Toutes ces observations pointent donc le fait que les interactions entre
chromatides, la spatialisation du génome sont autant de données à prendre à
compte pour appréhender les mécanismes d’endopolyploïdisation et leur rôle dans
l’expression génétique.
- 62 -
3.3. Caractéristiques cellulaires de la cellule polyploïde
3.3.1. Organisation et différenciation de l’enveloppe nucléaire lors de
l’endopolyploïdisation
L’organisation et le fonctionnement dynamique du génome dépendent
étroitement des échanges entre le cytoplasme et le noyau. A ce titre, il semble donc
intéressant de considérer aussi l’impact possible de l’endopolyploïdie sur l’enveloppe
nucléaire et l’organisation cytoplasmique.
L’enveloppe nucléaire est une double membrane constituée de la membrane
nucléaire interne et de la membrane nucléaire externe. Un autre système
membranaire spécifique, opérant la jonction entre ces deux membranes au niveau
des pores nucléaires, a aussi pu être identifié (Evans et al. 2009). Elle crée un
environnement biochimique distinct du cytoplasme, et offre une surface d’ancrage de
la chromatine (Rose et al. 2004) et jouerait un rôle important dans la régulation de
l’expression génétique (Akhtar and Gasser 2007). La membrane nucléaire régule
aussi les échanges avec le cytoplasme grâce à une structure protéique complexe, le
pore nucléaire, composé d’environ trente polypeptides différents pour un poids
moléculaire total de 40 à 70 MDa et entouré de la membrane du pore. Celui-ci forme
un canal aqueux de 40 nm de diamètre par lequel les petites molécules (masse < 20-
40 kDa) diffusent librement, alors que les molécules plus grosses sont transportées
via des processus actifs et signaux-dépendants (Brandizzi et al. 2004, Hetzer 2010).
Les principaux mouvements du nucléoplasme vers le cytoplasme concernent des
ARNm, des ARNt et des protéines, et ceux du cytoplasme vers le noyau consistent
majoritairement en l’import de protéines nucléaires. Des motifs spécifiques d’acides
aminés déterminent la capacité à l’importation ou à l’exportation nucléaire (Brandizzi,
et al. 2004).
- 63 -
L’étude de l’enveloppe nucléaire végétale a moins progressé que celle de son
pendant animal. Plusieurs caractéristiques différencient ces deux enveloppes. Tout
d’abord, les lamines, famille de protéines nucléaires formant un réseau enchevêtré
de fibres sur la face interne de l’enveloppe nucléaire des métazoaires et permettant
l’accrochage de la chromatine, semblent absentes chez les végétaux et les levures.
La microscopie électronique a révélé la présence de structures similaires chez les
plantes supérieures (Rose, et al. 2004). De plus, les plantes ne possèdent pas de
centrosomes clairement défini, le rôle de centre organisateur de microtubules
(« MTOC », « microtubule organizing center »), présent chez lez animaux, semblant
assuré par l’enveloppe nucléaire (Meier 2007).
Durant la différenciation, il a été montré que la membrane nucléaire pouvait
subir d’importantes modifications chez les animaux et chez les végétaux. Chez les
animaux, (Fricker et al. 1997) ont montré la présence de nombreuses invaginations,
ou canaux membranaires dérivés du réticulum endoplasmique, pouvant traverser
tout le noyau. Chez les végétaux, (Collings et al. 2000) ont aussi révélé la présence
de profonds sillons et d’invaginations chez les noyaux de cellules d’épiderme
d’oignon et de la lignée cellulaire BY-2 de tabac. Le terme « invagination », désignait
ici des structures semblables à celles décrites par Fricker, à savoir de profonds
canaux tubulaires dérivés du RE. Ils ont aussi pu co-localiser ces invaginations avec
des filaments d’actine. Cependant, l’apparition de ces sillons ne semble pas
dépendante de la polymérisation des fibres d’actine, car elle se maintient en
présence de cytochalasine D, drogue dépolymérisante des filaments d’actine. Dans
cette étude (Collings, et al. 2000), ces structures se sont révélées stables dans le
temps, contrairement aux observations de Fricker et al. (1997), et aux changements
de forme des noyaux observés chez Arabidopsis (Chytilova et al. 2000). Expliquant
la fonctionnalité de ces invaginations par une augmentation de la surface d’échange
et par l’export putatif d’ARN via les fibres d’actine observées, Collings et al. (2000)
- 64 -
suggèrent la concomitance de ce phénomène avec l’endopolyploïdisation, car la
mise en place de ces invaginations, comme l’endopolyploïdisation, semble réservée
à certains types cellulaires. Cependant, cette suggestion n’a pas encore été vérifiée,
et très peu de données existent quant à l’influence de l’endopolyploïdie sur
l’ultrastructure du noyau. Les seules observations notables sur la structure des
noyaux durant l’endopolyploïdisation proviennent du modèle des cellules du
trophoblaste des mammifères, où le noyau endorédupliqué subit un phénomène
particulier de dépolyploïdisation en se subdivisant en plusieurs sous-structures
(Zybina and Zybina 2008).
3.3.2. Organisation et évolution du cytoplasme en relation avec
l’endopolyploïdie
Si beaucoup d’études font état de la régulation fine du rapport nucléo-
cytoplasmique chez les animaux, peu de données existent quant à ce phénomène
chez les plantes, du fait de la difficulté à mesurer le volume cytoplasmique, qui
découle de l’importance et de la variabilité du compartiment vacuolaire chez les
cellules végétales (Sugimoto-Shirasu and Roberts 2003).
Si le volume du cytoplasme suit la quantité d’ADN selon l’hypothèse du rapport
nucléo-cytoplasmique, la question se pose de l’évolution des organelles lors de la
croissance cytoplasmique. En effet, les mitochondries et les chloroplastes sont le
siège de fonctions physiologiques majeures comme la respiration, la photosynthèse,
ainsi que des programmes d’expression génétique coordonnés avec ceux du noyau.
On peut donc s’attendre à ce que leur population, leur volume ou leur contenu en
ADN s’adapte au niveau de ploïdie nucléaire au cours de la croissance cellulaire.
Peu de données sont disponibles à ce sujet. (Raynaud et al., 2005) ont montré la
présence d’une régulation commune aux divisions cellulaire et plastidiale, en
montrant que la diminution d’expression du gène AtCDT1 affectait ces 2 processus.
- 65 -
(Schwacke et al. 2007) ont révélé récemment la présence de facteurs de
transcription à double localisation, nucléaire et plastidiale, ou nucléaire et
mitochondriale, ce qui constitue un argument en faveur d’une coordination dans la
régulation de l’expression génétique au sein de ces organelles.
Nous avons déjà évoqué l’hypothèse d’un apport de l’endopolyploïdie à la
croissance cellulaire et tissulaire via une centralisation des fonctions au sein d’une
seule cellule. Dans ce cas on peut se demander si le gain d’ergonomie
potentiellement acquis dans la cellule polyploïde passe par une structuration
cytoplasmique particulière. Il a été évoqué plus haut la présence de filaments
d’actine au sein de replis membranaires du noyau chez l’oignon et une relation
putative de ces structures avec l’endopolyploïdie (Collings, et al. 2000). Or, il a été
que la myosine XI est fortement impliquée dans la motilité des organelles tel que le
réticulum endoplasmique, l’appareil de golgi, les peroxysomes, les mitochondries et
le noyau lui-même (cité par (Thomas et al. 2009)). Dans ce cas, y-a-t-il des
interactions privilégiées entre le noyau polyploïde et son cytoplasme environnant,
interactions notamment opérées via le cytosquelette ? En effet, il a déjà été rapporté
chez le tabac des rapprochements et même un regroupement des plastes autour de
l’enveloppe nucléaire, rapprochement supposé améliorer les interactions
fonctionnelles entre ces organelles. De plus, les plastes ont été co-localisés avec les
repliements de l’enveloppe nucléaire (Kwok and Hanson 2004). Cependant, à ce
jour, aucune étude n’a mis en évidence un lien entre polyploïdie et la mise en place
d’une organisation spécifique du cytoplasme de la cellule polyploïde et plus
particulièrement à proximité du noyau.
- 66 -
3.4. Objectifs du travail de thèse
Nous avons souligné la forte représentation de l’endopolyploïdisation chez les
Eucaryotes au sein de nombreux tissus, et mis en avant l’importance que pourrait
jouer ce mécanisme, en particulier durant le développement du fruit, via une
probable implication dans la croissance et la différenciation cellulaire. Son implication
dans la croissance cellulaire chez la tomate a entre autres été démontré en révélant
une corrélation positive entre taille cellulaire moyenne et ploïdie moyenne au sein de
20 fonds génétiques différents (Cheniclet et al. 2005). De plus, cette étude a aussi
mis en avant une corrélation positive entre le poids moyen du fruit et la taille
cellulaire moyenne dans le péricarpe. Afin d’aller plus loin dans la compréhension de
ce mécanisme et de son implication dans le développement et la différenciation du
fruit de tomate, nous avons réalisé une étude à différentes échelles en définissant 2
axes principaux de ce travail :
I – Etude de l’endopolyploïdisation à l’échelle cellulaire et sub-cellulaire :
implication dans la croissance, la différenciation cellulaire et intégration
dans le développement du péricarpe.
Comme il a été mentionné au cours de cette introduction, les thématiques de
croissance cellulaire et de différenciation ont souvent été mises en lien avec le
phénomène d’endopolyploïdisation. Cependant, il existe peu d’études faisant cas de
l’établissement de liens directs entre niveau de ploïdie et taille cellulaire (Cebolla et
al. 1999, Gendreau et al. 1997, Kudo and Kimura 2002, Lee et al. 2004, Melaragno
et al. 1993). De plus, il n’existe pas, à notre connaissance, d’étude mettant en lien
endopolyploïdie et phénotype cellulaire, tant sur les aspects organisationnels que sur
les aspects de différenciation interne de la cellule. C’est dans cet objectif qu’une
mise au point d’un outil de détermination de la ploïdie in situ a été réalisée dans ce
travail. Cet outil nous a permis d’étudier la ploïdie directement dans son contexte
- 67 -
cellulaire et ainsi d’étudier finement les caractères liés à l’endopolyploïdisation. Un
intérêt particulier a été porté sur l’étude structurale et son environnement. De même,
nous avons voulu améliorer grâce cette méthode nos connaissances concernant la
mise en place de l’endopolyploïdisation à l’échelle tissulaire, et ainsi mieux
appréhender son intégration dans le programme de développement du fruit.
II) Impact des variations de ploïdie sur le développement du fruit :
implication dans la croissance cellulaire et la cinétique de développement
du fruit.
Nous avons aussi mis en avant lors de cette introduction (Bourdon, et al. 2010)
une hypothèse relativement récente concernant le rôle de l’endopolyploïdisation
dans la vitesse de croissance (Barow 2006, Barow and Meister 2003). Afin de tester
l’influence du niveau de ploïdie sur ce paramètre, nous avons alors cherché, au sein
d’une population de lignées génétiquement proches, des plantes présentant des
fruits affectées dans le niveau de ploïdie. Pour ce faire, nous avons entrepris le
criblage d’une banque de mutants EMS de tomate (cv Micro-Tom) afin d’isoler des
mutants présentant des profils de ploïdie altérés dans le but d’étudier leur cinétique
de croissance cellulaire et organismique.
- 68 -
REFERENCES INTRODUCTION PARTIE 3
Akhtar, A. and Gasser, S.M. (2007) The nuclear envelope and transcriptional
control. Nat Rev Genet, 8, 507-517.
Anisimov, A.P. (2005) Endopolyploidy as a morphogenetic factor of development.
Cell Biology International, 29, 993-1004.
Barlow, P.W. (1975) The polytene nucleus of the giant hair cell
of<i>Bryonia</i> anthers. Protoplasma, 83, 339-349.
Barow, M. (2006) Endopolyploidy in seed plants. BioEssays, 28, 271-281.
Barow, M. and Meister, A. (2003) Endopolyploidy in seed plants is differently
correlated to systematics, organ, life strategy and genome size. Plant Cell and
Environment, 26, 571-584.
Berr, A. and Schubert, I. (2007) Interphase Chromosome Arrangement in
Arabidopsis thaliana Is Similar in Differentiated and Meristematic Tissues and
Shows a Transient Mirror Symmetry After Nuclear Division. Genetics, 176,
853-863.
Bourdon, M., Frangne, N., Mathieu-Rivet, E., Nafati, M., Cheniclet, C., Renaudin,
J.-P. and Chevalier, C. (2010) Endoreduplication and Growth of Fleshy
Fruits. In Progress in Botany 71, pp. 101-132.
Bramsiepe, J., Wester, K., Weinl, C., Roodbarkelari, F., Kasili, R., Larkin, J.C.,
Hülskamp, M. and Schnittger, A. (2010) Endoreplication Controls Cell Fate
Maintenance. PLoS Genet, 6, e1000996.
Branco, M.R. and Pombo, A. (2007) Chromosome organization: new facts, new
models. Trends in Cell Biology, 17, 127-134.
Brandizzi, F., Irons, S.L. and Evans, D.E. (2004) The plant nuclear envelope: new
prospects for a poorly understood structure. New Phytologist, 163, 227-246.
Carvalheira, G.M.G. (2000) Plant polytene chromosomes. Genetics and Molecular
Biology, 23, 1043-1050.
Cebolla, A., Maria Vinardell, J., Kiss, E., Olah, B., Roudier, F., Kondorosi, A. and
Kondorosi, E. (1999) The mitotic inhibitor ccs52 is required for
- 69 -
endoreduplication and ploidy-dependent cell enlargement in plants. EMBO J,
18, 4476-4484.
Cheniclet, C., Rong, W.Y., Causse, M., Frangne, N., Bolling, L., Carde, J.-P. and
Renaudin, J.-P. (2005) Cell Expansion and Endoreduplication Show a Large
Genetic Variability in Pericarp and Contribute Strongly to Tomato Fruit Growth.
Plant Physiol., 139, 1984-1994.
Chytilova, E., Macas, J., Sliwinska, E., Rafelski, S.M., Lambert, G.M. and
Galbraith, D.W. (2000) Nuclear Dynamics in Arabidopsis thaliana. Mol. Biol.
Cell, 11, 2733-2741.
Collings, D.A., Carter, C.N., Rink, J.C., Scott, A.C., Wyatt, S.E. and Allen, N.S.
(2000) Plant Nuclei Can Contain Extensive Grooves and Invaginations. Plant
Cell, 12, 2425-2440.
Cremer, T. and Cremer, C. (2006) Rise, fall and resurrection of chromosome
territories: a historical perspective Part II. Fall and resurrection of chromosome
territories during the 1950S to 1980s. Part III. Chromosome territories and the
functional nuclear architecture: experiments and models from the 1990s to the
present. European Journal of Histochemistry, 50, 223-272.
Cremer, T. and Cremer, M. (2010) Chromosome Territories. Cold Spring Harbor
Perspectives in Biology, 2.
D'Amato (1984) Role of polyploidy in reproductive organs and tissues. Embryology
of angiosperms, 519-566.
Dej, K.J. and Spradling, A.C. (1999) The endocycle controls nurse cell polytene
chromosome structure during Drosophila oogenesis. Development, 126, 293-
303.
Duncan, I.W. (2002) Transvection effects in Drosophila. Annual Review of Genetics,
36, 521-556.
Edgar, B.A. and Orr-Weaver, T.L. (2001) Endoreplication Cell Cycles: More for
Less. Cell, 105, 297-306.
Evans, D., Graumann, S.L.I.K. and Runions, J. (2009) The Plant Nuclear
Envelope. In Functional Organization of the Plant Nucleus, pp. 9-28.
- 70 -
Fricker, M., Hollinshead, M., White, N. and Vaux, D. (1997) Interphase Nuclei of
Many Mammalian Cell Types Contain Deep, Dynamic, Tubular Membrane-
bound Invaginations of the Nuclear Envelope. The Journal of Cell Biology,
136, 531-544.
Galitski, T., Saldanha, A.J., Styles, C.A., Lander, E.S. and Fink, G.R. (1999)
Ploidy Regulation of Gene Expression. Science, 285, 251-254.
Gendreau, E., Orbovic, V., Höfte, H. and Traas, J. (1999) Gibberellin and ethylene
control endoreduplication levels in the <i>Arabidopsis thaliana</i>
hypocotyl. Planta, 209, 513-516.
Gendreau, E., Traas, J., Desnos, T., Grandjean, O., Caboche, M. and Hofte, H.
(1997) Cellular Basis of Hypocotyl Growth in Arabidopsis thaliana. Plant
Physiol., 114, 295-305.
Guo, M., Davis, D. and Birchler, J.A. (1996) Dosage Effects on Gene Expression in
a Maize Ploidy Series. Genetics, 142, 1349-1355.
Hartl, T.A., Smith, H.F. and Bosco, G. (2008) Chromosome Alignment and
Transvection Are Antagonized by Condensin II. Science, 322, 1384-1387.
Hetzer, M.W. (2010) The Nuclear Envelope. Cold Spring Harbor Perspectives in
Biology, 2, Article No.: a000539.
Kato, N. and Lam, E. (2003) Chromatin of endoreduplicated pavement cells has
greater range of movement than that of diploid guard cells in Arabidopsis
thaliana. J Cell Sci, 116, 2195-2201.
Kudo, N. and Kimura, Y. (2002) Nuclear DNA endoreduplication during petal
development in cabbage: relationship between ploidy levels and cell size. J.
Exp. Bot., 53, 1017-1023.
Kwok, E.Y. and Hanson, M.R. (2004) Plastids and stromules interact with the
nucleus and cell membrane in vascular plants. Plant Cell Reports, 23, 188-
195.
Larson-Rabin, Z., Li, Z., Masson, P.H. and Day, C.D. (2009) FZR2/CCS52A1
Expression Is a Determinant of Endoreduplication and Cell Expansion in
Arabidopsis. Plant Physiol., 149, 874-884.
- 71 -
Lee, H.-C., Chiou, D.-W., Chen, W.-H., Markhart, A.H., Chen, Y.-H. and Lin, T.-Y.
(2004) Dynamics of cell growth and endoreduplication during orchid flower
development. Plant Science, 166, 659-667.
Lu, P., Prost, S., Caldwell, H., Tugwood, J., Betton, G. and Harrison, D. (2007)
Microarray analysis of gene expression of mouse hepatocytes of different
ploidy. Mammalian Genome, 18, 617-626.
Mathieu-Rivet, E., Gevaudant, F., Sicard, A., Salar, S., Do, P.T., Mouras, A.,
Fernie, A.R., Gibon, Y., Rothan, C., Chevalier, C. and Hernould, M. (2010)
Functional analysis of the anaphase promoting complex activator CCS52A
highlights the crucial role of endo-reduplication for fruit growth in tomato. Plant
Journal, 62, 727-741.
Meier, I. (2007) Composition of the plant nuclear envelope: theme and variations.
Journal of Experimental Botany, 58, 27-34.
Melaragno, J.E., Mehrotra, B. and Coleman, A.W. (1993) Relationship between
Endopolyploidy and Cell Size in Epidermal Tissue of Arabidopsis. Plant Cell,
5, 1661-1668.
Raslova, H., Kauffmann, A., Sekkai, D., Ripoche, H., Larbret, F., Robert, T., Le
Roux, D.T., Kroemer, G., Debili, N., Dessen, P., Lazar, V. and
Vainchenker, W. (2007) Interrelation between polyploidization and
megakaryocyte differentiation: a gene profiling approach. Blood, 109, 3225-
3234.
Raslova, H., Roy, L., Vourc'h, C., Le Couedic, J.P., Brison, O., Metivier, D.,
Feunteun, J., Kroemer, G., Debili, N. and Vainchenker, W. (2003)
Megakaryocyte polyploidization is associated with a functional gene
amplification. Blood, 101, 541-544.
Raynaud, C., Perennes, C., Reuzeau, C., Catrice, O., Brown, S. and
Bergounioux, C. (2005) Cell and plastid division are coordinated through the
prereplication factor AtCDT1. Proceedings of the National Academy of
Sciences of the United States of America, 102, 8216-8221.
Rose, A., Patel, S. and Meier, I. (2004) The plant nuclear envelope. Planta, 218,
327-336.
- 72 -
Schoenfelder, S., Sexton, T., Chakalova, L., Cope, N.F., Horton, A., Andrews, S.,
Kurukuti, S., Mitchell, J.A., Umlauf, D., Dimitrova, D.S., Eskiw, C.H., Luo,
Y., Wei, C.-L., Ruan, Y., Bieker, J.J. and Fraser, P. (2010) Preferential
associations between co-regulated genes reveal a transcriptional interactome
in erythroid cells. Nat Genet, 42, 53-61.
Schubert, V., Klatte, M., Pecinka, A., Meister, A., Jasencakova, Z. and Schubert,
I. (2006) Sister Chromatids Are Often Incompletely Aligned in Meristematic
and Endopolyploid Interphase Nuclei of Arabidopsis thaliana. Genetics, 172,
467-475.
Schwacke, R., Fischer, K., Ketelsen, B., Krupinska, K. and Krause, K. (2007)
Comparative survey of plastid and mitochondrial targeting properties of
transcription factors in Arabidopsis and rice. Molecular Genetics and
Genomics, 277, 631-646.
Serrani, J., Fos, M., Atarés, A. and García-Martínez, J. (2007) Effect of Gibberellin
and Auxin on Parthenocarpic Fruit Growth Induction in the cv Micro-Tom of
Tomato. Journal of Plant Growth Regulation, 26, 211-221.
Sugimoto-Shirasu, K. and Roberts, K. (2003) "Big it up": endoreduplication and
cell-size control in plants. Current Opinion in Plant Biology, 6, 544-553.
Tartof, K.D. and Henikoff, S. (1991) Trans-sensing effects from Drosophila to
humans. Cell, 65, 201-203.
Therman, E. (1995) Chromosome behavior in cell differentiation: a field ripe for
exploration? Genetics, 141, 799-804.
Thomas, C., Tholl, S., Moes, D., Dieterle, M., Papuga, J., Moreau, F. and
Steinmetz, A. (2009) Actin bundling in plants. Cell Motility and the
Cytoskeleton, 66, 940-957.
Vriezen, W.H., Feron, R., Maretto, F., Keijman, J. and Mariani, C. (2008) Changes
in tomato ovary transcriptome demonstrate complex hormonal regulation of
fruit set. New Phytologist, 177, 60-76.
Zimmet, J. and Ravid, K. (2000) Polyploidy: Occurrence in nature, mechanisms,
and significance for the megakaryocyte-platelet system. Experimental
hematology, 28, 3-16.
- 73 -
Zybina, E.V. and Zybina, T.G. (2008) Modifications of nuclear envelope during
differentiation and depolyploidization of rat trophoblast cells. Micron, 39, 593-
606.

- 74 -
CHAPITRE 2 : RESULTATS
- 75 -
PARTIE 1 : ARTICLE 1
In planta quantification of endoreduplication
using Fluorescent In Situ Hybridization (FISH)
Matthieu Bourdon1,2, Olivier Coriton3, Catherine Cheniclet1,2, Spencer Brown4,
Christel Poujol5, Christian Chevalier1,*, Jean-Pierre Renaudin2 and Nathalie Frangne2
1 Institut National de la Recherche Agronomique (INRA), Unité Mixte de Recherche
619 sur la Biologie du Fruit, BP 81, F-33883 Villenave d'Ornon cedex, France;
2 Université Bordeaux 1, Unité Mixte de Recherche 619 sur la Biologie du Fruit, BP
81, F-33883 Villenave d'Ornon cedex, France;
3 Institut National de la Recherche Agronomique (INRA), Unité Mixte de Recherche
118 d’Amélioration des Plantes et Biotechnologies Végétales, BP 35327, F-35653 Le
Rheu cedex, France.
4 Centre National de la Recherche Scientifique (CNRS), Institut des Sciences du
Végétal, UPR 2355, bâtiment 23/24; F-91198 Gif-sur-Yvette, France
5 Université V. Segalen Bordeaux 2, Photonic Imaging Platform of BIC (Bordeaux
Imaging Center), Institut des neurosciences François Magendie, Université V
Segalen Bordeaux2, 33077 Bordeaux edex, France
* Author for correspondence: Christian Chevalier
Institut National de la Recherche Agronomique (INRA), Université de Bordeaux,
Unité Mixte de Recherche 619 sur la Biologie du Fruit, BP 81, F-33883 Villenave
d'Ornon Cedex, France
Tel: +33 557122693; Fax: +33 557122541; e-mail: [email protected]
- 76 -
Running title: In situ endoreduplication assessment for plant nuclei
Key words: Endoreduplication, polyteny, pericarp, nuclei, FISH, Tomato
ABSTRACT
Endopolyploidy, i.e. amplification of the genome in absence of mitosis, occurs in
many plant species and goes along with organ and cell differentiation. Deciphering
the functional roles of endopolyploidy is hampered by the fact that polyploid tissues
generally comprise cells with various ploidy levels. In some fleshy fruits (amongst
them tomato fruit) the ploidy levels present at the end of development range from 2C
to 256C in the same tissue.
For investigating the temporal and spatial distribution of endopolyploidy it is
necessary to address the DNA content of individual nuclei in situ. Conventional
methods such as fluorometry or densitometry can be used for some tissues
displaying favorable characteristics: small cells, small nuclei, organization in
monolayer. But high levels of varying polyploidy are usually associated with large
sizes of nuclei and cells, in a complex 3D-organization of the tissues. The
conventional methods are inadequate for such tissue, becoming semi-quantitative
and imprecise.
We have developed a new method based on BAC-FISH that allows the in situ
determination of DNA ploidy level of individual nuclei. This method relies on the
counting of hybridization signals and not on intensity measurements and is expected
to provide an alternative method to map endopolyploidy patterns in mature, 3-D
organized plant tissues as illustrated by the analysis of ploidy level and cell size in
pericarp from tomato mature green fruit.
- 77 -
INTRODUCTION
Endopolyploidy is a widespread process which corresponds to the amplification of
the genome in absence of mitosis. It can be restricted to certain cell types or tissues
but most of the differentiated cells in numerous higher plant species undergo several
rounds of DNA synthesis leading to endopolyploidy (Nagl, 1975). Endopolyploidy has
been described to be associated with increased gene expression (Galitski et al.,
1999; Raslova et al., 2003) and increased cell growth (Lee et al., 2009). In plants, a
strong correlation between cell size and endoreduplication has been reported in a
broad range of species (Melaragno et al., 1993; Gendreau et al., 1998; Vilhar et al.,
2002; Cheniclet et al., 2005; Jovtchev et al., 2006; Bourdon et al., 2010).
Deciphering the functional roles of endopolyploidy is hampered by the fact that
polyploid tissues are often made of cells with various degrees of endopolyploidy (e.g.
in tomato fruit; Cheniclet et al., 2005). The extent of this mechanism is often
assessed by global methods such as flow cytometry, which describes the frequency
distribution of the different ploidy classes of nuclei present in a tissue, but does not
provide any information on the tissue-specific localization of these nuclei. Therefore
linking the ploidy level of each individual nucleus to its cellular and tissular
environment is hardly possible.
Since endopolyploidy is involved in organ and cell differentiation and in many
developmental and physiological processes (Lee et al., 2009), investigating the
temporal and spatial distribution of this phenomenon in a tissue is an important step
towards understanding its role. It is therefore necessary to address the DNA content
of individual nuclei in situ.
Two kinds of methods are available to measure the DNA content of individual
nuclei in vivo: densitometry and fluorometry. Both methods are based on DNA
staining, the former one using Schiff’s reagent according to the Feulgen reaction
(Greilhuber, 2008) and the latter using a fluorochrome such as 4',6-diamino-2-
- 78 -
phenylindole (DAPI) or propidium iodide (Dolezel and Bartos, 2005; Johnston et al.,
1999). In both cases the signal can be quantified either by a photometer equipped
with diaphragms suited to the nuclear size (photometric cytometry) or by analysis of
images generally acquired with a CCD camera (image cytometry).
In the Feulgen method the DNA content is proportional to the nuclear absorbance
(or optical density) calculated from measurement of the transmitted light intensity.
The use of the Feulgen method requires a strict standardization of sample
preparation and staining procedure and a precise calibration of the instrument in
order to guarantee reliable measurements of DNA amounts (Vilhar and Desmastia,
2002). The Feulgen method is widely used in medical sciences for diagnostic
purposes (Haroske et al., 1998). In plant sciences it has been used mainly for the
determination of plant genome size (Bennett and Leitch, 1995) and now tends to be
replaced by flow cytometry. The determination of genome size was usually
performed on isolated nuclei or on meristematic tissues suitable for squash
preparations, allowing the obtention of a monolayer of cells on a microscope glass
slide. This method cannot be applied if the maintenance of tissue integrity is required
for a spatial localization of the observed nuclei. Few studies report simultaneous
measurement of ploidy level by Feulgen densitometry and spatial localization of the
observed nuclei in “intact” tissues, such as maize caryopsis (Vilhar et al., 2002;
Dermastia et al., 2009) or sorghum caryopsis (Kladnik et al., 2006). In the latter case
the measurements were made using 20 µm paraffin sections, i.e. thick enough to
contain whole nuclei (5-20 µm in diameter).
In the fluorometric method, the DNA content is estimated from the intensity of
fluorescence emitted by the stained nuclei. The in situ measurement of ploidy levels
was achieved in Arabidopsis leaf and hypocotyls-epidermis, using a
microspectrofluorometer (Melaragno et al., 1993). The fluorometric method was also
used in combination with image analysis, to measure directly the relative nuclear
- 79 -
DNA content of individual cells from DAPI-stained Arabidopsis hypocotyls in situ
(Gendreau et al., 1998) or in Arabidopsis meristematic cells treated with different
drugs (Grandjean et al., 2004). So far the in situ measurement of ploidy levels by
densitometric or fluorometric methods has been applied only to young tissues with
small cells and nuclei, either in monolayers or in paraffin sections.
In fleshy fruits of many species, very high ploidy levels (256C) are reached at the
end of fruit development, concomitant with very large cell sizes (Bourdon et al.,
2010). As a consequence the above-mentioned methods may not be appropriate to
perform in situ measurements of ploidy levels in fully developed fruit tissues in which
cell and nuclear size can range over two orders due to endopolyploidy.
In order to investigate endopolyploidy in tomato fruit at the cellular level, we have
developed a new method based on fluorescent in situ hybridization (FISH) that allows
a direct determination of in situ DNA ploidy level of individual nuclei. This method is
based on the counting of hybridization signals, and it is therefore free from
constraints related to measurement of staining intensities. It is thus expected to
provide an alternative way to densitometric and fluorometric methods to analyze
endopolyploidy patterns in mature differentiated, 3-D organized plant tissues. We
applied this method to map ploidy level in pericarp from mature green fruit. Our
results indicate that ploidy level is not only dependent on cell size but also relies on
cell position within the pericarp.
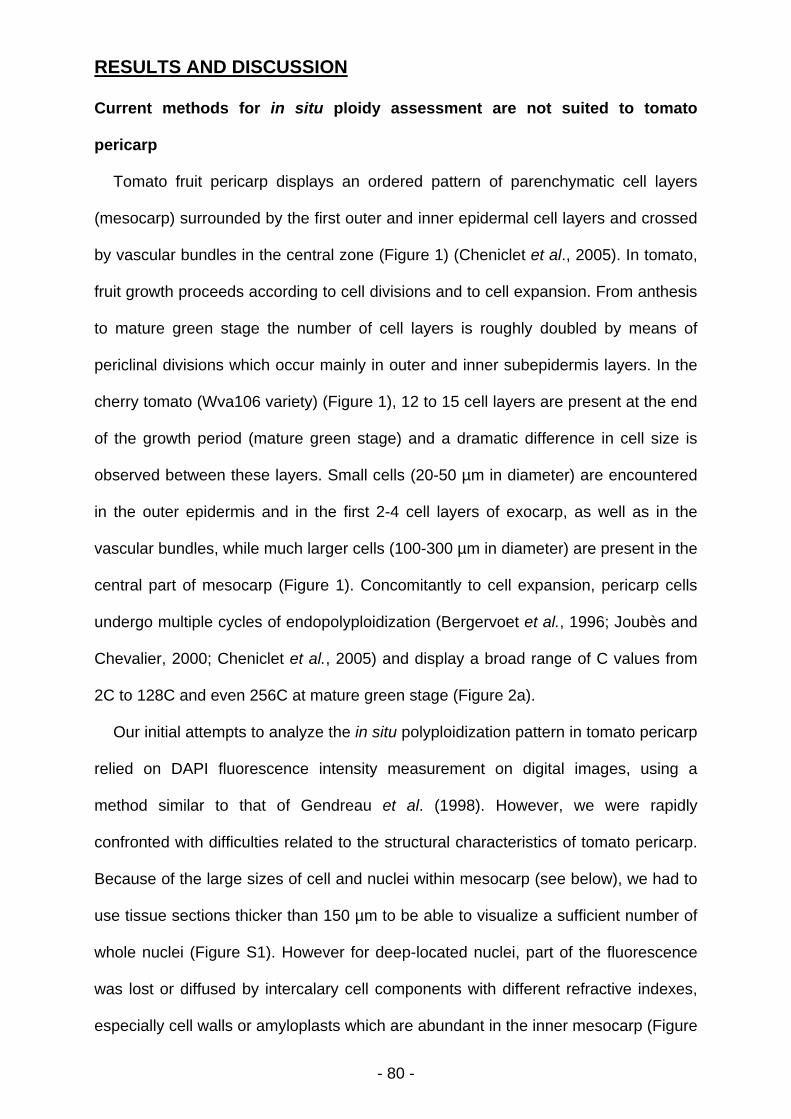
- 80 -
RESULTS AND DISCUSSION
Current methods for in situ ploidy assessment are not suited to tomato
pericarp
Tomato fruit pericarp displays an ordered pattern of parenchymatic cell layers
(mesocarp) surrounded by the first outer and inner epidermal cell layers and crossed
by vascular bundles in the central zone (Figure 1) (Cheniclet et al., 2005). In tomato,
fruit growth proceeds according to cell divisions and to cell expansion. From anthesis
to mature green stage the number of cell layers is roughly doubled by means of
periclinal divisions which occur mainly in outer and inner subepidermis layers. In the
cherry tomato (Wva106 variety) (Figure 1), 12 to 15 cell layers are present at the end
of the growth period (mature green stage) and a dramatic difference in cell size is
observed between these layers. Small cells (20-50 µm in diameter) are encountered
in the outer epidermis and in the first 2-4 cell layers of exocarp, as well as in the
vascular bundles, while much larger cells (100-300 µm in diameter) are present in the
central part of mesocarp (Figure 1). Concomitantly to cell expansion, pericarp cells
undergo multiple cycles of endopolyploidization (Bergervoet et al., 1996; Joubès and
Chevalier, 2000; Cheniclet et al., 2005) and display a broad range of C values from
2C to 128C and even 256C at mature green stage (Figure 2a).
Our initial attempts to analyze the in situ polyploidization pattern in tomato pericarp
relied on DAPI fluorescence intensity measurement on digital images, using a
method similar to that of Gendreau et al. (1998). However, we were rapidly
confronted with difficulties related to the structural characteristics of tomato pericarp.
Because of the large sizes of cell and nuclei within mesocarp (see below), we had to
use tissue sections thicker than 150 µm to be able to visualize a sufficient number of
whole nuclei (Figure S1). However for deep-located nuclei, part of the fluorescence
was lost or diffused by intercalary cell components with different refractive indexes,
especially cell walls or amyloplasts which are abundant in the inner mesocarp (Figure
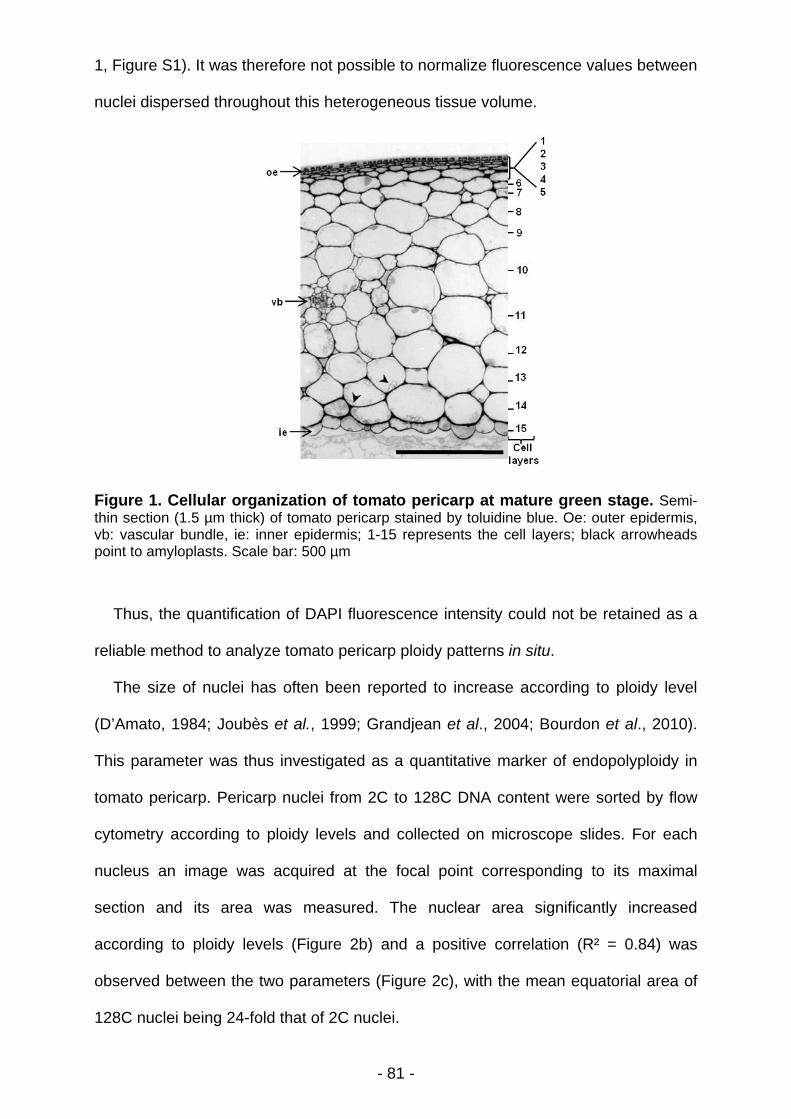
- 81 -
1, Figure S1). It was therefore not possible to normalize fluorescence values between
nuclei dispersed throughout this heterogeneous tissue volume.
Figure 1. Cellular organization of tomato pericarp at mature green stage. Semi-thin section (1.5 µm thick) of tomato pericarp stained by toluidine blue. Oe: outer epidermis, vb: vascular bundle, ie: inner epidermis; 1-15 represents the cell layers; black arrowheads point to amyloplasts. Scale bar: 500 µm
Thus, the quantification of DAPI fluorescence intensity could not be retained as a
reliable method to analyze tomato pericarp ploidy patterns in situ.
The size of nuclei has often been reported to increase according to ploidy level
(D’Amato, 1984; Joubès et al., 1999; Grandjean et al., 2004; Bourdon et al., 2010).
This parameter was thus investigated as a quantitative marker of endopolyploidy in
tomato pericarp. Pericarp nuclei from 2C to 128C DNA content were sorted by flow
cytometry according to ploidy levels and collected on microscope slides. For each
nucleus an image was acquired at the focal point corresponding to its maximal
section and its area was measured. The nuclear area significantly increased
according to ploidy levels (Figure 2b) and a positive correlation (R² = 0.84) was
observed between the two parameters (Figure 2c), with the mean equatorial area of
128C nuclei being 24-fold that of 2C nuclei.
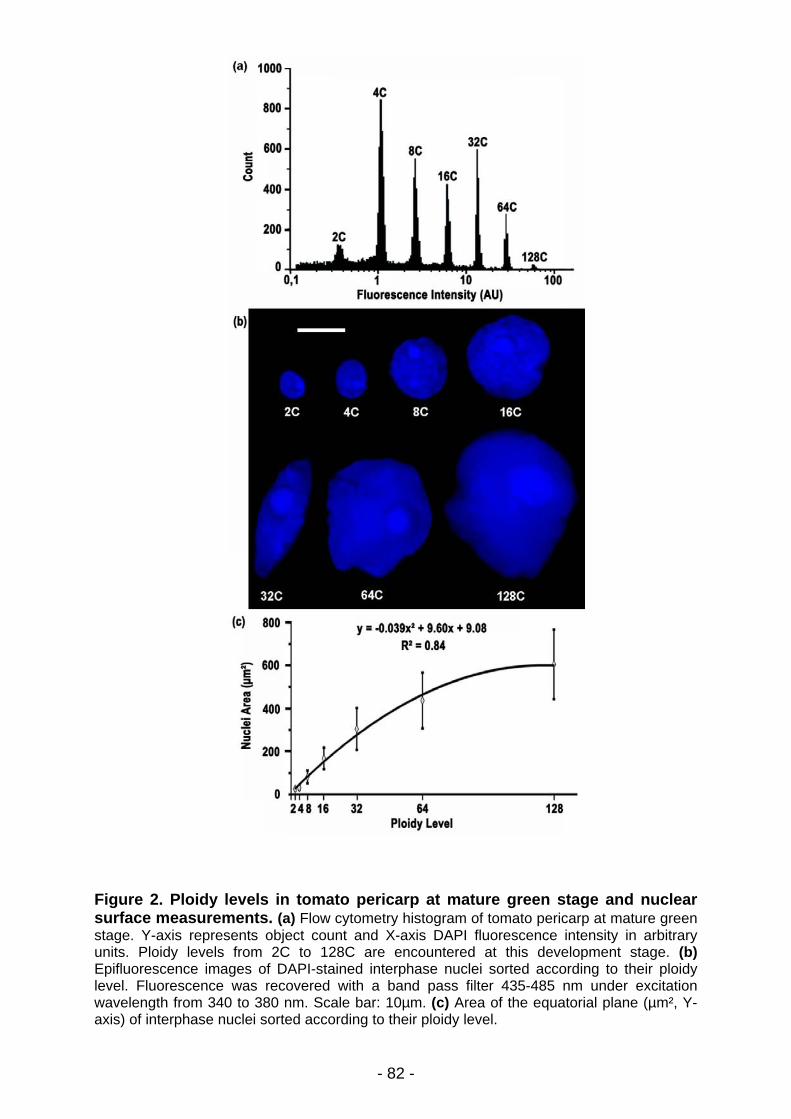
- 82 -
Figure 2. Ploidy levels in tomato pericarp at mature green stage and nuclear surface measurements. (a) Flow cytometry histogram of tomato pericarp at mature green stage. Y-axis represents object count and X-axis DAPI fluorescence intensity in arbitrary units. Ploidy levels from 2C to 128C are encountered at this development stage. (b) Epifluorescence images of DAPI-stained interphase nuclei sorted according to their ploidy level. Fluorescence was recovered with a band pass filter 435-485 nm under excitation wavelength from 340 to 380 nm. Scale bar: 10µm. (c) Area of the equatorial plane (µm², Y-axis) of interphase nuclei sorted according to their ploidy level.
- 83 -
Since the shape of the nuclei is very variable in pericarp we could not extrapolate
the nuclear volume from the measurement of their sectional area and therefore were
not able to assess the expected proportionality between nuclear volume and ploidy
level. Despite the correlation displayed between nuclear area and ploidy level, the
large standard deviations led to partial overlapping of surface values corresponding
to adjacent ploidy levels. Thus the area measurements of nuclei allowed only to
discriminate low, medium or high ploidy classes, but did not allow the determination
of the precise ploidy level of a nucleus. Additionally, these results from isolated nuclei
could not be simply extrapolated to nuclei observed in situ. First, a variation in the
volume and shape of nuclei could occur during nuclei extraction and sorting. Second,
the measured area of the nuclei depends on their orientation: isolated nuclei tend to
lie on their largest side on microscope slides, while in situ nuclei are immobilized in a
fixed orientation, most often flattened between a rigid cell wall and a turgescent
vacuole (Figure S1). The in situ determination of nuclear sizes from 2-D images is
therefore not robust. The estimation of ploidy levels from in situ nuclear size
measurements was thus not retained as the parameter was too imprecise.
In situ determination of ploidy using FISH on purified and sorted nuclei
Hence we aimed at developing a reliable method less sensitive towards
heterogeneity of cell size, form and content as well as location and orientation of the
nucleus. To achieve this, the measured parameters have to be highly correlated to
ploidy levels. The number of a given DNA locus in endopolyploid cells is directly
connected to the ploidy level. Thus, we developed a method for ploidy determination
based on the detection of a given locus by Fluorescent In Situ Hybridization (FISH).
Each copy of the locus is visualized by a fluorescent signal in the nuclear volume and
the number of signals is determined. This method offers the advantage to rely on
object counting rather than on integrating fluorescence intensities.
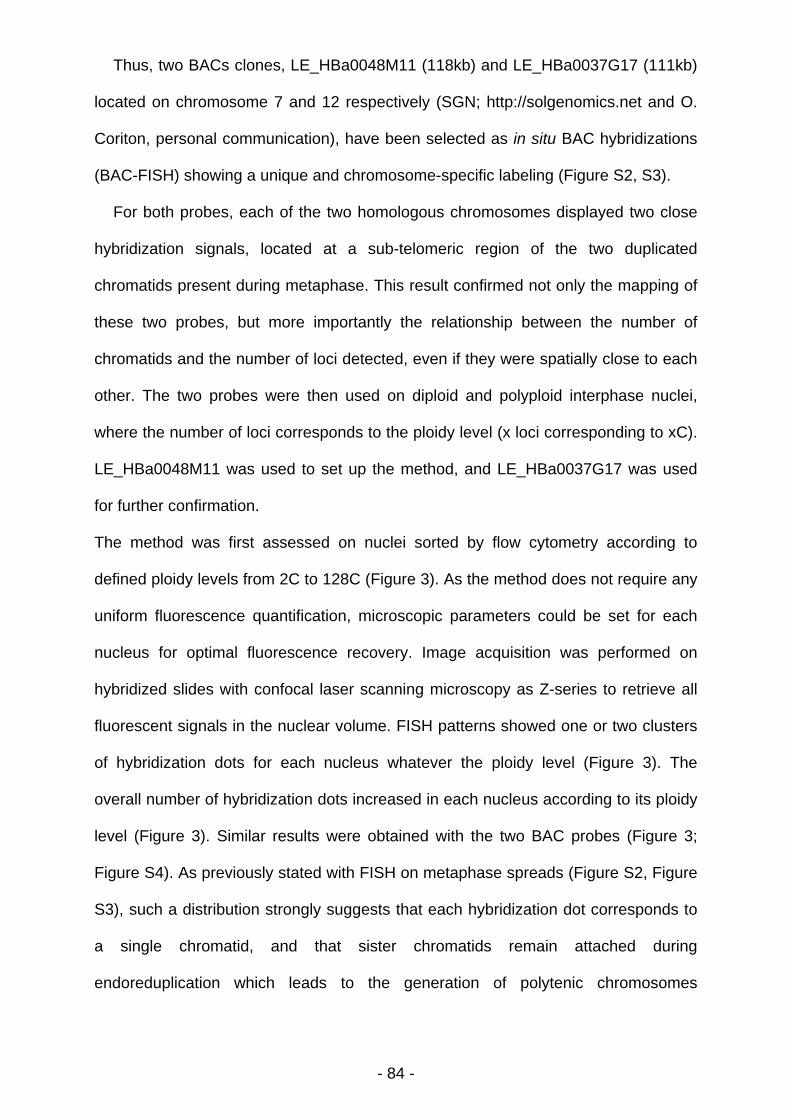
- 84 -
Thus, two BACs clones, LE_HBa0048M11 (118kb) and LE_HBa0037G17 (111kb)
located on chromosome 7 and 12 respectively (SGN; http://solgenomics.net and O.
Coriton, personal communication), have been selected as in situ BAC hybridizations
(BAC-FISH) showing a unique and chromosome-specific labeling (Figure S2, S3).
For both probes, each of the two homologous chromosomes displayed two close
hybridization signals, located at a sub-telomeric region of the two duplicated
chromatids present during metaphase. This result confirmed not only the mapping of
these two probes, but more importantly the relationship between the number of
chromatids and the number of loci detected, even if they were spatially close to each
other. The two probes were then used on diploid and polyploid interphase nuclei,
where the number of loci corresponds to the ploidy level (x loci corresponding to xC).
LE_HBa0048M11 was used to set up the method, and LE_HBa0037G17 was used
for further confirmation.
The method was first assessed on nuclei sorted by flow cytometry according to
defined ploidy levels from 2C to 128C (Figure 3). As the method does not require any
uniform fluorescence quantification, microscopic parameters could be set for each
nucleus for optimal fluorescence recovery. Image acquisition was performed on
hybridized slides with confocal laser scanning microscopy as Z-series to retrieve all
fluorescent signals in the nuclear volume. FISH patterns showed one or two clusters
of hybridization dots for each nucleus whatever the ploidy level (Figure 3). The
overall number of hybridization dots increased in each nucleus according to its ploidy
level (Figure 3). Similar results were obtained with the two BAC probes (Figure 3;
Figure S4). As previously stated with FISH on metaphase spreads (Figure S2, Figure
S3), such a distribution strongly suggests that each hybridization dot corresponds to
a single chromatid, and that sister chromatids remain attached during
endoreduplication which leads to the generation of polytenic chromosomes
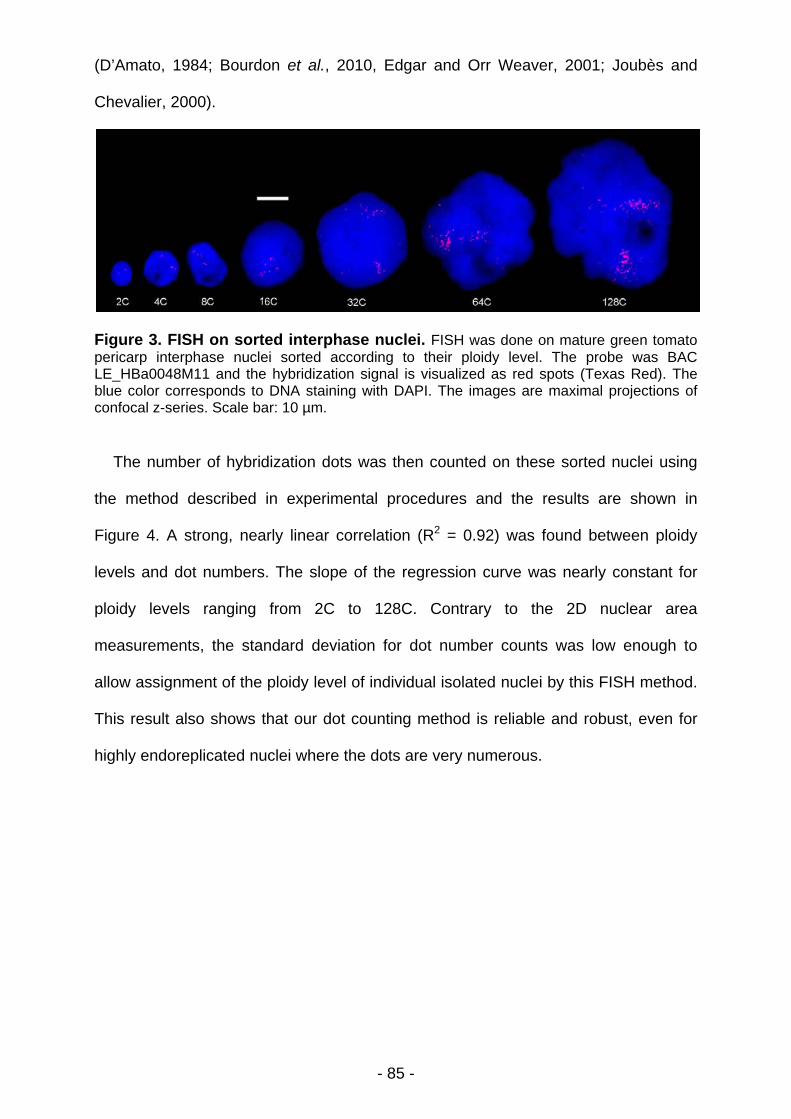
- 85 -
(D’Amato, 1984; Bourdon et al., 2010, Edgar and Orr Weaver, 2001; Joubès and
Chevalier, 2000).
Figure 3. FISH on sorted interphase nuclei. FISH was done on mature green tomato pericarp interphase nuclei sorted according to their ploidy level. The probe was BAC LE_HBa0048M11 and the hybridization signal is visualized as red spots (Texas Red). The blue color corresponds to DNA staining with DAPI. The images are maximal projections of confocal z-series. Scale bar: 10 µm.
The number of hybridization dots was then counted on these sorted nuclei using
the method described in experimental procedures and the results are shown in
Figure 4. A strong, nearly linear correlation (R2 = 0.92) was found between ploidy
levels and dot numbers. The slope of the regression curve was nearly constant for
ploidy levels ranging from 2C to 128C. Contrary to the 2D nuclear area
measurements, the standard deviation for dot number counts was low enough to
allow assignment of the ploidy level of individual isolated nuclei by this FISH method.
This result also shows that our dot counting method is reliable and robust, even for
highly endoreplicated nuclei where the dots are very numerous.
- 86 -
Figure 4. Correlation between ploidy levels and LE_HBa0048M11 FISH locus counts. Results of LE_HBa0048M11 FISH dot counts on tomato mature green pericarp interphase nuclei sorted according to their ploidy level. Thirty nuclei were acquired per ploidy level.
The relationship between the ploidy level and the number of loci detected by BAC-
FISH having been validated on sorted nuclei, we then applied the method to analyze
endopolyploidy patterns in tomato mature green pericarp.
Application of the FISH method to sectioned and fixed pericarp tissues
The application of this BAC-FISH method to pericarp tissue has necessitated the
development of a new protocol adapted from that of Prieto et al. (2007). We had to
optimize several parameters: tissue preservation, section thickness, method for
handling the sections and permeabilization steps.
The efficiency of the fixation depends on the depth within the pericarp fragment
and the fixation duration. After 1 h of fixation in the presence of 4%
paraformaldehyde, serial sections through the pericarp fragment were observed
under the microscope in order to check for tissue integrity and for the presence of
nuclei after DAPI staining. The effective penetration of the fixative was deduced from
the presence of nuclei. Indeed, a progressive loss of nuclei may occur as the
strength of the fixation decreases with tissue depth. Yet efficient retention of nuclei in
situ also depends on the section thickness so this parameter was tested. Finally, for
tomato pericarp, a series of six 150 µm-thick sections, over a total of ~900 µm,
- 87 -
appeared to be the best compromise between an efficient recovery of whole nuclei
and a clear visualization of the different cell layers.
Two slightly different protocols were set up for processing tissue sections. Indeed,
we had major difficulties to maintain the 150 µm-thick tissue sections on the surface
of glass slides. A large panel of in-house or commercially coated slides was tested in
order to avoid the loss of tissue sections during hybridization and washing steps, but
none of them improved significantly the adhesion of tissue sections. A first successful
FISH protocol (Protocol 1) (see Experimental procedures) included a thin layer of bi-
compounded epoxy Araldite® glue to achieve strong adhesion of the sections onto
the slide. Although providing consistent results (Figure 5a,c,e), the reproducibility of
Protocol 1 was somewhat hampered by the difficulty to obtain a homogeneous
spread of the glue. Moreover, the use of the glue could increase the natural
autofluorescence of tomato tissue which complicated visual assessment of the FISH
signals.
To circumvent these constraints, a second FISH protocol (Protocol 2) was
performed, using immersed tissue sections in microtubes. But the cell wall
permeabilization step of Protocol 1 (0.1% cellulase-pectolyase, see Experimental
procedures), when performed in microtubes, was very deleterious to tissue integrity
and led to difficulties in retrieving whole sections or to deposit them flat on
microscope slides for observation (data not shown). After testing several enzyme
concentrations we found that despite omitting this step, probe access to the genomic
DNA was efficient. Probably, the proteinase treatment (pepsin), which came later in
the protocol, was sufficient to give the probe access to the nuclei. This simplified
Protocol 2 conserved tissue structures well, gave highly reproducible hybridizations
and offered convenient tissue handling (Figure 5b,d,f). When we compared the
protocols 1 and 2, similar results were obtained (Figure 5). Moreover, FISH patterns
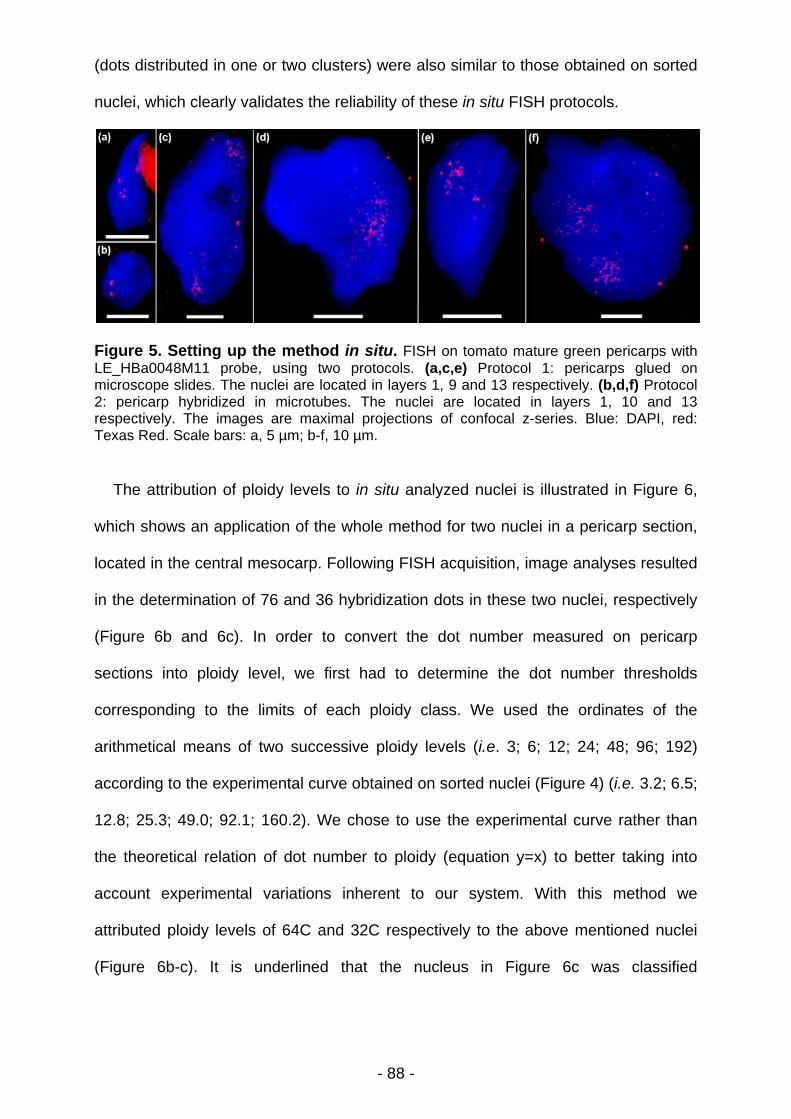
- 88 -
(dots distributed in one or two clusters) were also similar to those obtained on sorted
nuclei, which clearly validates the reliability of these in situ FISH protocols.
Figure 5. Setting up the method in situ. FISH on tomato mature green pericarps with LE_HBa0048M11 probe, using two protocols. (a,c,e) Protocol 1: pericarps glued on microscope slides. The nuclei are located in layers 1, 9 and 13 respectively. (b,d,f) Protocol 2: pericarp hybridized in microtubes. The nuclei are located in layers 1, 10 and 13 respectively. The images are maximal projections of confocal z-series. Blue: DAPI, red: Texas Red. Scale bars: a, 5 µm; b-f, 10 µm.
The attribution of ploidy levels to in situ analyzed nuclei is illustrated in Figure 6,
which shows an application of the whole method for two nuclei in a pericarp section,
located in the central mesocarp. Following FISH acquisition, image analyses resulted
in the determination of 76 and 36 hybridization dots in these two nuclei, respectively
(Figure 6b and 6c). In order to convert the dot number measured on pericarp
sections into ploidy level, we first had to determine the dot number thresholds
corresponding to the limits of each ploidy class. We used the ordinates of the
arithmetical means of two successive ploidy levels (i.e. 3; 6; 12; 24; 48; 96; 192)
according to the experimental curve obtained on sorted nuclei (Figure 4) (i.e. 3.2; 6.5;
12.8; 25.3; 49.0; 92.1; 160.2). We chose to use the experimental curve rather than
the theoretical relation of dot number to ploidy (equation y=x) to better taking into
account experimental variations inherent to our system. With this method we
attributed ploidy levels of 64C and 32C respectively to the above mentioned nuclei
(Figure 6b-c). It is underlined that the nucleus in Figure 6c was classified
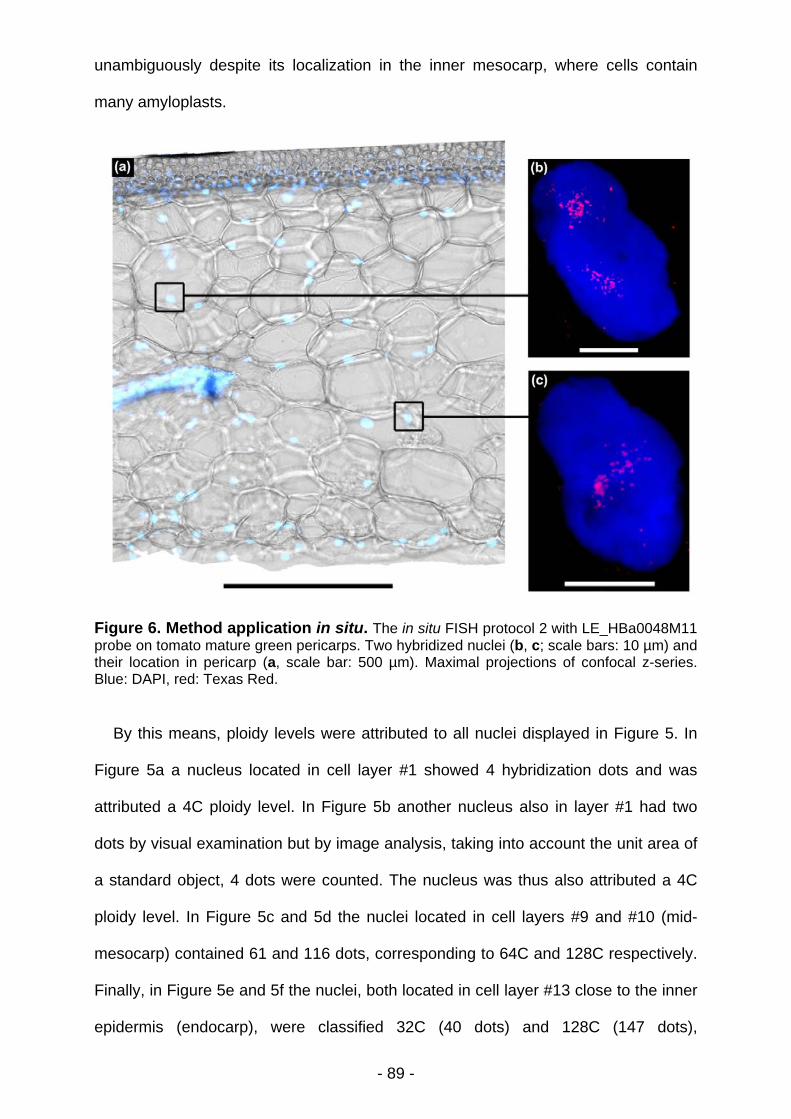
- 89 -
unambiguously despite its localization in the inner mesocarp, where cells contain
many amyloplasts.
Figure 6. Method application in situ. The in situ FISH protocol 2 with LE_HBa0048M11 probe on tomato mature green pericarps. Two hybridized nuclei (b, c; scale bars: 10 µm) and their location in pericarp (a, scale bar: 500 µm). Maximal projections of confocal z-series. Blue: DAPI, red: Texas Red.
By this means, ploidy levels were attributed to all nuclei displayed in Figure 5. In
Figure 5a a nucleus located in cell layer #1 showed 4 hybridization dots and was
attributed a 4C ploidy level. In Figure 5b another nucleus also in layer #1 had two
dots by visual examination but by image analysis, taking into account the unit area of
a standard object, 4 dots were counted. The nucleus was thus also attributed a 4C
ploidy level. In Figure 5c and 5d the nuclei located in cell layers #9 and #10 (mid-
mesocarp) contained 61 and 116 dots, corresponding to 64C and 128C respectively.
Finally, in Figure 5e and 5f the nuclei, both located in cell layer #13 close to the inner
epidermis (endocarp), were classified 32C (40 dots) and 128C (147 dots),
- 90 -
respectively. These examples show that ploidy levels can be assigned
unambiguously to nuclei located in different pericarp areas, whatever the occurrence
of autofluorescence, presence of amyloplasts or nuclear orientation.
To investigate the contribution of endopolyploidy in pericarp development, we
performed this FISH-based method for determining the ploidy levels reached at
mature green stage in the different cells layers and establishing a ploidy map of the
tomato pericarp.
The ploidy distribution in tomato pericarp follows a specific but heterogeneous
pattern
In order to summarize the results obtained on different pericarp fragments we
have drawn a scheme representing a theoretical pericarp (Figure 7). On this scheme
only 13 cell layers figure, even if the pericarp can contain up to 16 cell layers. In fact,
it is difficult to distinguish the tiny outer subepidermal cell layers within such thick
pericarp sections. In order to built this ploidy map, fifteen to twenty-one nuclei were
analyzed for each cell layer excepted for the #2 (11 nuclei), #8 (12 nuclei) and the
cells close to vascular bundles (9 nuclei). The two protocols described above were
equally used in terms of sampling.
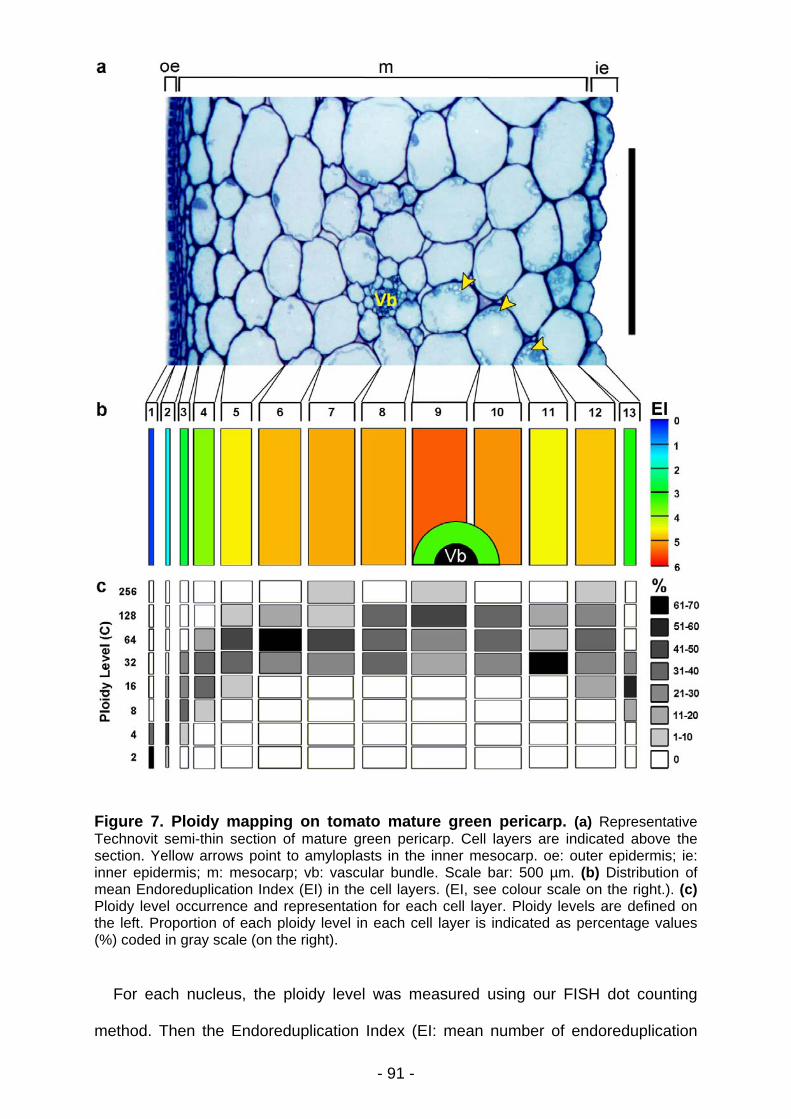
- 91 -
Figure 7. Ploidy mapping on tomato mature green pericarp. (a) Representative Technovit semi-thin section of mature green pericarp. Cell layers are indicated above the section. Yellow arrows point to amyloplasts in the inner mesocarp. oe: outer epidermis; ie: inner epidermis; m: mesocarp; vb: vascular bundle. Scale bar: 500 µm. (b) Distribution of mean Endoreduplication Index (EI) in the cell layers. (EI, see colour scale on the right.). (c) Ploidy level occurrence and representation for each cell layer. Ploidy levels are defined on the left. Proportion of each ploidy level in each cell layer is indicated as percentage values (%) coded in gray scale (on the right).
For each nucleus, the ploidy level was measured using our FISH dot counting
method. Then the Endoreduplication Index (EI: mean number of endoreduplication
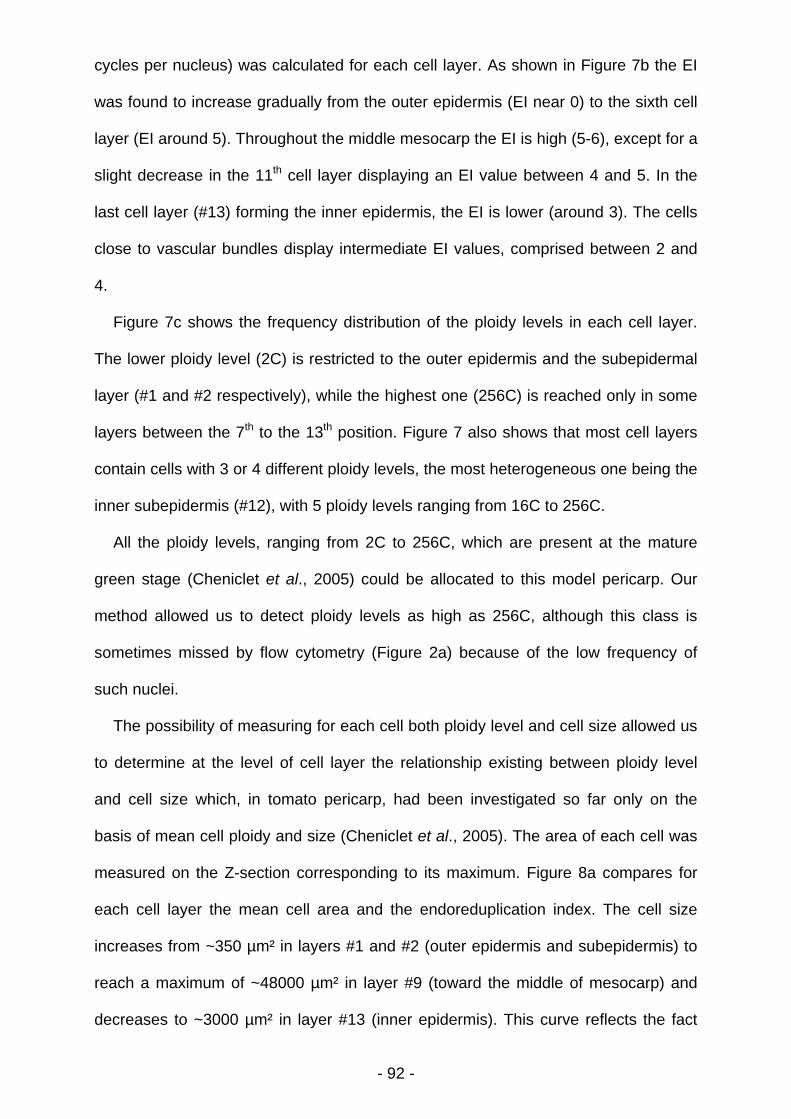
- 92 -
cycles per nucleus) was calculated for each cell layer. As shown in Figure 7b the EI
was found to increase gradually from the outer epidermis (EI near 0) to the sixth cell
layer (EI around 5). Throughout the middle mesocarp the EI is high (5-6), except for a
slight decrease in the 11th cell layer displaying an EI value between 4 and 5. In the
last cell layer (#13) forming the inner epidermis, the EI is lower (around 3). The cells
close to vascular bundles display intermediate EI values, comprised between 2 and
4.
Figure 7c shows the frequency distribution of the ploidy levels in each cell layer.
The lower ploidy level (2C) is restricted to the outer epidermis and the subepidermal
layer (#1 and #2 respectively), while the highest one (256C) is reached only in some
layers between the 7th to the 13th position. Figure 7 also shows that most cell layers
contain cells with 3 or 4 different ploidy levels, the most heterogeneous one being the
inner subepidermis (#12), with 5 ploidy levels ranging from 16C to 256C.
All the ploidy levels, ranging from 2C to 256C, which are present at the mature
green stage (Cheniclet et al., 2005) could be allocated to this model pericarp. Our
method allowed us to detect ploidy levels as high as 256C, although this class is
sometimes missed by flow cytometry (Figure 2a) because of the low frequency of
such nuclei.
The possibility of measuring for each cell both ploidy level and cell size allowed us
to determine at the level of cell layer the relationship existing between ploidy level
and cell size which, in tomato pericarp, had been investigated so far only on the
basis of mean cell ploidy and size (Cheniclet et al., 2005). The area of each cell was
measured on the Z-section corresponding to its maximum. Figure 8a compares for
each cell layer the mean cell area and the endoreduplication index. The cell size
increases from ~350 µm² in layers #1 and #2 (outer epidermis and subepidermis) to
reach a maximum of ~48000 µm² in layer #9 (toward the middle of mesocarp) and
decreases to ~3000 µm² in layer #13 (inner epidermis). This curve reflects the fact
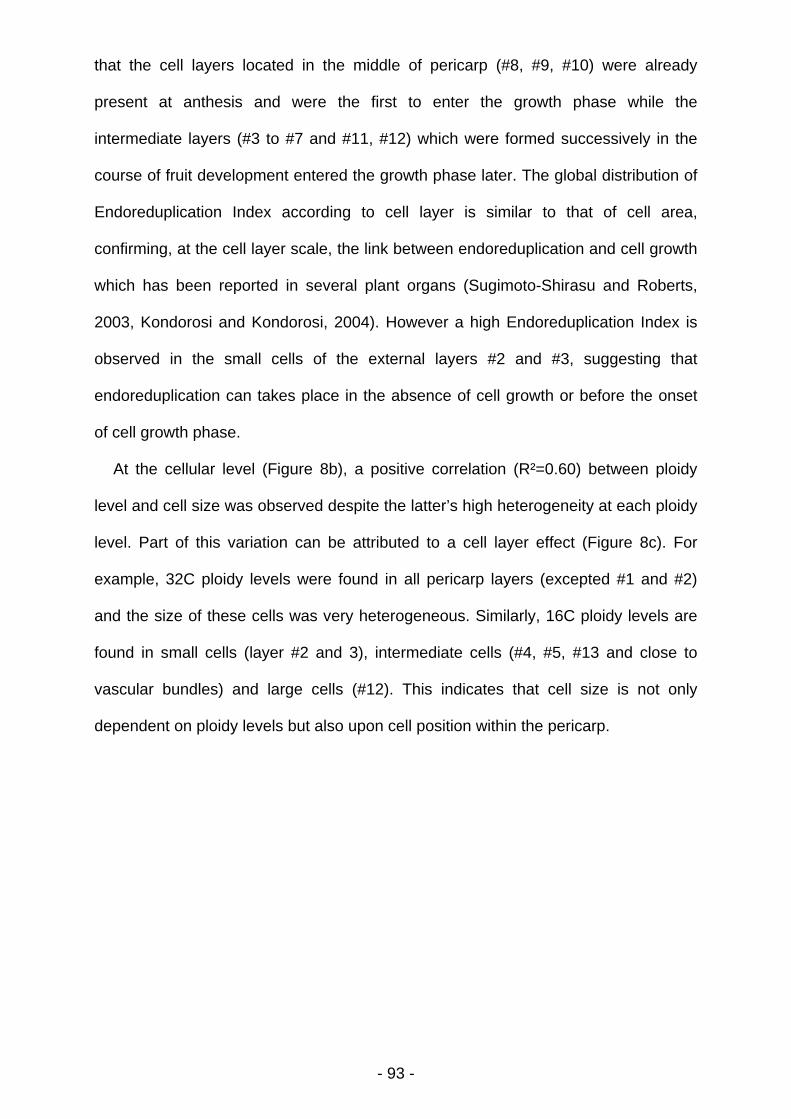
- 93 -
that the cell layers located in the middle of pericarp (#8, #9, #10) were already
present at anthesis and were the first to enter the growth phase while the
intermediate layers (#3 to #7 and #11, #12) which were formed successively in the
course of fruit development entered the growth phase later. The global distribution of
Endoreduplication Index according to cell layer is similar to that of cell area,
confirming, at the cell layer scale, the link between endoreduplication and cell growth
which has been reported in several plant organs (Sugimoto-Shirasu and Roberts,
2003, Kondorosi and Kondorosi, 2004). However a high Endoreduplication Index is
observed in the small cells of the external layers #2 and #3, suggesting that
endoreduplication can takes place in the absence of cell growth or before the onset
of cell growth phase.
At the cellular level (Figure 8b), a positive correlation (R²=0.60) between ploidy
level and cell size was observed despite the latter’s high heterogeneity at each ploidy
level. Part of this variation can be attributed to a cell layer effect (Figure 8c). For
example, 32C ploidy levels were found in all pericarp layers (excepted #1 and #2)
and the size of these cells was very heterogeneous. Similarly, 16C ploidy levels are
found in small cells (layer #2 and 3), intermediate cells (#4, #5, #13 and close to
vascular bundles) and large cells (#12). This indicates that cell size is not only
dependent on ploidy levels but also upon cell position within the pericarp.
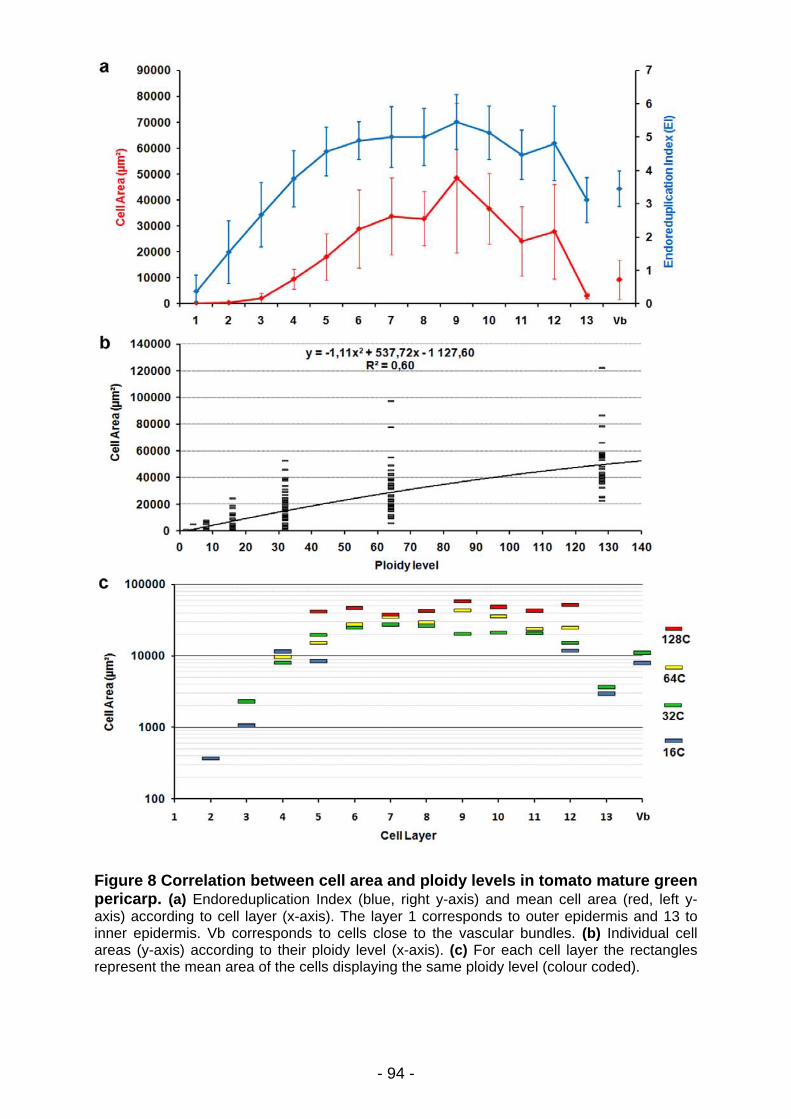
- 94 -
Figure 8 Correlation between cell area and ploidy levels in tomato mature green pericarp. (a) Endoreduplication Index (blue, right y-axis) and mean cell area (red, left y-axis) according to cell layer (x-axis). The layer 1 corresponds to outer epidermis and 13 to inner epidermis. Vb corresponds to cells close to the vascular bundles. (b) Individual cell areas (y-axis) according to their ploidy level (x-axis). (c) For each cell layer the rectangles represent the mean area of the cells displaying the same ploidy level (colour coded).
- 95 -
CONCLUSION
Despite the widespread occurrence of endopolyploidy in plants, the available
methods to investigate its spatial distribution (“mapping”) in a tissue context are
clearly limited, notably in complex, 3-D organized plant tissues with disparate cells,
such as fruit tissues. Our study demonstrates an innovative method to determine
ploidy levels directly in plant tissue samples, making use of the BAC-FISH technique.
The FISH Protocol 2 described herein is efficient, reliable, and easily reproducible. It
requires the use of a BAC clone specific marker as probe to attribute a single locus
as a single chromosome. The locus should be preferably distant enough from the
centromere to allow discrimination of the dots in polyploid nuclei. This method has
allowed discriminating a broad range of ploidy levels (2C to 256C) and circumvents
non-uniform tissue features that interfere with quantitative imaging. Compared to
conventional fluorometry already used with plant tissues (Melaragno et al, 1993), the
BAC-FISH dot counting is a method devoid of the constraints of assessing and
integrating total nuclear fluorescence intensity. It appears more robust for
endopolyploidy studies in tissues containing large cells; an important point since
endopolyploidy has been described as being correlated with cell size (Cheniclet et al,
2005; Sugimoto-Shirasu and Roberts, 2003). This method is also compatible with the
study of endopolyploidy in tissues containing compounds emitting autofluorescence.
Ploidy determination by local dot count rather than by relative integral nuclear
fluorescence is an important progress. It should allow consideration of
endopolyploidy which occurs in many plant species (Barrow, 2006), even in highly
diffusive tissues such as seeds, cotyledons and nodules.
This method has allowed us to draw the ploidy map of pericarp from mature green
tomato fruits. Moreover these results are in agreement with the observations made
by Nafati et al. (2011). Indeed, by overexpressing SlKRP1 during the expansion
- 96 -
phase of tomato fruit, the authors hypothesized that endoreduplication would rather
support a range of cell size than a defined one and that it would precede cell
expansion. Our present observations from normal fruit concur these two
assumptions, underlining the partial independence of the two cellular processes. The
method will now be used for analyzing the evolution of endoreduplication pattern in
tomato pericarp in the course of fruit development, and its connection with cell
division, expansion and differentiation processes.
EXPERIMENTAL PROCEDURES
Plant material and growth conditions
Tomato plants (Solanum lycopersicum L. cv. Wva106, 2n=2x=24) were grown in a
greenhouse during the autumn season with a 15 h light (approximately 270 W.m-2) / 9
h dark photoperiod. On average, the temperature was 25°C during the day and 16°C
during the night. Individual flowers were tagged on the day of anthesis (flower
opening). Fruits were harvested at mature green stage (29-31 dpa).
For chromosomal preparation, tomato seeds (cv. MicroTom) were germinated in a
Petri dish containing a wet Whatman paper at room temperature and in darkness.
Forty-eight hours later, the dishes were transferred to 4°C (for 12 to 24 h) in order to
synchronize mitoses and subsequently transferred to room temperature (for another
12 to 24 h).
Cytological analysis
For cytological analysis pericarp from 30 dpa fruits was prepared by a resin-
embedding method. Thin fragments from equatorial zone were fixed in 2.5%
glutaraldehyde in 100 mM pH 7.2 phosphate buffer for 4 h at 20°C, dehydrated
through an ethanol series and embedded in Technovit 7100 (Kulzer). Sections (1-3
- 97 -
µm thick) were made on a Reichert 2040 microtome Leica Microsystems (www.leica-
microsystems.com) and stained with 0.04% toluidine blue. Images were acquired
with an Axiophot microscope (Carl Zeiss SAS, www.zeiss.fr) and a SPOT digital
camera (Diagnostic Instruments Inc, www.diaginc.com).
Chromosome Preparation
Slide preparations were performed as described in Nicolas et al. (2007) on meiotic
chromosome preparations. Briefly tomato root tips of 0.5 - 1.5 cm in length were
treated with 0.04% 8-hydroxiquinoleine to accumulate metaphase events, fixed in 3:1
ethanol-glacial acetic acid, washed in 0.01 M citric acid-sodium citrate pH 4.5 and
then permeabilized with a solution of 5% cellulase RS Onozuka (Yakult Hansha
Tokyo, Japan) and 1% Y23 pectolyase (Duchefa Biochemie, The Netherlands). One
root tip was transferred to a slide and was squashed in a drop of 3:1 ethanol: acetic
acid. After air-drying, slides were stored at -20°C until FISH was performed.
Isolation of tomato nuclei and flow cytometry
Nuclei were prepared from about 2 mm thick sections of tomato pericarp (without
septa) at mature green stage by chopping with a razor blade in 2 ml of Galbraith’s
extraction buffer (Galbraith et al., 1983) complemented with 5 mM sodium
metabisulfite and 1% (w/v) polyethylene glycol 10000. The suspension was filtered
twice through a 48 µm nylon mesh and nuclei were stained with DAPI (4’,6-
diamidino-2-phenylindole, Sigma-Aldrich, St-Louis, USA) at a final concentration of 5
µg.ml-1. Nuclei were sorted with a MoFlo XDP cytometer (Beckman Coulter, Roissy,
France; www.beckmancoulter.com) using standard isotonic sheath at 30 psi, 3 drop
sorting and coincidence abort. DAPI was excited with a 405 nm laser, using light-
scatter to gate on nuclei, height/area discrimination against doublets and signal area
of the 455 nm emission, When sorting for subsequent imaging of nuclear size, three
- 98 -
fruits were used and 500 nuclei of each ploidy level (2C to 128C) were sorted directly
onto 3-well microscope glass slides (Superfrost® CML France, www.cml.fr) prepared
with 20 µl of a cushion made of 500 mM sucrose, 50% Galbraith’s buffer, 2%
paraformaldehyde and 50 µg.ml-1 chromomycin A3. (Chromomycin A3 was used for
heterochromatin staining experiments whose data are not presented here.) For FISH
experiments, nine fruits were used for preparing slides containing 200 to 2000 nuclei
of a given ploidy level (2C to 128C). Nuclei were sorted on slides covered with 10 µl
of a 2 M sucrose cushion, allowed to dry at room temperature and stored at -20°C up
to several months. To maintain nuclear morphology when sorting onto slides, a
slower flow was used with sheath at 15 psi. DAPI and chromomycin A3 were from
Sigma-Aldrich (St. Louis, USA).
Image acquisition
Images of sorted nuclei were acquired with an epifluorescence microscope Nikon®
Eclipse 800 (www.nikon.fr) equipped with a Spot RTKE digital camera (Diagnostic
Instruments Inc, www.diaginc.com). For image acquisition of DAPI/chromomycin A3
stained interphasic nuclei sorted according to their ploidy level, the fluorescence was
recovered with a band pass filter from 435 to 485 nm under excitation wavelength
from 340 to 380 nm. FISH images were recorded as Z-series (Z step: 0.2 µm) at the
maximal resolution (pixel size X, Y, Z: 80, 80, 198 nm) of a confocal laser-scanning
microscope (Scanhead TCS-SP2 on a DMRXA2, Leica Microsystems,
http://www.leica-microsystems.com/) with a 63x/NA1.4 HCX PL APO objective, using
for Texas Red a Helium/Neon 543 nm laser for excitation and 570-675 nm as
emission range and for DAPI the 405 nm diode for excitation and 430-490 nm as
emission range.
- 99 -
Image analysis
The surface of the sorted nuclei was measured with Image ProPlus software (Media
Cybernetics Inc.,www.mediacy.com) on 2D epifluorescence images. In order to count
the hybridization dots on confocal Z-series, we used the Metamorph software
(Molecular Devices, http://www.moleculardevices.com) and particularly the
Multidimensional Image Analysis (MIA) module developed by Racine et al. (2006,
2007). The method is based on locally-adaptive noise filtering and 2D segmentation
by wavelet transformation (Starck et al., 1998) followed by maximal projection of the
segmented images. The number of dots was estimated on this projection by
measuring the surface of the segmented objects and taking into account the area of
a standard object previously defined from multiple 2D images. In order to minimize
noise, for each Z-series of a nucleus two regions of interest corresponding to the two
clusters of signals were drawn, and the analysis was restricted to these regions and
to the range of Z-planes containing specific signal. The relation between nuclear
endoploidy (from sorted nuclei) and dot number was determined (cf. Figure 4), and
class thresholds were established (see section Application of the FISH method to
sectioned and fixed pericarp tissues). The Endoreduplication Index (EI) is defined as
the number of endoreduplication cycles per nucleus and is calculated from the ploidy
level (P) by the formula: EI=Log2(P)-1. The EI is 0 for 2C nuclei, 1 for 4C nuclei, 2 for
8C nuclei, and so forth.
FISH procedure on isolated interphase nuclei
Two BAC clones LE_HBa0048M11 (118 kb) and LE_HBa0037G17 (111 kb) obtained
from tomato Heinz 1706 HindIII BAC Library (Budiman et al., 2000) were labeled by
random priming with biotin-14-dUTP according to manufacturer’s recommendations
(Invitrogen, Life Technologies, Paisley, UK).
FISH was performed as follows:
- 100 -
Step 1 - RNAse treatment: Nuclei-coated slides obtained as described above were
briefly washed with 2X SSC at 42°C and then incubated in 100 µg.ml-1 RNAse A
(Sigma Aldrich, St Louis, USA) (in 2X SSC) for 1 h at 37°C and washed twice in 2X
SSC at 42°C for 3 min. Step 2 - Pepsin digestion: Slides were incubated with
0.05% pepsin (Sigma Aldrich, St. Louis, USA) in 10 mM HCl for 20 min at 37°C, and
washed twice in 2X SSC at 42°C for 3 min. Step 3 - Post-fixation: Slides were fixed
10 min with 4% paraformaldehyde (Sigma-Aldrich) in 0.1 M phosphate buffer (pH 7)
at room temperature and washed twice in 2X SSC at room temperature for 3 min.
Step 4 – Denaturation: Slides were denatured 2 min at 70°C in 70% formamide in
2X SSC. Step 5 – Dehydration: Immediately after denaturation, slides were
dehydrated in ethanol series (70, 90, and 100%) for 3 min each at -20°C and finally
air-dried. Step 6 – Hybridization: The hybridization mixture consisted of 50%
deionized formamide, 10% dextran sulfate, 2X SSC, 0.25% SDS, 0.2 µg.ml-1 of
sonicated salmon sperm DNA and 100 ng per slide of labeled probes previously
denatured at 92°C for 6 min and cooled in ice bath for 15 min. In situ hybridization
was done overnight at 37°C. Step 7 - Detection and amplification of the FISH
signal: Post-hybridization washes were in 2X SSC for 5 min at 42°C, 5 min in 50%
formamide in 2X·SSC at 42°C, 5 min in 2X SSC at 42°C, 5 min in 4X SSC-0.2%
Tween 20 at 42°C, 5 min in 4X SSC-0.2% at room temperature. Slides were then
saturated with 200 µl of 5% BSA in 4X SSC-0.2% Tween 20 solution for 5 min at
room temperature. Biotinylated probes were detected by avidin-Texas Red, and
fluorescence was subsequently amplified with biotinylated anti-avidin D and avidin-
Texas Red (Vector Laboratories, Burlingame, USA). Each detection/amplification
step was followed by a double wash in 4X SSC-0.2% Tween 20 at 42°C for 3 min
and a second blocking step with 5%BSA was performed before fluorescence
amplification. Nuclei were finally mounted and counterstained in Vectashield (Vector
Laboratories, Burlingame, USA), containing 1.5 µg.ml-1 DAPI. Each 37°C incubation
- 101 -
step was realized in a moist chamber and each 42°C wash step was done under
gentle agitation.
FISH procedure on vibratome sections
Pericarp pieces from fruit equatorial region were fixed 1 h in 4% paraformaldehyde in
0.1 M Phosphate Buffer under vacuum infiltration at 20 kPa. Fixed tissues were then
washed for 10 min in 50 mM Tris, 150 mM Nacl (pH 7) (TBS) and 150 µm sections
were obtained using a vibrating blade microtome Microm HM 650V (Microm
MicroTech France, http://mm-france.fr/). Very slow and large amplitude sectioning
was performed as recommended by Prieto et al. (2007). The pericarp sections were
treated according to two slightly different protocols:
For Protocol 1, sections were deposited on a thin layer of bi-compounded epoxy
Araldite® rapid glue (Hunstman Advanced Materials, Düsserldorf, Germany) and
allowed to dry a minimum of 2 h at room temperature. Tissues prepared in this way
can be stored for months at -20°C. Sections were then dehydrated through a series
of methanol (30, 50, 70, and 100%) baths for 3 min each at room temperature and
allowed to dry at room temperature. The permeabilization step with 0.1% cellulase
RS Onozuka (Yakult Hansha Tokyo, Japan) and 0.1% pectolyase Y23 (Duchefa
Biochemie, The Netherlands) was done for 30 min in TBS at 37°C. Slides were
subsequently washed for 10 min in TBS at room temperature and dehydrated
through another methanol bath series (30, 50, 70, and 100%).
For Protocol 2, freshly obtained sections were deposited in 2 ml microcentrifuge
tubes. Sections were then dehydrated through methanol bath series (30, 50, 70, and
100%) for 3 min each at room temperature and allowed to dry at room temperature
under vacuum at 20 kPa to ensure drying. The permeabilization step with enzymes
was omitted.
- 102 -
The next steps of these two protocols refer to the FISH procedure on isolated
nuclei (above),.but performed in this order: step 1, 2, 3, 5, 4, 6 and 7. Indeed,
dehydration (step 5) was performed before denaturation (step 4) which was realized
with the following modifications: after dehydration, denaturation of samples and
probes was achieved simultaneously at 78°C during 8 min (according to Prieto et al.,
2007). This longer denaturation step appeared to be much more effective than the
70% formamide treatment for 2 min at 70°C used for isolated nuclei.
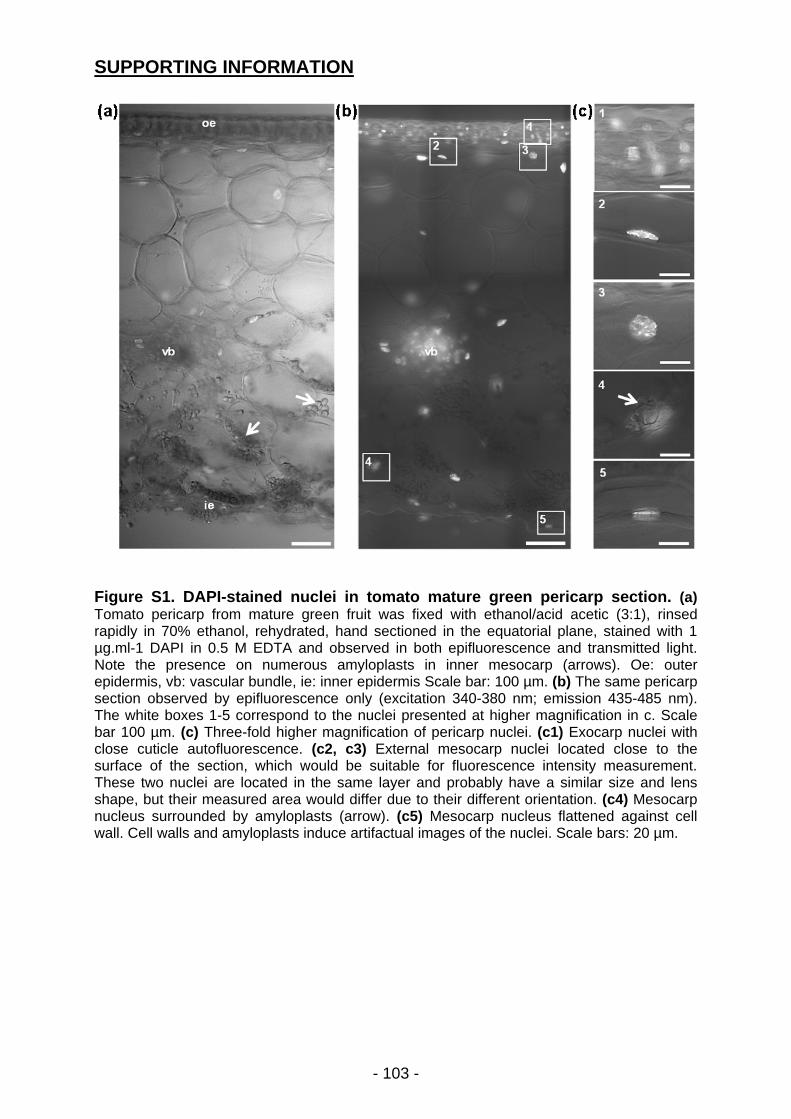
- 103 -
SUPPORTING INFORMATION
Figure S1. DAPI-stained nuclei in tomato mature green pericarp section. (a) Tomato pericarp from mature green fruit was fixed with ethanol/acid acetic (3:1), rinsed rapidly in 70% ethanol, rehydrated, hand sectioned in the equatorial plane, stained with 1 µg.ml-1 DAPI in 0.5 M EDTA and observed in both epifluorescence and transmitted light. Note the presence on numerous amyloplasts in inner mesocarp (arrows). Oe: outer epidermis, vb: vascular bundle, ie: inner epidermis Scale bar: 100 µm. (b) The same pericarp section observed by epifluorescence only (excitation 340-380 nm; emission 435-485 nm). The white boxes 1-5 correspond to the nuclei presented at higher magnification in c. Scale bar 100 µm. (c) Three-fold higher magnification of pericarp nuclei. (c1) Exocarp nuclei with close cuticle autofluorescence. (c2, c3) External mesocarp nuclei located close to the surface of the section, which would be suitable for fluorescence intensity measurement. These two nuclei are located in the same layer and probably have a similar size and lens shape, but their measured area would differ due to their different orientation. (c4) Mesocarp nucleus surrounded by amyloplasts (arrow). (c5) Mesocarp nucleus flattened against cell wall. Cell walls and amyloplasts induce artifactual images of the nuclei. Scale bars: 20 µm.
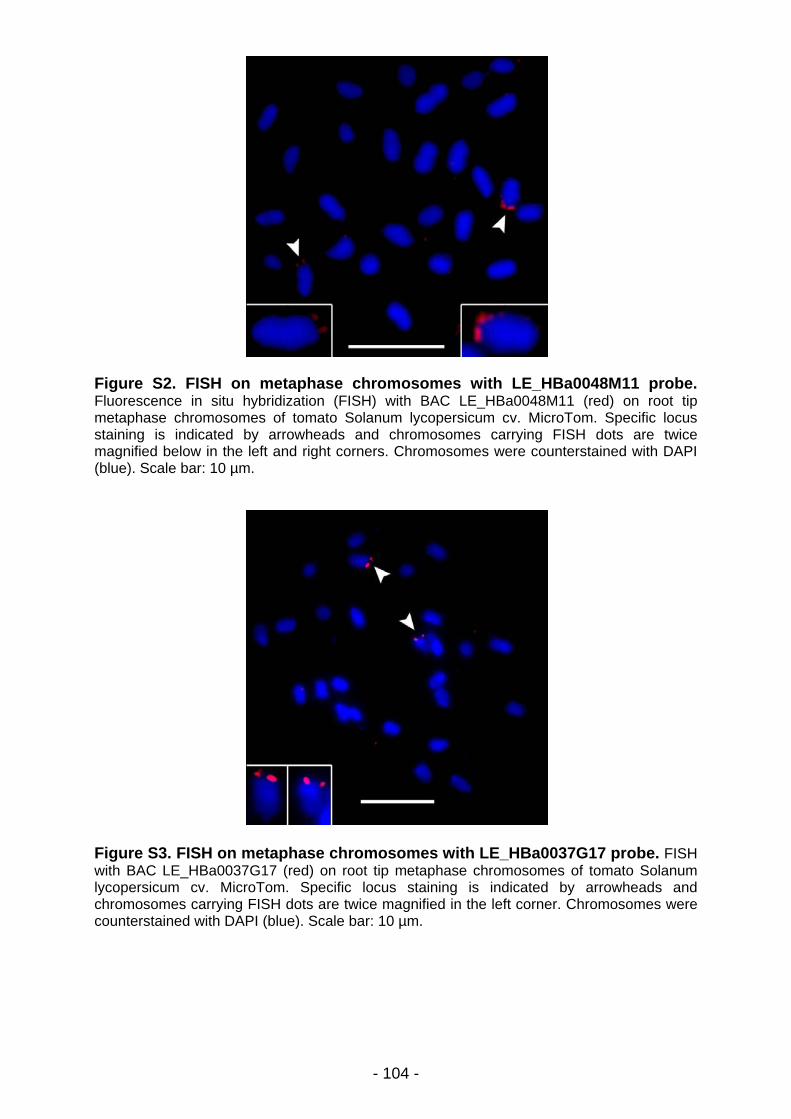
- 104 -
Figure S2. FISH on metaphase chromosomes with LE_HBa0048M11 probe. Fluorescence in situ hybridization (FISH) with BAC LE_HBa0048M11 (red) on root tip metaphase chromosomes of tomato Solanum lycopersicum cv. MicroTom. Specific locus staining is indicated by arrowheads and chromosomes carrying FISH dots are twice magnified below in the left and right corners. Chromosomes were counterstained with DAPI (blue). Scale bar: 10 µm.
Figure S3. FISH on metaphase chromosomes with LE_HBa0037G17 probe. FISH with BAC LE_HBa0037G17 (red) on root tip metaphase chromosomes of tomato Solanum lycopersicum cv. MicroTom. Specific locus staining is indicated by arrowheads and chromosomes carrying FISH dots are twice magnified in the left corner. Chromosomes were counterstained with DAPI (blue). Scale bar: 10 µm.
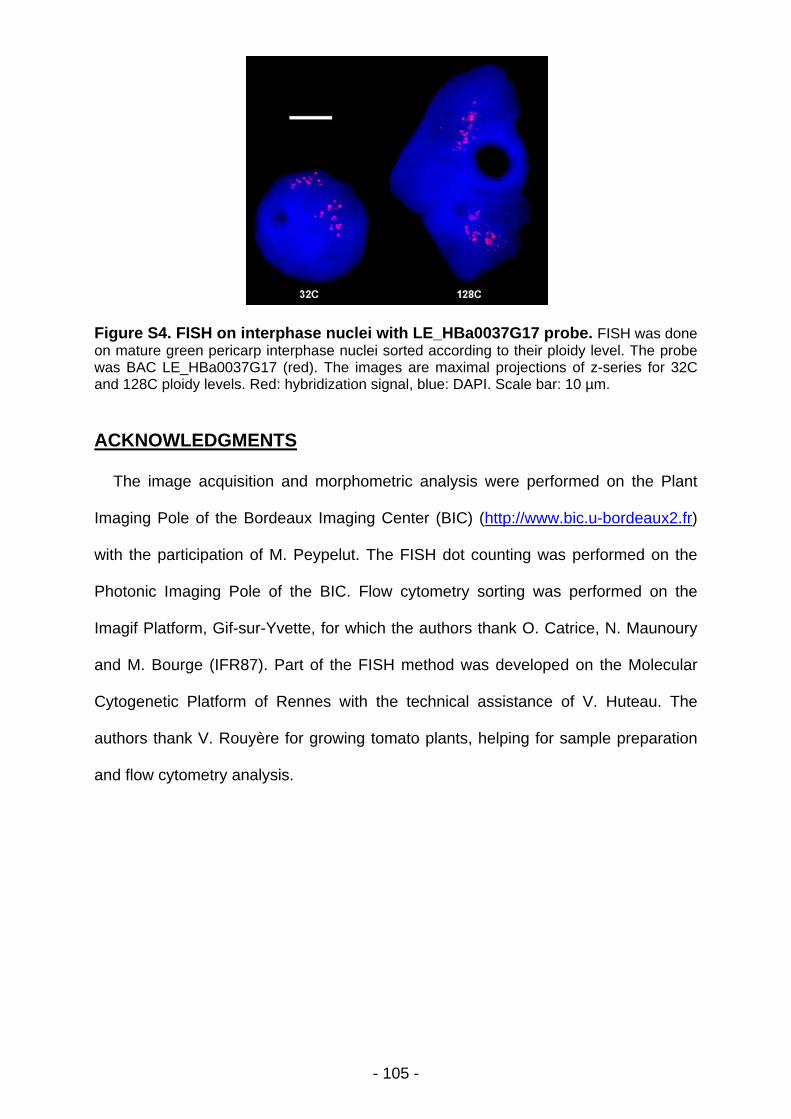
- 105 -
Figure S4. FISH on interphase nuclei with LE_HBa0037G17 probe. FISH was done on mature green pericarp interphase nuclei sorted according to their ploidy level. The probe was BAC LE_HBa0037G17 (red). The images are maximal projections of z-series for 32C and 128C ploidy levels. Red: hybridization signal, blue: DAPI. Scale bar: 10 µm.
ACKNOWLEDGMENTS
The image acquisition and morphometric analysis were performed on the Plant
Imaging Pole of the Bordeaux Imaging Center (BIC) (http://www.bic.u-bordeaux2.fr)
with the participation of M. Peypelut. The FISH dot counting was performed on the
Photonic Imaging Pole of the BIC. Flow cytometry sorting was performed on the
Imagif Platform, Gif-sur-Yvette, for which the authors thank O. Catrice, N. Maunoury
and M. Bourge (IFR87). Part of the FISH method was developed on the Molecular
Cytogenetic Platform of Rennes with the technical assistance of V. Huteau. The
authors thank V. Rouyère for growing tomato plants, helping for sample preparation
and flow cytometry analysis.
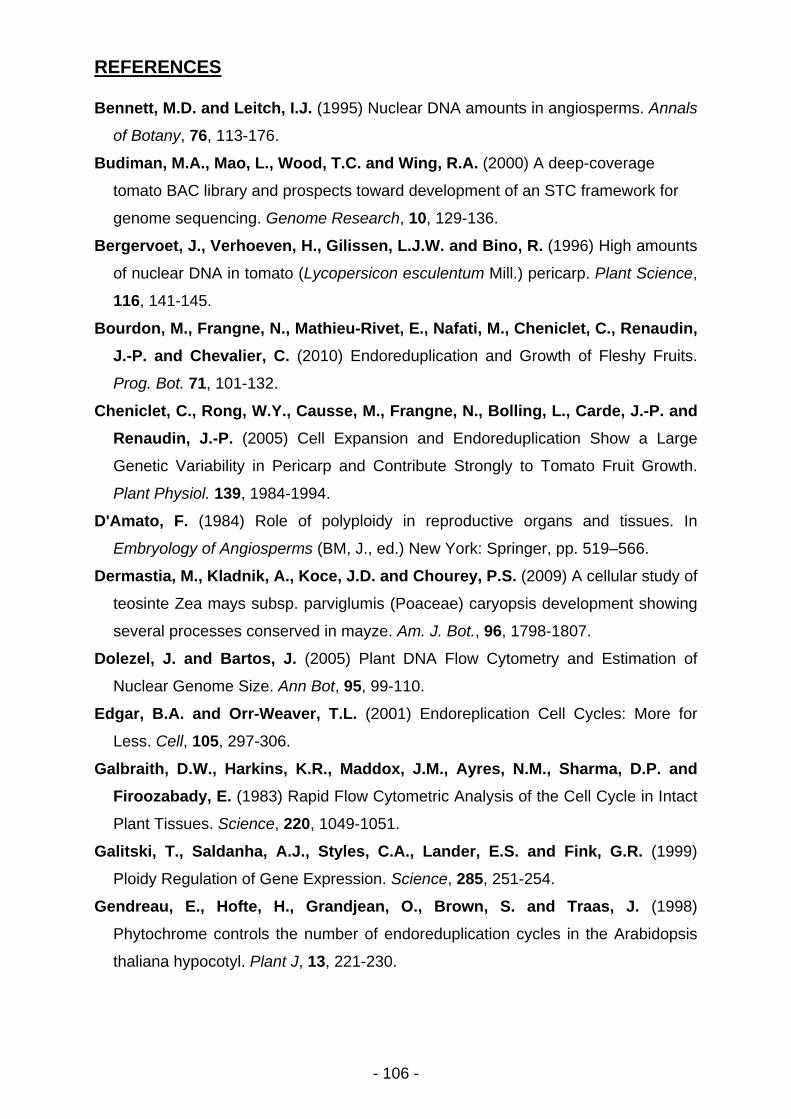
- 106 -
REFERENCES
Bennett, M.D. and Leitch, I.J. (1995) Nuclear DNA amounts in angiosperms. Annals
of Botany, 76, 113-176.
Budiman, M.A., Mao, L., Wood, T.C. and Wing, R.A. (2000) A deep-coverage
tomato BAC library and prospects toward development of an STC framework for
genome sequencing. Genome Research, 10, 129-136.
Bergervoet, J., Verhoeven, H., Gilissen, L.J.W. and Bino, R. (1996) High amounts
of nuclear DNA in tomato (Lycopersicon esculentum Mill.) pericarp. Plant Science,
116, 141-145.
Bourdon, M., Frangne, N., Mathieu-Rivet, E., Nafati, M., Cheniclet, C., Renaudin,
J.-P. and Chevalier, C. (2010) Endoreduplication and Growth of Fleshy Fruits.
Prog. Bot. 71, 101-132.
Cheniclet, C., Rong, W.Y., Causse, M., Frangne, N., Bolling, L., Carde, J.-P. and
Renaudin, J.-P. (2005) Cell Expansion and Endoreduplication Show a Large
Genetic Variability in Pericarp and Contribute Strongly to Tomato Fruit Growth.
Plant Physiol. 139, 1984-1994.
D'Amato, F. (1984) Role of polyploidy in reproductive organs and tissues. In
Embryology of Angiosperms (BM, J., ed.) New York: Springer, pp. 519–566.
Dermastia, M., Kladnik, A., Koce, J.D. and Chourey, P.S. (2009) A cellular study of
teosinte Zea mays subsp. parviglumis (Poaceae) caryopsis development showing
several processes conserved in mayze. Am. J. Bot., 96, 1798-1807.
Dolezel, J. and Bartos, J. (2005) Plant DNA Flow Cytometry and Estimation of
Nuclear Genome Size. Ann Bot, 95, 99-110.
Edgar, B.A. and Orr-Weaver, T.L. (2001) Endoreplication Cell Cycles: More for
Less. Cell, 105, 297-306.
Galbraith, D.W., Harkins, K.R., Maddox, J.M., Ayres, N.M., Sharma, D.P. and
Firoozabady, E. (1983) Rapid Flow Cytometric Analysis of the Cell Cycle in Intact
Plant Tissues. Science, 220, 1049-1051.
Galitski, T., Saldanha, A.J., Styles, C.A., Lander, E.S. and Fink, G.R. (1999)
Ploidy Regulation of Gene Expression. Science, 285, 251-254.
Gendreau, E., Hofte, H., Grandjean, O., Brown, S. and Traas, J. (1998)
Phytochrome controls the number of endoreduplication cycles in the Arabidopsis
thaliana hypocotyl. Plant J, 13, 221-230.
- 107 -
Grandjean, O., Vernoux, T., Laufs, P., Belcram, K., Mizukami, Y. and Traas, J.
(2004) In Vivo Analysis of Cell Division, Cell Growth, and Differentiation at the
Shoot Apical Meristem in Arabidopsis. Plant Cell, 16, 74-87.
Greilhuber, J. (2008) Cytochemistry and C-values: The Less-well-known World of
Nuclear DNA Amounts. Ann. Bot. 101, 791-804.
Haroske, G., Giroud, F., Reith, A. and Böcking, A. (1998) 1997 ESACP consensus
report on diagnostic DNA image cytometry. Part I: Basic considerations and
recommendations for preparation, measurement and interpretation. European
Society for Analytical Cellular Pathology. Analytical Cellular Pathology, 17, 189-
200.
Johnston, J.S., Bennett, M.D., Rayburn, A.L., Galbraith, D.W. and Price, H.J.
(1999) Reference standards for determination of DNA content of plant nuclei. Am.
J. Bot., 86, 609-613.
Joubés J., Phan T-H., Just D., Rothan C., Bergounioux C., Raymond P.,
Chevalier C (1999) Molecular and biochemical characterization of the involvement
of Cyclin-dependent kinase CDKA during the early development of tomato fruit.
Plant Physiol 121,857–869
Joubès, J. and Chevalier, C. (2000) Endoreduplication in higher plants. Plant Mol.
Biol. 43, 735-745.
Jovtchev, G., Schubert, V., Meister, A. and Schubert, I. (2006) Nuclear DNA
content and nuclear and cell volume are positively correlated in angiosperms.
Cytogenetic and Genome Research, 114, 77-82.
Kladnik, A., Chourey, P.S., Pring, D.R. and Dermastia, M. (2006) Development of
the endosperm of Sorghum bicolor during the endoreduplication-associated
growth phase. J. Cereal Sci. 43, 209-215.
Kondorosi, E. and Kondorosi, A. (2004) Endoreduplication and activation of the
anaphase-promoting complex during symbiotic cell development. FEBS Lett. 567,
152-157.
Lee, H.O., Davidson, J.M. and Duronio, R.J. (2009) Endoreplication: polyploidy
with purpose. Genes & Development, 23, 2461-2477.
Melaragno, J.E., Mehrotra, B. and Coleman, A.W. (1993) Relationship between
Endopolyploidy and Cell Size in Epidermal Tissue of Arabidopsis. Plant Cell, 5,
1661-1668.
Nafati, M., Cheniclet, C., Hernould, M., Do, P.T., Fernie, A., Chevalier, C.,
Gévaudant, F. (2011) The specific overexpression of a Cyclin Dependent Kinase
- 108 -
Inhibitor in tomato fruit mesocarp cells uncouples endoreduplication and cell
growth. Plant J., in press.
Nicolas, S.D, Le Mignon, G., Eber. F., Coriton. O., Monod. H., Clouet. V., Huteau.
V., Lostanlen. A., Delourme. R., Chalhoub. B., Ryder. C.D., Chèvre. A.M.and
Jenczewski. E. (2007) Homeologous recombination plays a major role in
chromosome rearrangements that occur during meiosis of Brassica napus
haploids. Genetics. Feb;175(2):487‐503
Prieto, P., Moore, G. and Shaw, P. (2007) Fluorescence in situ hybridization on
vibratome sections of plant tissues. Nature. Prot. 2, 1831-1838.
Racine, V., Hertzog, A., Jouanneau, J., Salamero, J., Kervrann, C. and Sibarita,
J.-B. (2006) Multiple-target tracking of 3D fluorescent objects based on simulated
annealing. IEEE International Symposium on Biomedical Imaging, 1020-1023.
Racine, V., Sachse, M., Salamero, J., Fraisier, V., Trubuil, A. and Sibarita, J.B.
(2007) Visualization and quantification of vesicle trafficking on a three-dimensional
cytoskeleton network in living cells. J.Microscopy, 225, 214-228.
Raslova, H., Roy, L., Vourc'h, C., Le Couedic, J.P., Brison, O., Metivier, D.,
Feunteun, J., Kroemer, G., Debili, N. and Vainchenker, W. (2003)
Megakaryocyte polyploidization is associated with a functional gene amplification.
Blood, 101, 541-544.
Starck, J.L., Murtagh, F. and Bijaoui, A. (1998) Image processing and
dataanalysis: The multiscale approach. New York, USA: Cambridge University
Press.
Sugimoto-Shirasu, K. and Roberts, K. (2003) "Big it up": endoreduplication and
cell-size control in plants. Curr. Opin. Plant Biol. 6, 544-553.
Vilhar, B. and Dermastia, M. (2002) Standardisation of instrumentation in plant DNA
image cytometry. Acta Bot. Croat., 61, 11-26.
Vilhar, B., Kladnik, A., Blejec, A., Chourey, P.S. and Dermastia, M. (2002a)
Cytometrical Evidence That the Loss of Seed Weight in the miniature1 Seed
Mutant of Maize Is Associated with Reduced Mitotic Activity in the Developing
Endosperm. Plant Physiol., 129, 23-30.
- 109 -
PARTIE 2 : ARTICLE 2
Structural analysis of endopolyploid nuclei from tomato (Solanum lycopersicum) fruit cells
Matthieu Bourdon2, Catherine Cheniclet1,2, Mehdi Nafati1,2, Olivier Coriton3, Spencer Brown5,
Martine Peypelut4, Valérie Rouyére2, Adeline Moïse1, Jean-Pierre Renaudin2, Christian
Chevalier1,*, Nathalie Frangne2
1 Institut National de la Recherche Agronomique (INRA), Unité Mixte de Recherche 619 sur
la Biologie du Fruit, BP 81, F-33883 Villenave d'Ornon Cedex, France ;
2 Université Bordeaux 1, Unité Mixte de Recherche 619 sur la Biologie du Fruit, BP 81, F-
33883 Villenave d'Ornon Cedex, France ;
3 Institut National de la Recherche Agronomique (INRA), Unité Mixte de Recherche 118
d’Amélioration des Plantes et Biotechnologies Végétales, BP 35327, F-35653 Le Rheu
Cedex, France ;
4 Bordeaux Imaging Center, Pôle Imagerie du Végétal, 71 av. E. Bourlaux, F-33883 Villenave
d’Ornon, France;
5 Centre National de la Recherche Scientifique (CNRS), Institut des Sciences du Végétal,
UPR 2355, bâtiment 23/24 ; F-91198 Gif-sur-Yvette, France.
* Author for correspondence: Christian Chevalier
Institut National de la Recherche Agronomique (INRA), Université de Bordeaux, Unité Mixte
de Recherche 619 sur la Biologie du Fruit, BP 81, F-33883 Villenave d'Ornon Cedex, France
Tel: +33 557122693; Fax: +33 557122541; e-mail: [email protected]
Running title:
Key words: nucleus, endopolyploidy, polyteny, tomato, FISH
- 110 -
ABSTRACT
Endopolyploidy is a widespread process which corresponds to the amplification of
the genome in the absence of mitosis. In tomato fruits, very high ploidy levels (up to
256C) are reached at the end of fruit development, concomitant with very large cell
sizes (Bourdon et al., 2010). By using cellular approaches (Fluorescence and
electron microscopy) we provide a structural analysis of endoreduplicated nuclei at
the level of chromatin and nucleolus organization, nuclear shape and relation with
other cellular organelles such as mitochondria. We demonstrate that
endopolyploidization affects deeply the nuclear structure in tomato. In mesocarp
cells, displaying high ploidy levels, nuclei possess a highly complex shape with
numerous deep grooves, allowing them to maintain a constant area to perimeter ratio
despite of their increase in volume. Numerous mitochondria are observed in the
close vicinity of polyploid nuclei. FISH method demonstrates that endopolyploidy
leads to the formation of polytene chromosomes and to increased rDNA transcription.
Our results enlighten the role of endoreduplication in the establishment of a highly
structured supra-cellular system required for the promotion of cell growth during
tomato fruit development.
- 111 -
INTRODUCTION
Endopolyploidy is a widespread phenomenon in higher plants. It can result from
the generation of multinucleate cells originating from acytokinetic mitosis, such as in
the formation of the syncitial female gametophyte (Yadegari and Drews, 2004), in
anther tapetum (D’Amato 1984) or in seed endosperm (Berger, 2003) or from nuclear
fusion, such as in the chalazal domain of the endosperm in Arabidopsis (Baroux et
al., 2004). Endopolyploidy can also originate from endomitosis or from
endoreduplication. During endomitosis, the chromosome number within the nucleus
is doubled as chromosomes double and condense, sister chromatids separate
normally, but return to the interphase state within an intact nuclear envelope, thus
generating nuclear endopolyploidy. However this process is rather unusual in plants
(D’Amato, 1984). Endoreduplication is the major source of endopolyploidy in higher
plants, particularly in Angiosperms where it arises in most tissues (Nagl, 1976;
D’Amato, 1984). During endoreduplication, endonuclear DNA duplication occurs in
the absence of any obvious condensation and decondensation steps leading to the
production of chromosomes with 2n chromatids without any change in chromosome
number (Joubès and Chevalier, 2000).
So far the physiological role of endoreduplication during plant development is not
fully understood. Related to the nuclear DNA amplification and the consequent
multiplication of the gene copy number, endoreduplication has been proposed to
support an increase in transcriptional and metabolic activities (Galitski et al., 1999;
Kondorosi and Kondorosi, 2004) or to provide a means to protect the genome
against DNA damage caused by adverse environmental factors (Hase et al., 2006).
However none of these theories has been undisputedly demonstrated in plants.
The most obvious role for endoreduplication is associated with the determination
of cell size, as positive correlations between endoreduplication and cell size are
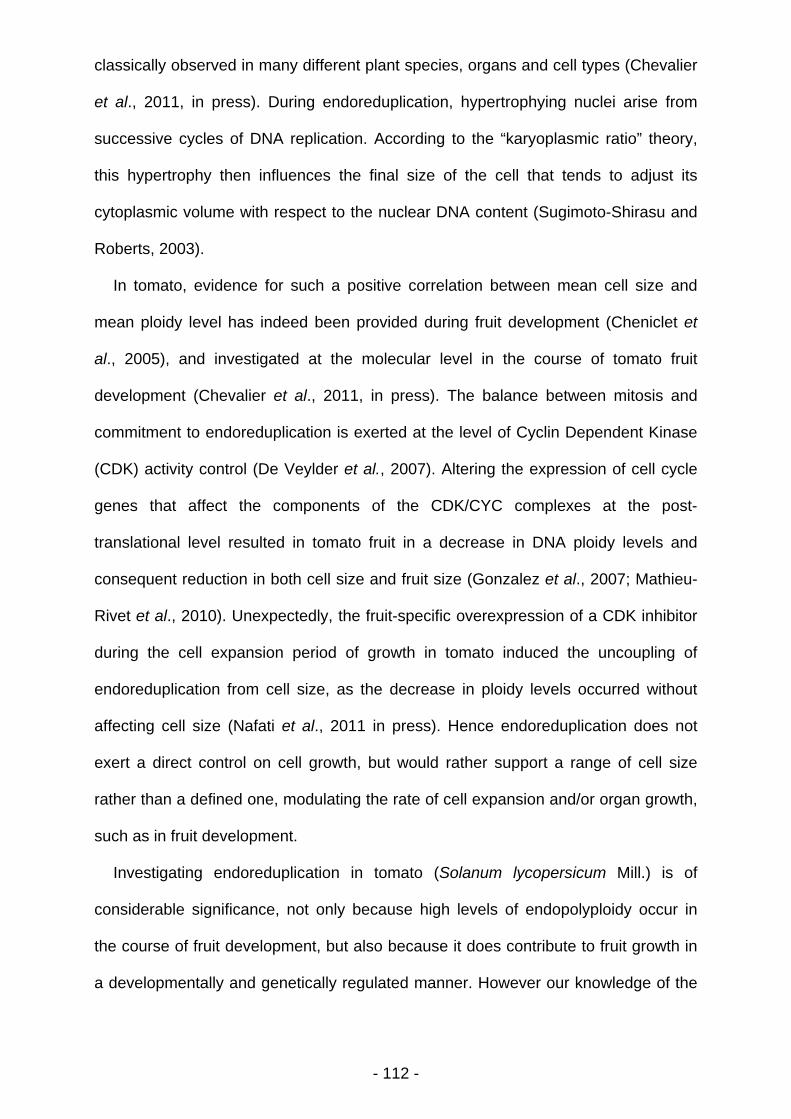
- 112 -
classically observed in many different plant species, organs and cell types (Chevalier
et al., 2011, in press). During endoreduplication, hypertrophying nuclei arise from
successive cycles of DNA replication. According to the “karyoplasmic ratio” theory,
this hypertrophy then influences the final size of the cell that tends to adjust its
cytoplasmic volume with respect to the nuclear DNA content (Sugimoto-Shirasu and
Roberts, 2003).
In tomato, evidence for such a positive correlation between mean cell size and
mean ploidy level has indeed been provided during fruit development (Cheniclet et
al., 2005), and investigated at the molecular level in the course of tomato fruit
development (Chevalier et al., 2011, in press). The balance between mitosis and
commitment to endoreduplication is exerted at the level of Cyclin Dependent Kinase
(CDK) activity control (De Veylder et al., 2007). Altering the expression of cell cycle
genes that affect the components of the CDK/CYC complexes at the post-
translational level resulted in tomato fruit in a decrease in DNA ploidy levels and
consequent reduction in both cell size and fruit size (Gonzalez et al., 2007; Mathieu-
Rivet et al., 2010). Unexpectedly, the fruit-specific overexpression of a CDK inhibitor
during the cell expansion period of growth in tomato induced the uncoupling of
endoreduplication from cell size, as the decrease in ploidy levels occurred without
affecting cell size (Nafati et al., 2011 in press). Hence endoreduplication does not
exert a direct control on cell growth, but would rather support a range of cell size
rather than a defined one, modulating the rate of cell expansion and/or organ growth,
such as in fruit development.
Investigating endoreduplication in tomato (Solanum lycopersicum Mill.) is of
considerable significance, not only because high levels of endopolyploidy occur in
the course of fruit development, but also because it does contribute to fruit growth in
a developmentally and genetically regulated manner. However our knowledge of the
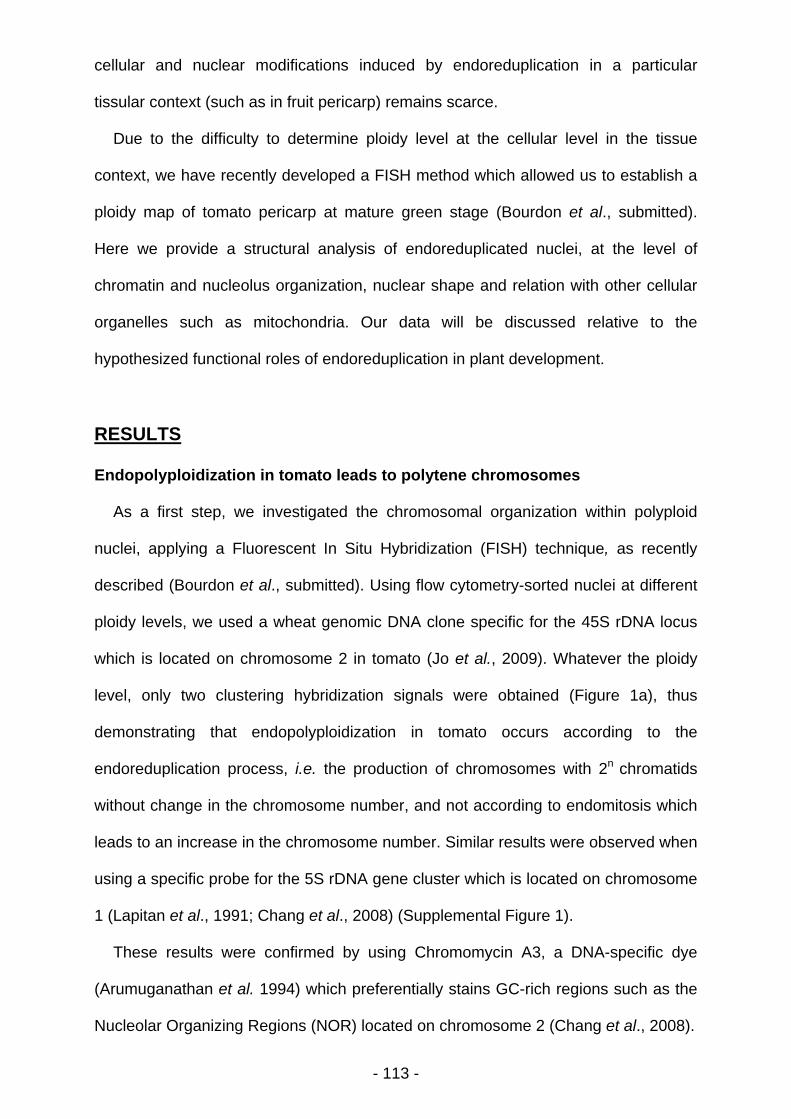
- 113 -
cellular and nuclear modifications induced by endoreduplication in a particular
tissular context (such as in fruit pericarp) remains scarce.
Due to the difficulty to determine ploidy level at the cellular level in the tissue
context, we have recently developed a FISH method which allowed us to establish a
ploidy map of tomato pericarp at mature green stage (Bourdon et al., submitted).
Here we provide a structural analysis of endoreduplicated nuclei, at the level of
chromatin and nucleolus organization, nuclear shape and relation with other cellular
organelles such as mitochondria. Our data will be discussed relative to the
hypothesized functional roles of endoreduplication in plant development.
RESULTS
Endopolyploidization in tomato leads to polytene chromosomes
As a first step, we investigated the chromosomal organization within polyploid
nuclei, applying a Fluorescent In Situ Hybridization (FISH) technique, as recently
described (Bourdon et al., submitted). Using flow cytometry-sorted nuclei at different
ploidy levels, we used a wheat genomic DNA clone specific for the 45S rDNA locus
which is located on chromosome 2 in tomato (Jo et al., 2009). Whatever the ploidy
level, only two clustering hybridization signals were obtained (Figure 1a), thus
demonstrating that endopolyploidization in tomato occurs according to the
endoreduplication process, i.e. the production of chromosomes with 2n chromatids
without change in the chromosome number, and not according to endomitosis which
leads to an increase in the chromosome number. Similar results were observed when
using a specific probe for the 5S rDNA gene cluster which is located on chromosome
1 (Lapitan et al., 1991; Chang et al., 2008) (Supplemental Figure 1).
These results were confirmed by using Chromomycin A3, a DNA-specific dye
(Arumuganathan et al. 1994) which preferentially stains GC-rich regions such as the
Nucleolar Organizing Regions (NOR) located on chromosome 2 (Chang et al., 2008).
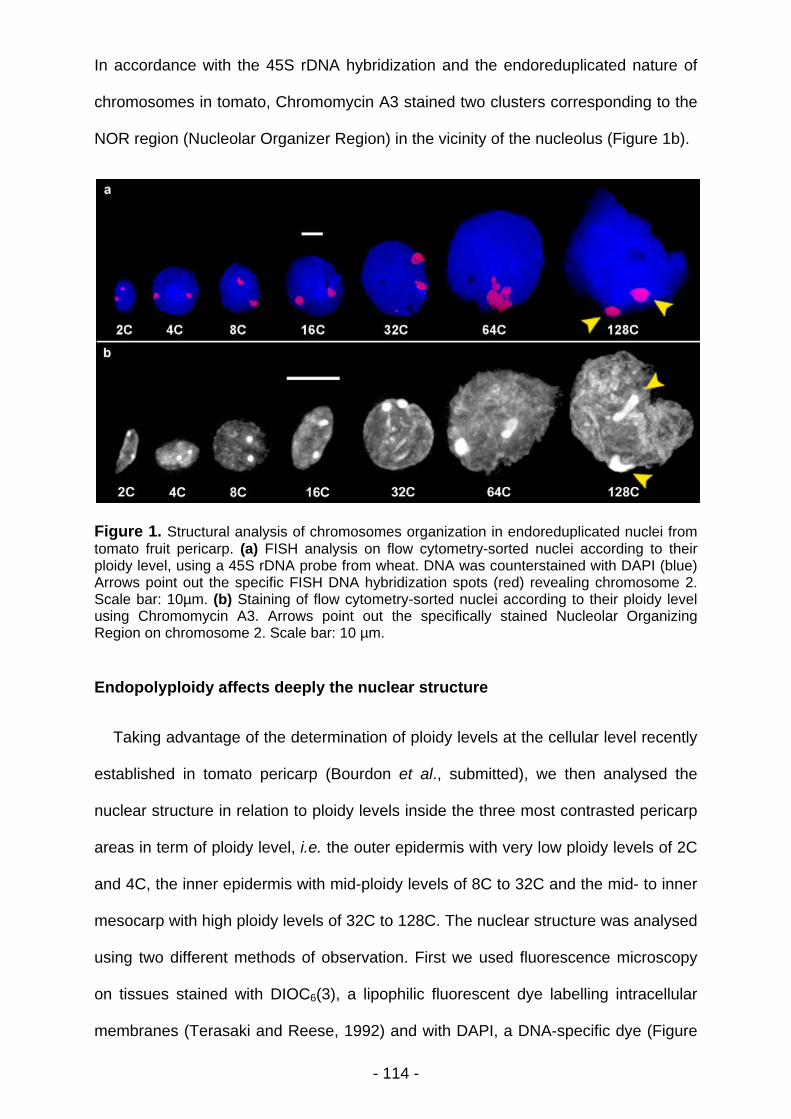
- 114 -
In accordance with the 45S rDNA hybridization and the endoreduplicated nature of
chromosomes in tomato, Chromomycin A3 stained two clusters corresponding to the
NOR region (Nucleolar Organizer Region) in the vicinity of the nucleolus (Figure 1b).
Figure 1. Structural analysis of chromosomes organization in endoreduplicated nuclei from tomato fruit pericarp. (a) FISH analysis on flow cytometry-sorted nuclei according to their ploidy level, using a 45S rDNA probe from wheat. DNA was counterstained with DAPI (blue) Arrows point out the specific FISH DNA hybridization spots (red) revealing chromosome 2. Scale bar: 10µm. (b) Staining of flow cytometry-sorted nuclei according to their ploidy level using Chromomycin A3. Arrows point out the specifically stained Nucleolar Organizing Region on chromosome 2. Scale bar: 10 µm.
Endopolyploidy affects deeply the nuclear structure
Taking advantage of the determination of ploidy levels at the cellular level recently
established in tomato pericarp (Bourdon et al., submitted), we then analysed the
nuclear structure in relation to ploidy levels inside the three most contrasted pericarp
areas in term of ploidy level, i.e. the outer epidermis with very low ploidy levels of 2C
and 4C, the inner epidermis with mid-ploidy levels of 8C to 32C and the mid- to inner
mesocarp with high ploidy levels of 32C to 128C. The nuclear structure was analysed
using two different methods of observation. First we used fluorescence microscopy
on tissues stained with DIOC6(3), a lipophilic fluorescent dye labelling intracellular
membranes (Terasaki and Reese, 1992) and with DAPI, a DNA-specific dye (Figure
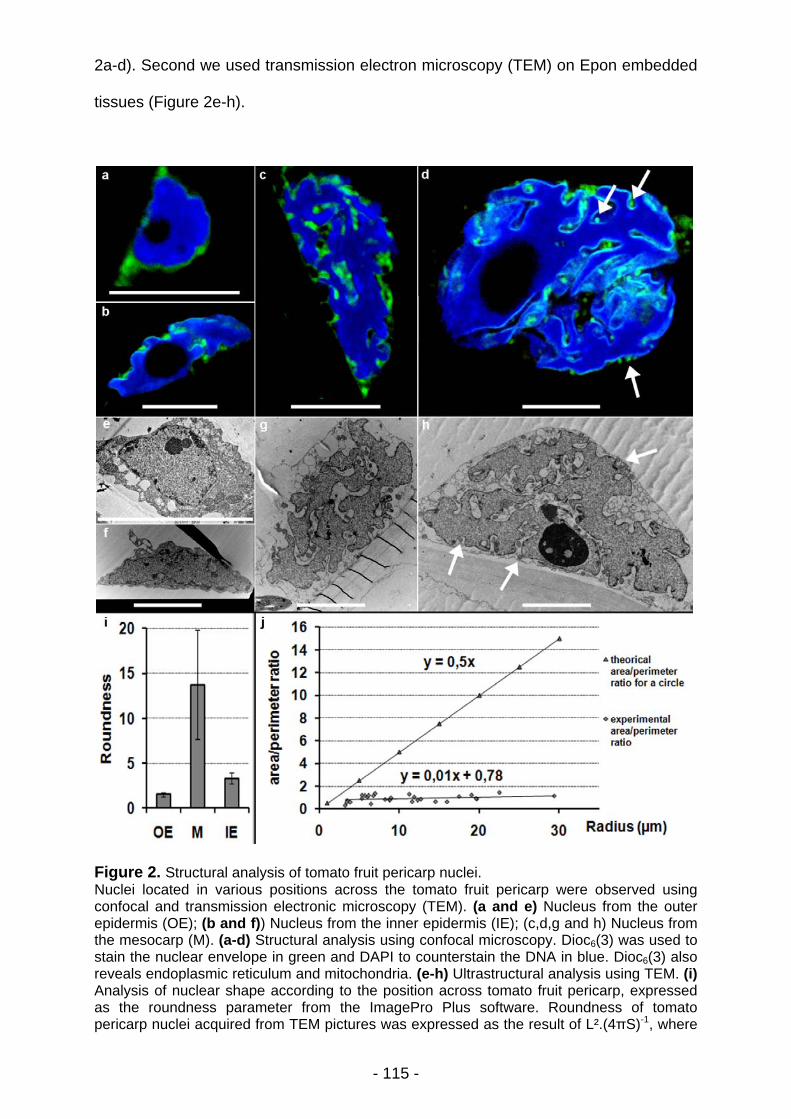
- 115 -
2a-d). Second we used transmission electron microscopy (TEM) on Epon embedded
tissues (Figure 2e-h).
Figure 2. Structural analysis of tomato fruit pericarp nuclei. Nuclei located in various positions across the tomato fruit pericarp were observed using confocal and transmission electronic microscopy (TEM). (a and e) Nucleus from the outer epidermis (OE); (b and f)) Nucleus from the inner epidermis (IE); (c,d,g and h) Nucleus from the mesocarp (M). (a-d) Structural analysis using confocal microscopy. Dioc6(3) was used to stain the nuclear envelope in green and DAPI to counterstain the DNA in blue. Dioc6(3) also reveals endoplasmic reticulum and mitochondria. (e-h) Ultrastructural analysis using TEM. (i) Analysis of nuclear shape according to the position across tomato fruit pericarp, expressed as the roundness parameter from the ImagePro Plus software. Roundness of tomato pericarp nuclei acquired from TEM pictures was expressed as the result of L².(4πS)-1, where
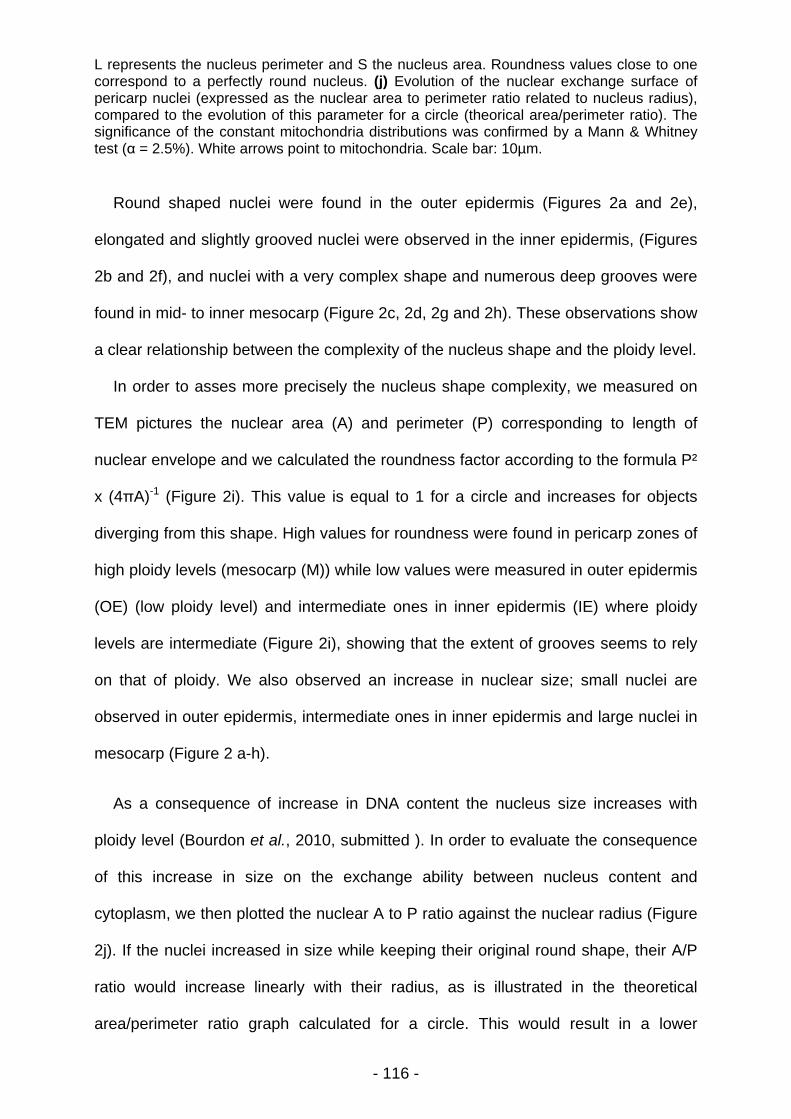
- 116 -
L represents the nucleus perimeter and S the nucleus area. Roundness values close to one correspond to a perfectly round nucleus. (j) Evolution of the nuclear exchange surface of pericarp nuclei (expressed as the nuclear area to perimeter ratio related to nucleus radius), compared to the evolution of this parameter for a circle (theorical area/perimeter ratio). The significance of the constant mitochondria distributions was confirmed by a Mann & Whitney test (α = 2.5%). White arrows point to mitochondria. Scale bar: 10µm.
Round shaped nuclei were found in the outer epidermis (Figures 2a and 2e),
elongated and slightly grooved nuclei were observed in the inner epidermis, (Figures
2b and 2f), and nuclei with a very complex shape and numerous deep grooves were
found in mid- to inner mesocarp (Figure 2c, 2d, 2g and 2h). These observations show
a clear relationship between the complexity of the nucleus shape and the ploidy level.
In order to asses more precisely the nucleus shape complexity, we measured on
TEM pictures the nuclear area (A) and perimeter (P) corresponding to length of
nuclear envelope and we calculated the roundness factor according to the formula P²
x (4πA)-1 (Figure 2i). This value is equal to 1 for a circle and increases for objects
diverging from this shape. High values for roundness were found in pericarp zones of
high ploidy levels (mesocarp (M)) while low values were measured in outer epidermis
(OE) (low ploidy level) and intermediate ones in inner epidermis (IE) where ploidy
levels are intermediate (Figure 2i), showing that the extent of grooves seems to rely
on that of ploidy. We also observed an increase in nuclear size; small nuclei are
observed in outer epidermis, intermediate ones in inner epidermis and large nuclei in
mesocarp (Figure 2 a-h).
As a consequence of increase in DNA content the nucleus size increases with
ploidy level (Bourdon et al., 2010, submitted ). In order to evaluate the consequence
of this increase in size on the exchange ability between nucleus content and
cytoplasm, we then plotted the nuclear A to P ratio against the nuclear radius (Figure
2j). If the nuclei increased in size while keeping their original round shape, their A/P
ratio would increase linearly with their radius, as is illustrated in the theoretical
area/perimeter ratio graph calculated for a circle. This would result in a lower
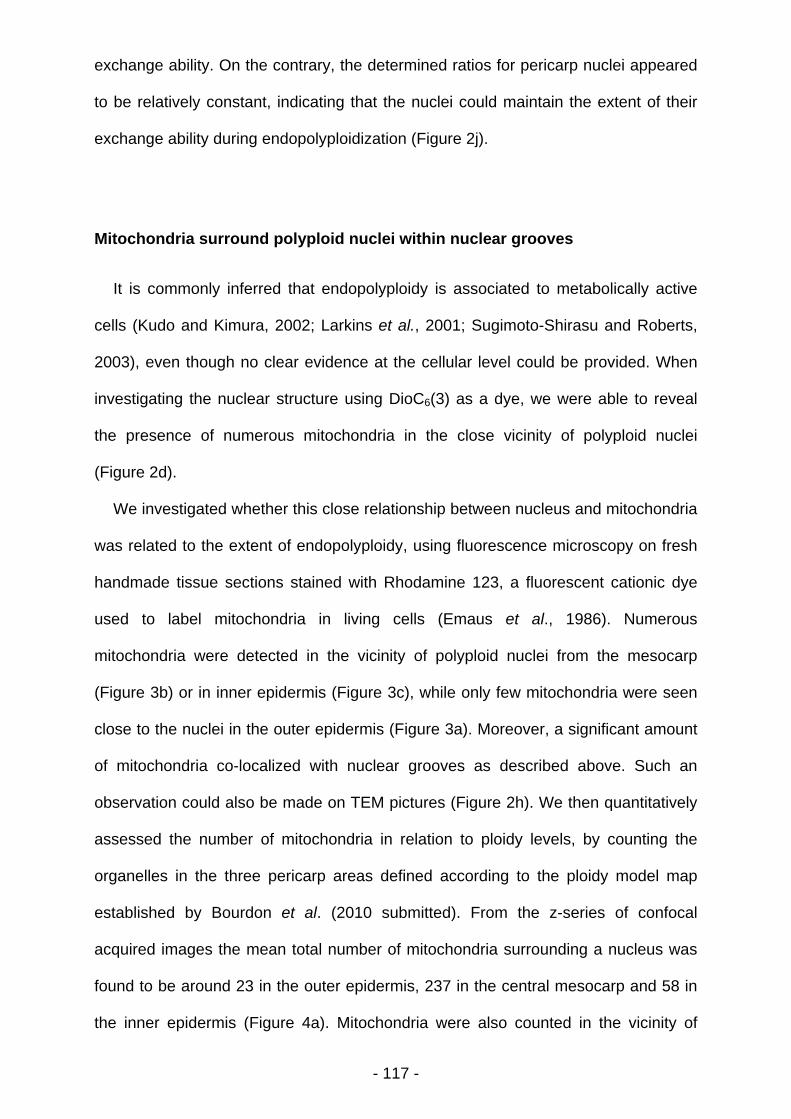
- 117 -
exchange ability. On the contrary, the determined ratios for pericarp nuclei appeared
to be relatively constant, indicating that the nuclei could maintain the extent of their
exchange ability during endopolyploidization (Figure 2j).
Mitochondria surround polyploid nuclei within nuclear grooves
It is commonly inferred that endopolyploidy is associated to metabolically active
cells (Kudo and Kimura, 2002; Larkins et al., 2001; Sugimoto-Shirasu and Roberts,
2003), even though no clear evidence at the cellular level could be provided. When
investigating the nuclear structure using DioC6(3) as a dye, we were able to reveal
the presence of numerous mitochondria in the close vicinity of polyploid nuclei
(Figure 2d).
We investigated whether this close relationship between nucleus and mitochondria
was related to the extent of endopolyploidy, using fluorescence microscopy on fresh
handmade tissue sections stained with Rhodamine 123, a fluorescent cationic dye
used to label mitochondria in living cells (Emaus et al., 1986). Numerous
mitochondria were detected in the vicinity of polyploid nuclei from the mesocarp
(Figure 3b) or in inner epidermis (Figure 3c), while only few mitochondria were seen
close to the nuclei in the outer epidermis (Figure 3a). Moreover, a significant amount
of mitochondria co-localized with nuclear grooves as described above. Such an
observation could also be made on TEM pictures (Figure 2h). We then quantitatively
assessed the number of mitochondria in relation to ploidy levels, by counting the
organelles in the three pericarp areas defined according to the ploidy model map
established by Bourdon et al. (2010 submitted). From the z-series of confocal
acquired images the mean total number of mitochondria surrounding a nucleus was
found to be around 23 in the outer epidermis, 237 in the central mesocarp and 58 in
the inner epidermis (Figure 4a). Mitochondria were also counted in the vicinity of
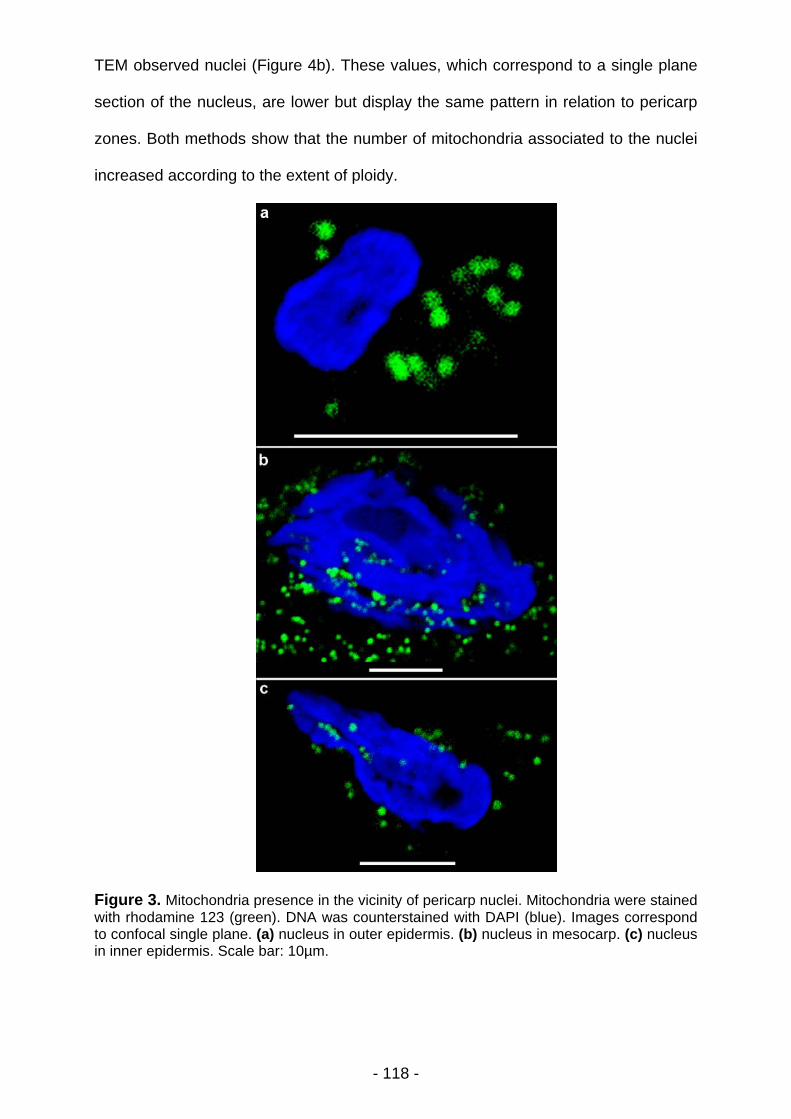
- 118 -
TEM observed nuclei (Figure 4b). These values, which correspond to a single plane
section of the nucleus, are lower but display the same pattern in relation to pericarp
zones. Both methods show that the number of mitochondria associated to the nuclei
increased according to the extent of ploidy.
Figure 3. Mitochondria presence in the vicinity of pericarp nuclei. Mitochondria were stained with rhodamine 123 (green). DNA was counterstained with DAPI (blue). Images correspond to confocal single plane. (a) nucleus in outer epidermis. (b) nucleus in mesocarp. (c) nucleus in inner epidermis. Scale bar: 10µm.
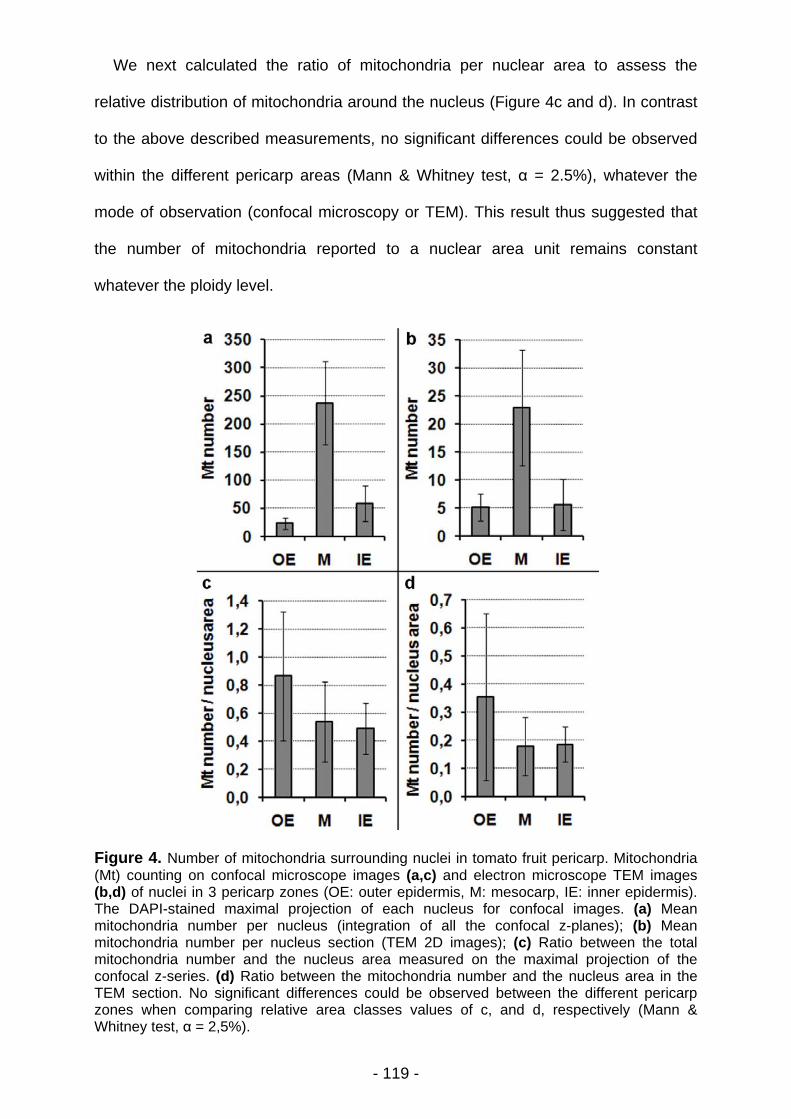
- 119 -
We next calculated the ratio of mitochondria per nuclear area to assess the
relative distribution of mitochondria around the nucleus (Figure 4c and d). In contrast
to the above described measurements, no significant differences could be observed
within the different pericarp areas (Mann & Whitney test, α = 2.5%), whatever the
mode of observation (confocal microscopy or TEM). This result thus suggested that
the number of mitochondria reported to a nuclear area unit remains constant
whatever the ploidy level.
Figure 4. Number of mitochondria surrounding nuclei in tomato fruit pericarp. Mitochondria (Mt) counting on confocal microscope images (a,c) and electron microscope TEM images (b,d) of nuclei in 3 pericarp zones (OE: outer epidermis, M: mesocarp, IE: inner epidermis). The DAPI-stained maximal projection of each nucleus for confocal images. (a) Mean mitochondria number per nucleus (integration of all the confocal z-planes); (b) Mean mitochondria number per nucleus section (TEM 2D images); (c) Ratio between the total mitochondria number and the nucleus area measured on the maximal projection of the confocal z-series. (d) Ratio between the mitochondria number and the nucleus area in the TEM section. No significant differences could be observed between the different pericarp zones when comparing relative area classes values of c, and d, respectively (Mann & Whitney test, α = 2,5%).
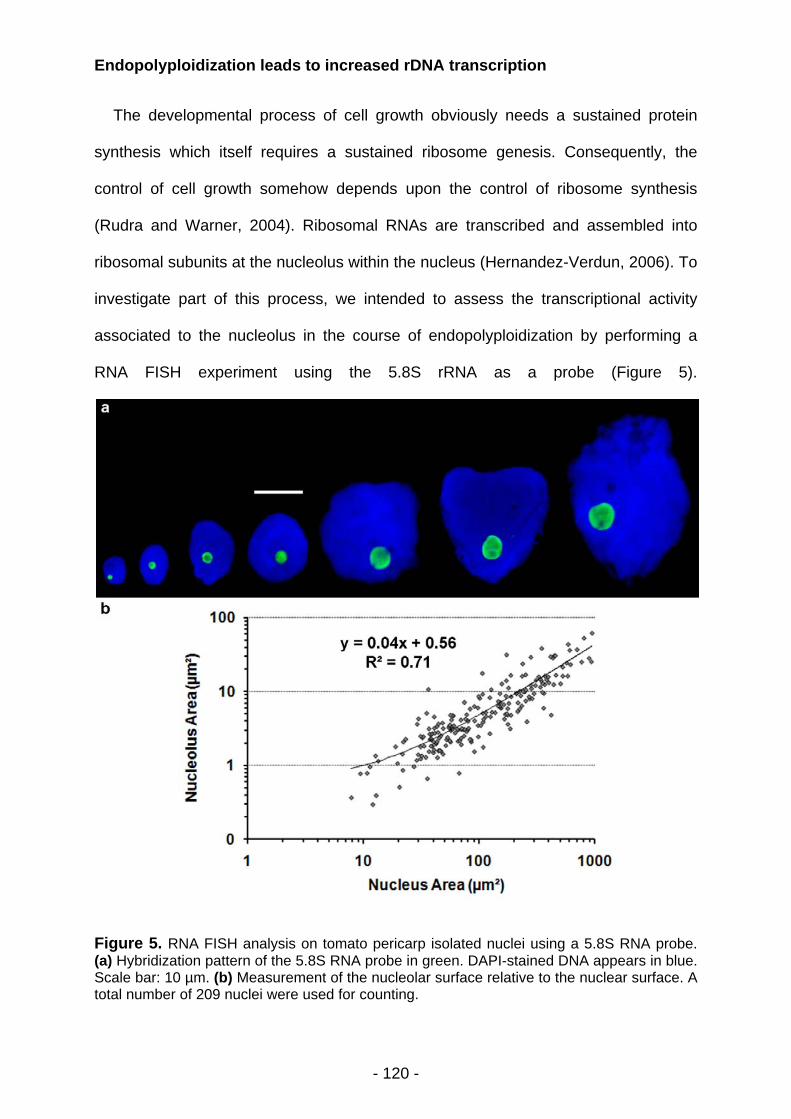
- 120 -
Endopolyploidization leads to increased rDNA transcription
The developmental process of cell growth obviously needs a sustained protein
synthesis which itself requires a sustained ribosome genesis. Consequently, the
control of cell growth somehow depends upon the control of ribosome synthesis
(Rudra and Warner, 2004). Ribosomal RNAs are transcribed and assembled into
ribosomal subunits at the nucleolus within the nucleus (Hernandez-Verdun, 2006). To
investigate part of this process, we intended to assess the transcriptional activity
associated to the nucleolus in the course of endopolyploidization by performing a
RNA FISH experiment using the 5.8S rRNA as a probe (Figure 5).
Figure 5. RNA FISH analysis on tomato pericarp isolated nuclei using a 5.8S RNA probe. (a) Hybridization pattern of the 5.8S RNA probe in green. DAPI-stained DNA appears in blue. Scale bar: 10 µm. (b) Measurement of the nucleolar surface relative to the nuclear surface. A total number of 209 nuclei were used for counting.
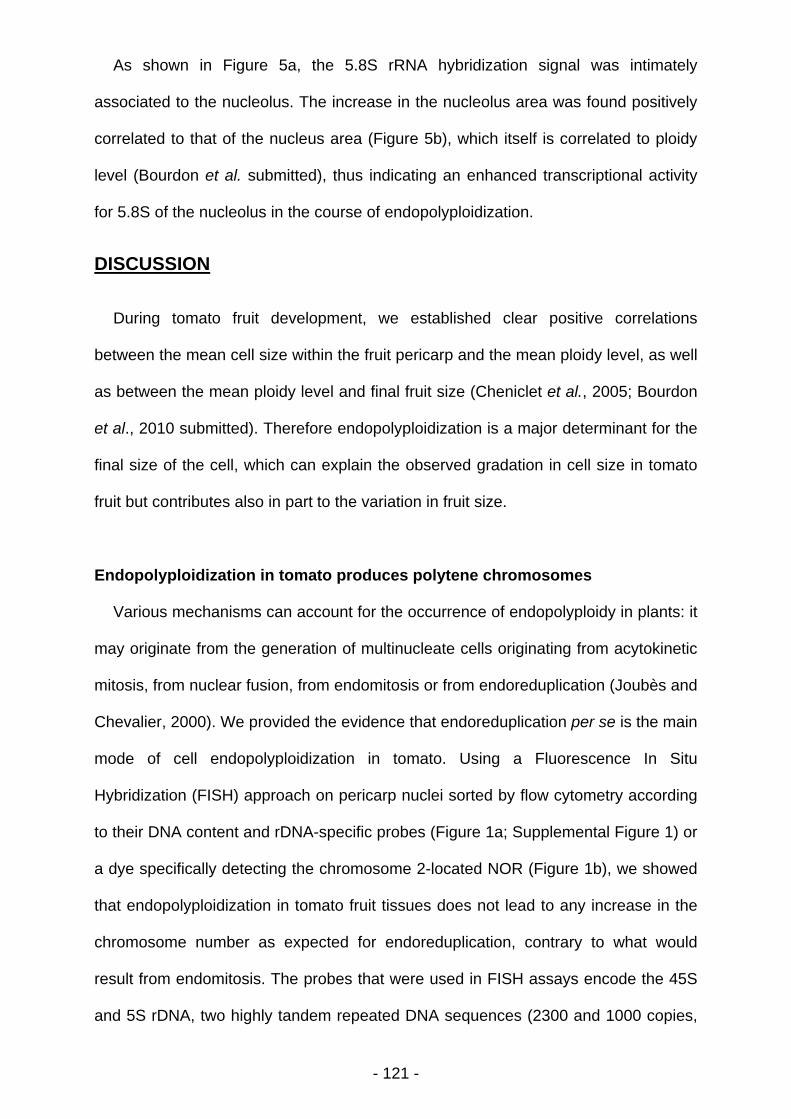
- 121 -
As shown in Figure 5a, the 5.8S rRNA hybridization signal was intimately
associated to the nucleolus. The increase in the nucleolus area was found positively
correlated to that of the nucleus area (Figure 5b), which itself is correlated to ploidy
level (Bourdon et al. submitted), thus indicating an enhanced transcriptional activity
for 5.8S of the nucleolus in the course of endopolyploidization.
DISCUSSION
During tomato fruit development, we established clear positive correlations
between the mean cell size within the fruit pericarp and the mean ploidy level, as well
as between the mean ploidy level and final fruit size (Cheniclet et al., 2005; Bourdon
et al., 2010 submitted). Therefore endopolyploidization is a major determinant for the
final size of the cell, which can explain the observed gradation in cell size in tomato
fruit but contributes also in part to the variation in fruit size.
Endopolyploidization in tomato produces polytene chromosomes
Various mechanisms can account for the occurrence of endopolyploidy in plants: it
may originate from the generation of multinucleate cells originating from acytokinetic
mitosis, from nuclear fusion, from endomitosis or from endoreduplication (Joubès and
Chevalier, 2000). We provided the evidence that endoreduplication per se is the main
mode of cell endopolyploidization in tomato. Using a Fluorescence In Situ
Hybridization (FISH) approach on pericarp nuclei sorted by flow cytometry according
to their DNA content and rDNA-specific probes (Figure 1a; Supplemental Figure 1) or
a dye specifically detecting the chromosome 2-located NOR (Figure 1b), we showed
that endopolyploidization in tomato fruit tissues does not lead to any increase in the
chromosome number as expected for endoreduplication, contrary to what would
result from endomitosis. The probes that were used in FISH assays encode the 45S
and 5S rDNA, two highly tandem repeated DNA sequences (2300 and 1000 copies,
- 122 -
respectively; Chang et al., 2008). The use of non-repeated DNA sequences encoded
by BAC probes specifically hybridizing to chromosome 7 and 11 allowed us to
confirm that endopolyploidization in tomato produces chromosomes with 2n
chromatids (Bourdon et al., 2010; submitted). Indeed, we could obtain in this study
FISH signals that were organized in two clusters displaying a number of hybridizing
dots (thus corresponding to the detected chromatids) that were nicely correlated to
the various ploidy levels. Altogether these results demonstrate the polytene
organization of tomato chromosomes in endopolyploid cells.
Polytene chromosomes are thus characterized by the pairing of sister chromatids
that stay attached to the same centromere. However, such a chromatid pairing is not
always evident (Carvalheira, 2000), and classic vs. nonclassic polyteny was even
described (Zybina and Zybina, 1996). In tomato fruit nuclei, chromosomes are not
even visible and indirect techniques such as FISH or Chromomycin A3 staining could
reveal restricted areas of chromosomes that demonstrated the occurrence of
polyteny (Figure 1). The biological significance of such a chromosomal organisation
is largely unknown. In Arabidopsis, it has been shown that GFP-tagged loci have a
greater range of movement in endoreduplicated cells compared to their diploid
counterparts (Kato and Lam, 2003), while the centromeres of endoreduplicated
chromosomes are intimately linked to the nuclear envelope, thus constraining
movement (Fang and Spector, 2005). Even if these observed chromosomal
organisation and potential movement are not well understood, it may be interpreted
in light of specific chromosomal territories. Indeed such a positioning of the genome
in the nuclear volume is thought to be of great importance in the regulation of gene
expression (Schoenfelder et al., 2010). Hence, polyteny, by restraining chromosome
to specific nuclear areas (Figure 1) could maintain chromosomal territories during
endoreduplication, and thus offer a better efficiency for gene transcription by
grouping co-regulated genes to restricted “transcription factories”.
- 123 -
Endoreduplication triggers the formation of a highly structured supra-cellular
system during fruit development.
The tomato fruit pericarp is composed of a broad variety of cell types from the
inner epidermis to outer epidermis according to a complex differentiation pattern
during fruit development (Bourdon et al., 2010, submitted). Endoreduplication has
often been associated with the cell differentiation process, because it is associated
with the final differentiation of cells or organs, such as in leaf trichomes, suspensor
cells or hypocotyls (D'Amato, 1984; Gendreau et al., 1997; Hulskamp et al., 1999).
However, the direct implication of endoreduplication in driving cell differentiation is
still a matter of debate. So far the best established model for cell differentiation
related to endoreduplication is the Arabidopsis leaf trichome, where the number of
endoreduplication cycles determines the branching shape of the cell (Ishida et al.,
2008). Moreover, Bramsiepe et al. (2010) showed recently that endoreduplication is
directly implicated in trichome cell fate maintenance as the promotion of
endoreduplication in glabrous patterning mutants restores trichome initiation.
In tomato, our previous analysis of the ploidy level distribution and cell fate across
the pericarp tissue showed no evidence for any positive correlation between
endoreduplication and cell fate, since a definite ploidy level or a definite ploidy extent
cannot be assigned to a precise cell fate or cell size (Bourdon et al., 2010,
submitted). Although cell size has been classically described as being positively
correlated to endoreduplication in wild type tomato fruits (Cheniclet et al., 2005;
Nafati et al., 2011, in press), we have shown that there is a great discrepancy of cell
sizes in the pericarp with partially overlapping ploidy levels (Bourdon et al., 2010,
submitted). These data were in full agreement with the proposed hypothesis from
Nafati et al. (2011, in press) stating that endoreduplication would rather support a
range of cell size than a precise definite one, thus supporting the idea that it would
serve as a trigger for cell growth (Mathieu-Rivet et al., 2010) .
- 124 -
The nuclear structure of endoreduplicated cells in tomato pericarp is deeply
affected by endopolyploidization. Nuclei appear as complex organelles, with highly
invaginated and groovy nuclear envelopes (Figure 2). Such nuclear grooves were
already reported for plant and animal nuclei (Fricker et al., 1997; Collings et al.,
2000). Even if this structural feature was suggested to be associated with polyploidy
(Collings et al., 2000), it has been neither reported elsewhere, to our knowledge, nor
directly linked to the extent of DNA ploidy. We were able to show that
endoreduplicated nuclei within the fruit pericarp maintain a constant area to perimeter
ratio (Figure 2j), suggesting that the profound invaginations characterizing the
endoreduplicated nuclei operate to ensure the maintenance of efficient nucleus to
cytoplasm communications, despite the increase in cell volume. Interestingly,
numerous mitochondia were found to be localized in the grooves of the
endoreduplicated nuclear envelope (Figure 3), i.e. at the level of the cytoplasm-to-
nucleus exchange surface. Therefore the presence of a large population of
mitochondria close to the endoreduplicated nuclear envelope could be explained by
an absolute need of ATP synthesis, required as an energy supply for nuclear
biochemical processes such as DNA replication, and even transcription and
translation activities during endoreduplication.
Endoreduplication impacts the nucleolus activity
The functional role of endoreduplication on the differentiation of metabolically-
specialized cells has been commonly stated (but still not demonstrated at the cellular
level) (Chevalier et al., 2011, in press). The highly polyploid endosperm cells of
maize kernels which accumulate large amounts of starch and storage proteins
(Sabelli and Larkins, 2009), and the nitrogen-fixing symbiotic root nodule cells in
legumes (Cebolla et al., 1999) are quoted as metabolically specialized and highly
endoreduplicated cells. Interestingly an important transcriptional activity is tightly
- 125 -
linked to the endoreduplication-associated nitrogen-fixing nodules (Mergaert et al.,
2003). As far as tomato fruit is concerned, only descriptive analyses for
transcriptional and metabolic profiling in endoreduplicated tissues were provided
(Lemaire-Chamley et al., 2005; Mounet et al., 2009; Schauer et al., 2006;
Steinhauser et al., 2010), without any direct link with the extent of endoreduplication.
Using a 5.8S rDNA probe in RNA FISH experiment, we here provide evidence that
not only the size of the nucleolus was positively correlated with the nucleus size and
consequently with ploidy levels (Figure 5), but more importantly that the transcription
of 5.8S rDNA was enhanced during endoreduplication. These data are consistent
with our observation of the enlargement of the Nucleolar Organizing Region revealed
by chromomycin A3 staining (Figure 1b). Such a nucleolus enlargement has been
reported in rodent trophoblasts (Zybina and Zybina, 1996) and drosophila (Pierce et
al., 2004), in light of increased transcriptional and translational activities in the
context of endopolyploidization. Interestingly, this feature was also associated with
the rate of proliferating activity in cancer cells (Derenzini et al., 2000). It is therefore
tempting to draw a parallel with a putative increased rate of growth induced by
endoreduplication. The adjustment of a nuclear-to-cytoplasmic ratio to drive cell
growth (according to the karyoplasmic theory; Sugimoto-Shirasu and Roberts, 2003)
would thus require to control the ribosomal RNA and protein synthesis as to enhance
the ribosome biogenesis, in order to control the number of “cytoplasmic factories”
essential for a sustained cell growth.
By manipulating the expression of a gene that is specifically associated with
endoreduplication, Mathieu-Rivet et al. (2010) demonstrated the biological
significance of endoreduplication as a determinant for cell and fruit growth in tomato.
In addition, the manipulation of endoreduplication and consequent induction of fruit
growth also impacted greatly nitrogen metabolism in developing fruits, establishing a
link between endoreduplication-induced growth and primary metabolism.
- 126 -
Interestingly, it was recently reported in yeast that polyploidy-associated differential
gene regulation is regulated by the increase in cell size (Wu et al., 2010): a causal
relationship between cell size and transcription was indeed demonstrated,
suggesting that cells adjust their transcriptional capacities to their geometric
properties including cell size.
CONCLUSION
According to Anisimov (2005), endopolyploidization can be seen as a mean to
provide a highly functional supra-cellular oligomerized system, centralizing
physiological functions aimed at improving the ergonomy of the cell and simplifying
intracellular regulations. Alongside with previous studies (Cheniclet et al., 2005;
Bourdon et al., 2010 submitted; Mathieu-Rivet et al., 2010; Nafati et al., in press), the
present report has contributed to enlighten the functional role of endoreduplication in
the establishment of a highly structured supra-cellular system required for the
promotion of cell growth during tomato fruit development. In cooperation with the
adjustment of the nuclear-to-cytoplasmic volume ratio, different levels of specific
structural (chromosomal, nuclear) organization in endoreduplicated cells were
observed which could account for the involvement of endoreduplication in the
determination of cell growth.
- 127 -
EXPERIMENTAL PROCEDURES
Plant material and growth conditions
Cherry tomato (Solanum lycopersicum Mill. cv Wva106) plants were grown in a
greenhouse under a thermoperiod of 25°C/20°C and a photoperiod of 14/10 h
(day/night). Tomato fruits were harvested at mature green stage (29-32 dpa (days
post anthesis)).
Flow cytometry
Nuclei were prepared from about 2 mm thick sections of tomato pericarp (without
septa) from equatorial region by gentle chopping with a razor blade in 2 ml of
Galbraith’s extraction buffer (Galbraith et al., 1983). The suspension was filtered
twice through a 48 µm nylon mesh and nuclei were stained with DAPI at a final
concentration of 5 µg.ml-1. With a 405 nm laser, light-scatter to gate on nuclei,
height/area discrimination against doublets and signal area of the 455 nm emission,
nuclei were sorted with a MoFlo XDP cytometer (Beckman Coulter, Roissy, France;
www.beckmancoulter.com) using standard isotonic sheath, 3 drop sorting and
coincidence abort. For chromomycin A3 labelling experiments three fruits were used
to prepare slides containing 500 nuclei of each ploidy level (2C to 128C) sorted
directly onto 3-well microscope glass slides (Superfrost®; CML France, www.cml.fr)
prepared with 20 µl of a cushion made of 500 mM sucrose, in 50% Galbraith’s buffer,
(Galbraith et al., 1983) 2% paraformaldehyde and 50 µg.ml-1 chromomycin A3. Image
acquisition was performed in a short delay after nucleus sorting. For FISH
experiments, 3 fruits were used for preparing slides containing up to 2000 nuclei of a
given ploidy level (2C to 128C). Nuclei were sorted on slides covered with 10 µl of a
500 mM sucrose cushion, allowed to dry at room temperature and stored at -20°C.
To maintain nuclear morphology when sorting onto slides, a slower flow was used,
- 128 -
with sheath at 15 psi. DAPI and chromomycin A3 were from Sigma-Aldrich (St. Louis,
USA).
Probes for Fluorescent In Situ Hybridization (FISH)
A 45S rDNA ribosomal probe was used for DNA FISH experiments. The pTa71
plasmid contains a 9 kbp-long EcoRI fragment encoding the 45S rDNA repeat unit
(18S-5.8S-26S genes and spacers) isolated from Triticum aestivum (Gerlach and
Bedbrook, 1979). The 5S rDNA ribosomal probe from tomato was as described in Xu
and Earle (1996). Probes were labeled by random priming with biotin-14-dUTP
according to manufacturer’s recommendations (In Vitrogen, Life Technologies,
Paisley, UK). For RNA FISH, the 5.8S sequence of the 45S (5.8S, 18S and 25S)
rDNA transcription unit was amplified by PCR. The sense probe used as a negative
control was amplified using the following set of 5’ and 3’ primers respectively:
TAATACGACTCACTATAGGGACAAACGACTCTCGGCAAC and
CGTGACGCCCAGGCAGACGTGCCCTCGGCCAAATGGCTTC. The antisense
probe was amplified using the following set of 5’ and 3’ primers respectively:
ACAAACGACTCTCGGCAACGGATATCTCGGCTCTCGCAT and
TAATACGACTCACTATAGGGAGGCAGACGTGCCCTCG. For both combinations of
primers, the sequence of the T7 promoter (indicated as underlined) was included in
the 5’ primer (synthesis of the sense probe) and in the 3’ primer (synthesis of the
antisense probe) to allow the specific transcription by the T7 RNA polymerase. PCR
were performed using tomato (cv Microtom) genomic DNA. Amplicons were then
purified on agarose gel with Wizard® PCR Preps DNA Purification System
(Promega, Madison, Wisconsin, USA). Then RNA Digoxigenin labeled probes were
synthesized by in vitro transcription assays with the SP6/T7 DIG RNA labeling kit
(Roche Diagnostics, Meylan France) according to manufacturer’s instructions. The
- 129 -
DIG labeling efficiency was then checked by dot blot using Anti-Digoxigenin-AP, Fab
fragments (Roche Diagnostics, Meylan France ).
DNA FISH procedures
DNA FISH was performed as described in Bourdon et al. (2010, submitted) using
flow-cytometry sorted nuclei according to their ploidy levels
Preparation of isolated nuclei for RNA FISH
Nuclei were prepared on ice from about 2 mm thick sections of 30 dpa tomato
pericarp (without septa) by gentle chopping with a razor blade in 1 mL of CyStain UV
ploidy buffer (Partec). The suspension was filtered through a 30 µm nylon mesh
directly on 400 µl of 2M sucrose cushion in the same buffer and centrifuged at 1200 g
for 10 min at 4°C in order to pellet the amyloplasts. 150µL of the centrifuged
suspension were then recovered just over the cushion interface, taked and were
gently homogenized by pipetting up and down. Finally, 10µL of this homogenate
were deposited and spread out on pasteurized microscope glass slides and allowed
to dry.
RNA FISH
RNA FISH was performed directly after nuclei isolation as described in Jolly et
al.(1997), using a protocol adapted from Popp et al.(1990). Nuclei prepared as
described above were prefixed in 4% paraformaldehyde/PBS during 10 min, then
washed twice in Tris-HCl 0.1M during 5 min, permeabilized in HCl 0.1M for 10 min,
then in 0.5% saponin/triton X100 in PBS three times for 5 min, protected in 20%
glycerol in PBS, once again permeabilized in liquid nitrogen 3 times for 3 s, and
finally dehydrated in ascending ethanol baths of 5 min each (70%, 90%, 100% at -
20°C) and allowed to dry for 15 min. The hybridization mixture consisted of 50%
- 130 -
deionized formamide, 10% dextran sulfate, 2X SSC, 0.25% SDS, 0.2 µg.ml-1 of
sonicated salmon sperm DNA and 100 ng per slide of labeled probes previously
denatured at 92°C for 6 min and cooled in ice bath for 15 min. In situ hybridization
was carried out overnight at 37°C. Post-hybridization washes were in 2X SSC for 5
min at 42°C, 5 min in 50% formamide in 2X·SSC at 42°C, 5 min in 2X SSC at 42°C, 5
min in 4X SSC-0.2% Tween 20 at 42°C, 5 min in 4X SSC-0.2% at room temperature.
Slides were then saturated with 200 µl of 5% BSA in 4X SSC-0.2% Tween 20
solution for 5 min at room temperature. Digoxigenin labeled probes were detected by
Anti-Digoxigenin-Fluorescein (Roche Diagnostics, Meylan France). The Nuclei were
finally mounted and counterstained in Vectashield (Vector Laboratories, Burlingame,
USA), containing 1.5 µg.mL-1 DAPI. Three negative controls were performed to
confirm the specificity of this protocol: 1) hybridization with the T7 transcribed 5.8S
sense probe described above; 2) include a 1 h treatment with RNAse right after the
nuclei isolation step; 3) hybridization with a mock treatment (DEPC treated water
instead of the DIG-labeled probe).
Dioc6(3) labelling
Equatorial hand made slices of 30 dpa fruit pericarp were cut into small pieces and
fixed under vacuum infiltration at 20 kPa for 1 hour at 20°C in 4% paraformaldehyde
in 0.1M phosphate buffer pH7.2. Fixed tissues were left in the fixative solution
overnight, finally washed for 10 min in 0.1M phosphate buffer. 150 µm sections were
then obtained using a vibrating blade microtome (Microm HM 650V; MicroTech
France, http://mm-france.fr/), under very slow and large amplitude sectioning.
Staining of the nuclear envelope was then performed for 10 min in a 1.7 nM 3,3'-
Dihexyloxacarbocyanine iodide (DioC6(3)) solution in 0.1M phosphate buffer pH7.2.
Finally, the sections were briefly washed in 0.1M phosphate buffer pH7.2 and
mounted on microscope glass slides in the same buffer.
- 131 -
Mitochondria staining
All steps were performed in a medium consisting in 0.1 M phosphate buffer pH7.2
with 0.3 M sorbitol. Fresh 30 dpa pericarp hand-made sections from fruit equatorial
region were stained for 1 min with 0.5 µM Rhodamine 123 (Emaus et al., 1986).
Sections were then briefly washed for 1 min, stained 1 min with 10 µg.mL-1 DAPI
(Sigma-Aldrich, St. Louis, USA), washed again for 1min and finally mounted in 0.1M
phosphate buffer pH7.2 with 0.3M sorbitol and immediatly observed with confocal
microscope.
Fluorescence microscopy
Fluorescent images of the nuclei were recorded as z-series on a confocal laser-
scanning microscope (Leica, Scanhead TCS-SP2 on a DMRXA2, Leica
Microsystems, http://www.leica-microsystems.com/) with a 63x/NA1.4 HCX PL APO
objective. The excitation (Ex) and emission (Em) wavelengths were as follow: for
Dioc6(3) Ex 488 nm (argon laser) Em 505-555, for Rhodamine 123 Ex 496 nm (argon
laser) Em 500-560 nm, for DAPI Ex 405 nm (diode) Em 430-490 nm, for 45S and 5S
rDNA FISH, (Texas red labeled probes) Ex 543nm (helium/neon laser) Em 570-675,
for 5.8S RNA FISH (Fluorescein labeled probes) Ex 488nm (argon laser) Ex 500-550
nm. Images of nuclei stained with chromomycin A3 were acquired on a Leica
DMI6000 microscope with a 20x objective and with Ex 450-490 Em long pass 515
nm.
Electron microscopy
Pericarp fragments excised from fruit equatorial plane were fixed in 2.5%
glutaraldehyde in 150 mM phosphate buffer pH 7.2 for 4-6 hr at 4°C. During the first
30-40 min after immersion in the fixative the samples were submitted to a partial
vacuum (20 kPa) to extract intercellular gas. After 3 washes in phosphate buffer
- 132 -
(successively 200 mM, 150 mM and 100 mM), the samples were post-fixed in 1%
osmium tetroxide in 100 mM phosphate buffer for 3 hr at 4°C, rinsed again with
phosphate buffer (100 mM then 50 mM) and water. An additional fixation step was
performed in 1% tannic acid (BDH) in water for 30 min at room temperature. Tissues
were dehydrated at 4°C through an ethanol series, infiltrated successively with
propylene oxide (2 x 10min), propylene oxide/Epon (1:1, v/v) (2 hr in capped vials
then 2 hr in open vials under ventilated hood) and finally in Epon overnight. The
samples were embedded in Epon in gelatine capsules and polymerization achieved
for 3 days at 60°C.
Semi-thin sections (1 µm) were made with glass knives on a Reichert 2040
microtome, stained with toluidine blue and photographed on a Zeiss Axiophot
microscope with a Spot camera (Diagnostics Instruments). The most interesting
nuclei were located and their position in pericarp recorded on printed images.
Ultrathin sections (50 nm) of the selected areas (containing interesting nuclei) were
then made with a diamond knife on a Reichert Ultracut S ultramicrotome collected on
naked 600 mesh hexagonal grids or parlodion-coated 100 or 200 mesh grids, and
stained with 7% uranyl acetate (ethanol 50%) and optionally with lead citrate. Digital
images were acquired on a CM10 (FEI) transmission electron microscope with an
AMT camera (Elexience).
Image analysis
All measurements and counting were made with Image ProPlus 6.2 software
(Media Cybernetics Inc., www.mediacy.com).
For measurements of nuclear grooves on TEM images, the nuclear radius was
calculated as the mean value of Feret min and Feret max, being respectively the
width and length of the smallest rectangle enclosing the nucleus. The nuclear
perimeter was measured as the length of nuclear envelope, including that of
- 133 -
enclosed invaginations. Counting of mitochondria on TEM images was performed by
tagging the mitochondria close to the nucleus, i.e. at a maximal distance of ca. 2 µm
from the nuclear envelope (the mean size of mitochondria in this tissue being 1
µmx0.5 µm).
For mitochondria (stained with Rhodamine) counting the z-series were treated by
blind deconvolution using the AutoQuant X software (Roper Scientific). The outline of
the nucleus was determined by image segmentation on the maximal projection of the
DAPI series. This outline was applied onto the Rhodamine series and the
mitochondria located within this outline or in the ca. 1 µm width surrounding area
were manually tagged on each z-plane with Image Pro Plus. This method ensures
that mitochondria which are visible on two successive planes due to the poor
resolution in z-axis are not counted twice.
Since a small sampling was used for image analyses, significantly different
distributions between pericarp areas (i.e. inner- and outer epidermis, mesocarp) were
tested with a non-parametric Mann & Whitney test (α = 2.5%).
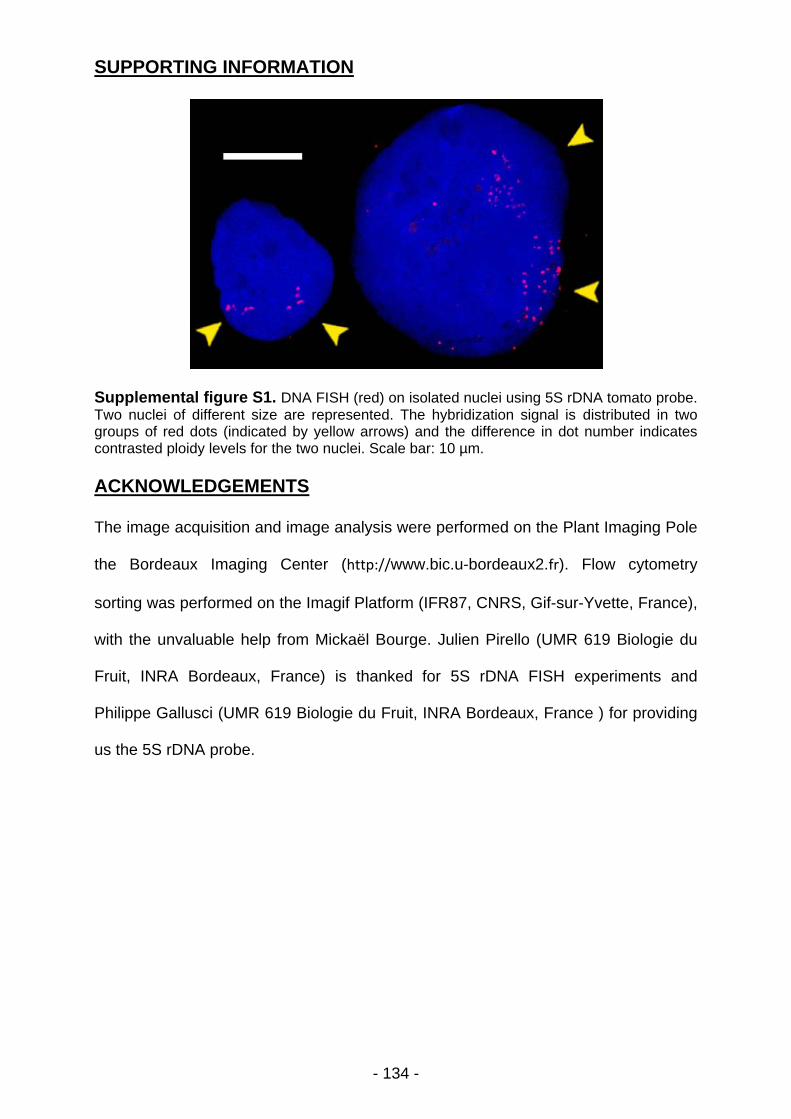
- 134 -
SUPPORTING INFORMATION
Supplemental figure S1. DNA FISH (red) on isolated nuclei using 5S rDNA tomato probe. Two nuclei of different size are represented. The hybridization signal is distributed in two groups of red dots (indicated by yellow arrows) and the difference in dot number indicates contrasted ploidy levels for the two nuclei. Scale bar: 10 µm. ACKNOWLEDGEMENTS
The image acquisition and image analysis were performed on the Plant Imaging Pole
the Bordeaux Imaging Center (http://www.bic.u-bordeaux2.fr). Flow cytometry
sorting was performed on the Imagif Platform (IFR87, CNRS, Gif-sur-Yvette, France),
with the unvaluable help from Mickaël Bourge. Julien Pirello (UMR 619 Biologie du
Fruit, INRA Bordeaux, France) is thanked for 5S rDNA FISH experiments and
Philippe Gallusci (UMR 619 Biologie du Fruit, INRA Bordeaux, France ) for providing
us the 5S rDNA probe.
- 135 -
REFERENCES
Anisimov, A.P. (2005) Endopolyploidy as a morphogenetic factor of development.
Cell Biology International, 29, 993-1004.
Arumuganathan, K., Martin, G.B., Telenius, H., Tanksley, S.D. and Earle, E.D.
(1994) Chromosome 2-specific DNA clones from flow-sorted chromosomes of
tomato. Molecular and General Genetics MGG, 242, 551-558.
Baroux, C., Fransz, P. and Grossniklaus, U. (2004) Nuclear fusions contribute to
polyploidization of the gigantic nuclei in the chalazal endosperm of
Arabidopsis. Planta, 220, 38-46.
Berger, F. (2003) Endosperm: the crossroad of seed development. Current Opinion
in Plant Biology, 6, 42-50.
Bourdon, M., Coriton, O., Cheniclet, C., Brown, S., Poujol, C., Chevalier, C.,
Renaudin, J.-P., Frangne, N. (2010) In planta quantification of
endopolyploidy using Fluorescent In Situ Hybridization (FISH).
SubmittedBramsiepe, J., Wester, K., Weinl, C., Roodbarkelari, F., Kasili,
R., Larkin, J.C., Hülskamp, M. and Schnittger, A. (2010) Endoreplication
Controls Cell Fate Maintenance. PLoS Genet, 6, e1000996.
Carvalheira, G.M.G. (2000) Plant polytene chromosomes. Genetics and Molecular
Biology, 23, 1043-1050.
Cebolla, A., Maria Vinardell, J., Kiss, E., Olah, B., Roudier, F., Kondorosi, A. and
Kondorosi, E. (1999) The mitotic inhibitor ccs52 is required for
endoreduplication and ploidy-dependent cell enlargement in plants. EMBO J,
18, 4476-4484.
Chang, S.-B., Yang, T.-J., Datema, E., van Vugt, J., Vosman, B., Kuipers, A.,
Meznikova, M., Szinay, D., Lankhorst, R., Jacobsen, E. and de Jong, H.
(2008) FISH mapping and molecular organization of the major repetitive
sequences of tomato. Chromosome Research, 16, 919-933.
Cheniclet, C., Rong, W.Y., Causse, M., Frangne, N., Bolling, L., Carde, J.-P. and
Renaudin, J.-P. (2005) Cell Expansion and Endoreduplication Show a Large
Genetic Variability in Pericarp and Contribute Strongly to Tomato Fruit Growth.
Plant Physiol., 139, 1984-1994.
Chevalier, C., Nafati, M., Mathieu-Rivet, E., Bourdon M., Frangne, N., Cheniclet,
C., Renaudin J.-P. Gévaudant, F., Hernould, M. (2011) Elucidating the
functional role of endoreduplication in tomato fruit development. Ann. Bot., in
press.
- 136 -
Collings, D.A., Carter, C.N., Rink, J.C., Scott, A.C., Wyatt, S.E. and Allen, N.S.
(2000) Plant Nuclei Can Contain Extensive Grooves and Invaginations. Plant
Cell, 12, 2425-2440.
D'Amato, F. (1984) Role of polyploidy in reproductive organs and tissues. Johri, BM
(ed) . Embryology of angiosperms . Springer, New York, 519-566.
De Veylder, L., Beeckman, T. and Inze, D. (2007) The ins and outs of the plant cell
cycle. Nature Reviews Molecular Cell Biology, 8, 655-665.
Derenzini, M., Trere, D., Pession, A., Govoni, M., Sirri, V. and Chieco, P. (2000)
Nucleolar size indicates the rapidity of cell proliferation in cancer tissues.
Journal of Pathology, 191, 181-186.
Emaus, R.K., Grunwald, R. and Lemasters, J.J. (1986) RHODAMINE-123 AS A
PROBE OF TRANSMEMBRANE POTENTIAL IN ISOLATED RAT-LIVER
MITOCHONDRIA - SPECTRAL AND METABOLIC PROPERTIES. Biochimica
Et Biophysica Acta, 850, 436-448.
Fang, Y. and Spector, D.L. (2005) Centromere Positioning and Dynamics in Living
Arabidopsis Plants. Mol. Biol. Cell, 16, 5710-5718.
Fricker, M., Hollinshead, M., White, N. and Vaux, D. (1997) Interphase Nuclei of
Many Mammalian Cell Types Contain Deep, Dynamic, Tubular Membrane-
bound Invaginations of the Nuclear Envelope. The Journal of Cell Biology,
136, 531-544.
Galbraith, D.W., Harkins, K.R., Maddox, J.M., Ayres, N.M., Sharma, D.P. and
Firoozabady, E. (1983) Rapid Flow Cytometric Analysis of the Cell Cycle in
Intact Plant Tissues. Science, 220, 1049-1051.
Galitski, T., Saldanha, A.J., Styles, C.A., Lander, E.S. and Fink, G.R. (1999)
Ploidy Regulation of Gene Expression. Science, 285, 251-254.
Gendreau, E., Traas, J., Desnos, T., Grandjean, O., Caboche, M. and Hofte, H.
(1997) Cellular Basis of Hypocotyl Growth in Arabidopsis thaliana. Plant
Physiol., 114, 295-305.
Gerlach, W.L. and Bedbrook, J.R. (1979) Cloning and characterization of ribosomal
RNA genes from wheat and barley. Nucleic Acids Research, 7, 1869-1885.
Gonzalez, N., Gevaudant, F., Hernould, M., Chevalier, C. and Mouras, A. (2007)
The cell cycle-associated protein kinase WEE1 regulates cell size in relation to
endoreduplication in developing tomato fruit. Plant Journal, 51, 642-655.
Hase, Y., Trung, K.H., Matsunaga, T. and Tanaka, A. (2006) A mutation in the uvi4
gene promotes progression of endo-reduplication and confers increased
tolerance towards ultraviolet B light. The Plant Journal, 46, 317-326.
- 137 -
Hernandez-Verdun, D. (2006) Nucleolus: from structure to dynamics. Histochemistry
and Cell Biology, 125, 127-137.
Hulskamp, M., Schnittger, A. and Folkers, U. (1999) Pattern formation and cell
differentiation: Trichomes in Arabidopsis as a genetic model system.
International Review of Cytology - a Survey of Cell Biology, Vol 186, 186, 147-
178.
Ishida, T., Kurata, T., Okada, K., Wada, T. (2008) A genetic regulatory network in
the development of trichomes and root hairs. Annual Review in Plant Biology,
59, 365-386.
Jo, S.-H., Koo, D.-H., Kim, J., Hur, C.-G., Lee, S., Yang, T.-j., Kwon, S.-Y. and
Choi, D. (2009) Evolution of ribosomal DNA-derived satellite repeat in tomato
genome. BMC Plant Biology, 9, 42.
Jolly, C., Mongelard, F., Robert-Nicoud, M. and Vourc'h, C. (1997) Optimization of
Nuclear Transcript Detection by FISH and Combination with Fluorescence
Immunocytochemical Detection of Transcription Factors. J. Histochem.
Cytochem., 45, 1585-1592.
Joubès, J. and Chevalier, C. (2000) Endoreduplication in higher plants. Plant
Molecular Biology, 43, 735-745.
Kato, N. and Lam, E. (2003) Chromatin of endoreduplicated pavement cells has
greater range of movement than that of diploid guard cells in Arabidopsis
thaliana. J Cell Sci, 116, 2195-2201.
Kondorosi, E. and Kondorosi, A. (2004) Endoreduplication and activation of the
anaphase-promoting complex during symbiotic cell development. FEBS
Letters, 567, 152-157.
Kudo, N. and Kimura, Y. (2002) Nuclear DNA endoreduplication during petal
development in cabbage: relationship between ploidy levels and cell size. J.
Exp. Bot., 53, 1017-1023.
Lapitan, N.L.V., Ganal, M.W. and Tanksley, S.D. (1991) ORGANIZATION OF THE
5S-RIBOSOMAL RNA GENES IN THE GENOME OF TOMATO. Genome, 34,
509-514.
Larkins, B.A., Dilkes, B.P., Dante, R.A., Coelho, C.M., Woo, Y.m. and Liu, Y.
(2001) Investigating the hows and whys of DNA endoreduplication. Journal of
Experimental Botany, 52, 183-192.
Lemaire-Chamley, M., Petit, J., Garcia, V., Just, D., Baldet, P., Germain, V.,
Fagard, M., Mouassite, M., Cheniclet, C. and Rothan, C. (2005) Changes in
- 138 -
Transcriptional Profiles Are Associated with Early Fruit Tissue Specialization in
Tomato. Plant Physiol., 139, 750-769.
Mathieu-Rivet, E., Gevaudant, F., Sicard, A., Salar, S., Do, P.T., Mouras, A.,
Fernie, A.R., Gibon, Y., Rothan, C., Chevalier, C. and Hernould, M. (2010)
Functional analysis of the anaphase promoting complex activator CCS52A
highlights the crucial role of endo-reduplication for fruit growth in tomato. Plant
Journal, 62, 727-741.
Mergaert, P., Nikovics, K., Kelemen, Z., Maunoury, N., Vaubert, D., Kondorosi,
A. and Kondorosi, E. (2003) A novel family in Medicago truncatula consisting
of more than 300 nodule-specific genes coding for small, secreted
polypeptides with conserved cysteine motifs. Plant Physiology, 132, 161-173.
Mounet, F., Moing, A., Garcia, V., Petit, J., Maucourt, M., Deborde, C., Bernillon,
S., Le Gall, G., Colquhoun, I., Defernez, M., Giraudel, J.-L., Rolin, D.,
Rothan, C. and Lemaire-Chamley, M. (2009) Gene and Metabolite
Regulatory Network Analysis of Early Developing Fruit Tissues Highlights New
Candidate Genes for the Control of Tomato Fruit Composition and
Development. Plant Physiol., 149, 1505-1528.
Nafati, M., Cheniclet, C., Hernould, M., Do, P.T., Fernie, A., Chevalier, C.,
Gévaudant, F. (2011) The specific overexpression of a Cyclin Dependent
Kinase Inhibitor in tomato fruit mesocarp cells uncouples endoreduplication
and cell growth. Plant J., in press.
Nagl, W. (1975) DNA endoreduplication and polyteny understood as evolutionary
strategies. Nature, UK, 261, 614-615.
Pierce, S.B., Yost, C., Britton, J.S., Loo, L.W.M., Flynn, E.M., Edgar, B.A. and
Eisenman, R.N. (2004) dMyc is required for larval growth and endoreplication
in Drosophila. Development, 131, 2317-2327.
Popp, S., Scholl, H.P., Loos, P., Jauch, A., Stelzer, E., Cremer, C. and Cremer, T.
(1990) Distribution of chromosome 18 and X centric heterochromatin in the
interphase nucleus of cultured human cells. Experimental Cell Research, 189,
1-12.
Rudra, D. and Warner, J.R. (2004) What better measure than ribosome synthesis?
Genes & Development, 18, 2431-2436.
Sabelli, P.A. and Larkins, B.A. (2009) The contribution of cell cycle regulation to
endosperm development. Sexual Plant Reproduction, 22, 207-219.
- 139 -
Schauer, N., Semel, Y., Roessner, U., Gur, A., Balbo, I., Carrari, F., Pleban, T.,
Perez-Melis, A., Bruedigam, C., Kopka, J., Willmitzer, L., Zamir, D. and
Fernie, A.R. (2006) Comprehensive metabolic profiling and phenotyping of
interspecific introgression lines for tomato improvement. Nature
Biotechnology, 24, 447-454.
Schoenfelder, S., Sexton, T., Chakalova, L., Cope, N.F., Horton, A., Andrews, S.,
Kurukuti, S., Mitchell, J.A., Umlauf, D., Dimitrova, D.S., Eskiw, C.H., Luo,
Y., Wei, C.-L., Ruan, Y., Bieker, J.J. and Fraser, P. (2010) Preferential
associations between co-regulated genes reveal a transcriptional interactome
in erythroid cells. Nat Genet, 42, 53-61.
Steinhauser, M.C., Steinhauser, D., Koehl, K., Carrari, F., Gibon, Y., Fernie, A.R.
and Stitt, M. (2010) Enzyme Activity Profiles during Fruit Development in
Tomato Cultivars and Solanum pennellii. Plant Physiology, 153, 80-98.
Sugimoto-Shirasu, K. and Roberts, K. (2003) "Big it up": endoreduplication and
cell-size control in plants. Current Opinion in Plant Biology, 6, 544-553.
Terasaki, M. and Reese, T.S. (1992) Characterization of endoplasmic reticulum by
co-localization of BiP and dicarbocyanine dyes. J Cell Sci, 101, 315-322.
Xu, J. and Earle, E.D. (1996) High resolution physical mapping of 45S (5.8S, 18S
and 25S) rDNA gene loci in the tomato genome using a combination of
karyotyping and FISH of pachytene chromosomes. Chromosoma, 104, 545-
550.
Yadegari, R. and Drews, G.N. (2004) Female gametophyte development. Plant Cell,
16, S133-S141.
Zybina, E.V. and Zybina, T.G. (1996) Polytene chromosomes in mammalian cells.
International Review of Cytology - a Survey of Cell Biology, Vol 165, 165, 53-
119.
- 140 -
PARTIE 3 :
RECHERCHE DE MUTANTS AFFECTES DANS
L’ENDOREDUPLICATION : CRIBLAGE DE LA BANQUE DE
MUTANTS TILLING MICRO-TOM
INTRODUCTION
L’endopolyploïdisation, augmentation du nombre de copies d’un génome dans une
cellule, est un phénomène extrêmement répandu chez les eucaryotes, qui
concernerait plus de 90 % des Angiospermes (D'Amato 1984). Ce processus se
caractérise par l’apparition au sein d’organes spécifiques de cellules avec des
gammes de ploïdie variées (Barow 2006). Il est souvent associé à la croissance
cellulaire ou de l’organe et au métabolisme via une amplification fonctionnelle du
génome dans les cellules où il a lieu. Chez les plantes, il atteint des proportions
moyennes (jusqu’à 32 C environ) dans les parties végétatives telles que les feuilles
(Galbraith et al. 1991), l’hypocotyle (Gendreau et al. 1997), alors que les niveaux
atteints dans les organes reproducteurs peuvent être beaucoup plus élevés (jusqu’à
24576 C, (Nagl 1975)). Chez la tomate, on remarque la mise en place de forts
niveaux de ploïdie (256 C à 512 C) au cours du développement du fruit (Bergervoet
et al. 1996, Cheniclet et al. 2005). Une corrélation positive a été démontrée entre la
ploïdie moyenne de fruit, la taille cellulaire moyenne et le poids moyen du fruit au
sein de lignées génétiquement différentes de tomate (Cheniclet, et al. 2005). Il a
aussi été récemment suggéré (Barow and Meister 2003, Bourdon et al. 2010) une
implication de l’endopolyploïdisation dans la vitesse de croissance de l’organe ou
l’espèce considérée. Dans le but de tester cette hypothèse, nous avons cherché à
- 141 -
comparer des lignées de tomate significativement affectées dans l’endoreduplication
et génétiquement proches. Du fait de l’absence, au début de ce travail, de lignées
disponibles (mutants ou plantes transgéniques), nous avons engagé le criblage
d’une banque de mutants de tomate, variété Micro-Tom, pour rechercher des
mutants potentiellement affectés dans l’endoreduplication.
RESULTATS
La banque de mutants TILLING de la variété de tomate Micro-Tom de l’UMR 619
Biologie du Fruit a été utilisée pour la recherche de mutants affectés dans le
phénomène d’endoréduplication. Elle contient approximativement 3000 familles de
mutants m2 conservées sous formes de graines issues de l’autofécondation de
plantes m1 qui correspondent aux graines ayant subi le traitement mutagène (EMS)
(Figure 1). Les plantes ont été annotées lors de leur croissance pour plusieurs
aspects de leur phénotype, notamment les caractéristiques morphologiques des
fruits, dont la taille et l’épaisseur du péricarpe, et ce parfois sur plusieurs générations
(Just D., communication personnelle).
Choix des familles à étudier
La première étape a consisté à choisir parmi toutes les familles de la banque
celles présentant la plus grande probabilité d’être affectées dans l’endoreduplication.
La liste et la description des familles de toute la banque est présente à l’adresse
suivante : http://bordeaux.inra.fr/umr619/live/MMDB/
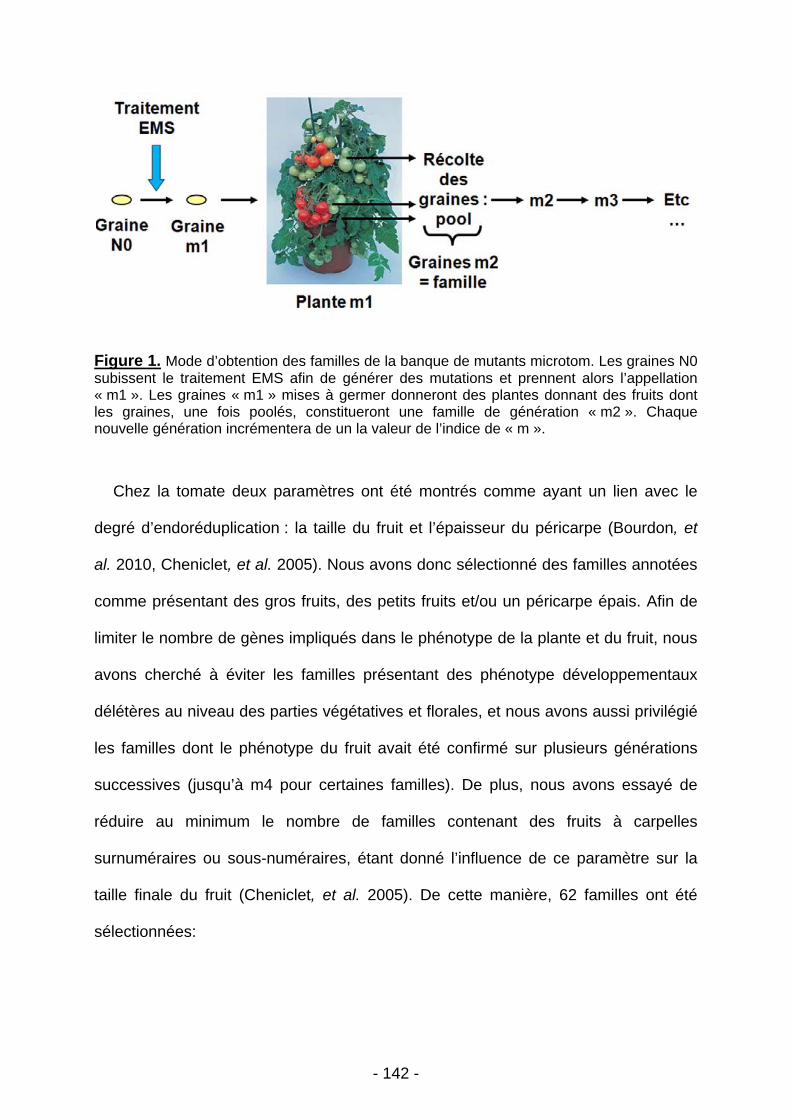
- 142 -
Figure 1. Mode d’obtention des familles de la banque de mutants microtom. Les graines N0 subissent le traitement EMS afin de générer des mutations et prennent alors l’appellation « m1 ». Les graines « m1 » mises à germer donneront des plantes donnant des fruits dont les graines, une fois poolés, constitueront une famille de génération « m2 ». Chaque nouvelle génération incrémentera de un la valeur de l’indice de « m ».
Chez la tomate deux paramètres ont été montrés comme ayant un lien avec le
degré d’endoréduplication : la taille du fruit et l’épaisseur du péricarpe (Bourdon, et
al. 2010, Cheniclet, et al. 2005). Nous avons donc sélectionné des familles annotées
comme présentant des gros fruits, des petits fruits et/ou un péricarpe épais. Afin de
limiter le nombre de gènes impliqués dans le phénotype de la plante et du fruit, nous
avons cherché à éviter les familles présentant des phénotype développementaux
délétères au niveau des parties végétatives et florales, et nous avons aussi privilégié
les familles dont le phénotype du fruit avait été confirmé sur plusieurs générations
successives (jusqu’à m4 pour certaines familles). De plus, nous avons essayé de
réduire au minimum le nombre de familles contenant des fruits à carpelles
surnuméraires ou sous-numéraires, étant donné l’influence de ce paramètre sur la
taille finale du fruit (Cheniclet, et al. 2005). De cette manière, 62 familles ont été
sélectionnées:
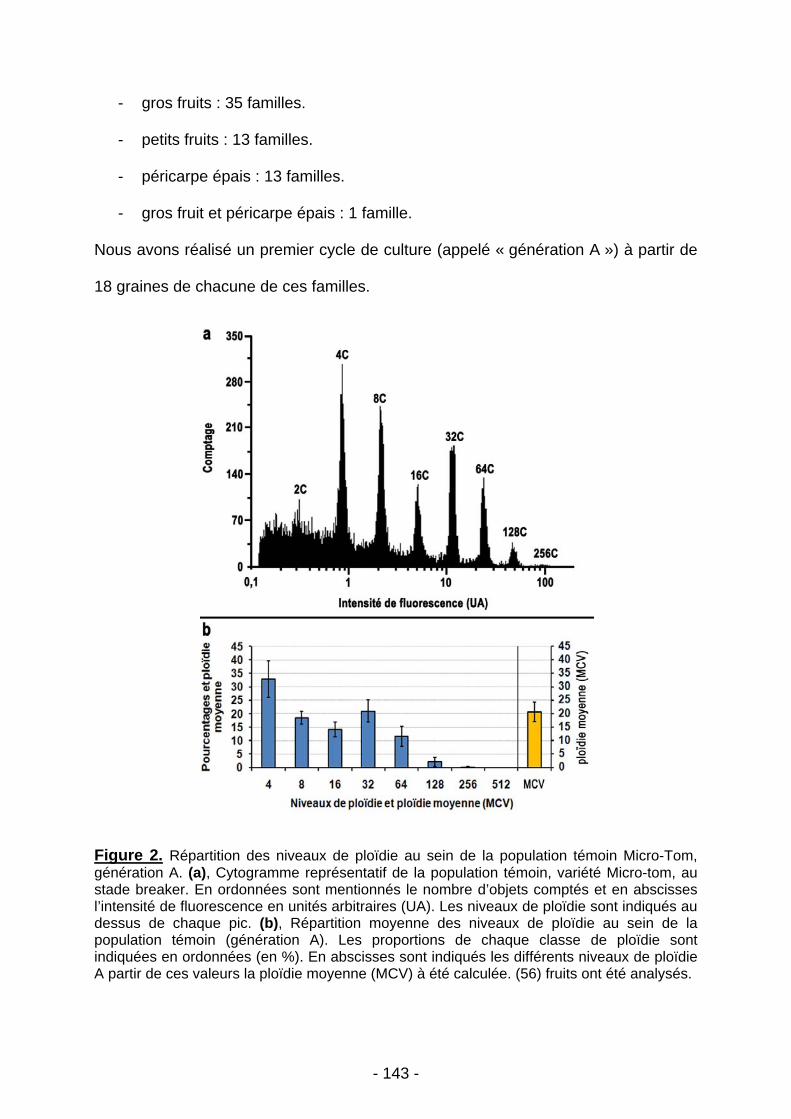
- 143 -
- gros fruits : 35 familles.
- petits fruits : 13 familles.
- péricarpe épais : 13 familles.
- gros fruit et péricarpe épais : 1 famille.
Nous avons réalisé un premier cycle de culture (appelé « génération A ») à partir de
18 graines de chacune de ces familles.
Figure 2. Répartition des niveaux de ploïdie au sein de la population témoin Micro-Tom, génération A. (a), Cytogramme représentatif de la population témoin, variété Micro-tom, au stade breaker. En ordonnées sont mentionnés le nombre d’objets comptés et en abscisses l’intensité de fluorescence en unités arbitraires (UA). Les niveaux de ploïdie sont indiqués au dessus de chaque pic. (b), Répartition moyenne des niveaux de ploïdie au sein de la population témoin (génération A). Les proportions de chaque classe de ploïdie sont indiquées en ordonnées (en %). En abscisses sont indiqués les différents niveaux de ploïdie A partir de ces valeurs la ploïdie moyenne (MCV) à été calculée. (56) fruits ont été analysés.
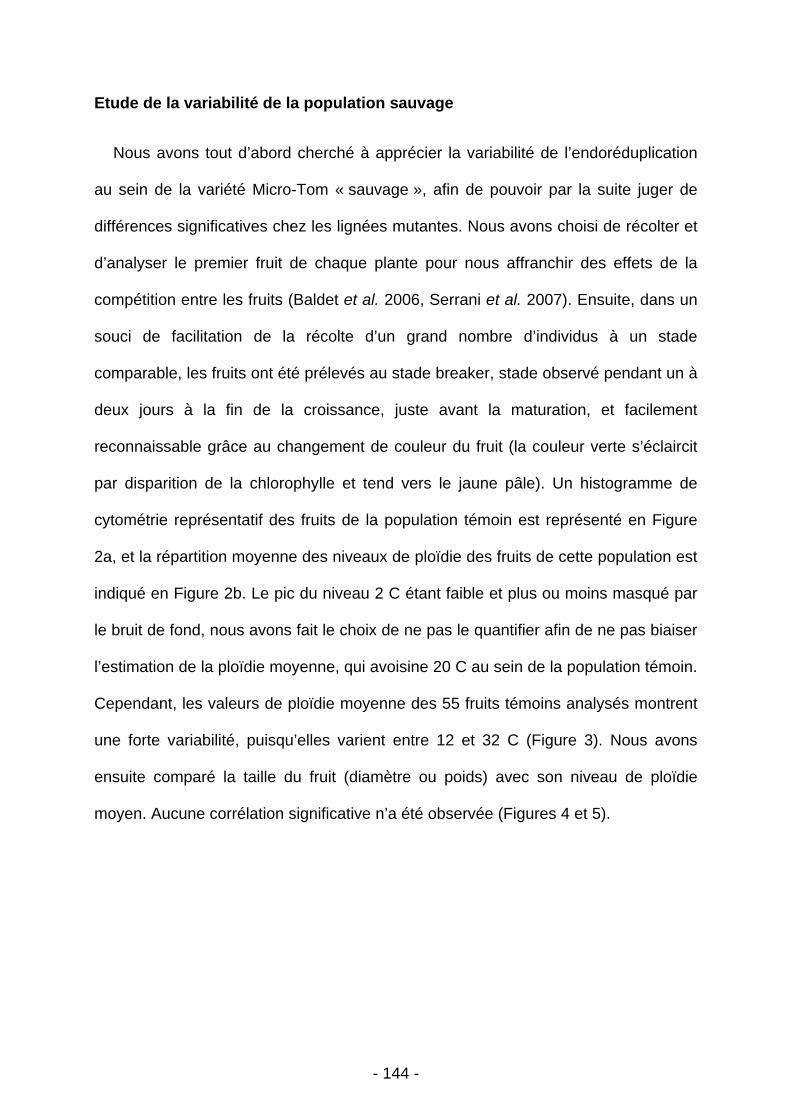
- 144 -
Etude de la variabilité de la population sauvage
Nous avons tout d’abord cherché à apprécier la variabilité de l’endoréduplication
au sein de la variété Micro-Tom « sauvage », afin de pouvoir par la suite juger de
différences significatives chez les lignées mutantes. Nous avons choisi de récolter et
d’analyser le premier fruit de chaque plante pour nous affranchir des effets de la
compétition entre les fruits (Baldet et al. 2006, Serrani et al. 2007). Ensuite, dans un
souci de facilitation de la récolte d’un grand nombre d’individus à un stade
comparable, les fruits ont été prélevés au stade breaker, stade observé pendant un à
deux jours à la fin de la croissance, juste avant la maturation, et facilement
reconnaissable grâce au changement de couleur du fruit (la couleur verte s’éclaircit
par disparition de la chlorophylle et tend vers le jaune pâle). Un histogramme de
cytométrie représentatif des fruits de la population témoin est représenté en Figure
2a, et la répartition moyenne des niveaux de ploïdie des fruits de cette population est
indiqué en Figure 2b. Le pic du niveau 2 C étant faible et plus ou moins masqué par
le bruit de fond, nous avons fait le choix de ne pas le quantifier afin de ne pas biaiser
l’estimation de la ploïdie moyenne, qui avoisine 20 C au sein de la population témoin.
Cependant, les valeurs de ploïdie moyenne des 55 fruits témoins analysés montrent
une forte variabilité, puisqu’elles varient entre 12 et 32 C (Figure 3). Nous avons
ensuite comparé la taille du fruit (diamètre ou poids) avec son niveau de ploïdie
moyen. Aucune corrélation significative n’a été observée (Figures 4 et 5).
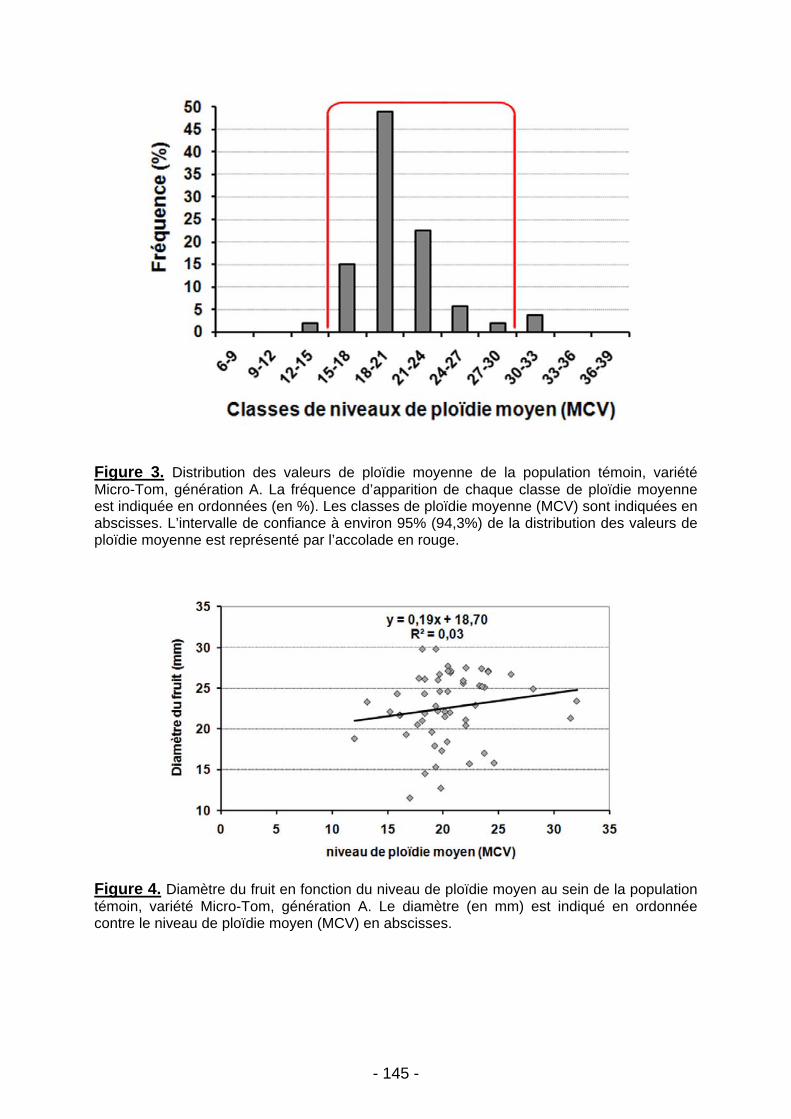
- 145 -
Figure 3. Distribution des valeurs de ploïdie moyenne de la population témoin, variété Micro-Tom, génération A. La fréquence d’apparition de chaque classe de ploïdie moyenne est indiquée en ordonnées (en %). Les classes de ploïdie moyenne (MCV) sont indiquées en abscisses. L’intervalle de confiance à environ 95% (94,3%) de la distribution des valeurs de ploïdie moyenne est représenté par l’accolade en rouge.
Figure 4. Diamètre du fruit en fonction du niveau de ploïdie moyen au sein de la population témoin, variété Micro-Tom, génération A. Le diamètre (en mm) est indiqué en ordonnée contre le niveau de ploïdie moyen (MCV) en abscisses.
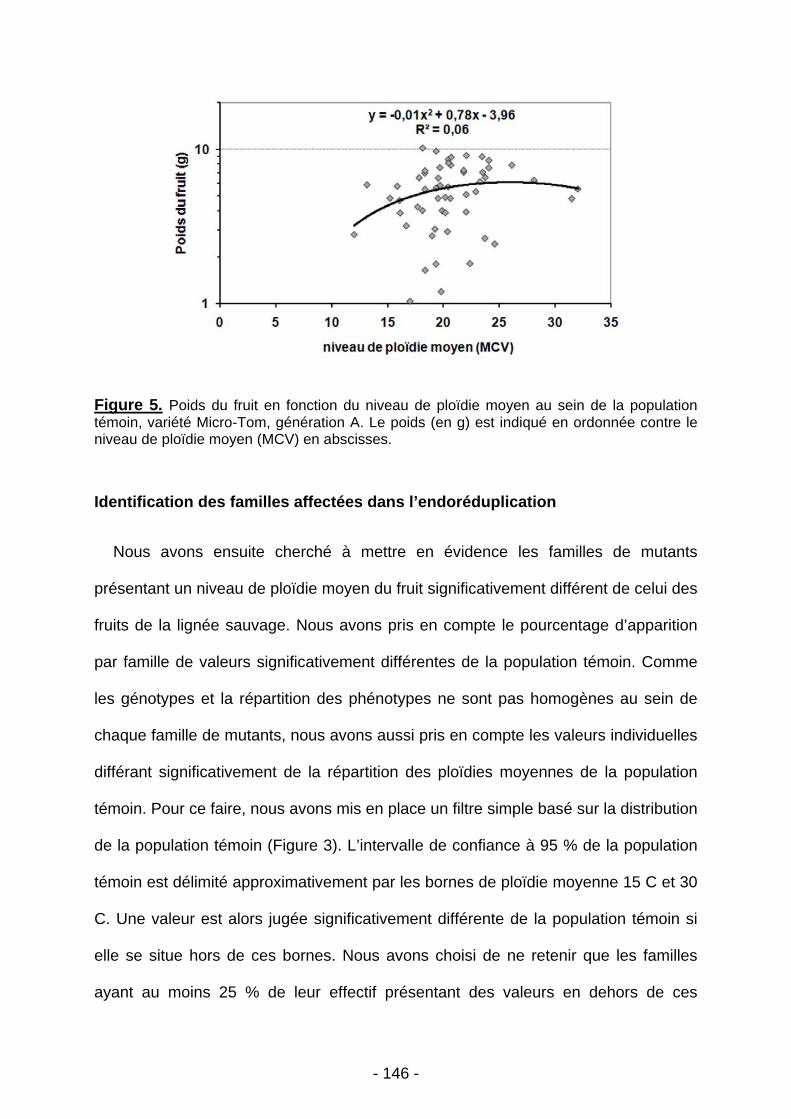
- 146 -
Figure 5. Poids du fruit en fonction du niveau de ploïdie moyen au sein de la population témoin, variété Micro-Tom, génération A. Le poids (en g) est indiqué en ordonnée contre le niveau de ploïdie moyen (MCV) en abscisses.
Identification des familles affectées dans l’endoréduplication
Nous avons ensuite cherché à mettre en évidence les familles de mutants
présentant un niveau de ploïdie moyen du fruit significativement différent de celui des
fruits de la lignée sauvage. Nous avons pris en compte le pourcentage d’apparition
par famille de valeurs significativement différentes de la population témoin. Comme
les génotypes et la répartition des phénotypes ne sont pas homogènes au sein de
chaque famille de mutants, nous avons aussi pris en compte les valeurs individuelles
différant significativement de la répartition des ploïdies moyennes de la population
témoin. Pour ce faire, nous avons mis en place un filtre simple basé sur la distribution
de la population témoin (Figure 3). L’intervalle de confiance à 95 % de la population
témoin est délimité approximativement par les bornes de ploïdie moyenne 15 C et 30
C. Une valeur est alors jugée significativement différente de la population témoin si
elle se situe hors de ces bornes. Nous avons choisi de ne retenir que les familles
ayant au moins 25 % de leur effectif présentant des valeurs en dehors de ces
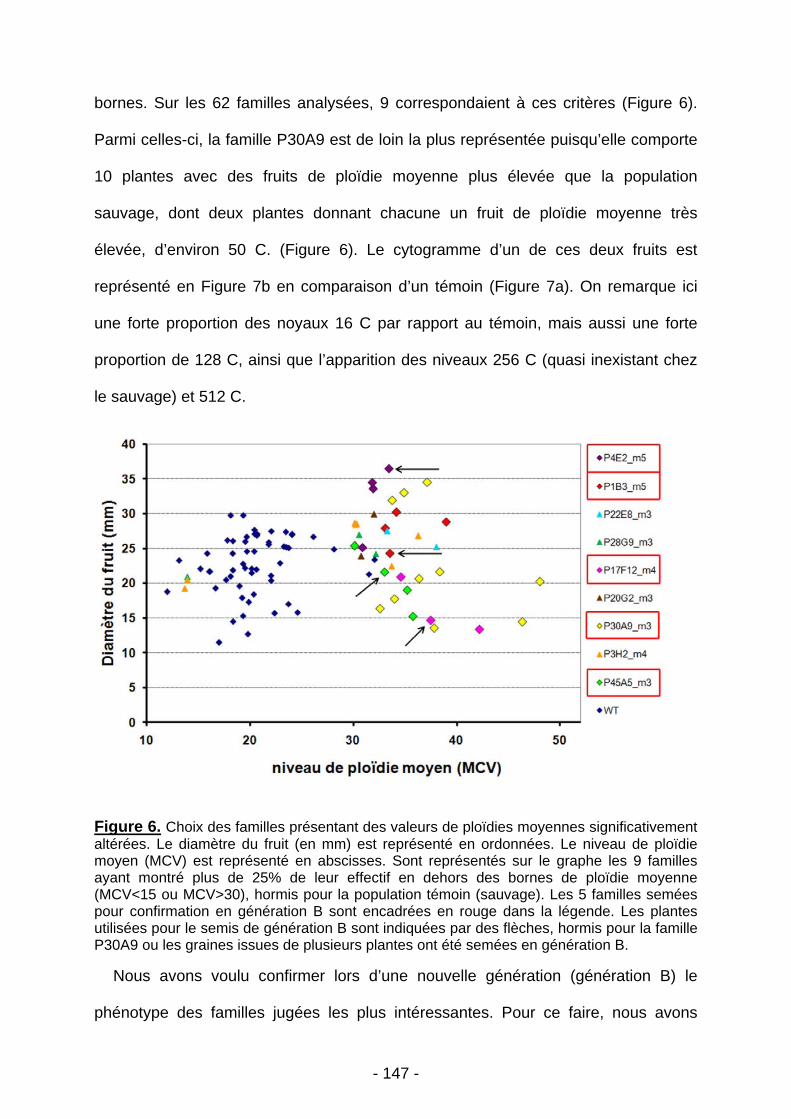
- 147 -
bornes. Sur les 62 familles analysées, 9 correspondaient à ces critères (Figure 6).
Parmi celles-ci, la famille P30A9 est de loin la plus représentée puisqu’elle comporte
10 plantes avec des fruits de ploïdie moyenne plus élevée que la population
sauvage, dont deux plantes donnant chacune un fruit de ploïdie moyenne très
élevée, d’environ 50 C. (Figure 6). Le cytogramme d’un de ces deux fruits est
représenté en Figure 7b en comparaison d’un témoin (Figure 7a). On remarque ici
une forte proportion des noyaux 16 C par rapport au témoin, mais aussi une forte
proportion de 128 C, ainsi que l’apparition des niveaux 256 C (quasi inexistant chez
le sauvage) et 512 C.
Figure 6. Choix des familles présentant des valeurs de ploïdies moyennes significativement altérées. Le diamètre du fruit (en mm) est représenté en ordonnées. Le niveau de ploïdie moyen (MCV) est représenté en abscisses. Sont représentés sur le graphe les 9 familles ayant montré plus de 25% de leur effectif en dehors des bornes de ploïdie moyenne (MCV<15 ou MCV>30), hormis pour la population témoin (sauvage). Les 5 familles semées pour confirmation en génération B sont encadrées en rouge dans la légende. Les plantes utilisées pour le semis de génération B sont indiquées par des flèches, hormis pour la famille P30A9 ou les graines issues de plusieurs plantes ont été semées en génération B.
Nous avons voulu confirmer lors d’une nouvelle génération (génération B) le
phénotype des familles jugées les plus intéressantes. Pour ce faire, nous avons
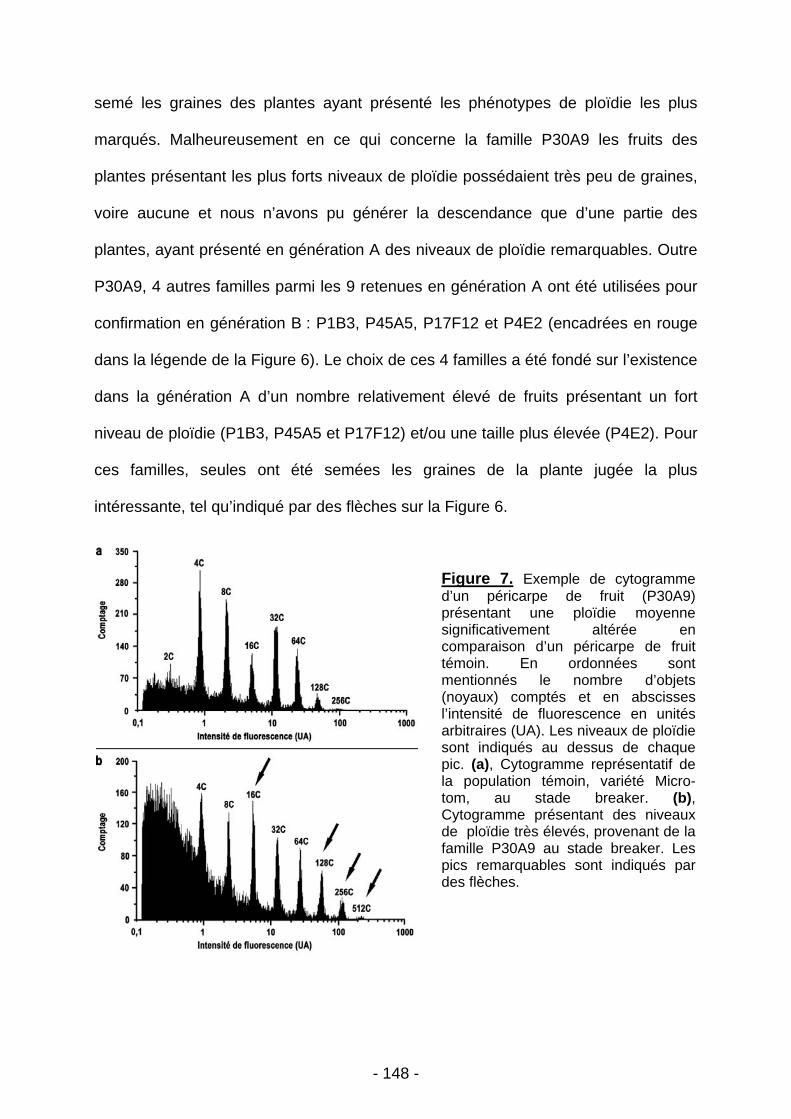
- 148 -
semé les graines des plantes ayant présenté les phénotypes de ploïdie les plus
marqués. Malheureusement en ce qui concerne la famille P30A9 les fruits des
plantes présentant les plus forts niveaux de ploïdie possédaient très peu de graines,
voire aucune et nous n’avons pu générer la descendance que d’une partie des
plantes, ayant présenté en génération A des niveaux de ploïdie remarquables. Outre
P30A9, 4 autres familles parmi les 9 retenues en génération A ont été utilisées pour
confirmation en génération B : P1B3, P45A5, P17F12 et P4E2 (encadrées en rouge
dans la légende de la Figure 6). Le choix de ces 4 familles a été fondé sur l’existence
dans la génération A d’un nombre relativement élevé de fruits présentant un fort
niveau de ploïdie (P1B3, P45A5 et P17F12) et/ou une taille plus élevée (P4E2). Pour
ces familles, seules ont été semées les graines de la plante jugée la plus
intéressante, tel qu’indiqué par des flèches sur la Figure 6.
Figure 7. Exemple de cytogramme d’un péricarpe de fruit (P30A9) présentant une ploïdie moyenne significativement altérée en comparaison d’un péricarpe de fruit témoin. En ordonnées sont mentionnés le nombre d’objets (noyaux) comptés et en abscisses l’intensité de fluorescence en unités arbitraires (UA). Les niveaux de ploïdie sont indiqués au dessus de chaque pic. (a), Cytogramme représentatif de la population témoin, variété Micro-tom, au stade breaker. (b), Cytogramme présentant des niveaux de ploïdie très élevés, provenant de la famille P30A9 au stade breaker. Les pics remarquables sont indiqués par des flèches.
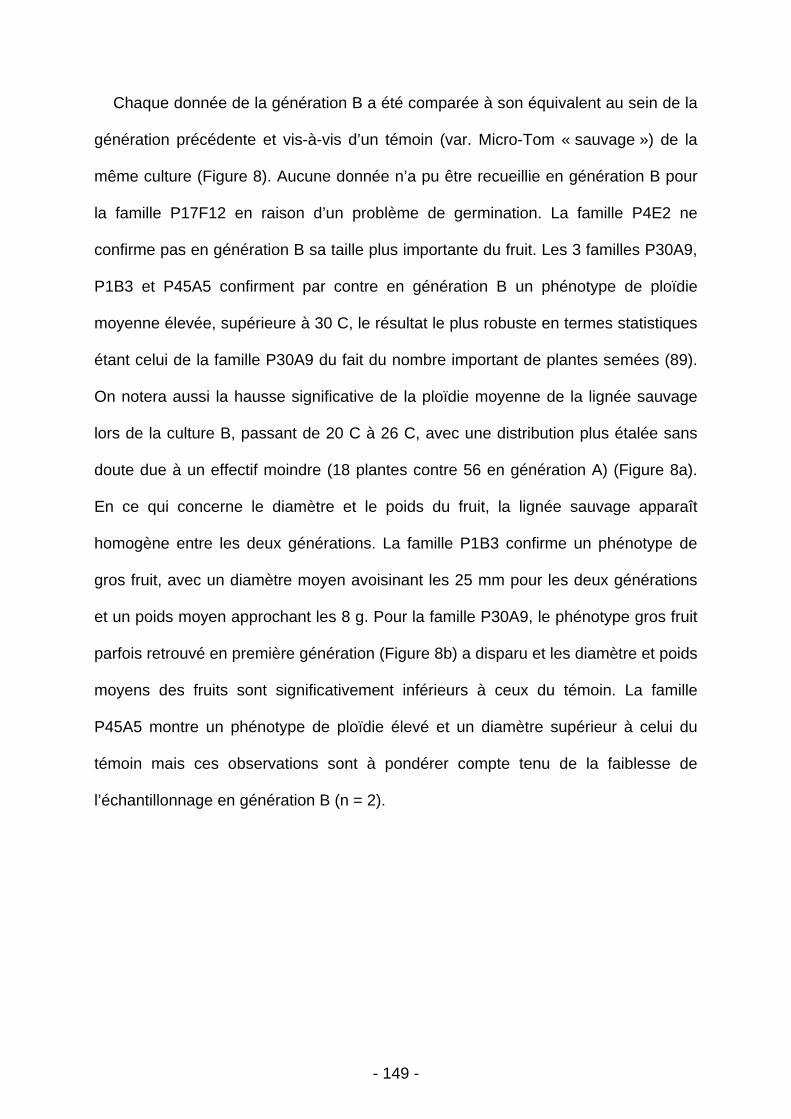
- 149 -
Chaque donnée de la génération B a été comparée à son équivalent au sein de la
génération précédente et vis-à-vis d’un témoin (var. Micro-Tom « sauvage ») de la
même culture (Figure 8). Aucune donnée n’a pu être recueillie en génération B pour
la famille P17F12 en raison d’un problème de germination. La famille P4E2 ne
confirme pas en génération B sa taille plus importante du fruit. Les 3 familles P30A9,
P1B3 et P45A5 confirment par contre en génération B un phénotype de ploïdie
moyenne élevée, supérieure à 30 C, le résultat le plus robuste en termes statistiques
étant celui de la famille P30A9 du fait du nombre important de plantes semées (89).
On notera aussi la hausse significative de la ploïdie moyenne de la lignée sauvage
lors de la culture B, passant de 20 C à 26 C, avec une distribution plus étalée sans
doute due à un effectif moindre (18 plantes contre 56 en génération A) (Figure 8a).
En ce qui concerne le diamètre et le poids du fruit, la lignée sauvage apparaît
homogène entre les deux générations. La famille P1B3 confirme un phénotype de
gros fruit, avec un diamètre moyen avoisinant les 25 mm pour les deux générations
et un poids moyen approchant les 8 g. Pour la famille P30A9, le phénotype gros fruit
parfois retrouvé en première génération (Figure 8b) a disparu et les diamètre et poids
moyens des fruits sont significativement inférieurs à ceux du témoin. La famille
P45A5 montre un phénotype de ploïdie élevé et un diamètre supérieur à celui du
témoin mais ces observations sont à pondérer compte tenu de la faiblesse de
l’échantillonnage en génération B (n = 2).
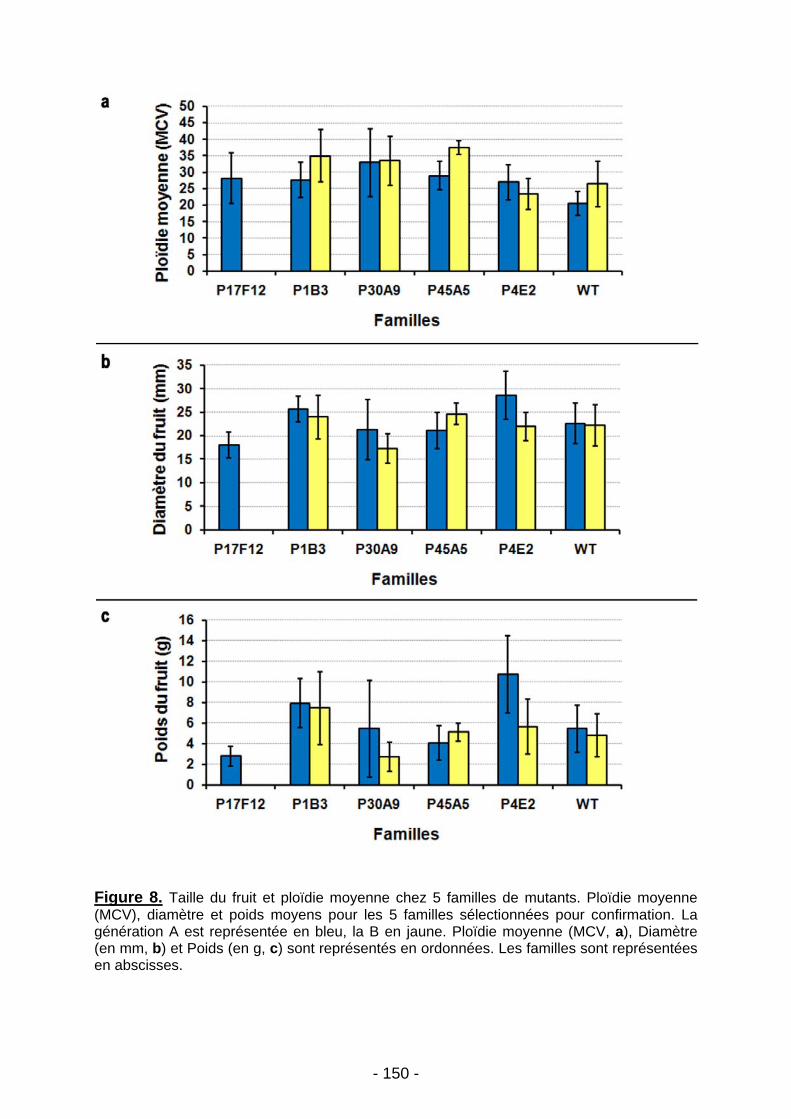
- 150 -
Figure 8. Taille du fruit et ploïdie moyenne chez 5 familles de mutants. Ploïdie moyenne (MCV), diamètre et poids moyens pour les 5 familles sélectionnées pour confirmation. La génération A est représentée en bleu, la B en jaune. Ploïdie moyenne (MCV, a), Diamètre (en mm, b) et Poids (en g, c) sont représentés en ordonnées. Les familles sont représentées en abscisses.
- 151 -
Figure 9. Structure des demi-fruits de génération A. (a), demi- fruits de plantes sauvages (WT) ; 3 exemples sont représentés pour illustrer la variabilité de taille des fruits du témoin. (b), demi- fruits de plantes de la famille P30A9 ; 3 exemples de fruits fortement polyploïdes sont représentées. (c),(d),(e) et (f) demi- fruits de plantes des familles :respectivement P17F12, P1B3, P45A5, P4E2. Echelle : 20 mm.
Morphologie des fruits des lignées affectées dans l’endoréduplication
Nous avons comparé la morphologie des fruits des lignées remarquables avec
celle des fruits témoins (Figure 9). Sur un petit nombre de fruits des images du
péricarpe coloré au bleu de toluidine ont été acquises afin d’analyser la morphologie
du péricarpe au niveau cellulaire (Figures 9 et 10). Bien que l’ensemble des images
n’ait pu être analysé de façon quantitative, certaines observations peuvent être
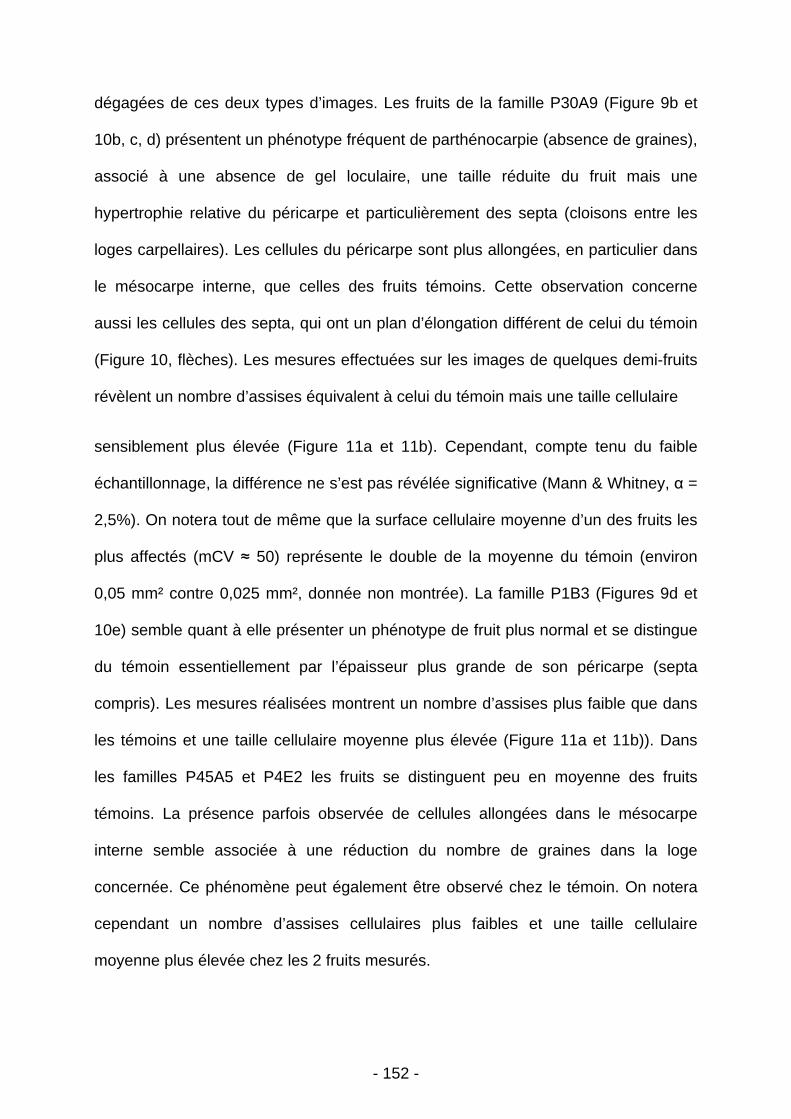
- 152 -
dégagées de ces deux types d’images. Les fruits de la famille P30A9 (Figure 9b et
10b, c, d) présentent un phénotype fréquent de parthénocarpie (absence de graines),
associé à une absence de gel loculaire, une taille réduite du fruit mais une
hypertrophie relative du péricarpe et particulièrement des septa (cloisons entre les
loges carpellaires). Les cellules du péricarpe sont plus allongées, en particulier dans
le mésocarpe interne, que celles des fruits témoins. Cette observation concerne
aussi les cellules des septa, qui ont un plan d’élongation différent de celui du témoin
(Figure 10, flèches). Les mesures effectuées sur les images de quelques demi-fruits
révèlent un nombre d’assises équivalent à celui du témoin mais une taille cellulaire
sensiblement plus élevée (Figure 11a et 11b). Cependant, compte tenu du faible
échantillonnage, la différence ne s’est pas révélée significative (Mann & Whitney, α =
2,5%). On notera tout de même que la surface cellulaire moyenne d’un des fruits les
plus affectés (mCV ≈ 50) représente le double de la moyenne du témoin (environ
0,05 mm² contre 0,025 mm², donnée non montrée). La famille P1B3 (Figures 9d et
10e) semble quant à elle présenter un phénotype de fruit plus normal et se distingue
du témoin essentiellement par l’épaisseur plus grande de son péricarpe (septa
compris). Les mesures réalisées montrent un nombre d’assises plus faible que dans
les témoins et une taille cellulaire moyenne plus élevée (Figure 11a et 11b)). Dans
les familles P45A5 et P4E2 les fruits se distinguent peu en moyenne des fruits
témoins. La présence parfois observée de cellules allongées dans le mésocarpe
interne semble associée à une réduction du nombre de graines dans la loge
concernée. Ce phénomène peut également être observé chez le témoin. On notera
cependant un nombre d’assises cellulaires plus faibles et une taille cellulaire
moyenne plus élevée chez les 2 fruits mesurés.
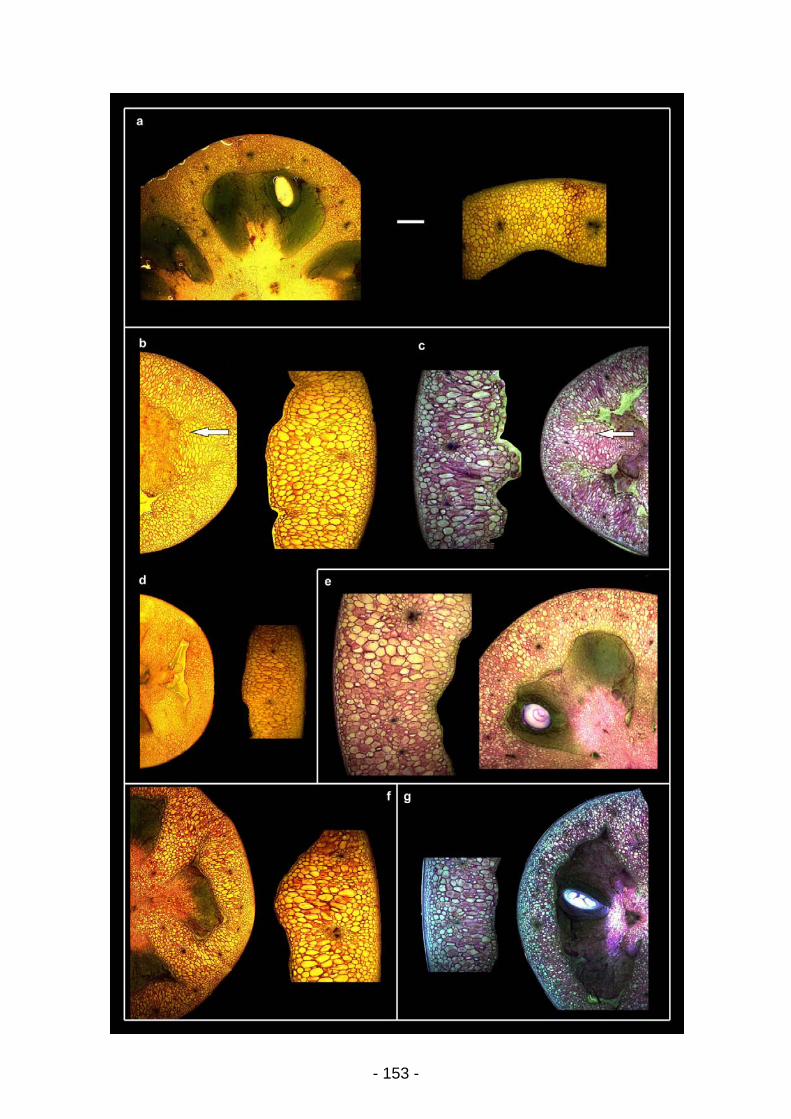
- 153 -
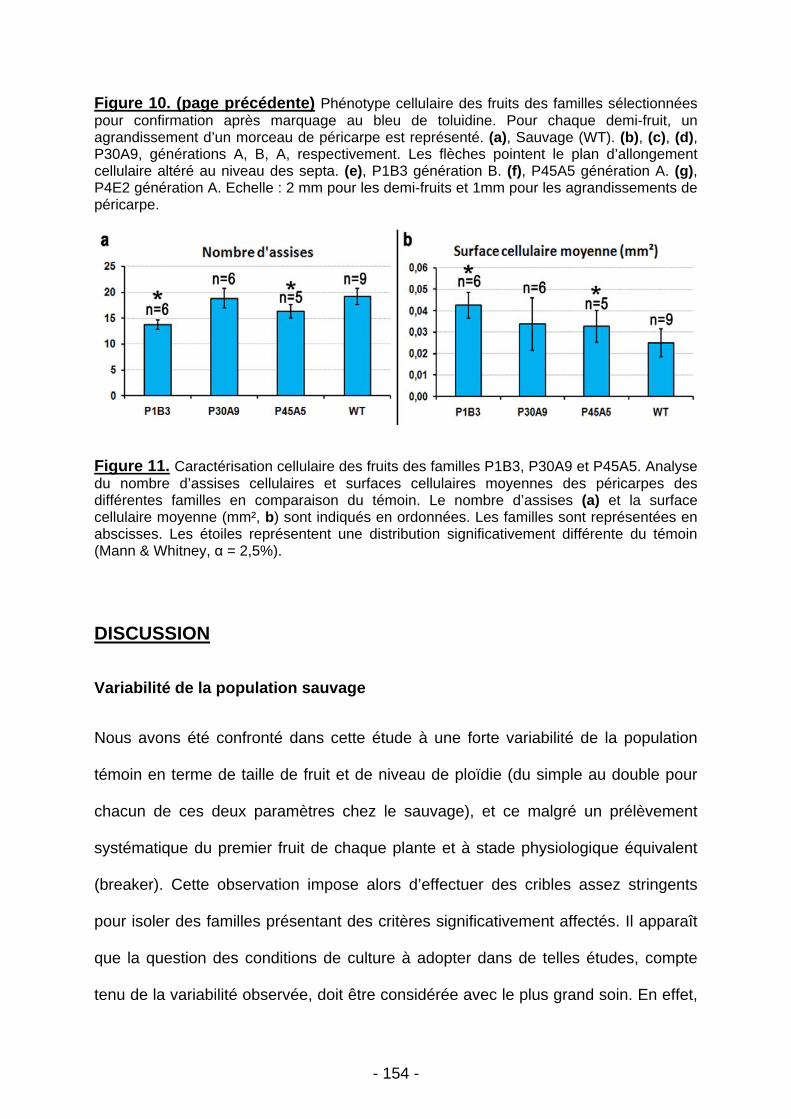
- 154 -
Figure 10. (page précédente) Phénotype cellulaire des fruits des familles sélectionnées pour confirmation après marquage au bleu de toluidine. Pour chaque demi-fruit, un agrandissement d’un morceau de péricarpe est représenté. (a), Sauvage (WT). (b), (c), (d), P30A9, générations A, B, A, respectivement. Les flèches pointent le plan d’allongement cellulaire altéré au niveau des septa. (e), P1B3 génération B. (f), P45A5 génération A. (g), P4E2 génération A. Echelle : 2 mm pour les demi-fruits et 1mm pour les agrandissements de péricarpe.
Figure 11. Caractérisation cellulaire des fruits des familles P1B3, P30A9 et P45A5. Analyse du nombre d’assises cellulaires et surfaces cellulaires moyennes des péricarpes des différentes familles en comparaison du témoin. Le nombre d’assises (a) et la surface cellulaire moyenne (mm², b) sont indiqués en ordonnées. Les familles sont représentées en abscisses. Les étoiles représentent une distribution significativement différente du témoin (Mann & Whitney, α = 2,5%).
DISCUSSION
Variabilité de la population sauvage
Nous avons été confronté dans cette étude à une forte variabilité de la population
témoin en terme de taille de fruit et de niveau de ploïdie (du simple au double pour
chacun de ces deux paramètres chez le sauvage), et ce malgré un prélèvement
systématique du premier fruit de chaque plante et à stade physiologique équivalent
(breaker). Cette observation impose alors d’effectuer des cribles assez stringents
pour isoler des familles présentant des critères significativement affectés. Il apparaît
que la question des conditions de culture à adopter dans de telles études, compte
tenu de la variabilité observée, doit être considérée avec le plus grand soin. En effet,
- 155 -
nous pensons qu’une partie de la variabilité observée pourrait être due à certaines
conditions culturales. Tout d’abord, les plants étaient cultivés dans des pots
relativement petits, pour permettre une forte densité de plantes. Cette contrainte
retentit sur la croissance et est susceptible d’induire de la variabilité. De plus, la
densité des plantes n’a pas été la même à chaque endroit de la table de culture
durant la génération A, le taux de germination n’étant pas homogène partout. En
effet, ce taux va dépendre principalement des familles mises en culture et de leur
capacité à germer en fonction des mutations qu’elles portent, potentiellement létales
ou délétères pour une bonne germination en terre. Par conséquent, certaines plantes
se sont retrouvées en environnement plus confiné que d’autres, environnement qui a
pu favoriser la survenue de plusieurs attaques d’oïdium en augmentant localement le
taux d’humidité. Ensuite, on sait que le bon développement du fruit dépend du taux
de fécondation des ovules. Or, pour cela, les fleurs doivent être « vibrées »
efficacement à la date optimale, point difficile à réaliser à l’échelle d’un telle culture.
Enfin, nous ajouterons à cela, que Micro-Tom, contrairement à d’autres variétés de
tomate (ex : WVA106, utilisée dans les autres parties de la thèse), ne forme pas de
grappes bien déterminées de fleurs. Conséquemment, le nombre de fleurs varie
d’une plante à l’autre (et ce au sein d’une même famille), conduisant à
l’établissement d’une charge en fruits différentes d’une plante à l’autre et donc
potentiellement à de grosses variations quant à la taille finale du premier fruit. En ce
sens, il aurait été préférable de limiter le nombre de fleurs par fruits, comme suggéré
par (Serrani, et al. 2007).
- 156 -
Etude corrélative des paramètres mesurés pour l’ensemble de la génération A
Contrairement aux résultats obtenus au sein de plusieurs lignées de tomate
(Cheniclet, et al. 2005), présentant une diversité génétique notable, nous n’avons
pas observé de corrélation positive significative entre les paramètres mesurés
(ploïdie, diamètre, poids du fruit) ni à l’échelle de la population sauvage ni à celle des
populations mutantes sélectionnées. Ceci pointe le fait que l’endoréduplication n’est
qu’un des multiples paramètres biologiques pouvant influer sur la croissance et la
taille finale du fruit. En conséquence, son effet strict peut être, à l’échelle d’une
population mutante, difficilement discernable compte tenu du nombre de gènes
potentiellement affectés au sein de la banque et des variations environnementales
évoquées plus haut. En revanche, le fait de n’avoir identifié aucune lignée mutante
significativement et négativement affectée dans ses niveaux d’endopolyploïdisation
serait en faveur d’un caractère obligatoire de ce mécanisme lors du développement
du fruit. Il faut aussi relativiser cette hypothèse du fait que notre échantillonnage ne
comportait que 13 familles annotées pour le caractère « petits fruits », susceptible
d’être associé à une faible endoréduplication.
Identification de lignées faiblement affectées dans le phénomène
d’endoréduplication
Notre objectif initial était de détecter des lignées drastiquement affectées dans la
mise en place de l’endopolyploïdisation, c’est-à-dire présentant au moins une ou
deux classes de ploïdie de plus ou de moins par rapport à celles existant chez le
sauvage. Cet objectif n’a pas été entièrement rempli dans la mesure où les lignées
les plus affectées comportaient au maximum un niveau de ploïdie supplémentaire
(256 C), à l’exception de rares fruits montrant également un faible pourcentage de
- 157 -
noyaux à 512 C (Figure 7). Le fait que nous n’ayons pas trouvé de lignée très
affectée pour l’endoreduplication dans notre échantillonnage de 62 familles ne
prouve pas que de telles lignées n’existent pas parmi les 3000 familles de la
collection. Les critères retenus pour le choix des familles à tester (taille du fruit et du
péricarpe) n’ayant pas permis de détecter de fortes variations de ploïdie, on peut
envisager que de telles variations existent en l’absence de phénotype morphologique
notable au niveau du fruit. En effet, nous avons choisi comme familles à semer celles
présentant un phénotype liée à une croissance modifiée (gros fruits, petits fruits,
péricarpe épais), nous basant donc sur l’a priori que les familles présentant une
croissance modifiée auraient plus de chances de montrer une variation de ploïdie
moyenne. Or, s’il est vrai que la mise en place de l’endopolyploïdisation est très
souvent associée aux phénomènes de croissance dans la littérature (John and Qi
2008, Sugimoto-Shirasu and Roberts 2003), des découplages entre ces deux
phénomènes ont déjà été observé (Leiva-Neto et al., 2004 ; Nafati, 2011 et al., sous
presse). En ce sens, effectuer un criblage de familles non associées à la croissance
du fruit aurait peut-être été plus fructueux pour isoler une lignée affectée de manière
importante dans niveau moyen d’endopolyploïdisation. Cependant, les moyens
humains et la place en serre étant limités, effectuer un choix de familles parmi la
banque de mutants était nécessaire. Il convient aussi de redéfinir ce qui pourrait être
un niveau de ploïdie moyen significativement altéré. En effet, les variations de ploïdie
dont il est fait état dans la littérature dépassent, à notre connaissance, rarement le
doublement ou la division par deux de la valeur de la ploïdie moyenne (Leiva-Neto et
al. 2004). En fait, nous sommes confrontés ici à un mécanisme dépendant de
multiples facteurs, à la croisée des chemins entre division, croissance et
différenciation. En ce sens, il apparaît presque illusoire de pouvoir isoler des lignées
- 158 -
complètement inhibées dans la mise en place de l’endopolyploïdisation ou
présentant au moins deux niveaux de ploïdie supplémentaires.
P30A9 : une ploïdie élevée associée à un phénotype partiellement
parthénocarpique
La famille la plus affectée que nous ayons pu identifier (P30A9) présente un
phénotype marqué de parthénocarpie. Ceci rend donc difficile d’éventuelles analyses
futures dans le cadre de cinétiques de croissance nécessitant un développement
d’apparence normal du fruit. En ce sens, la famille qui correspond le plus à ces
critères serait P1B3, associant un fruit significativement plus gros, contenant des
graines viables et ayant une ploïdie modérément plus élevée, qui semble associée à
une réduction du nombre d’assises et une augmentation de la taille cellulaire dans le
péricarpe. Nous pouvons cependant émettre quelques hypothèses concernant
l’origine du phénotype du fruit P30A9. Il est fait état dans la littérature de plusieurs
études dans lesquelles le développement du fruit peut être induit via un apport
d’hormones exogènes, donnant lieu à la formation de fruits parthénocarpiques
(Bünger-Kibler and Bangerth 1982, Serrani, et al. 2007). Le phénotype de
développement cellulaire observé chez P30A9 ressemble étrangement au phénotype
pouvant être observé sur des lignées dont le développement du fruit a été déclenché
par un apport exogène de gibbérellines (Bünger-Kibler and Bangerth 1982, Serrani,
et al. 2007). En effet, le développement des cellules du mésocarpe interne semble
affecté de la même manière, présentant une surface plus grande et un allongement
cellulaire fortement privilégié dans un seul axe (perpendiculaire à la surface du fruit).
En ce sens on pourrait émettre l’hypothèse que la mutation responsable du
phénotype observé chez la famille P30A9 provienne d’un métabolisme ou d’une voie
de signalisation altérée des gibbérellines. Le phénotype de ploïdie plus marqué
- 159 -
observé ans cette famille serait alors compatible avec l’observation de l’implication
des gibbérellines dans le contrôle de l’endopolyploïdie chez Arabidopsis thaliana
(Gendreau et al. 1999).
Confirmation de l’augmentation de la taille cellulaire moyenne chez les plantes
significativement altérée dans leur niveau de ploïdie moyen
Malgré le fait que les familles isolées lors de cette étude n’ont pas totalement
satisfait nos attentes en termes de variations de ploïdie, nous avons pu lors de cette
étude confirmer la relation ploïdie moyenne et taille cellulaire moyenne
précédemment relevé dans (Cheniclet, et al. 2005) chez trois familles mutantes de la
banque tilling Micro-Tom. Ce résultat va donc dans le sens d’une croissance
cellulaire favorisée par la mise en place de la ploïdie.
Nous avons pu lors de ce travail isoler plusieurs familles de mutants affectées
dans leur niveau de ploïdie moyen. Cependant, les phénotypes les plus marqués
relevés chez une famille (P30A9) ont été associés à la présence de parthénocarpie.
Cette observation, couplée à la présence de phénotypes moins marqués au sein des
autres familles isolées, a donc constitué un frein à la poursuite de cette étude.
MATERIEL ET METHODES
Conditions de culture
Génération A:
Dix-huit graines de chacune des 62 familles sélectionnées ont été semées et
cultivées en petites alvéoles (environ 6 cm de diamètre) dans du terreau Agrofino®
(Peltracom) avec un arrosage en sub-irrigation 2 fois par semaine avec une solution
nutritive à pH 5,8 (KNO3 3,5 mM, K2SO4 1 mM, KH2PO4 2 mM, Ca(NO3)2 6 mM,
- 160 -
MgSO4 2 mM) jusqu’à la mise à fruit. Par la suite, la fréquence d’arrosage reste
identique mais la solution nutritive est composée de KNO3 4 mM, K2SO4 1,5 mM,
KH2PO4 1,5 mM, Ca(NO3)2 4 mM, MgSO4 1,5 mM. Nous avons ajouté 4 lignes de
18 graines de plantes sauvages réparties uniformément au sein de la culture afin
d’éprouver d’éventuels effets positions sur la table de culture. Les semis ont été
réalisés le 07 février 2008 et les fruits récoltés au stade breaker entre le 14 avril et le
23 mai. Le taux moyen de germination de toute la table de culture a été de 64%.
Génération B:
La famille P30A9 ayant révélé les phénotypes les plus contrastés en terme de ploïdie
moyenne, jusqu’à 18 graines produites par chaque plante intéressante de la
génération A (en fonction du nombre de graines disponibles) ont été semées. Pour
les 4 autres familles sélectionnées (cf résultats), jusqu’à 12 graines produites par la
plante la plus intéressante ont été semées. 21 plantes sauvages ont été réparties à
trois endroits différents dans la table de culture. Les conditions de culture pour la
génération B ont été volontairement choisies plus favorables afin que chaque plante
puisse avoir une croissance moins contrainte. Pour ce faire des pots carrés de 9x9
cm de côté ont été utilisés avec un espacement entre les plantes plus important
(environ 4 cm). Le terreau, les conditions d’éclairage et les solutions nutritives ont été
les mêmes que pour la génération A. Le taux moyen de germination de toute la table
de culture a été de 70%.
Confirmation du phénotype morphologique
Compte tenu du grand nombre de plantes (760 germées), nous avons choisi
d’analyser la ploïdie uniquement des fruits correspondant au phénotype de taille
attendu selon nos critères de présélection des familles (480 plantes). Le diamètre
- 161 -
moyen des fruits sauvages de Micro-Tom varie de 20 à 24 mm environ (D. Just,
communication personnelle). Nous avons donc sélectionné les fruits à analyser par
cytométrie comme suit :
- petit fruit : diamètre inférieur à 20 mm.
- gros fruit : diamètre supérieur à 24 mm.
- péricarpe épais : tous les fruits ont été analysés puisque nous ne pouvions avoir un
à priori de l’épaisseur du péricarpe avant ouverture du fruit. De plus le caractère
épaisseur du péricarpe constitue une valeur relative (surface du péricarpe sur
surface du fruit) qu’il aurait été difficile de mesurer avant chaque analyse
cytométrique.
Récolte et photographie des fruits
Les fruits on été récoltés au stade breaker. Chaque fruit à analyser a été mesuré
selon son grand diamètre, pesé, et photographié à l’aide d’un appareil Canon EOS
400D, entier puis coupé en deux.
Cytométrie en flux.
Un morceau de péricarpe de chaque loge carpellaire au niveau équatorial du fruit
a été prélevé afin que l’analyse cytométrique reflète au mieux les différentes parties
du péricarpe du fruit. Ces fragments ont été hachés à l’aide d’une lame de rasoir
dans 1 mL de tampon CyStain® UV ploidy (Partec, Münster, Allemagne). Le produit
du hachage est ensuite filtré sur une maille en nylon de 100 µm et analysé à l’aide
d’un cytomètre en flux PAS-II flow (Partec, Münster, Allemagne). Les analyses
quantitatives des histogrammes de ploïdie ont été réalisées grâce au logiciel DPAC
(Partec, Münster, Allemagne) et grâce à une macro développée sur le logiciel
- 162 -
d’analyse d’images ImagePro Plus 6.2 (Media Cybernetics, Bethesda, EU). La
ploïdie moyenne de chaque histogramme de ploïdie a été calculée selon la somme
de toutes les « C-value » pondérées par leur fréquence respective.
Analyse phénotypique des fruits à la loupe binoculaire
L’analyse des demi-fruits a été réalisé après 1 minute de marquage dans une
solution de 0,04% de bleu de toluidine dans 0,1 M de tampon phosphate. Les demi-
fruits ont alors été rapidement rincés à l’eau et observés sous un stéréomicroscope
MZLeica FLIII. Les images ont été acquises avec une caméra couleur Leica DC300F.
Le nombre d’assises par fruit est déterminé visuellement dans 3 loges carpellaires
différentes. Les analyses de taille cellulaire moyenne ont été réalisé grâce au logiciel
d’analyse d’images ImagePro Plus 6.2 (Media Cybernetics, Bethesda, EU) sur 3
loges carpellaires différentes pour chaque fruit analysé.
REFERENCES
Baldet, P., Hernould, M., Laporte, F., Mounet, F., Just, D., Mouras, A., Chevalier,
C. and Rothan, C. (2006) The expression of cell proliferation-related genes in
early developing flowers is affected by a fruit load reduction in tomato plants.
Journal of Experimental Botany, 57, 961-970.
Barow, M. (2006) Endopolyploidy in seed plants. BioEssays, 28, 271-281.
Barow, M. and Meister, A. (2003) Endopolyploidy in seed plants is differently
correlated to systematics, organ, life strategy and genome size. Plant Cell and
Environment, 26, 571-584.
Bergervoet, J.H.W., Berhoeven, H.A., Gilissen, L.J.W. and Bino, R.J. (1996) High
amounts of nuclear DNA in tomato (Lycopersicon esculentum Mill.) pericarp.
Plant Science, 116, 141-145.
Bourdon, M., Frangne, N., Mathieu-Rivet, E., Nafati, M., Cheniclet, C., Renaudin,
J.-P. and Chevalier, C. (2010) Endoreduplication and Growth of Fleshy Fruits.
In Progress in Botany 71, pp. 101-132.
- 163 -
Bünger-Kibler, S. and Bangerth, F. (1982) Relationship between cell number, cell
size and fruit size of seeded fruits of tomato (Lycopersicon esculentum Mill.),
and those induced parthenocarpically by the application of plant growth
regulators. Plant Growth Regulation, 1, 143-154.
Cheniclet, C., Rong, W.Y., Causse, M., Frangne, N., Bolling, L., Carde, J.-P. and
Renaudin, J.-P. (2005) Cell Expansion and Endoreduplication Show a Large
Genetic Variability in Pericarp and Contribute Strongly to Tomato Fruit Growth.
Plant Physiol., 139, 1984-1994.
D'Amato, F. (1984) Role of polyploidy in reproductive organs and tissues. Johri, BM
(ed) . Embryology of angiosperms . Springer, New York, 519-566.
Galbraith, D.W., Harkins, K.R. and Knapp, S. (1991) Systemic endopolyploidy in
Arabidopsis thaliana. Journal Name: Plant Physiology; (United States); Journal
Volume: 96:3, Medium: X; Size: Pages: 985-989.
Gendreau, E., Orbovic, V., Höfte, H. and Traas, J. (1999) Gibberellin and ethylene
control endoreduplication levels in the <i>Arabidopsis thaliana</i>
hypocotyl. Planta, 209, 513-516.
Gendreau, E., Traas, J., Desnos, T., Grandjean, O., Caboche, M. and Hofte, H.
(1997) Cellular Basis of Hypocotyl Growth in Arabidopsis thaliana. Plant
Physiol., 114, 295-305.
John, P.C.L. and Qi, R. (2008) Cell division and endoreduplication: doubtful engines
of vegetative growth. Trends in Plant Science, 13, 121-127.
Leiva-Neto, J.T., Grafi, G., Sabelli, P.A., Dante, R.A., Woo, Y.-m., Maddock, S.,
Gordon-Kamm, W.J. and Larkins, B.A. (2004) A Dominant Negative Mutant
of Cyclin-Dependent Kinase A Reduces Endoreduplication but Not Cell Size or
Gene Expression in Maize Endosperm. Plant Cell, 16, 1854-1869.
Nafati, M., Cheniclet, C., Hernould, M., Do, P.T., Fernie, A., Chevalier, C.,
Gévaudant, F. (2011) The specific overexpression of a Cyclin Dependent
Kinase Inhibitor in tomato fruit mesocarp cells uncouples endoreduplication
and cell growth. Plant J., in press.
Nagl, W. (1975) DNA endoreduplication and polyteny understood as evolutionary
strategies. Nature, UK, 261, 614-615.
- 164 -
Serrani, J., Fos, M., Atarés, A. and García-Martínez, J. (2007) Effect of Gibberellin
and Auxin on Parthenocarpic Fruit Growth Induction in the cv Micro-Tom of
Tomato. Journal of Plant Growth Regulation, 26, 211-221.
Sugimoto-Shirasu, K. and Roberts, K. (2003) "Big it up": endoreduplication and
cell-size control in plants. Current Opinion in Plant Biology, 6, 544-553.
- 165 -
CHAPITRE 3 : DISCUSSION - CONCLUSION
1. Contexte et problématique
Nous avons souligné dans ce travail la grande représentation du phénomène
d’endopolyploïdisation chez les eucaryotes. Chez les plantes, ce phénomène semble
tellement répandu (D'Amato 1984, Joubès and Chevalier 2000, Nagl 1975) que cette
observation légitime à elle seule l’intérêt que nous pouvons porter à son implication
lors du développement. Dans la littérature, ce phénomène est majoritairement
associé à la croissance cellulaire (Sugimoto-Shirasu and Roberts 2003) et à la
différentiation (Bramsiepe et al. 2010, Hulskamp 2004). Il est aussi mis en relation
avec le métabolisme :
- premièrement de par l’observation de son existence dans un grand nombre
de cellules productrices spécialisées ou de soutien à la croissance (cellules
des glandes productrices de soie chez Bombyx mori (D'Amato and Durante
2001), cellules du trophoblastes chez les mammifères (Zybina and Zybina
1996), cellules du suspenseur de l’embryon des Spermaphytes (Carvalheira
2000, D'Amato 1984)).
- deuxièmement par l’hypothèse d’une amplification fonctionnelle du génome
(Bourdon et al. 2010).
Nous avons aussi mis en avant l’hypothèse de l’influence de l’endopolyploïdie sur
la vitesse de croissance dans le fruit (Bourdon, et al. 2010), et ce à partir de données
chiffrées de durée de croissance de différentes espèces de fruits. Nous avons voulu
aller plus loin dans l’étude de l’endopolyploïdie au sein du fruit de tomate, par la
description de sa mise en place à l’échelle chromosomique, cellulaire ainsi que sa
- 166 -
distribution tissulaire. Nous avons ainsi apporté une série d’informations nouvelles
sur ce phénomène, informations qui devraient permettre de mieux comprendre son
incidence sur le fonctionnement cellulaire et, à ,une échelle plus intégrée, sur la
croissance et la différentiation des organes polyploïdes.
2. Implication de l’endopolyploïdisation dans la croissance
cellulaire
Dans un premier temps nous avons étudié la relation existant entre ploïdie et taille
cellulaire directement à l’échelle de la cellule au sein du péricarpe. Cette analyse a
été rendue possible grâce à la mise au point d’un outil de détermination de la ploïdie
in situ basé sur des méthodes de FISH (Bourdon, article 2, soumis). Cet outil nous a
permis de confirmer directement à l’échelle cellulaire la corrélation positive entre
niveau de ploïdie et taille cellulaire précédemment observée à l’échelle tissulaire
(Cheniclet et al. 2005). De plus, ce résultat a pu être confirmé lors du criblage de la
banque de mutants Micro-Tom. En effet, 3 des familles de mutants isolées lors du
criblage et arborant une ploïdie moyenne plus élevée ont montré une augmentation
de leur taille cellulaire moyenne. Cependant, nous avons aussi pu montrer que le
niveau de ploïdie ne déterminait pas précisément la taille cellulaire, et que d’autres
paramètres tels que l’âge de la cellule et sa position dans le péricarpe semblaient
influer sur l’acquisition d’une taille cellulaire donnée. Malgré tout, le paramètre ploïdie
semble affecter le potentiel global de croissance cellulaire, les cellules les plus
grandes ayant invariablement les plus hauts niveaux de ploïdie. La méthode de
mesure in situ de la ploïdie a aussi permis l’établissement d’une cartographie
relativement précise des niveaux de ploïdie au sein du péricarpe de tomate.
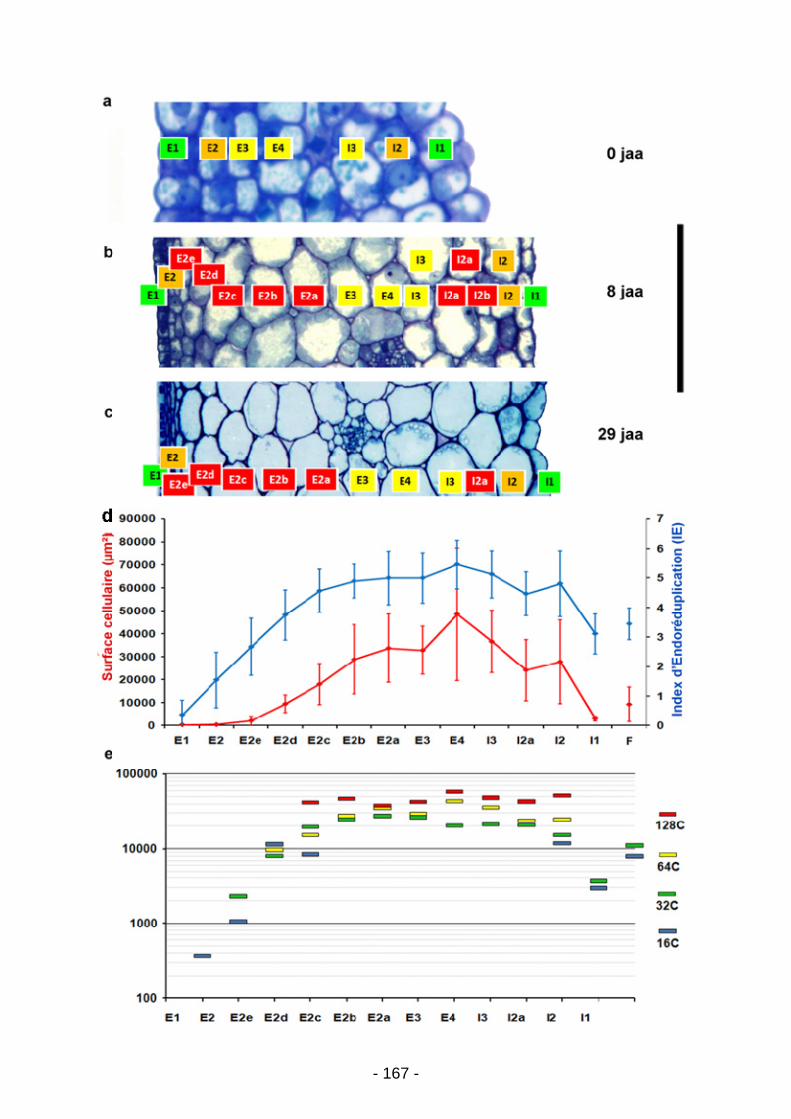
- 167 -
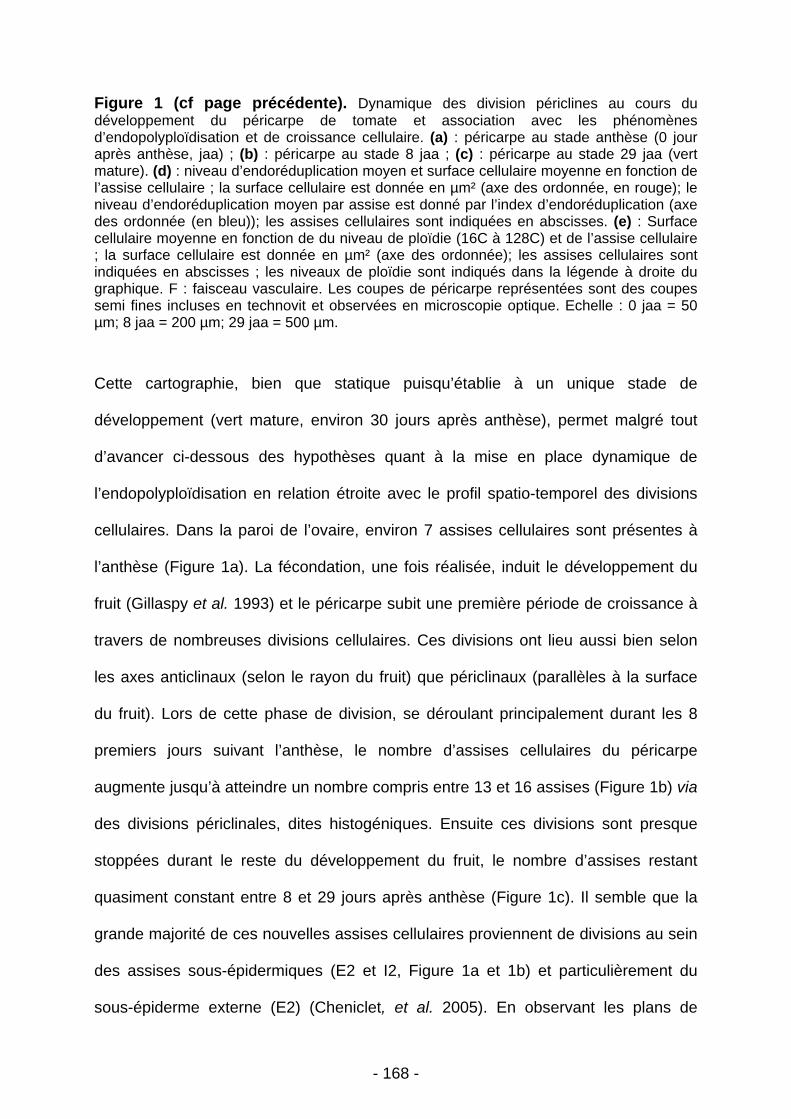
- 168 -
Figure 1 (cf page précédente). Dynamique des division périclines au cours du développement du péricarpe de tomate et association avec les phénomènes d’endopolyploïdisation et de croissance cellulaire. (a) : péricarpe au stade anthèse (0 jour après anthèse, jaa) ; (b) : péricarpe au stade 8 jaa ; (c) : péricarpe au stade 29 jaa (vert mature). (d) : niveau d’endoréduplication moyen et surface cellulaire moyenne en fonction de l’assise cellulaire ; la surface cellulaire est donnée en µm² (axe des ordonnée, en rouge); le niveau d’endoréduplication moyen par assise est donné par l’index d’endoréduplication (axe des ordonnée (en bleu)); les assises cellulaires sont indiquées en abscisses. (e) : Surface cellulaire moyenne en fonction de du niveau de ploïdie (16C à 128C) et de l’assise cellulaire ; la surface cellulaire est donnée en µm² (axe des ordonnée); les assises cellulaires sont indiquées en abscisses ; les niveaux de ploïdie sont indiqués dans la légende à droite du graphique. F : faisceau vasculaire. Les coupes de péricarpe représentées sont des coupes semi fines incluses en technovit et observées en microscopie optique. Echelle : 0 jaa = 50 µm; 8 jaa = 200 µm; 29 jaa = 500 µm.
Cette cartographie, bien que statique puisqu’établie à un unique stade de
développement (vert mature, environ 30 jours après anthèse), permet malgré tout
d’avancer ci-dessous des hypothèses quant à la mise en place dynamique de
l’endopolyploïdisation en relation étroite avec le profil spatio-temporel des divisions
cellulaires. Dans la paroi de l’ovaire, environ 7 assises cellulaires sont présentes à
l’anthèse (Figure 1a). La fécondation, une fois réalisée, induit le développement du
fruit (Gillaspy et al. 1993) et le péricarpe subit une première période de croissance à
travers de nombreuses divisions cellulaires. Ces divisions ont lieu aussi bien selon
les axes anticlinaux (selon le rayon du fruit) que périclinaux (parallèles à la surface
du fruit). Lors de cette phase de division, se déroulant principalement durant les 8
premiers jours suivant l’anthèse, le nombre d’assises cellulaires du péricarpe
augmente jusqu’à atteindre un nombre compris entre 13 et 16 assises (Figure 1b) via
des divisions périclinales, dites histogéniques. Ensuite ces divisions sont presque
stoppées durant le reste du développement du fruit, le nombre d’assises restant
quasiment constant entre 8 et 29 jours après anthèse (Figure 1c). Il semble que la
grande majorité de ces nouvelles assises cellulaires proviennent de divisions au sein
des assises sous-épidermiques (E2 et I2, Figure 1a et 1b) et particulièrement du
sous-épiderme externe (E2) (Cheniclet, et al. 2005). En observant les plans de
- 169 -
division à différents stades de développement, nous avons nommé les nouvelles
assises formées après l’anthèse en fonction de l’assise dont elles semblent issues et
de leur ordre d’apparition chronologique (Figure 1b et 1c). Ainsi, les assises
provenant des divisions de la couche sous-épidermique externe (E2) portent les
noms E2a, E2b, et ainsi de suite (l’assise E2a étant la première formée), et les
assises provenant des divisions de la couche sous-épidermique interne (I2) sont
nommées I2a, I2b, etc. Au fur et à mesure de la formation de nouvelles assises, les
premières formées sont repoussées vers la partie centrale du mésocarpe. La
dynamique de division cellulaire pourrait ainsi expliquer une partie de la répartition
des niveaux de ploïdie que nous avons mise en évidence dans ce travail. En effet
l’augmentation graduelle du niveau de ploïdie de l’épiderme externe vers le milieu du
mésocarpe (E1 à E3/E4, Figure 1d) pourrait s’expliquer par le gradient d’âge des
cellules. De plus les cellules sont le siège d’un nombre variable de cycles de
divisions avant d’entrer en endocycle (Cheniclet, communication personnelle ; (Bertin
et al. 2007)), ce qui pourrait expliquer l’hétérogénéité des niveaux de ploïdie
observée au sein d’une même assise. Comparons maintenant l’évolution des niveaux
de ploïdie en fonction de la taille cellulaire (Figure 1e). Si l’on considère les niveaux
de ploïdie 32C entre les assises E2e (néo-formée) et E3 (présente à l’anthèse), la
taille cellulaire est beaucoup plus grande en E3 qu’en E2e. Ceci laisserait suggérer
que, contrairement aux hypothèses avancées par (John and Qi 2008), la mise en
place de l’endoréduplication précèderait la croissance cellulaire, puisqu’à niveau de
ploïdie égal, la surface cellulaire est plus grande au sein de l’assise la plus âgée
(E3). Le même type de remarque peut être faite en comparant le niveau 16C entre
les assises E2e et E2c.
- 170 -
Lorsque l’on considère l’évolution de la ploïdie à partir de l’assise génératrice
interne (I2), on s’aperçoit que cette assise présente un niveau de ploïdie moyen
beaucoup plus élevé que E2 et avec une hétérogénéité des valeurs. Ceci est en
accord avec l’observation que dans I2 les divisions cellulaires sont moins fréquentes
et ne concerneraient sans doute pas toutes les cellules de cette assise (C. Cheniclet,
communication personnelle).
Par conséquent, plusieurs cellules de cette assise entreraient dès l’anthèse dans
l’endocycle (aboutissant à des niveaux élevés de ploïdie au stade vert mature) alors
que d’autres se diviseraient une ou deux fois avant d’entrer en endocycle donnant
des niveaux moins élevés. Par conséquent, le fait que certaines cellules n’atteignent
pas les niveaux de ploïdie les plus élevés durant le développement du péricarpe
pourrait être expliqué en grande partie par un délai de transition entre le cycle
cellulaire et l’endopolyploïdisation. De plus, (Bünger-Kibler and Bangerth 1982)
décrivent les faisceaux vasculaires comme des « centres de division cellulaire ». En
accord avec cette observation et notre hypothèse, la zone entourant les faisceaux
vasculaires présente des niveaux de ploïdie plus faibles que les cellules adjacentes
des mêmes assises (cf. E3, E4, I3 et F, Figure 1d). Il a été aussi montré que
certaines cellules de la partie centrale du mésocarpe entrent en division cellulaire
lors des premiers stades de développement (lors des 15 premiers jaa), selon des
plans de division plus ou moins aléatoires (Cheniclet, et al. 2005), ce qui pourrait
expliquer l’hétérogénéité des niveaux de ploïdie retrouvés au sein de ces assises.
Cependant, des expérimentations supplémentaires sont nécessaires, et ce à
plusieurs stades de développement, afin de comprendre la dynamique précise de
mise en place de l’endopolyploïdisation dans le péricarpe de tomate et la transition
du cycle cellulaire vers l’endopolyploïdisation. En effet, Nafati et al. (2011, sous
- 171 -
presse) ont montré que l’intégration des phénomènes de division et
d’endoréduplication pouvait être modélisée à l’échelle du tissu et du fruit au cours du
développement. Il sera alors intéressant d’implémenter ces informations avec des
données de dynamique de division cellulaire et d’endoréduplication à l’échelle des
différentes assises cellulaires du péricarpe. Pour ce faire, il pourrait être envisagé
une cartographie dynamique des cellules en division aux premiers stades de
développement du fruit, couplé à une cartographie de cellules endopolyploïdisées.
Un blocage des cellules en métaphase pourrait être réalisé comme pour les plaques
métaphasiques obtenues à partir de racines (Bourdon et al., 2010, soumis), et les
échantillons ainsi obtenus seraient utilisés pour étudier la répartition des niveaux de
ploïdie comme détaillé dans (Bourdon et al., 2010, soumis). De cette façon une
cartographie des cellules en cours de division cellulaire ainsi qu’une cartographie des
cellules endopolyploïdisées pourrait être obtenue en même temps.
3. Amplification fonctionnelle du génome et profils d’expression
associés à l’endopolyploïdisation
Lors de cette étude nous nous sommes aussi intéressé à l’amplification
fonctionnelle du génome durant l’endoréduplication. En effet, c’est une des
hypothèses majeures pour expliquer la stratégie de croissance liée à la mise en
place de l’endoréduplication. La duplication du génome entraînerait une
augmentation proportionnelle du nombre global de transcrits et ainsi du métabolisme
général de la cellule polyploïde. Nous avons ainsi obtenu des données allant dans le
sens d’une augmentation de la transcription des gènes codant certains ARN
ribosomaux, molécules à l’interface des phénomènes de transcription et de
traduction, par leur intégration au sein des ribosomes. Nous avons aussi entrepris
- 172 -
une analyse plus ciblée afin de montrer une amplification fonctionnelle à l’échelle de
gènes candidats dupliqués en couplant des méthodes de RNA FISH et de DNA
FISH. Brièvement, ce type d’expérimentation consiste à montrer que toutes les
copies d’un gène sont dupliquées en co-localisant dans le noyau la position de ses
loci (DNA FISH) et des ARNm naissants produits à partir de ces loci (RNA FISH).
Cependant, nous avons rencontré des difficultés méthodologiques liées à la
réalisation du FISH à l’échelle du gène, que ce soit pour les méthodes de DNA FISH
ou de RNA FISH. En effet, les différents essais n’ont pas permis de détecter de
signaux fluorescents. Il est à noter qu’à notre connaissance peu de travaux font état
de la faisabilité de cette méthode chez les plantes (Wegel and Shaw 2005). Nous
envisageons aussi de coupler ces approches qualitatives à des méthodes de
quantification des ARNm des candidats choisis en relation avec le niveau de ploïdie.
Des études de RT-PCR seront réalisées prochainement à partir de populations de
noyaux triés en fonction du niveau de ploïdie. Enfin une étude globale de
l’expression des gènes, toujours sur noyaux triés par cytométrie en flux sera aussi
réalisée par l’utilisation de la méthode de RNA-Seq (Wang et al. 2009). Nous
espérons ainsi améliorer notre compréhension de l’amplification fonctionnelle du
génome et des profils d’expression mis en place durant l’endoréduplication.
4. Supra-organisation et ergonomie de la cellule endopolyploïde
En parallèle des hypothèses de la stratégie de croissance via une amplification
fonctionnelle du génome sont aussi avancées les hypothèses d’économie d’énergie
via l’endoréduplication. En effet, la cellule endorédupliquée n’ayant plus à effectuer
de réorganisations structurales importantes liées à la division cellulaire (répartition du
cytoplasme en deux cellules filles, mise en place d’un fuseau mitotique et d’une paroi
- 173 -
intermédiaire), le gain d’énergie résultant serait un des avantages majeurs de
l’endoréduplication sur la division cellulaire lors de la croissance de l’organe. En effet,
un organe en développement, à taille finale égale, dépenserait à priori moins
d’énergie en assurant la croissance d’un nombre limité de grandes cellules
polyploïdes qu’en assurant la division et la croissance d’un nombre important de
cellules diploïdes (Nagl, 1976). Cependant, on peut aller plus loin dans
l’interprétation de l’économie d’énergie via l’endoréduplication. En effet, selon
l’hypothèse formulé par (Anisimov, 2005), la centralisation des fonctions cellulaires
au sein d’une cellule polyploïde et la structuration particulière de ces différentes
fonctions conduirait à un meilleure ergonomie de la cellule polyploïde, ce qui pourrait
entraîner par la même occasion une économie d’énergie considérable lors du
développement cellulaire et tissulaire. Cette hypothèse est donc en accord avec les
implications déjà citées de l’endopolyploïdisation dans la croissance et la vitesse de
croissance. Cependant aucune donnée à notre connaissance ne fait mention d’une
économie d’énergie substantielle via une organisation structurale particulière. Or
nous avons ici obtenu des indices pouvant aller dans ce sens. Tout d’abord, nous
avons montré par l’utilisation de plusieurs sondes utilisées en FISH et du marquage à
la chromomycine A3 que l’endopolyploïdisation procédait chez la tomate par
endoréduplication, créant ainsi une forme de polyténie. Ce phénomène a pour
conséquence principale le regroupement dans l’espace nucléaire de chromatides
filles par rattachement au même centromère et pourrait ainsi opérer un maintien des
territoires chromosomiques lors de l’endoréduplication. L’influence d’une telle
conformation spatiale est inconnue mais nous émettons l’hypothèse que cette
proximité des chromatides filles entre elles pourrait améliorer l’efficacité des
processus de transcription en cours. En effet, il a récemment été montré que des
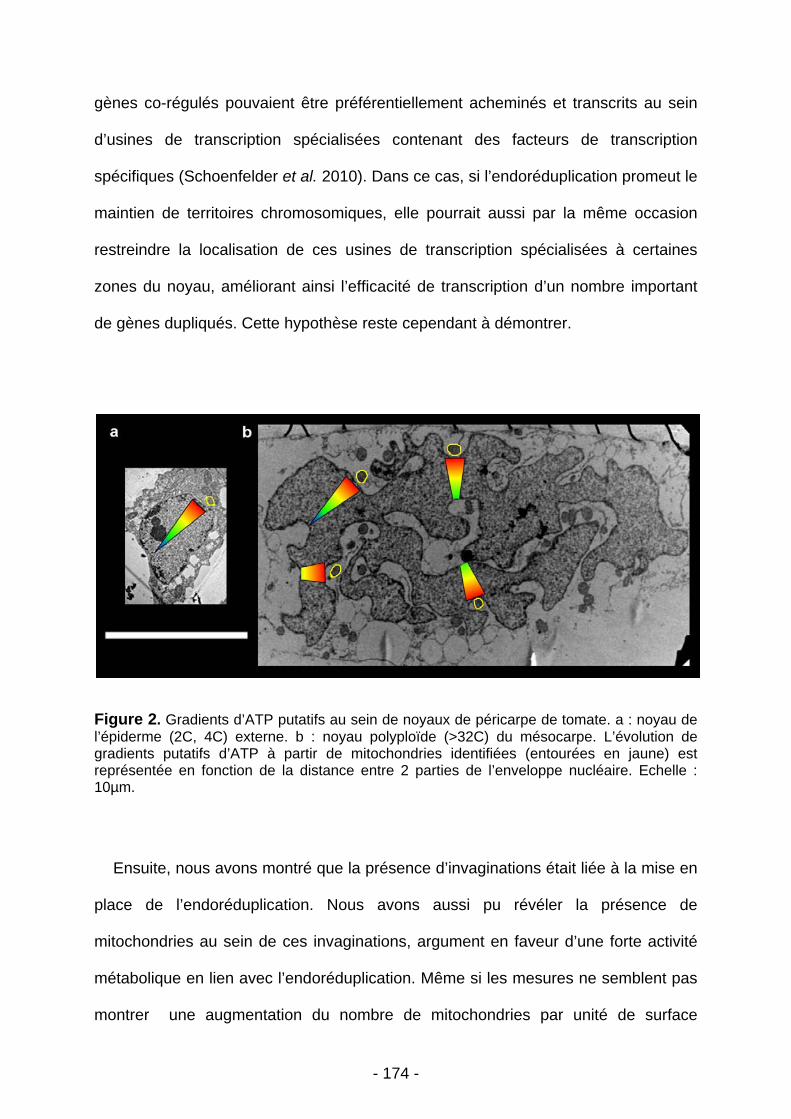
- 174 -
gènes co-régulés pouvaient être préférentiellement acheminés et transcrits au sein
d’usines de transcription spécialisées contenant des facteurs de transcription
spécifiques (Schoenfelder et al. 2010). Dans ce cas, si l’endoréduplication promeut le
maintien de territoires chromosomiques, elle pourrait aussi par la même occasion
restreindre la localisation de ces usines de transcription spécialisées à certaines
zones du noyau, améliorant ainsi l’efficacité de transcription d’un nombre important
de gènes dupliqués. Cette hypothèse reste cependant à démontrer.
Figure 2. Gradients d’ATP putatifs au sein de noyaux de péricarpe de tomate. a : noyau de l’épiderme (2C, 4C) externe. b : noyau polyploïde (>32C) du mésocarpe. L’évolution de gradients putatifs d’ATP à partir de mitochondries identifiées (entourées en jaune) est représentée en fonction de la distance entre 2 parties de l’enveloppe nucléaire. Echelle : 10µm.
Ensuite, nous avons montré que la présence d’invaginations était liée à la mise en
place de l’endoréduplication. Nous avons aussi pu révéler la présence de
mitochondries au sein de ces invaginations, argument en faveur d’une forte activité
métabolique en lien avec l’endoréduplication. Même si les mesures ne semblent pas
montrer une augmentation du nombre de mitochondries par unité de surface
- 175 -
nucléaire, un avantage non négligeable pourrait provenir d’une telle structuration via
l’augmentation locale de la concentration en ATP au sein des noyaux. En effet, à
l’observation des images de microscopie électronique (Figure 2), Il semble que,
malgré l’augmentation (considérable) de volume du noyau en fonction de la ploïdie,
la distance maximale entre les point situés « au cœur » du noyau et l’enveloppe
nucléaire n’augmente pas, voire diminue, avec la ploïdie. On peutalors émettre
l’hypothèse que l’ATP produit par les mitochondries pourrait, à coefficient de diffusion
égal, se retrouver à des concentrations locales plus élevées, comme illustré dans la
Figure 2. En effet, si l’on considère une mitochondrie donnée (entourées en jaune
sur la figure), celle-ci va créer un gradient local d’ATP dans son environnement
proche. Si la distance entre deux enveloppes diminue, alors la « longueur » du
gradient diminue et la valeur minimum du gradient de concentration sera plus élevée.
Ce faisant, l’activité biologique du noyau pourrait alors être améliorée, l’efficacité des
mécanismes dépendant de l’ATP au sein du noyau étant favorisée. Dans le même
ordre d’idée, on peut penser que la formation d’invaginations permet de faciliter
l’export des ARNs messagers vers le cytoplasme et d’une manière générale de
favoriser tous les échanges entre le noyau et le cytoplasme. De même, on peut alors
se demander si le reste du cytoplasme subit une organisation particulière ayant pour
conséquence un fonctionnement « facilité » de la cellule.

- 176 -
Figure 3. Noyaux du mésocarpe de tomate à proximité d’amincissements de la paroi. (a) : deux noyaux distincts (n1 et n2) proches dans l’espace via un amincissement de la paroi, vraisemblablement lieu de plasmodesmes. (b) : deux noyaux distincts (n3 et n4) proches dans l’espace via un amincissement de la paroi, vraisemblablement lieu de plasmodesmes. Les flèches jaunes pointent la jonction entre noyaux. pa : paroi. Echelles : 10µm. Stade : vert mature (30 jaa).
Anisimov (2005) émet aussi l’hypothèse d’une simplification des systèmes
récepteurs des cellules et d’échanges entre les cellules. Nous avons pu obtenir
quelques indices préliminaires à de telles simplifications. En effet, un petit nombre
d’images acquises lors de la cartographie de la ploïdie obtenue par les méthodes de
FISH ont révélé une proximité entre certains noyaux polyploïdes et des
amincissements de la paroi cellulaire, vraisemblablement lieu de regroupement de
plasmodesmes (Figure 3). Une étude systématique de cette proximité doit cependant
être entreprise en relation avec le niveau de ploïdie afin de montrer un éventuel lien
avec la mise en place de l’endoréduplication chez la tomate. On peut alors se
demander pourquoi des cellules mettraient en place un rapprochement de leur noyau
- 177 -
dans l’espace via ces zones d’amincissements pariétaux. Malgré tout, cette
observation serait en accord avec une communication intercellulaire facilitée via une
amélioration des échanges symplastiques. Toutes ces observations tendent vers la
mise en place d’une cellule à l’organisation et au fonctionnement optimisés. En effet,
même si nos observations vont plutôt dans le sens d’un maintien du nombre
d’organites par unité de génome ou d’un maintien de la capacité globale d’échange
du noyau, on ne peut écarter l’hypothèse que les structurations observées, que ce
soit à l’échelle chromosomique, nucléaire ou cellulaire, servent une meilleure
ergonomie de la cellule polyploïde. Ce faisant, la mise en place de
l’endopolyploïdisation soutiendrait l’hypothèse de l’établissement d’une cellule au
rendement, plus élevés. Cependant, la problématique énergétique de la cellule
polyploïde reste très peu discutée dans la littérature, et, à notre connaissance,
aucune approche expérimentale n’a été tentée en vue d’étudier cette question
spécifique. Or, on pourrait imaginer comparer la production d’ATP des mitochondries
de cellules polyploïdes de cellules diploïdes en utilisant un compétiteur de l’oxygène
en tant qu’accepteur final d’électron produisant une réaction colorée et mesurable
par spectrophotométrie (ex : TTC,( Triphényl 2.3.5 tétrazolium chlorure) (Ruf and
Brunner 2003)). A ces données pourraient être couplées des analyses cytométriques
et des dosages protéiques permettant d’effectuer des corrélations entre énergie
produite (et donc potentiellement consommée) par unité de temps, quantité d’ADN
(et donc niveau de ploïdie moyen) et quantité totale de protéines produites (par unité
de temps). Ainsi, l’on pourrait mieux appréhender les notions de consommation et
d’économie d’énergie chez les cellules endopolyploïdisées, notions qui peuvent être
mises en relation directe avec les problématiques de croissance et de vitesse de
croissance.
- 178 -
5. CONCLUSION
Nous avons lors de cette étude mis au point une méthode de détermination de la
ploïdie in situ. Celle-ci nous a permis d’étudier les caractéristiques structurales de la
cellule en lien direct avec l’endopolyploïdisation et d’émettre l’hypothèse que la mise
en place de l’endopolyploïdisation pouvait être reliée à des problématiques
d’ergonomie cellulaire et d’économie d’énergie. De plus, nous avons pu confirmer
que l’endopolyploïdisation était étroitement liée à la croissance cellulaire et ce via
deux approches : le criblage de la banque de mutants Micro-Tom et la ploïdie in situ.
La première a révélé que la plupart des phénotypes d’augmentation de ploïdie
montraient une augmentation de leur taille cellulaire moyenne. De plus, aucun fruit
mutant dépourvu d’endopolyploïdisation n’a pu être identifié, ce qui peut nous
permettre de penser que le bon déroulement du développement du fruit de tomate
passe obligatoirement par la mise en place de l’endopolyploïdisation. La seconde a
révélé cette même corrélation mais directement à l’échelle cellulaire. Elle nous a
aussi indiqué que l’endopolyploïdisation, plutôt que de déterminer la taille cellulaire
finale, permettait plutôt une potentialisation de la croissance cellulaire. Enfin, nous
avons aussi pu obtenir, en corrélant les résultats de la répartition de la ploïdie in situ
et la dynamique de division cellulaire durant le développement du péricarpe de
tomate, des indices en faveur d’une mise en place de l’endopolyploïdisation
précédant la croissance cellulaire.
- 179 -
REFERENCES DISCUSSION - CONCLUSION
Anisimov, A.P. (2005) Endopolyploidy as a morphogenetic factor of development.
Cell Biology International, 29, 993-1004.
Bertin, N., Lecomte, A., Brunel, B., Fishman, S. and Genard, M. (2007) A model
describing cell polyploidization in tissues of growing fruit as related to
cessation of cell proliferation. Journal of Experimental Botany, 58, 1903-1913.
Bourdon, M., Frangne, N., Mathieu-Rivet, E., Nafati, M., Cheniclet, C., Renaudin,
J.-P. and Chevalier, C. (2010) Endoreduplication and Growth of Fleshy Fruits.
In Progress in Botany 71, pp. 101-132.
Bourdon, M., Coriton, O., Cheniclet, C., Brown, S., Poujol, C., Chevalier, C.,
Renaudin, J.-P., Frangne, N. (2010) In planta quantification of endopolyploidy
using Fluorescent In Situ Hybridization (FISH). Submitted
Bramsiepe, J., Wester, K., Weinl, C., Roodbarkelari, F., Kasili, R., Larkin, J.C.,
Hülskamp, M. and Schnittger, A. (2010) Endoreplication Controls Cell Fate
Maintenance. PLoS Genet, 6, e1000996.
Bünger-Kibler, S. and Bangerth, F. (1982) Relationship between cell number, cell
size and fruit size of seeded fruits of tomato (Lycopersicon esculentum Mill.),
and those induced parthenocarpically by the application of plant growth
regulators. Plant Growth Regulation, 1, 143-154.
Carvalheira, G.M.G. (2000) Plant polytene chromosomes. Genetics and Molecular
Biology, 23, 1043-1050.
Cheniclet, C., Rong, W.Y., Causse, M., Frangne, N., Bolling, L., Carde, J.-P. and
Renaudin, J.-P. (2005) Cell Expansion and Endoreduplication Show a Large
Genetic Variability in Pericarp and Contribute Strongly to Tomato Fruit Growth.
Plant Physiol., 139, 1984-1994.
D'Amato, F. (1984) Role of polyploidy in reproductive organs and tissues. Johri, BM
(ed) . Embryology of angiosperms . Springer, New York, 519-566.
D'Amato, F. and Durante, M. (2001) Polyploidy: John Wiley & Sons, Ltd.
Gillaspy, G., Bendavid, H. and Gruissem, W. (1993) FRUITS - A
DEVELOPMENTAL PERSPECTIVE. Plant Cell, 5, 1439-1451.
Hulskamp, M. (2004) Plant trichomes: a model for cell differentiation. Nat Rev Mol
Cell Biol, 5, 471-480.
- 180 -
John, P.C.L. and Qi, R. (2008) Cell division and endoreduplication: doubtful engines
of vegetative growth. Trends in Plant Science, 13, 121-127.
Joubès, J. and Chevalier, C. (2000) Endoreduplication in higher plants. Plant
Molecular Biology, 43, 735-745.
Nafati, M., Cheniclet, C., Hernould, M., Do, P.T., Fernie, A., Chevalier, C.,
Gévaudant, F. (2011) The specific overexpression of a Cyclin Dependent
Kinase Inhibitor in tomato fruit mesocarp cells uncouples endoreduplication
and cell growth. Plant J., in press.
Nagl, W. (1975) DNA endoreduplication and polyteny understood as evolutionary
strategies. Nature, UK, 261, 614-615.
Nagl, W. (1976) NUCLEAR ORGANIZATION. Annual Review of Plant Physiology
and Plant Molecular Biology, 27, 39-69.
Ruf, M. and Brunner, I. (2003) Vitality of tree fine roots: reevaluation of the
tetrazolium test. Tree Physiology, 23, 257-263.
Schoenfelder, S., Sexton, T., Chakalova, L., Cope, N.F., Horton, A., Andrews, S.,
Kurukuti, S., Mitchell, J.A., Umlauf, D., Dimitrova, D.S., Eskiw, C.H., Luo,
Y., Wei, C.-L., Ruan, Y., Bieker, J.J. and Fraser, P. (2010) Preferential
associations between co-regulated genes reveal a transcriptional interactome
in erythroid cells. Nat Genet, 42, 53-61.
Sugimoto-Shirasu, K. and Roberts, K. (2003) "Big it up": endoreduplication and
cell-size control in plants. Current Opinion in Plant Biology, 6, 544-553.
Wang, Z., Gerstein, M. and Snyder, M. (2009) RNA-Seq: a revolutionary tool for
transcriptomics. Nat Rev Genet, 10, 57-63.
Wegel, E. and Shaw, P. (2005) Gene activation and deactivation related changes in
the three-dimensional structure of chromatin. Chromosoma, 114, 331-337.
Zybina, E.V. and Zybina, T.G. (1996) Polytene chromosomes in mammalian cells.
International Review of Cytology - a Survey of Cell Biology, Vol 165, 165, 53-
119.
- 181 -
ANNEXES
PRODUCTION SCIENTIFIQUE
Revues à comité de lecture
Bourdon, M., Coriton, O., Cheniclet, C., Brown, S., Poujol, C., Chevalier, C.,
Renaudin, J.-P., Frangne, N. (2011) In planta quantification of
endoreduplication using Fluorescent In Situ Hybridization (FISH). Plant
Journal, 66 : 1089-1099.
Chevalier, C., Nafati, M., Mathieu-Rivet, E., Bourdon M., Frangne, N., Cheniclet,
C., Renaudin J.-P. Gévaudant, F., Hernould, M. (2011) Elucidating the
functional role of endoreduplication in tomato fruit development. Ann. Bot.
Domergue F., Vishwanath S.J., Joubès J., Ono J., Lee J., Bourdon M., Alhattab
R., Lowe C., Pascal S., Lessire R., and Rowland O. (2010) Three
Arabidopsis fatty acyl-CoA reductases, FAR1, FAR4, and FAR5, generate
primary fatty alcohols associated with suberin deposition. Plant Physiol, 153:
1539-1554.
Chapitres d’ouvrage
Bourdon, M., Frangne, N., Mathieu-Rivet, E., Nafati, M., Cheniclet, C., Renaudin,
J.-P. and Chevalier, C. (2010) Endoreduplication and Growth of Fleshy Fruits.
In Progress in Botany 71, pp. 101-132.
Communications à des congrès
2010 - Bourdon M., Coriton O., Cheniclet C., Brown S., Peypelut M.,
Rouyère V., Renaudin J.P., Chevalier C., Frangne N. Toward a
- 182 -
comprehensive model for setting up endopolyploidization during tomato
fruit development. XVII Congress of the FESPB, 4-9 July 2010,
Valencia, Spain (Best Poster Price)
2010 - Bourdon M., Coriton O., Cheniclet C., Brown S., Peypelut M.,
Chevalier C., Renaudin J.P., Frangne N. Endopolyploïdisation et fruit
de tomate. Journées de l’école doctorale, 28 avril 2010, Arcachon,
France (communication orale).
2009 - Bourdon M., Coriton O., Cheniclet C., Brown S., Peypelut M.,
Chevalier C., Renaudin J.P., Frangne N. Cytogenetics for
understanding endopolyploidization in tomato. 8th National Meeting of
the Société Française de Biologie Végétale (SFBV), 8-10 July 2009,
Strasbourg, France (Poster).
2009 - Bourdon M., Coriton O., Cheniclet C., Brown S., Peypelut M.,
Rouyère V., Chevalier C., Renaudin J.P., Frangne N. A Cytogenetics
approach to understand endopolyploidization in tomato. Journées de
l’école doctorale, avril 2009, Arcachon, France (Poster).
2008 - Bourdon M., Coriton O., Cheniclet C., Brown S., Peypelut M.,
Chevalier C., Renaudin J.P., Frangne N. Endopolyploidy in tomato
fruit (Solanum lycopersicum) : Endomitosis vs Endoreduplication?
Réunion du groupe Cytogénétique & Polyploïdie, 2-4 avril 2008,
Angers, France (communication orale).
Recommended