Preventing
Healthcare-Associated Infections
Council of State and Territorial Epidemiologists
Sunday Workshop
June 7, 2009
Presented by:
Division of Healthcare Quality Promotion
Centers for Disease Control and Prevention
Agenda � Welcome & Introduction � Overview of HAI Prevention Activities � Recovery Act Background and Intent � State HAI Plans and Progress � NHSN � Prevention Collaboratives � CDC Technical Support � Questions
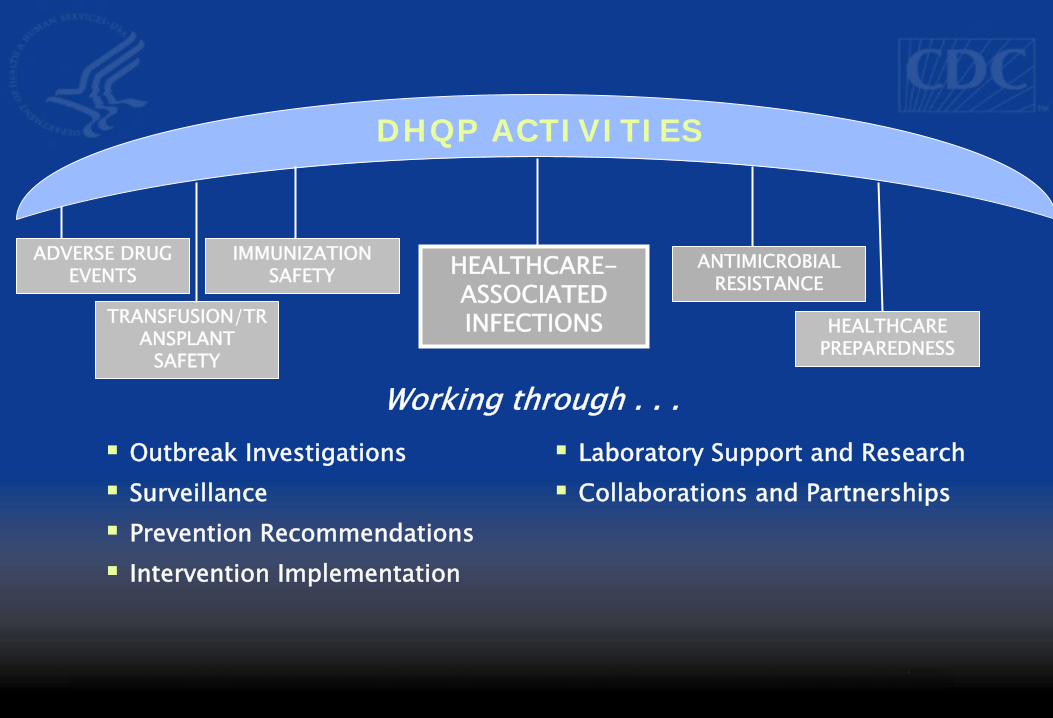
DHQP ACTIVITIES
HEALTHCARE-ASSOCIATED INFECTIONS
ANTIMICROBIAL RESISTANCE
ADVERSE DRUG EVENTS
TRANSFUSION/TRANSPLANT
SAFETY
HEALTHCARE PREPAREDNESS
IMMUNIZATION SAFETY
� Outbreak Investigations � Surveillance � Prevention Recommendations � Intervention Implementation
� Laboratory Support and Research � Collaborations and Partnerships
Working through . . .
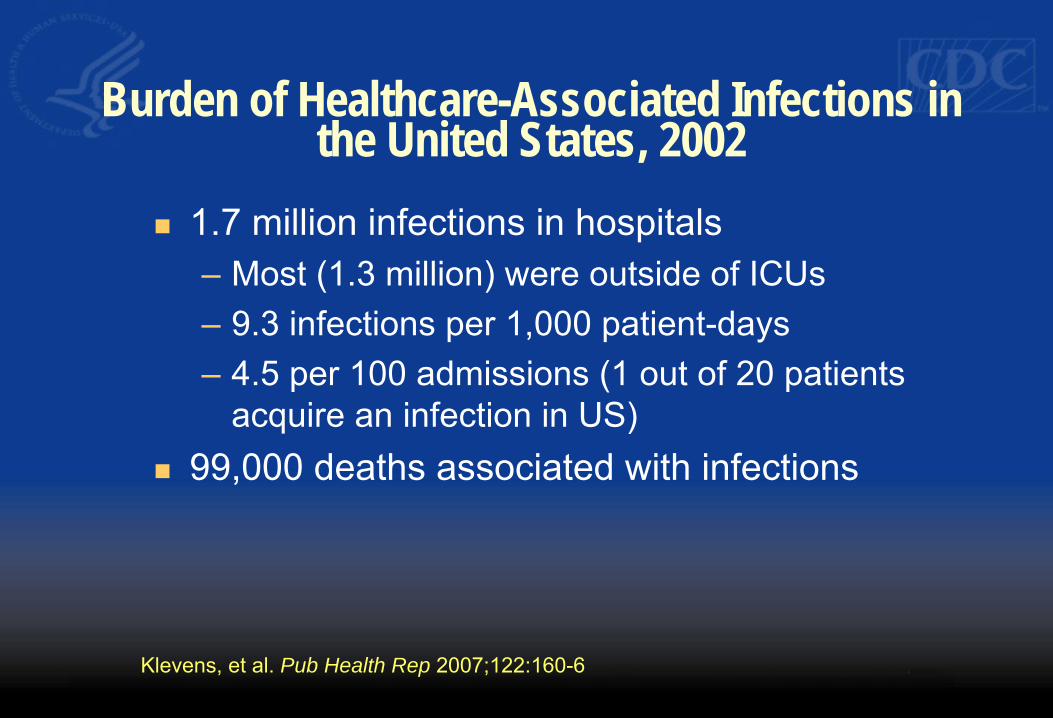
Burden of Healthcare-Associated Infections inthe United States, 2002
� 1.7 million infections in hospitals – Most (1.3 million) were outside of ICUs – 9.3 infections per 1,000 patient-days – 4.5 per 100 admissions (1 out of 20 patients
acquire an infection in US) � 99,000 deaths associated with infections
Klevens, et al. Pub Health Rep 2007;122:160-6
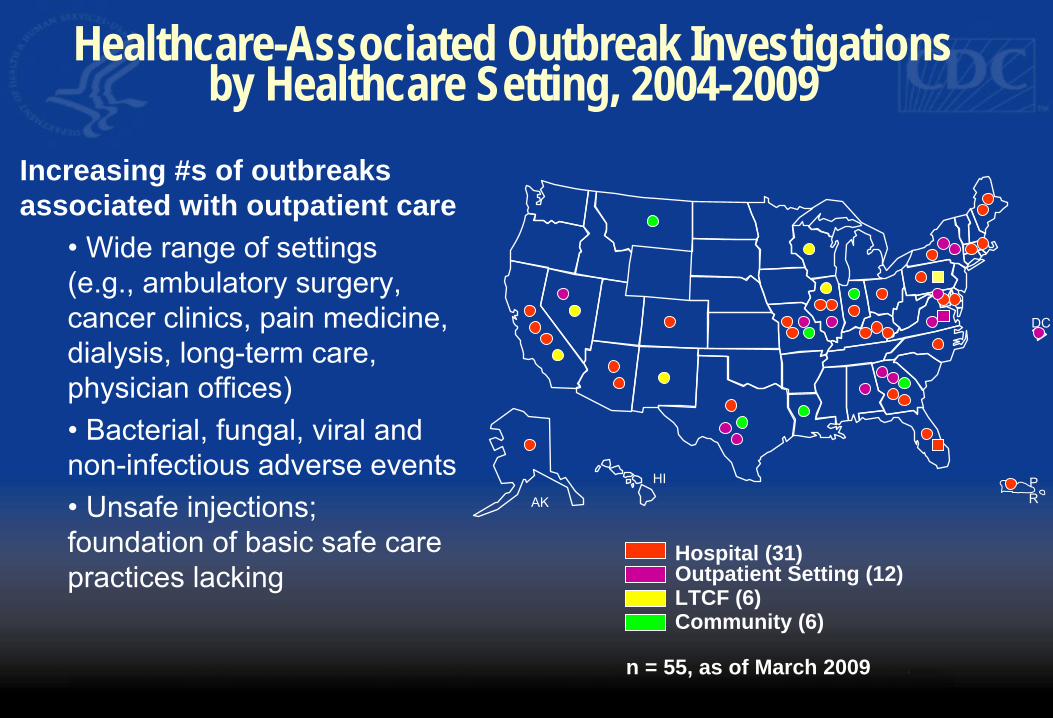
Healthcare-Associated Outbreak Investigationsby Healthcare Setting, 2004-2009
Increasing #s of outbreaks associated with outpatient care
• Wide range of settings
(e.g., ambulatory surgery,
cancer clinics, pain medicine,
dialysis, long-term care,
physician offices)
• Bacterial, fungal, viral and
non-infectious adverse events
• Unsafe injections;
foundation of basic safe care Hospital (31)Outpatient Setting (12)practices lacking LTCF (6)Community (6)
DC
AK
HI P R
n = 55, as of March 2009
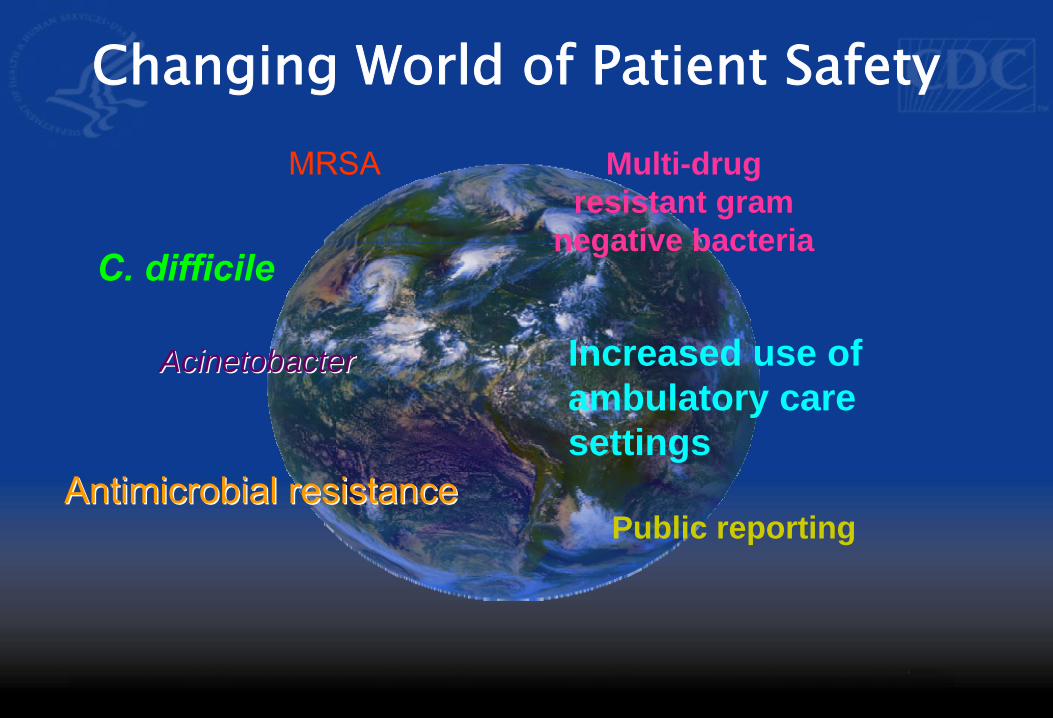
MRSA
Increased use of ambulatory care settings
C. difficile
Antimicrobial resistanceAntimicrobial resistancePublic reporting
Multi-drug resistant gram
negative bacteria
Changing World of Patient Safety
AcinetobacterAcinetobacter
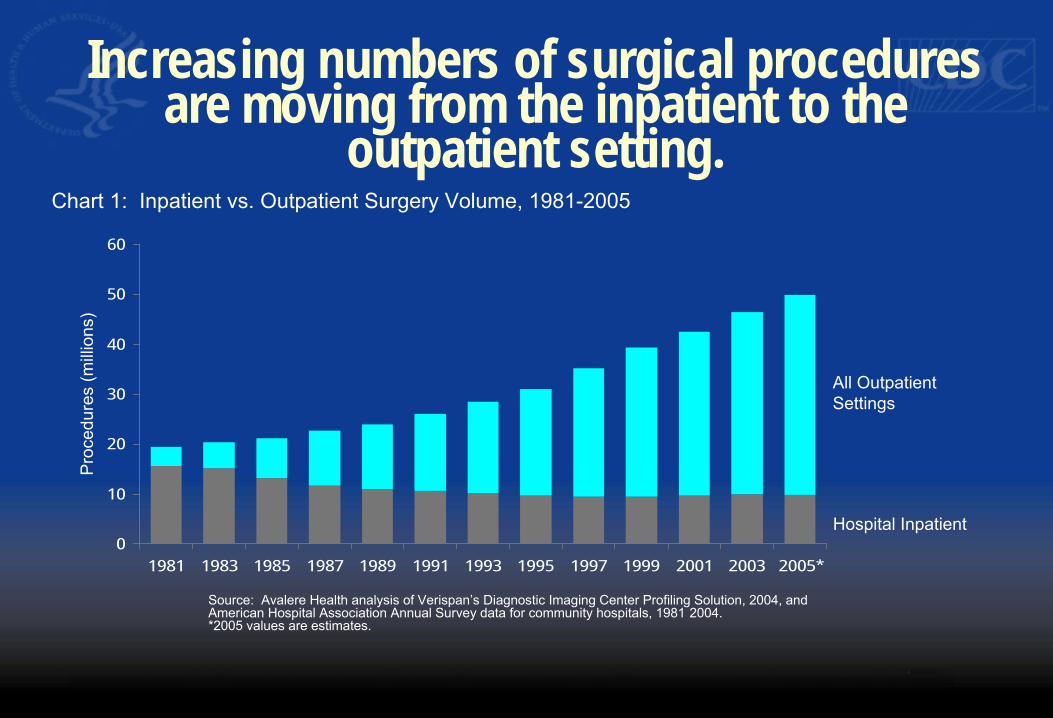
Increasing numbers of surgical proceduresare moving from the inpatient to the
outpatient setting.
Chart 1: Inpatient vs. Outpatient Surgery Volume, 1981-2005
Pro
cedu
res
(mill
ions
)
60
50
40
30
20
10
0
All Outpatient Settings
Hospital Inpatient
1981 1983 1985 1987 1989 1991 1993 1995 1997 1999 2001 2003 2005*
Source: Avalere Health analysis of Verispan’s Diagnostic Imaging Center Profiling Solution, 2004, and
American Hospital Association Annual Survey data for community hospitals, 1981 2004.
*2005 values are estimates.
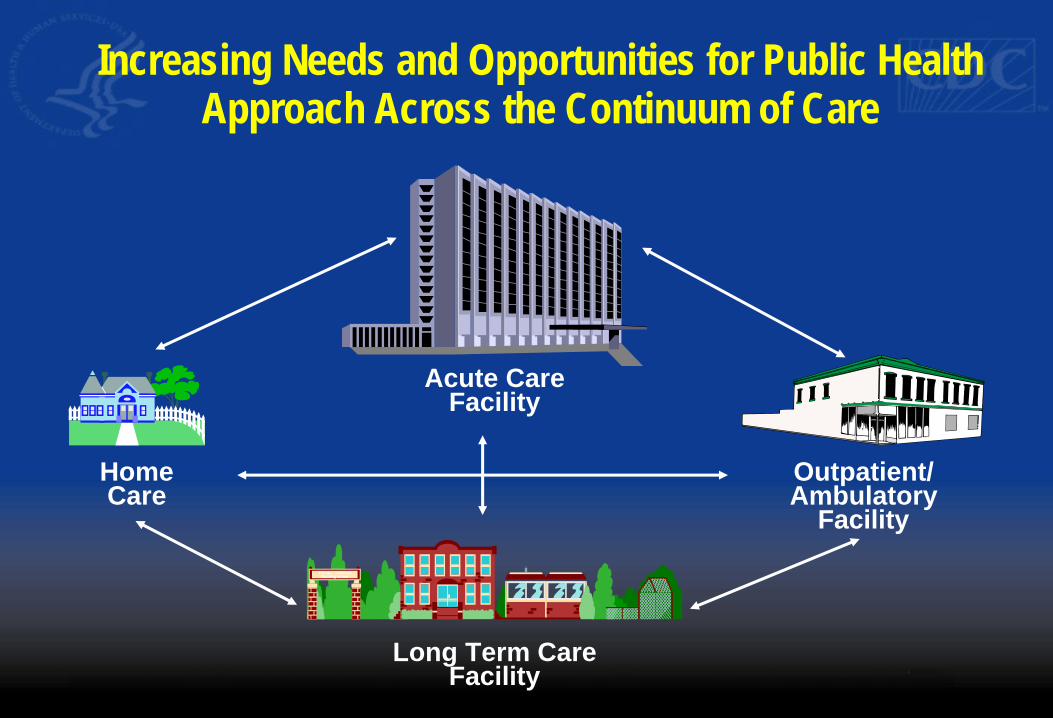
Increasing Needs and Opportunities for Public Health Approach Across the Continuum of Care
Acute Care Facility
Home Outpatient/Care Ambulatory
Facility Tranqu Gardens
Nursing Home
Long Term Care
Facility
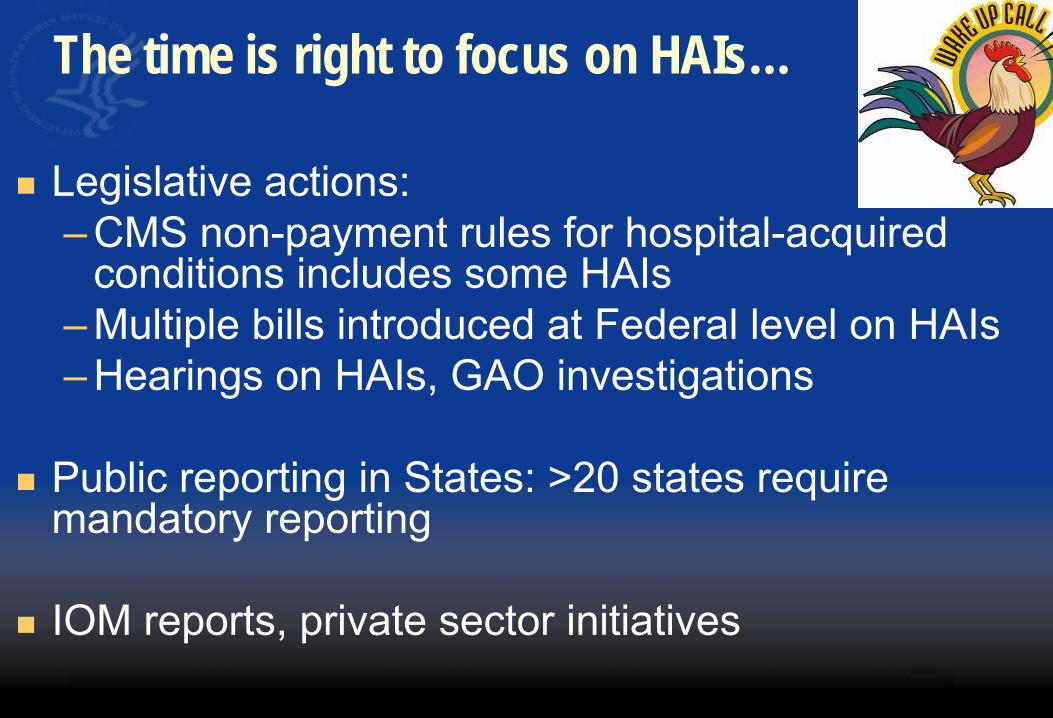
The time is right to focus on HAIs…
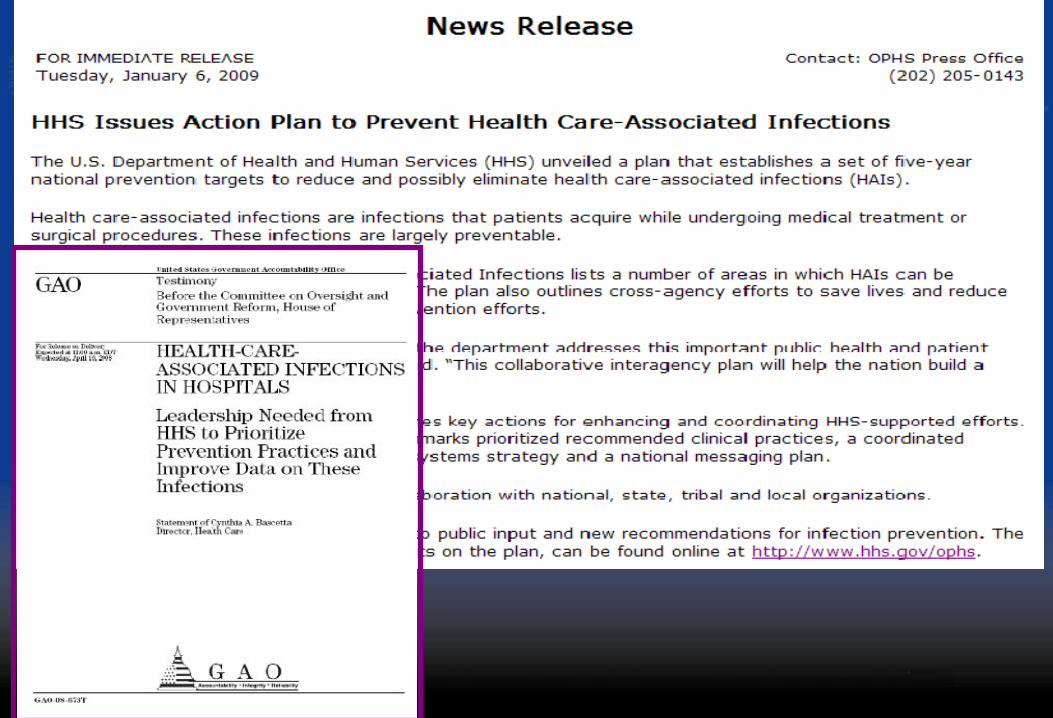
� Legislative actions: – CMS non-payment rules for hospital-acquired
conditions includes some HAIs – Multiple bills introduced at Federal level on HAIs – Hearings on HAIs, GAO investigations
� Public reporting in States: >20 states requiremandatory reporting
� IOM reports, private sector initiatives
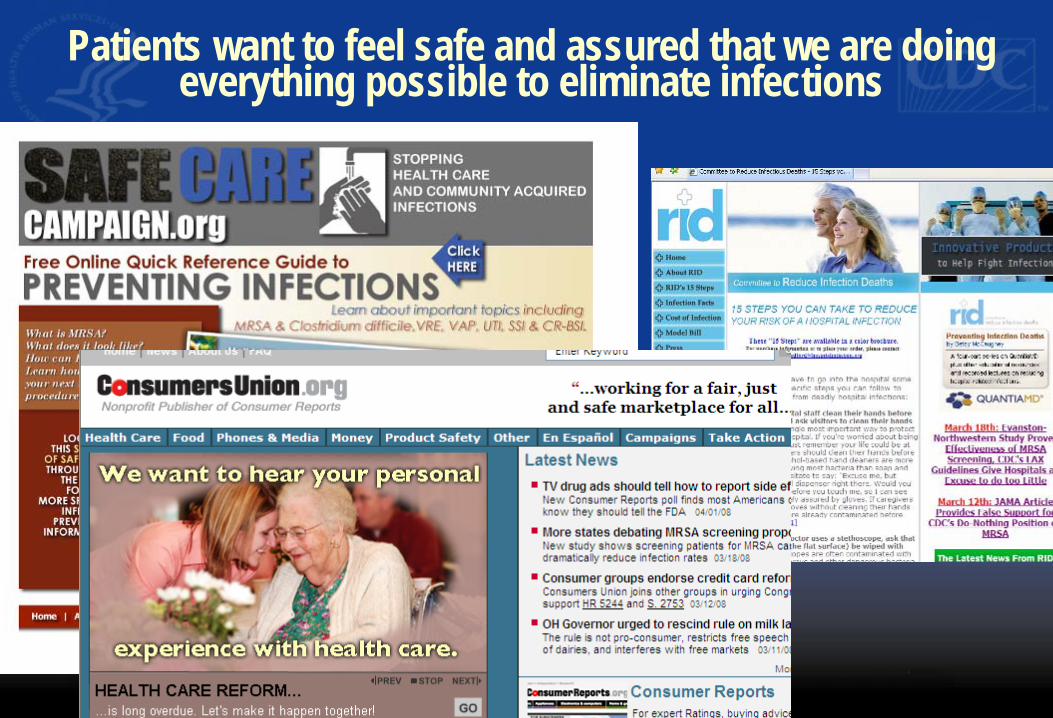
Patients want to feel safe and assured that we are doingeverything possible to eliminate infections
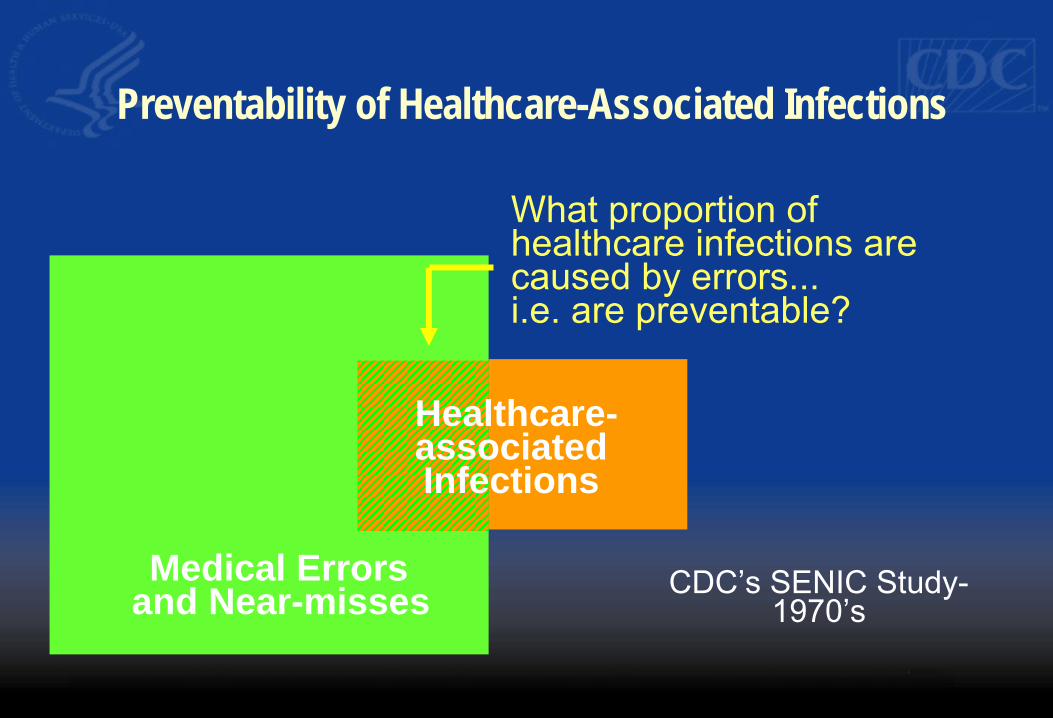
Medical Errors and Near-misses
Healthcare-associated Infections
What proportion ofhealthcare infections are caused by errors...i.e. are preventable?
CDC’s SENIC Study-1970’s
Preventability of Healthcare-Associated Infections
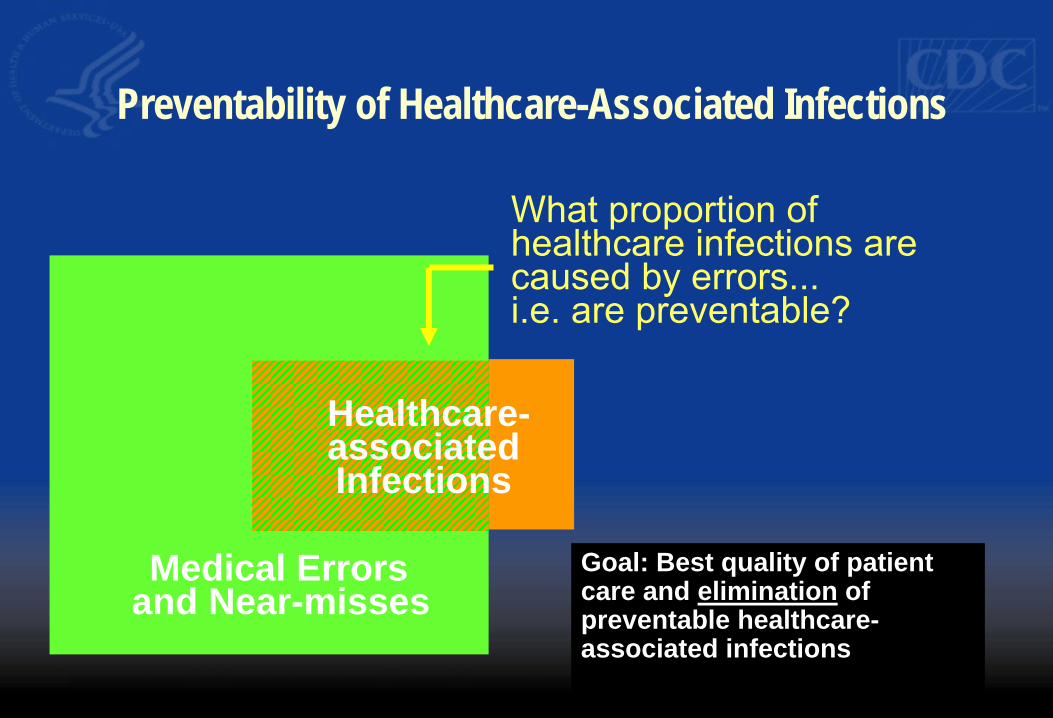
Preventability of Healthcare-Associated Infections
Medical Errors and Near-misses
Healthcare-associated Infections
What proportion ofhealthcare infections are caused by errors...i.e. are preventable?
Goal: Best quality of patientcare and elimination of preventable healthcare-associated infections
Keys for the Elimination of
Healthcare-Associated Infections � Full adherence to recommendations
– Across care continuum � Collect data and disseminate results
– Communication with providers and consumers
– Evaluate how we’re doing � Identify and respond to emerging
threats � Improve science for prevention
through research � Recognize/ensure excellence
Keys for the Elimination of
Healthcare-Associated Infections • Full adherence to prevention recommendations (Accountability)
• Success in regional initiatives
¾ ARRA funds to expand to state health agencies
• Needs extend across the care continuum • Oversight and monitoring
• Collection of data to assess prevention impact and dissemination of results to healthcare providers and consumers (Transparency and sustainability) • State reporting legislation ¾ NHSN in 50 States, using data to move towards national targets
Keys for the Elimination of
Healthcare-Associated Infections (cont.)
• Identify and respond to emerging threats • Outbreak investigations as a flag for emerging problems ¾ Evidence base, strategies and guidelines to address new problems
• Finding new solutions for HAI prevention • Identifying and addressing knowledge gaps • Innovative ways to increase adherence to recommendations
• Ensuring excellence • CMS deficit reduction act, survey capacity
¾ Promoting best practices, ARRA to increase inspections in ASCs
Keys for the Elimination of
Healthcare-Associated Infections (cont.)
• New Knowledge • Identify and respond to emerging threats
• Outbreak investigations as a flag for emerging problems ¾ Strategies and guidelines to address new problems
• Finding new solutions for HAI prevention • Indentifying and addressing knowledge gaps • Innovative ways to increase adherence to recommendations
Recovery Act Intent andBackground
Recovery Act
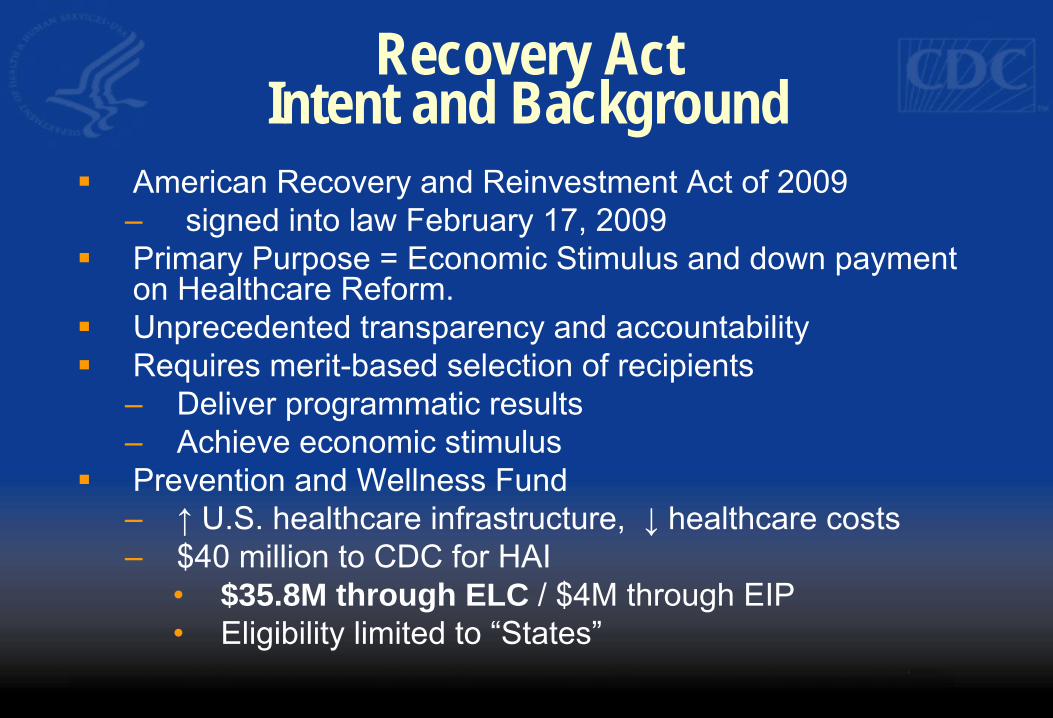
Intent and Background � American Recovery and Reinvestment Act of 2009
– signed into law February 17, 2009 � Primary Purpose = Economic Stimulus and down payment
on Healthcare Reform. � Unprecedented transparency and accountability � Requires merit-based selection of recipients
– Deliver programmatic results – Achieve economic stimulus
� Prevention and Wellness Fund – ↑ U.S. healthcare infrastructure, ↓ healthcare costs – $40 million to CDC for HAI
• $35.8M through ELC / $4M through EIP • Eligibility limited to “States”
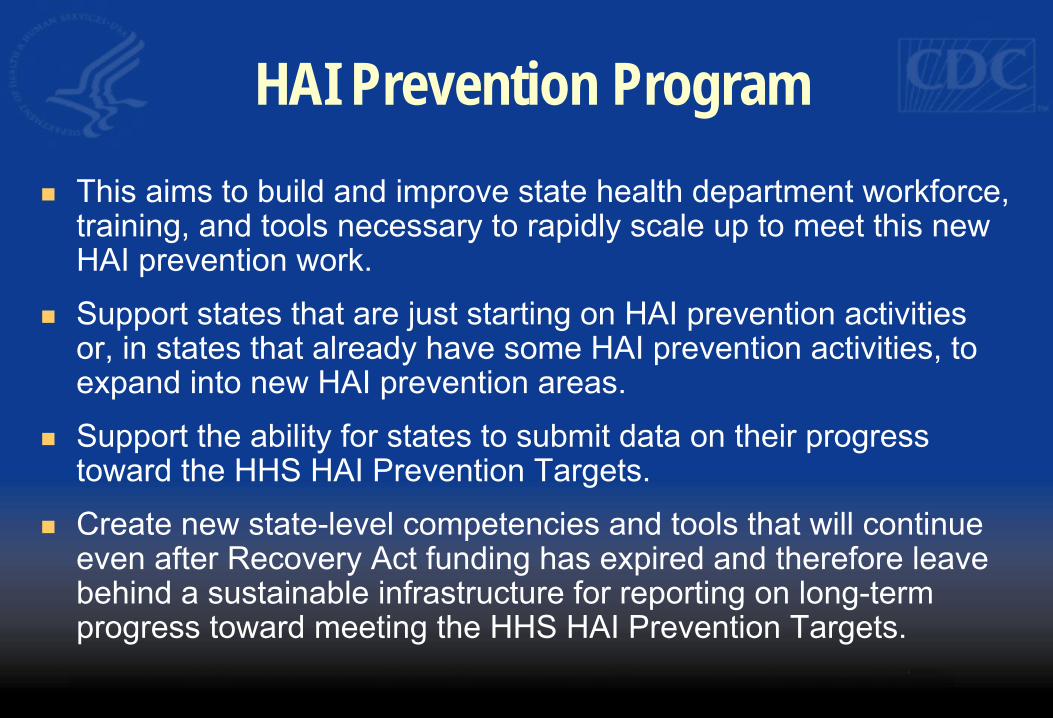
HAI Prevention Program � This aims to build and improve state health department workforce,
training, and tools necessary to rapidly scale up to meet this newHAI prevention work.
� Support states that are just starting on HAI prevention activitiesor, in states that already have some HAI prevention activities, toexpand into new HAI prevention areas.
� Support the ability for states to submit data on their progresstoward the HHS HAI Prevention Targets.
� Create new state-level competencies and tools that will continueeven after Recovery Act funding has expired and therefore leave behind a sustainable infrastructure for reporting on long-termprogress toward meeting the HHS HAI Prevention Targets.
Activities – Epidemiology and Laboratory Capacity (ELC) Program
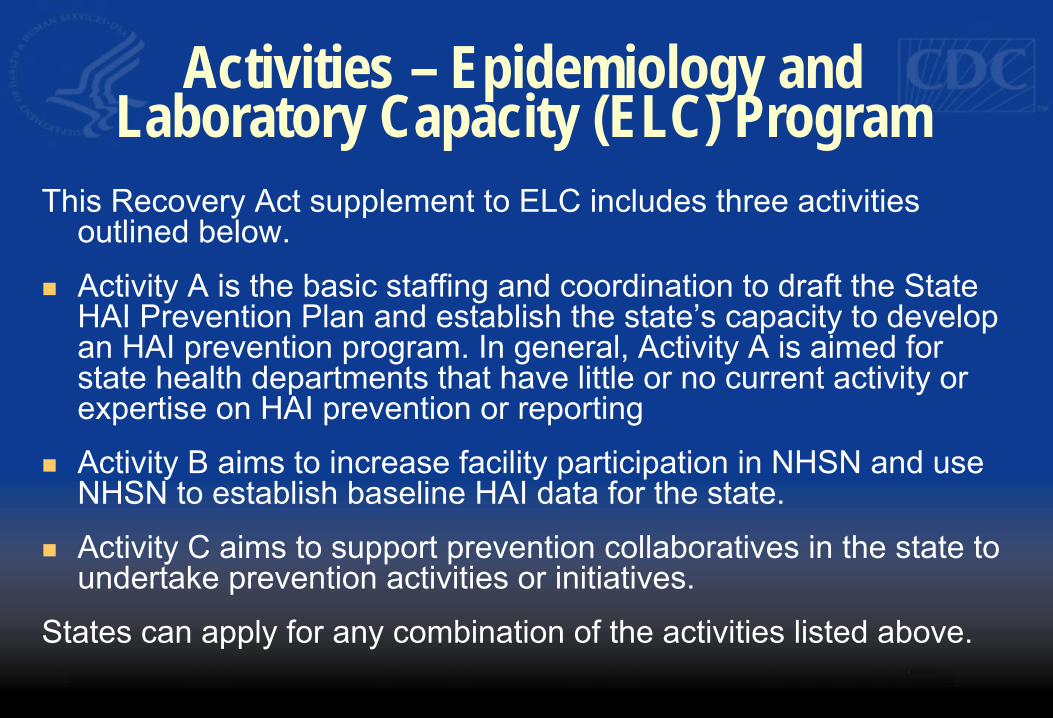
This Recovery Act supplement to ELC includes three activities outlined below.
� Activity A is the basic staffing and coordination to draft the StateHAI Prevention Plan and establish the state’s capacity to developan HAI prevention program. In general, Activity A is aimed forstate health departments that have little or no current activity or expertise on HAI prevention or reporting
� Activity B aims to increase facility participation in NHSN and useNHSN to establish baseline HAI data for the state.
� Activity C aims to support prevention collaboratives in the state toundertake prevention activities or initiatives.
States can apply for any combination of the activities listed above.
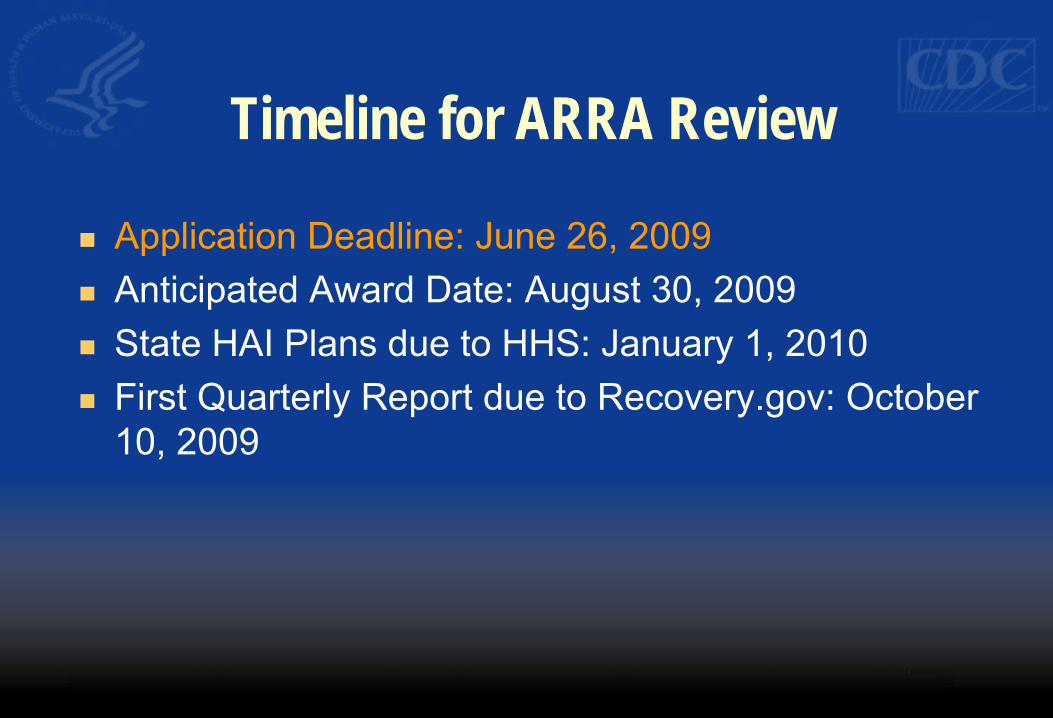
Timeline for ARRA Review � Application Deadline: June 26, 2009 � Anticipated Award Date: August 30, 2009 � State HAI Plans due to HHS: January 1, 2010 � First Quarterly Report due to Recovery.gov: October
10, 2009
State HAI Plans and Progress
Block Grant Funds and HAI Plans
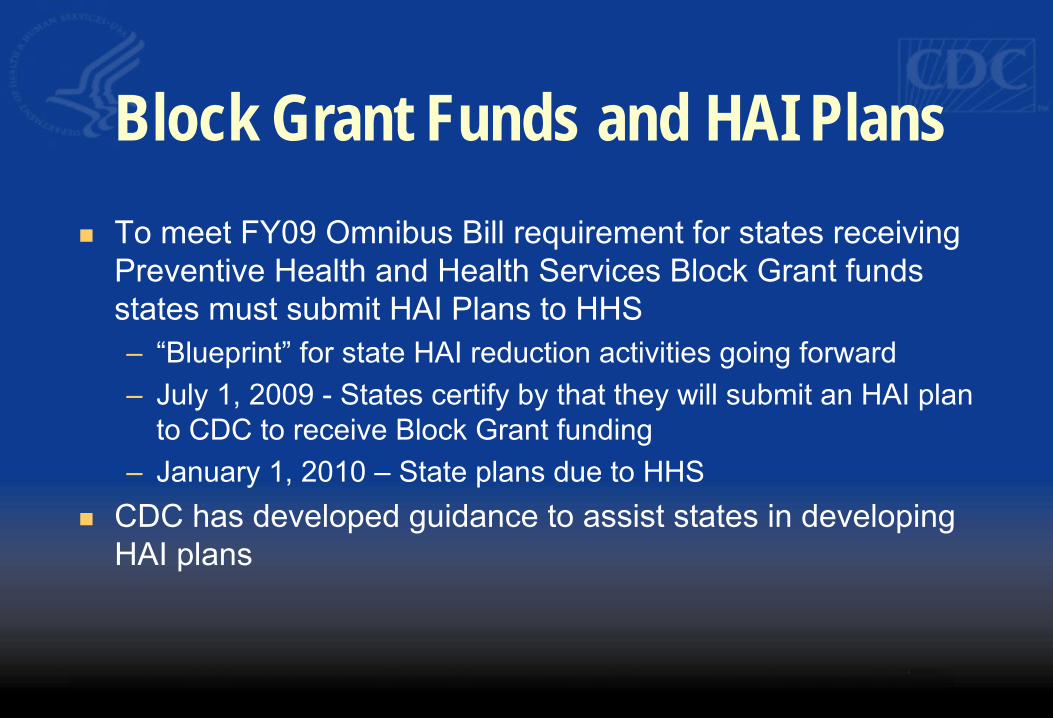
� To meet FY09 Omnibus Bill requirement for states receiving Preventive Health and Health Services Block Grant funds states must submit HAI Plans to HHS – “Blueprint” for state HAI reduction activities going forward – July 1, 2009 - States certify by that they will submit an HAI plan
to CDC to receive Block Grant funding – January 1, 2010 – State plans due to HHS
� CDC has developed guidance to assist states in developing HAI plans
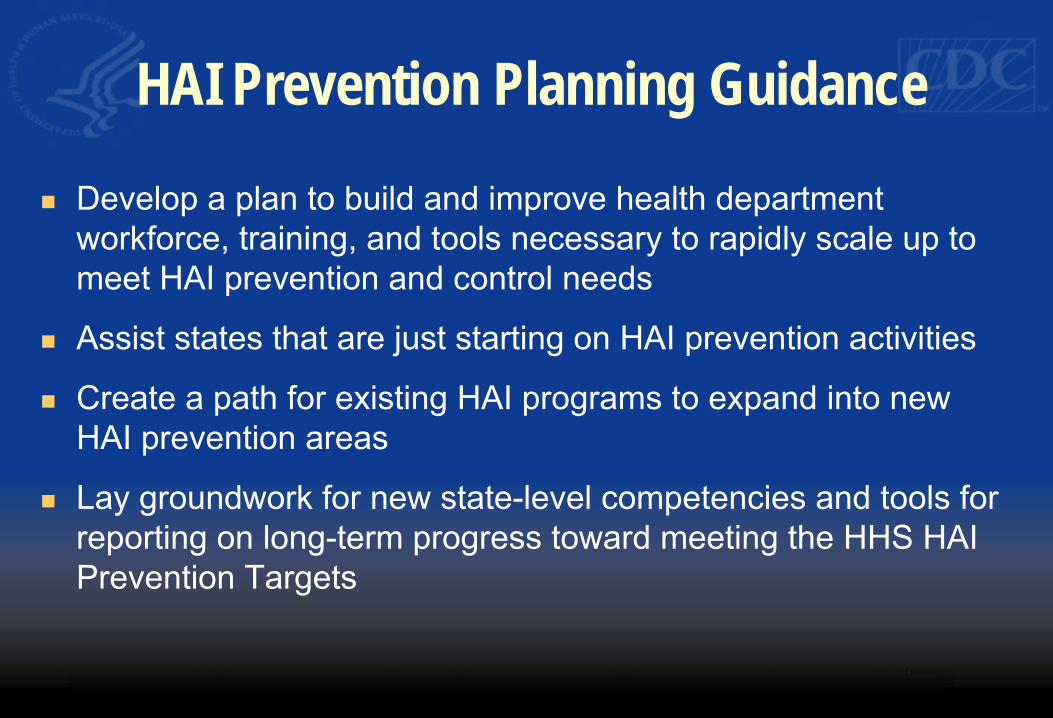
HAI Prevention Planning Guidance
� Develop a plan to build and improve health department workforce, training, and tools necessary to rapidly scale up to meet HAI prevention and control needs
� Assist states that are just starting on HAI prevention activities
� Create a path for existing HAI programs to expand into new HAI prevention areas
� Lay groundwork for new state-level competencies and tools for reporting on long-term progress toward meeting the HHS HAI Prevention Targets
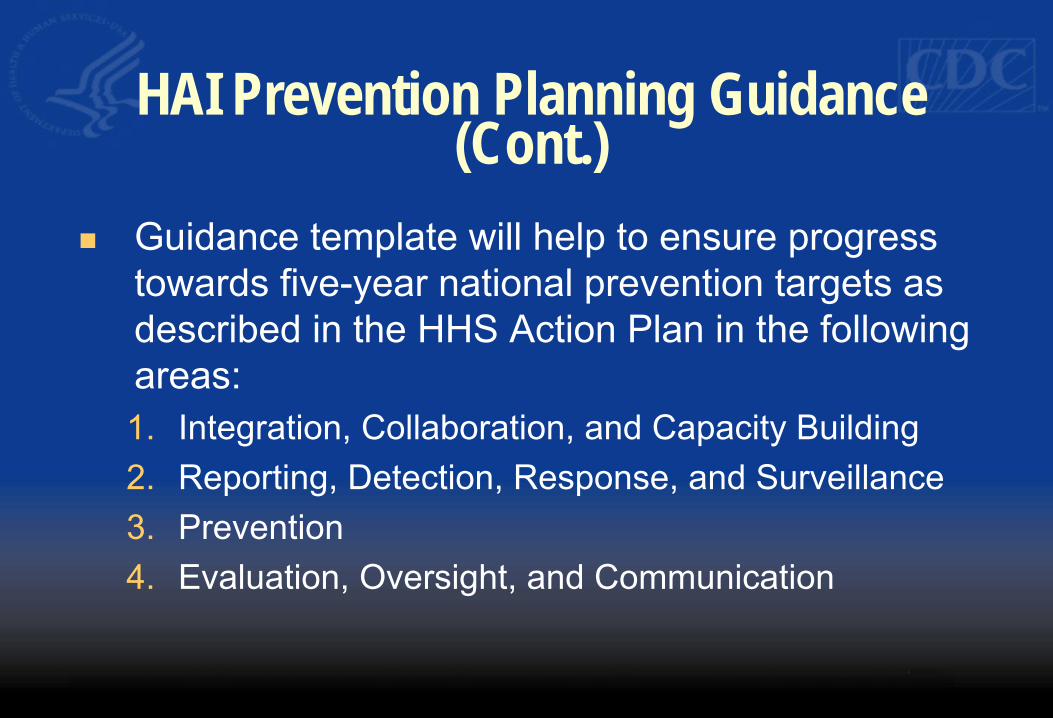
HAI Prevention Planning Guidance (Cont.)
� Guidance template will help to ensure progress towards five-year national prevention targets as described in the HHS Action Plan in the following areas: 1. Integration, Collaboration, and Capacity Building
2. Reporting, Detection, Response, and Surveillance
3. Prevention 4. Evaluation, Oversight, and Communication
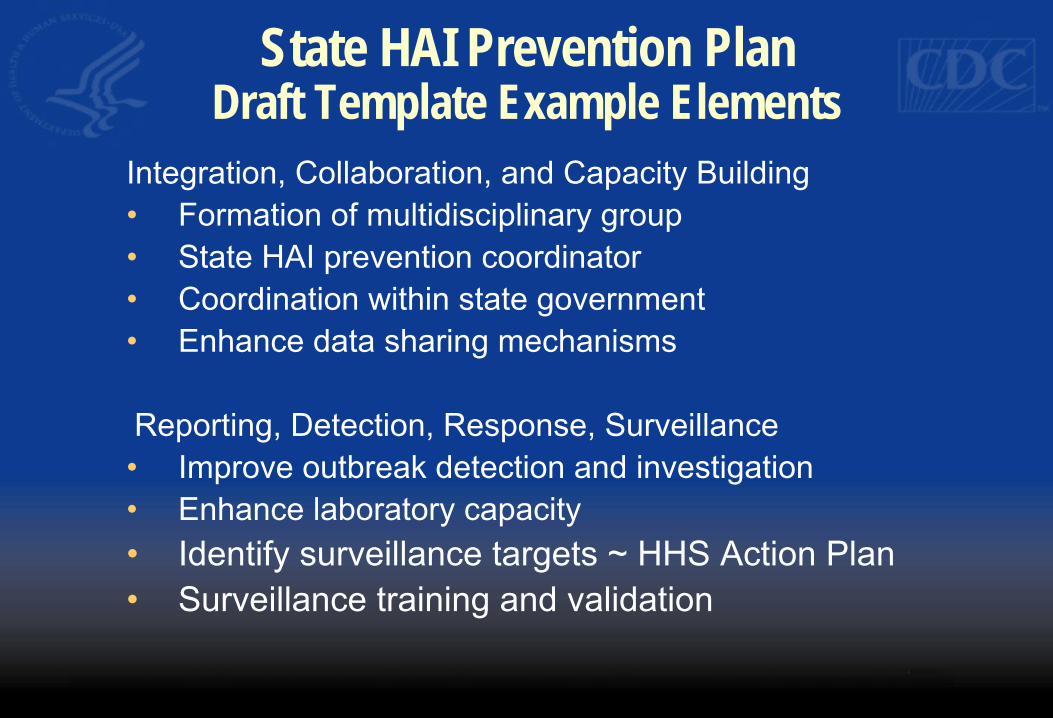
State HAI Prevention Plan
Draft Template Example Elements Integration, Collaboration, and Capacity Building • Formation of multidisciplinary group • State HAI prevention coordinator • Coordination within state government • Enhance data sharing mechanisms
Reporting, Detection, Response, Surveillance • Improve outbreak detection and investigation • Enhance laboratory capacity • Identify surveillance targets ~ HHS Action Plan
• Surveillance training and validation
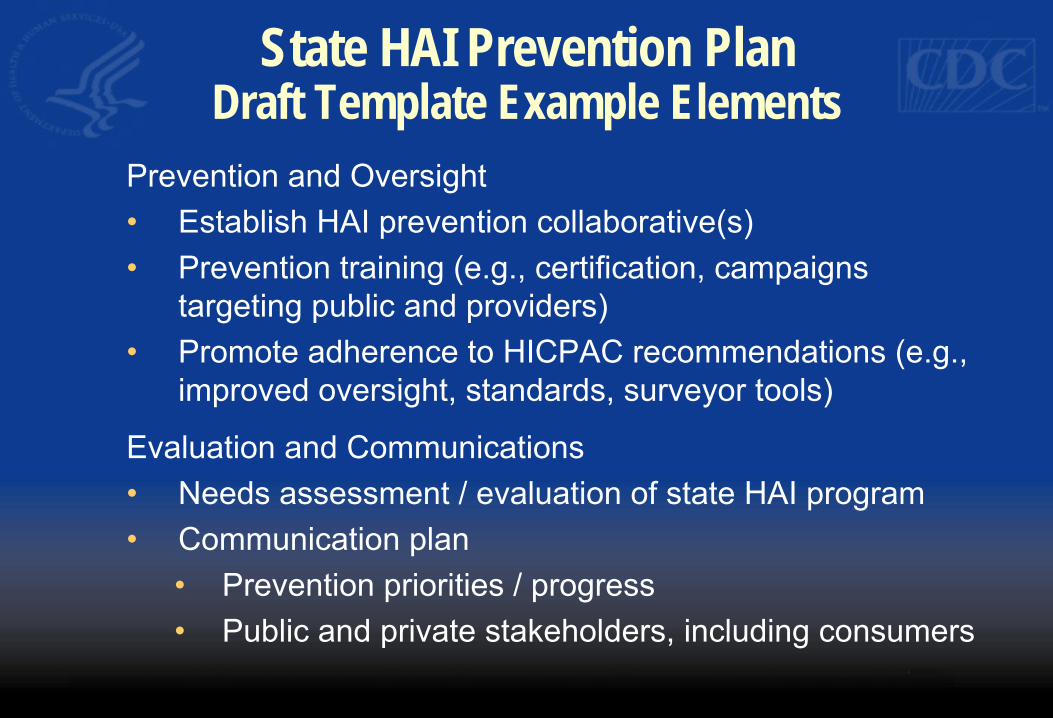
State HAI Prevention Plan
Draft Template Example Elements Prevention and Oversight • Establish HAI prevention collaborative(s) • Prevention training (e.g., certification, campaigns
targeting public and providers) • Promote adherence to HICPAC recommendations (e.g.,
improved oversight, standards, surveyor tools)
Evaluation and Communications • Needs assessment / evaluation of state HAI program • Communication plan
• Prevention priorities / progress • Public and private stakeholders, including consumers
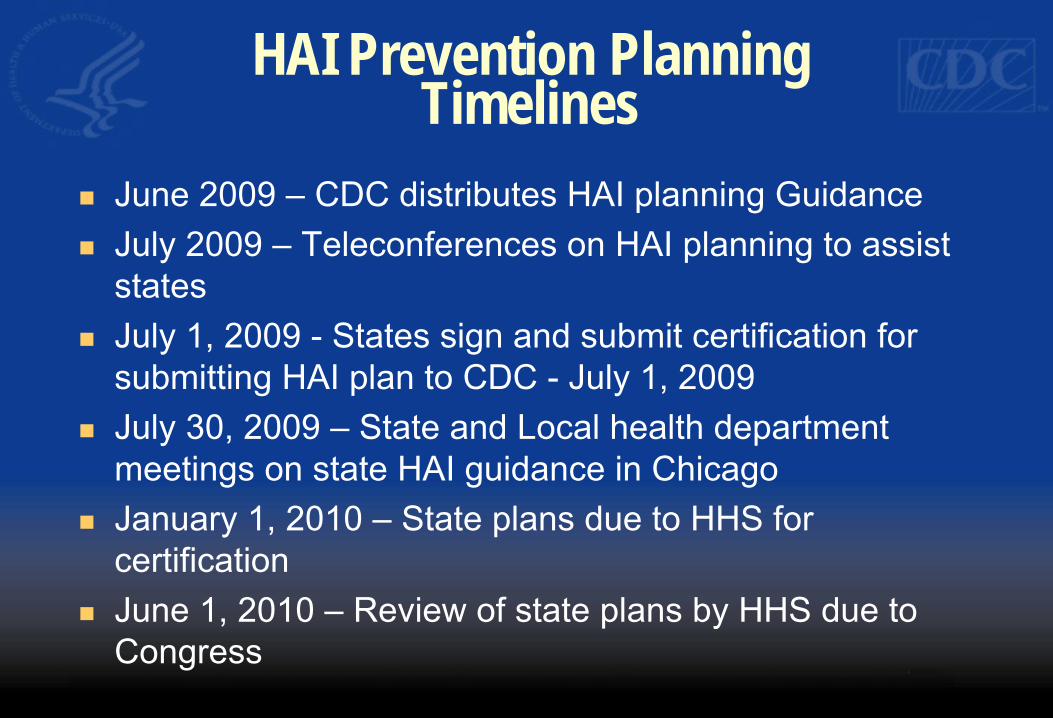
HAI Prevention Planning
Timelines
� June 2009 – CDC distributes HAI planning Guidance � July 2009 – Teleconferences on HAI planning to assist
states � July 1, 2009 - States sign and submit certification for
submitting HAI plan to CDC - July 1, 2009 � July 30, 2009 – State and Local health department
meetings on state HAI guidance in Chicago � January 1, 2010 – State plans due to HHS for
certification � June 1, 2010 – Review of state plans by HHS due to
Congress
National Healthcare Safety NetworkNHSN
NHSN as a Tool for State HAI
Reporting Programs
Catherine Rebmann
NHSN Implementation Team Leader
Division of Healthcare Quality Promotion
Centers for Disease Control and Prevention
CSTE Annual Meeting
June 7, 2009
Target Audience
� This session is designed for state or local health department employees who want to use the National Healthcare Safety Network (NHSN) to collect HAI data from all or some of the healthcare facilities in their jurisdiction.
Objectives
� What is NHSN? – Purposes – Components and Modules – Surveillance methodology
� Who is using NHSN and what are they using itfor?
� Use of the GROUP function in NHSN – What is a Group? – How to form a Group – Tips for the Group to get the data they need
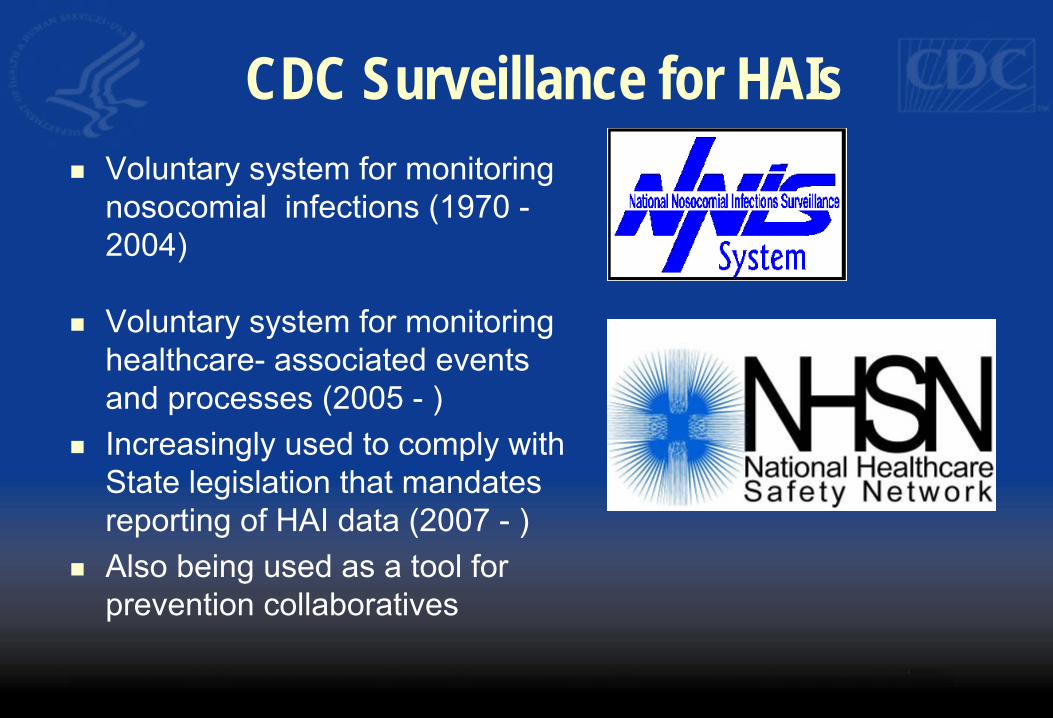
CDC Surveillance for HAIs � Voluntary system for monitoring
nosocomial infections (1970 -2004)
� Voluntary system for monitoring healthcare- associated events and processes (2005 - )
� Increasingly used to comply with State legislation that mandates reporting of HAI data (2007 - )
� Also being used as a tool for prevention collaboratives
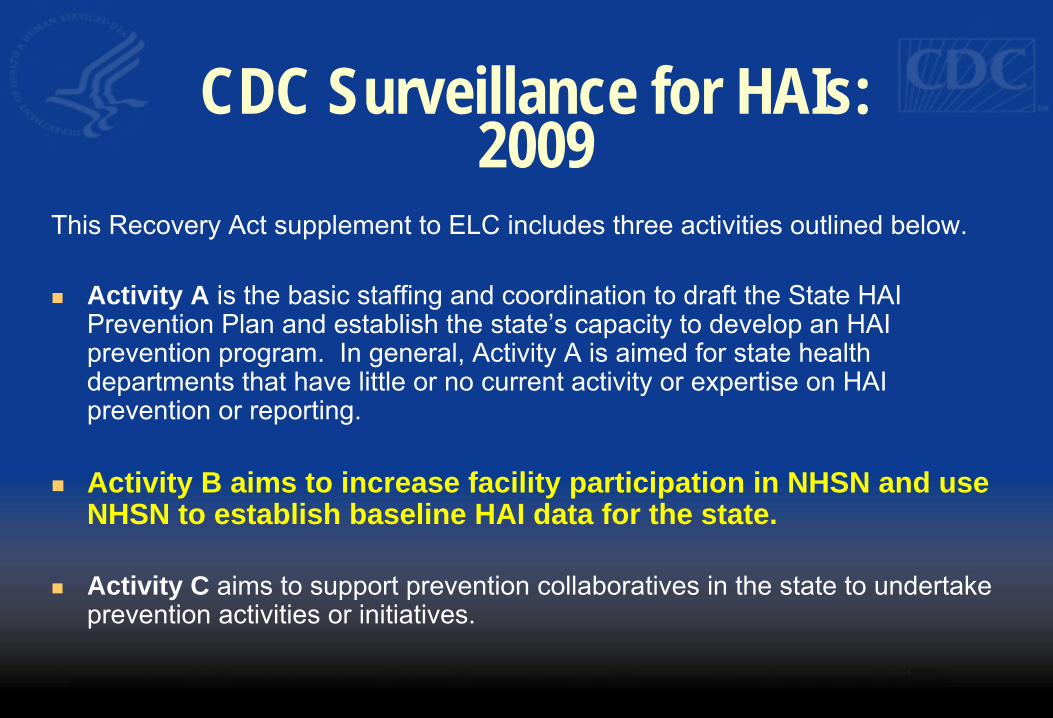
CDC Surveillance for HAIs: 2009
This Recovery Act supplement to ELC includes three activities outlined below.
� Activity A is the basic staffing and coordination to draft the State HAI Prevention Plan and establish the state’s capacity to develop an HAI prevention program. In general, Activity A is aimed for state health departments that have little or no current activity or expertise on HAI prevention or reporting.
� Activity B aims to increase facility participation in NHSN and useNHSN to establish baseline HAI data for the state.
� Activity C aims to support prevention collaboratives in the state to undertake prevention activities or initiatives.
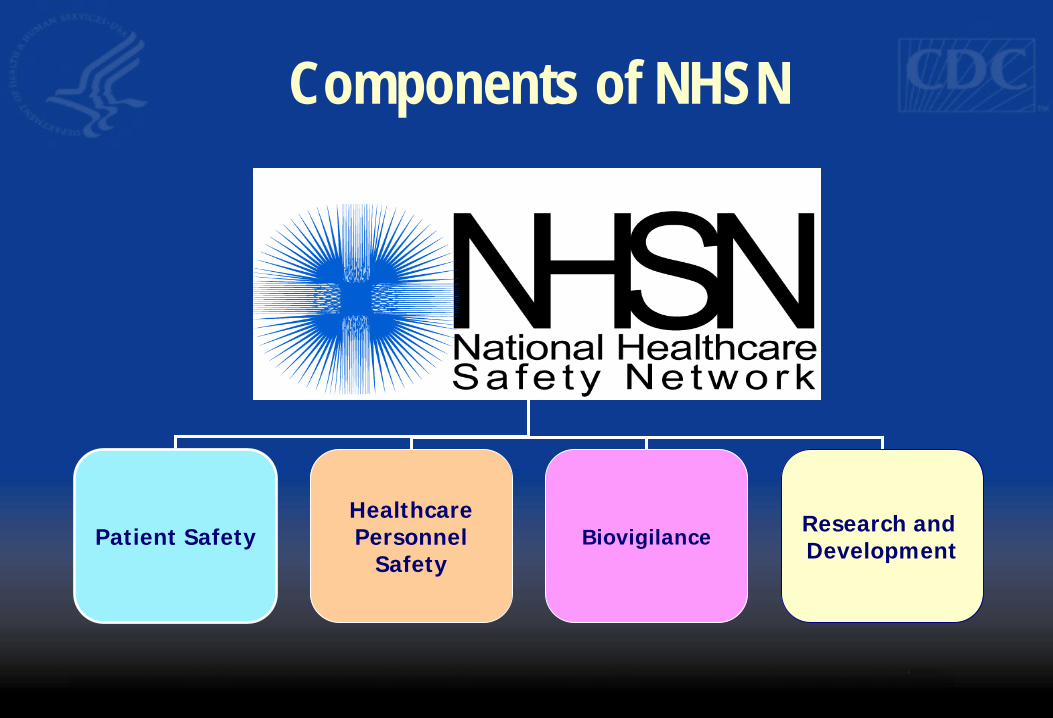
Components of NHSN
Patient Safety Healthcare Personnel
Safety
Research and Development Biovigilance
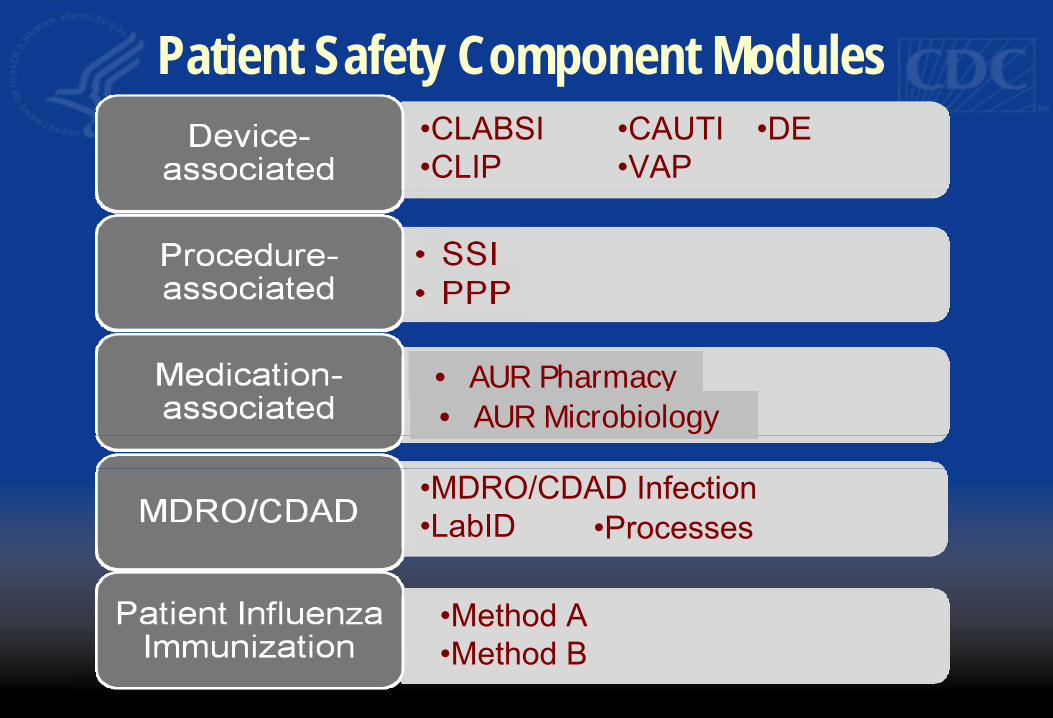
•CLABSI •CLIP
•CAUTI •VAP
•DE
•Method A •Method B
Patient Safety Component Modules
•MDRO/CDAD Infection •LabID •Processes
• AUR Pharmacy • AUR Microbiology
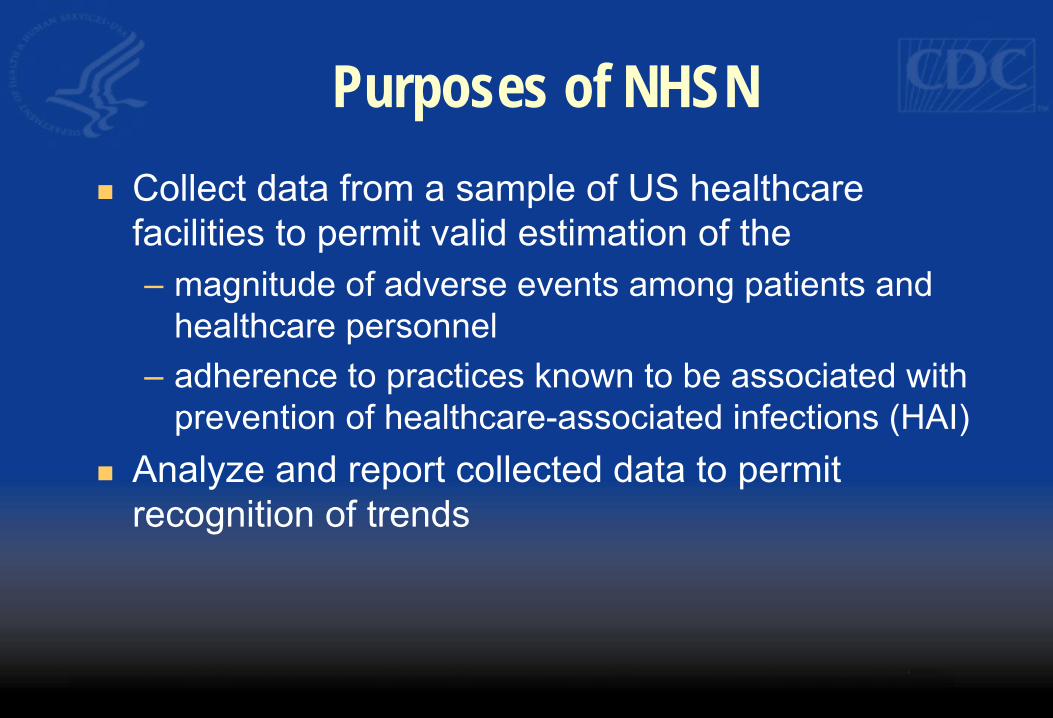
Purposes of NHSN
� Collect data from a sample of US healthcare facilities to permit valid estimation of the – magnitude of adverse events among patients and
healthcare personnel – adherence to practices known to be associated with
prevention of healthcare-associated infections (HAI) � Analyze and report collected data to permit
recognition of trends
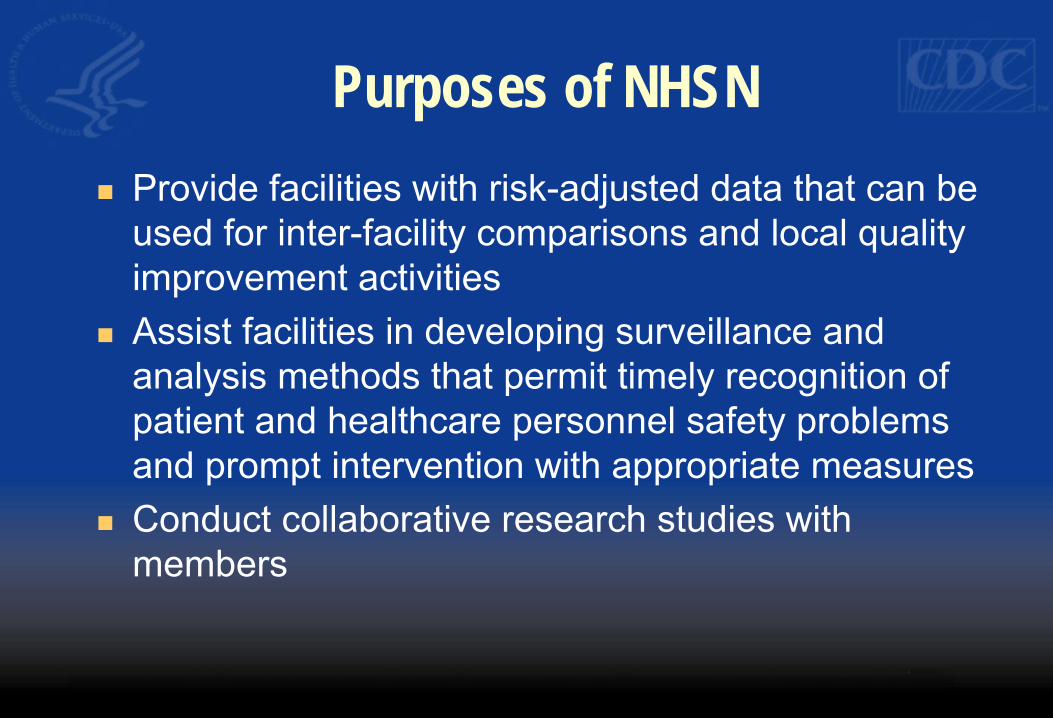
Purposes of NHSN
� Provide facilities with risk-adjusted data that can be used for inter-facility comparisons and local quality improvement activities
� Assist facilities in developing surveillance and analysis methods that permit timely recognition of patient and healthcare personnel safety problems and prompt intervention with appropriate measures
� Conduct collaborative research studies with members
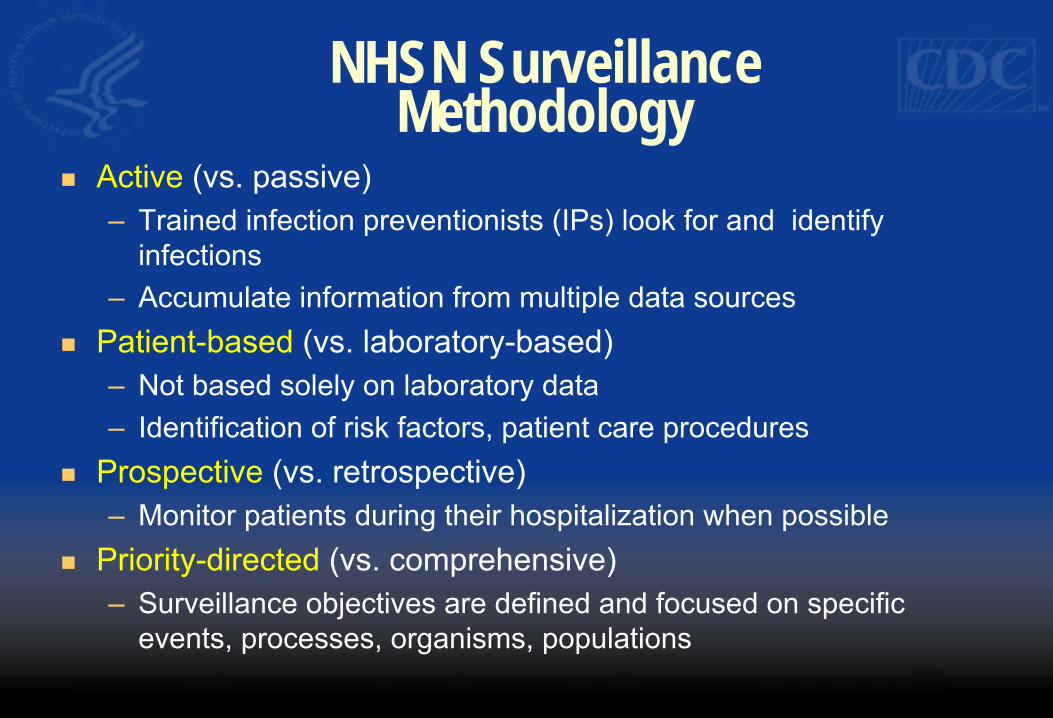
NHSN Surveillance
Methodology
� Active (vs. passive) – Trained infection preventionists (IPs) look for and identify
infections – Accumulate information from multiple data sources
� Patient-based (vs. laboratory-based) – Not based solely on laboratory data – Identification of risk factors, patient care procedures
� Prospective (vs. retrospective) – Monitor patients during their hospitalization when possible
� Priority-directed (vs. comprehensive) – Surveillance objectives are defined and focused on specific
events, processes, organisms, populations
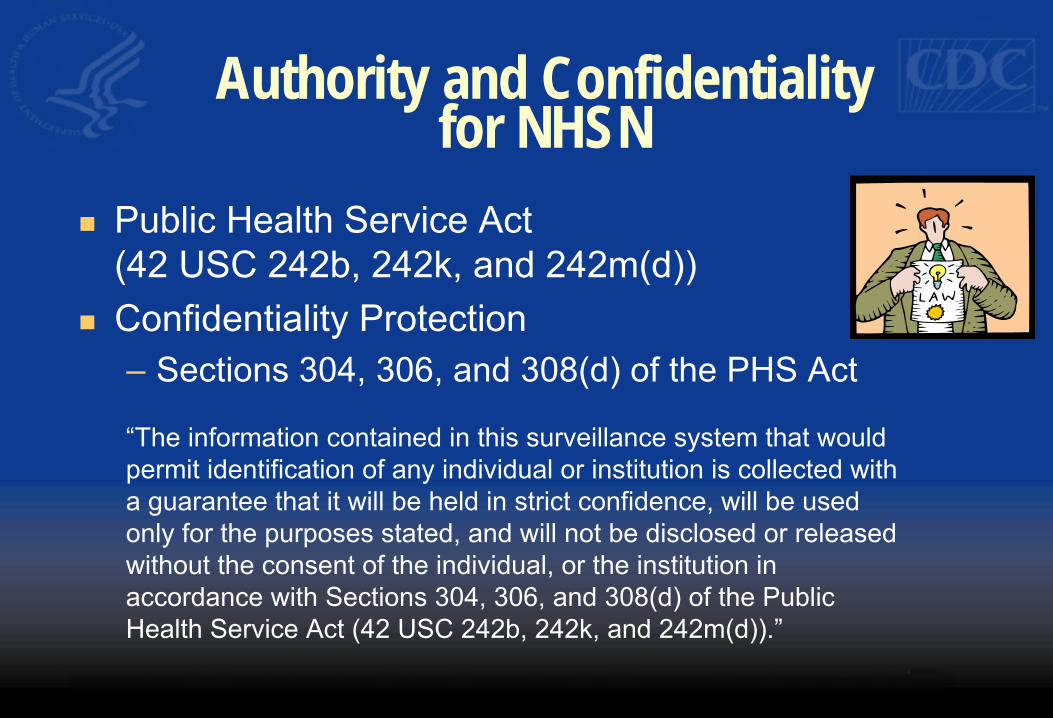
Authority and Confidentialityfor NHSN
� Public Health Service Act (42 USC 242b, 242k, and 242m(d))
� Confidentiality Protection – Sections 304, 306, and 308(d) of the PHS Act
“The information contained in this surveillance system that would permit identification of any individual or institution is collected with a guarantee that it will be held in strict confidence, will be used only for the purposes stated, and will not be disclosed or released without the consent of the individual, or the institution in accordance with Sections 304, 306, and 308(d) of the Public Health Service Act (42 USC 242b, 242k, and 242m(d)).”
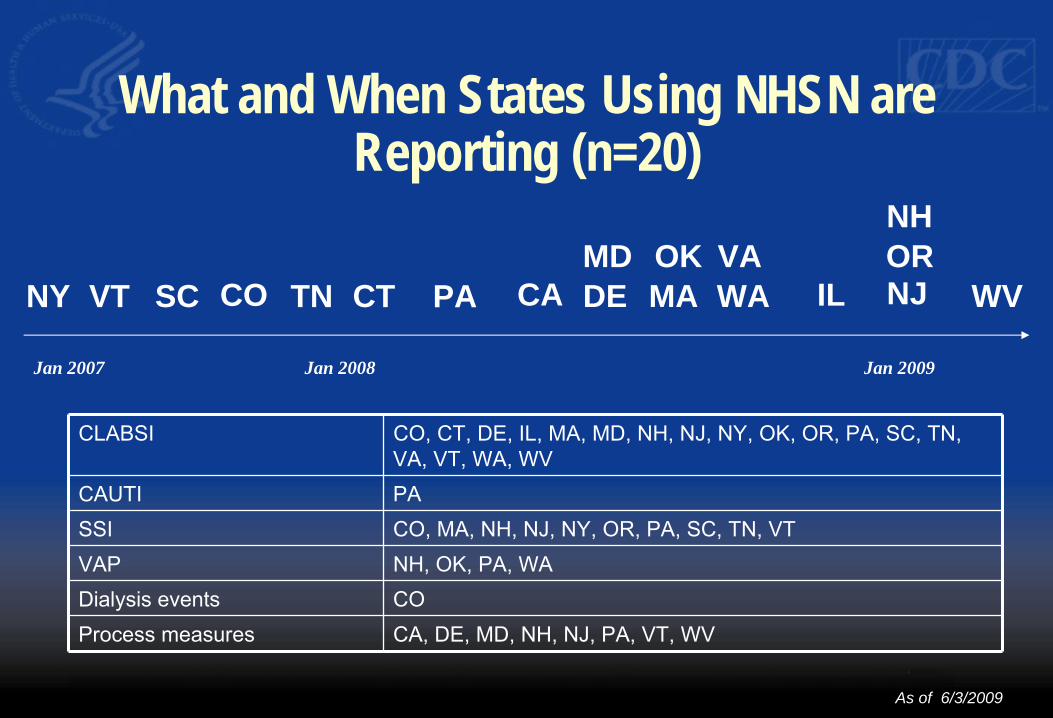
What and When States Using NHSN areReporting (n=20)
NH MD OK VA OR
NY VT SC CO TN CT PA CA DE MA WA IL NJ WV
Jan 2007 Jan 2008 Jan 2009
CLABSI CO, CT, DE, IL, MA, MD, NH, NJ, NY, OK, OR, PA, SC, TN, VA, VT, WA, WV
CAUTI PA SSI CO, MA, NH, NJ, NY, OR, PA, SC, TN, VT VAP NH, OK, PA, WA Dialysis events CO Process measures CA, DE, MD, NH, NJ, PA, VT, WV
As of 6/3/2009
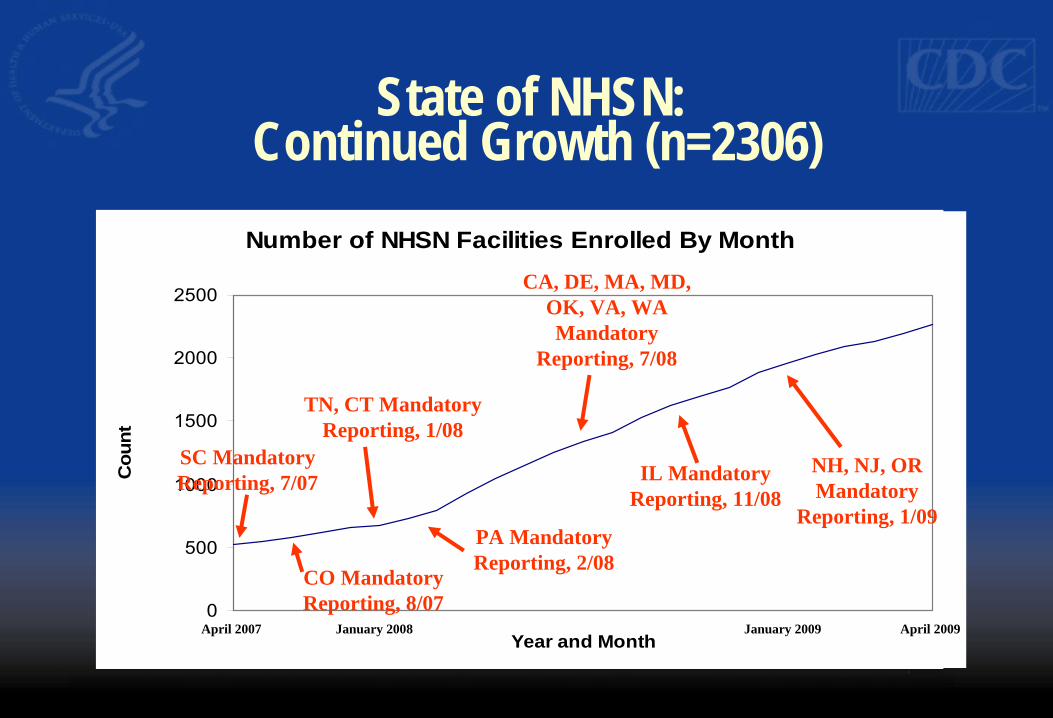
Number of NHSN Facilities Enrolled By Month
0
500
1000
1500
2000
2500
Year and Month
Cou
nt
State of NHSN:Continued Growth (n=2306)
SC Mandatory Reporting, 7/07
CO Mandatory Reporting, 8/07
PA Mandatory Reporting, 2/08
TN, CT Mandatory Reporting, 1/08
CA, DE, MA, MD, OK, VA, WA Mandatory
Reporting, 7/08
April 2007 January 2008 January 2009
NH, NJ, OR Mandatory
Reporting, 1/09
IL Mandatory Reporting, 11/08
April 2009
Why use NHSN for HAI
Reporting?
� Provides standard definitions, protocols and methodology
� Not just a reporting tool, comparative rates used for performance improvement
� Useful analysis tools are included � CDC provides training and user support � Use of the application is free � Ability to share data with a Group
What is a Group in NHSN? � A Group is a collection of facilities that have
joined together within the NHSN framework to share some or all of their data at a single (Group) level for a mutual purpose (e.g., performance improvement, state and/or public reporting).
Steps to form a Group in NHSN
1. Complete required reading and training for the Group Administrator or Group User
2. An NHSN facility “nominates” the Group 3. The Group Administrator obtains a digital certificate 4. The Group Administrator adds additional users to the group
and sets a Group joining password. 5. The Group Administrator sends the Group ID and Group
joining password to facilities and invites them to join the Group 6. Facilities join the Group and confer some/all rights to data
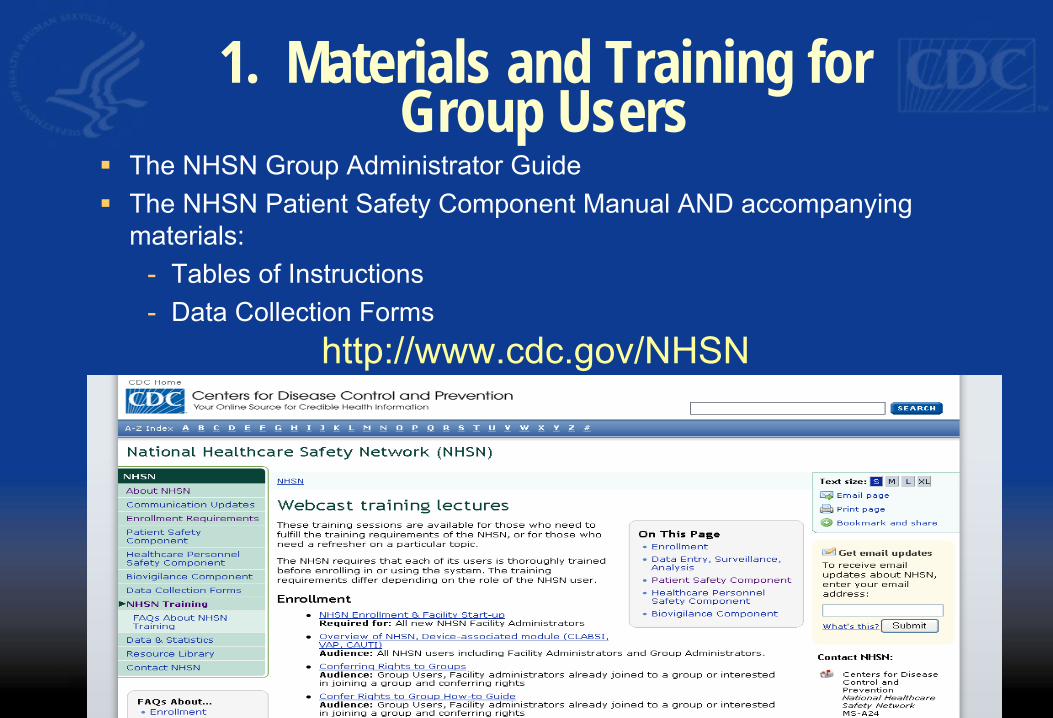
1. Materials and Training forGroup Users
� The NHSN Group Administrator Guide � The NHSN Patient Safety Component Manual AND accompanying
materials:
- Tables of Instructions
- Data Collection Forms
http://www.cdc.gov/NHSN
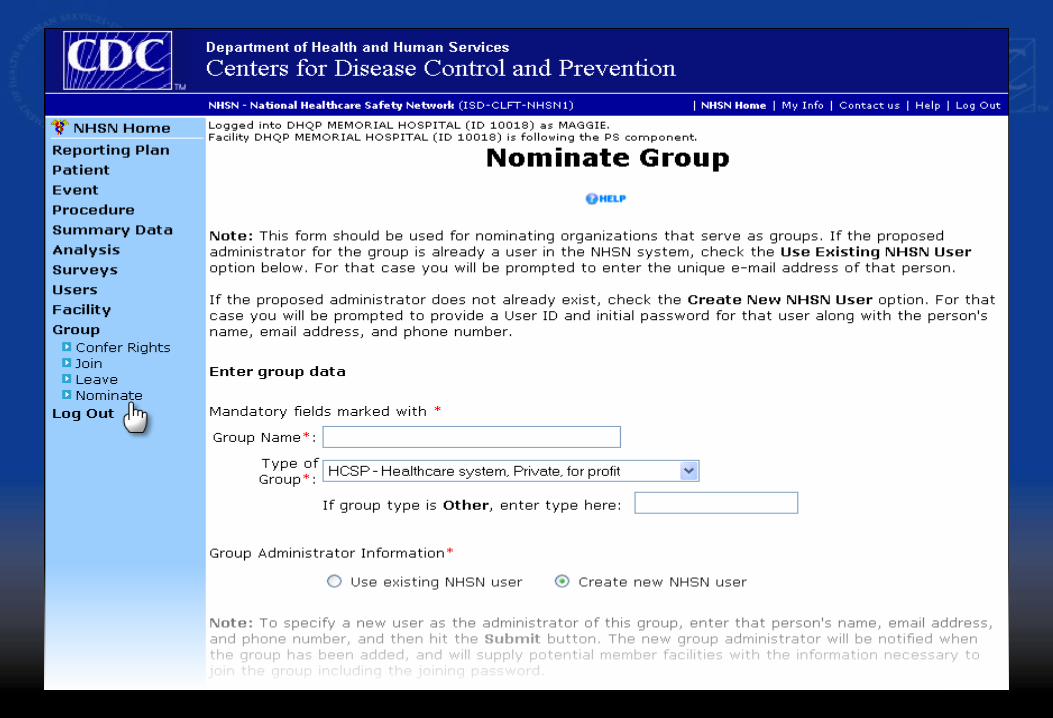
2. An NHSN Facility “Nominates”the Group
� Selects Nominate from the Group section of NHSN Nav Bar � Enters the name and type of Group � Enters the information about the Group Administrator
Nominating a group does not automatically join the facility to the�
�
�
group Only ONE facility should do the group nomination Provide the nominator with your correct e-mail address, itMUST match your digital certificate
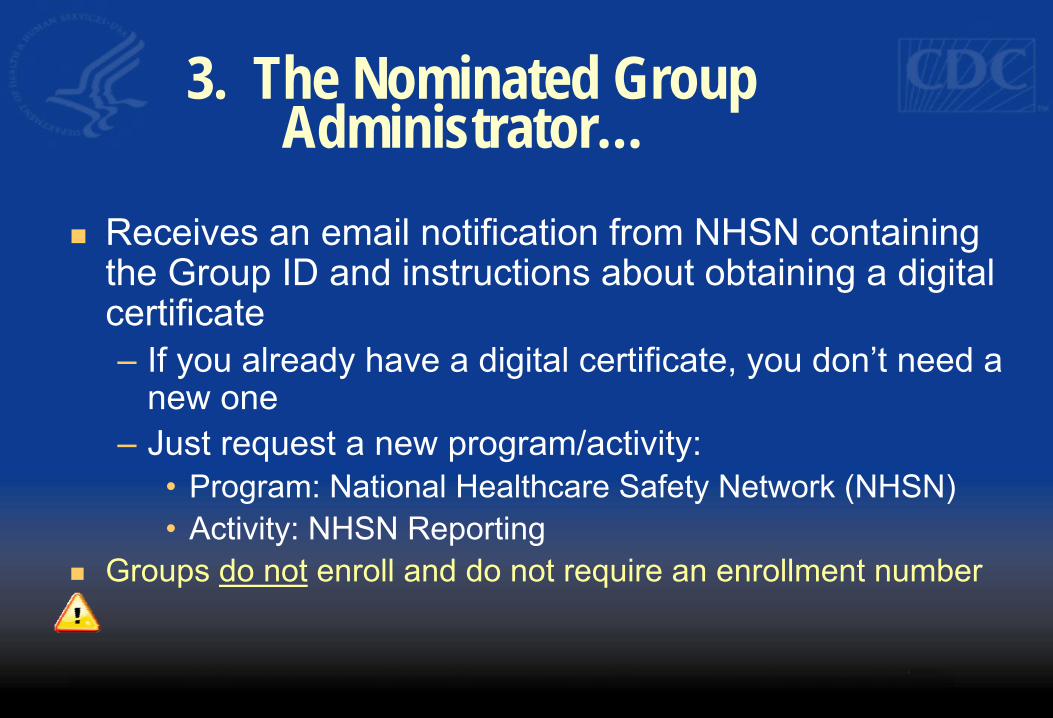
3. The Nominated Group
Administrator…
� Receives an email notification from NHSN containingthe Group ID and instructions about obtaining a digitalcertificate – If you already have a digital certificate, you don’t need a
new one – Just request a new program/activity:
• Program: National Healthcare Safety Network (NHSN) • Activity: NHSN Reporting
� Groups do not enroll and do not require an enrollment number
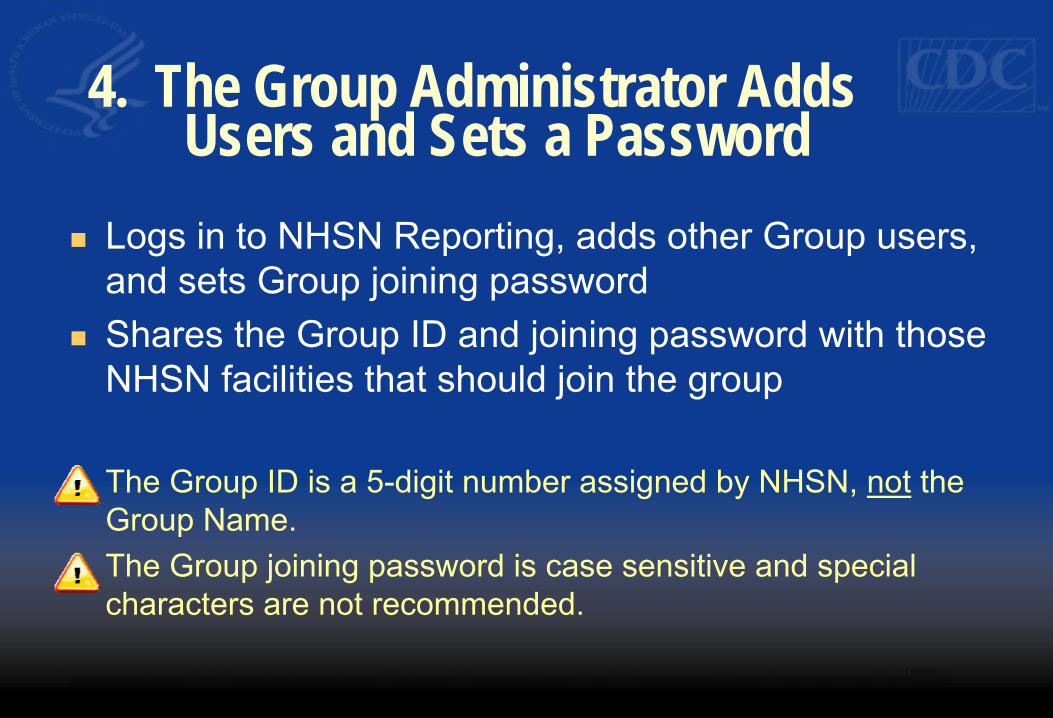
4. The Group Administrator Adds Users and Sets a Password
� Logs in to NHSN Reporting, adds other Group users, and sets Group joining password
� Shares the Group ID and joining password with those NHSN facilities that should join the group
� The Group ID is a 5-digit number assigned by NHSN, not the Group Name.
� The Group joining password is case sensitive and special characters are not recommended.
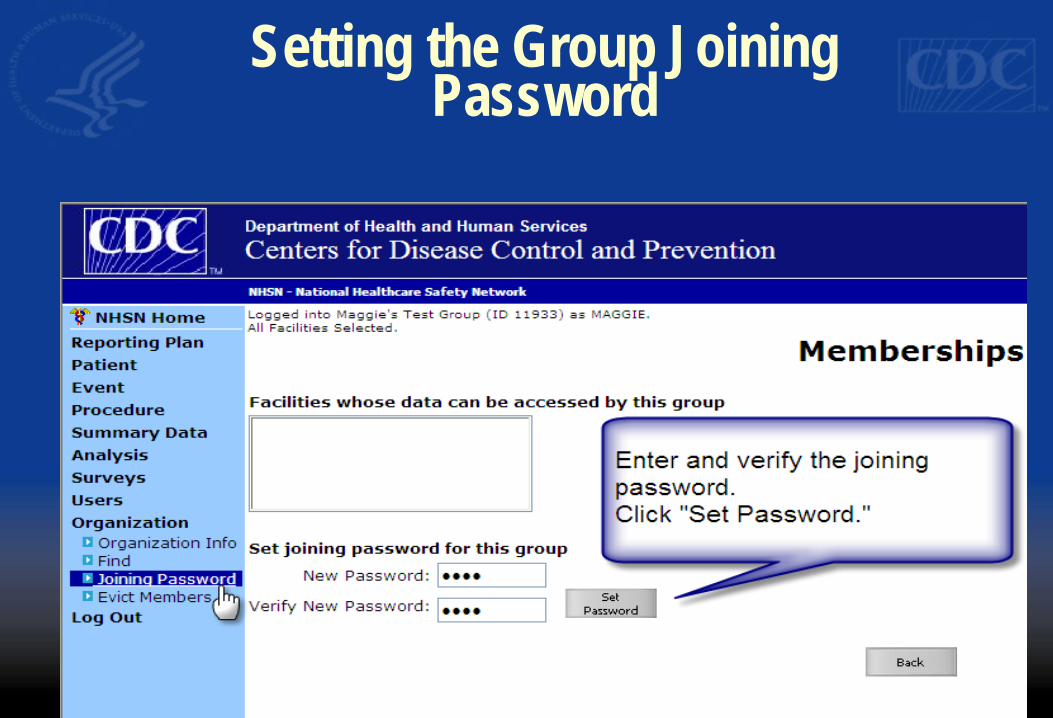
Setting the Group JoiningPassword
5. The Group AdministratorInvites Facilities to Join
� From the Group section of NHSN Nav Bar, the Facility Administrator selects Join
� Enters the Group ID � Enters the Group Joining Password
� A facility can join as many groups as they want to or need to.
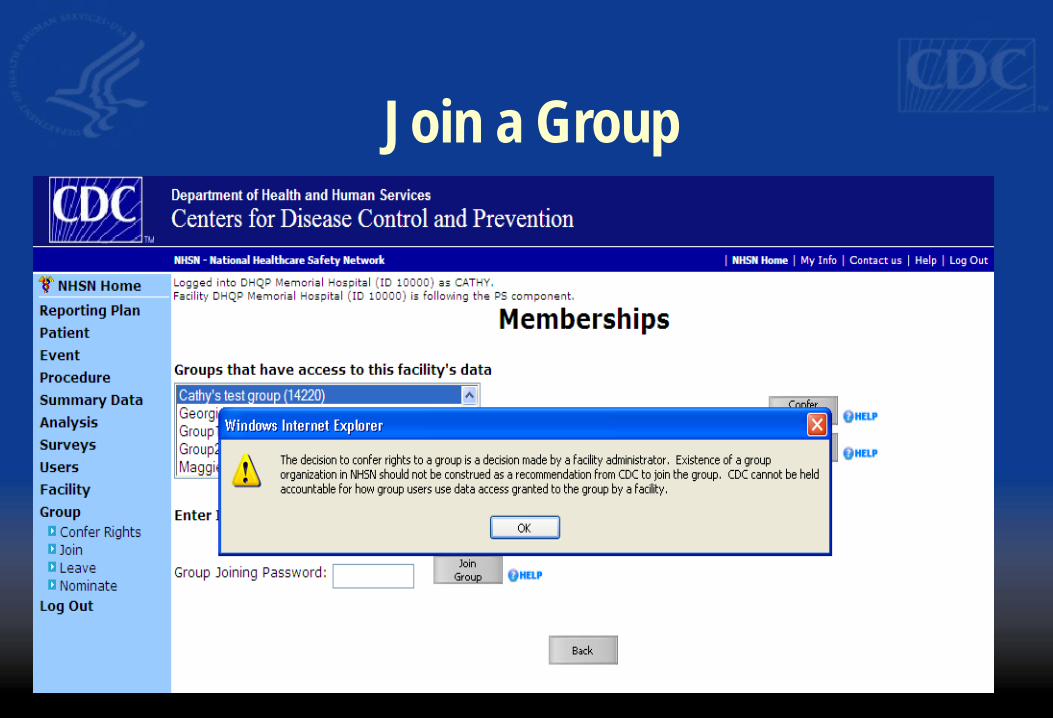
Join a Group
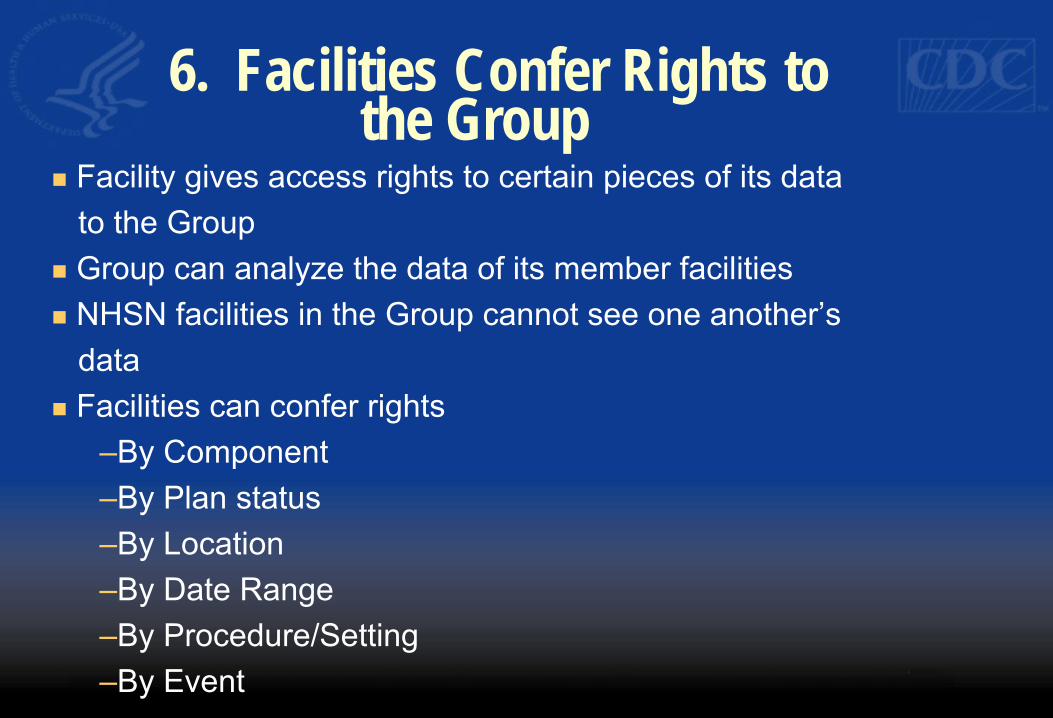
6. Facilities Confer Rights to
the Group
� Facility gives access rights to certain pieces of its data to the Group
� Group can analyze the data of its member facilities � NHSN facilities in the Group cannot see one another’s
data � Facilities can confer rights
–By Component –By Plan status –By Location –By Date Range –By Procedure/Setting –By Event
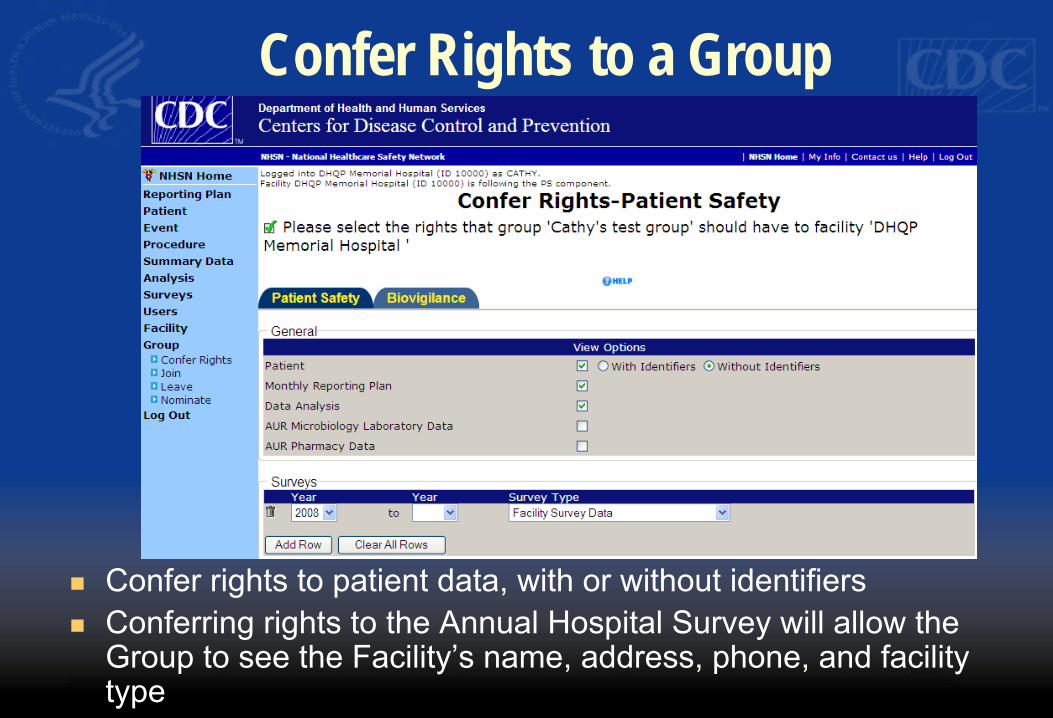
Confer Rights to a Group
� Confer rights to patient data, with or without identifiers � Conferring rights to the Annual Hospital Survey will allow the
Group to see the Facility’s name, address, phone, and facility type
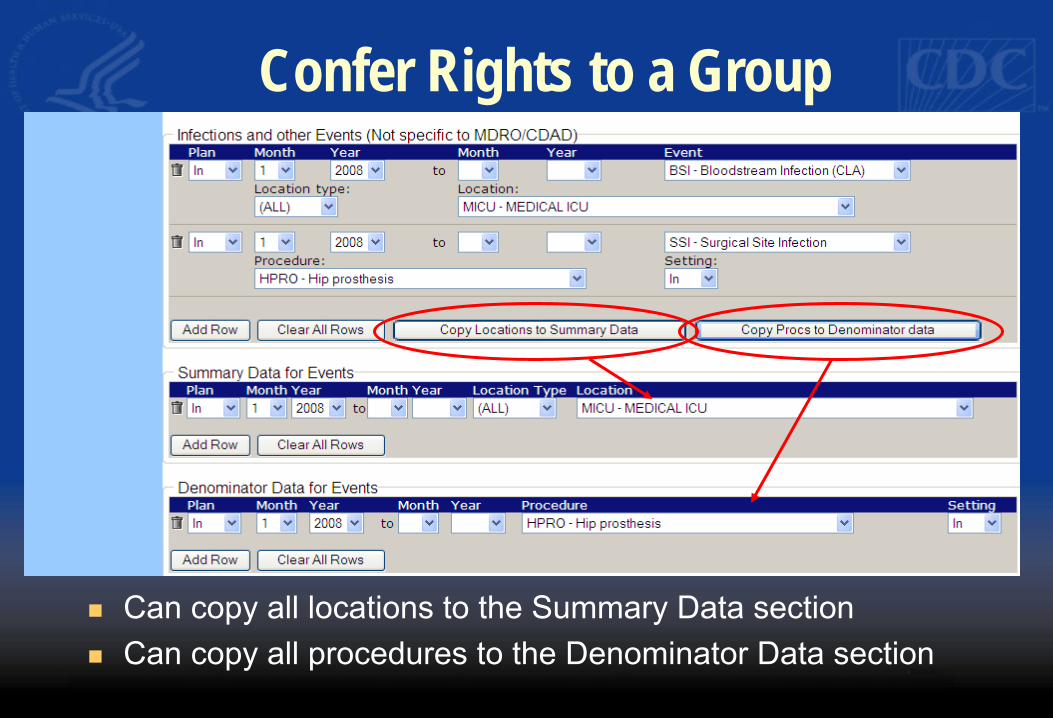
Confer Rights to a Group
� Can copy all locations to the Summary Data section � Can copy all procedures to the Denominator Data section
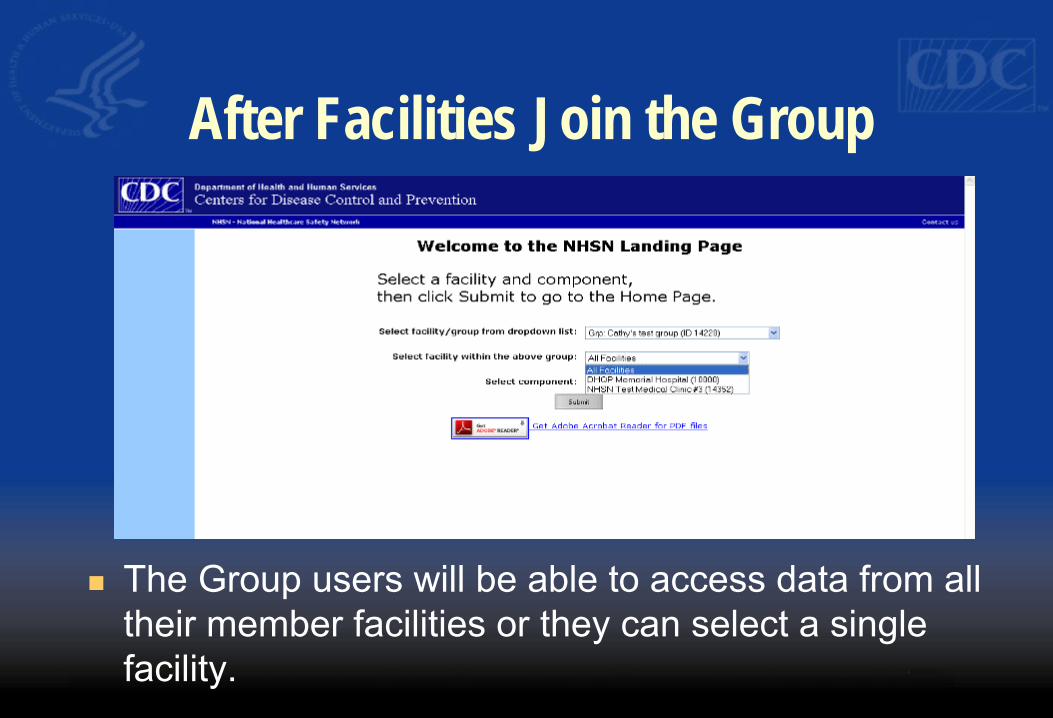
After Facilities Join the Group
� The Group users will be able to access data from all their member facilities or they can select a single facility.
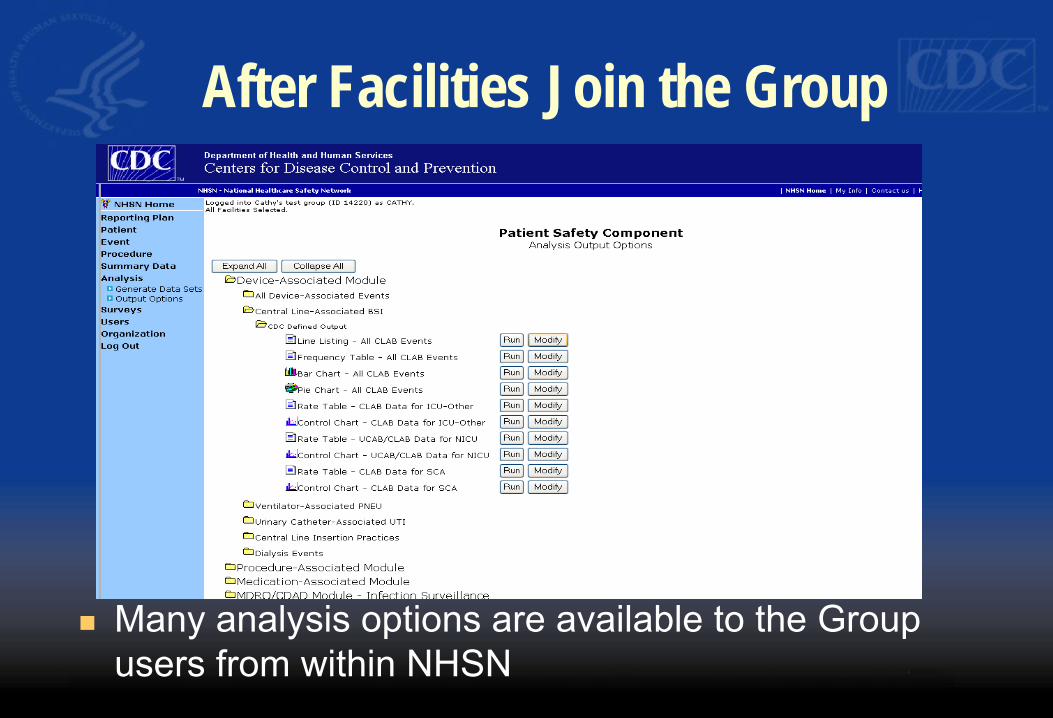
After Facilities Join the Group
� Many analysis options are available to the Group users from within NHSN
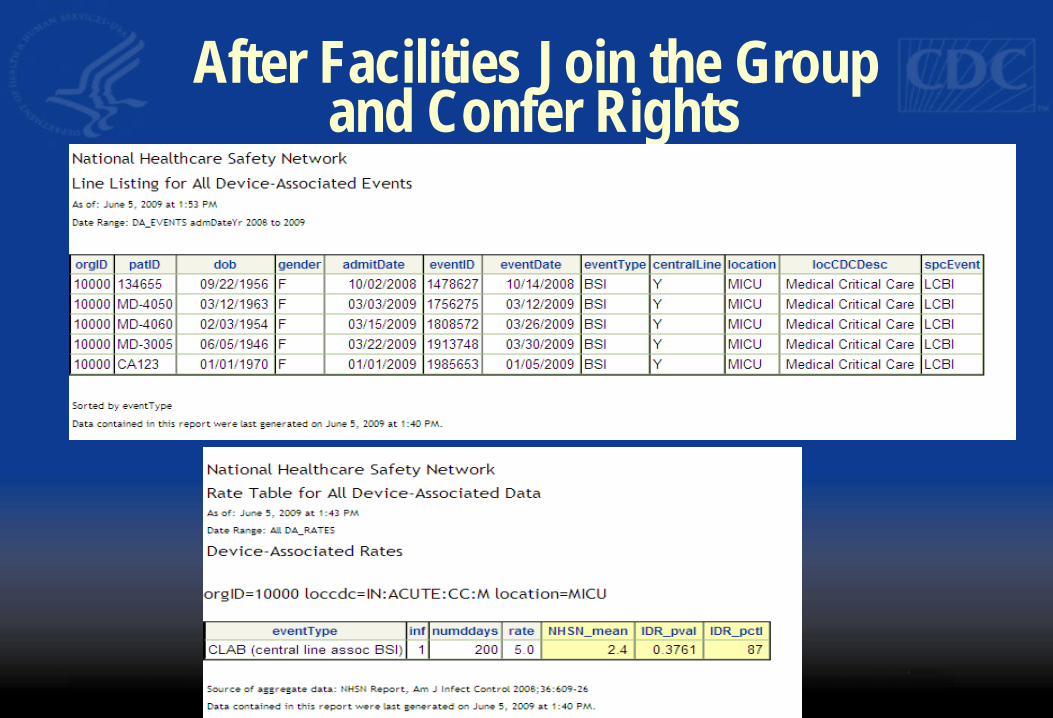
After Facilities Join the Groupand Confer Rights
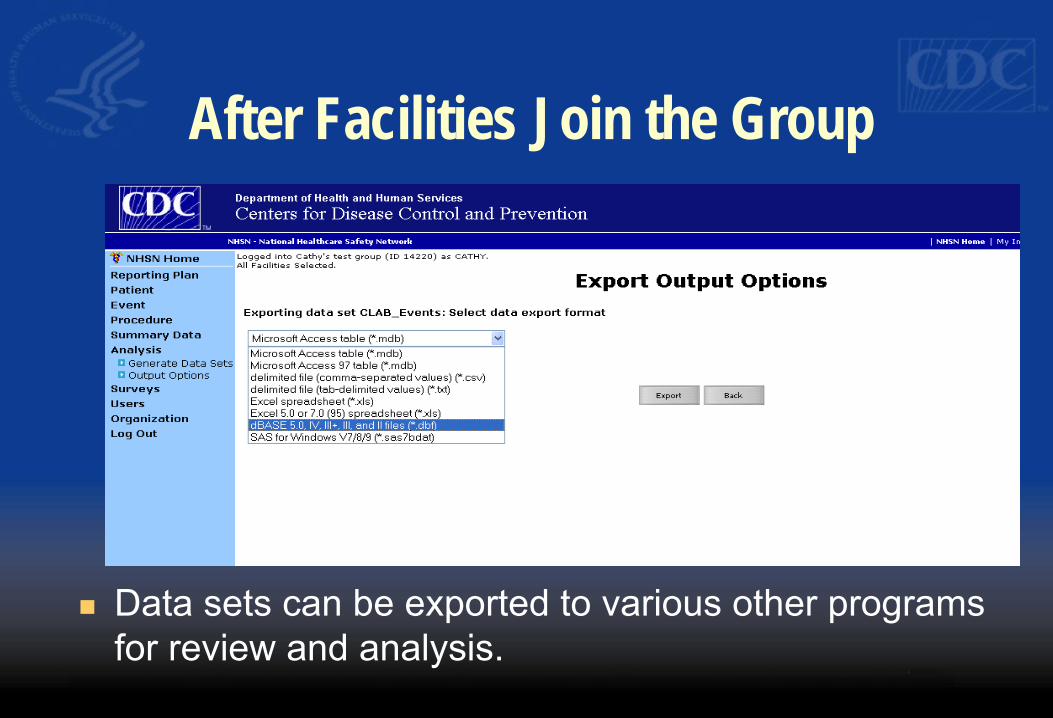
After Facilities Join the Group
� Data sets can be exported to various other programs for review and analysis.
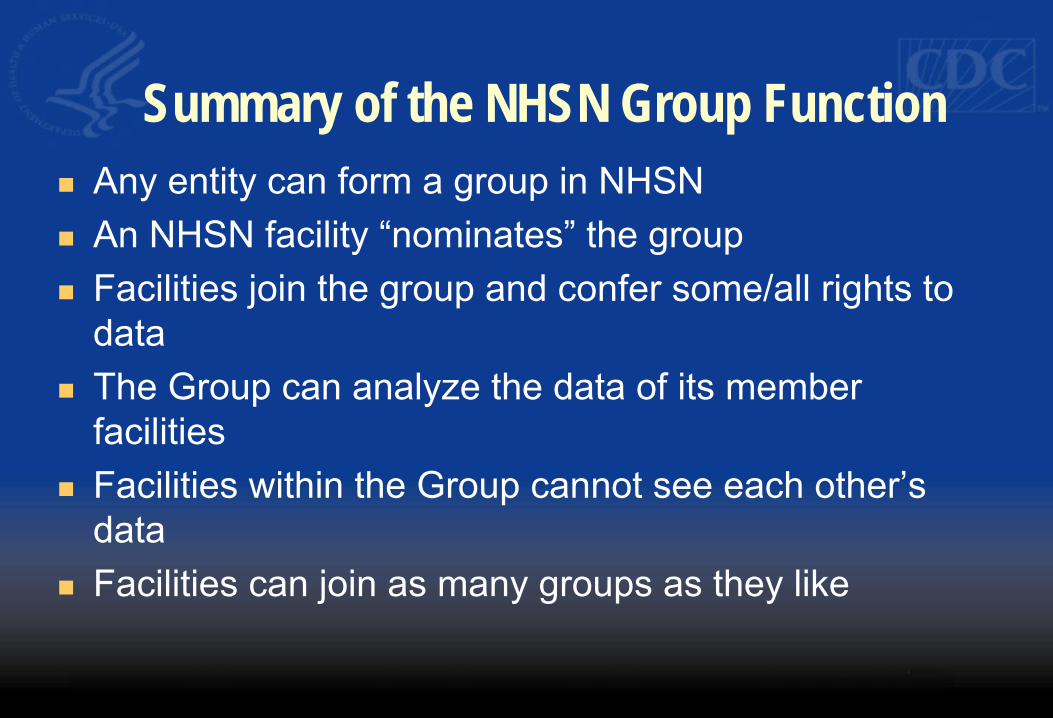
Summary of the NHSN Group Function � Any entity can form a group in NHSN � An NHSN facility “nominates” the group � Facilities join the group and confer some/all rights to
data � The Group can analyze the data of its member
facilities � Facilities within the Group cannot see each other’s
data � Facilities can join as many groups as they like
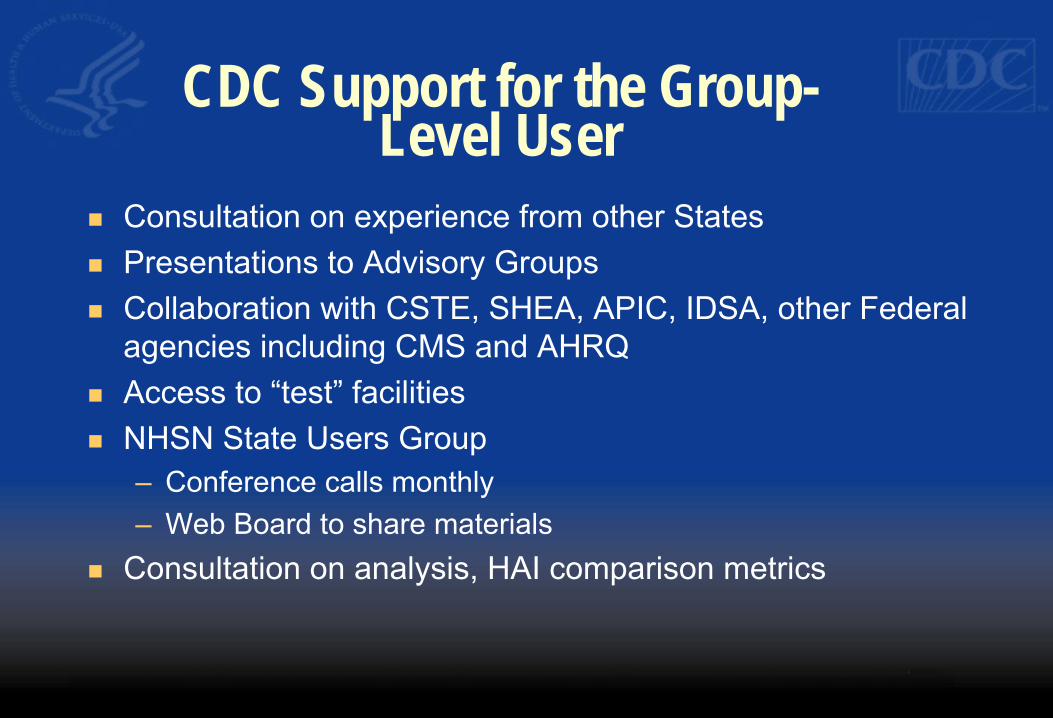
CDC Support for the Group-Level User
� Consultation on experience from other States � Presentations to Advisory Groups � Collaboration with CSTE, SHEA, APIC, IDSA, other Federal
agencies including CMS and AHRQ � Access to “test” facilities � NHSN State Users Group
– Conference calls monthly – Web Board to share materials
� Consultation on analysis, HAI comparison metrics
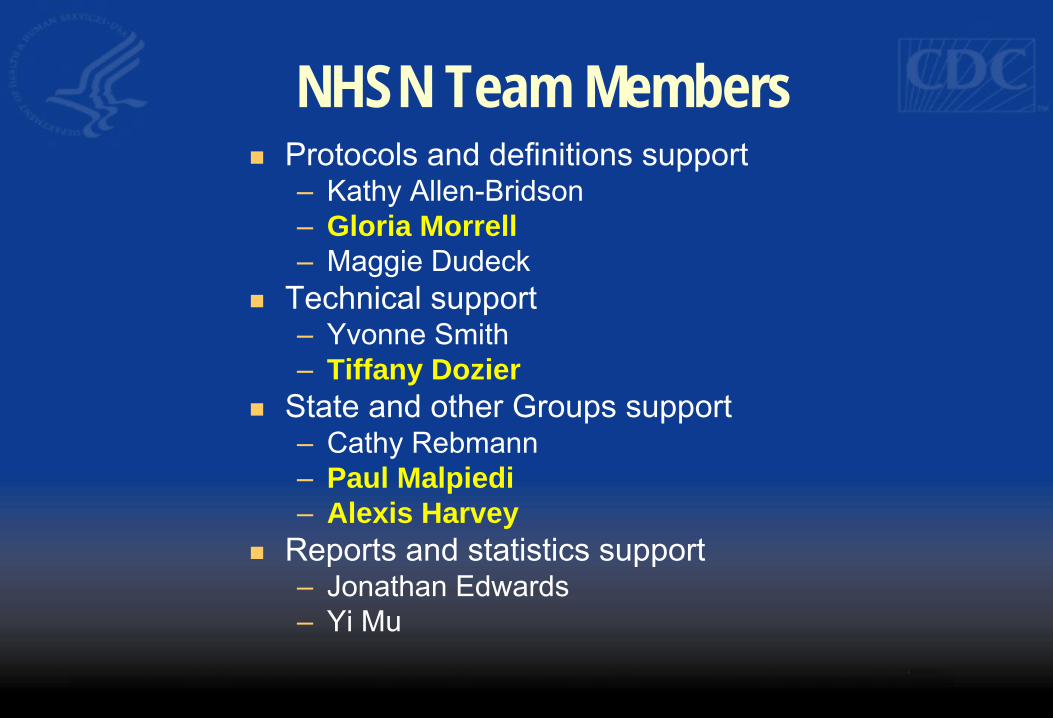
NHSN Team Members � Protocols and definitions support
– Kathy Allen-Bridson – Gloria Morrell – Maggie Dudeck
� Technical support – Yvonne Smith – Tiffany Dozier
� State and other Groups support – Cathy Rebmann – Paul Malpiedi – Alexis Harvey
� Reports and statistics support – Jonathan Edwards – Yi Mu
http://www.cdc.gov/NHSN [email protected]
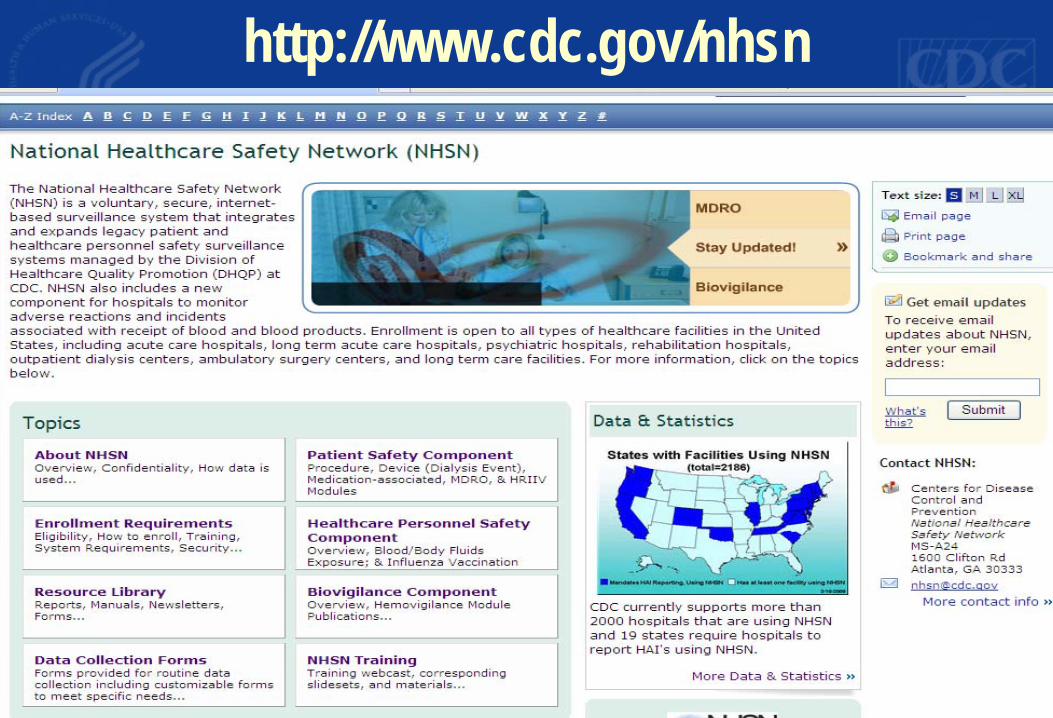
http://www.cdc.gov/nhsn
Prevention Collaboratives
Establishing HAI Prevention Collaborativesusing ARRA Funds
Establish a Prevention Collaborative
� Activity C in Funding Opportunity Number: CI07-70402ARRA09
� “Establish multicenter evidence-based HAI prevention collaboratives among acute carehospitals within the state”
� “Make measurable progress toward the NationalPrevention Targets outlined in the HHS Action Planto Prevent Healthcare-Associated Infections”
Why a Prevention Collaborative?
� Rethinking the preventable fraction – Prevention successes
� Organizational theory – Healthcare facilities as complex adaptive systems
likely to benefit from collaboration � Evidence for collaboratives in other disciplines
What is the Preventable Fraction ofHealthcare-Associated Infections?
What is the Preventable Fraction of Healthcare-Associated Infections?
� Study on the Efficacy of Nosocomial Infection Control (SENIC) study results – 1971-1976 – Suggested 6% of all nosocomial infections could be prevented
by minimal infection control efforts, 32% by “well organized and highly effective infection control programs
� Harbarth et al: at least 20% of infections are preventable J Hosp Infection 2003;54:258
What is the Preventable Fraction of Healthcare-Associated Infections?
� Some may have interpreted these data to mean that most healthcare-associated infections are inevitable – What impact has this had on the psychology of
prevention? � How has this influenced the way infection control
programs operate? – Difficult to define success when achievable results
unknown-what should the goal be?
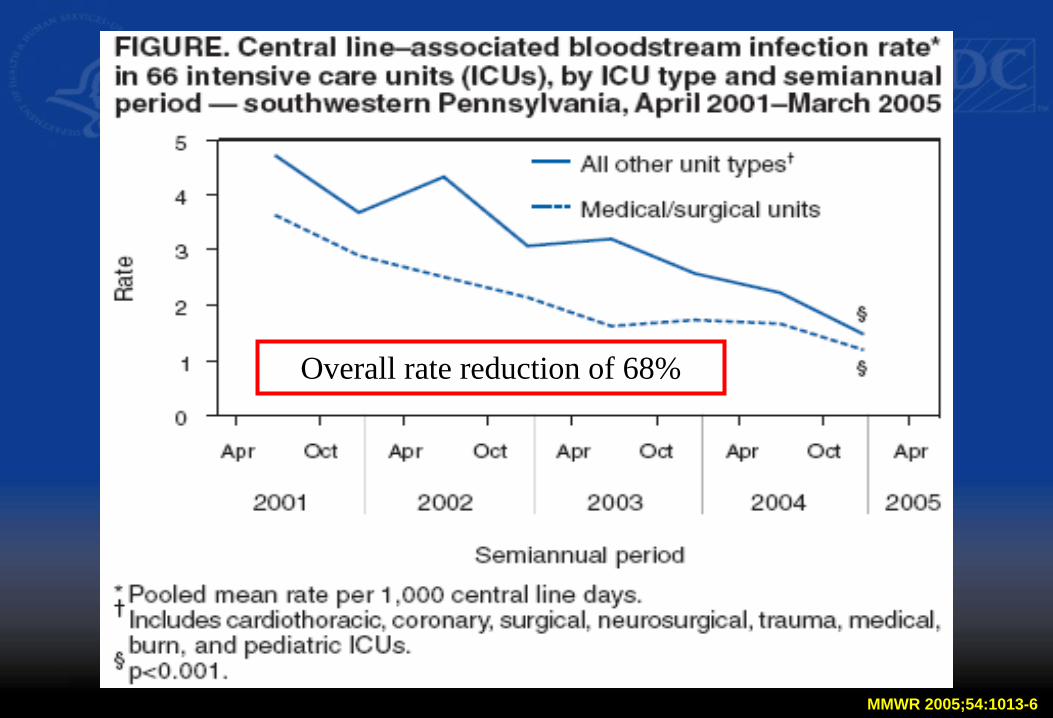
Overall rate reduction of 68%
MMWR 2005;54:1013-6
Rat
e pe
r 100
0 ce
ntra
l lin
e-da
ys
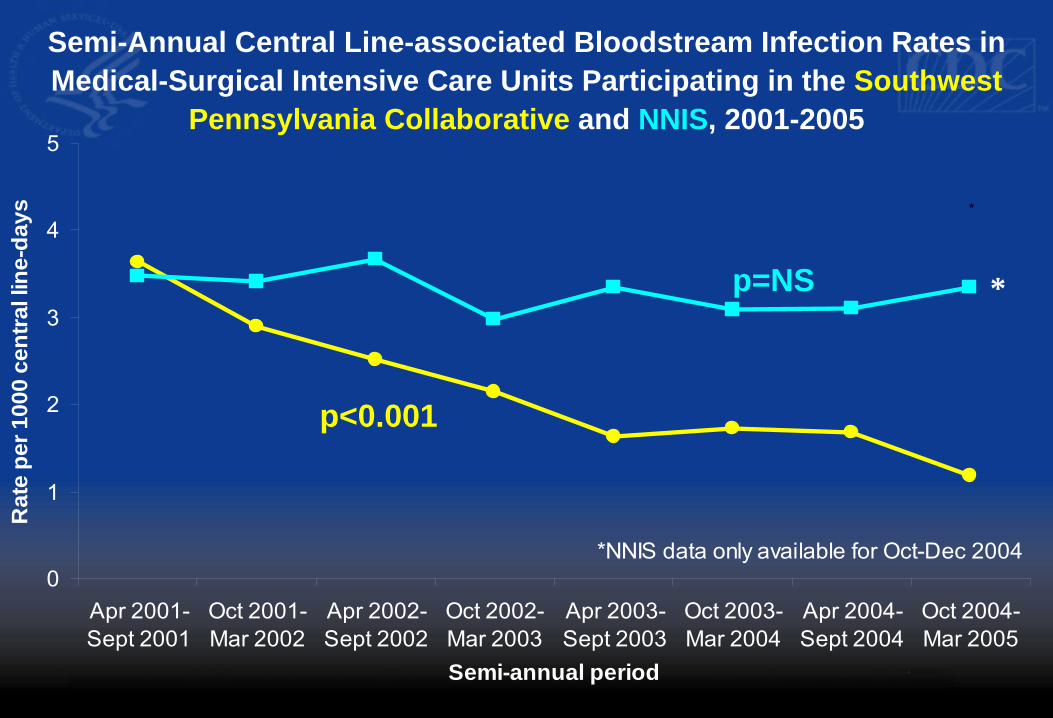
Semi-Annual Central Line-associated Bloodstream Infection Rates in
Medical-Surgical Intensive Care Units Participating in the Southwest
Pennsylvania Collaborative and NNIS, 2001-2005 5
* 4
p<0.001
p=NS * 3
2
1
0 *NNIS data only available for Oct-Dec 2004
Apr 2001-Sept 2001
Oct 2001-Mar 2002
Apr 2002-Sept 2002
Oct 2002-Mar 2003
Apr 2003-Sept 2003
Semi-annual period
Oct 2003-Mar 2004
Apr 2004-Sept 2004
Oct 2004-Mar 2005
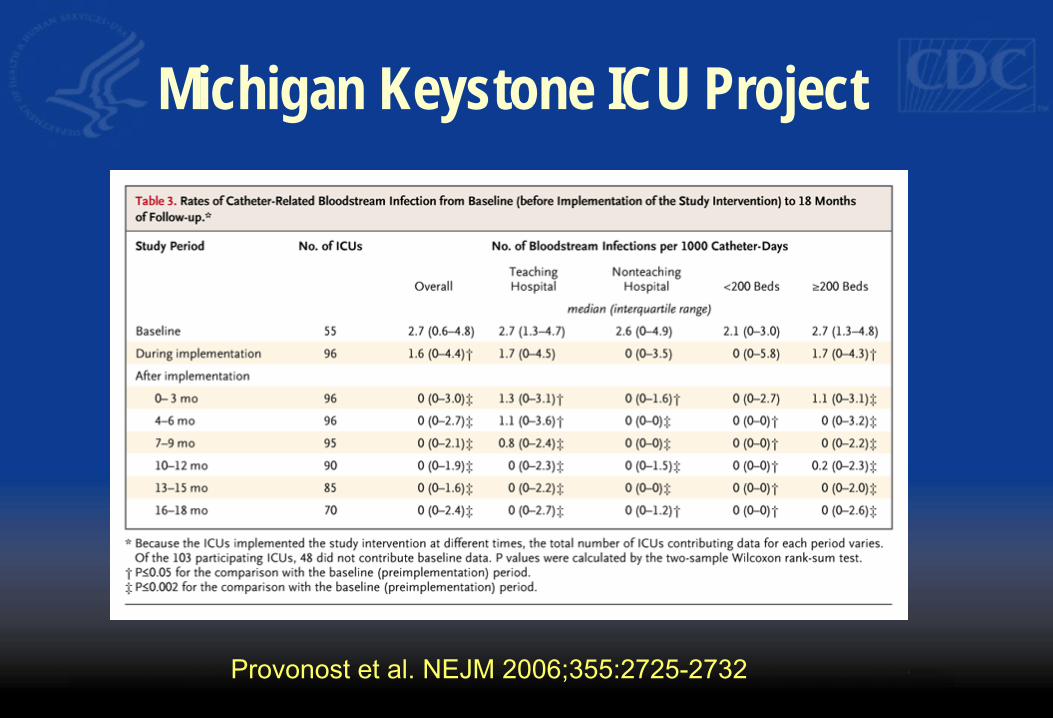
Provonost et al. NEJM 2006;355:2725-2732
Michigan Keystone ICU Project
MR
SA p
er 1
000
Patie
nt D
ays
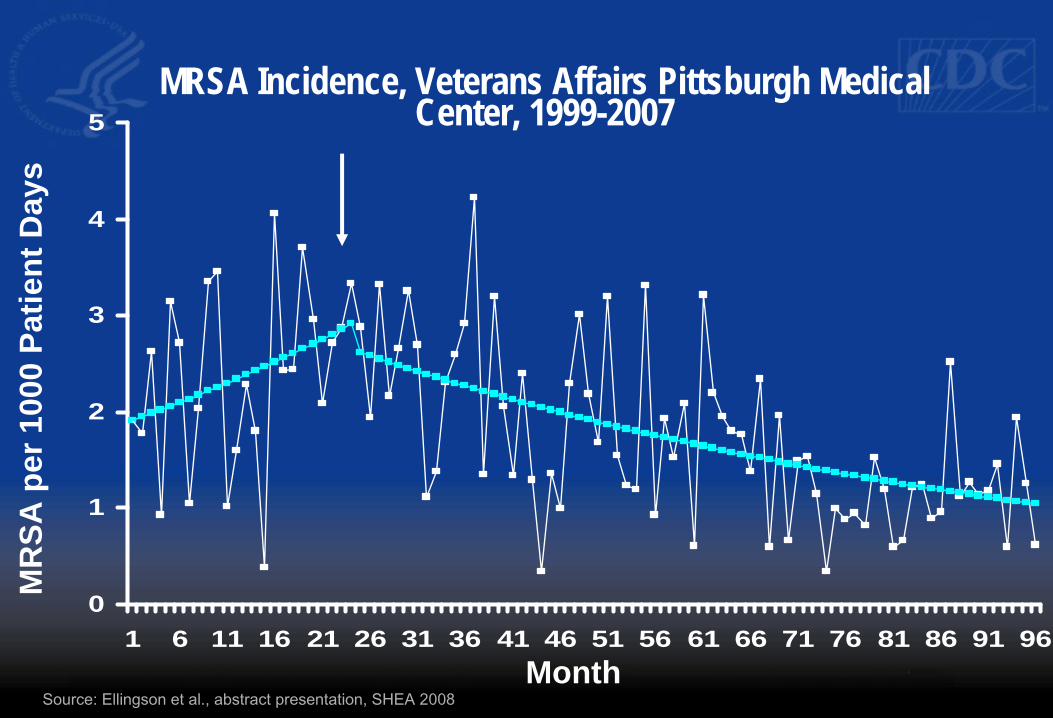
MRSA Incidence, Veterans Affairs Pittsburgh MedicalCenter, 1999-20075
4
3
2
1
0 1 6 11 16 21 26 31 36 41 46 51 56 61 66 71 76 81 86 91 96
Month
Source: Ellingson et al., abstract presentation, SHEA 2008
MR
SA p
er 1
000
Patie
nt D
ays
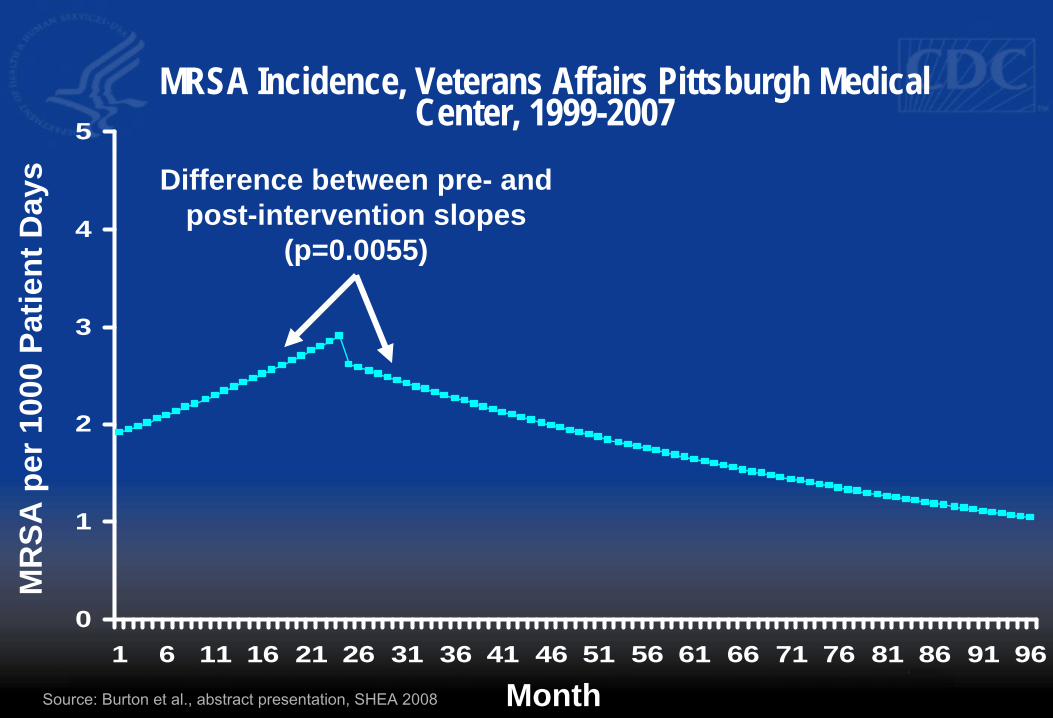
MRSA Incidence, Veterans Affairs Pittsburgh MedicalCenter, 1999-20075
Difference between pre- and
post-intervention slopes 4 (p=0.0055)
3
2
1
0 1 6 11 16 21 26 31 36 41 46 51 56 61 66 71 76 81 86 91 96
Source: Burton et al., abstract presentation, SHEA 2008 Month
MR
SA p
er 1
000
Patie
nt D
ays
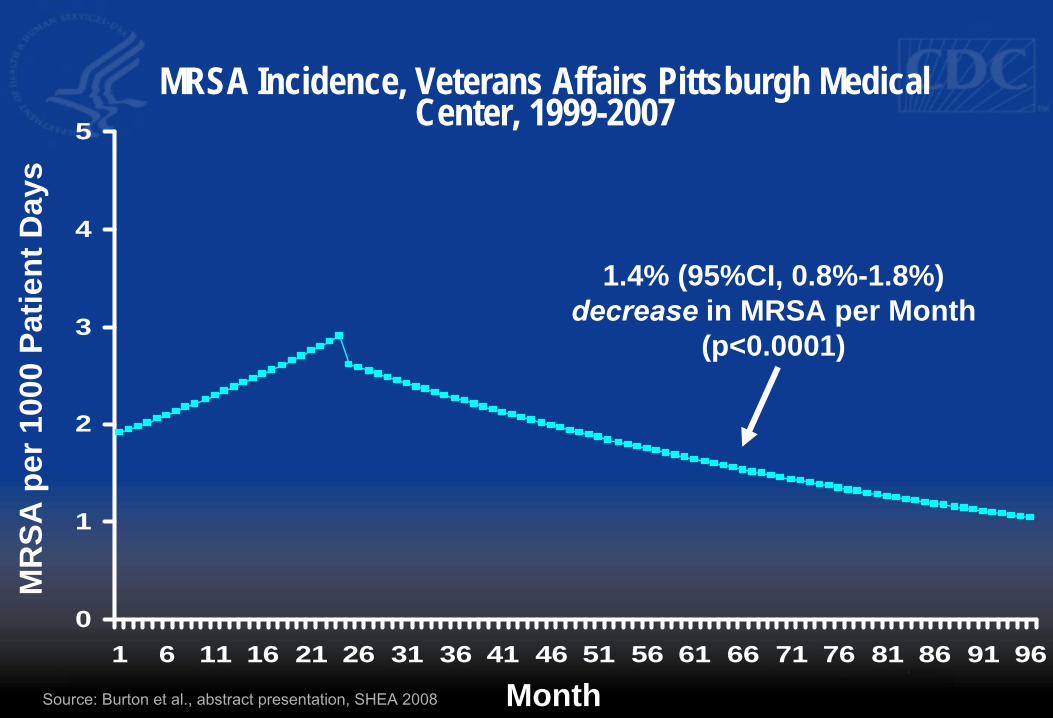
MRSA Incidence, Veterans Affairs Pittsburgh MedicalCenter, 1999-20075
4
1.4% (95%CI, 0.8%-1.8%) decrease in MRSA per Month3
2
1
(p<0.0001)
0 1 6 11 16 21 26 31 36 41 46 51 56 61 66 71 76 81 86 91 96
Source: Burton et al., abstract presentation, SHEA 2008 Month
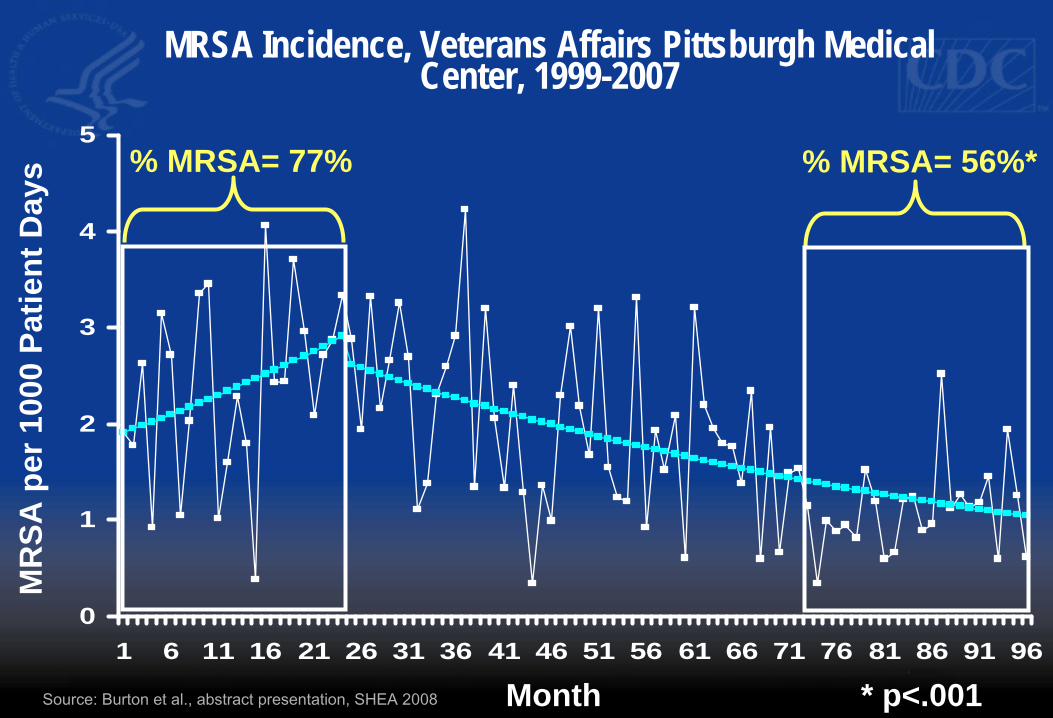
MRSA Incidence, Veterans Affairs Pittsburgh MedicalCenter, 1999-2007
0
1
2
3
4
5
MR
SA p
er 1
000
Patie
nt D
ays % MRSA= 77% % MRSA= 56%*
1 6 11 16 21 26 31 36 41 46 51 56 61 66 71 76 81 86 91 96
Source: Burton et al., abstract presentation, SHEA 2008 Month * p<.001

Positive Deviance MRSA Prevention Collaborative
• In 2006 three hospitals partnered with the Plexus Instituteand CDC to implement MRSA prevention programs inacute care settings
• Began in early 2007 - Positive Deviance approach - Hand hygiene - Contact precautions
- Active Surveillance in ICUs only
• Hospitals agreed to share electronic data for objectiveevaluation of the intervention
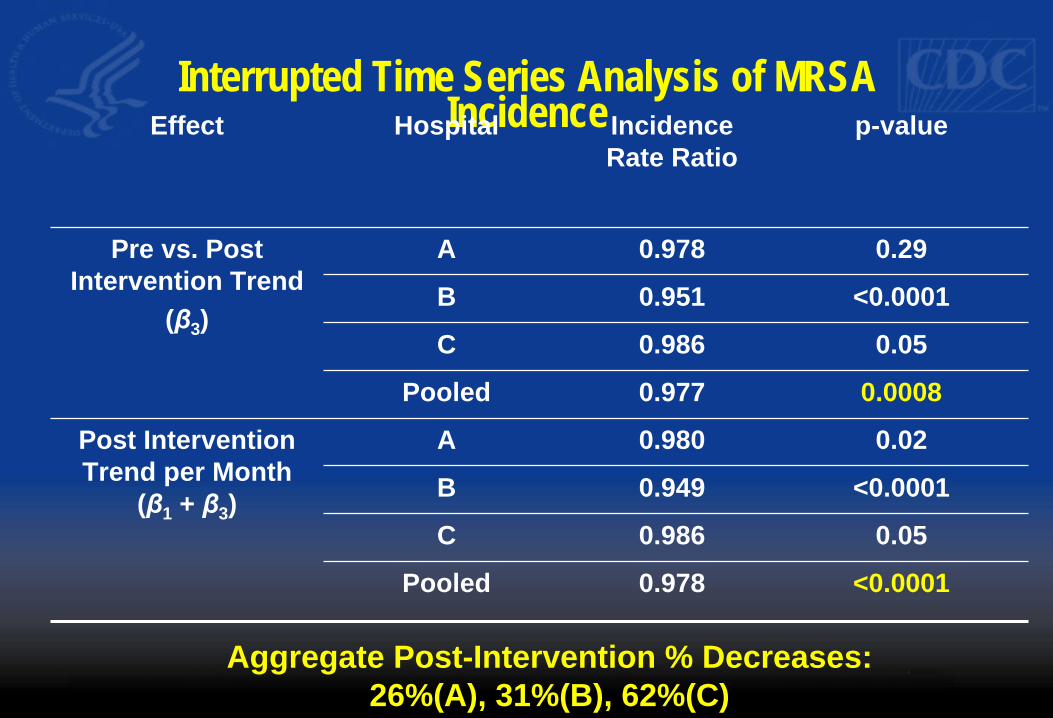
Interrupted Time Series Analysis of MRSA IncidenceEffect Hospital Incidence p-value
Rate Ratio
Pre vs. Post A 0.978 0.29 Intervention Trend B 0.951 <0.0001
(β3) C 0.986 0.05
Pooled 0.977 0.0008
Post Intervention A 0.980 0.02 Trend per Month
(β1 + β3) B 0.949 <0.0001
C 0.986 0.05
Pooled 0.978 <0.0001
Aggregate Post-Intervention % Decreases:
26%(A), 31%(B), 62%(C)
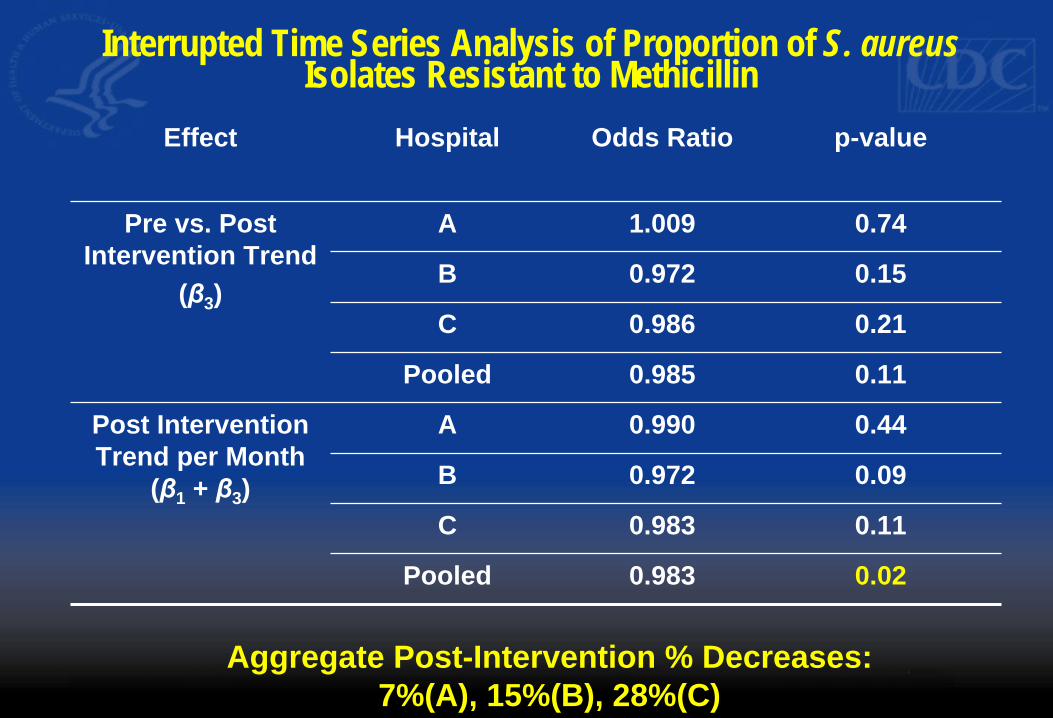
Interrupted Time Series Analysis of Proportion of S. aureusIsolates Resistant to Methicillin
Effect Hospital Odds Ratio p-value
Pre vs. Post A 1.009 0.74 Intervention Trend
(β3) C
B
0.986
0.972
0.21
0.15
Pooled 0.985 0.11
Post Intervention A 0.990 0.44 Trend per Month
(β1 + β3) B 0.972 0.09
C 0.983 0.11
Pooled 0.983 0.02
Aggregate Post-Intervention % Decreases:
7%(A), 15%(B), 28%(C)
Different Organizational Theories ofHealthcare Delivery
� Traditional Organizational Theories – Healthcare facilities viewed as machine-like,
replaceable parts, if each part doing its job things will go smoothly
– “well oiled machine” � Organizational theory based on complexity science
– Healthcare facilities viewed as dynamic, living, social systems, or “Complex Adaptive Systems”
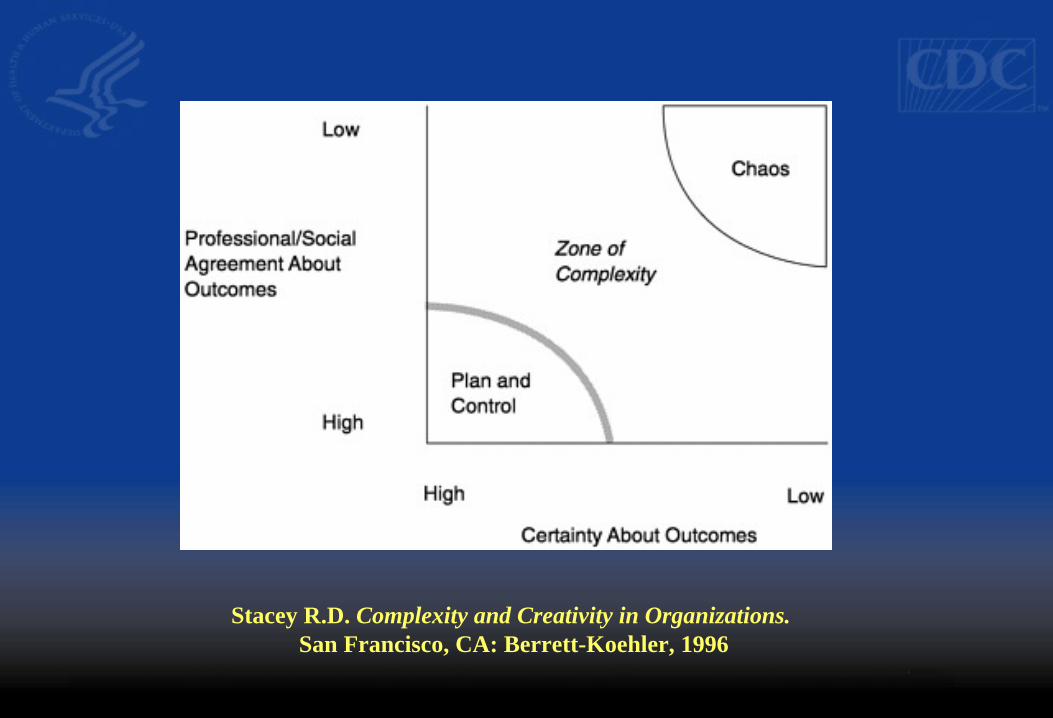
Stacey R.D. Complexity and Creativity in Organizations. San Francisco, CA: Berrett-Koehler, 1996
Complex Adaptive Systems � Definition by Ralph Stacey:
– CASs consist of a network of agents that interact with each other according to a set of rules that require them to examine and respond to each other’s behavior to improve their behavior and thus the behavior of the system they comprise.
Complex Adaptive Systems � Diverse fields of science have found value in complexity
theory – Chemistry, Physics, Physiology, Mathematics, Sociology,
Economics, Meteorology � Examples of systems that have been studied as a Complex
adaptive systems: – immune system – Human brain – a colony of social insects such as termites or ants – the stock market – almost any collection of human beings
Complex Adaptive Systems � System implies:
– Multiple Agents – Agents are Interdependent and Connected
� Complex implies: – Diversity – Many Elements – Large Number of Connections
� Adaptive implies: – Capacity to Alter or Change
Complex adaptive systems depend upon interconnection to adapt, change, and transform
If healthcare facilities behave like complex adaptive systems, then they should benefit greatly from collaboration
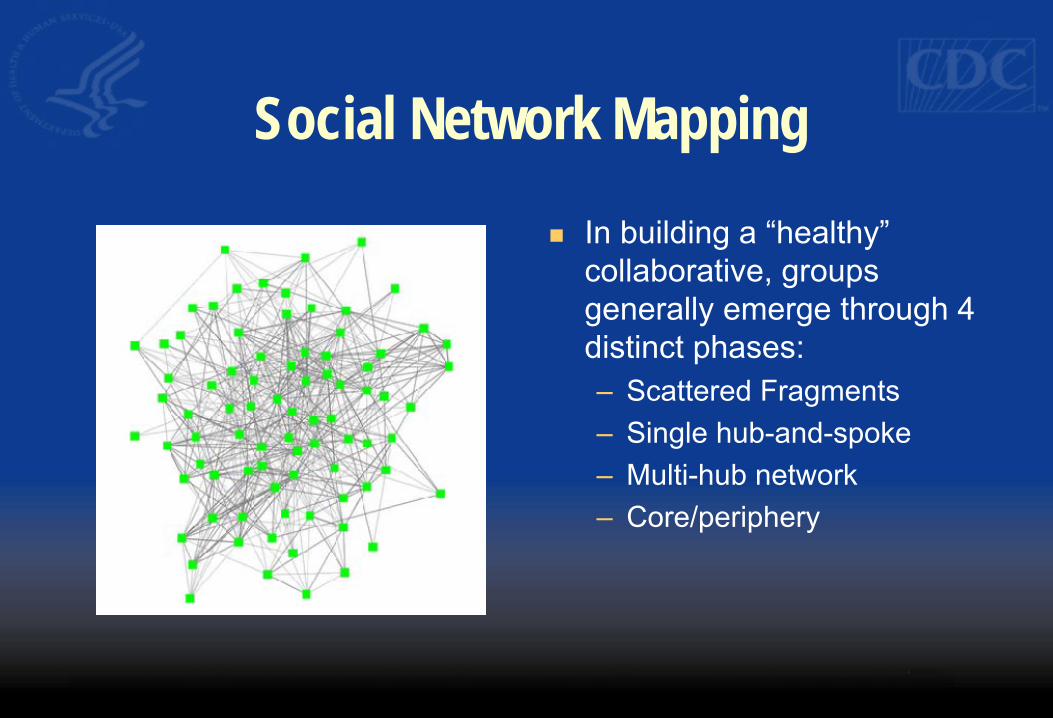
Social Network Mapping
� In building a “healthy” collaborative, groups generally emerge through 4 distinct phases: – Scattered Fragments – Single hub-and-spoke – Multi-hub network – Core/periphery
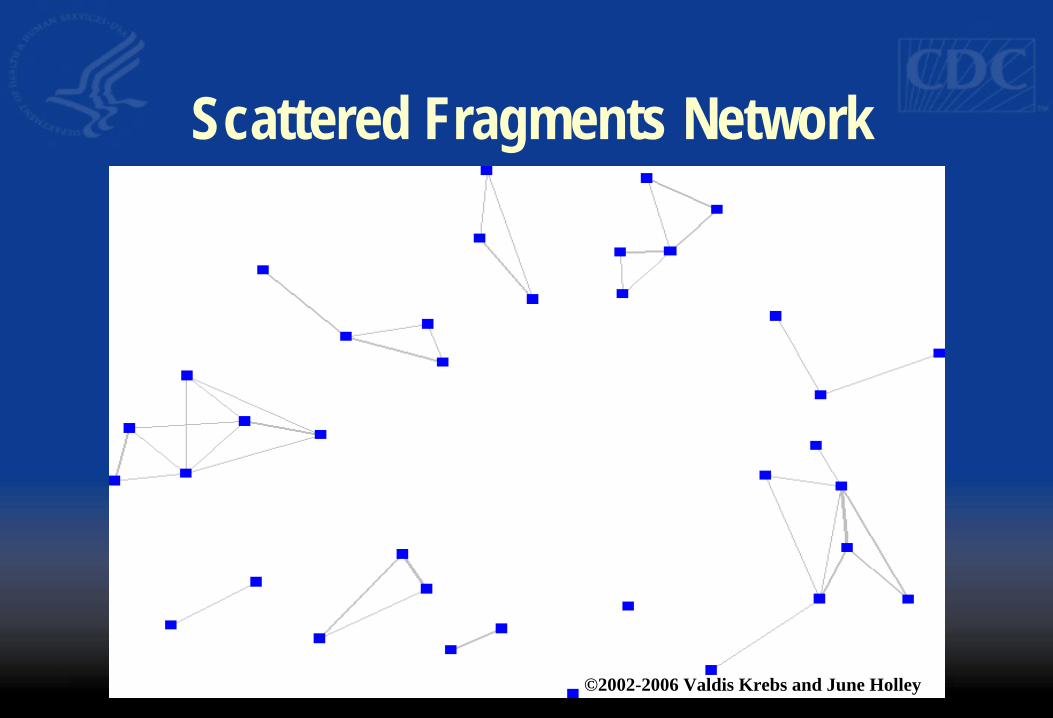
Scattered Fragments Network
©2002-2006 Valdis Krebs and June Holley
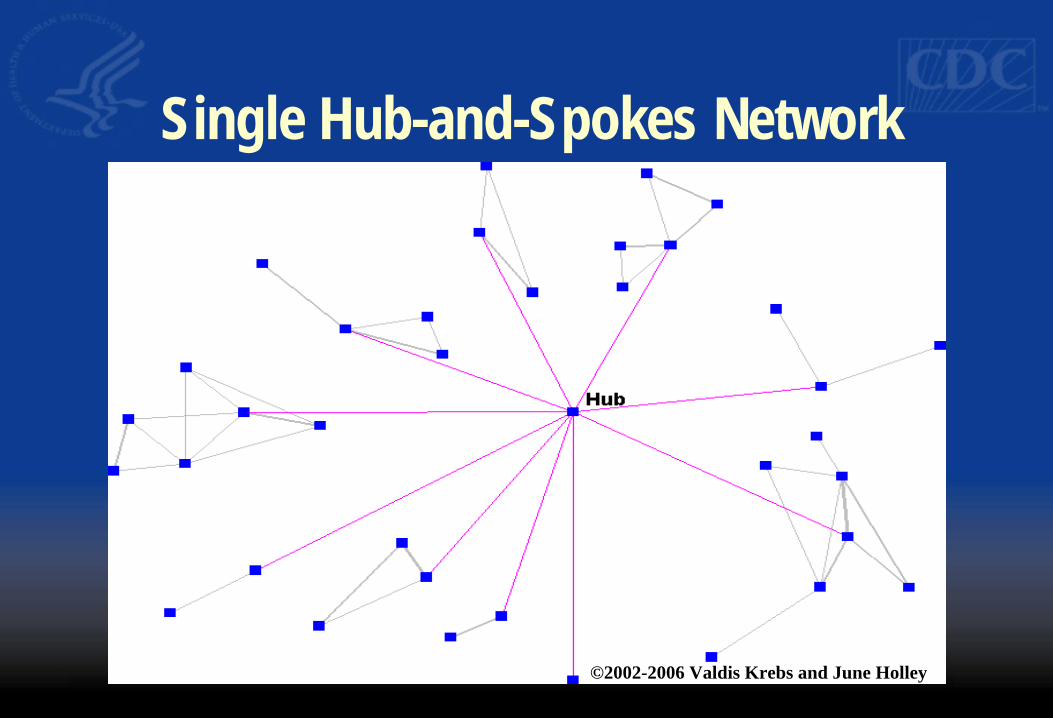
Single Hub-and-Spokes Network
©2002-2006 Valdis Krebs and June Holley
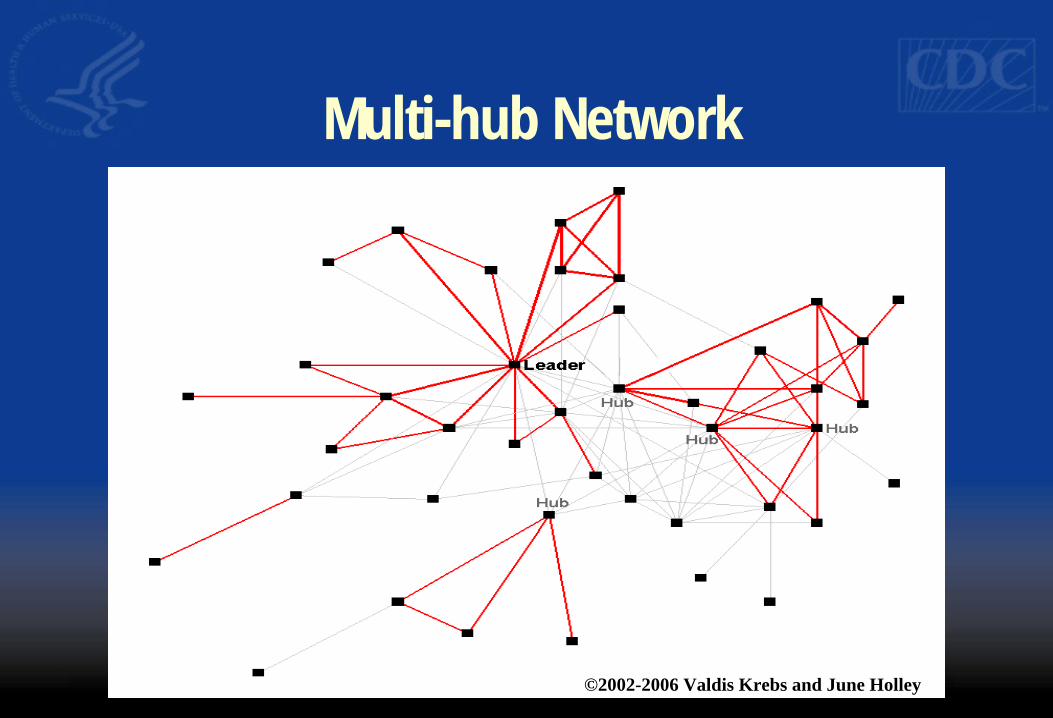
Multi-hub Network
©2002-2006 Valdis Krebs and June Holley
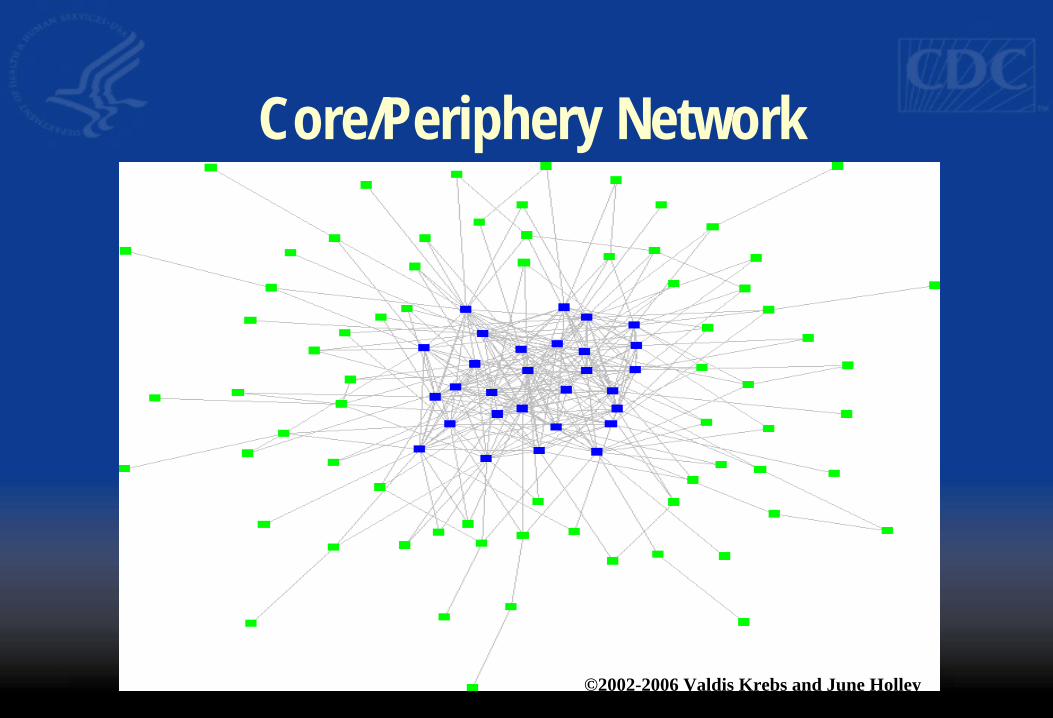
Core/Periphery Network
©2002-2006 Valdis Krebs and June Holley
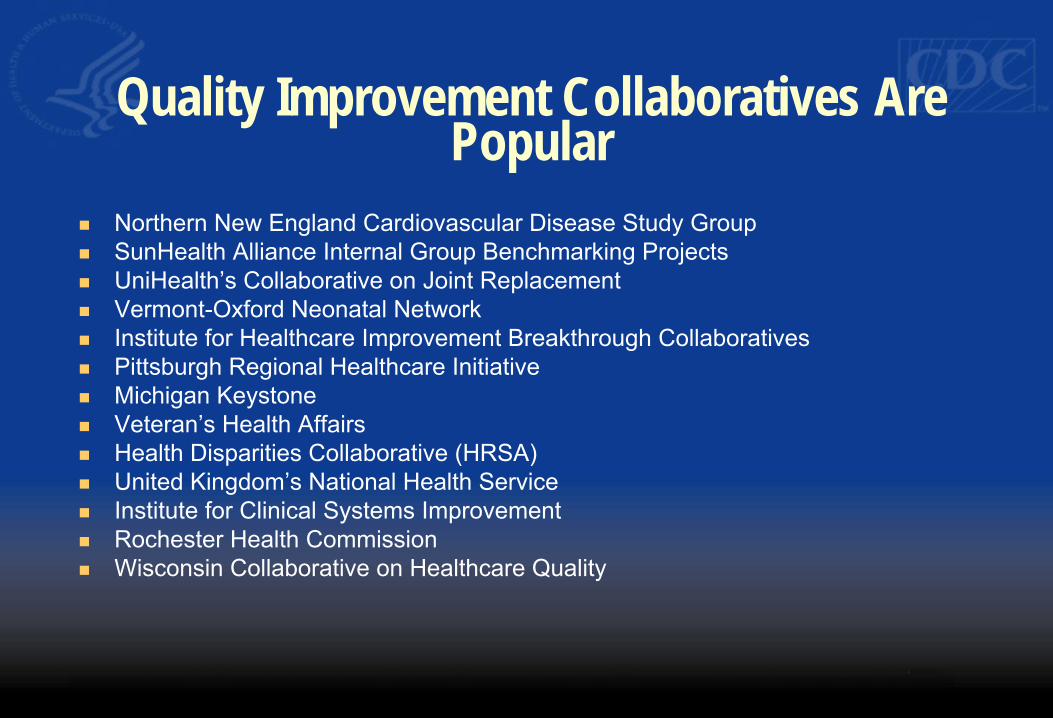
Quality Improvement Collaboratives ArePopular
� Northern New England Cardiovascular Disease Study Group � SunHealth Alliance Internal Group Benchmarking Projects � UniHealth’s Collaborative on Joint Replacement � Vermont-Oxford Neonatal Network � Institute for Healthcare Improvement Breakthrough Collaboratives � Pittsburgh Regional Healthcare Initiative � Michigan Keystone � Veteran’s Health Affairs � Health Disparities Collaborative (HRSA) � United Kingdom’s National Health Service � Institute for Clinical Systems Improvement � Rochester Health Commission � Wisconsin Collaborative on Healthcare Quality
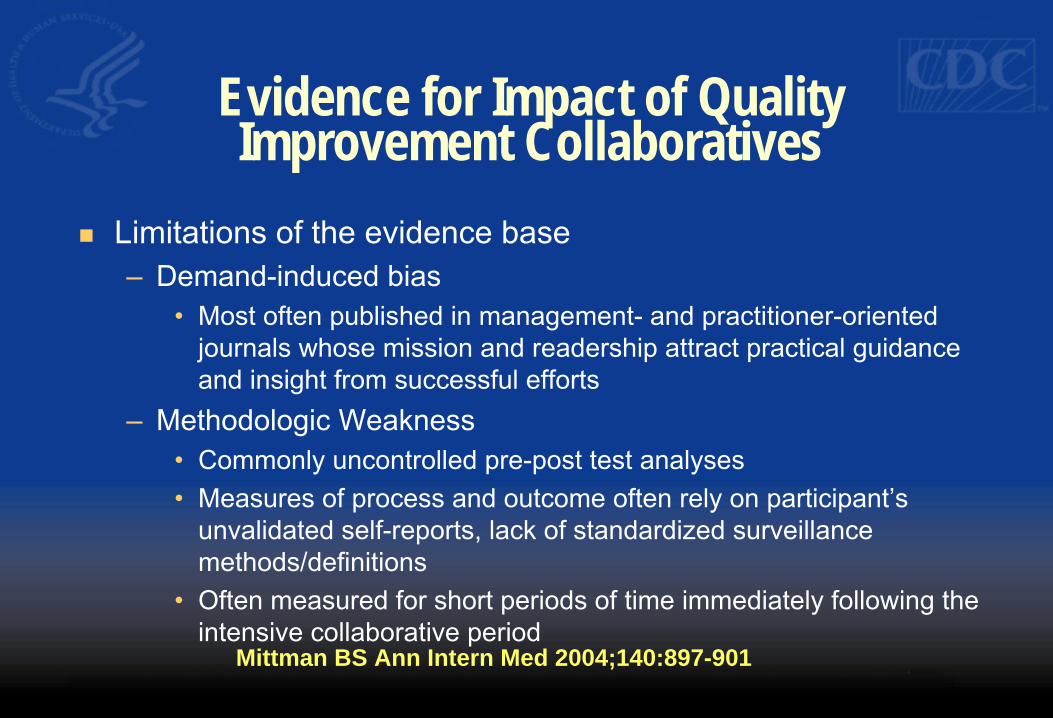
Evidence for Impact of QualityImprovement Collaboratives
� Limitations of the evidence base – Demand-induced bias
• Most often published in management- and practitioner-oriented journals whose mission and readership attract practical guidance and insight from successful efforts
– Methodologic Weakness • Commonly uncontrolled pre-post test analyses • Measures of process and outcome often rely on participant’s
unvalidated self-reports, lack of standardized surveillance methods/definitions
• Often measured for short periods of time immediately following the intensive collaborative period
Mittman BS Ann Intern Med 2004;140:897-901
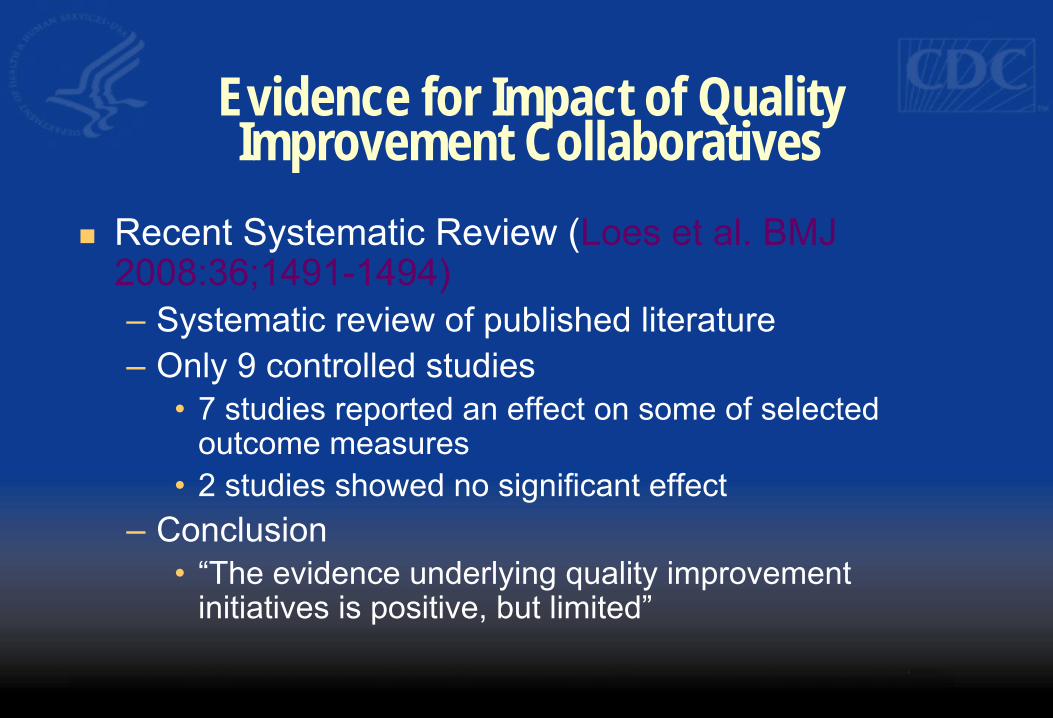
Evidence for Impact of QualityImprovement Collaboratives
� Recent Systematic Review (Loes et al. BMJ 2008:36;1491-1494) – Systematic review of published literature – Only 9 controlled studies
• 7 studies reported an effect on some of selected outcome measures
• 2 studies showed no significant effect – Conclusion
• “The evidence underlying quality improvementinitiatives is positive, but limited”
Why the Heterogeneity of Results?
� Possibilities: – Collaboration has no (or only modest) benefit – Effects are unpredictable – Intervention (i.e. effective collaboration) incorrectly or
incompletely implemented in some cases
� Even if the collaboration itself is not responsible for improvement, the demonstrating improvement across a large group of healthcare facilities may be an important strategy for stimulating global changes in practice
Characteristics of Effective Collaboration
� Active support of leaders – Engagement of experts
� Free flow of information – informal – Formal
• Use standardized, valid methodology for measuring outcomes � Multiple individuals within a unit/facility interact and develop meaningful
working relationships with those in other units/facilities � Make use of the peripheries of individuals/organizations to draw in new
ideas (i.e. diverse participation, involve the “unusual suspects”)
Characteristics of EffectiveCollaboration
� Support self organizing behavior – Encourage and coach individuals/facilities to form projects and
test out ideas for improvement (even very small projects) • provide opportunities to share with the larger collaborative
� View collaborative as longer term commitment � Regional collaboration may have special advantages
Objectives for Activity C in ARRA Funding
� Need an objective, standardized measure of outcomes – Use of NHSN: recommended – Consistency with NHSN definitions: required
� Constitute and convene a multidisciplinary advisory group
� Collaborate with ongoing activities in hospitals, hospital associations, others
Objectives for Activity C in ARRA Funding
� Identify/define participating hospitals � At least three face-to-face meetings over the two
years � Establish multicenter evidence-based HAI
prevention collaboratives � Demonstrate progress toward reaching at least two
HHS HAI Prevention Targets
Establishing a MultidisciplinaryOversight/Advisory Group
� Should involve multiple stakeholders – e.g. health department, healthcare facilities, payors,
purchasers, consumers, hospital associations, professional organizations).
� Provides project leadership and guidance, including initial selection of targets for HAI prevention initiatives and ongoing project oversight
Establishing a MultidisciplinaryOversight/Advisory Group
� Examples of proposed metrics of activity – Letters of commitment from steering group members – Face to face meetings – Selection of targets for prevention collaborative (i.e.
which HAIs will be targeted in the prevention collaborative?)
– Selection of specific prevention goal – Regular feedback of outcomes to Steering group
What are the Staff Needs? � Project coordination (managing logistics,
coordinating meetings, coordinating communications, tracking progress, etc.)
� Expertise and/or training in healthcare infection control
� Expertise and/or training in coordinating multicenter collaborative prevention projects
How will You Facilitate Sharing ofInformation
� Successful prevention collaboratives are dependentupon mechanisms to facilitate sharing of informationand data among participating facilities – face-to-face meetings – regularly scheduled teleconferences between face-to-
face meetings – other supportive communication infrastructure for
regular sharing between participants (web sites,listservs, etc.)
How will You Measure and PresentOutcomes?
� Successful prevention collaboratives have standardized anduniform outcome measures that allow sharing of progressamong participants and tracking aggregate group progress – Select measurement system (e.g. NHSN) – Establish willingness of facilities to participate in measurement
system and share data with central coordinator – Demonstrate regular feedback of outcome data to participating
facilities, to include a comparison of their individualperformance to aggregate performance of others.
CDC Technical Support
Questions
Thank you!
CDC’s Division of Healthcare Quality Promotion
http://www.cdc.gov/ncidod/dhqp/
Technical assistance specific to the Recovery Act project:
Telephone: (404) 639-4000 Email: [email protected]
The findings and conclusions in this presentation are those of the author(s) and do not necessarily represent the official position of the Centers for Disease
Control and Prevention.
Recommended