Embed Size (px)
DESCRIPTION
Les laboratoires pharmaceutiques, biotechnologiques ainsi que les producteurs de matières premières ou d’excipients (secteur chimique) ont besoin de disposer rapidement de résultats fiables pour assurer la qualité de leurs produits, tout en optimisant le coût des méthodes analytiques de contrôle ou au sens large des procédés impliqués dans leur production et leur contrôle. Le Laboratoire de Chimie Analytique de l’ULg et la société Arlenda ont, ensemble, mis au point de nouvelles stratégies de développement de procédés de fabrication et de méthodes analytiques séparatives, en se basant sur la planification expérimentale et le concept de Design Space (ou espace de conception dans lequel les objectifs prédéfinis sont atteints).
Citation preview

Parole d’expert
Prof. Philippe Hubert – ULg - Laboratoire de Chimie Analytique Eric Rozet – ULg - Laboratoire de Chimie Analytique Pierre Lebrun - Chercheur, Arlenda
Design space ou Espace de conception

Avec le soutien de :

1
Design Space ou Espace de Conception
29 novembre 2011
B. Boulanger - P. Lebrun - E. Rozet - Ph. Hubert

2
Facts

3
Desired state • Product quality and performance achieved and
assured by design of effective and efficient manufacturing processes
• Product specifications based on mechanistic understanding of how formulation and process factors impact product performance
• Ability for continuous improvement and assurance of quality

4
Regulatory Framework
Quality by Design (QbD) vs. Quality by Testing (QbT)
Increased knowledge
Science based Assurance of quality
Design Space (DS)

5
Regulatory Framework • ICH Q8: Design Space (DS):
• "the multidimensional combination and interaction of input variables and process parameters that have been demonstrated to provide assurance of quality"
• "working within the DS is not considered as a change"
• "Understand and gain knowledge about a process to find a parametric region of reliable robustness for future performance of this process"

6
Analytical Chemistry Lab focus
• How to build DS for Analytical methods ?
• Objective: – Define a robust region of input factors that
guarantees obtaining future appropriate separation of complex mixture components
OH
NH
OCH3

7
Analytical Chemistry Lab focus
• Multivariate: – Key input factors: pH, temperature, Gradient time, etc – Key responses: retention times
è Designs of Experiments (DOEs):
• Critical Quality Attribute: Separation (S) Colonnes de donnÈes pH Temperature Temps de gradient
Nuage de points 3D
S=B2-E1

8
Design of experiments
• Mean Response Surface ?
à Generally, mean responses are used for op1miza1on ✗ do not provide any clue about process reliability ✗ fail to give any informa1on on how the process will perform in the future ✗ will certainly give disappoin1ng and unexplained results for the future use of the method
With parameters pH>0 and %ACN>-‐0.8, will my separa<on really be at least 1 minutes?
Guarantee ??
S>1 minutes

S=1 min. P(S=1 min.)=50%
9
Op1mized Robust assay : Take into account the uncertainty about future run for defining a Design Space. Think risk, instead of mean. Here, probability to have a Separa1on > 1 minutes. Mean based DS Risk based S>1 minutes P(S>1 min.)
Design Space
mean responses = there is about 50% of chance that my response is, say, 1 minutes.

10 P(S>0) = 94.6%
Example Separation of 9 AINS by HPLC
Design Space

11
Legend : A. Paracetamol - B. Benzoate - C. Nipagine - D. Nipasol – E. Nimesulide – F. BHA - G. Ibuprofen; H. Mefenamic acid - I. BHT
Experimental
Predicted
Example

12
Birth of the project • Limitations of the classical statistical
methodologies – to provide risk-based solutions – even for simple statistical models
• Opportunity to develop new ways of thinking – integrate predictive uncertainty in the results
à Creation of the PPP – between University of Liège, Arlenda and RW
12
13
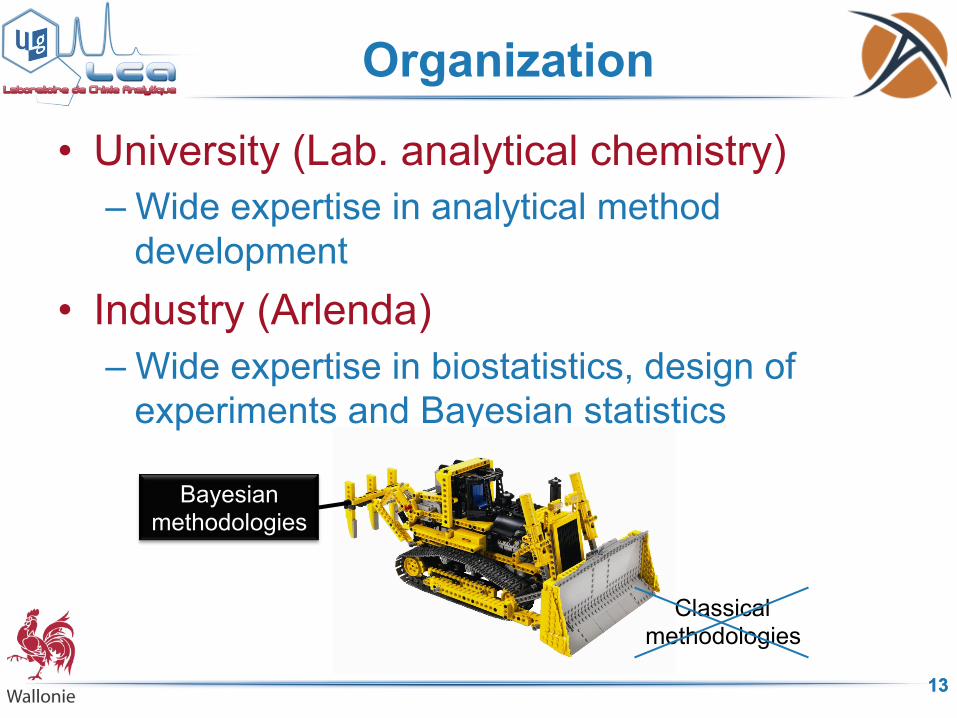
Organization
• University (Lab. analytical chemistry) – Wide expertise in analytical method
development • Industry (Arlenda)
– Wide expertise in biostatistics, design of experiments and Bayesian statistics
13
Classical methodologies
Bayesian methodologies

14
Organization • How to build the bulldozer ? • University
– 1 chemist – 1 statistician – 1 pharmacist
• Arlenda – Several PhD in statistics – 1 I.T. manager
14

15
Example for process
15
• A very general Process
Process
Critical Process Parameters (X) : • Quantitative • Qualitative • In-process
Output
Noises • Input variables
• Non-controlled variables • Material noise
Critical Quality Attributes (Y) => specifications
Running two times the process with X unchanged will not
provide two times the same output

16
Spray-drying process • Spray-drying is intended to create a powder with small
and controlled particle’s size for pulmonary delivery of a drug substance
• Several Critical Process Parameters (CPP) have an influence on several Critical Quality Attributes (CQA)
– CPP: inlet temperature, spray flow-rate, feed rate (other process parameters are kept constant) – CQA: yield, moisture, inhalable fraction, flowability
• Specifications on CQA defined as minimal satisfactory quality
– yield > 80% – moisture < 1% – Inhalable fraction > 60% – …
16

17
Spray-drying process • The process must provide, in its future use, quality
outputs – e.g. during routine
• According to specifications derived from safety, efficacy, economical reasons – Whatever future conditions of use, that are not always perfectly
controlled – Then, outputs should be not sensitive to minor changes
• This is Quality by Design – The way the process is developed leads to the product quality – This quality and the associated risks are assessed – Achieved using Design Space methodologies
17

18
Spray-drying process • Design Space, Risk and ICH Q8
– ICH Q8 proposes to use the Design Space (DS) risk-based methodology to fulfil these objectives
Target : “Understand and gain knowledge about a process to find a parametric region of reliable robustness for future performance of this process”
à Assurance of quality à Assessment of the risk not to achieve quality
18
19
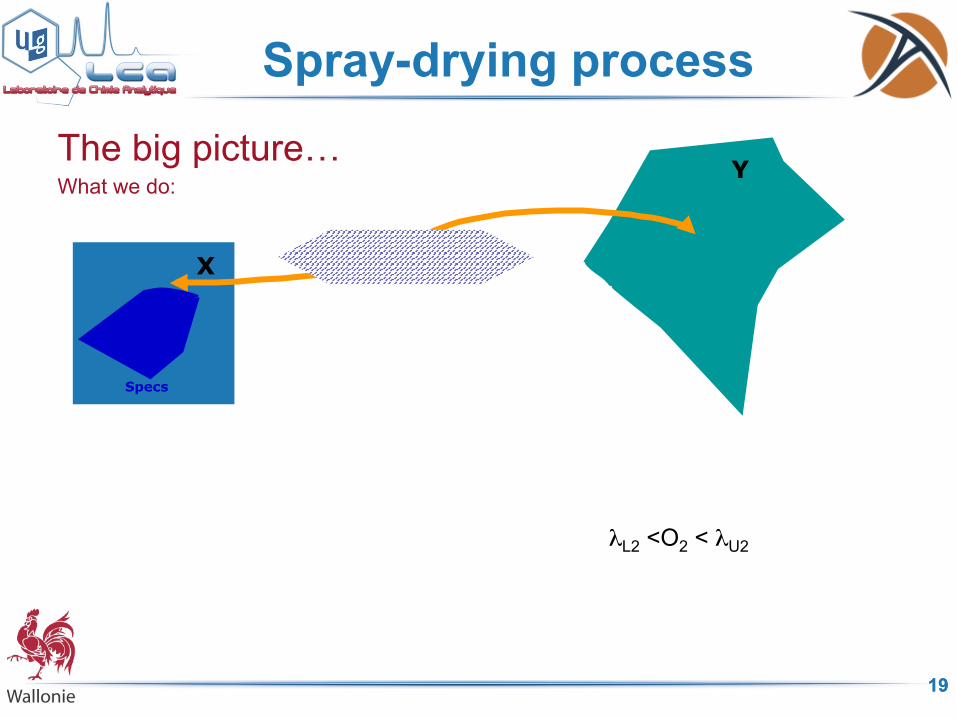
Spray-drying process
The big picture… What we do:
19
X
Y
Specs
λL2 <O2 < λU2
Predictive Model f
Target
Responses
CQAs CQAs = O(Y) = f(X) Designed experiments
DS
λL1 <O1 < λU1
Question: Guarantee that CQAs∈ λ
=> P(CQAs∈ λ) ?
20
Computation
• This implies to know the behavior of the CQAs in the future – How they change when CPPs change – How they are statistically distributed – How they are dependent
• Fortunately, solutions exist in the Bayesian statistical framework for every problem !
20

21
Spray-drying process • Risk-based design space: predicted P(CQAs∈ λ)
• In the Design Space, there is 45% of chance to observe each CQA within specification, jointly
• There is also 100-45% = 55% of risk not to observe the CQAs within specification (jointly) !
21
From a probabilistic perspective, the addition of univariatespecifications in a multivariate analysis logically leads to a de-crease in the joint predictive probability of acceptance [23]. At
optimal condition, the following decreasing probabilities illustratethis situation.
P(Yield > 80%) = 0.71,P(Yield > 80% and Moisture < 1%) = 0.56,P(Yield > 80% and Moisture < 1% and Fraction > 60%) = 0.48,P(Yield > 80% and Moisture < 1% and Fraction > 60% and Hausner< 1.18) = 0.45.The definition of multivariate specifications may be seen as a
remedy to this. In this context, desirability functions can be envis-aged to aggregate the values of every individual predicted CQA intoa single value, namely the desirability index, representing thedesirability of the solution [24,25]. Monte-Carlo simulations canbe used to propagate the predictive uncertainty and the correla-tions of the CQAs to the desirability index [26]. This index allowsfor certain trade-offs between the CQAs. A slightly bad result forone CQA could be compensated by a very satisfactory result foranother.
In this 5-CQAs study with univariate specifications, it may notbe surprising to observe the optimal joint estimated expectedprobability of acceptance being about 0.45. Of course, finding aDS with a higher minimal quality level and even stronger specifica-tions would be an even more desirable situation.
Some estimates for each CQA are provided in Table 6, computedfrom the distribution presented in Fig. 6. The mean values (Fig. 6,dashed lines) or the medians (plain line) are the values expressingthe central tendency one can expect to observe. Additionally, the75% and 95% Bayesian predictive intervals are also provided asvaluable information about the uncertainty of prediction.
For instance, the 75% predictive interval around the CQA Inhala-ble fraction is very large ([49–85]%). Then, the model is poorlyinformative regarding this CQA. A similar conclusion was reachedwhen looking at the marginal acceptance probability for this CQAat the optimum, which was only 0.62.
4.2. Validation
The optimal solution has been carried out three times indepen-dently on the same apparatus to observe how the process performswithin its 0.45 quality level DS. Table 7 summarizes the experi-mental results. They reinforce the statistics observed during theoptimization process.
As expected, the process performs according to the predictions.Most batches are within specifications. The inhalable fraction isseen as acceptable (higher than 60%) except in the third batch(red). However, on average (bold), the process corroborates the re-sults of the joint expected probability, which was about 0.45. Obvi-ously, a longer-term study would be necessary to plainly assess theroutine performance of the process.
Finally, Table 7 provides the indication of the variability ob-served in the three independent batches. This variability is lowcompared to the predictive uncertainty that was observed (seeFig. 6 and Table 6). This indicates that the residuals predictiveuncertainty is not only due to the noise of the process. The poormodel fit is also a concern. A possible explanation is that morecomplex interactions and higher order or non-linear effects arepresent. Unfortunately, the central composite face-centered designused in the experimental part is too light to detect such effects.
Fig. 5. Probability map that the CQAs satisfy the five specifications presented inTable 3. Inner black lines define the DS for the minimal quality level p = 0.437 Theblack point is the suboptimal condition xsub presented in Fig. 4. (For interpretationof the references to color in this figure legend, the reader is referred to the webversion of this article.)
Table 5Design space of the process.
Critical process parameters DS range
Feed rate (ml/min) [4.2–4.8]Spray flow rate (L/h) [1614–1744]Inlet temperature (!C) [118–125]
P. Lebrun et al. / European Journal of Pharmaceutics and Biopharmaceutics xxx (2011) xxx–xxx 7
Please cite this article in press as: P. Lebrun et al., Design space approach in the optimization of the spray-drying process, Eur. J. Pharm. Biopharm. (2011),doi:10.1016/j.ejpb.2011.09.014

22
Spray-drying process
• Validation – Experiments have been repeated 3 times
independently at optimal condition, i.e. • Inlet Temperature: 123.75°C • Spray Flow Rate: 1744 L/h • Feed Rate: 4.69 ml/min
• Jointly, 2 out of the 3 runs within specification 22
Indeed, the design allows only the estimation of the main and qua-dratic effects and the principal interactions. This underlines theneed to define more informative designs when little is knownabout the process, even if the price that must be paid is the carry-ing out of more experiments.
5. Conclusions
When setting up a QbD-compliant ICH Q8 design space for aprocess such as spray-drying, the use of the mean response surfaceoptimization methodology is not recommended due to the inevita-ble uncertainties and interactions that are encountered. Accord-ingly, the data gathered through a well-designed experimentalplan have been analyzed using a risk-based Bayesian predictive ap-proach allowing the uncertainties and interactions to be integratedinto a multivariate statistical model.
These variabilities result in a minimal quality level that hasbeen kept relatively low in order to be able to define a designspace, i.e., the guarantee of jointly observing the critical qualityattributes within their acceptance limits is low. Even with this sit-uation, these guarantees are quantified along with the risks of notobserving such quality, jointly or marginally. The specificationshave been designed such as to provide a minimal satisfying qualityfor whole process. In this way, the quality of the resulting product
is built in by the design and controlled setup of the spray-dryingequipment.
Validation of the optimal condition within the design space hasbeen carried out, and these experiments provided a product com-pliant with the predicted quality. To better assess how the guaran-tees of quality prediction perform, one would consider analyzinglonger-term process data.
In addition, the validation experiments carried out indepen-dently provided supplementary information concerning the statis-tical model. Indeed, the good repeatability of the process seems toindicate that the causes of the poor model fit were not solely due tothe noise present in the data. Instead, more complex interactionsor non-linearity of the responses can be present. In cases wherenothing or little is known about a specific process, defining a moreinformative though labor-intensive design of experiments shouldbe envisaged.
Finally, the definition of a low guarantee design space could beseen as the very first step toward a quality by design methodology.The results presented are of great interest for the spray-dryingmanufacturers and experimenters in order to improve quality.For instance, the causes of variation could be identified, such aspoorly controlled factors. Furthermore, the effect of the key processparameters that have been kept constant during this study couldbe analyzed in a more detailed way through a new experimentalplan.
Acknowledgments
The authors would like to thank the Walloon Region of Belgiumfor the PPP convention funds No. 917007 and Arlenda S.A. for par-tial funding. A research grant from the Belgium National Fund forScientific Research (F.R.S-FNRS) to E. Rozet is also gratefullyacknowledged.
Appendix A. Supplementary material
Supplementary data associated with this article can be found, inthe online version, at doi:10.1016/j.ejpb.2011.09.014.
References
[1] International Conference on Harmonization (ICH) of Technical Requirementsfor Registration of Pharmaceuticals for Human Use, Topic Q8(R2): Pharm. Dev.Geneva, 2009.
[2] L. Yu, Pharmaceutical quality by design: product and process development,understanding, and control, Pharm. Res. 25 (2008) 781–791.
[3] Food and Drugs Administration, Applying ICH Q8(R2), Q9, and Q10 Principlesto CMC Review. Chapter 5000 – Pharmaceutical Sciences, 5016.1, February2011.
[4] M.E. Aulton, K. Taylor, Pharmaceutics. The Science of Dosage Form Design,second ed., Churchill Livingstone, Leicester, 2001. pp. 473–489.
[5] D.A. Groneberg, C. Witt, U. Wagner, K.F. Chung, A. Fischer, Fundamentals ofpulmonary drug delivery, Respir. Med. 97 (2003) 382–387.
[6] A.J. Hickey, Pharmaceutical Inhalation Aerosol Technology, Marcel Dekker Inc.,New York, 1996.
[7] M.J. Maltesen, S. Bjerregaard, L. Hovgaard, S. Havelund, M. van de Weert,Quality by design – spray-drying of insulin intended for inhalation, Eur. J.Pharm. Biopharm. 70 (2008) 828–838.
[8] K. Masters, Spray-Drying in Practice, SprayDry Consult International ApS,Copenhagen, Denmark, 2002.
Fig. 6. Marginal predictive kernel density estimations of the critical qualityattributes on at the optimum. See Fig. 4 for colors and legend. (For interpretationof the references to color in this figure legend, the reader is referred to the webversion of this article.)
Table 6Statistics on the CQAs at the optimal input condition.
CQA Lower95%
Lower75%
Median Mean Upper75%
Upper95%
Yield(%)
42 75 88 81 94 !100
Moisture content(%)
0.26 0.57 0.71 0.76 0.89 1.31
Inhalablefraction (%)
17 49 70 65 85 100
Compressibilityindex
0.4 6.2 8.8 9 11.5 16.1
Hausner ratio 1 1.07 1.09 1.1 1.13 1.19
Table 7Results of the validation experiments.
Batches Yield(%)
Moisturecontent (%)
Inhalablefraction (%)
Compressibilityindex
Hausnerratio
1 88 <0.2 63 11.6 1.132 89 <0.2 62 12 1.143 88 <0.2 59 11.5 1.13Mean 88.7 <0.2 61.18 11.76 1.13Standard
deviation0.61 NA 1.82 0.22 0.01
8 P. Lebrun et al. / European Journal of Pharmaceutics and Biopharmaceutics xxx (2011) xxx–xxx
Please cite this article in press as: P. Lebrun et al., Design space approach in the optimization of the spray-drying process, Eur. J. Pharm. Biopharm. (2011),doi:10.1016/j.ejpb.2011.09.014

23
Spray-drying process • Post-analysis (« How they are statistically distributed »)
– Marginal predictive densities of the CQAs
23
Indeed, the design allows only the estimation of the main and qua-dratic effects and the principal interactions. This underlines theneed to define more informative designs when little is knownabout the process, even if the price that must be paid is the carry-ing out of more experiments.
5. Conclusions
When setting up a QbD-compliant ICH Q8 design space for aprocess such as spray-drying, the use of the mean response surfaceoptimization methodology is not recommended due to the inevita-ble uncertainties and interactions that are encountered. Accord-ingly, the data gathered through a well-designed experimentalplan have been analyzed using a risk-based Bayesian predictive ap-proach allowing the uncertainties and interactions to be integratedinto a multivariate statistical model.
These variabilities result in a minimal quality level that hasbeen kept relatively low in order to be able to define a designspace, i.e., the guarantee of jointly observing the critical qualityattributes within their acceptance limits is low. Even with this sit-uation, these guarantees are quantified along with the risks of notobserving such quality, jointly or marginally. The specificationshave been designed such as to provide a minimal satisfying qualityfor whole process. In this way, the quality of the resulting product
is built in by the design and controlled setup of the spray-dryingequipment.
Validation of the optimal condition within the design space hasbeen carried out, and these experiments provided a product com-pliant with the predicted quality. To better assess how the guaran-tees of quality prediction perform, one would consider analyzinglonger-term process data.
In addition, the validation experiments carried out indepen-dently provided supplementary information concerning the statis-tical model. Indeed, the good repeatability of the process seems toindicate that the causes of the poor model fit were not solely due tothe noise present in the data. Instead, more complex interactionsor non-linearity of the responses can be present. In cases wherenothing or little is known about a specific process, defining a moreinformative though labor-intensive design of experiments shouldbe envisaged.
Finally, the definition of a low guarantee design space could beseen as the very first step toward a quality by design methodology.The results presented are of great interest for the spray-dryingmanufacturers and experimenters in order to improve quality.For instance, the causes of variation could be identified, such aspoorly controlled factors. Furthermore, the effect of the key processparameters that have been kept constant during this study couldbe analyzed in a more detailed way through a new experimentalplan.
Acknowledgments
The authors would like to thank the Walloon Region of Belgiumfor the PPP convention funds No. 917007 and Arlenda S.A. for par-tial funding. A research grant from the Belgium National Fund forScientific Research (F.R.S-FNRS) to E. Rozet is also gratefullyacknowledged.
Appendix A. Supplementary material
Supplementary data associated with this article can be found, inthe online version, at doi:10.1016/j.ejpb.2011.09.014.
References
[1] International Conference on Harmonization (ICH) of Technical Requirementsfor Registration of Pharmaceuticals for Human Use, Topic Q8(R2): Pharm. Dev.Geneva, 2009.
[2] L. Yu, Pharmaceutical quality by design: product and process development,understanding, and control, Pharm. Res. 25 (2008) 781–791.
[3] Food and Drugs Administration, Applying ICH Q8(R2), Q9, and Q10 Principlesto CMC Review. Chapter 5000 – Pharmaceutical Sciences, 5016.1, February2011.
[4] M.E. Aulton, K. Taylor, Pharmaceutics. The Science of Dosage Form Design,second ed., Churchill Livingstone, Leicester, 2001. pp. 473–489.
[5] D.A. Groneberg, C. Witt, U. Wagner, K.F. Chung, A. Fischer, Fundamentals ofpulmonary drug delivery, Respir. Med. 97 (2003) 382–387.
[6] A.J. Hickey, Pharmaceutical Inhalation Aerosol Technology, Marcel Dekker Inc.,New York, 1996.
[7] M.J. Maltesen, S. Bjerregaard, L. Hovgaard, S. Havelund, M. van de Weert,Quality by design – spray-drying of insulin intended for inhalation, Eur. J.Pharm. Biopharm. 70 (2008) 828–838.
[8] K. Masters, Spray-Drying in Practice, SprayDry Consult International ApS,Copenhagen, Denmark, 2002.
Fig. 6. Marginal predictive kernel density estimations of the critical qualityattributes on at the optimum. See Fig. 4 for colors and legend. (For interpretationof the references to color in this figure legend, the reader is referred to the webversion of this article.)
Table 6Statistics on the CQAs at the optimal input condition.
CQA Lower95%
Lower75%
Median Mean Upper75%
Upper95%
Yield(%)
42 75 88 81 94 !100
Moisture content(%)
0.26 0.57 0.71 0.76 0.89 1.31
Inhalablefraction (%)
17 49 70 65 85 100
Compressibilityindex
0.4 6.2 8.8 9 11.5 16.1
Hausner ratio 1 1.07 1.09 1.1 1.13 1.19
Table 7Results of the validation experiments.
Batches Yield(%)
Moisturecontent (%)
Inhalablefraction (%)
Compressibilityindex
Hausnerratio
1 88 <0.2 63 11.6 1.132 89 <0.2 62 12 1.143 88 <0.2 59 11.5 1.13Mean 88.7 <0.2 61.18 11.76 1.13Standard
deviation0.61 NA 1.82 0.22 0.01
8 P. Lebrun et al. / European Journal of Pharmaceutics and Biopharmaceutics xxx (2011) xxx–xxx
Please cite this article in press as: P. Lebrun et al., Design space approach in the optimization of the spray-drying process, Eur. J. Pharm. Biopharm. (2011),doi:10.1016/j.ejpb.2011.09.014
Compared with validation SD, these uncertainties seems huge !
In fact, the model does not fit
well the data
Predictive uncertainty = data uncertainty + model uncertainty

24
Spray-drying process
• Conclusion – Effective Design Space is the ultimate tool to
optimize a process or a method while concurrently assessed its robustness
• To provide guarantee that future runs will be on specifications
– Even in presence of poor model fit… • Here, due to a poorly designed set of experiments
– … it allows providing risk-based results • But guarantee is kept low (45%)
24

25
Gain • What are the benefits for industry ?
– Classical benefits due to DOE • The time to run experiments before obtaining results is
controlled • This time is generally reduced in comparison to “handmade”
optimization. Costs are reduced as well
– Benefits due to risk-based Design Space • Guarantee and risk to be on specification are controlled • Process/method knowledge leads to quality product and
robustness • Robustness generally eases transfer between manufacturing
sites, for instance • Better quality products also allows reducing costs
– Less batches out-of-specification – Improvement of process reliability
25
26
Role of the partners • Before PPP, University and Arlenda had a
recognized expertise in Statistics for (Bio)Analytical methods
• Now, growing expertise in Quality by Design and Design Space computations
• Arlenda is extending its activity – Opening new offices in the US – Hiring a major QbD and non-clinical statistics expert
from the US
26

27
• For a research implying academic developments and publications – Contact:
• [email protected] • [email protected]
• For a research for commercial purposes – Contact:
• [email protected] • [email protected]
27

28
• Merci pour votre attention !
28


![Conférence lacelle lebrun- boutin précongrès aqpf novembre 2011 [1]](https://img.pdfslide.fr/doc/110x75/5464fdf8af7959167a8b6014/conference-lacelle-lebrun-boutin-precongres-aqpf-novembre-2011-1.jpg)