Embed Size (px)
Citation preview
19 novembre 2015 ‹N°› www.ibsa.irisnet.be
Capturing territorial disparities of Brussels’ population boom:
The ‘Monitoring des Quartiers’, an interactive decision
support tool
Jean-Pierre HERMIA
Carole THAYS
<1>
www.monitoringdesquartiers.irisnet.be
19 novembre 2015 ‹N°› www.ibsa.irisnet.be
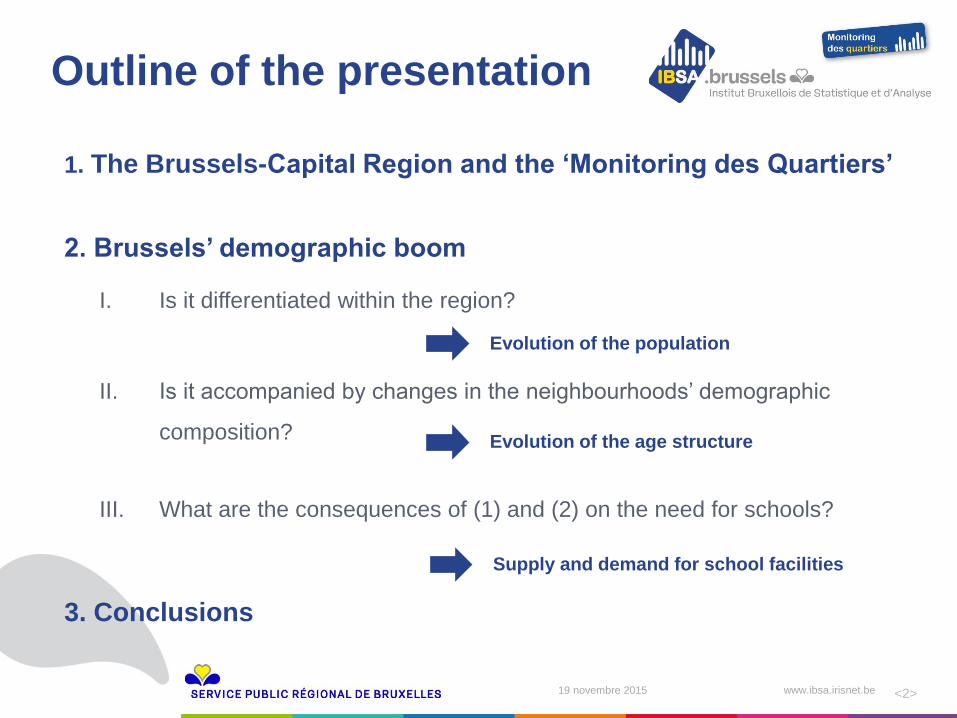
I. Is it differentiated within the region?
II. Is it accompanied by changes in the neighbourhoods’ demographic
composition?
III. What are the consequences of (1) and (2) on the need for schools?
Outline of the presentation
<2>
1. The Brussels-Capital Region and the ‘Monitoring des Quartiers’
2. Brussels’ demographic boom
3. Conclusions
Evolution of the population
Evolution of the age structure
Supply and demand for school facilities
19 novembre 2015 ‹N°› www.ibsa.irisnet.be
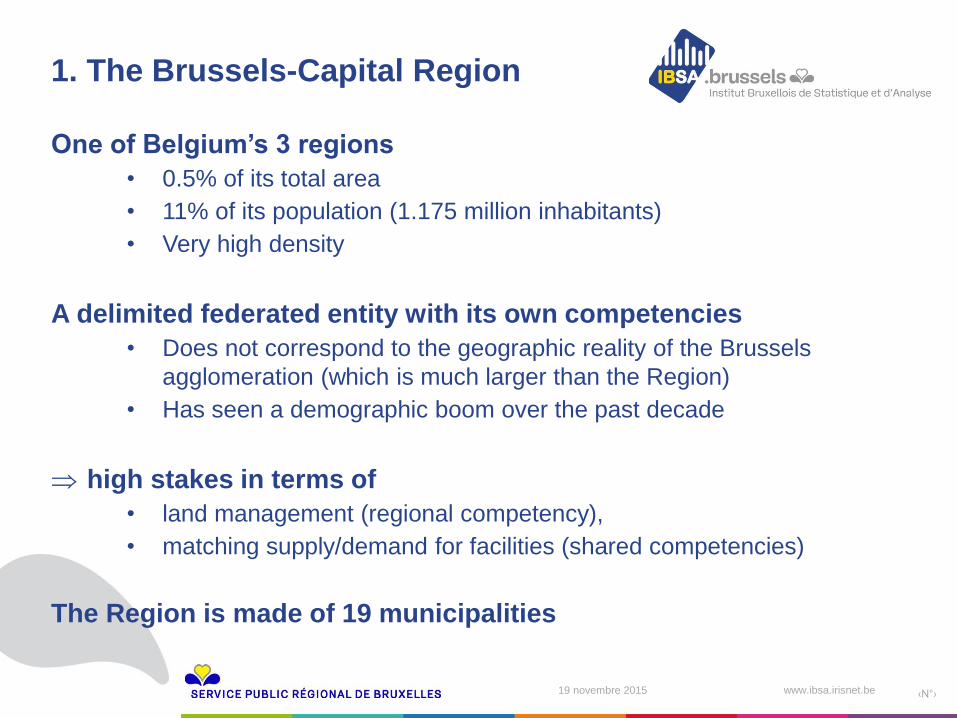
One of Belgium’s 3 regions
• 0.5% of its total area
• 11% of its population (1.175 million inhabitants)
• Very high density
A delimited federated entity with its own competencies
• Does not correspond to the geographic reality of the Brussels
agglomeration (which is much larger than the Region)
• Has seen a demographic boom over the past decade
high stakes in terms of
• land management (regional competency),
• matching supply/demand for facilities (shared competencies)
The Region is made of 19 municipalities
1. The Brussels-Capital Region
19 novembre 2015 ‹N°› www.ibsa.irisnet.be
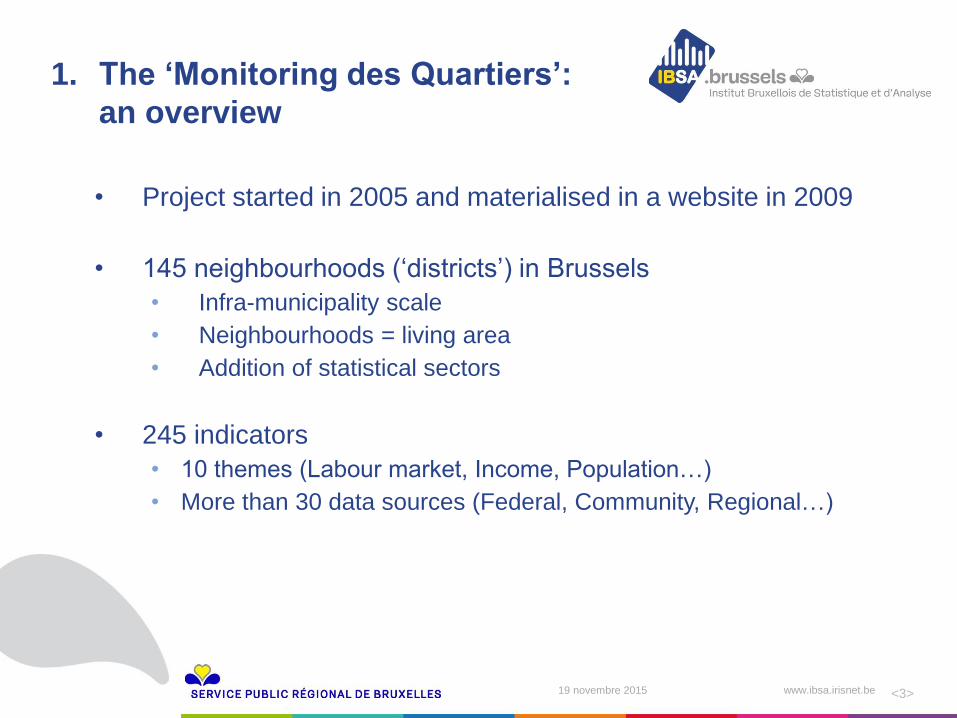
1. The ‘Monitoring des Quartiers’:
an overview
<3>
• Project started in 2005 and materialised in a website in 2009
• 145 neighbourhoods (‘districts’) in Brussels
• Infra-municipality scale
• Neighbourhoods = living area
• Addition of statistical sectors
• 245 indicators
• 10 themes (Labour market, Income, Population…)
• More than 30 data sources (Federal, Community, Regional…)
19 novembre 2015 ‹N°› www.ibsa.irisnet.be www.monitoringdesquartiers.irisnet.be
19 novembre 2015 ‹N°› www.ibsa.irisnet.be
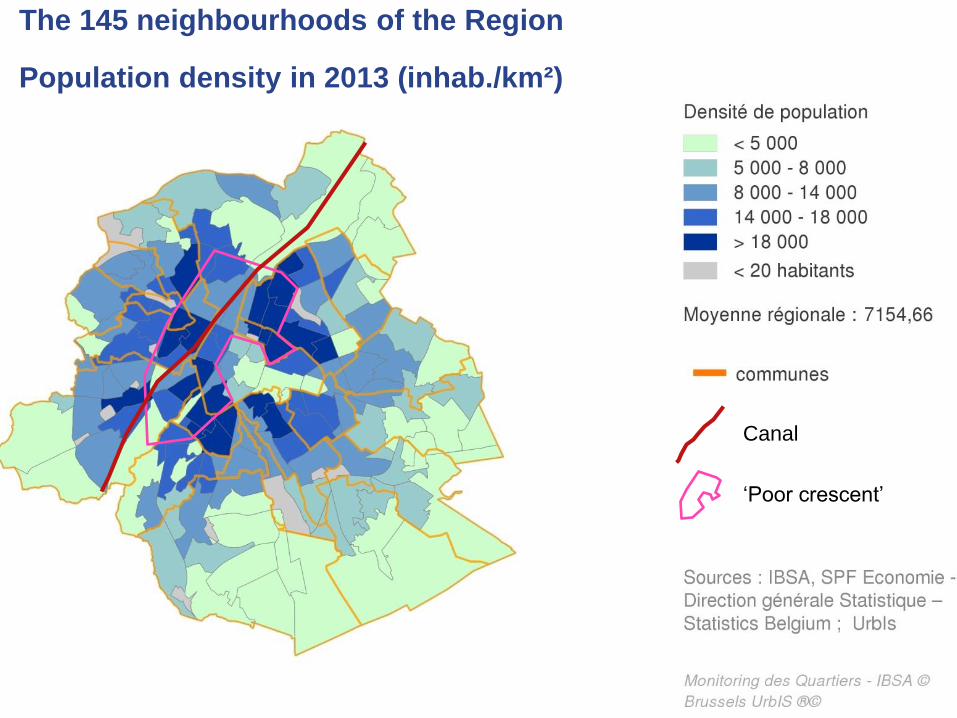
The 145 neighbourhoods of the Region
Population density in 2013 (inhab./km²)
‘Poor crescent’
Canal
19 novembre 2015 ‹N°› www.ibsa.irisnet.be
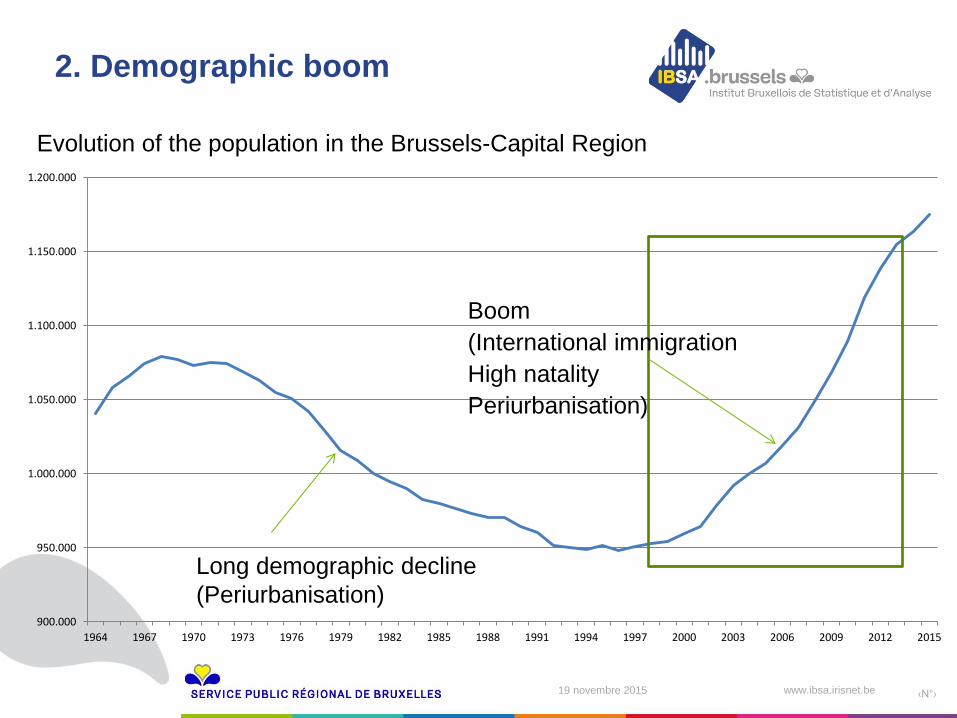
2. Demographic boom
Croissance de la population en RBC
900.000
950.000
1.000.000
1.050.000
1.100.000
1.150.000
1.200.000
1964 1967 1970 1973 1976 1979 1982 1985 1988 1991 1994 1997 2000 2003 2006 2009 2012 2015
Evolution of the population in the Brussels-Capital Region
Long demographic decline
(Periurbanisation)
Boom
(International immigration
High natality
Periurbanisation)
19 novembre 2015 ‹N°› www.ibsa.irisnet.be
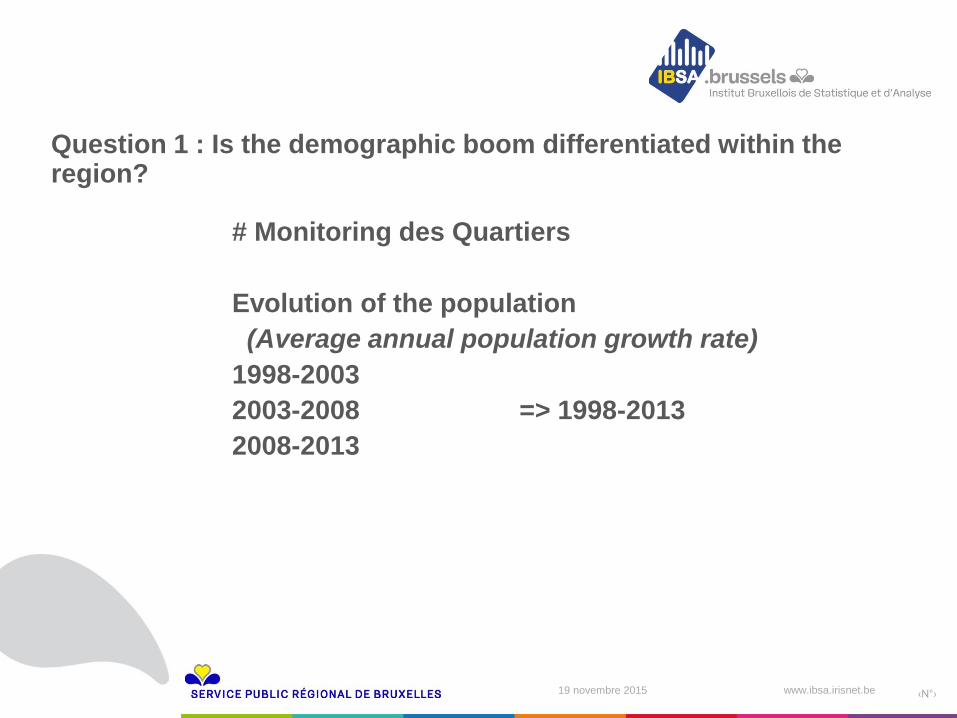
Question 1 : Is the demographic boom differentiated within the region?
# Monitoring des Quartiers
Evolution of the population
(Average annual population growth rate)
1998-2003
2003-2008 => 1998-2013
2008-2013
19 novembre 2015 ‹N°› www.ibsa.irisnet.be
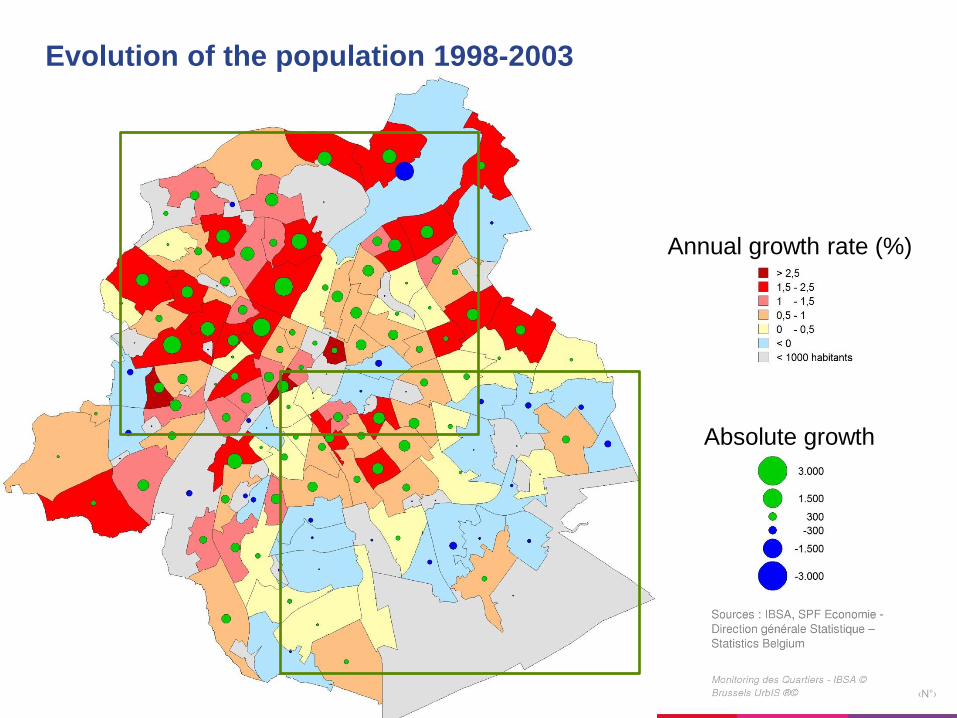
Evolution of the population 1998-2003
Annual growth rate (%)
Absolute growth
19 novembre 2015 ‹N°› www.ibsa.irisnet.be
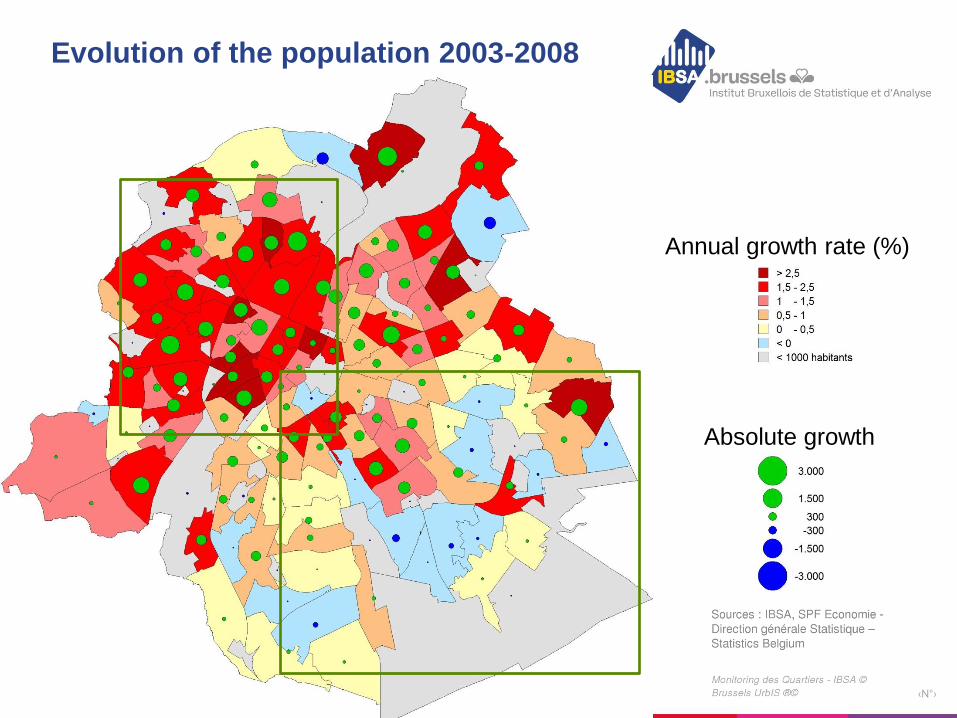
Evolution of the population 2003-2008
Annual growth rate (%)
Absolute growth
19 novembre 2015 ‹N°› www.ibsa.irisnet.be
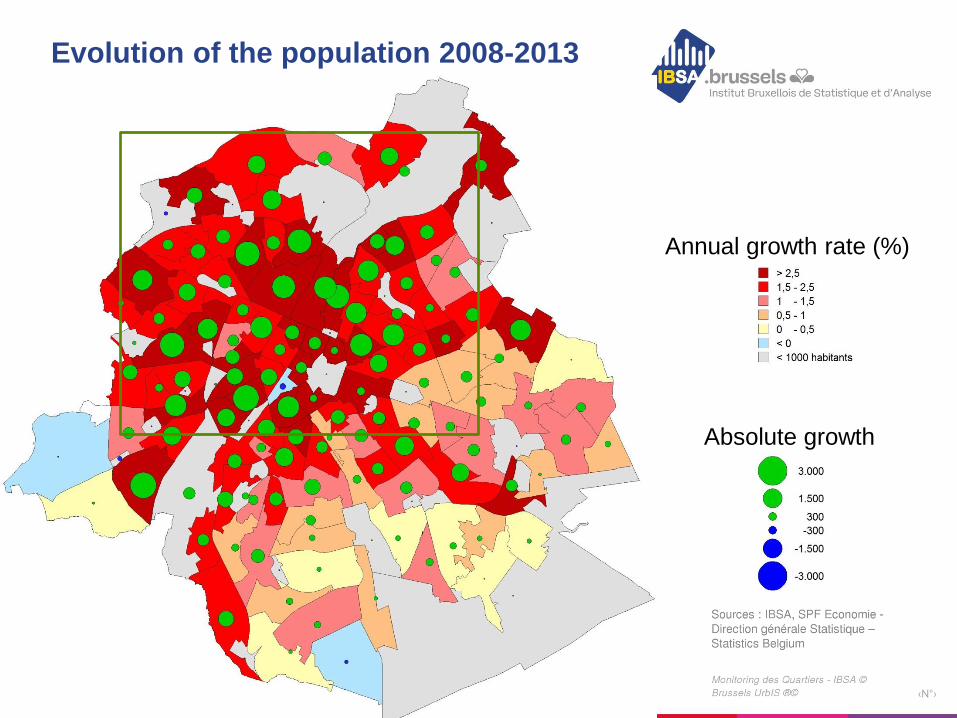
Evolution of the population 2008-2013
Annual growth rate (%)
Absolute growth
19 novembre 2015 ‹N°› www.ibsa.irisnet.be
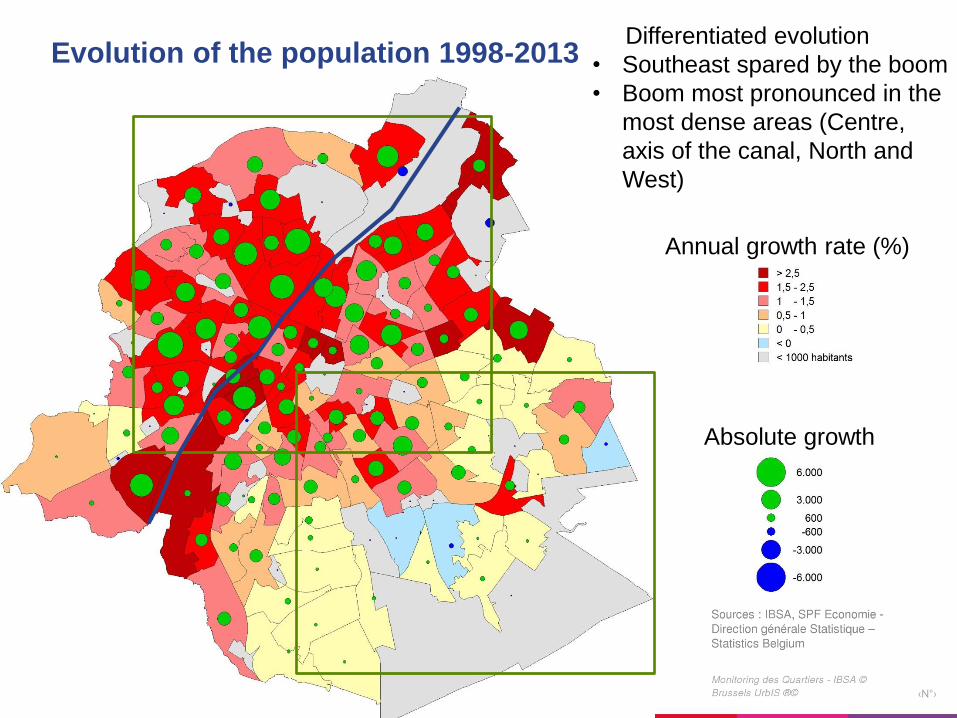
Evolution of the population 1998-2013
Differentiated evolution
• Southeast spared by the boom
• Boom most pronounced in the
most dense areas (Centre,
axis of the canal, North and
West)
Annual growth rate (%)
Absolute growth
19 novembre 2015 ‹N°› www.ibsa.irisnet.be
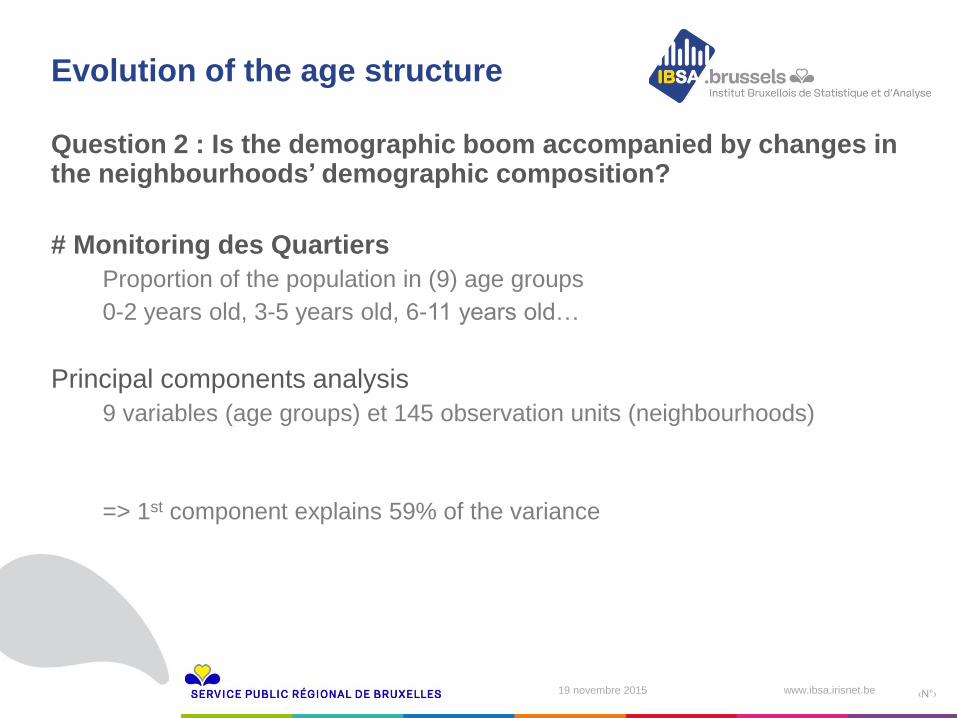
Question 2 : Is the demographic boom accompanied by changes in the neighbourhoods’ demographic composition?
# Monitoring des Quartiers
Proportion of the population in (9) age groups
0-2 years old, 3-5 years old, 6-11 years old…
Principal components analysis
9 variables (age groups) et 145 observation units (neighbourhoods)
=> 1st component explains 59% of the variance
Evolution of the age structure
19 novembre 2015 ‹N°› www.ibsa.irisnet.be
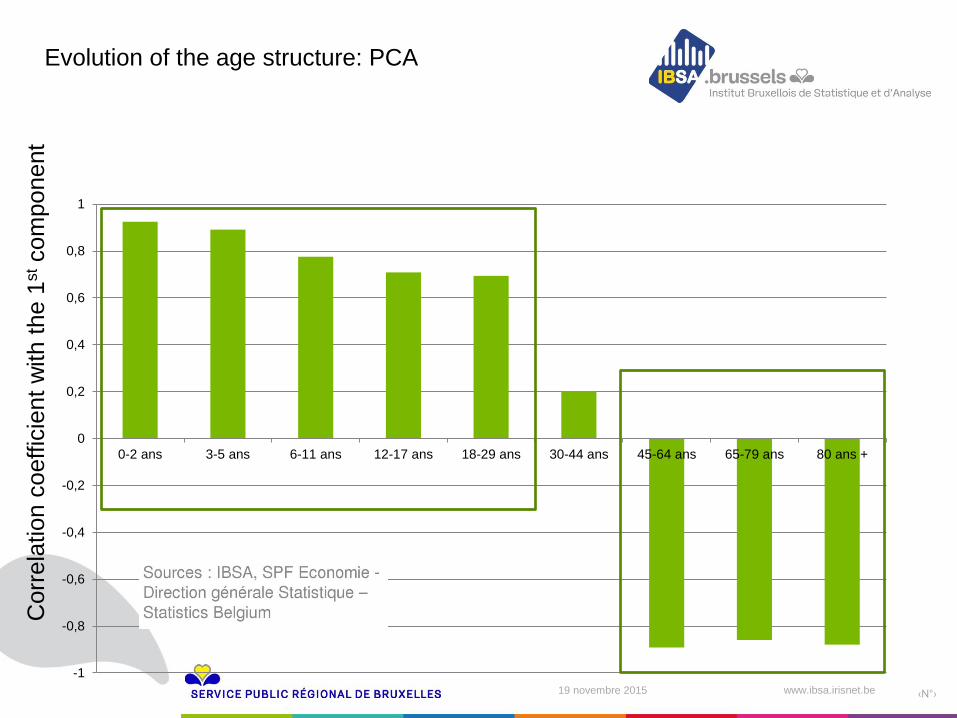
-1
-0,8
-0,6
-0,4
-0,2
0
0,2
0,4
0,6
0,8
1
0-2 ans 3-5 ans 6-11 ans 12-17 ans 18-29 ans 30-44 ans 45-64 ans 65-79 ans 80 ans +
Evolution of the age structure: PCA C
orr
ela
tion c
oeffic
ient
with t
he 1
st c
om
ponent
19 novembre 2015 ‹N°› www.ibsa.irisnet.be
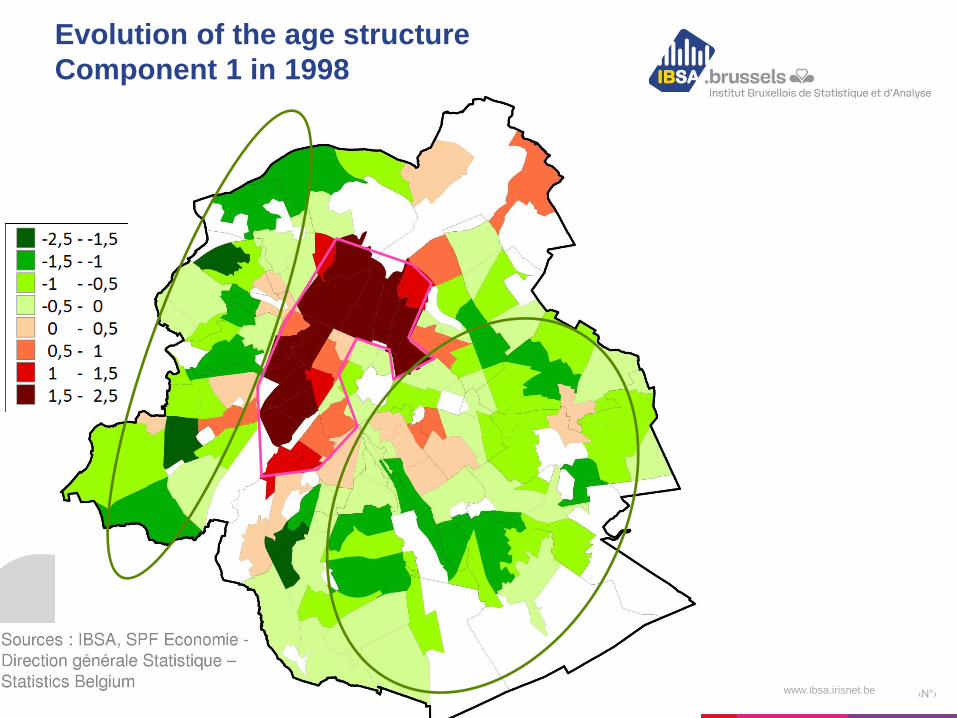
Evolution of the age structure
Component 1 in 1998
19 novembre 2015 ‹N°› www.ibsa.irisnet.be
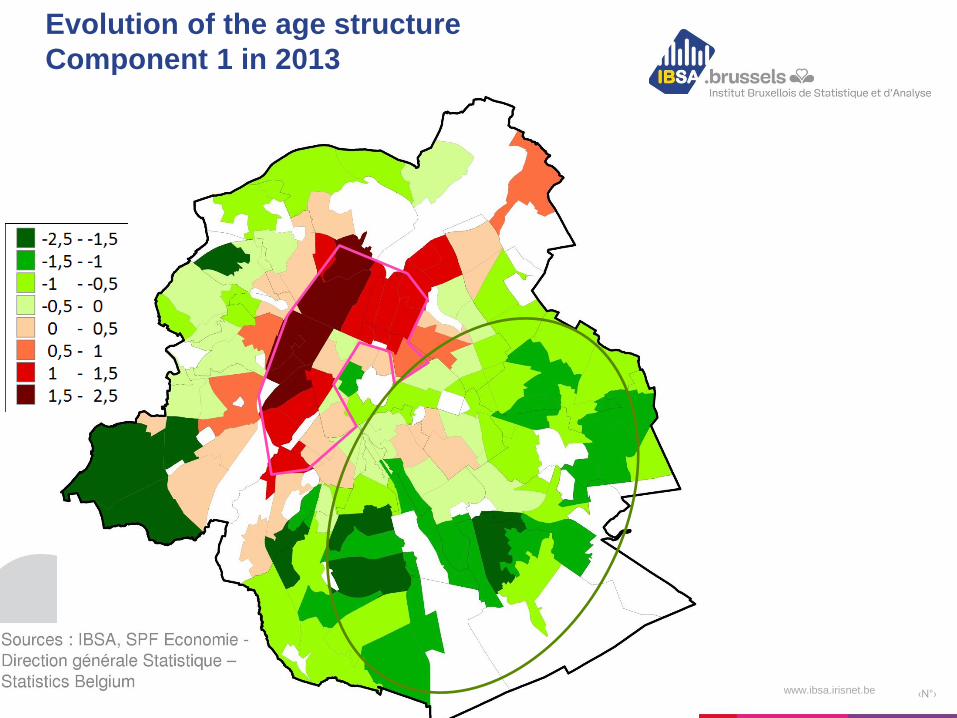
Evolution of the age structure
Component 1 in 2013
19 novembre 2015 ‹N°› www.ibsa.irisnet.be
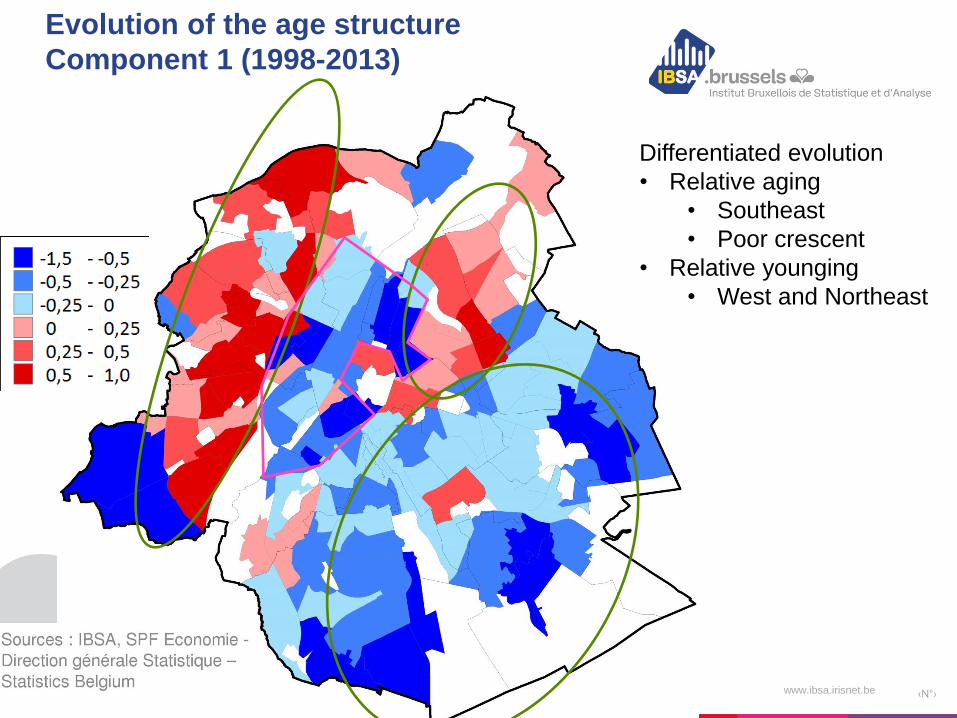
Evolution of the age structure
Component 1 (1998-2013)
Differentiated evolution
• Relative aging
• Southeast
• Poor crescent
• Relative younging
• West and Northeast
19 novembre 2015 ‹N°› www.ibsa.irisnet.be
Question 3 : What are the effects of
• the heterogeneity of the demographic boom within the Region
• the differentiated demographic change
on the adequacy between supply and demand for school facilities?
Impact on the need for schools
19 novembre 2015 ‹N°› www.ibsa.irisnet.be
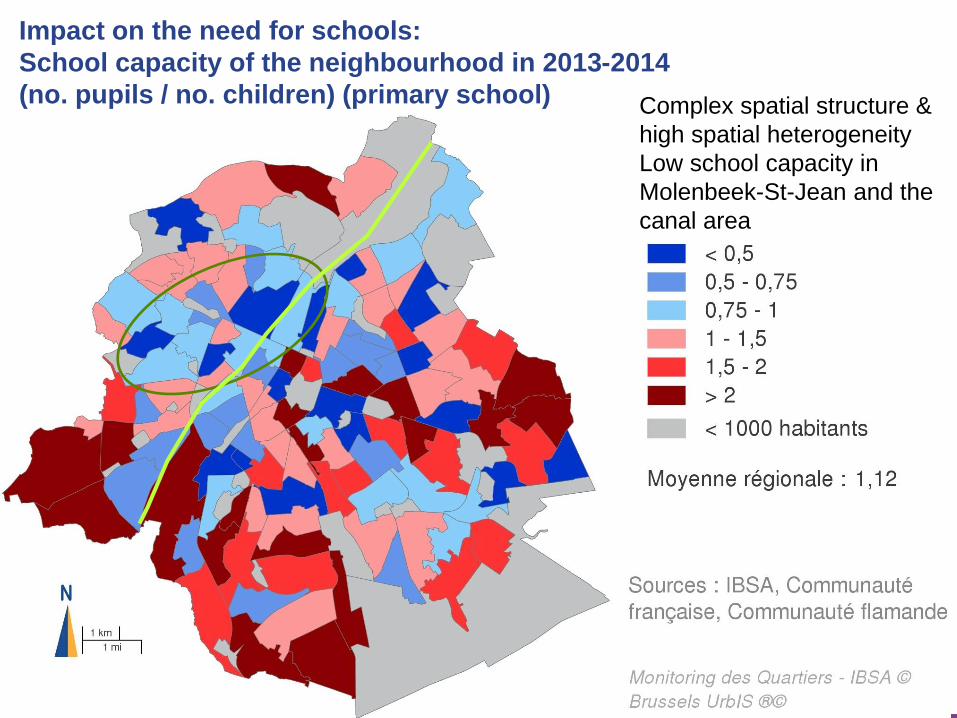
Impact on the need for schools:
School capacity of the neighbourhood in 2013-2014
(no. pupils / no. children) (primary school) Complex spatial structure &
high spatial heterogeneity
Low school capacity in
Molenbeek-St-Jean and the
canal area
19 novembre 2015 ‹N°› www.ibsa.irisnet.be
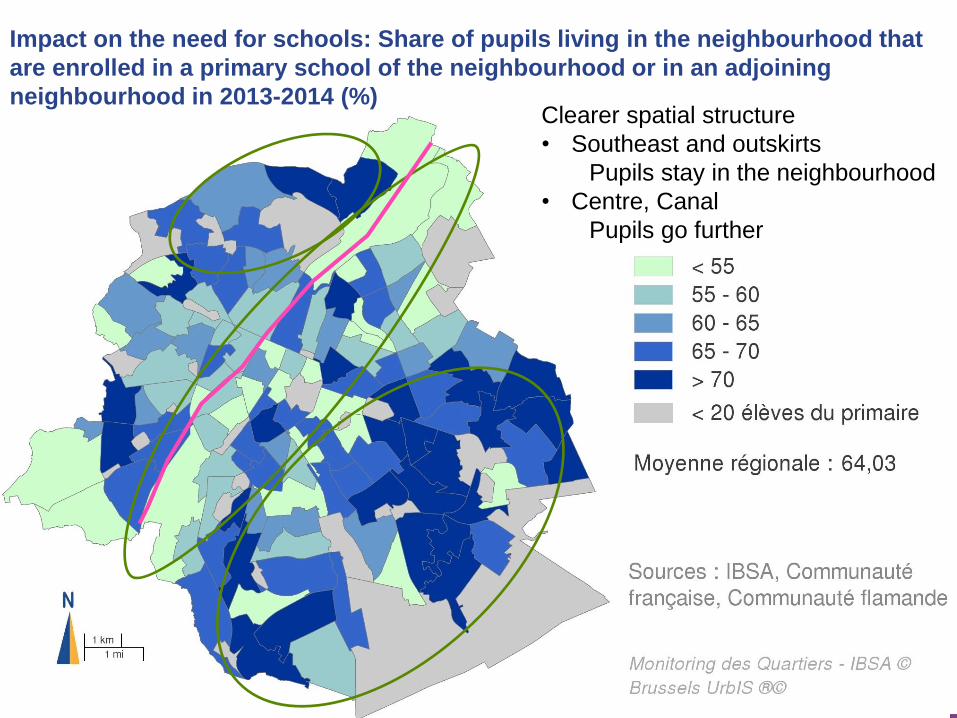
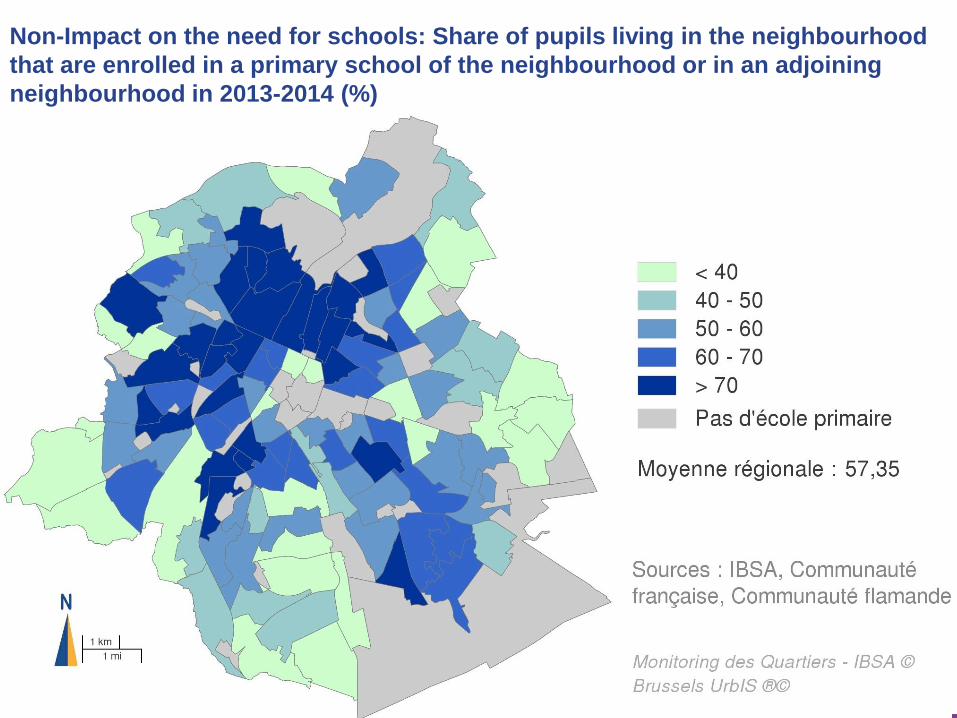
Impact on the need for schools: Share of pupils living in the neighbourhood that
are enrolled in a primary school of the neighbourhood or in an adjoining
neighbourhood in 2013-2014 (%) Clearer spatial structure
• Southeast and outskirts
Pupils stay in the neighbourhood
• Centre, Canal
Pupils go further
19 novembre 2015 ‹N°› www.ibsa.irisnet.be
The ‘Monitoring des Quartiers’ is a decision support tool
Particularly for the political decision makers and public institutions
The demographic boom and its consequences is intended to be an illustrative
example of the numerous possibilities of the tool
It allows to understand the infra-municipality realities
The municipality scale poorly grasps numerous city context
It compares various themes
It undergoes continuous development and improvements
We need your input/feedbacks
Conclusions
19 novembre 2015 ‹N°› www.ibsa.irisnet.be
Thank you for your attention … and suggestions!

19 novembre 2015 ‹N°› www.ibsa.irisnet.be
19 novembre 2015 ‹N°› www.ibsa.irisnet.be
Non-Impact on the need for schools: Share of pupils living in the neighbourhood
that are enrolled in a primary school of the neighbourhood or in an adjoining
neighbourhood in 2013-2014 (%)