Embed Size (px)
Citation preview
Direct ion de la recherche technolog ique Laborato i re d ’ Innovat ion pour les Technolog ies des Energ ies nouvel les et les Nanomatér iaux Département Elect r ic i té e t Hydrogène pour les Transports Laborato i re des Composants pour Pi le à combust ib le , Elec t ro lyse et Modél isat ion
Rapport technique DEHT-DR-10/052b
« NEXPEL Project » Next-generation PEM electrolyzer for sustainable hy drogen
production
WP3 “New binary/ternary catalyst systems” D3.1“Defined electrochemical test procedures for sc reening of catalyst activity”
Authors: Edel Sheridan (SINTEF), Magnus Thomassen (SINTEF), Nicolas Guillet (CEA)
Référence PRODEM 09.02727 Nature du rapport Final
WP3 “New binary/ternary catalyst systems” - Defined electrochemical test procedures for catalyst activ ity screening
Rapport technique DEHT-DR-10/052b Page 2/36
List of Project Contributors
Rapport complet à :
SINTEF E. Sheridan 1 ex. (NEXPEL e-room)
M. Thomassen
Fumatech T. Klicpera 1 ex. (NEXPEL e-room)
ISE Frauhnofer T. Smolika 1 ex. (NEXPEL e-room)
HELION P. Charril 1 ex. (NEXPEL e-room)
DEHT F. Mattera 1 ex. (Courriel)
Th. Priem 1 ex. (Courriel)
Secrétariat 1 ex. (Courriel)
DEHT/LCPEM O. Lemaire 1 ex. (Courriel)
J. Pauchet 1 ex. (Courriel)
N. Guillet 1 ex. (Papier)
Archivage papier Original + 1 ex.
Page de garde signée + résumé + Liste de diffusion à :
Chefs des autres départements du LITEN
Chefs des autres laboratoires du LITEN
Page de garde signée + résumé + Liste de diffusion + Bordereau d’envoi signé à :
Ingénieur Qualité LITEN : J-F. NOWAK
Bureau financier (Ventes) : M.POIRÉ
WP3 “New binary/ternary catalyst systems” - Defined electrochemical test procedures for catalyst activ ity screening
Rapport technique DEHT-DR-10/052b Page 3/36
Preface
This document was produced as part of work package 3 (WP3) of the NEXPEL project
(Next generation PEM electrolysers for sustainable hydrogen production), funded by the
European community’s Seventh Framework Porgramme (FP7/2007-2013) for the Fuel Cells
and Hydrogen Joint Technology Initiative under grant agreement no. 245262. WP3, “New
binary/ternary catalyst systems”, which is coordinated by SINTEF, is dedicated to the
development of new catalysts for oxygen and hydrogen evolution during water electrolysis.
Standardised test procedures have to be defined for electrochemical testing of the catalysts
developed in order to have comparable results from different partners.
Key Words
WATER ELECTROLYSIS, PEM ELECTROLYSER, NEXPEL, CATAL YST, TEST PROTOCOL
ÉLECTROLYSE DE L’EAU, ELECTROLYSE PEM, NEXPEL, CATA LYSEUR, PROTOCOLE DE
TEST
WP3 “New binary/ternary catalyst systems” - Defined electrochemical test procedures for catalyst activ ity screening
Rapport technique DEHT-DR-10/052b Page 4/36
I. INTRODUCTION .............................................................................................................................5
I.1 STANDARDISED DATA AND STATE OF THE ART COMPARISON OF WATER ELECTROLYSERS ...................6
I.2 TARGETED RESULTS WITHIN NEXPEL PROJECT..............................................................................6
II. THEORY OF ANALYTICAL TECHNIQUES.................... ...............................................................7
II.1 CYCLIC VOLTAMMETRY..............................................................................................................7
II.1.1 Cyclic Voltammetry of noble metal based materials ..........................................................7
II.1.2 Cyclic Voltammetry of oxides ...........................................................................................10
II.2 LINEAR SWEEP VOLTAMMETRY - POLARISATION CURVES...........................................................12
II.3 IMPEDANCE SPECTROSCOPY ...................................................................................................12
III. EXPERIMENTAL ....................................... ...................................................................................14
III.1 SAMPLE PREPARATION ............................................................................................................14
III.1.1 Catalyst layer preparation ............................................................................................14
III.2 THREE ELECTRODE CELL SETUP ...............................................................................................17
III.2.1 Flat electrode................................................................................................................17
III.2.2 Rotating ring – disc electrode.......................................................................................19
III.3 MEA TESTING DEVICES ...........................................................................................................20
III.3.1 Half cell setup...............................................................................................................20
III.3.2 Easy Test Cell ..............................................................................................................22
III.3.3 Pipetting method ..........................................................................................................24
III.3.4 Small size electrolysis cell............................................................................................25
IV. TESTING PROTOCOLS ...............................................................................................................26
IV.1 THREE ELECTRODE CELL SETUP ...............................................................................................26
IV.2 SAMPLE PREPARATION ............................................................................................................27
IV.2.1 Deposition of catalyst suspension................................................................................27
IV.2.2 Catalyst ink...................................................................................................................27
IV.2.3 MEA..............................................................................................................................27
IV.3 CHARACTERIZATION TECHNIQUES ............................................................................................28
IV.3.1 Cyclic voltammetry – Active surface Area....................................................................28
IV.3.2 Cyclic Voltammetry - Polarisation curves.....................................................................28
IV.4 IMPEDANCE SPECTROSCOPY MEASUREMENTS ..........................................................................31
IV.5 STABILITY CRITERIA (HALF CELL AND SINGLE CELL TESTS)..........................................................32
IV.6 POLARISATION CURVE (SINGLE CELL TESTS) .............................................................................33
V. REFERENCES ..............................................................................................................................35
WP3 “New binary/ternary catalyst systems” - Defined electrochemical test procedures for catalyst activ ity screening
Rapport technique DEHT-DR-10/052b Page 5/36
I. Introduction
This document was produced as part of WP3 of the NEXPEL project (Next generation PEM
electrolyser for sustainable hydrogen production), funded by European community (SP1-
JTI-FCH). WP3, coordinated by SINTEF, is dedicated to the development of new catalysts
for oxygen and hydrogen evolution during water electrolysis.
Standardised test procedures have to be defined for electrochemical testing of the catalysts
developed in order to have comparable results from different partners.
• The reaction occurring at the cathodic side of a PEM water electrolyser is expected
to be the reduction of protons (H+):
2H+ + 2e- H2 E0 H+/H2 = 0V vs. SHE
Catalysts used for this electrode are mainly composed of platinum (Pt) on a support
material. Platinum black or carbon supported platinum nanoparticles can be used. Platinum
loading on the support material is generally between 0.4 and 5mg Pt cm-2.
• At the anodic side, the water oxidation reaction is expected to be:
2H2O O2 + 4H+ + 4e- E0 O2/H2O = 1.23V vs. SHE
Due to the high potential and low pH conditions of the proton exchange membrane, only a
few metal oxides are stable enough to be used as catalysts at the anodic side of the
reaction. Iridium (Ir) and Ir based metal alloy oxides (with Ru, Ta, Sn…) are usually utilized
with loadings comprised of between 1 and 6mg IrO2 cm-2.
Due to the different conditions, devices and techniques used to evaluate the electrocatalytic
performance of the anodic and cathodic catalysts are not exactly the same. For example on
the anodic side, catalysts would have to be deposited on a support which does not oxidize
at high potentials, which could reach 1.5V vs. RHE or at high temperatures up to 80°C.
WP3 “New binary/ternary catalyst systems” - Defined electrochemical test procedures for catalyst activ ity screening
Rapport technique DEHT-DR-10/052b Page 6/36
I.1 Standardised data and state of the art comparis on of water electrolysers
Generally when comparing catalysts for water electrolysis a number of parameters are
considered including the catalyst activity in relation to surface area, the noble metal loading,
stability and durability over a range of applied electrical potentials and temperatures. The
testing of these parameters is usually carried out using a series of electrochemical
experiments which are complimented by physical characterisation techniques such as
transmission electron microscopy (TEM), Scanning electron microscopy (SEM) and X-ray
diffraction (XRD) which examines the structure and composition of the catalysts.
Often, the efficiency of the catalyst is reported in terms of the potential recorded at a
potential of 1 A cm-2 or alternatively as the current density (A cm-2) obtained at a specific
potential and operation temperature such as 1.8 V and 80°C.
I.2 Targeted results within NEXPEL project
- H2 evolution catalysts: Despite the development of supported noble metal catalysts
for PEM fuel cells little implementation of such catalysts has been seen for water
electrolysis. Generally Platinum Black has been used with a loading of up to 2 mg
cm-2. Within the Nexpel project it is expected to reduce Pt loading to 0.2 mg cm-2 by
using Pt on a support material such as carbon black or carbon nanofibers.
- O2 evolution catalysts: Nanocrystalline Ru or Ir metal / metal oxides in the form of
agglomerates with sizes of about 50nm are commonly used. Hence the active
material in its pure form is most probably not being used to its full potential. A
relatively high loading of up to 6 mg cm-2 of Ir or Ru eg Ir black is used. Supported Ir
or Ir oxide provides a cheaper alternative and the targeted loading within the Nexpel
project is 0.8 mg cm-2.
WP3 “New binary/ternary catalyst systems” - Defined electrochemical test procedures for catalyst activ ity screening
Rapport technique DEHT-DR-10/052b Page 7/36
II. Theory of Analytical Techniques
II.1 Cyclic Voltammetry
Cyclic voltammetry (CV) is one of the most useful analysis tools for investigating
electrocatalysts. The voltammogram is a current response to a potential sweep and gives
an electrochemical spectrum of the electrode surface, with information regarding the solid-
state redox transitions, active area and the electrode capacitance found. Normally, cyclic
voltammetry is performed by sweeping the potential between two potential limits at a
constant sweep rate (linear cyclic voltammetry).
Often cyclic voltammetry is used to study electrode reactions involving electroactive species
present in the electrolyte, but it is also extremely useful for following the adsorption of
species on the electrode (e.g. Hads or CO on Pt). Reversible adsorption processes are
characterised by the anodic and cathodic peaks being sharp and symmetrical with no
significant difference in the peak potentials. For irreversible adsorption processes, the
forward peak (i.e. adsorption of soluble species onto the electrode) becomes non-
symmetric and the reverse desorption peak does not occur. For quasi-reversible reactions,
there will be both peaks, however they will not be symmetric and there will be some
difference between the peak potentials.
II.1.1 Cyclic Voltammetry of noble metal based materials
Noble metals such as Pt, Pd and Au have well defined hydrogen adsorption and desorption
peaks seen upon cycling between suitable potential limits using the cyclic voltammetry
technique. Due to these defined peaks several values can be determined for the Pt based
catalysts. By analysis of the oxidation peaks a determination of the electroactive surface
area (EAS) of catalyst (m2.gcatalyst-1) can be determined.
The EAS areas can be calculated from the hydrogen desorption peak area and from the CO
stripping peak area.
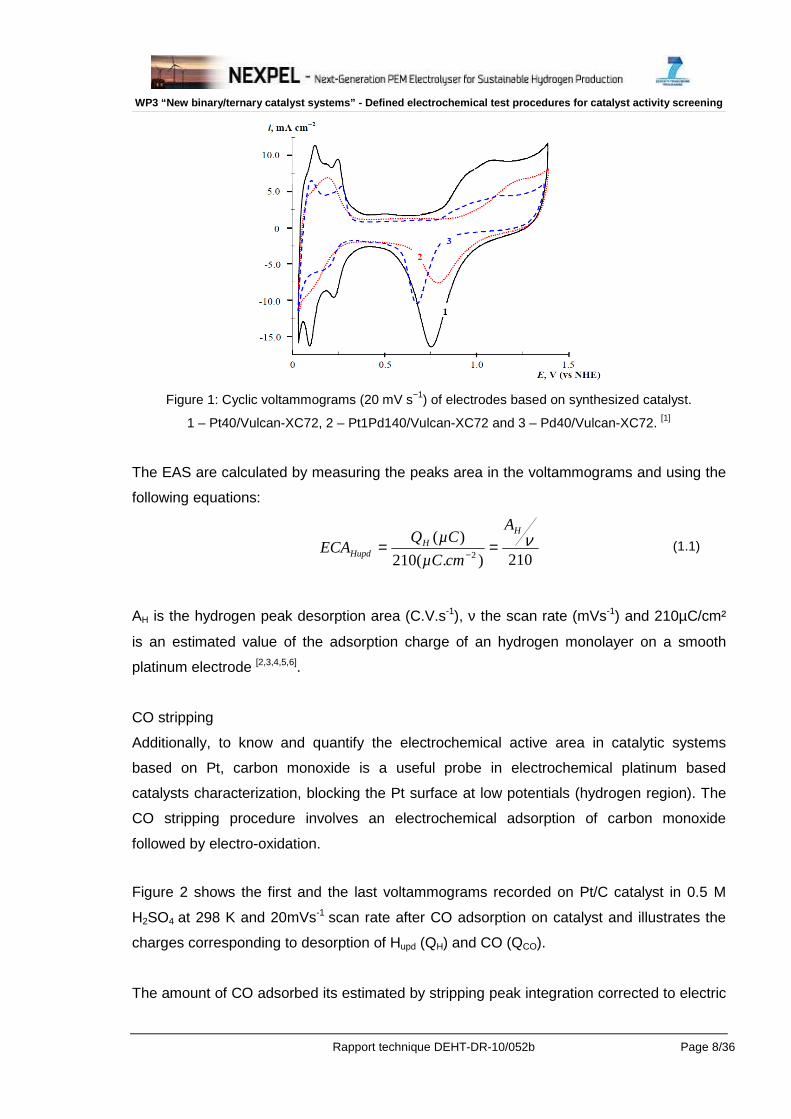
Figure 1 shows the cyclic voltammograms obtained in 1 M H2SO4 at 298 K and 20 mV.s-1
scan rate on Pt/C, PtPd/C and Pd/C catalysts [1].
WP3 “New binary/ternary catalyst systems” - Defined electrochemical test procedures for catalyst activ ity screening
Rapport technique DEHT-DR-10/052b Page 8/36
Figure 1: Cyclic voltammograms (20 mV s−1) of electrodes based on synthesized catalyst.
1 – Pt40/Vulcan-XC72, 2 – Pt1Pd140/Vulcan-XC72 and 3 – Pd40/Vulcan-XC72. [1]
The EAS are calculated by measuring the peaks area in the voltammograms and using the
following equations:
210).(210
)(2
νH
HHupd
A
cmµC
µCQECA == − (1.1)
AH is the hydrogen peak desorption area (C.V.s-1), ν the scan rate (mVs-1) and 210µC/cm²
is an estimated value of the adsorption charge of an hydrogen monolayer on a smooth
platinum electrode [2,3,4,5,6].
CO stripping
Additionally, to know and quantify the electrochemical active area in catalytic systems
based on Pt, carbon monoxide is a useful probe in electrochemical platinum based
catalysts characterization, blocking the Pt surface at low potentials (hydrogen region). The
CO stripping procedure involves an electrochemical adsorption of carbon monoxide
followed by electro-oxidation.
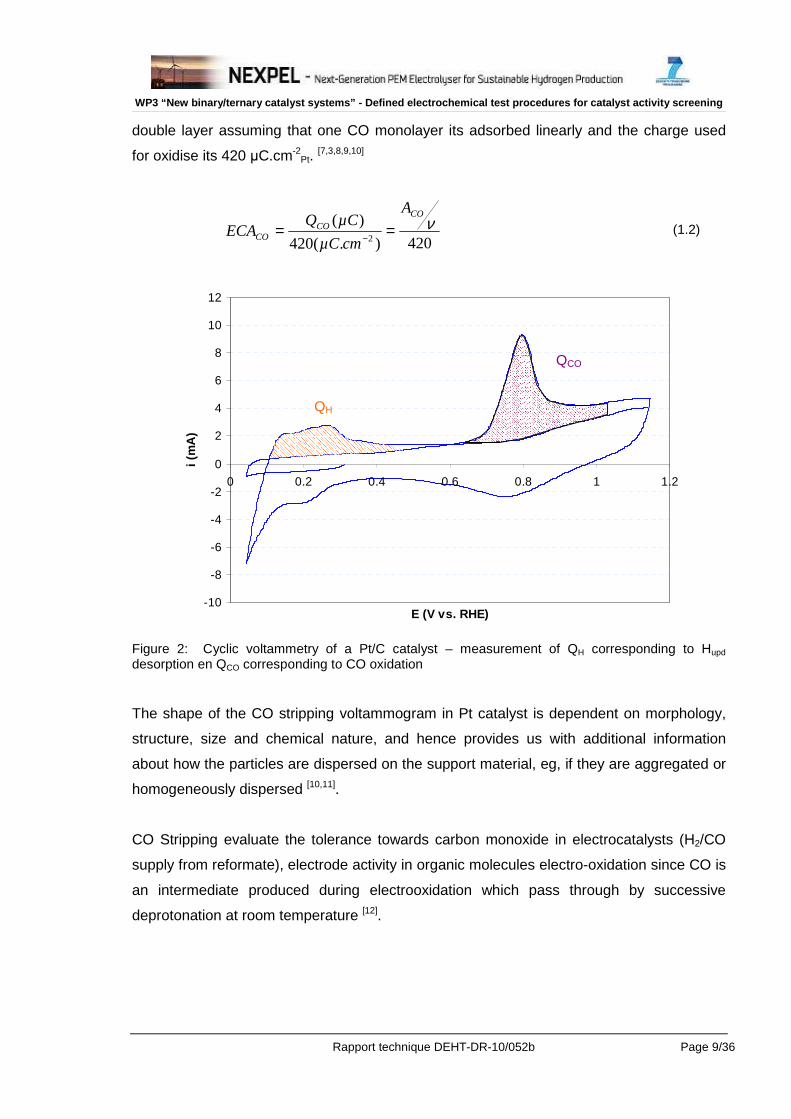
Figure 2 shows the first and the last voltammograms recorded on Pt/C catalyst in 0.5 M
H2SO4 at 298 K and 20mVs-1 scan rate after CO adsorption on catalyst and illustrates the
charges corresponding to desorption of Hupd (QH) and CO (QCO).
The amount of CO adsorbed its estimated by stripping peak integration corrected to electric
WP3 “New binary/ternary catalyst systems” - Defined electrochemical test procedures for catalyst activ ity screening
Rapport technique DEHT-DR-10/052b Page 9/36
double layer assuming that one CO monolayer its adsorbed linearly and the charge used
for oxidise its 420 µC.cm-2Pt.
[7,3,8,9,10]
420).(420
)(2
νCO
COCO
A
cmµC
µCQECA == − (1.2)
Figure 2: Cyclic voltammetry of a Pt/C catalyst – measurement of QH corresponding to Hupd desorption en QCO corresponding to CO oxidation
The shape of the CO stripping voltammogram in Pt catalyst is dependent on morphology,
structure, size and chemical nature, and hence provides us with additional information
about how the particles are dispersed on the support material, eg, if they are aggregated or
homogeneously dispersed [10,11].
CO Stripping evaluate the tolerance towards carbon monoxide in electrocatalysts (H2/CO
supply from reformate), electrode activity in organic molecules electro-oxidation since CO is
an intermediate produced during electrooxidation which pass through by successive
deprotonation at room temperature [12].
-10
-8
-6
-4
-2
0
2
4
6
8
10
12
0 0.2 0.4 0.6 0.8 1 1.2
E (V vs. RHE)
i (m
A)
QH
QCO
WP3 “New binary/ternary catalyst systems” - Defined electrochemical test procedures for catalyst activ ity screening
Rapport technique DEHT-DR-10/052b Page 10/36
II.1.2 Cyclic Voltammetry of oxides
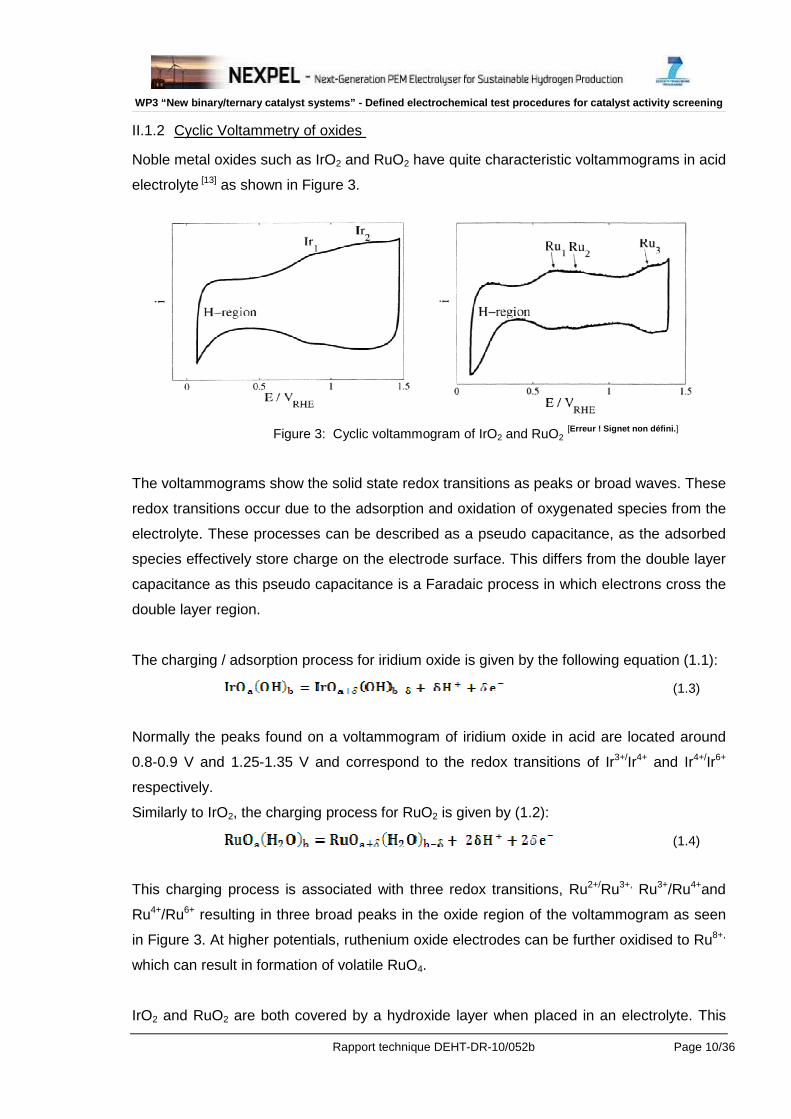
Noble metal oxides such as IrO2 and RuO2 have quite characteristic voltammograms in acid
electrolyte [13] as shown in Figure 3.
Figure 3: Cyclic voltammogram of IrO2 and RuO2
[Erreur ! Signet non défini. ]
The voltammograms show the solid state redox transitions as peaks or broad waves. These
redox transitions occur due to the adsorption and oxidation of oxygenated species from the
electrolyte. These processes can be described as a pseudo capacitance, as the adsorbed
species effectively store charge on the electrode surface. This differs from the double layer
capacitance as this pseudo capacitance is a Faradaic process in which electrons cross the
double layer region.
The charging / adsorption process for iridium oxide is given by the following equation (1.1):
(1.3)
Normally the peaks found on a voltammogram of iridium oxide in acid are located around
0.8-0.9 V and 1.25-1.35 V and correspond to the redox transitions of Ir3+/Ir4+ and Ir4+/Ir6+
respectively.
Similarly to IrO2, the charging process for RuO2 is given by (1.2):
(1.4)
This charging process is associated with three redox transitions, Ru2+/Ru3+, Ru3+/Ru4+and
Ru4+/Ru6+ resulting in three broad peaks in the oxide region of the voltammogram as seen
in Figure 3. At higher potentials, ruthenium oxide electrodes can be further oxidised to Ru8+,
which can result in formation of volatile RuO4.
IrO2 and RuO2 are both covered by a hydroxide layer when placed in an electrolyte. This
WP3 “New binary/ternary catalyst systems” - Defined electrochemical test procedures for catalyst activ ity screening
Rapport technique DEHT-DR-10/052b Page 11/36
hydroxide and lattice oxy groups enable the oxides to conduct protons via a “hopping” type
mechanism. This implies that under some circumstances, protons can penetrate into the
bulk of the oxide along crystal grain boundaries, pores, and defects, with the transport
limited by the diffusion at these interfaces. This observation gives rise to the “inner” and
“outer” surface area of the oxides
The ratio of Qa/Qc is used to examine the reversibility of the redox process. Qa and Qc are
attained by calculating the ratio of the charge between 0.15 and 1.15 VSCE of the forward
sweep and the reverse sweep respectively [14,15,16,17]. These calculations could show
changes in the reversibility during the charging process.
The voltamograms of noble metal oxides give vital information regarding the active area of
these materials. It has been shown that the charge associated with the oxide region
(normally 0.6-1.4 V) is directly proportional to the surface area or electrode roughness [18,20]
Furthermore, measuring the anodic charge (Qa) as a function of sweep rate (ν) can yield
interesting information regarding the morphology of the active surface19. By plotting 1/Qa
vs. ν0.5 and Qa vs. ν−0.5 and extrapolating the linear sections to the origin, the charge values
at ν = ∞ and ν=0 are found. At high sweep rates only the outer surface of the oxide material
takes part in the charging process, whereas at very low sweep rates the “inner” surface is
also accessible due to diffusion of protons through pores, cracks and grain boundaries in
the oxide material. The proton exchange between surface oxide-OH groups and the acid
electrolyte is considered to be rapid at “easily accessible” regions, whereas this exchange
has some diffusion limitations within the inner regions. Thus at ν=0 the charge is said to be
the total charge (Qt) and at ν = ∞ the charge gives the outer charge (Qo). The total charge
is the summation of the inner (Qi) and outer charge. The outer charge (Qo) is recognized as
representing the surface available for the electrochemical reactions and is thus a measure
of the active surface area of the catalyst under investigation.
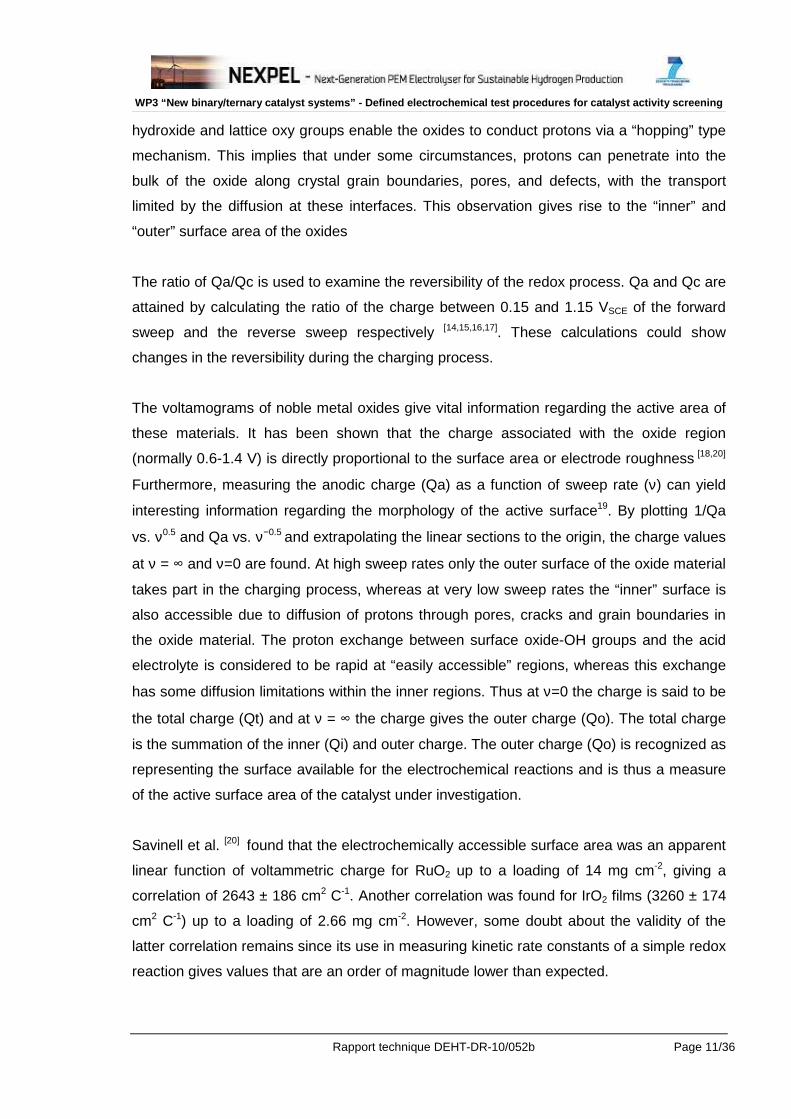
Savinell et al. [20] found that the electrochemically accessible surface area was an apparent
linear function of voltammetric charge for RuO2 up to a loading of 14 mg cm-2, giving a
correlation of 2643 ± 186 cm2 C-1. Another correlation was found for IrO2 films (3260 ± 174
cm2 C-1) up to a loading of 2.66 mg cm-2. However, some doubt about the validity of the
latter correlation remains since its use in measuring kinetic rate constants of a simple redox
reaction gives values that are an order of magnitude lower than expected.
WP3 “New binary/ternary catalyst systems” - Defined electrochemical test procedures for catalyst activ ity screening
Rapport technique DEHT-DR-10/052b Page 12/36
Figure 4: Voltammetric charge and electrochemically active (real) surface area correlated with loading for IrO2 and RuO2 on coated titanium electrodes. [20]
II.2 Linear Sweep Voltammetry - Polarisation curves
Linear Sweep Voltammetry examines the potential–current (E-I) relationship at the
electrode surface and can be carried out under either potentiostatic (controlled potential) or
galvanostatic (controlled current) conditions in which the response in the current or potential
is monitored. In order to obtain a steady state the scan is usually run very slowly typically 1
– 5 mV/s. The analysis of the polarisation curve can provide information concerning the
kinetics and the mechanism of the reaction at the catalyst in addition to providing a useful
tool to compare catalyst activity.
II.3 Impedance Spectroscopy
AC Impedance is a method used to examine the stability, kinetics, double layer capacitance
and other factors at the working electrode surface. Impedance measurements involve
applying a small sinusoidal perturbation which is superimposed over a fixed DC potential or
current at the electrode. The frequency of the sinusoidal perturbation is then varied over a
range of frequency from about 105 -10-1 Hz and the AC response of the electrode recorded.
AC Impedance in this work provides information concerning the ohmic resistance and the
electrochemical activity at the electrode and in the cell.
Experimental results are expressed as a real and imaginary part from the shift in phase.
These components are plotted on a vector diagram known as a “Nyquist” plot with the real
component (Z’) on the x-axis and the imaginary component (-Z’’) on the y-axis at each
measured frequency.

WP3 “New binary/ternary catalyst systems” - Defined electrochemical test procedures for catalyst activ ity screening
Rapport technique DEHT-DR-10/052b Page 13/36
To interpret electrochemical impedance spectrums, the electrochemical systems are often
represented as an equivalent electric circuit. These circuits are typically constructed of
resistors, capacitors and inductors. In addition other more complex elements are used to
interpret the theoretical and experimental data such as Warburg elements (which describe
diffusion processes) and constant phase elements (which describe porous or rough
electrodes).
WP3 “New binary/ternary catalyst systems” - Defined electrochemical test procedures for catalyst activ ity screening
Rapport technique DEHT-DR-10/052b Page 14/36
III. Experimental
III.1 Sample preparation
III.1.1 Catalyst layer preparation
The catalyst layer is composed of a catalyst powder (eg. 2.0 mg) set in suspension (eg.
1000 µl) in a solvent (eg. 20% isopropanol or ethanol in water). The catalyst may be
dispersed by placing it in an ultrasonic bath for ~3min. This suspension can be sprayed or
deposited on the flat electrode or the rotating disk electrode to fully cover it. In the case of
the RDE electrode, 20µl of the catalyst dispersion is taken out with a pipette and put on a
glassy carbon disk. After drying, a binder such as a dilute Nafion solution is then generally
added on the catalyst to avoid delamination of the catalyst during experimental
measurements. Alternatively the catalyst can also be set in suspension in a mixture of
solvent and Nafion binder. The support is then coated with an appropriate amount of this
mixture.
In most cases, the catalyst is mixed with deionised water, isopropanol and ionomer (Nafion
or others). The amount of ionomer can vary: 16wt% to 30wt% [21,22]. After sonication and/or
stirring, the obtained ink is dropped, painted or sprayed on a conductive substrate such as
glass carbon or gold of a ring disk electrode or on to the MEA electrode preparation[23,24].
Titanium-based substrates are typically used for anodic catalysts. They could be polished
and etched in concentred HCl at 80°C [20,25].
Catalyst layers are sometimes directly grown on the surface of a conductive substrate such
as titanium foil or sinter, directly [26,27] or after sand-blasting and etching into boiling 10%
oxalic acid [28] , boiling 37% HCl [29] or both [30,31].
Catalyst can also be electrodeposited on the surface of a conductive electrode (glassy
carbon, Au, Pt)[32] , ITO [33] or other conductive layers [34,35]
WP3 “New binary/ternary catalyst systems” - Defined electrochemical test procedures for catalyst activ ity screening
Rapport technique DEHT-DR-10/052b Page 15/36
III.1.2 MEA preparation
Initially the Nafion membrane is prepared using a standardised procedure as follows.
• Pre clean Nafion 115 membrane in boiling water for 15 minutes
• Boil in 3% H2O2 for 30 minutes
• Wash with distilled water
• Boil in 0.5M H2SO4 for 30 minutes
• Wash with distilled water
• Boil in distilled water for 15 minutes (three times)
• Store in distilled water until use
The catalyst powder is usually mixed with the Nafion ionomer in alcoholic solution
(5wt%[36,37], 10wt%[38,39], 15wt%[40], 20wt%[41], 25wt%[42], 30wt%[43,44], 33wt% Nafion
[45,46,47,48]), then sprayed or pipetted on to a point onto a Nafion (112 to 117) membrane by
spray, decal[38,37,49] or pipetting50 technique.
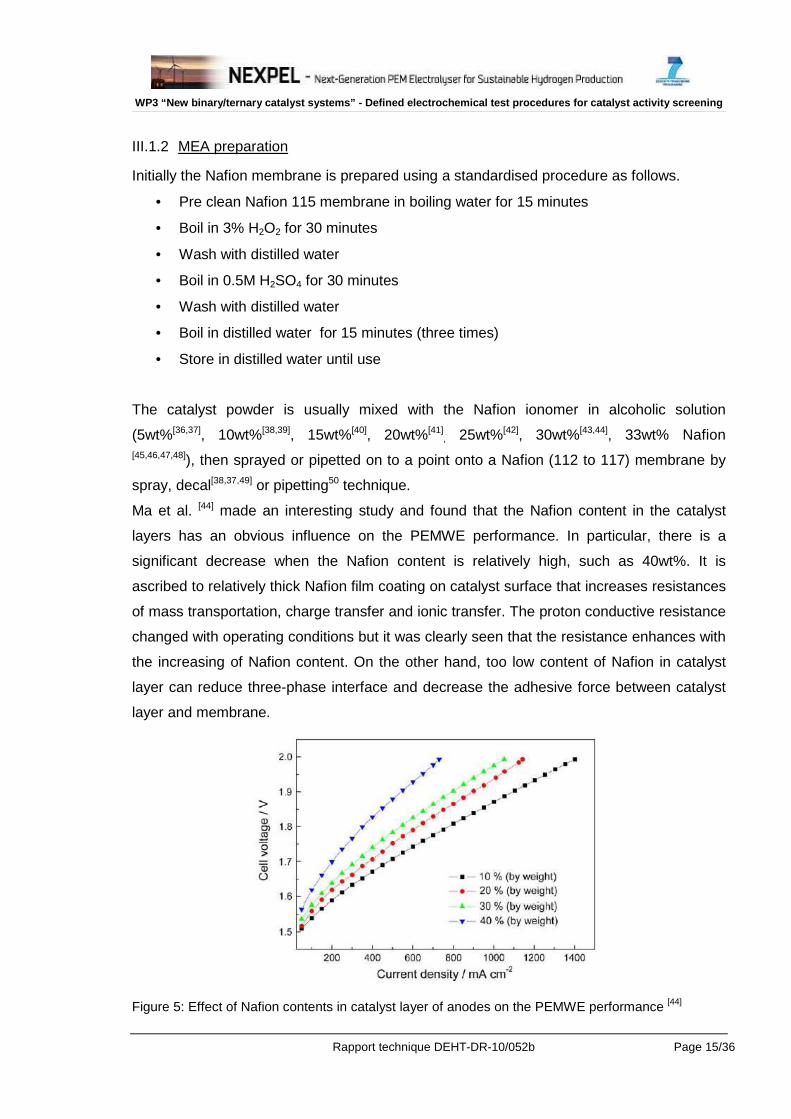
Ma et al. [44] made an interesting study and found that the Nafion content in the catalyst
layers has an obvious influence on the PEMWE performance. In particular, there is a
significant decrease when the Nafion content is relatively high, such as 40wt%. It is
ascribed to relatively thick Nafion film coating on catalyst surface that increases resistances
of mass transportation, charge transfer and ionic transfer. The proton conductive resistance
changed with operating conditions but it was clearly seen that the resistance enhances with
the increasing of Nafion content. On the other hand, too low content of Nafion in catalyst
layer can reduce three-phase interface and decrease the adhesive force between catalyst
layer and membrane.
Figure 5: Effect of Nafion contents in catalyst layer of anodes on the PEMWE performance [44]
WP3 “New binary/ternary catalyst systems” - Defined electrochemical test procedures for catalyst activ ity screening
Rapport technique DEHT-DR-10/052b Page 16/36
The low adhesive force will lead to an easy breaking away of the catalyst layers from the
surface of membrane. In order to ensure the stability of MEA, the best content of Nafion in
the anode was about 30wt%.
Pipetting method
• Make 2% Nafion solution using 1:1 nafion and iso-propanol
• Weigh out 12.5 mg of catalyst and add 250 µl of 2% nafion solution
• Ultrasonicate for 1h and then stir for 1h at 2000 rpm
• Dry prepared-Nafion membrane at 70°C for 1h
• Place membrane on a Teflon sheet on the hotplate at 95°C
• Add 20 µl of the catalyst ink to the membrane using pipette and leave to dry.
• Cure membrane in the oven at 80°C for 15 minutes
• Cut 5cm2 square of the E-Tek
• Put the E-Tek on opposite side of nafion and place between two Teflon sheets
• Hot press at 130°C for 60 seconds using 50 kg forc e (10kg/cm2)
WP3 “New binary/ternary catalyst systems” - Defined electrochemical test procedures for catalyst activ ity screening
Rapport technique DEHT-DR-10/052b Page 17/36
III.2 Three electrode cell setup
The three electrodes cell setup is the most common setup used in electrochemistry. It is
composed of a working electrode (WE) counter electrode (CE) and reference electrode
(REF) immersed in an electrolyte. The electrolyte is generally an aqueous solution of H2SO4
or HClO4. This type of cell is used for both the flat electrode experiments and with the
rotating ring disk electrode as will be described in the following section.
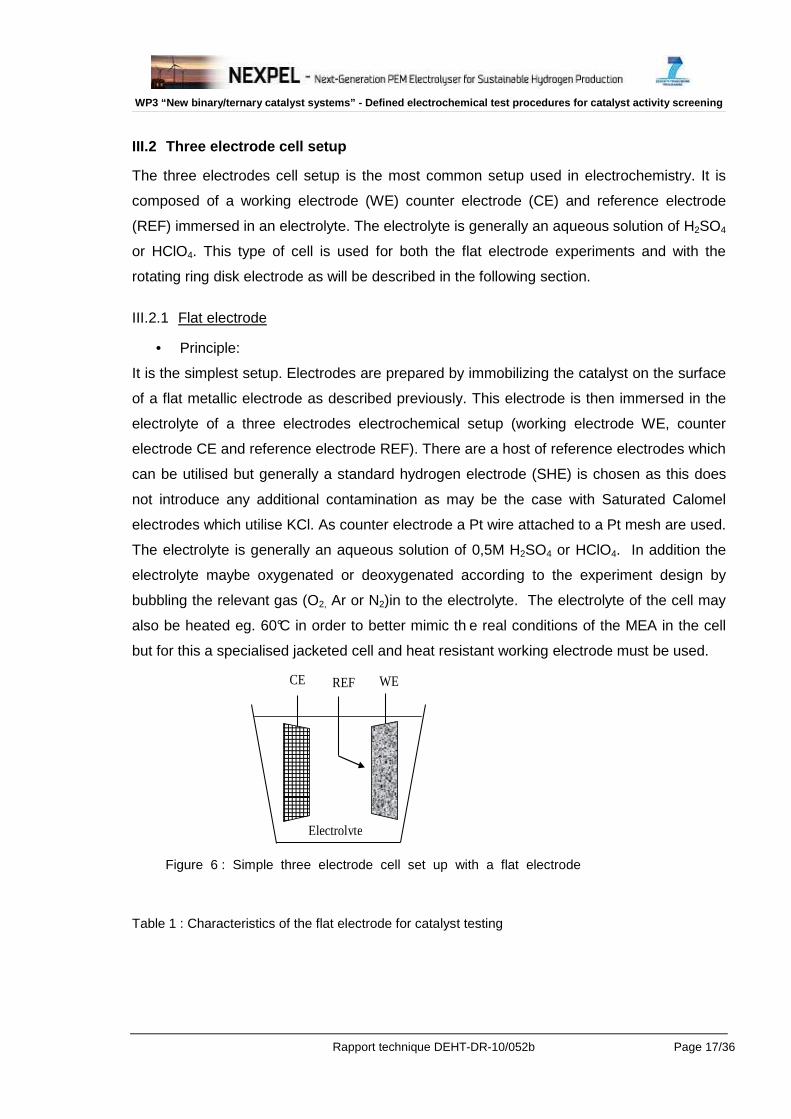
III.2.1 Flat electrode
• Principle:
It is the simplest setup. Electrodes are prepared by immobilizing the catalyst on the surface
of a flat metallic electrode as described previously. This electrode is then immersed in the
electrolyte of a three electrodes electrochemical setup (working electrode WE, counter
electrode CE and reference electrode REF). There are a host of reference electrodes which
can be utilised but generally a standard hydrogen electrode (SHE) is chosen as this does
not introduce any additional contamination as may be the case with Saturated Calomel
electrodes which utilise KCl. As counter electrode a Pt wire attached to a Pt mesh are used.
The electrolyte is generally an aqueous solution of 0,5M H2SO4 or HClO4. In addition the
electrolyte maybe oxygenated or deoxygenated according to the experiment design by
bubbling the relevant gas (O2, Ar or N2)in to the electrolyte. The electrolyte of the cell may
also be heated eg. 60°C in order to better mimic th e real conditions of the MEA in the cell
but for this a specialised jacketed cell and heat resistant working electrode must be used.
Table 1 : Characteristics of the flat electrode for catalyst testing
Figure 6 : Simple three electrode cell set up with a flat electrode
CE REF WE
Electrolyte
WP3 “New binary/ternary catalyst systems” - Defined electrochemical test procedures for catalyst activ ity screening
Rapport technique DEHT-DR-10/052b Page 18/36
Advantage Disadvantage
- easy to implement
- small amount of catalyst needed (depend on
the WE surface area)
- In the case of RDE experiment measurement of
the produced gas flow while cycling potential
- The electrode has to be stable through the
whole potential window of measurement (0 to
1.5V vs. RHE). Eg titanium or gold plate.
- Evacuation of produced gas
-Not necessarily representative of MEA
behaviour
WP3 “New binary/ternary catalyst systems” - Defined electrochemical test procedures for catalyst activ ity screening
Rapport technique DEHT-DR-10/052b Page 19/36
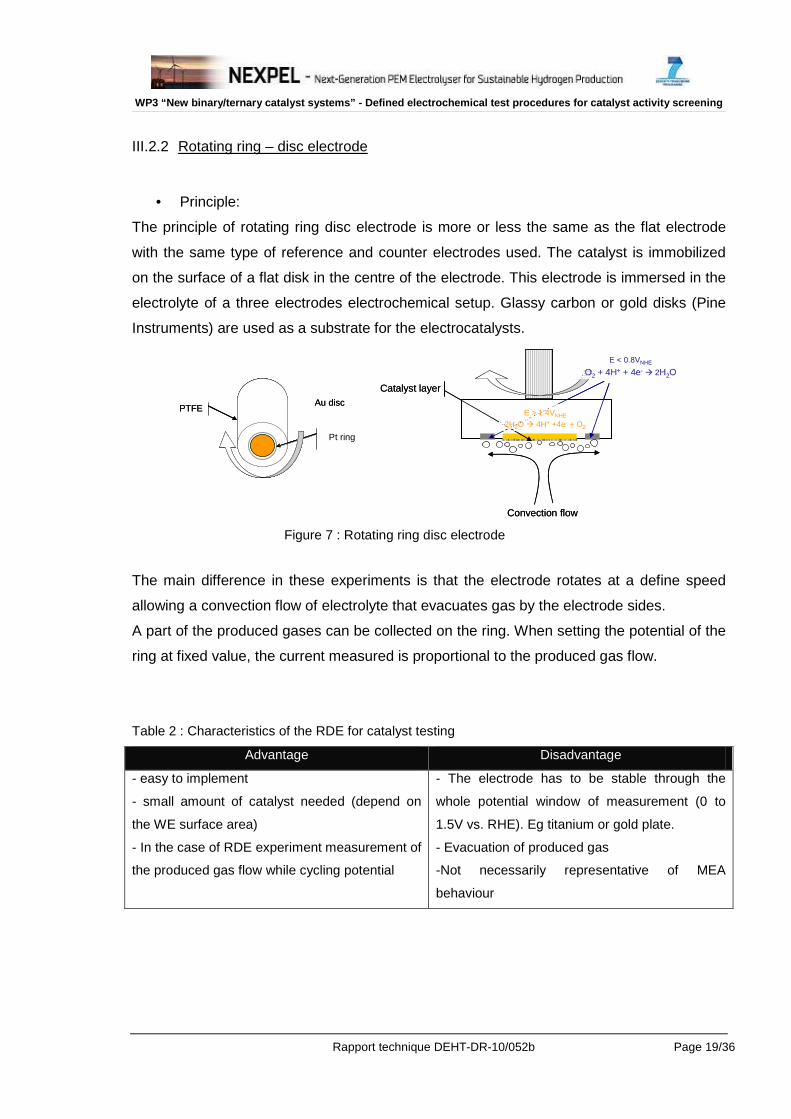
III.2.2 Rotating ring – disc electrode
• Principle:
The principle of rotating ring disc electrode is more or less the same as the flat electrode
with the same type of reference and counter electrodes used. The catalyst is immobilized
on the surface of a flat disk in the centre of the electrode. This electrode is immersed in the
electrolyte of a three electrodes electrochemical setup. Glassy carbon or gold disks (Pine
Instruments) are used as a substrate for the electrocatalysts.
The main difference in these experiments is that the electrode rotates at a define speed
allowing a convection flow of electrolyte that evacuates gas by the electrode sides.
A part of the produced gases can be collected on the ring. When setting the potential of the
ring at fixed value, the current measured is proportional to the produced gas flow.
Table 2 : Characteristics of the RDE for catalyst testing
Advantage Disadvantage
- easy to implement
- small amount of catalyst needed (depend on
the WE surface area)
- In the case of RDE experiment measurement of
the produced gas flow while cycling potential
- The electrode has to be stable through the
whole potential window of measurement (0 to
1.5V vs. RHE). Eg titanium or gold plate.
- Evacuation of produced gas
-Not necessarily representative of MEA
behaviour
Figure 7 : Rotating ring disc electrode
Convection flow
Catalyst layer
E > 1.4VNHE
2H2O 4H+ +4e- + O2
E < 0.8VNHE
O2 + 4H+ + 4e- 2H2O
Convection flow
Catalyst layer
E > 1.4VNHE
2H2O 4H+ +4e- + O2
E < 0.8VNHE
O2 + 4H+ + 4e- 2H2O
Pt ring
Au discPTFE
Pt ring
Au discPTFE
WP3 “New binary/ternary catalyst systems” - Defined electrochemical test procedures for catalyst activ ity screening
Rapport technique DEHT-DR-10/052b Page 20/36
III.3 MEA testing devices
Three different devices can be used to evaluate and compare the electrocatalytic
performance of the catalyst. Each device has got its advantages and disadvantages which
are presented and discussed below.
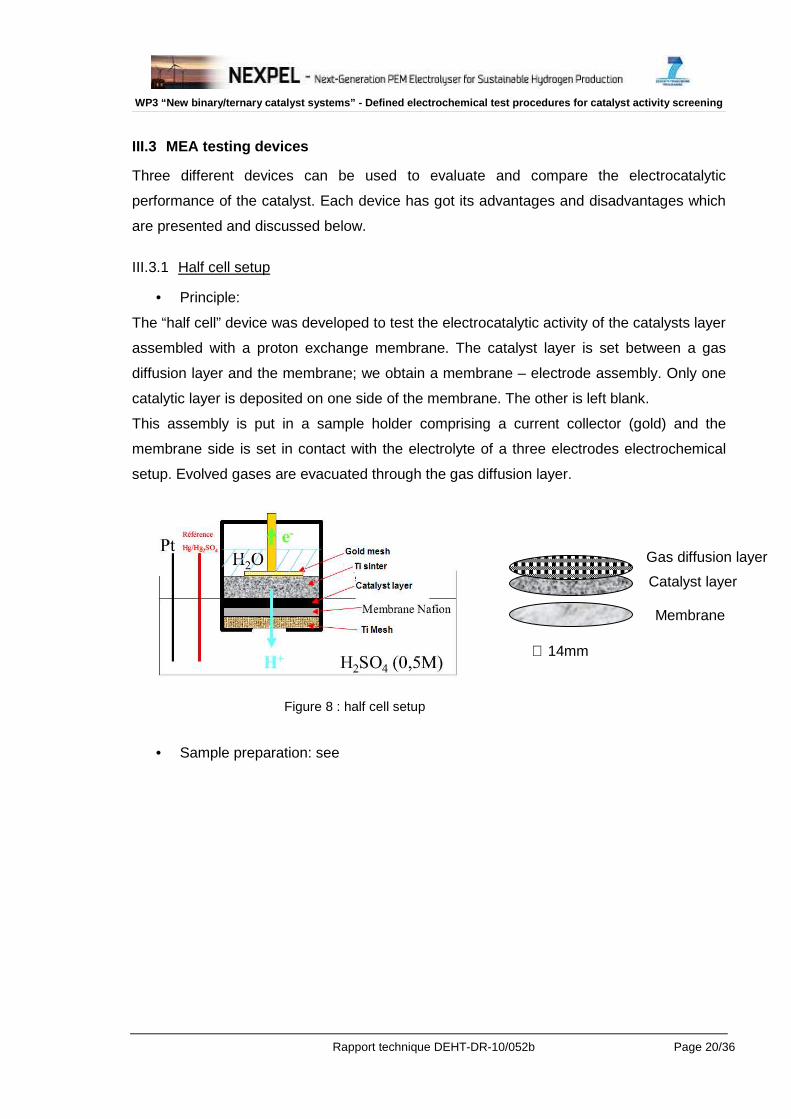
III.3.1 Half cell setup
• Principle:
The “half cell” device was developed to test the electrocatalytic activity of the catalysts layer
assembled with a proton exchange membrane. The catalyst layer is set between a gas
diffusion layer and the membrane; we obtain a membrane – electrode assembly. Only one
catalytic layer is deposited on one side of the membrane. The other is left blank.
This assembly is put in a sample holder comprising a current collector (gold) and the
membrane side is set in contact with the electrolyte of a three electrodes electrochemical
setup. Evolved gases are evacuated through the gas diffusion layer.
• Sample preparation: see
Figure 8 : half cell setup
Gas diffusion layer
Catalyst layer
Membrane
∅ 14mm
WP3 “New binary/ternary catalyst systems” - Defined electrochemical test procedures for catalyst activ ity screening
Rapport technique DEHT-DR-10/052b Page 21/36
MEA preparation, section III.1.1.
A suspension of catalyst in a mixture of solvent and binder is deposited on the membrane
(spray, knife coating, screenprinting, decal …) or on the gas diffusion layer. It is possible to
evaluate the influence of catalyst layer composition (amount of Nafion) and differences
relative to the deposition technique.
Table 3 : Characteristics of the half cell setup for catalyst testing
Advantage Disadvantage
- easy to implement
- small amount of catalyst needed
- representrative of MEA behavior
- High electrical resistance of electrolyte (few Ω
cm-2) leading to a limitation to low currents
densities
WP3 “New binary/ternary catalyst systems” - Defined electrochemical test procedures for catalyst activ ity screening
Rapport technique DEHT-DR-10/052b Page 22/36
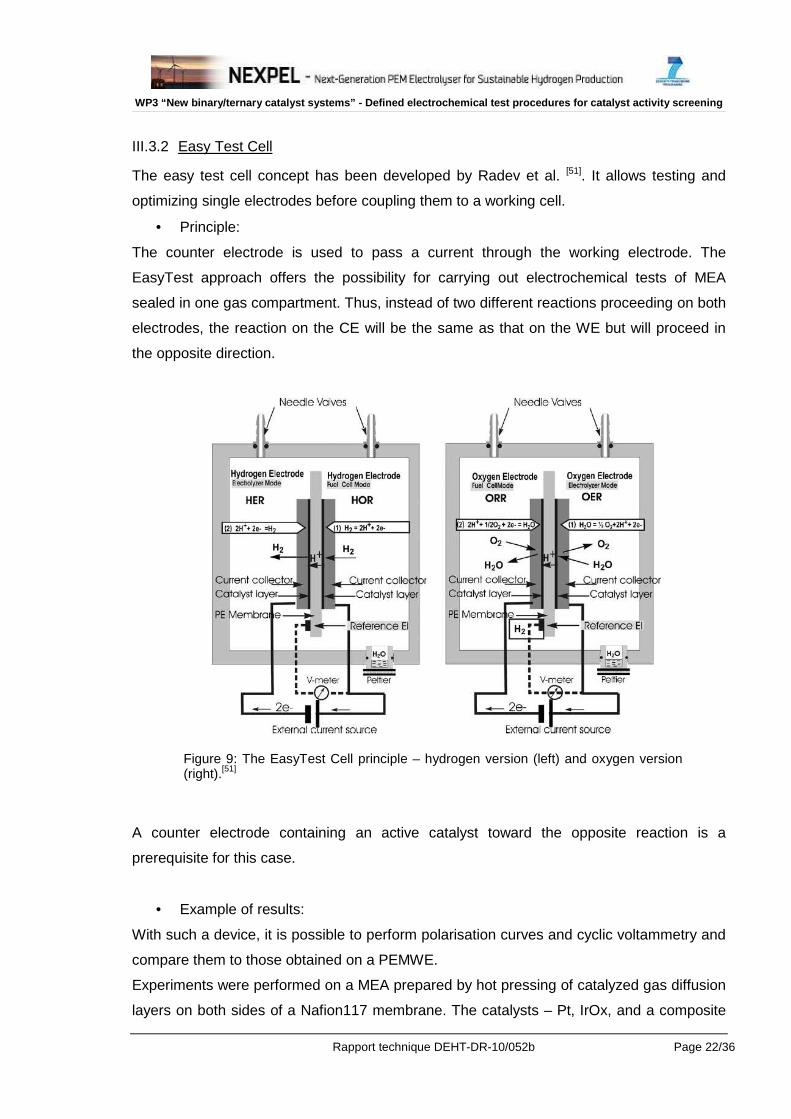
III.3.2 Easy Test Cell
The easy test cell concept has been developed by Radev et al. [51]. It allows testing and
optimizing single electrodes before coupling them to a working cell.
• Principle:
The counter electrode is used to pass a current through the working electrode. The
EasyTest approach offers the possibility for carrying out electrochemical tests of MEA
sealed in one gas compartment. Thus, instead of two different reactions proceeding on both
electrodes, the reaction on the CE will be the same as that on the WE but will proceed in
the opposite direction.
A counter electrode containing an active catalyst toward the opposite reaction is a
prerequisite for this case.
• Example of results:
With such a device, it is possible to perform polarisation curves and cyclic voltammetry and
compare them to those obtained on a PEMWE.
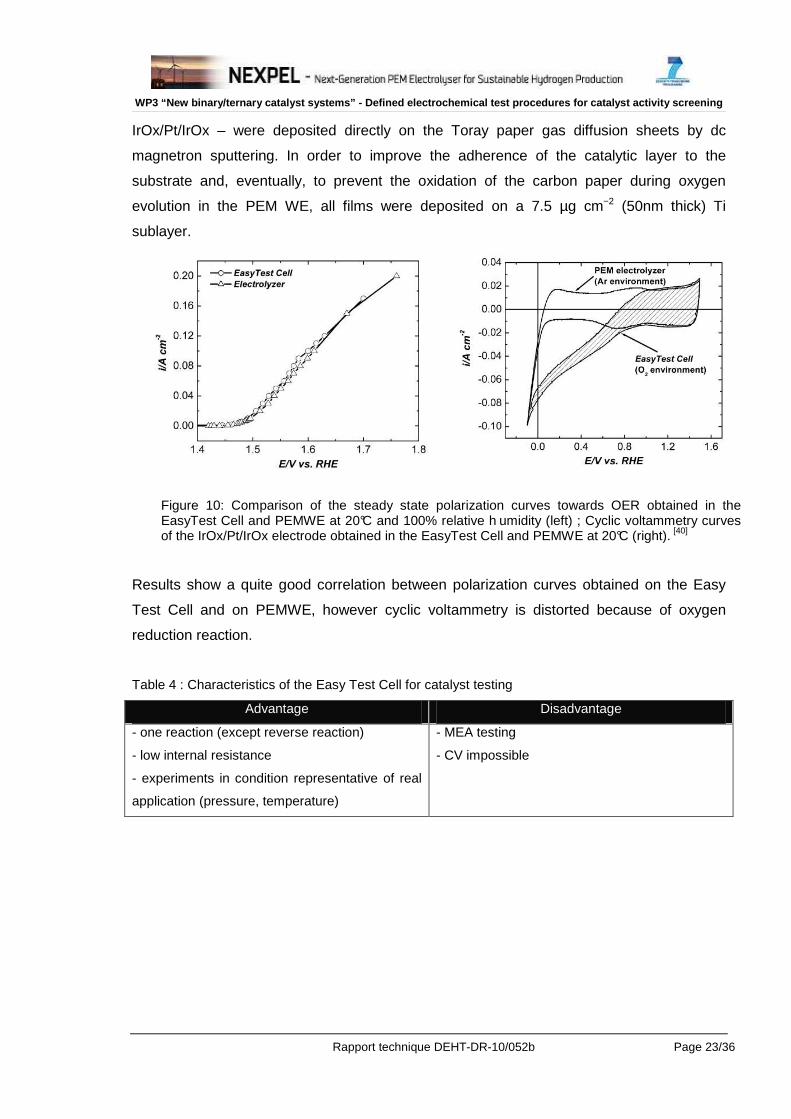
Experiments were performed on a MEA prepared by hot pressing of catalyzed gas diffusion
layers on both sides of a Nafion117 membrane. The catalysts – Pt, IrOx, and a composite
Figure 9: The EasyTest Cell principle – hydrogen version (left) and oxygen version (right).[51]
WP3 “New binary/ternary catalyst systems” - Defined electrochemical test procedures for catalyst activ ity screening
Rapport technique DEHT-DR-10/052b Page 23/36
IrOx/Pt/IrOx – were deposited directly on the Toray paper gas diffusion sheets by dc
magnetron sputtering. In order to improve the adherence of the catalytic layer to the
substrate and, eventually, to prevent the oxidation of the carbon paper during oxygen
evolution in the PEM WE, all films were deposited on a 7.5 µg cm−2 (50nm thick) Ti
sublayer.
Results show a quite good correlation between polarization curves obtained on the Easy
Test Cell and on PEMWE, however cyclic voltammetry is distorted because of oxygen
reduction reaction.
Table 4 : Characteristics of the Easy Test Cell for catalyst testing
Advantage Disadvantage
- one reaction (except reverse reaction)
- low internal resistance
- experiments in condition representative of real
application (pressure, temperature)
- MEA testing
- CV impossible
Figure 10: Comparison of the steady state polarization curves towards OER obtained in the EasyTest Cell and PEMWE at 20°C and 100% relative h umidity (left) ; Cyclic voltammetry curves of the IrOx/Pt/IrOx electrode obtained in the EasyTest Cell and PEMWE at 20°C (right). [40]
WP3 “New binary/ternary catalyst systems” - Defined electrochemical test procedures for catalyst activ ity screening
Rapport technique DEHT-DR-10/052b Page 24/36
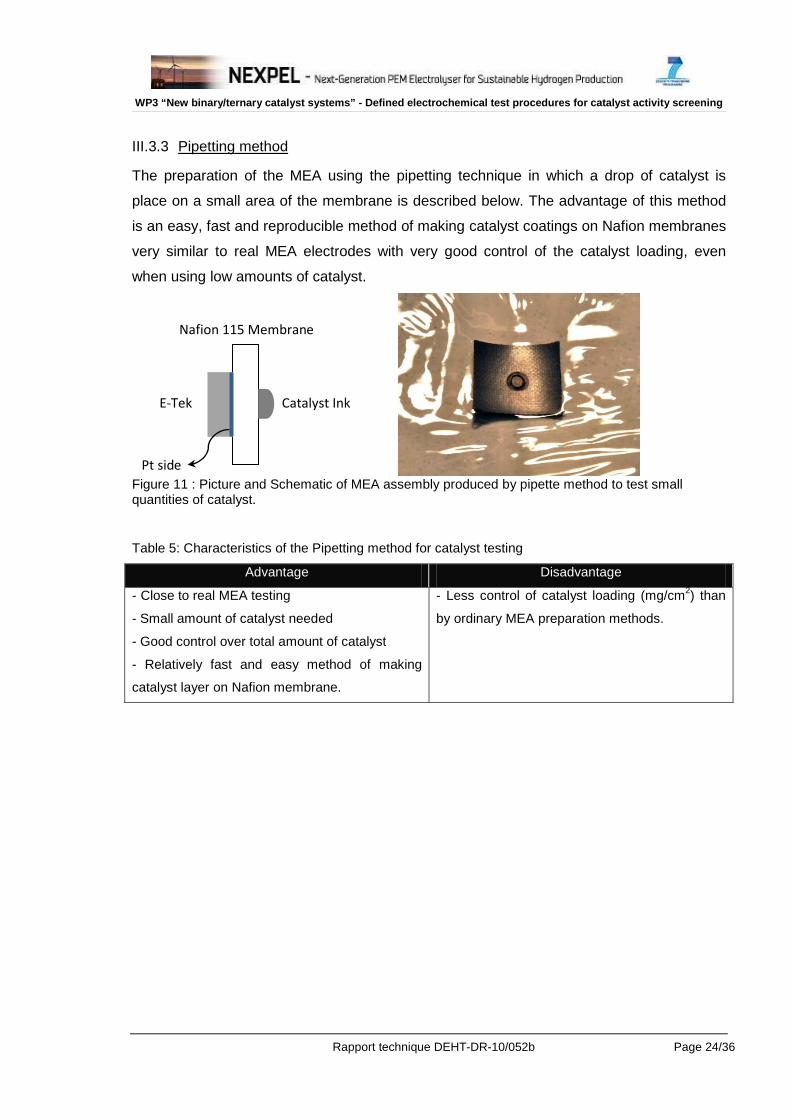
III.3.3 Pipetting method
The preparation of the MEA using the pipetting technique in which a drop of catalyst is
place on a small area of the membrane is described below. The advantage of this method
is an easy, fast and reproducible method of making catalyst coatings on Nafion membranes
very similar to real MEA electrodes with very good control of the catalyst loading, even
when using low amounts of catalyst.
E-Tek
Nafion 115 Membrane
Catalyst Ink
Pt side
Figure 11 : Picture and Schematic of MEA assembly produced by pipette method to test small quantities of catalyst.
Table 5: Characteristics of the Pipetting method for catalyst testing
Advantage Disadvantage
- Close to real MEA testing
- Small amount of catalyst needed
- Good control over total amount of catalyst
- Relatively fast and easy method of making
catalyst layer on Nafion membrane.
- Less control of catalyst loading (mg/cm2) than
by ordinary MEA preparation methods.
WP3 “New binary/ternary catalyst systems” - Defined electrochemical test procedures for catalyst activ ity screening
Rapport technique DEHT-DR-10/052b Page 25/36
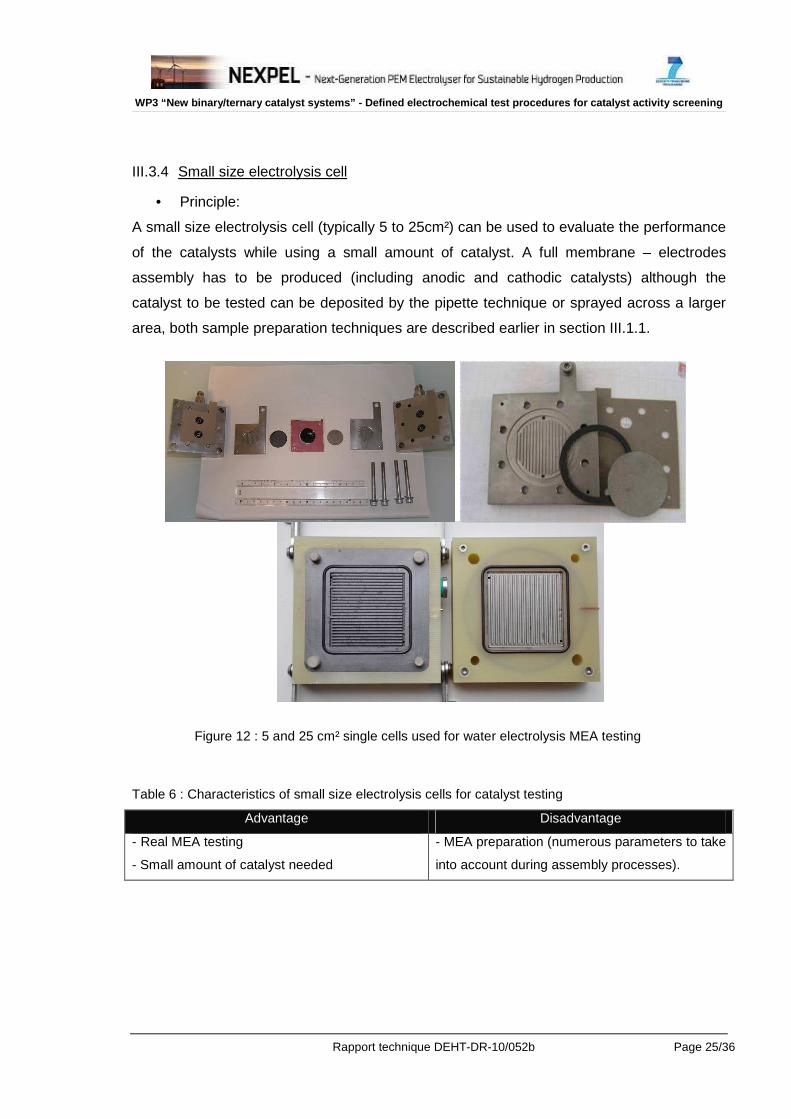
III.3.4 Small size electrolysis cell
• Principle:
A small size electrolysis cell (typically 5 to 25cm²) can be used to evaluate the performance
of the catalysts while using a small amount of catalyst. A full membrane – electrodes
assembly has to be produced (including anodic and cathodic catalysts) although the
catalyst to be tested can be deposited by the pipette technique or sprayed across a larger
area, both sample preparation techniques are described earlier in section III.1.1.
Table 6 : Characteristics of small size electrolysis cells for catalyst testing
Advantage Disadvantage
- Real MEA testing
- Small amount of catalyst needed
- MEA preparation (numerous parameters to take
into account during assembly processes).
Figure 12 : 5 and 25 cm² single cells used for water electrolysis MEA testing
WP3 “New binary/ternary catalyst systems” - Defined electrochemical test procedures for catalyst activ ity screening
Rapport technique DEHT-DR-10/052b Page 26/36
IV. Testing protocols
To compare the results of tests conducted by NEXPEL partners on catalysts and MEA, it is
necessary to harmonize the testing procedures and conditions under which these tests will
be conducted. The aim of this paper is to describe the main tests and propose a detailed
description of protocols.
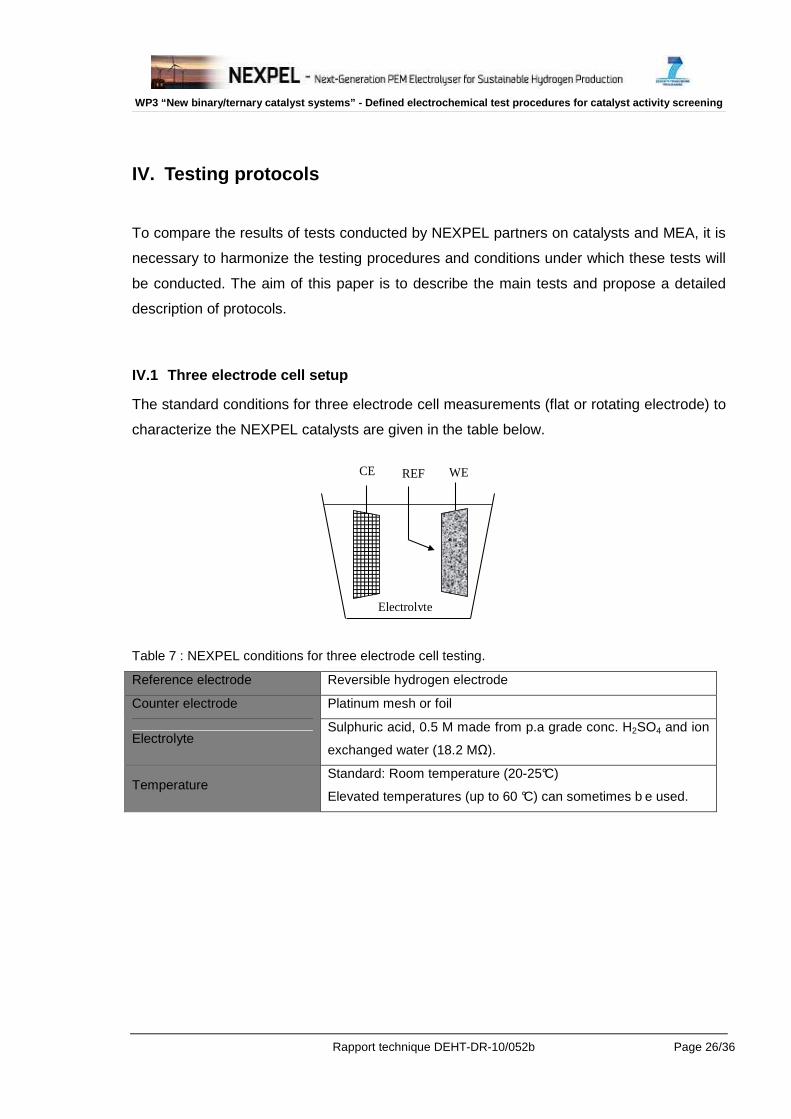
IV.1 Three electrode cell setup
The standard conditions for three electrode cell measurements (flat or rotating electrode) to
characterize the NEXPEL catalysts are given in the table below.
Table 7 : NEXPEL conditions for three electrode cell testing.
Reference electrode Reversible hydrogen electrode
Counter electrode Platinum mesh or foil
Electrolyte Sulphuric acid, 0.5 M made from p.a grade conc. H2SO4 and ion
exchanged water (18.2 MΩ).
Temperature Standard: Room temperature (20-25°C)
Elevated temperatures (up to 60 °C) can sometimes b e used.
CE REF WE
Electrolyte
WP3 “New binary/ternary catalyst systems” - Defined electrochemical test procedures for catalyst activ ity screening
Rapport technique DEHT-DR-10/052b Page 27/36
IV.2 Sample preparation
IV.2.1 Deposition of catalyst suspension
Aqueous suspensions of the catalyst materials are produced by ultrasonically dispersing
the appropriate amount of catalyst in a mixture of 20% isopropanol in water. The amount of
catalyst added is dependent on the loading of active material and also the density and
surface area of the support.
Typically a 20 µl aliquot of the suspension is pipetted onto the substrate. After evaporation
of the water under flowing nitrogen atmosphere, 20 µl of a diluted Nafion solution (1/100
5wt% Nafion in pure water) is added on the top of the dried catalyst powder.
IV.2.2 Catalyst ink
The catalyst suspension is obtained, dispersing the catalyst powder with deionised water,
isopropanol (20%) and Nafion (5wt% solution). Amount of ionomer for standard test is fixed
at 30wt% for both anodic and cathodic catalysts.
IV.2.3 MEA
Ink is obtained as previously described. (The powder of catalyst is usually mixed with
Nafion ionomer in alcohol solution. Standard electrodes are prepared by either pipetting or
spraying the catalyst ink onto a PTFE support then decal on Nafion 117 membrane by hot
pressing 135°C, 1Mpa for 3 minutes.
WP3 “New binary/ternary catalyst systems” - Defined electrochemical test procedures for catalyst activ ity screening
Rapport technique DEHT-DR-10/052b Page 28/36
IV.3 Characterization techniques
IV.3.1 Cyclic voltammetry – Active surface Area
For anodic catalysts, cyclic voltammetry would be performed between 0 and 1.4 V/RHE at
20 mV.s-1 under nitrogen bubbling.
The active surface area of the catalysts are evaluated by extrapolating the anodic charge
(Qa) to infinite sweep rate as described in section II.1.2.
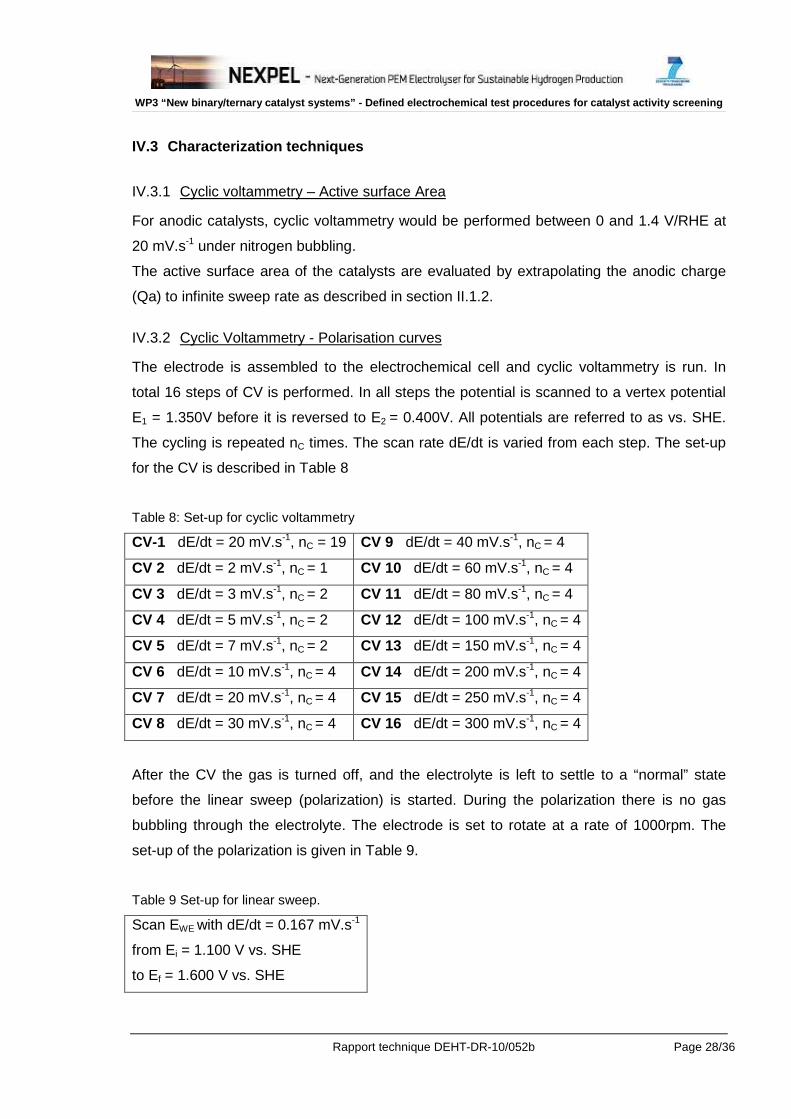
IV.3.2 Cyclic Voltammetry - Polarisation curves
The electrode is assembled to the electrochemical cell and cyclic voltammetry is run. In
total 16 steps of CV is performed. In all steps the potential is scanned to a vertex potential
E1 = 1.350V before it is reversed to E2 = 0.400V. All potentials are referred to as vs. SHE.
The cycling is repeated nC times. The scan rate dE/dt is varied from each step. The set-up
for the CV is described in Table 8
Table 8: Set-up for cyclic voltammetry
CV-1 dE/dt = 20 mV.s-1, nC = 19 CV 9 dE/dt = 40 mV.s-1, nC = 4
CV 2 dE/dt = 2 mV.s-1, nC = 1 CV 10 dE/dt = 60 mV.s-1, nC = 4
CV 3 dE/dt = 3 mV.s-1, nC = 2 CV 11 dE/dt = 80 mV.s-1, nC = 4
CV 4 dE/dt = 5 mV.s-1, nC = 2 CV 12 dE/dt = 100 mV.s-1, nC = 4
CV 5 dE/dt = 7 mV.s-1, nC = 2 CV 13 dE/dt = 150 mV.s-1, nC = 4
CV 6 dE/dt = 10 mV.s-1, nC = 4 CV 14 dE/dt = 200 mV.s-1, nC = 4
CV 7 dE/dt = 20 mV.s-1, nC = 4 CV 15 dE/dt = 250 mV.s-1, nC = 4
CV 8 dE/dt = 30 mV.s-1, nC = 4 CV 16 dE/dt = 300 mV.s-1, nC = 4
After the CV the gas is turned off, and the electrolyte is left to settle to a “normal” state
before the linear sweep (polarization) is started. During the polarization there is no gas
bubbling through the electrolyte. The electrode is set to rotate at a rate of 1000rpm. The
set-up of the polarization is given in Table 9.
Table 9 Set-up for linear sweep.
Scan EWE with dE/dt = 0.167 mV.s-1
from Ei = 1.100 V vs. SHE
to Ef = 1.600 V vs. SHE
WP3 “New binary/ternary catalyst systems” - Defined electrochemical test procedures for catalyst activ ity screening
Rapport technique DEHT-DR-10/052b Page 29/36
For anodic catalysts, cyclic voltammetry can be performed between 1.2 and 1.5 V vs. RHE
on rotating disk electrode and between 1.2 and 1.7 V vs. RHE on half-cell. Slow scanning
speeds (typically 1 mV.s-1 or 5 mV.s-1) are preferred to limit the effects related to capacitive
phenomena.
On rotating ring disc electrodes and half cells, the faradaic currents (If) are relatively low
and the contribution of capacitive current (Ic) cannot be neglected. One way to reduce the
capacitive effect is to reduce the scan speed to approach the steady state and limit the
effects related to phenomenon of "charge / discharge the double layer" and pseudo
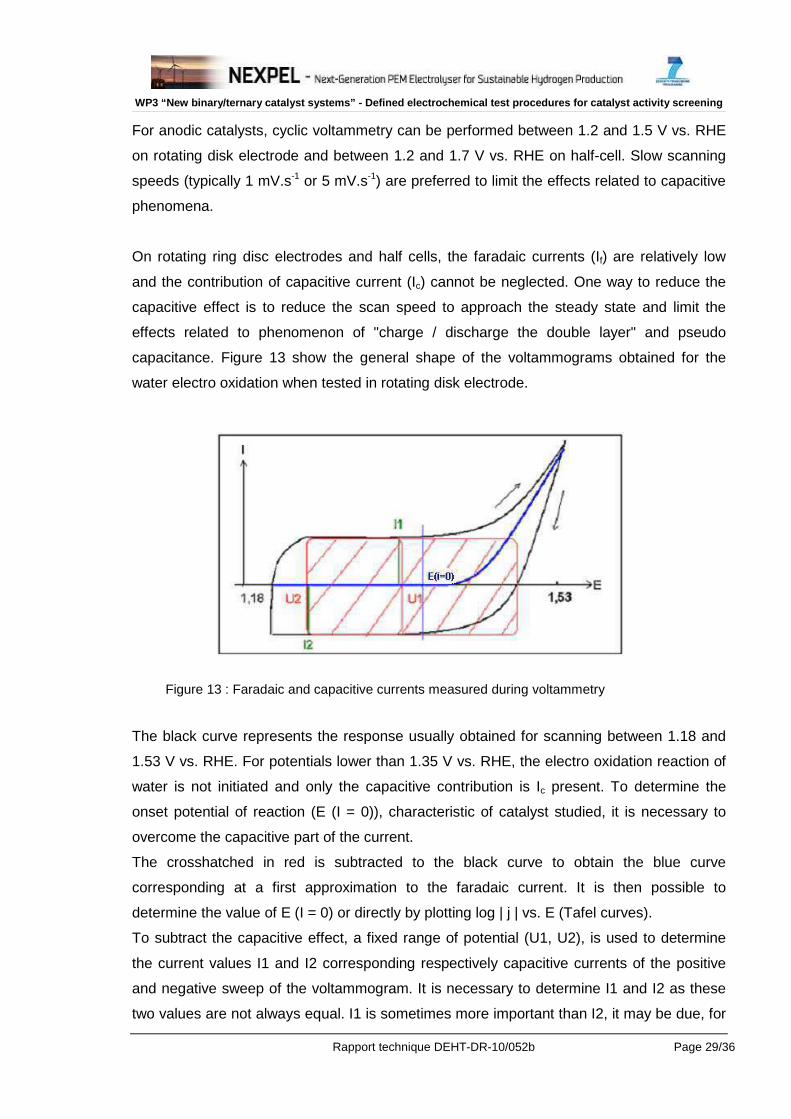
capacitance. Figure 13 show the general shape of the voltammograms obtained for the
water electro oxidation when tested in rotating disk electrode.
The black curve represents the response usually obtained for scanning between 1.18 and
1.53 V vs. RHE. For potentials lower than 1.35 V vs. RHE, the electro oxidation reaction of
water is not initiated and only the capacitive contribution is Ic present. To determine the
onset potential of reaction (E (I = 0)), characteristic of catalyst studied, it is necessary to
overcome the capacitive part of the current.
The crosshatched in red is subtracted to the black curve to obtain the blue curve
corresponding at a first approximation to the faradaic current. It is then possible to
determine the value of E (I = 0) or directly by plotting log | j | vs. E (Tafel curves).
To subtract the capacitive effect, a fixed range of potential (U1, U2), is used to determine
the current values I1 and I2 corresponding respectively capacitive currents of the positive
and negative sweep of the voltammogram. It is necessary to determine I1 and I2 as these
two values are not always equal. I1 is sometimes more important than I2, it may be due, for
Figure 13 : Faradaic and capacitive currents measured during voltammetry
WP3 “New binary/ternary catalyst systems” - Defined electrochemical test procedures for catalyst activ ity screening
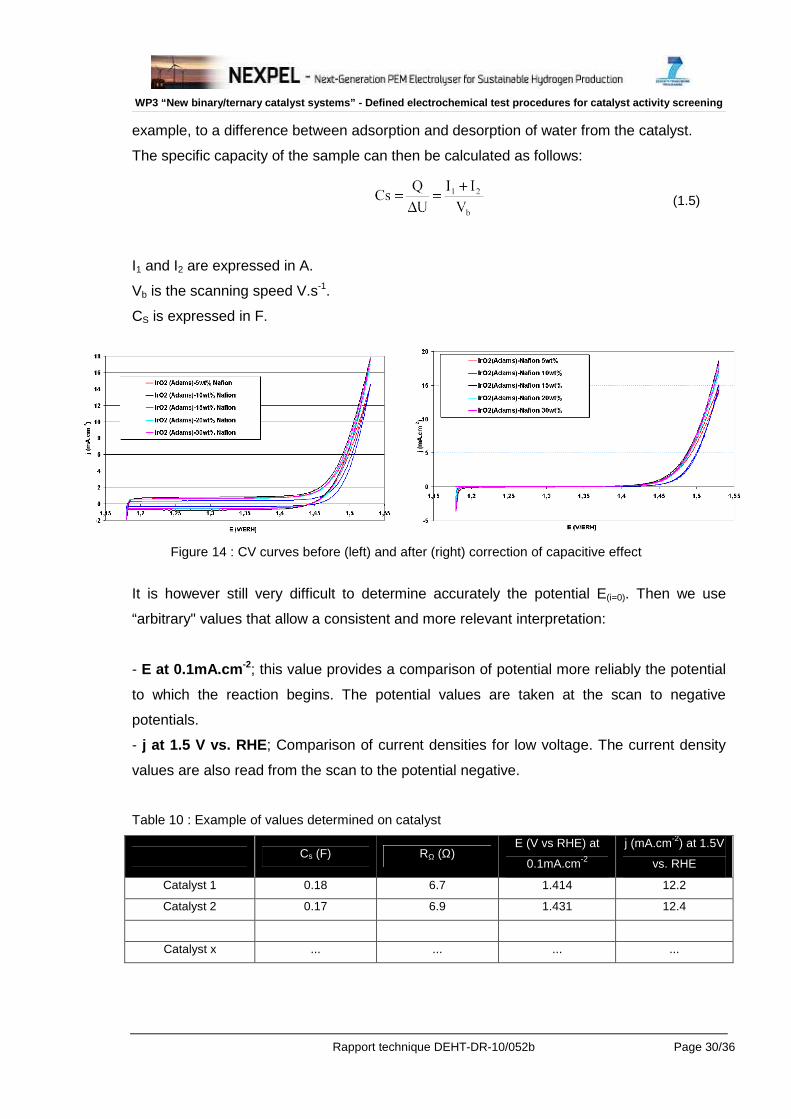
Rapport technique DEHT-DR-10/052b Page 30/36
example, to a difference between adsorption and desorption of water from the catalyst.
The specific capacity of the sample can then be calculated as follows:
(1.5)
I1 and I2 are expressed in A.
Vb is the scanning speed V.s-1.
CS is expressed in F.
It is however still very difficult to determine accurately the potential E(i=0). Then we use
“arbitrary" values that allow a consistent and more relevant interpretation:
- E at 0.1mA.cm -2; this value provides a comparison of potential more reliably the potential
to which the reaction begins. The potential values are taken at the scan to negative
potentials.
- j at 1.5 V vs. RHE ; Comparison of current densities for low voltage. The current density
values are also read from the scan to the potential negative.
Table 10 : Example of values determined on catalyst
Cs (F) RΩ (Ω)
E (V vs RHE) at
0.1mA.cm-2
j (mA.cm-2) at 1.5V
vs. RHE
Catalyst 1 0.18 6.7 1.414 12.2
Catalyst 2 0.17 6.9 1.431 12.4
Catalyst x ... ... ... ...
Figure 14 : CV curves before (left) and after (right) correction of capacitive effect
WP3 “New binary/ternary catalyst systems” - Defined electrochemical test procedures for catalyst activ ity screening
Rapport technique DEHT-DR-10/052b Page 31/36
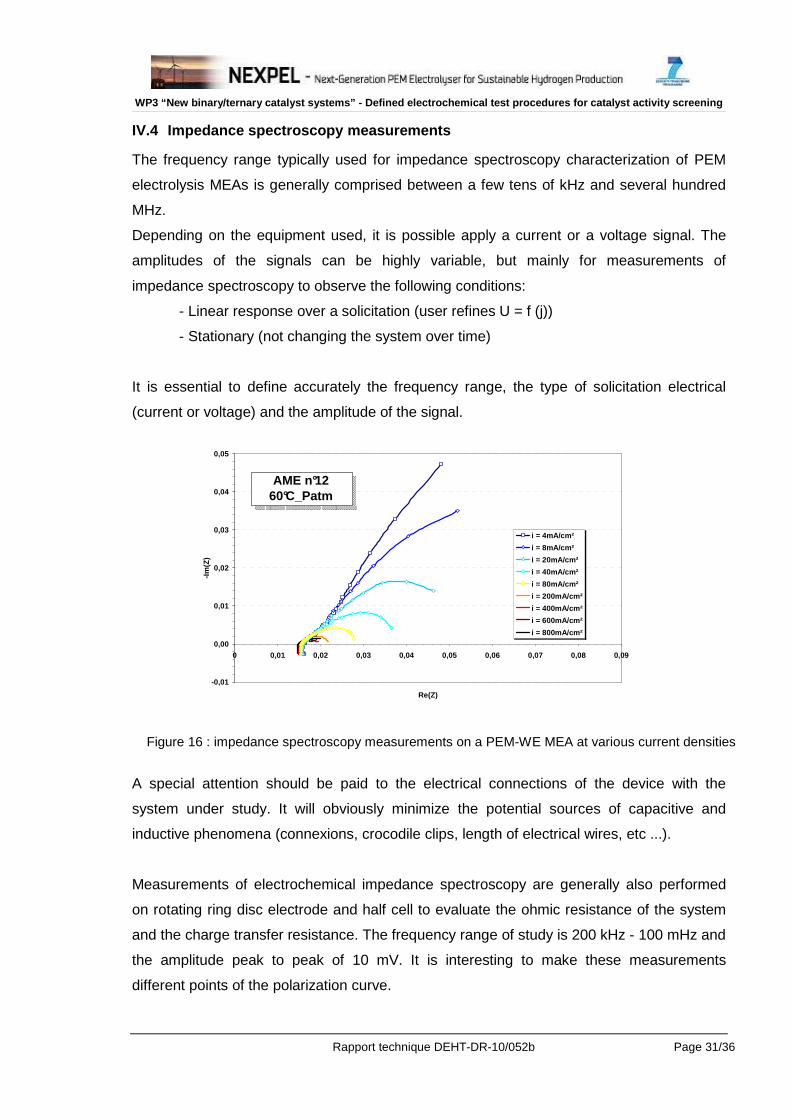
IV.4 Impedance spectroscopy measurements
The frequency range typically used for impedance spectroscopy characterization of PEM
electrolysis MEAs is generally comprised between a few tens of kHz and several hundred
MHz.
Depending on the equipment used, it is possible apply a current or a voltage signal. The
amplitudes of the signals can be highly variable, but mainly for measurements of
impedance spectroscopy to observe the following conditions:
- Linear response over a solicitation (user refines U = f (j))
- Stationary (not changing the system over time)
It is essential to define accurately the frequency range, the type of solicitation electrical
(current or voltage) and the amplitude of the signal.
-0,01
0,00
0,01
0,02
0,03
0,04
0,05
0 0,01 0,02 0,03 0,04 0,05 0,06 0,07 0,08 0,09
Re(Z)
-Im
(Z)
i = 4mA/cm²
i = 8mA/cm²
i = 20mA/cm²
i = 40mA/cm²
i = 80mA/cm²
i = 200mA/cm²
i = 400mA/cm²
i = 600mA/cm²
i = 800mA/cm²
AME n°1260°C_Patm
A special attention should be paid to the electrical connections of the device with the
system under study. It will obviously minimize the potential sources of capacitive and
inductive phenomena (connexions, crocodile clips, length of electrical wires, etc ...).
Measurements of electrochemical impedance spectroscopy are generally also performed
on rotating ring disc electrode and half cell to evaluate the ohmic resistance of the system
and the charge transfer resistance. The frequency range of study is 200 kHz - 100 mHz and
the amplitude peak to peak of 10 mV. It is interesting to make these measurements
different points of the polarization curve.
Figure 16 : impedance spectroscopy measurements on a PEM-WE MEA at various current densities
WP3 “New binary/ternary catalyst systems” - Defined electrochemical test procedures for catalyst activ ity screening
Rapport technique DEHT-DR-10/052b Page 32/36
IV.5 Stability criteria (half cell and single cell tests)
The stability conditions at an operating point should verify the following criteria:
1 - Stability of pressure (∆P <10% pressure) over a period of 2 minutes
2 - Stability of gas flow rates (∆Q <1% rate) over a period of 2 minutes
3 - Stability of the amount of hydrogen in oxygen and oxygen levels in hydrogen
(∆τ<0.1%)
4 - Stability of temperature (∆T<2°C) over a period of 2 minutes
5 - Voltage stability (∆U<5mV) over a period of 2 minutes
• Procedure:
- After applying a stabilized current density, observation of pressure, flow and
temperature variation versus time (2min).
- If the parameters are stable (∆P<10%, ∆Q<1%, ∆τ<0.1%, ∆T<2°C), the voltage is
considered stable when the voltage variation is less than ± 5mV/cellule on the period of
2 minutes.
- In case of oscillations, measure the oscillation frequency and the average value of at
least 3 periods. Voltage is considered stable when changing the voltage is below where
5mV/cell on the period of 2 minutes.
WP3 “New binary/ternary catalyst systems” - Defined electrochemical test procedures for catalyst activ ity screening
Rapport technique DEHT-DR-10/052b Page 33/36
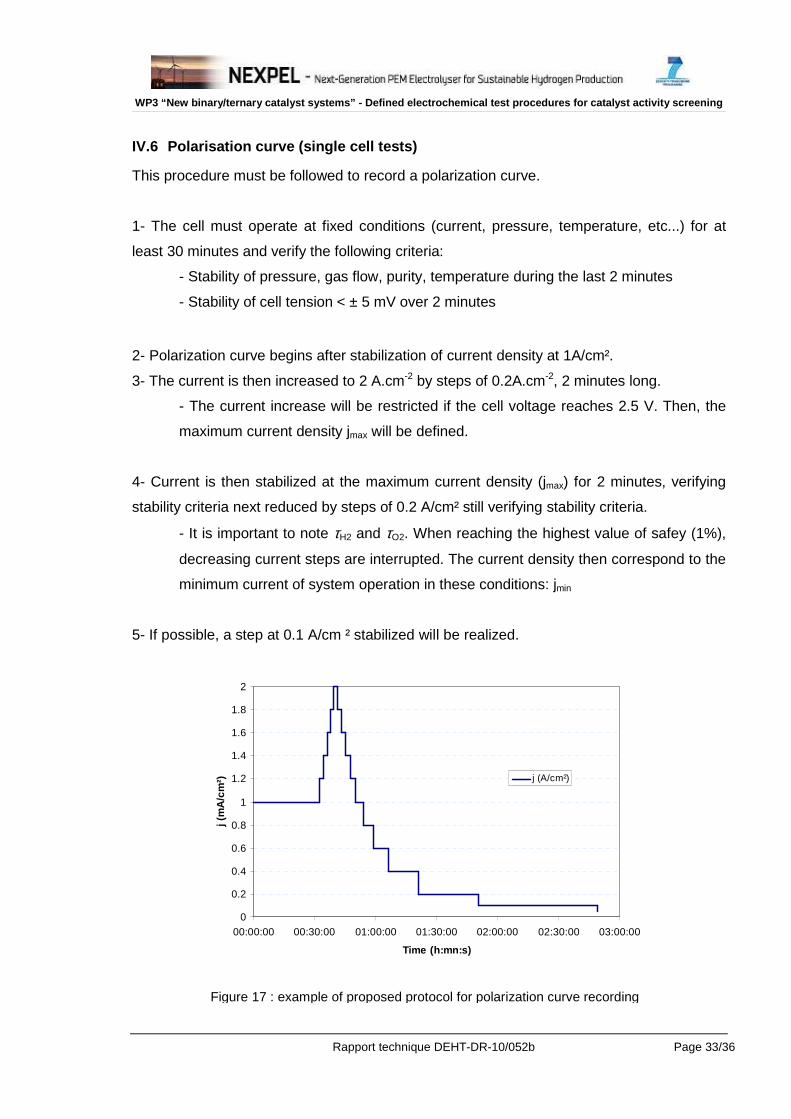
IV.6 Polarisation curve (single cell tests)
This procedure must be followed to record a polarization curve.
1- The cell must operate at fixed conditions (current, pressure, temperature, etc...) for at
least 30 minutes and verify the following criteria:
- Stability of pressure, gas flow, purity, temperature during the last 2 minutes
- Stability of cell tension < ± 5 mV over 2 minutes
2- Polarization curve begins after stabilization of current density at 1A/cm².
3- The current is then increased to 2 A.cm-2 by steps of 0.2A.cm-2, 2 minutes long.
- The current increase will be restricted if the cell voltage reaches 2.5 V. Then, the
maximum current density jmax will be defined.
4- Current is then stabilized at the maximum current density (jmax) for 2 minutes, verifying
stability criteria next reduced by steps of 0.2 A/cm² still verifying stability criteria.
- It is important to note τH2 and τO2. When reaching the highest value of safey (1%),
decreasing current steps are interrupted. The current density then correspond to the
minimum current of system operation in these conditions: jmin
5- If possible, a step at 0.1 A/cm ² stabilized will be realized.
0
0.2
0.4
0.6
0.8
1
1.2
1.4
1.6
1.8
2
00:00:00 00:30:00 01:00:00 01:30:00 02:00:00 02:30:00 03:00:00
Time (h:mn:s)
j (m
A/c
m²) j (A/cm²)
Figure 17 : example of proposed protocol for polarization curve recording
WP3 “New binary/ternary catalyst systems” - Defined electrochemical test procedures for catalyst activ ity screening
Rapport technique DEHT-DR-10/052b Page 34/36
1.4
1.5
1.6
1.7
1.8
1.9
2
2.1
0 0.5 1 1.5 2 2.5
j (A/cm²)
E (
V)
60°C
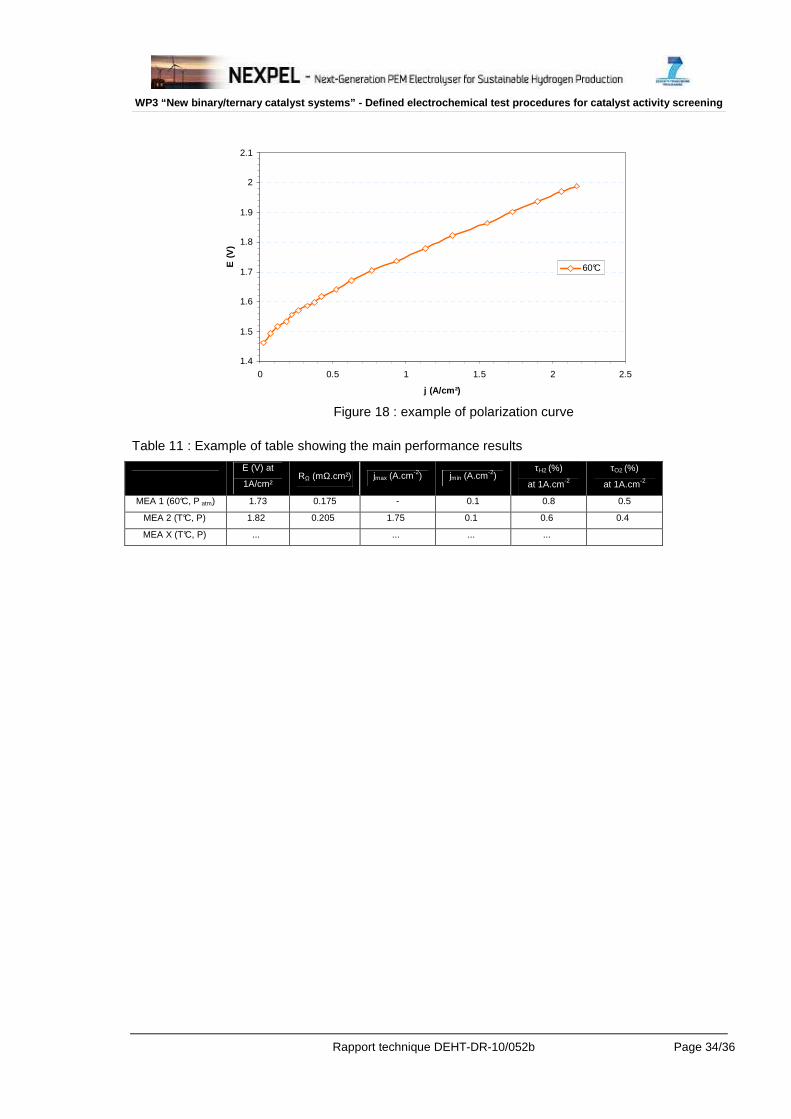
Table 11 : Example of table showing the main performance results
E (V) at
1A/cm² RΩ (mΩ.cm²) jmax (A.cm-2) jmin (A.cm-2)
τH2 (%)
at 1A.cm-2
τO2 (%)
at 1A.cm-2
MEA 1 (60°C, P atm) 1.73 0.175 - 0.1 0.8 0.5
MEA 2 (T°C, P) 1.82 0.205 1.75 0.1 0.6 0.4
MEA X (T°C, P) ... ... ... ...
Figure 18 : example of polarization curve
WP3 “New binary/ternary catalyst systems” - Defined electrochemical test procedures for catalyst activ ity screening
Rapport technique DEHT-DR-10/052b Page 35/36
V. References
1 S. Grigoriev et al. WHEC 16 / 13-16 june 2006 Lyon 2 J. Wu et al, International journal of hydrogen (2008), vol. 33, no6, pp. 1735-1746 3 T. Vidakovic et al. Electrochimica Acta 52 (2007) 5606-5613 4 A. Lasia Journal of Electroanalytical Chemistry 562 (2004) 23-31 5 A. Lasia, Journal of Electroanalytical Chemistry 593 (2006) 159-166 6 H. Ducnan Journal of Electranalytical Chemistry 621 (2008) 62-68 7 X. Xue et al.,Electrochimica Acta 50 (2005) 3470–3478 8 F. Maillard et al, Faraday Discuss. (2004), 125, 357-377 9 A. Pozio et al. Journal of Power Sources Volume 105, Issue 1, (2002) 13-19 10 F. Maillard et al. Journal of Electroanalytical Chemistry 599 (2007) 221-232 11 F. Delime et al. Journal of Applied Electrochemistry 28 (1998) 27-35 12 H. A. Gasteiger et al., Journal of Physical Chemistry, Vol. 97, No. 46, I993 13 K.A. Soliman et al., Electrochemistry Communications 11 (2009) 31–33 14 F. Mattos-Costa et al., Electrochimica Acta 44 (1998) 1515-1523 15 C.P. De Pauli et al. Journal of Electroanalytical Chemistry 396 (1995) 161-168 16 A. Marshall et al., Electrochimica Acta 51 (2006) 3161–3167 17 J. Gaudet et al. Chem. Mater., Vol. 17, No. 6 (2005) 1570-1579 18 L. Burke et al., J. Electroanal. Chem., 96 (1979) 19-27. 19 S. Ardizzone et al. Electrochimica Acta, 35 (1990), 263-267. 20 R.F. Savinell et al. J. Electrochem. Soc., Vol. 137, No. 2, (1990) 489-494 21 K.C. Neyerlin et al. Journal of The Electrochemical Society, 156 (3) (2009) B363-B369 22 R. Forgie et al. Electrochemical and Solid-State Letters, 13 (4) (2010) B36-B39 23 L.F. Petrik et al., Journal of Power Sources 185 (2008) 838–845 24 A.T. Marshall, Electrochimica Acta 55 (2010) 1978–1984 25 X. Cui et al., Materials Chemistry and Physics 113 (2009) 314–321 26 R. Balaji et al., Electrochemistry Communications 11 (2009) 1700–1702 27 P. Millet et al. Int. Journal of Hydrogen Energy 35 (2010) 5043 28 X.-M. Wang et al., Electrochimica Acta 55 (2010) 4587–4593 29 F. Ye et al. Int. Journal of Hydrogen Energy 35 (2010) 8049 30 C.R. Costa et al., Journal of Hazardous Materials 153 (2008) 616–627 31 D. Profeti et al. J Appl Electrochem 38 (2008) 837–843 32 A.M. Mohammad et al., Electrochimica Acta 53 (2008) 4351–4358 33 M. Yagi et al. J. Phys. Chem. B, Vol. 109, No. 46, (2005) 21489-21491 34 S. Tong et al.,Chinese Journal of Chemical Engineering, 16(6) (2008) 885-889 35 A. Habibi et al. Int. Journal of Hydrogen Energy 33 (2008) 2668 36 A. Marshall et al., Energy 32 (2007) 431–436

WP3 “New binary/ternary catalyst systems” - Defined electrochemical test procedures for catalyst activ ity screening
Rapport technique DEHT-DR-10/052b Page 36/36
37 U. Wittstadt et al., Journal of Power Sources 145 (2005) 555–562 38 G. Wei et al. Int. Journal of Hydrogen Energy 35 (2010) 3951 39 A.T. Marshall et al., Int. Journal of Hydrogen Energy 33 (2008) 4649 40 S. Grigoriev et al., Int. Journal of Hydrogen Energy 34 (2009) 4968 41 E. Rasten et al., Electrochimica Acta 48 (2003) 3945-3952 42 S. Song et al., Electrochemistry Communications 8 (2006) 399–405 43 S. Song et al. Int. Journal of Hydrogen Energy 33 (2008) 4955– 4961 44 L. Ma et al., Int. Journal of Hydrogen Energy 34 (2009) 678 45 S. Siracusano et al., Electrochimica Acta 54 (2009) 6292–6299 46 S. siracusano et al., Int. Journal of Hydrogen Energy 35 (2010)5558-5568 47 V. Antonucci et al., Electrochimica Acta 53 (2008) 7350–7356 48 S. Zhigang et al., Journal of Power Sources 79 (1999) 82–85 49 T. Ioroi et al., Journal of Power Sources 112 (2002) 583–587 50 K. Wikander et al., Electrochimica Acta 54 (2009) 6848-6855 51 I. Radev et al., Electrochimica Acta 54 (2009) 1269–1276