Embed Size (px)
Citation preview
1
SUPPLEMENTARY INFORMATION for:
A unique self-organization of bacterial sub-communities creates iridescence in Cellulophaga
lytica colony biofilms
Betty Kientza,#, Stephen Lukeb, Peter Vukusicb,#, Renaud Péteric,#, Cyrille Beaudryc, Tristan
Renaultd, David Simonc, Tâm Mignote & Eric Rosenfelda,#,1
aUMR 7266 CNRS- Littoral Environnement et Sociétés, Microbial Physiology Group - Université de La
Rochelle, Avenue Michel Crépeau, 17042 La Rochelle, France
bSchool of Physics, University of Exeter, Exeter EX4 4QL, United Kingdom
cLaboratoire Mathématiques, Image et Applications EA 3165, Université de La Rochelle, France.
dInstitut Français pour la Recherche et l'Exploitation de la Mer, Unité Santé Génétique et Microbiologie
des Mollusques, Laboratoire de Génétique et de Pathologie des Mollusques Marins, La Tremblade,
France.
eUMR 7283 CNRS Laboratoire de Chimie Bactérienne, Institut de Microbiologie de la Méditerranée,
University of Aix-Marseille, Marseille, France
#Equal contribution of authors.
1Correspondence to: [email protected]
Contents
- Legends for supplementary movies (S1 to S10)---------------p. 2-4
- Dataset S1---------------------------------------------------------------p. 5-9
- Dataset S2---------------------------------------------------------------p. 10-12
- (Dataset S3, uploaded as excel file)
- Dataset S4---------------------------------------------------------------p. 13-17
- Dataset S5---------------------------------------------------------------p. 18
- Dataset S6---------------------------------------------------------------p. 19-22
2
Movie S1: MA-grown C. lytica (x100, plate rotation).
Growth conditions: C. lytica CECT8139 strain was isolated by streaking on a marine agar (MA)
plate and incubated 24 h at 25°C. Specifically for this experiment, a little ink (1 % v/v, Paper
mate®) was added to the culture medium in order to limit reflections of incident light into the
agar at the time of observation.
Observation: Iridescence of C. lytica colonies was observed using the Keyence microscope at
a x100 magnification by continuously rotating the plate.
Movie S2: CYT-grown C. lytica (x200, plate rotation).
Growth conditions: C. lytica CECT8139 strain was isolated by streaking on a cytophaga agar
(CYT) plate and incubated 24 h at 25°C.
Observation: Iridescence was observed by using the Keyence microscope at a x200
magnification by continuously rotating the plate.
Movie S3: LN-grown C. lytica (x200, plate rotation).
Growth conditions: C. lytica CECT8139 strain was isolated by streaking on a low nutrient agar
(LN) plate and incubated 24 h at 25°C.
Observation: Iridescence was observed by using the Keyence microscope at a x200
magnification by continuously rotating the plate. In this condition, colony was transparent and
only blue-green iridescence was visualized.
Movie S4: MA-grown C. lytica (x100, high to low incidence angles).
Growth conditions: C. lytica CECT8139 strain was isolated by streaking on a marine agar (MA)
plate and incubated 24 h at 25°C.
Observation: “Pointillistic” iridescence and transitory colorations of C. lytica colonies were
analyzed at x100 magnification using the Keyence microscope equipped with a VH-K20 lens
3
ring (see Methods). By moving the VH-K20 lens ring from right to left, positions of illumination
were varying continuously from high to low light incidence angles. See also Fig. 1(a-d) in the
manuscript.
Movie S5: CYT-grown C. lytica (x100, high to low incidence angles).
Growth conditions: C. lytica CECT8139 strain was isolated by streaking on a cytophaga agar
(CYT) plate and incubated 24 h at 25°C.
Observation: “Pointillistic” iridescence and transitory colorations of C. lytica colonies were
analyzed at a x100 magnification using the Keyence microscope equipped with a VH-K20 lens
ring (see Methods). By moving the VH-K20 lens ring from right to left, positions of illumination
were varying continuously from high to low light incidence angles.
Movie S6: Gliding motility and cell organization of C. lytica CECT 8139 in an iridescent zone
of the colony biofilm (CYT agar medium).
Movements were recorded during 40 sec (one photo every three seconds) using time-lapse
phase contrast microscopy (100x objective, see Methods).
Movie S7: Gliding motility and cell organization of C. lytica CECT 8139 in an iridescent zone
of the colony biofilm (MA agar medium).
Movements were recorded during 2 x 1 min (one photo every three seconds) using time-lapse
phase contrast microscopy (100x objective, see Methods).
Movie S8: Gliding motility and cell organization of C. lytica CECT 8139 in an iridescent zone
of the colony biofilm (LN agar medium).
Movements were recorded during 40 sec (one photo every three seconds) using time-lapse
phase contrast microscopy (100x objective, see Methods).
4
Movie S9: Observation of C. lytica CECT 8139 cells grown in sNA agar medium (no
iridescence in the colony biofilm).
Pictures were recorded during 30 sec (one photo every three seconds) using time-lapse phase
contrast microscopy (100x objective, see Methods).
Movie S10: Observation of C. lytica CIP 103822 cells grown in CYT agar medium (no
iridescence in the colony biofilm).
Pictures were recorded during 40 sec (one photo every three seconds) using time-lapse phase
contrast microscopy (100x objective, see Methods).
5
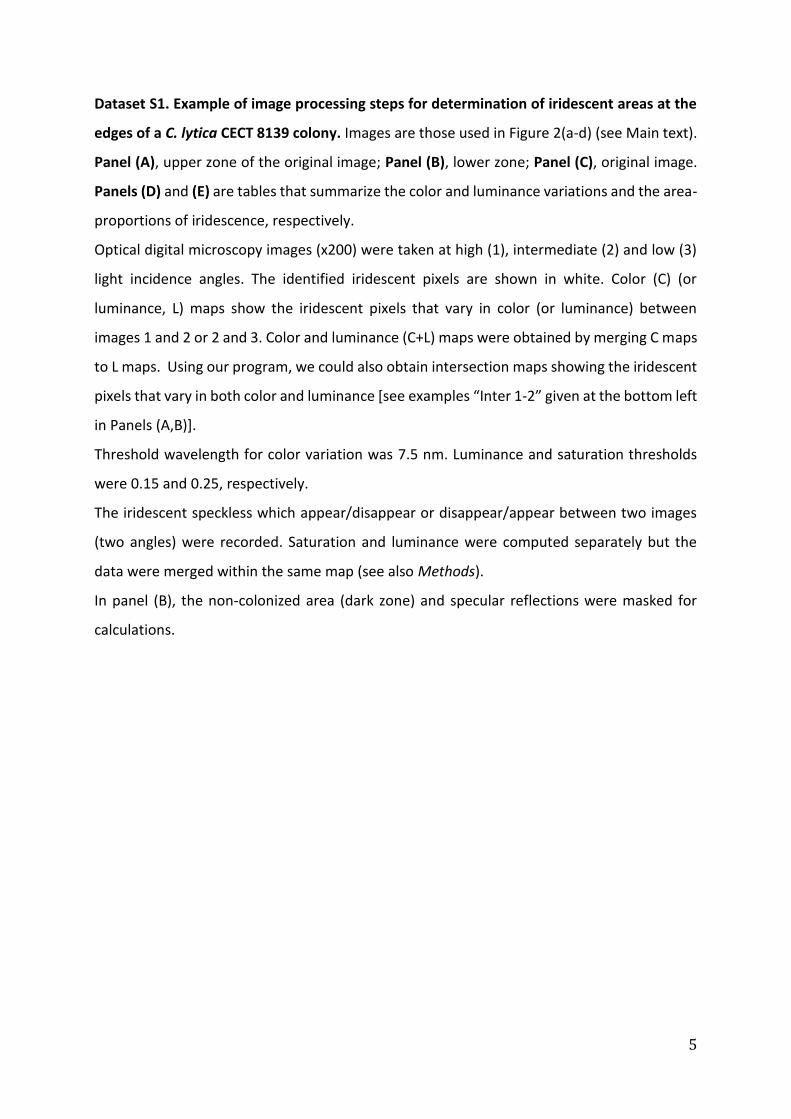
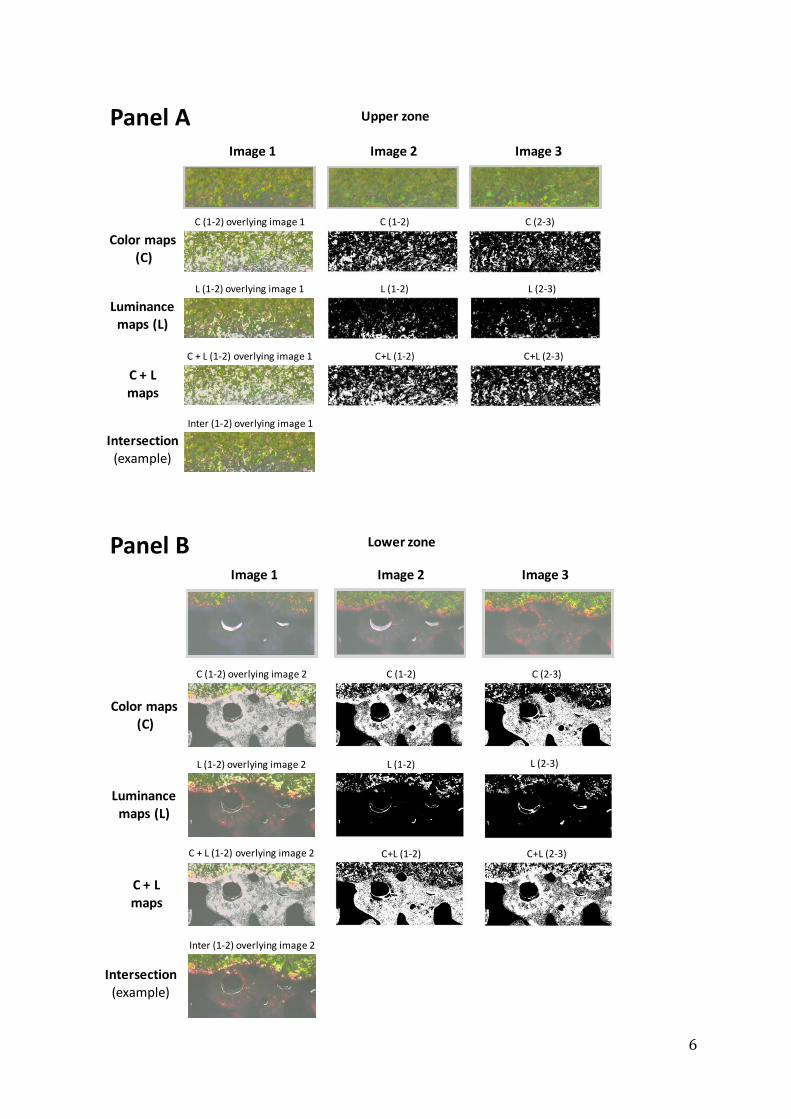
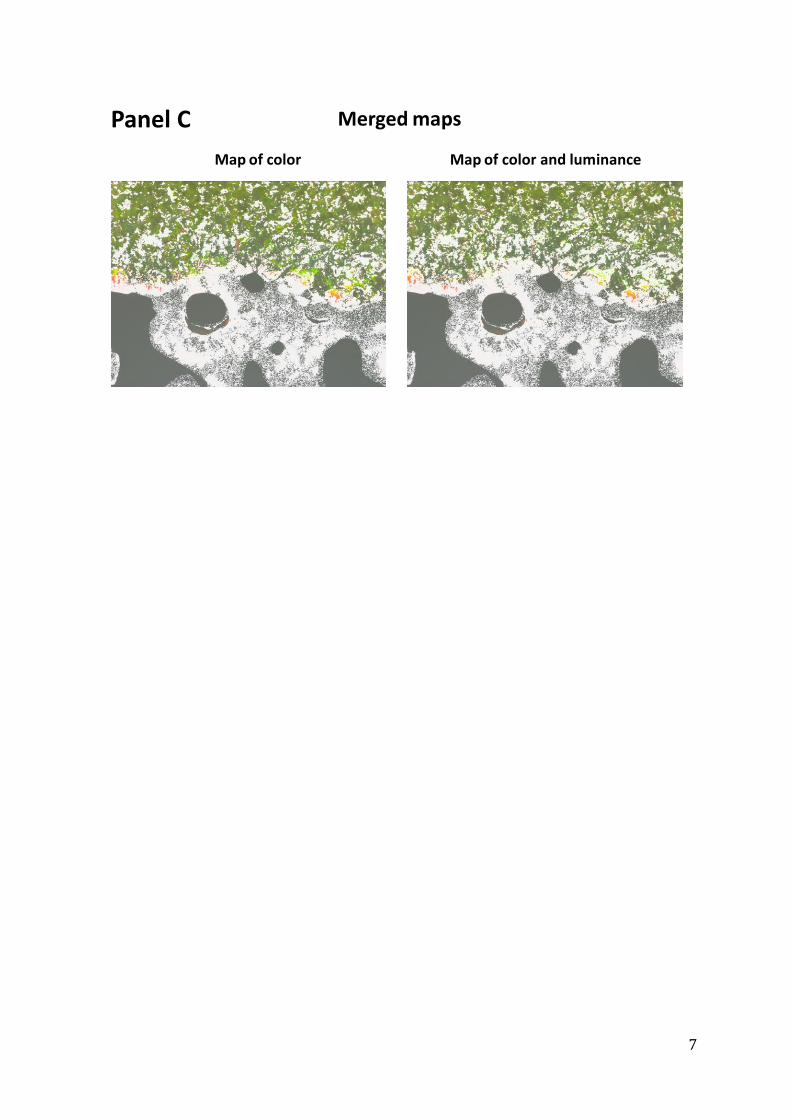
Dataset S1. Example of image processing steps for determination of iridescent areas at the
edges of a C. lytica CECT 8139 colony. Images are those used in Figure 2(a-d) (see Main text).
Panel (A), upper zone of the original image; Panel (B), lower zone; Panel (C), original image.
Panels (D) and (E) are tables that summarize the color and luminance variations and the area-
proportions of iridescence, respectively.
Optical digital microscopy images (x200) were taken at high (1), intermediate (2) and low (3)
light incidence angles. The identified iridescent pixels are shown in white. Color (C) (or
luminance, L) maps show the iridescent pixels that vary in color (or luminance) between
images 1 and 2 or 2 and 3. Color and luminance (C+L) maps were obtained by merging C maps
to L maps. Using our program, we could also obtain intersection maps showing the iridescent
pixels that vary in both color and luminance [see examples “Inter 1-2” given at the bottom left
in Panels (A,B)].
Threshold wavelength for color variation was 7.5 nm. Luminance and saturation thresholds
were 0.15 and 0.25, respectively.
The iridescent speckless which appear/disappear or disappear/appear between two images
(two angles) were recorded. Saturation and luminance were computed separately but the
data were merged within the same map (see also Methods).
In panel (B), the non-colonized area (dark zone) and specular reflections were masked for
calculations.
6
2
C (1-2) C (2-3)
L (2-3)
Intersection(example)
L (1-2)
Image 1 Image 2 Image 3
Color maps(C)
Luminancemaps (L)
C + Lmaps
C (1-2) overlying image 1
L (1-2) overlying image 1
Upper zone
Inter (1-2) overlying image 1
C+L (1-2) C+L (2-3)C + L (1-2) overlying image 1
APanel A
3
C (1-2) C (2-3)
C+L (1-2) C+L (2-3)
L (2-3)
Intersection(example)
L (1-2)
Image 1 Image 2 Image 3
Color maps(C)
Luminancemaps (L)
C + Lmaps
C (1-2) overlying image 2
L (1-2) overlying image 2
C + L (1-2) overlying image 2
Lower zone
Inter (1-2) overlying image 2
BPanel B
7
4
Map of color Map of color and luminance
Merged mapsCPanel C
8
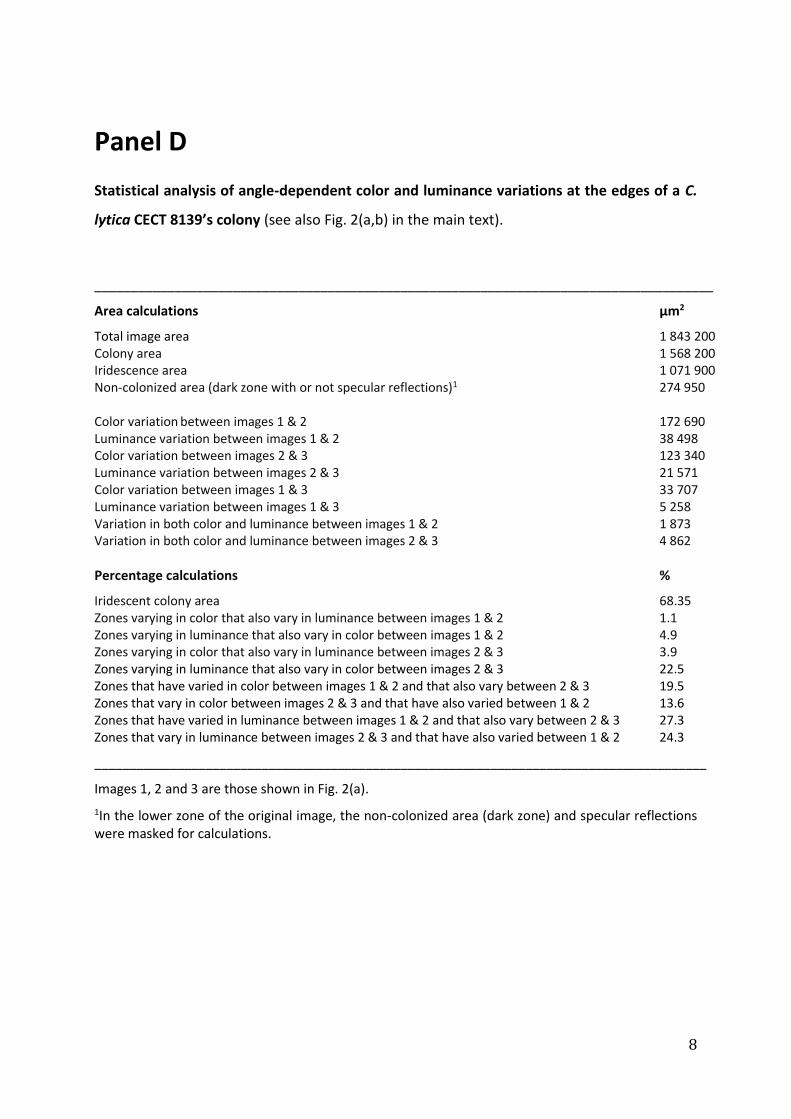
Panel D
Statistical analysis of angle-dependent color and luminance variations at the edges of a C.
lytica CECT 8139’s colony (see also Fig. 2(a,b) in the main text).
_____________________________________________________________________________________
Area calculations µm2
Total image area 1 843 200 Colony area 1 568 200 Iridescence area 1 071 900 Non-colonized area (dark zone with or not specular reflections)1 274 950 Color variation between images 1 & 2 172 690 Luminance variation between images 1 & 2 38 498 Color variation between images 2 & 3 123 340 Luminance variation between images 2 & 3 21 571 Color variation between images 1 & 3 33 707 Luminance variation between images 1 & 3 5 258 Variation in both color and luminance between images 1 & 2 1 873 Variation in both color and luminance between images 2 & 3 4 862
Percentage calculations %
Iridescent colony area 68.35 Zones varying in color that also vary in luminance between images 1 & 2 1.1 Zones varying in luminance that also vary in color between images 1 & 2 4.9 Zones varying in color that also vary in luminance between images 2 & 3 3.9 Zones varying in luminance that also vary in color between images 2 & 3 22.5 Zones that have varied in color between images 1 & 2 and that also vary between 2 & 3 19.5 Zones that vary in color between images 2 & 3 and that have also varied between 1 & 2 13.6 Zones that have varied in luminance between images 1 & 2 and that also vary between 2 & 3 27.3 Zones that vary in luminance between images 2 & 3 and that have also varied between 1 & 2 24.3
________________________________________________________________________________________
Images 1, 2 and 3 are those shown in Fig. 2(a).
1In the lower zone of the original image, the non-colonized area (dark zone) and specular reflections were masked for calculations.
9
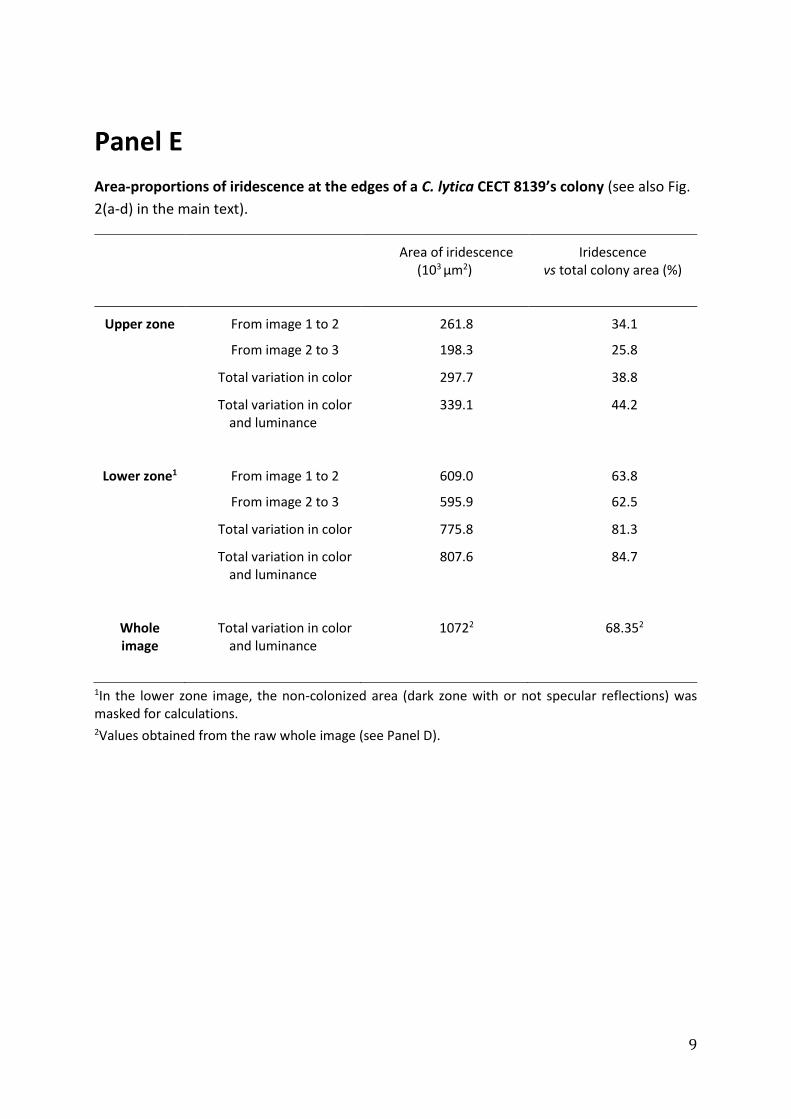
Panel E
Area-proportions of iridescence at the edges of a C. lytica CECT 8139’s colony (see also Fig.
2(a-d) in the main text).
Area of iridescence (103 µm2)
Iridescence vs total colony area (%)
Upper zone From image 1 to 2 261.8 34.1
From image 2 to 3 198.3 25.8
Total variation in color 297.7 38.8
Total variation in color and luminance
339.1 44.2
Lower zone1 From image 1 to 2 609.0 63.8
From image 2 to 3 595.9 62.5
Total variation in color 775.8 81.3
Total variation in color and luminance
807.6 84.7
Whole image
Total variation in color and luminance
10722 68.352
1In the lower zone image, the non-colonized area (dark zone with or not specular reflections) was masked for calculations. 2Values obtained from the raw whole image (see Panel D).
10
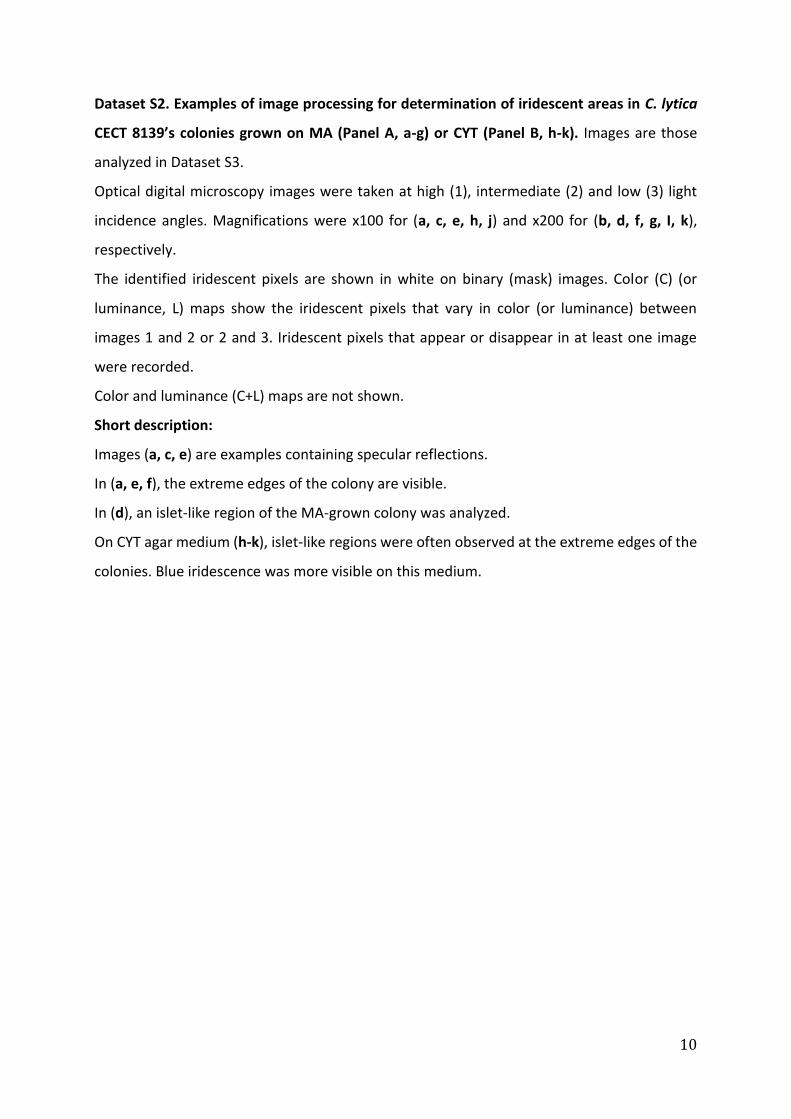
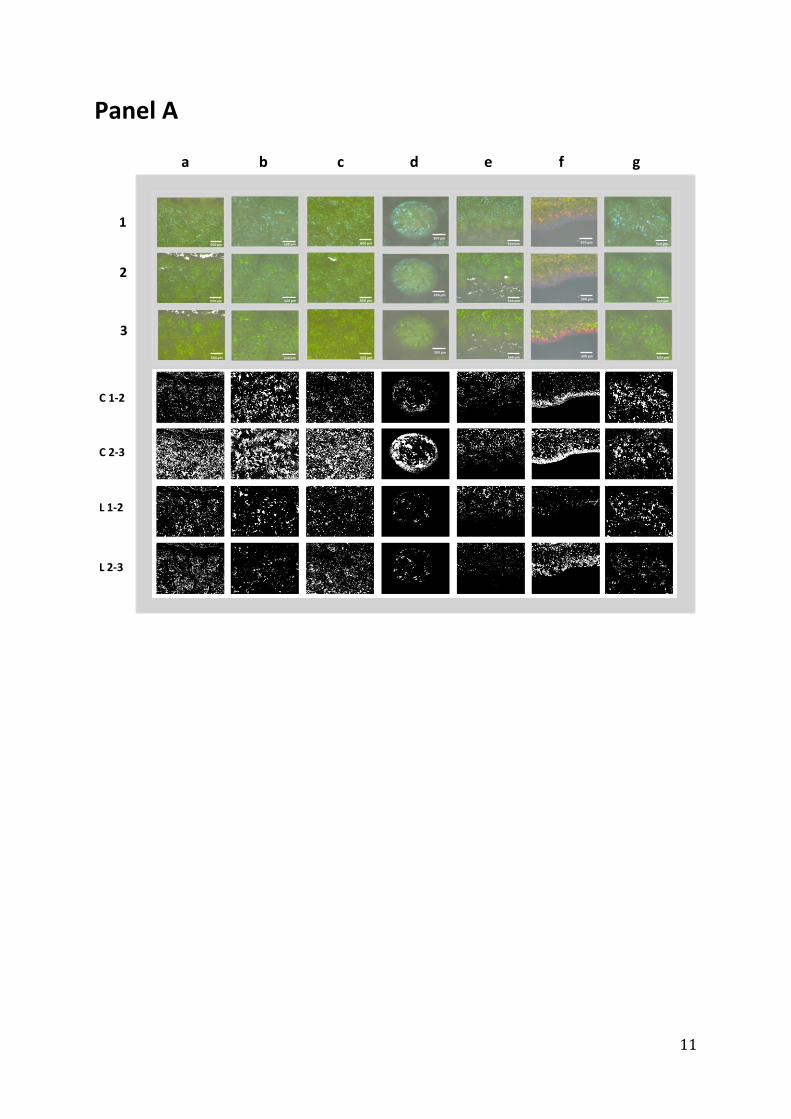
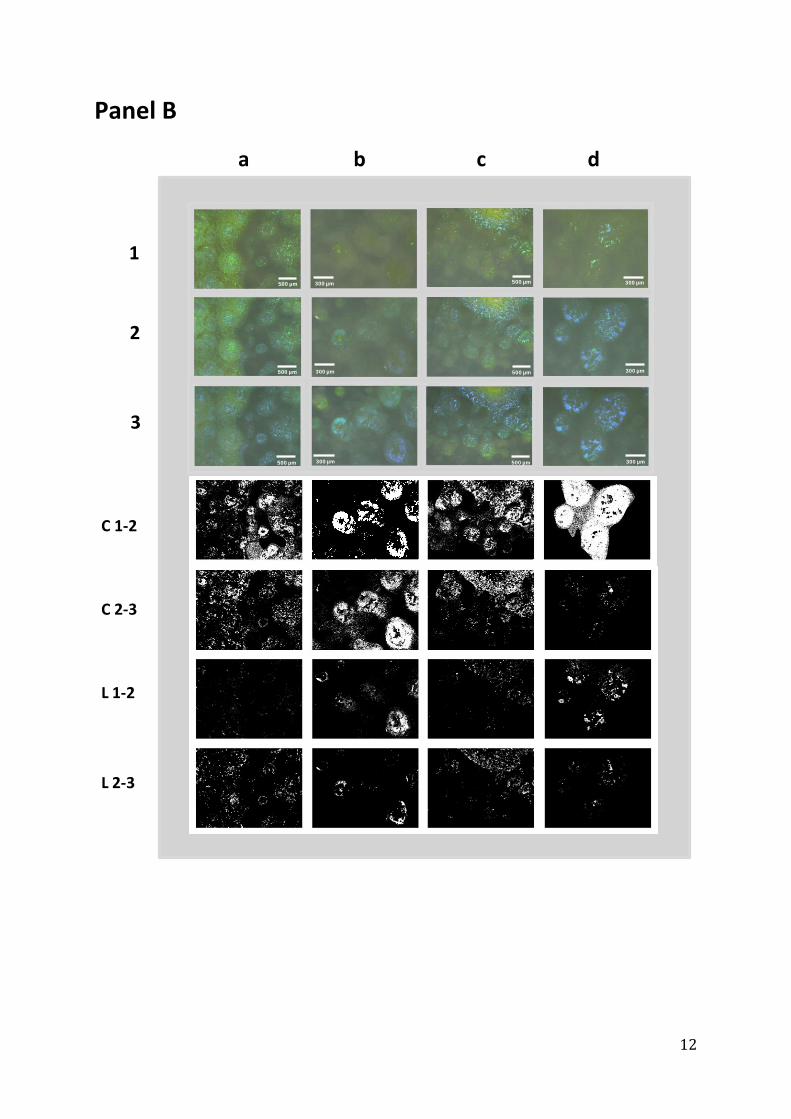
Dataset S2. Examples of image processing for determination of iridescent areas in C. lytica
CECT 8139’s colonies grown on MA (Panel A, a-g) or CYT (Panel B, h-k). Images are those
analyzed in Dataset S3.
Optical digital microscopy images were taken at high (1), intermediate (2) and low (3) light
incidence angles. Magnifications were x100 for (a, c, e, h, j) and x200 for (b, d, f, g, I, k),
respectively.
The identified iridescent pixels are shown in white on binary (mask) images. Color (C) (or
luminance, L) maps show the iridescent pixels that vary in color (or luminance) between
images 1 and 2 or 2 and 3. Iridescent pixels that appear or disappear in at least one image
were recorded.
Color and luminance (C+L) maps are not shown.
Short description:
Images (a, c, e) are examples containing specular reflections.
In (a, e, f), the extreme edges of the colony are visible.
In (d), an islet-like region of the MA-grown colony was analyzed.
On CYT agar medium (h-k), islet-like regions were often observed at the extreme edges of the
colonies. Blue iridescence was more visible on this medium.
11
Panel A
1
2
3
500 µm
500 µm
500 µm
1
2
3
500 µm
500 µm
500 µm
1
2
3
500 µm
500 µm
500 µm
1
2
3
300 µm
300 µm
300 µm
1
2
3
300 µm
300 µm
300 µm
1
2
3
300 µm
300 µm
300 µm
1
2
3
500 µm
500 µm
500 µm
1
2
3
500 µm
500 µm
500 µm
1
2
3
500 µm
500 µm
500 µm
1
2
3
300 µm
300 µm
300 µm
1
2
3
300 µm
300 µm
300 µm
1
2
3
300 µm
300 µm
300 µm
1
2
3
500 µm
500 µm
500 µm
1
2
3
500 µm
500 µm
500 µm
1
2
3
500 µm
500 µm
500 µm
1
2
3
300 µm
300 µm
300 µm
1
2
3
300 µm
300 µm
300 µm
1
2
3
300 µm
300 µm
300 µm
1
2
3
500 µm
500 µm
500 µm
1
2
3
500 µm
500 µm
500 µm
1
2
3
500 µm
500 µm
500 µm
C 1-2
C 2-3
L 1-2
L 2-3
b c d e f ga
1
2
3
A
12
Panel B
1
2
3
500 µm
500 µm
500 µm
1
2
3
500 µm
500 µm
500 µm
1
2
3
500 µm
500 µm
500 µm
1
2
3
300 µm
300 µm
300 µm
1
2
3
300 µm
300 µm
300 µm
1
2
3
300 µm
300 µm
300 µm
1
2
3
500 µm
500 µm
500 µm
1
2
3
500 µm
500 µm
500 µm
1
2
3
500 µm
500 µm
500 µm
1
2
3
300 µm
300 µm
300 µm
1
2
3
300 µm
300 µm
300 µm
1
2
3
300 µm
300 µm
300 µm
C 1-2
C 2-3
L 1-2
L 2-3
b c da
1
2
3
B
13
Dataset S3 (uploaded as Excel file). Statistical analyses of angle-dependent color and
luminance variations in C. lytica CECT 8139 colonies. See also Dataset S2.
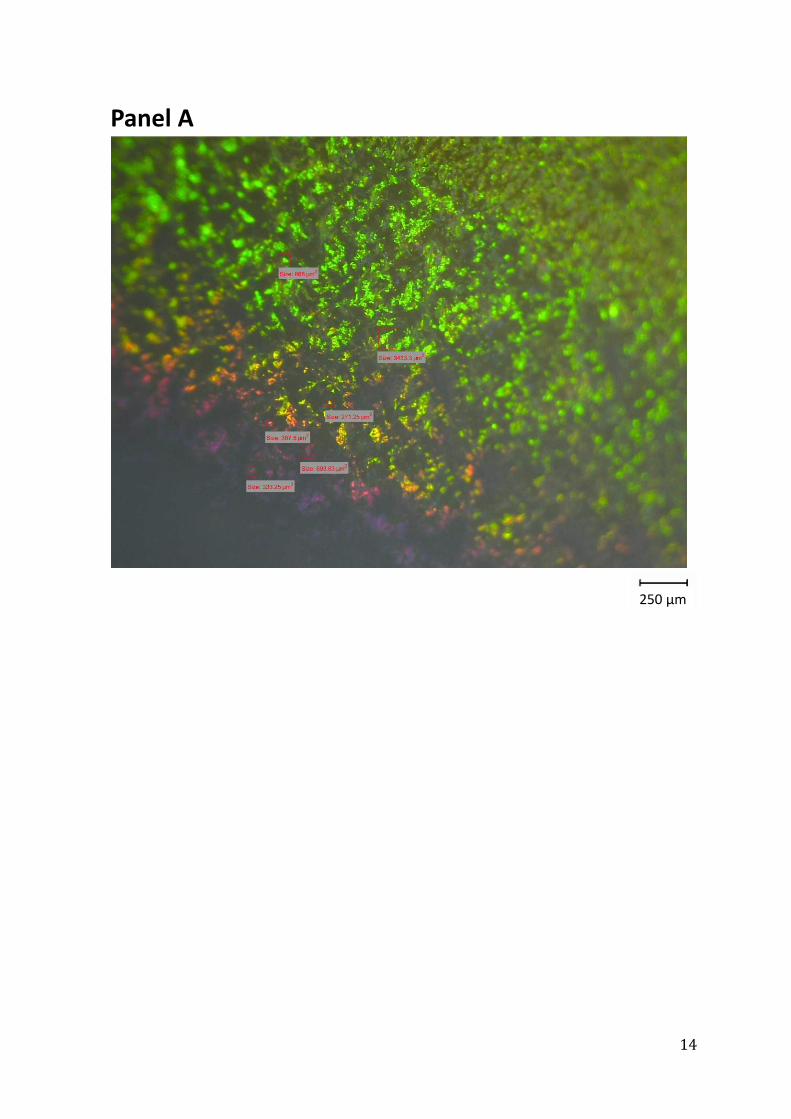
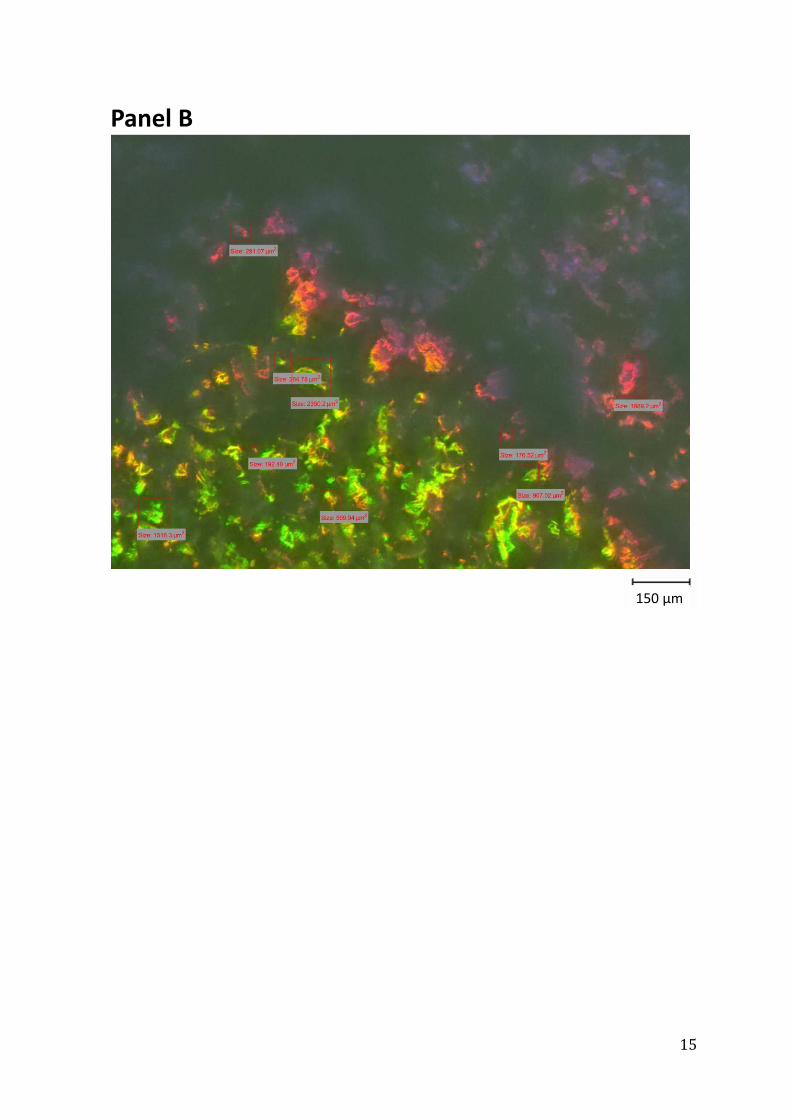
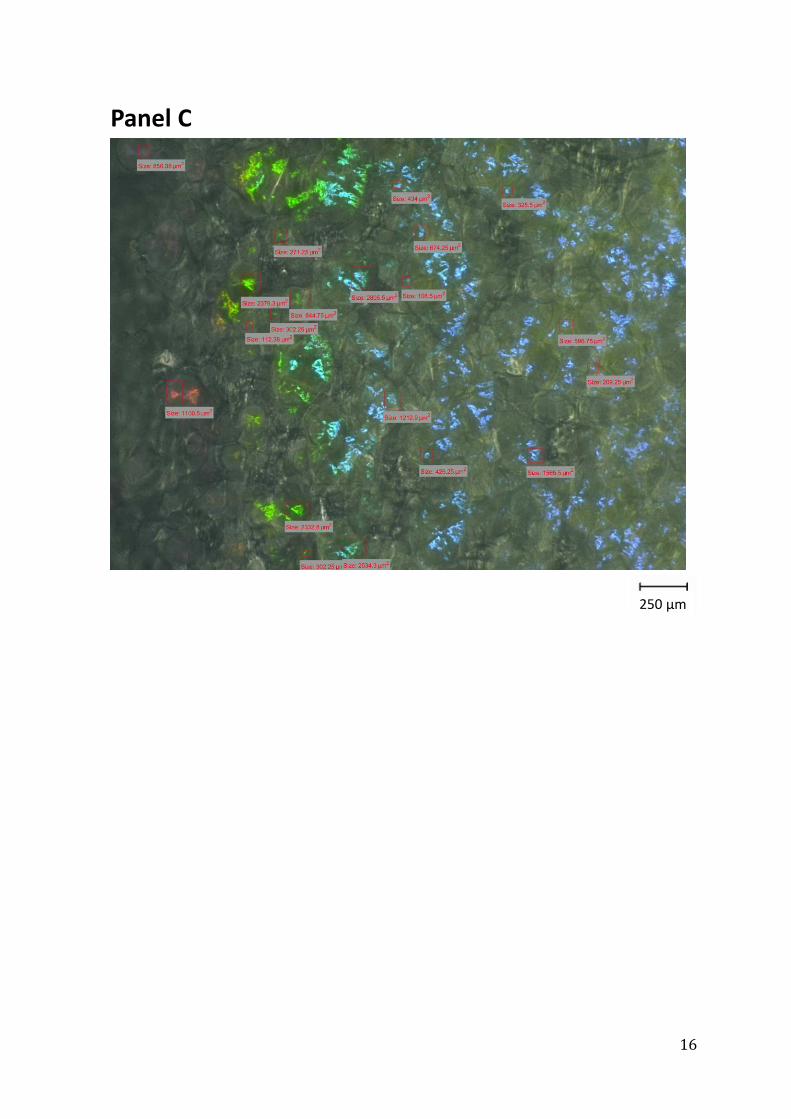
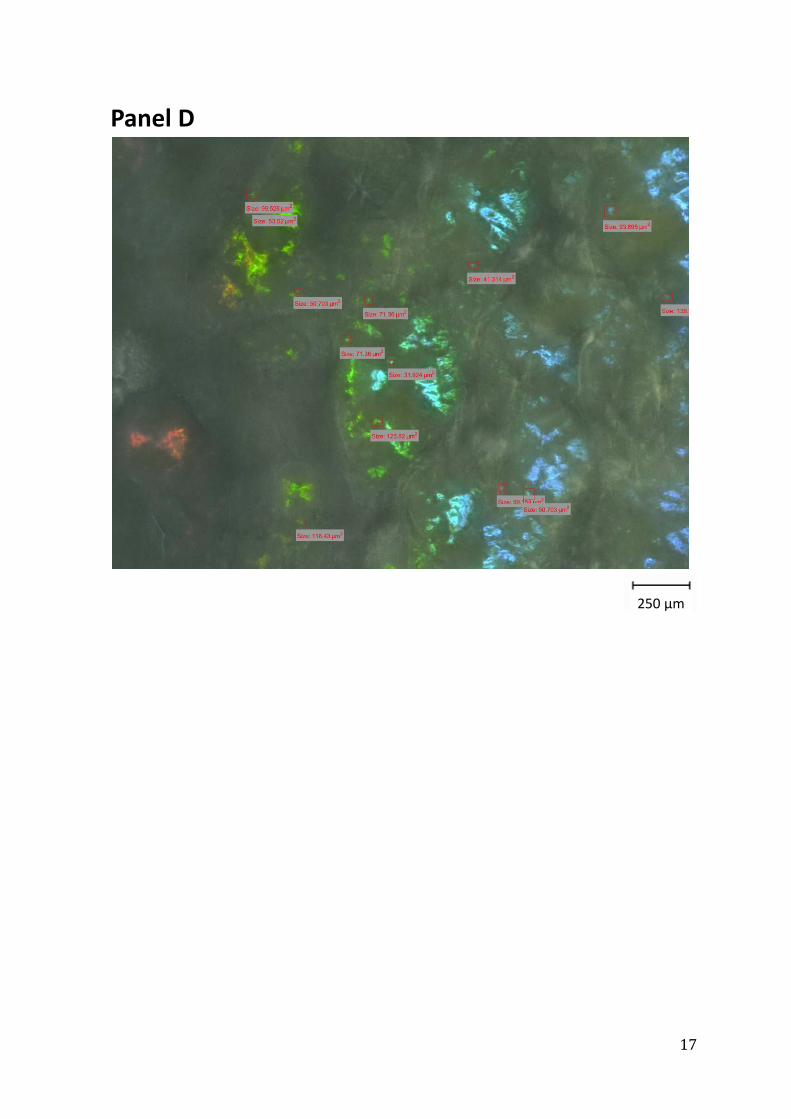
Dataset S4 (related to Figure 2(f)). Examples of determinations of iridescence elemental
unit sizes in C. lytica CECT 8139’s colonies grown on MA (A-B) or CYT (C-D).
Direct observations of colored colonies were performed under epi-illumination by using a
numeric Keyence microscope (VHX-1000E). A VHX-1100 camera with a VH-Z20R/Z20W
objective lens was adjusted at x100 (A,C) or x200 (B,D) magnifications. To avoid specular
reflections, the VH-S30 supporting mount of the camera was oriented at a 60° angle from the
plate. The DEPTH UP/3D tool corresponding to the depth-from-defocus (DFD) process was
employed to focus on all optical fields and to improve image quality.
Size of the iridescent “speckles” were determined using a specific image processing program
(see Methods). The examples C-D (CYT-grown colony) are enlarged images of those shown in
Figure 2(f) (See Main text) and contain additional computational results.
14
Panel A
250 µm
15
150 µm
Panel B
16
250 µm
Panel C
17
250 µm
Panel D
18
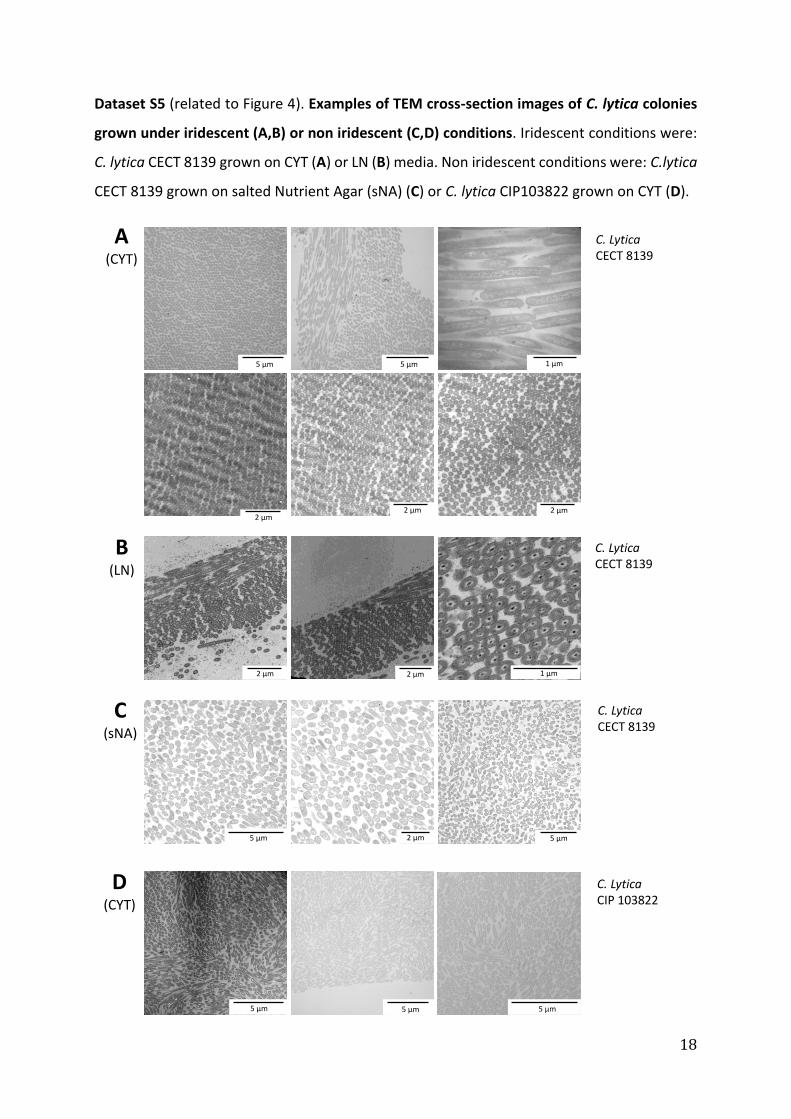
Dataset S5 (related to Figure 4). Examples of TEM cross-section images of C. lytica colonies
grown under iridescent (A,B) or non iridescent (C,D) conditions. Iridescent conditions were:
C. lytica CECT 8139 grown on CYT (A) or LN (B) media. Non iridescent conditions were: C.lytica
CECT 8139 grown on salted Nutrient Agar (sNA) (C) or C. lytica CIP103822 grown on CYT (D).
2 µm
5 µm5 µm 1 µm
2 µm 2 µm
A(CYT)
2 µm 1 µm2 µm
B(LN)
C. LyticaCECT 8139
C. LyticaCECT 8139
5 µm 2 µm 5 µm
5 µm 5 µm5 µm
C(sNA)
D(CYT)
C. LyticaCIP 103822
C. LyticaCECT 8139
19
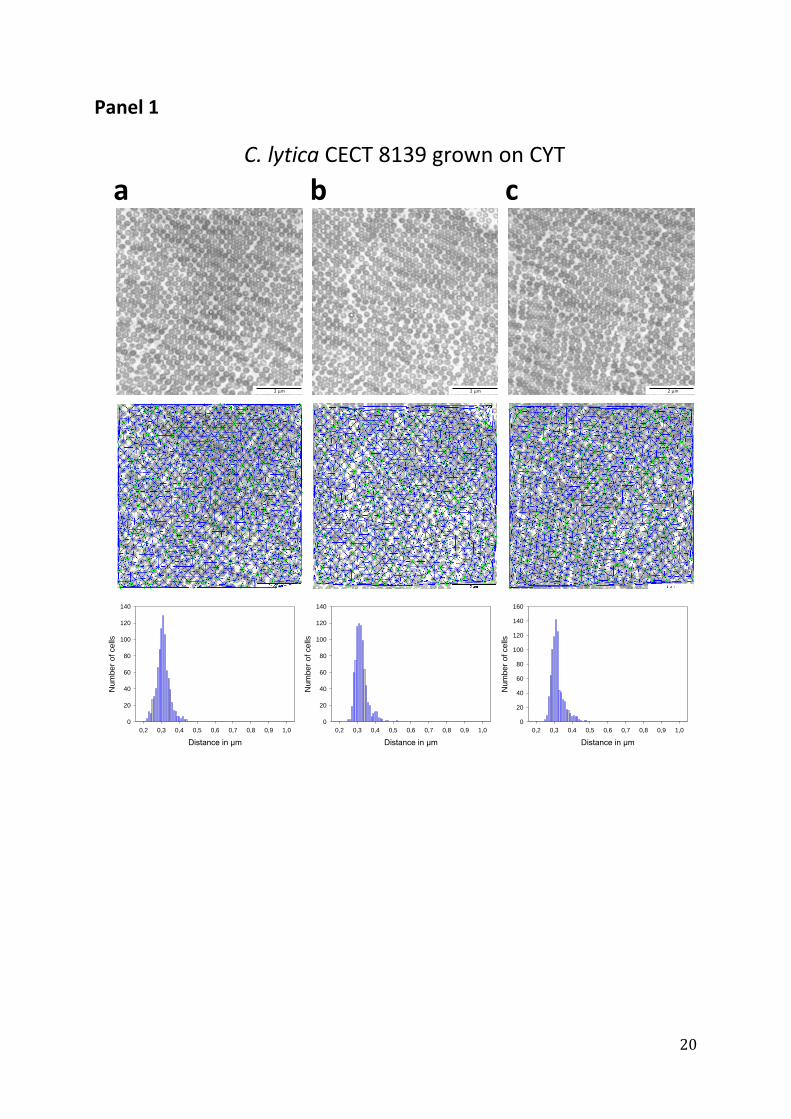
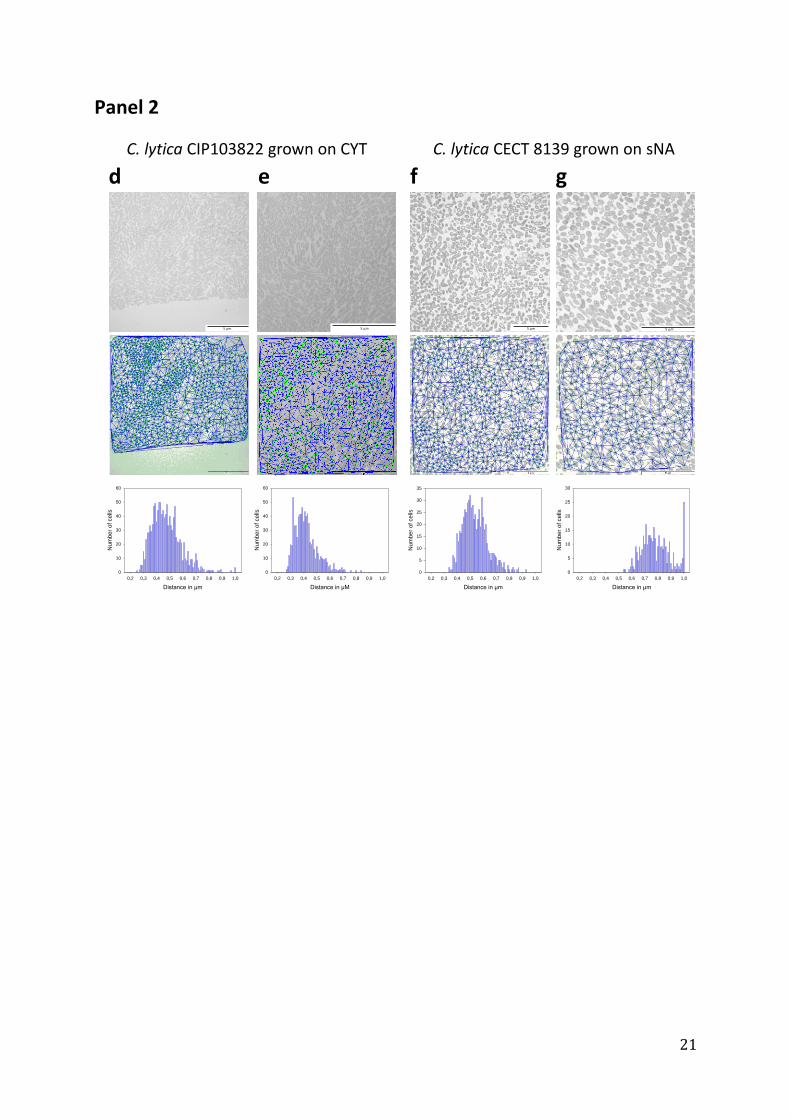
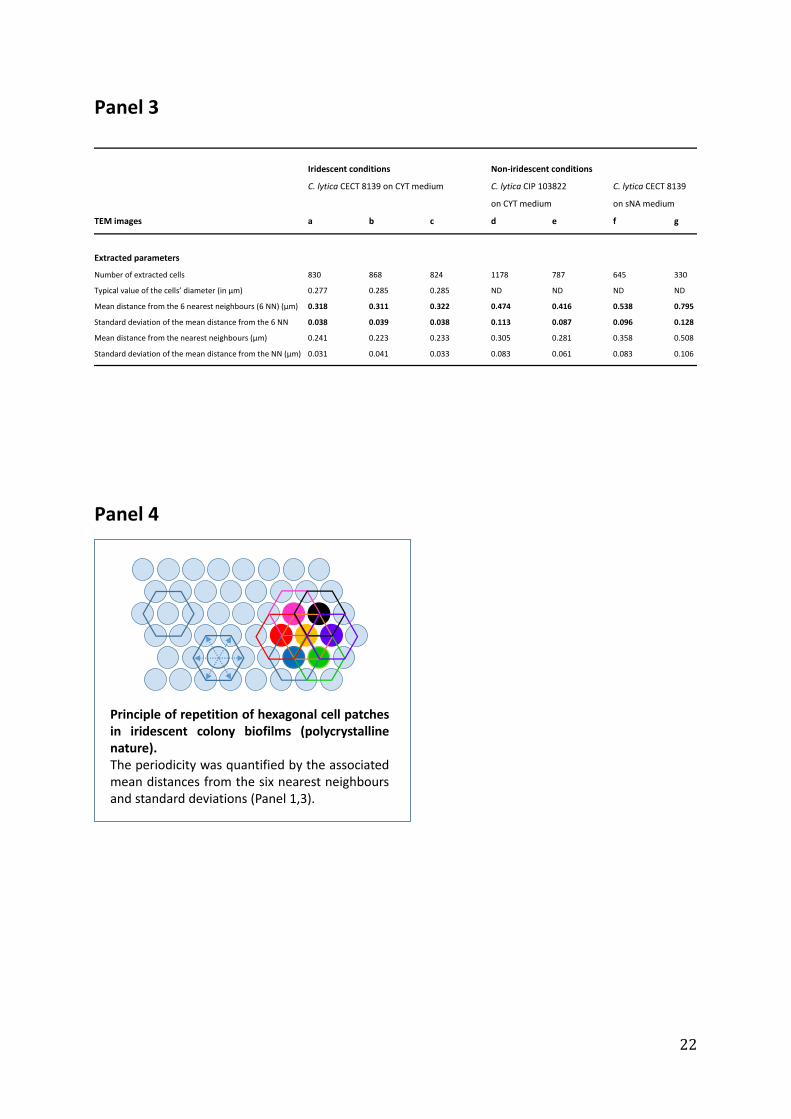
Dataset S6 (related to Figure 3(d,e)). Mathematical morphology analysis of TEM images.
Positive samples are presented in Panel 1 (CECT 8139 strain on CYT) and negative ones in
Panel 2 (CIP103822 strain on CYT or CECT 8139 strain on sNA). Panel 3 is a table that
summarizes the statistics of the structures (number of extracted cells, typical value of the cells’
diameter, mean distances). Panel 4 is a scheme showing the principle of repetition of
hexagonal cell patches in iridescent colony biofilms.
In Panels 1-2, each figure shows:
– The original TEM image
– The extracted cells and the associated Delaunay graph
– The frequency plot of the mean distance from the 6 nearest-neighbours of each cell.
The Delaunay graphs show that the spatial arrangement of the positive samples are visually
more regular than the negative ones; there are some strong ’local’ deformations on the
Delaunay graphs of negative samples. This observation tends to be confirmed by the standard
deviations on the 6 nearest neighbours (a measure more robust than the nearest neighbour),
and by the spread of the histograms in the case of negative samples (e.g. sNA condition).
Moreover, the mean and standard deviation on the positive samples are quite similar on the
different images.
20
Panel 1
C. lytica CECT 8139 grown on CYT
2 µm2 µm 2 µm
CYT1
Distance in µm
0,2 0,3 0,4 0,5 0,6 0,7 0,8 0,9 1,0
Num
ber
of cells
0
20
40
60
80
100
120
140
CYT3
Distance in µm
0,2 0,3 0,4 0,5 0,6 0,7 0,8 0,9 1,0
Num
ber
of cells
0
20
40
60
80
100
120
140
CYT4
Distance in µm
0,2 0,3 0,4 0,5 0,6 0,7 0,8 0,9 1,0
Num
ber
of cells
0
20
40
60
80
100
120
140
160
a b c
21
Panel 2
C. lytica CIP103822 grown on CYT C. lytica CECT 8139 grown on sNA
5 µm5 µm5 µm
CIP7500
Distance in µm
0,2 0,3 0,4 0,5 0,6 0,7 0,8 0,9 1,0
Num
ber
of
ce
lls
0
10
20
30
40
50
60
CIP12000
Distance in µM
0,2 0,3 0,4 0,5 0,6 0,7 0,8 0,9 1,0
Num
ber
of
ce
lls
0
10
20
30
40
50
60
GN1
Distance in µm
0,2 0,3 0,4 0,5 0,6 0,7 0,8 0,9 1,0
Num
ber
of cells
0
5
10
15
20
25
30
35
GN2
Distance in µm
0,2 0,3 0,4 0,5 0,6 0,7 0,8 0,9 1,0
Num
ber
of
ce
lls
0
5
10
15
20
25
30
5 µm
d e f g
22
Panel 3
Panel 4
Iridescent conditions Non-iridescent conditions
C. lytica CECT 8139 on CYT medium C. lytica CIP 103822 C. lytica CECT 8139
on CYT medium on sNA medium
TEM images a b c d e f g
Extracted parameters
Number of extracted cells 830 868 824 1178 787 645 330
Typical value of the cells’ diameter (in µm) 0.277 0.285 0.285 ND ND ND ND
Mean distance from the 6 nearest neighbours (6 NN) (µm) 0.318 0.311 0.322 0.474 0.416 0.538 0.795
Standard deviation of the mean distance from the 6 NN 0.038 0.039 0.038 0.113 0.087 0.096 0.128
Mean distance from the nearest neighbours (µm) 0.241 0.223 0.233 0.305 0.281 0.358 0.508
Standard deviation of the mean distance from the NN (µm) 0.031 0.041 0.033 0.083 0.061 0.083 0.106
Principle of repetition of hexagonal cell patchesin iridescent colony biofilms (polycrystallinenature).The periodicity was quantified by the associatedmean distances from the six nearest neighboursand standard deviations (Panel 1,3).