Embed Size (px)
Citation preview
THESE INSA Rennes sous le sceau de l’Université européenne de Bretagne pour obtenir le titre de
DOCTEUR DE L’INSA DE RENNES
Spécialité : Electronique et Télécommunications
Et pour obtenir le titre de “Dottore di Ricerca”“Corso di
Dottorato in Ingegneria Industriale e dell’Informazione, Ciclo
XXV” “Università degli Studi di Udine, Italia” “ Dipartimento di
Ingegneria Elettrica, Gestionale e Meccanica”
présentée par
Abdallah Hamini ECOLE DOCTORALE : MATISSE
LABORATOIRE : IETR
New Algorithms for Green Wired and Wireless
Communications
Thèse soutenue le 12/03/2013 devant le jury composé de :
Jean-Pierre Cancès
Professeur à l’université de Limoges / rapporteur et président
Didier Le Ruyet
Professeur au CNAM, Paris / rapporteur
Gilles Burel Professeur à l’université de Bretagne Occidentale / examinateur
Jean-Yves Baudais
Charge de recherche au CNRS-IETR / co-encadrant de thèse
Andrea M. Tonello
Professeur à l’université de Udine (Italie) / co-directeur de thèse
Jean-François Hélard Professeur à l’INSA de Rennes / directeur de thèse
N° d’ordre : 13ISAR 06
Résumé
La recrudescence et le déploiement de nouveaux services et applications dans les systèmes de communication, ainsi que le nombre toujours croissant d’utilisateurs, conduisent à une augmentation de la consommation d’énergie des réseaux et technologies de l’information et de la communication, ce qui contribue de façon significative au réchauffement climatique. Ainsi, pour satisfaire aux exigences énergétiques aussi bien pour les réseaux sans fil que filaires, de nouvelles approches doivent être développées. Dans un premier temps, nos travaux de recherche se focalisent sur les mécanismes d’allocation des ressources de systèmes point-à-point dans deux modes de transmission (mono-porteuse et multi-porteuses) avec pour objectif la minimisation de l’énergie consommée. Dans cette partie, nous présentons une nouvelle approche appelée ultra large temps (ULT) ainsi qu’une nouvelle métrique pour les systèmes de communication. En se basant sur cette nouvelle approche, des algorithmes d’allocation des ressources sont proposés afin d’améliorer l’efficacité énergétique des réseaux sans fil et des réseaux filaires, dont notamment les réseaux CPL (courant porteur en ligne). Dans un second temps, nous étudions les techniques impulsionnelles ultra large bande (ULB). Un simulateur logiciel de liaison point-à-point ULB impulsionnelle, générique et paramétrable a été développé. L’objectif est d’améliorer l’efficacité énergétique d’une liaison ULB. Les différents paramètres du système (largeur de l’impulsion, temps de garde, nombre d’impulsions transmises) sont exploités afin d’optimiser les performances du système. Ainsi, la forme d’onde ULB impulsionnelle a été dimensionnée afin de s’adapter au mieux aux caractéristiques du canal de transmission. Les résultats de ces travaux permettent de poser les premières règles d’ingénierie en termes de dimensionnement des systèmes de communication ULB impulsionnelle dans le cadre de la radio verte. Enfin, la dernière partie de nos travaux se focalise sur la conception de l’impulsion dans les systèmes de communication ULB. Le choix de la forme de l’impulsion est très important pour améliorer les performances du système et pour économiser l’énergie. L’objectif est de trouver la meilleure impulsion pour minimiser l’énergie consommée tout en garantissant le niveau attendu de performances.
Abstract
The demand for new services and applications in
communication systems, as well as the number of users,
are steadily increasing. This growth involves a great use
of energy in information and communications
technologies, which contributes significantly to global
warming. Furthermore, to satisfy the energy requirements
for both wired and wireless networks, new approaches
must be developed.
Firstly, our researches focus on resource allocation
mechanisms in point-to-point systems for two
transmission modes (single-carrier and multi-carrier) with
the goal of minimizing the energy consumption. In this
part, we present a new approach called ultra wide time
(UWT) and a new metric for communication systems.
Based on this approach, efficient algorithms for resource
allocation are proposed to improve energy efficiency in
wireless and wired networks.
Secondly, we study ultra wideband (UWB)
communications. A software simulator of impulse UWB
communications generic and configurable has been
developed. The objective is to improve the energy
efficiency of UWB systems. Various system parameters
(pulse width, guard time, number of pulses transmitted)
are used to optimize system performances. The UWB
pulse waveform has been designed to better adapt to the
characteristics of the transmission channel. The results of
this work lay the first rules of energy efficiency
engineering design in impulse UWB systems.
Finally, the last part of our work focuses on the pulse
design in UWB communication systems. The choice of
the pulse shape is very important to improve the system
performances and to save energy. The objective is to find
the best pulse to minimize energy consumption while
ensuring the expected level of performances.
�
New Algorithms for Green Wired and Wireless Communications�
Abdallah Hamini �
�
�
�
�
En partenariat avec�
�
�
�
�
�


To my parents

Acknowledgements
Now that I have completed my thesis, it is time to express my gratitude. I would like to
express my sincere thanks to all people who have contributed to the realization of my
thesis, who help me carry out my research over the last three years; and my apologies
to those I unintentionally forget.
First and foremost, I am very grateful to the director of my PhD, Prof. Jean-
François Hélard, for providing me such a wonderful opportunity and for his supervision
of my research work. I am equally grateful to my co-director, Prof. Andrea M. Tonello
for providing me an invaluable opportunity to have dual degree and for his helpful
advice and interesting discussions. My special thanks go to my co-advisor Dr. Jean-
Yves Baudais; his support and help made it possible for me to accomplish, step by step,
my dissertation through the last years.
I would particularly like to thank Jean-Pierre Cances, Prof. at university of Limo-
ges, for presiding over my PhD defense and for the report they wrote. All my gratitude
to Didier le ruyet, Prof. at CNAM of Paris, for the time they spent reading and com-
menting on my thesis. Special thanks to Gilles Burel, Prof. at university of Western
Brittany, for being the jury member. I would also like to thank all the administrative
staff in INSA of Rennes and University of Udine for their help and guidance in all
administrative matters.
All my colleagues at IETR and WipLi-lab have enriched my graduate life in many
ways. I would like to thank them all, especially Fahad Syed Muhammad, Ali Maiga,
Youssef Nasser, Ahmad Jabban, Fabio Versolatto, Daniele Inserra, Massimo Antoniali,
Salvatore D’Alessandro and Nicola Moret. Last but not least, I am extremely thankful
to my loving family, my parents who always believed in me, my sister and my brother
for their unconditional and unlimited support and affection. Many thanks to my friends
for moral support during difficult times.
vii

Contents
Acknowledgements vii
List of Figures xxxiii
List of Tables xxxvii
Acronyms xxxix
Introduction 1
1 Green radio 7
1.1 ICT development . . . . . . . . . . . . . . . . . . . . . . . . . . . . . . . 7
1.2 Future technologies and challenges . . . . . . . . . . . . . . . . . . . . . 9
1.3 Energy consumption in ICT . . . . . . . . . . . . . . . . . . . . . . . . . 11
1.3.1 ICT consumption . . . . . . . . . . . . . . . . . . . . . . . . . . . 11
1.3.2 Greenhouse gas emissions . . . . . . . . . . . . . . . . . . . . . . 14
1.4 Green technologies . . . . . . . . . . . . . . . . . . . . . . . . . . . . . . 16
1.4.1 Motivations and objectives . . . . . . . . . . . . . . . . . . . . . 17
1.4.2 Green technology challenges and solutions . . . . . . . . . . . . 17
1.4.2.1 Architecture design . . . . . . . . . . . . . . . . . . . . 18
1.4.2.2 Metric energy . . . . . . . . . . . . . . . . . . . . . . . 19
1.4.2.3 Power effective signal . . . . . . . . . . . . . . . . . . . 20
1.4.2.4 Frequency management . . . . . . . . . . . . . . . . . . 20
1.4.2.5 Resource allocation . . . . . . . . . . . . . . . . . . . . 21
1.5 Study context: motivation and vision . . . . . . . . . . . . . . . . . . . . 21
1.6 Conclusion . . . . . . . . . . . . . . . . . . . . . . . . . . . . . . . . . . 22
ix
CONTENTS
2 System specifications 23
2.1 Introduction . . . . . . . . . . . . . . . . . . . . . . . . . . . . . . . . . . 23
2.2 OFDM systems . . . . . . . . . . . . . . . . . . . . . . . . . . . . . . . . 23
2.2.1 OFDM principle . . . . . . . . . . . . . . . . . . . . . . . . . . . 24
2.2.2 OFDM waveform . . . . . . . . . . . . . . . . . . . . . . . . . . . 25
2.2.3 Resource allocation in OFDM . . . . . . . . . . . . . . . . . . . . 26
2.3 UWB systems . . . . . . . . . . . . . . . . . . . . . . . . . . . . . . . . . 28
2.3.1 Description of impulse radio UWB . . . . . . . . . . . . . . . . . 28
2.3.2 Gaussian pulses . . . . . . . . . . . . . . . . . . . . . . . . . . . . 30
2.3.3 Communication model . . . . . . . . . . . . . . . . . . . . . . . . 31
2.3.4 Multi-band OFDM . . . . . . . . . . . . . . . . . . . . . . . . . . 33
2.3.4.1 Multi-band technique . . . . . . . . . . . . . . . . . . . 33
2.3.4.2 Impulse radio and MB-OFDM comparison . . . . . . . 35
2.4 Applications . . . . . . . . . . . . . . . . . . . . . . . . . . . . . . . . . . 35
2.4.1 WiMAX . . . . . . . . . . . . . . . . . . . . . . . . . . . . . . . . 35
2.4.1.1 Channel model . . . . . . . . . . . . . . . . . . . . . . . 37
2.4.1.2 Energy consumption . . . . . . . . . . . . . . . . . . . . 38
2.4.2 PLC . . . . . . . . . . . . . . . . . . . . . . . . . . . . . . . . . . 40
2.4.2.1 Power line channel . . . . . . . . . . . . . . . . . . . . . 41
2.4.2.2 Energy consumption . . . . . . . . . . . . . . . . . . . . 45
2.4.3 WiMedia . . . . . . . . . . . . . . . . . . . . . . . . . . . . . . . 45
2.4.3.1 UWB indoor channel model . . . . . . . . . . . . . . . 46
2.5 Conclusion . . . . . . . . . . . . . . . . . . . . . . . . . . . . . . . . . . 47
3 UWT approach: Application to resource allocation of OFDM systems 51
3.1 Introduction . . . . . . . . . . . . . . . . . . . . . . . . . . . . . . . . . . 51
3.2 Energy versus quantity of information . . . . . . . . . . . . . . . . . . . 52
3.2.1 Fundamental of information theory . . . . . . . . . . . . . . . . . 53
3.2.2 Lower bound of energy . . . . . . . . . . . . . . . . . . . . . . . . 53
3.3 UWT approach and energy efficiency . . . . . . . . . . . . . . . . . . . . 55
3.4 Resource allocation of parallel and quasi-static channels . . . . . . . . . 57
3.4.1 Lower bound of energy . . . . . . . . . . . . . . . . . . . . . . . . 57
3.4.2 Water-filling solution . . . . . . . . . . . . . . . . . . . . . . . . . 58
x
CONTENTS
3.4.3 Energy efficiency optimization . . . . . . . . . . . . . . . . . . . 60
3.4.3.1 Minimization of maximum time of communication . . . 60
3.4.3.2 Channel occupancy cumulative time optimization . . . 63
3.4.4 Proposed algorithm . . . . . . . . . . . . . . . . . . . . . . . . . 65
3.5 Applications and results . . . . . . . . . . . . . . . . . . . . . . . . . . . 65
3.5.1 WiMAX results . . . . . . . . . . . . . . . . . . . . . . . . . . . . 65
3.5.2 PLC results . . . . . . . . . . . . . . . . . . . . . . . . . . . . . . 67
3.6 Conclusion . . . . . . . . . . . . . . . . . . . . . . . . . . . . . . . . . . 70
4 UWB parameters optimization 73
4.1 Introduction . . . . . . . . . . . . . . . . . . . . . . . . . . . . . . . . . . 73
4.2 Resource allocation and energy optimization in UWB . . . . . . . . . . 74
4.2.1 Problem formulation . . . . . . . . . . . . . . . . . . . . . . . . . 74
4.2.2 Energy efficiency and system parameters . . . . . . . . . . . . . . 75
4.3 QoS and energy efficiency . . . . . . . . . . . . . . . . . . . . . . . . . . 76
4.4 Capacity optimization . . . . . . . . . . . . . . . . . . . . . . . . . . . . 78
4.4.1 Capacity calculation . . . . . . . . . . . . . . . . . . . . . . . . . 80
4.4.2 Guard time optimization . . . . . . . . . . . . . . . . . . . . . . 81
4.4.2.1 Optimization Method . . . . . . . . . . . . . . . . . . . 81
4.4.3 Parameters adjustment for guard time optimization . . . . . . . 83
4.4.3.1 Delay spread metric . . . . . . . . . . . . . . . . . . . . 83
4.4.3.2 Energy of channel approximation . . . . . . . . . . . . . 84
4.4.3.3 System capacity approximation . . . . . . . . . . . . . . 85
4.4.4 Applications and simulation results . . . . . . . . . . . . . . . . . 86
4.4.4.1 Capacity optimization . . . . . . . . . . . . . . . . . . . 86
4.4.4.2 Parameters optimization . . . . . . . . . . . . . . . . . 88
4.4.4.3 Performance evaluation and validation . . . . . . . . . . 93
4.5 MB resource management principle . . . . . . . . . . . . . . . . . . . . . 95
4.5.1 Problem formulation . . . . . . . . . . . . . . . . . . . . . . . . . 95
4.5.2 Energy and sub-band allocation . . . . . . . . . . . . . . . . . . . 96
4.6 Conclusion . . . . . . . . . . . . . . . . . . . . . . . . . . . . . . . . . . 97
xi
CONTENTS
5 Pulse design 99
5.1 Introduction . . . . . . . . . . . . . . . . . . . . . . . . . . . . . . . . . . 99
5.2 Time reversal pulse . . . . . . . . . . . . . . . . . . . . . . . . . . . . . . 100
5.2.1 Pulse design: Cauchy-Schwarz inequality . . . . . . . . . . . . . 100
5.2.2 Comparison between UWB pulse and time reversal pulse . . . . 103
5.2.3 Pulse without phase estimation . . . . . . . . . . . . . . . . . . . 105
5.3 Optimal pulse for energy minimization . . . . . . . . . . . . . . . . . . . 105
5.3.1 Problem formulation . . . . . . . . . . . . . . . . . . . . . . . . . 105
5.3.2 Performance evaluation . . . . . . . . . . . . . . . . . . . . . . . 107
5.4 Conclusion . . . . . . . . . . . . . . . . . . . . . . . . . . . . . . . . . . 108
Conclusion and perspectives 111
Appendix A 115
Appendix B 117
Bibliography 121
xii
Résumé étendu en français
Introduction
Avec la croissance fulgurante de l’utilisation des systèmes de communication sans fil
et filaires et la forte expansion de l’Internet mobile et services multimédias, l’accès
à Internet sans fil et filaires est devenu une partie intégrante et vitale de la société
moderne. En conséquence, la demande des nouvelles applications, services et le nombre
d’utilisateurs ne cessent de croître. Ces nouveaux services et technologies exigent de
plus en plus de ressources. La transmission des données augmente d’un facteur de 10
tous les cinq ans, ce qui provoque une augmentation de la consommation d’énergie de
16 à 20% chaque année. En appliquant ce taux aux réseaux de communication, qui
contribuent à plus de 50% de l’ensemble du secteur des technologies de l’information et
de la communication (TIC), un grand défi en ce qui concerne les besoins énergétiques
des réseaux filaires et sans fil doit être relevé à l’avenir. Actuellement, le secteur des TIC
consomme 3% de l’énergie mondiale. Sur ces 3%, l’énergie utilisée pour les systèmes de
télécommunications représente 57%.
L’humanité est également confrontée au problème de réchauffement climatique, ce
qui peut entraîner des conséquences désastreuses. Ce dernier est principalement causé
par les émissions de gaz à effet de serre provenant des activités humaines. Parmi ces gaz
émis, le dioxyde de carbone co2 est l’un des plus grands contributeurs, principalement
générés par l’utilisation de l’énergie. L’émission de co2 a fortement augmenté avec la
révolution industrielle. Les activités humaines émettent deux fois plus de co2 que les
processus naturels peuvent absorber. En raison de cette augmentation des émissions
de co2, il y a un intérêt considérable dans la réduction de la consommation actuelle
d’énergie pour le secteur des télécommunications.
xiii
Le changement climatique, la hausse des coûts de l’énergie et les contraintes de
ressources deviennent des enjeux principaux pour les gouvernements et les entreprises.
Ces questions conduisent à des nouvelles tendances dans le développement des tech-
nologies vertes. L’étude des communications efficaces du point de vue énergétique
nécessitent des investigations dans divers domaines. Dans ce contexte, une gestion effi-
cace de l’énergie grâce à des stratégies d’allocation est essentielle pour mieux exploiter
toutes les ressources disponibles sur les réseaux filaires et sans fil. Ces stratégies définis-
sent les règles de partage des ressources afin de minimiser la consommation d’énergie
dans les systèmes de communications.
Cette thèse vise à étudier et optimiser les stratégies d’allocation des ressources
(temps-fréquence) et la conception d’impulsions afin de minimiser la consommation
d’énergie. Les études menées dans cette thèse peuvent être regroupées en trois grandes
parties. Dans un premier temps, une étude analytique est menée sur la consommation
énergétique pour les réseaux actuels afin d’avoir une vision globale de la consommation
d’énergie pour les communications sans fil et filaires. WiMAX et courants porteurs en
ligne (CPL) sont pris comme exemples. La seconde partie concerne l’optimisation de
l’énergie de la couche physique pour les communications mono et multi-porteuses. Nous
proposons une nouvelle approche appelée ultra large temps (ULT) afin de mieux ex-
ploiter la consommation d’énergie. Sur la base de cette approche, une nouvelle métrique
et de nouveaux algorithmes d’allocation sont définis. Enfin, dans la dernière partie,
nous nous focalisons sur la conception d’impulsions pour les systèmes ultra large bande
(ULB). Les systèmes actuels utilisent l’impulsion gaussienne pour la transmission. Pre-
mièrement les paramètres de l’impulsion gaussienne sont optimisés de façon à réduire la
consommation d’énergie. Deuxièmement, nous utilisons des nouvelles formes d’ondes
pour les communications ULB afin de minimiser la consommation d’énergie.
xiv
Résumé étendu en français
Chapitre 1
Radio verte
Introduction
Les initiatives environnementales dans le secteur des télécommunications d’aujourd’hui
sont multiples. Deux objectifs des TIC doivent être notés. D’abord la consomma-
tion d’énergie dans le secteur des TIC doit être contrôlée. Deuxièmement, exploiter
les potentialités des TIC pour aider les autres secteurs à réduire leurs consommation
énergétique. Ajoutant à cela, la réduction d’émission de co2, le groupe d’experts inter-
gouvernemental sur l’évolution du climat (IPCC) a fixé l’objectif de réduire de moitié
les émissions de gaz à effet de serre le plus rapidement possible avant 2050.
Émissions de gaz à effet de serre
Dans les dernières décennies, le monde a connu une forte augmentation des émissions
de gaz à effet de serre ( le dioxyde de carbone, le méthane, l’oxyde nitreux, ...). Parmi
ces gaz émis, le dioxyde de carbone co2 est l’un des plus grands contributeurs, prin-
cipalement généré par l’utilisation d’énergie et représente plus de 84% de ces gaz. La
concentration de co2 dans l’atmosphère est de plus en plus élevée, l’augmentation d’au
moins 35% depuis la révolution industrielle et de 18% depuis 1960. L’humanité transmet
40 GT (gigatonnes) de dioxyde de carbone. Le nouveau rapport de l’agence interna-
tionale de l’énergie prevoit une emission d’environ 45 GT de dioxyde de carbone d’ici
2030. Le groupe d’experts intergouvernemental sur le changement climatique (IPCC)
prévoit une augmentation de la température moyenne de 1,1 à 6.4◦C d’ici 2100. Ce
réchauffement est des dizaines de fois plus rapide que ce que l’humanité a connu depuis
sa création.
Actuellement, le secteur des TIC représente environ 2% des émissions mondiales
de co2. Sur ces 2%, le secteur des télécommunications représente 28% d’émissions
totales. Les réseaux mobiles sont responsables de 43% du co2 émis par le secteur des
télécommunications, où le réseau radio est responsable de 80 à 90% d’empreinte co2
de l’infrastructure mobile. D’autre part, il est estimé que le secteur des TIC atteint
un niveau de 2,6% des émissions mondiales de co2 à l’horizon 2020. A cet effet, il y a
un intérêt considérable dans la réduction effective de la consommation d’énergie dans
xv
le secteur du sans fil, en particulier en Europe. Orange (France), Ericsson (Suède) et
Vodafone (Royaume-Uni) veulent réduire considérablement leurs émissions de co2 dans
une proportion de 20 à 50% d’ici 2020.
Radio verte
L’objectif principal dans les technologies vertes est de fournir de nouvelles techniques
pour économiser l’énergie. Les technologies vertes sont des initiatives clés pour de
futures applications. Pour caractériser et quantifier la consommation d’un système de
communication, il est nécessaire de prendre en compte tous les éléments ou fonctions
nécessitant de l’énergie : le traitement de signal, tant à l’émission qu’à la réception, les
transducteurs ou les têtes radio fréquences, les relais et d’autres intermédiaires. Une
approche véritablement globale de la consommation et de la pollution doit également
prendre en compte la fabrication, l’installation, la maintenance et le recyclage des
éléments.
Motivations et vision
L’allocation de ressources dans un système de communication est un enjeu important,
lorsque l’on cherche à optimiser ses performances. Tout système doit en effet faire
face à un certain nombre de limitations physiques et technologiques et des contraintes
supplémentaires imposées par les utilisateurs. Cette thèse vise à étudier et optimiser
les stratégies d’allocation de ressources. La consommation d’énergie sera intégrée dans
les critères d’optimisation. Selon le paradigme proposé par Shannon, un canal de com-
munication peut être divisé en trois blocs, à savoir l’émetteur, le canal de transmission
et le récepteur. Dans ce contexte, le travail de thèse se focalise sur la réduction de
la consommation d’énergie au côté de l’émetteur. Trois technologies (WiMAX, ULB,
CPL) sont examinées et optimisées, afin de répondre à cet objectif ambitieux.
xvi
Résumé étendu en français
Chapitre 2
Spécifications du système
Introduction
Le deuxième chapitre présente les principales techniques de transmission exploitées dans
cette thèse. Tout d’abord, le principe des modulations multi-porteuses, en particulier le
concept d’OFDM est détaillé. Puis un aperçu de l’allocation de ressources des systèmes
multi-porteuse est décrit, laquelle peut être considéré comme le point départ de nos
études. La deuxième partie de ce chapitre est consacrée à la description du système
ULB. Enfin, les systèmes considérés dans cette thèse sont présentés. Outre le modèle
de canal adopté est également donnée. En outre, la consommation d’énergie pour les
systèmes WiMAX et CPL sont fournis.
OFDM
Les techniques de modulations multi-porteuses comme l’OFDM ont été retenues pour
assurer des débits de transmission élevés dans les milieux très sélectifs en fréquence.
Cette technique permet la transmission des données à haut débit. L’OFDM appartient
à une famille de systèmes de transmission appelée modulation multi-porteuses, qui
repose sur l’idée de diviser un flux de données haut débit en plusieurs flux parallèles
de bas débit. La modulation multi-porteuses permet d’éliminer ou de minimiser les
interférences inter-symbole (ISI).
Allocation de ressources
La gestion des ressources au sein d’un système de communications s’impose comme
une question de premier plan dès lors que l’on cherche à optimiser ses performances.
Dans l’hypothèse d’une connaissance parfaite de la réponse du canal, on peut alors
optimiser ces paramètres libres du système en fonction du comportement du canal et
des contraintes afin d’assurer un certain niveau de qualité de service. Les ressources qui
doivent être gérées dépendent du système mis en œuvre et peuvent être la fréquence, le
temps, l’énergie d’émission, etc. L’allocation des ressources peut être considérée comme
un problème d’optimisation sous contrainte et est généralement divisée en deux cas : la
maximisation de débit (RM) et la maximisation de la robustesse (ROM) ou l’objectif
xvii
est de, respectivement, maximiser le débit réalisable et la robustesse du système contre
le bruit. Dans cette thèse, l’objectif d’optimisation est de minimiser l’énergie pour
transmettre une quantité d’information.
ULB
L’ULB est une technique de transmission radio qui consiste à utiliser des signaux
s’étalant sur une large bande de fréquences, typiquement de l’ordre de 500 MHz à
plusieurs GHz. Une définition aujourd’hui communément admise est que les signaux
ULB ont un rapport largeur de bande sur fréquence centrale, ou fractionnel band, au
moins égal à 20% ou bien une largeur de bande supérieure à 500 MHz. Aux États-Unis,
la FCC a alloué un spectre s’étalant de 3,1 à 10,6 GHz pour les applications ULB sans
licence, avec une limite de DSP de -41,3 dBm/MHz sur tout le spectre, alors qu’en
Europe l’ECC (European Communications Commission) a imposé une limite de DSP
beaucoup plus faible, sauf sur la bande de 6-8,5 GHz. Des mesures similaires sur la
puissance d’émission des systèmes ULB ont aussi été prises dans le reste du monde.
Ces sévères limitations en puissance ont pour but principal de réduire les interférences
avec les systèmes à bande étroite dont le spectre est masqué par celui de l’ULB, tels
que l’UMTS, le GSM et le WLAN.
La solution MB-OFDM
La solution MB-OFDM est basée sur une modulation OFDM et une technique multi-
bandes qui divise le spectre ULB en 14 sous-bandes de 528 MHz chacune. La plupart
des études ont été réalisées sur les trois premières sous-bandes. Les avantages de la
solution MB-OFDM résident principalement dans sa faible complexité technique, la
modulation OFDM présentant un grand degré de maturité et étant déjà adoptée par
plusieurs standards (e.g., DVB-T, DVB-H, ADSL, 802.11a, etc.).
xviii
Résumé étendu en français
Chapitre 3
ULT Approche : allocation de ressources pour le système
OFDM
Introduction
Dans ce chapitre, nous réalisons une étude asymptotique de la consommation d’énergie
dans les systèmes mono et multi-porteuses. Les résultats de l’étude permettent de
définir la limite asymptotique d’énergie pour transmettre une quantité d’information
et conduisent à proposer une nouvelle approche pour les systèmes de communication.
Dans la deuxième partie, nous nous focalisons sur l’allocation des ressources pour les
canaux parallèles. Les solutions développées visent à proposer la distribution de bits
et d’énergie dans les systèmes de communication. Trois cas d’allocation de ressources
sont étudiés afin d’obtenir une meilleure efficacité énergétique pour les systèmes multi-
porteuses par rapport aux solutions existantes. L’approche proposée d’allocation de
ressources peut être utilisée pour tous les modèles de canaux parallèles. Les résultats
sont présentés pour les réseaux CPL et WiMAX. De plus, les performances des algo-
rithmes d’allocations proposés sont comparées aux résultats obtenus avec le schéma
OFDM conventionnel. Les différents résultats présentés dans ce chapitre montrent une
amélioration significative de la consommation d’énergie avec les solutions proposées.
Limite énergétique
Pour économiser l’énergie, l’émetteur et le récepteur peuvent être conçus pour max-
imiser l’information par unité d’énergie. L’énergie minimum requise est atteinte lorsque
le nombre de degrés de liberté est illimité. Le nombre de degrés de liberté est représenté
par l’élément fréquence-temps de la formule.
J =(
2Q
T B − 1)
TBN0 (1)
où J est l’énergie totale nécessaire pour envoyer Q bits, T et B sont le temps et la bande
de transmission respectivement. Pour la transmission d’une quantité d’information
donnée, avec un temps infini de transmission ou une bande de transmission infinie, le
nombre de degrés de liberté tend vers l’infini et l’énergie minimale pour transmettre une
quantité d’information est obtenue. Le compromis entre le temps de communication et
xix
100
101
102
�120
�110
�100
�90
�80
�70
�60
Time (s)
J (
dB
J)
Energy
Asymptotic limit
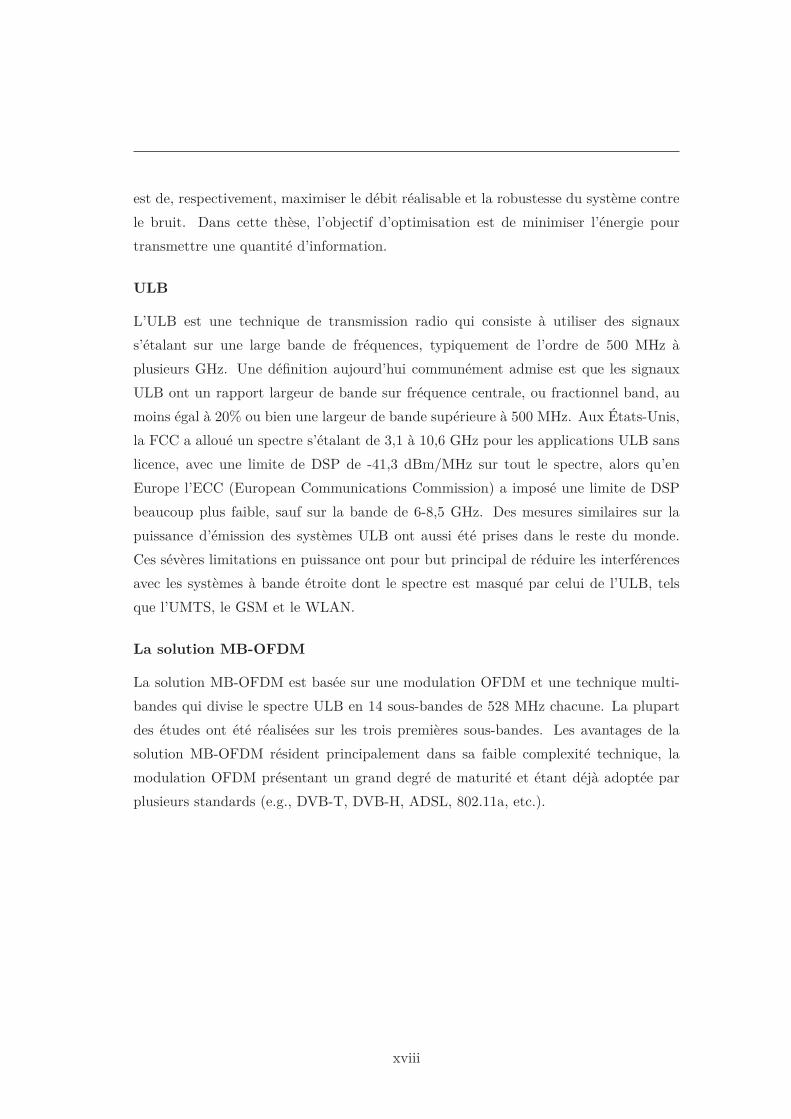
Figure 1: Relation entre l’énergie et le temps de communication
l’énergie est représentée sur la Fig. (1). Dans cet exemple Q = 1 Gbit, B = 50 MHz.
Nous observons que l’énergie diminue lorsque le temps de communication augmente.
Pour réduire l’énergie de transmission, il est nécessaire de transmettre les données
sur une longue période de temps que nous définissons comme une nouvelle approche
appelée ULT. Par définition, la quantité d’informations et l’énergie réalisées dans un
système mono-porteuse ULT sont déterminées par
limT →∞
J = QN0 loge 2 (2)
Dans un système multi-porteuses ULT, l’énergie est défini
limT →∞
J =QN0 log 2
maxi
|hi|2(3)
Pour caractériser la consommation d’énergie des systèmes de communication, nous
définissons une nouvelle métrique, appelée efficacité énergétique.
Definition 1 L’efficacité énergétique est le rapport entre la limite asymptotique d’énergie
d’un système et l’énergie consommée par ce système.
J(β) =1
βN0Q loge 2 (4)
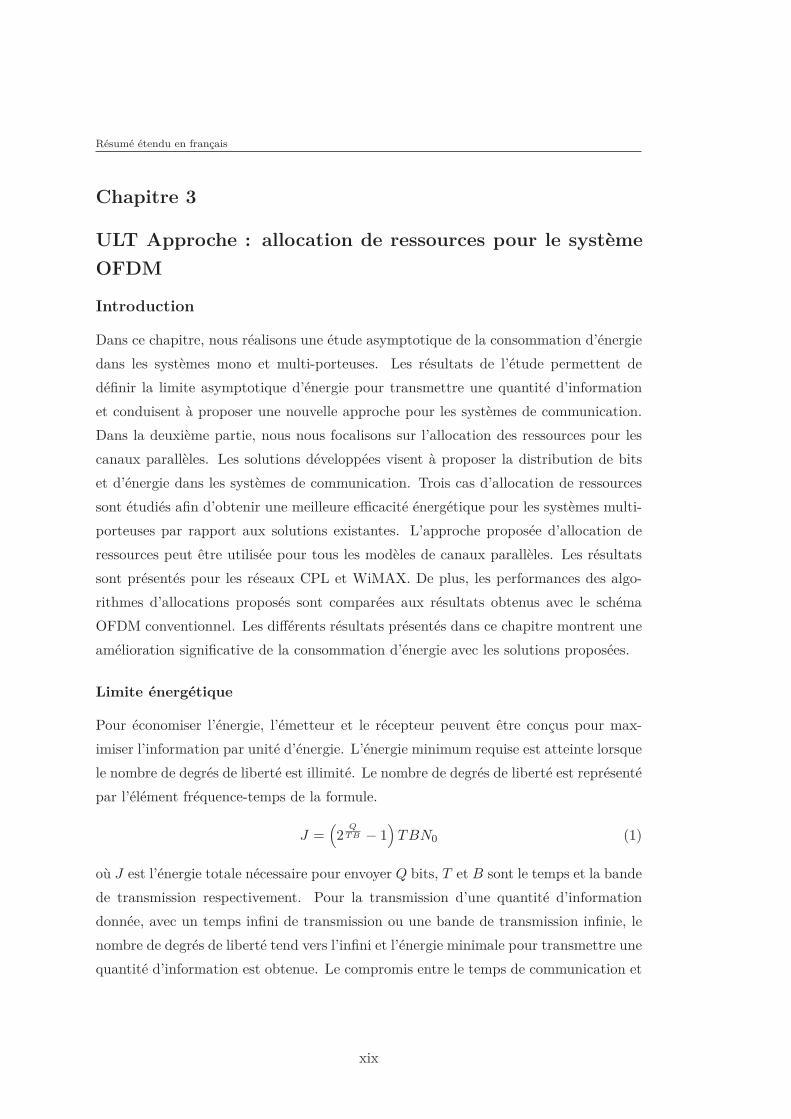
Avec cette définition, β vérifie 0 < β ≤ 1. La relation entre l’efficacité énergétique, la
quantité d’information et le temps de communication est donnée dans la Fig. (2).
Minimisation du temps de communication
Dans un premier temps, nous proposons de minimiser le temps maximum de commu-
nication. L’objectif d’allocation de ressources est alors de trouver la combinaison de
xx
Résumé étendu en français
00.2
0.40.6
0.81
�10
�5
00
20
40
60
80
100
Data (Gbit)β (dB)
Tim
e (
s)
Figure 2: Relation entre l’efficacité énergétique, la quantité d’information et le temps decommunication
{Qi, T i} qui satisfait la contrainte d’énergie. Le problème d’optimisation est défini
comme suit
min maxi
Ti subject to
n∑
i=1
Qi = Q
n∑
i=1
Ji =lim
T →∞J
β
Qi ≥ 0, Ji ≥ 0
(5)
Optimisation du temps cumulé de communication
Avec certains systèmes de communication, il peut être intéressant de minimiser temps
cumulé d’occupation des canaux et non pas le temps maximum de communication.
L’avantage est de libérer dès que possible les canaux pour d’autres communications.
Par exemple, avec une efficacité donnée, le problème est défini par :
min∑
i
Ti subject to
n∑
i=1
Qi = Q
n∑
i=1
Ji =lim
T →∞J
β
Qi ≥ 0, Ji ≥ 0
(6)
xxi
0 0.5 1 1.5 20
10
20
30
40
50
60
Distance (km)
En
erg
y (
dB
J)
Conventional WiMAX
Green UWT WiMAX
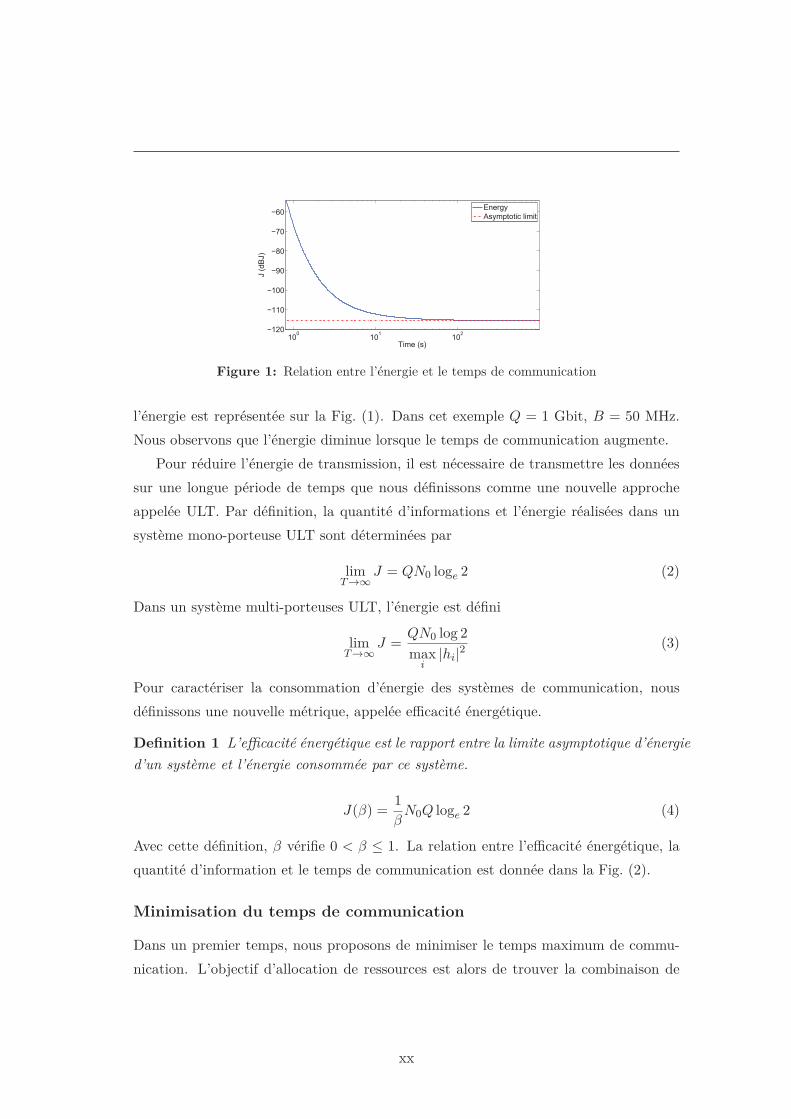
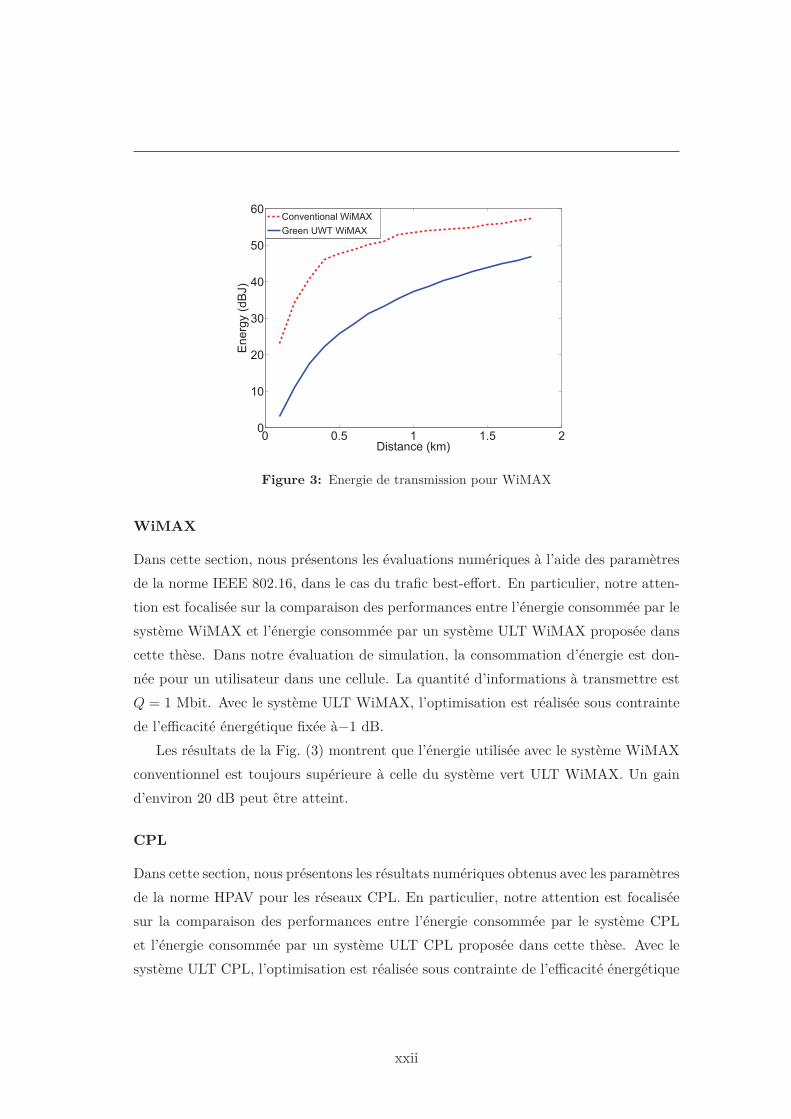
Figure 3: Energie de transmission pour WiMAX
WiMAX
Dans cette section, nous présentons les évaluations numériques à l’aide des paramètres
de la norme IEEE 802.16, dans le cas du trafic best-effort. En particulier, notre atten-
tion est focalisée sur la comparaison des performances entre l’énergie consommée par le
système WiMAX et l’énergie consommée par un système ULT WiMAX proposée dans
cette thèse. Dans notre évaluation de simulation, la consommation d’énergie est don-
née pour un utilisateur dans une cellule. La quantité d’informations à transmettre est
Q = 1 Mbit. Avec le système ULT WiMAX, l’optimisation est réalisée sous contrainte
de l’efficacité énergétique fixée à−1 dB.
Les résultats de la Fig. (3) montrent que l’énergie utilisée avec le système WiMAX
conventionnel est toujours supérieure à celle du système vert ULT WiMAX. Un gain
d’environ 20 dB peut être atteint.
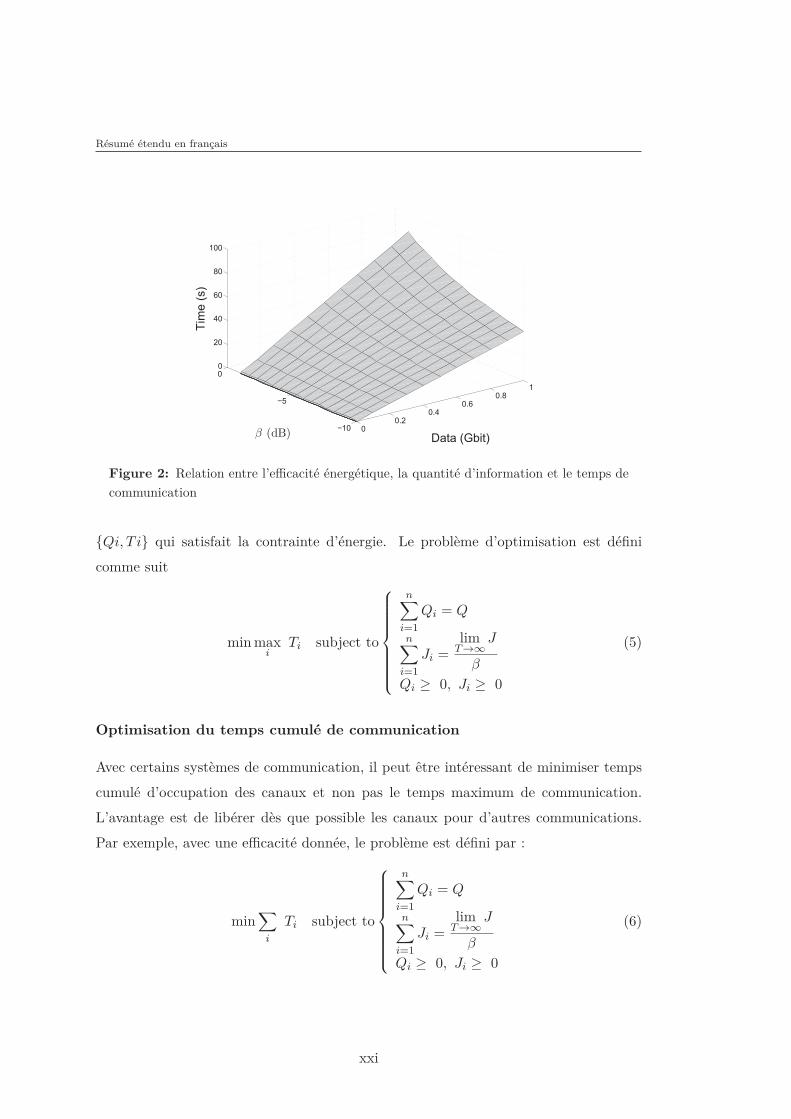
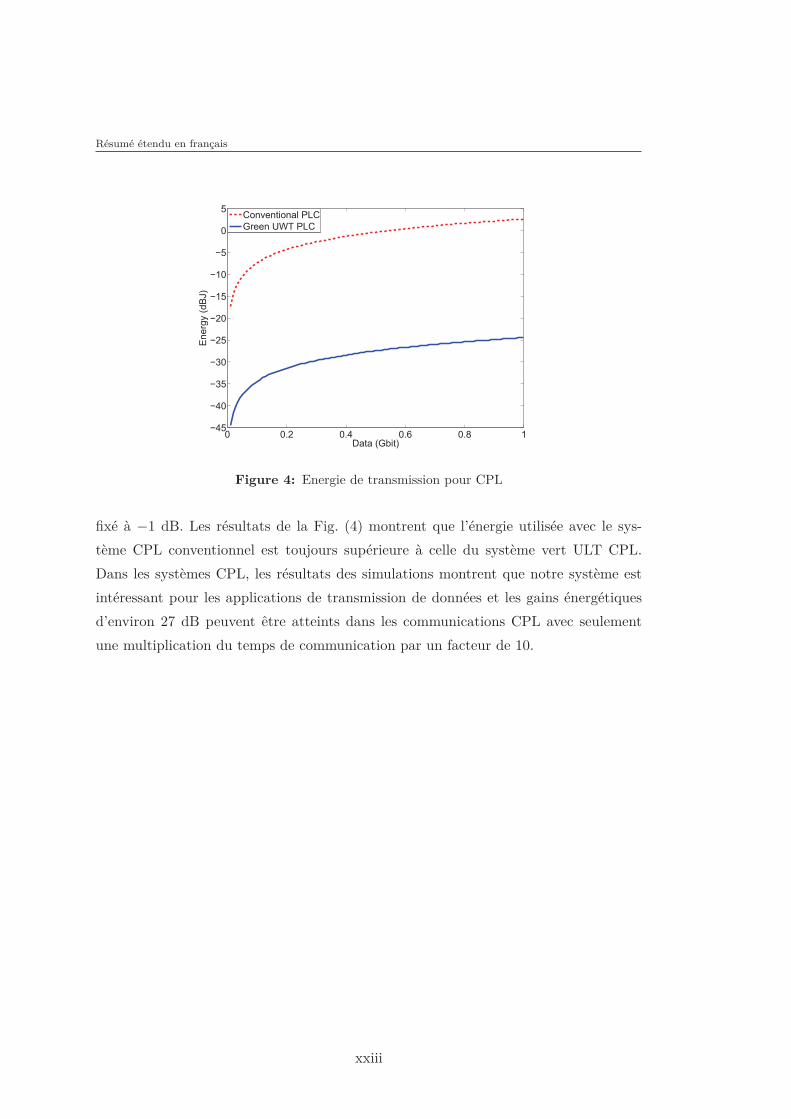
CPL
Dans cette section, nous présentons les résultats numériques obtenus avec les paramètres
de la norme HPAV pour les réseaux CPL. En particulier, notre attention est focalisée
sur la comparaison des performances entre l’énergie consommée par le système CPL
et l’énergie consommée par un système ULT CPL proposée dans cette thèse. Avec le
système ULT CPL, l’optimisation est réalisée sous contrainte de l’efficacité énergétique
xxii
Résumé étendu en français
0 0.2 0.4 0.6 0.8 1�45
�40
�35
�30
�25
�20
�15
�10
�5
0
5
Data (Gbit)
En
erg
y (
dB
J)
Conventional PLC
Green UWT PLC
Figure 4: Energie de transmission pour CPL
fixé à −1 dB. Les résultats de la Fig. (4) montrent que l’énergie utilisée avec le sys-
tème CPL conventionnel est toujours supérieure à celle du système vert ULT CPL.
Dans les systèmes CPL, les résultats des simulations montrent que notre système est
intéressant pour les applications de transmission de données et les gains énergétiques
d’environ 27 dB peuvent être atteints dans les communications CPL avec seulement
une multiplication du temps de communication par un facteur de 10.
xxiii
Chapitre 4
Optimisation des paramètres d’un système ULB
Introduction
Le travail dans ce chapitre se focalise sur les communications ULB. L’objectif princi-
pal est de définir les paramètres des systèmes ULB qui minimisent la consommation
d’énergie. La première proposition est d’utiliser la forme d’onde des systèmes ULB,
puis de déterminer les paramètres optimaux pour la minimisation de l’énergie. Dans ce
chapitre, nous nous focalisons sur l’impulsion gaussienne proposée pour les systèmes de
communication ULB. Différents paramètres (largeur de l’impulsion Tp, temps de garde
Tg, nombre de répétitions d’impulsions L) sont exploitées pour optimiser l’énergie d’un
système ULB.
En plus de l’efficacité énergétique, dans la deuxième partie, nous nous focalisons
sur la maximisation de la capacité. L’efficacité énergétique est fixée par la métrique
d’efficacité énergétique, et la capacité du système est maximisée. La principale ap-
proche pour la conception de systèmes ULB est de choisir la durée de symbole plus
large que la réponse impulsionnelle du canal, afin d’éviter les interférences inter-symbole
(ISI). Cependant, cette approche ne permet pas de maximiser la capacité du système.
L’adaptation du temps de garde est un moyen flexible de l’exploitation des ressources
du système d’une manière efficace. Le temps de garde optimal est complexe à obtenir.
Pour réduire cette complexité, une nouvelle méthode d’optimisation est introduite.
Ce procédé d’optimisation définit des nouveaux paramètres qui fournissent des perfor-
mances très proches des performances optimales du système. Ces paramètres lient le
temps de garde aux caractéristiques du canal avec des équations simples. L’adaptation
du temps de garde est directement basée sur ces paramètres. Les résultats de simu-
lation sont effectués pour les communications ULB sur les canaux WiMedia. Dans la
dernière partie de ce chapitre, nous nous focalisons sur l’allocation de ressources pour
les systèmes multi-bandes. Le problème de minimisation d’énergie est présenté et des
nouveaux algorithmes sont proposé pour les systèmes multi-bandes.
xxiv
Résumé étendu en français
05
1015
2025
3035
0
1
2
3
4
5
−10
−8
−6
−4
−2
0
TgTp
β
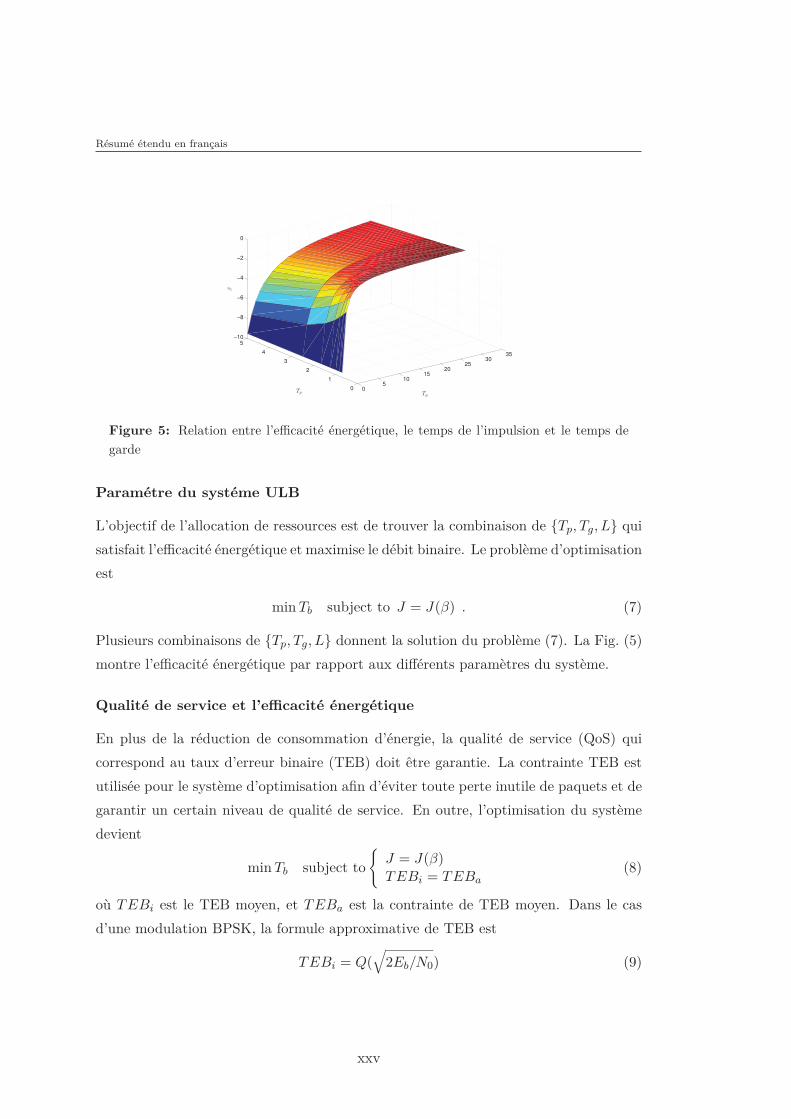
Figure 5: Relation entre l’efficacité énergétique, le temps de l’impulsion et le temps degarde
Paramétre du systéme ULB
L’objectif de l’allocation de ressources est de trouver la combinaison de {Tp, Tg, L} qui
satisfait l’efficacité énergétique et maximise le débit binaire. Le problème d’optimisation
est
min Tb subject to J = J(β) . (7)
Plusieurs combinaisons de {Tp, Tg, L} donnent la solution du problème (7). La Fig. (5)
montre l’efficacité énergétique par rapport aux différents paramètres du système.
Qualité de service et l’efficacité énergétique
En plus de la réduction de consommation d’énergie, la qualité de service (QoS) qui
correspond au taux d’erreur binaire (TEB) doit être garantie. La contrainte TEB est
utilisée pour le système d’optimisation afin d’éviter toute perte inutile de paquets et de
garantir un certain niveau de qualité de service. En outre, l’optimisation du système
devient
min Tb subject to
{
J = J(β)TEBi = TEBa
(8)
où TEBi est le TEB moyen, et TEBa est la contrainte de TEB moyen. Dans le cas
d’une modulation BPSK, la formule approximative de TEB est
TEBi = Q(√
2Eb/N0) (9)
xxv
La nouvelle optimisation fournit les valeurs optimales du système sous contraintes
de TEB et d’efficacité énergétique.
Optimisation de la capacité
L’impulsion gaussienne a été initialement proposée et a été largement utilisée pour
les applications ULB. La durée de symbole système ULB est généralement large de
telle sorte que l’interférence entre symboles soit négligée. Cependant pour maximiser
la capacité, le système n’a pas nécessairement besoin d’un temps de garde très large.
Autrement dit, le système peut tolérer une quantité d’interférence afin de réduire le
temps de garde, et la capacité du système peut être augmentée. L’adaptation du temps
de garde permet l’exploitation des ressources de manière efficace. Dans ce chapitre, nous
présentons une analyse du problème d’optimisation de temps de garde. Le problème
d’optimisation est complexe et nécessite un temps de calcul important. Le développe-
ment d’une nouvelle méthode d’optimisation pour réduire la complexité du système et
améliorer la capacité d’adaptation de temps de garde est nécessaire. Une des méthodes
efficaces consiste à définir de nouveaux paramètres qui fournissent des performances
très proches à la configuration optimale. Ces paramètres relient le temps de garde aux
caractéristiques du canal avec des équations simples. Trois mesures du canal sont con-
sidérées. Ces mesures sont la moyenne quadratique (RMS) de retard du canal, l’énergie
reçue et l’utilisation de la formule de la capacité. Ce choix est motivé par le fait que
ces mesures peuvent être obtenues facilement dans les systèmes de communication. Le
procédé d’optimisation fournit la valeur des paramètres qui seront utilisés directement
dans les systèmes pratiques. Ces valeurs des paramètres facilitent le calcul du temps
de garde et évitent ainsi le coût associé à l’optimisation du temps de garde. Le temps
de garde peut être flexible et adapté par cette méthode pour n’importe quel canal.
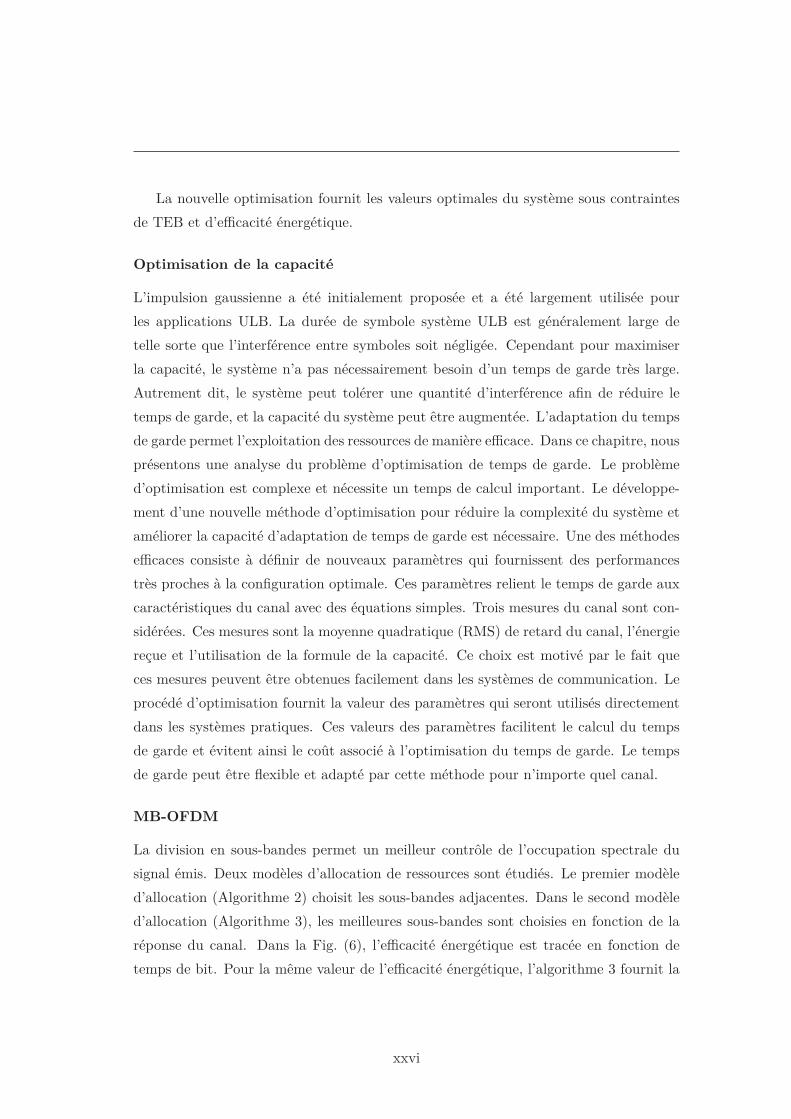
MB-OFDM
La division en sous-bandes permet un meilleur contrôle de l’occupation spectrale du
signal émis. Deux modèles d’allocation de ressources sont étudiés. Le premier modèle
d’allocation (Algorithme 2) choisit les sous-bandes adjacentes. Dans le second modèle
d’allocation (Algorithme 3), les meilleures sous-bandes sont choisies en fonction de la
réponse du canal. Dans la Fig. (6), l’efficacité énergétique est tracée en fonction de
temps de bit. Pour la même valeur de l’efficacité énergétique, l’algorithme 3 fournit la
xxvi
Résumé étendu en français
5 10 15 20 25 30 35 40�10
�9
�8
�7
�6
�5
�4
�3
�2
�1
Tb (ns)
β(dB)
Algorithm 2
Algorithm 3
Figure 6: la relation entre le temps de bit et l’efficacité énergétique
durée minimale de bit. Cet algorithme nécessite moins d’énergie pour le même débit
binaire.
xxvii
Chapitre 5
Conception des impulsions
Introduction
Dans les systèmes de communications, nous pouvons utiliser d’autres impulsions avec le
nouveau défi de la radio verte, les nouveaux systèmes de communication ULB ont besoin
de concevoir une nouvelle forme d’onde afin d’atteindre une consommation d’énergie op-
timale. Ce chapitre traite le problème de la conception de l’impulsion ULB. La question
principale ici est de concevoir une impulsion sans assumer une forme d’onde de base.
Dans ce chapitre, nous étudions diverses impulsions qui consomment moins d’énergie
que l’impulsion gaussienne . Deux impulsions d’émission dans les communications ULB
sont proposées. Chaque impulsion apporte une amélioration en termes d’efficacité én-
ergétique. Dans un premier temps, l’impulsion est optimisée dans le cas d’un récepteur
à filtre adapté. Par ailleurs, une amélioration à cette impulsion est également fournie.
Deuxièmement, nous ne nous limitons pas au récepteur à filtre adapté. Notre approche
consiste à obtenir la meilleur impulsion d’émission dans le cas général. Une nouvelle
impulsion est alors donnée dans ce chapitre.
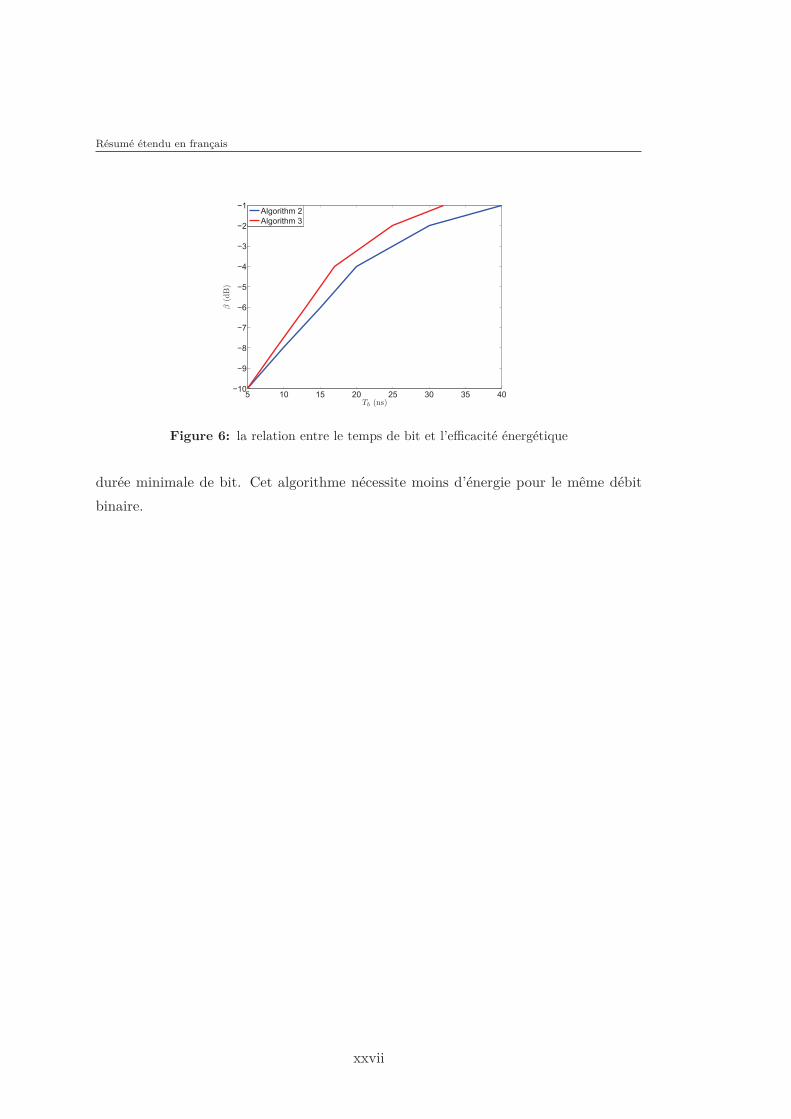
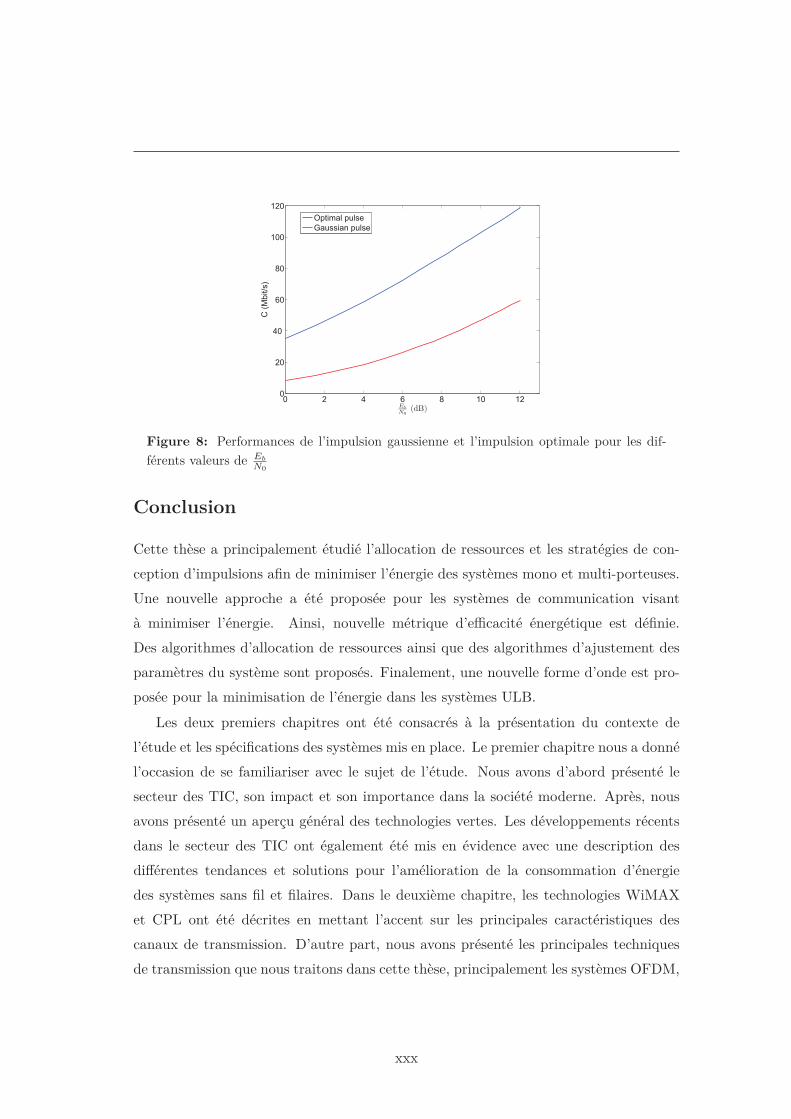
Retournement temporel
L’objectif de cette section est de trouver l’impulsion qui maximise le rapport signal sur
bruit dans le cas du récepteur à filtre adapté. Une impulsion sous-optimale a été trouvée
en appliquant l’inégalité de Cauchy-Schwarz. Cette solution conduit à l’utilisation de
l’impulsion de retournement temporel. L’impulsion de retournement temporel fournit
les meilleures performances en termes de TEB et de la capacité pour une valeur fixe de
Eb/N0. Le gain entre les deux impulsions est supérieur à 3 dB. Comme dans la Fig. (7),
un facteur de gain de 50% en termes d’énergie est alors atteint avec l’impulsion de
retournement temporel. Cette impulsion permet des gains d’énergie dans les systèmes
de communication avec les mêmes performances.
Impulsion optimale
Dans cette section, notre objectif est de définir l’impulsion optimale pour un sys-
tème de communication. Pour établir une formulation plus explicite de minimisa-
xxviii
Résumé étendu en français
0 2 4 6 8 10 120
20
40
60
80
Eb
N0
(dB)
C (
Mb
it/s
)
Gaussian pulse
Time reversal pulse
Figure 7: Performances de l’impulsion gaussienne et l’impulsion de retournement temporelpour les différents valeurs de Eb
N0
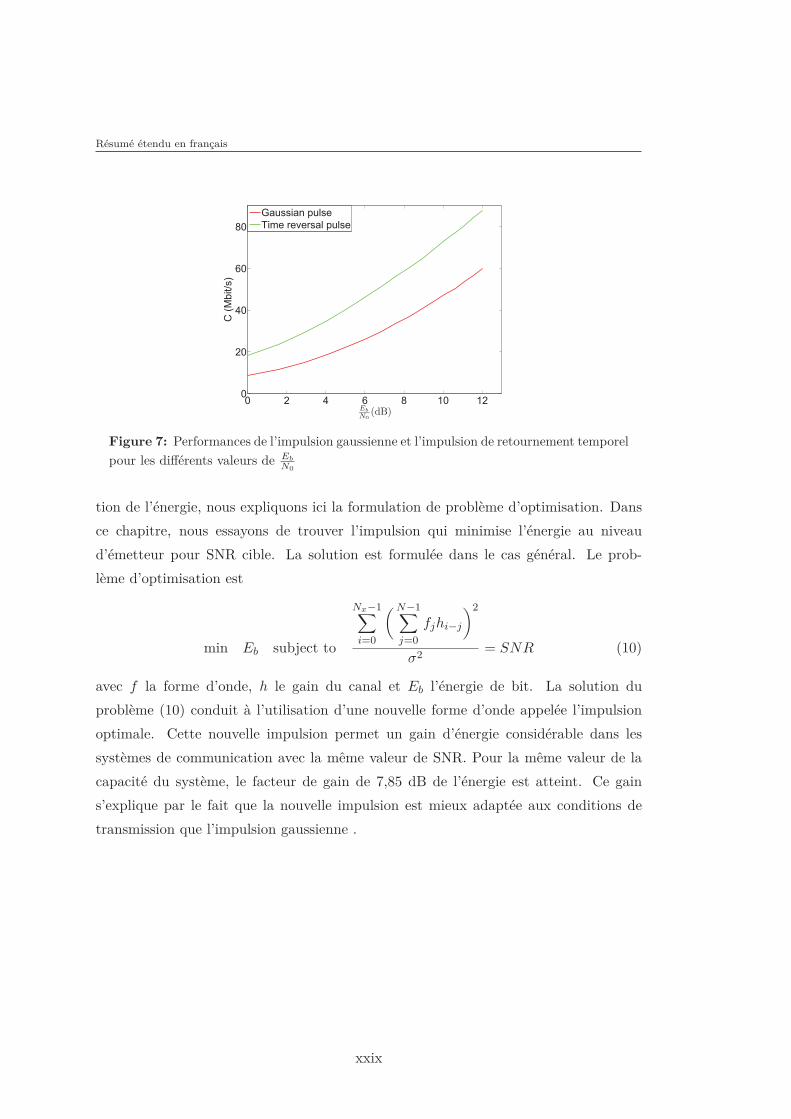
tion de l’énergie, nous expliquons ici la formulation de problème d’optimisation. Dans
ce chapitre, nous essayons de trouver l’impulsion qui minimise l’énergie au niveau
d’émetteur pour SNR cible. La solution est formulée dans le cas général. Le prob-
lème d’optimisation est
min Eb subject to
Nx−1∑
i=0
( N−1∑
j=0
fjhi−j
)2
σ2= SNR (10)
avec f la forme d’onde, h le gain du canal et Eb l’énergie de bit. La solution du
problème (10) conduit à l’utilisation d’une nouvelle forme d’onde appelée l’impulsion
optimale. Cette nouvelle impulsion permet un gain d’énergie considérable dans les
systèmes de communication avec la même valeur de SNR. Pour la même valeur de la
capacité du système, le facteur de gain de 7,85 dB de l’énergie est atteint. Ce gain
s’explique par le fait que la nouvelle impulsion est mieux adaptée aux conditions de
transmission que l’impulsion gaussienne .
xxix
0 2 4 6 8 10 120
20
40
60
80
100
120
Eb
N0
(dB)
C (
Mb
it/s
)
Optimal pulse
Gaussian pulse
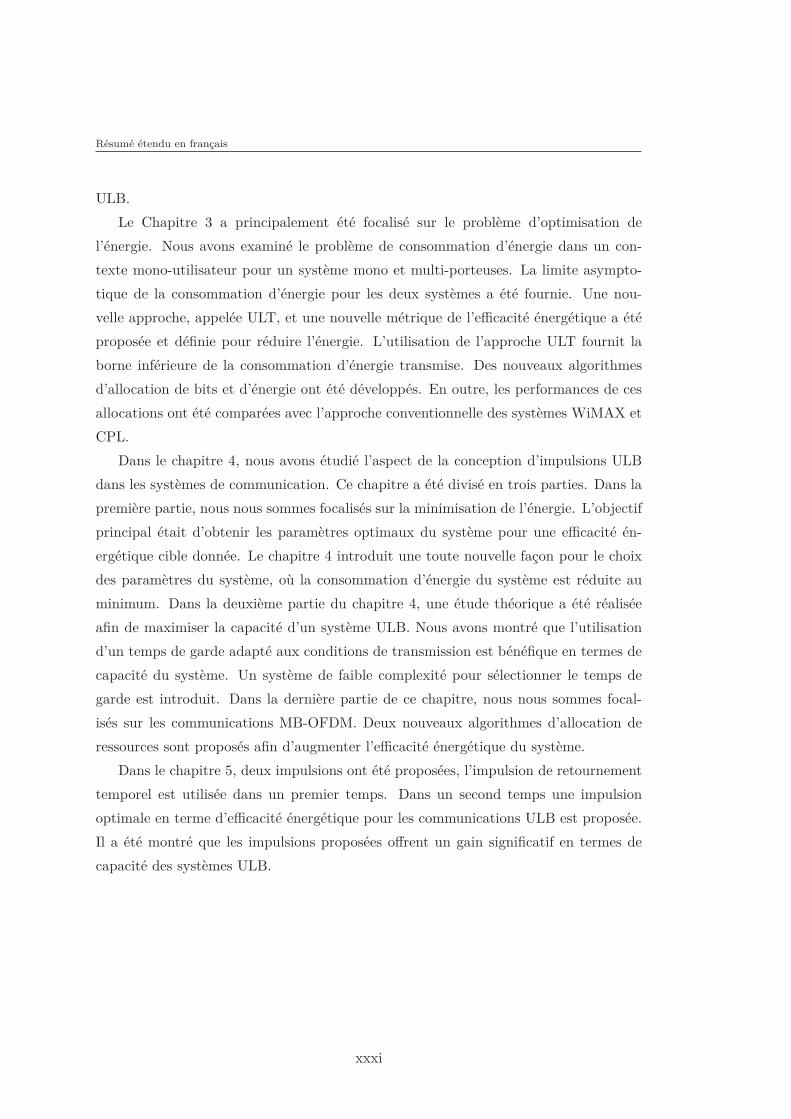
Figure 8: Performances de l’impulsion gaussienne et l’impulsion optimale pour les dif-férents valeurs de Eb
N0
Conclusion
Cette thèse a principalement étudié l’allocation de ressources et les stratégies de con-
ception d’impulsions afin de minimiser l’énergie des systèmes mono et multi-porteuses.
Une nouvelle approche a été proposée pour les systèmes de communication visant
à minimiser l’énergie. Ainsi, nouvelle métrique d’efficacité énergétique est définie.
Des algorithmes d’allocation de ressources ainsi que des algorithmes d’ajustement des
paramètres du système sont proposés. Finalement, une nouvelle forme d’onde est pro-
posée pour la minimisation de l’énergie dans les systèmes ULB.
Les deux premiers chapitres ont été consacrés à la présentation du contexte de
l’étude et les spécifications des systèmes mis en place. Le premier chapitre nous a donné
l’occasion de se familiariser avec le sujet de l’étude. Nous avons d’abord présenté le
secteur des TIC, son impact et son importance dans la société moderne. Après, nous
avons présenté un aperçu général des technologies vertes. Les développements récents
dans le secteur des TIC ont également été mis en évidence avec une description des
différentes tendances et solutions pour l’amélioration de la consommation d’énergie
des systèmes sans fil et filaires. Dans le deuxième chapitre, les technologies WiMAX
et CPL ont été décrites en mettant l’accent sur les principales caractéristiques des
canaux de transmission. D’autre part, nous avons présenté les principales techniques
de transmission que nous traitons dans cette thèse, principalement les systèmes OFDM,
xxx
Résumé étendu en français
ULB.
Le Chapitre 3 a principalement été focalisé sur le problème d’optimisation de
l’énergie. Nous avons examiné le problème de consommation d’énergie dans un con-
texte mono-utilisateur pour un système mono et multi-porteuses. La limite asympto-
tique de la consommation d’énergie pour les deux systèmes a été fournie. Une nou-
velle approche, appelée ULT, et une nouvelle métrique de l’efficacité énergétique a été
proposée et définie pour réduire l’énergie. L’utilisation de l’approche ULT fournit la
borne inférieure de la consommation d’énergie transmise. Des nouveaux algorithmes
d’allocation de bits et d’énergie ont été développés. En outre, les performances de ces
allocations ont été comparées avec l’approche conventionnelle des systèmes WiMAX et
CPL.
Dans le chapitre 4, nous avons étudié l’aspect de la conception d’impulsions ULB
dans les systèmes de communication. Ce chapitre a été divisé en trois parties. Dans la
première partie, nous nous sommes focalisés sur la minimisation de l’énergie. L’objectif
principal était d’obtenir les paramètres optimaux du système pour une efficacité én-
ergétique cible donnée. Le chapitre 4 introduit une toute nouvelle façon pour le choix
des paramètres du système, où la consommation d’énergie du système est réduite au
minimum. Dans la deuxième partie du chapitre 4, une étude théorique a été réalisée
afin de maximiser la capacité d’un système ULB. Nous avons montré que l’utilisation
d’un temps de garde adapté aux conditions de transmission est bénéfique en termes de
capacité du système. Un système de faible complexité pour sélectionner le temps de
garde est introduit. Dans la dernière partie de ce chapitre, nous nous sommes focal-
isés sur les communications MB-OFDM. Deux nouveaux algorithmes d’allocation de
ressources sont proposés afin d’augmenter l’efficacité énergétique du système.
Dans le chapitre 5, deux impulsions ont été proposées, l’impulsion de retournement
temporel est utilisée dans un premier temps. Dans un second temps une impulsion
optimale en terme d’efficacité énergétique pour les communications ULB est proposée.
Il a été montré que les impulsions proposées offrent un gain significatif en termes de
capacité des systèmes ULB.
xxxi

xxxii
List of Figures
1 Relation entre l’énergie et le temps de communication . . . . . . . . . . xx
2 Relation entre l’efficacité énergétique, la quantité d’information et le
temps de communication . . . . . . . . . . . . . . . . . . . . . . . . . . xxi
3 Energie de transmission pour WiMAX . . . . . . . . . . . . . . . . . . . xxii
4 Energie de transmission pour CPL . . . . . . . . . . . . . . . . . . . . . xxiii
5 Relation entre l’efficacité énergétique, le temps de l’impulsion et le temps
de garde . . . . . . . . . . . . . . . . . . . . . . . . . . . . . . . . . . . . xxv
6 la relation entre le temps de bit et l’efficacité énergétique . . . . . . . . xxvii
7 Performances de l’impulsion gaussienne et l’impulsion de retournement
temporel pour les différents valeurs de Eb
N0. . . . . . . . . . . . . . . . . xxix
8 Performances de l’impulsion gaussienne et l’impulsion optimale pour les
différents valeurs de Eb
N0. . . . . . . . . . . . . . . . . . . . . . . . . . . xxx
1.1 Technologies evolution [1] . . . . . . . . . . . . . . . . . . . . . . . . . . 10
1.2 Energy consumption in ICT . . . . . . . . . . . . . . . . . . . . . . . . . 12
1.3 co2 footprint . . . . . . . . . . . . . . . . . . . . . . . . . . . . . . . . . 15
1.4 Carbon footprint of ICT . . . . . . . . . . . . . . . . . . . . . . . . . . . 16
2.1 Frequency and Time domain representation of an OFDM signal . . . . . 26
2.2 Time and Frequency domain for Second-order Gaussian mono cycle . . . 30
2.3 The model of the system . . . . . . . . . . . . . . . . . . . . . . . . . . . 31
2.4 The mathematical model . . . . . . . . . . . . . . . . . . . . . . . . . . . 32
2.5 UWB spectrum bands in the MB-OFDM system . . . . . . . . . . . . . 34
2.6 Energy consumption of conventional WiMAX systems . . . . . . . . . . 40
2.7 Transfer function of the reference model proposed by Zimmermann PLC
channel . . . . . . . . . . . . . . . . . . . . . . . . . . . . . . . . . . . . 43
xxxiii
LIST OF FIGURES
2.8 DSP mask for PLC systems . . . . . . . . . . . . . . . . . . . . . . . . . 44
2.9 PLC energy consumption . . . . . . . . . . . . . . . . . . . . . . . . . . 46
2.10 Example of UWB channel realizations for models CM1, CM2, CM3,
CM4, in time and frequency domains . . . . . . . . . . . . . . . . . . . . 48
3.1 Relationship between energy and time, Q = 1 Gbit, B = 50 MHz. . . . . 54
3.2 Relationship between spectral efficiency and energy efficiency. . . . . . . 56
3.3 Pareto border of energy minimization . . . . . . . . . . . . . . . . . . . 64
3.4 Energy consumption of WiMAX systems . . . . . . . . . . . . . . . . . . 67
3.5 Transmission time with WiMAX systems . . . . . . . . . . . . . . . . . 68
3.6 Energy vs energy efficiency and quantity of information . . . . . . . . . 69
3.7 Time vs energy efficiency and quantity of information . . . . . . . . . . 70
3.8 Energy consumption in PLC . . . . . . . . . . . . . . . . . . . . . . . . . 71
3.9 Time of transmission in PLC . . . . . . . . . . . . . . . . . . . . . . . . 71
4.1 Energy vs bandwidth and bit duration . . . . . . . . . . . . . . . . . . . 75
4.2 Energy efficiency vs the pulse repetition and pulse time . . . . . . . . . 76
4.3 Energy efficiency vs the pulse time and guard time . . . . . . . . . . . . 77
4.4 BER vs Tp and Tg . . . . . . . . . . . . . . . . . . . . . . . . . . . . . . 79
4.5 BER vs Tp and L . . . . . . . . . . . . . . . . . . . . . . . . . . . . . . . 79
4.6 An example of multi-path CM1 channel impulse response and the CDF
of the received energy . . . . . . . . . . . . . . . . . . . . . . . . . . . . 84
4.7 Capacity vs SNR over CM1 channel . . . . . . . . . . . . . . . . . . . . 86
4.8 Capacity vs guard time . . . . . . . . . . . . . . . . . . . . . . . . . . . 87
4.9 CDF of the optimal capacity . . . . . . . . . . . . . . . . . . . . . . . . 89
4.10 CDF of parameter ρ1 . . . . . . . . . . . . . . . . . . . . . . . . . . . . . 89
4.11 CDF of parameter ρ2 . . . . . . . . . . . . . . . . . . . . . . . . . . . . . 90
4.12 CDF of parameter ρ3 . . . . . . . . . . . . . . . . . . . . . . . . . . . . . 90
4.13 PDF of parameter ρ1 . . . . . . . . . . . . . . . . . . . . . . . . . . . . . 91
4.14 PDF of parameter ρ2 . . . . . . . . . . . . . . . . . . . . . . . . . . . . . 92
4.15 PDF of parameter ρ3 . . . . . . . . . . . . . . . . . . . . . . . . . . . . . 92
4.16 CDF of error for all parameters . . . . . . . . . . . . . . . . . . . . . . . 94
4.17 Energy efficiency vs the bit duration Tb . . . . . . . . . . . . . . . . . . 97
xxxiv
LIST OF FIGURES
5.1 System model . . . . . . . . . . . . . . . . . . . . . . . . . . . . . . . . . 101
5.2 Optimal pulse . . . . . . . . . . . . . . . . . . . . . . . . . . . . . . . . . 102
5.3 BER vs Eb/N0 . . . . . . . . . . . . . . . . . . . . . . . . . . . . . . . . 104
5.4 System capacity vs Eb/N0 . . . . . . . . . . . . . . . . . . . . . . . . . . 104
5.5 Optimal pulse over CM1 channel . . . . . . . . . . . . . . . . . . . . . . 107
5.6 SNR vs Energy of bit . . . . . . . . . . . . . . . . . . . . . . . . . . . . 108
5.7 System capacity vs Eb
N0. . . . . . . . . . . . . . . . . . . . . . . . . . . . 109
xxxv

LIST OF FIGURES
xxxvi
List of Tables
2.1 MCS table . . . . . . . . . . . . . . . . . . . . . . . . . . . . . . . . . . . 37
2.2 ITU multi-path channel models . . . . . . . . . . . . . . . . . . . . . . . 38
2.3 WiMAX simulated system and channel parameters . . . . . . . . . . . . 39
2.4 Parameters of the 15-path model . . . . . . . . . . . . . . . . . . . . . . 43
2.5 Attenuation parameters corresponding to the length profiles . . . . . . . 44
2.6 UWB channel characteristics . . . . . . . . . . . . . . . . . . . . . . . . 47
3.1 PLC system and channel parameters . . . . . . . . . . . . . . . . . . . . 68
4.1 Capacity comparison . . . . . . . . . . . . . . . . . . . . . . . . . . . . . 87
4.2 Performance parameters value . . . . . . . . . . . . . . . . . . . . . . . . 93
4.3 The maximum error capacity . . . . . . . . . . . . . . . . . . . . . . . . 94
5.1 System parameters . . . . . . . . . . . . . . . . . . . . . . . . . . . . . . 103
xxxvii

LIST OF TABLES
xxxviii
Acronyms
ADC Analog-to-Digital ConverterADSL Asymmetric Digital Subscriber LineAMC Adaptive Modulation and CodingBER Bit-Error-RateBPSK Binary Phase-Shift KeyingCDF Cumulative Distribution FunctionCMOS Complementary Metal Oxide SemiconductorCPE Customer-premises equipmentDC Direct CurrentDSL Digital Subscriber LineDVB-T Digital Video Broadcasting-TerrestrialFCC Federal Communications CommissionGSM Global System for Mobile CommunicationsHPAV Home Plug AVHPAV BPL HomePlug Broadband Power LineHV High VoltageICT Information and Communication TechnologyIPCC Intergovernmental Panel on Climate ChangeISI Inter-Symbol InterferenceKKT Karush Kuhn TuckerLAN Local Area NetworkLCA Life Cycle Assessment
xxxix
LOS Line-of-SightLTE Long Term EvolutionLV Low VoltageMA Margin AdaptiveMAC Media Access ControlMB-OFDM Multi-Band-Orthogonal Frequency Division MultiplexingMCS Modulation and Coding SchemeMIMO Multiple-Input Multiple-OutputMV Medium VoltageNLOS Non Line-of-SightOFDM Orthogonal Frequency Division MultiplexingOFDMA Orthogonal Frequency Division Multiple AccessPDF Probability distribution functionPUSC Partial Use of Sub-CarriersPLC Power Line CommunicationPSD Power Spectral DensityQoS Quality of ServiceRF Radio FrequencyRA Rate AdaptiveUWB Ultra Wide BandUWT Ultra Wide TimeSNR Signal-to-Noise RatioWiMAX Worldwide Interoperability for Microwave AccessWLAN Wireless Local Area NetworkWPAN Wireless Personal Area Network
xl
Introduction
With the explosive growth in the use of wireless and wired communication systems and
the strong expansion of mobile Internet and multimedia services, wireless and wired
Internet accesses have become an integral and vital part of modern society. Many of
our daily activities mobilize a part of the wireless and wired networks. As a result,
the demand for new applications, services and the number of users is steadily growing.
These new services and technologies demand more and more of resources.
Due to increasing demand of data traffic rates and rollout of advanced communica-
tion systems, an exponential surge of energy consumed by telecommunication industry
has already occurred in recent years. The data transmission is increasing by a factor of
10 times every five years, causing an increase in energy consumption of 16 to 20% every
year. Applying this rate to communications networks, which contribute more than 50%
of the entire information and communications technologies (ICT) energy footprint, a
great challenge regarding the energy requirements of wired and wireless networks is
expected in the future.
The humanity is also facing another urgent problem of global warming, which may
cause disastrous consequences. It is mainly caused by the emission of greenhouse gases
coming from human activities. Among these emitted gases, carbon dioxide co2 is one
of the greatest contributors, mainly generated by energy utilization. Human activities
emit twice more of co2 than natural processes can absorb. The emission of co2 has
risen sharply with the industrial revolution and eventually will rise significantly if the
industries do not take precautions. Currently, the ICT sector represents 2% of global
co2 emissions (around the same percentage as that of the air traffic and about one
fourth as that of the road traffic) and consumes 3% of global energy. Out of this 3%,
the energy used for telecommunication systems represents 57%. On the other hand, it
is estimated that the ICT sector will reach a level of 2.6% of the global co2 emission
1
around 2020. Due to this increase in co2 emission, there is a considerable interest
in reducing current energy consumption in the telecommunications sector within the
green communications context.
Climate change, rising energy costs and resource constraints are becoming main is-
sues for governments and businesses. These issues drive new trends in the development
of green technologies. These new green technologies are supported by both public and
private sectors. Green technologies are key of future applications. The study of green
communications will require investigations in various areas such as efficient medium ac-
cess channel protocols, frequency reuse strategies, spectral policy and new performance
metrics. In this context, effective management of energy through allocation strategies is
essential to better exploit all the available resources on the wireless and wired networks.
These strategies define the rules for sharing resources in order to minimize consumption
energy and satisfy the multiple constraints.
Thesis overview and contributions
This work was carried out at the Institute of Electronics and Telecommunications of
Rennes (IETR) in the National Institute of Applied Sciences (INSA-Rennes) and the
University of Udine (Italy). This thesis aims to study and optimize resource allocation
strategies (time-frequency) and pulse design to minimize the energy consumption.
The studies in this thesis can be grouped into three main parts. The first part is
devoted to have a global vision for energy consumption for wireless and wired com-
munications. WiMAX and power line communication (PLC) networks are taken as
examples. The objective is to see the current state of energy consumption in commu-
nication systems.
The second part concerns the optimization of the energy of physical layer for single
and multi-carrier communications. We propose a new approach called ultra wide time
(UWT) to better exploit the energy consumption, which is the first original contribution
of this thesis. Based on this approach, new algorithms for resource allocation and
performance metrics are defined. The system is analyzed in single carrier and multi-
carrier contexts. Compared to existing methods of allocating resources for multi-carrier
systems, we see that this solution can greatly improve the energy efficiency of the
systems.
2
Introduction
Finally, in the last part, we focus on pulse design for ultra wide band (UWB)
systems. The objective of this part is to explore the different pulses in conjunction
with various resource allocation and optimization schemes to consume less energy in
communication systems. Current systems use the Gaussian pulse for transmission. In
the beginning the system parameters of Gaussian pulse are optimized so as to reduce
the energy consumption. New system parameters algorithms are then proposed and
analyzed for UWB communications. This is the second original contribution of this
thesis. Secondly, we define a new pulse waveform for UWB communications proposed
in order to minimize the energy consumption. This is the third original contribution of
this thesis. The pulse proposed can greatly improve the energy efficiency of the system.
This dissertation is organized as follows. Chapter 1 specifies some of the fundamen-
tal aspects of ICT. An overview of green radio is given. The first part of this chapter
provides a historical overview of ICT, discusses on the energy consumption of ICT and
lists the main green solutions. The future challenges of telecommunication are also
considered in this chapter. Finally, the context of the study is presented.
Chapter 2 describes the main transmission techniques exploited in this thesis,
mainly the multi-carrier modulation. An overview of conventional orthogonal frequency
division multiplexing (OFDM) systems is given. The impulse and multi-band UWB
principle is also elaborated in this chapter. Finally, the considered systems in this thesis
are presented. This chapter also discusses the resource allocation optimization. An in-
troduction to energy consumption is given followed by the description of fundamentals
of resource allocation and optimization for multi-carrier systems. Different resource
allocation strategies are presented. The energy consumption for WiMAX and PLC
systems are provided.
Chapter 3 presents the resource allocation principles and optimization strategies,
namely, the energy minimization. A survey key results from information theory is
given. Therefore, an asymptotic study for energy consumption in single and multi-
carrier systems is realized. The results of study permit to define the limit of energy
consumption for data transmission. A new approach of communication systems is pro-
posed. This approach provides a basis for the development of other resource allocation
solutions, especially those based on the energy efficiency metric criterion. Furthermore,
the resource allocation for parallel channels are developed. Three cases of resource al-
3
location are studied in order to obtain better energy efficiency for multi-carrier systems
in comparison to existing solutions.
Chapter 4 is devoted to pulse design aspect of UWB systems. The major question
for the first part of chapter is: what is the optimal system parameters to minimize
energy. The first proposition is to use the shape of impulse UWB systems and then
to determine the best parameters for the energy minimization. This chapter focuses
on Gaussian pulse proposed for UWB communication systems. Furthermore, in the
second part, the system capacity maximization is developed. The energy efficiency is
fixed by the metric, and the system capacity is maximized. The last part of this chapter
focuses on multi-band allocation. The energy minimization problem is presented and
a new algorithm is introduced for multi-band allocations.
Chapter 5 presents the global pulse design optimization for UWB communications.
The main question solved is how to design a pulse without assuming a particular set
of basis signals. Various pulses shaping that consume less energy than Gaussian pulse
are proposed.
Finally, in the general conclusion of the thesis, we summarize this dissertation and
draw some perspectives of this work. Some recommendations are also proposed for
future research works.
List of publications and reports
Journal Papers
• A. Hamini, J.-Y. Baudais, A.M. Tonello and J.-F. Helard "Guard time optimiza-
tion for capacity maximization of UWB communications", to be submitted.
• J.-Y. Baudais, A. Hamini and A.M. Tonello "Energy efficiency in parallel inde-
pendent channels", to be submitted.
International Conferences
• A. Hamini, J.-Y. Baudais and J.-F. Helard "Best effort communications with
green metrics", in IEEE Wireless Communications, Networks Conference, (Can-
cun, Mexico), pp. 1346-1351, March 2011.
4
Introduction
• A. Hamini, J.-Y. Baudais, and J.-F. Helard "Green resource allocation for pow-
erline communications", in IEEE International Symposium on Power Line Com-
munications and Its Applications, (Udine, Italy), pp. 393-398, April 2011.
National Conferences
• J.-Y. Baudais, A. Hamini et J.-F. Hélard "Efficacité énergétique pour les commu-
nications vertes", in Colloque GRETSI, (Bordeaux, France), September 2011.
Reports
• A. Hamini "Deployment of monocyle pulse in UWT" rapport GDR-ISIS, Septem-
bre 2010.
• A. Hamini "Pulse design and resource allocation in UWB communication" rapport
UEB (université européenne de Bretagne), October 2011.
5

Chapter 1
Green radio
In a context where the energy demand is growing continuously, it becomes important for
all sectors to take into account the problem of energy consumption and the ICT sector
is not exempt. The energy consumed by wireless and wired networks is not negligible.
However, it is insufficiently considered for actual networks. This first chapter aims to
present the context of the study.
The first part describes the ICT sector, its origin and scope of deployment. Thus,
after some historical information, we focus on the future and emerging technologies.
The energy consumption in ICT sector is then discussed. We provide some statistics for
energy consumption, and the impact of environment. An overview of green technologies
is then proposed, followed by motivations and the solutions for future green networks.
The last part describes the motivations and visions of the thesis.
1.1 ICT development
Before considering the link between ICT and energy, and in particular between ICT
and sustainable development, it is important to define the term ICT and to understand
the social and technological environment in which they grow. ICT today comes from
the marriage of computers, electronics, telecommunications and broadcasting. The use
of ICT continues to expand and new technologies contribute every day. The acronym
ICT was used for the first time by academic researchers in 1980 [2], but it’s more cited
being used in UK government report [3]. Information and communication technolo-
gies include all technologies that enable the processing of information and facilitate
7
1.1 ICT development
different forms of communication among human actors, mainly information technology,
Internet and telecommunications. ICT are a set of resources to manipulate information
and especially computers, programs and networks needed to convert, store, manage,
transmit and retrieve information. ICT can be grouped into a few sectors: computer
equipments, servers, hardware, microelectronics and components, telecommunications
and computer networks. The modern technologies of information has gone through
important stages before coming to the current state of technology advancement. Up
to now, the constraints (speed, capacity and reliability of information) have gradually
progressed.
The real revolution in the ICT sector began by the invention of Internet and the
mobile phone. Then, technological innovations, coupled with lower costs and compe-
tition, contrary to all expectations, provoked an explosion of mobile telephony. New
networks are spread for internal and external connection and a territorial development
of digital technology for broadband Internet is developed. In fact, these tools feature
new services in terms of access to information. Mobile communications systems revolu-
tionized the way people communicate, joining together communications and mobility.
A long way in a remarkably short time has been achieved in the history of wireless. This
convergence is not only a technological revolution but also marketing. The progress of
information society is based on the success of information technology which has been
made possible by innovations in microelectronics. In the last years, ICT systems have
allowed the enormous economic improvement [4]. The technologies of information and
communication gradually penetrate all fields of economic and social activities. ICT is
widely recognized for its essential role in transforming the economy and society. In the
last decade, with the expansion of Internet, the use of ICT has been increased and a
majority of the people are using these tools to access information. On the other hand,
the number of available services have exploded and the ICT sector has become an inte-
gral and vital sector for humanity. ICT now plays an increasingly important role in the
advancement and operations of many fields such as manufacturing, transport systems,
medical science, government departments, the arts, businesses of all sizes and shapes.
ICT is being deployed and utilized in many sectors to carry out a wide range of tasks.
The wireless and wired communication is one of the most vibrant areas in the ICT
field today. This is due to several factors. First, there has been an explosive increase
in demand for connectivity, driven so far mainly by cellular telephony [5]. Second, the
8
1. GREEN RADIO
enormous progress in integrated circuits has enabled small area and low power imple-
mentation of sophisticated signal processing algorithms and coding techniques. Third,
the success of second-generation (2G) digital wireless standards in particular provides a
concrete demonstration that good ideas from communication theory can have a signifi-
cant impact in practice. Rarely have technical innovations changed everyday life as fast
and profoundly as the massive use of the Internet and introduction of personal mobile
communications. The last decade has witnessed a phenomenal growth of subscribers in
both wireless and wired technology. There has been a clear shift from fixed to mobile
cellular telephony. The first Global system for mobile communications (GSM) phone
call took place 1991 in Finland. Only 20 years later there were over 3 billion GSM
users [5]. During the last few years, more than 60% of people on this planet possessed
a mobile telephone [5]. On the other hand, the number of Internet servers has increased
by a factor of 1000 [6]. Internet appears in the 80s and now has more than 2 billion
users [6].
These two developments have, and continue to evolve strongly. The data trans-
mission rates both in the wired and wireless networks have been increasing by about
a factor 10 every 5 years [4]. In order to fit this exponentially rising, the capacity of
storage devices and the processing power double approximately every 18 months.
1.2 Future technologies and challenges
The increasing ICT dimension is also an important element in the context within which
the future and emerging technologies will operate. Telecommunication sector consti-
tutes a major sector of ICT and is undergoing an enormous growth. Capacity issues
and delivery of complex real time services are some of the main concerns that yield high
power consumption patterns. In this section, we will not detail enough the importance
of the other sectors ICT, but we focus on telecommunication improvements and the
applications of tomorrow.
The quantity of information transmitted currently to individuals and organizations
is unprecedented in human history, and the rate of information generation continues to
grow exponentially. The last decade witnessed more and more the use of new techniques
and technologies to improve the rate of information transmission. Both wired and
9
1.2 Future technologies and challenges
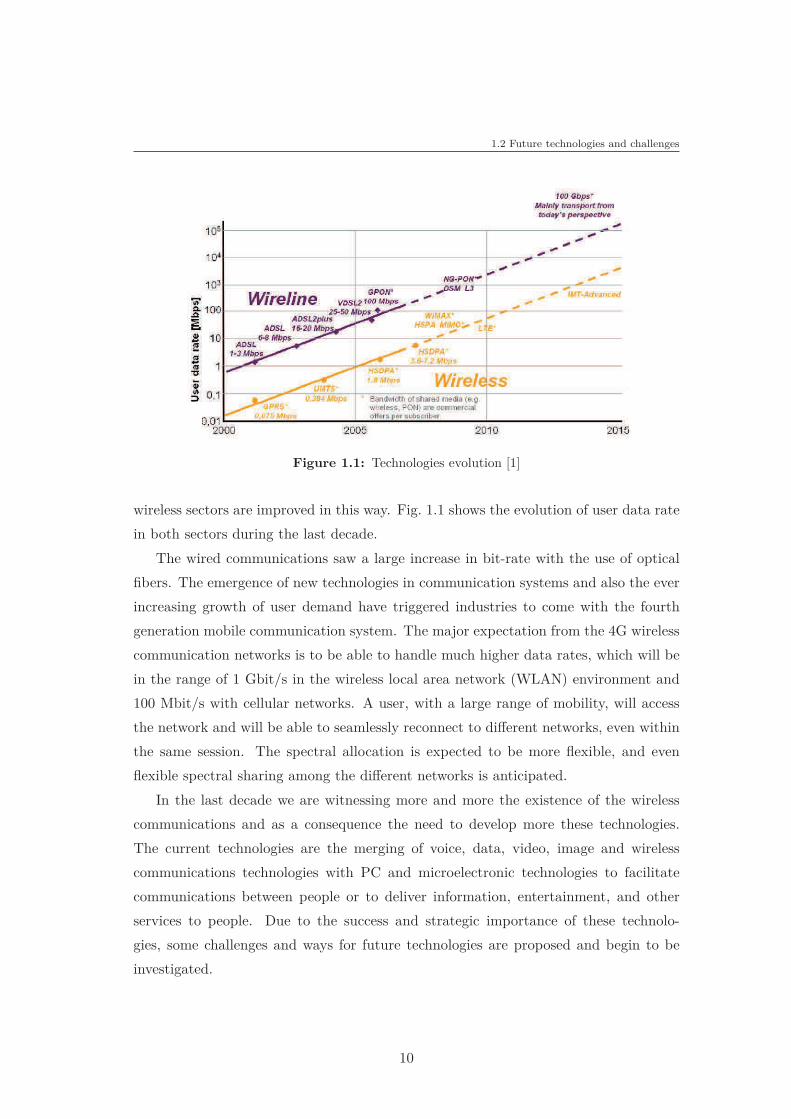
Figure 1.1: Technologies evolution [1]
wireless sectors are improved in this way. Fig. 1.1 shows the evolution of user data rate
in both sectors during the last decade.
The wired communications saw a large increase in bit-rate with the use of optical
fibers. The emergence of new technologies in communication systems and also the ever
increasing growth of user demand have triggered industries to come with the fourth
generation mobile communication system. The major expectation from the 4G wireless
communication networks is to be able to handle much higher data rates, which will be
in the range of 1 Gbit/s in the wireless local area network (WLAN) environment and
100 Mbit/s with cellular networks. A user, with a large range of mobility, will access
the network and will be able to seamlessly reconnect to different networks, even within
the same session. The spectral allocation is expected to be more flexible, and even
flexible spectral sharing among the different networks is anticipated.
In the last decade we are witnessing more and more the existence of the wireless
communications and as a consequence the need to develop more these technologies.
The current technologies are the merging of voice, data, video, image and wireless
communications technologies with PC and microelectronic technologies to facilitate
communications between people or to deliver information, entertainment, and other
services to people. Due to the success and strategic importance of these technolo-
gies, some challenges and ways for future technologies are proposed and begin to be
investigated.
10
1. GREEN RADIO
First, the challenge of flexible and intelligent networks is considered. The concept
of flexible radio will play an important role in mobile communications in the future. It
is to be reconfigured by software radio systems and dynamically, in order to live the
standards of many current and future communication systems (eg, WiMAX and Long
term evolution, LTE) within the same equipment, optimize the use of radio resources
and reduce the specific hardware [7].
Second, the cost challenge for new ICT technologies is expected to have an impact
on both professional and personnel lives. However, advances in transmission technology
alone may not be sufficient to support the anticipated demand for higher data rates and
greater traffic volumes. Fortunately, a low cost means of increasing capacity is to match
wireless infrastructures to the non-uniform spatial distribution of traffic. Multiple radio
access standards and base station classes, having different cost and performance, could
be combined to create a heterogeneous wireless access network. To support high data
rates with wide area coverage at a low cost would require substantial technological
advances though [8].
Last but not least, ICT technologies are expected to achieve substantial efficiency
gains of energy as well as reduce the greenhouse gases emissions. This incorporates
the ICT contributions to the public-private partnerships on energy efficiency for all
technologies. Characteristic examples are green networks, energy efficient electron-
ics and the application of embedded systems towards low carbon and energy efficient
technologies [1]. Thus, the work of the thesis is subscribed in this way.
1.3 Energy consumption in ICT
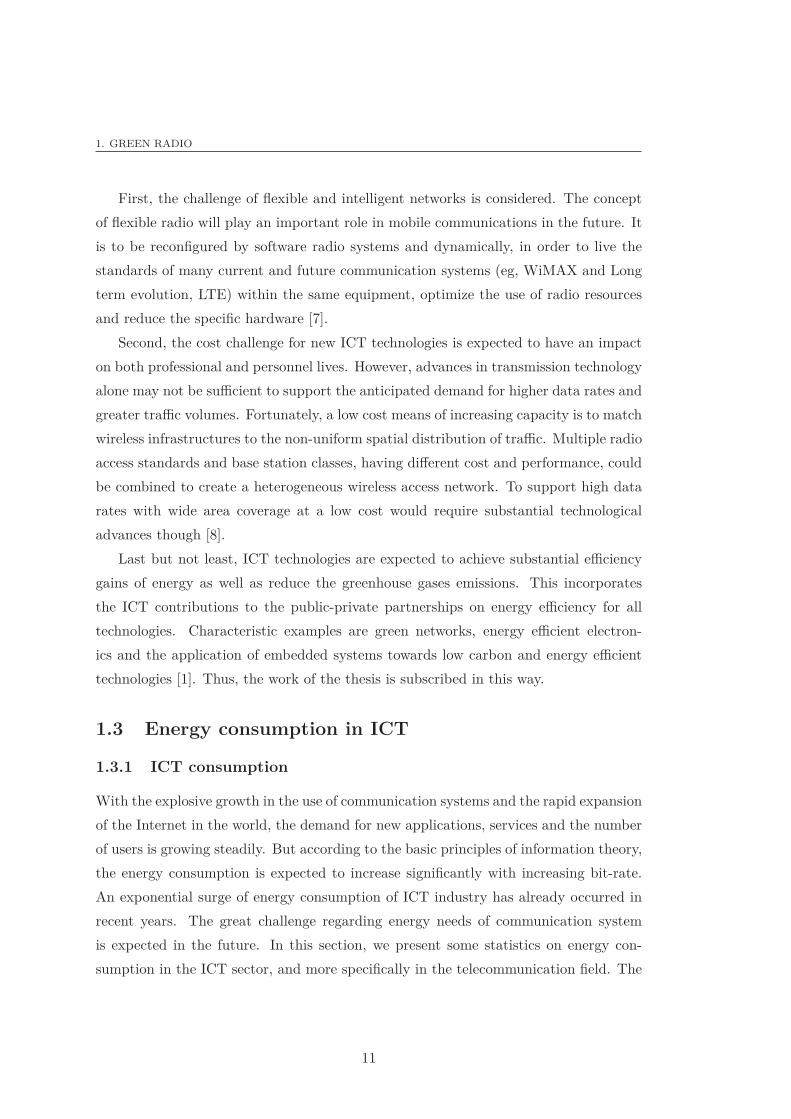
1.3.1 ICT consumption
With the explosive growth in the use of communication systems and the rapid expansion
of the Internet in the world, the demand for new applications, services and the number
of users is growing steadily. But according to the basic principles of information theory,
the energy consumption is expected to increase significantly with increasing bit-rate.
An exponential surge of energy consumption of ICT industry has already occurred in
recent years. The great challenge regarding energy needs of communication system
is expected in the future. In this section, we present some statistics on energy con-
sumption in the ICT sector, and more specifically in the telecommunication field. The
11
1.3 Energy consumption in ICT
PCs and monitors
40%
Servers
23%
Fixed line
telecommunications
15%
Mobile
communications
9%
LAN and offices
communication
7%
Other
equipments
6%
Figure 1.2: Energy consumption in ICT
energy demand of ICT is growing much faster than the total energy demand. Growth
in energy consumption is 16% to 20% per year in the field of ICT [1]. In France, the
power consumption is between 55 and 60 TWh per year, or 13.5% of the electricity
consumption by end-use applications [9]. Taking into account the end use equipment
and its related infrastructure (servers, routers, switches for the Internet, base station
switching units and others for telecommunication), typical calculations for an indus-
trialized country suggest that ICT accounts for about 3% of total electricity demand
[10, 11]. This is comparable to the energy consumption of the aviation industry. If
we incorporate the entire life cycle, the share of ICT is closer to 4% of total electricity
[12]. The exponential growth of ICT, which will be required for reducing the energy
intensity of the entire economy, is currently not sustainable. Fig. 1.2 shows the energy
consumption of different sectors of ICT. The PCs and monitor are responsible of 40%
of energy consumption in ICT sectors. The growth rate for PCs energy consumption
worldwide is expected to be somewhat about 7.5% per year [13]. This is mainly caused
by the growing number of PCs that are used worldwide (growing by about 10%) and
the ever rising data volumes to be processed by a PC.
12
1. GREEN RADIO
The operation of telecommunication networks (including the operation of servers,
mobile networks, WLANs, LANs and fixed line networks) represents 50% for ICT con-
sumption. For network equipment, the energy consumption growth rates are typically
about 12% per year. Especially the growing wireless access infrastructure (for mobile
phones, wireless computer access, etc.) and the quick rise in home networks are re-
sponsible for steeply growing energy consumption rates. This considerable growth is
mainly caused by the ever growing data volumes to be processed, stored and accessed,
and the associated power for cooling.
The analysis of the energy consumption in telecommunication networks, must make
a distinction between the customer premises equipment (CPE), core networks and ac-
cess networks. CPE is equipment that is in the customer site (a firm) and is connected
to the infrastructure of an operator in a point of presence via a local loop. CPE gener-
ally refers to devices such as telephones, routers, switches, home networking adapters
and Internet access gateways that enable consumers to access communications service
providers. Core networks are the Internet highways of the telecommunication networks.
They are built to interconnect different sites and aggregate the traffic between these
sites. They typically have a mesh structure. Core networks are built on many levels
covering areas ranging from small cities to global networks. Access network is that part
of a network which connects subscribers to their immediate service provider. They are
typically built in a tree structure. We distinguish fixed access networks in which the
user is connected to the network by a cable and wireless access networks which use
radio waves. In [14], the distribution of the network power consumption of a typical
operator is provided. It shows that half of the operational power consumption is used
for the fixed line access network and about one fifth for the mobile access network.
The aggregation and backbone networks represent a much smaller fraction. For wire-
less communications, the significant environmental impact is due to the high energy
consumption in cellular base stations. There are 4 million base stations and around 3
billion subscribers worldwide [15]. The energy consumed by the base stations accounts
for 80% of the energy used by operators [10].
Currently the 3G base stations use powers very inefficiently because of linear RF
power amplifiers [10]. In [10], the energy consumed by the second and third generations
networks are provided. Note that the power consumed by 3G networks is 5 times larger
than the power consumption of second generation networks. The telecommunication
13
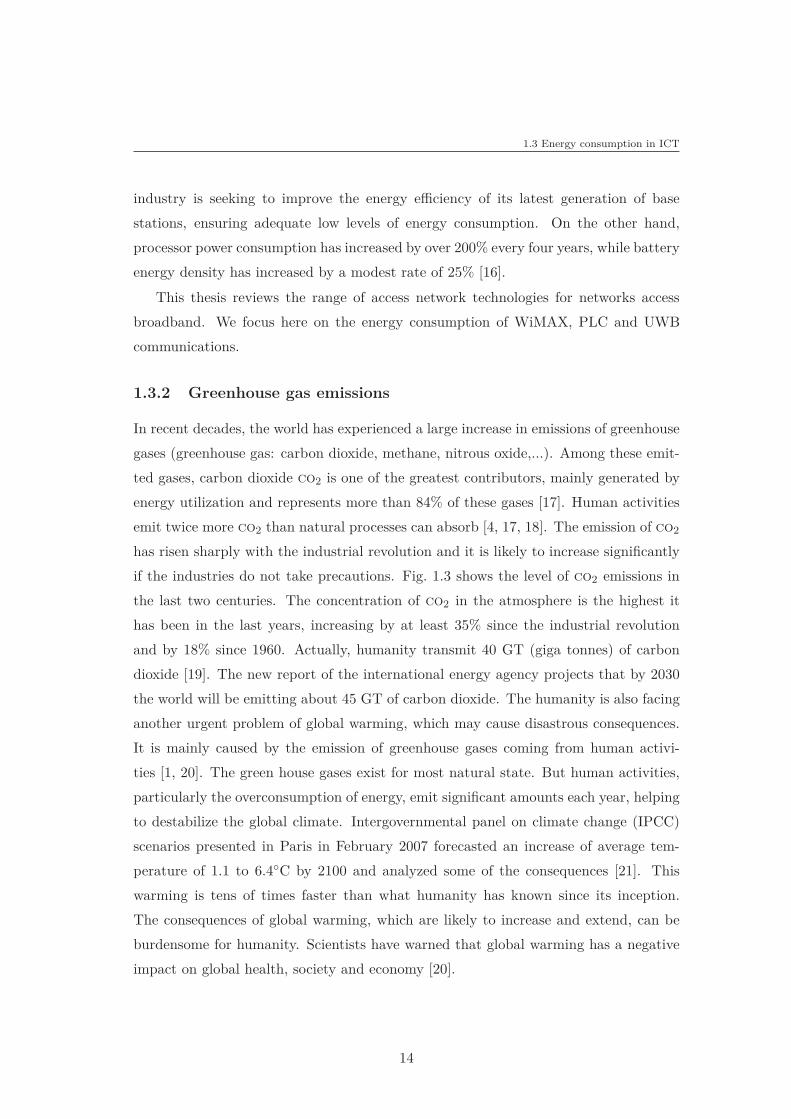
1.3 Energy consumption in ICT
industry is seeking to improve the energy efficiency of its latest generation of base
stations, ensuring adequate low levels of energy consumption. On the other hand,
processor power consumption has increased by over 200% every four years, while battery
energy density has increased by a modest rate of 25% [16].
This thesis reviews the range of access network technologies for networks access
broadband. We focus here on the energy consumption of WiMAX, PLC and UWB
communications.
1.3.2 Greenhouse gas emissions
In recent decades, the world has experienced a large increase in emissions of greenhouse
gases (greenhouse gas: carbon dioxide, methane, nitrous oxide,...). Among these emit-
ted gases, carbon dioxide co2 is one of the greatest contributors, mainly generated by
energy utilization and represents more than 84% of these gases [17]. Human activities
emit twice more co2 than natural processes can absorb [4, 17, 18]. The emission of co2
has risen sharply with the industrial revolution and it is likely to increase significantly
if the industries do not take precautions. Fig. 1.3 shows the level of co2 emissions in
the last two centuries. The concentration of co2 in the atmosphere is the highest it
has been in the last years, increasing by at least 35% since the industrial revolution
and by 18% since 1960. Actually, humanity transmit 40 GT (giga tonnes) of carbon
dioxide [19]. The new report of the international energy agency projects that by 2030
the world will be emitting about 45 GT of carbon dioxide. The humanity is also facing
another urgent problem of global warming, which may cause disastrous consequences.
It is mainly caused by the emission of greenhouse gases coming from human activi-
ties [1, 20]. The green house gases exist for most natural state. But human activities,
particularly the overconsumption of energy, emit significant amounts each year, helping
to destabilize the global climate. Intergovernmental panel on climate change (IPCC)
scenarios presented in Paris in February 2007 forecasted an increase of average tem-
perature of 1.1 to 6.4◦C by 2100 and analyzed some of the consequences [21]. This
warming is tens of times faster than what humanity has known since its inception.
The consequences of global warming, which are likely to increase and extend, can be
burdensome for humanity. Scientists have warned that global warming has a negative
impact on global health, society and economy [20].
14
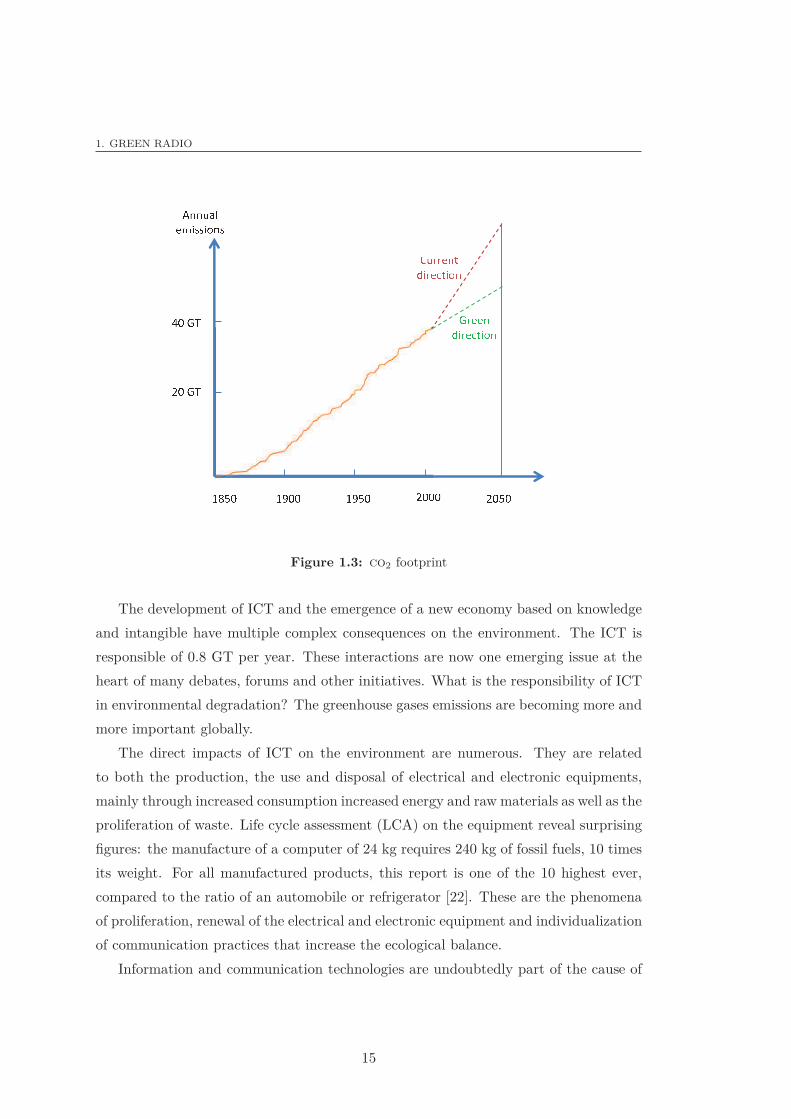
1. GREEN RADIO
✁ ✂ ✄ ☎ ✄ ✂ ✄ ✆ ✄ ✄ ☎ ✄ ✄ ✄ ✆ ✂ ✄
✝ ✞ ✟ ✟ ✠ ✡ ☛☞ ✌ ✟ ✠ ✍ ☛ ✌ ✎ ✡✏ ✡ ✡ ✞ ✑ ✒✠ ✓ ✌ ✔ ✔ ✌ ✎ ✡ ✔✕ ✄ ✖ ✗☎ ✄ ✖ ✗ ✖ ✟ ✠ ✠ ✡☞ ✌ ✟ ✠ ✍ ☛ ✌ ✎ ✡
Figure 1.3: co2 footprint
The development of ICT and the emergence of a new economy based on knowledge
and intangible have multiple complex consequences on the environment. The ICT is
responsible of 0.8 GT per year. These interactions are now one emerging issue at the
heart of many debates, forums and other initiatives. What is the responsibility of ICT
in environmental degradation? The greenhouse gases emissions are becoming more and
more important globally.
The direct impacts of ICT on the environment are numerous. They are related
to both the production, the use and disposal of electrical and electronic equipments,
mainly through increased consumption increased energy and raw materials as well as the
proliferation of waste. Life cycle assessment (LCA) on the equipment reveal surprising
figures: the manufacture of a computer of 24 kg requires 240 kg of fossil fuels, 10 times
its weight. For all manufactured products, this report is one of the 10 highest ever,
compared to the ratio of an automobile or refrigerator [22]. These are the phenomena
of proliferation, renewal of the electrical and electronic equipment and individualization
of communication practices that increase the ecological balance.
Information and communication technologies are undoubtedly part of the cause of
15
1.4 Green technologies
Data
centers
Telecoms
28✘PCs, peripherals Fixed
infrastructure
Mobile
infrastructure
43✘Devices
Radio
networks
80 � 90%
Core
networks
Co2 footprint of
ICT
Co2 footprint of Telecoms Co2 footprint of Mobile
infrastructure
ICT: 2% of total
CO2 footprint of
from human
activity
Figure 1.4: Carbon footprint of ICT
the high emission of co2 and the global warming as witnessed. Currently, ICT sector
represents about 2% of global co2 emissions (around the same percentage as that of
the air traffic and about one fourth as that of the road traffic) [1, 4, 23]. Out of
this 2%, the total ICT emissions due to the telecommunication infrastructures and
devices represents 28%. Mobile networks are responsible for 43% of co2 emitted by
the telecommunication sector, where radio network is responsible from 80 to 90% of
co2 footprint of mobile infrastructure. Fig. 1.4 shows the carbon emmision of different
sectors of ICT. On the other hand, ICT sector is estimated to reach an emission of 2.6%
of co2 around 2020 [4, 10]. To this effect, there is a considerable interest in the actual
reduction of energy consumption in the wireless sector, especially in Europe. Orange
(France), Ericsson (Sweden) and Vodafone (UK) want to significantly reduce their co2
emissions by a ratio of 20 to 50% by 2020 [24].
1.4 Green technologies
The main focus in green technologies is to provide new techniques to save energy con-
sumption. Green technologies are key initiatives for future applications [25, 26, 27].
Therefore we seek in this thesis to understand what stakeholders mean by green ICT
specially in wireless and wired communications. In this section we will discuss the mo-
tivation of green technologies and emerging services. We conclude with our perspective
on future trends, directions and themes of research on green technologies. The main
objective of green radio is to reduce co2 emissions by reducing energy consumption. To
characterize and quantify the consumption of a communication system, it is necessary
16
1. GREEN RADIO
to take into account all the elements or functions requiring energy: signal processing,
both on transmission and reception transducers or radio frequency (RF) heads, relays
and any other intermediate signaling messages, track back and forward. A truly global
approach to consumption and pollution also needs to take into account manufacturing,
installation, maintenance and recycling of elements.
1.4.1 Motivations and objectives
In addition to minimize the environmental impact of ICT industry, there are a number
of reasons why green technologies should be used. The main motivations for green
radio are economic, ecologic, health and technical.
• On the economic front, a way to improve revenue for operators is to reduce their
energy costs. On the other hand, the taxes introduced by the states on carbon
emissions obligate operators to find optimal solutions for energy resource. The
world economy can benefit from $ 800 billion annually [28].
• On the environment and ecology front, the energy limitation allows to conserve
natural resources (water, air, gas). The restriction of the energy used involves a
reduction of co2 emissions, enabling the ICT sector to respond to the problem
of global warming . This reduction of co2 emissions can help other sectors to
decrease their emissions of co2 as for example tele-medicine.
• On the health front, the experts urge caution against risks of radiation from
cellular networks and mobile phones. The evidence is growing that the cellular
radiation affects the health of its users [29].
• On the technical front, the renewable energy sources, use of smart grids, intelligent
routing systems, and energy efficient base stations are stronger interest and set
up is supported by the public and private sectors. The best use of the spectrum
sharpens band spectral, allow more energy resources.
1.4.2 Green technology challenges and solutions
Environmental initiatives in the telecommunication sector today are multiple. They
meet for new regulatory constraints, but also the desire to position itself as green
business with consumers. Two objectives of ICT should be noted. First the increasing
17
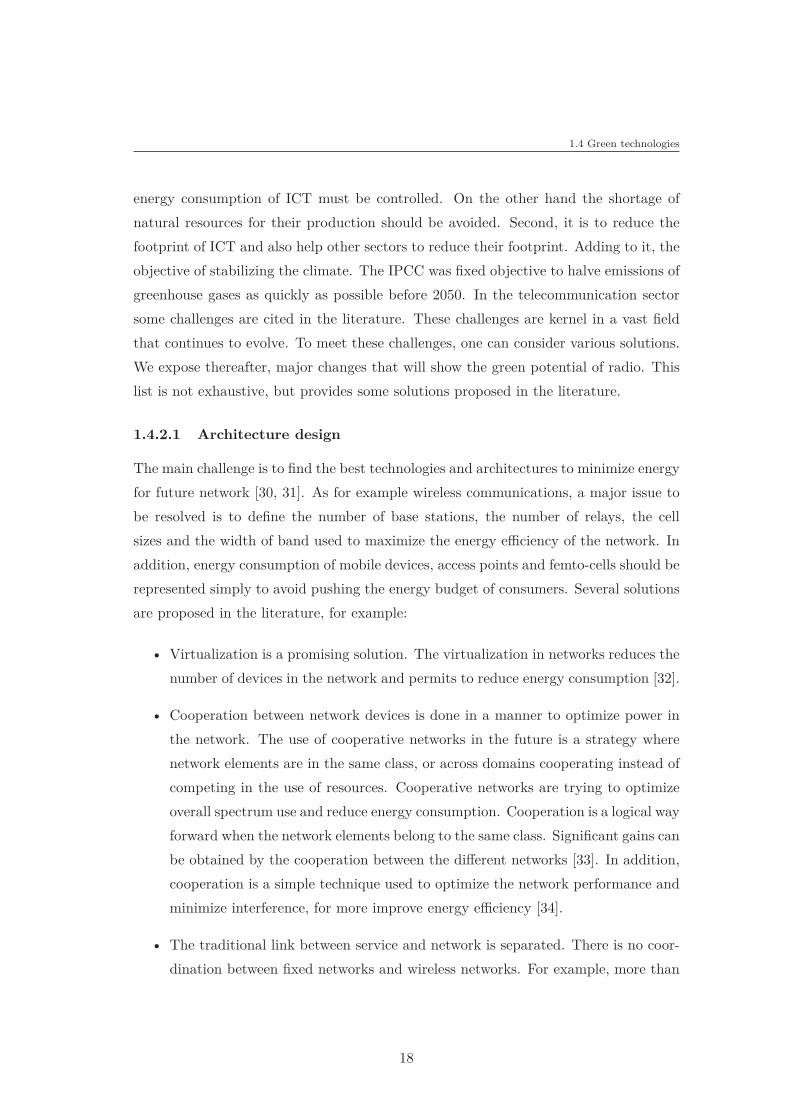
1.4 Green technologies
energy consumption of ICT must be controlled. On the other hand the shortage of
natural resources for their production should be avoided. Second, it is to reduce the
footprint of ICT and also help other sectors to reduce their footprint. Adding to it, the
objective of stabilizing the climate. The IPCC was fixed objective to halve emissions of
greenhouse gases as quickly as possible before 2050. In the telecommunication sector
some challenges are cited in the literature. These challenges are kernel in a vast field
that continues to evolve. To meet these challenges, one can consider various solutions.
We expose thereafter, major changes that will show the green potential of radio. This
list is not exhaustive, but provides some solutions proposed in the literature.
1.4.2.1 Architecture design
The main challenge is to find the best technologies and architectures to minimize energy
for future network [30, 31]. As for example wireless communications, a major issue to
be resolved is to define the number of base stations, the number of relays, the cell
sizes and the width of band used to maximize the energy efficiency of the network. In
addition, energy consumption of mobile devices, access points and femto-cells should be
represented simply to avoid pushing the energy budget of consumers. Several solutions
are proposed in the literature, for example:
• Virtualization is a promising solution. The virtualization in networks reduces the
number of devices in the network and permits to reduce energy consumption [32].
• Cooperation between network devices is done in a manner to optimize power in
the network. The use of cooperative networks in the future is a strategy where
network elements are in the same class, or across domains cooperating instead of
competing in the use of resources. Cooperative networks are trying to optimize
overall spectrum use and reduce energy consumption. Cooperation is a logical way
forward when the network elements belong to the same class. Significant gains can
be obtained by the cooperation between the different networks [33]. In addition,
cooperation is a simple technique used to optimize the network performance and
minimize interference, for more improve energy efficiency [34].
• The traditional link between service and network is separated. There is no coor-
dination between fixed networks and wireless networks. For example, more than
18
1. GREEN RADIO
30% of mobile telephone calls are made by households users [35], generating un-
necessary power consumption. Developing new architectures that allow to use the
mobile network through the fixed network in the home can improve the energy
efficiency. In this way, the distinction between the uplink and downlink can im-
prove the energy efficiency. For example, the uplink using the fixed infrastructure
with the help of new points access installed in homes proposed in [35] provide
huge benefits.
• Using relays and femto-cells in radio networks can also be one solution. The
radiation of a mobile depends on the distance from the nearest base station.
Another potential network component is the use of small cells, as wireless hotspots
and femto-cells (indoor). The femto-cells operate with a transmission power lower
than base station [36, 37].
1.4.2.2 Metric energy
A basic task for green technologies consists in developing metrics to assess the energy
efficiency of current and future networks, in order to find the best networks and archi-
tectures for less energy consumption. For example, optimization based on the metric
of the life cycle for each network equipment can be used. LCA is a technique to as-
sess energy consumption and environmental impacts associated with all the stages of
a product’s life [38]. Later on, academia and industry have offered several metrics for
network energy efficiency. Energy metric can be defined in various perspectives. One
way is to define it as the performance per unit energy consumption. The other way is
to define it as the ratio of efficient output energy to total input energy. We cite in this
section some metrics proposed in the literature.
• The performance metric called area power consumption is proposed in [39]. This
metric is defined as the average power Pc consumed by a cell divided by the
corresponding average cell Ac area measured in (W/m2) .
A1 =Pc
Ac(1.1)
• The power efficiency metric is provided in [40]. This metric evaluates the efficiency
of power in a cell and is defined as the number of bits per unit of energy measured
in (bit/s/W).
19
1.4 Green technologies
• In [41], the performance metric relates the energy consumption in watts and the
effective system throughput in bit/s and is defined as
A2 =E
R(1.2)
where E is the energy consumption and R is the effective system throughput.
1.4.2.3 Power effective signal
One of the challenge of networks focuses on the power reduction of the transmitted
signals [42, 43]. We can consider several complementary techniques. These techniques
include distributed power control, interference cancellation algorithms co-channel and
distributed aperture techniques to avoid interference. Various solutions are proposed:
• Use multiple-input multiple-output antennas (MIMO) antennas that allow to re-
duce the emission of co2 by keeping the transmission rate. A profit in energy
budget is 15% to 19% when using two antennas compared with the use of a single
antenna [44].
• Define a new adaptive transmission power control method to the current require-
ments architectures [45, 46].
• Use of new materials for construction equipment telecommunications which con-
sumes less energy [47].
1.4.2.4 Frequency management
This task focuses on the impact of the availability of frequency bands in future net-
works [48, 49]. The spectrum opens many new authorized bands between 300 MHz and
10 GHz. This work considers how dynamic spectrum access in Multi-band networks
could be used to save energy. The access dynamic spectrum can also be used by relay
links to select the radio time and frequency transmissions in the cell, to maximize the
use of spectrum and minimize interference to other terminals in the network. Different
solutions are proposed:
• Attaching optional green networking requirements to new spectrum license ap-
plications, or renewals could be one of the possible methods to do this. Dynamic
spectrum access is developed in [48].
20
1. GREEN RADIO
• Use of flexible spectrum should be exploited to reduce overall energy consumption.
Cognitive radio has been studied in this direction. In [50, 51] the green radio
concept is mixed with cognitive radio.
1.4.2.5 Resource allocation
This is an increasingly topic important for distributed wireless and wired networks. On
the theoretical side, the recent results of energy efficiency in wireless and wired net-
works and the ability of Shannon’s channel can provide many useful tools for developing
more practical approaches to resource allocation [42, 52, 53]. The new management re-
source and planning techniques that optimize performance energy in the network with
QoS constraints will also be well studied as techniques that mitigate the interference
between the cells. The challenge is to see how the techniques of resource allocations
can be used to reduce the energy. Four distinctive approaches explore this problem.
The first approach comes from the perspective of the multi-user diversity gain, seeking
to minimize energy consumption for all users [54]. The second approach will consider
improvements to media access control (MAC) in wireless networks to minimize the en-
ergy consumption [55]. The third approach comes from the perspective of the Shannon
formula analysis [56]. This work explores the trade-off between allocation of resources
and energy to maximize performance. The final approach to resource allocation stud-
ies how connectivity between base stations in a cellular network can be used to reduce
interference, to minimize the energy consumption and to maximize throughput.
1.5 Study context: motivation and vision
Energy consumption will be the subject of discussions of all future networks. The data
on which we base our work is far from complete. The references are still scarce. We
felt it necessary and important to enrich the research in this direction, in order to have
a greater knowledge of the energy consumption of communication systems and better
understand its evolution. We will need to design systems of next generation towards the
power to deliver the services within the limited resources (energy, spectrum). Resource
allocation in a communications system is a prominent issue, when one seeks to optimize
its performance. Any system must indeed deal with a certain amount of physical and
technological limitations and with additional constraints imposed by users. This thesis
21
1.6 Conclusion
aims to study and optimize resource allocation strategies. Energy consumption will be
integrated into optimization criteria. According to the paradigm proposed by Shannon,
any communication channel can be divided into three blocks, namely the transmitter,
the transmission channel and the receiver. From the standpoint of communication
theory, the channel seen by the system includes not only the medium through which
the message is propagated, the transmit filters and receiver present in all communication
but also the sub-assemblies allow the message to access the medium. In this context, the
work of the thesis is focused on minimizing the energy consumption at the transmitter
side. Three main technologies (WiMAX, UWB, PLC) are investigated and optimized,
in order to meet this challenging goal.
1.6 Conclusion
This first chapter has given us the opportunity to become familiar with the subject of
the study. In this chapter, we first presented ICT sector, its impact and importance
in modern society. We defined the term and stated that the ICT scope of our study
is restricted to the field of ICT for telecommunications. After, we have emphasized
the environmental and energy context of ICT. Then focusing on the quantification of
the ICT impact different conclusions can be drawn. The rising costs of energy and
the need to reduce global co2 emissions to protect our environment are engines of the
economy and ecology emerging today. The operators of telecommunication sector take
the cost of energy as a new important element in their calculation. Energy efficiency is
the key for the next decade. It saves money and creates a new competitive advantage
for radio and wired networks. This requires the operators to adopt green technologies.
Energy efficiency will be integrated into the optimization criteria. The next chapter
comprehensively discusses the fundamentals of UWB and OFDM systems. An overview
of the system specifications used in this thesis is given.
22
Chapter 2
System specifications
2.1 Introduction
The second chapter presents the main transmission techniques exploited in this thesis.
First, the principle of multi-carrier modulations and particularly the concept of OFDM
is detailed. Then, an overview of the resources allocation technics is provided, which
can be considered as the starting point of our studies. The second part of this chapter
is dedicated to the description of UWB systems. Afterwards, the multi-band OFDM
(MB-OFDM) UWB system performance is presented, followed by a discussion of the
advantages and drawbacks of this technique. Finally, the considered systems in this
thesis are presented. Besides the channel model adopted is also given. In addition, the
energy consumption for WiMAX and PLC systems are provided.
2.2 OFDM systems
OFDM belongs to a family of transmission schemes called multi-carrier modulations,
based on the idea of dividing a given high bit-rate data stream into several parallel lower
bit-rate which are transmitted on separate carriers often called sub-carriers, or tones.
Multi-carrier modulation permits encoding digital data on multiple carrier frequencies.
The concept of frequency division multiplexing (FDM) was proposed by Doelz [57] for
the first time in 1950. However, the concept of OFDM has been implemented in real
systems, after various improvements, almost 40 years later as the recent developments
in semiconductor and circuit miniaturization technologies have reduced the cost of the
hardware and signal processing needed for multi-carrier modulation systems [58, 59]. In
23
2.2 OFDM systems
recent times, OFDM is considered as a leading technology for high bit-rate. Particularly,
a number of standards for wired and wireless communications have chosen OFDM
to improve the performance of modern communication systems. This includes LTE,
WiMAX, IEEE 802.11a, terrestrial digital video broadcasting (DVB-T) and digital
subscriber line (DSL) for wired and wireless communications.
2.2.1 OFDM principle
OFDM is a special form of multi-carrier modulation with densely spaced sub-carriers
and overlapping spectra. The principle is based on the parallelization of the information
to be transmitted. The high initial data-rate 1/Td is spread across multiple frequency
channels at low speed sub-carriers. If N is the number of sub-carriers used, the symbols
transmitted by each of them have a duration Ts = N ×Td. Then, the throughput of the
multi-carrier signal is identical to that of single-carrier signal with the same spectral
occupancy [60]. The signal is composed of N sub-carriers. In the frequency domain,
the signal distortions introduced by the channel in this way are limited since each sub-
band is narrow enough to consider the response of the channel as locally flat. The idea
of dividing frequency selective wide band channels into a number of narrow band sub-
channels, non-selective in frequency, is the core reason that makes the system robust
against large delay spreads by maintaining the orthogonality of sub-carriers in frequency
domain. In the time domain, the signal obtained is divided into symbols of duration
Ts resulting from the superposition of N sinusoidal signals at different frequencies. By
sufficiently increasing the number of sub-carriers, the symbol duration can be made
even greater than the delay spread of the channel impulse response, which tends to
minimize the effects of inter-symbol interference. In practice, an excessive increase,
can not be considered due to the limitations imposed by the coherence time of the
channel. Therefore, the guard interval is used. During this guard interval, no useful
data is transmitted. Inserted as a cyclic prefix of each OFDM symbol, for most of the
standard systems, its role is to absorb the residual inter-symbol interference, as long as
its duration is chosen to be greater than or equal to the maximum spread of delays of the
channel impulse response. On the other hand, one of the main reasons for its acceptance
as a leading transmission technology is its ability to modulate adaptively different sub-
channels. For our part, we assume that the signal is adapted to the transmission
channel: the guard interval, the number of sub-carriers and the inter-carrier spacing
24
2. SYSTEM SPECIFICATIONS
are selected to perfectly absorb interference caused by multi-path channels and limit
loss spectral efficiency generated by the guard interval.
In communication systems, the low-pass received signal y(t) can be given as,
y(t) =
∫ ∞
−∞h(τ)x(t − τ)dτ + n(t), (2.1)
where x(t) is the transmitted signal, h(t) is the channel impulse response. If the trans-
mitted signal bandwidth [−fx
2 , fx
2 ] is greater than the channel coherence bandwidth,
frequency selectivity occurs. The channel coherence bandwidth is inversely related to
the delay spread [61]. In the case of frequency selective channel, the frequency com-
ponents of x(t) with frequency separation exceeding the coherence bandwidth tend to
have different channel gains.
2.2.2 OFDM waveform
The orthogonality of OFDM is related to the pulse shaping function. Various pulse
shaping functions have been proposed in the literature [62], the rectangular function
is one of them. This function can be seen as a rectangular window, with duration
Ts equal to the OFDM symbol duration. In frequency domain, it can be represented
by a sinc function for each sub-carrier of the generated signal. A minimum spacing
between adjacent sub-carriers is required in order to attain the frequency orthogonality
between the signal on N sub-carriers. For the rectangular pulse shaping, this minimum
sub-carrier spacing can be expressed as
△f =1
Ts(2.2)
OFDM signal in time and frequency domains is represented in Fig. 2.1. In time domain,
OFDM signal can be considered as compound function consisting of various overlapping
sinusoids. In frequency domain, the OFDM signal is represented by a series of sinc
functions separated by △f . It should be noted here that in a frequency selective
channel, the number of sub-carriers is very great such that the OFDM spectrum for
a given sub-carrier is flat. Due to their distinct characteristics, the extraction and
identification of various sub-carriers is possible everywhere in the spectrum that helps in
adapting the system according to the dimension of the given spectrum. This flexibility
in the spectrum management is very advantageous as it is quite possible to assign
different modulation orders (i.e. different numbers of bits) and different transmit powers
25
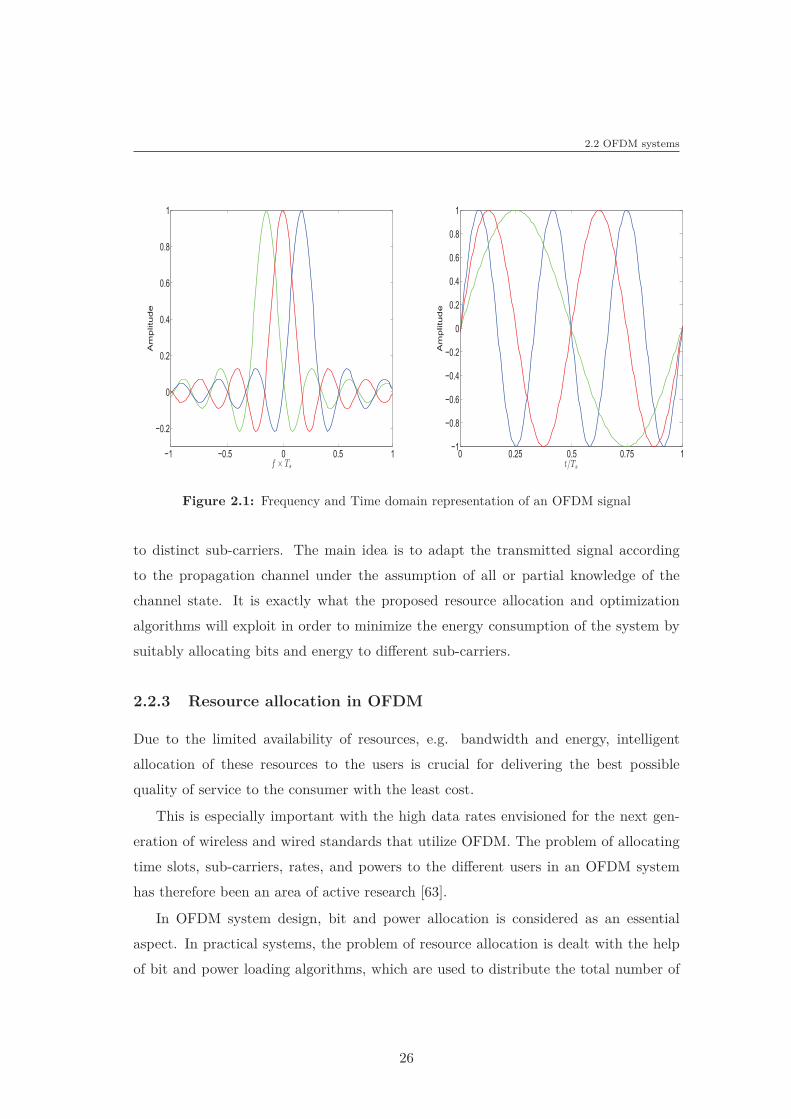
2.2 OFDM systems
�1 �0.5 0 0.5 1
�0.2
0
0.2
0.4
0.6
0.8
1
f × Ts
Am
plitu
de
0 0.25 0.5 0.75 1�1
�0.8
�0.6
�0.4
�0.2
0
0.2
0.4
0.6
0.8
1
t/Ts
Am
plitu
de
Figure 2.1: Frequency and Time domain representation of an OFDM signal
to distinct sub-carriers. The main idea is to adapt the transmitted signal according
to the propagation channel under the assumption of all or partial knowledge of the
channel state. It is exactly what the proposed resource allocation and optimization
algorithms will exploit in order to minimize the energy consumption of the system by
suitably allocating bits and energy to different sub-carriers.
2.2.3 Resource allocation in OFDM
Due to the limited availability of resources, e.g. bandwidth and energy, intelligent
allocation of these resources to the users is crucial for delivering the best possible
quality of service to the consumer with the least cost.
This is especially important with the high data rates envisioned for the next gen-
eration of wireless and wired standards that utilize OFDM. The problem of allocating
time slots, sub-carriers, rates, and powers to the different users in an OFDM system
has therefore been an area of active research [63].
In OFDM system design, bit and power allocation is considered as an essential
aspect. In practical systems, the problem of resource allocation is dealt with the help
of bit and power loading algorithms, which are used to distribute the total number of
26
2. SYSTEM SPECIFICATIONS
bits and the total available power among different sub-carriers in an optimal way to
maximize the system performances.
The resource allocation can be considered as a constraint optimization problem [64]
and is generally divided into two cases: margin adaptive (MA) [65] and rate adaptive
(RA) [66]. The objective of MA is to achieve the minimum overall transmit power given
the constraints on the users data rate and bit error rate (BER). On the other hand,
the objective of RA technique is to maximize total throughput, where total transmit
power is assumed to be constant. The optimization problem of RA can be formulated
in the case of point multi-point under total power constraint [67]
maxPk,n
N∑
n=1
B
Nklog2(1 +
Pk,nαk,nN0BNk
) (2.3)
subject toN
∑
n=1
K∑
k=1
Pk,n ≤ Pmax
where N is the total number of sub-carriers, K the total number of users, B the total
bandwidth, Pk,n the allocated power to user k in sub-carrier n, αk,n the channel gain of
user k in sub-carriers n, N0 the power spectrum density of additive white Gaussian noise
and Pmax the total power constraint. It was shown in [68] that in order to maximize
the total capacity, each sub-carrier should be allocated to the user with the best gain
on it, and the power should be allocated using the water-filling algorithm across the
sub-carriers. However, no fairness among the users was considered in [68]. Thus, the
users that have the best channel conditions will be assigned all the resources, which
leaves many users without a chance to use the spectrum.
The margin adaptive resource allocation problem was investigated in [65], in which
an iterative sub-carrier and power allocation algorithm was proposed to minimize the
total transmit power given a set of fixed user data rates requirements. They applied
a constraint relaxation technique, which allowed the binary integer parameter of sub-
carrier assignment to take on real values, which in turn implies a time-sharing of each
sub-carrier among users. The problem optimization is defined as
PT = minck,n
N∑
n=1
K∑
k=1
Pk,n (2.4)
subject to Rk =N
∑
n=1
ck,n∀ k ∈ {1, 2, ..., k}
27
2.3 UWB systems
where PT is the total power, Rk the user k data rate, ck,n the number of bits per OFDM
symbol of user k in sub-carrier n.
In this thesis, the bit-rate and the power is not considered for resource allocation
algorithms. Our focus is on quantity of information and energy consumption. Then, the
target is to minimize the energy required to transmit a given quantity of information
Q. The variables are {Qi}ni=1 and the optimization problem is
minn
∑
i=1
(2Qi
TiBi − 1)TiBiN0
|hi|2subject to
n∑
i=1Qi = Q
Qi ≥ 0(2.5)
where Qi is the quantity of information allocated to sub-channel i, Ti and Bi are the
transmission time and the bandwidth of sub-channel i respectively. We detail the
optimization procedures for such a strategy in the next chapter.
2.3 UWB systems
2.3.1 Description of impulse radio UWB
UWB is not a new technology [69]. However, it has gained great attention recently in
industry as well as in academia. The first definition for UWB signals is provided by the
Defense Advanced Research Projects Agency based on the fractional bandwidth Bf of
the signal which is defined as [70]
Bf =fH − fL
fH + fL(2.6)
where fH and fL are respectively the higher and lower −3 dB point in the spectrum.
According to the first provided definition, a signal can be classified as an UWB signal if
Bf is greater than 0.25. In February 2002, the FCC approved that any signal having a
−10 dB fractional bandwidth larger than 0.20, or a bandwidth greater than 500 MHz,
is characterized as an UWB signal. The wide bandwidth provides many advantages
over narrow-band systems [69]. In particular, UWB systems
• provide high data rates,
• have potentially small size, low complexity and low cost,
• robustness for multi-path and interference,
28
2. SYSTEM SPECIFICATIONS
• allow ranging and communication at the same time.
The advantage of UWB systems compared to narrow bandwidth systems can be un-
derstood by examining the Shannon capacity formula which is expressed as [71]
C = B log2(1 +S
N0) (2.7)
where C is the maximum channel capacity in bit/s, B the channel bandwidth in Hz,
and SN0the signal-to-noise ratio (SNR). We notice that to improve the channel capacity,
we can increase either the system bandwidth or the SNR. However, the capacity grows
linearly with the bandwidth [72], but only logarithmically with the signal power. For
this reason, communication engineers in general prefer to increase the system bandwidth
rather than the power, to achieve higher data rates.
UWB systems can be implemented in low cost, low-power integrated circuit pro-
cesses due to the baseband nature of the signal transmission. Unlike conventional radio
systems, the UWB transmitter produces a very short time-domain pulse, which is able
to propagate without the need of an additional radio frequency mixing stage [73]. The
UWB signal spans frequencies commonly used as carrier frequencies due to its very
wide-band nature. Consequently, the signal will propagate well without using addi-
tional up-conversion and down-conversion stages. Besides, single chip complementary
metal-oxide semiconductor (CMOS) integration of UWB transceiver contributes di-
rectly to low cost, low power and small size devices. Because of the large bandwidth of
the transmitted signal, UWB transmissions can resolve many paths, and consequently
very high multi-path resolution is achieved. For instance, a Gaussian monocycle UWB
transceiver experiences only a 1.5 dB fading margin in dense multi-path, which is very
low compared to deep fades experienced in narrow-band systems [74]. Finally, the
ultra-short duration of UWB waveforms offers the ability to provide high precision
ranging and high-speed data communication. For instance, UWB radios offer timing
precisions much better than the global positioning system and other radio systems [75],
as well as opportunities for short-range radar applications. Modulation techniques
UWB systems have historically been based on impulse radio concepts. However, since
the FCC decision, different modulation techniques have been proposed for UWB ap-
plications. In this section, we describe the two main modulation techniques considered
by the IEEE 802.15.3a study group for high data rate wireless personal area network
(WPAN) applications: the impulse response UWB and the MB-OFDM techniques.
29
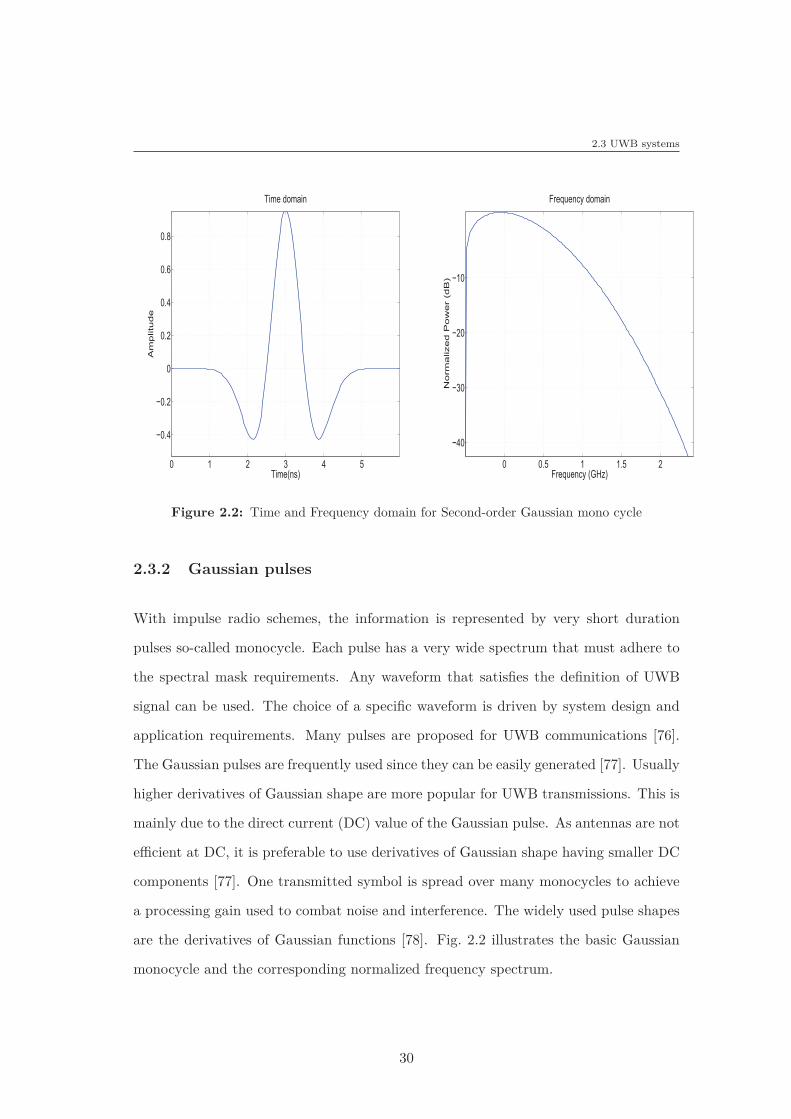
2.3 UWB systems
0 1 2 3 4 5
�0.4
�0.2
0
0.2
0.4
0.6
0.8
Time(ns)
Am
plitu
de
Time domain
0 0.5 1 1.5 2
�40
�30
�20
�10
Frequency domain
Frequency (GHz)
Norm
alized P
ow
er (
dB
)
Figure 2.2: Time and Frequency domain for Second-order Gaussian mono cycle
2.3.2 Gaussian pulses
With impulse radio schemes, the information is represented by very short duration
pulses so-called monocycle. Each pulse has a very wide spectrum that must adhere to
the spectral mask requirements. Any waveform that satisfies the definition of UWB
signal can be used. The choice of a specific waveform is driven by system design and
application requirements. Many pulses are proposed for UWB communications [76].
The Gaussian pulses are frequently used since they can be easily generated [77]. Usually
higher derivatives of Gaussian shape are more popular for UWB transmissions. This is
mainly due to the direct current (DC) value of the Gaussian pulse. As antennas are not
efficient at DC, it is preferable to use derivatives of Gaussian shape having smaller DC
components [77]. One transmitted symbol is spread over many monocycles to achieve
a processing gain used to combat noise and interference. The widely used pulse shapes
are the derivatives of Gaussian functions [78]. Fig. 2.2 illustrates the basic Gaussian
monocycle and the corresponding normalized frequency spectrum.
30
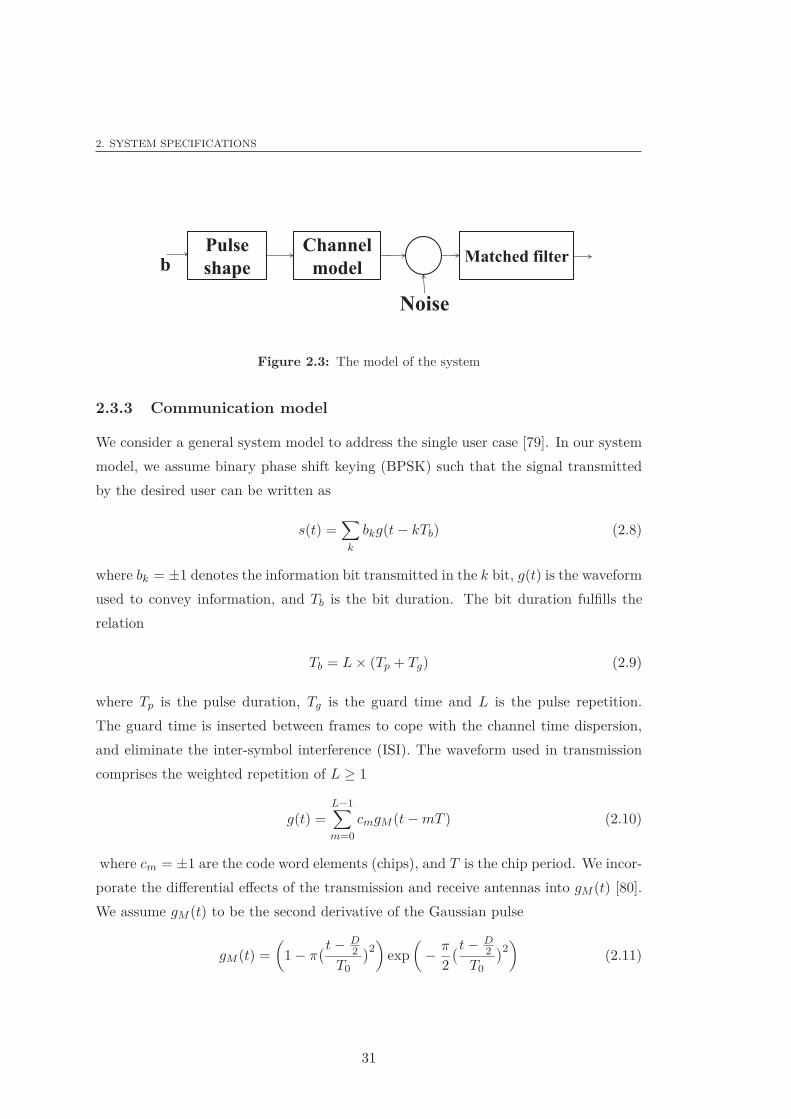
2. SYSTEM SPECIFICATIONS
Pulse
shape
Channel
model Matched filter
Noise
b
Figure 2.3: The model of the system
2.3.3 Communication model
We consider a general system model to address the single user case [79]. In our system
model, we assume binary phase shift keying (BPSK) such that the signal transmitted
by the desired user can be written as
s(t) =∑
k
bkg(t − kTb) (2.8)
where bk = ±1 denotes the information bit transmitted in the k bit, g(t) is the waveform
used to convey information, and Tb is the bit duration. The bit duration fulfills the
relation
Tb = L × (Tp + Tg) (2.9)
where Tp is the pulse duration, Tg is the guard time and L is the pulse repetition.
The guard time is inserted between frames to cope with the channel time dispersion,
and eliminate the inter-symbol interference (ISI). The waveform used in transmission
comprises the weighted repetition of L ≥ 1
g(t) =L−1∑
m=0
cmgM (t − mT ) (2.10)
where cm = ±1 are the code word elements (chips), and T is the chip period. We incor-
porate the differential effects of the transmission and receive antennas into gM (t) [80].
We assume gM (t) to be the second derivative of the Gaussian pulse
gM (t) =
(
1 − π( t − D
2
T0
)2)
exp
(
− π
2
( t − D2
T0
)2)
(2.11)
31
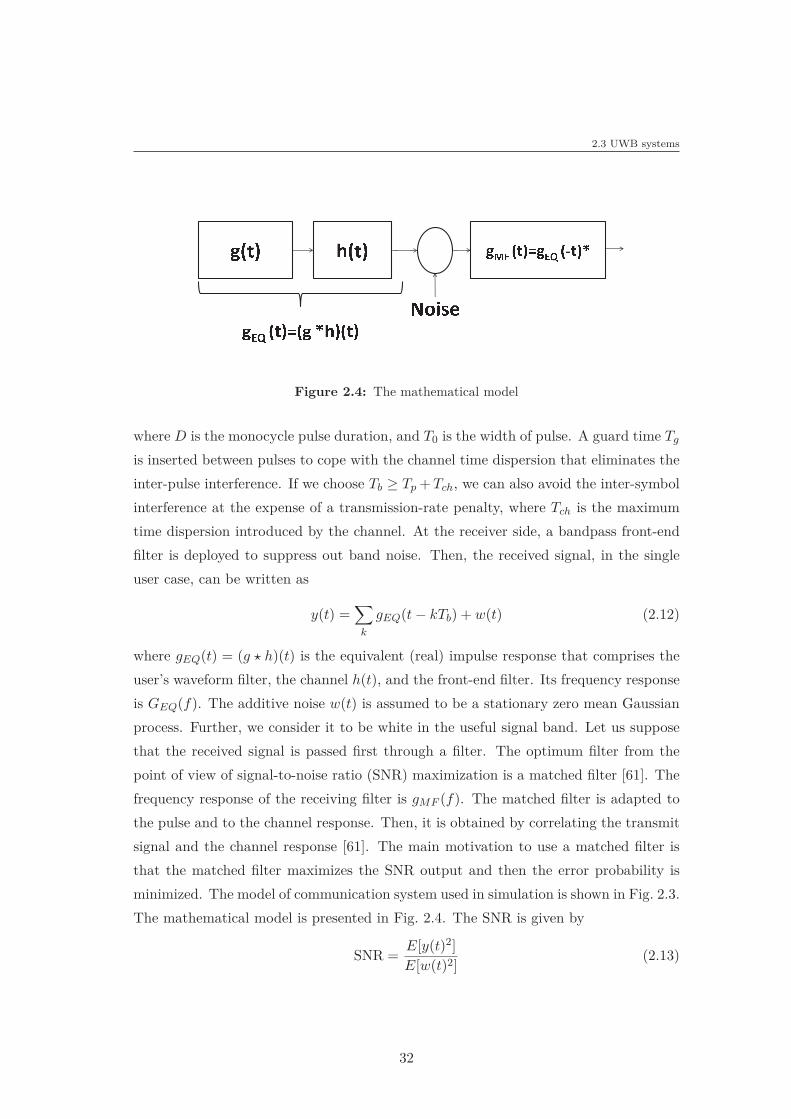
2.3 UWB systems
✙ ✚ ✛ ✜ ✢ ✚ ✛ ✜ ✣ ✤ ✥ ✦ ✧ ★ ✩ ✣ ✪ ✫ ✦ ✬ ✧ ★ ✭✮ ✯ ✰ ✱ ✲ ✳ ✴ ✱ ✮ ✵ ✶ ✳ ✱ ✲ ✳ ✷ ✸ ✹ ✺ ✻Figure 2.4: The mathematical model
where D is the monocycle pulse duration, and T0 is the width of pulse. A guard time Tg
is inserted between pulses to cope with the channel time dispersion that eliminates the
inter-pulse interference. If we choose Tb ≥ Tp + Tch, we can also avoid the inter-symbol
interference at the expense of a transmission-rate penalty, where Tch is the maximum
time dispersion introduced by the channel. At the receiver side, a bandpass front-end
filter is deployed to suppress out band noise. Then, the received signal, in the single
user case, can be written as
y(t) =∑
k
gEQ(t − kTb) + w(t) (2.12)
where gEQ(t) = (g ⋆ h)(t) is the equivalent (real) impulse response that comprises the
user’s waveform filter, the channel h(t), and the front-end filter. Its frequency response
is GEQ(f). The additive noise w(t) is assumed to be a stationary zero mean Gaussian
process. Further, we consider it to be white in the useful signal band. Let us suppose
that the received signal is passed first through a filter. The optimum filter from the
point of view of signal-to-noise ratio (SNR) maximization is a matched filter [61]. The
frequency response of the receiving filter is gMF (f). The matched filter is adapted to
the pulse and to the channel response. Then, it is obtained by correlating the transmit
signal and the channel response [61]. The main motivation to use a matched filter is
that the matched filter maximizes the SNR output and then the error probability is
minimized. The model of communication system used in simulation is shown in Fig. 2.3.
The mathematical model is presented in Fig. 2.4. The SNR is given by
SNR =E[y(t)2]
E[w(t)2](2.13)
32
2. SYSTEM SPECIFICATIONS
where y(t) represents the signal component and w(t) the noise component. The received
energy is equal to
S = E[|b(kt)|2|g(0)|2] (2.14)
S = Mb|g(0)|2 (2.15)
where Mb ∈ {−1, +1}
• Hence, to simplify the calculation of the SNR, it night be calculated in the fre-
quency domain. The formula of the SNR in the frequency domain becomes
SNR =Mb|
∫
GEQ(f)G∗EQ(f)df |2
N0/2∫
|GEQ(f)|2df(2.16)
• When there is no inter-symbol interference, the output SNR obtained with the
matched filter is
SNRb =Mb
N0/2
∫
|GEQ(f)|2df (2.17)
2.3.4 Multi-band OFDM
2.3.4.1 Multi-band technique
Many companies have proposed a multi-band technique for UWB applications in order
to solve common problems encountered when working on a single-band impulse radio
technology. These problems include [81]
• inflexible spectrum mask because the occupied spectrum can not be easily altered
since it is dictated in large part by the pulse-shaping filter,
• implementation difficulties and active circuits design giving rise to increased cost
and power consumption,
• high sample rates in digital-to-analog and analog-to-digital converters,
• weakness to strong interferences,
• single-band UWB not well suited to low cost RF-CMOS implementations. A
multi-band UWB signaling can be seen as a simple division of a single UWB
signal into multiple sub-bands in the frequency domain. These sub-bands may be
33
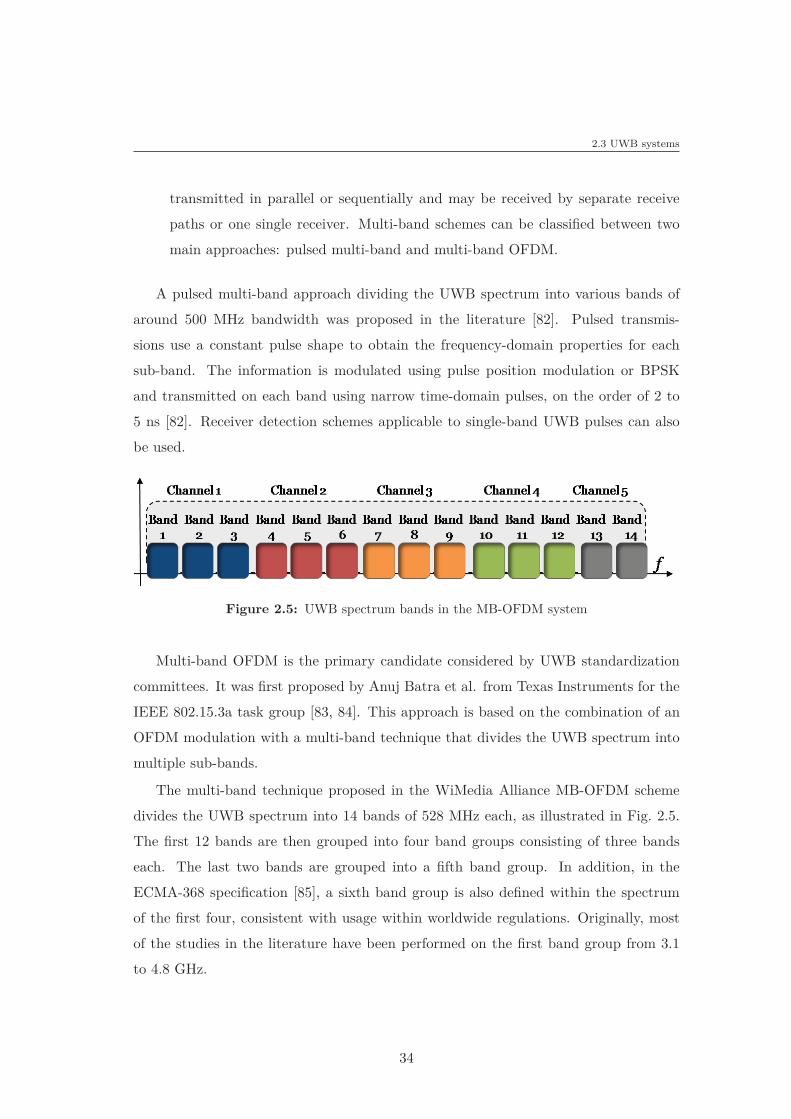
2.3 UWB systems
transmitted in parallel or sequentially and may be received by separate receive
paths or one single receiver. Multi-band schemes can be classified between two
main approaches: pulsed multi-band and multi-band OFDM.
A pulsed multi-band approach dividing the UWB spectrum into various bands of
around 500 MHz bandwidth was proposed in the literature [82]. Pulsed transmis-
sions use a constant pulse shape to obtain the frequency-domain properties for each
sub-band. The information is modulated using pulse position modulation or BPSK
and transmitted on each band using narrow time-domain pulses, on the order of 2 to
5 ns [82]. Receiver detection schemes applicable to single-band UWB pulses can also
be used.
Figure 2.5: UWB spectrum bands in the MB-OFDM system
Multi-band OFDM is the primary candidate considered by UWB standardization
committees. It was first proposed by Anuj Batra et al. from Texas Instruments for the
IEEE 802.15.3a task group [83, 84]. This approach is based on the combination of an
OFDM modulation with a multi-band technique that divides the UWB spectrum into
multiple sub-bands.
The multi-band technique proposed in the WiMedia Alliance MB-OFDM scheme
divides the UWB spectrum into 14 bands of 528 MHz each, as illustrated in Fig. 2.5.
The first 12 bands are then grouped into four band groups consisting of three bands
each. The last two bands are grouped into a fifth band group. In addition, in the
ECMA-368 specification [85], a sixth band group is also defined within the spectrum
of the first four, consistent with usage within worldwide regulations. Originally, most
of the studies in the literature have been performed on the first band group from 3.1
to 4.8 GHz.
34
2. SYSTEM SPECIFICATIONS
2.3.4.2 Impulse radio and MB-OFDM comparison
The transmitted signal in the single-band impulse radio can be easily generated in the
analog domain using analog circuits. Further, when the signal bandwidth is very large,
the analog circuits and mixed-signal circuits, such as the analog to digital converters
in the receiver are difficult to design. Beside, these circuits consume a large amount
of energy in order to process the signal at a high data rate and keep a sufficiently low
noise figure. In addition, the complexity of the digital baseband is high, due to the
large number of RAKE fingers that is needed to capture sufficient energy in a dense
multi-path environment [86].
In the pulsed multi-band approach, the information is processed over a much smaller
bandwidth which enables reducing the energy consumption and the design complexity,
and improving the spectral flexibility. The multi-path energy collection can be improved
by adding several RF chains, but this increases power consumption and devices cost [86].
On the other hand, the MB-OFDM approach benefits from the same multi-band
advantages as the pulsed multi-band approach. The MB-OFDM system is able to
capture multi-path energy efficiently with a single RF chain. Furthermore, it offers
relaxed frequency-switching time requirements and increases the spectral flexibility.
One particularly important issue for UWB systems is its resistance to interference [87].
The MB-OFDM system facilitates the interference avoidance based on OFDM principle.
In addition, the MB-OFDM technology has been specially built by low cost CMOS
processes [86], which makes it easier to integrate into a single-chip solution. One of the
few drawbacks of MB-OFDM is that requires inverse discrete Fourier transform which
returns the transmitter more complex. Added to this, the peak-to-average power ratio
of the transmitted signal may be slightly higher than that of the pulse-based multi-band
systems.
2.4 Applications
2.4.1 WiMAX
The IEEE 802.16 group was formed in 1998 to develop an air-interface standard for
wireless broadband. The group’s initial focus was the development of a LOS-based
35
2.4 Applications
point-to-multipoint wireless broadband system for operation in the 10–66 GHz millime-
ter wave band. The original IEEE 802.16 standard, completed in December 2001 was
based on a single-carrier physical (PHY) layer with a burst time division multiplexed
MAC layer. The IEEE 802.16 group subsequently produced 802.16a, an amendment to
the standard, to include non line-of-sight (NLOS) applications in the 2–11 GHz band,
using an orthogonal frequency division multiplexing based physical layer. Additions
to the MAC layer, such as support for orthogonal frequency division multiple access
(OFDMA), was also included. Further revisions resulted in a new standard in 2004,
called IEEE 802.16-2004, which replaced all prior versions and formed the basis for the
first WiMAX solution. This WiMAX solution based on IEEE 802.16-2004 is intended
to fixed applications, and we refer to this as fixed WiMAX [88]. In December 2005, the
IEEE group completed and approved IEEE 802.16e-2005, an amendment to the IEEE
802.16-2004 standard that added mobility support. The IEEE 802.16e-2005 forms the
basis for the mobile applications and is often referred to as mobile WiMAX. WiMAX
is capable of supporting very high peak data rates. In fact, the peak PHY data rate
can be as high as 74 Mbit/s [89]. The IEEE 802.16e-2005 standard offers a wide choice
of optional PHY and MAC features. This section is intended to provide a high-level
overview of the channel in WiMAX technology with an emphasis on the PHY layer
features. The WiMAX physical layer is based on orthogonal frequency division mul-
tiplexing, which allows WiMAX to operate in NLOS conditions. WiMAX supports a
variety of modulation and coding schemes and allows for the scheme to change on a
burst-by-burst basis per link, depending on channel conditions. In WiMaX, the set
of available sub-carriers should be divided into several groups of sub-carriers called
sub-channels [90]. A sub-channel, as defined in the IEEE 802.16e-2005 standard, is a
logical collection of sub-carriers. The number and exact distribution of the sub-carriers
that constitute a sub-channel depend on the sub-carrier permutation mode. The per-
mutation into sub-channels is used in the both uplink and downlink. Two methods for
permutation are used in WiMAX systems [88, 90]. The first permutation uses either
adjacent sub-carriers called adaptive and modulation coding (AMC). Te second per-
mutation uses sub-carriers distributed in a pseudo-randomly in the frequency spectrum
called partial usage of sub-carriers (PUSC).
The sub-channel PUSC permutation exploits the frequency diversity. With PUSC,
it is possible to allocate all or part of the six sub-channel transmitters. It is also possible
36
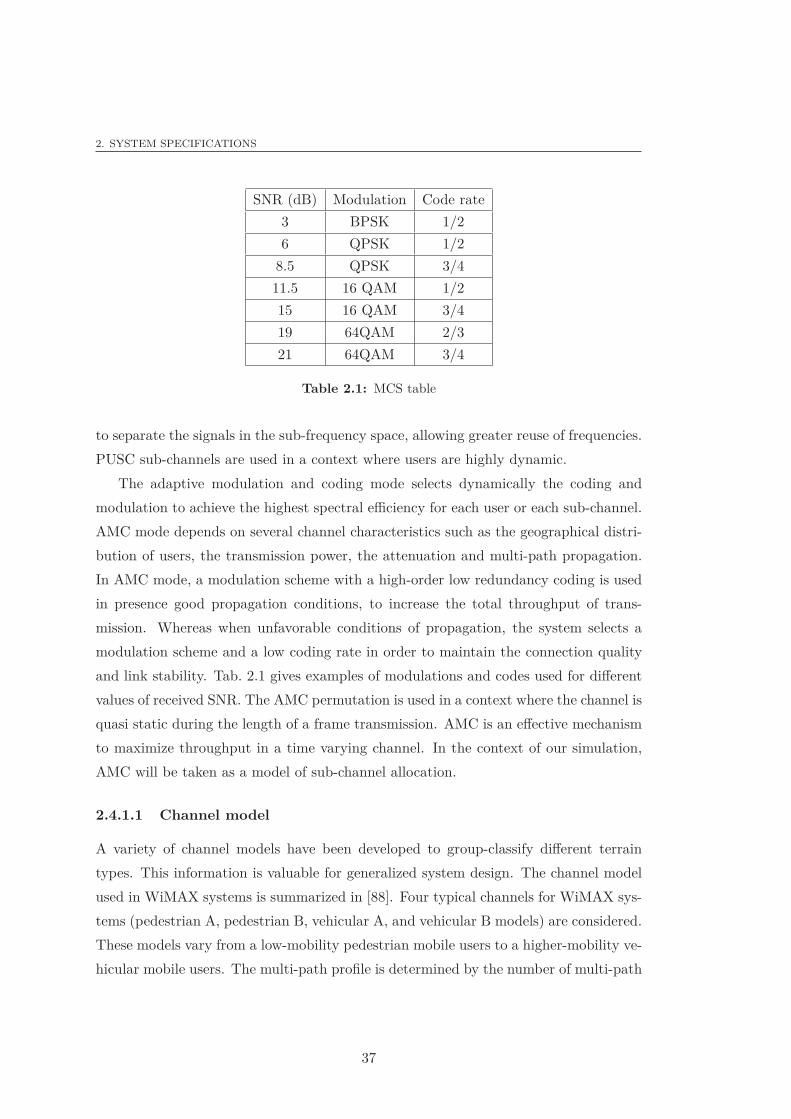
2. SYSTEM SPECIFICATIONS
SNR (dB) Modulation Code rate
3 BPSK 1/2
6 QPSK 1/2
8.5 QPSK 3/4
11.5 16 QAM 1/2
15 16 QAM 3/4
19 64QAM 2/3
21 64QAM 3/4
Table 2.1: MCS table
to separate the signals in the sub-frequency space, allowing greater reuse of frequencies.
PUSC sub-channels are used in a context where users are highly dynamic.
The adaptive modulation and coding mode selects dynamically the coding and
modulation to achieve the highest spectral efficiency for each user or each sub-channel.
AMC mode depends on several channel characteristics such as the geographical distri-
bution of users, the transmission power, the attenuation and multi-path propagation.
In AMC mode, a modulation scheme with a high-order low redundancy coding is used
in presence good propagation conditions, to increase the total throughput of trans-
mission. Whereas when unfavorable conditions of propagation, the system selects a
modulation scheme and a low coding rate in order to maintain the connection quality
and link stability. Tab. 2.1 gives examples of modulations and codes used for different
values of received SNR. The AMC permutation is used in a context where the channel is
quasi static during the length of a frame transmission. AMC is an effective mechanism
to maximize throughput in a time varying channel. In the context of our simulation,
AMC will be taken as a model of sub-channel allocation.
2.4.1.1 Channel model
A variety of channel models have been developed to group-classify different terrain
types. This information is valuable for generalized system design. The channel model
used in WiMAX systems is summarized in [88]. Four typical channels for WiMAX sys-
tems (pedestrian A, pedestrian B, vehicular A, and vehicular B models) are considered.
These models vary from a low-mobility pedestrian mobile users to a higher-mobility ve-
hicular mobile users. The multi-path profile is determined by the number of multi-path
37
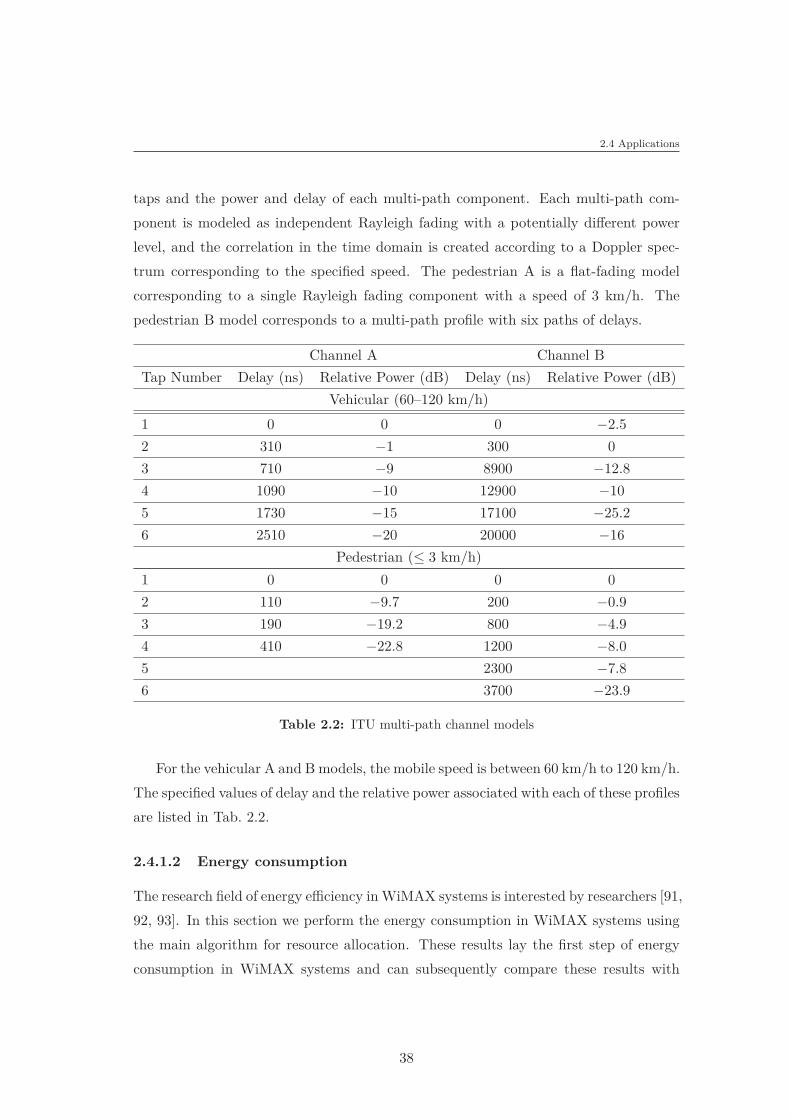
2.4 Applications
taps and the power and delay of each multi-path component. Each multi-path com-
ponent is modeled as independent Rayleigh fading with a potentially different power
level, and the correlation in the time domain is created according to a Doppler spec-
trum corresponding to the specified speed. The pedestrian A is a flat-fading model
corresponding to a single Rayleigh fading component with a speed of 3 km/h. The
pedestrian B model corresponds to a multi-path profile with six paths of delays.
Channel A Channel B
Tap Number Delay (ns) Relative Power (dB) Delay (ns) Relative Power (dB)
Vehicular (60–120 km/h)
1 0 0 0 −2.5
2 310 −1 300 0
3 710 −9 8900 −12.8
4 1090 −10 12900 −10
5 1730 −15 17100 −25.2
6 2510 −20 20000 −16
Pedestrian (≤ 3 km/h)
1 0 0 0 0
2 110 −9.7 200 −0.9
3 190 −19.2 800 −4.9
4 410 −22.8 1200 −8.0
5 2300 −7.8
6 3700 −23.9
Table 2.2: ITU multi-path channel models
For the vehicular A and B models, the mobile speed is between 60 km/h to 120 km/h.
The specified values of delay and the relative power associated with each of these profiles
are listed in Tab. 2.2.
2.4.1.2 Energy consumption
The research field of energy efficiency inWiMAX systems is interested by researchers [91,
92, 93]. In this section we perform the energy consumption in WiMAX systems using
the main algorithm for resource allocation. These results lay the first step of energy
consumption in WiMAX systems and can subsequently compare these results with
38
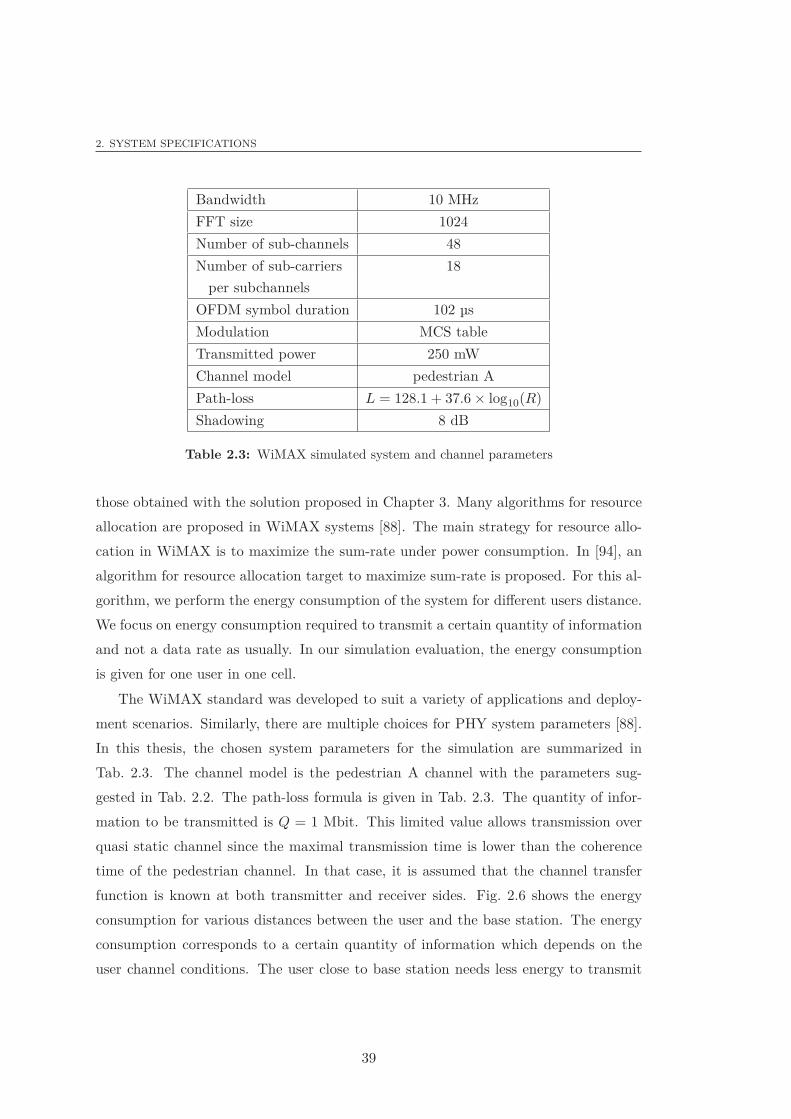
2. SYSTEM SPECIFICATIONS
Bandwidth 10 MHz
FFT size 1024
Number of sub-channels 48
Number of sub-carriers 18
per subchannels
OFDM symbol duration 102 µs
Modulation MCS table
Transmitted power 250 mW
Channel model pedestrian A
Path-loss L = 128.1 + 37.6 × log10(R)
Shadowing 8 dB
Table 2.3: WiMAX simulated system and channel parameters
those obtained with the solution proposed in Chapter 3. Many algorithms for resource
allocation are proposed in WiMAX systems [88]. The main strategy for resource allo-
cation in WiMAX is to maximize the sum-rate under power consumption. In [94], an
algorithm for resource allocation target to maximize sum-rate is proposed. For this al-
gorithm, we perform the energy consumption of the system for different users distance.
We focus on energy consumption required to transmit a certain quantity of information
and not a data rate as usually. In our simulation evaluation, the energy consumption
is given for one user in one cell.
The WiMAX standard was developed to suit a variety of applications and deploy-
ment scenarios. Similarly, there are multiple choices for PHY system parameters [88].
In this thesis, the chosen system parameters for the simulation are summarized in
Tab. 2.3. The channel model is the pedestrian A channel with the parameters sug-
gested in Tab. 2.2. The path-loss formula is given in Tab. 2.3. The quantity of infor-
mation to be transmitted is Q = 1 Mbit. This limited value allows transmission over
quasi static channel since the maximal transmission time is lower than the coherence
time of the pedestrian channel. In that case, it is assumed that the channel transfer
function is known at both transmitter and receiver sides. Fig. 2.6 shows the energy
consumption for various distances between the user and the base station. The energy
consumption corresponds to a certain quantity of information which depends on the
user channel conditions. The user close to base station needs less energy to transmit
39
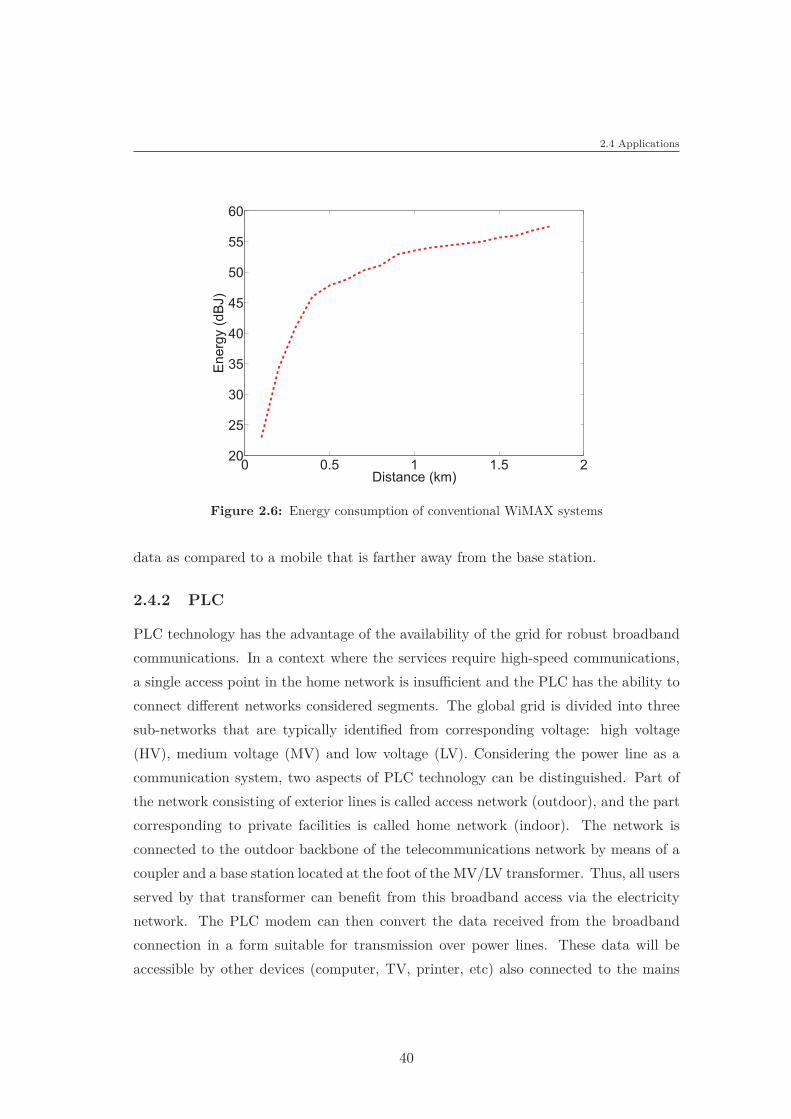
2.4 Applications
0 0.5 1 1.5 220
25
30
35
40
45
50
55
60
Distance (km)
Energ
y (
dB
J)
Figure 2.6: Energy consumption of conventional WiMAX systems
data as compared to a mobile that is farther away from the base station.
2.4.2 PLC
PLC technology has the advantage of the availability of the grid for robust broadband
communications. In a context where the services require high-speed communications,
a single access point in the home network is insufficient and the PLC has the ability to
connect different networks considered segments. The global grid is divided into three
sub-networks that are typically identified from corresponding voltage: high voltage
(HV), medium voltage (MV) and low voltage (LV). Considering the power line as a
communication system, two aspects of PLC technology can be distinguished. Part of
the network consisting of exterior lines is called access network (outdoor), and the part
corresponding to private facilities is called home network (indoor). The network is
connected to the outdoor backbone of the telecommunications network by means of a
coupler and a base station located at the foot of the MV/LV transformer. Thus, all users
served by that transformer can benefit from this broadband access via the electricity
network. The PLC modem can then convert the data received from the broadband
connection in a form suitable for transmission over power lines. These data will be
accessible by other devices (computer, TV, printer, etc) also connected to the mains
40
2. SYSTEM SPECIFICATIONS
via a PLC modem. It should be noted that with the rise of automation services, the
network Indoor PLC is a reasonable solution for the realization of networks with a large
number of terminals, not only for their applications in the industrial and commercial
sector and in large buildings, but also for their applications in private households.
Industrial PLC came together in consortium to support standardization work. The
consortium also allows industries to share their opinions, interests and propose their own
standards. Different consortium and standards bodies define the rules for the possible
use of PLC networks and devices that should be accepted by the various stakeholders
such as manufacturers, Internet service providers, integrators and network operators.
Some well-known consortium are listed below:
• HomePlug powerline alliance,
• Universal Power Line Association,
• Consumer Electronics Power Line Communication Alliance
• United Power Line Council,
• Continental Automated Buildings Association.
The standard focused in this thesis is the HPAV. The HomePlug AV represents the next
generation of technology from the HomePlug Powerline Alliance. The HPAV alliance
founded in March 2000 has now over 75 members. It works to create programs and
certification requirements for reliable operation of the PLC network [95]. The alliance
accelerates application for authorization to market its products and services Homeplug
worldwide through mentoring programs and training on the market. The alliance has
created several specifications for standards such as HomePlug 1.0 PLC, HomePlug AV
(HPAV) and HomePlug broadband power line (HPAV BPL).
2.4.2.1 Power line channel
When propagating through the transmission channel, the transmitted waves are sub-
ject to various phenomena which modify their shape, their amplitude and phase. In
the most general case, there may be attenuation phenomena, phase shift, reflection,
diffraction or diffusion, depending on the interactions between the waves and the phys-
ical medium. PLC channel is further characterized by the high levels of interference and
41
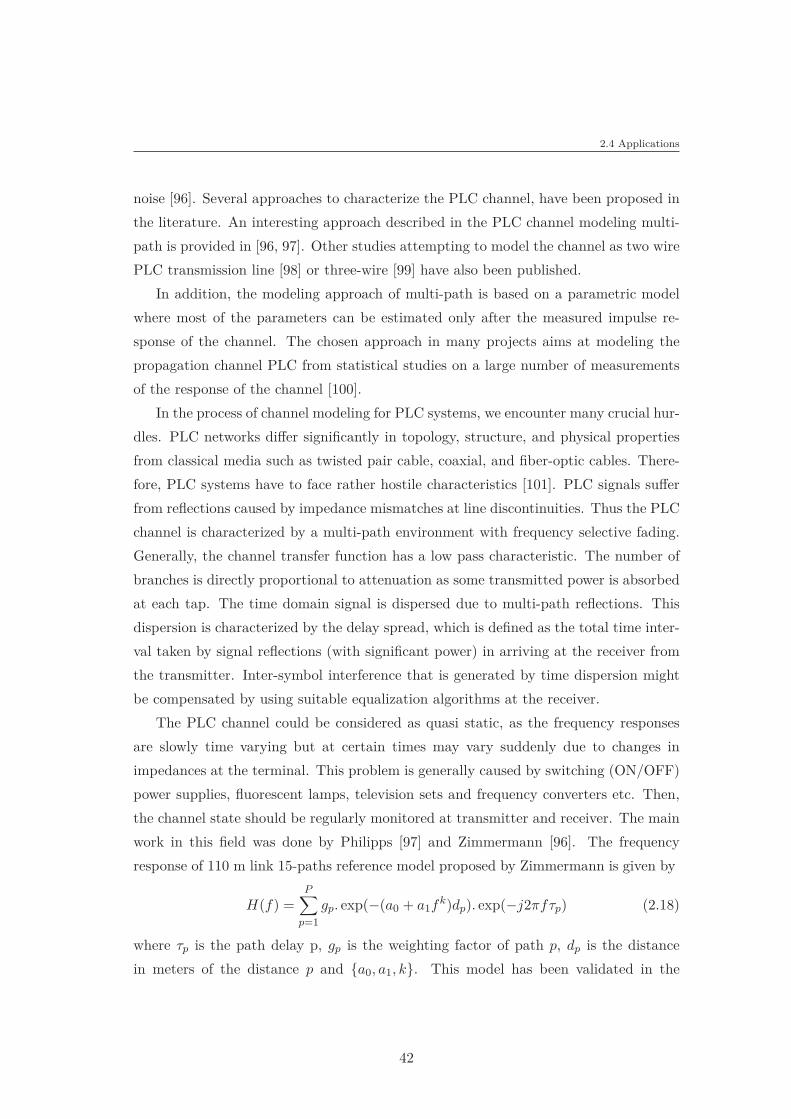
2.4 Applications
noise [96]. Several approaches to characterize the PLC channel, have been proposed in
the literature. An interesting approach described in the PLC channel modeling multi-
path is provided in [96, 97]. Other studies attempting to model the channel as two wire
PLC transmission line [98] or three-wire [99] have also been published.
In addition, the modeling approach of multi-path is based on a parametric model
where most of the parameters can be estimated only after the measured impulse re-
sponse of the channel. The chosen approach in many projects aims at modeling the
propagation channel PLC from statistical studies on a large number of measurements
of the response of the channel [100].
In the process of channel modeling for PLC systems, we encounter many crucial hur-
dles. PLC networks differ significantly in topology, structure, and physical properties
from classical media such as twisted pair cable, coaxial, and fiber-optic cables. There-
fore, PLC systems have to face rather hostile characteristics [101]. PLC signals suffer
from reflections caused by impedance mismatches at line discontinuities. Thus the PLC
channel is characterized by a multi-path environment with frequency selective fading.
Generally, the channel transfer function has a low pass characteristic. The number of
branches is directly proportional to attenuation as some transmitted power is absorbed
at each tap. The time domain signal is dispersed due to multi-path reflections. This
dispersion is characterized by the delay spread, which is defined as the total time inter-
val taken by signal reflections (with significant power) in arriving at the receiver from
the transmitter. Inter-symbol interference that is generated by time dispersion might
be compensated by using suitable equalization algorithms at the receiver.
The PLC channel could be considered as quasi static, as the frequency responses
are slowly time varying but at certain times may vary suddenly due to changes in
impedances at the terminal. This problem is generally caused by switching (ON/OFF)
power supplies, fluorescent lamps, television sets and frequency converters etc. Then,
the channel state should be regularly monitored at transmitter and receiver. The main
work in this field was done by Philipps [97] and Zimmermann [96]. The frequency
response of 110 m link 15-paths reference model proposed by Zimmermann is given by
H(f) =P
∑
p=1
gp. exp(−(a0 + a1fk)dp). exp(−j2πfτp) (2.18)
where τp is the path delay p, gp is the weighting factor of path p, dp is the distance
in meters of the distance p and {a0, a1, k}. This model has been validated in the
42
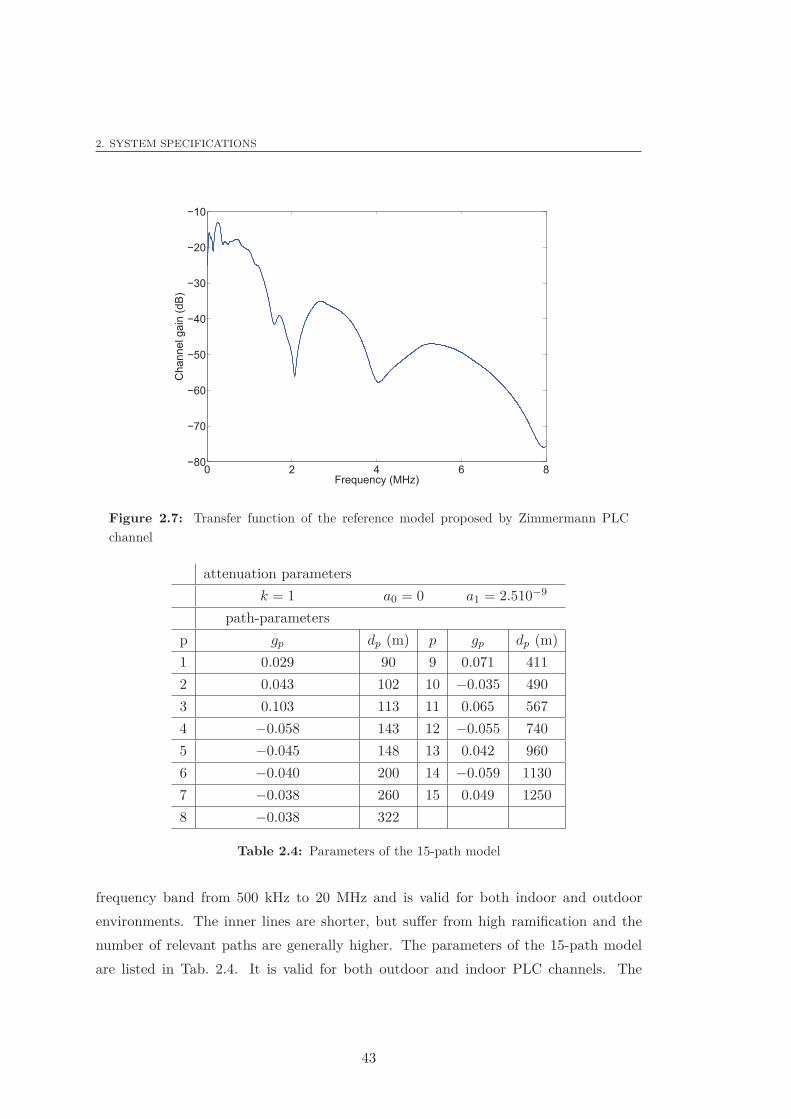
2. SYSTEM SPECIFICATIONS
0 2 4 6 8�80
�70
�60
�50
�40
�30
�20
�10
Frequency (MHz)
Ch
an
ne
l g
ain
(d
B)
Figure 2.7: Transfer function of the reference model proposed by Zimmermann PLC
channel
attenuation parameters
k = 1 a0 = 0 a1 = 2.510−9
path-parameters
p gp dp (m) p gp dp (m)
1 0.029 90 9 0.071 411
2 0.043 102 10 −0.035 490
3 0.103 113 11 0.065 567
4 −0.058 143 12 −0.055 740
5 −0.045 148 13 0.042 960
6 −0.040 200 14 −0.059 1130
7 −0.038 260 15 0.049 1250
8 −0.038 322
Table 2.4: Parameters of the 15-path model
frequency band from 500 kHz to 20 MHz and is valid for both indoor and outdoor
environments. The inner lines are shorter, but suffer from high ramification and the
number of relevant paths are generally higher. The parameters of the 15-path model
are listed in Tab. 2.4. It is valid for both outdoor and indoor PLC channels. The
43
2.4 Applications
0 20 40 60 80
�80
�75
�70
�65
�60
�55
�50
Frequency (MHz)
DS
P (
dB
m/H
z)
Figure 2.8: DSP mask for PLC systems
indoor lines are shorter, but they suffer from strong branching: the number of relevant
paths is then usually higher while the attenuation associated with each path is smaller.
Length profiles of the attenuation of power line links, i.e. neglecting the impacts of
notches, as proposed in [96], and the corresponding parameters are listed in Tab. 2.4.
The attenuation corresponding to the length profiles is provided in Tab. 2.5. These
profiles are used to compare the performance of PLC systems at various distances.
class gp a1 (m−1) a1 (s/p) k
100m 1 9.4 10−3 4.2 10−7 0.7
150m 1 1.09 10−2 3.36 10−7 0.7
200m 1 9.33 10−3 3.24 10−7 0.7
300m 1 8.4 10−3 3.0 10−7 1
380m 1 6.2 10−3 4.0 10−7 1
Table 2.5: Attenuation parameters corresponding to the length profiles
A power spectral density (PSD) mask for HPAV specification is shown in Fig. 2.8,
where 4 or 5 additional sub-carriers on either side are set to zero amplitude in order to
guarantee that the energy inside the licensed band will be at least 30 dB lower than the
44
2. SYSTEM SPECIFICATIONS
normal transmit power. A high background noise level of 110 dBm/Hz is considered
for indoor PLC networks [102].
2.4.2.2 Energy consumption
Many algorithms for resource allocation have been proposed for PLC standard [103,
104]. As others technologies, the primary strategy for resource allocation in PLC is to
maximize the bit-rate under power consumption. In [103], an algorithm for resource
allocation target to maximize bit-rate is proposed. In this section, we present numerical
evaluations of OFDM transmission in powerline communications. In particular, our
attention is focused on performance of the energy consumed by a conventional PLC
system. The generated signal is composed of N = 1024 sub-carriers transmitted in the
band 0–20 MHz. The OFDM symbol duration is 57 µs including a guard interval of
5.8 µs. Perfect synchronization and channel estimation are assumed and the channel
transfer function is known at both transmitter and receiver sides. The performance
of simulations are computed in the case of perfect channel coding with a system noise
margin equal to 0 dB. The signal is transmitted with respect to a PSD mask. Fig. 2.9
shows the energy consumption of the PLC system versus data transmission. This
figure allows us to understand the relation between quantity of information and energy
consumption and permits therefore to compare it with the solution proposed for energy
minimization in PLC communications.
2.4.3 WiMedia
The WiMedia Alliance defines, certifies and supports enabling wireless technology for
multimedia applications. WiMedia UWB technology represents the next evolution of
WPAN offering end users wireless convenience for a broad range of PC and consumer
electronics products. WiMedia Alliance is also focused on providing specifications for
streaming video applications. WiMedia technology is an ISO-published radio standard
for high-speed, UWB wireless connectivity that offers an unsurpassed combination of
high data throughput rates and low energy consumption. With regulatory approval
in major markets worldwide, this technology has gained broad industry momentum as
evidenced by its selection for Wireless USB and high-speed Bluetooth. The standard-
ization activity of wireless personal area networks takes place in the IEEE international
standards working group 802.15. In late 2001, the IEEE established the 802.15.3a study
45
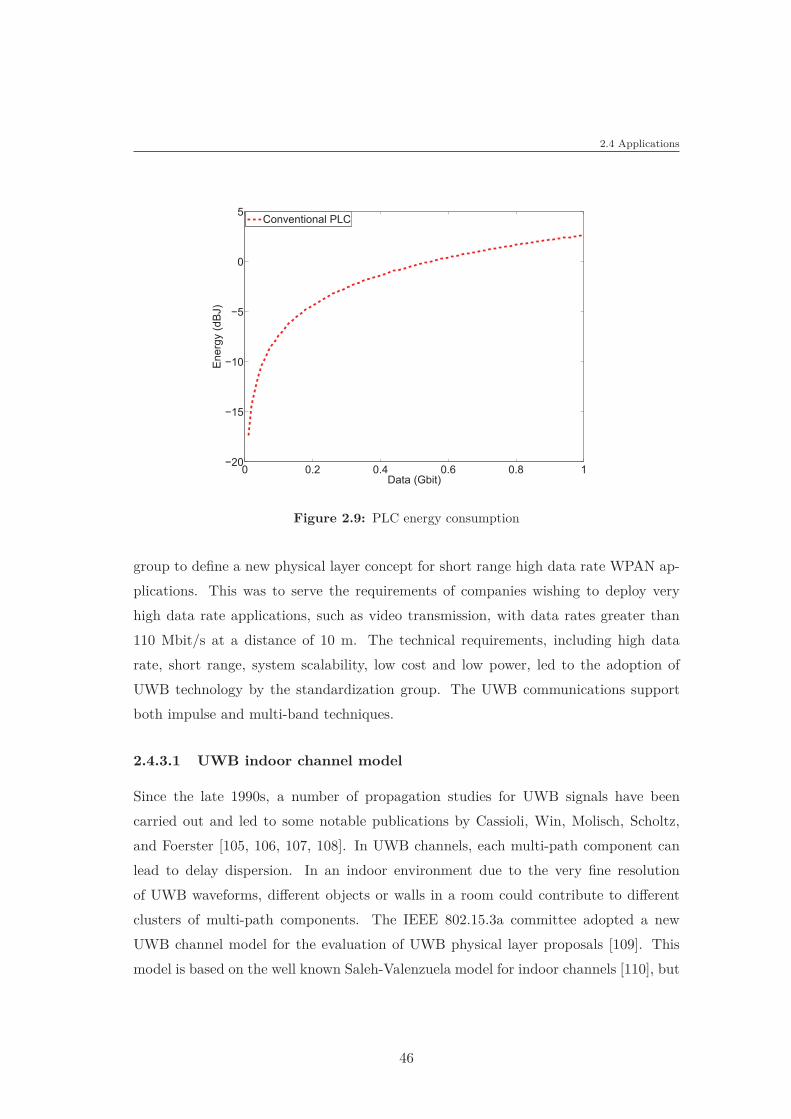
2.4 Applications
0 0.2 0.4 0.6 0.8 1�20
�15
�10
�5
0
5
Data (Gbit)
En
erg
y (
dB
J)
Conventional PLC
Figure 2.9: PLC energy consumption
group to define a new physical layer concept for short range high data rate WPAN ap-
plications. This was to serve the requirements of companies wishing to deploy very
high data rate applications, such as video transmission, with data rates greater than
110 Mbit/s at a distance of 10 m. The technical requirements, including high data
rate, short range, system scalability, low cost and low power, led to the adoption of
UWB technology by the standardization group. The UWB communications support
both impulse and multi-band techniques.
2.4.3.1 UWB indoor channel model
Since the late 1990s, a number of propagation studies for UWB signals have been
carried out and led to some notable publications by Cassioli, Win, Molisch, Scholtz,
and Foerster [105, 106, 107, 108]. In UWB channels, each multi-path component can
lead to delay dispersion. In an indoor environment due to the very fine resolution
of UWB waveforms, different objects or walls in a room could contribute to different
clusters of multi-path components. The IEEE 802.15.3a committee adopted a new
UWB channel model for the evaluation of UWB physical layer proposals [109]. This
model is based on the well known Saleh-Valenzuela model for indoor channels [110], but
46
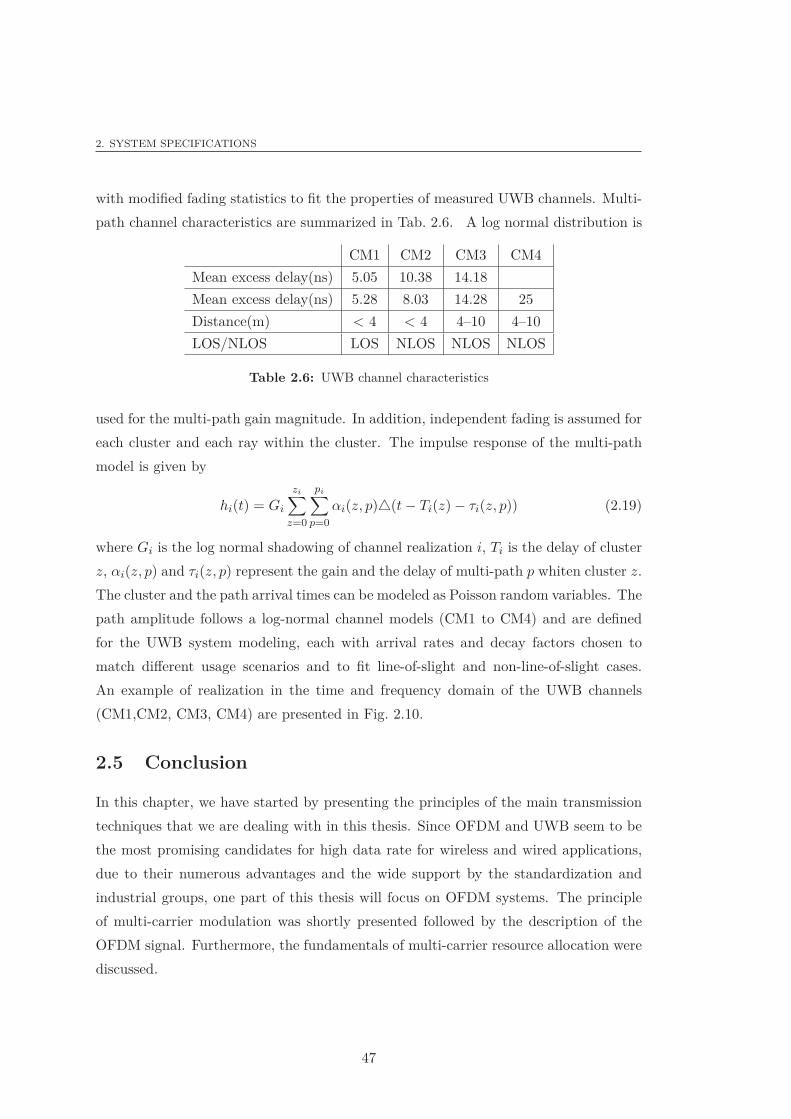
2. SYSTEM SPECIFICATIONS
with modified fading statistics to fit the properties of measured UWB channels. Multi-
path channel characteristics are summarized in Tab. 2.6. A log normal distribution is
CM1 CM2 CM3 CM4
Mean excess delay(ns) 5.05 10.38 14.18
Mean excess delay(ns) 5.28 8.03 14.28 25
Distance(m) < 4 < 4 4–10 4–10
LOS/NLOS LOS NLOS NLOS NLOS
Table 2.6: UWB channel characteristics
used for the multi-path gain magnitude. In addition, independent fading is assumed for
each cluster and each ray within the cluster. The impulse response of the multi-path
model is given by
hi(t) = Gi
zi∑
z=0
pi∑
p=0
αi(z, p)△(t − Ti(z) − τi(z, p)) (2.19)
where Gi is the log normal shadowing of channel realization i, Ti is the delay of cluster
z, αi(z, p) and τi(z, p) represent the gain and the delay of multi-path p whiten cluster z.
The cluster and the path arrival times can be modeled as Poisson random variables. The
path amplitude follows a log-normal channel models (CM1 to CM4) and are defined
for the UWB system modeling, each with arrival rates and decay factors chosen to
match different usage scenarios and to fit line-of-slight and non-line-of-slight cases.
An example of realization in the time and frequency domain of the UWB channels
(CM1,CM2, CM3, CM4) are presented in Fig. 2.10.
2.5 Conclusion
In this chapter, we have started by presenting the principles of the main transmission
techniques that we are dealing with in this thesis. Since OFDM and UWB seem to be
the most promising candidates for high data rate for wireless and wired applications,
due to their numerous advantages and the wide support by the standardization and
industrial groups, one part of this thesis will focus on OFDM systems. The principle
of multi-carrier modulation was shortly presented followed by the description of the
OFDM signal. Furthermore, the fundamentals of multi-carrier resource allocation were
discussed.
47
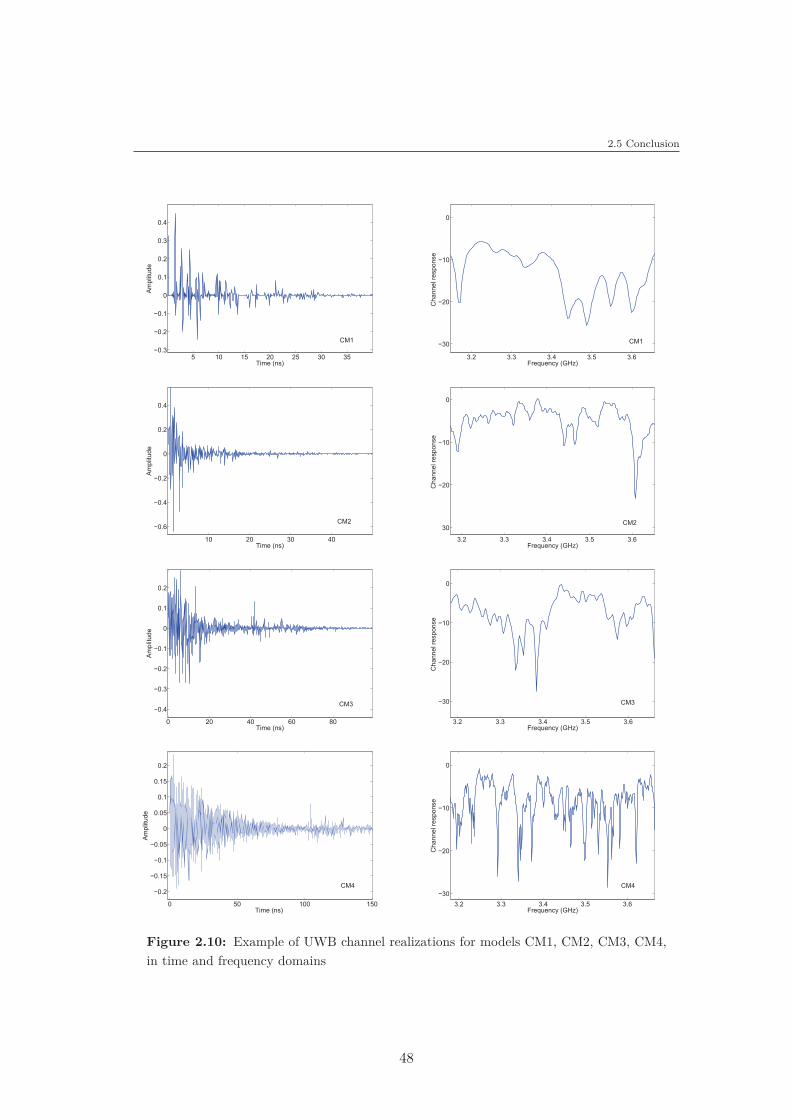
2.5 Conclusion
5 10 15 20 25 30 35�0.3
�0.2
�0.1
0
0.1
0.2
0.3
0.4
Time (ns)
Am
plit
ud
e
CM1
3.2 3.3 3.4 3.5 3.6
0
�10
�20
�30
Frequency (GHz)
Ch
an
ne
l re
sp
on
se
CM1
10 20 30 40
�0.6
�0.4
�0.2
0
0.2
0.4
Time (ns)
Am
plit
ud
e
CM2
3.2 3.3 3.4 3.5 3.6
30
�20
�10
0
Frequency (GHz)
Ch
an
ne
l re
sp
on
se
CM2
0 20 40 60 80
�0.4
�0.3
�0.2
�0.1
0
0.1
0.2
Time (ns)
Am
plit
ud
e
CM3
3.2 3.3 3.4 3.5 3.6
�30
�20
�10
0
Frequency (GHz)
Ch
an
ne
l re
sp
on
se
CM3
0 50 100 150
�0.2
�0.15
�0.1
�0.05
0
0.05
0.1
0.15
0.2
Time (ns)
Am
plit
ud
e
CM4
3.2 3.3 3.4 3.5 3.6
�30
�20
�10
0
Frequency (GHz)
Ch
an
ne
l re
sp
on
se
CM4
Figure 2.10: Example of UWB channel realizations for models CM1, CM2, CM3, CM4,
in time and frequency domains
48
2. SYSTEM SPECIFICATIONS
In addition, we have presented a general overview on UWB technology which makes
the reader familiar with the UWB environment. In brief, UWB has emerged as an ex-
citing technology for wireless communications since 2002 when the FCC allocated a 7.5
GHz spectrum for unlicensed use of UWB devices. As described, UWB holds enormous
potential for wireless applications, which can used to minimize energy. Besides, we have
seen that there are two main modulation schemes considered for UWB communications:
the impulse UWB and MB-OFDM techniques.
Finally, an overview of energy consumption in WiMAX and PLC systems has been
provided. Simulation results from rate maximization algorithms were also presented.
The resource allocation strategies considered in this chapter did not take into account
the energy consumption. The next chapter will present the energy minimization prob-
lem for single and multi-carrier systems. Different modifications will be proposed in
the following chapter to improve the energy efficiency of WiMAX and PLC systems.
49

Chapter 3
UWT approach: Application to
resource allocation of OFDM
systems
3.1 Introduction
After having presented the system specifications in the previous chapter, here we discuss
the energy minimization strategies under quantity of information constraint for single
and multi-carrier systems. Our analysis is independent to the technologies constraint.
Our goal is to define the asymptotic limit for communication systems. This chapter
deals with the fundamental energy optimization of a general class with single and
parallel channels. We show that it is possible to significantly reduce the transmitted
energy by focusing only on the physical layer point-to-point. Here, it is not the power
transmitted with bit-rate constraint which is minimized, but the corresponding energy
consumption to transmit a quantity of information. The bandwidth was relaxed in the
case of UWB. We propose to relax the time constraint and define energy efficiency as
a characteristic of the link.
In the previous chapter, the OFDM system and the general principle of resource
allocation for multi-carrier modulations have been described. In this chapter, we discuss
the strategy of energy minimization for OFDM systems. We propose here different
allocation strategies for OFDM based on a new approach to minimize energy. The goal
is to optimize the energy consumption of OFDM systems. A general overview of energy
51
3.2 Energy versus quantity of information
consumption is first studied and the different optimization strategies, namely, energy
minimization are described. The objective is to propose a new algorithms for resource
allocation to reduce the energy consumption that corresponds to the constraint of the
quantity of information transmitted in WiMAX and PLC networks.
In the first phase, we survey key results from information theory. Therefore, we re-
alize an asymptotic study for energy consumption in single and multi-carrier systems.
The results of study permit to define the limit of energy consumption for data trans-
mission and lead to propose a new approach of communication systems. This approach
provides a basis for the development of resource allocation optimization. Especially
those based on the energy efficiency metric criterion is the first original contribution of
this dissertation.
In the second phase, we focus on resource allocation for parallel channels. The
solutions developed aim at proposing distribution of bits and energy in communication
systems. Three cases of resource allocation are studied in order to obtain better en-
ergy efficiency for multi-carrier systems in comparison to existing solutions. The new
solutions are the second original contribution of this dissertation.
The proposed resource allocation approach can be used for all parallel channel mod-
els. The results are shown only for OFDM schemes on both systems PLC and WiMAX.
Besides, the performances of the proposed allocation algorithms are discussed and the
simulation results obtained with the OFDM scheme of the proposed system are com-
pared to the results obtained with the OFDM scheme presented in the previous chapter.
The different optimization results presented in this chapter show that a significant im-
provement for energy consumption will be obtained with the proposed solutions.
3.2 Energy versus quantity of information
Before defining the energy efficiency and describing new algorithms for resource alloca-
tion, it is necessary to perform an asymptotic study to define the energy consumption
required to transmit an amount of quantity of information. Thus we calculate the
energy limit or the minimum energy for transmitting a given amount of information.
The first study is realized for single carrier communication, followed thereafter by the
asymptotic calculation in the case of multi-carrier systems.
52
3. UWT APPROACH: APPLICATION TO RESOURCE ALLOCATION OF OFDM SYSTEMS
3.2.1 Fundamental of information theory
From Shannon limit [71], the capacity in bits per two dimensions (bit/s/Hz) of additive
white Gaussian noise channel is
C = log2
(
1 +P
BN0
)
(3.1)
This formula gives the capacity of transmission, where P (W) is the transmitted power,
B (Hz) is the channel bandwidth and N0 (W/Hz) is the noise spectral density. The
transmission of Q bits in a bandwidth B requires a communication duration time T
(second) such that
Q = C × B × T (3.2)
The relation between the power P and energy J is
P =J
T(3.3)
From Shannon capacity, (3.2) and (3.3), the quantity of information Q can be written
as
Q = TB log2
(
1 +J
TBN0
)
(3.4)
where J (Joule) is the total energy required to send Q bits and
J =(
2Q
T B − 1)
TBN0 (3.5)
3.2.2 Lower bound of energy
To save energy, transceivers can be designed to maximize information per unit energy.
In [56], the required minimum energy is reached when the number of degrees of freedom
is unlimited. The number of degrees of freedom is represented by one frequency-time
element from the formula (3.5) [111]. With infinite time of transmission or infinite
bandwidth, for a given Q, the number of degrees of freedom tends to infinity and the
required energy can then be minimized. The asymptotic limit for the energy required
to transmit one bit is calculated in [56] for wide band communication. With delay
tolerant applications and networks, the constraint on the time of transmission can
be relaxed [112, 113]. The trade-off between time and energy consumption in (3.5)
53
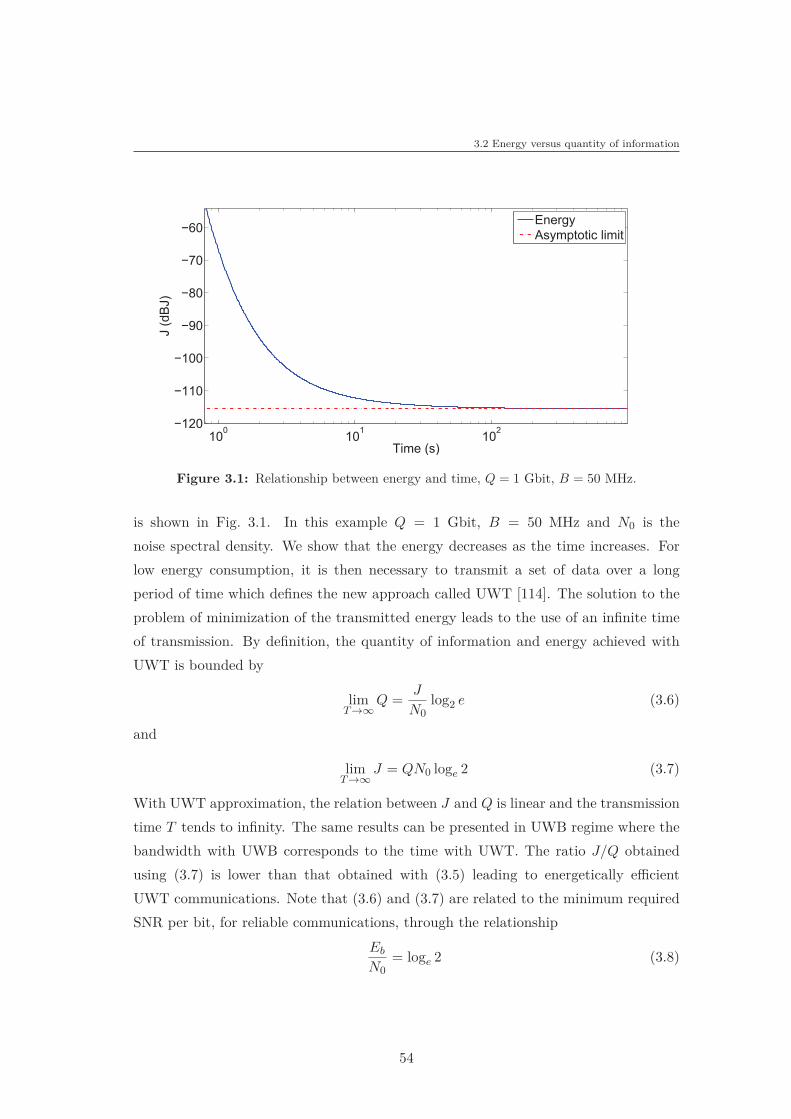
3.2 Energy versus quantity of information
100
101
102
�120
�110
�100
�90
�80
�70
�60
Time (s)
J (
dB
J)
Energy
Asymptotic limit
Figure 3.1: Relationship between energy and time, Q = 1 Gbit, B = 50 MHz.
is shown in Fig. 3.1. In this example Q = 1 Gbit, B = 50 MHz and N0 is the
noise spectral density. We show that the energy decreases as the time increases. For
low energy consumption, it is then necessary to transmit a set of data over a long
period of time which defines the new approach called UWT [114]. The solution to the
problem of minimization of the transmitted energy leads to the use of an infinite time
of transmission. By definition, the quantity of information and energy achieved with
UWT is bounded by
limT →∞
Q =J
N0log2 e (3.6)
and
limT →∞
J = QN0 loge 2 (3.7)
With UWT approximation, the relation between J and Q is linear and the transmission
time T tends to infinity. The same results can be presented in UWB regime where the
bandwidth with UWB corresponds to the time with UWT. The ratio J/Q obtained
using (3.7) is lower than that obtained with (3.5) leading to energetically efficient
UWT communications. Note that (3.6) and (3.7) are related to the minimum required
SNR per bit, for reliable communications, through the relationship
Eb
N0= loge 2 (3.8)
54
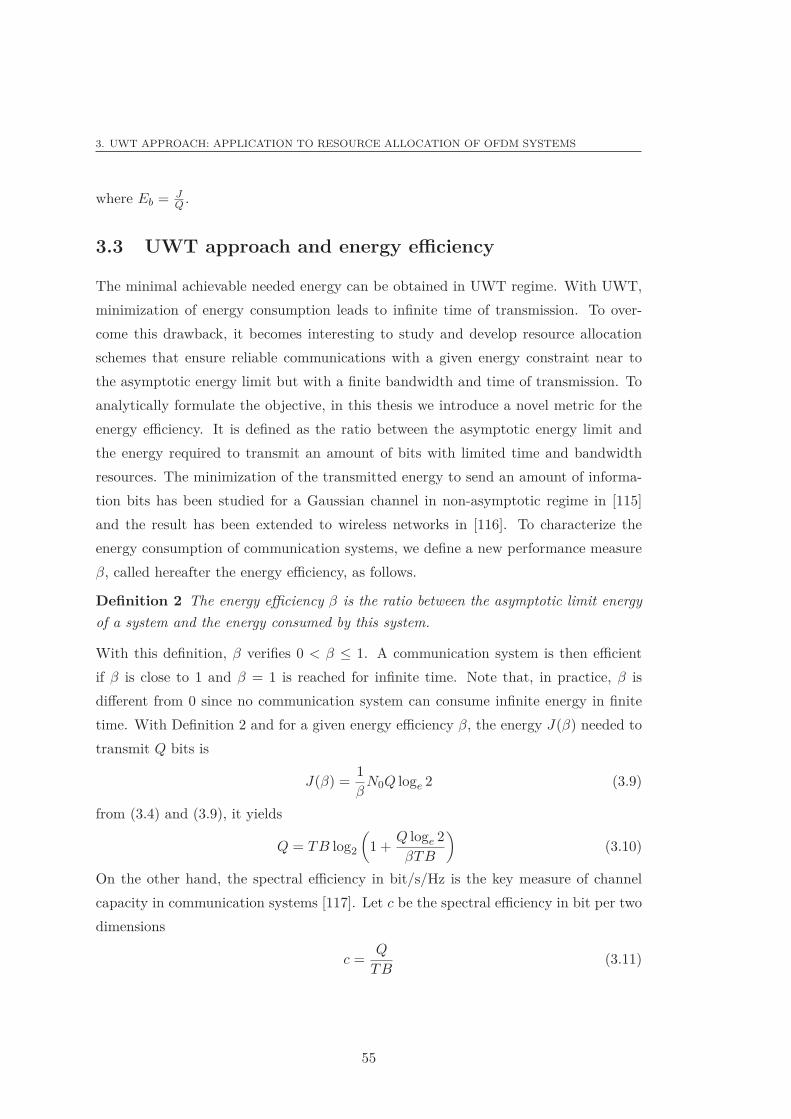
3. UWT APPROACH: APPLICATION TO RESOURCE ALLOCATION OF OFDM SYSTEMS
where Eb = JQ .
3.3 UWT approach and energy efficiency
The minimal achievable needed energy can be obtained in UWT regime. With UWT,
minimization of energy consumption leads to infinite time of transmission. To over-
come this drawback, it becomes interesting to study and develop resource allocation
schemes that ensure reliable communications with a given energy constraint near to
the asymptotic energy limit but with a finite bandwidth and time of transmission. To
analytically formulate the objective, in this thesis we introduce a novel metric for the
energy efficiency. It is defined as the ratio between the asymptotic energy limit and
the energy required to transmit an amount of bits with limited time and bandwidth
resources. The minimization of the transmitted energy to send an amount of informa-
tion bits has been studied for a Gaussian channel in non-asymptotic regime in [115]
and the result has been extended to wireless networks in [116]. To characterize the
energy consumption of communication systems, we define a new performance measure
β, called hereafter the energy efficiency, as follows.
Definition 2 The energy efficiency β is the ratio between the asymptotic limit energy
of a system and the energy consumed by this system.
With this definition, β verifies 0 < β ≤ 1. A communication system is then efficient
if β is close to 1 and β = 1 is reached for infinite time. Note that, in practice, β is
different from 0 since no communication system can consume infinite energy in finite
time. With Definition 2 and for a given energy efficiency β, the energy J(β) needed to
transmit Q bits is
J(β) =1
βN0Q loge 2 (3.9)
from (3.4) and (3.9), it yields
Q = TB log2
(
1 +Q loge 2
βTB
)
(3.10)
On the other hand, the spectral efficiency in bit/s/Hz is the key measure of channel
capacity in communication systems [117]. Let c be the spectral efficiency in bit per two
dimensions
c =Q
TB(3.11)
55
3.3 UWT approach and energy efficiency
0 0.5 1 1.5 2�3.5
�3
�2.5
�2
�1.5
�1
�0.5
0
Spectral efficiency (bit/s/Hz)
En
erg
y e
ffic
ien
cy (
dB
J)
Figure 3.2: Relationship between spectral efficiency and energy efficiency.
Using (3.10) and (3.11), the spectral efficiency and the energy efficiency are related as
follows
2c − 1
c=
loge 2
β(3.12)
The relationship between energy efficiency and spectral efficiency is a bijective function
shown in Fig. 3.2. The optimization of a communication system under energy efficiency
constraint is then similar to the optimization of the system under spectral efficiency
constraint. For example, the energy efficiency required to transmit a quantity of infor-
mation with spectral efficiency c = 1 bit/s/Hz is β = −1.6 dB. This energy efficiency
is independent of time. On the other hand, for a given capacity, the energy needed to
transmit a quantity of information is related to the amount of information.
56
3. UWT APPROACH: APPLICATION TO RESOURCE ALLOCATION OF OFDM SYSTEMS
3.4 Resource allocation of parallel and quasi-static chan-
nels
In any communication system, the allocated frequencies and the transmit energy are
the keys of any resource allocation. The systems are assigned limited frequency band,
which explains why the frequency allocation is a critical issue that should be considered
carefully in order to respect the regulations. Furthermore, the allocated energy is a
constraint imposed by the regulation such as medical and industry regulations. Here,
we focus on resource allocation of parallel and quasi static channels. Several techniques
based on parallel transmission as OFDM and MIMO systems are considered.
3.4.1 Lower bound of energy
The capacity of N parallel and independent channels is the sum capacity of these
channels given by
C =N
∑
i=1
log2
(
1 +Ji
BiTiN0|hi|2
)
(3.13)
where |hi|2 is the gain of sub-channel i, and Ji is the energy allocated to this sub-
channel. The transmission time of the channel i is Ti and Bi is the corresponding
bandwidth of the channel. Using the notation of the previous section, the formula of
quantity of information of multi-carrier systems is
Q =N
∑
i=1
TiBi log2
(
1 +Ji
BiTiN0|hi|2
)
(3.14)
To transmit the quantity of information Q, the total energy used is
J =n
∑
i=1
(2Qi
TiBi − 1)TiBiN0
|hi|2(3.15)
where Qi is the quantity of information allocated to sub-channel i andN
∑
i=1
Qi = Q.
With UWT approach, the asymptotic limit is given by an infinite time of transmission
or infinite bandwidth. The energy minimization leads to infinite time as described in
the previous section. The energy achieved with UWT is then
limT →∞
J = N0 log 2n
∑
i=1
Qi
|hi|2(3.16)
57
3.4 Resource allocation of parallel and quasi-static channels
The resource allocation problem with UWT returns to define the quantity of informa-
tion allocated to each channel. The lower bound energy consumption is then
J∞ = minn
∑
i=1
Qi=Q
limT →∞
J (3.17)
A simple solution in UWT context is to transmit all the data on the best channel. The
best channel is the channel that provides the best SNR. The lower bound of transmitted
energy consumption with parallel channels is then
J∞ =QN0 log 2
maxi
|hi|2(3.18)
and is reached with an infinite time of transmission.
Proof
Let j = arg maxi
|hi|2, the total energy is the sum of the energies, for an infinite timeof transmission,
∑
i
Ji =N
∑
i=1
Qi log 2
|hi|2(3.19)
∑
i
Ji =Q log 2
|hj |2 +∑
iÓ=j
(1
|hi|2− 1
|hj |2 )Qi log 2 ≥ Q log 2
|hj |2 (3.20)
Then, the total energy is minimal for Qi = 0, ∀i Ó= j. This limit defines a bounded set
of energy like channel capacity which is an upper bound rate. We note that the limit
energy of N channels is not the sum of the minimum energy of each channel, whereas
the capacity of N independent channels is the sum of the capacities of each channel.
3.4.2 Water-filling solution
In this section to simplify the approach, we choose B and T independent of i which
is the case with OFDM systems, where the transmission time T is the same for all
sub-channels and B is the bandwidth of each sub-channel. To transmit the quantity of
information Q, the total energy used is
J =n
∑
i=1
(2QiT B − 1)
TBN0
|hi|2(3.21)
58
3. UWT APPROACH: APPLICATION TO RESOURCE ALLOCATION OF OFDM SYSTEMS
The problem turns out to minimize the total energy J under constraints T , B andn
∑
i=1
Qi = Q. One approach to solve this minimization problem is based on a water-
filling optimization. The water-filling scheme greatly simplifies the transmitter and
receiver design, and it has been the subject of a considerable number of studies. In this
dissertation, the optimization problem can be equivalently expressed as
minn
∑
i=1
(2QiT B − 1)
TBN0
|hi|2(3.22)
subject to
n∑
i=1Qi = Q
Qi ≥ 0.
The solution is obtained using the Lagrangian relaxation and Karush-Kuhn-Tucker
(KKT) conditions [118]. The Lagrangian of the optimization problem is
L({Qj}nj=1, λ, {µi}k
i=1) =n
∑
i=1
(2QiT B − 1)
TBN0
|hi|2
+λ
(
Q −n
∑
i=1
Qi
)
−n
∑
i=1
µiQi (3.23)
and the KKT conditions associated with the constrained minimization problem, given
in (3.22) are [118]
−Qi ≤ 0 , ∀i ∈ [1, n] (3.24)
Q −n
∑
i=1
Qi = 0 (3.25)
µi ≥ 0 , ∀i ∈ [1, n] (3.26)
µiQi = 0 , ∀i ∈ [1, n] (3.27)
∂
∂QiJ ({Qi}n
i=1) − λ − µi = 0 , ∀i ∈ [1, n] (3.28)
The optimal solution that solves (3.24)–(3.28) is then
if µi = 0 ⇒ λ = ∂∂Qi
J(
{Qi}ni=1
)
if µi Ó= 0 ⇒ Q∗j (λ) = 0
(3.29)
(3.29) and (3.22) can be solved using the set I such that
i ∈ I iff µi = 0 (3.30)
59
3.4 Resource allocation of parallel and quasi-static channels
The Lagrangian multiplier λ is identified using the equality constraint and the optimal
quantity of information allocated to sub-channel i ∈ I is then
Q∗i = TB
(
QT B −
∑
j∈I
log2
|hj |2N0 log 2
|I| + log2
|hi|2N0 log 2
)
(3.31)
where |I| is the size of I, and the quantity of information allocated to sub-channel i /∈ I
is
Q∗i = 0 (3.32)
The solution {Q∗i }n
i=1 minimizes the total energy, given in (3.21), used to transmit Q
bits over n sub-channels and verifies
n∑
i=1
Q∗i = Q (3.33)
This solution solves (3.22) with a given communication time T , bandwidth B and
number N of parallel independent channels.
3.4.3 Energy efficiency optimization
3.4.3.1 Minimization of maximum time of communication
As indicated previously the energy efficiency β is used to characterize the transmitted
energy of communication systems. The goal is hereafter then to find the bit and the
associated energy distributions among parallel channels for a given energy efficiency.
The resource allocation objective is then to find the combination of {Qi, Ti}ni=1 that
satisfies the energy constraint J∞
β . In that case and from (3.9), the energy used is
J∞
β=
1
β
QN0 loge 2
maxi
|hi|2(3.34)
The optimization problem can be written as follows
min maxi
Ti subject to
n∑
i=1
Qi = Q
n∑
i=1
Ji =J∞
β
Qi ≥ 0, Ji ≥ 0
(3.35)
60
3. UWT APPROACH: APPLICATION TO RESOURCE ALLOCATION OF OFDM SYSTEMS
In this section, the problem is solved in the case of uniform spectral efficiency: all the
channels are exploited with the same spectral efficiency and with the same channel
bandwidth, ∀i ∈ [1; n], Bi = B. The spectral efficiency c is
c =Qi
BTi(3.36)
As the infinite norm is not differentiable, the p-norm is used. The optimization problem
becomes
min limp→∞
( k∑
i=1
T pi
)
1p
= limp→∞
min
( k∑
i=1
T pi
)
1p
= limp→∞
minn
∑
i=1
T pi (3.37)
Note that with (3.4) and (3.5), if Qi ≥ 0 then Ji ≥ 0 and the converse is true. One
constraint can then be removed. The Lagrangian of problem (3.35) is
L =n
∑
i=1
T pi + λ
(
J∞
β−
n∑
i=1
Ji
)
+ µ
(
Q −n
∑
i=1
Qi
)
−n
∑
i=1
νiJi (3.38)
There is no simple form for this Lagrangian. We then first solve the Lagrangian with
only energetic constraint and secondly we introduce the data constraint to solve the
problem. The Lagrangian of the sub-problem is
L({Jj}nj=1, λ, {νi}k
i=1) =n
∑
i=1
(
Ji|hi|2
BN0(2c − 1)
)p
+
λ
Q
B
N0 log 2
maxi
|hi|2−
n∑
i=1
Ji
−n
∑
i=1
νiJi (3.39)
and the KKT conditions are
−Ji ≤ 0, ∀i ∈ [1, n] (3.40)
J −n
∑
i=1
Ji = 0 (3.41)
νi ≥ 0, ∀i ∈ [1, n] (3.42)
νiJi = 0, ∀i ∈ [1, n] (3.43)
∂
∂JiL ({Ji}n
i=1) − λ − νi = 0, ∀i ∈ [1, n] (3.44)
61
3.4 Resource allocation of parallel and quasi-static channels
The optimal solution that solves (3.40)–(3.44) is then
{
if νi = 0 ⇒ Jp−1i (λ) =
(
λBN0(2c−1)p|hi|2
)p
if νi Ó= 0 ⇒ Ji(λ) = 0(3.45)
Let I such that ∀i ∈ I, µi = 0. Using (3.45) and the energetic constraint, it yields for
all j in I
Jj =
J∞
β
∑
i∈I
(
|hj |2|hi|2
)p
p−1
(3.46)
and
J∗j = lim
p→∞Jj =
J∞
β
|hj |−2
∑
i∈I
|hi|−2(3.47)
With (3.15), the minimum time is
T ∗j =
1β
Q log 2
maxi
|hi|2
B(2c − 1)∑
i∈I
|hi|−2(3.48)
We observe that T ∗j is independent of j, ∀j ∈ I, T ∗
j = T ∗. Therefore, this solution
leads to uniform distribution among a subset of channels. It is important to note that
this solution differs from the water-filling solution obtained with transmission time
constraint. The last unknown parameter for allocation is the spectral efficiency c.
Thus, the problem to minimize the time T returns to solve
c
(2c − 1)=
β
|I| log 2
∑
i∈I
maxi
|hj |2
|hi|2(3.49)
where the unknown parameter is c. Let
w =β
|I| log 2
∑
i∈I
maxi
|hj |2
|hi|2(3.50)
Then, we can write (3.49) as follows
w2c − c − w = 0 (3.51)
62
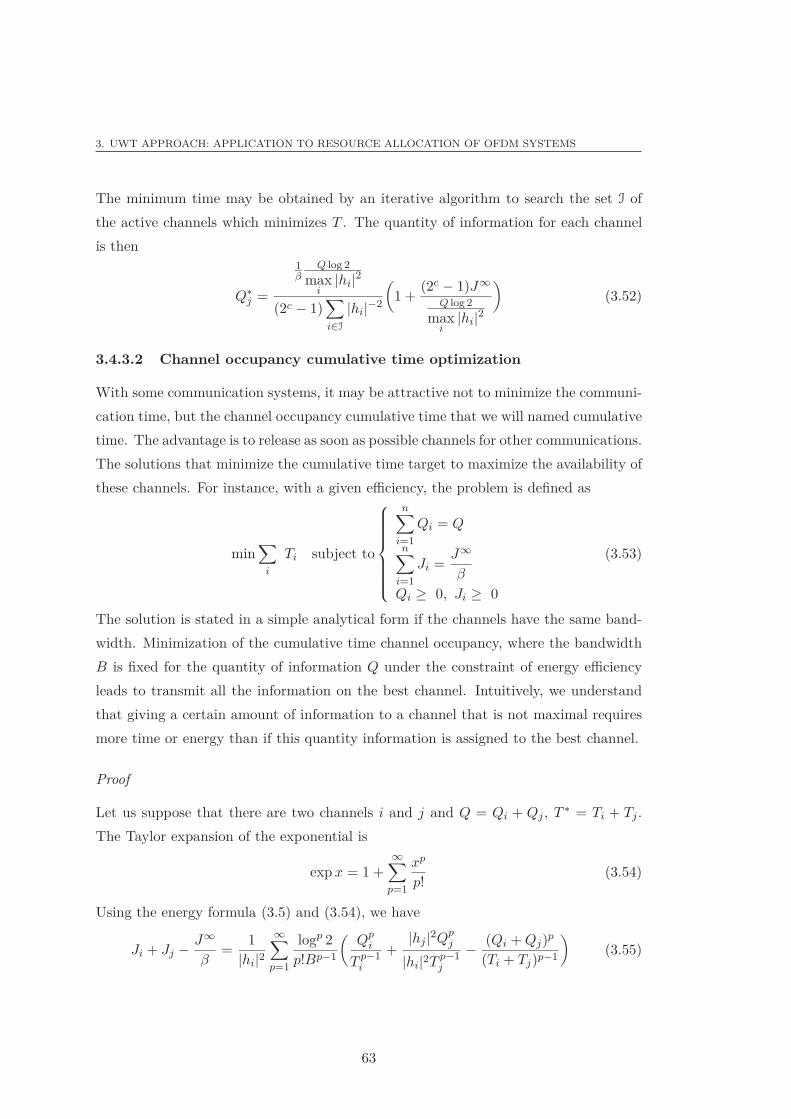
3. UWT APPROACH: APPLICATION TO RESOURCE ALLOCATION OF OFDM SYSTEMS
The minimum time may be obtained by an iterative algorithm to search the set I of
the active channels which minimizes T . The quantity of information for each channel
is then
Q∗j =
1β
Q log 2
maxi
|hi|2
(2c − 1)∑
i∈I
|hi|−2
(
1 +(2c − 1)J∞
Q log 2
maxi
|hi|2
)
(3.52)
3.4.3.2 Channel occupancy cumulative time optimization
With some communication systems, it may be attractive not to minimize the communi-
cation time, but the channel occupancy cumulative time that we will named cumulative
time. The advantage is to release as soon as possible channels for other communications.
The solutions that minimize the cumulative time target to maximize the availability of
these channels. For instance, with a given efficiency, the problem is defined as
min∑
i
Ti subject to
n∑
i=1
Qi = Q
n∑
i=1
Ji =J∞
β
Qi ≥ 0, Ji ≥ 0
(3.53)
The solution is stated in a simple analytical form if the channels have the same band-
width. Minimization of the cumulative time channel occupancy, where the bandwidth
B is fixed for the quantity of information Q under the constraint of energy efficiency
leads to transmit all the information on the best channel. Intuitively, we understand
that giving a certain amount of information to a channel that is not maximal requires
more time or energy than if this quantity information is assigned to the best channel.
Proof
Let us suppose that there are two channels i and j and Q = Qi + Qj , T ∗ = Ti + Tj .
The Taylor expansion of the exponential is
exp x = 1 +∞
∑
p=1
xp
p!(3.54)
Using the energy formula (3.5) and (3.54), we have
Ji + Jj − J∞
β=
1
|hi|2∞
∑
p=1
logp 2
p!Bp−1
(
Qpi
T p−1i
+|hj |2Qp
j
|hi|2T p−1j
− (Qi + Qj)p
(Ti + Tj)p−1
)
(3.55)
63
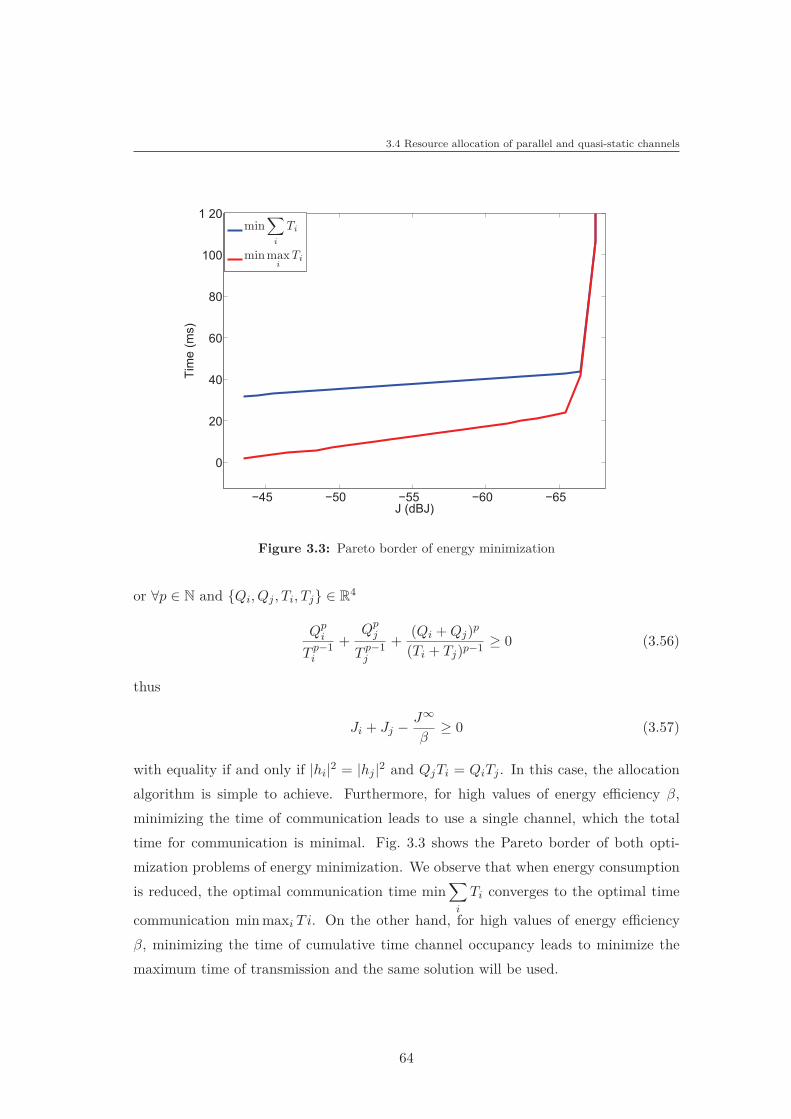
3.4 Resource allocation of parallel and quasi-static channels
�65�60�55�50�45
0
20
40
60
80
100
1 20
J (dBJ)
Tim
e (
ms)
min∑
i
Ti
minmaxi
Ti
Figure 3.3: Pareto border of energy minimization
or ∀p ∈ N and {Qi, Qj , Ti, Tj} ∈ R4
Qpi
T p−1i
+Qp
j
T p−1j
+(Qi + Qj)p
(Ti + Tj)p−1≥ 0 (3.56)
thus
Ji + Jj − J∞
β≥ 0 (3.57)
with equality if and only if |hi|2 = |hj |2 and QjTi = QiTj . In this case, the allocation
algorithm is simple to achieve. Furthermore, for high values of energy efficiency β,
minimizing the time of communication leads to use a single channel, which the total
time for communication is minimal. Fig. 3.3 shows the Pareto border of both opti-
mization problems of energy minimization. We observe that when energy consumption
is reduced, the optimal communication time min∑
i
Ti converges to the optimal time
communication min maxi Ti. On the other hand, for high values of energy efficiency
β, minimizing the time of cumulative time channel occupancy leads to minimize the
maximum time of transmission and the same solution will be used.
64
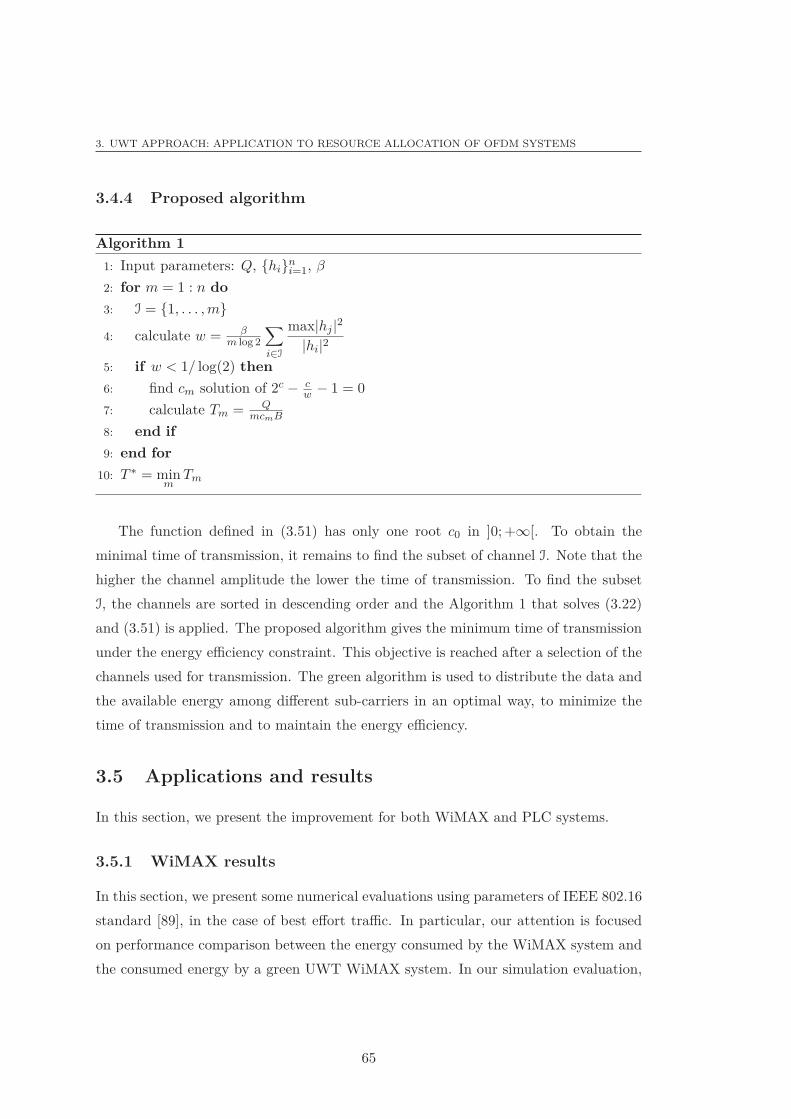
3. UWT APPROACH: APPLICATION TO RESOURCE ALLOCATION OF OFDM SYSTEMS
3.4.4 Proposed algorithm
Algorithm 1
1: Input parameters: Q, {hi}ni=1, β
2: for m = 1 : n do
3: I = {1, . . . , m}4: calculate w = β
m log 2
∑
i∈I
max|hj |2|hi|2
5: if w < 1/ log(2) then
6: find cm solution of 2c − cw − 1 = 0
7: calculate Tm = QmcmB
8: end if
9: end for
10: T ∗ = minm
Tm
The function defined in (3.51) has only one root c0 in ]0; +∞[. To obtain the
minimal time of transmission, it remains to find the subset of channel I. Note that the
higher the channel amplitude the lower the time of transmission. To find the subset
I, the channels are sorted in descending order and the Algorithm 1 that solves (3.22)
and (3.51) is applied. The proposed algorithm gives the minimum time of transmission
under the energy efficiency constraint. This objective is reached after a selection of the
channels used for transmission. The green algorithm is used to distribute the data and
the available energy among different sub-carriers in an optimal way, to minimize the
time of transmission and to maintain the energy efficiency.
3.5 Applications and results
In this section, we present the improvement for both WiMAX and PLC systems.
3.5.1 WiMAX results
In this section, we present some numerical evaluations using parameters of IEEE 802.16
standard [89], in the case of best effort traffic. In particular, our attention is focused
on performance comparison between the energy consumed by the WiMAX system and
the consumed energy by a green UWT WiMAX system. In our simulation evaluation,
65
3.5 Applications and results
the energy consumption is given for one user in one cell. The channel model is the
pedestrian channel with the parameters suggested in previous chapter. The channel
and system parameters are summarized in Tab. 2.3. The quantity of information to
be transmitted is Q = 1 Mbit. This limited value allows transmission over quasi-static
channel since the maximal transmission time is lower than the coherence time of the
pedestrian channel. In that case, it is assumed that the channel transfer function is
known at both transmitter and receiver sides. With the UWT WiMAX system, the
optimization is carried out performed under energy efficiency constraint and β is fixed
to −1 dB. The information allocation is performed using (3.52) and conditions given in
(3.22), and the communication time is given by (3.48). The resulting communication
system can differ from the system defined by the WiMAX specifications but it is used to
point out the capability of UWT approach. Practically, the modulation orders and the
bit rates with UWT approach differ from those defined in [89]. UWT could be a good
approach for new communication systems that allow low and very low spectral efficiency.
Furthermore, the increase of transmission time needs to define new end-to-end delays.
The total consumed energy of a conventional WIMAX system and of a green UWT
WiMAX system is plotted in Fig. 3.4 for different transmission distances R between
the base station and the user. The corresponding transmission time is shown in Fig. 3.5
for various link distances. The capabilities offered by the UWT capproach are compared
to the performance obtained with the conventional WiMAX system presented in the
previous chapter. The transmitted energy depends on the distance between the base
station and the user, and the total energy increases with R. The results in Fig. 3.4 show
that the energy used with the conventional WiMAX system is always higher than that
with the green UWT WIMAX system. A gain of around 20 dB can be reached. The
gain is higher for small distance than for high distance. Significant gains are obtained
in favorable channel conditions. Since β = −1 dB, the consumed energy with the
UWT approach is only 1 dB higher than the lower bound of the consumed energy. The
energy efficiency of the conventional WiMAX system is given by the algebraic distance
of the two curves minus 1 dB. This energy efficiency is then always lower than −7 dB.
Let us now compare the transmission time for both solutions, i.e. UWT WiMAX and
conventional WiMAX. With UWT, it is clear that to save consumed energy required
to send Q bits, it is necessary to transmit information over a long period of time. As
shown in Fig. 3.5, for short distance the communication time with UWT is larger than
66
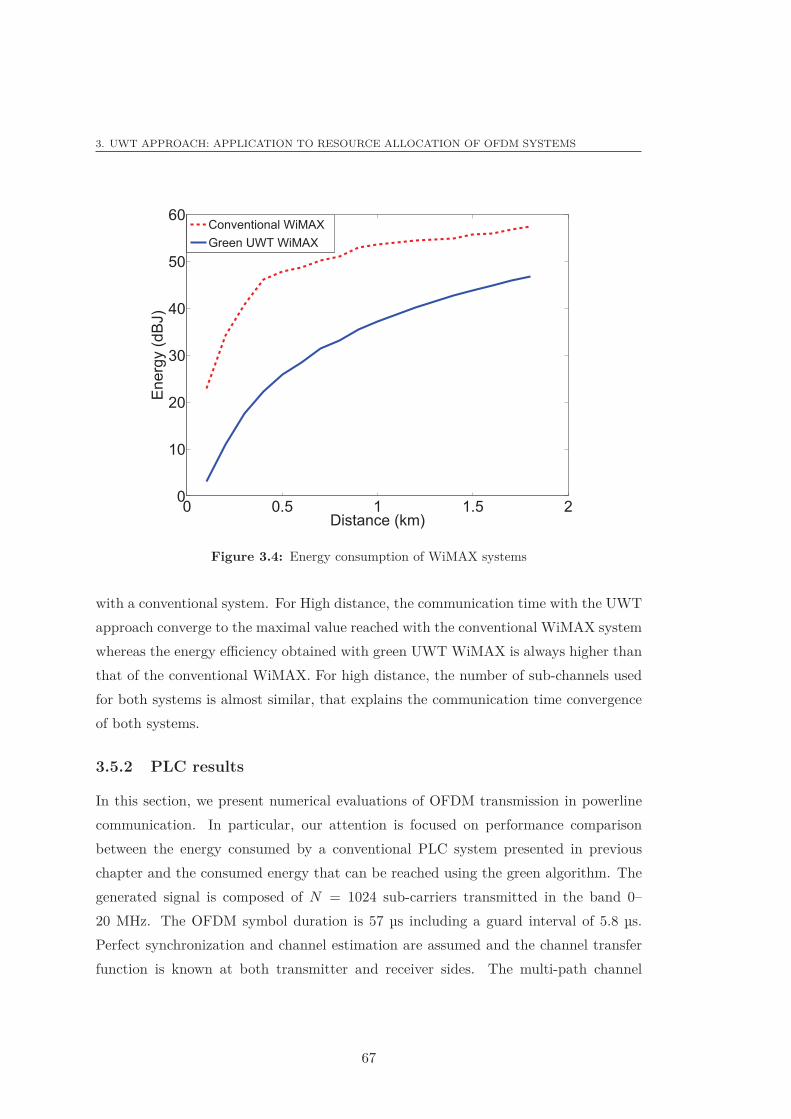
3. UWT APPROACH: APPLICATION TO RESOURCE ALLOCATION OF OFDM SYSTEMS
0 0.5 1 1.5 20
10
20
30
40
50
60
Distance (km)
Energ
y (
dB
J)
Conventional WiMAX
Green UWT WiMAX
Figure 3.4: Energy consumption of WiMAX systems
with a conventional system. For High distance, the communication time with the UWT
approach converge to the maximal value reached with the conventional WiMAX system
whereas the energy efficiency obtained with green UWT WiMAX is always higher than
that of the conventional WiMAX. For high distance, the number of sub-channels used
for both systems is almost similar, that explains the communication time convergence
of both systems.
3.5.2 PLC results
In this section, we present numerical evaluations of OFDM transmission in powerline
communication. In particular, our attention is focused on performance comparison
between the energy consumed by a conventional PLC system presented in previous
chapter and the consumed energy that can be reached using the green algorithm. The
generated signal is composed of N = 1024 sub-carriers transmitted in the band 0–
20 MHz. The OFDM symbol duration is 57 µs including a guard interval of 5.8 µs.
Perfect synchronization and channel estimation are assumed and the channel transfer
function is known at both transmitter and receiver sides. The multi-path channel
67
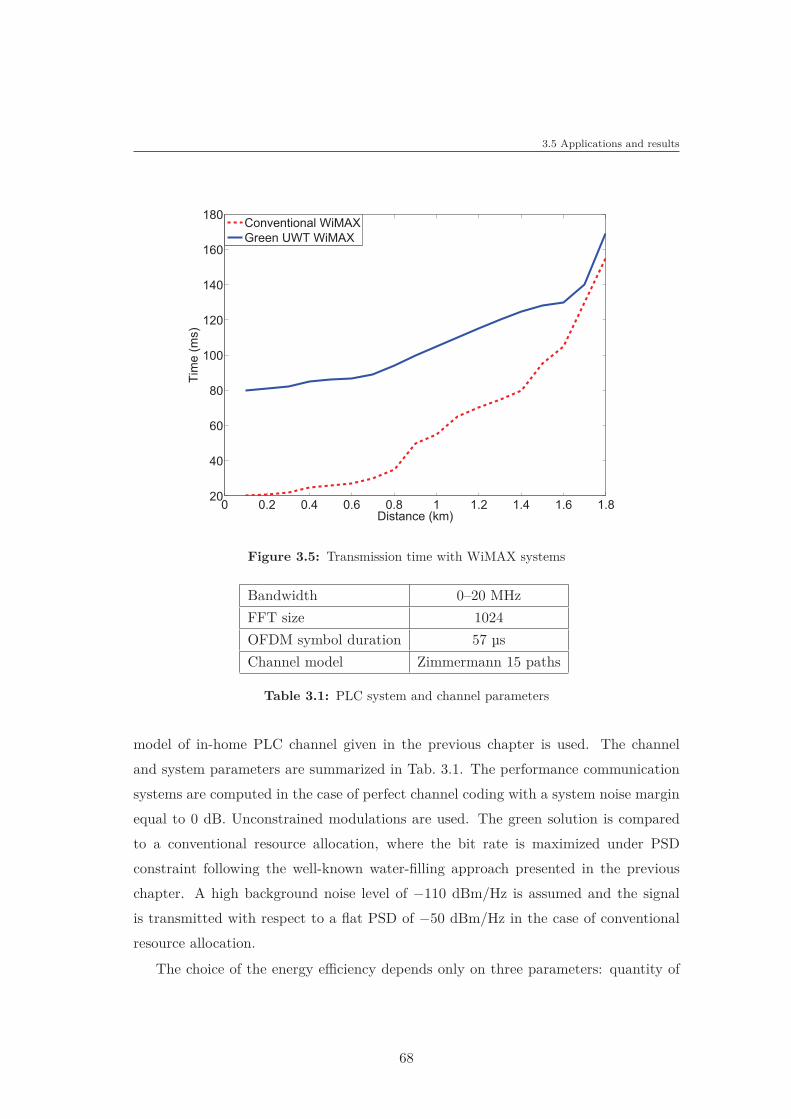
3.5 Applications and results
0 0.2 0.4 0.6 0.8 1 1.2 1.4 1.6 1.820
40
60
80
100
120
140
160
180
Distance (km)
Tim
e (
ms)
Conventional WiMAX
Green UWT WiMAX
Figure 3.5: Transmission time with WiMAX systems
Bandwidth 0–20 MHz
FFT size 1024
OFDM symbol duration 57 µs
Channel model Zimmermann 15 paths
Table 3.1: PLC system and channel parameters
model of in-home PLC channel given in the previous chapter is used. The channel
and system parameters are summarized in Tab. 3.1. The performance communication
systems are computed in the case of perfect channel coding with a system noise margin
equal to 0 dB. Unconstrained modulations are used. The green solution is compared
to a conventional resource allocation, where the bit rate is maximized under PSD
constraint following the well-known water-filling approach presented in the previous
chapter. A high background noise level of −110 dBm/Hz is assumed and the signal
is transmitted with respect to a flat PSD of −50 dBm/Hz in the case of conventional
resource allocation.
The choice of the energy efficiency depends only on three parameters: quantity of
68
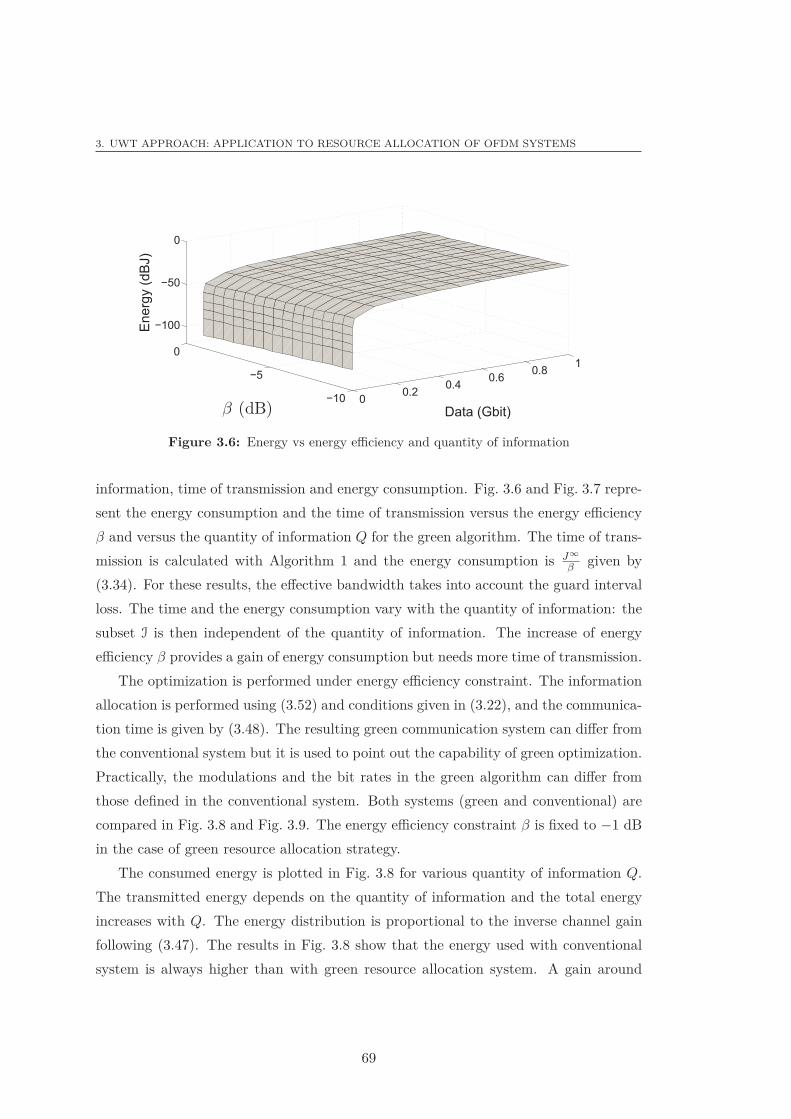
3. UWT APPROACH: APPLICATION TO RESOURCE ALLOCATION OF OFDM SYSTEMS
00.2
0.40.6
0.81
�10
�5
0
�100
�50
0
Data (Gbit)β (dB)
Energ
y (
dB
J)
Figure 3.6: Energy vs energy efficiency and quantity of information
information, time of transmission and energy consumption. Fig. 3.6 and Fig. 3.7 repre-
sent the energy consumption and the time of transmission versus the energy efficiency
β and versus the quantity of information Q for the green algorithm. The time of trans-
mission is calculated with Algorithm 1 and the energy consumption is J∞
β given by
(3.34). For these results, the effective bandwidth takes into account the guard interval
loss. The time and the energy consumption vary with the quantity of information: the
subset I is then independent of the quantity of information. The increase of energy
efficiency β provides a gain of energy consumption but needs more time of transmission.
The optimization is performed under energy efficiency constraint. The information
allocation is performed using (3.52) and conditions given in (3.22), and the communica-
tion time is given by (3.48). The resulting green communication system can differ from
the conventional system but it is used to point out the capability of green optimization.
Practically, the modulations and the bit rates in the green algorithm can differ from
those defined in the conventional system. Both systems (green and conventional) are
compared in Fig. 3.8 and Fig. 3.9. The energy efficiency constraint β is fixed to −1 dB
in the case of green resource allocation strategy.
The consumed energy is plotted in Fig. 3.8 for various quantity of information Q.
The transmitted energy depends on the quantity of information and the total energy
increases with Q. The energy distribution is proportional to the inverse channel gain
following (3.47). The results in Fig. 3.8 show that the energy used with conventional
system is always higher than with green resource allocation system. A gain around
69
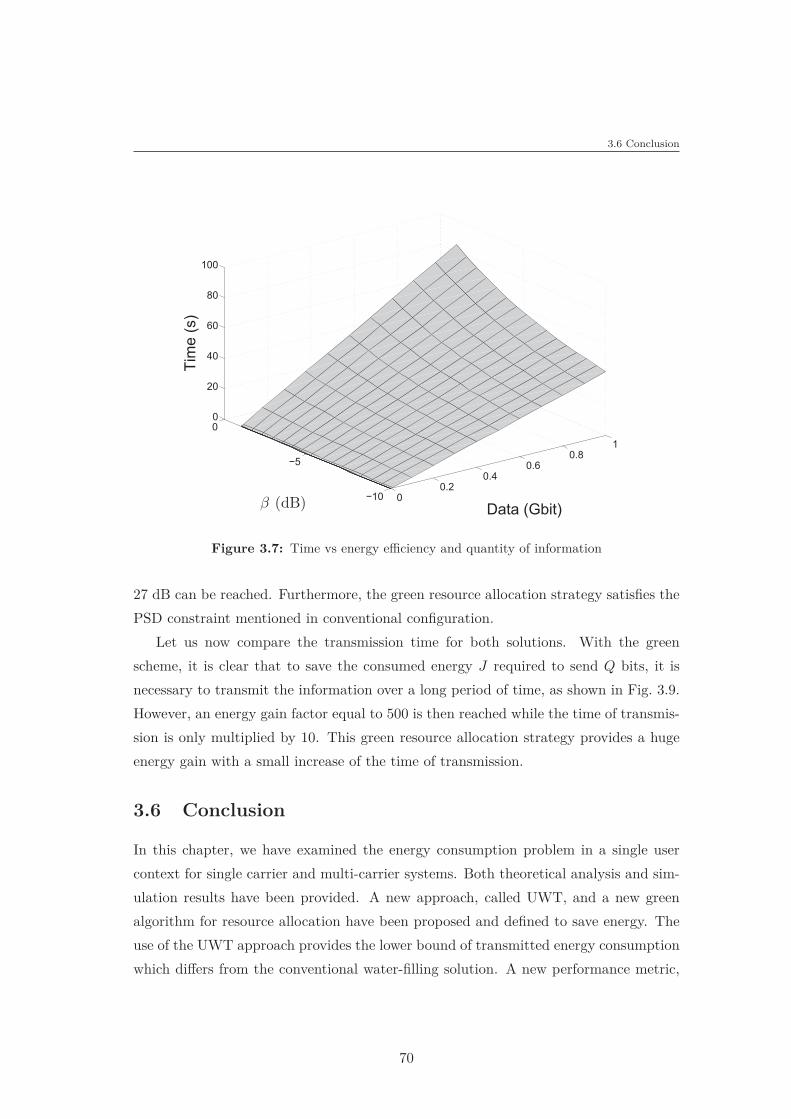
3.6 Conclusion
00.2
0.40.6
0.81
�10
�5
00
20
40
60
80
100
Data (Gbit)β (dB)
Tim
e (
s)
Figure 3.7: Time vs energy efficiency and quantity of information
27 dB can be reached. Furthermore, the green resource allocation strategy satisfies the
PSD constraint mentioned in conventional configuration.
Let us now compare the transmission time for both solutions. With the green
scheme, it is clear that to save the consumed energy J required to send Q bits, it is
necessary to transmit the information over a long period of time, as shown in Fig. 3.9.
However, an energy gain factor equal to 500 is then reached while the time of transmis-
sion is only multiplied by 10. This green resource allocation strategy provides a huge
energy gain with a small increase of the time of transmission.
3.6 Conclusion
In this chapter, we have examined the energy consumption problem in a single user
context for single carrier and multi-carrier systems. Both theoretical analysis and sim-
ulation results have been provided. A new approach, called UWT, and a new green
algorithm for resource allocation have been proposed and defined to save energy. The
use of the UWT approach provides the lower bound of transmitted energy consumption
which differs from the conventional water-filling solution. A new performance metric,
70
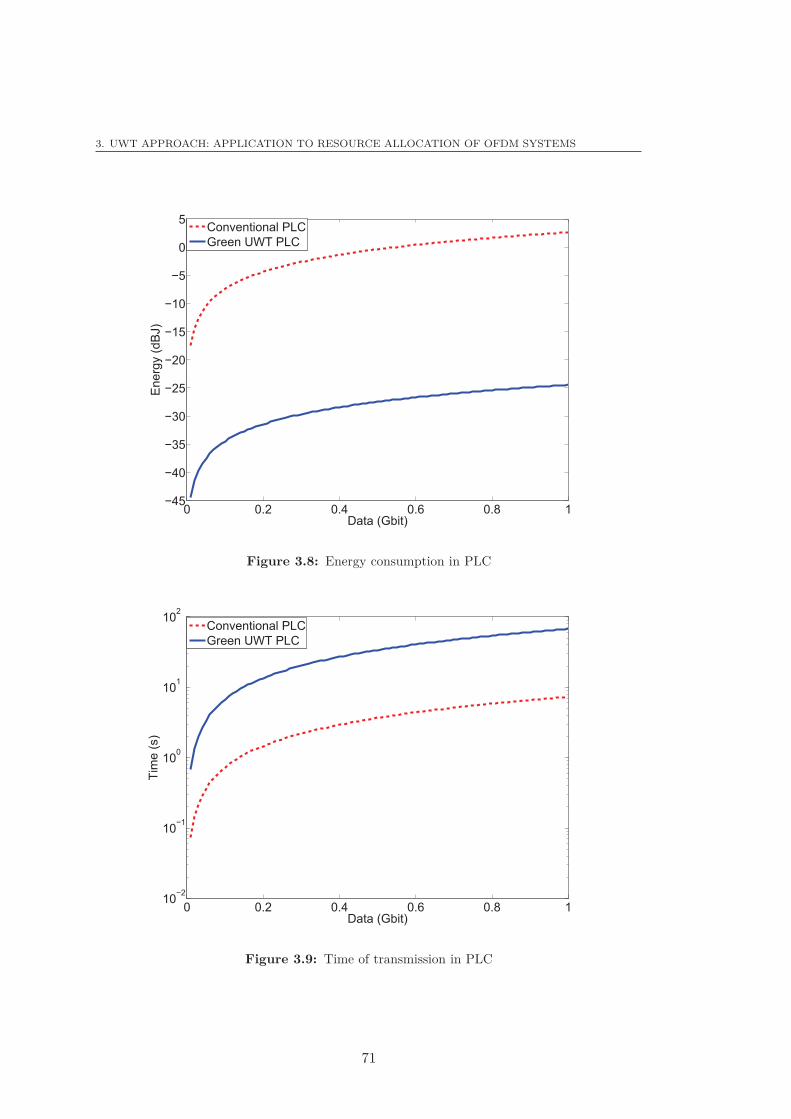
3. UWT APPROACH: APPLICATION TO RESOURCE ALLOCATION OF OFDM SYSTEMS
0 0.2 0.4 0.6 0.8 1�45
�40
�35
�30
�25
�20
�15
�10
�5
0
5
Data (Gbit)
En
erg
y (
dB
J)
Conventional PLC
Green UWT PLC
Figure 3.8: Energy consumption in PLC
0 0.2 0.4 0.6 0.8 110
�2
10�1
100
101
102
Data (Gbit)
Tim
e (
s)
Conventional PLC
Green UWT PLC
Figure 3.9: Time of transmission in PLC
71
3.6 Conclusion
called the energy efficiency, evaluates the ratio between the transmitted energy con-
sumed by the communication system and the lower bound of this energy consumption
has been defined. Simulation results show that UWT is attractive in best effort applica-
tions and gains of around 20 dB can be reached for WiMAX communications. In PLC
systems, simulation results show that our scheme is attractive for data transmission
applications and energetic gains around 27 dB can be reached in PLC communications
with only a multiplication of the time of transmission by a factor of 10. This green
resource allocation strategy provides a huge energy gain with a weak increase of the
transmission time. To be applied, the UWT solution needs new protocols that sup-
port new end-to-end delays, and needs communication systems that allow low spectral
efficiency. In the next chapter, we will focus on energy performance of UWB commu-
nications.
72
Chapter 4
UWB parameters optimization
4.1 Introduction
The main focus of green radio is to provide new techniques to save energy consumption.
According to this trend, ultra wide time approach has been introduced in the previous
chapter to save energy. The work in this chapter is focused on UWB communications.
The main objective is to define the parameters of UWB systems that minimize the en-
ergy consumption in communication systems. The major question for the first part of
this chapter is: what are the optimal parameters of the system to minimize energy. The
first proposition is to use the shape of impulse UWB systems and then to determine
the best parameters for the energy minimization. In this chapter, we focus on Gaussian
pulses proposed for UWB communication systems. Different parameters (pulse width,
guard time, pulse repetition) are exploited to optimize the performance of communica-
tion systems. In addition, we investigate a practical range of pulse repetition interval
values and number of pulses per bit in terms of energy efficiency.
Added to the energy efficiency, in the second part, we focus on system capacity
maximization. The energy efficiency is fixed by the metric, and the system capacity
is maximized. The main approach for UWB system design is to choose the symbol
duration larger than the delay of the channel impulse response, in order to avoid inter
symbol interference (ISI). However, this approach does not maximize the system capac-
ity. An adaptation of the guard time is a flexible mean of exploiting system resources
efficiently especially in multi-path environment. The optimal guard time solution is ob-
tained by complex numerical method. To reduce this complexity, a new optimization
73
4.2 Resource allocation and energy optimization in UWB
method is introduced. This optimization method defines new parameters that provide
very close performance to the performance of the optimal system. These parameters
link the guard time to the channel characteristics with simple equations. In practical
systems, the guard time adaptation is based directly on these parameter values. Simu-
lation results are performed for UWB communications over WiMedia channel and show
that the significant gain is achievable with the proposed guard time adaptation.
In the last part of this chapter, we focus on multi-band allocation. The energy
minimization problem is presented and a new algorithm is introduced for multi-band
allocation.
4.2 Resource allocation and energy optimization in UWB
4.2.1 Problem formulation
To save energy, transceivers can be designed to maximize information per unit energy.
The energy consumed to transmit one bit is
Eb = (21
TbB − 1)TbBN0
|h|2 (4.1)
where B (Hz) is the channel bandwidth, Tb (second) is the bit duration, N0 (W/Hz)
is the noise spectral density and |h|2 is the gain of the equivalent channel with noise
margin. The equivalent channel is composed of the user waveform filter, the channel
response and the front-end filter. The formula (4.1) is derived from the formula of
the Shannon capacity [71]. In [56], the required minimum energy is reached when the
number of degrees of freedom is unlimited. The number of degrees of freedom can be
represented by one frequency-time element. With infinite time or infinite bandwidth
of transmission, the number of degrees of freedom tends to infinity and the required
energy can then be minimized. The asymptotic limits for energy is
E∞b = lim
TbB→+∞Eb =
N0 log 2
|h|2 (4.2)
For example, the trade-off between bit duration, bandwidth and energy of transmission
(4.1) is shown in Fig. 4.1. The energy decreases as the bit duration Tb and the band-
width B increases. Using the communication model introduced in Chapter 2, (4.1)
becomes
Eb = (21
L(Tp+Tg) cxTp − 1)
L(Tp + Tg) cxTp
N0
|h|2 (4.3)
74
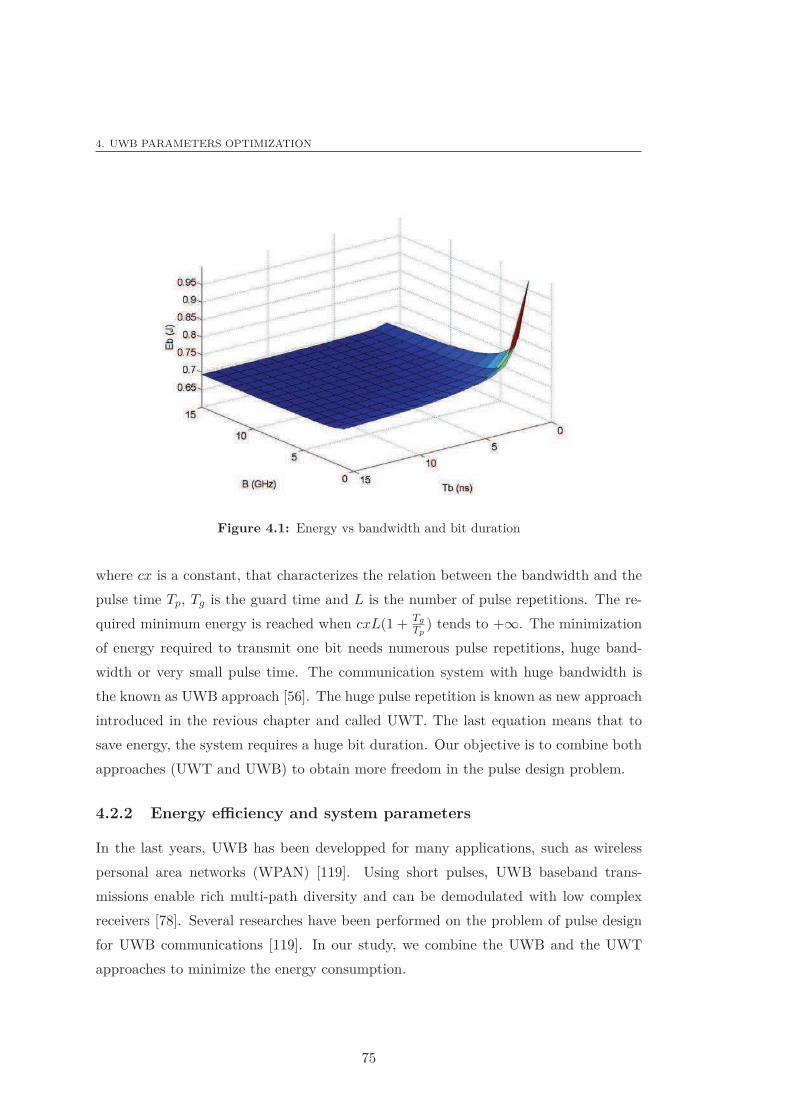
4. UWB PARAMETERS OPTIMIZATION
Figure 4.1: Energy vs bandwidth and bit duration
where cx is a constant, that characterizes the relation between the bandwidth and the
pulse time Tp, Tg is the guard time and L is the number of pulse repetitions. The re-
quired minimum energy is reached when cxL(1 +Tg
Tp) tends to +∞. The minimization
of energy required to transmit one bit needs numerous pulse repetitions, huge band-
width or very small pulse time. The communication system with huge bandwidth is
the known as UWB approach [56]. The huge pulse repetition is known as new approach
introduced in the revious chapter and called UWT. The last equation means that to
save energy, the system requires a huge bit duration. Our objective is to combine both
approaches (UWT and UWB) to obtain more freedom in the pulse design problem.
4.2.2 Energy efficiency and system parameters
In the last years, UWB has been developped for many applications, such as wireless
personal area networks (WPAN) [119]. Using short pulses, UWB baseband trans-
missions enable rich multi-path diversity and can be demodulated with low complex
receivers [78]. Several researches have been performed on the problem of pulse design
for UWB communications [119]. In our study, we combine the UWB and the UWT
approaches to minimize the energy consumption.
75
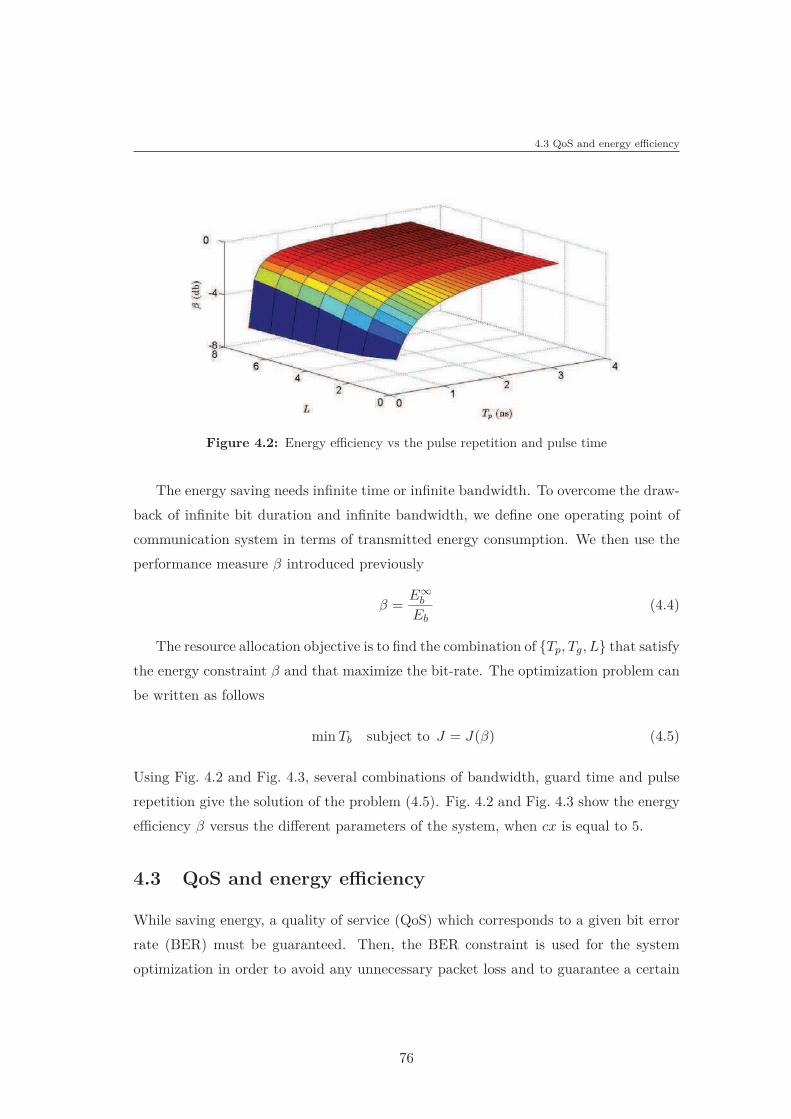
4.3 QoS and energy efficiency
Figure 4.2: Energy efficiency vs the pulse repetition and pulse time
The energy saving needs infinite time or infinite bandwidth. To overcome the draw-
back of infinite bit duration and infinite bandwidth, we define one operating point of
communication system in terms of transmitted energy consumption. We then use the
performance measure β introduced previously
β =E∞
b
Eb(4.4)
The resource allocation objective is to find the combination of {Tp, Tg, L} that satisfythe energy constraint β and that maximize the bit-rate. The optimization problem can
be written as follows
min Tb subject to J = J(β) (4.5)
Using Fig. 4.2 and Fig. 4.3, several combinations of bandwidth, guard time and pulse
repetition give the solution of the problem (4.5). Fig. 4.2 and Fig. 4.3 show the energy
efficiency β versus the different parameters of the system, when cx is equal to 5.
4.3 QoS and energy efficiency
While saving energy, a quality of service (QoS) which corresponds to a given bit error
rate (BER) must be guaranteed. Then, the BER constraint is used for the system
optimization in order to avoid any unnecessary packet loss and to guarantee a certain
76
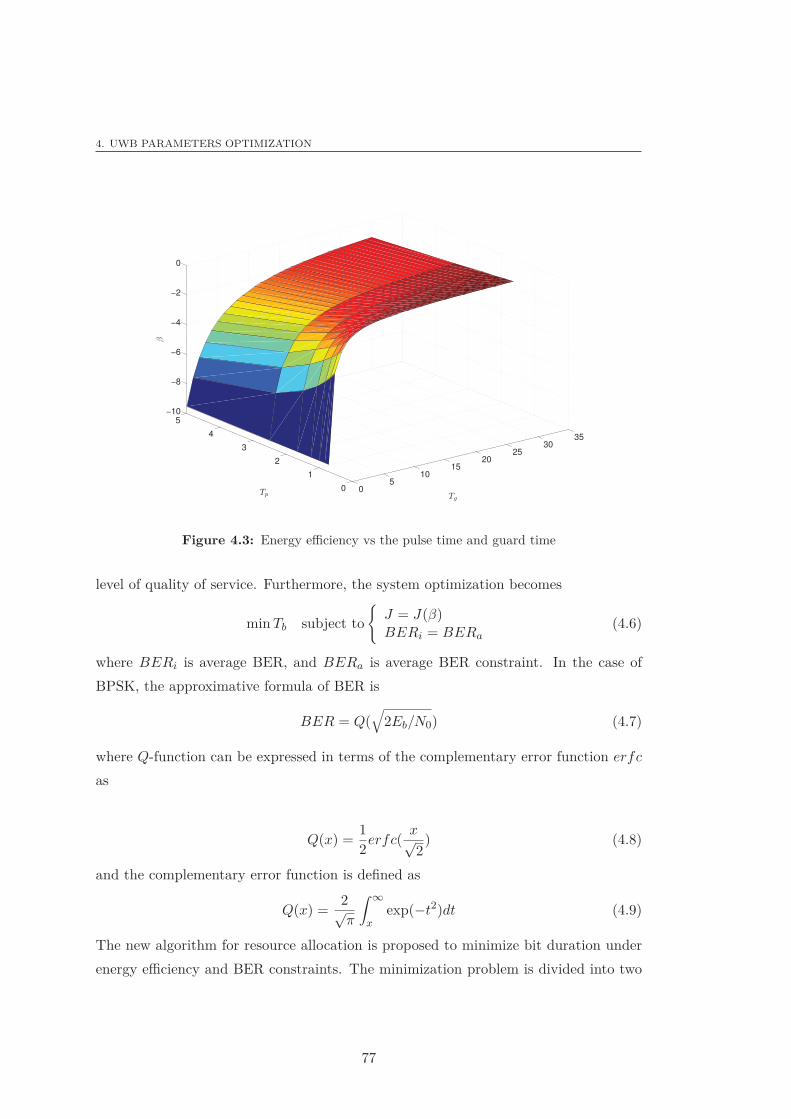
4. UWB PARAMETERS OPTIMIZATION
05
1015
2025
3035
0
1
2
3
4
5
−10
−8
−6
−4
−2
0
TgTp
β
Figure 4.3: Energy efficiency vs the pulse time and guard time
level of quality of service. Furthermore, the system optimization becomes
min Tb subject to
{
J = J(β)BERi = BERa
(4.6)
where BERi is average BER, and BERa is average BER constraint. In the case of
BPSK, the approximative formula of BER is
BER = Q(√
2Eb/N0) (4.7)
where Q-function can be expressed in terms of the complementary error function erfc
as
Q(x) =1
2erfc(
x√2
) (4.8)
and the complementary error function is defined as
Q(x) =2√π
∫ ∞
xexp(−t2)dt (4.9)
The new algorithm for resource allocation is proposed to minimize bit duration under
energy efficiency and BER constraints. The minimization problem is divided into two
77

4.4 Capacity optimization
sub problems. We minimize the pulse time under energy constraint and the guard time
or pulse repetition to respect the BER constraint.
(4.6) ⇒{
minTp subject to Eb = Eb(β)
minTg subject to BERi = BERor
{
minTp subject to Eb = Eb(β)
minL subject to BERi = BER
The detailed calculation of our solution is given in Appendix A. The proposed
solution gives the system parameters as follows. The pulse time is
Tp =−r log 2
B(rW (−2−1r log 2r ) − log 2)
(4.10)
where r = Eb(β)|h|2
N0and W is the Lambert function. The guard time is
Tg =−u log 2
B(uW (−2−1u log 2u ) − log 2)
− Tp (4.11)
where
u = |h|2(Q−1(BER))2 (4.12)
The number of pulse repetitions is
L =−n log 2
TpB(nW (−2−1n log 2n ) − log 2)
(4.13)
where
n = |h|2(Q−1(BER))2 (4.14)
The new optimization provides the optimum values of the system under BER and
energy efficiency constraints. The BER constraint is plotted in Fig. 4.4 and Fig. 4.5
versus the system parameters {Tp, Tg,L}.
4.4 Capacity optimization
Gaussian monocycle was initially proposed and has been widely used for UWB applica-
tions [78, 119]. The symbol duration of UWB system is generally larger than the max-
imum delay spread such that the inter-symbol interference can be neglected [120, 121].
To maximize the capacity, the system does not necessarily need a huge guard time.
78
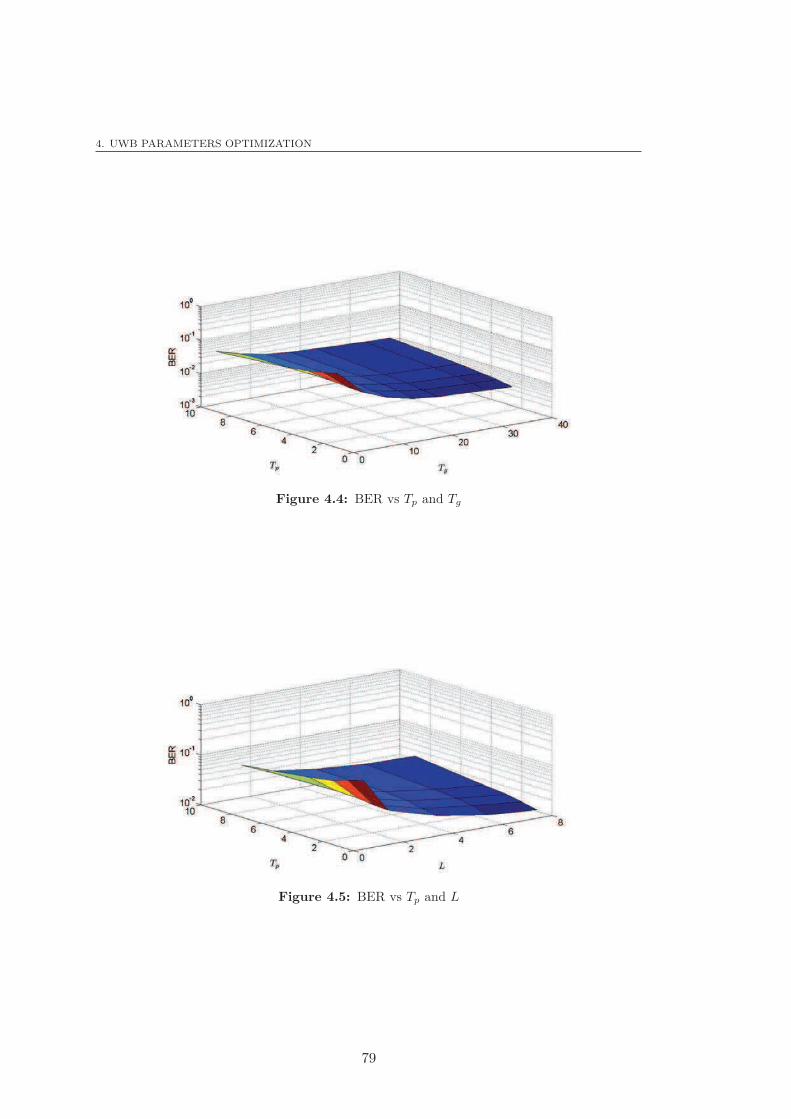
4. UWB PARAMETERS OPTIMIZATION
Figure 4.4: BER vs Tp and Tg
Figure 4.5: BER vs Tp and L
79
4.4 Capacity optimization
That is, the system can tolerate an amount of interference in order to reduce the guard
time, and the system capacity can be improved. An adaptation of guard time is a
flexible mean to exploit system resources efficiently especially in multi-path environ-
ment. The case of a guard interval shorter than the channel impulse response has
been considered with OFDM systems [122, 123]. In this chapter we report an analysis
of the guard time optimization problem. The optimization problem is complex and
requires a large computation time. Development of a new optimization method to re-
duce the system complexity and to improve the capacity with guard time adaptation
is needed. One of the efficient methods is to define new parameters that provide very
close performances to the optimal configuration. These parameters link the guard time
to the channel characteristics with simple equations. To this end, three measures of
the channel are considered. These measures are the root mean square (RMS) delay
spread, the received energy and the energy of the interference. This choice is motivated
by the fact that these measures can easily be obtained in communication systems. The
optimization method provides the parameters value that will be used directly in the
practical systems. These parameters values facilitate the guard time calculation and
thus avoids the cost associated with guard time optimization. The guard time can be
flexibly adjusted by this method for any channel.
4.4.1 Capacity calculation
To evaluate the impact of the guard time on the system performance, we define the
optimum value of guard time that maximizes the system capacity. The capacity is
defined as the maximum of the mutual information
C = maxp(x)
I(X, Y ) (4.15)
In the case of BPSK, the mutual information is maximized for equi-probable signaling.
Let us now compute the mutual information as a function of the bit energy Eb, the
power spectral density of noise N0 and the interference. The mutual information is
I(X, Y ) = S(Y ) − S(Y/X) (4.16)
where the both entropies are defined as [124]
S(Y/X) =1
2log2 2πe (4.17)
80
4. UWB PARAMETERS OPTIMIZATION
and
S(Y ) = −E[log2 p(Y )] (4.18)
where the probability p(Y ) is defined as
p(Y ) =
(
1
2n+1
1√2π
2∑
s=1
2n∑
i=1
exp(−(y − bsA +
∑nj=1 ajαj,i)
2
2)
)
(4.19)
where n is the number of bits that interfere, aj is the interference amplitude of bit
j, αi,j is the matrix of possible cases of interference with dimensions {n, 2n}. The
detailed calculation for capacity expressions is given in Appendix B. Then, the capacity
measured in bit/s/Hz achieved in the case of BPSK is
C(Tg) = − 1
TbB
(
E
[
log2
(
1
2n+1
1√2π
2∑
s=1
2n∑
i=1
exp(
−(y − bsA +
∑nj=1 ajαj,i)
2
2)
)]
− 1
2log2(2πe)
)
(4.20)
where B is the channel bandwidth. The Monte Carlo integration is needed to compute
C(Tg). The optimal value of the guard time is given by
T ∗g = arg max
Tg
C(Tg) (4.21)
The evaluation of the argument in (4.21) is computationally hard because it requires a
Monte Carlo computation for each guard time value. Therefore, the attractive solution
is to define a new optimization method with low complexity.
4.4.2 Guard time optimization
4.4.2.1 Optimization Method
The optimization problem in (4.21) tends to be complex and often requires large
amounts of computation time. In this section, we describe in detail the optimiza-
tion method. The objective is to find a parameter value, which simplify the guard time
optimization. In practical systems, the guard time adaptation is based directly on this
parameter value.
The first step of optimization method consists in analysing the channel model and
calculates the optimal parameter for each realization of the impulse responses. The
81
4.4 Capacity optimization
second step of optimization is to define the parameter values of the channel. The last
step consists in comparing different measures used and defines the best parameter for
the UWB systems.
The present optimization consists of an initial step that determines the character-
istics of the channel. The optimal guard time depends on each channel realization. In
order to obtain global channel characteristics, several realizations will be considered for
each channel model. The initial step includes the steps of calculating capacity, defin-
ing the optimal guard time and calculating the optimal parameters linking the guard
time and the chosen measure. The measures are the RMS delay spread, the received
energy and the energy interference. The relation between the optimal parameter ρλ,
the optimal guard time and the measure L for each channel realization is defined as
ρλ = fL(T ∗g , λ) (4.22)
where λ is the value of the measure L, and fL(.) the function that links λ, T ∗g and ρλ.
The second step permits to define a sub-optimal guard time T ∗g that links the real-
ization λ of the measure L with a mean parameter ρ̄λ. The parameter ρ̄λ characterizes
each channel model. This step allows to avoid the cost associated to capacity calcula-
tion. Then, the guard time is obtained directly by the parameter ρ̄λ and the value of
the measure λ. The guard time is defined as
T̂ ∗g = f−1
L(ρ̄λ, λ) (4.23)
The last step is dedicated to the performance evaluation. Firstly, the capacity corre-
sponding to the chosen parameters is calculated. Secondly, the relative error capacity is
used to compare the performance of all parameters. The last step of optimization is to
select the best parameter value and measure among all possibilities. The optimization
method is summarized as follows:
• Define the characteristics of each channel
1. Capacity calculation using (4.20)
2. Optimal guard time calculation using (4.21)
3. Parameter value calculation using (4.22)
• Fix one parameter value for all channel realizations in each channel model
82
4. UWB PARAMETERS OPTIMIZATION
1. Guard time calculation using (4.23) for each channel
• Performance evaluation for each channel
1. Calculate the capacity corresponding to the parameter value
2. Calculate the relative error between the capacity of parameter value and the
optimal capacity of the system
4.4.3 Parameters adjustment for guard time optimization
In this section, the parameters linking the optimal guard time and the measures are
presented.
4.4.3.1 Delay spread metric
The delay spread is a key measure of the channel. Delay spread is an effective indicator
that makes it easy to evaluate multi-path propagation. The interference causes in
a digital system is mainly related to this measure. Practically, delay spread value is
directly related to the propagation environment. Obviously, delay spread is not constant
in wireless mobile communication channel and its values can change depending on the
terrain, the distance and the antenna directivity. The first parameter proposed is based
on the evaluation of RMS delay spread [123]. The RMS delay spread is defined as
σ =
√
∫ ∞0 (τ − µ)|h(τ)|2dτ
∫ ∞0 Ac(τ)dτ
(4.24)
and the average delay spread is
µ =
∫ ∞0 τAc(τ)dτ∫ ∞
0 Ac(τ)dτ(4.25)
where |h(τ)|2 is the power delay profile with τ the multi-path delay. The significant
fraction of the received energy is captured within ρ1σ with ρ1 > 0 [125]. Conversely,
when Tb ≫ σ the system experiences negligible inter-symbol interference. The measure
L is the RMS delay and λ in (4.22) is σ. The parameter linking the guard time and
the RMS delay spread is given as
ρ1 =T ∗
g
σ − Tp(4.26)
where T ∗g is defined by (4.21) and fL by (4.22) is a rational function.
83
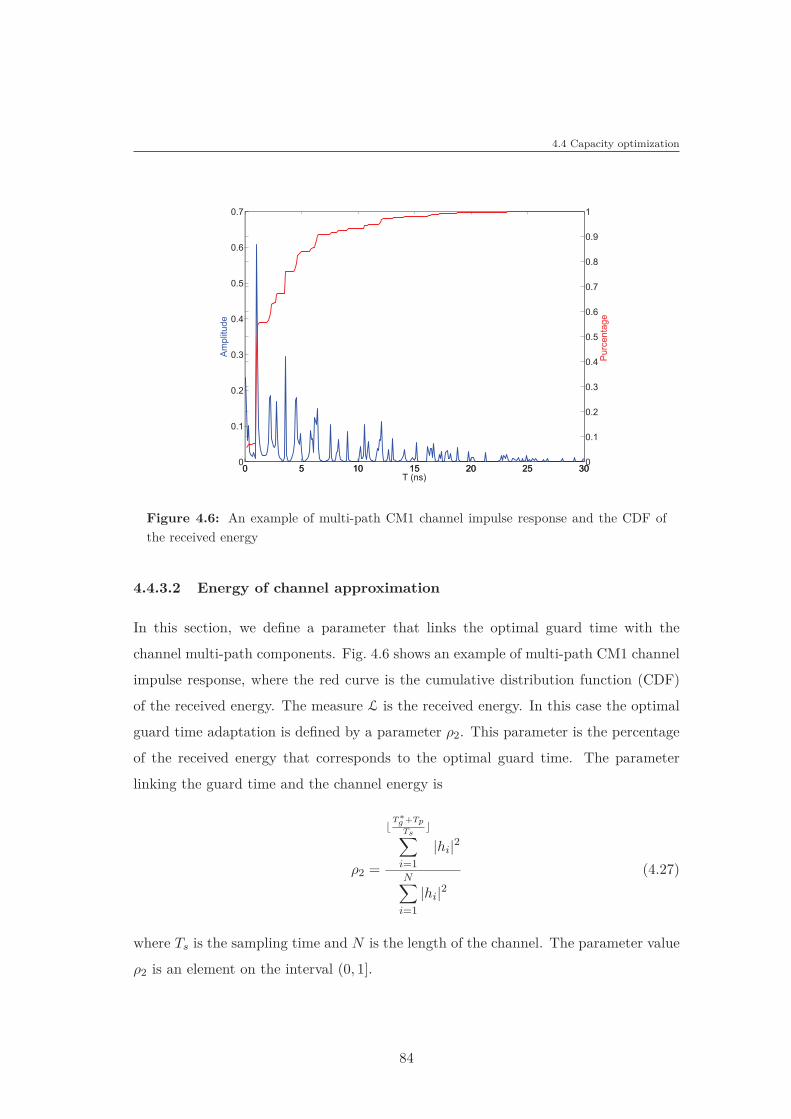
4.4 Capacity optimization
0 5 10 15 20 25 300
0.1
0.2
0.3
0.4
0.5
0.6
0.7
T (ns)
Am
plit
ud
e
0 5 10 15 20 25 300
0.1
0.2
0.3
0.4
0.5
0.6
0.7
0.8
0.9
1
Pu
rce
nta
ge
Figure 4.6: An example of multi-path CM1 channel impulse response and the CDF of
the received energy
4.4.3.2 Energy of channel approximation
In this section, we define a parameter that links the optimal guard time with the
channel multi-path components. Fig. 4.6 shows an example of multi-path CM1 channel
impulse response, where the red curve is the cumulative distribution function (CDF)
of the received energy. The measure L is the received energy. In this case the optimal
guard time adaptation is defined by a parameter ρ2. This parameter is the percentage
of the received energy that corresponds to the optimal guard time. The parameter
linking the guard time and the channel energy is
ρ2 =
⌊T ∗
g +Tp
Ts⌋
∑
i=1
|hi|2
N∑
i=1
|hi|2(4.27)
where Ts is the sampling time and N is the length of the channel. The parameter value
ρ2 is an element on the interval (0, 1].
84
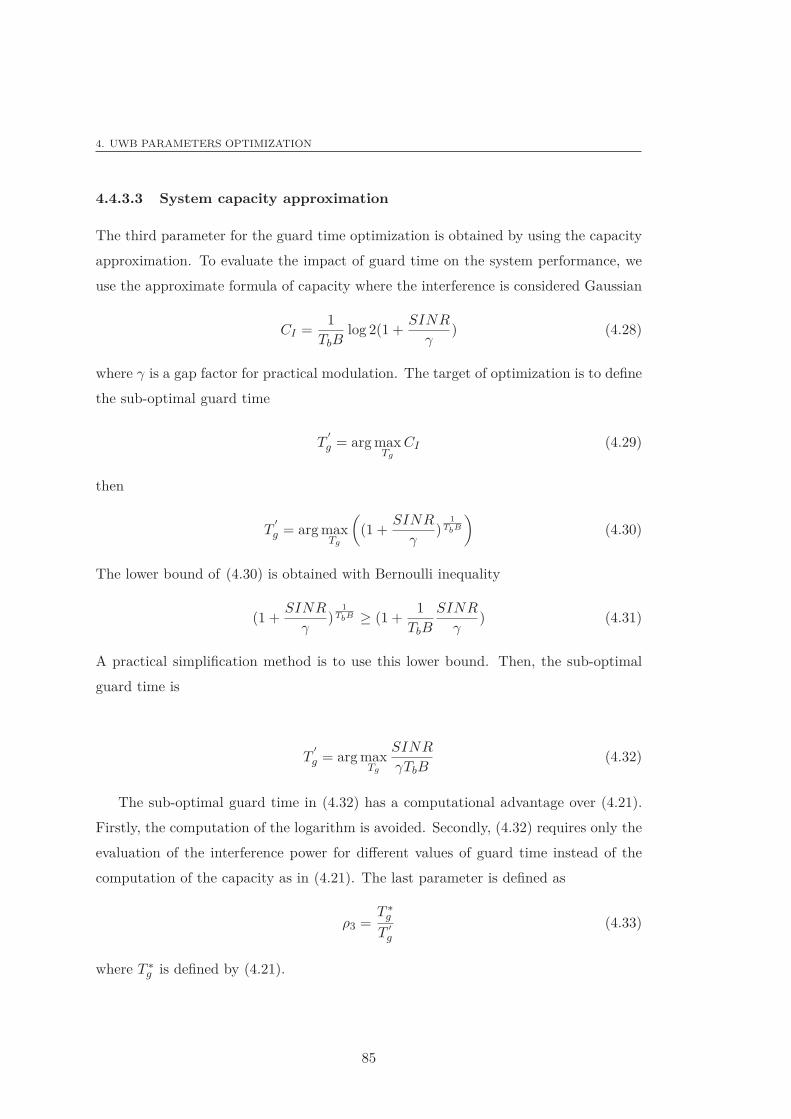
4. UWB PARAMETERS OPTIMIZATION
4.4.3.3 System capacity approximation
The third parameter for the guard time optimization is obtained by using the capacity
approximation. To evaluate the impact of guard time on the system performance, we
use the approximate formula of capacity where the interference is considered Gaussian
CI =1
TbBlog 2(1 +
SINR
γ) (4.28)
where γ is a gap factor for practical modulation. The target of optimization is to define
the sub-optimal guard time
T′
g = arg maxTg
CI (4.29)
then
T′
g = arg maxTg
(
(1 +SINR
γ)
1TbB
)
(4.30)
The lower bound of (4.30) is obtained with Bernoulli inequality
(1 +SINR
γ)
1TbB ≥ (1 +
1
TbB
SINR
γ) (4.31)
A practical simplification method is to use this lower bound. Then, the sub-optimal
guard time is
T′
g = arg maxTg
SINR
γTbB(4.32)
The sub-optimal guard time in (4.32) has a computational advantage over (4.21).
Firstly, the computation of the logarithm is avoided. Secondly, (4.32) requires only the
evaluation of the interference power for different values of guard time instead of the
computation of the capacity as in (4.21). The last parameter is defined as
ρ3 =T ∗
g
T ′
g
(4.33)
where T ∗g is defined by (4.21).
85
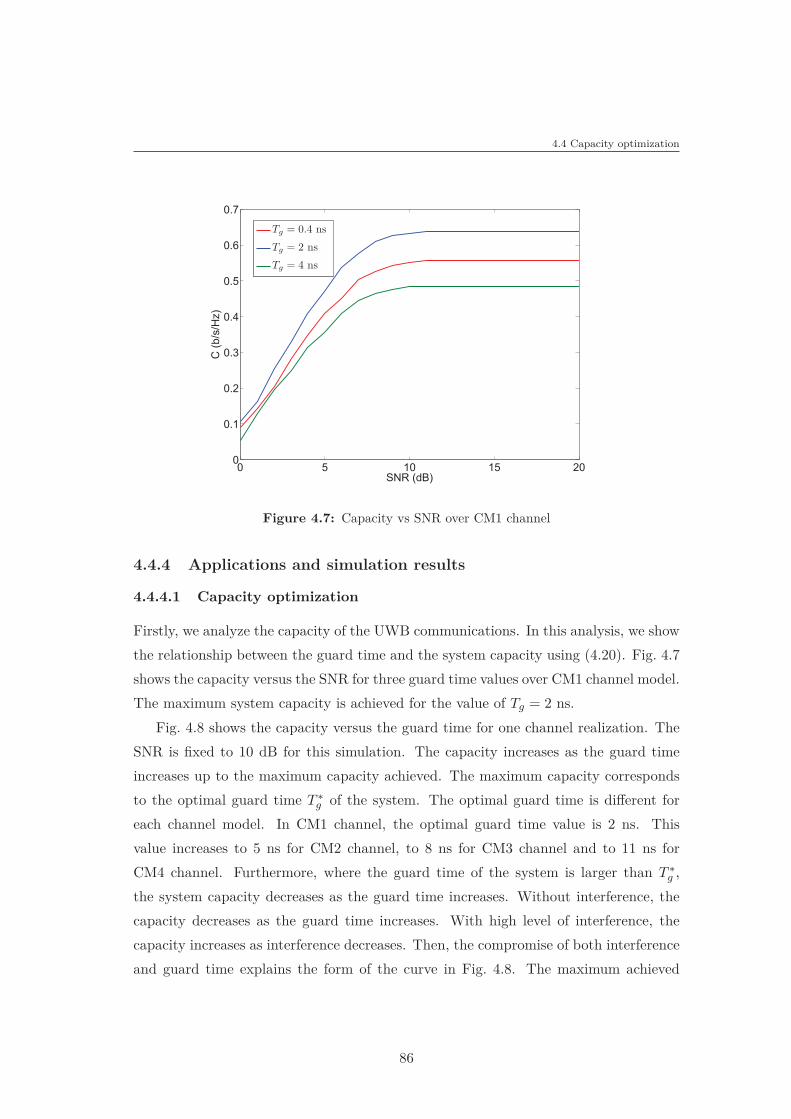
4.4 Capacity optimization
0 5 10 15 200
0.1
0.2
0.3
0.4
0.5
0.6
0.7
SNR (dB)
C (
b/s
/Hz)
Tg = 0.4 ns
Tg = 2 ns
Tg = 4 ns
Figure 4.7: Capacity vs SNR over CM1 channel
4.4.4 Applications and simulation results
4.4.4.1 Capacity optimization
Firstly, we analyze the capacity of the UWB communications. In this analysis, we show
the relationship between the guard time and the system capacity using (4.20). Fig. 4.7
shows the capacity versus the SNR for three guard time values over CM1 channel model.
The maximum system capacity is achieved for the value of Tg = 2 ns.
Fig. 4.8 shows the capacity versus the guard time for one channel realization. The
SNR is fixed to 10 dB for this simulation. The capacity increases as the guard time
increases up to the maximum capacity achieved. The maximum capacity corresponds
to the optimal guard time T ∗g of the system. The optimal guard time is different for
each channel model. In CM1 channel, the optimal guard time value is 2 ns. This
value increases to 5 ns for CM2 channel, to 8 ns for CM3 channel and to 11 ns for
CM4 channel. Furthermore, where the guard time of the system is larger than T ∗g ,
the system capacity decreases as the guard time increases. Without interference, the
capacity decreases as the guard time increases. With high level of interference, the
capacity increases as interference decreases. Then, the compromise of both interference
and guard time explains the form of the curve in Fig. 4.8. The maximum achieved
86
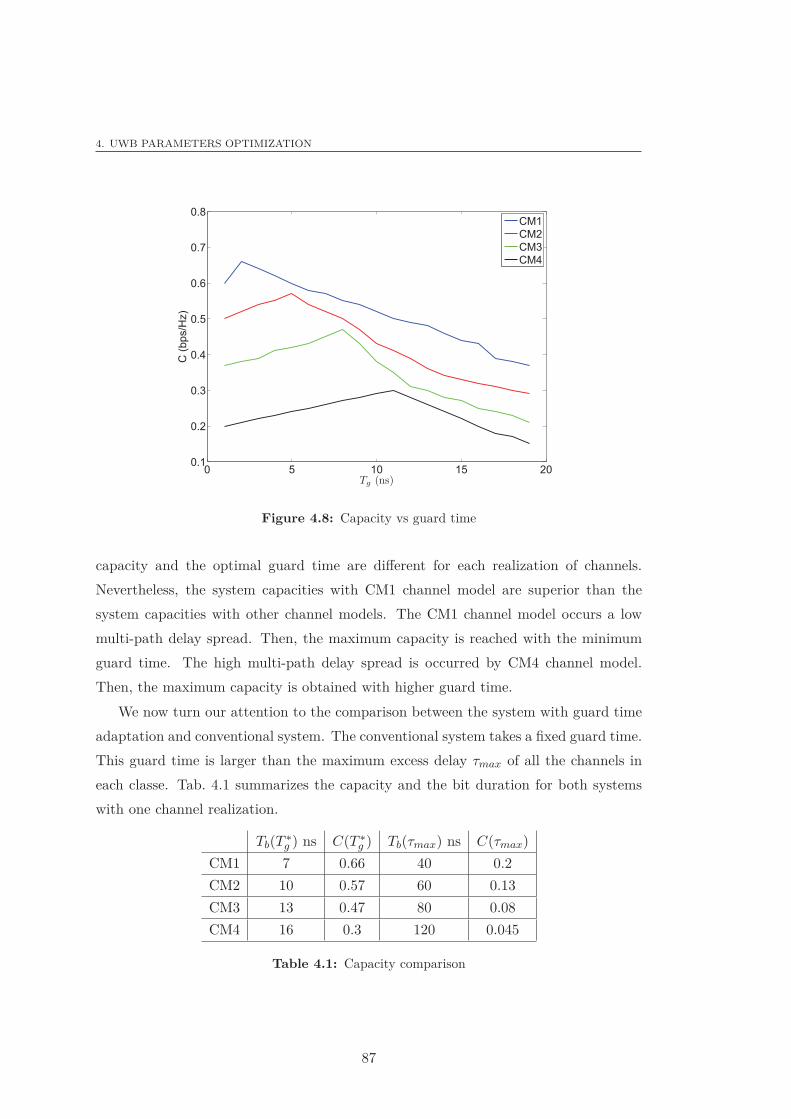
4. UWB PARAMETERS OPTIMIZATION
0 5 10 15 200.1
0.2
0.3
0.4
0.5
0.6
0.7
0.8
Tg (ns)
C (
bp
s/H
z)
CM1
CM2
CM3
CM4
Figure 4.8: Capacity vs guard time
capacity and the optimal guard time are different for each realization of channels.
Nevertheless, the system capacities with CM1 channel model are superior than the
system capacities with other channel models. The CM1 channel model occurs a low
multi-path delay spread. Then, the maximum capacity is reached with the minimum
guard time. The high multi-path delay spread is occurred by CM4 channel model.
Then, the maximum capacity is obtained with higher guard time.
We now turn our attention to the comparison between the system with guard time
adaptation and conventional system. The conventional system takes a fixed guard time.
This guard time is larger than the maximum excess delay τmax of all the channels in
each classe. Tab. 4.1 summarizes the capacity and the bit duration for both systems
with one channel realization.
Tb(T∗g ) ns C(T ∗
g ) Tb(τmax) ns C(τmax)
CM1 7 0.66 40 0.2
CM2 10 0.57 60 0.13
CM3 13 0.47 80 0.08
CM4 16 0.3 120 0.045
Table 4.1: Capacity comparison
87
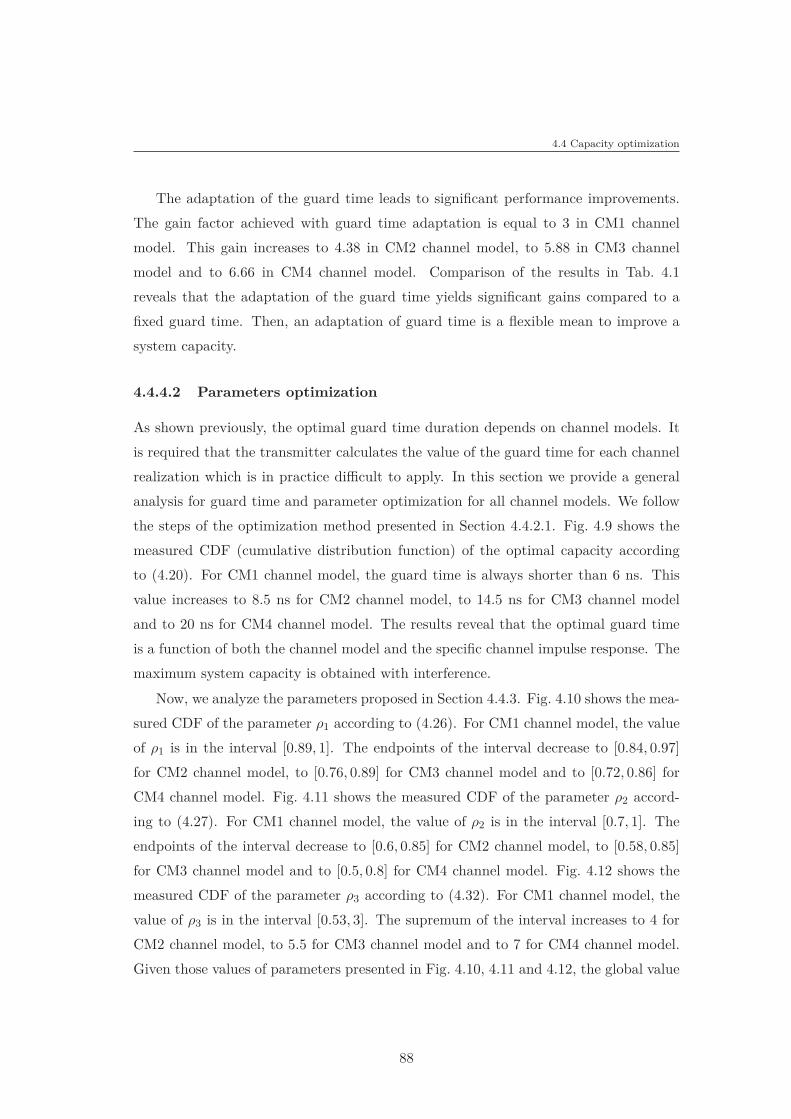
4.4 Capacity optimization
The adaptation of the guard time leads to significant performance improvements.
The gain factor achieved with guard time adaptation is equal to 3 in CM1 channel
model. This gain increases to 4.38 in CM2 channel model, to 5.88 in CM3 channel
model and to 6.66 in CM4 channel model. Comparison of the results in Tab. 4.1
reveals that the adaptation of the guard time yields significant gains compared to a
fixed guard time. Then, an adaptation of guard time is a flexible mean to improve a
system capacity.
4.4.4.2 Parameters optimization
As shown previously, the optimal guard time duration depends on channel models. It
is required that the transmitter calculates the value of the guard time for each channel
realization which is in practice difficult to apply. In this section we provide a general
analysis for guard time and parameter optimization for all channel models. We follow
the steps of the optimization method presented in Section 4.4.2.1. Fig. 4.9 shows the
measured CDF (cumulative distribution function) of the optimal capacity according
to (4.20). For CM1 channel model, the guard time is always shorter than 6 ns. This
value increases to 8.5 ns for CM2 channel model, to 14.5 ns for CM3 channel model
and to 20 ns for CM4 channel model. The results reveal that the optimal guard time
is a function of both the channel model and the specific channel impulse response. The
maximum system capacity is obtained with interference.
Now, we analyze the parameters proposed in Section 4.4.3. Fig. 4.10 shows the mea-
sured CDF of the parameter ρ1 according to (4.26). For CM1 channel model, the value
of ρ1 is in the interval [0.89, 1]. The endpoints of the interval decrease to [0.84, 0.97]
for CM2 channel model, to [0.76, 0.89] for CM3 channel model and to [0.72, 0.86] for
CM4 channel model. Fig. 4.11 shows the measured CDF of the parameter ρ2 accord-
ing to (4.27). For CM1 channel model, the value of ρ2 is in the interval [0.7, 1]. The
endpoints of the interval decrease to [0.6, 0.85] for CM2 channel model, to [0.58, 0.85]
for CM3 channel model and to [0.5, 0.8] for CM4 channel model. Fig. 4.12 shows the
measured CDF of the parameter ρ3 according to (4.32). For CM1 channel model, the
value of ρ3 is in the interval [0.53, 3]. The supremum of the interval increases to 4 for
CM2 channel model, to 5.5 for CM3 channel model and to 7 for CM4 channel model.
Given those values of parameters presented in Fig. 4.10, 4.11 and 4.12, the global value
88
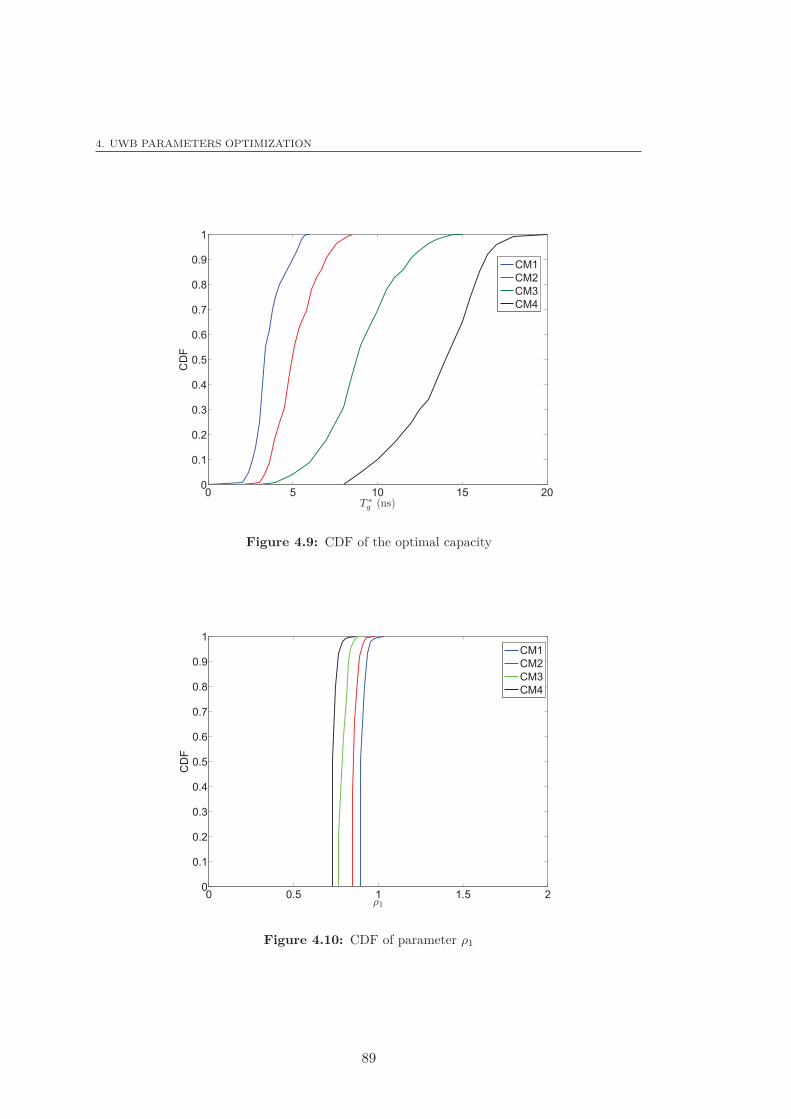
4. UWB PARAMETERS OPTIMIZATION
0 5 10 15 200
0.1
0.2
0.3
0.4
0.5
0.6
0.7
0.8
0.9
1
T ∗
g (ns)
CD
F
CM1
CM2
CM3
CM4
Figure 4.9: CDF of the optimal capacity
0 0.5 1 1.5 20
0.1
0.2
0.3
0.4
0.5
0.6
0.7
0.8
0.9
1
ρ1
CD
F
CM1
CM2
CM3
CM4
Figure 4.10: CDF of parameter ρ1
89
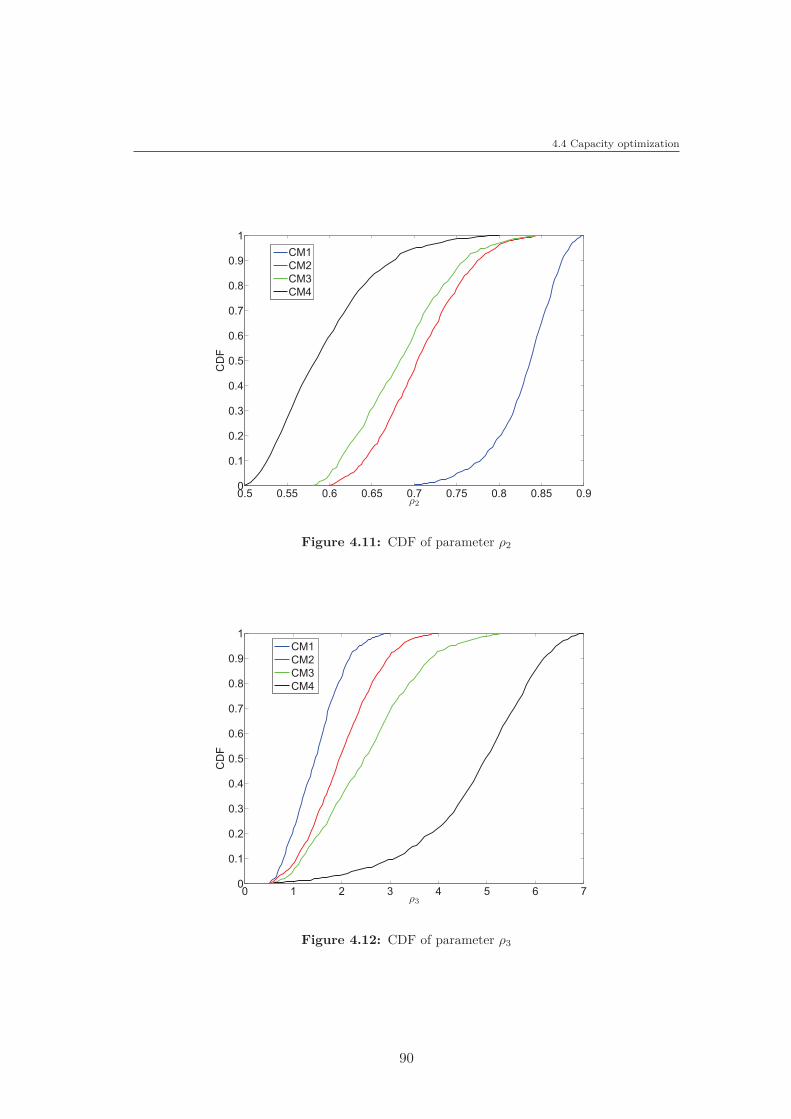
4.4 Capacity optimization
0.5 0.55 0.6 0.65 0.7 0.75 0.8 0.85 0.90
0.1
0.2
0.3
0.4
0.5
0.6
0.7
0.8
0.9
1
ρ2
CD
F
CM1
CM2
CM3
CM4
Figure 4.11: CDF of parameter ρ2
0 1 2 3 4 5 6 70
0.1
0.2
0.3
0.4
0.5
0.6
0.7
0.8
0.9
1
ρ3
CD
F
CM1
CM2
CM3
CM4
Figure 4.12: CDF of parameter ρ3
90
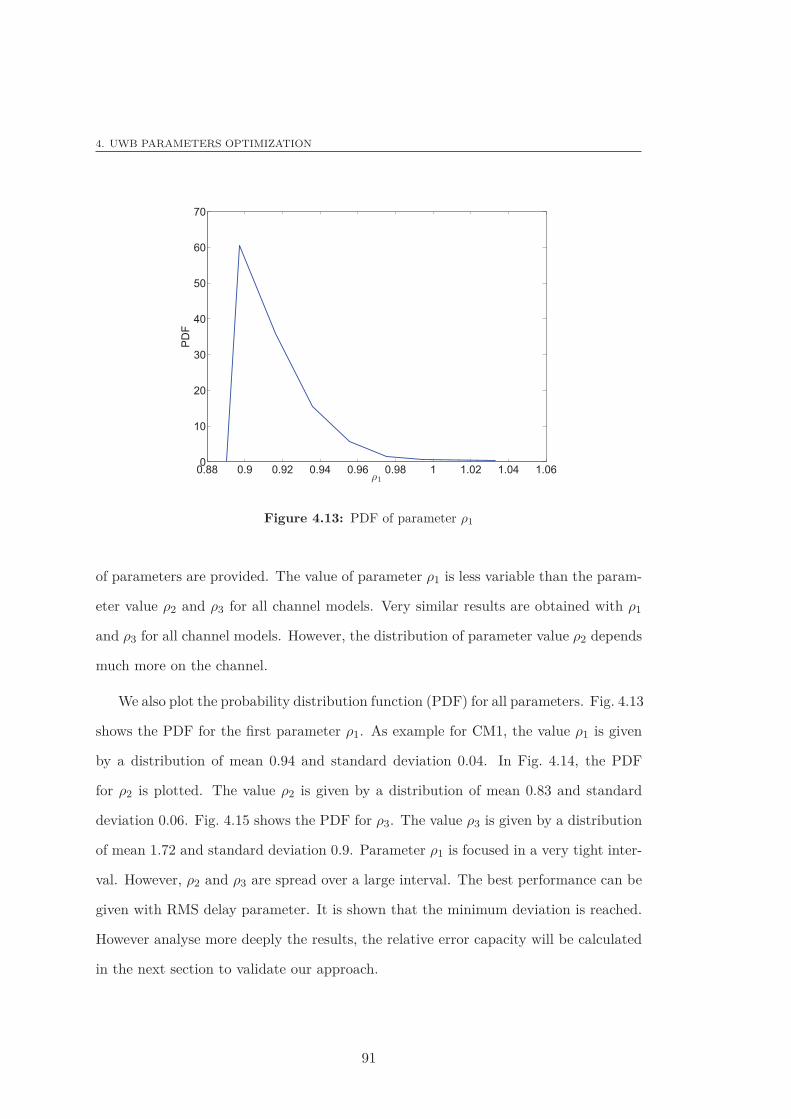
4. UWB PARAMETERS OPTIMIZATION
0.88 0.9 0.92 0.94 0.96 0.98 1 1.02 1.04 1.060
10
20
30
40
50
60
70
ρ1
PD
F
Figure 4.13: PDF of parameter ρ1
of parameters are provided. The value of parameter ρ1 is less variable than the param-
eter value ρ2 and ρ3 for all channel models. Very similar results are obtained with ρ1
and ρ3 for all channel models. However, the distribution of parameter value ρ2 depends
much more on the channel.
We also plot the probability distribution function (PDF) for all parameters. Fig. 4.13
shows the PDF for the first parameter ρ1. As example for CM1, the value ρ1 is given
by a distribution of mean 0.94 and standard deviation 0.04. In Fig. 4.14, the PDF
for ρ2 is plotted. The value ρ2 is given by a distribution of mean 0.83 and standard
deviation 0.06. Fig. 4.15 shows the PDF for ρ3. The value ρ3 is given by a distribution
of mean 1.72 and standard deviation 0.9. Parameter ρ1 is focused in a very tight inter-
val. However, ρ2 and ρ3 are spread over a large interval. The best performance can be
given with RMS delay parameter. It is shown that the minimum deviation is reached.
However analyse more deeply the results, the relative error capacity will be calculated
in the next section to validate our approach.
91
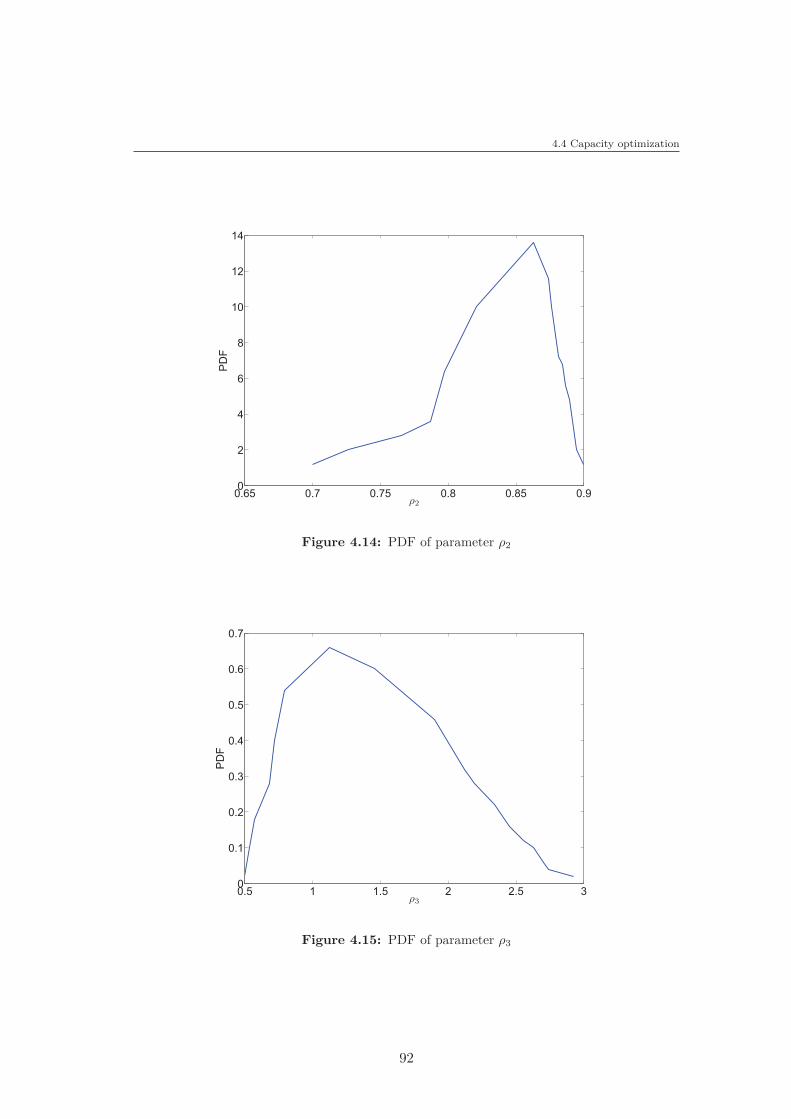
4.4 Capacity optimization
0.65 0.7 0.75 0.8 0.85 0.90
2
4
6
8
10
12
14
ρ2
PD
F
Figure 4.14: PDF of parameter ρ2
0.5 1 1.5 2 2.5 30
0.1
0.2
0.3
0.4
0.5
0.6
0.7
ρ3
PD
F
Figure 4.15: PDF of parameter ρ3
92
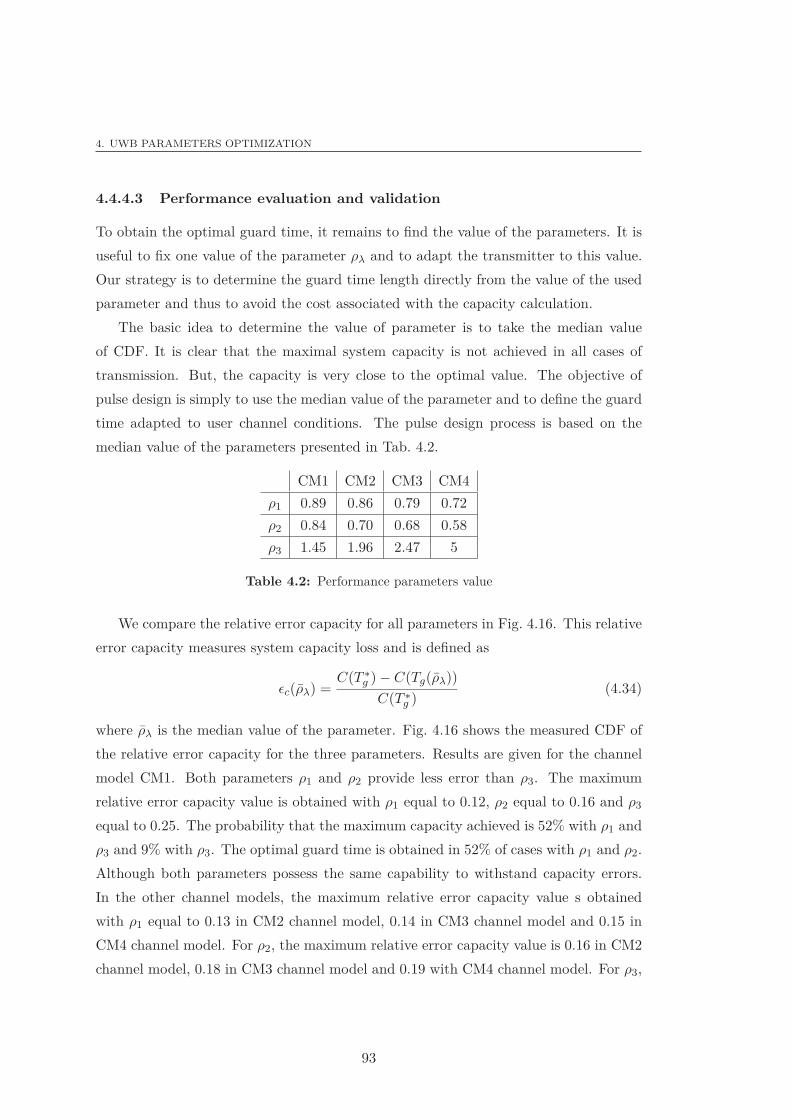
4. UWB PARAMETERS OPTIMIZATION
4.4.4.3 Performance evaluation and validation
To obtain the optimal guard time, it remains to find the value of the parameters. It is
useful to fix one value of the parameter ρλ and to adapt the transmitter to this value.
Our strategy is to determine the guard time length directly from the value of the used
parameter and thus to avoid the cost associated with the capacity calculation.
The basic idea to determine the value of parameter is to take the median value
of CDF. It is clear that the maximal system capacity is not achieved in all cases of
transmission. But, the capacity is very close to the optimal value. The objective of
pulse design is simply to use the median value of the parameter and to define the guard
time adapted to user channel conditions. The pulse design process is based on the
median value of the parameters presented in Tab. 4.2.
CM1 CM2 CM3 CM4
ρ1 0.89 0.86 0.79 0.72
ρ2 0.84 0.70 0.68 0.58
ρ3 1.45 1.96 2.47 5
Table 4.2: Performance parameters value
We compare the relative error capacity for all parameters in Fig. 4.16. This relative
error capacity measures system capacity loss and is defined as
ǫc(ρ̄λ) =C(T ∗
g ) − C(Tg(ρ̄λ))
C(T ∗g )
(4.34)
where ρ̄λ is the median value of the parameter. Fig. 4.16 shows the measured CDF of
the relative error capacity for the three parameters. Results are given for the channel
model CM1. Both parameters ρ1 and ρ2 provide less error than ρ3. The maximum
relative error capacity value is obtained with ρ1 equal to 0.12, ρ2 equal to 0.16 and ρ3
equal to 0.25. The probability that the maximum capacity achieved is 52% with ρ1 and
ρ3 and 9% with ρ3. The optimal guard time is obtained in 52% of cases with ρ1 and ρ2.
Although both parameters possess the same capability to withstand capacity errors.
In the other channel models, the maximum relative error capacity value s obtained
with ρ1 equal to 0.13 in CM2 channel model, 0.14 in CM3 channel model and 0.15 in
CM4 channel model. For ρ2, the maximum relative error capacity value is 0.16 in CM2
channel model, 0.18 in CM3 channel model and 0.19 with CM4 channel model. For ρ3,
93
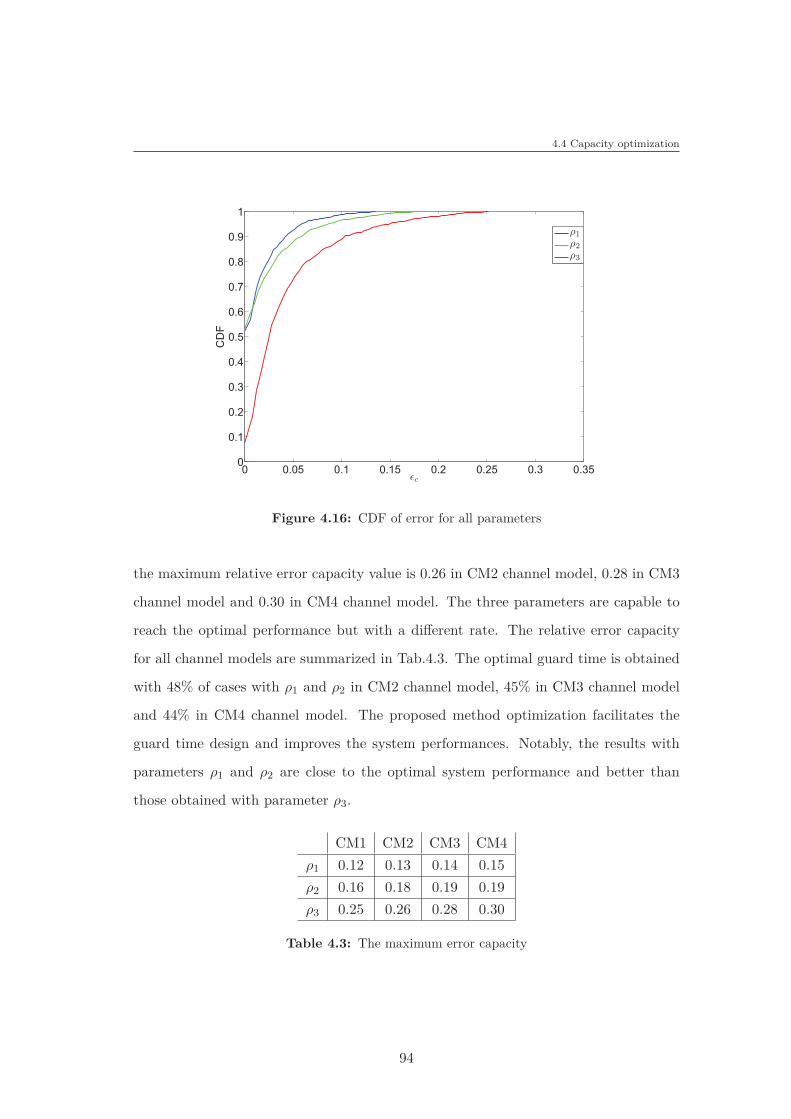
4.4 Capacity optimization
0 0.05 0.1 0.15 0.2 0.25 0.3 0.350
0.1
0.2
0.3
0.4
0.5
0.6
0.7
0.8
0.9
1
ǫc
CD
Fρ1
ρ2
ρ3
Figure 4.16: CDF of error for all parameters
the maximum relative error capacity value is 0.26 in CM2 channel model, 0.28 in CM3
channel model and 0.30 in CM4 channel model. The three parameters are capable to
reach the optimal performance but with a different rate. The relative error capacity
for all channel models are summarized in Tab.4.3. The optimal guard time is obtained
with 48% of cases with ρ1 and ρ2 in CM2 channel model, 45% in CM3 channel model
and 44% in CM4 channel model. The proposed method optimization facilitates the
guard time design and improves the system performances. Notably, the results with
parameters ρ1 and ρ2 are close to the optimal system performance and better than
those obtained with parameter ρ3.
CM1 CM2 CM3 CM4
ρ1 0.12 0.13 0.14 0.15
ρ2 0.16 0.18 0.19 0.19
ρ3 0.25 0.26 0.28 0.30
Table 4.3: The maximum error capacity
94
4. UWB PARAMETERS OPTIMIZATION
4.5 MB resource management principle
4.5.1 Problem formulation
Recently, with the high demand of data transfers, the multi-band technique is used for
communication systems. The UWB systems can be either single-band, or, multi-band.
The IEEE is undergoing a process of extensive discussions on UWB standard 802.15.3a.
A multi-band system is a particular type of multi-carrier system where the transmitted
bandwidth is divided into sub-bands that are transmitted in parallel. The solution is
based on a sequential use of sub-bands through a frequency-hopping. In a MB-UWB
system, a chunk of bandwidth is divided into multiple sub-bands each with 528 MHz
bandwidth as presented in Chapter 2. The division into sub-bands permits a better
control of the spectral occupancy of the transmitted signal. Two models of resource
allocation are studied hereafter. The first one choses the adjacent sub-bands. With the
second one, the best sub-bands are chosen according to channel response. It’s assumed
that channel state information is available at the transmitters. Hence, our target is
to define the best allocation that minimizes the bit duration under energy efficiency
constraint. The goal of this solution is to exploit the resource in the frequency and
time domains. The optimization problem is defined as
minTb subject to
n∑
i=1
Ebi= Eb(β)
Ebi≥ 0
. (4.35)
In this case under energy efficiency constraint, we define the required bandwidth for
transmission. The target is to define the best adjacent sub-bands for transmission.
The processes of the first algorithm named Algorithm 2 proposed is as follows: the
energy efficiency constraint of the system is achieved when the best channels are used.
Our target is to define the best adjacent sub-bands that minimizes the bit duration
corresponding to energy efficiency β. Then, the algorithm chooses the best adjacent
sub-bands and the minimum time of transmission is calculated using the formula given
in Appendix A. With thus solution, it is easy to define the parameters of the pulse in
the time domain.
95
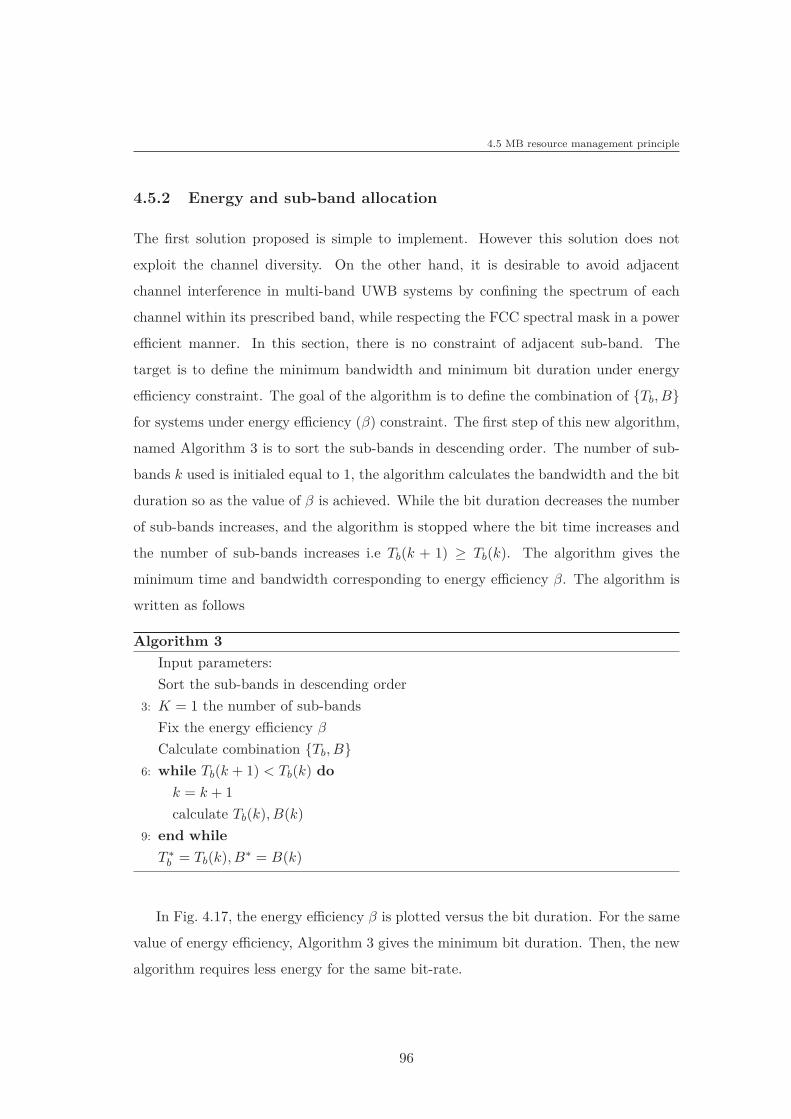
4.5 MB resource management principle
4.5.2 Energy and sub-band allocation
The first solution proposed is simple to implement. However this solution does not
exploit the channel diversity. On the other hand, it is desirable to avoid adjacent
channel interference in multi-band UWB systems by confining the spectrum of each
channel within its prescribed band, while respecting the FCC spectral mask in a power
efficient manner. In this section, there is no constraint of adjacent sub-band. The
target is to define the minimum bandwidth and minimum bit duration under energy
efficiency constraint. The goal of the algorithm is to define the combination of {Tb, B}for systems under energy efficiency (β) constraint. The first step of this new algorithm,
named Algorithm 3 is to sort the sub-bands in descending order. The number of sub-
bands k used is initialed equal to 1, the algorithm calculates the bandwidth and the bit
duration so as the value of β is achieved. While the bit duration decreases the number
of sub-bands increases, and the algorithm is stopped where the bit time increases and
the number of sub-bands increases i.e Tb(k + 1) ≥ Tb(k). The algorithm gives the
minimum time and bandwidth corresponding to energy efficiency β. The algorithm is
written as follows
Algorithm 3
Input parameters:
Sort the sub-bands in descending order
3: K = 1 the number of sub-bands
Fix the energy efficiency β
Calculate combination {Tb, B}6: while Tb(k + 1) < Tb(k) do
k = k + 1
calculate Tb(k), B(k)
9: end while
T ∗b = Tb(k), B∗ = B(k)
In Fig. 4.17, the energy efficiency β is plotted versus the bit duration. For the same
value of energy efficiency, Algorithm 3 gives the minimum bit duration. Then, the new
algorithm requires less energy for the same bit-rate.
96
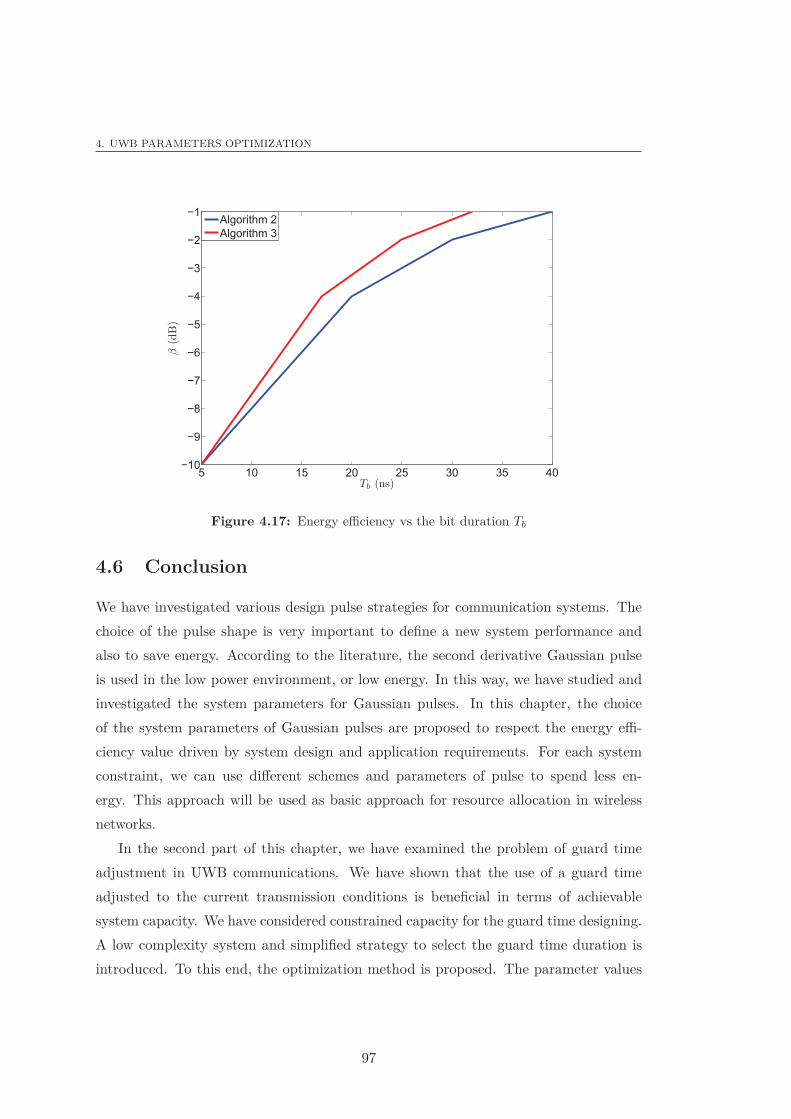
4. UWB PARAMETERS OPTIMIZATION
5 10 15 20 25 30 35 40�10
�9
�8
�7
�6
�5
�4
�3
�2
�1
Tb (ns)
β(dB)
Algorithm 2
Algorithm 3
Figure 4.17: Energy efficiency vs the bit duration Tb
4.6 Conclusion
We have investigated various design pulse strategies for communication systems. The
choice of the pulse shape is very important to define a new system performance and
also to save energy. According to the literature, the second derivative Gaussian pulse
is used in the low power environment, or low energy. In this way, we have studied and
investigated the system parameters for Gaussian pulses. In this chapter, the choice
of the system parameters of Gaussian pulses are proposed to respect the energy effi-
ciency value driven by system design and application requirements. For each system
constraint, we can use different schemes and parameters of pulse to spend less en-
ergy. This approach will be used as basic approach for resource allocation in wireless
networks.
In the second part of this chapter, we have examined the problem of guard time
adjustment in UWB communications. We have shown that the use of a guard time
adjusted to the current transmission conditions is beneficial in terms of achievable
system capacity. We have considered constrained capacity for the guard time designing.
A low complexity system and simplified strategy to select the guard time duration is
introduced. To this end, the optimization method is proposed. The parameter values
97
4.6 Conclusion
for all channel models are provided. Furthermore, we have compared all parameters.
Numerical results for typical indoor UWB channels have shown significant gains due
to guard time adaptation. These gains come from adjusting the guard time according
to the instantaneous channel impulse response.
In the last part of this chapter, we focus on MB UWB communications. A new
algorithm for resource allocation is proposed to increase the energy efficiency of those
systems. In this chapter, the Gaussian pulse is used for transmission, and its parameters
are optimized. In the next chapter, we will focus on others pulses to improve the energy
efficiency of UWB systems.
98
Chapter 5
Pulse design
5.1 Introduction
The usual pulse used with UWB system is the Gaussian monocycle pulse. Unfortu-
nately, the Gaussian monocycle is not a flexible pulse and there is less freedom for
energy minimization. In communication systems, we can use other pulses. With the
new challenge for green radio, the emerging UWB communication systems need to de-
sign a new pulse shape in order to achieve optimal energy consumption. In practical
systems, with the new developments in DSP hardware, it has become possible to use
any pulse shape for digital data transmission. Motivated by these considerations, this
chapter deals with the problem of a UWB pulse design. The main question solved here
is how to design a pulse without assuming a particular set of basis signals.
In this chapter, we study various pulses shaping that consume less energy than
Gaussian pulse. Three transmitting pulses in UWB communications are proposed.
Each pulse provides improvement for energy efficiency. The chapter is organized as
follows. Firstly, the pulse is optimized in the case of matched filter receiver. Using
Cauchy-Schwarz inequality, the time reversal is obtained for energy minimization. Fur-
thermore, an improvement of time reversal pulse is also provided. Secondly, we do not
limit ourselves to matched filter receiver. Our approach is to obtain the best transmit-
ting pulse in the general case. The solution of the new problem is then given in this
chapter. The new proposed pulse provides a huge energy gain for UWB communica-
tions. We present numerical results of UWB systems with indoor UWB channels that
confirm the gains achieved with the proposed pulse.
99
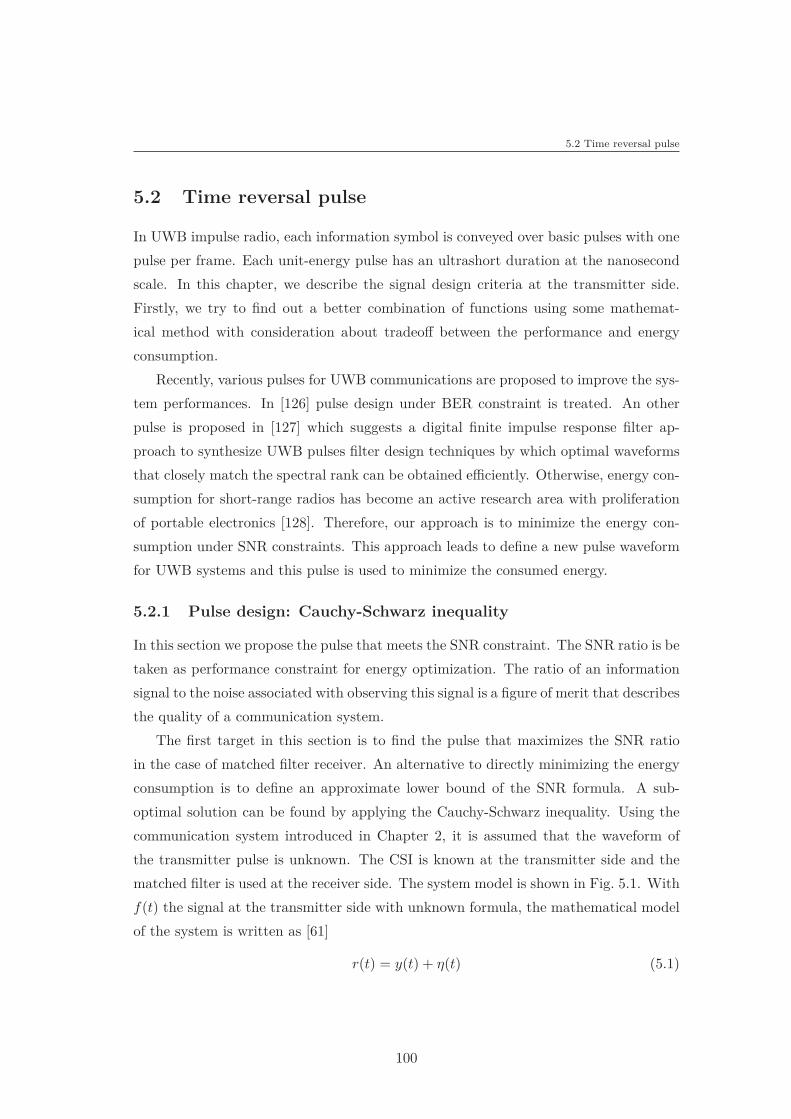
5.2 Time reversal pulse
5.2 Time reversal pulse
In UWB impulse radio, each information symbol is conveyed over basic pulses with one
pulse per frame. Each unit-energy pulse has an ultrashort duration at the nanosecond
scale. In this chapter, we describe the signal design criteria at the transmitter side.
Firstly, we try to find out a better combination of functions using some mathemat-
ical method with consideration about tradeoff between the performance and energy
consumption.
Recently, various pulses for UWB communications are proposed to improve the sys-
tem performances. In [126] pulse design under BER constraint is treated. An other
pulse is proposed in [127] which suggests a digital finite impulse response filter ap-
proach to synthesize UWB pulses filter design techniques by which optimal waveforms
that closely match the spectral rank can be obtained efficiently. Otherwise, energy con-
sumption for short-range radios has become an active research area with proliferation
of portable electronics [128]. Therefore, our approach is to minimize the energy con-
sumption under SNR constraints. This approach leads to define a new pulse waveform
for UWB systems and this pulse is used to minimize the consumed energy.
5.2.1 Pulse design: Cauchy-Schwarz inequality
In this section we propose the pulse that meets the SNR constraint. The SNR ratio is be
taken as performance constraint for energy optimization. The ratio of an information
signal to the noise associated with observing this signal is a figure of merit that describes
the quality of a communication system.
The first target in this section is to find the pulse that maximizes the SNR ratio
in the case of matched filter receiver. An alternative to directly minimizing the energy
consumption is to define an approximate lower bound of the SNR formula. A sub-
optimal solution can be found by applying the Cauchy-Schwarz inequality. Using the
communication system introduced in Chapter 2, it is assumed that the waveform of
the transmitter pulse is unknown. The CSI is known at the transmitter side and the
matched filter is used at the receiver side. The system model is shown in Fig. 5.1. With
f(t) the signal at the transmitter side with unknown formula, the mathematical model
of the system is written as [61]
r(t) = y(t) + η(t) (5.1)
100
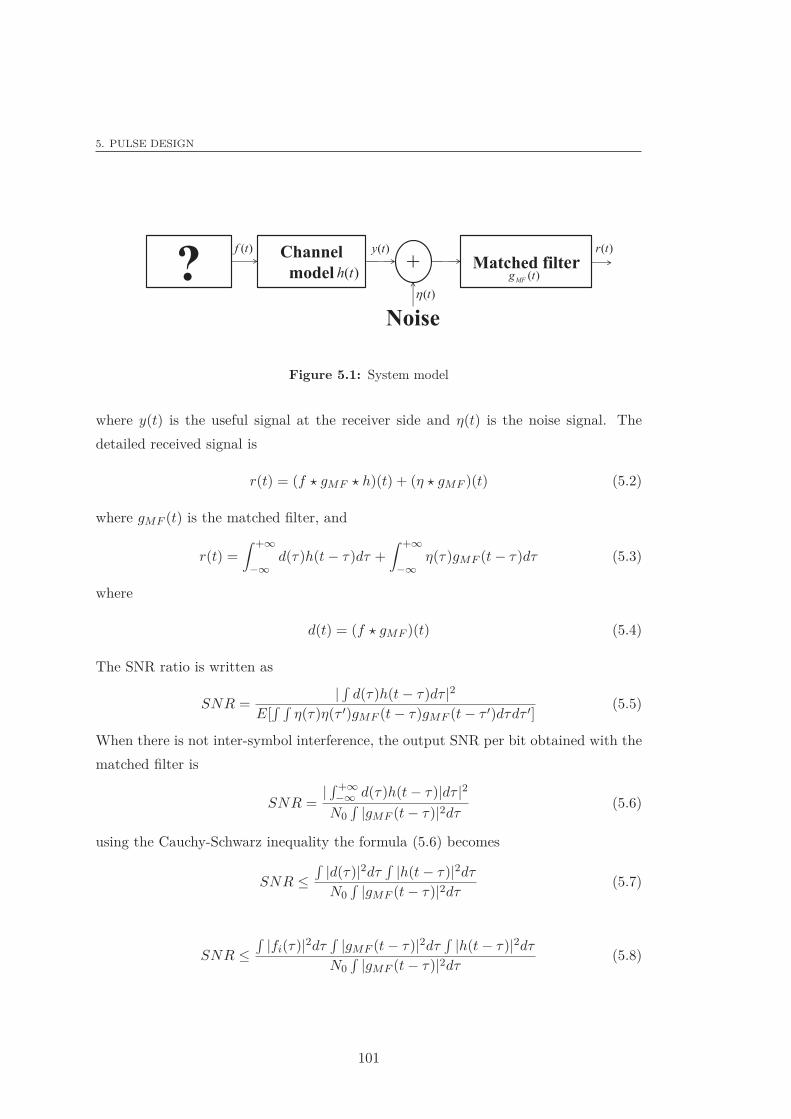
5. PULSE DESIGN
? Channel
model Matched filter
Noise
( )r t
( )MFg t
( )th
( )y t
( )h t
( )f t
+
Figure 5.1: System model
where y(t) is the useful signal at the receiver side and η(t) is the noise signal. The
detailed received signal is
r(t) = (f ⋆ gMF ⋆ h)(t) + (η ⋆ gMF )(t) (5.2)
where gMF (t) is the matched filter, and
r(t) =
∫ +∞
−∞d(τ)h(t − τ)dτ +
∫ +∞
−∞η(τ)gMF (t − τ)dτ (5.3)
where
d(t) = (f ⋆ gMF )(t) (5.4)
The SNR ratio is written as
SNR =|∫
d(τ)h(t − τ)dτ |2E[
∫ ∫
η(τ)η(τ ′)gMF (t − τ)gMF (t − τ ′)dτdτ ′](5.5)
When there is not inter-symbol interference, the output SNR per bit obtained with the
matched filter is
SNR =|∫ +∞
−∞ d(τ)h(t − τ)|dτ |2N0
∫
|gMF (t − τ)|2dτ(5.6)
using the Cauchy-Schwarz inequality the formula (5.6) becomes
SNR ≤∫
|d(τ)|2dτ∫
|h(t − τ)|2dτ
N0∫
|gMF (t − τ)|2dτ(5.7)
SNR ≤∫
|fi(τ)|2dτ∫
|gMF (t − τ)|2dτ∫
|h(t − τ)|2dτ
N0∫
|gMF (t − τ)|2dτ(5.8)
101
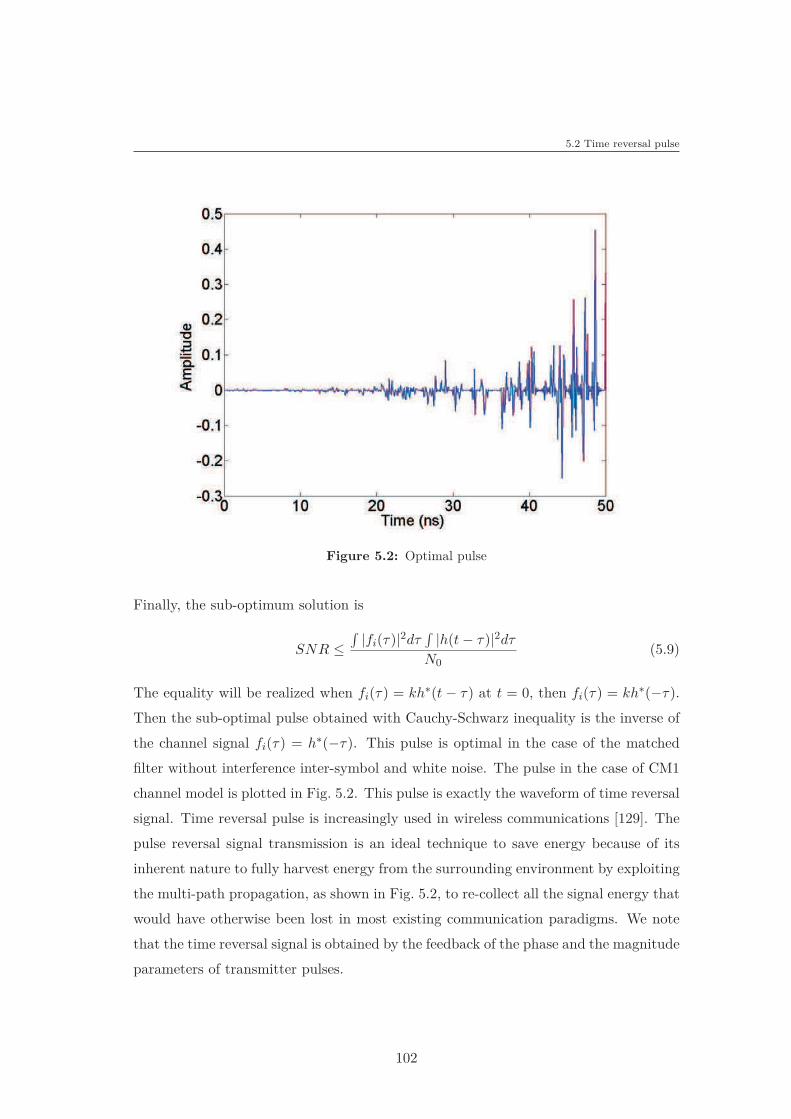
5.2 Time reversal pulse
Figure 5.2: Optimal pulse
Finally, the sub-optimum solution is
SNR ≤∫
|fi(τ)|2dτ∫
|h(t − τ)|2dτ
N0(5.9)
The equality will be realized when fi(τ) = kh∗(t − τ) at t = 0, then fi(τ) = kh∗(−τ).
Then the sub-optimal pulse obtained with Cauchy-Schwarz inequality is the inverse of
the channel signal fi(τ) = h∗(−τ). This pulse is optimal in the case of the matched
filter without interference inter-symbol and white noise. The pulse in the case of CM1
channel model is plotted in Fig. 5.2. This pulse is exactly the waveform of time reversal
signal. Time reversal pulse is increasingly used in wireless communications [129]. The
pulse reversal signal transmission is an ideal technique to save energy because of its
inherent nature to fully harvest energy from the surrounding environment by exploiting
the multi-path propagation, as shown in Fig. 5.2, to re-collect all the signal energy that
would have otherwise been lost in most existing communication paradigms. We note
that the time reversal signal is obtained by the feedback of the phase and the magnitude
parameters of transmitter pulses.
102
5. PULSE DESIGN
Bandwidth 1 GHz
Bit duration (Tb) 40 ns
Pulse duration 5 ns
Guard time 35 ns
L 1
Channel model CM1
Table 5.1: System parameters
5.2.2 Comparison between UWB pulse and time reversal pulse
In this section, we present numerical evaluations of monocycle and time reversal pulses
in UWB channel. In particular, our attention is focused on performance comparison
between both pulses. BER and system capacity performance are plotted versus the
Eb/N0 (energy per bit to noise power spectral density ratio). Perfect synchronization
and channel estimation are assumed and the channel transfer function is known at
both transmitter and receiver sides. The multi-path channel model of UWB given in
Chapter 2 is used. The channel and system parameters are summarized in Table 5.1.
The bandwidth and bit duration for both pulses are similar. The same bit energy is
used for both pulses. The formula of the system capacity is obtained using the Shannon
capacity formula in the case of Gaussian noise and interferences. The system capacity
is
C =1
Tblog2(1 + SINR) (5.10)
Let us now compare the performance for both pulses, i.e. monocycle pulse and time
reversal pulse. Fig. 5.3 and Fig. 5.4 represent the system capacity and the bit error
rate versus Eb/N0. The time reversal pulse provides the best performances in term of
BER and channel capacity for fixed value of Eb/N0. The gap gain between both pulses
is more than 3 dB. In term of energy efficiency, for the same BER, the system with
the time reversal pulse needs 50 % of energy less than the system with the monocycle
pulse. As shown in Fig. 5.3, a gain factor of 50 % in energy saving is then reached with
time reversal pulse. This pulse provides energy gains in communication systems with
the same performance. We show through numerical simulations that the time reversal
pulse compared to the Gaussian monocycle reveals significant energy reduction. On
the other hand, time reversal improves the quality of the received signal.
103
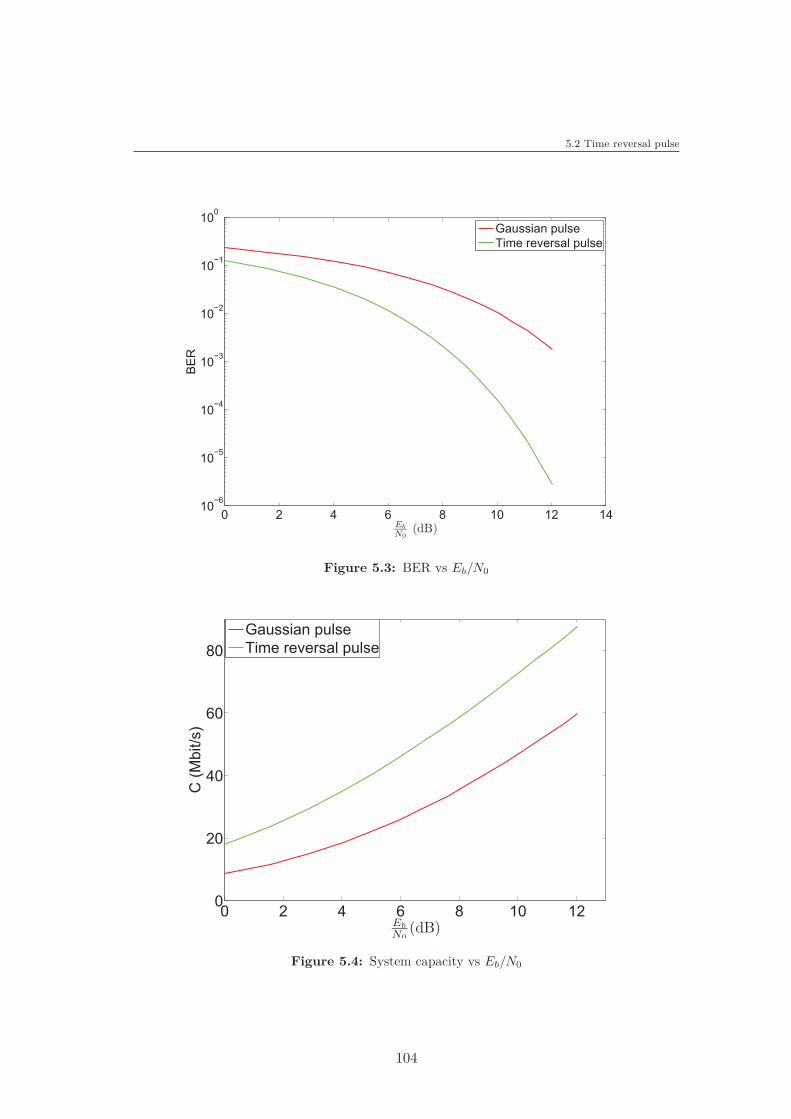
5.2 Time reversal pulse
0 2 4 6 8 10 12 1410
6
10 5
10 4
10 3
10 2
10 1
100
Eb
N0
(dB)
BER
Gaussian!pulse
Time!reversal!pulse
Figure 5.3: BER vs Eb/N0
0 2 4 6 8 10 120
20
40
60
80
Eb
N0
(dB)
C!(Mbit/s)
Gaussian!pulse
Time!reversal!pulse
Figure 5.4: System capacity vs Eb/N0
104
5. PULSE DESIGN
5.2.3 Pulse without phase estimation
The time reversal pulse saves energy and provides high performance in communication
systems. However, this pulse is dependent on the knowledge of CSI at transmitter side.
The system with time reversal pulse requires feedback to design the pulse. The system
needs to transmit the amplitude and the phase of the channel at transmitter side. Then,
in this case we propose a new pulse for communication systems. The proposition is to
develop new pulse model for communication systems which offers similar performance
to the time reversal pulse. In this section, the analysis is realized in frequency domain.
The received signal without noise of in the frequency domain in the case of time
reversal is defined as G(f) = |A(f)|2, where Gtx(f) = |A(f)|exp(jθch), is the transmit-
ted signal, H(f) = |A(f)| exp(−jθch) is the channel response and the matched filter is
defined as GMF (f) = |A(f)|2.The proposed method is to reduce the number of parameters retransmitted to the
transmitter side. The target is to alleviate the feedback. In this case, the system
consumes less energy. The same performance as the performance of time reversal pulse
is obtained. The new pulse needs to retransmit only the amplitude of the channel
response. The transmitted signal is then Gtx(f) = |A(f)|. In this case, the matchedfilter becomes GMF = |A(f)|2 exp(jθch). For this new pulse, the received signal without
noise is G(f) = |A(f)|2. The system can achieve the same energy saving compared tothe first approach (time reversal pulse) using an easier feedback. Mathematical and
numerical results show that the proposed pulse provides the same gains compared to
the time reversal pulse. With this new pulse, the system needs less energy and keeps the
same performance. The time reversal pulse involves to feedback both magnitude and
phase components of the frequency response, whereas only the amplitude component
must be feedback with this new pulse.
5.3 Optimal pulse for energy minimization
5.3.1 Problem formulation
In this section, our target is to define the optimal pulse for energy minimization. In [56]
the minimum energy required to realize communication system is defined. The time
reversal pulse is proposed as the first solution of energy efficiency. To establish a
105
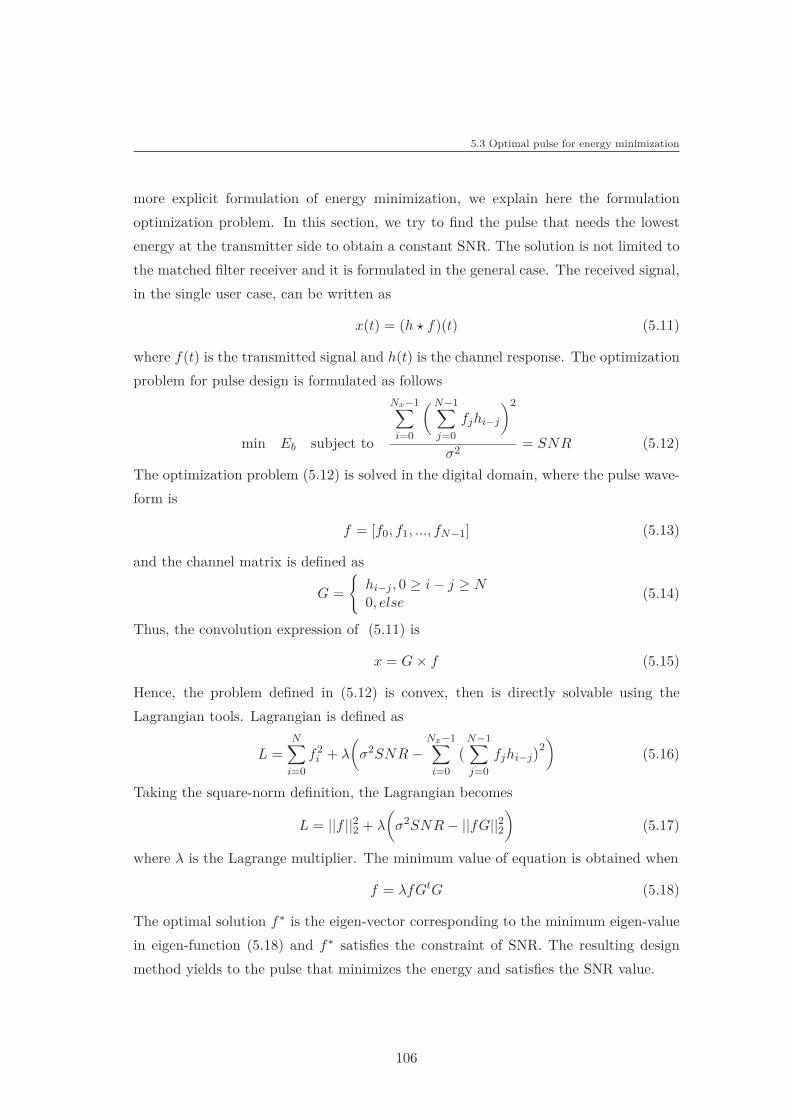
5.3 Optimal pulse for energy minimization
more explicit formulation of energy minimization, we explain here the formulation
optimization problem. In this section, we try to find the pulse that needs the lowest
energy at the transmitter side to obtain a constant SNR. The solution is not limited to
the matched filter receiver and it is formulated in the general case. The received signal,
in the single user case, can be written as
x(t) = (h ⋆ f)(t) (5.11)
where f(t) is the transmitted signal and h(t) is the channel response. The optimization
problem for pulse design is formulated as follows
min Eb subject to
Nx−1∑
i=0
( N−1∑
j=0
fjhi−j
)2
σ2= SNR (5.12)
The optimization problem (5.12) is solved in the digital domain, where the pulse wave-
form is
f = [f0, f1, ..., fN−1] (5.13)
and the channel matrix is defined as
G =
{
hi−j , 0 ≥ i − j ≥ N0, else
(5.14)
Thus, the convolution expression of (5.11) is
x = G × f (5.15)
Hence, the problem defined in (5.12) is convex, then is directly solvable using the
Lagrangian tools. Lagrangian is defined as
L =N
∑
i=0
f2i + λ
(
σ2SNR −Nx−1∑
i=0
(
N−1∑
j=0
fjhi−j)2
)
(5.16)
Taking the square-norm definition, the Lagrangian becomes
L = ||f ||22 + λ
(
σ2SNR − ||fG||22)
(5.17)
where λ is the Lagrange multiplier. The minimum value of equation is obtained when
f = λfGtG (5.18)
The optimal solution f∗ is the eigen-vector corresponding to the minimum eigen-value
in eigen-function (5.18) and f∗ satisfies the constraint of SNR. The resulting design
method yields to the pulse that minimizes the energy and satisfies the SNR value.
106
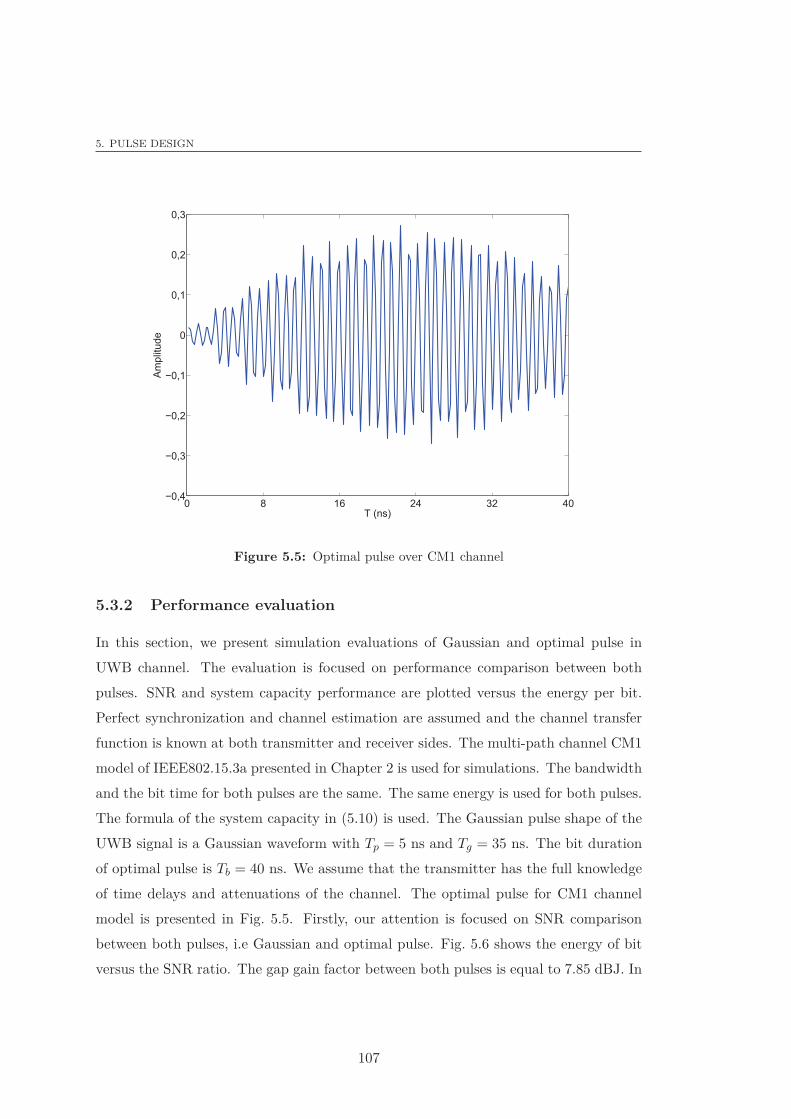
5. PULSE DESIGN
0 8 16 24 32 40 0,4
0,3
0,2
0,1
0
0,1
0,2
0,3
T!(ns)
Amplitude
Figure 5.5: Optimal pulse over CM1 channel
5.3.2 Performance evaluation
In this section, we present simulation evaluations of Gaussian and optimal pulse in
UWB channel. The evaluation is focused on performance comparison between both
pulses. SNR and system capacity performance are plotted versus the energy per bit.
Perfect synchronization and channel estimation are assumed and the channel transfer
function is known at both transmitter and receiver sides. The multi-path channel CM1
model of IEEE802.15.3a presented in Chapter 2 is used for simulations. The bandwidth
and the bit time for both pulses are the same. The same energy is used for both pulses.
The formula of the system capacity in (5.10) is used. The Gaussian pulse shape of the
UWB signal is a Gaussian waveform with Tp = 5 ns and Tg = 35 ns. The bit duration
of optimal pulse is Tb = 40 ns. We assume that the transmitter has the full knowledge
of time delays and attenuations of the channel. The optimal pulse for CM1 channel
model is presented in Fig. 5.5. Firstly, our attention is focused on SNR comparison
between both pulses, i.e Gaussian and optimal pulse. Fig. 5.6 shows the energy of bit
versus the SNR ratio. The gap gain factor between both pulses is equal to 7.85 dBJ. In
107
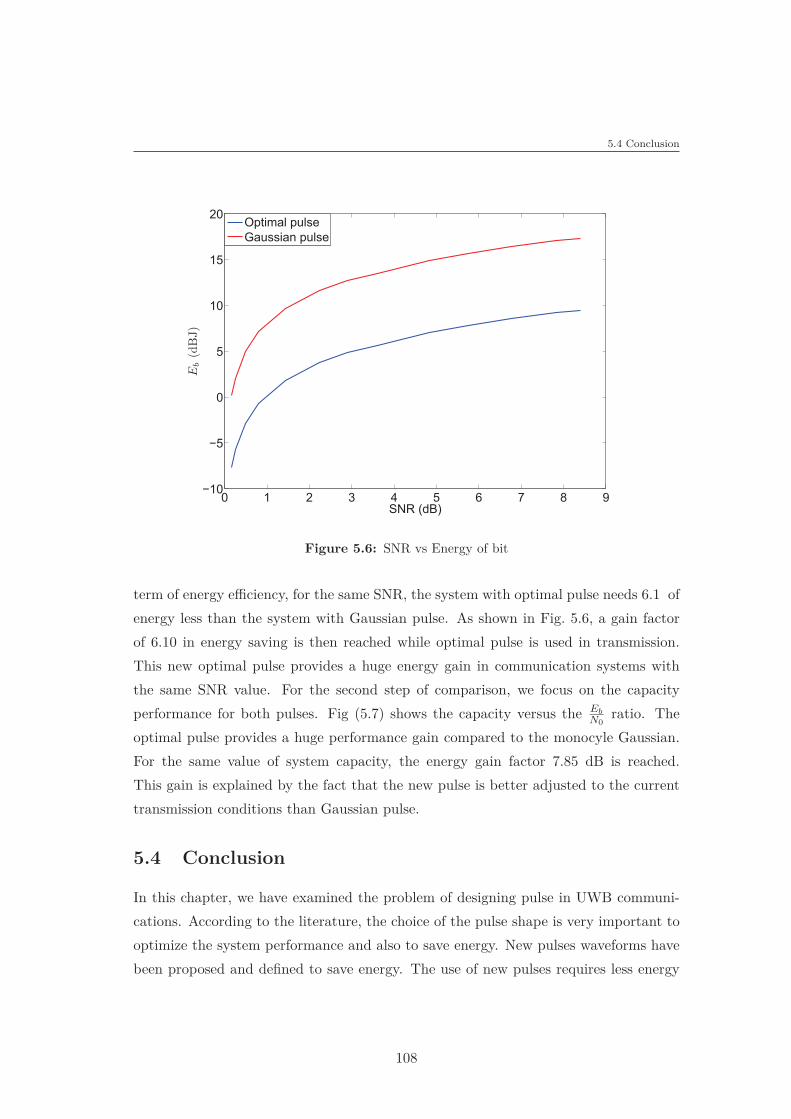
5.4 Conclusion
0 1 2 3 4 5 6 7 8 9 10
5
0
5
10
15
20
SNR!(dB)
Eb(dBJ)
Optimal!pulse
Gaussian!pulse
Figure 5.6: SNR vs Energy of bit
term of energy efficiency, for the same SNR, the system with optimal pulse needs 6.1 of
energy less than the system with Gaussian pulse. As shown in Fig. 5.6, a gain factor
of 6.10 in energy saving is then reached while optimal pulse is used in transmission.
This new optimal pulse provides a huge energy gain in communication systems with
the same SNR value. For the second step of comparison, we focus on the capacity
performance for both pulses. Fig (5.7) shows the capacity versus the Eb
N0ratio. The
optimal pulse provides a huge performance gain compared to the monocyle Gaussian.
For the same value of system capacity, the energy gain factor 7.85 dB is reached.
This gain is explained by the fact that the new pulse is better adjusted to the current
transmission conditions than Gaussian pulse.
5.4 Conclusion
In this chapter, we have examined the problem of designing pulse in UWB communi-
cations. According to the literature, the choice of the pulse shape is very important to
optimize the system performance and also to save energy. New pulses waveforms have
been proposed and defined to save energy. The use of new pulses requires less energy
108
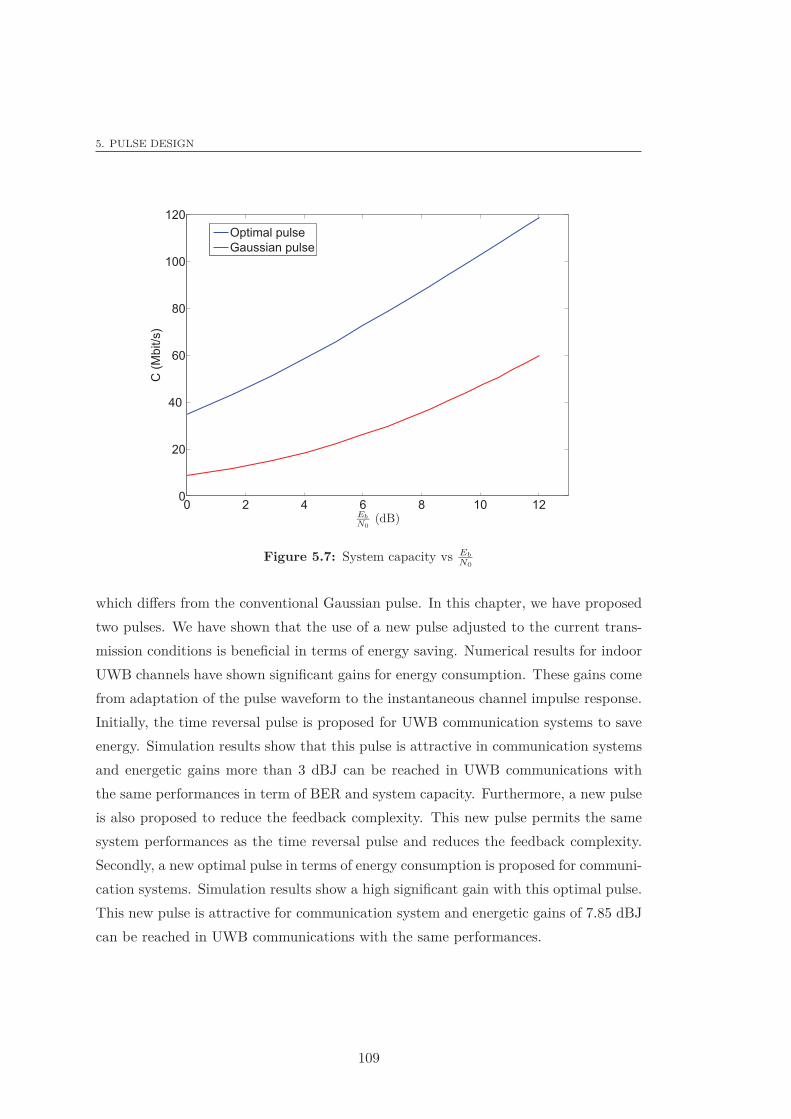
5. PULSE DESIGN
0 2 4 6 8 10 120
20
40
60
80
100
120
Eb
N0
(dB)
C (
Mb
it/s
)
Optimal pulse
Gaussian pulse
Figure 5.7: System capacity vs Eb
N0
which differs from the conventional Gaussian pulse. In this chapter, we have proposed
two pulses. We have shown that the use of a new pulse adjusted to the current trans-
mission conditions is beneficial in terms of energy saving. Numerical results for indoor
UWB channels have shown significant gains for energy consumption. These gains come
from adaptation of the pulse waveform to the instantaneous channel impulse response.
Initially, the time reversal pulse is proposed for UWB communication systems to save
energy. Simulation results show that this pulse is attractive in communication systems
and energetic gains more than 3 dBJ can be reached in UWB communications with
the same performances in term of BER and system capacity. Furthermore, a new pulse
is also proposed to reduce the feedback complexity. This new pulse permits the same
system performances as the time reversal pulse and reduces the feedback complexity.
Secondly, a new optimal pulse in terms of energy consumption is proposed for communi-
cation systems. Simulation results show a high significant gain with this optimal pulse.
This new pulse is attractive for communication system and energetic gains of 7.85 dBJ
can be reached in UWB communications with the same performances.
109

Conclusion and perspectives
This thesis primarily investigated various resource allocation and pulse design optimiza-
tion strategies in order to enhance the energy of single carrier and multi-carrier sys-
tems, so that they can be efficiently used in future wireless and wired communications.
Theoretical studies were performed to lay the fundamentals of energy consumption in
communication systems. Several new ideas were presented such as new UWT approach
proposed for communication systems aiming at minimizing energy, energy efficiency
metric, green resource allocation, system parameters optimization in UWB and new
optimal pulses for energy minimization.
The first two chapters of this document have been devoted to the presentation of
the context of the study and the specifications of the implemented systems. The first
chapter has given us the opportunity to become familiar with the subject of the study.
We first presented ICT sector, its impact and importance in modern society. We defined
the term and stated that the ICT scope of our study. After, we have emphasized
the environmental and energy context of ICT. We presented a general overview of
green technologies. These new green technologies attract the attention of both business
and research communities. Several statistics of ICT energy consumption were then
presented. Recent developments in ICT sector were also highlighted with a description
of various trends and solutions working for the enhancement of energy consumption
over wireless and wired communications. In the second chapter, WiMAX, PLC and
UWB technologies have been described with a focus on the main characteristics of
the transmission channels. On the other hand, we presented the principles of the
main transmission techniques we are dealing with in this thesis, mainly the OFDM
schemes. After reviewing techniques, multi-carrier modulation was described in detail
with its parameters. Besides, we described the two main modulation schemes considered
for UWB systems: the MB-OFDM and impulse UWB techniques. The MB-OFDM
111
approach is based on the combination of OFDM with a multi-band technique. At the
end of the second chapter, we introduced the general problem of resources allocation
by presenting the principles, in particular in optimization policies. Then, an overview
of energy consumption in WiMAX and PLC systems is provided.
Chapter 3 primarily focused on the energy optimization problem. We have examined
the energy consumption problem in a single user context for single carrier and multi-
carrier systems. The asymptotic limit of energy consumption for both systems has been
provided. This analysis is independent of the technologies constraint. The presented
results give the fundamental energy material of a general class with single and parallel
channels. A new approach, called UWT, and a new energy efficiency metric have been
proposed and defined to save energy. The use of UWT approach provides the lower
bound of transmitted energy consumption which differs from the conventional solutions.
New allocation algorithms for bits and energy have been developed and formed the basis
for multi-carrier systems. In addition, performances of these allocations were compared
with those of conventional WiMAX and PLC systems. It was shown that proposed
algorithms perform better than existing allocations in terms of energy consumption.
In Chapter 4, we have investigated the aspect of pulse design in UWB communi-
cation systems. This chapter was divided in three parts. In the first part, we focused
on energy minimization. According to the literature, the second derivative Gaussian
pulse is used in the low power environment, or low energy. In this way, we studied and
investigated the system parameters for monocycle Gaussian pulse. The main objective
of this study was to obtain the optimal system parameters for a given target energy
efficiency. This study also offers a wide variety of combination system parameters that
can be chosen depending on the desired system constraints. Chapter 4 introduced an
entirely new way for system parameters, where energy consumption of the system is
minimized to enhance the system performances. The second part of Chapter 4 ex-
tended the UWB study to capacity maximization. A theoretical study was performed
for UWB systems to maximize the capacity and energy distribution. We have shown
that the use of a guard time adjusted to the current transmission conditions is benefi-
cial in terms of achievable system capacity. We have considered constrained capacity
for the guard time designing. A low complexity system and simplified parameter to
select the guard time is introduced. To this end, the optimization method is proposed.
112
Conclusion and perspectives
The parameter values for all channel models are provided. Furthermore, we have com-
pared all parameters. Numerical results for typical indoor UWB channels have shown
significant gains due to guard time adaptation. These gains come from adjusting the
guard time according to the instantaneous channel impulse response. In the last part of
this chapter, we focused on MB-UWB communications. A new algorithm for resource
allocation is proposed to increase the energy efficiency of the system. Bit and energy al-
gorithms were also discussed in combination of simple approach and simulation results
were presented.
In Chapter 5, we extended the study of pulse design and energy optimization for
UWB systems. In this chapter, we introduced energy optimization taking into account
the SNR constraint. Two pulses were proposed, one for time reversal and the other for
optimal energy systems in the context of UWB communications. It was shown that
proposed pulses provide significant gain for UWB communications. They give better
system capacity performance for low values of bit energy.
Many prospects can be listed for future works based on this thesis:
• The work carried out in this thesis has focused on energy consumption for commu-
nication systems without taking into account the energy consumption for practical
systems. However, this work may be extended to a practical system taking into
account the system energy consumption.
• The resource allocation algorithms focus only on the physical layer. An interesting
future work would be to implement and test these algorithms in the final OFDM
systems. Besides, these algorithms could be combined within enhanced cross layer
mechanisms in order to improve the system performance, while respecting the QoS
requirements and constraints provided by the MAC layer. Thus, dynamic cross-
layer spectrum allocation for high data rate systems could be developed without
notably increasing the system complexity. Furthermore, the resource allocation
algorithms with multi-user scenario should be developed.
• The resource allocation schemes may be extended to the case of imperfect CSI
consideration.
• In this thesis, two degrees of freedom (time and frequency) have been exploited. In
this way, an additional degree of freedom for communication systems can improve
113
the energy efficiency. Thus, the exploitation of the space-time-frequency domain
for high data rate systems could be developed without notably increasing the
system complexity.
• The proposed pulse design optimization takes into account the SNR value in order
to enhance the energy efficiency. To develop a new pulse taking into account other
performance criteria as system capacity will lead to the propose of a new pulses
for UWB communications.
114
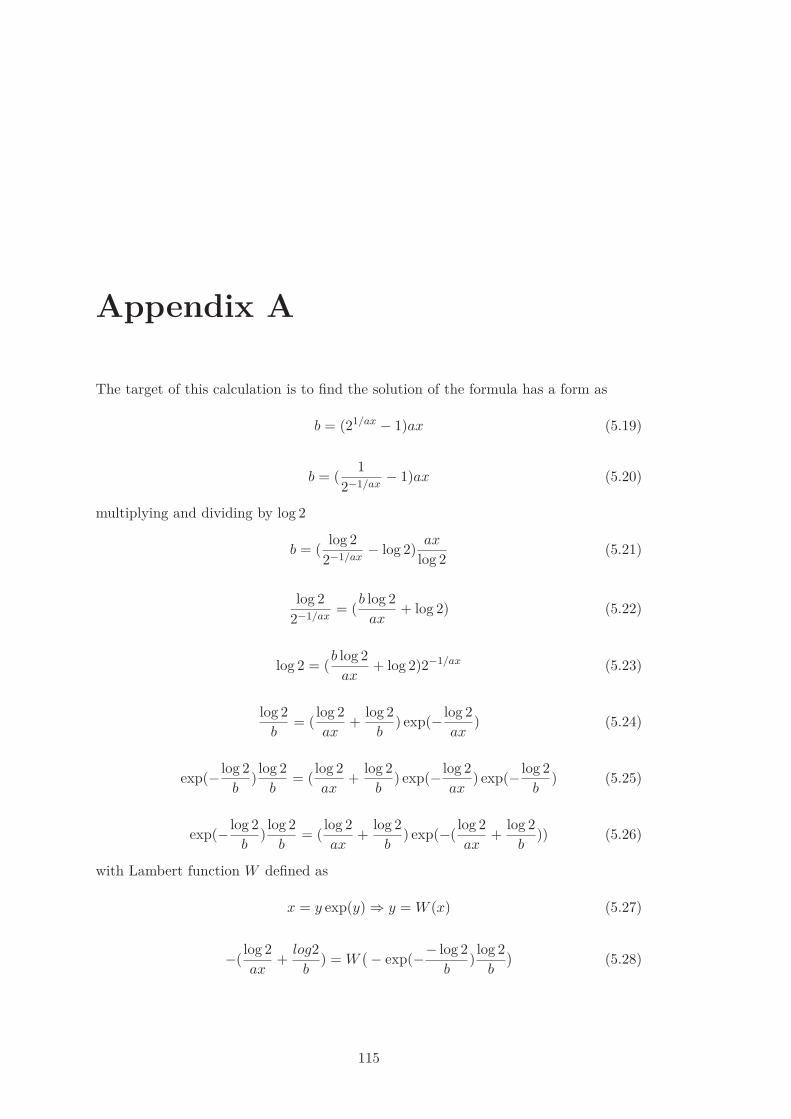
Appendix A
The target of this calculation is to find the solution of the formula has a form as
b = (21/ax − 1)ax (5.19)
b = (1
2−1/ax− 1)ax (5.20)
multiplying and dividing by log 2
b = (log 2
2−1/ax− log 2)
ax
log 2(5.21)
log 2
2−1/ax= (
b log 2
ax+ log 2) (5.22)
log 2 = (b log 2
ax+ log 2)2−1/ax (5.23)
log 2
b= (
log 2
ax+
log 2
b) exp(− log 2
ax) (5.24)
exp(− log 2
b)log 2
b= (
log 2
ax+
log 2
b) exp(− log 2
ax) exp(− log 2
b) (5.25)
exp(− log 2
b)log 2
b= (
log 2
ax+
log 2
b) exp(−(
log 2
ax+
log 2
b)) (5.26)
with Lambert function W defined as
x = y exp(y) ⇒ y = W (x) (5.27)
−(log 2
ax+
log2
b) = W
(
− exp(−− log 2
b)log 2
b
)
(5.28)
115
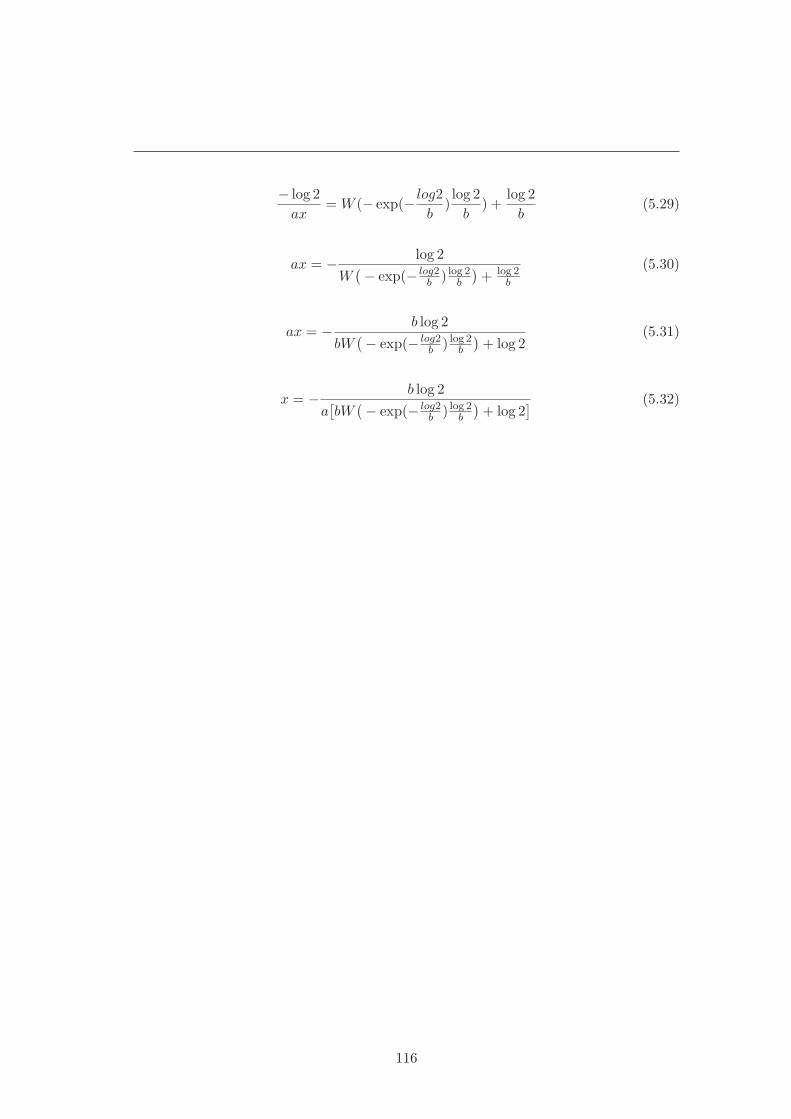
− log 2
ax= W (− exp(− log2
b)log 2
b) +
log 2
b(5.29)
ax = − log 2
W(
− exp(− log2b ) log 2
b
)
+ log 2b
(5.30)
ax = − b log 2
bW(
− exp(− log2b ) log 2
b
)
+ log 2(5.31)
x = − b log 2
a[
bW(
− exp(− log2b ) log 2
b
)
+ log 2]
(5.32)
116
Appendix B
Capacity
Let us first consider BPSK signaling, for which we have the channel model
Y =√
EsX + N, X ∈ {−1, +1}, N ∼ N(0, σ2) (5.33)
that the mutual information I(X,Y), subject to the constraint of BPSK signaling, is
maximized for equiprobable signaling. Let us now compute the mutual information
I(X,Y) as a function of the signal power Es and the noise power σ2. We first show that,
as with the capacity without an input alphabet constraint, the capacity for BPSK also
depends on these parameters only through their ratio, the SNR Es/σ2. To show this,
replace Y by Y/σ to get the model
Y =√
SNR X + N, N ∼ N(0, σ2) (5.34)
For notational simplicity, set A =√
SNR. We have
p(Y | + 1) =1√2π
exp (−(Y − A)2/2) (5.35)
p(Y | − 1) =1√2π
exp (−(Y + A)2/2) (5.36)
and
p(Y ) =1
2p(Y | + 1) +
1
2p(Y | − 1) (5.37)
117
p(Y ) =1
2
1√2π
2∑
s=1
exp (−(Y + bsA)2/2) (5.38)
where bs = {−1, 1}We can now compute
I(X, Y ) = h(Y ) − h(Y, X) (5.39)
As on [124], we can show that h(Y |X) = h(Z) = 1/2 log2(2πe). We can now compute
h(Y ) = −∫
log2(p(Y ))p(Y ) (5.40)
by numerical integration, plugging in (5.36). An alternative approach, which is partic-
ularly useful for more complicated constellations and channel models, is to use Monte
Carlo integration (i.e., simulation-based empirical averaging) for computing the expec-
tation h(Y ) = −E[log2 p(Y )]. For this method, we generate i.i.d. samples Yi using the
model (5.34), and then use the estimate
h = − 1
n
n∑
1
log2 p(Yi) (5.41)
then the capacity
C = −E[log2 p(Y )] − 1/2 log2(2πe) (5.42)
C = −E[log2
1
2
1√2π
2∑
i=1
exp (−(Y + biA)2/2)] − 1/2 log2(2πe) (5.43)
Capacity with interference
• One bit of interference
p(Y ) =1
4p(Y |(+1, a1)) +
1
4p(Y |(+1, −a1))
+1
4p(Y |(−1, −a1)) +
1
4p(Y |(−1, a1)) (5.44)
118
Conclusion and perspectives
where a1 is the amplitude interference.
p(Y ) =1
4
1√2π
(
exp −(Y − A + a1)2
2+ exp −(Y − A − a1)2
2
+ exp −(Y + A + a1)2
2+ exp −(Y + A − a1)2
2
)
(5.45)
then
h(Y ) = −E
[
log2
(
1
4
1√2π
(exp −(Y − A + a1)2
2+ exp −(Y − A − a1)2
2
+ exp −(Y + A + a1)2
2+ exp −(Y + A − a1)2
2)
)]
(5.46)
• Two bits of interference
p(Y ) =1
8p(Y |(+1, a1, a2)) +
1
8p(Y |(+1, a1, −a2))
+1
8p(Y |(+1, −a1, −a2)) +
1
8p(Y |(+1, −a1, a2))
+1
8p(Y |(−1, a1, a2)) +
1
8p(Y |(−1, a1, −a2))
+1
8p(Y |(−1, −a1, −a2)) +
1
8p(Y |(−1, −a1, a2)) (5.47)
p(Y ) =1
8
1√2π
(
exp −(Y − A + a1 + a2)2
2+ exp −(Y − A + a1 − a2)2
2
+ exp −(Y − A − a1 − a2)2
2+ exp −(Y − A − a1 + a2)2
2
+ exp −(Y + A + a1 + a2)2
2+ exp −(Y + A + a1 − a2)2
2
+ exp −(Y + A − a1 + a2)2
2+ exp −(Y + A − a1 − a2)2
2
)
(5.48)
then
h(Y ) = −E
[
log2
(
1
8
1√2π
(exp −(Y − A + a1 + a2)2
2+ exp −(Y − A + a1 − a2)2
2
+ exp −(Y − A − a1 − a2)2
2+ exp −(Y − A − a1 + a2)2
2
+ exp −(Y + A + a1 + a2)2
2+ exp −(Y + A + a1 − a2)2
2
+ exp −(Y + A − a1 + a2)2
2+ exp −(Y + A − a1 − a2)2
2)
)]
(5.49)
119
h(Y ) = −E
[
log2
(
1
2n+1
1√2π
2∑
s=1
2n∑
i=1
exp(−(y − bsA +
∑nj=1 ajαj,i)
2
2)
)]
(5.50)
the capacity for interference
C = −E
[
log2
(
1
2n+1
1√2π
2∑
s=1
2n∑
i=1
exp(−(y − bsA +
∑nj=1 ajαj,i)
2
2)
)]
− 1/2 log2(2πe)
(5.51)
where n is the number of bit interference, aj is the interference amplitude of j
bit, αj,i is the matrix of possible case of interference with a dimension {n, 2n}and bs = {−1, 1}. As example for n = 2:
αj,i =
+1 −1+1 +1−1 +1−1 −1
(5.52)
120
Bibliography
[1] M. Haardt, “Future mobile and wireless radio systems: Challenges in european
research,” The European Commission, Tech. Rep., 2008.
[2] W. H. Melody, R. E. Mansell, and B. J. Richards, Information and Communica-
tion Technologies: Social Sciences Research and Training: A Report by the ESRC
Programme on Information and Communication Technologies, E. P. on Informa-
tion and C. Technologies, Eds. Economic and Social Research Council, 1986.
[3] Independent ICT in Schools Commission (United Kingdom), “Information and
communications technology in uk schools: an independent inquiry,” Stevenson
Report, Tech. Rep., 1997.
[4] G. Fettweis and E. Zimmermann, “ICT energy consumption – Trends and chal-
lenges,” in The 11th International Symposium on Wireless Personal Multimedia
Communications (WPMC ), 2008, pp. 1–3.
[5] S. Chetan, “GSM technologies to reach 4 billion mobile connections worldwide,”
3G Americas, Tech. Rep., 2007.
[6] [Online]. Available: http://www.internetworldstats.com/stats.htm
[7] M. Debbah, “Mobile flexible networks: The challenges ahead,” in International
Conference on Advanced Technologies for Communications, Oct. 2008, pp. 3–7.
[8] S. G. Glisic, Advanced Wireless Networks 4G Technologiesh. John Wiley & Sons
Ltd, 2006.
[9] H. Breuil, D. Burettea, and B. Flury-Hérard, “ICT and sustainable development,”
Ministry of Ecology, Energy, Sustainable Development and territory Planning,
Tech. Rep., Dec. 2008.
121
BIBLIOGRAPHY
[10] F. Williams, “Green wireless communications,” eMobility, Tech. Rep., 2008.
[11] R. Tafazolli, “Energy aware radio and network technologies,” in Next Generation
Wireless Green Networks Workshop, Nov. 2009.
[12] ——, “Mobile and wireless communications technology platform,” eMobility,
Tech. Rep., 2010.
[13] “ICTs and climate change,” International Telecommunication Union (ITU), Tech.
Rep., Oct. 2008.
[14] S. Armour, S. Fletcher, A. Jeffries, D. Lister, S. McLaughlin, J. Thompson, and
P. Grant, “Green radio: Sustainable wireless networks,” Mobile VCE, Feb. 2009.
[15] I. Oppermann, “Windmills get smart the wider applications of smart telco soft-
ware,” Next Generation Wireless Green Networks Workshop, Nov. 2009.
[16] K. Lahiri, A. Raghunathan, S. Dey, and D. Panigrahi, “Battery-driven system
design: A new frontier in low power design,” National Science Foundation, 2002.
[17] J. Hansen, M. Sato, P. Kharecha, G. Russell, D. W. Lea, and M. Siddall, “Climate
change and trace gases,” Philosophical transactions of the royal society A, vol.
365, pp. 1925–1954, May 2007.
[18] T. Kelly, “ICTs and climate change,” ITU-T Technology, Tech. Rep., Dec. 2007.
[19] “World energy outlook 2010,” International energy agency, Tech. Rep., 2012.
[20] A. Ogasawara, “Energy issues confronting the information and communications
sector: Need to reduce the power consumed by the communications infrastruc-
ture,” Science & technology trends, vol. Quarterly review, no. 21, pp. 32–41, 2006.
[21] M. Parry, O. Canziani, J. Palutikof, P. van der Linden, and C. Hanson, “2007
assessment of climate change: Impacts, adaptation and vulnerability,” Intergov-
ernmental Panel on Climate Change, Tech. Rep., 2007.
[22] R. kuehr and E. Williams, Computers and the Environment: Understanding and
Managing their impacts, Eco efficiency in industry and sciences series, Ed. United
Nation universite, 2004.
122
BIBLIOGRAPHY
[23] H. Karl, “An overview of energy efficiency techniques for mobile communication
systems,” Technical University Berlin, Tech. Rep., 2003.
[24] S. McLaughlin, “Green radio: The key issues programme objectives & overview,”
WWRF–21, Oct. 2008, stockholm.
[25] M. Yousif, “Towards green ICT,” European Research Consortium for Informatics
and Mathematics ERCIM, Oct. 2009.
[26] P. Demestichas, K. Tsagkaris, G. Athanasiou, and Y. Kritikou, “Green footprint
of cognitive management technologies for future networks,” in MIPRO, Proceed-
ings of the 34th International Convention, May 2011, pp. 645–649.
[27] C. Han, T. Harrold, S. Armour, I. Krikidis, S. Videv, P. Grant, H. Haas,
J. Thompson, I. Ku, C.-X. Wang, T. A. Le, M. Nakhai, J. Zhang, and L. Hanzo,
“Green radio: radio techniques to enable energy-efficient wireless networks,”
IEEE Communications Magazine, vol. 49, no. 6, pp. 46–54, Jun. 2011.
[28] J. Chou, “Green IT & virtualization management,” Microsoft Technology Center,
2009.
[29] J. Lin, “Health effects - cellular mobile telephone radiation and intracranial tu-
mors,” IEEE Microwave Magazine, vol. 8, no. 3, pp. 50–52, Jun. 2007.
[30] B. Badic, T. O’Farrell, P. Loskot, and J. He, “Energy efficient radio access ar-
chitectures for green radio: Large versus small cell size deployment,” in IEEE
Vehicular Technology Conference, 2009, pp. 1–5.
[31] Y. Chen, S. Zhang, and S. Xu, “Characterizing energy efficiency and deploy-
ment efficiency relations for green architecture design,” in IEEE International
Conference on Communications (ICC), May 2010, pp. 1–5.
[32] Y. Al-Hazmi and H. de Meer, “Virtualization of 802.11 interfaces for wireless
mesh networks,” in International Conference on Wireless On-Demand Network
Systems and Services (WONS), Jan. 2011, pp. 44–51.
[33] M. Ismail and W. Zhuang, “Network cooperation for energy saving in green radio
communications,” IEEE Wireless Communications, vol. 18, no. 5, pp. 76–81, Oct.
2011.
123
BIBLIOGRAPHY
[34] M. Dohler and Y. Li, Eds., Cooperative communciation hardware, Channel &
PHY. Wiley, 2010.
[35] D. Ezri and S. Shilo, “Green cellular – optimizing the cellular network for minimal
emission from mobile stations,” in IEEE International Conference on Microwaves,
Communications, Antennas and Electronics Systems, Nov. 2009, pp. 1–5.
[36] J. Leon, F. Bader, and M.-S. Alouini, “Per-energy capacity and handoff strate-
gies in macro-femto cells environment,” in IEEE Wireless Communications and
Networking Conference Workshops (WCNCW), Apr. 2012, pp. 1–6.
[37] H. Leem, S. Y. Baek, and D. K. Sung, “The effects of cell size on energy saving,
system capacity, and per-energy capacity,” in IEEE Wireless Communications
and Networking Conference (WCNC), Apr. 2010, pp. 1–6.
[38] T. Chen, H. Kim, and Y. Yang, “Energy efficiency metrics for green wireless
communications,” in International Conference on Wireless Communications and
Signal Processing (WCSP), Oct. 2010, pp. 1–6.
[39] F. Richter, A. J. Fehske, and G. P. Fettweis, “Energy efficiency aspects of base
station deployment strategies for cellular networks,” in IEEE Vehicular Technol-
ogy Conference, Anchorage, Alaska, USA, 2009, pp. 1–5.
[40] J. Akhtman and L. Hanzo, “Power versus bandwidth efficiency in wireless commu-
nications: The economic perspective,” in IEEE Vehicular Technology Conference,
Anchorage, Alaska, USA, 2009.
[41] A. Alimian, B. Nordman, and D. Kharitonov, “Network and telecom equip-
ment - energy and performance assessment,” in Test Procedure and Measurement
Methodology, Nov. 2008.
[42] C. Han and S. Armour, “Adaptive power and resource allocation strategies for
green radio,” in IEEE Global Telecommunications Conference (GLOBECOM),
Dec. 2011, pp. 1–5.
[43] J. Zhang and J. Andrews, “Adaptive spatial intercell interference cancellation in
multicell wireless networks,” IEEE Journal on Selected Areas in Communications,
vol. 28, no. 9, pp. 1455–1468, Dec. 2010.
124
BIBLIOGRAPHY
[44] Huawei, “Energy saving in LTE,” Next Generation Wireless Green Networks
Workshop, Nov. 2009.
[45] L. Zheng, W. Wang, A. Mathewson, B. O’Flynn, and M. Hayes, “An adaptive
transmission power control method for wireless sensor networks,” in IET Irish
Signals and Systems Conference (ISSC), Jun. 2010, pp. 261–265.
[46] R. Oda, T. Ohta, and Y. Kakuda, “A transmission power control adaptive to
variation of node density in mobile ad hoc network clustering,” in Second In-
ternational Conference on Communication Software and Networks, ICCSN, Feb.
2010, pp. 141–146.
[47] M. Abdullah, A. Agalgaonkar, and K. Muttaqi, “Quantification of emission re-
duction from electricity network with the integration of renewable resources,” in
IEEE Power and Energy Society General Meeting, Jul. 2011, pp. 1–7.
[48] L. Mfupe, M. Masonta, T. Olwal, and M. Mzyece, “Dynamic spectrum ac-
cess: regulations, standards and green radio policy considerations,” in South-
ern African Telecommunication Networks and Applications Conference (SATNAC
2012), 2012.
[49] “Green paper on radio spectrum policy,” Commission of the european communi-
ties, Tech. Rep., 1998.
[50] J. palicot, “Cognitive radio: An enabling technology for the green radio commu-
nications concept,” in IWCMC, Leipzig, Germany, Jun. 2009.
[51] F. Haider, C.-X. Wang, X. Hong, H. Harald, D. Yuan, and E. Hepsaydir,
“Spectral-energy efficiency tradeoff in cognitive radio networks with peak inter-
ference power constraints,” in IEEE International Conference on Communication
Technology (ICCT), sept. 2011, pp. 368–372.
[52] C. E. Strinati and G. P., “Green resource allocation for OFDMA wireless cellular
networks,” in IEEE 21st International Symposium on Personal Indoor and Mobile
Radio Communications (PIMRC), 2010, pp. 2775–2780.
125
BIBLIOGRAPHY
[53] C. Comaniciu, N. B. Mandayam, and H. V. Poor, “Radio resource management
for green wireless networks,” in IEEE Vehicular Technology Conference, Anchor-
age, Alaska, USA, Sep. 2009, pp. 1–5.
[54] C. Han and S. Armour, “Energy efficient radio resource management strategies
for green radio,” IET Communications, vol. 5, no. 18, pp. 2629–2639, 2011.
[55] A. Goldsmith and S. Wicker, “Design challenges for energy-constrained ad hoc
wireless networks,” IEEE Wireless Communications, vol. 9, no. 4, pp. 8–27, Aug.
2002.
[56] S. Verdu, “Spectral efficiency in the wideband regime,” IEEE Transactions on
Information Theory, vol. 48, no. 6, pp. 1319–1343, Jun. 2002.
[57] M. Doelz, E. Heald, and D. Martin, “Binary data transmission techniques for
linear systems,” Proceedings of the IRE, vol. 45, no. 5, pp. 656–661, May 1957.
[58] R. van Nee, G. Awater, M. Morikura, H. Takanashi, M.Webster, and K. Halford,
“New high-rate wireless LAN standards,” in IEEE Communications Magazine,
vol. 37, no. 12, 1999, pp. 82–88.
[59] R. Van Nee, “A new OFDM standard for high rate wireless LAN in the 5 GHz
band,” in IEEE Vehicular Technology Conference, vol. 1, 1999, pp. 258–262.
[60] R. Chang and R. Gibby, “A theoretical study of performance of an orthogonal
multiplexing data transmission scheme,” IEEE Transactions on Communication
Technology, vol. 16, no. 4, pp. 529–540, Aug. 1968.
[61] J. Proakis, Digital communication. Wiley, 2002.
[62] B. Le Floch, M. Alard, and C. Berrou, “Coded orthogonal frequency division
multiplex,” Proceedings of the IEEE, vol. 83, no. 6, pp. 982–996, Jun. 1995.
[63] R. Annauth and H. Rughooputh, “Evolutionary multi-objective approach for re-
source allocation in OFDM systems,” in Fourth International Joint Conference
on Computational Sciences and Optimization (CSO), Apr. 2011, pp. 195–199.
126
BIBLIOGRAPHY
[64] D. P. Palomar, A. Pascual-Iserte, J. M. Cioffi, and M. A. Lagunas, Convex op-
timization theory applied to joint transmitter-receiver design in MIMO channels.
John Wiley & Sons, 2005, in Space Time Processing for MIMO Communications.
[65] C. Y. Wong, R. Cheng, K. Lataief, and R. Murch, “Multiuser OFDM with adap-
tive subcarrier, bit, and power allocation,” IEEE Journal on Selected Areas in
Communications, vol. 17, no. 10, pp. 1747–1758, Oct. 1999.
[66] W. Rhee and J. Cioffi, “Increase in capacity of multiuser OFDM system using
dynamic subchannel allocation,” in IEEE Vehicular Technology Conference Pro-
ceedings, vol. 2, 2000, pp. 1085–1089.
[67] A. Leke and J. Cioffi, “A maximum rate loading algorithm for discrete multitone
modulation systems,” in IEEE Global Telecommunications Conference (GLOBE-
COM), vol. 3, Nov. 1997, pp. 1514–1518.
[68] J. Jiho and K. B. Lee, “Transmit power adaptation for multiuser OFDM systems,”
IEEE Journal on Selected Areas in Communications, vol. 21, no. 2, pp. 171–178,
Feb. 2003.
[69] T. W. Barrett, “History of ultrawideband (UWB) radar & communications: Pio-
neers and innovatorst,” in Progress In Electromagnetics Symposium, Cambridge,
Jul. 2000.
[70] J. D. Taylor, Introduction to Ultra-Wideband Radar Systems. Boca Raton, FL:
CRC Press, 1995.
[71] C. Shannon, “A mathematical theory of communication,” The Bell System Tech-
nical Journal, vol. 27, pp. 379–423, Jul. 1948.
[72] F. Nekoogar, Ultra-Wideband Communications: Fundamentals and Applications.
Prentice Hall, 2006.
[73] I. Oppermann, M. Hamalainen, and J. Iinatti, Eds., UWB Theory and Applica-
tions. John Wiley & Sons Ltd, 2004.
[74] J. Gerrits and J. Farserotu, “Wavelet generation circuit for UWB impulse radio
applications,” Electronics Letters, vol. 38, no. 25, pp. 1737–1738, Dec. 2002.
127
BIBLIOGRAPHY
[75] Time Domain Corporation, “Comments of time domain corporation, docket 98-
154. in the matter of revision of part 15 of the FCC rules regarding ultra wide-
band transmission systems,” 1998.
[76] X. Chen and S. Kiaei, “Monocycle shapes for ultra wideband system,” in IEEE
International Symposium on Circuits and Systems, vol. 1, 2002, pp. 597–600.
[77] H. Nikookar and R. Prasad, Intorduction to ultra wideand for wireless commun-
ciation. Springer, 2009.
[78] M. Win and R. Scholtz, “Impulse radio: how it works,” IEEE Communications
Letters, vol. 2, no. 2, pp. 36–38, Feb. 1998.
[79] A. M. Tonello and R. Rinaldo, “Frequency domain channel estimation and de-
tection for impulse radio systems,” in WPMC, Italy, Sep. 2004.
[80] K. Bai, Ultra-Wideband Technology And Wireless Sensor Networks: Acquisition
And Distributed Inference. ProQuest, 2008.
[81] K. Fazel, “Performance of convolutionally coded CDMA/OFDM in a frequency-
time selective fading channel and its near-far resistance,” in IEEE International
Conference on Communications (ICC), May 1994, pp. 1438–1442.
[82] V. Somayazulu, J. Foerster, and S. Roy, “Design challenges for very high data rate
UWB systems,” in Conference Record of the Thirty-Sixth Asilomar Conference
on Signals, Systems and Computers, vol. 1, Nov. 2002, pp. 717–721.
[83] A. Batra, J. Balakrishnan, G. Aiello, J. Foerster, and A. Dabak, “Design of a
multiband OFDM system for realistic UWB channel environments,” IEEE Trans-
actions on Microwave Theory and Techniques, vol. 52, no. 9, pp. 2123–2138, Sep.
2004.
[84] A. B. et al, “TI physical layer proposal for IEEE 802.15 task group 3a,” IEEE
P802.15-03/142r2-TG3a, Mar. 2003.
[85] High rate ultra wideband PHY and MAC standard, Standard ECMA-368 Std.,
Dec. 2005.
128
BIBLIOGRAPHY
[86] R. Aiello and A. Batra, “Ultra wideband systems: Technologies and applications,”
Communications Engineering Series,Newnes, 2006.
[87] D. Valderas, J. I. Sancho, D. Puente, C. Ling, and X. Chen, Eds., Ultra Wideband
Antennas design and applications. Imperial college press, 2011.
[88] J. G. Andrews, A. Ghosh, and R. Muhamed, Fundamentals of WiMAX Under-
standing Broadband Wireless Networking. Prentic hall, 2008.
[89] Standard for Local and metropolitan area networks, LAN/MAN Standards Com-
mittee of the IEEE Computer Society Std., Oct. 2008.
[90] C. So-In, R. Jain, and A.-K. Tamimi, “Scheduling in ieee 802.16e mobile WiMAX
networks: key issues and a survey,” IEEE Journal on Selected Areas in Commu-
nications, vol. 27, no. 2, pp. 156–171, Feb. 2009.
[91] J. Baliga, R. Ayre, W. Sorin, K. Hinton, and R. Tucker, “Energy consumption in
access networks,” inOptical Fiber communication/National Fiber Optic Engineers
Conference, Feb. 2008, pp. 1–3.
[92] J. Baliga, R. Ayre, K. Hinton, and R. Tucker, “Energy consumption in wired and
wireless access networks,” IEEE Communications Magazine, vol. 49, no. 6, pp.
70–77, Jun. 2011.
[93] C. Lange, D. Kosiankowski, R. Weidmann, and A. Gladisch, “Energy consump-
tion of telecommunication networks and related improvement options,” IEEE
Journal of Selected Topics in Quantum Electronics, vol. 17, no. 2, pp. 285–295,
Mar.-Apr. 2011.
[94] Y. J. Zhang and K. Letaief, “Multiuser adaptive subcarrier and bit allocation
with adaptive cell selection for OFDM systems,” IEEE Transactions on Wireless
Communications, vol. 3, no. 5, pp. 1566–1575, 2004.
[95] [Online]. Available: https://www.homeplug.org/home/
[96] M. Zimmermann and K. Dostert, “A multipath model for the powerline channel,”
IEEE Transactions on Communications, vol. 50, no. 4, pp. 553–559, Apr. 2002.
129
BIBLIOGRAPHY
[97] H. Philipps, “Modeling of power line communications channels,” in IEEE In-
ternational Symposium on Power Line Communications and Its Applications,
Lancaster, Apr. 1999, pp. 14–21.
[98] O. Hooijen, “On the relation between network topology and power line signal
attenuation,” in IEEE International Symposium on Power Line Communications
and Its Applications, Tokyo, Japan, Mar. 1998, pp. 45–56.
[99] S. Galli and T. Banwell, “Modeling the indoor power line channel: new results
and modem design considerations,” in IEEE Consumer Communications and
Networking Conference (CCNC), Jan. 2004, pp. 25–30.
[100] M. Tlich, P. Pagani, G. Avril, F. Gauthier, A. Zeddam, A. Kartit, O. Isson,
A. Tonello, F. Pecile, S. D’Alessandro, T. Zheng, M. Biondi, G. Mijic, K. Kriznar,
J.-Y. Baudais, and A. Maiga, “PLC channel characterization and modelling,”
OMEGA project, Tech. Rep., 2009.
[101] T. Waldeck, M. Busser, and K. Dostert, “Telecommunication applications over
the low voltage power distribution grid,” in International Symposium on Spread
Spectrum Techniques and Applications, vol. 1, Sep. 1998, pp. 73–77.
[102] M. Crussiere, J.-Y. Baudais, and J.-F. Helard, “Adaptive spread-spectrum multi-
carrier multiple-access over wirelines,” IEEE Journal on Selected Areas in Com-
munications, vol. 24, no. 7, pp. 1377–1388, Jul. 2006.
[103] A. Maiga, J.-Y. Baudais, and J.-F. Hélard, “Very high bit rate power line com-
munications for home networks,” in Internation Symposium on Power Line Com-
munications, Dresden, Germany, Mar. 2009, pp. 313–318.
[104] J. Zyren, “Homeplug green PHY overview,” Atheros Communications, Tech.
Rep., May 2010.
[105] D. Cassioli, M. Win, and A. Molisch, “The ultra-wide bandwidth indoor chan-
nel: from statistical model to simulations,” IEEE Journal on Selected Areas in
Communications, vol. 20, no. 6, pp. 1247–1257, Aug. 2002.
130
BIBLIOGRAPHY
[106] M. Win and R. Scholtz, “On the robustness of ultra-wide bandwidth signals in
dense multipath environments,” IEEE Communications Letters, vol. 2, no. 2, pp.
51–53, 1998.
[107] ——, “Characterization of ultra-wide bandwidth wireless indoor channels: a
communication-theoretic view,” IEEE Journal on Selected Areas in Communi-
cations, vol. 20, no. 9, pp. 1613–1627, Dec. 2002.
[108] J. Foerster, “The effects of multipath interference on the performance of UWB
systems in an indoor wireless channel,” in IEEE Vehicular Technology Conference,
vol. 2, 2001, pp. 1176–1180.
[109] ——, “Channel modeling sub-comittee report final,” IEEE P802.15 Working
Journal on Selected Areas in Communications (WPANs), Tech. Rep., Feb. 2003.
[110] A. Saleh and R. Valenzuela, “A statistical model for indoor multipath propa-
gation,” IEEE Journal on Selected Areas in Communications, vol. 5, no. 2, pp.
128–137, Feb. 1987.
[111] S. Draper, L. Liu, A. Molisch, and J. Yedidia, “Routing in cooperative wireless
networks with mutual-information accumulation,” in IEEE International Confer-
ence on Communications (ICC), May 2008, pp. 4272–4277.
[112] R. Bolla, R. Bruschi, F. Davoli, and F. Cucchietti, “Energy efficiency in the
future internet: A survey of existing approaches and trends in energy-aware fixed
network infrastructures,” IEEE Communications Surveys Tutorials, vol. 13, no. 2,
pp. 223–244, quarter 2011.
[113] K. Fall, “A delay-tolerant network architecture for challenged internets, intel re-
search,” in Conference on Applications, Technologies, Architectures, and Protocols
for Computer Communication, Karlsruhe, Germany, Aug. 2003.
[114] A. Hamini, J.-Y. Baudais, and J.-F. Helard, “Best effort communications with
green metrics,” in IEEE Wireless Communications and Networking Conference
(WCNC), Mar. 2011, pp. 1346–1351.
131
BIBLIOGRAPHY
[115] Y. Polyanskiy, H. V. Poor, and S. Verdu, “Minimum energy to send k bits with
and without feedback,” in IEEE International Symposium on Information Theory
Proceedings (ISIT), Jun. 2010, pp. 221–225.
[116] V. Rodoplu and T. Meng, “Bits-per-joule capacity of energy-limited wireless net-
works,” IEEE Transactions on Wireless Communications, vol. 6, no. 3, pp. 857–
865, march 2007.
[117] M.-S. Alouini and A. J. Goldsmith, “Capacity of rayleigh fading channels un-
der different adaptive transmission and diversity–combining techniques,” IEEE
Transactions on Vehicular Technology, vol. 48, no. 4, pp. 1165–1181, Jul. 1999.
[118] Z.-Q. Luo and W. Yu, “An introduction to convex optimization for communica-
tions and signal processing,” IEEE Journal on Selected Areas in Communications,
vol. 24, no. 8, pp. 1426–1438, Aug. 2006.
[119] M. Ghavami, L. B. Michael, and R. Kohno, Ultra wide band: signal and systems
in communication engineering. Willey, 2007.
[120] L. Yang and G. Giannakis, “Ultra-wideband communications: an idea whose time
has come,” IEEE Signal Processing Magazine, vol. 21, no. 6, pp. 26–54, Nov. 2004.
[121] K. Witrisal, “Noncoherent autocorrelation detection of orthogonal multicarrier
UWB signals,” in IEEE International Conference on Ultra-Wideband, vol. 2,
2008, pp. 161–164.
[122] Z. Zhao-yang and L. Li-feng, “A novel OFDM transmission scheme with length-
adaptive cyclic prefix,” Journal of Zhejiang University SCIENCE, vol. 2004, pp.
1336–1342, 2004.
[123] A. Tonello, S. D’Alessandro, and L. Lampe, “Cyclic prefix design and allocation in
bit-loaded OFDM over power line communication channels,” IEEE Transactions
on Communications, vol. 58, no. 11, pp. 3265–3276, Nov. 2010.
[124] U. Madhow, Fundamental of digital communication. Cambridge University
Press, 2008.
[125] A. Goldsmith, Wireless Communication. Stanford University, 2005.
132
BIBLIOGRAPHY
[126] B. Berksoy and L. Wei, “Pulse waveform optimization for UWB systems with
PPM on Gaussian channels,” in IEEE Vehicular Technology Conference, vol. 5,
Oct. 2003, pp. 3174–3178.
[127] X. Luo, L. Yang, and G. Giannakis, “Designing optimal pulse-shapers for ultra-
wideband radios,” in IEEE Conference on Ultra Wideband Systems and Tech-
nologies, Nov. 2003, pp. 349–353.
[128] D. Wentzloff, F. Lee, D. Daly, M. Bhardwaj, P. Mercier, and A. Chandrakasan,
“Energy efficient pulsed-uwb cmos circuits and systems,” in IEEE International
Conference on Ultra-Wideband ICUWB, 2007, pp. 282 –287.
[129] S. M. Emami, J. Hansen, S. Member, A. D. Kim, G. Papanicolaou, A. J. Paulraj,
D. Cheung, and C. Prettie, “Predicted time reversal performance in wireless
communications using channel measurements,” IEEE Communications Letters,
2002.
133