Embed Size (px)
Citation preview
Measuring Generalisation to Unseen Viewpoints,Articulations, Shapes and Objects for 3D HandPose Estimation under Hand-Object Interaction
Anil Armagan1, Guillermo Garcia-Hernando1,2, Seungryul Baek1,20, ShreyasHampali3, Mahdi Rad3, Zhaohui Zhang4, Shipeng Xie4, MingXiu Chen4, BoshenZhang5, Fu Xiong6, Yang Xiao5, Zhiguo Cao5, Junsong Yuan7, Pengfei Ren8,Weiting Huang8, Haifeng Sun8, Marek Hruz9, Jakub Kanis9, Zdenek Krnoul9,
Qingfu Wan10, Shile Li11, Linlin Yang12, Dongheui Lee11, Angela Yao13, WeiguoZhou14, Sijia Mei14, Yunhui Liu15, Adrian Spurr16, Umar Iqbal17, Pavlo
Molchanov17, Philippe Weinzaepfel18, Romain Bregier18, Gregory Rogez18,Vincent Lepetit3,19, and Tae-Kyun Kim1,21
Abstract. We study how well different types of approaches generalise inthe task of 3D hand pose estimation under single hand scenarios and hand-object interaction. We show that the accuracy of state-of-the-art methodscan drop, and that they fail mostly on poses absent from the training set.Unfortunately, since the space of hand poses is highly dimensional, it isinherently not feasible to cover the whole space densely, despite recentefforts in collecting large-scale training datasets. This sampling problemis even more severe when hands are interacting with objects and/orinputs are RGB rather than depth images, as RGB images also vary withlighting conditions and colors. To address these issues, we designed apublic challenge (HANDS’19) to evaluate the abilities of current 3D handpose estimators (HPEs) to interpolate and extrapolate the poses of atraining set. More exactly, HANDS’19 is designed (a) to evaluate theinfluence of both depth and color modalities on 3D hand pose estimation,under the presence or absence of objects; (b) to assess the generalisationabilities w.r.t . four main axes: shapes, articulations, viewpoints, andobjects; (c) to explore the use of a synthetic hand models to fill thegaps of current datasets. Through the challenge, the overall accuracy hasdramatically improved over the baseline, especially on extrapolation tasks,from 27mm to 13mm mean joint error. Our analyses highlight the impactsof: Data pre-processing, ensemble approaches, the use of a parametric 3Dhand model (MANO), and different HPE methods/backbones.
1Imperial College London, 2Niantic, Inc., 3Graz Uni. of Technology, 4Rokid Corp.Ltd., 5HUST, 6Megvii Research Nanjing, 7SUNY Buffalo, 8BUPT,9Uni. of WestBohemia, 10Fudan Uni., 11TUM, 12Uni. of Bonn, 13NUS, 14Harbin Inst. of Technology,15CUHK, 16ETH Zurich, 17NVIDIA Research, 18NAVER LABS Europe, 19ENPCParisTech, 20UNIST, 21KAIST.Challenge webpage: https://sites.google.com/view/hands2019/challenge
arX
iv:2
003.
1376
4v2
[cs
.CV
] 1
0 Se
p 20
20
2 Armagan et al.
1 Introduction
3D hand pose estimation is crucial to many applications including naturaluser-interaction in AR/VR, robotics, teleoperation, and healthcare. The recentsuccesses primarily come from large-scale training sets [48], deep convolutionalneural networks [11,25], and fast optimisation for model fitting [17,26]. State-of-the-art methods now deliver satisfactory performance for viewpoints seenat training time and single hand scenarios. However, as we will show, thesemethods substantially drop accuracy when applied to egocentric viewpoints forexample, and in the presence of significant foreground occlusions. These cases arenot well represented on the training sets of existing benchmarks [6,23,24]. Thechallenges become even more severe when we consider RGB images and hand-object interaction scenarios. These issues are well aligned with the observationsfrom the former public challenge HANDS’17 [47]: The state-of-the-art methodsdropped accuracy from frontal to egocentric views, and from open to closure handpostures. The average accuracy was also significantly lower under hand-objectinteraction [6].
Given the difficulty to interpolate and extrapolate poses from the training set,one may opt for creating even larger training sets. Unfortunately, an inherentchallenge in 3D hand pose estimation is the very high dimensionality of theproblem, as hand poses, hand shapes and camera viewpoints have a large numberof degrees-of-freedom that can vary independently. This complexity increaseseven more when we consider the case of a hand manipulating an object. Despitethe recent availability of large-scale datasets [48], and the development of com-plex calibrated multi-view camera systems to help the annotation or synthetic
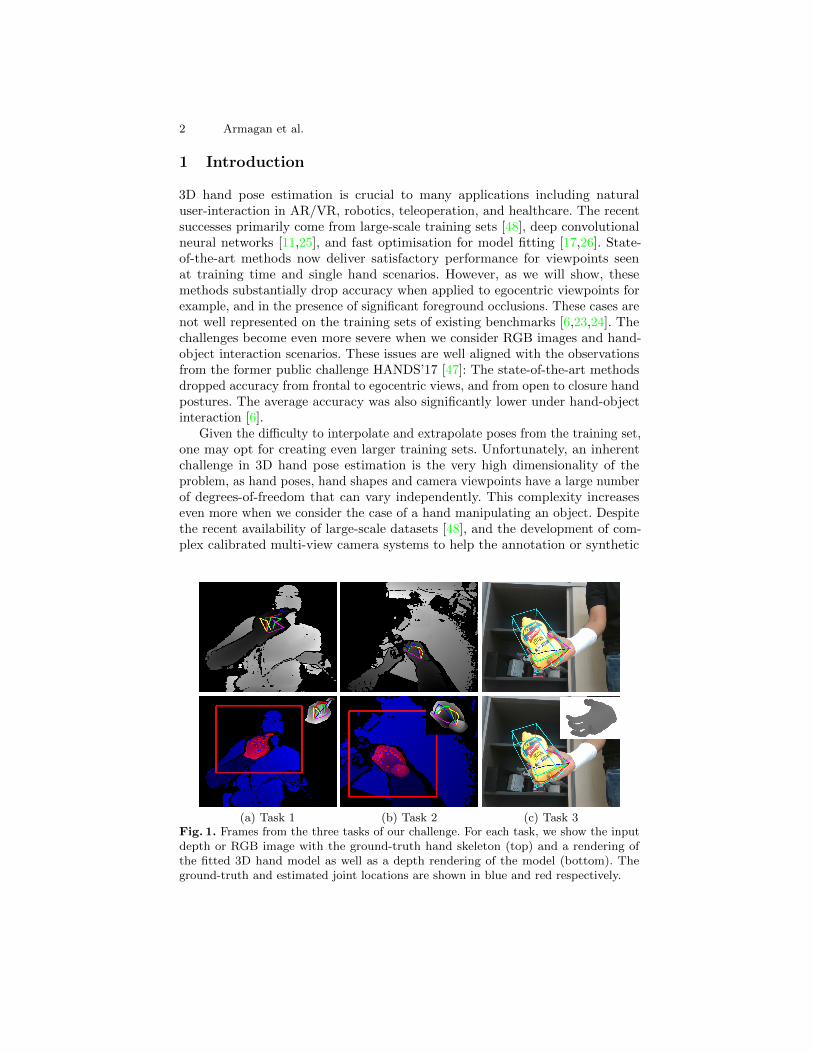
(a) Task 1 (b) Task 2 (c) Task 3Fig. 1. Frames from the three tasks of our challenge. For each task, we show the inputdepth or RGB image with the ground-truth hand skeleton (top) and a rendering ofthe fitted 3D hand model as well as a depth rendering of the model (bottom). Theground-truth and estimated joint locations are shown in blue and red respectively.
Measuring Generalisation for 3D Hand Pose Estimation 3
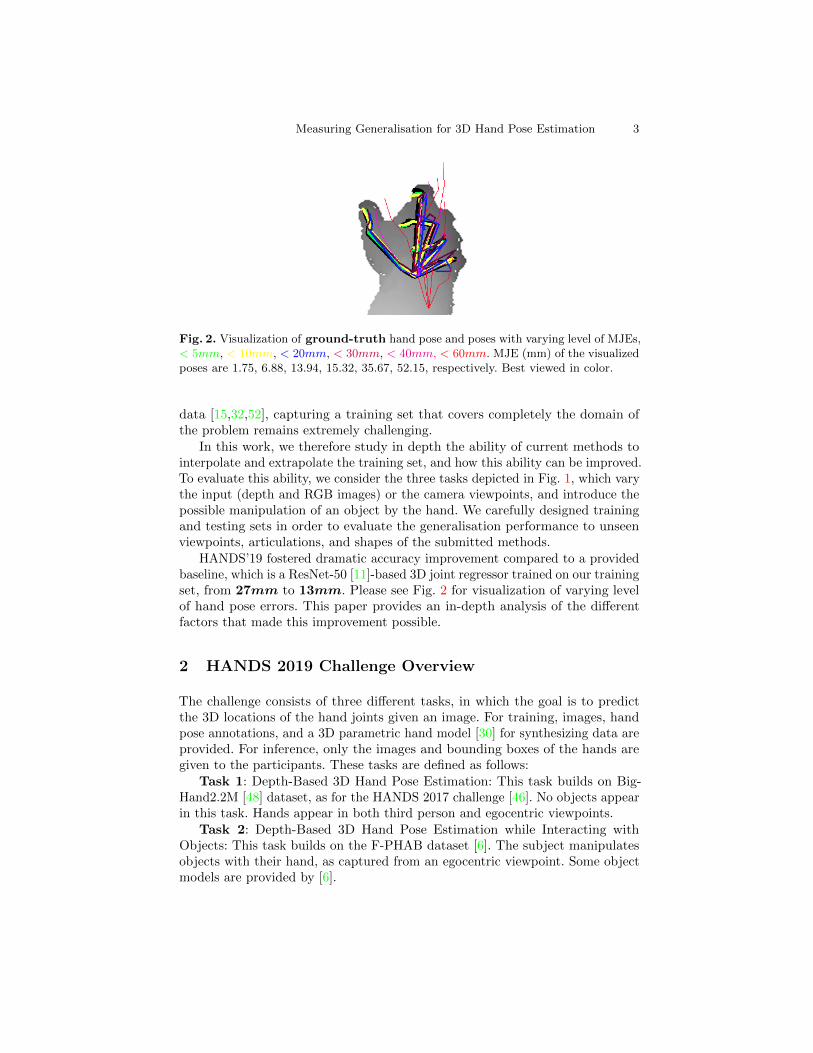
Fig. 2. Visualization of ground-truth hand pose and poses with varying level of MJEs,< 5mm, < 10mm, < 20mm, < 30mm, < 40mm, < 60mm. MJE (mm) of the visualizedposes are 1.75, 6.88, 13.94, 15.32, 35.67, 52.15, respectively. Best viewed in color.
data [15,32,52], capturing a training set that covers completely the domain ofthe problem remains extremely challenging.
In this work, we therefore study in depth the ability of current methods tointerpolate and extrapolate the training set, and how this ability can be improved.To evaluate this ability, we consider the three tasks depicted in Fig. 1, which varythe input (depth and RGB images) or the camera viewpoints, and introduce thepossible manipulation of an object by the hand. We carefully designed trainingand testing sets in order to evaluate the generalisation performance to unseenviewpoints, articulations, and shapes of the submitted methods.
HANDS’19 fostered dramatic accuracy improvement compared to a providedbaseline, which is a ResNet-50 [11]-based 3D joint regressor trained on our trainingset, from 27mm to 13mm. Please see Fig. 2 for visualization of varying levelof hand pose errors. This paper provides an in-depth analysis of the differentfactors that made this improvement possible.
2 HANDS 2019 Challenge Overview
The challenge consists of three different tasks, in which the goal is to predictthe 3D locations of the hand joints given an image. For training, images, handpose annotations, and a 3D parametric hand model [30] for synthesizing data areprovided. For inference, only the images and bounding boxes of the hands aregiven to the participants. These tasks are defined as follows:
Task 1: Depth-Based 3D Hand Pose Estimation: This task builds on Big-Hand2.2M [48] dataset, as for the HANDS 2017 challenge [46]. No objects appearin this task. Hands appear in both third person and egocentric viewpoints.
Task 2: Depth-Based 3D Hand Pose Estimation while Interacting withObjects: This task builds on the F-PHAB dataset [6]. The subject manipulatesobjects with their hand, as captured from an egocentric viewpoint. Some objectmodels are provided by [6].
4 Armagan et al.
Task 3: RGB-Based 3D Hand Pose Estimation while Interacting with Objects:This task builds on the HO-3D [9] dataset. The subject manipulates objects withtheir hand, as captured from a third person viewpoint. The objects are used fromthe YCB dataset [42]. The ground truth wrist position of the test images is alsoprovided in this task.
The BigHand2.2M [48] and F-PHAB [6] datasets have been used by 116and 123 unique institutions to date. HANDS’19 received 80 requests to accessthe datasets with the designed partitions, and 17, 10 and 9 participants haveevaluated their methods on Task 1, Task 2 and Task 3, respectively.
3 Evaluation Criteria
We evaluate the generalisation capability of HPEs in terms of four “axes”:Viewpoint, Articulation, Shape, and Object. For each axis, frames within adataset are automatically annotated by using the ground-truth 3D joint locationsand the object information to annotate each frame in each axis. The annotationdistribution of the dataset for each axis are used are used to create a trainingand a test set. Using the frame annotations on each axis, the sets are sampled ina structured way to have the test frames that are similar to the frames in thetraining data (for interpolation) and also the test frames where axes’ annotationsare never seen in the training data (for extrapolation). More details on the datasetare given in Section 4. To measure the generalisation of HPEs, six evaluationcriteria are further defined with the four main axes:
Viewpoint, Articulation, Shape and Object are respectively used formeasuring the extrapolation performance of HPEs on the frames with articulationcluster, viewpoint angle, hand shape and object type (axis annotations) thatare not present in the training set. Extrapolation is used to measure theperformance on the frames with axis annotations that do not overlap/present inthe training set. Lastly, Interpolation is defined to measure the performanceon the frames with the axis annotations present in the training set.
Extrapolation Interpolation ShapeEvaluation criteria
0
5
10
15
20
25
30
Mea
n Jo
int E
rror
(mm
)
Winners of different tasks on three common axes
Task1Task2Task3
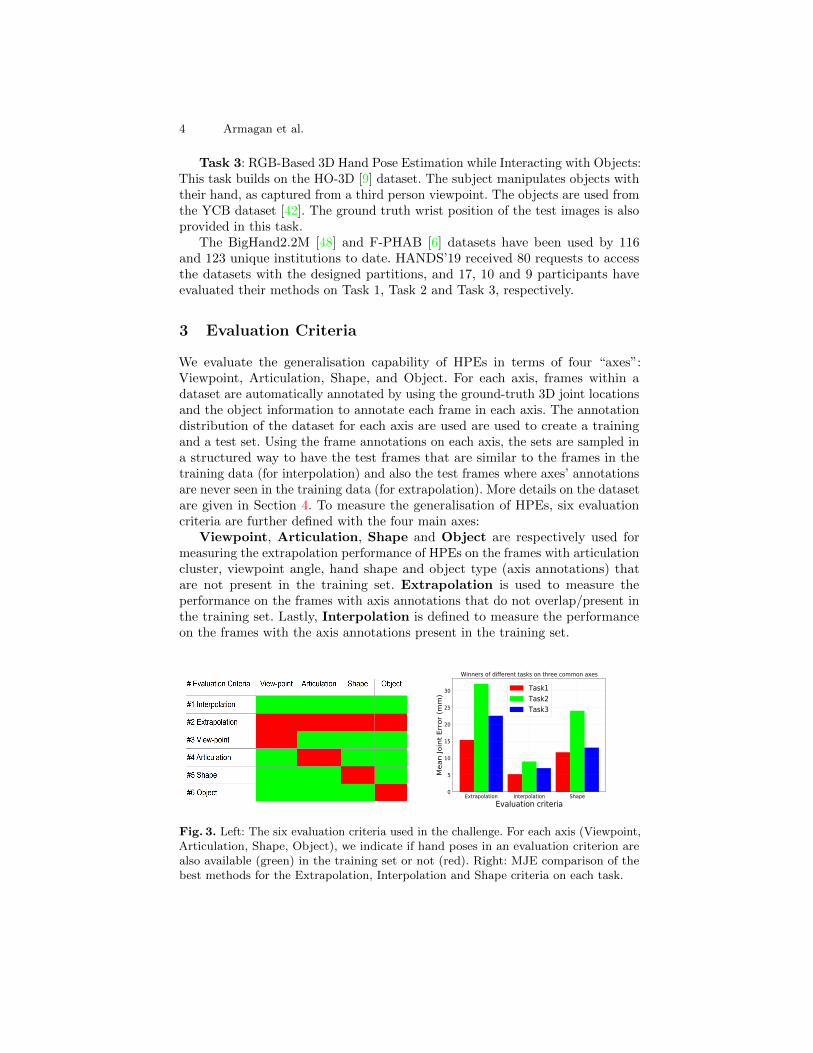
Fig. 3. Left: The six evaluation criteria used in the challenge. For each axis (Viewpoint,Articulation, Shape, Object), we indicate if hand poses in an evaluation criterion arealso available (green) in the training set or not (red). Right: MJE comparison of thebest methods for the Extrapolation, Interpolation and Shape criteria on each task.
Measuring Generalisation for 3D Hand Pose Estimation 5
-180-160 -120 -80 -40 0 40 80 120 160180Task 1 - Azimuth viewpoint (deg)
0
200
400
600
800
1000
1200
Num
ber o
f fra
mes
TrainingTest
0 20 40 60 80 100 120 140 160Task 1 - Elevation viewpoint (deg)
0
250
500
750
1000
1250
1500
1750
2000
Num
ber o
f fra
mes
TrainingTest
2 4 6 8 101214161820222426283032Task 1 - Articulation ids
0
2000
4000
6000
8000
10000
12000
14000
Num
ber o
f fra
mes
TrainingTest
S1 S2 S3 S4 S5 S6 S7 S8 S9 S10Task 1 - Shape ids
0
5000
10000
15000
20000
25000
30000
Num
ber o
f fra
mes Training
Test
S1 S2 S3 S4 S5 S6Task 2 - Shape ids
0
2000
4000
6000
8000
10000
12000
14000
Num
ber o
f fra
mes
TrainingTest
O1 O7 O13 O19 O25 O31 O37Task 2 - Object ids
0
250
500
750
1000
1250
1500
1750
2000
Num
ber o
f fra
mes Training
Test
S1 S2 S3 S4 S5Task 3 - Shape ids
0
1000
2000
3000
4000
5000
Num
ber o
f fra
mes Training
Test
O1 O2 O3 O4 O5 O6Task 3 - Object ids
0
500
1000
1500
2000
2500
3000
Num
ber o
f fra
mes Training
Test
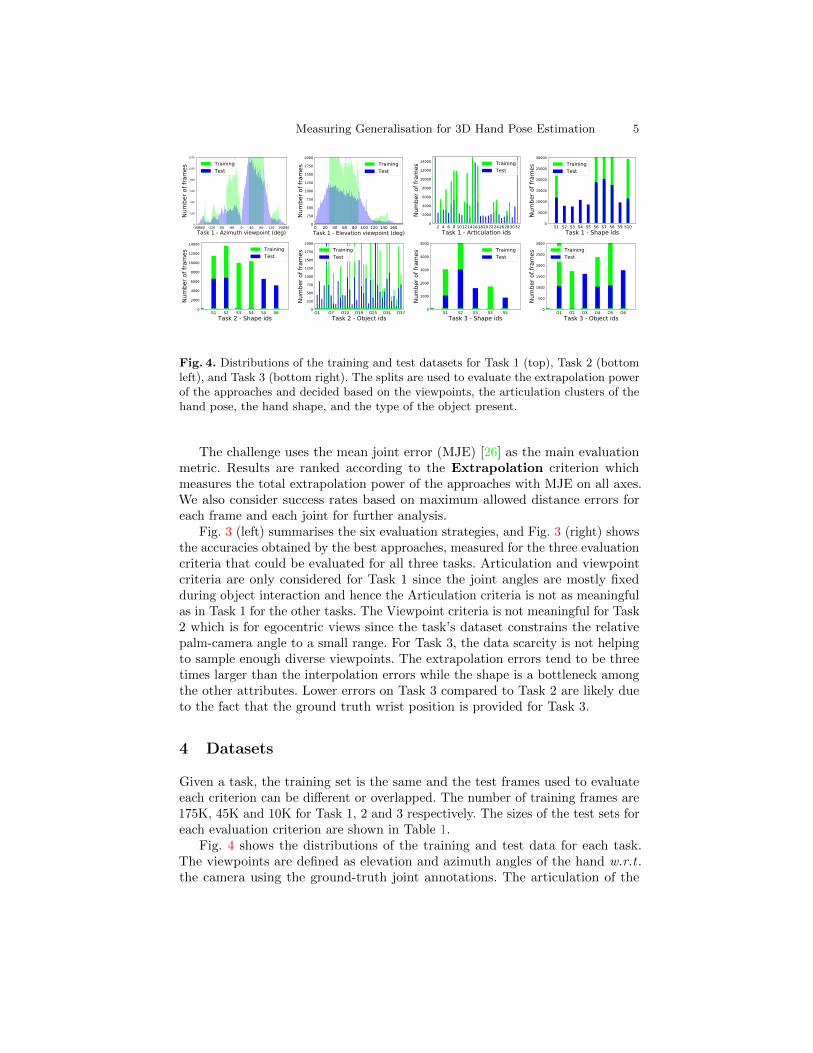
Fig. 4. Distributions of the training and test datasets for Task 1 (top), Task 2 (bottomleft), and Task 3 (bottom right). The splits are used to evaluate the extrapolation powerof the approaches and decided based on the viewpoints, the articulation clusters of thehand pose, the hand shape, and the type of the object present.
The challenge uses the mean joint error (MJE) [26] as the main evaluationmetric. Results are ranked according to the Extrapolation criterion whichmeasures the total extrapolation power of the approaches with MJE on all axes.We also consider success rates based on maximum allowed distance errors foreach frame and each joint for further analysis.
Fig. 3 (left) summarises the six evaluation strategies, and Fig. 3 (right) showsthe accuracies obtained by the best approaches, measured for the three evaluationcriteria that could be evaluated for all three tasks. Articulation and viewpointcriteria are only considered for Task 1 since the joint angles are mostly fixedduring object interaction and hence the Articulation criteria is not as meaningfulas in Task 1 for the other tasks. The Viewpoint criteria is not meaningful for Task2 which is for egocentric views since the task’s dataset constrains the relativepalm-camera angle to a small range. For Task 3, the data scarcity is not helpingto sample enough diverse viewpoints. The extrapolation errors tend to be threetimes larger than the interpolation errors while the shape is a bottleneck amongthe other attributes. Lower errors on Task 3 compared to Task 2 are likely dueto the fact that the ground truth wrist position is provided for Task 3.
4 Datasets
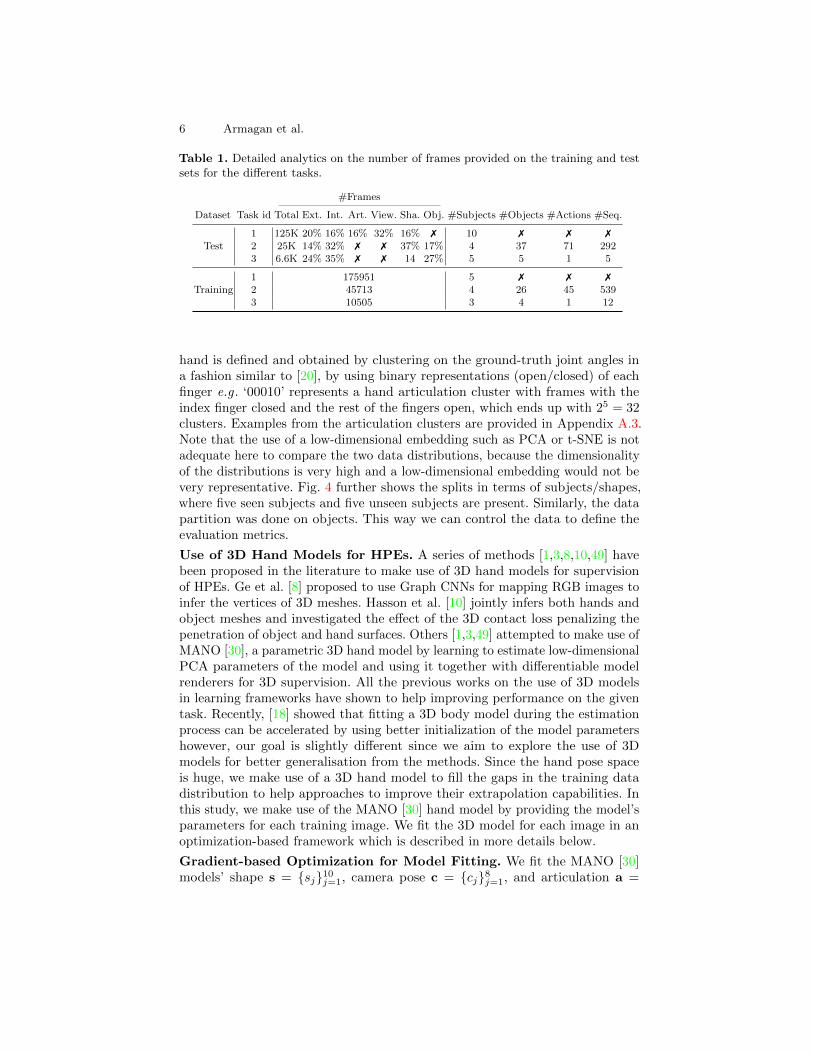
Given a task, the training set is the same and the test frames used to evaluateeach criterion can be different or overlapped. The number of training frames are175K, 45K and 10K for Task 1, 2 and 3 respectively. The sizes of the test sets foreach evaluation criterion are shown in Table 1.
Fig. 4 shows the distributions of the training and test data for each task.The viewpoints are defined as elevation and azimuth angles of the hand w.r.t .the camera using the ground-truth joint annotations. The articulation of the
6 Armagan et al.
Table 1. Detailed analytics on the number of frames provided on the training and testsets for the different tasks.
#Frames
Dataset Task id Total Ext. Int. Art. View. Sha. Obj. #Subjects #Objects #Actions #Seq.
Test1 125K 20% 16% 16% 32% 16% 7 10 7 7 7
2 25K 14% 32% 7 7 37% 17% 4 37 71 2923 6.6K 24% 35% 7 7 14 27% 5 5 1 5
Training1 175951 5 7 7 7
2 45713 4 26 45 5393 10505 3 4 1 12
hand is defined and obtained by clustering on the ground-truth joint angles ina fashion similar to [20], by using binary representations (open/closed) of eachfinger e.g . ‘00010’ represents a hand articulation cluster with frames with theindex finger closed and the rest of the fingers open, which ends up with 25 = 32clusters. Examples from the articulation clusters are provided in Appendix A.3.Note that the use of a low-dimensional embedding such as PCA or t-SNE is notadequate here to compare the two data distributions, because the dimensionalityof the distributions is very high and a low-dimensional embedding would not bevery representative. Fig. 4 further shows the splits in terms of subjects/shapes,where five seen subjects and five unseen subjects are present. Similarly, the datapartition was done on objects. This way we can control the data to define theevaluation metrics.
Use of 3D Hand Models for HPEs. A series of methods [1,3,8,10,49] havebeen proposed in the literature to make use of 3D hand models for supervisionof HPEs. Ge et al. [8] proposed to use Graph CNNs for mapping RGB images toinfer the vertices of 3D meshes. Hasson et al. [10] jointly infers both hands andobject meshes and investigated the effect of the 3D contact loss penalizing thepenetration of object and hand surfaces. Others [1,3,49] attempted to make use ofMANO [30], a parametric 3D hand model by learning to estimate low-dimensionalPCA parameters of the model and using it together with differentiable modelrenderers for 3D supervision. All the previous works on the use of 3D modelsin learning frameworks have shown to help improving performance on the giventask. Recently, [18] showed that fitting a 3D body model during the estimationprocess can be accelerated by using better initialization of the model parametershowever, our goal is slightly different since we aim to explore the use of 3Dmodels for better generalisation from the methods. Since the hand pose spaceis huge, we make use of a 3D hand model to fill the gaps in the training datadistribution to help approaches to improve their extrapolation capabilities. Inthis study, we make use of the MANO [30] hand model by providing the model’sparameters for each training image. We fit the 3D model for each image in anoptimization-based framework which is described in more details below.
Gradient-based Optimization for Model Fitting. We fit the MANO [30]models’ shape s = {sj}10j=1, camera pose c = {cj}8j=1, and articulation a =
Measuring Generalisation for 3D Hand Pose Estimation 7
{aj}45j=1 parameters to the i-th raw skeletons of selected articulations z = {zi}Ki=1,by solving the following equation:
(si∗, ci∗,ai∗) = arg min(s,c,a)
O(s, c,a, zi)),∀i ∈ [1,K] , (1)
where our proposed objective function O(s, c,a, zi) for the sample i is defined asfollows:
O(s, c,a, zi) = ||freg(V (s, c,a))− zi||22 +
10∑j=1
‖sj‖22 +RLap(V (s, c,a)) . (2)
V (s, c,a) denotes the 3D mesh as a function of the three parameters s, c,a.Eq. (2) is composed of the following terms: i) the Euclidean distance between3D skeleton ground-truths zi and the current MANO mesh model’s 3D skeletonvalues freg(V (s, c,a))1; ii) A shape regularizer enforcing the shape parameters sto be close to their MANO model’s mean values, normalized to 0 as in [30], tomaximize the shape likelihood; and iii) A Laplacian regularizer RLap(V (s, c,a))to obtain the smooth mesh surfaces as in [16]. Eq. (1) is solved iteratively byusing the gradients from Eq. (2) as follows:
(st+1, ct+1,at+1) = (st, ct,at)− γ · ∇O(st, ct,at, zi),∀t ∈ [1, T ] , (3)
where γ = 10−3 and T = 3000 are empirically set. This process is similar to therefinement step of [39,1], which refines estimated meshes by using the gradientsfrom the loss. In Fig. 5, both the target and the fitted depth images during theprocess described by Eq. (3) are depicted. Minor errors of the fitting are not aproblem for our purpose given that we will generate input and output pairs ofthe fitted model by exploiting fitted meshes’ self-data generation capability whileignoring original depth and skeletons. Here the aim of fitting the hand modelis to obtain a plausible and a complete articulation space. The model is fittedwithout optimizing over depth information from the model and the input depthimage since we did not observe an improvement on the parameter estimation.Moreover, the optimization needs to be constrained to produce plausible handshapes and noise and other inconsistencies may appear in the depth image.
5 Evaluated Methods
In this section, we present the gist of selected 14 methods among 36 participants(17 for Task 1, 10 for Task 2, 9 for Task 3) to further analyze their resultsin Section 6. Methods are categorized based on their main components andproperties. See Tables 2,3 and 4 for a glance of the properties of the methodsin HANDS’19.2D and 3D supervision for HPEs. Approaches that embed and process 3Ddata obtain high accuracies but less efficient [47] in terms of their complexitycompared to 2D-based approaches. 3D-based methods use 3D convolutionallayers for point-clouds input similar to NTIS which uses an efficient voxel-based
1 freg geometrically regresses the skeleton from the mesh vertex coordinates. It isprovided with the MANO model and the weights are fixed during the process.
8 Armagan et al.
(a) (b) (c)
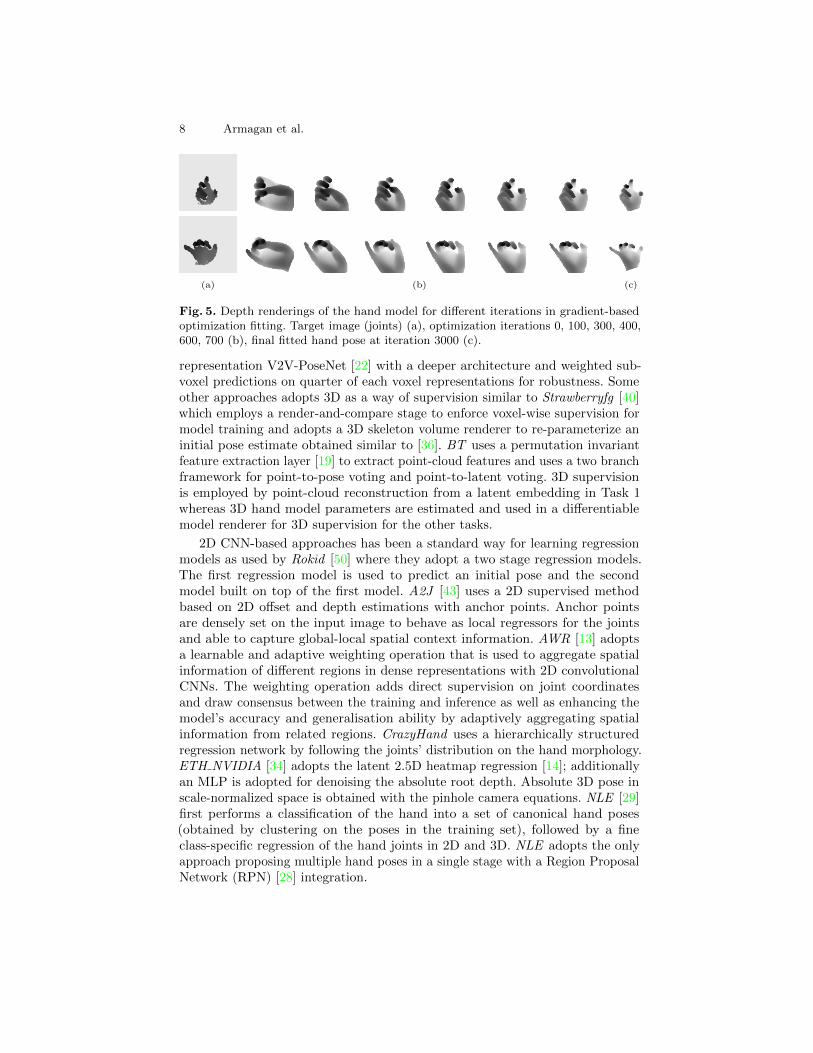
Fig. 5. Depth renderings of the hand model for different iterations in gradient-basedoptimization fitting. Target image (joints) (a), optimization iterations 0, 100, 300, 400,600, 700 (b), final fitted hand pose at iteration 3000 (c).
representation V2V-PoseNet [22] with a deeper architecture and weighted sub-voxel predictions on quarter of each voxel representations for robustness. Someother approaches adopts 3D as a way of supervision similar to Strawberryfg [40]which employs a render-and-compare stage to enforce voxel-wise supervision formodel training and adopts a 3D skeleton volume renderer to re-parameterize aninitial pose estimate obtained similar to [36]. BT uses a permutation invariantfeature extraction layer [19] to extract point-cloud features and uses a two branchframework for point-to-pose voting and point-to-latent voting. 3D supervisionis employed by point-cloud reconstruction from a latent embedding in Task 1whereas 3D hand model parameters are estimated and used in a differentiablemodel renderer for 3D supervision for the other tasks.
2D CNN-based approaches has been a standard way for learning regressionmodels as used by Rokid [50] where they adopt a two stage regression models.The first regression model is used to predict an initial pose and the secondmodel built on top of the first model. A2J [43] uses a 2D supervised methodbased on 2D offset and depth estimations with anchor points. Anchor pointsare densely set on the input image to behave as local regressors for the jointsand able to capture global-local spatial context information. AWR [13] adoptsa learnable and adaptive weighting operation that is used to aggregate spatialinformation of different regions in dense representations with 2D convolutionalCNNs. The weighting operation adds direct supervision on joint coordinatesand draw consensus between the training and inference as well as enhancing themodel’s accuracy and generalisation ability by adaptively aggregating spatialinformation from related regions. CrazyHand uses a hierarchically structuredregression network by following the joints’ distribution on the hand morphology.ETH NVIDIA [34] adopts the latent 2.5D heatmap regression [14]; additionallyan MLP is adopted for denoising the absolute root depth. Absolute 3D pose inscale-normalized space is obtained with the pinhole camera equations. NLE [29]first performs a classification of the hand into a set of canonical hand poses(obtained by clustering on the poses in the training set), followed by a fineclass-specific regression of the hand joints in 2D and 3D. NLE adopts the onlyapproach proposing multiple hand poses in a single stage with a Region ProposalNetwork (RPN) [28] integration.
Measuring Generalisation for 3D Hand Pose Estimation 9
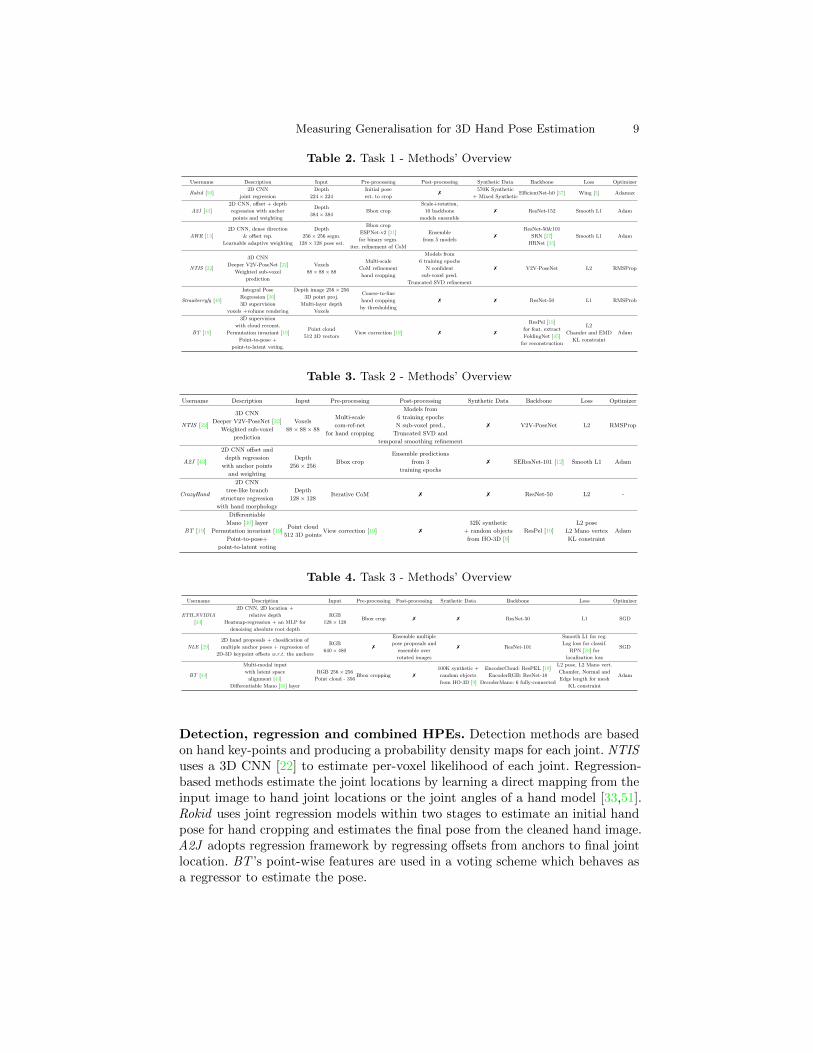
Table 2. Task 1 - Methods’ Overview
Username Description Input Pre-processing Post-processing Synthetic Data Backbone Loss Optimizer
Rokid [50]2D CNN
joint regression
Depth
224 × 224
Initial pose
est. to crop7
570K Synthetic
+ Mixed SyntheticEfficientNet-b0 [37] Wing [5] Adamax
A2J [43]
2D CNN, offset + depth
regression with anchor
points and weighting
Depth
384 × 384Bbox crop
Scale+rotation,
10 backbone
models ensemble
7 ResNet-152 Smooth L1 Adam
AWR [13]
2D CNN, dense direction
& offset rep.
Learnable adaptive weighting
Depth
256 × 256 segm.
128 × 128 pose est.
Bbox crop
ESPNet-v2 [21]
for binary segm.
iter. refinement of CoM
Ensemble
from 5 models7
ResNet-50&101
SRN [27]
HRNet [35]
Smooth L1 Adam
NTIS [22]
3D CNN
Deeper V2V-PoseNet [22]
Weighted sub-voxel
prediction
Voxels
88 × 88 × 88
Multi-scale
CoM refinement
hand cropping
Models from
6 training epochs
N confident
sub-voxel pred.
Truncated SVD refinement
7 V2V-PoseNet L2 RMSProp
Strawberryfg [40]
Integral Pose
Regression [36]
3D supervision
voxels +volume rendering
Depth image 256 × 256
3D point proj.
Multi-layer depth
Voxels
Coarse-to-fine
hand cropping
by thresholding
7 7 ResNet-50 L1 RMSProb
BT [19]
3D supervision
with cloud reconst.
Permutation invariant [19]
Point-to-pose +
point-to-latent voting.
Point cloud
512 3D vectorsView correction [19] 7 7
ResPel [19]
for feat. extract
FoldingNet [45]
for reconstruction
L2
Chamfer and EMD
KL constraint
Adam
Table 3. Task 2 - Methods’ Overview
Username Description Input Pre-processing Post-processing Synthetic Data Backbone Loss Optimizer
NTIS [22]
3D CNN
Deeper V2V-PoseNet [22]
Weighted sub-voxel
prediction
Voxels
88 × 88 × 88
Multi-scale
com-ref-net
for hand cropping
Models from
6 training epochs
N sub-voxel pred.,
Truncated SVD and
temporal smoothing refinement
7 V2V-PoseNet L2 RMSProp
A2J [43]
2D CNN offset and
depth regression
with anchor points
and weighting
Depth
256 × 256Bbox crop
Ensemble predictions
from 3
training epochs
7 SEResNet-101 [12] Smooth L1 Adam
CrazyHand
2D CNN
tree-like branch
structure regression
with hand morphology
Depth
128 × 128Iterative CoM 7 7 ResNet-50 L2 -
BT [19]
Differentiable
Mano [30] layer
Permutation invariant [19]
Point-to-pose+
point-to-latent voting
Point cloud
512 3D pointsView correction [19] 7
32K synthetic
+ random objects
from HO-3D [9]
ResPel [19]
L2 pose
L2 Mano vertex
KL constraint
Adam
Table 4. Task 3 - Methods’ Overview
Username Description Input Pre-processing Post-processing Synthetic Data Backbone Loss Optimizer
ETH NVIDIA
[34]
2D CNN, 2D location +
relative depth
Heatmap-regression + an MLP for
denoising absolute root depth
RGB
128 × 128Bbox crop 7 7 ResNet-50 L1 SGD
NLE [29]
2D hand proposals + classification of
multiple anchor poses + regression of
2D-3D keypoint offsets w.r.t . the anchors
RGB
640 × 4807
Ensemble multiple
pose proposals and
ensemble over
rotated images
7 ResNet-101
Smooth L1 for reg.
Log loss for classif.
RPN [28] for
localization loss
SGD
BT [44]
Multi-modal input
with latent space
alignment [44]
Differentiable Mano [30] layer
RGB 256 × 256
Point cloud - 356Bbox cropping 7
100K synthetic +
random objects
from HO-3D [9]
EncoderCloud: ResPEL [19]
EncoderRGB: ResNet-18
DecoderMano: 6 fully-connected
L2 pose, L2 Mano vert.
Chamfer, Normal and
Edge length for mesh
KL constraint
Adam
Detection, regression and combined HPEs. Detection methods are basedon hand key-points and producing a probability density maps for each joint. NTISuses a 3D CNN [22] to estimate per-voxel likelihood of each joint. Regression-based methods estimate the joint locations by learning a direct mapping from theinput image to hand joint locations or the joint angles of a hand model [33,51].Rokid uses joint regression models within two stages to estimate an initial handpose for hand cropping and estimates the final pose from the cleaned hand image.A2J adopts regression framework by regressing offsets from anchors to final jointlocation. BT ’s point-wise features are used in a voting scheme which behaves asa regressor to estimate the pose.
10 Armagan et al.
Some approaches take advantage of both detection-based and regression-basedmethods. Similarly, AWR, Strawberryfg estimates probability maps to estimatejoint locations with a differentiable soft-argmax operation [36]. A hierarchical ap-proach proposed by CrazyHand regresses the joint locations from joint probabilitymaps. ETH NVIDIA estimates 2D joint locations from estimated probabilitymaps and regresses relative depth distance of the hand joints w.r.t . a root joint.NLE first localizes the hands and classifies them to anchor poses and the finalpose is regressed from the anchors.
Method-wise ensembles. A2J uses densely set anchor points in a voting stagewhich helps to predict location of the joints in an ensemble way for bettergeneralisation leveraging the uncertainty in reference point detection. In a similaressence, AWR adaptively aggregates the predictions from different regions andStrawberryfg adopts local patch refinement [41] where refinement models areadopted to refine bone orientations. BT uses the permutation equivariant featuresextracted from the point-cloud in a point-to-pose voting scheme where the votesare ensembled to estimate the pose. NLE ensembles anchor poses to estimatethe final pose.
Ensembles in post-processing. Rather than a single pose estimator, an en-semble approach was adopted by multiple entries by randomly replicating themethods and fusing the predictions in the post-prediction stage, e.g . A2J , AWR,NTIS , NLE and Strawberryfg .
A2J ensembles predictions from ten different backbone architectures in Task1 like AWR (5 backbones) and augments test images to ensemble the predictionswith different scales and rotations as similar to rotation augmentation adopted byNLE . NTIS uses predictions obtained from the same model at 6 different trainingepochs. A similar ensembling is also adopted by A2J in Task 2. NTIS adopts adifferent strategy where N most confident sub-voxel predictions are ensembledto further use them in a refinement stage with Truncated SVDs together withtemporal smoothing (Task 2). NLE takes advantage of ensembles from multiplepose proposals [29]. Strawberryfg employs a different strategy and ensembles thepredictions from models that are trained with various input modalities.
(a) RealCropped
Hand
(b) SyntheticDepth
Rendering
(c) Real +Synthetic
Mixed Hand
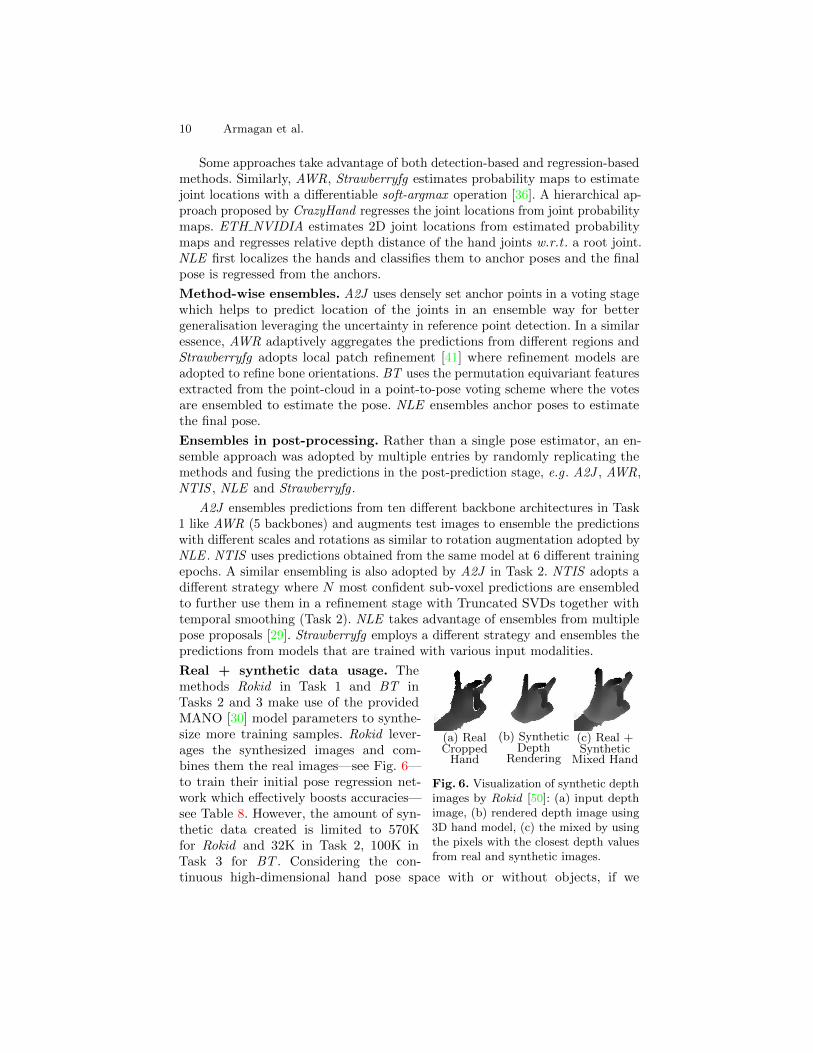
Fig. 6. Visualization of synthetic depthimages by Rokid [50]: (a) input depthimage, (b) rendered depth image using3D hand model, (c) the mixed by usingthe pixels with the closest depth valuesfrom real and synthetic images.
Real + synthetic data usage. Themethods Rokid in Task 1 and BT inTasks 2 and 3 make use of the providedMANO [30] model parameters to synthe-size more training samples. Rokid lever-ages the synthesized images and com-bines them the real images—see Fig. 6—to train their initial pose regression net-work which effectively boosts accuracies—see Table 8. However, the amount of syn-thetic data created is limited to 570Kfor Rokid and 32K in Task 2, 100K inTask 3 for BT . Considering the con-tinuous high-dimensional hand pose space with or without objects, if we
Measuring Generalisation for 3D Hand Pose Estimation 11
sub-sample uniformly and at minimum, for instance, 102(azimuth/elevationangles)×25(articulation)×101(shape)×101(object) = 320K, the number is al-ready very large, causing a huge compromise issue for memory and training GPUhours. Random sampling was applied without a prior on the data distribution orsmart sampling techniques [4,2]. BT generates synthetic images with objects andhands similar to [23] by randomly placing the objects from [9] to nearby handlocations without taking into account the hand and object interaction. The restof the methods use the provided real training data only.Multi-modal inputs for HPEs. BT adopts [44] in Task 3 to align latentspaces from depth and RGB input modalities and to embed the inherit depthinformation in depth images during learning. Strawberryfg makes use of multi-inputs where each is obtained from different representations of the depth image,e.g . point-cloud, 3D point projection [7], multi-layer depth map [31], depthvoxel [22].Dominating HPE backbones. ResNet [11] architectures with residual connec-tions have been a popular backbone choice among many HPEs e.g . A2J , AWR,Strawberryfg , CrazyHand , ETH NVIDIA, NLE or implicitly by BT within theResPEL [19] architecture. Rokid adopts EfficientNet-b0 [37] as a backbone whichuniformly scales the architecture’s depth, width, and resolution.
6 Results and Discussion
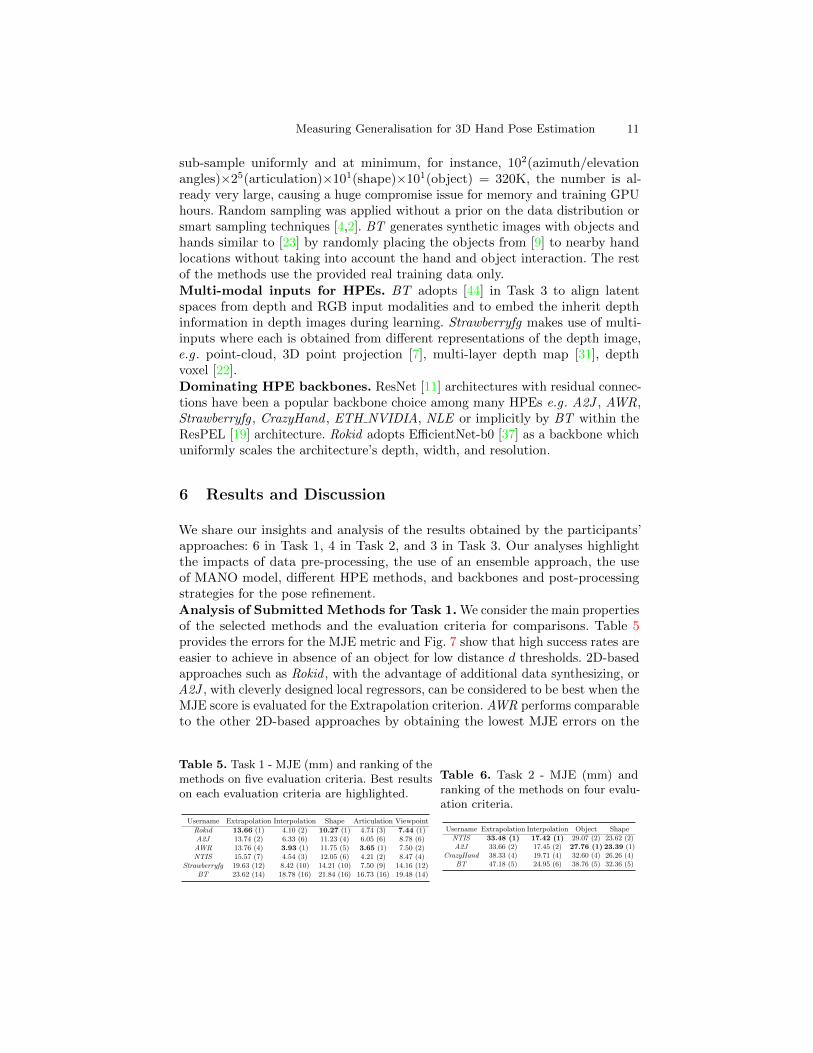
We share our insights and analysis of the results obtained by the participants’approaches: 6 in Task 1, 4 in Task 2, and 3 in Task 3. Our analyses highlightthe impacts of data pre-processing, the use of an ensemble approach, the useof MANO model, different HPE methods, and backbones and post-processingstrategies for the pose refinement.Analysis of Submitted Methods for Task 1. We consider the main propertiesof the selected methods and the evaluation criteria for comparisons. Table 5provides the errors for the MJE metric and Fig. 7 show that high success rates areeasier to achieve in absence of an object for low distance d thresholds. 2D-basedapproaches such as Rokid , with the advantage of additional data synthesizing, orA2J , with cleverly designed local regressors, can be considered to be best when theMJE score is evaluated for the Extrapolation criterion. AWR performs comparableto the other 2D-based approaches by obtaining the lowest MJE errors on the
Table 5. Task 1 - MJE (mm) and ranking of themethods on five evaluation criteria. Best resultson each evaluation criteria are highlighted.
Username Extrapolation Interpolation Shape Articulation Viewpoint
Rokid 13.66 (1) 4.10 (2) 10.27 (1) 4.74 (3) 7.44 (1)A2J 13.74 (2) 6.33 (6) 11.23 (4) 6.05 (6) 8.78 (6)AWR 13.76 (4) 3.93 (1) 11.75 (5) 3.65 (1) 7.50 (2)NTIS 15.57 (7) 4.54 (3) 12.05 (6) 4.21 (2) 8.47 (4)
Strawberryfg 19.63 (12) 8.42 (10) 14.21 (10) 7.50 (9) 14.16 (12)BT 23.62 (14) 18.78 (16) 21.84 (16) 16.73 (16) 19.48 (14)
Table 6. Task 2 - MJE (mm) andranking of the methods on four evalu-ation criteria.
Username Extrapolation Interpolation Object Shape
NTIS 33.48 (1) 17.42 (1) 29.07 (2) 23.62 (2)A2J 33.66 (2) 17.45 (2) 27.76 (1) 23.39 (1)
CrazyHand 38.33 (4) 19.71 (4) 32.60 (4) 26.26 (4)BT 47.18 (5) 24.95 (6) 38.76 (5) 32.36 (5)
12 Armagan et al.
0 20 40 60 80 100 120Maximum allowed distance to GT (mm)
0
20
40
60
80
100
Frac
tion
of fr
ames
with
in d
istan
ce (%
)
Total Extrapolation Analysis on Test Samples
RokidA2JAWRNTISStrawberryfgBT
0 20 40 60 80 100 120Maximum allowed distance to GT (mm)
0
20
40
60
80
100
Frac
tion
of fr
ames
with
in d
istan
ce (%
)
Extrapolation Analysis on Viewpoint
RokidA2JAWRNTISStrawberryfgBT
0 20 40 60 80 100 120Maximum allowed distance to GT (mm)
0
20
40
60
80
100
Frac
tion
of fr
ames
with
in d
istan
ce (%
)
Extrapolation Analysis on Articulation
RokidA2JAWRNTISStrawberryfgBT
(a) Extrapolation (b) Viewpoint (c) Articulation
0 20 40 60 80 100 120Maximum allowed distance to GT (mm)
0
20
40
60
80
100
Frac
tion
of fr
ames
with
in d
istan
ce (%
)
Extrapolation Analysis on Shapes
RokidA2JAWRNTISStrawberryfgBT
0 10 20 30 40 50 60 70 80Maximum allowed distance to GT (mm)
0
20
40
60
80
100
Frac
tion
of fr
ames
with
in d
istan
ce (%
)
Interpolation Analysis on Test Samples
RokidA2JAWRNTISStrawberryfgBT
S1 S2 S3 S4 S5 S6 S7 S8 S9 S10Shape Id
0
10
20
30
40
50
Mea
n Jo
int E
rror (
mm
)
Analysis on Seen/Unseen ShapesRokidA2JAWRNTISStrawberryfgBT
(d) Shape (e) Interpolation (f) Shape MJE
-180 -150 -90 -60 0 30 90 120 150 180Azimuth angle (deg)
0
20
40
60
80
100
Mea
n Jo
int E
rror (
mm
)
Analysis on Varying Azimuth Viewpoints
RokidA2JAWRNTISStrawberryfgBT
0 15 30 60 90 120 165 180Elevation angle (deg)
0
20
40
60
80
100
Mea
n Jo
int E
rror (
mm
)
Analysis on Varying Elevation Viewpoints
RokidA2JAWRNTISStrawberryfgBT
1 - - 4 - - 7 - -10- -13- -16- -19- -22- -25- -28- - 32Cluster Id
0
5
10
15
20
25
30
Mea
n Jo
int E
rror (
mm
)
Analysis on Seen/Unseen Articulation ClustersRokidA2JAWRNTISStrawberryfgBT
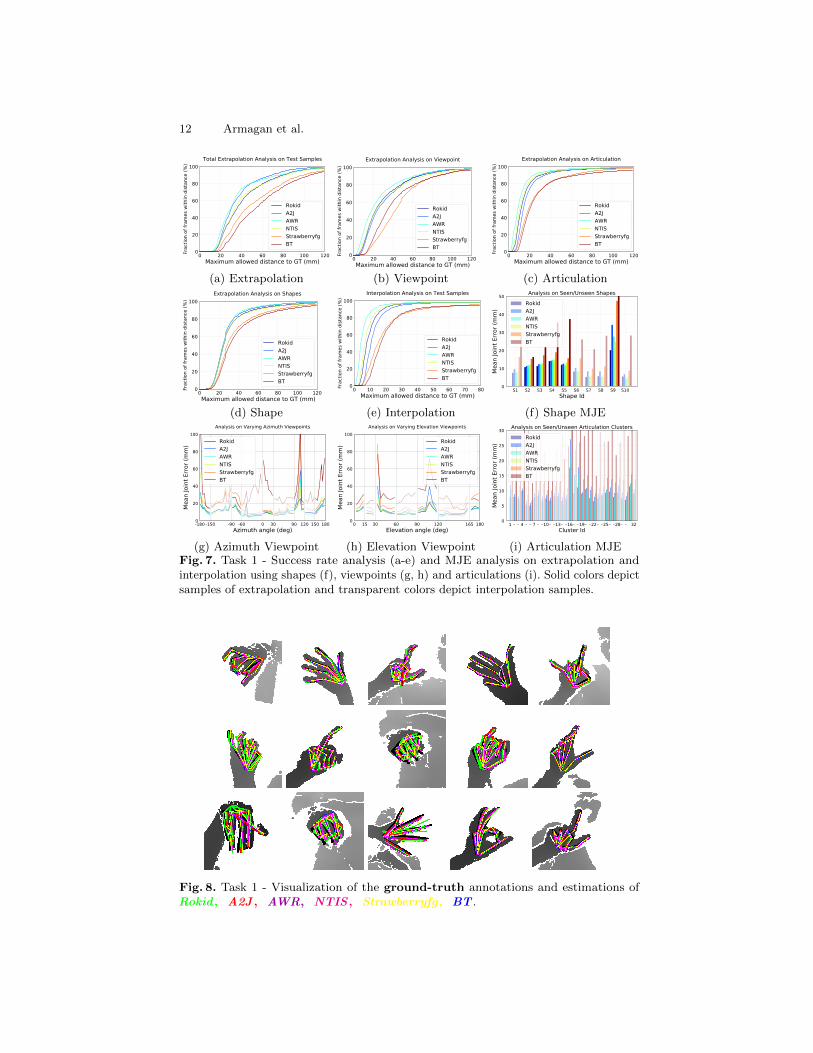
(g) Azimuth Viewpoint (h) Elevation Viewpoint (i) Articulation MJEFig. 7. Task 1 - Success rate analysis (a-e) and MJE analysis on extrapolation andinterpolation using shapes (f), viewpoints (g, h) and articulations (i). Solid colors depictsamples of extrapolation and transparent colors depict interpolation samples.
Fig. 8. Task 1 - Visualization of the ground-truth annotations and estimations ofRokid , A2J , AWR, NTIS , Strawberryfg , BT .
Measuring Generalisation for 3D Hand Pose Estimation 13
Interpolation and Articulation criteria. AWR performs best for the distancesless than 50mm on Extrapolation as well as showing better generalisation tounseen Viewpoints and Articulations, while excelling to interpolate well. Asimilar trend is observed with the 3D-voxel-based approach NTIS . However, theother 3D supervised methods, Strawberryfg and BT show lower generalisationcapability compared to other approaches while performing reasonably well onthe Articulation, Shape, and Interpolation criteria but not being able to show asimilar performance for the Extrapolation and Viewpoint criteria.
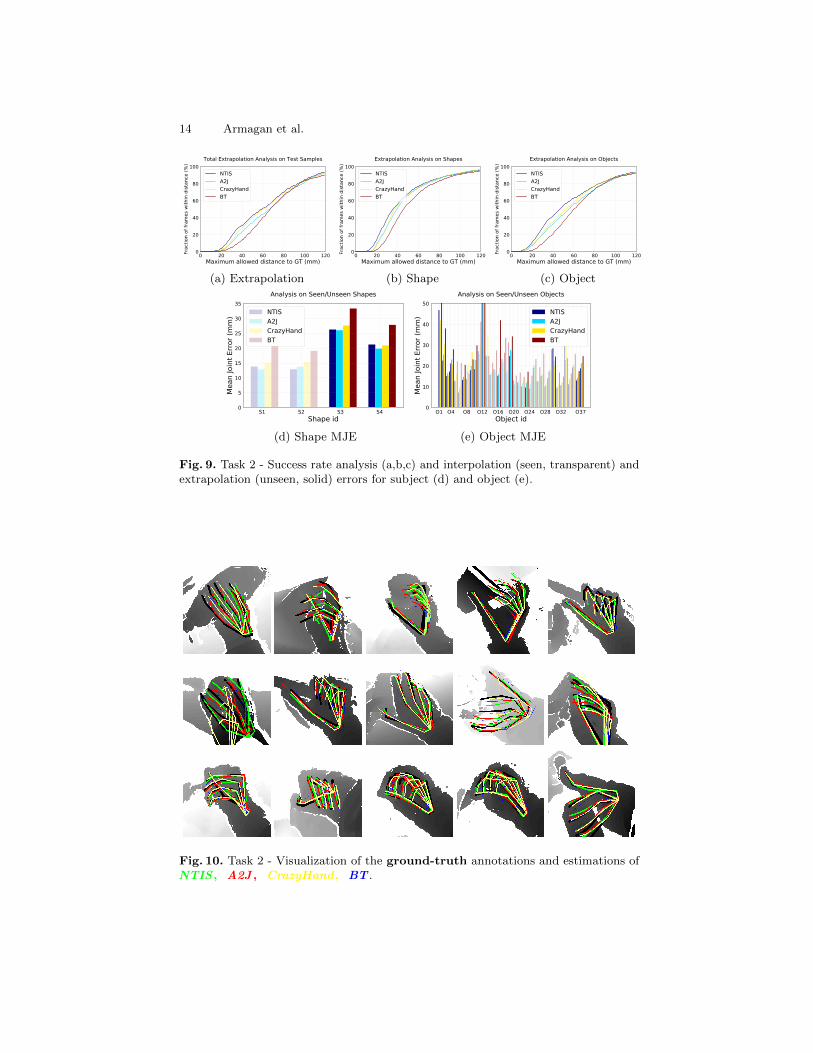
Analysis of Submitted Methods for Task 2. We selected four submittedmethods to compare on Task 2, where a hand interacts with an object in anegocentric viewpoint. Success rates illustrated in Fig. 9 highlight the difficultyof extrapolation. All methods struggle to show good performance on estimatingframes with joint errors less than 15mm. On the other hand, all methods canestimate 20% to 30% of the joints correctly with less than 15mm error for theother criteria in this task.
NTIS (a voxel-based) and A2J (weighted local regressors with anchor points)perform similarly when MJEs for all joints are considered. However, NTIS obtainshigher success rates on the frame-based evaluation for all evaluation criteria withlow distance error thresholds (d), see Fig. 9. Its performance is relatively muchhigher when Extrapolation is considered, especially for the frames with unseenobjects, see Fig. 9. This can be explained by having a better embedding of theoccluded hand structure with the voxels in the existence of seen/unseen objects.NTIS interpolates well under low distance thresholds.
Note that the first three methods, NTIS , A2J , and CrazyHand perform verysimilar for high error thresholds e.g . d > 30mm. CrazyHand uses a structureddetection-regression-based HPE where a heatmap regression is employed for thejoints from palm to tips in a sequential manner which is highly valuable foregocentric viewpoints, helps to obtain comparable results with A2J where thestructure is implicitly refined by the local anchor regressors.
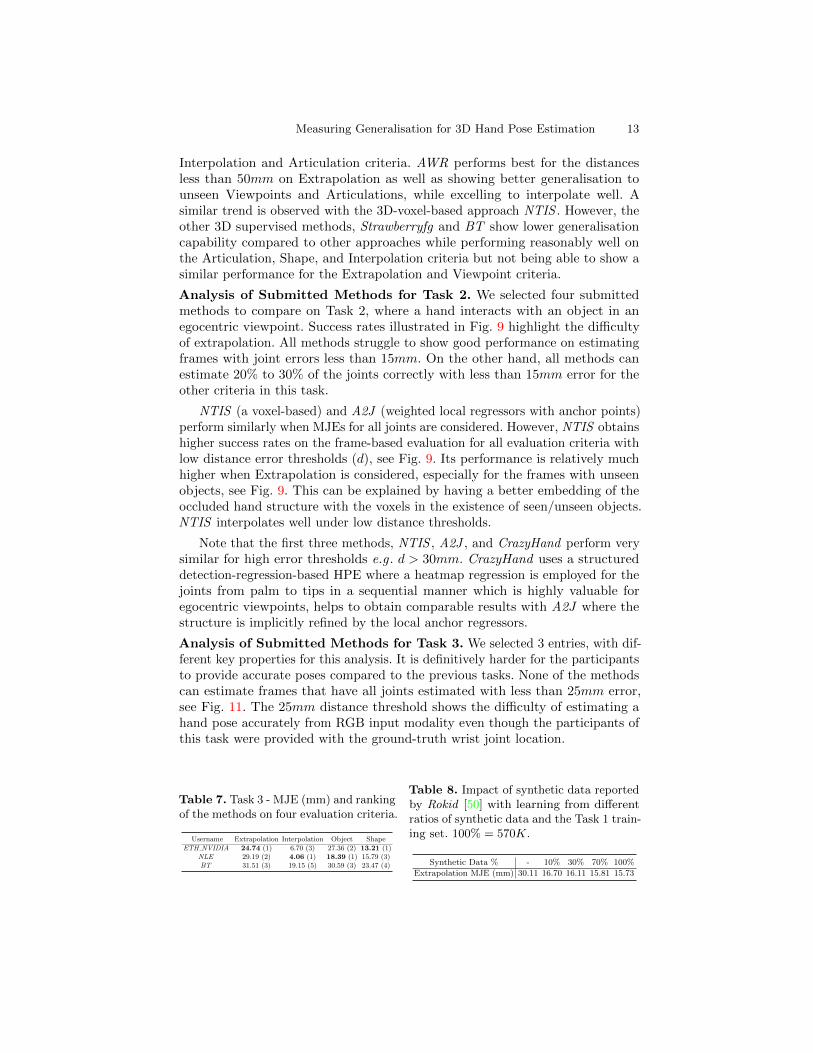
Analysis of Submitted Methods for Task 3. We selected 3 entries, with dif-ferent key properties for this analysis. It is definitively harder for the participantsto provide accurate poses compared to the previous tasks. None of the methodscan estimate frames that have all joints estimated with less than 25mm error,see Fig. 11. The 25mm distance threshold shows the difficulty of estimating ahand pose accurately from RGB input modality even though the participants ofthis task were provided with the ground-truth wrist joint location.
Table 7. Task 3 - MJE (mm) and rankingof the methods on four evaluation criteria.
Username Extrapolation Interpolation Object Shape
ETH NVIDIA 24.74 (1) 6.70 (3) 27.36 (2) 13.21 (1)NLE 29.19 (2) 4.06 (1) 18.39 (1) 15.79 (3)BT 31.51 (3) 19.15 (5) 30.59 (3) 23.47 (4)
Table 8. Impact of synthetic data reportedby Rokid [50] with learning from differentratios of synthetic data and the Task 1 train-ing set. 100% = 570K.
Synthetic Data % - 10% 30% 70% 100%
Extrapolation MJE (mm) 30.11 16.70 16.11 15.81 15.73
14 Armagan et al.
0 20 40 60 80 100 120Maximum allowed distance to GT (mm)
0
20
40
60
80
100
Frac
tion
of fr
ames
with
in d
istan
ce (%
)
Total Extrapolation Analysis on Test Samples
NTISA2JCrazyHandBT
0 20 40 60 80 100 120Maximum allowed distance to GT (mm)
0
20
40
60
80
100
Frac
tion
of fr
ames
with
in d
istan
ce (%
)
Extrapolation Analysis on Shapes
NTISA2JCrazyHandBT
0 20 40 60 80 100 120Maximum allowed distance to GT (mm)
0
20
40
60
80
100
Frac
tion
of fr
ames
with
in d
istan
ce (%
)
Extrapolation Analysis on Objects
NTISA2JCrazyHandBT
(a) Extrapolation (b) Shape (c) Object
S1 S2 S3 S4Shape id
0
5
10
15
20
25
30
35
Mea
n Jo
int E
rror (
mm
)
Analysis on Seen/Unseen Shapes
NTISA2JCrazyHandBT
O1 O4 O8 O12 O16 O20 O24 O28 O32 O37Object id
0
10
20
30
40
50
Mea
n Jo
int E
rror (
mm
)
Analysis on Seen/Unseen Objects
NTISA2JCrazyHandBT
(d) Shape MJE (e) Object MJE
Fig. 9. Task 2 - Success rate analysis (a,b,c) and interpolation (seen, transparent) andextrapolation (unseen, solid) errors for subject (d) and object (e).
Fig. 10. Task 2 - Visualization of the ground-truth annotations and estimations ofNTIS , A2J , CrazyHand , BT .
Measuring Generalisation for 3D Hand Pose Estimation 15
20 40 60 80 100 120Maximum allowed distance to GT (mm)
0
20
40
60
80
100
Frac
tion
of fr
ames
with
in d
istan
ce (%
)
Total Extrapolation Analysis on Test Samples
ETH_NVIDIANLEBT
0 20 40 60 80 100 120Maximum allowed distance to GT (mm)
0
20
40
60
80
100
Frac
tion
of fr
ames
with
in d
istan
ce (%
)
Extrapolation Analysis on Shapes
ETH_NVIDIANLEBT
S1 S2 S3 S4 S5Shape Id
0
5
10
15
20
25
30
Mea
n Jo
int E
rror (
mm
)
MJE Analysis on Shape Axis
ETH_NVIDIANLEBT
(a) Extrapolation (b) Shape (c) Shape MJE
20 40 60 80 100 120Maximum allowed distance to GT (mm)
0
20
40
60
80
100
Frac
tion
of fr
ames
with
in d
istan
ce (%
)
Extrapolation Analysis on Objects
ETH_NVIDIANLEBT
0 10 20 30 40 50Maximum allowed distance to GT (mm)
0
20
40
60
80
100
Frac
tion
of fr
ames
with
in d
istan
ce (%
)
Interpolation Analysis on Test Samples
ETH_NVIDIANLEBT
O1 O2 O3 O4 O5 O6Object Id
0
5
10
15
20
25
30
Mea
n Jo
int E
rror (
mm
)
MJE Analysis on Object Axis
ETH_NVIDIANLEBT
(d) Object (e) Interpolation (f) Object MJE
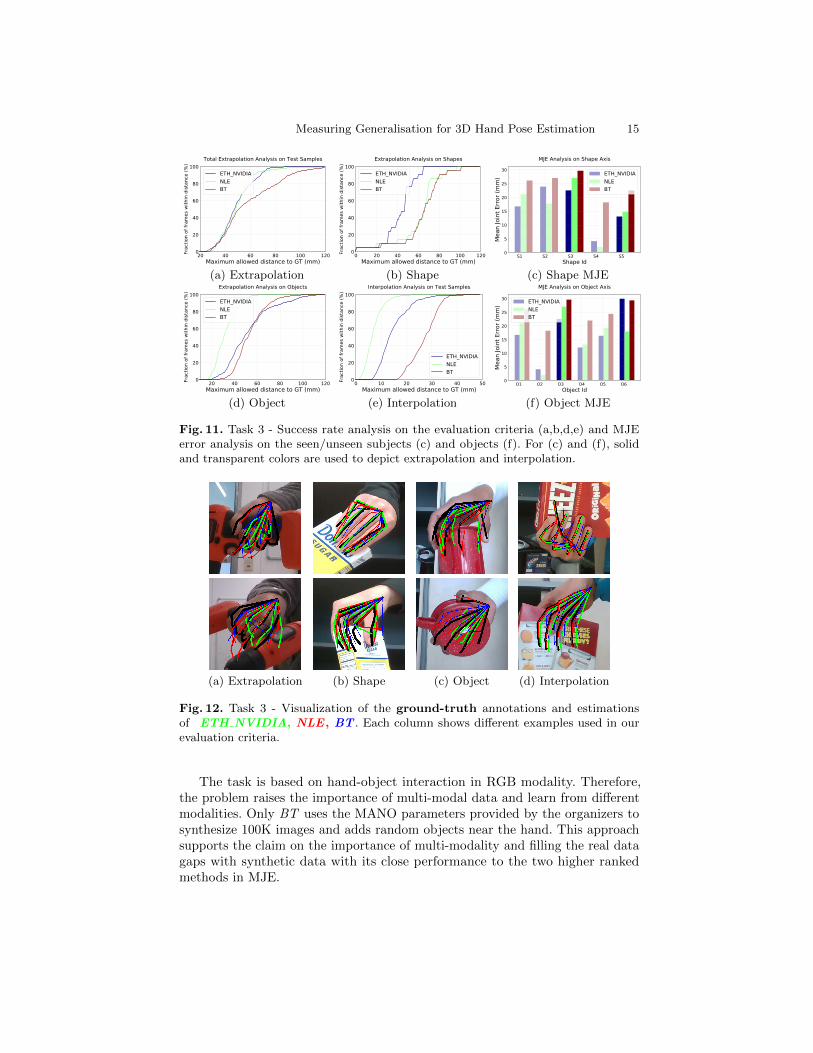
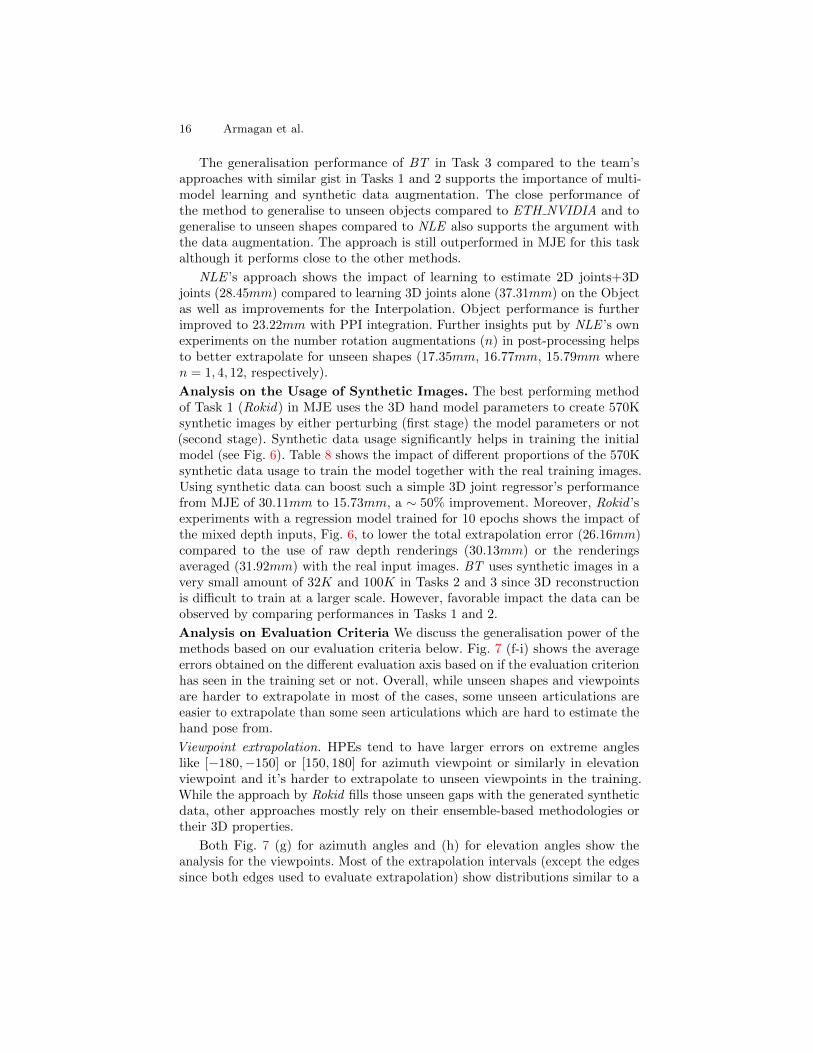
Fig. 11. Task 3 - Success rate analysis on the evaluation criteria (a,b,d,e) and MJEerror analysis on the seen/unseen subjects (c) and objects (f). For (c) and (f), solidand transparent colors are used to depict extrapolation and interpolation.
(a) Extrapolation (b) Shape (c) Object (d) Interpolation
Fig. 12. Task 3 - Visualization of the ground-truth annotations and estimationsof ETH NVIDIA, NLE , BT . Each column shows different examples used in ourevaluation criteria.
The task is based on hand-object interaction in RGB modality. Therefore,the problem raises the importance of multi-modal data and learn from differentmodalities. Only BT uses the MANO parameters provided by the organizers tosynthesize 100K images and adds random objects near the hand. This approachsupports the claim on the importance of multi-modality and filling the real datagaps with synthetic data with its close performance to the two higher rankedmethods in MJE.
16 Armagan et al.
The generalisation performance of BT in Task 3 compared to the team’sapproaches with similar gist in Tasks 1 and 2 supports the importance of multi-model learning and synthetic data augmentation. The close performance ofthe method to generalise to unseen objects compared to ETH NVIDIA and togeneralise to unseen shapes compared to NLE also supports the argument withthe data augmentation. The approach is still outperformed in MJE for this taskalthough it performs close to the other methods.
NLE ’s approach shows the impact of learning to estimate 2D joints+3Djoints (28.45mm) compared to learning 3D joints alone (37.31mm) on the Objectas well as improvements for the Interpolation. Object performance is furtherimproved to 23.22mm with PPI integration. Further insights put by NLE ’s ownexperiments on the number rotation augmentations (n) in post-processing helpsto better extrapolate for unseen shapes (17.35mm, 16.77mm, 15.79mm wheren = 1, 4, 12, respectively).
Analysis on the Usage of Synthetic Images. The best performing methodof Task 1 (Rokid) in MJE uses the 3D hand model parameters to create 570Ksynthetic images by either perturbing (first stage) the model parameters or not(second stage). Synthetic data usage significantly helps in training the initialmodel (see Fig. 6). Table 8 shows the impact of different proportions of the 570Ksynthetic data usage to train the model together with the real training images.Using synthetic data can boost such a simple 3D joint regressor’s performancefrom MJE of 30.11mm to 15.73mm, a ∼ 50% improvement. Moreover, Rokid ’sexperiments with a regression model trained for 10 epochs shows the impact ofthe mixed depth inputs, Fig. 6, to lower the total extrapolation error (26.16mm)compared to the use of raw depth renderings (30.13mm) or the renderingsaveraged (31.92mm) with the real input images. BT uses synthetic images in avery small amount of 32K and 100K in Tasks 2 and 3 since 3D reconstructionis difficult to train at a larger scale. However, favorable impact the data can beobserved by comparing performances in Tasks 1 and 2.
Analysis on Evaluation Criteria We discuss the generalisation power of themethods based on our evaluation criteria below. Fig. 7 (f-i) shows the averageerrors obtained on the different evaluation axis based on if the evaluation criterionhas seen in the training set or not. Overall, while unseen shapes and viewpointsare harder to extrapolate in most of the cases, some unseen articulations areeasier to extrapolate than some seen articulations which are hard to estimate thehand pose from.
Viewpoint extrapolation. HPEs tend to have larger errors on extreme angleslike [−180,−150] or [150, 180] for azimuth viewpoint or similarly in elevationviewpoint and it’s harder to extrapolate to unseen viewpoints in the training.While the approach by Rokid fills those unseen gaps with the generated syntheticdata, other approaches mostly rely on their ensemble-based methodologies ortheir 3D properties.
Both Fig. 7 (g) for azimuth angles and (h) for elevation angles show theanalysis for the viewpoints. Most of the extrapolation intervals (except the edgessince both edges used to evaluate extrapolation) show distributions similar to a
Measuring Generalisation for 3D Hand Pose Estimation 17
Gaussian which is expected since the mid-intervals are most far away viewpointsfrom a seen viewpoint from the training set. While both elevation and azimuthextrapolation errors are always higher than the interpolation error obtainedwith the corresponding methods, however the azimuth extrapolation tends to bevarying more than the elevation extrapolation for some angles.Articulation extrapolation. Fig. 7 (i) shows the average errors for 32 articulationclusters. 16 of those clusters have already seen in the training set while 16 havenever seen and only available in the test set. While the samples that fall intosome clusters, (e.g . 16, 18, 19, 20 and 31) tend to be harder to estimate most ofthe time, however some articulations without depending on seen (e.g . 1, 7, 8, 17)or unseen are hard to estimate as well because of the type of the articulation.Fig. 20 shows the example frames for the 32 clusters.Shape extrapolation. Fig. 7 (f) shows average errors obtained for different shapetypes seen/unseen. All approaches have higher errors on unseen hand shapes(2, 3, 4, 5, 9) compared to errors obtained on shapes (1, 6, 7, 8, 10) seen in thetraining set.
Fig. 11 (c, f) show the MJE analysis based on seen/unseen shapes (c) andobjects (f). A list of objects that appear in the task test set is given in Table 21.Although shape ’S5’ refers to an unseen shape, all methods can extrapolate tothis shape better than some other seen shapes in the training set. This can beexplained with ’S5’ being similar to some other shapes and it has the lowestnumber of frames (easy examples) compared to number of test frames fromother shapes in the test set, see Fig. 4 (bottom right) for the distributions of thetraining and test set. A similar aspect has been observed in [46] where differenthand shape analysis has been provided, see Fig. 19. However, all methods tend tohave higher errors on the frames from another unseen test shape ’S3’ as expected.Object extrapolation. Poses for hands with unseen objects, ’O3’ power drill and’O6’ mug, are harder to extrapolate by most methods since their shapes are quitedifferent than the other seen objects in the training set. Please note that seen’O2’ object has the lowest number of frames in the test set. Some example framesfor the listed objects are showed in Fig. 18.
7 Ablation Studies by the Participants
Here we present the experiments and their results conducted by the participantsfor the challenge. Section 7.1 presents experimental results conducted by theparticipated approaches based on different backbone architectures and similarly,Section 7.2 shows experimental evaluation on the ensembling techniques inpre-processing, post-processing and methodological level.
7.1 Experiments with Different Backbone Architectures
While Residual Network (ResNet) [11] backbones are well adopted by manyapproaches and ResNet-50 or ResNet-101 architectures obtain better resultscompared to other backbone models as reported in experiments of AWR and NLE .
18 Armagan et al.
However, most approaches adopt ensembling predictions from models trained withdifferent backbone architectures and this improves the performance as showed inTables 9 and 10.
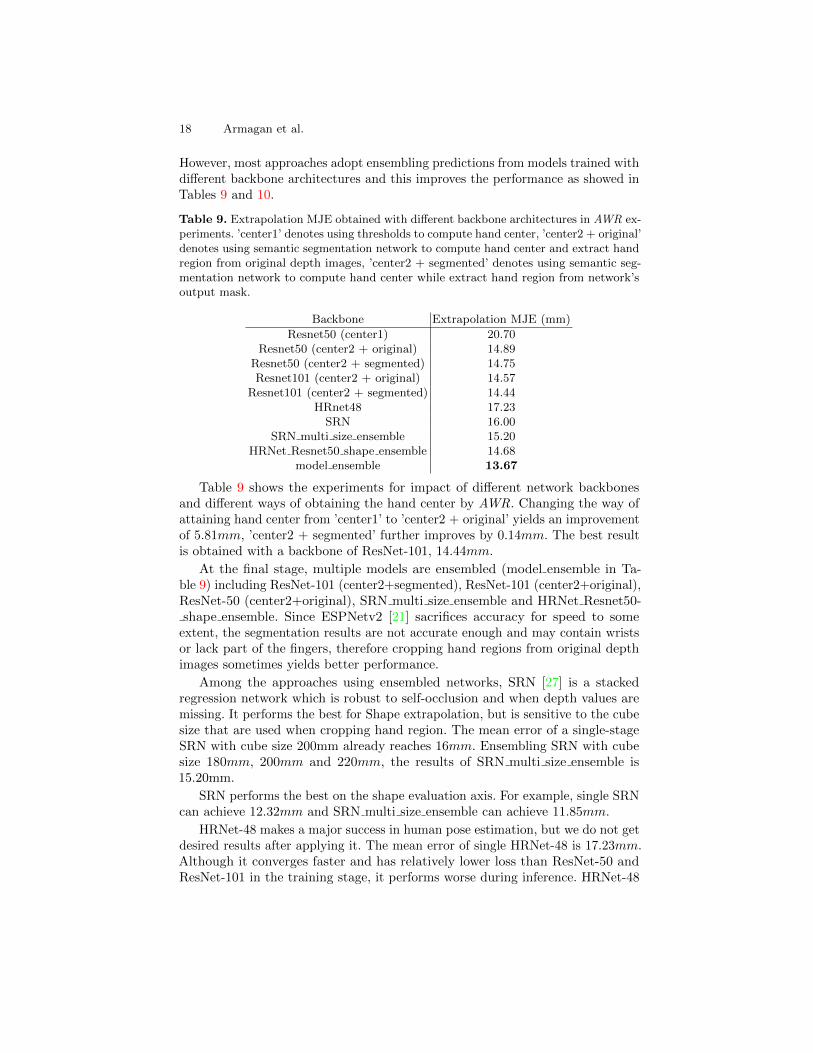
Table 9. Extrapolation MJE obtained with different backbone architectures in AWR ex-periments. ’center1’ denotes using thresholds to compute hand center, ’center2 + original’denotes using semantic segmentation network to compute hand center and extract handregion from original depth images, ’center2 + segmented’ denotes using semantic seg-mentation network to compute hand center while extract hand region from network’soutput mask.
Backbone Extrapolation MJE (mm)
Resnet50 (center1) 20.70Resnet50 (center2 + original) 14.89
Resnet50 (center2 + segmented) 14.75Resnet101 (center2 + original) 14.57
Resnet101 (center2 + segmented) 14.44HRnet48 17.23
SRN 16.00SRN multi size ensemble 15.20
HRNet Resnet50 shape ensemble 14.68model ensemble 13.67
Table 9 shows the experiments for impact of different network backbonesand different ways of obtaining the hand center by AWR. Changing the way ofattaining hand center from ’center1’ to ’center2 + original’ yields an improvementof 5.81mm, ’center2 + segmented’ further improves by 0.14mm. The best resultis obtained with a backbone of ResNet-101, 14.44mm.
At the final stage, multiple models are ensembled (model ensemble in Ta-ble 9) including ResNet-101 (center2+segmented), ResNet-101 (center2+original),ResNet-50 (center2+original), SRN multi size ensemble and HRNet Resnet50-shape ensemble. Since ESPNetv2 [21] sacrifices accuracy for speed to some
extent, the segmentation results are not accurate enough and may contain wristsor lack part of the fingers, therefore cropping hand regions from original depthimages sometimes yields better performance.
Among the approaches using ensembled networks, SRN [27] is a stackedregression network which is robust to self-occlusion and when depth values aremissing. It performs the best for Shape extrapolation, but is sensitive to the cubesize that are used when cropping hand region. The mean error of a single-stageSRN with cube size 200mm already reaches 16mm. Ensembling SRN with cubesize 180mm, 200mm and 220mm, the results of SRN multi size ensemble is15.20mm.
SRN performs the best on the shape evaluation axis. For example, single SRNcan achieve 12.32mm and SRN multi size ensemble can achieve 11.85mm.
HRNet-48 makes a major success in human pose estimation, but we do not getdesired results after applying it. The mean error of single HRNet-48 is 17.23mm.Although it converges faster and has relatively lower loss than ResNet-50 andResNet-101 in the training stage, it performs worse during inference. HRNet-48
Measuring Generalisation for 3D Hand Pose Estimation 19
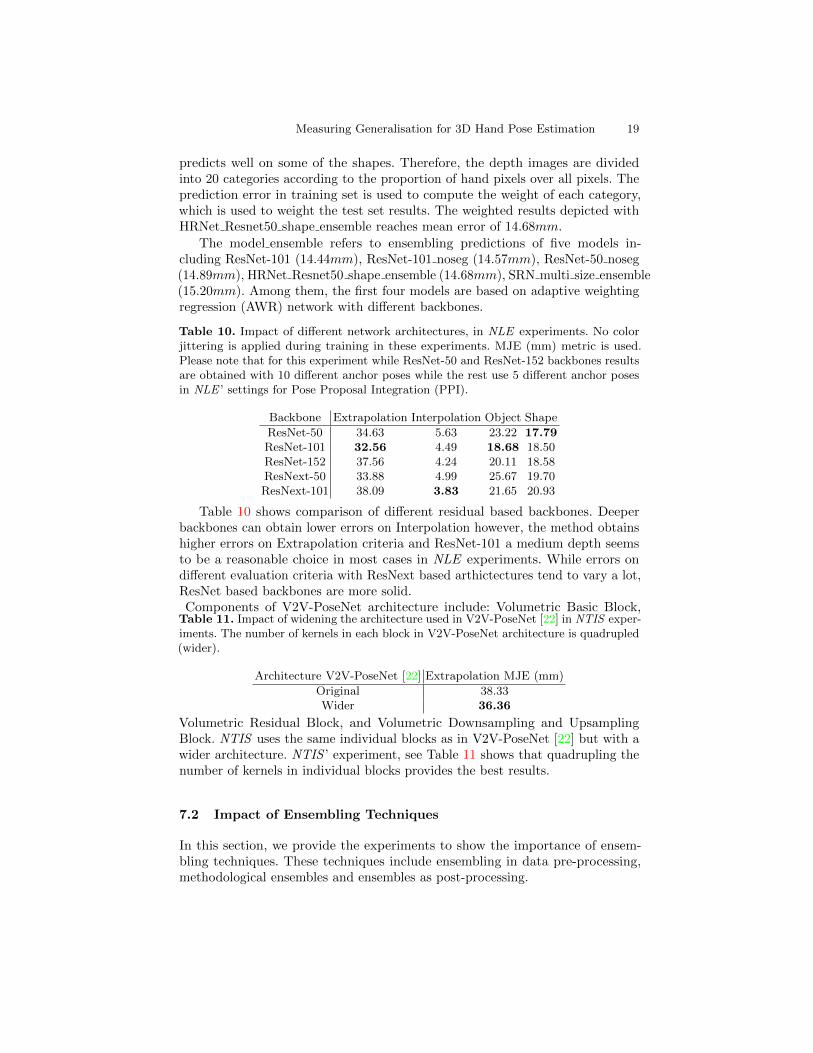
predicts well on some of the shapes. Therefore, the depth images are dividedinto 20 categories according to the proportion of hand pixels over all pixels. Theprediction error in training set is used to compute the weight of each category,which is used to weight the test set results. The weighted results depicted withHRNet Resnet50 shape ensemble reaches mean error of 14.68mm.
The model ensemble refers to ensembling predictions of five models in-cluding ResNet-101 (14.44mm), ResNet-101 noseg (14.57mm), ResNet-50 noseg(14.89mm), HRNet Resnet50 shape ensemble (14.68mm), SRN multi size ensemble(15.20mm). Among them, the first four models are based on adaptive weightingregression (AWR) network with different backbones.
Table 10. Impact of different network architectures, in NLE experiments. No colorjittering is applied during training in these experiments. MJE (mm) metric is used.Please note that for this experiment while ResNet-50 and ResNet-152 backbones resultsare obtained with 10 different anchor poses while the rest use 5 different anchor posesin NLE ’ settings for Pose Proposal Integration (PPI).
Backbone Extrapolation Interpolation Object Shape
ResNet-50 34.63 5.63 23.22 17.79ResNet-101 32.56 4.49 18.68 18.50ResNet-152 37.56 4.24 20.11 18.58ResNext-50 33.88 4.99 25.67 19.70ResNext-101 38.09 3.83 21.65 20.93
Table 10 shows comparison of different residual based backbones. Deeperbackbones can obtain lower errors on Interpolation however, the method obtainshigher errors on Extrapolation criteria and ResNet-101 a medium depth seemsto be a reasonable choice in most cases in NLE experiments. While errors ondifferent evaluation criteria with ResNext based arthictectures tend to vary a lot,ResNet based backbones are more solid.Components of V2V-PoseNet architecture include: Volumetric Basic Block,
Table 11. Impact of widening the architecture used in V2V-PoseNet [22] in NTIS exper-iments. The number of kernels in each block in V2V-PoseNet architecture is quadrupled(wider).
Architecture V2V-PoseNet [22] Extrapolation MJE (mm)
Original 38.33Wider 36.36
Volumetric Residual Block, and Volumetric Downsampling and UpsamplingBlock. NTIS uses the same individual blocks as in V2V-PoseNet [22] but with awider architecture. NTIS ’ experiment, see Table 11 shows that quadrupling thenumber of kernels in individual blocks provides the best results.
7.2 Impact of Ensembling Techniques
In this section, we provide the experiments to show the importance of ensem-bling techniques. These techniques include ensembling in data pre-processing,methodological ensembles and ensembles as post-processing.
20 Armagan et al.
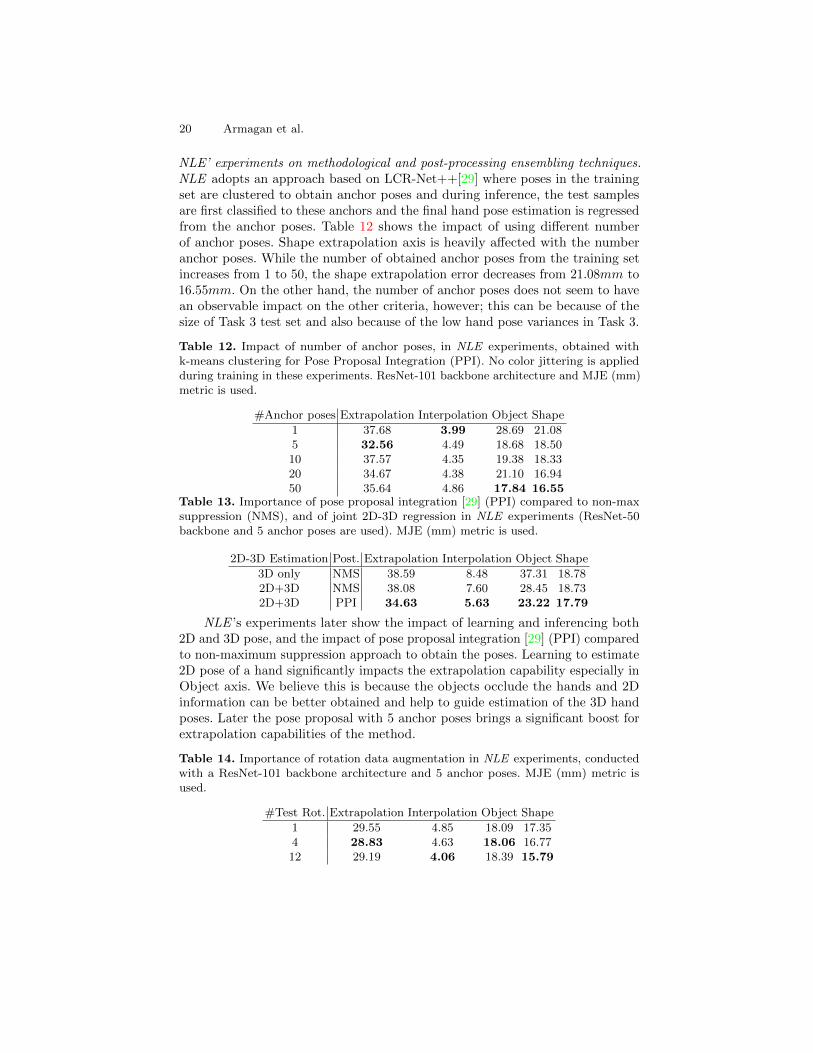
NLE’ experiments on methodological and post-processing ensembling techniques.NLE adopts an approach based on LCR-Net++[29] where poses in the trainingset are clustered to obtain anchor poses and during inference, the test samplesare first classified to these anchors and the final hand pose estimation is regressedfrom the anchor poses. Table 12 shows the impact of using different numberof anchor poses. Shape extrapolation axis is heavily affected with the numberanchor poses. While the number of obtained anchor poses from the training setincreases from 1 to 50, the shape extrapolation error decreases from 21.08mm to16.55mm. On the other hand, the number of anchor poses does not seem to havean observable impact on the other criteria, however; this can be because of thesize of Task 3 test set and also because of the low hand pose variances in Task 3.
Table 12. Impact of number of anchor poses, in NLE experiments, obtained withk-means clustering for Pose Proposal Integration (PPI). No color jittering is appliedduring training in these experiments. ResNet-101 backbone architecture and MJE (mm)metric is used.
#Anchor poses Extrapolation Interpolation Object Shape
1 37.68 3.99 28.69 21.085 32.56 4.49 18.68 18.5010 37.57 4.35 19.38 18.3320 34.67 4.38 21.10 16.9450 35.64 4.86 17.84 16.55
Table 13. Importance of pose proposal integration [29] (PPI) compared to non-maxsuppression (NMS), and of joint 2D-3D regression in NLE experiments (ResNet-50backbone and 5 anchor poses are used). MJE (mm) metric is used.
2D-3D Estimation Post. Extrapolation Interpolation Object Shape
3D only NMS 38.59 8.48 37.31 18.782D+3D NMS 38.08 7.60 28.45 18.732D+3D PPI 34.63 5.63 23.22 17.79
NLE ’s experiments later show the impact of learning and inferencing both2D and 3D pose, and the impact of pose proposal integration [29] (PPI) comparedto non-maximum suppression approach to obtain the poses. Learning to estimate2D pose of a hand significantly impacts the extrapolation capability especially inObject axis. We believe this is because the objects occlude the hands and 2Dinformation can be better obtained and help to guide estimation of the 3D handposes. Later the pose proposal with 5 anchor poses brings a significant boost forextrapolation capabilities of the method.
Table 14. Importance of rotation data augmentation in NLE experiments, conductedwith a ResNet-101 backbone architecture and 5 anchor poses. MJE (mm) metric isused.
#Test Rot. Extrapolation Interpolation Object Shape
1 29.55 4.85 18.09 17.354 28.83 4.63 18.06 16.7712 29.19 4.06 18.39 15.79
Measuring Generalisation for 3D Hand Pose Estimation 21
NLE adopts another ensembling technique in the post-processing stagewhere test images are rotated by uniformly covering the space and the predictionsobtained from each rotated test sample is ensembled. Experiments of NLE showthat rotation as a post-processing ensemble technique helps significantly onshape extrapolation as well as interpolation axis and has minor impacts on otherextrapolation criteria. Table 14 shows the impact of different number of rotationensembles.
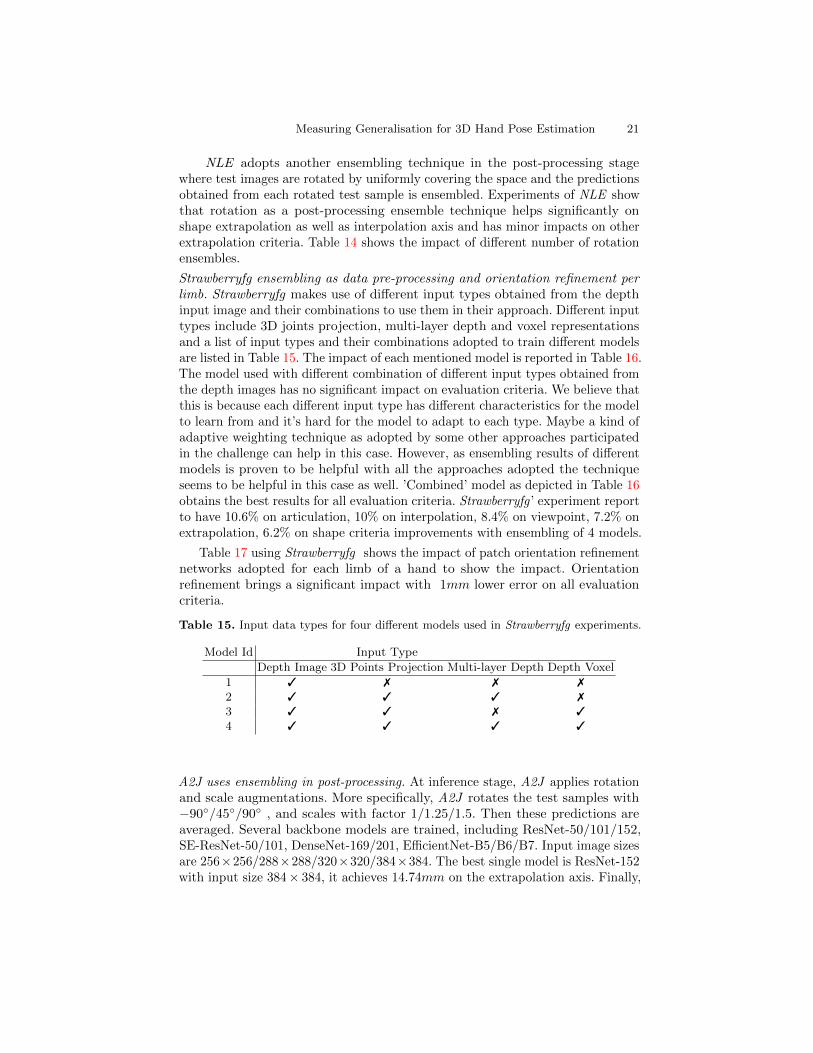
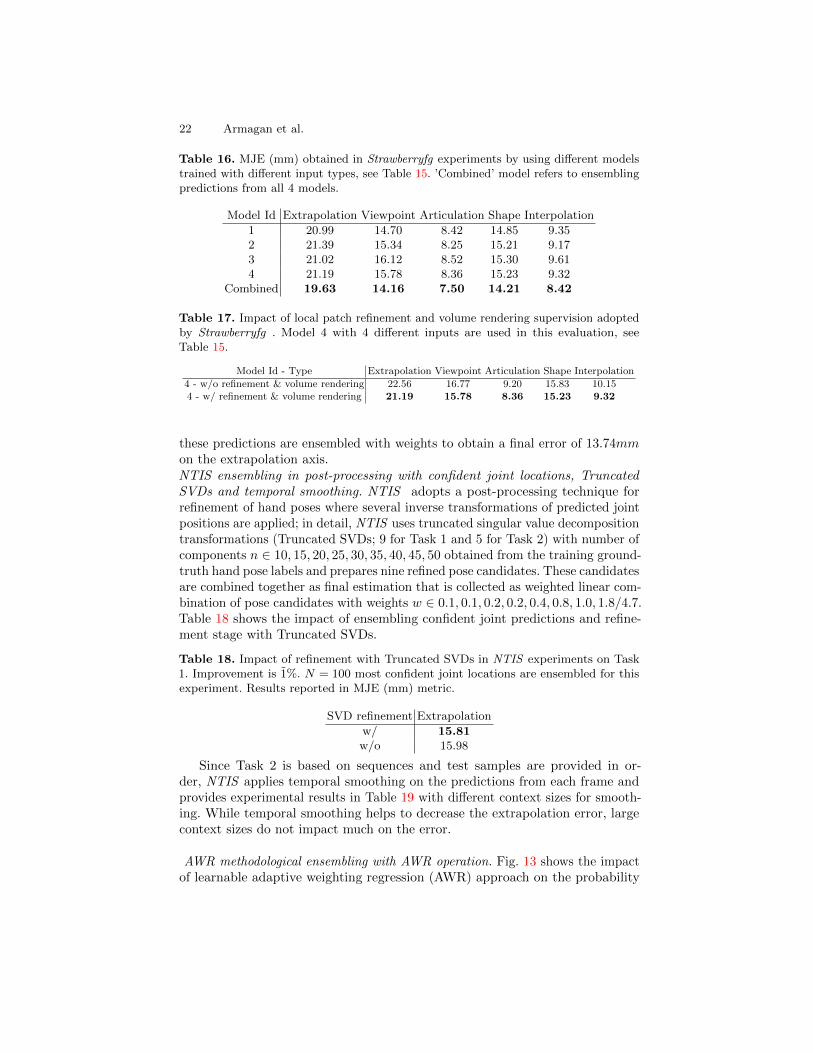
Strawberryfg ensembling as data pre-processing and orientation refinement perlimb. Strawberryfg makes use of different input types obtained from the depthinput image and their combinations to use them in their approach. Different inputtypes include 3D joints projection, multi-layer depth and voxel representationsand a list of input types and their combinations adopted to train different modelsare listed in Table 15. The impact of each mentioned model is reported in Table 16.The model used with different combination of different input types obtained fromthe depth images has no significant impact on evaluation criteria. We believe thatthis is because each different input type has different characteristics for the modelto learn from and it’s hard for the model to adapt to each type. Maybe a kind ofadaptive weighting technique as adopted by some other approaches participatedin the challenge can help in this case. However, as ensembling results of differentmodels is proven to be helpful with all the approaches adopted the techniqueseems to be helpful in this case as well. ’Combined’ model as depicted in Table 16obtains the best results for all evaluation criteria. Strawberryfg ’ experiment reportto have 10.6% on articulation, 10% on interpolation, 8.4% on viewpoint, 7.2% onextrapolation, 6.2% on shape criteria improvements with ensembling of 4 models.
Table 17 using Strawberryfg shows the impact of patch orientation refinementnetworks adopted for each limb of a hand to show the impact. Orientationrefinement brings a significant impact with 1mm lower error on all evaluationcriteria.
Table 15. Input data types for four different models used in Strawberryfg experiments.
Model Id Input Type
Depth Image 3D Points Projection Multi-layer Depth Depth Voxel
1 3 7 7 7
2 3 3 3 7
3 3 3 7 3
4 3 3 3 3
A2J uses ensembling in post-processing. At inference stage, A2J applies rotationand scale augmentations. More specifically, A2J rotates the test samples with−90◦/45◦/90◦ , and scales with factor 1/1.25/1.5. Then these predictions areaveraged. Several backbone models are trained, including ResNet-50/101/152,SE-ResNet-50/101, DenseNet-169/201, EfficientNet-B5/B6/B7. Input image sizesare 256×256/288×288/320×320/384×384. The best single model is ResNet-152with input size 384× 384, it achieves 14.74mm on the extrapolation axis. Finally,
22 Armagan et al.
Table 16. MJE (mm) obtained in Strawberryfg experiments by using different modelstrained with different input types, see Table 15. ’Combined’ model refers to ensemblingpredictions from all 4 models.
Model Id Extrapolation Viewpoint Articulation Shape Interpolation
1 20.99 14.70 8.42 14.85 9.352 21.39 15.34 8.25 15.21 9.173 21.02 16.12 8.52 15.30 9.614 21.19 15.78 8.36 15.23 9.32
Combined 19.63 14.16 7.50 14.21 8.42
Table 17. Impact of local patch refinement and volume rendering supervision adoptedby Strawberryfg . Model 4 with 4 different inputs are used in this evaluation, seeTable 15.
Model Id - Type Extrapolation Viewpoint Articulation Shape Interpolation
4 - w/o refinement & volume rendering 22.56 16.77 9.20 15.83 10.154 - w/ refinement & volume rendering 21.19 15.78 8.36 15.23 9.32
these predictions are ensembled with weights to obtain a final error of 13.74mmon the extrapolation axis.NTIS ensembling in post-processing with confident joint locations, TruncatedSVDs and temporal smoothing. NTIS adopts a post-processing technique forrefinement of hand poses where several inverse transformations of predicted jointpositions are applied; in detail, NTIS uses truncated singular value decompositiontransformations (Truncated SVDs; 9 for Task 1 and 5 for Task 2) with number ofcomponents n ∈ 10, 15, 20, 25, 30, 35, 40, 45, 50 obtained from the training ground-truth hand pose labels and prepares nine refined pose candidates. These candidatesare combined together as final estimation that is collected as weighted linear com-bination of pose candidates with weights w ∈ 0.1, 0.1, 0.2, 0.2, 0.4, 0.8, 1.0, 1.8/4.7.Table 18 shows the impact of ensembling confident joint predictions and refine-ment stage with Truncated SVDs.
Table 18. Impact of refinement with Truncated SVDs in NTIS experiments on Task1. Improvement is 1%. N = 100 most confident joint locations are ensembled for thisexperiment. Results reported in MJE (mm) metric.
SVD refinement Extrapolation
w/ 15.81w/o 15.98
Since Task 2 is based on sequences and test samples are provided in or-der, NTIS applies temporal smoothing on the predictions from each frame andprovides experimental results in Table 19 with different context sizes for smooth-ing. While temporal smoothing helps to decrease the extrapolation error, largecontext sizes do not impact much on the error.
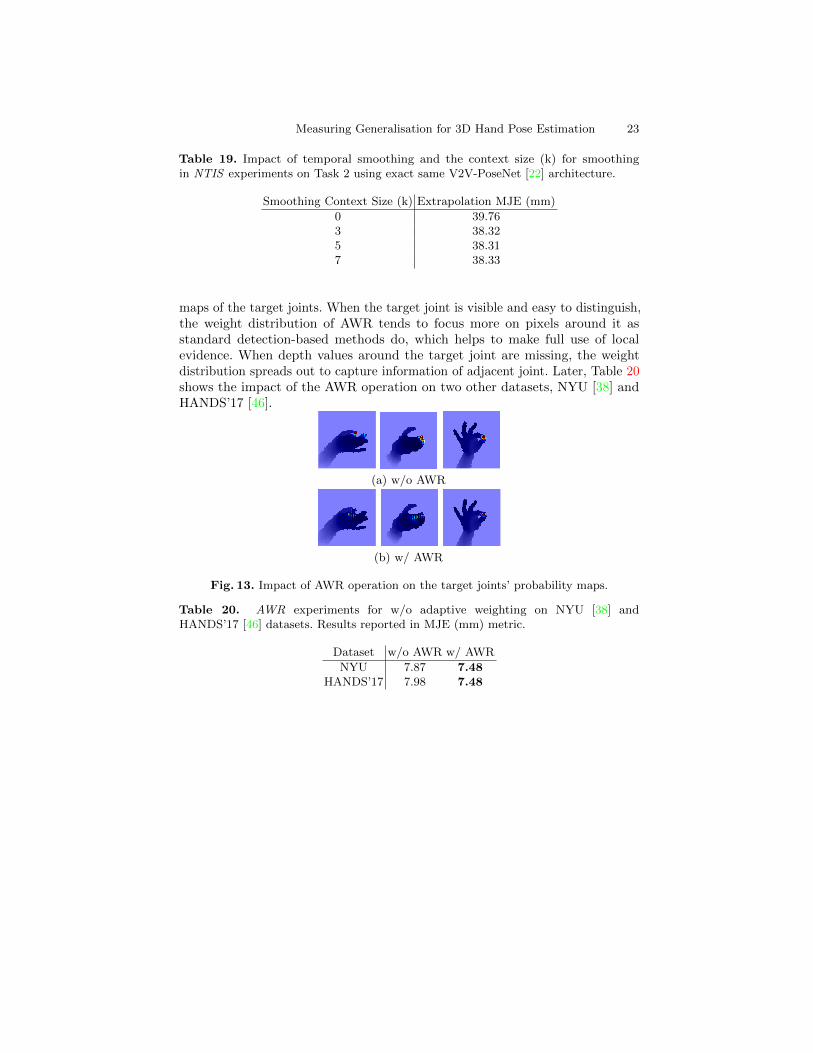
AWR methodological ensembling with AWR operation. Fig. 13 shows the impactof learnable adaptive weighting regression (AWR) approach on the probability
Measuring Generalisation for 3D Hand Pose Estimation 23
Table 19. Impact of temporal smoothing and the context size (k) for smoothingin NTIS experiments on Task 2 using exact same V2V-PoseNet [22] architecture.
Smoothing Context Size (k) Extrapolation MJE (mm)
0 39.763 38.325 38.317 38.33
maps of the target joints. When the target joint is visible and easy to distinguish,the weight distribution of AWR tends to focus more on pixels around it asstandard detection-based methods do, which helps to make full use of localevidence. When depth values around the target joint are missing, the weightdistribution spreads out to capture information of adjacent joint. Later, Table 20shows the impact of the AWR operation on two other datasets, NYU [38] andHANDS’17 [46].
(a) w/o AWR
(b) w/ AWR
Fig. 13. Impact of AWR operation on the target joints’ probability maps.
Table 20. AWR experiments for w/o adaptive weighting on NYU [38] andHANDS’17 [46] datasets. Results reported in MJE (mm) metric.
Dataset w/o AWR w/ AWR
NYU 7.87 7.48HANDS’17 7.98 7.48
24 Armagan et al.
8 Conclusion
We carefully designed structured training and test sets for 3D HPEs and organizeda challenge for the hand pose community to show state-of-the-art methodsstill tend to fail to extrapolate on large pose spaces. Our analyses highlightthe impacts of using ensembles, the use of synthetic images, different type ofHPEs e.g . 2D, 3D or local-estimators and post-processing. Ensemble techniques,both methodologically in 2D and 3D HPEs and in post-processing, help manyapproaches to boost their performance on extrapolation. The submitted HPEswere proven to be successful while interpolating in all the tasks, but theirextrapolation capabilities vary significantly. Scenarios such as hands interactingwith objects present the biggest challenges to extrapolate by most of the evaluatedmethods both in depth and RGB modalities.Given the limited extrapolation capabilities of the methods, usage of syntheticdata is appealing. Only a few methods actually were making use of syntheticdata to improve extrapolation. 570K synthetic images used by the winner ofTask 1 is still a very small number compared to how large, potentially infinite,it could be. We believe that investigating these possibilities, jointly with datasub-sampling strategies and real-synthetic domain adaptation is a promising andinteresting line of work. The question of what would be the outcome if we sample‘dense enough’ in the continuous and infinite pose space and how ’dense enough’is defined when we are limited by hardware and time is significant to answer.Acknowledgements. This work is partially supported by Huawei TechnologiesCo. Ltd. and Samsung Electronics. S. Baek was supported by IITP funds fromMSIT of Korea (No. 2020-0-01336 AIGS of UNIST, No. 2020-0-00537 Developmentof 5G based low latency device - edge cloud interaction technology).
Measuring Generalisation for 3D Hand Pose Estimation 25
References
1. Baek, S., Kim, K.I., Kim, T.K.: Pushing the envelope for RGB-based dense 3Dhand pose estimation via neural rendering. In: CVPR (2019) 6, 7
2. Bhattarai, B., Baek, S., Bodur, R., Kim, T.K.: Sampling strategies for GANsynthetic data. In: ICASSP (2020) 11
3. Boukhayma, A., de Bem, R., Torr, P.H.: 3D hand shape and pose from images inthe wild. In: CVPR (2019) 6
4. Cubuk, E.D., Zoph, B., Mane, D., Vasudevan, V., Le, Q.V.: AutoAugment: Learningaugmentation strategies from data. In: CVPR (2019) 11
5. Feng, Z.H., Kittler, J., Awais, M., Huber, P., Wu, X.J.: Wing loss for robust faciallandmark localisation with convolutional neural networks. In: CVPR (2018) 9
6. Garcia-Hernando, G., Yuan, S., Baek, S., Kim, T.K.: First-person hand actionbenchmark with RGB-D videos and 3D hand pose annotations. In: CVPR (2018)2, 3, 4
7. Ge, L., Liang, H., Yuan, J., Thalmann, D.: Robust 3D hand pose estimation insingle depth images: from single-view CNN to multi-view CNNs. In: CVPR (2016)11
8. Ge, L., Ren, Z., Li, Y., Xue, Z., Wang, Y., Cai, J., Yuan, J.: 3D hand shape andpose estimation from a single RGB image. In: CVPR (2019) 6
9. Hampali, S., Oberweger, M., Rad, M., Lepetit, V.: HO-3D: A multi-user, multi-object dataset for joint 3D hand-object pose estimation. In: arXiv preprintarXiv:1907.01481v1 (2019) 4, 9, 11, 31
10. Hasson, Y., Varol, G., Tzionas, D., Kalevatykh, I., Black, M.J., Laptev, I., Schmid,C.: 3D hand shape and pose estimation from a single RGB image. In: CVPR (2019)6
11. He, K., Zhang, X., Ren, S., Sun, J.: Deep residual learning for image recognition.In: CVPR (2016) 2, 3, 11, 17
12. Hu, J., Shen, L., Albanie, S., Sun, G., Wu, E.: Squeeze-and-excitation networks. In:CVPR (2018) 9
13. Huang, W., Ren, P., Wang, J., Qi, Q., Sun, H.: AWR: Adaptive weighting regressionfor 3D hand pose estimation. In: AAAI (2020) 8, 9
14. Iqbal, U., Molchanov, P., Breuel, T., Gall, J., Kautz, J.: Hand pose estimation vialatent 2.5D heatmap regression. In: ECCV (2018) 8
15. Joo, H., Liu, H., Tan, L., Gui, L., Nabbe, B., Matthews, I., Kanade, T., Nobuhara,S., Sheikh, Y.: Panoptic studio: a massively multiview system for social motioncapture. In: ICCV (2015) 3
16. Kanazawa, A., Tulsiani, S., Efros, A.A., Malik, J.: Learning category-specific meshreconstruction from image collections. In: ECCV (2018) 7
17. Kennedy, J., Eberhart, R.: Particle Swarm Optimization. In: ICNN (1995) 2
18. Kolotouros, N., Pavlakos, G., Black, M.J., Daniilidis, K.: Learning to reconstruct3D human pose and shape via model-fitting in the loop. In: ICCV (2019) 6
19. Li, S., Lee, D.: Point-to-pose voting based hand pose estimation using residualpermutation equivariant layer. In: CVPR (2019) 8, 9, 11
20. Lin, J., Wu, Y., Huang, T.S.: Modeling the constraints of human hand motion. In:HUMO (2000) 6
21. Mehta, S., Rastegari, M., Caspi, A., Shapiro, L., Hajishirzi, H.: ESPNet: Efficientspatial pyramid of dilated convolutions for semantic segmentation. In: ECCV (2018)9, 18
26 Armagan et al.
22. Moon, G., Chang, J.Y., Lee, K.M.: V2V-PoseNet: Voxel-to-voxel prediction networkfor accurate 3D hand and human pose estimation from a single depth map. In:CVPR (2018) 8, 9, 11, 19, 23
23. Mueller, F., Bernard, F., Sotnychenko, O., Mehta, D., Sridhar, S., Casas, D.,Theobalt, C.: GANerated hands for real-time 3D hand tracking from monocularRGB. In: CVPR (2018) 2, 11
24. Mueller, F., Mehta, D., Sotnychenko, O., Sridhar, S., Casas, D., Theobalt, C.:Real-time hand tracking under occlusion from an egocentric RGB-D sensor. In:ICCV (2017) 2
25. Oberweger, M., Lepetit, V.: DeepPrior++: Improving fast and accurate 3D handpose estimation. In: ICCV Workshop on HANDS (2017) 2
26. Oikonomidis, I., Kyriazis, N., Argyros., A.A.: Efficient model-based 3D tracking ofhand articulations using kinect. In: BMVC (2011) 2, 5
27. Ren, P., Sun, H., Qi, Q., Wang, J., Huang, W.: SRN: Stacked regression networkfor real-time 3D hand pose estimation. In: BMVC (2019) 9, 18
28. Ren, S., He, K., Girshick, R., Sun, J.: Faster R-CNN: Towards real-time objectdetection with region proposal networks. In: NIPS (2015) 8, 9
29. Rogez, G., Weinzaepfel, P., Schmid, C.: LCR-Net++: Multi-person 2D and 3D posedetection in natural images. IEEE Transactions on Pattern Analysis and MachineIntelligence 42(5), 1146–1161 (2019) 8, 9, 10, 20
30. Romero, J., Tzionas, D., Black, M.J.: Embodied Hands: Modeling and capturinghands and bodies together. ACM Transactions on Graphics (Proc. SIGGRAPHAsia) 36(6), 245:1–245:17 (2017) 3, 6, 7, 9, 10
31. Shin, D., Ren, Z., Sudderth, E.B., Fowlkes, C.C.: Multi-layer depth and epipolarfeature transformers for 3D scene reconstruction. In: CVPR Workshops (2019) 11
32. Simon, T., Joo, H., Matthews, I., Sheikh, Y.: Hand keypoint detection in singleimages using multiview bootstrapping. In: CVPR (2017) 3
33. Sinha, A., Choi, C., Ramani, K.: DeepHand: Robust hand pose estimation bycompleting a matrix imputed with deep features. In: CVPR (2016) 9
34. Spurr, A., Iqbal, U., Molchanov, P., Hilliges, O., Kautz, J.: Weakly supervised 3Dhand pose estimation via biomechanical constraints. arXiv preprint arXiv:2003.09282(2020) 8, 9
35. Sun, K., Xiao, B., Liu, D., Wang, J.: Deep high-resolution representation learningfor human pose estimation. In: CVPR (2019) 9
36. Sun, X., Xiao, B., Wei, F., Liang, S., Wei, Y.: Integral human pose regression. In:ECCV (2018) 8, 9, 10
37. Tan, M., Le, Q.V.: EfficientNet: Rethinking model scaling for convolutional neuralnetworks. In: ICML (2019) 9, 11
38. Tompson, J., Stein, M., Lecun, Y., Perlin, K.: Real-time continuous pose recoveryof human hands using convolutional networks. TOG (2014) 23
39. Tung, H.Y.F., Tung, H.W., Yumer, E., Fragkiadaki, K.: Self-supervised learning ofmotion capture. In: NIPS (2017) 7
40. Wan, Q.: SenoritaHand: Analytical 3D skeleton renderer and patch-based refinementfor HANDS19 challenge Task 1 - Depth-based 3D hand pose estimation (Dec 2019),https://github.com/strawberryfg/Senorita-HANDS19-Pose 8, 9
41. Wan, Q., Qiu, W., Yuille, A.L.: Patch-based 3D human pose refinement. In: CVPRW(2019) 10
42. Xiang, Y., Schmidt, T., Narayanan, V., Fox, D.: A convolutional neural networkfor 6D object pose estimation in cluttered scenes. In: RSS (2018) 4
Measuring Generalisation for 3D Hand Pose Estimation 27
43. Xiong, F., Zhang, B., Xiao, Y., Cao, Z., Yu, T., Zhou, J.T., Yuan, J.: A2J: Anchor-to-joint regression network for 3D articulated pose estimation from a single depthimage. In: ICCV (2019) 8, 9
44. Yang, L., Li, S., Lee, D., Yao, A.: Aligning latent spaces for 3D hand pose estimation.In: ICCV (2019) 9, 11
45. Yang, Y., Feng, C., Shen, Y., Tian, D.: FoldingNet: Point cloud auto-encoder viadeep grid deformation. In: CVPR (2018) 9
46. Yuan, S., Ye, Q., Garcia-Hernando, G., Kim, T.K.: The 2017 hands in the millionchallenge on 3d hand pose estimation. arXiv preprint arXiv:1707.02237 (2017) 3,17, 23, 31
47. Yuan, S., Garcia-Hernando, G., Stenger, B., Moon, G., Chang, J.Y., Lee, K.M.,Molchanov, P., Kautz, J., Honari, S., Ge, L., Yuan, J., Chen, X., Wang, G., Yang,F., Akiyama, K., Wu, Y., Wan, Q., Madadi, M., Escalera, S., Li, S., Lee, D.,Oikonomidis, I., Argyros, A., Kim, T.K.: Depth-based 3D hand pose estimation:From current achievements to future goals. In: CVPR (2018) 2, 7
48. Yuan, S., Ye, Q., Stenger, B., Jain, S., Kim, T.K.: BigHand 2.2M Benchmark: handpose data set and state of the art analysis. In: CVPR (2017) 2, 3, 4
49. Zhang, X., Li, Q., Mo, H., Zhang, W., Zheng, W.: End-to-end hand mesh recoveryfrom a monocular RGB image. In: ICCV (2019) 6
50. Zhang, Z., Xie, S., Chen, M., Zhu, H.: HandAugment: A simple data augmentationmethod for depth-based 3D hand pose estimation. arXiv preprint arXiv:2001.00702(2020) 8, 9, 10, 13
51. Zhou, X., Wan, Q., Zhang, W., Xue, X., Wei, Y.: Model-based deep hand poseestimation. In: IJCAI (2016) 9
52. Zimmermann, C., Brox, T.: Learning to estimate 3D hand pose from single RGBimages. In: ICCV (2017) 3
28 Armagan et al.
A Appendix
A.1 Frame Success Rates for All Participated Users in theChallenge
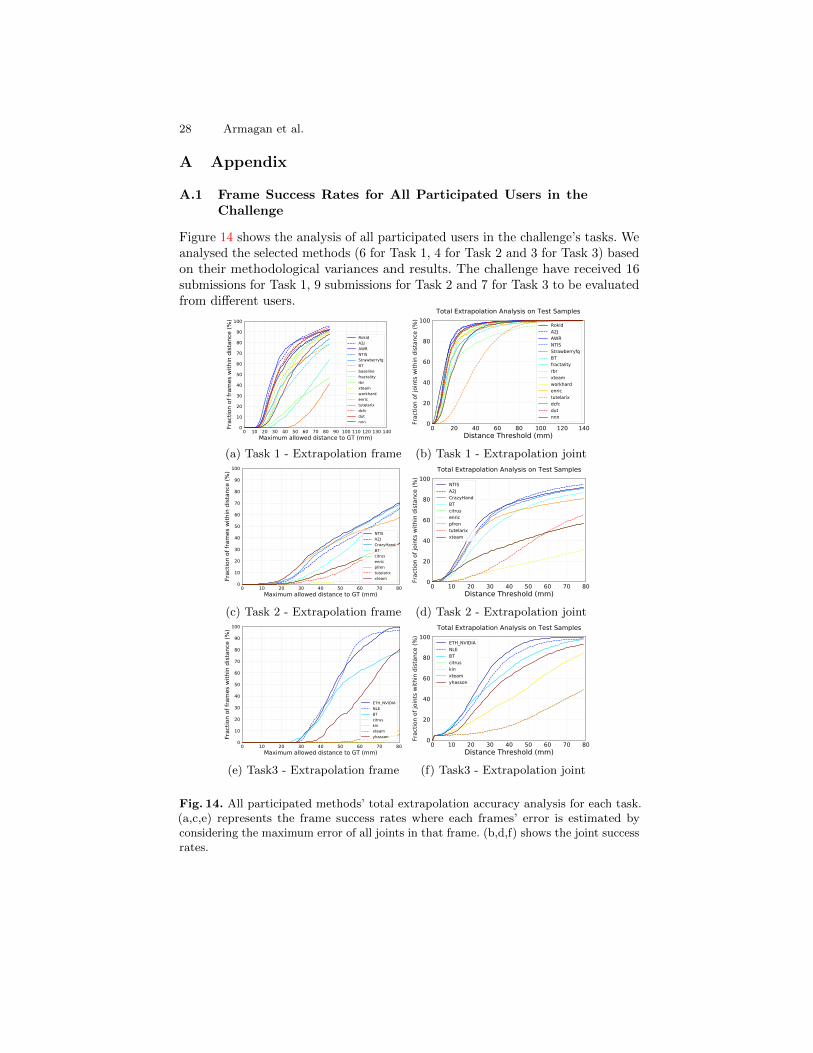
Figure 14 shows the analysis of all participated users in the challenge’s tasks. Weanalysed the selected methods (6 for Task 1, 4 for Task 2 and 3 for Task 3) basedon their methodological variances and results. The challenge have received 16submissions for Task 1, 9 submissions for Task 2 and 7 for Task 3 to be evaluatedfrom different users.
0 10 20 30 40 50 60 70 80 90 100 110 120 130 140Maximum allowed distance to GT (mm)
0
10
20
30
40
50
60
70
80
90
100
Frac
tion
of fr
ames
with
in d
istan
ce (%
)
RokidA2JAWRNTISStrawberryfgBTbaselinefractalityrbrxteamworkhardenrictutelarixdcfcdutnnn
0 20 40 60 80 100 120 140Distance Threshold (mm)
0
20
40
60
80
100
Frac
tion
of jo
ints
with
in d
istan
ce (%
)
Total Extrapolation Analysis on Test SamplesRokidA2JAWRNTISStrawberryfgBTfractalityrbrxteamworkhardenrictutelarixdcfcdutnnn
(a) Task 1 - Extrapolation frame (b) Task 1 - Extrapolation joint
0 10 20 30 40 50 60 70 80Maximum allowed distance to GT (mm)
0
10
20
30
40
50
60
70
80
90
100
Frac
tion
of fr
ames
with
in d
istan
ce (%
)
NTISA2JCrazyHandBTcitrusenricpfrentutelarixxteam
0 10 20 30 40 50 60 70 80Distance Threshold (mm)
0
20
40
60
80
100
Frac
tion
of jo
ints
with
in d
istan
ce (%
)
Total Extrapolation Analysis on Test Samples
NTISA2JCrazyHandBTcitrusenricpfrentutelarixxteam
(c) Task 2 - Extrapolation frame (d) Task 2 - Extrapolation joint
0 10 20 30 40 50 60 70 80Maximum allowed distance to GT (mm)
0
10
20
30
40
50
60
70
80
90
100
Frac
tion
of fr
ames
with
in d
istan
ce (%
)
ETH_NVIDIANLEBTcitruskinxteamyhasson
0 10 20 30 40 50 60 70 80Distance Threshold (mm)
0
20
40
60
80
100
Frac
tion
of jo
ints
with
in d
istan
ce (%
)
Total Extrapolation Analysis on Test Samples
ETH_NVIDIANLEBTcitruskinxteamyhasson
(e) Task3 - Extrapolation frame (f) Task3 - Extrapolation joint
Fig. 14. All participated methods’ total extrapolation accuracy analysis for each task.(a,c,e) represents the frame success rates where each frames’ error is estimated byconsidering the maximum error of all joints in that frame. (b,d,f) shows the joint successrates.
Measuring Generalisation for 3D Hand Pose Estimation 29
A.2 Joint Success Rates of the Analysed Approaches
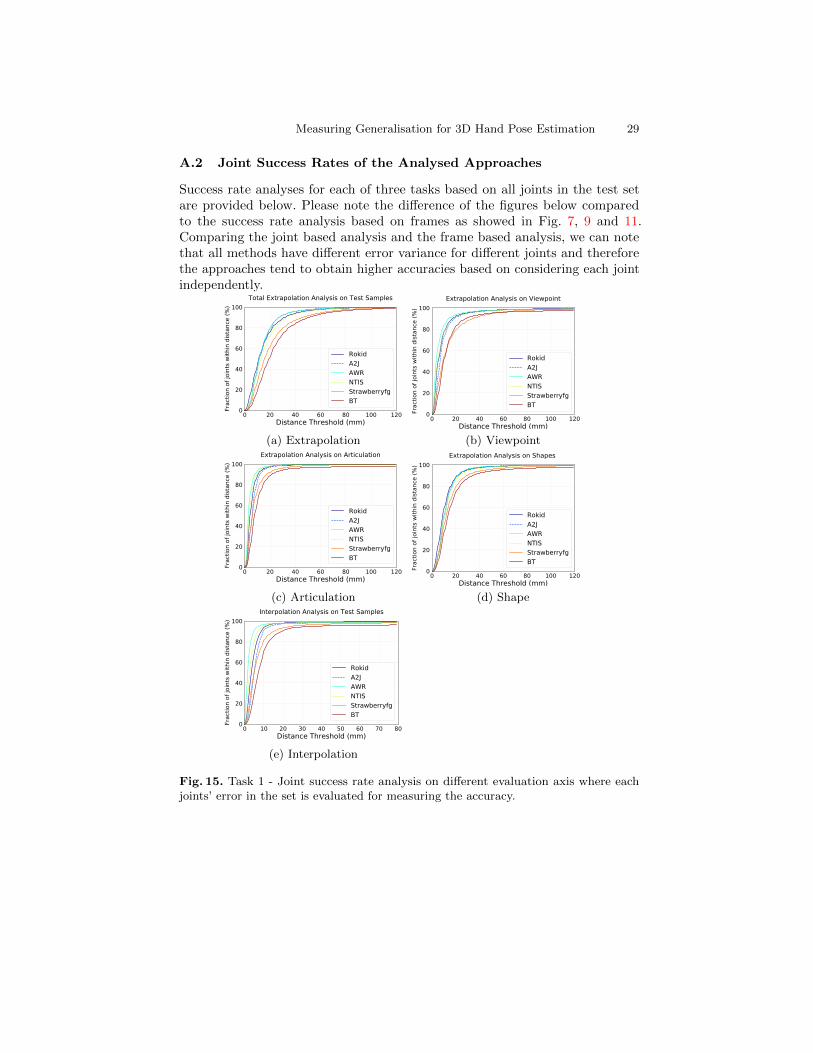
Success rate analyses for each of three tasks based on all joints in the test setare provided below. Please note the difference of the figures below comparedto the success rate analysis based on frames as showed in Fig. 7, 9 and 11.Comparing the joint based analysis and the frame based analysis, we can notethat all methods have different error variance for different joints and thereforethe approaches tend to obtain higher accuracies based on considering each jointindependently.
0 20 40 60 80 100 120Distance Threshold (mm)
0
20
40
60
80
100
Frac
tion
of jo
ints
with
in d
istan
ce (%
)
Total Extrapolation Analysis on Test Samples
RokidA2JAWRNTISStrawberryfgBT
0 20 40 60 80 100 120Distance Threshold (mm)
0
20
40
60
80
100
Frac
tion
of jo
ints
with
in d
istan
ce (%
)
Extrapolation Analysis on Viewpoint
RokidA2JAWRNTISStrawberryfgBT
(a) Extrapolation (b) Viewpoint
0 20 40 60 80 100 120Distance Threshold (mm)
0
20
40
60
80
100
Frac
tion
of jo
ints
with
in d
istan
ce (%
)
Extrapolation Analysis on Articulation
RokidA2JAWRNTISStrawberryfgBT
0 20 40 60 80 100 120Distance Threshold (mm)
0
20
40
60
80
100
Frac
tion
of jo
ints
with
in d
istan
ce (%
)
Extrapolation Analysis on Shapes
RokidA2JAWRNTISStrawberryfgBT
(c) Articulation (d) Shape
0 10 20 30 40 50 60 70 80Distance Threshold (mm)
0
20
40
60
80
100
Frac
tion
of jo
ints
with
in d
istan
ce (%
)
Interpolation Analysis on Test Samples
RokidA2JAWRNTISStrawberryfgBT
(e) Interpolation
Fig. 15. Task 1 - Joint success rate analysis on different evaluation axis where eachjoints’ error in the set is evaluated for measuring the accuracy.
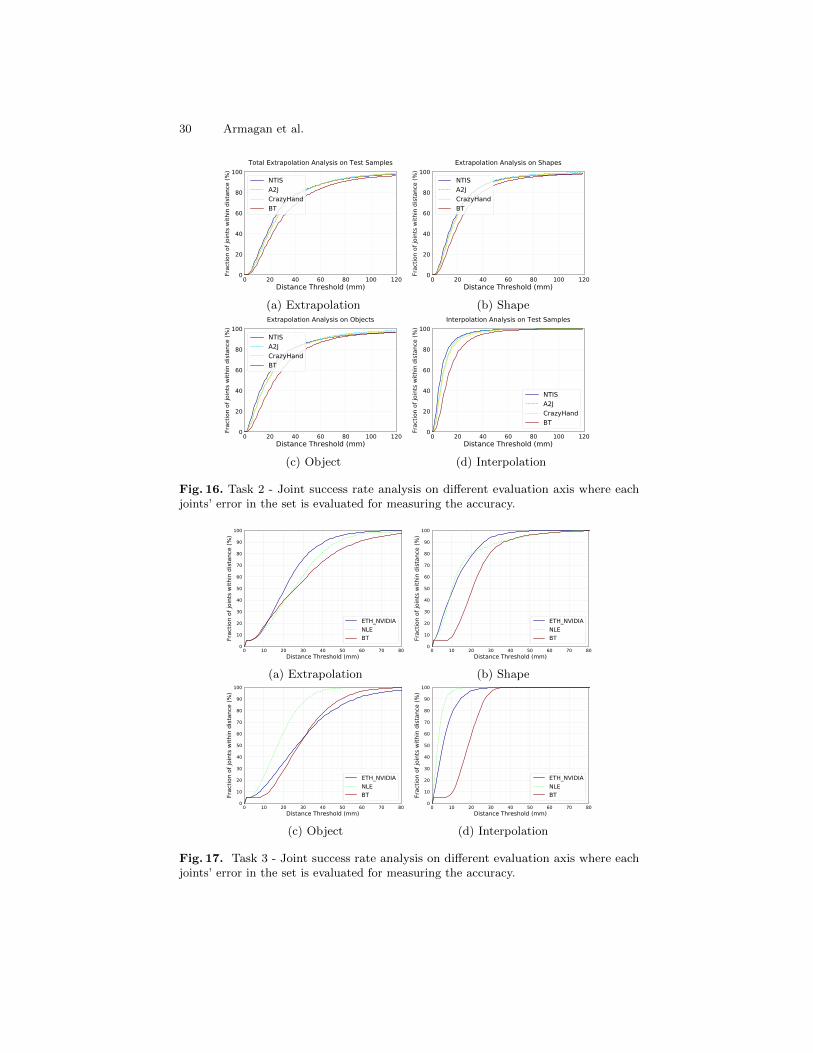
30 Armagan et al.
0 20 40 60 80 100 120Distance Threshold (mm)
0
20
40
60
80
100
Frac
tion
of jo
ints
with
in d
istan
ce (%
)
Total Extrapolation Analysis on Test Samples
NTISA2JCrazyHandBT
0 20 40 60 80 100 120Distance Threshold (mm)
0
20
40
60
80
100
Frac
tion
of jo
ints
with
in d
istan
ce (%
)
Extrapolation Analysis on Shapes
NTISA2JCrazyHandBT
(a) Extrapolation (b) Shape
0 20 40 60 80 100 120Distance Threshold (mm)
0
20
40
60
80
100
Frac
tion
of jo
ints
with
in d
istan
ce (%
)
Extrapolation Analysis on Objects
NTISA2JCrazyHandBT
0 20 40 60 80 100 120Distance Threshold (mm)
0
20
40
60
80
100
Frac
tion
of jo
ints
with
in d
istan
ce (%
)
Interpolation Analysis on Test Samples
NTISA2JCrazyHandBT
(c) Object (d) Interpolation
Fig. 16. Task 2 - Joint success rate analysis on different evaluation axis where eachjoints’ error in the set is evaluated for measuring the accuracy.
0 10 20 30 40 50 60 70 80Distance Threshold (mm)
0
10
20
30
40
50
60
70
80
90
100
Frac
tion
of jo
ints
with
in d
istan
ce (%
)
ETH_NVIDIANLEBT
0 10 20 30 40 50 60 70 80Distance Threshold (mm)
0
10
20
30
40
50
60
70
80
90
100
Frac
tion
of jo
ints
with
in d
istan
ce (%
)
ETH_NVIDIANLEBT
(a) Extrapolation (b) Shape
0 10 20 30 40 50 60 70 80Distance Threshold (mm)
0
10
20
30
40
50
60
70
80
90
100
Frac
tion
of jo
ints
with
in d
istan
ce (%
)
ETH_NVIDIANLEBT
0 10 20 30 40 50 60 70 80Distance Threshold (mm)
0
10
20
30
40
50
60
70
80
90
100
Frac
tion
of jo
ints
with
in d
istan
ce (%
)
ETH_NVIDIANLEBT
(c) Object (d) Interpolation
Fig. 17. Task 3 - Joint success rate analysis on different evaluation axis where eachjoints’ error in the set is evaluated for measuring the accuracy.
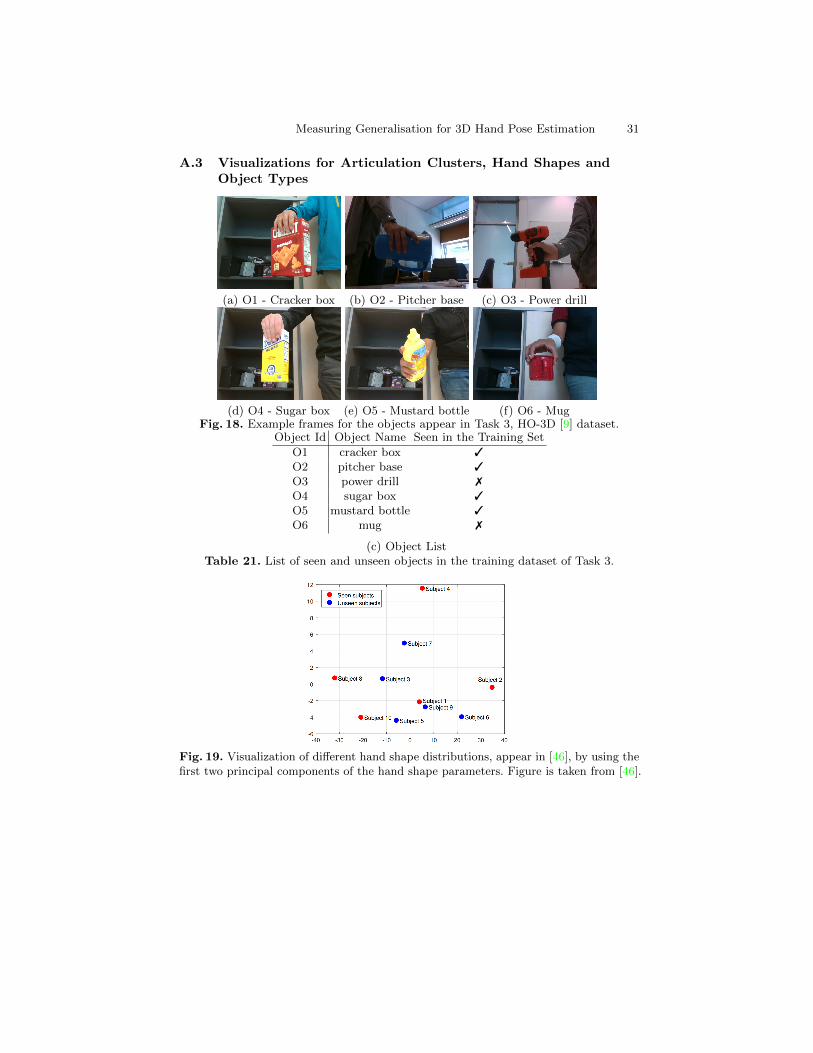
Measuring Generalisation for 3D Hand Pose Estimation 31
A.3 Visualizations for Articulation Clusters, Hand Shapes andObject Types
(a) O1 - Cracker box (b) O2 - Pitcher base (c) O3 - Power drill
(d) O4 - Sugar box (e) O5 - Mustard bottle (f) O6 - MugFig. 18. Example frames for the objects appear in Task 3, HO-3D [9] dataset.
Object Id Object Name Seen in the Training Set
O1 cracker box 3
O2 pitcher base 3
O3 power drill 7
O4 sugar box 3
O5 mustard bottle 3
O6 mug 7
(c) Object ListTable 21. List of seen and unseen objects in the training dataset of Task 3.
Fig. 19. Visualization of different hand shape distributions, appear in [46], by using thefirst two principal components of the hand shape parameters. Figure is taken from [46].
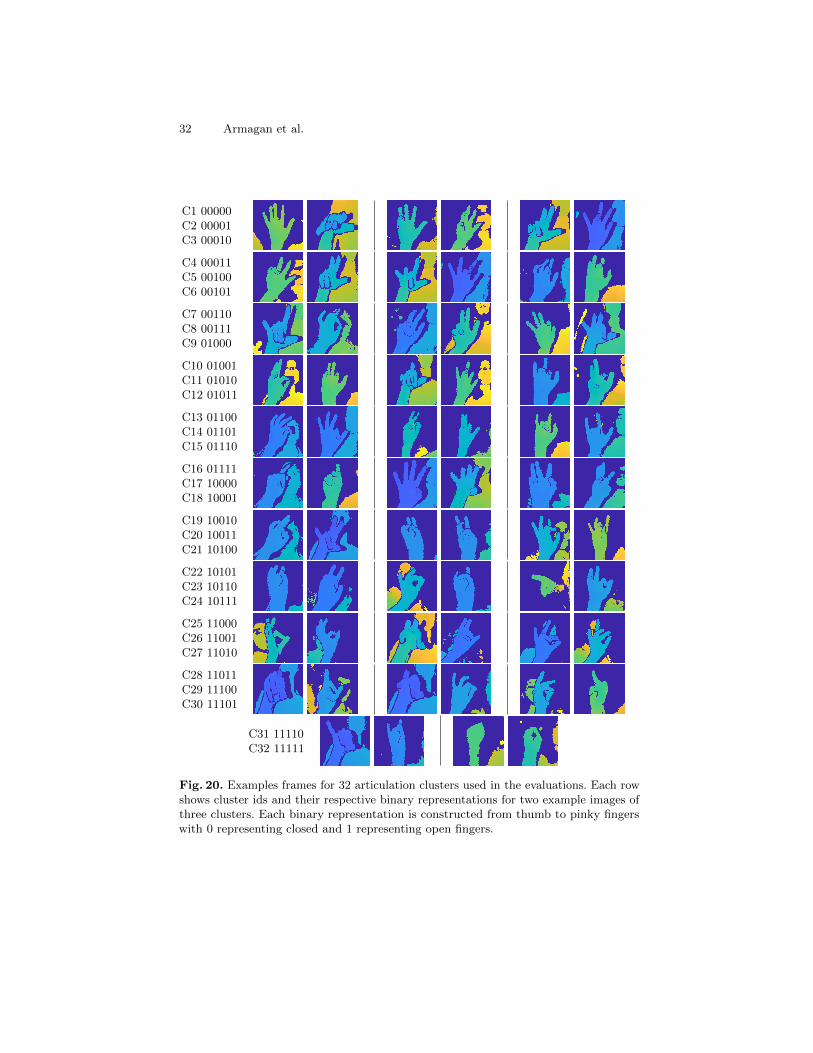
32 Armagan et al.
C1 00000C2 00001C3 00010
C4 00011C5 00100C6 00101
C7 00110C8 00111C9 01000
C10 01001C11 01010C12 01011
C13 01100C14 01101C15 01110
C16 01111C17 10000C18 10001
C19 10010C20 10011C21 10100
C22 10101C23 10110C24 10111
C25 11000C26 11001C27 11010
C28 11011C29 11100C30 11101
C31 11110C32 11111
Fig. 20. Examples frames for 32 articulation clusters used in the evaluations. Each rowshows cluster ids and their respective binary representations for two example images ofthree clusters. Each binary representation is constructed from thumb to pinky fingerswith 0 representing closed and 1 representing open fingers.


![Digital Oxymorons - Cedric Honnet · In Making 3D Printed Objects Interactive Using Wireless Accelerom-eters [9] the authors present an approach that equips 3D printed objects with](https://img.pdfslide.fr/doc/110x75/5fbd259f152a24352a03bdbd/digital-oxymorons-cedric-honnet-in-making-3d-printed-objects-interactive-using.jpg)


![Actions des groupes topologiques sur les objects …arXiv:1106.1040v6 [math.GR] 2 Feb 2012 Actions des groupes topologiques sur les objects universels Brice Rodrigue MBOMBO Département](https://img.pdfslide.fr/doc/110x75/5eccb292a0af283cb576ec53/actions-des-groupes-topologiques-sur-les-objects-arxiv11061040v6-mathgr-2-feb.jpg)