Embed Size (px)
Citation preview
UNIVERSITÉ DE STRASBOURG
ÉCOLE DOCTORALE DES SCIENCES CHIMIQUES
Institut de Science et d'Ingénierie Supramoléculaires (I.S.I.S.)
UMR 7006 Laboratoire de Nanochimie
THÈSE présentée par :
Maria Girolama DEL ROSSO
soutenue le : 06 Juillet 2015
pour obtenir le grade de : Docteur de l’université de Strasbourg
Discipline/ Spécialité : Chimie-Physique
EXPLORING SUPRAMOLECULAR INTERACTIONS IN HYBRID MATERIALS
THÈSE dirigée par :
SAMORÌ Paolo Professeur, Université de Strasbourg
RAPPORTEURS :
PATRONIAK Violetta Professeur, Université Adam Mickiewicz, Poznań STEFANKIEWICZ Artur R. Docteur, Wielkopolska Center for Advanced Technologies
(WCAT), Poznań
AUTRES MEMBRES DU JURY :
MAURO Matteo Docteur, Université de Strasbourg

Résumé
I
Résumé
Le domaine de la chimie supramoléculaire a été défini pour la première fois en 1978 par
J.-M. Lehn comme étant la «chimie de l'assemblage moléculaire et de lien
intermoléculaire". 1 C’est une branche de la chimie qui étudie les assemblages d'éléments
constitutifs moléculaires interagissant par des forces non covalentes, telles que des
interactions électrostatiques, des liaisons hydrogène, des interactions π-π, des forces de van
der Waals, etc.
Une entité supramoléculaire simple est habituellement produite à partir d'un processus de
reconnaissance entre les deux blocs de constructions moléculaires appelés récepteur et
substrat.
Depuis les premières études dans ce domaine, par Cram, Pedersen et Lehn pour lesquelles
les trois scientifiques ont été récompensés par le prix Nobel en 1987, le monde de la chimie
supramoléculaire est devenu de plus en plus large, donnant naissance à d'autres branches de
la chimie, comme la nanochimie.2
Grâce à l'auto-assemblage de molécules de structure approprié, comportant des fonctions
ad hoc, il est possible de concevoir des nanostructures hautement ordonnées 1D, 2D et 3D
possédant des propriétés chimiques et physiques spécifiques. Dans cette thèse, nous nous
sommes concentrés sur l'étude des différentes interactions supramoléculaires à partir
d’interactions chimiques hôte-invité simples, en employant des interactions
supramoléculaires afin de produire un matériau désiré et finalement, utiliser ces interactions
Résumé
II
supramoléculaires dans des dispositifs électroniques. Les principaux thèmes étudiés sont
donc:
- Etude de la complexation réversible du cryptand [2.2.2] avec l'ion potassium par titration
calorimétrique isotherme (ITC);
- Exploitation des interactions supramoléculaires pour la production de graphène préparé
par exfoliation en phase liquide (LPE graphène);
- Réalisation d'électrodes asymétriques qui peuvent répondre de façon indépendante à une
excitation lumineuse, grâce à la fonctionnalisation sélective de chaque électrode à travers la
chimisorption de monocouches auto-assemblées de deux molécules photochromiques
différentes.
La titration calorimétrique isotherme (ITC) est un outil performant, principalement utilisé
en biologie pour explorer des interactions non covalentes complexes. Très récemment, cette
technique a commencé à être utilisée en chimie supramoléculaire, dans le but d’étudier les
interactions des liaisons hôte- invité.3 L’ITC permet de déterminer simultanément, et avec
une grande précision, les paramètres thermodynamiques et la stœchiométrie d'une
interaction ligand-récepteur en une seule expérience, en mesurant les incréments de chaleur
survenant au cours des expériences de titrage. Étonnamment, dans la littérature, seuls de
rares exemples peuvent être trouvés sur l'application de l'ITC sur une simple chimie hôte-
invité en solution aqueuse.
Afin de mieux comprendre le mode de fonctionnement de l'ITC, ses avantages, ses
inconvénients et ses possibles applications futures, une étude détaillée a été effectuée sur un
système modèle basé sur la thermodynamique de la complexation des ions potassium par
Résumé
III
1,10-diaza-4, 7,13,16,21,24-hexaoxabicyclo [8.8.8] hexacosane (cryptand [2.2.2]) en
solution aqueuse. Le cryptand [2.2.2] a été l'un des premiers cryptands à avoir été
synthétisé par Lehn et ses collègues, et ses propriétés thermodynamiques ont déjà été
étudiées en détails par spectroscopie RMN.
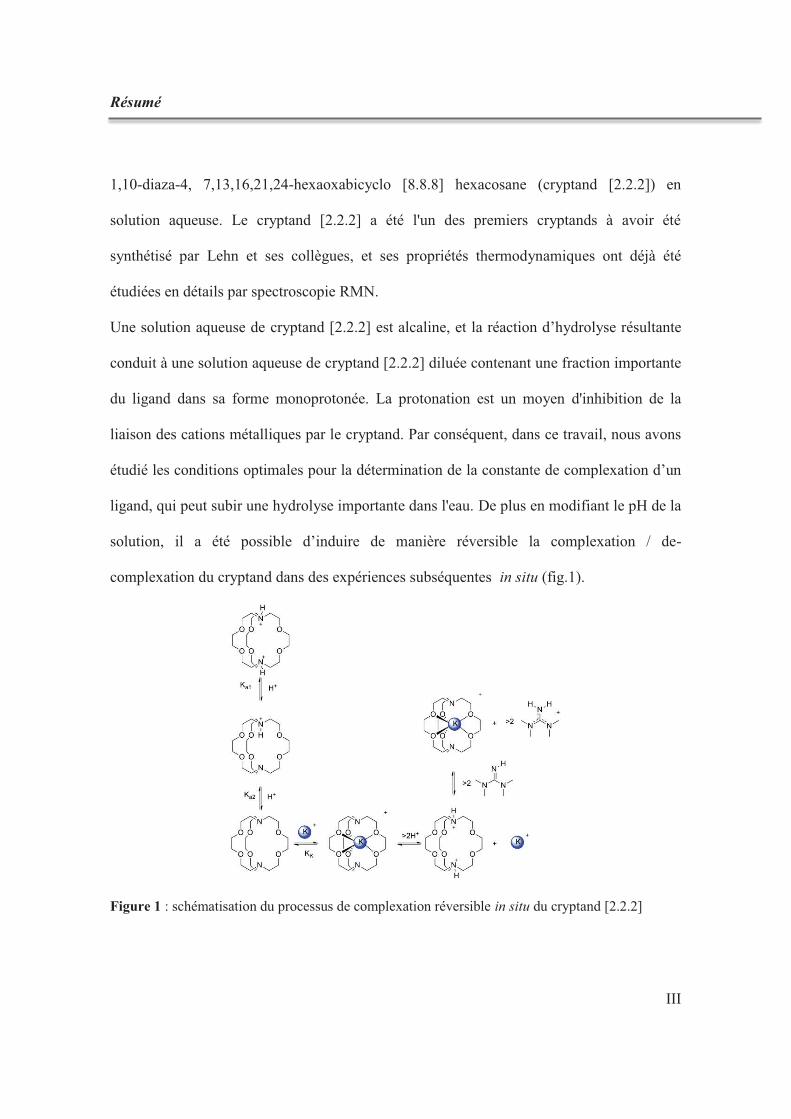
Une solution aqueuse de cryptand [2.2.2] est alcaline, et la réaction d’hydrolyse résultante
conduit à une solution aqueuse de cryptand [2.2.2] diluée contenant une fraction importante
du ligand dans sa forme monoprotonée. La protonation est un moyen d'inhibition de la
liaison des cations métalliques par le cryptand. Par conséquent, dans ce travail, nous avons
étudié les conditions optimales pour la détermination de la constante de complexation d’un
ligand, qui peut subir une hydrolyse importante dans l'eau. De plus en modifiant le pH de la
solution, il a été possible d’induire de manière réversible la complexation / de-
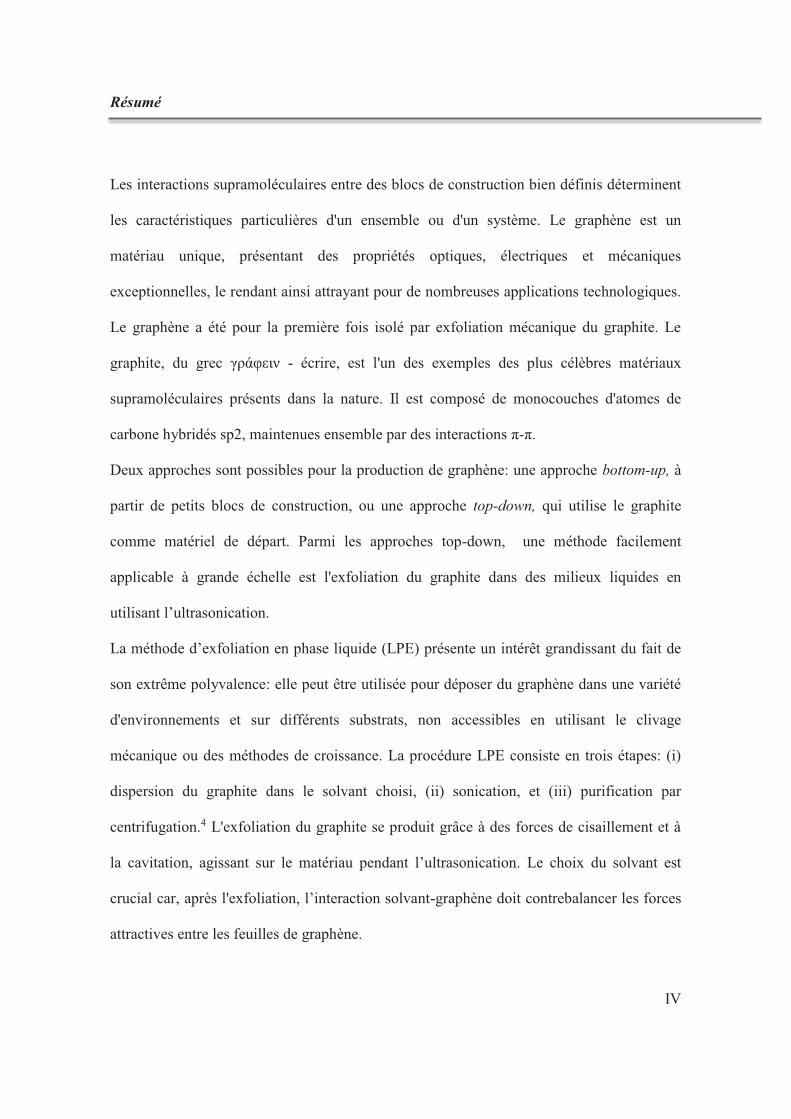
complexation du cryptand dans des expériences subséquentes in situ (fig.1).
Figure 1 : schématisation du processus de complexation réversible in situ du cryptand [2.2.2]
Résumé
IV
Les interactions supramoléculaires entre des blocs de construction bien définis déterminent
les caractéristiques particulières d'un ensemble ou d'un système. Le graphène est un
matériau unique, présentant des propriétés optiques, électriques et mécaniques
exceptionnelles, le rendant ainsi attrayant pour de nombreuses applications technologiques.
Le graphène a été pour la première fois isolé par exfoliation mécanique du graphite. Le
graphite, du grec γράφειν - écrire, est l'un des exemples des plus célèbres matériaux
supramoléculaires présents dans la nature. Il est composé de monocouches d'atomes de
carbone hybridés sp2, maintenues ensemble par des interactions π-π.
Deux approches sont possibles pour la production de graphène: une approche bottom-up, à
partir de petits blocs de construction, ou une approche top-down, qui utilise le graphite
comme matériel de départ. Parmi les approches top-down, une méthode facilement
applicable à grande échelle est l'exfoliation du graphite dans des milieux liquides en
utilisant l’ultrasonication.
La méthode d’exfoliation en phase liquide (LPE) présente un intérêt grandissant du fait de
son extrême polyvalence: elle peut être utilisée pour déposer du graphène dans une variété
d'environnements et sur différents substrats, non accessibles en utilisant le clivage
mécanique ou des méthodes de croissance. La procédure LPE consiste en trois étapes: (i)
dispersion du graphite dans le solvant choisi, (ii) sonication, et (iii) purification par
centrifugation.4 L'exfoliation du graphite se produit grâce à des forces de cisaillement et à
la cavitation, agissant sur le matériau pendant l’ultrasonication. Le choix du solvant est
crucial car, après l'exfoliation, l’interaction solvant-graphène doit contrebalancer les forces
attractives entre les feuilles de graphène.
Résumé
V
Il a été largement étudié et prouvé que les milieux liquides ayant une tension de surface
d'environ 40 mJ m-2, comme la N-méthyl-2-pyrrolidone (NMP) ou l’orto-dichlorobenzène
(o-DCB), sont les meilleurs choix pour la technique d'exfoliation, car ils minimisent
l'énergie interfaciale entre le solvant et le graphène et permettent ainsi de surpasser les
forces de van der Waals entre les couches de graphène adjacentes.
Récemment, il a été montré que l'addition de petites molécules organiques et / ou
polymères, présentant une forte affinité pour la surface de graphène, au cours de LPE du
graphite, permet de maitriser le rendement de l’exfoliation ainsi que la qualité du graphène
et, dans certains cas, peut conférer des propriétés supplémentaires au matériau exfolié.
Dans ce travail, nous montrons que la qualité et la quantité des dispersions de graphène
sans défauts, composé de quelques couches d’épaisseur, dans des solvants tels que l’orto-
dichlorobenzène, peuvent être améliorées. Cela est réalisé en ajoutant des molécules
organiques simples, en tirant parti ainsi de leurs interactions supramoléculaires avec le
graphite pendant l’exfoliation, ainsi qu’après l’exfoliation, avec le graphène.
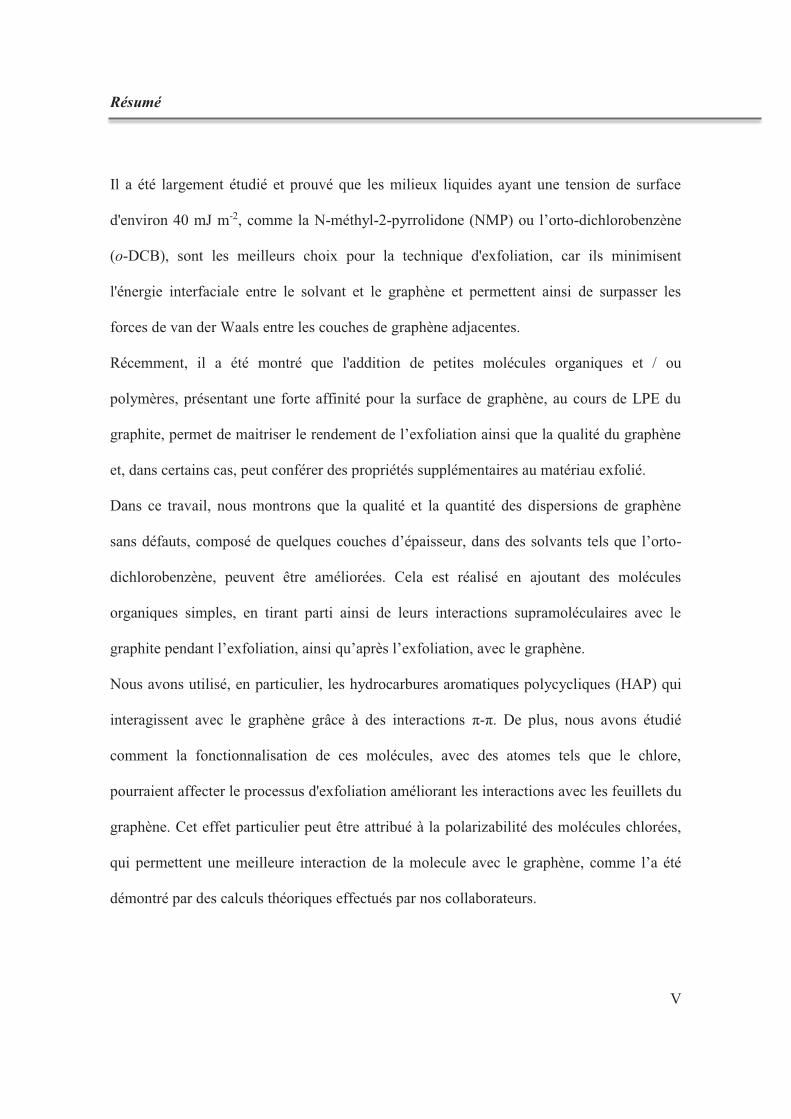
Nous avons utilisé, en particulier, les hydrocarbures aromatiques polycycliques (HAP) qui
interagissent avec le graphène grâce à des interactions π-π. De plus, nous avons étudié
comment la fonctionnalisation de ces molécules, avec des atomes tels que le chlore,
pourraient affecter le processus d'exfoliation améliorant les interactions avec les feuillets du
graphène. Cet effet particulier peut être attribué à la polarizabilité des molécules chlorées,
qui permettent une meilleure interaction de la molecule avec le graphène, comme l’a été
démontré par des calculs théoriques effectués par nos collaborateurs.
Résumé
VI
Figure 2 : a) molécules utilisées pour l’exfoliation ; b) pourcentage des monocouches de graphène
obtenu par analyse TEM ; c) images TEM et HRTEM des monocouches de graphène
Dans la dernière partie de la thèse, nous avons exploité les interactions supramoléculaires
pour la fabrication de dispositifs multifonctionnels en modifiant des électrodes en or par
l’utilisation de monocouches chimisorbées et auto-assemblées (SAM) de molécules
thiolées. Les SAM sont parmi les plus fascinants structures dans le domaine de la
nanochimie.5 La formation de SAM la plus populaire est induite par la création spontanée
d'une liaison chimique entre les groupes fonctionnels spécifiques et la surface de l’or.
L’interaction intermoléculaire est nécessaire pour stabiliser les SAM. Les SAM les plus
connues et les plus robustes sont celles possédant une fonction thiol, réagissant sur l’or.
Résumé
VII
En modulant la structure moléculaire, et par le choix approprié du groupement terminal, les
propriétés physiques et chimiques de la surface peuvent être contrôlées avec une grande
précision Le but de ce travail était d'étudier la possibilité de recouvrement d‘électrodes d'or
adjacentes de façon asymétrique, par chimisorption de SAM de molécules
photochromiques sur leurs surfaces. De telles SAM pourraient donc être commutées
indépendamment lors de l'application de différents stimuli lumineux. L'incorporation de
SAM photochromique à une interface métal-semi-conducteur a été conçue en vue de
pouvoir fournir un caractère photosensible à l'injection et l’extraction de charges en,
changeant la barrière tunnel ou le travail de sortie de l'électrode, lors de l'éclairage.
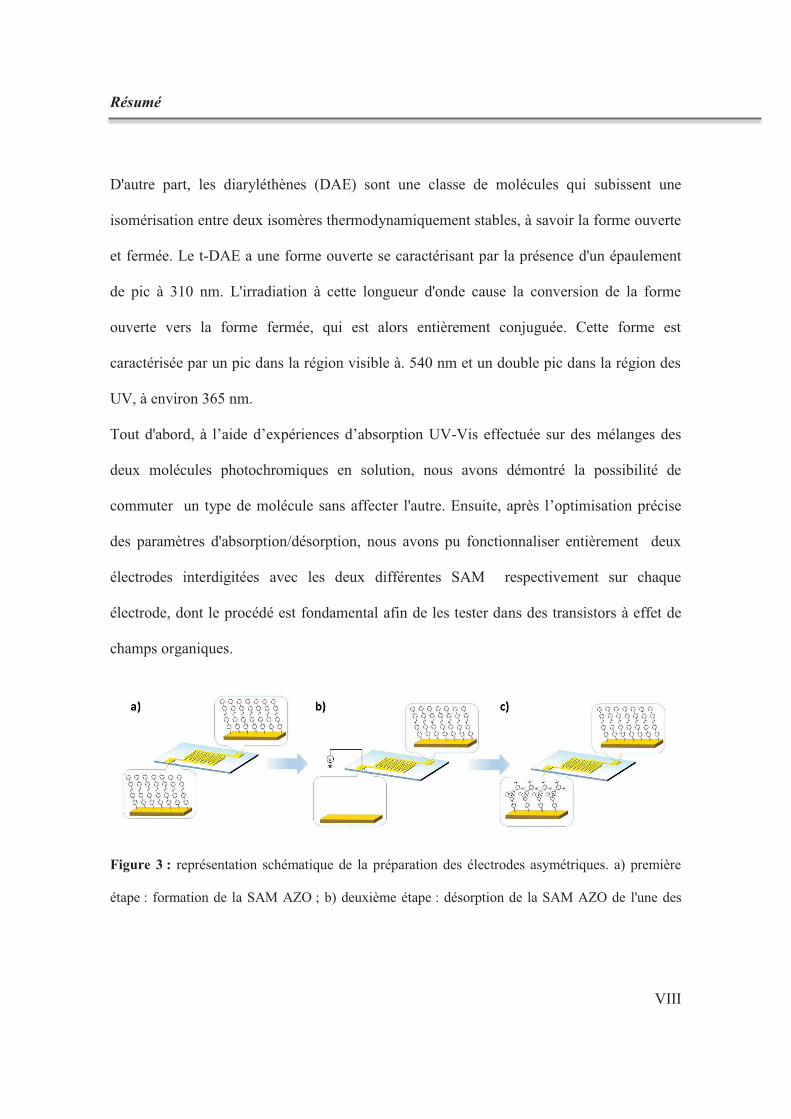
La fabrication d’électrodes asymétriques a été réalisée grâce à un processus en trois étapes
qui comprend l'adsorption de la molécule avec la formation de la SAM la plus stable sur les
électrodes d'or, la désorption électrochimique de la SAM de l'une des deux électrodes, et
l’adsorption successive de la seconde SAM sur l'électrode précédemment désorbée .
Pour ce faire, deux molécules différentes ont été conçues et synthétisées par nos
collaborateurs: un thioacétate de byphenylazobenzene (AZO) et un diaryléthène thioacétate
fonctionnalisé avec des groupes tert-butyle (t-DAE).
Les azobenzènes sont des systèmes photochromiques bien connus, qui peuvent subir une
isomérisation photochimique entre un état thermiquement stable trans (E) et un état
métastable cis (Z), par irradiation avec la lumière UV. L’isomérisation inverse peut être
déclenchée par irradiation avec de la lumière visible, ou par relaxation thermique. Dans le
cas de la molécule AZO nous avons utilisé respectivement des longueurs d'onde
d'irradiation de 365 et 455 nm.
Résumé
VIII
D'autre part, les diaryléthènes (DAE) sont une classe de molécules qui subissent une
isomérisation entre deux isomères thermodynamiquement stables, à savoir la forme ouverte
et fermée. Le t-DAE a une forme ouverte se caractérisant par la présence d'un épaulement
de pic à 310 nm. L'irradiation à cette longueur d'onde cause la conversion de la forme
ouverte vers la forme fermée, qui est alors entièrement conjuguée. Cette forme est
caractérisée par un pic dans la région visible à. 540 nm et un double pic dans la région des
UV, à environ 365 nm.
Tout d'abord, à l’aide d’expériences d’absorption UV-Vis effectuée sur des mélanges des
deux molécules photochromiques en solution, nous avons démontré la possibilité de
commuter un type de molécule sans affecter l'autre. Ensuite, après l’optimisation précise
des paramètres d'absorption/désorption, nous avons pu fonctionnaliser entièrement deux
électrodes interdigitées avec les deux différentes SAM respectivement sur chaque
électrode, dont le procédé est fondamental afin de les tester dans des transistors à effet de
champs organiques.
Figure 3 : représentation schématique de la préparation des électrodes asymétriques. a) première
étape : formation de la SAM AZO ; b) deuxième étape : désorption de la SAM AZO de l'une des
Résumé
IX
électrodes ; c) troisième étape : immersion de l’échantillon dans une solution de t-DAE SAM pour
former une SAM DAE sur l’électrode précédemment desorbée par voie électrochimique
En conclusion, ce travail de thèse vise à explorer les interactions supramoléculaires et à les
utiliser afin de moduler les propriétés physico-chimiques de systèmes et de matériaux
complexes. D'abord, une interaction classique hôte-invité a été étudiée, au moyen d'une
technique innovante telle que l'ITC, puis nous avons exploité les interactions
supramoléculaires afin de maitriser la production de graphène exfolié en phase liquide, en
mettant un accent particulier sur l'amélioration de la qualité et la quantité du matériau
produit. Enfin, nous avons étendu l'utilisation de la chimie supramoléculaire à un dispositif
réel par la fonctionnalisation des électrodes d'or avec des molécules photochromiques,
ouvrant alors la voie à des dispositifs organiques multifonctionnels, pouvant être contrôlés
par la lumière.
1. J. M. Lehn, Pure Appl Chem, 1978, 50, 871-892.
2. G. A. Ozin and A. Arsenault, eds., Nanochemistry – a chemical approach to
nanomaterials, The Royal Society of Chemistry, 2005.
3. F. P. Schmidtchen, in Analytical Methods in Supramolecular Chemistry
ed. C. A. Schalley, Wiley-VCH, Weinheim, 2007, pp. 55-78.
4. A. Ciesielski and P. Samori, Chem Soc Rev, 2014, 43, 381-398.
5. A. Ulman, Chem Rev, 1996, 96, 1533-1554.
Abstract
X
Abstract
The field of Supramolecular Chemistry was defined for the first time in 1978 by J.-M. Lehn as the
“chemistry of molecular assembly and of intermolecular bond”.1 It is the branch of chemistry which
deals with studies of the assembly of molecular building blocks interacting through non–covalent
forces, such as electrostatic interactions, hydrogen bonding, π-π interactions, van der Waals forces,
etc.
A simple supermolecular entity is usually generated from a recognition process between the two
molecular building blocks called receptor and substrate.
Since the first studies in this field by D. J. Cram, C. J. Pedersen and J.-M. Lehn for which the three
scientists were awarded with the Nobel Prize in 1987, the world of supramolecular chemistry has
become broader and broader giving birth to other branches of chemistry, such as nanochemistry.2
Through self-assembly of suitably designed molecules incorporating ad-hoc functionalities it is
possible to generate highly ordered one- (1D), two- (2D) and three-dimensional (3D) nanostructures
possessing specific chemical and physical properties.
In this thesis we focused on the investigation of different supramolecular interactions starting from a
simple host-guest system, going through the employment of supramolecular interactions in order to
produce a desired material and finally applying the principles of supramolecular chemistry in
electronic devices.
The principal topics investigated thus are:
- Study of the reversible complexation of cryptand [2.2.2] with potassium ion by Isothermal
Titration Calorimetry (ITC);
- Exploitation of supramolecular interactions for the production of graphene via liquid phase
exfoliation (LPE);
- Realization of asymmetric electrodes that can independently respond to a light stimulus, via
the selective functionalization of each electrode through the chemisorption of self-assembled
monolayers of two different photochromic molecules.
Abstract
XI
Isothermal Titration Calorimetry (ITC) is a powerful tool that is primarily used in biology to explore
complex non-covalent interactions. Just recently it started being used also in supramolecular
chemistry to investigate host-guest binding interactions.3 ITC makes it possible to determine
simultaneously and with a high degree of precision the thermodynamic parameters and
stoichiometry of a ligand–receptor interaction in a single experiment by measuring the increments of
heat occurring during stepwise titration experiments. Surprisingly only few examples can be found
in literature on the application of ITC on simple host- guest chemistry in aqueous solution.
In order to better understand the working principles of ITC, its advantages, its drawbacks and its
possible future applications a detailed study has been performed on a model system based on the
thermodynamics of the complexation of potassium ions by 1,10-diaza-4,7,13,16,21,24-
hexaoxabicyclo[8.8.8] hexacosane (cryptand [2.2.2]) in aqueous solution. Cryptand [2.2.2] was one
of the first cryptands to be synthetized by Lehn and co-workers and its thermodynamic properties
have been previously studied in depth by 1H NMR spectroscopy.
A solution of cryptand [2.2.2] in water is alkaline, and the resulting hydrolysis reaction results in a
dilute aqueous solution of cryptand [2.2.2] containing a significant fraction of the ligand in its
monoprotonated form. Protonation is one means of inhibiting metal-cation binding by the cryptand.
Thus, in this work, we have investigated the optimum conditions for determination of the
complexation constant for a ligand that may undergo significant hydrolysis in water. Moreover, by
changing the pH of the solution, it was possible to trigger the reversible complexation/de-
complexation of the cryptand in subsequent in situ experiments.
Supramolecular interactions between well-defined building blocks determine peculiar characteristic
of an ensemble or system. Graphene is a unique material exhibiting exceptional optical, electrical
and mechanical properties rendering it appealing for numerous technological applications. Graphene
was for the first time isolated by mechanical exfoliation of graphite. Graphite, from the old Greek
γράφειν – to write, is one of the well-known examples of supramolecular materials present in nature.
It is made by single layers of carbon atoms in sp2 hybridization which are held together by face-to-
face π-π interactions.
Two approaches are possible for the production of graphene: a bottom-up approach starting from
smaller building blocks or a top-down approach which exploits graphite as starting material. Among
the top-down approaches, an easily up-scalable one consists of the exfoliation of graphite in liquid
media by making use of ultrasonication. The liquid-phase exfoliation (LPE) method is becoming
Abstract
XII
more and more interesting because it is extremely versatile: it can be used to deposit graphene in a
variety of environments and on different substrates not accessible using mechanical cleavage or
growth methods. The LPE process consists of three stages: (i) dispersion of graphite in the chosen
solvent, (ii) sonication, and (iii) purification through centrifugation.4
Exfoliation of graphite occurs thanks to shear forces and cavitation, acting on the bulk material
during ultrasonication. The choice of the solvent is crucial since, after exfoliation, the solvent
graphene interaction needs to balance the attractive forces between graphene sheets.
It has been widely studied and proved that liquid media having surface tension around 40 mJ m-2,
like N-Methyl-2-pyrrolidone (NMP) or orto-dichlorobenzene (o-DCB), are the best choice for
exfoliation technique, since they minimize the interfacial energy between the solvent and graphene
and thus allowing for the overcoming of the van der Waals forces between adjacent graphene layers.
Recently, it has been shown that the addition of small organic molecules and/or polymers, featuring
a high affinity for the surface of graphene, during LPE of graphite can harness both the yield of
exfoliation and quality of graphene and, in particular cases, can confer additional properties to the
exfoliated material. In this work we show that the quality and quantity of defect-free, few layer thick
graphene dispersions in solvents such as orto-dichlorobenzene, can be increased by addition of
simple organic molecules taking advantage of their supramolecular interaction with graphite before
exfoliation and graphene after. We have employed in particular polycyclic aromatic hydrocarbons
which interact with graphene thanks to π-π interactions. We have moreover investigated how the
functionalization of these molecules with atoms such as chlorine could affect the exfoliation
process, improving the interactions with graphene sheets. This peculiarity effect can be ascribed to
the higher polarizability of the chlorine atoms respect to carbon which improves the dispersion
interactions with graphene, as revealed by theoretical calculations performed by our collaborators.
In the last part of the thesis we exploited supramolecular interactions for the fabrication of
multifunctional devices by engineering gold electrodes using chemisorbed self-assembled
monolayers (SAMs) of thiolated molecules. SAMs are one among the most fascinating scaffolds in
nanochemistry.5 On gold surfaces SAM formation is most commonly driven by the spontaneous
chemical bond formation of specific functional groups with the gold surface. The interactions
between adjacent molecules are necessary to stabilize the SAMs. The most robust and well-known
SAMs are those comprising thiolated moieties on gold. By design of the molecular backbone and
Abstract
XIII
proper choice of terminal group, the physical and chemical properties of the exposed surface can be
controlled with a great precision. The aim of the work was to explore the possibility of coating
adjacent gold electrodes in an asymmetric fashion by chemisorbing on their surfaces different SAMs
of photochromic molecules. Such SAMs could therefore be switched independently upon
application of different light stimuli. The incorporation of photochromic SAMs at the metal-
semiconductor interface was conceived in view of the possibility to provide a photoresponsive
nature to the charge injection and extraction by changing the tunneling barrier or the electrode work
function upon illumination.
The fabrication of asymmetric electrodes has been achieved through a three steps process which
involves the adsorption of the most stable SAM forming molecule on the gold electrodes, the
electrochemical desorption of the SAM from one of the two electrodes, and the successive
adsorption of the second SAM on the gold electrode left exposed by desorption.
For this purpose two different molecules have been designed and synthetized by our collaborators: a
byphenylazobenzene thioacetate (AZO) and a thioacetate diarylethene functionalized with tert-butyl
groups (t-DAE).
Azobenzenes are well-known photochromic systems which can undergo photochemical
isomerization between a thermally stable trans state (E) and a meta-stable cis state (Z) by irradiation
with UV light. Inverse isomerization can be triggered by irradiation with visible light or thermal
relaxation. In the case of molecule AZO we used respectively 365 and 455 nm irradiation
wavelengths.
On the other hand diarylethenes (DAE) are a class of molecules, that undergoes isomerization
between two thermodynamically stable isomers, i.e. the open and closed form. The t-DAE in the
open form is characterized by the presence of a shoulder peak at 310 nm. Irradiating at this
wavelength it is possible to convert the open form to the fully conjugated closed form which shows
a peak in the visible region at ca. 540 nm and a double peak in the UV region at ca. 365 nm.
First, through UV-Vis absorption experiments of mixtures of the two photochromic molecules in
solution we demonstrated the possibility of switching one type of molecule without affecting the
other
Finally, after careful tune of absorption/desorption parameters we were able to functionalize two
fully interdigitated electrodes with the two different SAMs, a fundamental process in order to test
them in organic field effect transistors.
Abstract
XIV
In conclusion this thesis is aimed at exploring supramolecular interactions and using them in
order to modulate physico-chemical properties of complex systems and materials. First, a classical
host-guest interaction was studied by means of the ITC technique, then we exploited supramolecular
interactions in order to harness the production of liquid-phase exfoliated graphene, with a particular
focus on improving the quality and quantity of material produced. Finally, we extended the use of
supramolecular chemistry to a real device by functionalization of gold electrodes with photochromic
molecules, hence paving the way towards multifunctional organic devices and in prospective to
graphene based light-controlled multifunctional devices.
1. J. M. Lehn, Pure Appl Chem, 1978, 50, 871-892.
2. G. A. Ozin and A. Arsenault, eds., Nanochemistry – a chemical approach to nanomaterials,
The Royal Society of Chemistry, 2005.
3. F. P. Schmidtchen, in Analytical Methods in Supramolecular Chemistry
ed. C. A. Schalley, Wiley-VCH, Weinheim, 2007, pp. 55-78.
4. A. Ciesielski and P. Samorì, Chem Soc Rev, 2014, 43, 381-398.
5. A. Ulman, Chem Rev, 1996, 96, 1533-1554.
Table of Contents
1
Table of Contents
Résumé .................................................................................................................................................. I
Abstract ................................................................................................................................................ X
Table of Contents ................................................................................................................................. 1
1. Introduction .................................................................................................................................. 5
1.1. From Supramolecular Chemistry to Nanotechnology ........................................................... 5
1.2. Non-covalent interactions: the toolbox of supramolecular chemistry ................................... 7
1.3. Host-guest chemistry ........................................................................................................... 10
1.4. From self-assembly to self-assembled monolayers ............................................................. 13
1.4.1. Use of self-assembled monolayers in organic electronics. .......................................... 16
1.5. References ........................................................................................................................... 21
2. Graphene .................................................................................................................................... 23
2.1. Introduction ......................................................................................................................... 23
2.2. Properties ............................................................................................................................. 23
2.2.1. Electronic properties .................................................................................................... 23
2.2.2. Optical properties ......................................................................................................... 24
2.2.3. Other properties ............................................................................................................ 25
2.3. Graphene fabrication ........................................................................................................... 26
2.4. Liquid-phase exfoliated graphene ....................................................................................... 29
2.4.1. Use of surfactants in LPE ............................................................................................. 31
2.4.2. Figures of merit in liquid-phase exfoliation ................................................................. 34
2.5. Characterization ................................................................................................................... 35
2.5.1. Imaging graphene ......................................................................................................... 35
2.5.2. Raman spectroscopy ..................................................................................................... 36
2.5.3. Transmission electron microscopy ............................................................................... 37
Table of Contents
2
2.5.4. Atomic force microscopy .............................................................................................. 38
2.5.5. X-Ray Photoelectron spectroscopy ............................................................................... 38
2.6. References ............................................................................................................................ 39
3. Experimental techniques ............................................................................................................. 43
3.1. Isothermal titration calorimetry ............................................................................................ 43
3.1.1. Working principle ......................................................................................................... 43
3.1.2. Experimental planning .................................................................................................. 44
3.1.3. Analysing thermodynamic data .................................................................................... 46
3.2. X-Ray Photoelectron Spectroscopy...................................................................................... 48
3.3. Single point Kelvin Probe .................................................................................................... 50
3.4. Photoelectron yield spectrometer in air (PYSA) .................................................................. 51
3.5. Organic field effect transistors ............................................................................................. 52
3.6. Raman spectroscopy ............................................................................................................. 55
3.7. Scanning Electron Microscopy (SEM)................................................................................. 57
3.8. Transmission electron microscopy ....................................................................................... 59
3.9. Thermal desorption spectroscopy ......................................................................................... 60
3.10. References ......................................................................................................................... 61
4. Complexation of cryptand 2.2.2: a bistable supramolecular switch studied by ITC .................. 62
4.1. Introduction .......................................................................................................................... 62
4.1.1. Experimental details ...................................................................................................... 64
4.2. Results and discussion .......................................................................................................... 65
4.2.1. Determination of the starting conditions ....................................................................... 65
4.2.2. Determination of pKa1 and pKa2 ................................................................................. 66
4.2.3. Reversible in-situ complexation of potassium ions by cryptand [2.2.2.] ...................... 69
4.3. Conclusions .......................................................................................................................... 74
4.4. References ............................................................................................................................ 75
4.5. Appendix 1 ........................................................................................................................... 77
4.5.1. ITC measurements ........................................................................................................ 77
Table of Contents
3
4.5.2. Calculation of the concentration in the cell of the reagents for the second and third
titration279
4.5.3. NMR studies ................................................................................................................. 80
5. Exploitation of supramolecular interactions for the production of liquid-phase exfoliated
graphene ............................................................................................................................................. 83
5.1. Introduction ......................................................................................................................... 83
5.2. Experimental details ............................................................................................................ 85
5.3. Results and discussion ......................................................................................................... 86
5.3.1. Theoretical calculations ................................................................................................ 86
5.3.2. Exfoliation .................................................................................................................... 90
5.3.3. Thermal desorption spectroscopy ................................................................................. 97
5.4. Conclusions ......................................................................................................................... 98
5.5. References ........................................................................................................................... 99
6. Preparation of optically switchable asymmetric electrodes: towards multifunctional devices 101
6.1. Introduction ........................................................................................................................... 101
6.2. Experimental details .............................................................................................................. 103
6.3. Experimental results and discussion ..................................................................................... 106
6.3.1. Independent switching of AZO and tDAE in solution: proof of concept ...................... 106
6.3.2. Switching of the molecules on the surface .................................................................... 111
6.3.3. Competitive chemisorption experiments ....................................................................... 117
6.3.4. Preparation of the asymmetric electrodes ...................................................................... 121
6.3.5. Incorporation of asymmetric electrodes in a device ...................................................... 124
6.3.5.1. OFETs with AZO SAMs on both electrodes .......................................................... 125
6.3.5.2. OFETs with p-tDAE SAM on both electrodes ....................................................... 128
6.3.5.3. OFETs with asymmetric electrodes ........................................................................ 130
6.3.5.4. Blank experiments .................................................................................................. 133
6.4. Conclusions ........................................................................................................................... 135
6.5. References ............................................................................................................................. 135
7. Conclusion and perspectives .................................................................................................... 138
8. Acknowledgements .................................................................................................................. 142

Table of Contents
4
1.Introduction
5
1. Introduction
1.1. From Supramolecular Chemistry to Nanotechnology
The concept of Supramolecular chemistry was defined for the first time in 1979 by Jean-Marie Lehn
as “the chemistry of molecular assemblies and of the intermolecular bond”1, even though the term
supramolecule appeared for the first time already in 1903 in Webster’s dictionary2 and examples of
supramolecular chemistry date back to the early days of modern chemistry (with the discovery of
chlorine hydrate by Sir Humphrey Davy in 1810 for example). The recognition of supramolecular
chemistry as a specific research field in fact started in 1960s with the studies on the selective
binding of alkali metal cations by natural3 as well as synthetic macrocyclic and macropolycyclic
ligands, the crown ethers4 and cryptands.1, 5 Because of this reason, at the beginning, supramolecular
chemistry was associated with the chemistry of the host-guest interactions.
After the establishment of this field, based on synthetic receptors which were designed with a
particular geometry or rigidity in order to fit their potential guest in a selective way, supramolecular
chemistry research horizons were expanded to “self-organization processes”. In these processes a
reversible and spontaneous organization of single entities takes place thanks to non-covalent
interactions forming ordered structures. This is the branch of self-assembly.6
With time, the objective of the study of researchers in the supramolecular field, changed from
molecular recognition per-se to molecular recognition as a tool, taking advantage of the increasing
knowledge on non-covalent interactions, towards the development of functional supramolecular
architectures of nanometric size.7 This led to the engineering of advanced supramolecular materials,
such as supramolecular polymers and liquid crystals paving the way towards a new field:
nanochemistry.8 Nanochemistry is concerned with the synthesis and study of assemblies of atoms or
molecules in highly ordered two-and three dimensional nanostructures, which have spatial
dimensions ranging between 2–200 nm. Nanochemistry is now a per-se discipline but much of its
success comes from the ability acquired by supramolecular chemists in manipulating non-covalent
1.Introduction
6
forces and exploiting them in the engineering of well order structures in the nanometric scale with
specific properties encoded in the molecular building blocks. Supramolecular chemistry is therefore
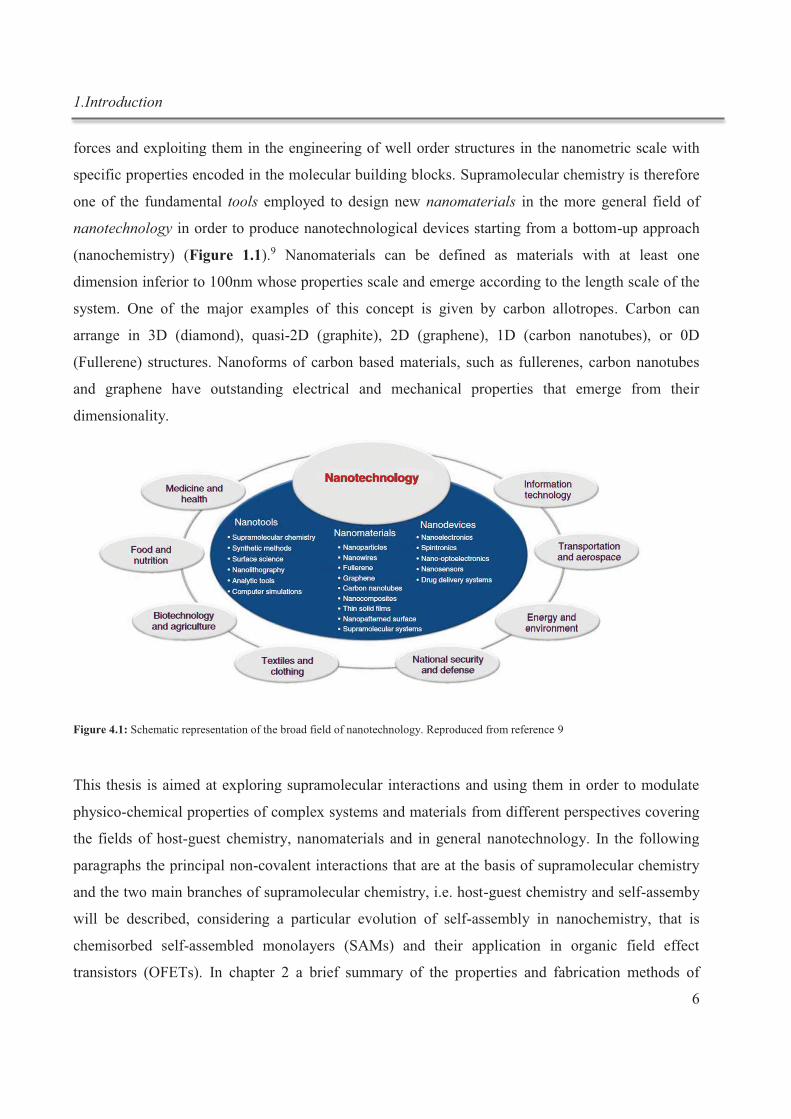
one of the fundamental tools employed to design new nanomaterials in the more general field of
nanotechnology in order to produce nanotechnological devices starting from a bottom-up approach
(nanochemistry) (Figure 1.1).9 Nanomaterials can be defined as materials with at least one
dimension inferior to 100nm whose properties scale and emerge according to the length scale of the
system. One of the major examples of this concept is given by carbon allotropes. Carbon can
arrange in 3D (diamond), quasi-2D (graphite), 2D (graphene), 1D (carbon nanotubes), or 0D
(Fullerene) structures. Nanoforms of carbon based materials, such as fullerenes, carbon nanotubes
and graphene have outstanding electrical and mechanical properties that emerge from their
dimensionality.
Figure 4.1: Schematic representation of the broad field of nanotechnology. Reproduced from reference 9
This thesis is aimed at exploring supramolecular interactions and using them in order to modulate
physico-chemical properties of complex systems and materials from different perspectives covering
the fields of host-guest chemistry, nanomaterials and in general nanotechnology. In the following
paragraphs the principal non-covalent interactions that are at the basis of supramolecular chemistry
and the two main branches of supramolecular chemistry, i.e. host-guest chemistry and self-assemby
will be described, considering a particular evolution of self-assembly in nanochemistry, that is
chemisorbed self-assembled monolayers (SAMs) and their application in organic field effect
transistors (OFETs). In chapter 2 a brief summary of the properties and fabrication methods of
1.Introduction
7
graphene, the new “wonder material” of nanochemistry will be given. The principal experimental
techniques employed in the experimental work of this thesis will be briefly summarized in chapter 3.
Then in chapter 4 it will be shown how one of the first example of supramolecular host-guest
chemistry, the complexation of potassium ion by cryptand [2.2.2] can be studied by isothermal
titration calorimetry (ITC) revealing the advantages and drawbacks of this technique. Chapter 5
illustrates how supramolecular interactions can be exploited in order to produce graphene through a
liquid-phase exfoliation process, with a particular focus on improving the quality and quantity of
material produced. In chapter 6 the use SAMs will be extended to organic electronic devices,
showing how SAMs can be implemented on gold electrodes paving the way toward multiresponsive
devices. Conclusions and perspectives will be outlined in chapter 7.
1.2. Non-covalent interactions: the toolbox of supramolecular
chemistry
Supramolecular entities are held together through non-covalent forces that are generally weaker than
covalent bonds and their energetic range goes from 2 kJ mol-1 for dispersion forces to 300 kJ mol-1
for ion-ion interactions. In Table 1.1 a summary of the non-covalent forces is reported.2
Supramolecular interactions Bond energy (kJ mol-1)
Ion-Ion 200-300
Ion-dipole 50-200
Dipole-dipole 5-50
Hydrogen bonding 4-120
Cation-π 5-80
π-π 0-50
Van der Waals <5 kJ mol-1 but variable according to the surface
area
Hydrophobic Related to solvent- solvent interaction energy
Table 1.1: Summary of non-covalent forces and their strength range
Ionic and dipolar interactions can be divided in three categories: (i) ion-ion, (ii) ion-dipole, and
(iii) dipole-dipole interactions. The strongest of these interactions is the ion-ion interaction, given
that its energy range is of the same order of covalent interactions. Moreover ion-ion interaction are
1.Introduction
8
non-directional forces because they can occur at any particular orientation of the two interacting
species, while ion-dipole and dipole-dipole interactions are orientation dependent and they are
useful in order to bring species into alignment.
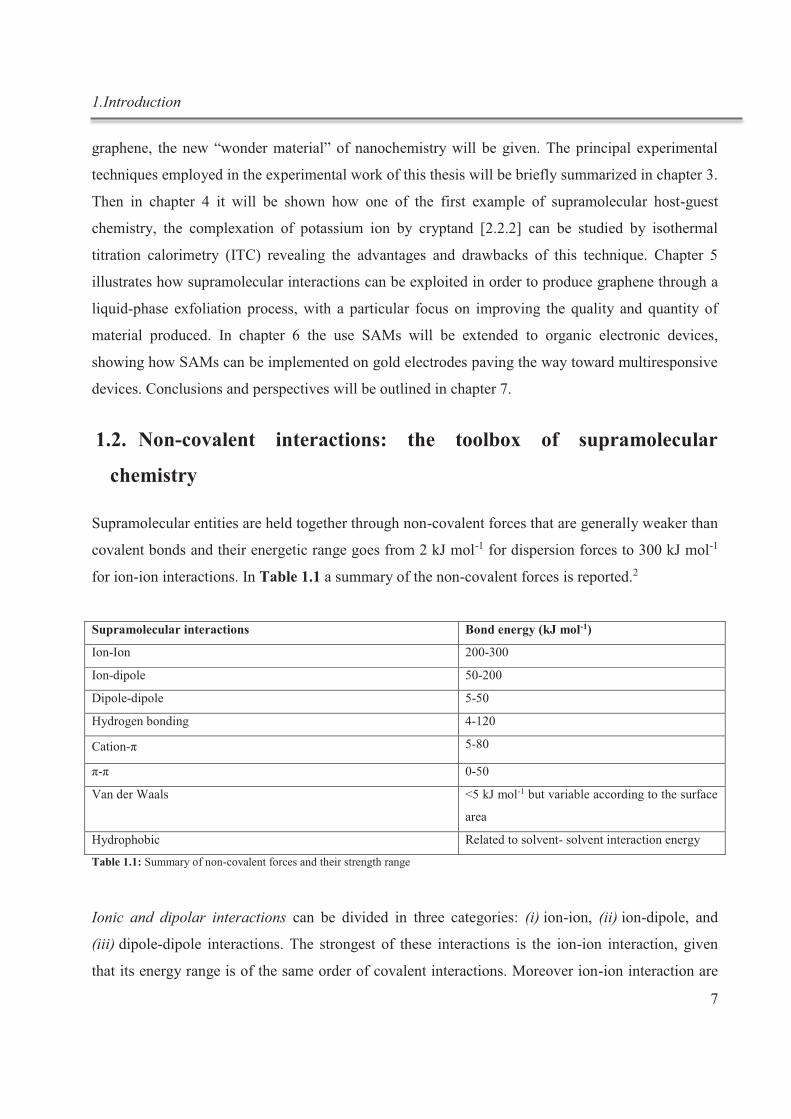
Hydrogen bond is the “master-key” non-covalent interaction in supramolecular chemistry, due to its
high directionality and strength.10 It is a special kind of dipole-dipole interaction between a proton
donor (D) and a proton acceptor (A). The hydrogen donors are groups with hydrogen attached to an
electronegative atom, giving rise to a dipole with a partial positive charge carried by the hydrogen.
The proton acceptors are electron-withdrawing atoms, which interact with the hydrogen dipole
(Figure 1.2).
Figure 1.2: Example of hydrogen bond, a carbonyl accepting a hydrogen bond from a secondary amine donor.
Van der Waals interactions, the weakest among non-covalent interactions, consist of an attractive
(dispersion) component, named London dispersion and a short-range repulsive component often
called ‘exchange repulsion’.
London dispersion forces are non-covalent forces which are originated by the attraction between
induced polarized electron clouds. This force is present in a small part in all intermolecular
interactions. The strength of this interaction depends from the polarizability of the molecules (i.e.
how easily the electron cloud of the molecule can be distorted) and from the surface area of the
molecule. The greater the surface of the molecule is, the more the area of the electron cloud which
can interact with another molecule, the stronger the force. Exchange repulsion interactions include
nuclear-nuclear repulsion and electron-electron repulsion, as well as changes in electronic kinetic
energy.
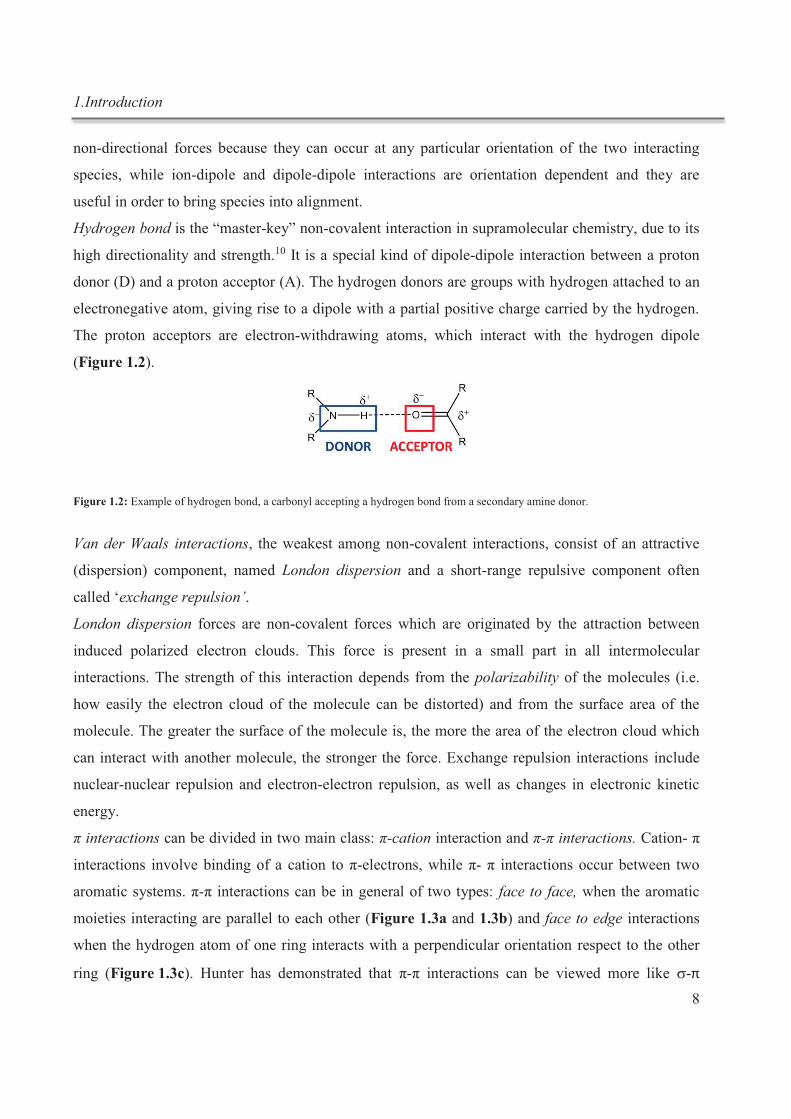
π interactions can be divided in two main class: π-cation interaction and π-π interactions. Cation- π
interactions involve binding of a cation to π-electrons, while π- π interactions occur between two
aromatic systems. π-π interactions can be in general of two types: face to face, when the aromatic
moieties interacting are parallel to each other (Figure 1.3a and 1.3b) and face to edge interactions
when the hydrogen atom of one ring interacts with a perpendicular orientation respect to the other
ring (Figure 1.3c). Hunter has demonstrated that π-π interactions can be viewed more like s-π
1.Introduction
9
attraction of the negatively charged π cloud of one of the two conjugated systems involved, and the
positively s system of the second aromatic molecule.11 Therefore face to face interactions in which
the centres of the molecules are along the same axe are in general unfavourable (repulsive) while
parallel displaced interaction are favored as well as face to edge interactions. In Figure 1.3d a
scheme of the different geometries of benzene-benzene interactions and a general scheme of how
the interaction varies from repulsive to attractive varying the geometry of interaction of the
molecules are reported.12
π interaction are given by the complex interplay of other non-covalent forces. In fact, from
theoretical calculations, it has been derived that the electrostatic energy is responsible for the
geometry of the dimer, whereas the stabilization of the dimer is due to van der Waals interactions
(and solvophobic effects).11
Figure 1.3: a) face to face parallel interaction; b) face to face parallel displaced interaction; c) edge to face interaction for two benzene molecules; d) diagram showing how the π-π interaction can change from repulsive to attractive according to the orientation
of one molecule compared to the other one. Taken from ref. 12.
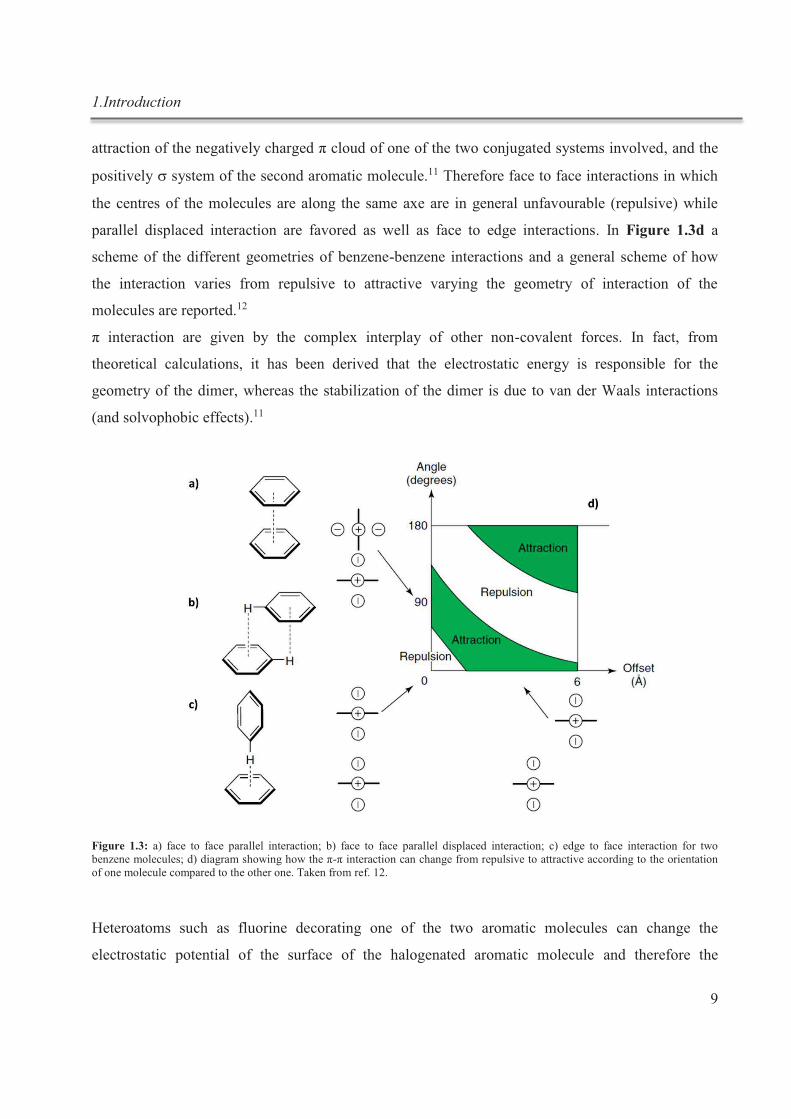
Heteroatoms such as fluorine decorating one of the two aromatic molecules can change the
electrostatic potential of the surface of the halogenated aromatic molecule and therefore the
1.Introduction
10
molecules can interact in a parallel fashion to the other aromatic molecule, as depicted in Figure
1.4.13
Figure 1.4: Surface electrostatic potential of benzene and fluorine showing that they are respectively negative and positive and parallel face to face interaction.
A well-known example in nature of π-π interaction is graphite, which is constituted by sheets of sp2
carbons atoms held together by weak face to face π- π interactions.
From graphite through exfoliation processes it is possible to isolate the single carbon sheets in order
to obtain graphene, the “material of the future”, which possesses extraordinary properties. In chapter
2 we will introduce this material, which is part of the nanochemistry world, and the fabrication
processes employed for its production. In chapter 5 we will show that through exfoliation of
graphite in a liquid medium it is possible to obtain dispersion of graphene sheets and the quality of
the dispersions can be improved by addition of molecules which can interact with graphene sheets
through non covalent interactions such as π-π stacking or van der Waals forces.
1.3. Host-guest chemistry
Host-guest chemistry studies the interaction between a molecule (host) which is capable of
enclosing another small molecule/ion (guest) through non-covalent interactions. It is worth to point
out that a stable host guest system is given by the multiple and simultaneous effect of non-covalent
interactions. In a host-guest system the stabilization obtained by a host with two or more binding
sites covalently linked between each other in binding the guest is higher than a system in which the
binding sites are acting separately from each other. This phenomenon is called cooperativity. The
cooperativity between sites is also a generalization of the chelate effect (Figure 1.5).
Above the chelate effect, an ulterior factor, which helps in increasing the organization order, is the
design of the host in a way that no significant conformational change is needed to interact with the
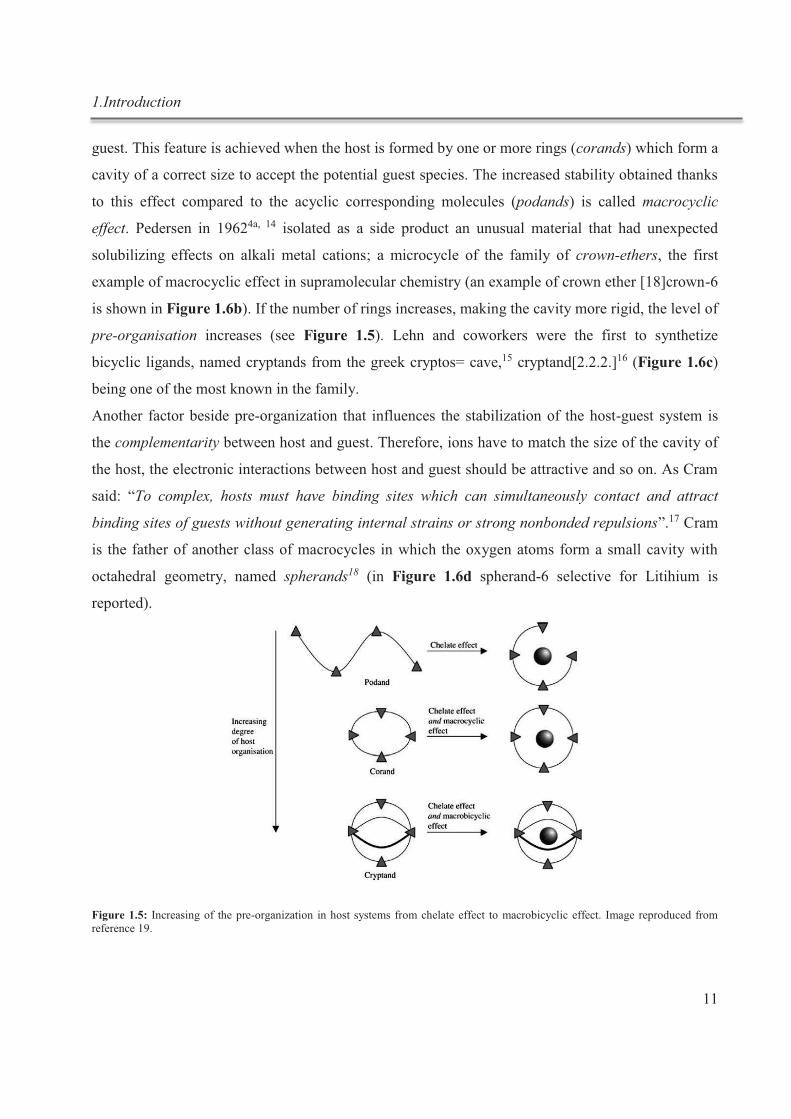
1.Introduction
11
guest. This feature is achieved when the host is formed by one or more rings (corands) which form a
cavity of a correct size to accept the potential guest species. The increased stability obtained thanks
to this effect compared to the acyclic corresponding molecules (podands) is called macrocyclic
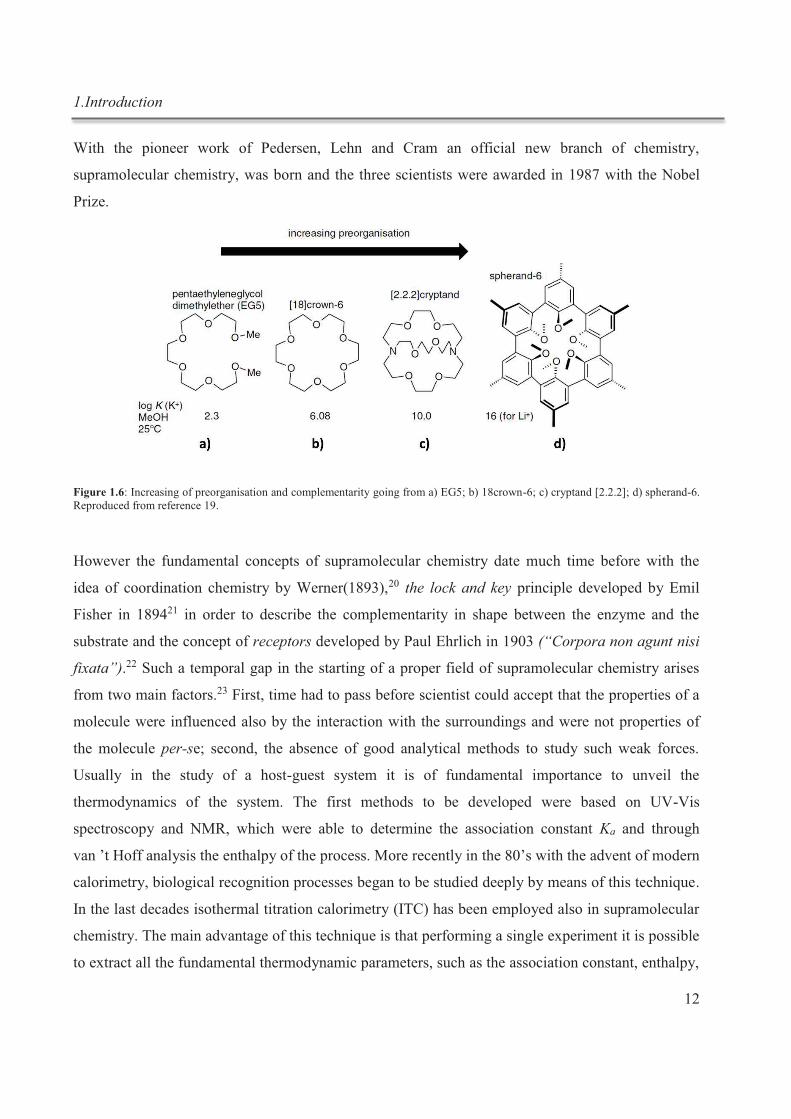
effect. Pedersen in 19624a, 14 isolated as a side product an unusual material that had unexpected
solubilizing effects on alkali metal cations; a microcycle of the family of crown-ethers, the first
example of macrocyclic effect in supramolecular chemistry (an example of crown ether [18]crown-6
is shown in Figure 1.6b). If the number of rings increases, making the cavity more rigid, the level of
pre-organisation increases (see Figure 1.5). Lehn and coworkers were the first to synthetize
bicyclic ligands, named cryptands from the greek cryptos= cave,15 cryptand[2.2.2.]16 (Figure 1.6c)
being one of the most known in the family.
Another factor beside pre-organization that influences the stabilization of the host-guest system is
the complementarity between host and guest. Therefore, ions have to match the size of the cavity of
the host, the electronic interactions between host and guest should be attractive and so on. As Cram
said: “To complex, hosts must have binding sites which can simultaneously contact and attract
binding sites of guests without generating internal strains or strong nonbonded repulsions”.17 Cram
is the father of another class of macrocycles in which the oxygen atoms form a small cavity with
octahedral geometry, named spherands18 (in Figure 1.6d spherand-6 selective for Litihium is
reported).
Figure 1.5: Increasing of the pre-organization in host systems from chelate effect to macrobicyclic effect. Image reproduced from reference 19.
1.Introduction
12
With the pioneer work of Pedersen, Lehn and Cram an official new branch of chemistry,
supramolecular chemistry, was born and the three scientists were awarded in 1987 with the Nobel
Prize.
Figure 1.6: Increasing of preorganisation and complementarity going from a) EG5; b) 18crown-6; c) cryptand [2.2.2]; d) spherand-6. Reproduced from reference 19.
However the fundamental concepts of supramolecular chemistry date much time before with the
idea of coordination chemistry by Werner(1893),20 the lock and key principle developed by Emil
Fisher in 189421 in order to describe the complementarity in shape between the enzyme and the
substrate and the concept of receptors developed by Paul Ehrlich in 1903 (“Corpora non agunt nisi
fixata”).22 Such a temporal gap in the starting of a proper field of supramolecular chemistry arises
from two main factors.23 First, time had to pass before scientist could accept that the properties of a
molecule were influenced also by the interaction with the surroundings and were not properties of
the molecule per-se; second, the absence of good analytical methods to study such weak forces.
Usually in the study of a host-guest system it is of fundamental importance to unveil the
thermodynamics of the system. The first methods to be developed were based on UV-Vis
spectroscopy and NMR, which were able to determine the association constant Ka and through
van ’t Hoff analysis the enthalpy of the process. More recently in the 80’s with the advent of modern
calorimetry, biological recognition processes began to be studied deeply by means of this technique.
In the last decades isothermal titration calorimetry (ITC) has been employed also in supramolecular
chemistry. The main advantage of this technique is that performing a single experiment it is possible
to extract all the fundamental thermodynamic parameters, such as the association constant, enthalpy,
1.Introduction
13
entropy and Gibbs energy. ITC measures directly the enthalpy of a binding event thus avoiding
errors generated by improper use of van ’t Hoff analysis.24 Most of the studies of host-guest binding
systems have been performed in organic solvents, in particular aprotic and nonpolar solvents that
maximize electrostatic interactions between molecules. However, in the natural world,
supramolecular interactions occur in water and the role of the solvent is crucial. Therefore, in
chapter 4 we focus our attention on the study of a model host-guest system such as the complexation
of the potassium ion by cryptand [2.2.2] in water, by means of ITC revealing the weak and the
strong points of ITC technique and all the precautions that have to be taken in order to perform a
correct experiment.
1.4. From self-assembly to self-assembled monolayers
Self-assembly is a process in which large ordered structures are formed spontaneously by single
components initially in disorder, through non-covalent interactions, thanks to the intrinsic
information embedded in the single components.6 The self-assembly process on solid surfaces (2-D
self-assembly) is the result of a delicate interplay between three main interactions:
molecule-molecule, molecule-substrate and eventually molecule-solvent interaction if the deposition
of the molecules takes place from solution.25
In nanochemistry self-assembly can be used to form ordered self-assembled monolayers (SAMs)
chemisorbed on a surface. SAMs are obtained via chemisorption of molecules on a substrate thanks
to a reactive head group followed by a slow reorganization of the tail group. In fact the backbone of
the molecule is designed in such a way that dispersive forces stabilize the supramolecular assembly
creating a long range order which can extend from few to several nanometers. The terminal group of
the molecule or the backbone itself can provide a chemical functionality to the SAM (Figure 1.7).
1.Introduction
14
Figure 1.7: Schematic representation of a decanethiol molecule adsorbed on Au(111) in a standing up configuration. In red the sulphur atom, in blue the carbon backbone and in white the hydrogens. Reproduced from reference 26.
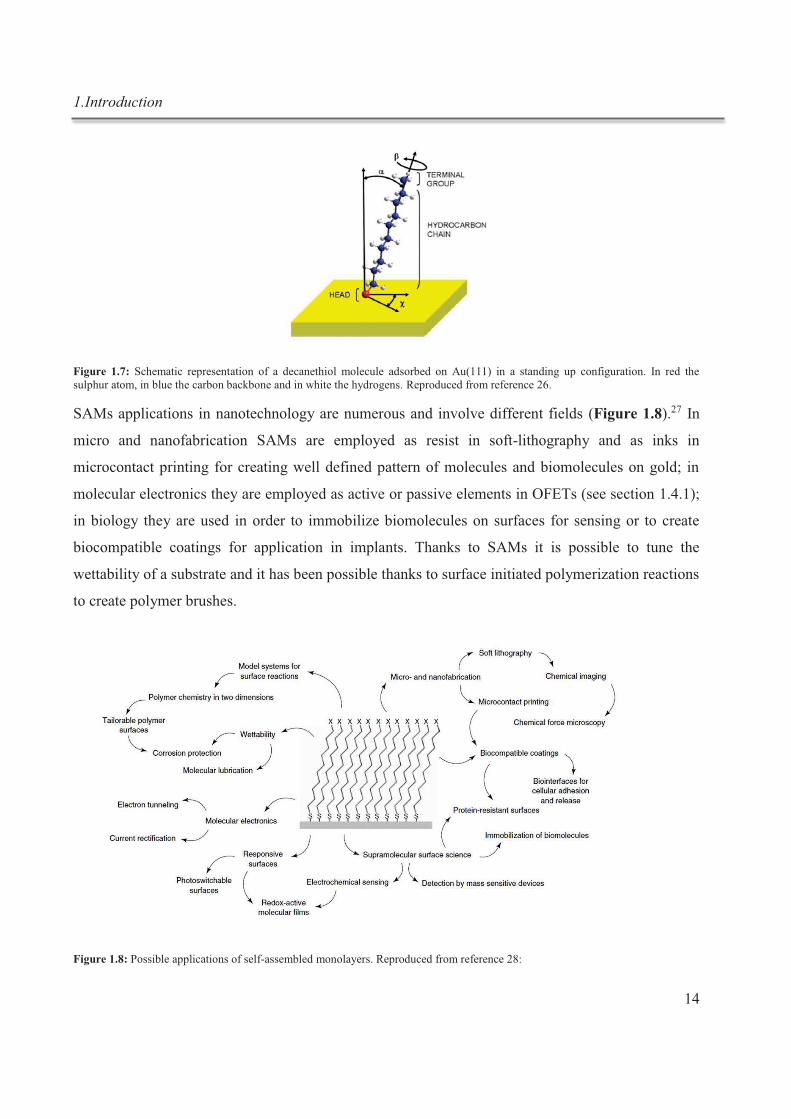
SAMs applications in nanotechnology are numerous and involve different fields (Figure 1.8).27 In
micro and nanofabrication SAMs are employed as resist in soft-lithography and as inks in
microcontact printing for creating well defined pattern of molecules and biomolecules on gold; in
molecular electronics they are employed as active or passive elements in OFETs (see section 1.4.1);
in biology they are used in order to immobilize biomolecules on surfaces for sensing or to create
biocompatible coatings for application in implants. Thanks to SAMs it is possible to tune the
wettability of a substrate and it has been possible thanks to surface initiated polymerization reactions
to create polymer brushes.
Figure 1.8: Possible applications of self-assembled monolayers. Reproduced from reference 28:
1.Introduction
15
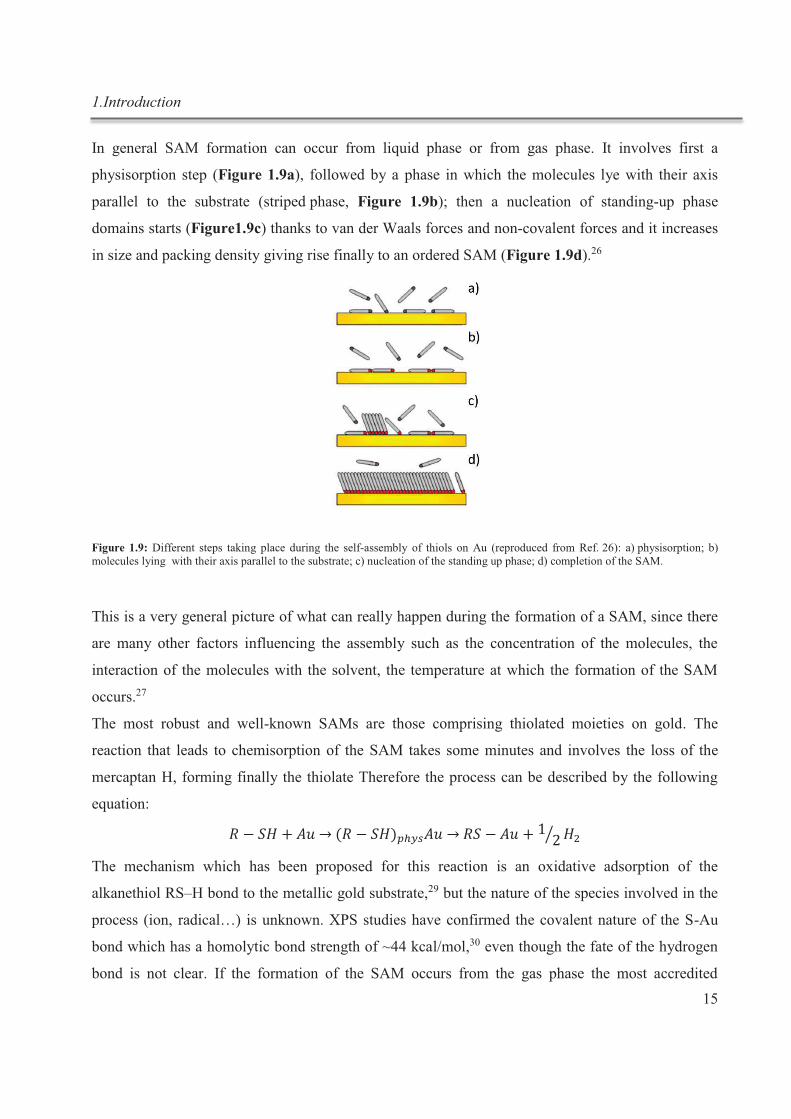
In general SAM formation can occur from liquid phase or from gas phase. It involves first a
physisorption step (Figure 1.9a), followed by a phase in which the molecules lye with their axis
parallel to the substrate (striped phase, Figure 1.9b); then a nucleation of standing-up phase
domains starts (Figure1.9c) thanks to van der Waals forces and non-covalent forces and it increases
in size and packing density giving rise finally to an ordered SAM (Figure 1.9d).26
Figure 1.9: Different steps taking place during the self-assembly of thiols on Au (reproduced from Ref. 26): a) physisorption; b) molecules lying with their axis parallel to the substrate; c) nucleation of the standing up phase; d) completion of the SAM.
This is a very general picture of what can really happen during the formation of a SAM, since there
are many other factors influencing the assembly such as the concentration of the molecules, the
interaction of the molecules with the solvent, the temperature at which the formation of the SAM
occurs.27
The most robust and well-known SAMs are those comprising thiolated moieties on gold. The
reaction that leads to chemisorption of the SAM takes some minutes and involves the loss of the
mercaptan H, forming finally the thiolate Therefore the process can be described by the following
equation:
The mechanism which has been proposed for this reaction is an oxidative adsorption of the
alkanethiol RS–H bond to the metallic gold substrate,29 but the nature of the species involved in the
process (ion, radical…) is unknown. XPS studies have confirmed the covalent nature of the S-Au
bond which has a homolytic bond strength of ~44 kcal/mol,30 even though the fate of the hydrogen
bond is not clear. If the formation of the SAM occurs from the gas phase the most accredited
1.Introduction
16
hypothesis is the formation of H2.31 In solution, beside formation of H2, the H can react with oxygen
present in solution leading to the formation of water. Some studies instead propose that the
adsorption occurs without the loss of the hydrogen.32
Use of self-assembled monolayers in organic electronics.
SAMs play an important role in improving the organic device performance. They can be employed
at different interfaces of the device. In particular, in organic field-effect transistors (OFETs), SAMs
can be exploited in the modification of source and drain electrodes and in the modification of the
dielectric interface.
Growth of SAMs on source and drain electrodes can improve the charge injection of the carriers in
the organic semiconductor. In fact molecules possessing a dipole moment perpendicular to the
surface can shift the work function ϕ of the substrate material of a value Dϕ given by the Helmholtz
equation:33
where q is the elementary charge, N the surface dipole density, the dipole moment perpendicular
to the surface, the vacuum permittivity, and the relative dielectric constant.
Dielectric surface treatment with SAMs produces benefits in the charge carrier transport, since the
charges implied in OFET transport are usually confined in the first 5 nm of organic semiconductor
from the semiconductor/dielectric interface.34 Functionalizing for example the SiO2 surface with an
octadecyl trichlorosilane (OTS) SAM the charge trapping caused by Si-OH groups on the dielectric
surface can be easily prevented.35
Tunneling is the most common transport mechanism in SAMs and is defined by the Arrhenius
equation:
where is tunneling resistance, is the effective contact resistance, is the exponential prefactor
that depends on the nature of bonding in the molecular back-bone and L is the SAM thickness.36
Recently SAMs, have been implemented in OFETs in order to confer new functionalities to the
device, opening new scenarios in the world of multiresponsive organic electronic devices.
Among molecules which are intrinsically functional, the class of photochromic molecules is one of
the most exploited in organic electronics. Photochromic molecules are molecules which upon a light
1.Introduction
17
stimulus undergo an isomerization which causes a variation in their absorption spectrum (i.e. their
color). Photochromic molecules belong to the more generic class of molecular switches,37 which are
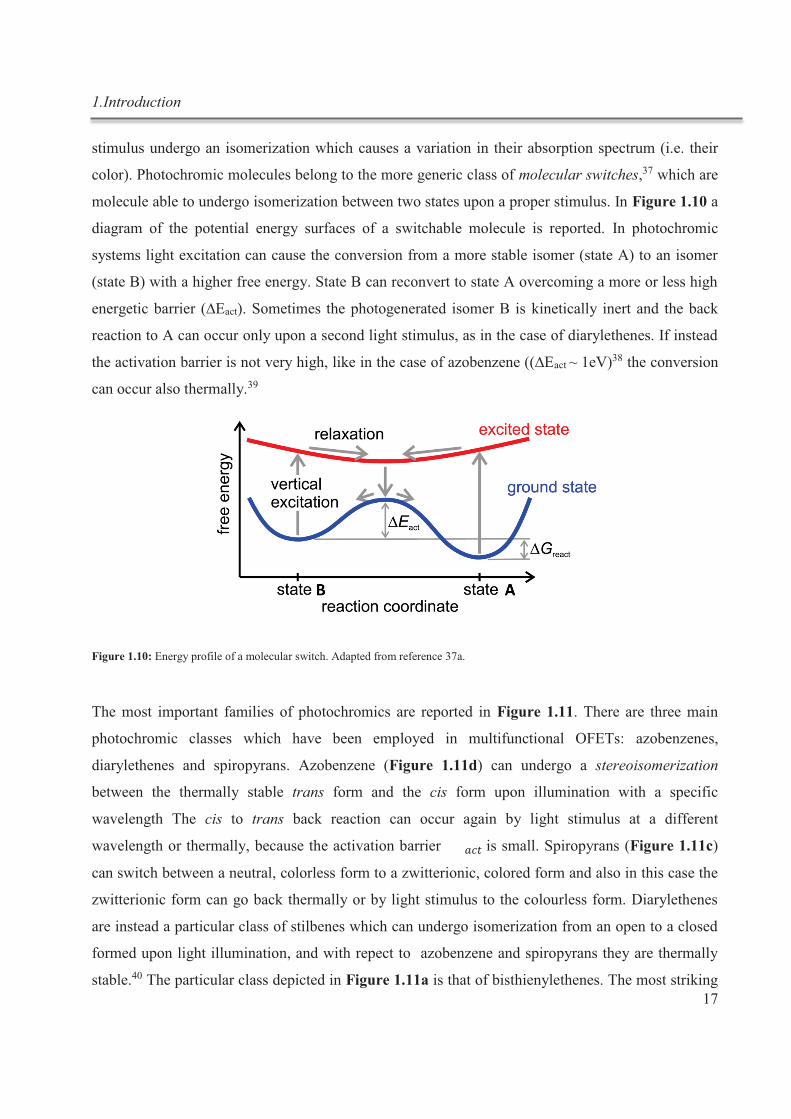
molecule able to undergo isomerization between two states upon a proper stimulus. In Figure 1.10 a
diagram of the potential energy surfaces of a switchable molecule is reported. In photochromic
systems light excitation can cause the conversion from a more stable isomer (state A) to an isomer
(state B) with a higher free energy. State B can reconvert to state A overcoming a more or less high
energetic barrier (∆Eact). Sometimes the photogenerated isomer B is kinetically inert and the back
reaction to A can occur only upon a second light stimulus, as in the case of diarylethenes. If instead
the activation barrier is not very high, like in the case of azobenzene ((∆Eact ~ 1eV)38 the conversion
can occur also thermally.39
Figure 1.10: Energy profile of a molecular switch. Adapted from reference 37a.
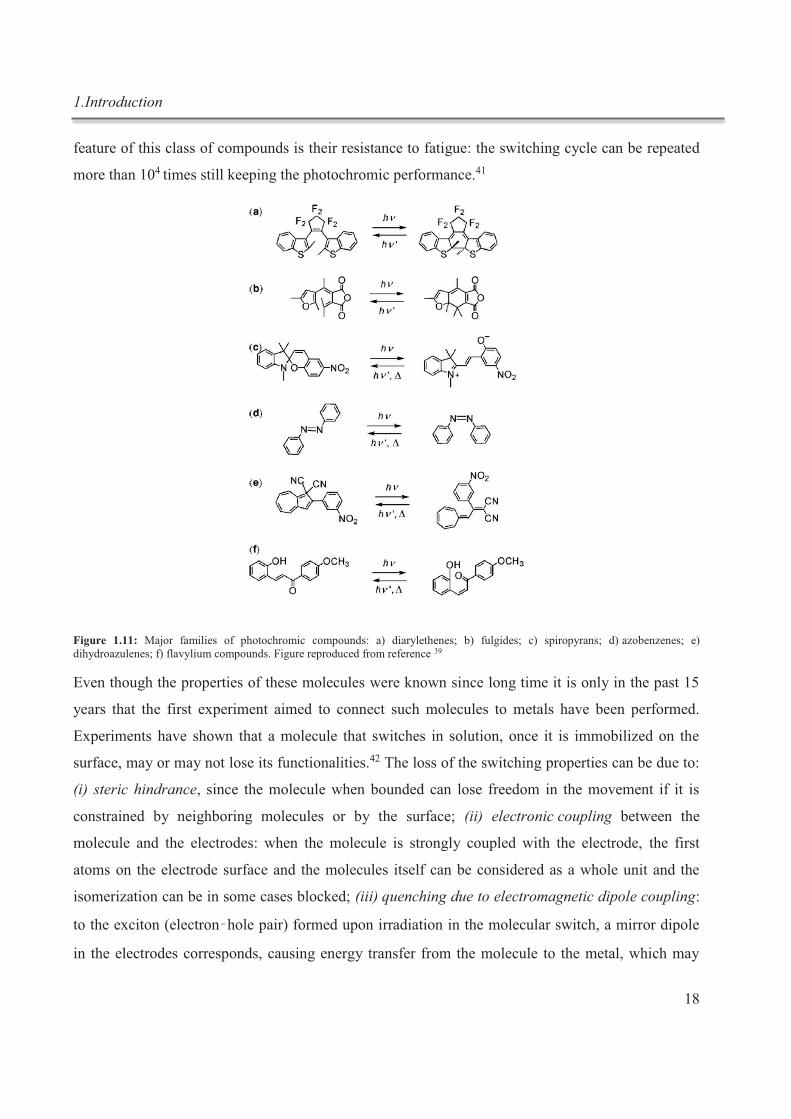
The most important families of photochromics are reported in Figure 1.11. There are three main
photochromic classes which have been employed in multifunctional OFETs: azobenzenes,
diarylethenes and spiropyrans. Azobenzene (Figure 1.11d) can undergo a stereoisomerization
between the thermally stable trans form and the cis form upon illumination with a specific
wavelength The cis to trans back reaction can occur again by light stimulus at a different
wavelength or thermally, because the activation barrier is small. Spiropyrans (Figure 1.11c)
can switch between a neutral, colorless form to a zwitterionic, colored form and also in this case the
zwitterionic form can go back thermally or by light stimulus to the colourless form. Diarylethenes
are instead a particular class of stilbenes which can undergo isomerization from an open to a closed
formed upon light illumination, and with repect to azobenzene and spiropyrans they are thermally
stable.40 The particular class depicted in Figure 1.11a is that of bisthienylethenes. The most striking
1.Introduction
18
feature of this class of compounds is their resistance to fatigue: the switching cycle can be repeated
more than 104 times still keeping the photochromic performance.41
Figure 1.11: Major families of photochromic compounds: a) diarylethenes; b) fulgides; c) spiropyrans; d) azobenzenes; e) dihydroazulenes; f) flavylium compounds. Figure reproduced from reference 39
Even though the properties of these molecules were known since long time it is only in the past 15
years that the first experiment aimed to connect such molecules to metals have been performed.
Experiments have shown that a molecule that switches in solution, once it is immobilized on the
surface, may or may not lose its functionalities.42 The loss of the switching properties can be due to:
(i) steric hindrance, since the molecule when bounded can lose freedom in the movement if it is
constrained by neighboring molecules or by the surface; (ii) electronic coupling between the
molecule and the electrodes: when the molecule is strongly coupled with the electrode, the first
atoms on the electrode surface and the molecules itself can be considered as a whole unit and the
isomerization can be in some cases blocked; (iii) quenching due to electromagnetic dipole coupling:
to the exciton (electron hole pair) formed upon irradiation in the molecular switch, a mirror dipole
in the electrodes corresponds, causing energy transfer from the molecule to the metal, which may
1.Introduction
19
lead to loss of the light-induced switching properties. Non-conjugated spacers can be inserted to
avoid (i) and (ii) but this may lead to a decrease of the conductance.42
The incorporation of photochromic molecules at interfaces allows the tuning of properties such as
charge injection in two and three terminal devices.
Different interfaces/surfaces of the OFETs have been engineered employing photochromic moieties.
To the best of our knowledge, only two examples of photochromic SAMs applied to OFET can be
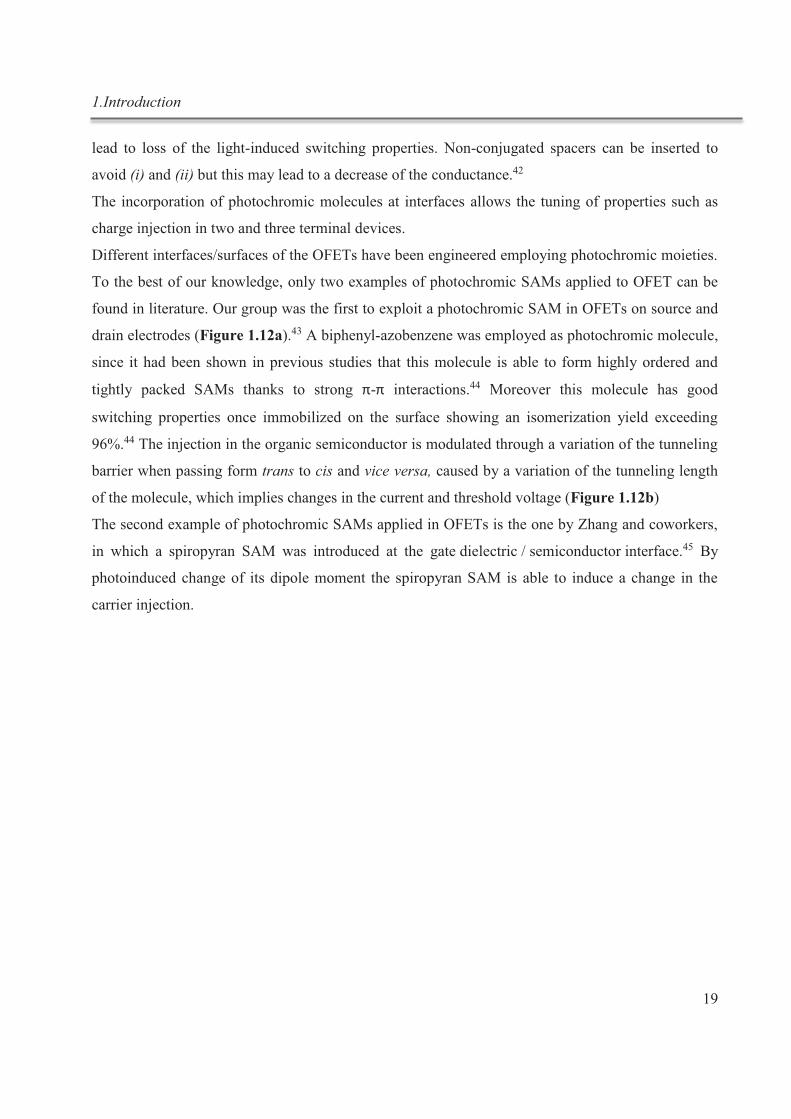
found in literature. Our group was the first to exploit a photochromic SAM in OFETs on source and
drain electrodes (Figure 1.12a).43 A biphenyl-azobenzene was employed as photochromic molecule,
since it had been shown in previous studies that this molecule is able to form highly ordered and
tightly packed SAMs thanks to strong π-π interactions.44 Moreover this molecule has good
switching properties once immobilized on the surface showing an isomerization yield exceeding
96%.44 The injection in the organic semiconductor is modulated through a variation of the tunneling
barrier when passing form trans to cis and vice versa, caused by a variation of the tunneling length
of the molecule, which implies changes in the current and threshold voltage (Figure 1.12b)
The second example of photochromic SAMs applied in OFETs is the one by Zhang and coworkers,
in which a spiropyran SAM was introduced at the gate dielectric / semiconductor interface.45 By
photoinduced change of its dipole moment the spiropyran SAM is able to induce a change in the
carrier injection.
1.Introduction
20
Figure 1.12: a) schematic representation of a OFET bearing an azobenzene SAM on the electrodes and the change in isomerization upon switching; b) variation of the current (ID)and of the threshold voltage (VTH) in linear and saturation regime upon isomerization of the azobenzene SAM for consecutive switching cycles
Chapter 6 of this thesis is part of this framework and aims at implementing multiple functionalities
in an OFET. In order to do so we have tried to implement two SAMs belonging to different
photochromic class, i.e. diarylethene and azobenzene in the same device. In the specific, we have
tried to build asymmetric electrodes with an azobenzene SAM on one electrode and a diarylethene
SAM on the second electrode. Preliminary tests have been done in order to show the independent
switching of the two SAMs upon illumination in the device.
1.Introduction
21
1.5. References
1. Lehn, J. M., Cryptates - Inclusion Complexes of Macropolycyclic Receptor Molecules. Pure Appl Chem 1978, 50 (9-10), 871-892. 2. Steed, J. W.; Turner, D. R.; Wallace, K., Core concepts in supramolecular chemistry and nanochemistry. John Wiley & Sons: 2007. 3. Ovchinnikov, Y. A., Second FEBS-Ferdinand Springer lecture: Membrane active complexones. Chemistry and biological function. FEBS letters 1974, 44 (1), 1-21. 4. (a) Pedersen, C. J., Cyclic polyethers and their complexes with metal salts. J. Am. Chem. Soc. 1967, 89 (26), 7017-7036; (b) Cram, D. J., Von molekularen Wirten und Gästen sowie ihren Komplexen (Nobel-Vortrag). Angew. Chem. 1988, 100 (8), 1041-1052; (c) Pedersen, C. J., The Discovery of Crown Ethers (Noble Lecture). Angew. Chem.,
Int. Ed. Engl. 1988, 27 (8), 1021-1027. 5. (a) Lehn, J. M., Cryptates: the chemistry of macropolycyclic inclusion complexes. Acc. Chem. Res. 1978, 11 (2), 49-57; (b) Lehn, J.-M., Supramolecular Chemistry—Scope and Perspectives Molecules, Supermolecules, and Molecular Devices (Nobel Lecture). Angew. Chem., Int. Ed. Engl. 1988, 27 (1), 89-112. 6. Whitesides, G. M.; Grzybowski, B., Self-Assembly at All Scales. Science 2002, 295 (5564), 2418-2421. 7. Reinhoudt, D. N., Supramolecular Materials and Technologies. John Wiley & Sons Ltd: 1999. 8. Ozin, G. A.; Arsenault, A. C.; Cademartiri, L.; Chemistry, R. S. o., Nanochemistry: A Chemical Approach to
Nanomaterials. Royal Society of Chemistry: 2009. 9. Iqbal, P.; Preece, J. A.; Mendes, P. M., Nanotechnology: The “Top-Down” and “Bottom-Up” Approaches. In
Supramol. Chem., John Wiley & Sons, Ltd: 2012. 10. Jeffrey, G. A., An Introduction to Hydrogen Bonding. Oxford University Press: 1997. 11. Hunter, C. A.; Sanders, J. K. M., The nature of .pi.-.pi. interactions. J. Am. Chem. Soc. 1990, 112 (14), 5525-5534. 12. Varshey, D. B.; Sander, J. R. G.; Friščić, T.; MacGillivray, L. R., Supramolecular Interactions. In Supramol.
Chem., John Wiley & Sons, Ltd: 2012. 13. Meyer, E. A.; Castellano, R. K.; Diederich, F., Interactions with Aromatic Rings in Chemical and Biological Recognition. Angew. Chem. Int. Ed. 2003, 42 (11), 1210-1250. 14. Pedersen, C. J., The Discovery of Crown Ethers (Noble Lecture). Angewandte Chemie International Edition in
English 1988, 27 (8), 1021-1027. 15. Lehn, J.-M., Supramolecular Chemistry—Scope and Perspectives Molecules, Supermolecules, and Molecular Devices (Nobel Lecture). Angew. Chem., Int. Ed. Engl. 1988, Physical Review B: Condensed Matter and Materials
Physics (1), 89-112. 16. Lehn, J. M.; Sauvage, J. P., Cryptates. XVI. [2]-Cryptates. Stability and selectivity of alkali and alkaline-earth macrobicyclic complexes. J. Am. Chem. Soc. 1975, 97 (23), 6700-6707. 17. Cram, D. J.; Cram, J. M., Container Molecules and their Guests. The Royal Society of Chemistry, Cambridge: 1994. 18. (a) Cram, D. J., The Design of Molecular Hosts, Guests, and Their Complexes (Nobel Lecture). Angewandte
Chemie International Edition in English 1988, 27 (8), 1009-1020; (b) Cram, D. J.; Kaneda, T.; Helgeson, R. C.; Brown, S. B.; Knobler, C. B.; Maverick, E.; Trueblood, K. N., Host-guest complexation. 35. Spherands, the first completely preorganized ligand systems. J. Am. Chem. Soc. 1985, 107 (12), 3645-3657. 19. Steed, J. W.; Atwood, J. L., Supramolecular Chemistry. 2nd Edition ed.; Wiley: 2009. 20. Werner, A., Beitrag zur Konstitution anorganischer Verbindungen. Zeitschrift für anorganische Chemie 1893, 3 (1), 267-330. 21. Fischer, E., Einfluss der Configuration auf die Wirkung der Enzyme. Berichte der deutschen chemischen
Gesellschaft 1894, 27 (3), 2985-2993. 22. Ehrlich, P., Chemotherapeutics: scientific principles, methods and results Lancet 1913, 2, 445-451. 23. Schalley, C. A., Analytical Methods in Supramolecular Chemistry. Wiley: 2007. 24. (a) Naghibi, H.; Tamura, A.; Sturtevant, J. M., Significant discrepancies between van't Hoff and calorimetric enthalpies. Proc. Natl. Acad. Sci. 1995, 92 (12), 5597-5599; (b) Liu, Y.; Sturtevant, J. M., Significant discrepancies between van't Hoff and calorimetric enthalpies. III. Biophys. Chem. 1997, 64 (1–3), 121-126; (c) Mizoue, L. S.; Tellinghuisen, J., Calorimetric vs. van't Hoff binding enthalpies from isothermal titration calorimetry: Ba2+-crown ether complexation. Biophys. Chem. 2004, 110 (1–2), 15-24. 25. Palermo, V.; Samorì, P., Molecular Self-Assembly across Multiple Length Scales. Angew. Chem. Int. Ed. 2007, 46 (24), 4428-4432.
1.Introduction
22
26. Vericat, C.; Vela, M. E.; Benitez, G.; Carro, P.; Salvarezza, R. C., Self-assembled monolayers of thiols and dithiols on gold: new challenges for a well-known system. Chem. Soc. Rev. 2010, 39 (5), 1805-1834. 27. Love, J. C.; Estroff, L. A.; Kriebel, J. K.; Nuzzo, R. G.; Whitesides, G. M., Self-Assembled Monolayers of Thiolates on Metals as a Form of Nanotechnology. Chem. Rev. 2005, 105 (4), 1103-1170. 28. Azzaroni, O.; Salvarezza, R. C., Chemisorbed Self-Assembled Monolayers. In Supramol. Chem., John Wiley & Sons, Ltd: 2012. 29. Ulman, A., Formation and structure of self-assembled monolayers. Chem. Rev. 1996, 96 (4), 1533-1554. 30. Dubois, L. H.; Nuzzo, R. G., Synthesis, Structure, and Properties of Model Organic Surfaces. Annu. Rev. Phys. Chem. 1992, 43 (1), 437-463. 31. Kankate, L.; Turchanin, A.; Gölzhäuser, A., On the Release of Hydrogen from the S−H groups in the
Formation of Self-Assembled Monolayers of Thiols. Langmuir 2009, 25 (18), 10435-10438. 32. Hasan, M.; Bethell, D.; Brust, M., The Fate of Sulfur-Bound Hydrogen on Formation of Self-Assembled Thiol Monolayers on Gold: 1H NMR Spectroscopic Evidence from Solutions of Gold Clusters. J. Am. Chem. Soc. 2002, 124 (7), 1132-1133. 33. Koch, N., Organic Electronic Devices and Their Functional Interfaces. ChemPhysChem 2007, 8 (10), 1438-1455. 34. Demeyu, L.; Stafström, S.; Bekele, M., Monte Carlo simulations of charge carrier mobility in semiconducting polymer field-effect transistors. Phys. Rev. B 2007, 76 (15), 155202. 35. Salleo, A.; Chabinyc, M. L.; Yang, M. S.; Street, R. A., Polymer thin-film transistors with chemically modified dielectric interfaces. Appl. Phys. Lett. 2002, 81 (23), 4383-4385. 36. Ho Choi, S.; Kim, B.; Frisbie, C. D., Electrical Resistance of Long Conjugated Molecular Wires. Science 2008, 320 (5882), 1482-1486. 37. (a) van der Molen, S. J.; Liljeroth, P., Charge transport through molecular switches. J. Phys.: Condens. Matter
2010, 22 (13), 133001; (b) Weibel, N.; Grunder, S.; Mayor, M., Functional molecules in electronic circuits. Org.
Biomol. Chem. 2007, 5 (15), 2343-2353. 38. Rau, H., Azo compounds. Photochromism: Molecules and Systems 2003, 165-+. 39. Balzani, V.; Credi, A.; Venturi, M., Molecular Devices and Machines: Concepts and Perspectives for the
Nanoworld. Second Edition ed.; Wiley-VCH Verlag GmbH & Co. KGaA: 2008. 40. Irie, M.; Mohri, M., Thermally irreversible photochromic systems. Reversible photocyclization of diarylethene derivatives. J. Org. Chem 1988, 53 (4), 803-808. 41. Irie, M., Diarylethenes for Memories and Switches. Chem. Rev. 2000, 100 (5), 1685-1716. 42. van der Molen, S. J.; Liljeroth, P., Conductance Properties of Switchable Molecules. In Molecular Switches, Wiley-VCH Verlag GmbH & Co. KGaA: 2011; pp 719-777. 43. Crivillers, N.; Orgiu, E.; Reinders, F.; Mayor, M.; Samorì, P., Optical Modulation of the Charge Injection in an Organic Field-Effect Transistor Based on Photochromic Self-Assembled-Monolayer-Functionalized Electrodes. Adv.
Mater. 2011, 23 (12), 1447-1452. 44. Pace, G.; Ferri, V.; Grave, C.; Elbing, M.; von Hänisch, C.; Zharnikov, M.; Mayor, M.; Rampi, M. A.; Samorì, P., Cooperative light-induced molecular movements of highly ordered azobenzene self-assembled monolayers. Proc.
Natl. Acad. Sci. 2007, 104 (24), 9937-9942. 45. Zhang, H.; Guo, X.; Hui, J.; Hu, S.; Xu, W.; Zhu, D., Interface Engineering of Semiconductor/Dielectric Heterojunctions toward Functional Organic Thin-Film Transistors. Nano Lett. 2011, 11 (11), 4939-4946.
2.Graphene
23
2. Graphene
2.1. Introduction
Graphene is a unique material exhibiting exceptional optical, electrical and mechanical properties
rendering it appealing for numerous technological applications. Some of these properties, e.g. high
conductivity, had already been predicted theoretically in 1947.1 Graphene had been already
synthetized on Platinum2 and from SiC3 in the 1970s, however it was only in 2004, when it was
isolated by micromechanical exfoliation by the group of Geim and Novoselov4, that its properties
started to be deeply studied. Such a seminal groundbreaking work has catalysed attention and a
notably high research activity on this type of material. Since then, new fascinating properties have
been revealed and different synthetic processing approaches have been exploited in order to produce
this material in large quantities paving the way towards industrial applications.5
In this chapter we will review the fundamental properties of graphene, synthetic routes for its
production and the techniques employed for its characterization. Moreover, we will focus our
attention on the liquid-phase exfoliation (LPE) of graphite approach since it is the one employed in
our experimental work and on the use of surfactants to improve the quantity and quality of the
dispersions produced.
2.2. Properties
Electronic properties
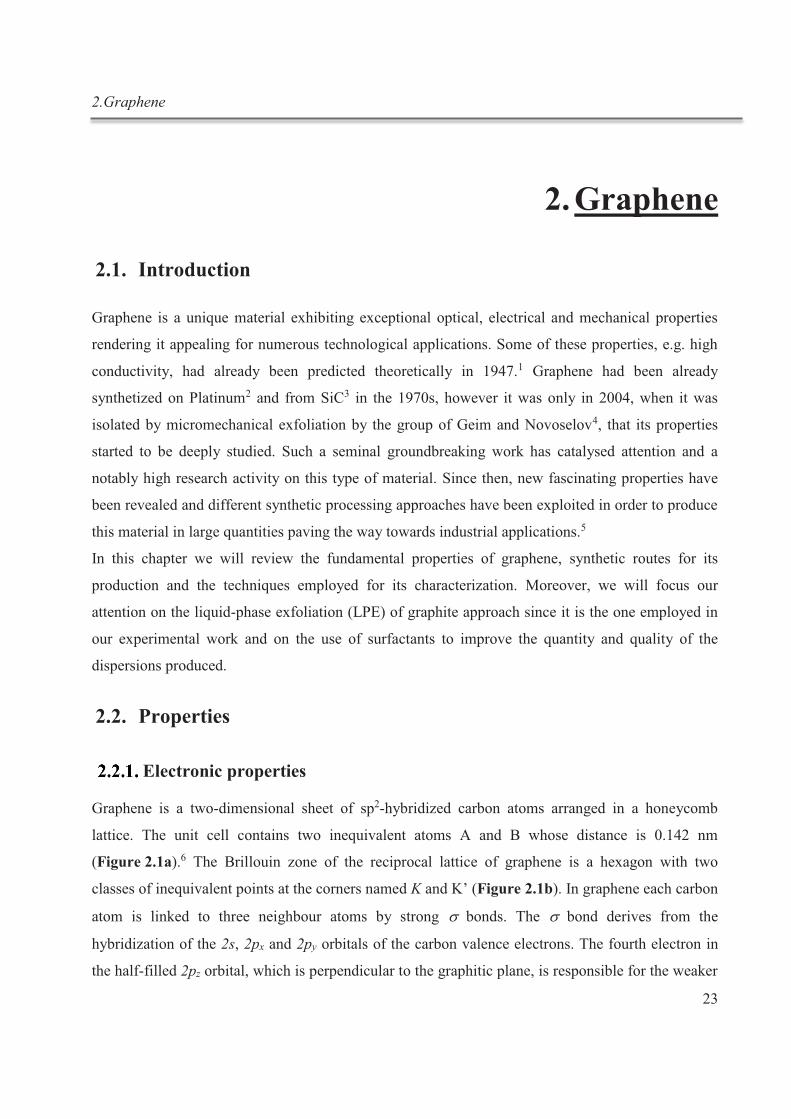
Graphene is a two-dimensional sheet of sp2-hybridized carbon atoms arranged in a honeycomb
lattice. The unit cell contains two inequivalent atoms A and B whose distance is 0.142 nm
(Figure 2.1a).6 The Brillouin zone of the reciprocal lattice of graphene is a hexagon with two
classes of inequivalent points at the corners named K and K’ (Figure 2.1b). In graphene each carbon
atom is linked to three neighbour atoms by strong s bonds. The s bond derives from the
hybridization of the 2s, 2px and 2py orbitals of the carbon valence electrons. The fourth electron in
the half-filled 2pz orbital, which is perpendicular to the graphitic plane, is responsible for the weaker
2.Graphene
24
π bond with the adjacent 2pz orbitals. The π electrons determine the electronic properties of
graphene. The energy dispersion of π electrons was derived by Wallace1 within the tight binding
approximation and it is represented in Figure 2.1c as a function of the wave vector k . The upper
band is called π* or anti-bonding band while the lower band is the bonding π band. The two bands
degenerate in the K and K’ points and the Fermi Energy level is constituted by the plane connecting
these points. In fact the π band is completely filled by electrons whereas the π* band is empty.
Since around the K and K’ points the dispersion can be approximated to cones (i.e. is linear)
electrons and holes at low energy levels behave like relativistic particles described by the Dirac
equation for spin-half particles. Therefore, the electrons and holes are called Dirac fermions, and the
six corners K and K’ of the Brillouin zone are called the Dirac points.7 The equation describing the
electronic dispersion relation around the Fermi energy is E = νF |k| where the Fermi velocity νF is
approximately 1/300 smaller than the speed of light, therefore νF ~ 106 m/s.
The Dirac Fermions in graphene in contrast to other Dirac fermions (e.g. neutrinos), bearing a
charge, can be manipulated through an electromagnetic field. This can lead to the observation of
many interesting effects such as the quantum Hall effect at room temperature8 and Berry’s phase in
graphene.9
Figure 2.1: a) Graphene lattice with unit cell containing two inequivalent carbon atoms A and B; b) Brillouin zone; c) Representation of the energy dispersion of π electrons; d) Magnification of the energy dispersion at one of the Dirac points. Figures a) and b) are taken from ref. 6, c) and d) from ref. 7.
Optical properties
Despite being only one atom layer thick, graphene is able to absorb a significant fraction of light
such that it can be possible to observe it by naked eye (Figure 2.2a).10 The opacity of graphene
surprisingly is not varying with material properties but is depending only from the fine structure
constant where e is the electron charge, is the reduced Planck constant and c is the speed of
2.Graphene
25
light. In fact, calculating the absorption of light by 2-D Dirac fermions with Fermi’s golden rule, it
leads to an opacity value of , where T is the transmittance. Therefore the origin
of the optical properties of graphene derives from its two dimensional nature and its gapless
electronic spectrum.
Graphene reflects less than 0.1% of light in the visible region and therefore the absorption can be
considered a linear function of the number of layers. N layers of graphene will have absorption equal
to N (Fig. 2.2b, inset).11 The absorption spectrum of single layer graphene is quite flat with a
peak around 270 nm (~ 4.6 eV) arising from Van Hove singularity of the band structure (Fig.
2.1c).12
Figure 2.2: a) On the right corner: sample prepared using a metal plate with holes of 20, 30 and 50 µm and graphene crystallites placed on them; main figure: photograph of a 50 µm aperture covered by a graphene monolayer and bilayer and transmittance profile along the yellow line. b) Open circle: transmittance of a single layer graphene; red line calculated transmittance for 2-D Dirac fermions and in green the corrected spectrum taking into account a nonlinearity and triangular warping of graphene’s electronic spectrum; in the inset: transmittance of the white light as function of the number of layers. The step at each layer (red arrow) corresponds to πα. c) On the top: transmission and reflection of a large scale graphene on a sapphire substrate (red curve) and of the bare sapphire (dashed curve) in the UV-region; on the bottom: experimental (black curve) and theoretical (blue curve) absorbance of the single layer graphene Image reproduce from ref. 12b.
Other properties
Graphene is a very elastic material with a Young modulus around 1 TPa. Nevertheless it is a very
strong material with a breaking strength of 42 N/m.13 Moreover, it is impermeable to gases and it
has a high thermal conductivity. All the extraordinary properties of this material make it suitable for
different applications. In Table 2.1 a summary of all the principal properties and the related possible
applications is reported.
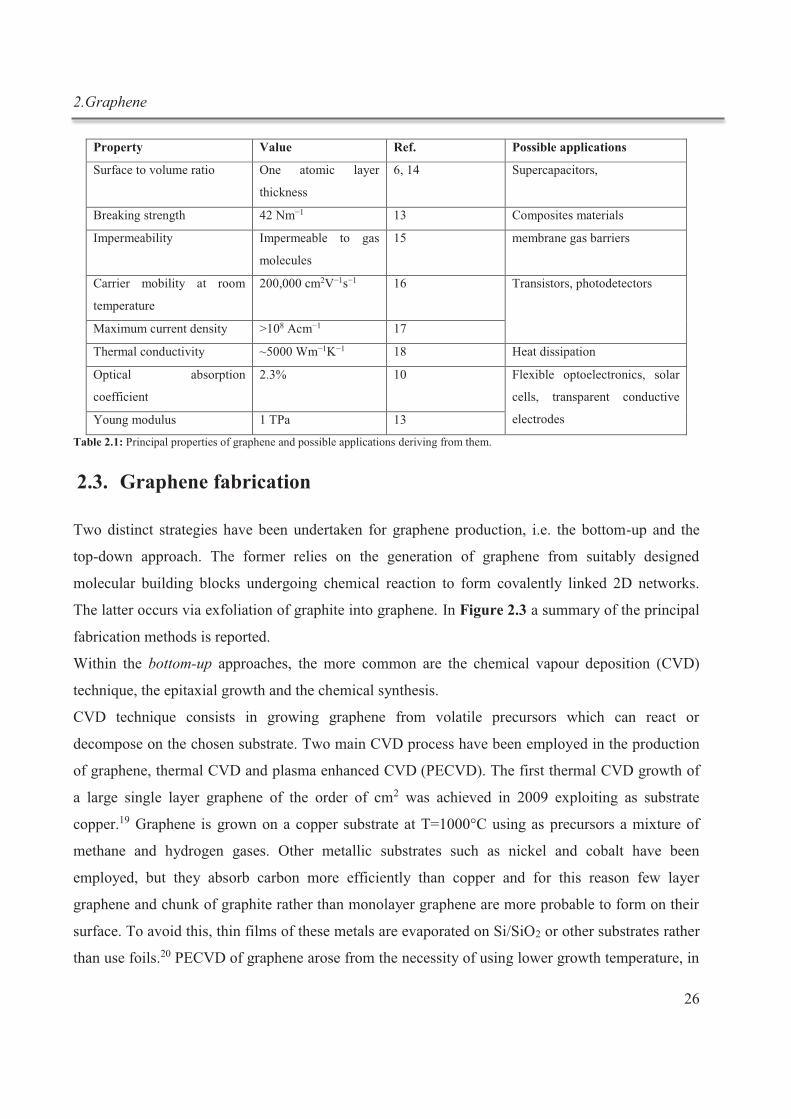
2.Graphene
26
Property Value Ref. Possible applications
Surface to volume ratio One atomic layer
thickness
6, 14 Supercapacitors,
Breaking strength 42 Nm−1 13 Composites materials
Impermeability Impermeable to gas
molecules
15 membrane gas barriers
Carrier mobility at room
temperature
200,000 cm2V−1s−1 16 Transistors, photodetectors
Maximum current density >108 Acm−1 17
Thermal conductivity ~5000 Wm−1K−1 18 Heat dissipation
Optical absorption
coefficient
2.3% 10 Flexible optoelectronics, solar
cells, transparent conductive
electrodes Young modulus 1 TPa 13
Table 2.1: Principal properties of graphene and possible applications deriving from them.
2.3. Graphene fabrication
Two distinct strategies have been undertaken for graphene production, i.e. the bottom-up and the
top-down approach. The former relies on the generation of graphene from suitably designed
molecular building blocks undergoing chemical reaction to form covalently linked 2D networks.
The latter occurs via exfoliation of graphite into graphene. In Figure 2.3 a summary of the principal
fabrication methods is reported.
Within the bottom-up approaches, the more common are the chemical vapour deposition (CVD)
technique, the epitaxial growth and the chemical synthesis.
CVD technique consists in growing graphene from volatile precursors which can react or
decompose on the chosen substrate. Two main CVD process have been employed in the production
of graphene, thermal CVD and plasma enhanced CVD (PECVD). The first thermal CVD growth of
a large single layer graphene of the order of cm2 was achieved in 2009 exploiting as substrate
copper.19 Graphene is grown on a copper substrate at T=1000°C using as precursors a mixture of
methane and hydrogen gases. Other metallic substrates such as nickel and cobalt have been
employed, but they absorb carbon more efficiently than copper and for this reason few layer
graphene and chunk of graphite rather than monolayer graphene are more probable to form on their
surface. To avoid this, thin films of these metals are evaporated on Si/SiO2 or other substrates rather
than use foils.20 PECVD of graphene arose from the necessity of using lower growth temperature, in
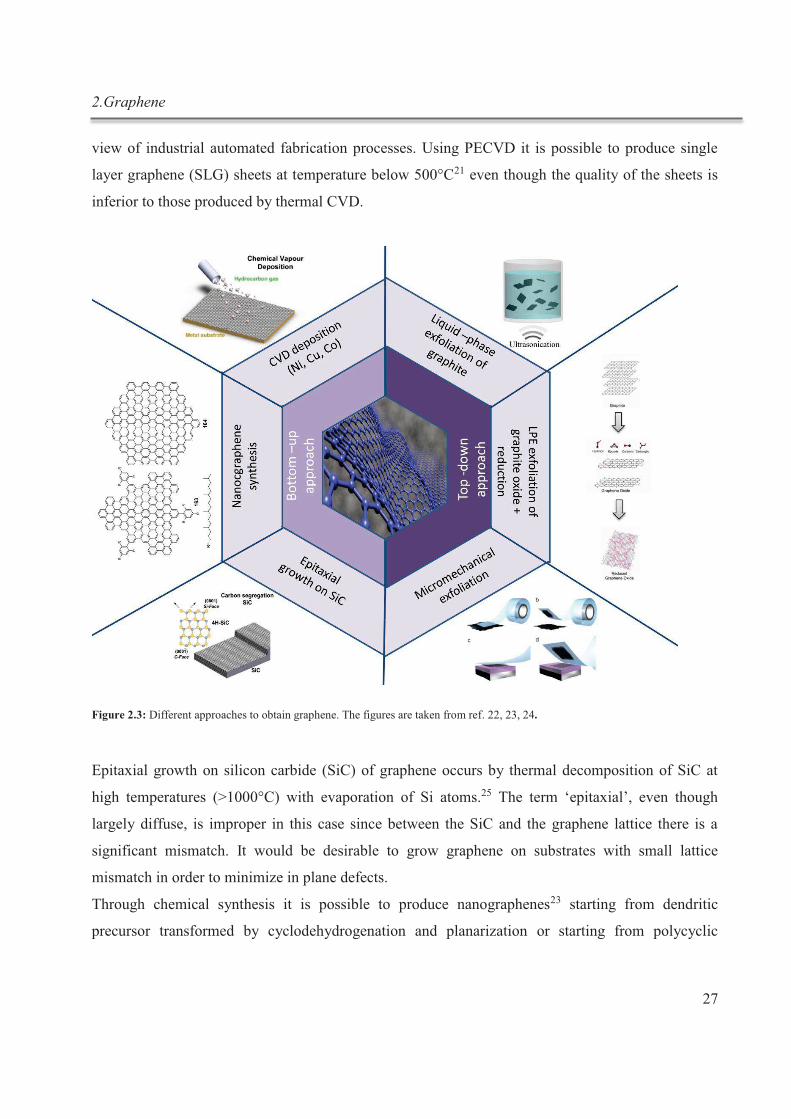
2.Graphene
27
view of industrial automated fabrication processes. Using PECVD it is possible to produce single
layer graphene (SLG) sheets at temperature below 500°C21 even though the quality of the sheets is
inferior to those produced by thermal CVD.
Figure 2.3: Different approaches to obtain graphene. The figures are taken from ref. 22, 23, 24.
Epitaxial growth on silicon carbide (SiC) of graphene occurs by thermal decomposition of SiC at
high temperatures (>1000°C) with evaporation of Si atoms.25 The term ‘epitaxial’, even though
largely diffuse, is improper in this case since between the SiC and the graphene lattice there is a
significant mismatch. It would be desirable to grow graphene on substrates with small lattice
mismatch in order to minimize in plane defects.
Through chemical synthesis it is possible to produce nanographenes23 starting from dendritic
precursor transformed by cyclodehydrogenation and planarization or starting from polycyclic
2.Graphene
28
aromatic hydrocarbons (PAHs) by pyrolysis.26 In a similar way it is possible to produce also
graphene nanoribbons (GNRs)27 and graphene quantum dots (GDs).28
Micromechanical exfoliation is the top-down approach employed by Geim and Novoselov to
produce graphene and study its basic properties.4 This technique consists of the peeling of graphite
by means of scotch tape.24 Afterwards the scotch tape is attached to the substrate and together with
scotch residues and big pieces of graphite, 50 µm wide monolayer thick architectures are left on the
substrate and it is possible to visualize them with an optical microscope. However, this technique
can be employed only for fundamental research due to the low yield of graphene sheets produced.
Alternative top-down approaches leading to large quantities of produced graphene are
solution-based processes such as liquid phase exfoliation (LPE) and reduction of graphene oxide.
The oxidation of graphite was a process developed in 1859 by Brodie29 using potassium chlorate
(KClO3) and fuming nitric acid and then ameliorated until arriving to the well-known Hammer’s
method30 which employs a mixture of sulphuric acid, sodium nitrate and potassium permanganate.
Once oxidized, graphitic planes present many defects like epoxide, hydroxyl and carboxylic groups
that allow obtaining graphene oxide dispersed sheets in different solvents by sonication, stirring or
thermal expansion of graphite oxide. Then it is possible to reduce, i.e. decrease the oxidation state of
the oxygen-containing groups, in the graphene oxide, chemically by alkaline substances,31
electrochemically,32 thermally33 or by means of UV irradiation,34 plasma treatment35 and so on. The
reduced graphene oxide (RGO), does not reach the electrical and optical properties of graphene,
because the sp2-conjugated network is never completely restored and many defects are present.
More recently, it has been shown that graphite can be directly exfoliated into graphene in liquid
media, without needing an oxidation step, by subsequent sonication and centrifugation cycles. Stable
dispersions of liquid-phase exfoliated graphene (LPE-G) can be obtained if solvents having a
surface tension close to that of graphene are employed.36
Another modern approach, which allows a mass production of high quality graphene in liquids, is
the electrochemical exfoliation of graphite (EEG) in organic37 and aqueous solutions.38 In this
process natural graphite or high oriented pyrolytic graphite (HOPG) is employed as electrode and
source of graphene in an electrochemical cell.
It has to be pointed out that every technique has its pros and cons. CVD and epitaxial growth
techniques have the advantage of producing high quality big graphene sheets, yet they are difficult
to be implemented for large-scale production and are expensive processes. LPE of graphite and
reduction of graphene oxide instead are highly upscalable methods but they produce graphene with
2.Graphene
29
small sheet size (~ 1 µm2) and of medium quality, which causes still problems when exploiting this
material in electronics.
2.4. Liquid-phase exfoliated graphene
The LPE process consists of three stages: (i) dispersion of graphite in the chosen solvent, (ii)
sonication, and (iii) purification through centrifugation.39
Exfoliation of graphite occurs thanks to shear forces and cavitation, acting on the bulk material
during ultrasonication. Acoustic waves, in fact, consist of alternate regions of compression and
rarefaction transmitted in a medium along the wave propagation direction. When a negative pressure
is exerted on a liquid the Wan der Waals forces between the molecules are overcome and small
bubbles (of micrometer range) of gas or cavities grow, nucleate and then collapse.40 This
phenomenon is known as cavitation. If the microbubble collapse against graphite this causes a
shockwave which will produce compressive stress waves propagating through the graphite; if the
collapse happens in the liquid close to the solid a jet of liquid will hit the graphite. For the theory of
stress waves,41 once a compressive wave enters in contact with the plane of graphite a tensile stress
on the graphite has to be reflected back causing the exfoliation (Figure 2.4 left). A second
phenomenon, which causes the exfoliation, is the unbalanced lateral compressive stress, which will
cause a shear effect causing delamination and dispersion of the flakes. In addition, the jet of liquid
can penetrate in between two layers causing the separation of the sheets (Figure 2.4 right).42
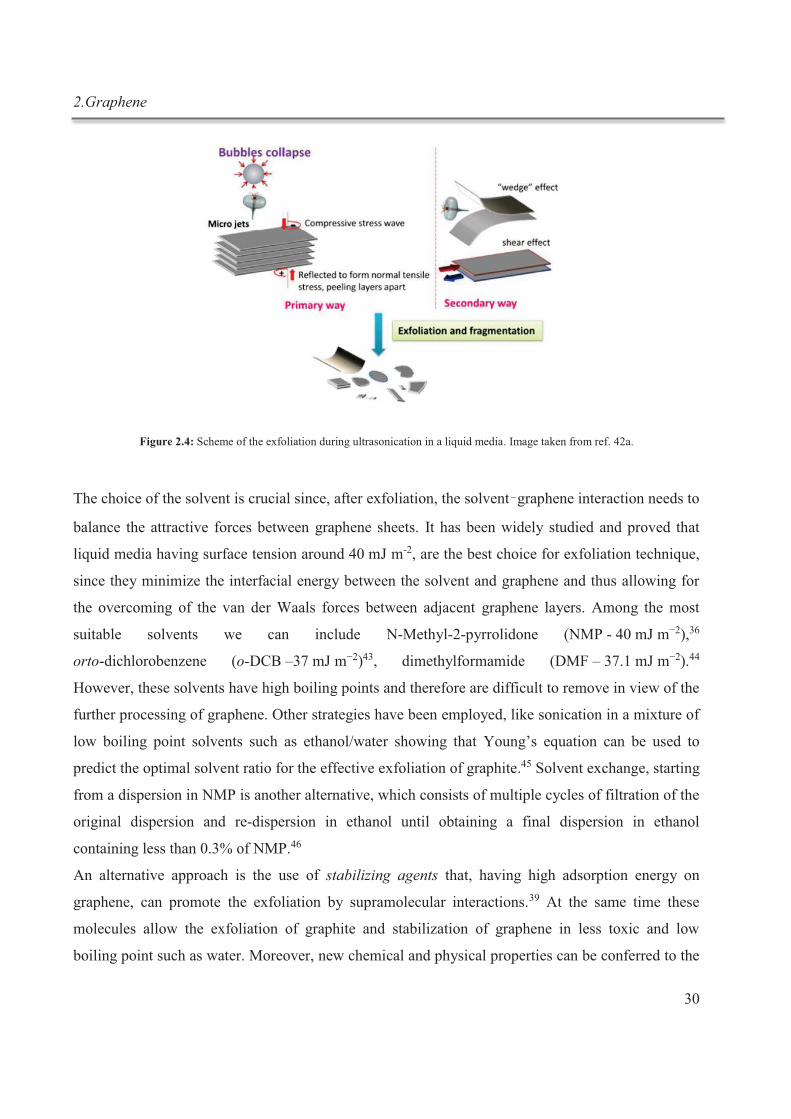
2.Graphene
30
Figure 2.4: Scheme of the exfoliation during ultrasonication in a liquid media. Image taken from ref. 42a.
The choice of the solvent is crucial since, after exfoliation, the solvent graphene interaction needs to
balance the attractive forces between graphene sheets. It has been widely studied and proved that
liquid media having surface tension around 40 mJ m-2, are the best choice for exfoliation technique,
since they minimize the interfacial energy between the solvent and graphene and thus allowing for
the overcoming of the van der Waals forces between adjacent graphene layers. Among the most
suitable solvents we can include N-Methyl-2-pyrrolidone (NMP - 40 mJ m−2),36
orto-dichlorobenzene (o-DCB –37 mJ m−2)43, dimethylformamide (DMF – 37.1 mJ m−2).44
However, these solvents have high boiling points and therefore are difficult to remove in view of the
further processing of graphene. Other strategies have been employed, like sonication in a mixture of
low boiling point solvents such as ethanol/water showing that Young’s equation can be used to
predict the optimal solvent ratio for the effective exfoliation of graphite.45 Solvent exchange, starting
from a dispersion in NMP is another alternative, which consists of multiple cycles of filtration of the
original dispersion and re-dispersion in ethanol until obtaining a final dispersion in ethanol
containing less than 0.3% of NMP.46
An alternative approach is the use of stabilizing agents that, having high adsorption energy on
graphene, can promote the exfoliation by supramolecular interactions.39 At the same time these
molecules allow the exfoliation of graphite and stabilization of graphene in less toxic and low
boiling point such as water. Moreover, new chemical and physical properties can be conferred to the
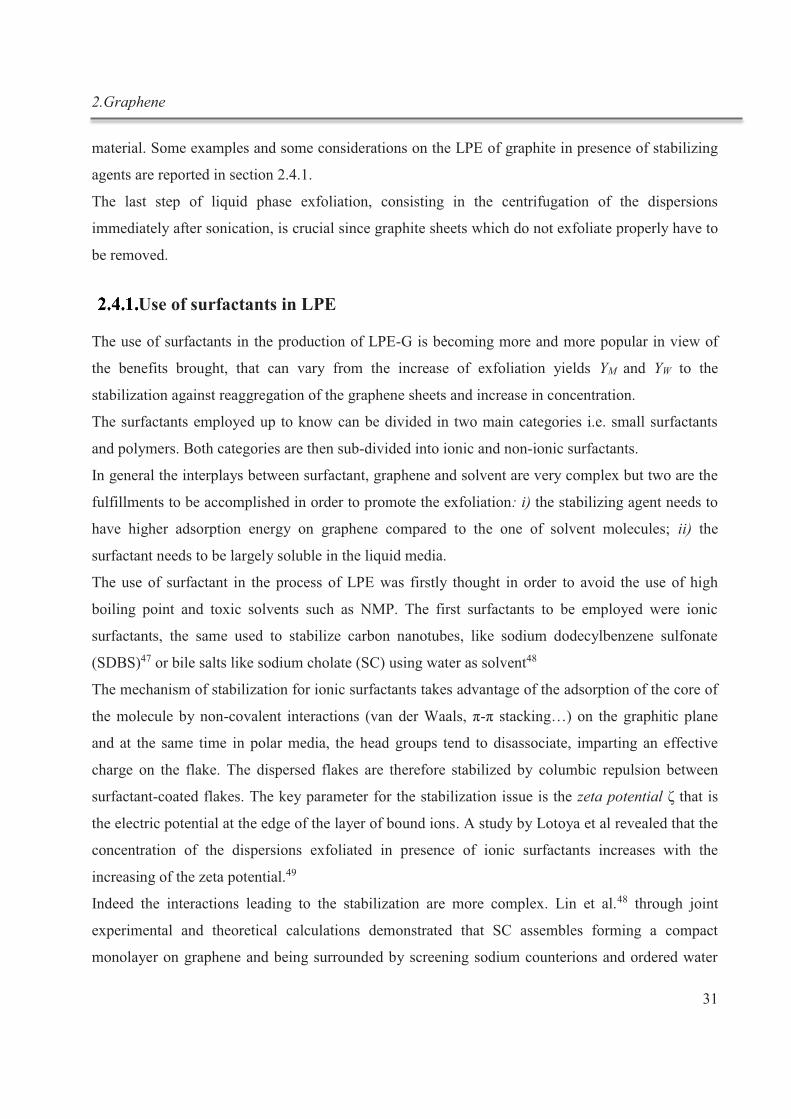
2.Graphene
31
material. Some examples and some considerations on the LPE of graphite in presence of stabilizing
agents are reported in section 2.4.1.
The last step of liquid phase exfoliation, consisting in the centrifugation of the dispersions
immediately after sonication, is crucial since graphite sheets which do not exfoliate properly have to
be removed.
Use of surfactants in LPE
The use of surfactants in the production of LPE-G is becoming more and more popular in view of
the benefits brought, that can vary from the increase of exfoliation yields YM and YW to the
stabilization against reaggregation of the graphene sheets and increase in concentration.
The surfactants employed up to know can be divided in two main categories i.e. small surfactants
and polymers. Both categories are then sub-divided into ionic and non-ionic surfactants.
In general the interplays between surfactant, graphene and solvent are very complex but two are the
fulfillments to be accomplished in order to promote the exfoliation: i) the stabilizing agent needs to
have higher adsorption energy on graphene compared to the one of solvent molecules; ii) the
surfactant needs to be largely soluble in the liquid media.
The use of surfactant in the process of LPE was firstly thought in order to avoid the use of high
boiling point and toxic solvents such as NMP. The first surfactants to be employed were ionic
surfactants, the same used to stabilize carbon nanotubes, like sodium dodecylbenzene sulfonate
(SDBS)47 or bile salts like sodium cholate (SC) using water as solvent48
The mechanism of stabilization for ionic surfactants takes advantage of the adsorption of the core of
the molecule by non-covalent interactions (van der Waals, π-π stacking…) on the graphitic plane
and at the same time in polar media, the head groups tend to disassociate, imparting an effective
charge on the flake. The dispersed flakes are therefore stabilized by columbic repulsion between
surfactant-coated flakes. The key parameter for the stabilization issue is the zeta potential ζ that is
the electric potential at the edge of the layer of bound ions. A study by Lotoya et al revealed that the
concentration of the dispersions exfoliated in presence of ionic surfactants increases with the
increasing of the zeta potential.49
Indeed the interactions leading to the stabilization are more complex. Lin et al.48 through joint
experimental and theoretical calculations demonstrated that SC assembles forming a compact
monolayer on graphene and being surrounded by screening sodium counterions and ordered water
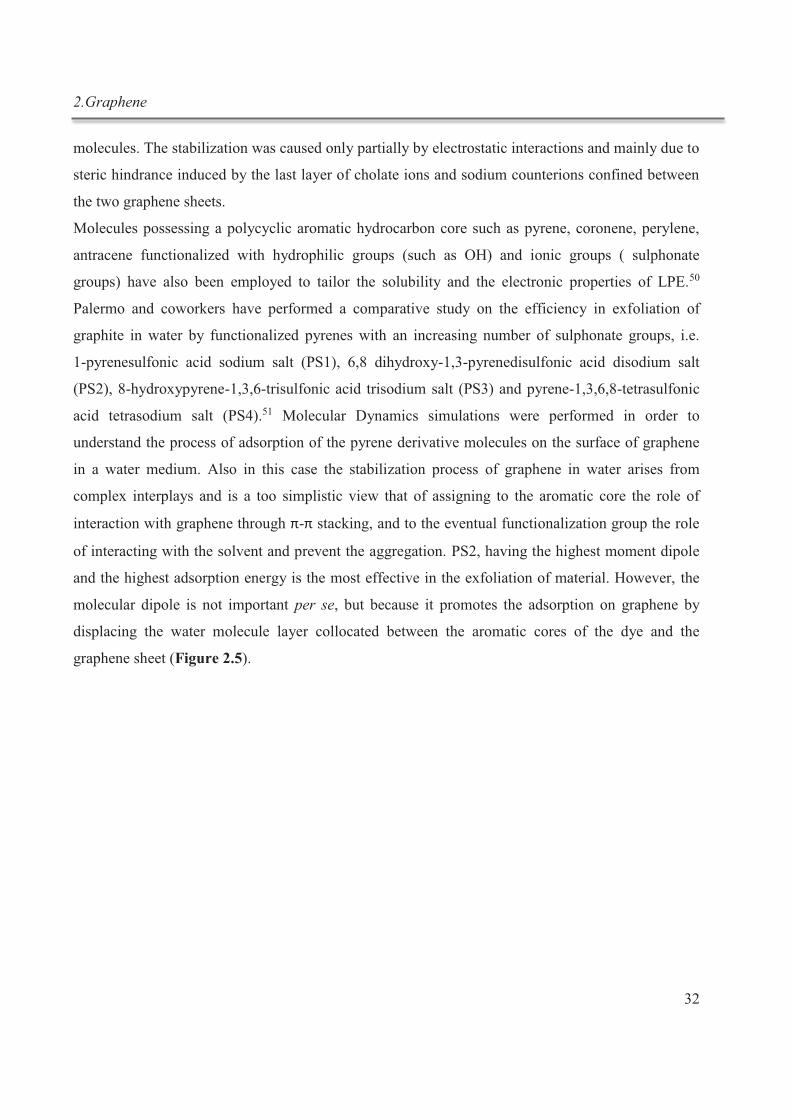
2.Graphene
32
molecules. The stabilization was caused only partially by electrostatic interactions and mainly due to
steric hindrance induced by the last layer of cholate ions and sodium counterions confined between
the two graphene sheets.
Molecules possessing a polycyclic aromatic hydrocarbon core such as pyrene, coronene, perylene,
antracene functionalized with hydrophilic groups (such as OH) and ionic groups ( sulphonate
groups) have also been employed to tailor the solubility and the electronic properties of LPE.50
Palermo and coworkers have performed a comparative study on the efficiency in exfoliation of
graphite in water by functionalized pyrenes with an increasing number of sulphonate groups, i.e.
1-pyrenesulfonic acid sodium salt (PS1), 6,8 dihydroxy-1,3-pyrenedisulfonic acid disodium salt
(PS2), 8-hydroxypyrene-1,3,6-trisulfonic acid trisodium salt (PS3) and pyrene-1,3,6,8-tetrasulfonic
acid tetrasodium salt (PS4).51 Molecular Dynamics simulations were performed in order to
understand the process of adsorption of the pyrene derivative molecules on the surface of graphene
in a water medium. Also in this case the stabilization process of graphene in water arises from
complex interplays and is a too simplistic view that of assigning to the aromatic core the role of
interaction with graphene through π-π stacking, and to the eventual functionalization group the role
of interacting with the solvent and prevent the aggregation. PS2, having the highest moment dipole
and the highest adsorption energy is the most effective in the exfoliation of material. However, the
molecular dipole is not important per se, but because it promotes the adsorption on graphene by
displacing the water molecule layer collocated between the aromatic cores of the dye and the
graphene sheet (Figure 2.5).
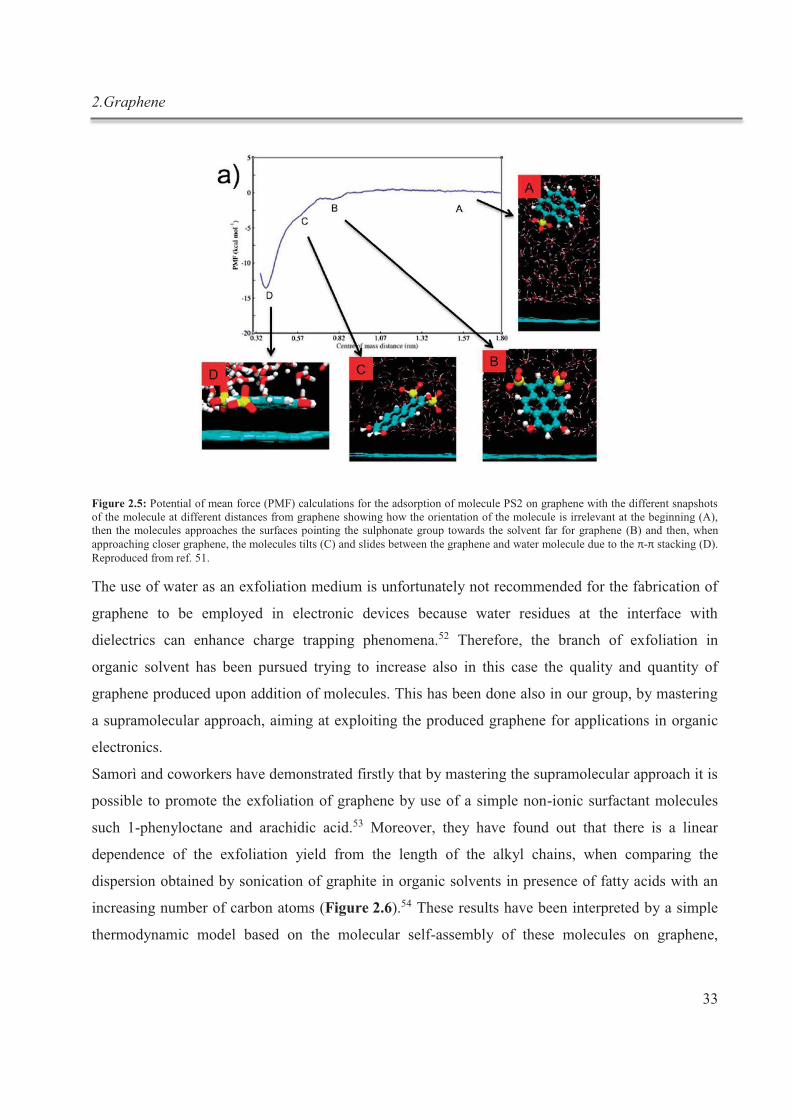
2.Graphene
33
Figure 2.5: Potential of mean force (PMF) calculations for the adsorption of molecule PS2 on graphene with the different snapshots of the molecule at different distances from graphene showing how the orientation of the molecule is irrelevant at the beginning (A), then the molecules approaches the surfaces pointing the sulphonate group towards the solvent far for graphene (B) and then, when approaching closer graphene, the molecules tilts (C) and slides between the graphene and water molecule due to the π-π stacking (D). Reproduced from ref. 51.
The use of water as an exfoliation medium is unfortunately not recommended for the fabrication of
graphene to be employed in electronic devices because water residues at the interface with
dielectrics can enhance charge trapping phenomena.52 Therefore, the branch of exfoliation in
organic solvent has been pursued trying to increase also in this case the quality and quantity of
graphene produced upon addition of molecules. This has been done also in our group, by mastering
a supramolecular approach, aiming at exploiting the produced graphene for applications in organic
electronics.
Samorì and coworkers have demonstrated firstly that by mastering the supramolecular approach it is
possible to promote the exfoliation of graphene by use of a simple non-ionic surfactant molecules
such 1-phenyloctane and arachidic acid.53 Moreover, they have found out that there is a linear
dependence of the exfoliation yield from the length of the alkyl chains, when comparing the
dispersion obtained by sonication of graphite in organic solvents in presence of fatty acids with an
increasing number of carbon atoms (Figure 2.6).54 These results have been interpreted by a simple
thermodynamic model based on the molecular self-assembly of these molecules on graphene,
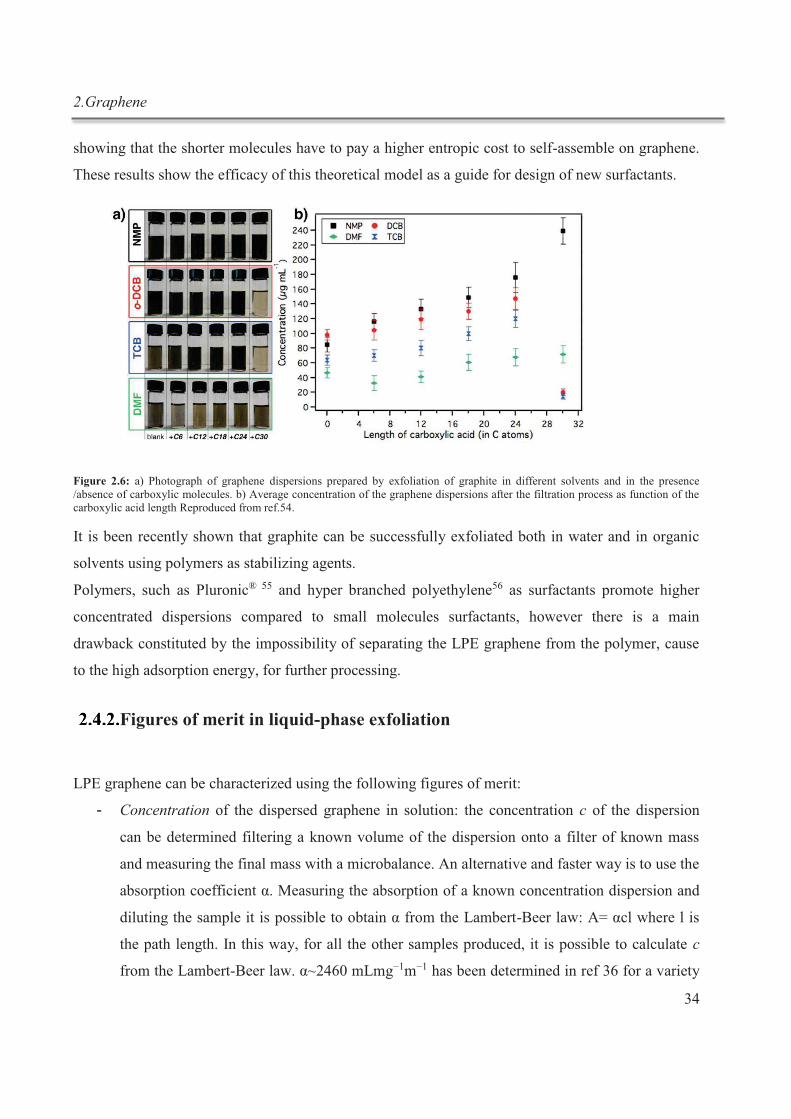
2.Graphene
34
showing that the shorter molecules have to pay a higher entropic cost to self-assemble on graphene.
These results show the efficacy of this theoretical model as a guide for design of new surfactants.
Figure 2.6: a) Photograph of graphene dispersions prepared by exfoliation of graphite in different solvents and in the presence /absence of carboxylic molecules. b) Average concentration of the graphene dispersions after the filtration process as function of the carboxylic acid length Reproduced from ref.54.
It is been recently shown that graphite can be successfully exfoliated both in water and in organic
solvents using polymers as stabilizing agents.
Polymers, such as Pluronic® 55 and hyper branched polyethylene56 as surfactants promote higher
concentrated dispersions compared to small molecules surfactants, however there is a main
drawback constituted by the impossibility of separating the LPE graphene from the polymer, cause
to the high adsorption energy, for further processing.
Figures of merit in liquid-phase exfoliation
LPE graphene can be characterized using the following figures of merit:
- Concentration of the dispersed graphene in solution: the concentration c of the dispersion
can be determined filtering a known volume of the dispersion onto a filter of known mass
and measuring the final mass with a microbalance. An alternative and faster way is to use the
absorption coefficient α. Measuring the absorption of a known concentration dispersion and
diluting the sample it is possible to obtain α from the Lambert-Beer law: A= αcl where l is
the path length. In this way, for all the other samples produced, it is possible to calculate c
from the Lambert-Beer law. α~2460 mLmg−1m−1 has been determined in ref 36 for a variety
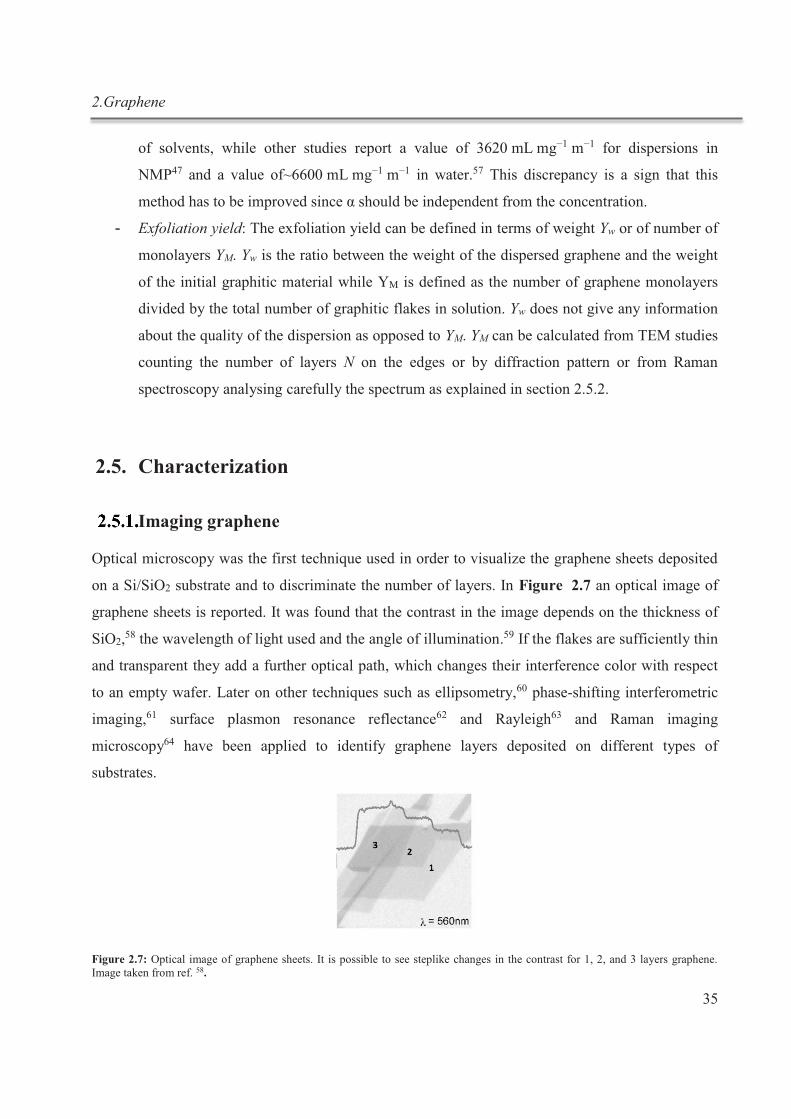
2.Graphene
35
of solvents, while other studies report a value of 3620 mL mg−1 m−1 for dispersions in
NMP47 and a value of~6600 mL mg−1 m−1 in water.57 This discrepancy is a sign that this
method has to be improved since α should be independent from the concentration.
- Exfoliation yield: The exfoliation yield can be defined in terms of weight Yw or of number of
monolayers YM. Yw is the ratio between the weight of the dispersed graphene and the weight
of the initial graphitic material while YM is defined as the number of graphene monolayers
divided by the total number of graphitic flakes in solution. Yw does not give any information
about the quality of the dispersion as opposed to YM. YM can be calculated from TEM studies
counting the number of layers N on the edges or by diffraction pattern or from Raman
spectroscopy analysing carefully the spectrum as explained in section 2.5.2.
2.5. Characterization
Imaging graphene
Optical microscopy was the first technique used in order to visualize the graphene sheets deposited
on a Si/SiO2 substrate and to discriminate the number of layers. In Figure 2.7 an optical image of
graphene sheets is reported. It was found that the contrast in the image depends on the thickness of
SiO2,58 the wavelength of light used and the angle of illumination.59 If the flakes are sufficiently thin
and transparent they add a further optical path, which changes their interference color with respect
to an empty wafer. Later on other techniques such as ellipsometry,60 phase-shifting interferometric
imaging,61 surface plasmon resonance reflectance62 and Rayleigh63 and Raman imaging
microscopy64 have been applied to identify graphene layers deposited on different types of
substrates.
Figure 2.7: Optical image of graphene sheets. It is possible to see steplike changes in the contrast for 1, 2, and 3 layers graphene. Image taken from ref. 58.
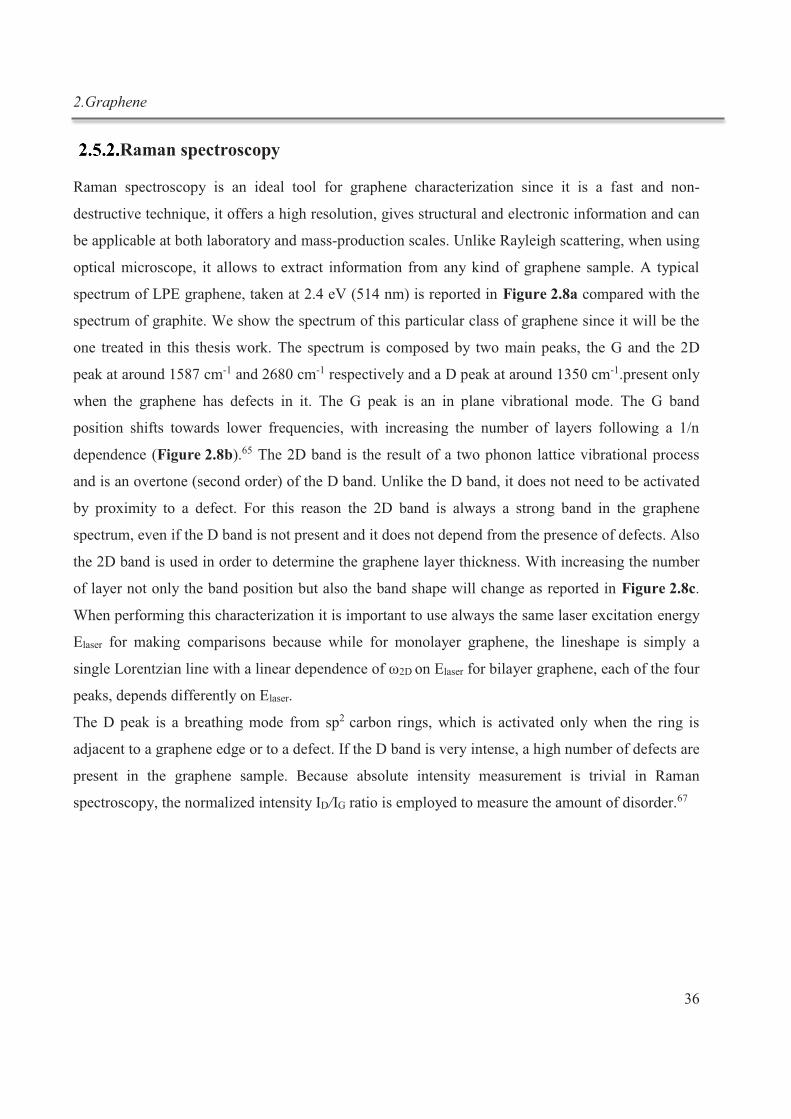
2.Graphene
36
Raman spectroscopy
Raman spectroscopy is an ideal tool for graphene characterization since it is a fast and non-
destructive technique, it offers a high resolution, gives structural and electronic information and can
be applicable at both laboratory and mass-production scales. Unlike Rayleigh scattering, when using
optical microscope, it allows to extract information from any kind of graphene sample. A typical
spectrum of LPE graphene, taken at 2.4 eV (514 nm) is reported in Figure 2.8a compared with the
spectrum of graphite. We show the spectrum of this particular class of graphene since it will be the
one treated in this thesis work. The spectrum is composed by two main peaks, the G and the 2D
peak at around 1587 cm-1 and 2680 cm-1 respectively and a D peak at around 1350 cm-1.present only
when the graphene has defects in it. The G peak is an in plane vibrational mode. The G band
position shifts towards lower frequencies, with increasing the number of layers following a 1/n
dependence (Figure 2.8b).65 The 2D band is the result of a two phonon lattice vibrational process
and is an overtone (second order) of the D band. Unlike the D band, it does not need to be activated
by proximity to a defect. For this reason the 2D band is always a strong band in the graphene
spectrum, even if the D band is not present and it does not depend from the presence of defects. Also
the 2D band is used in order to determine the graphene layer thickness. With increasing the number
of layer not only the band position but also the band shape will change as reported in Figure 2.8c.
When performing this characterization it is important to use always the same laser excitation energy
Elaser for making comparisons because while for monolayer graphene, the lineshape is simply a
single Lorentzian line with a linear dependence of ω2D on Elaser for bilayer graphene, each of the four
peaks, depends differently on Elaser.
The D peak is a breathing mode from sp2 carbon rings, which is activated only when the ring is
adjacent to a graphene edge or to a defect. If the D band is very intense, a high number of defects are
present in the graphene sample. Because absolute intensity measurement is trivial in Raman
spectroscopy, the normalized intensity ID/IG ratio is employed to measure the amount of disorder.67
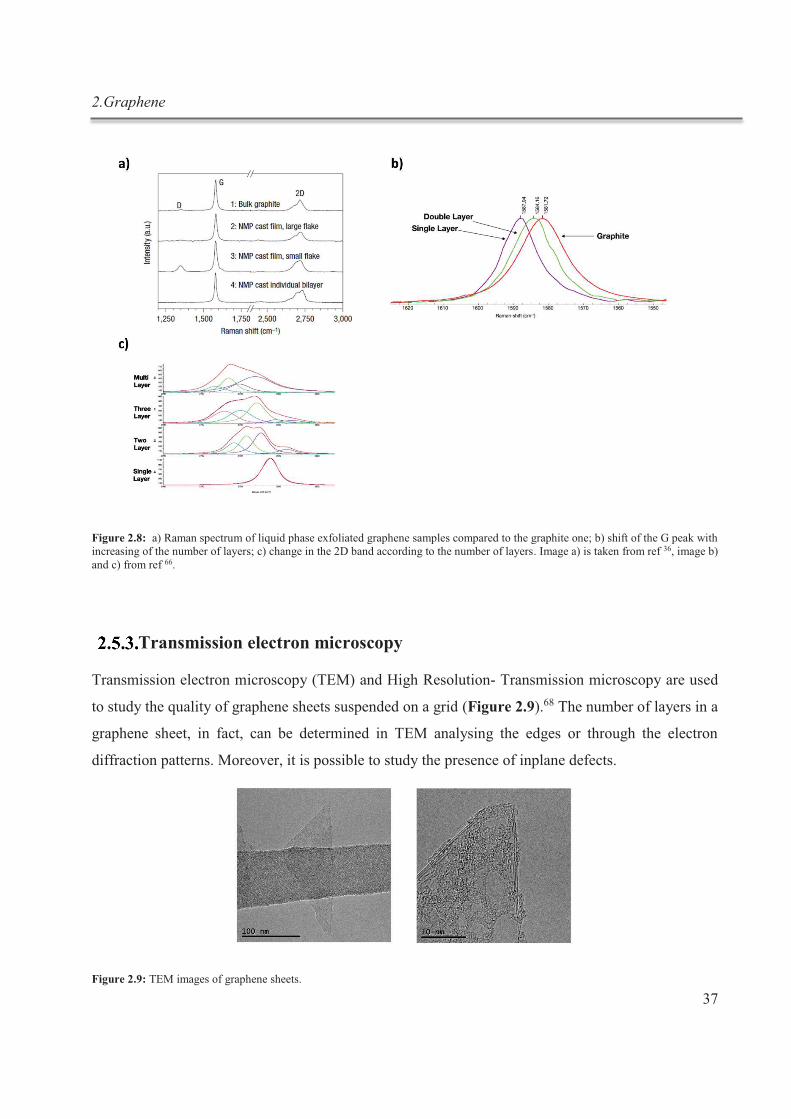
2.Graphene
37
Figure 2.8: a) Raman spectrum of liquid phase exfoliated graphene samples compared to the graphite one; b) shift of the G peak with increasing of the number of layers; c) change in the 2D band according to the number of layers. Image a) is taken from ref 36, image b) and c) from ref 66.
Transmission electron microscopy
Transmission electron microscopy (TEM) and High Resolution- Transmission microscopy are used
to study the quality of graphene sheets suspended on a grid (Figure 2.9).68 The number of layers in a
graphene sheet, in fact, can be determined in TEM analysing the edges or through the electron
diffraction patterns. Moreover, it is possible to study the presence of inplane defects.
Figure 2.9: TEM images of graphene sheets.
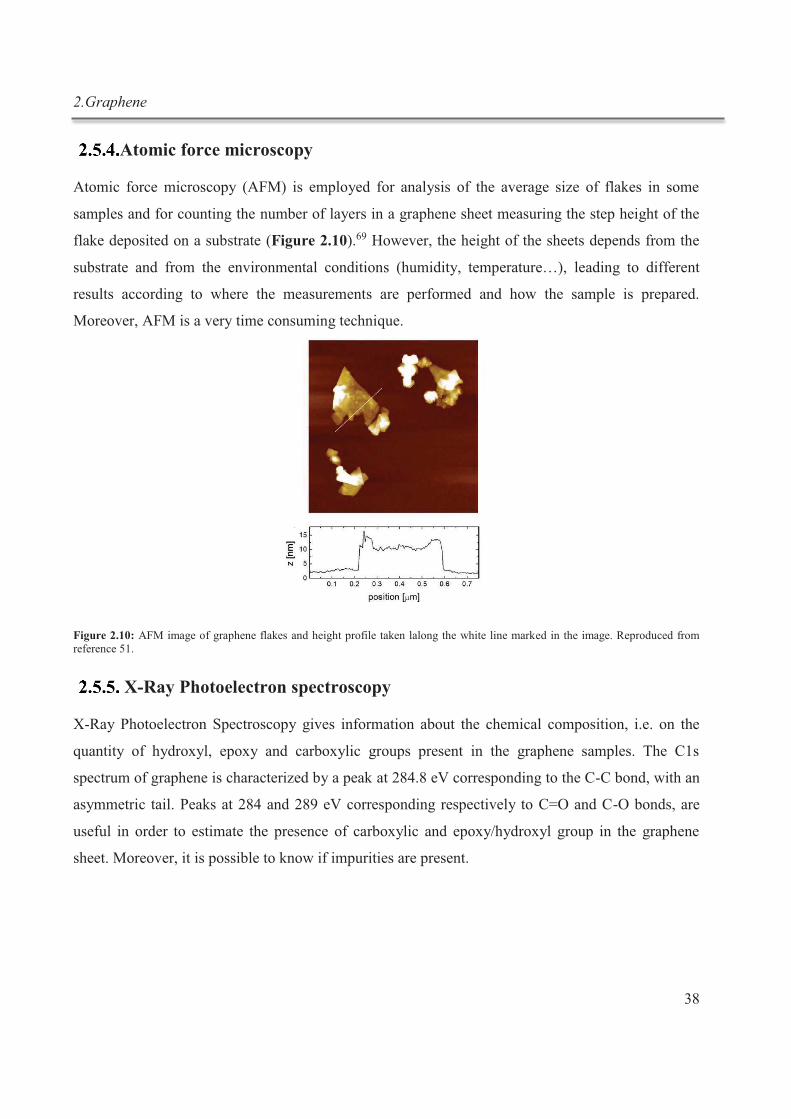
2.Graphene
38
Atomic force microscopy
Atomic force microscopy (AFM) is employed for analysis of the average size of flakes in some
samples and for counting the number of layers in a graphene sheet measuring the step height of the
flake deposited on a substrate (Figure 2.10).69 However, the height of the sheets depends from the
substrate and from the environmental conditions (humidity, temperature…), leading to different
results according to where the measurements are performed and how the sample is prepared.
Moreover, AFM is a very time consuming technique.
Figure 2.10: AFM image of graphene flakes and height profile taken lalong the white line marked in the image. Reproduced from reference 51.
X-Ray Photoelectron spectroscopy
X-Ray Photoelectron Spectroscopy gives information about the chemical composition, i.e. on the
quantity of hydroxyl, epoxy and carboxylic groups present in the graphene samples. The C1s
spectrum of graphene is characterized by a peak at 284.8 eV corresponding to the C-C bond, with an
asymmetric tail. Peaks at 284 and 289 eV corresponding respectively to C=O and C-O bonds, are
useful in order to estimate the presence of carboxylic and epoxy/hydroxyl group in the graphene
sheet. Moreover, it is possible to know if impurities are present.
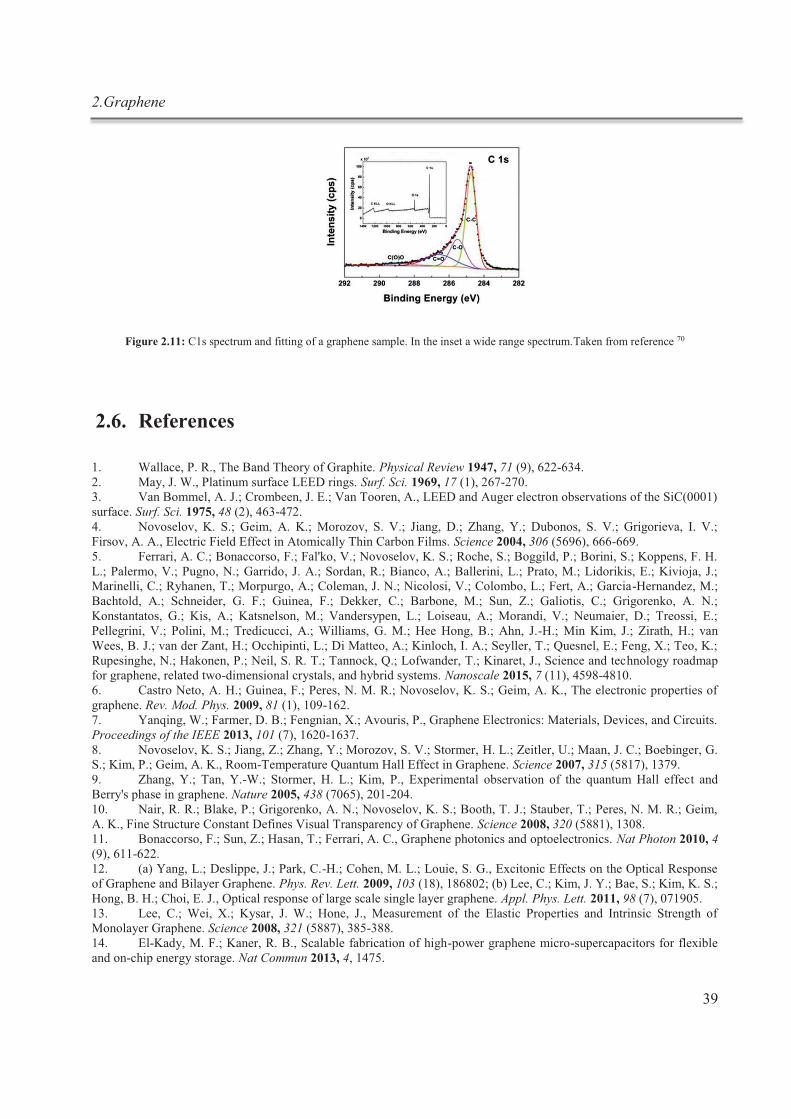
2.Graphene
39
Figure 2.11: C1s spectrum and fitting of a graphene sample. In the inset a wide range spectrum.Taken from reference 70
2.6. References
1. Wallace, P. R., The Band Theory of Graphite. Physical Review 1947, 71 (9), 622-634. 2. May, J. W., Platinum surface LEED rings. Surf. Sci. 1969, 17 (1), 267-270. 3. Van Bommel, A. J.; Crombeen, J. E.; Van Tooren, A., LEED and Auger electron observations of the SiC(0001) surface. Surf. Sci. 1975, 48 (2), 463-472. 4. Novoselov, K. S.; Geim, A. K.; Morozov, S. V.; Jiang, D.; Zhang, Y.; Dubonos, S. V.; Grigorieva, I. V.; Firsov, A. A., Electric Field Effect in Atomically Thin Carbon Films. Science 2004, 306 (5696), 666-669. 5. Ferrari, A. C.; Bonaccorso, F.; Fal'ko, V.; Novoselov, K. S.; Roche, S.; Boggild, P.; Borini, S.; Koppens, F. H. L.; Palermo, V.; Pugno, N.; Garrido, J. A.; Sordan, R.; Bianco, A.; Ballerini, L.; Prato, M.; Lidorikis, E.; Kivioja, J.; Marinelli, C.; Ryhanen, T.; Morpurgo, A.; Coleman, J. N.; Nicolosi, V.; Colombo, L.; Fert, A.; Garcia-Hernandez, M.; Bachtold, A.; Schneider, G. F.; Guinea, F.; Dekker, C.; Barbone, M.; Sun, Z.; Galiotis, C.; Grigorenko, A. N.; Konstantatos, G.; Kis, A.; Katsnelson, M.; Vandersypen, L.; Loiseau, A.; Morandi, V.; Neumaier, D.; Treossi, E.; Pellegrini, V.; Polini, M.; Tredicucci, A.; Williams, G. M.; Hee Hong, B.; Ahn, J.-H.; Min Kim, J.; Zirath, H.; van Wees, B. J.; van der Zant, H.; Occhipinti, L.; Di Matteo, A.; Kinloch, I. A.; Seyller, T.; Quesnel, E.; Feng, X.; Teo, K.; Rupesinghe, N.; Hakonen, P.; Neil, S. R. T.; Tannock, Q.; Lofwander, T.; Kinaret, J., Science and technology roadmap for graphene, related two-dimensional crystals, and hybrid systems. Nanoscale 2015, 7 (11), 4598-4810. 6. Castro Neto, A. H.; Guinea, F.; Peres, N. M. R.; Novoselov, K. S.; Geim, A. K., The electronic properties of graphene. Rev. Mod. Phys. 2009, 81 (1), 109-162. 7. Yanqing, W.; Farmer, D. B.; Fengnian, X.; Avouris, P., Graphene Electronics: Materials, Devices, and Circuits. Proceedings of the IEEE 2013, 101 (7), 1620-1637. 8. Novoselov, K. S.; Jiang, Z.; Zhang, Y.; Morozov, S. V.; Stormer, H. L.; Zeitler, U.; Maan, J. C.; Boebinger, G. S.; Kim, P.; Geim, A. K., Room-Temperature Quantum Hall Effect in Graphene. Science 2007, 315 (5817), 1379. 9. Zhang, Y.; Tan, Y.-W.; Stormer, H. L.; Kim, P., Experimental observation of the quantum Hall effect and Berry's phase in graphene. Nature 2005, 438 (7065), 201-204. 10. Nair, R. R.; Blake, P.; Grigorenko, A. N.; Novoselov, K. S.; Booth, T. J.; Stauber, T.; Peres, N. M. R.; Geim, A. K., Fine Structure Constant Defines Visual Transparency of Graphene. Science 2008, 320 (5881), 1308. 11. Bonaccorso, F.; Sun, Z.; Hasan, T.; Ferrari, A. C., Graphene photonics and optoelectronics. Nat Photon 2010, 4 (9), 611-622. 12. (a) Yang, L.; Deslippe, J.; Park, C.-H.; Cohen, M. L.; Louie, S. G., Excitonic Effects on the Optical Response of Graphene and Bilayer Graphene. Phys. Rev. Lett. 2009, 103 (18), 186802; (b) Lee, C.; Kim, J. Y.; Bae, S.; Kim, K. S.; Hong, B. H.; Choi, E. J., Optical response of large scale single layer graphene. Appl. Phys. Lett. 2011, 98 (7), 071905. 13. Lee, C.; Wei, X.; Kysar, J. W.; Hone, J., Measurement of the Elastic Properties and Intrinsic Strength of Monolayer Graphene. Science 2008, 321 (5887), 385-388. 14. El-Kady, M. F.; Kaner, R. B., Scalable fabrication of high-power graphene micro-supercapacitors for flexible and on-chip energy storage. Nat Commun 2013, 4, 1475.
2.Graphene
40
15. Nair, R. R.; Wu, H. A.; Jayaram, P. N.; Grigorieva, I. V.; Geim, A. K., Unimpeded Permeation of Water Through Helium-Leak-Tight Graphene-Based Membranes. Science 2012, 335 (6067), 442-444. 16. Chen, J.-H.; Jang, C.; Xiao, S.; Ishigami, M.; Fuhrer, M. S., Intrinsic and extrinsic performance limits of graphene devices on SiO2. Nat Nano 2008, 3 (4), 206-209. 17. Murali, R.; Yang, Y.; Brenner, K.; Beck, T.; Meindl, J. D., Breakdown current density of graphene nanoribbons. Appl. Phys. Lett. 2009, 94 (24), 243114. 18. Balandin, A. A.; Ghosh, S.; Bao, W.; Calizo, I.; Teweldebrhan, D.; Miao, F.; Lau, C. N., Superior Thermal Conductivity of Single-Layer Graphene. Nano Lett. 2008, 8 (3), 902-907. 19. Li, X.; Cai, W.; An, J.; Kim, S.; Nah, J.; Yang, D.; Piner, R.; Velamakanni, A.; Jung, I.; Tutuc, E.; Banerjee, S. K.; Colombo, L.; Ruoff, R. S., Large-Area Synthesis of High-Quality and Uniform Graphene Films on Copper Foils. Science 2009, 324 (5932), 1312-1314. 20. Kim, K. S.; Zhao, Y.; Jang, H.; Lee, S. Y.; Kim, J. M.; Kim, K. S.; Ahn, J.-H.; Kim, P.; Choi, J.-Y.; Hong, B. H., Large-scale pattern growth of graphene films for stretchable transparent electrodes. Nature 2009, 457 (7230), 706-710. 21. Kim, J.; Ishihara, M.; Koga, Y.; Tsugawa, K.; Hasegawa, M.; Iijima, S., Low-temperature synthesis of large-area graphene-based transparent conductive films using surface wave plasma chemical vapor deposition. Appl. Phys.
Lett. 2011, 98 (9), 091502. 22. Bonaccorso, F.; Lombardo, A.; Hasan, T.; Sun, Z.; Colombo, L.; Ferrari, A. C., Production and processing of graphene and 2d crystals. Mater. Today 2012, 15 (12), 564-589. 23. Sun, Z.; Ye, Q.; Chi, C.; Wu, J., Low band gap polycyclic hydrocarbons: from closed-shell near infrared dyes and semiconductors to open-shell radicals. Chem. Soc. Rev. 2012, 41 (23), 7857-7889. 24. Novoselov, K. S.; Neto, A. H. C., Two-dimensional crystals-based heterostructures: materials with tailored properties. Phys. Scr. 2012, 2012 (T146), 014006. 25. First, P. N.; de Heer, W. A.; Seyller, T.; Berger, C.; Stroscio, J. A.; Moon, J.-S., Epitaxial Graphenes on Silicon Carbide. MRS Bulletin 2010, 35 (04), 296-305. 26. Zhi, L.; Müllen, K., A bottom-up approach from molecular nanographenes to unconventional carbon materials. J. Mater. Chem. 2008, 18 (13), 1472-1484. 27. (a) Cai, J.; Ruffieux, P.; Jaafar, R.; Bieri, M.; Braun, T.; Blankenburg, S.; Muoth, M.; Seitsonen, A. P.; Saleh, M.; Feng, X.; Müllen, K.; Fasel, R., Atomically precise bottom-up fabrication of graphene nanoribbons. Nature 2010, 466 (7305), 470-473; (b) Dössel, L.; Gherghel, L.; Feng, X.; Müllen, K., Graphene Nanoribbons by Chemists: Nanometer-Sized, Soluble, and Defect-Free. Angew. Chem. Int. Ed. 2011, 50 (11), 2540-2543. 28. Yan, X.; Cui, X.; Li, B.; Li, L.-s., Large, Solution-Processable Graphene Quantum Dots as Light Absorbers for Photovoltaics. Nano Lett. 2010, 10 (5), 1869-1873. 29. Brodie, B. C., Ann. Chim. Phys 1860, 59, 466. 30. Hummers, W. S.; Offeman, R. E., Preparation of Graphitic Oxide. J. Am. Chem. Soc. 1958, 80 (6), 1339-1339. 31. Fan, X.; Peng, W.; Li, Y.; Li, X.; Wang, S.; Zhang, G.; Zhang, F., Deoxygenation of Exfoliated Graphite Oxide under Alkaline Conditions: A Green Route to Graphene Preparation. Adv. Mater. 2008, 20 (23), 4490-4493. 32. Guo, H.-L.; Wang, X.-F.; Qian, Q.-Y.; Wang, F.-B.; Xia, X.-H., A Green Approach to the Synthesis of Graphene Nanosheets. ACS Nano 2009, 3 (9), 2653-2659. 33. Mattevi, C.; Eda, G.; Agnoli, S.; Miller, S.; Mkhoyan, K. A.; Celik, O.; Mastrogiovanni, D.; Granozzi, G.; Garfunkel, E.; Chhowalla, M., Evolution of Electrical, Chemical, and Structural Properties of Transparent and Conducting Chemically Derived Graphene Thin Films. Adv. Funct. Mater. 2009, 19 (16), 2577-2583. 34. (a) Williams, G.; Seger, B.; Kamat, P. V., TiO2-Graphene Nanocomposites. UV-Assisted Photocatalytic Reduction of Graphene Oxide. ACS Nano 2008, 2 (7), 1487-1491; (b) Matsumoto, Y.; Koinuma, M.; Ida, S.; Hayami, S.; Taniguchi, T.; Hatakeyama, K.; Tateishi, H.; Watanabe, Y.; Amano, S., Photoreaction of Graphene Oxide Nanosheets in Water. J. Phys. Chem. C 2011, 115 (39), 19280-19286. 35. Gómez-Navarro, C.; Weitz, R. T.; Bittner, A. M.; Scolari, M.; Mews, A.; Burghard, M.; Kern, K., Electronic Transport Properties of Individual Chemically Reduced Graphene Oxide Sheets. Nano Lett. 2007, 7 (11), 3499-3503. 36. Hernandez, Y.; Nicolosi, V.; Lotya, M.; Blighe, F. M.; Sun, Z.; De, S.; McGovern, I. T.; Holland, B.; Byrne, M.; Gun'Ko, Y. K.; Boland, J. J.; Niraj, P.; Duesberg, G.; Krishnamurthy, S.; Goodhue, R.; Hutchison, J.; Scardaci, V.; Ferrari, A. C.; Coleman, J. N., High-yield production of graphene by liquid-phase exfoliation of graphite. Nat Nano
2008, 3 (9), 563-568. 37. Wang, J.; Manga, K. K.; Bao, Q.; Loh, K. P., High-Yield Synthesis of Few-Layer Graphene Flakes through Electrochemical Expansion of Graphite in Propylene Carbonate Electrolyte. J. Am. Chem. Soc. 2011, 133 (23), 8888-8891. 38. (a) Parvez, K.; Li, R.; Puniredd, S. R.; Hernandez, Y.; Hinkel, F.; Wang, S.; Feng, X.; Müllen, K., Electrochemically Exfoliated Graphene as Solution-Processable, Highly Conductive Electrodes for Organic Electronics.
2.Graphene
41
ACS Nano 2013, 7 (4), 3598-3606; (b) Parvez, K.; Wu, Z.-S.; Li, R.; Liu, X.; Graf, R.; Feng, X.; Müllen, K., Exfoliation of Graphite into Graphene in Aqueous Solutions of Inorganic Salts. J. Am. Chem. Soc. 2014, 136 (16), 6083-6091; (c) Su, C.-Y.; Lu, A.-Y.; Xu, Y.; Chen, F.-R.; Khlobystov, A. N.; Li, L.-J., High-quality thin graphene films from fast electrochemical exfoliation. ACS Nano 2011, 5 (3), 2332-2339. 39. Ciesielski, A.; Samori, P., Graphene via sonication assisted liquid-phase exfoliation. Chem. Soc. Rev. 2014, 43 (1), 381-98. 40. Cravotto, G.; Cintas, P., Power ultrasound in organic synthesis: moving cavitational chemistry from academia to innovative and large-scale applications. Chem. Soc. Rev. 2006, 35 (2), 180-196. 41. Kolsky, H., Stress Waves in Solids. Dover Publications, Inc.: 1963. 42. (a) Yi, M.; Shen, Z., A review on mechanical exfoliation for the scalable production of graphene. J. Mater.
Chem. A 2015; (b) Cravotto, G.; Cintas, P., Sonication-Assisted Fabrication and Post-Synthetic Modifications of Graphene-Like Materials. Chem.–Eur. J. 2010, 16 (18), 5246-5259. 43. Hamilton, C. E.; Lomeda, J. R.; Sun, Z.; Tour, J. M.; Barron, A. R., High-Yield Organic Dispersions of Unfunctionalized Graphene. Nano Lett. 2009, 9 (10), 3460-3462. 44. Li, X.; Zhang, G.; Bai, X.; Sun, X.; Wang, X.; Wang, E.; Dai, H., Highly conducting graphene sheets and Langmuir-Blodgett films. Nat Nano 2008, 3 (9), 538-542. 45. Halim, U.; Zheng, C. R.; Chen, Y.; Lin, Z.; Jiang, S.; Cheng, R.; Huang, Y.; Duan, X., A rational design of cosolvent exfoliation of layered materials by directly probing liquid–solid interaction. Nat Commun 2013, 4. 46. Zhang, X.; Coleman, A. C.; Katsonis, N.; Browne, W. R.; van Wees, B. J.; Feringa, B. L., Dispersion of graphene in ethanol using a simple solvent exchange method. Chem. Commun. 2010, 46 (40), 7539-7541. 47. Lotya, M.; Hernandez, Y.; King, P. J.; Smith, R. J.; Nicolosi, V.; Karlsson, L. S.; Blighe, F. M.; De, S.; Wang, Z.; McGovern, I. T.; Duesberg, G. S.; Coleman, J. N., Liquid Phase Production of Graphene by Exfoliation of Graphite in Surfactant/Water Solutions. J. Am. Chem. Soc. 2009, 131 (10), 3611-3620. 48. Lin, S.; Shih, C.-J.; Strano, M. S.; Blankschtein, D., Molecular Insights into the Surface Morphology, Layering Structure, and Aggregation Kinetics of Surfactant-Stabilized Graphene Dispersions. J. Am. Chem. Soc. 2011, 133 (32), 12810-12823. 49. Smith, R. J.; Lotya, M.; Coleman, J. N., The importance of repulsive potential barriers for the dispersion of graphene using surfactants. New J. Phys. 2010, 12 (12), 125008. 50. Schlierf, A.; Samorì, P.; Palermo, V., Graphene-organic composites for electronics: optical and electronic interactions in vacuum, liquids and thin solid films. J. Mater. Chem. C 2014, 2 (17), 3129-3143. 51. Schlierf, A.; Yang, H.; Gebremedhn, E.; Treossi, E.; Ortolani, L.; Chen, L.; Minoia, A.; Morandi, V.; Samorì, P.; Casiraghi, C.; Beljonne, D.; Palermo, V., Nanoscale insight into the exfoliation mechanism of graphene with organic dyes: effect of charge, dipole and molecular structure. Nanoscale 2013, 5 (10), 4205-4216. 52. Chua, L. L.; Zaumseil, J.; Chang, J. F.; Ou, E. C.; Ho, P. K.; Sirringhaus, H.; Friend, R. H., General observation of n-type field-effect behaviour in organic semiconductors. Nature 2005, 434 (7030), 194-9. 53. Ciesielski, A.; Haar, S.; El Gemayel, M.; Yang, H.; Clough, J.; Melinte, G.; Gobbi, M.; Orgiu, E.; Nardi, M. V.; Ligorio, G.; Palermo, V.; Koch, N.; Ersen, O.; Casiraghi, C.; Samorì, P., Harnessing the Liquid-Phase Exfoliation of Graphene Using Aliphatic Compounds: A Supramolecular Approach. Angew. Chem. Int. Ed. 2014, 53 (39), 10355-10361. 54. Haar, S.; Ciesielski, A.; Clough, J.; Yang, H.; Mazzaro, R.; Richard, F.; Conti, S.; Merstorf, N.; Cecchini, M.; Morandi, V.; Casiraghi, C.; Samorì, P., A Supramolecular Strategy to Leverage the Liquid-Phase Exfoliation of Graphene in the Presence of Surfactants: Unraveling the Role of the Length of Fatty Acids. Small 2015, 11 (14), 1691-1702. 55. Guardia, L.; Fernández-Merino, M. J.; Paredes, J. I.; Solís-Fernández, P.; Villar-Rodil, S.; Martínez-Alonso, A.; Tascón, J. M. D., High-throughput production of pristine graphene in an aqueous dispersion assisted by non-ionic surfactants. Carbon 2011, 49 (5), 1653-1662. 56. Xu, L.; McGraw, J.-W.; Gao, F.; Grundy, M.; Ye, Z.; Gu, Z.; Shepherd, J. L., Production of High-Concentration Graphene Dispersions in Low-Boiling-Point Organic Solvents by Liquid-Phase Noncovalent Exfoliation of Graphite with a Hyperbranched Polyethylene and Formation of Graphene/Ethylene Copolymer Composites. J. Phys.
Chem. C 2013, 117 (20), 10730-10742. 57. Lotya, M.; King, P. J.; Khan, U.; De, S.; Coleman, J. N., High-Concentration, Surfactant-Stabilized Graphene Dispersions. ACS Nano 2010, 4 (6), 3155-3162. 58. Blake, P.; Hill, E. W.; Castro Neto, A. H.; Novoselov, K. S.; Jiang, D.; Yang, R.; Booth, T. J.; Geim, A. K., Making graphene visible. Appl. Phys. Lett. 2007, 91 (6), 063124. 59. Yu, V.; Hilke, M., Large contrast enhancement of graphene monolayers by angle detection. Appl. Phys. Lett.
2009, 95 (15), 151904.
2.Graphene
42
60. Wurstbauer, U.; Röling, C.; Wurstbauer, U.; Wegscheider, W.; Vaupel, M.; Thiesen, P. H.; Weiss, D., Imaging ellipsometry of graphene. Appl. Phys. Lett. 2010, 97 (23), 231901. 61. Venkatachalam, D. K.; Parkinson, P.; Ruffell, S.; Elliman, R. G., Rapid, substrate-independent thickness determination of large area graphene layers. Appl. Phys. Lett. 2011, 99 (23), 234106. 62. Cheon, S.; Kihm, K. D.; Park, J. S.; Lee, J. S.; Lee, B. J.; Kim, H.; Hong, B. H., How to optically count graphene layers. Opt. Lett. 2012, 37 (18), 3765-3767. 63. Casiraghi, C.; Hartschuh, A.; Lidorikis, E.; Qian, H.; Harutyunyan, H.; Gokus, T.; Novoselov, K. S.; Ferrari, A. C., Rayleigh Imaging of Graphene and Graphene Layers. Nano Lett. 2007, 7 (9), 2711-2717. 64. Havener, R. W.; Ju, S.-Y.; Brown, L.; Wang, Z.; Wojcik, M.; Ruiz-Vargas, C. S.; Park, J., High-Throughput Graphene Imaging on Arbitrary Substrates with Widefield Raman Spectroscopy. ACS Nano 2012, 6 (1), 373-380. 65. (a) Ferrari, A. C.; Meyer, J. C.; Scardaci, V.; Casiraghi, C.; Lazzeri, M.; Mauri, F.; Piscanec, S.; Jiang, D.; Novoselov, K. S.; Roth, S.; Geim, A. K., Raman Spectrum of Graphene and Graphene Layers. Phys. Rev. Lett. 2006, 97 (18), 187401; (b) Dresselhaus, M. S.; Dresselhaus, G.; Hofmann, M., Raman spectroscopy as a probe of graphene and carbon nanotubes. Phil. Trans. R. Soc. A 2008, 366 (1863), 231-236. 66. Wall, M., The Raman Spectroscopy of Graphene and the Determination of Layer Thickness. ThermoScientific: 2011; Vol. Application Note: 52252. 67. Lucchese, M. M.; Stavale, F.; Ferreira, E. H. M.; Vilani, C.; Moutinho, M. V. O.; Capaz, R. B.; Achete, C. A.; Jorio, A., Quantifying ion-induced defects and Raman relaxation length in graphene. Carbon 2010, 48 (5), 1592-1597. 68. Meyer, J. C.; Geim, A. K.; Katsnelson, M. I.; Novoselov, K. S.; Booth, T. J.; Roth, S., The structure of suspended graphene sheets. Nature 2007, 446 (7131), 60-63. 69. Kouroupis-Agalou, K.; Liscio, A.; Treossi, E.; Ortolani, L.; Morandi, V.; Pugno, N. M.; Palermo, V., Fragmentation and exfoliation of 2-dimensional materials: a statistical approach. Nanoscale 2014, 6 (11), 5926-5933. 70. Huang, H.; Xia, Y.; Tao, X.; Du, J.; Fang, J.; Gan, Y.; Zhang, W., Highly efficient electrolytic exfoliation of graphite into graphene sheets based on Li ions intercalation-expansion-microexplosion mechanism. J. Mater. Chem.
2012, 22 (21), 10452-10456.
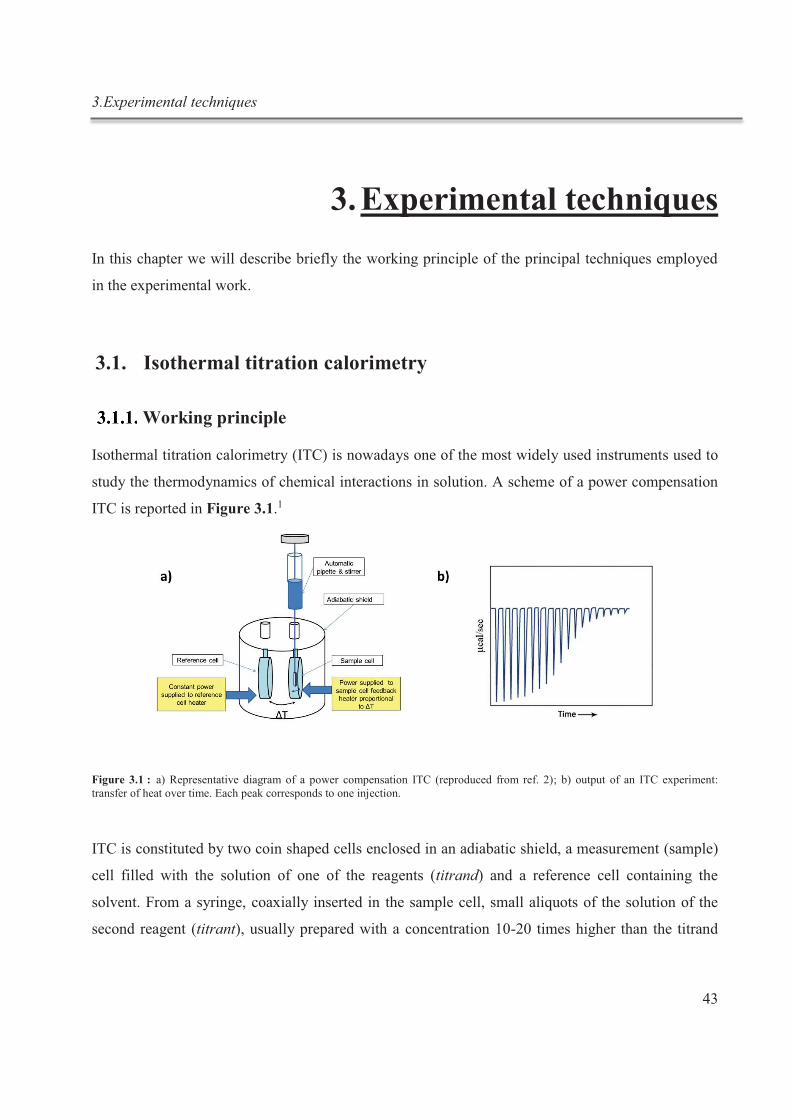
3.Experimental techniques
43
3. Experimental techniques
In this chapter we will describe briefly the working principle of the principal techniques employed
in the experimental work.
3.1. Isothermal titration calorimetry
Working principle
Isothermal titration calorimetry (ITC) is nowadays one of the most widely used instruments used to
study the thermodynamics of chemical interactions in solution. A scheme of a power compensation
ITC is reported in Figure 3.1.1
Figure 3.1 : a) Representative diagram of a power compensation ITC (reproduced from ref. 2); b) output of an ITC experiment: transfer of heat over time. Each peak corresponds to one injection.
ITC is constituted by two coin shaped cells enclosed in an adiabatic shield, a measurement (sample)
cell filled with the solution of one of the reagents (titrand) and a reference cell containing the
solvent. From a syringe, coaxially inserted in the sample cell, small aliquots of the solution of the
second reagent (titrant), usually prepared with a concentration 10-20 times higher than the titrand
3.Experimental techniques
44
one, are injected into the sample cell. While the titration experiment occurs, the syringe, which has a
paddle shaped end, rotates stirring the cell content.
During the experiment a constant power is always supplied to the reference cell in order to maintain
its temperature 0.01°C above the temperature of the insulating jacket. The temperature of the sample
cell is instead regulated by a feedback system which modulates the applied thermal power in order
to keep the temperature difference between both cells ∆T as low as possible. At any injection of the
titrant into the titrand the reaction occurring, causes a release or absorption of heat with a
consequent change of temperature which triggers the feedback system to adjust the electrical power
in order to maintain the temperature identical in both cells.
The transfer of power per injection is converted into a transfer of heat integrating the transfer of
power over time (Figure 3.1b). As the reactions approaches completion the transfer of heat diminish
reaching a minimum constant value (dilution heat).
The dilution heat of both reagents has to be subtracted from the experiment performing aside
dilution experiments. The transfer heat can be converted into a binding isotherm plotting the transfer
of heat per amount of titrant injected versus either the volume of titrant injected or the molar ratio
titrant/titrand.
From the fitting of the isotherm binding curve with an appropriate model it is possible to extrapolate
the binding constant aK , the stoichiometry n of the binding process and the standard enthalpy HD
per amount of titrant. Moreover using the fundamental equations of thermodynamics:
where T is the temperature and R is the gas constant, it is possible to calculate the Gibbs energy GD
and the entropy SD of the reaction under study.
Experimental planning
The main advantage of ITC compared to other analytical techniques such as for example NMR, is to
obtain in single experiment accurate values for aK , HD , n, GD and SD , but this is possible only
under optimum conditions.2
In order to extrapolate all this parameters, it is necessary to obtain a correct curvature of the binding
isotherm. The curvature in a binding isotherm is defined both from the concentration of the titrate
T
G
T
HS
KRTG a
D-
D=D
-=D ln
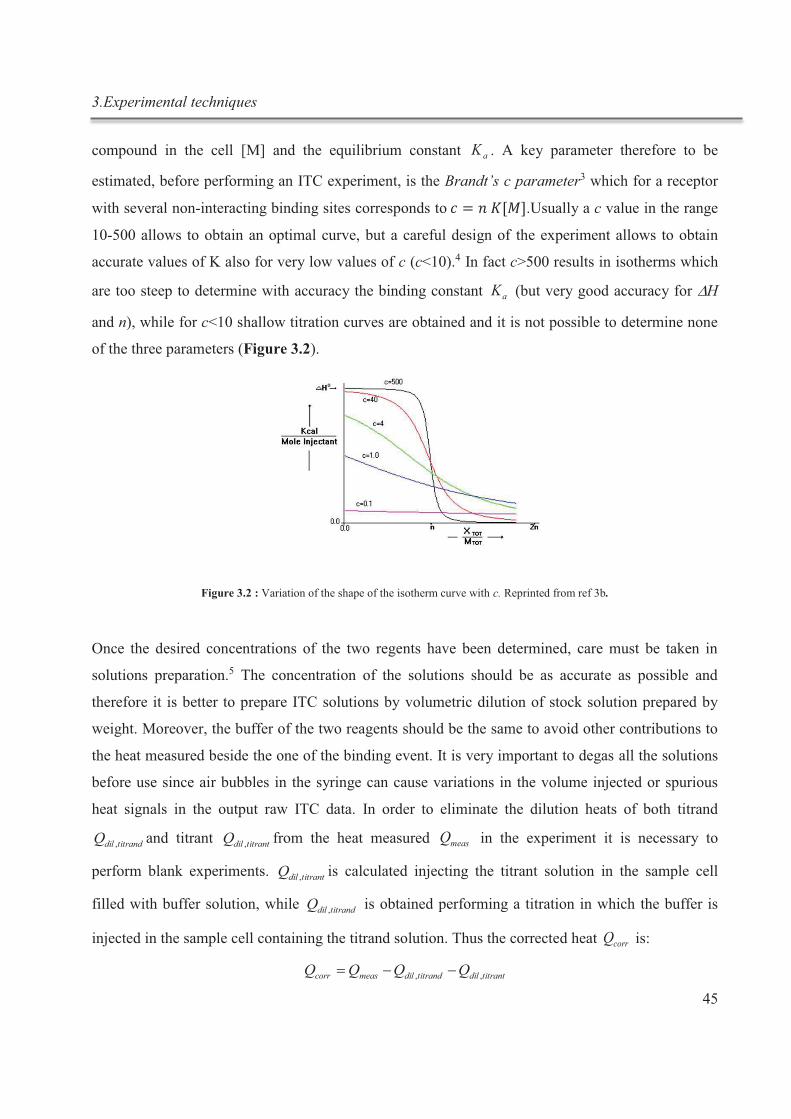
3.Experimental techniques
45
compound in the cell [M] and the equilibrium constant aK . A key parameter therefore to be
estimated, before performing an ITC experiment, is the Brandt’s c parameter3 which for a receptor
with several non-interacting binding sites corresponds to .Usually a c value in the range
10-500 allows to obtain an optimal curve, but a careful design of the experiment allows to obtain
accurate values of K also for very low values of c (c<10).4 In fact c>500 results in isotherms which
are too steep to determine with accuracy the binding constant aK (but very good accuracy for DH
and n), while for c<10 shallow titration curves are obtained and it is not possible to determine none
of the three parameters (Figure 3.2).
Figure 3.2 : Variation of the shape of the isotherm curve with c. Reprinted from ref 3b.
Once the desired concentrations of the two regents have been determined, care must be taken in
solutions preparation.5 The concentration of the solutions should be as accurate as possible and
therefore it is better to prepare ITC solutions by volumetric dilution of stock solution prepared by
weight. Moreover, the buffer of the two reagents should be the same to avoid other contributions to
the heat measured beside the one of the binding event. It is very important to degas all the solutions
before use since air bubbles in the syringe can cause variations in the volume injected or spurious
heat signals in the output raw ITC data. In order to eliminate the dilution heats of both titrand
titranddilQ , and titrant titrantdilQ , from the heat measured measQ in the experiment it is necessary to
perform blank experiments. titrantdilQ , is calculated injecting the titrant solution in the sample cell
filled with buffer solution, while titranddilQ , is obtained performing a titration in which the buffer is
injected in the sample cell containing the titrand solution. Thus the corrected heat corrQ is:
titrantdiltitranddilmeascorr QQQQ ,, --=
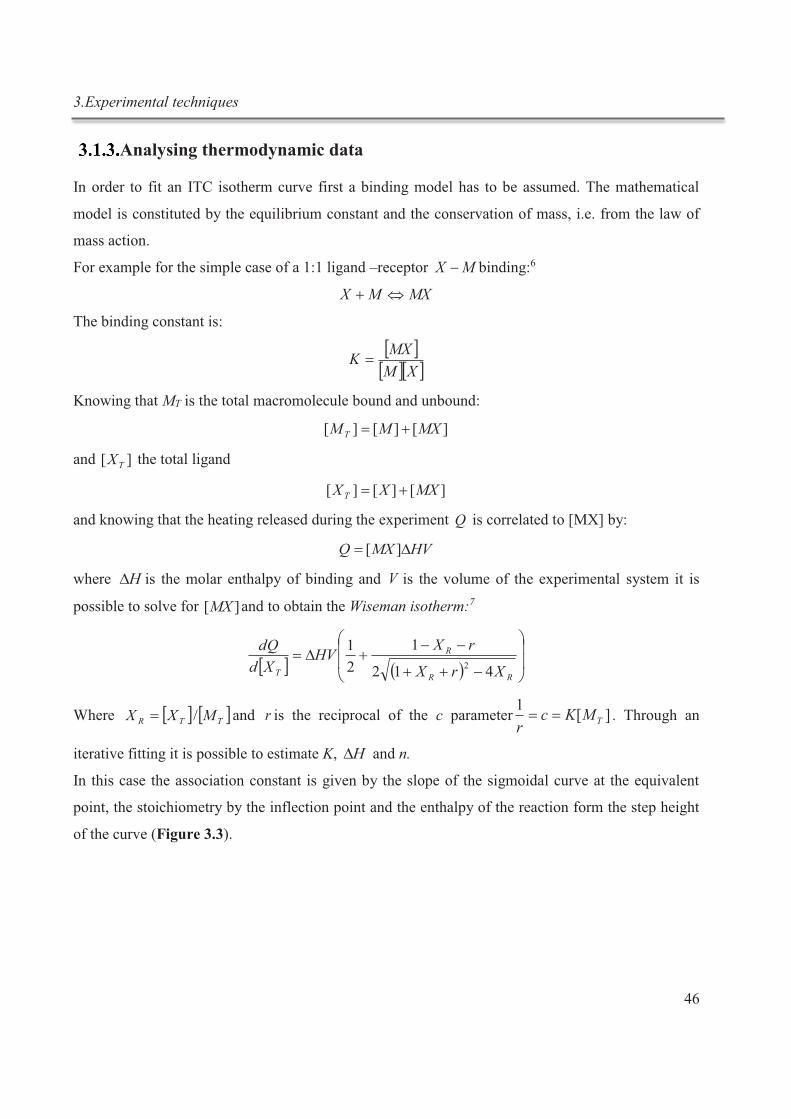
3.Experimental techniques
46
Analysing thermodynamic data
In order to fit an ITC isotherm curve first a binding model has to be assumed. The mathematical
model is constituted by the equilibrium constant and the conservation of mass, i.e. from the law of
mass action.
For example for the simple case of a 1:1 ligand –receptor MX - binding:6
MXMX Û+
The binding constant is:
[ ][ ][ ]XM
MXK =
Knowing that MT is the total macromolecule bound and unbound:
][][][ MXMM T +=
and ][ TX the total ligand
][][][ MXXX T +=
and knowing that the heating released during the experiment Q is correlated to [MX] by:
HVMXQ D= ][
where HD is the molar enthalpy of binding and V is the volume of the experimental system it is
possible to solve for ][MX and to obtain the Wiseman isotherm:7
[ ] ( ) ÷÷
ø
ö
çç
è
æ
-++
--+D=
RR
R
T XrX
rXHV
Xd
dQ
412
1
2
12
Where [ ] [ ]TTR MXX /= and r is the reciprocal of the c parameter ][1
TMKcr
== . Through an
iterative fitting it is possible to estimate K, HD and n.
In this case the association constant is given by the slope of the sigmoidal curve at the equivalent
point, the stoichiometry by the inflection point and the enthalpy of the reaction form the step height
of the curve (Figure 3.3).
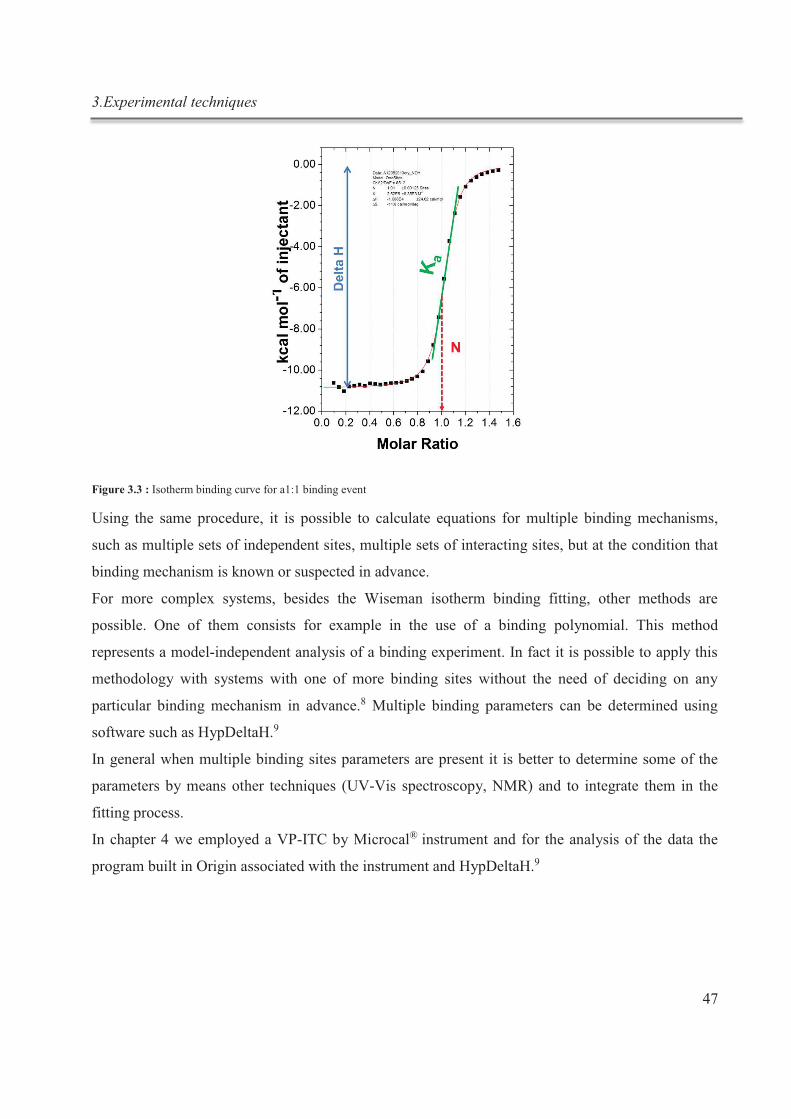
3.Experimental techniques
47
Figure 3.3 : Isotherm binding curve for a1:1 binding event
Using the same procedure, it is possible to calculate equations for multiple binding mechanisms,
such as multiple sets of independent sites, multiple sets of interacting sites, but at the condition that
binding mechanism is known or suspected in advance.
For more complex systems, besides the Wiseman isotherm binding fitting, other methods are
possible. One of them consists for example in the use of a binding polynomial. This method
represents a model-independent analysis of a binding experiment. In fact it is possible to apply this
methodology with systems with one of more binding sites without the need of deciding on any
particular binding mechanism in advance.8 Multiple binding parameters can be determined using
software such as HypDeltaH.9
In general when multiple binding sites parameters are present it is better to determine some of the
parameters by means other techniques (UV-Vis spectroscopy, NMR) and to integrate them in the
fitting process.
In chapter 4 we employed a VP-ITC by Microcal® instrument and for the analysis of the data the
program built in Origin associated with the instrument and HypDeltaH.9
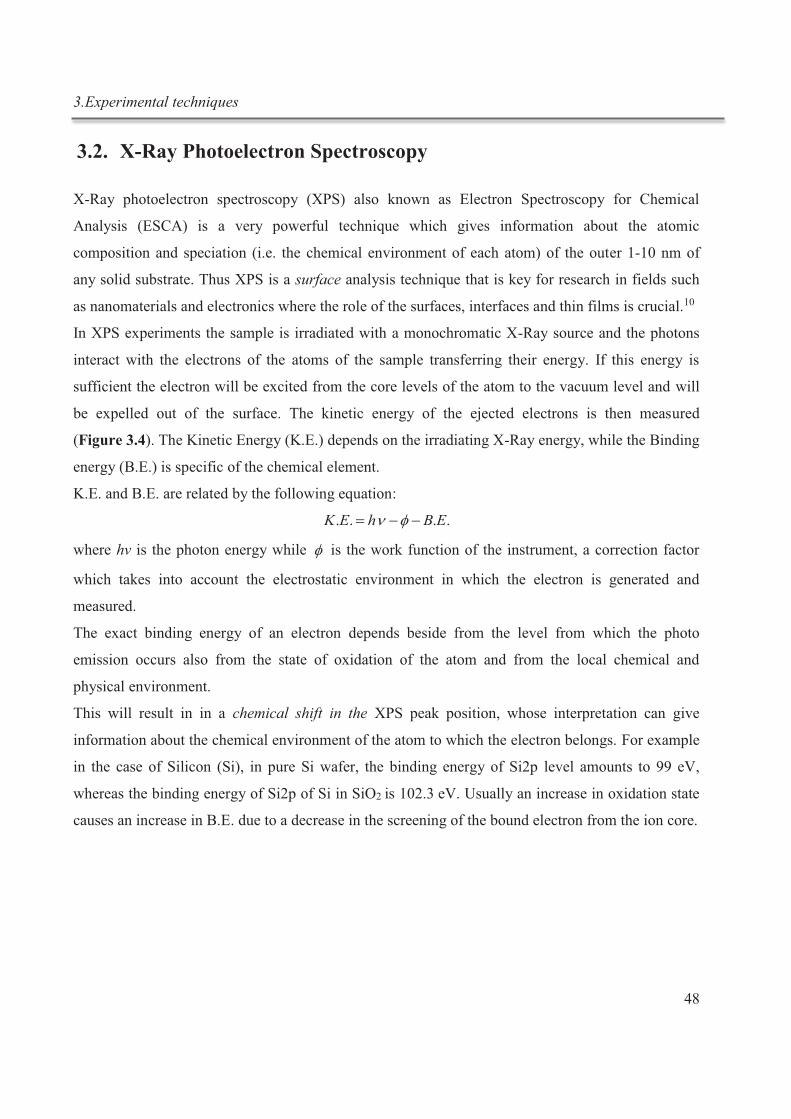
3.Experimental techniques
48
3.2. X-Ray Photoelectron Spectroscopy
X-Ray photoelectron spectroscopy (XPS) also known as Electron Spectroscopy for Chemical
Analysis (ESCA) is a very powerful technique which gives information about the atomic
composition and speciation (i.e. the chemical environment of each atom) of the outer 1-10 nm of
any solid substrate. Thus XPS is a surface analysis technique that is key for research in fields such
as nanomaterials and electronics where the role of the surfaces, interfaces and thin films is crucial.10
In XPS experiments the sample is irradiated with a monochromatic X-Ray source and the photons
interact with the electrons of the atoms of the sample transferring their energy. If this energy is
sufficient the electron will be excited from the core levels of the atom to the vacuum level and will
be expelled out of the surface. The kinetic energy of the ejected electrons is then measured
(Figure 3.4). The Kinetic Energy (K.E.) depends on the irradiating X-Ray energy, while the Binding
energy (B.E.) is specific of the chemical element.
K.E. and B.E. are related by the following equation:
.... EBhEK --= fn
where hν is the photon energy while f is the work function of the instrument, a correction factor
which takes into account the electrostatic environment in which the electron is generated and
measured.
The exact binding energy of an electron depends beside from the level from which the photo
emission occurs also from the state of oxidation of the atom and from the local chemical and
physical environment.
This will result in in a chemical shift in the XPS peak position, whose interpretation can give
information about the chemical environment of the atom to which the electron belongs. For example
in the case of Silicon (Si), in pure Si wafer, the binding energy of Si2p level amounts to 99 eV,
whereas the binding energy of Si2p of Si in SiO2 is 102.3 eV. Usually an increase in oxidation state
causes an increase in B.E. due to a decrease in the screening of the bound electron from the ion core.
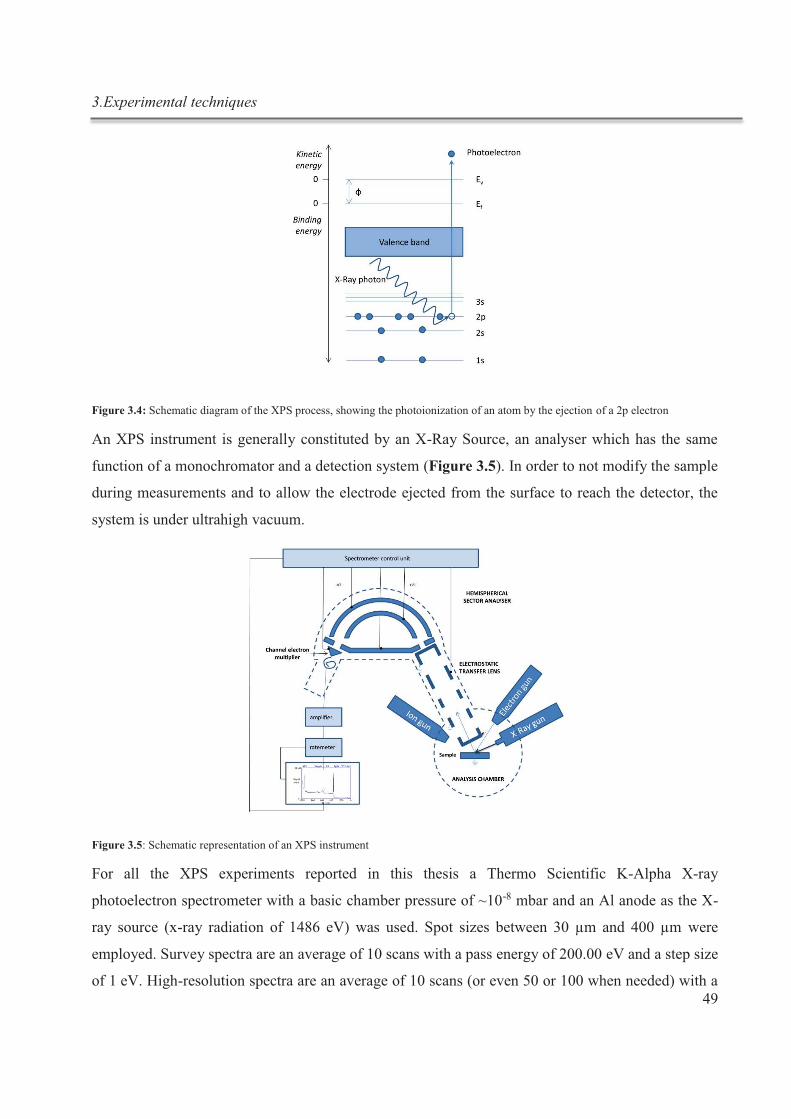
3.Experimental techniques
49
Figure 3.4: Schematic diagram of the XPS process, showing the photoionization of an atom by the ejection of a 2p electron
An XPS instrument is generally constituted by an X-Ray Source, an analyser which has the same
function of a monochromator and a detection system (Figure 3.5). In order to not modify the sample
during measurements and to allow the electrode ejected from the surface to reach the detector, the
system is under ultrahigh vacuum.
Figure 3.5: Schematic representation of an XPS instrument
For all the XPS experiments reported in this thesis a Thermo Scientific K-Alpha X-ray
photoelectron spectrometer with a basic chamber pressure of ~10-8 mbar and an Al anode as the X-
ray source (x-ray radiation of 1486 eV) was used. Spot sizes between 30 µm and 400 µm were
employed. Survey spectra are an average of 10 scans with a pass energy of 200.00 eV and a step size
of 1 eV. High-resolution spectra are an average of 10 scans (or even 50 or 100 when needed) with a
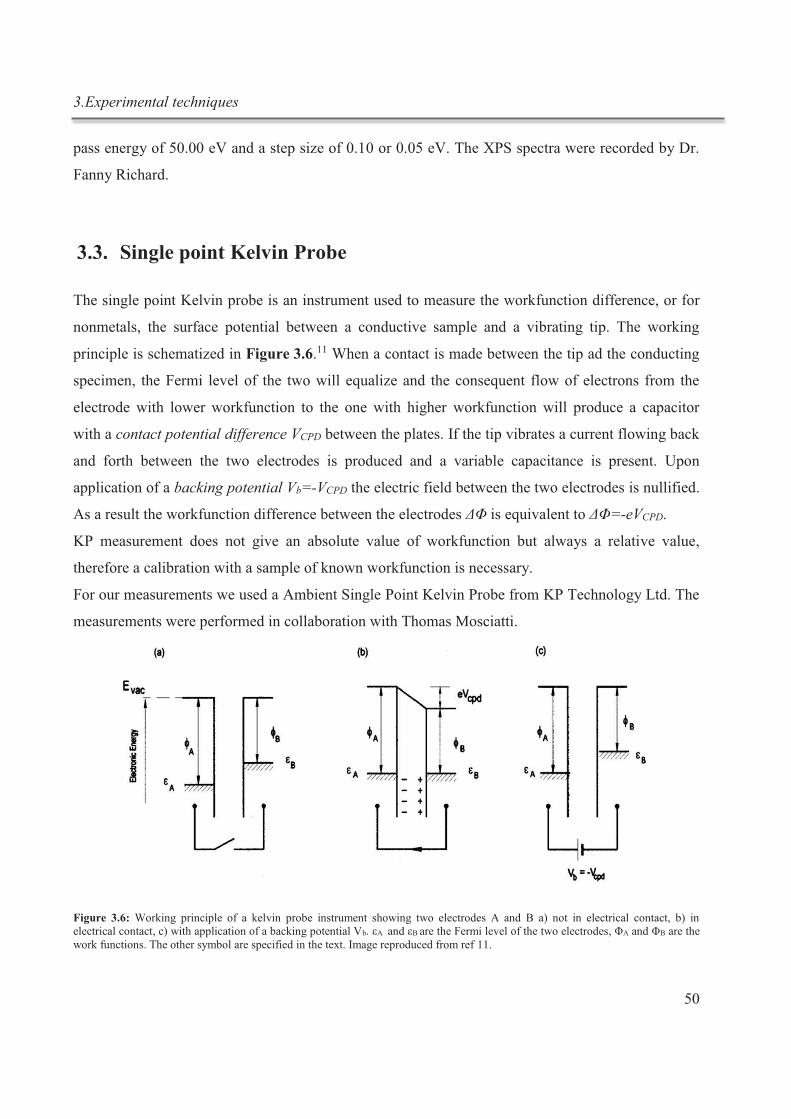
3.Experimental techniques
50
pass energy of 50.00 eV and a step size of 0.10 or 0.05 eV. The XPS spectra were recorded by Dr.
Fanny Richard.
3.3. Single point Kelvin Probe
The single point Kelvin probe is an instrument used to measure the workfunction difference, or for
nonmetals, the surface potential between a conductive sample and a vibrating tip. The working
principle is schematized in Figure 3.6.11 When a contact is made between the tip ad the conducting
specimen, the Fermi level of the two will equalize and the consequent flow of electrons from the
electrode with lower workfunction to the one with higher workfunction will produce a capacitor
with a contact potential difference VCPD between the plates. If the tip vibrates a current flowing back
and forth between the two electrodes is produced and a variable capacitance is present. Upon
application of a backing potential Vb=-VCPD the electric field between the two electrodes is nullified.
As a result the workfunction difference between the electrodes ΔΦ is equivalent to ΔΦ=-eVCPD.
KP measurement does not give an absolute value of workfunction but always a relative value,
therefore a calibration with a sample of known workfunction is necessary.
For our measurements we used a Ambient Single Point Kelvin Probe from KP Technology Ltd. The
measurements were performed in collaboration with Thomas Mosciatti.
Figure 3.6: Working principle of a kelvin probe instrument showing two electrodes A and B a) not in electrical contact, b) in electrical contact, c) with application of a backing potential Vb. εA and εB are the Fermi level of the two electrodes, ΦA and ΦB are the work functions. The other symbol are specified in the text. Image reproduced from ref 11.
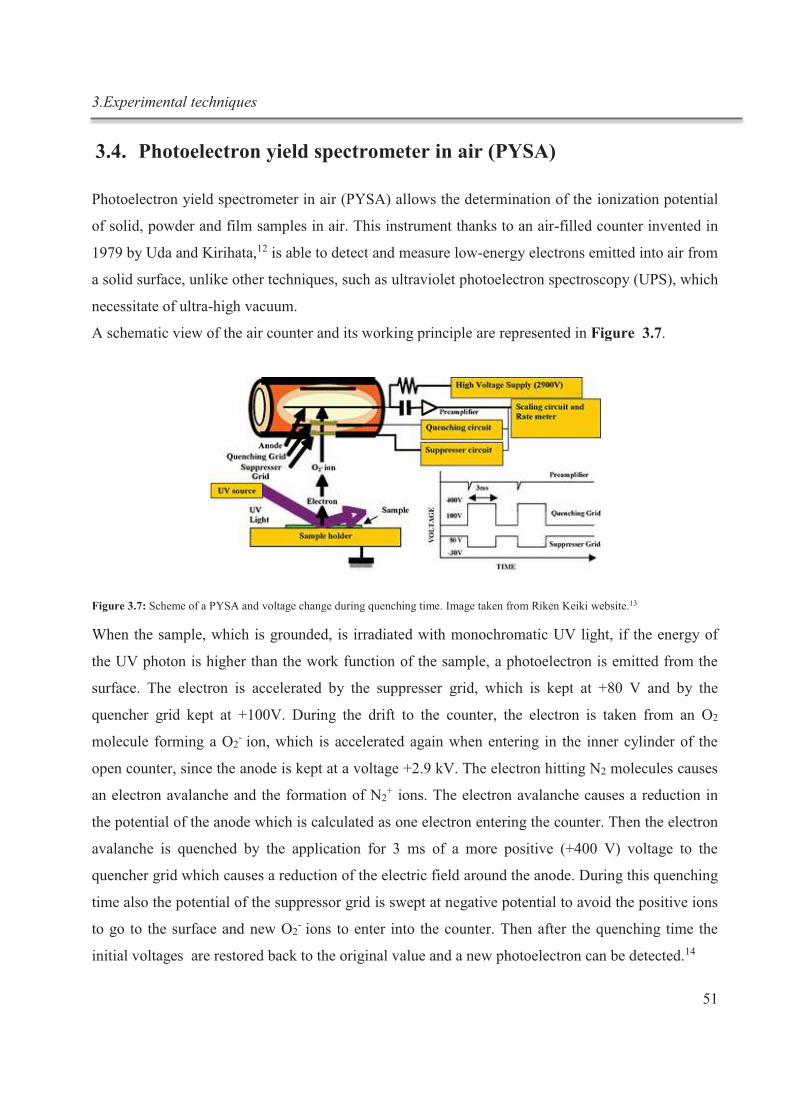
3.Experimental techniques
51
3.4. Photoelectron yield spectrometer in air (PYSA)
Photoelectron yield spectrometer in air (PYSA) allows the determination of the ionization potential
of solid, powder and film samples in air. This instrument thanks to an air-filled counter invented in
1979 by Uda and Kirihata,12 is able to detect and measure low-energy electrons emitted into air from
a solid surface, unlike other techniques, such as ultraviolet photoelectron spectroscopy (UPS), which
necessitate of ultra-high vacuum.
A schematic view of the air counter and its working principle are represented in Figure 3.7.
Figure 3.7: Scheme of a PYSA and voltage change during quenching time. Image taken from Riken Keiki website.13
When the sample, which is grounded, is irradiated with monochromatic UV light, if the energy of
the UV photon is higher than the work function of the sample, a photoelectron is emitted from the
surface. The electron is accelerated by the suppresser grid, which is kept at +80 V and by the
quencher grid kept at +100V. During the drift to the counter, the electron is taken from an O2
molecule forming a O2- ion, which is accelerated again when entering in the inner cylinder of the
open counter, since the anode is kept at a voltage +2.9 kV. The electron hitting N2 molecules causes
an electron avalanche and the formation of N2+ ions. The electron avalanche causes a reduction in
the potential of the anode which is calculated as one electron entering the counter. Then the electron
avalanche is quenched by the application for 3 ms of a more positive (+400 V) voltage to the
quencher grid which causes a reduction of the electric field around the anode. During this quenching
time also the potential of the suppressor grid is swept at negative potential to avoid the positive ions
to go to the surface and new O2- ions to enter into the counter. Then after the quenching time the
initial voltages are restored back to the original value and a new photoelectron can be detected.14
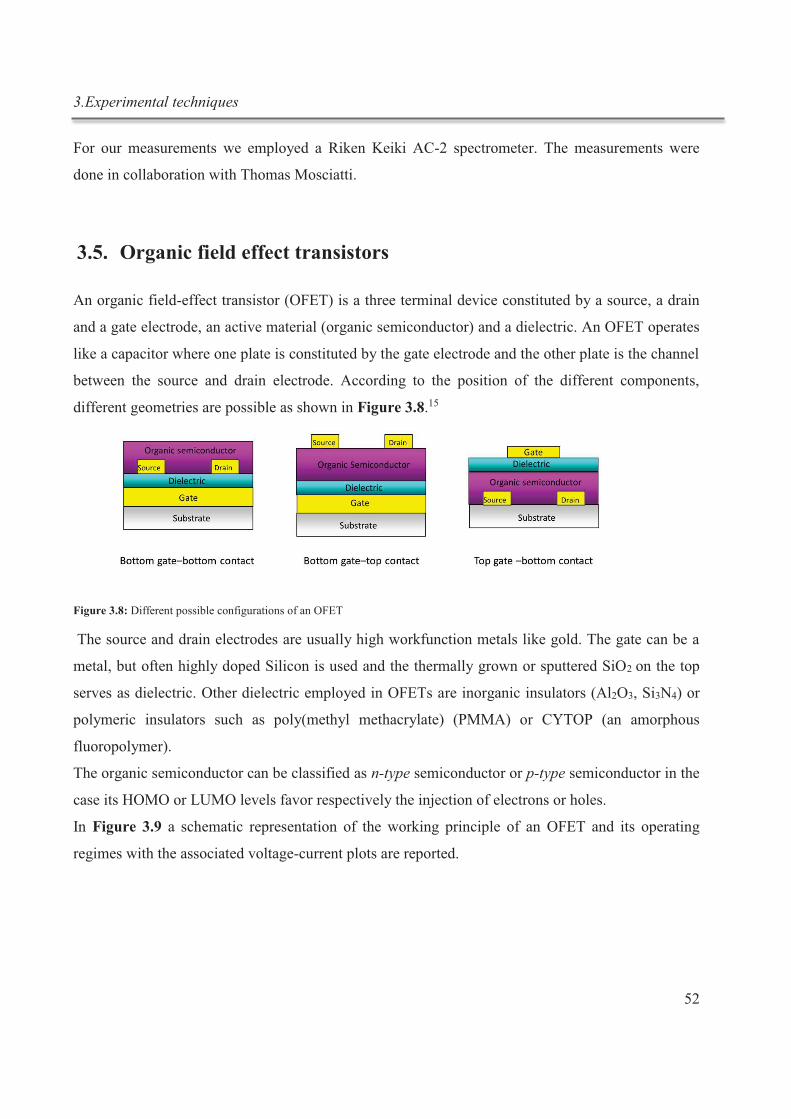
3.Experimental techniques
52
For our measurements we employed a Riken Keiki AC-2 spectrometer. The measurements were
done in collaboration with Thomas Mosciatti.
3.5. Organic field effect transistors
An organic field-effect transistor (OFET) is a three terminal device constituted by a source, a drain
and a gate electrode, an active material (organic semiconductor) and a dielectric. An OFET operates
like a capacitor where one plate is constituted by the gate electrode and the other plate is the channel
between the source and drain electrode. According to the position of the different components,
different geometries are possible as shown in Figure 3.8.15
Figure 3.8: Different possible configurations of an OFET
The source and drain electrodes are usually high workfunction metals like gold. The gate can be a
metal, but often highly doped Silicon is used and the thermally grown or sputtered SiO2 on the top
serves as dielectric. Other dielectric employed in OFETs are inorganic insulators (Al2O3, Si3N4) or
polymeric insulators such as poly(methyl methacrylate) (PMMA) or CYTOP (an amorphous
fluoropolymer).
The organic semiconductor can be classified as n-type semiconductor or p-type semiconductor in the
case its HOMO or LUMO levels favor respectively the injection of electrons or holes.
In Figure 3.9 a schematic representation of the working principle of an OFET and its operating
regimes with the associated voltage-current plots are reported.
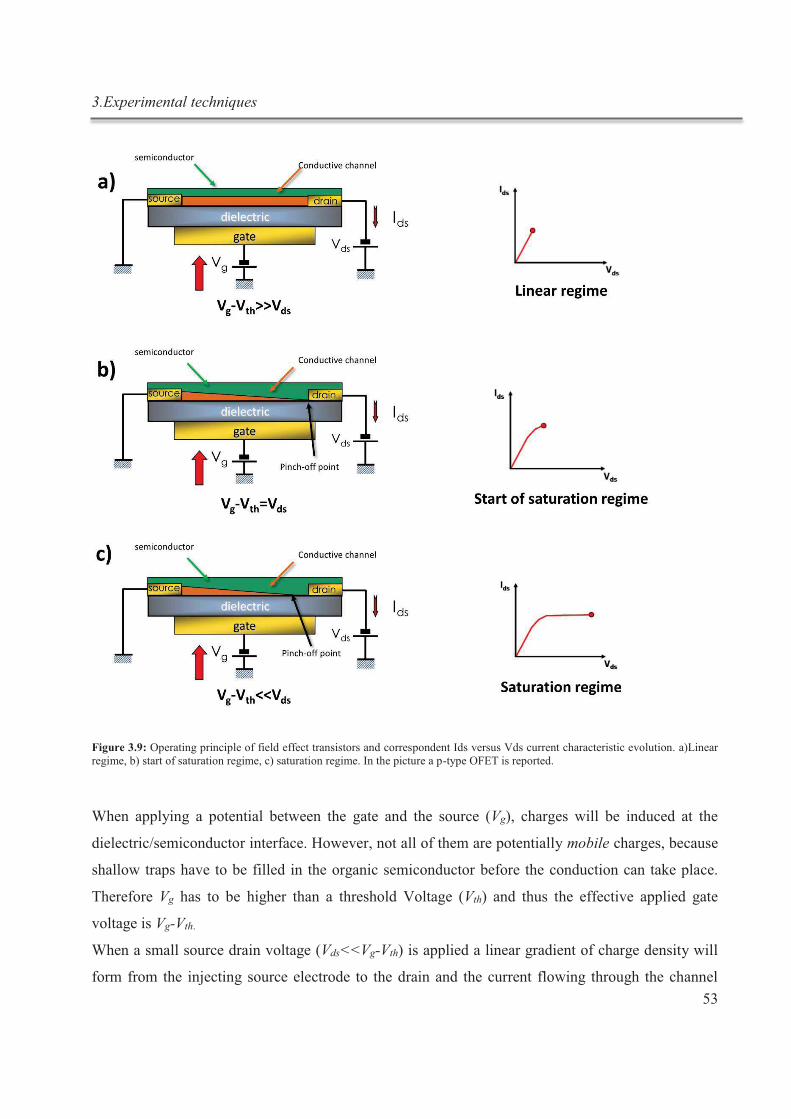
3.Experimental techniques
53
Figure 3.9: Operating principle of field effect transistors and correspondent Ids versus Vds current characteristic evolution. a)Linear regime, b) start of saturation regime, c) saturation regime. In the picture a p-type OFET is reported.
When applying a potential between the gate and the source (Vg), charges will be induced at the
dielectric/semiconductor interface. However, not all of them are potentially mobile charges, because
shallow traps have to be filled in the organic semiconductor before the conduction can take place.
Therefore Vg has to be higher than a threshold Voltage (Vth) and thus the effective applied gate
voltage is Vg-Vth.
When a small source drain voltage (Vds<<Vg-Vth) is applied a linear gradient of charge density will
form from the injecting source electrode to the drain and the current flowing through the channel
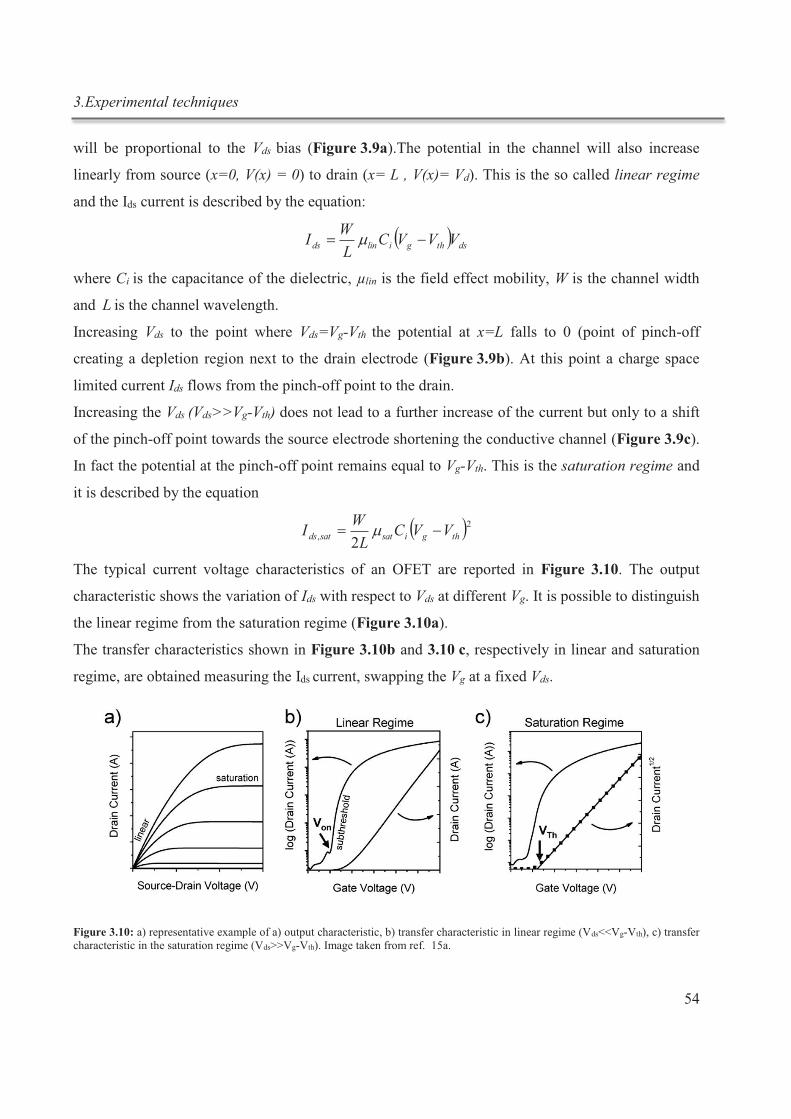
3.Experimental techniques
54
will be proportional to the Vds bias (Figure 3.9a).The potential in the channel will also increase
linearly from source (x=0, V(x) = 0) to drain (x= L , V(x)= Vd). This is the so called linear regime
and the Ids current is described by the equation:
( ) dsthgilinds VVVCL
WI -= m
where Ci is the capacitance of the dielectric, µlin is the field effect mobility, W is the channel width
and L is the channel wavelength.
Increasing Vds to the point where Vds=Vg-Vth the potential at x=L falls to 0 (point of pinch-off
creating a depletion region next to the drain electrode (Figure 3.9b). At this point a charge space
limited current Ids flows from the pinch-off point to the drain.
Increasing the Vds (Vds>>Vg-Vth) does not lead to a further increase of the current but only to a shift
of the pinch-off point towards the source electrode shortening the conductive channel (Figure 3.9c).
In fact the potential at the pinch-off point remains equal to Vg-Vth. This is the saturation regime and
it is described by the equation
( )2, 2 thgisatsatds VVCL
WI -= m
The typical current voltage characteristics of an OFET are reported in Figure 3.10. The output
characteristic shows the variation of Ids with respect to Vds at different Vg. It is possible to distinguish
the linear regime from the saturation regime (Figure 3.10a).
The transfer characteristics shown in Figure 3.10b and 3.10 c, respectively in linear and saturation
regime, are obtained measuring the Ids current, swapping the Vg at a fixed Vds.
Figure 3.10: a) representative example of a) output characteristic, b) transfer characteristic in linear regime (Vds<<Vg-Vth), c) transfer characteristic in the saturation regime (Vds>>Vg-Vth). Image taken from ref. 15a.
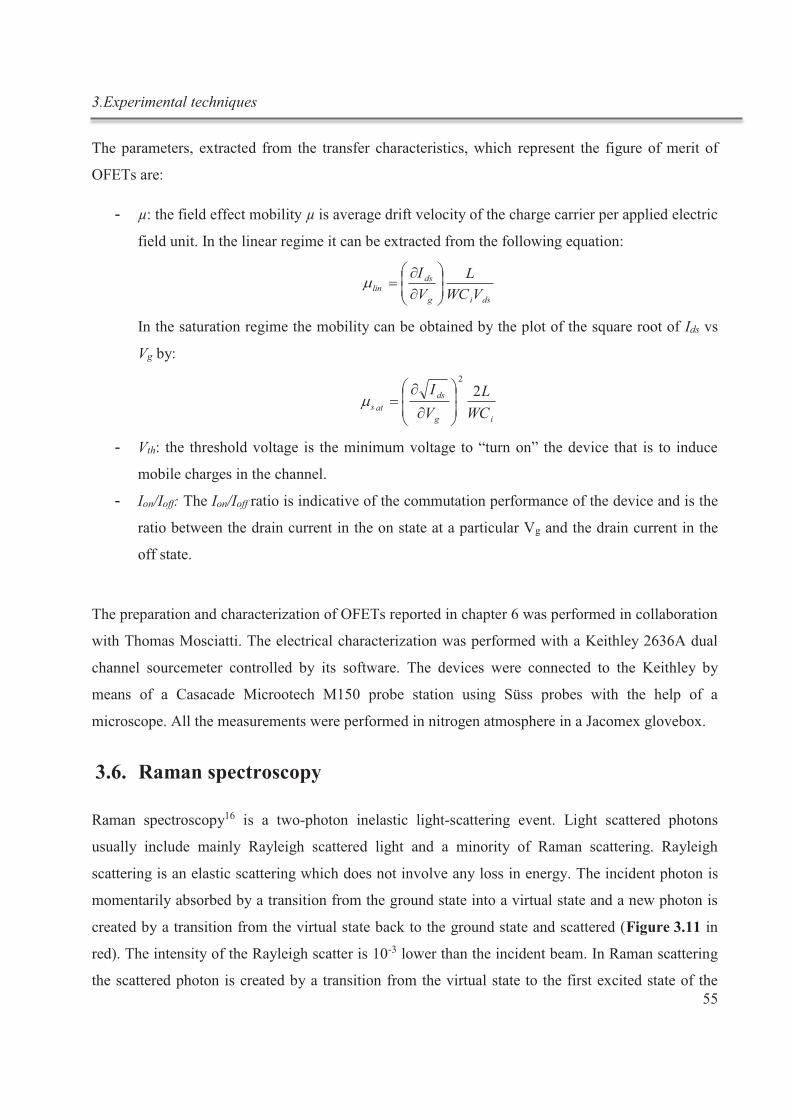
3.Experimental techniques
55
The parameters, extracted from the transfer characteristics, which represent the figure of merit of
OFETs are:
- µ: the field effect mobility µ is average drift velocity of the charge carrier per applied electric
field unit. In the linear regime it can be extracted from the following equation:
dsig
dslin
VWC
L
V
I
÷÷ø
öççè
æ
¶=m
In the saturation regime the mobility can be obtained by the plot of the square root of Ids vs
Vg by:
ig
ds
atsWC
L
V
I 22
÷÷
ø
ö
çç
è
æ
¶=m
- Vth: the threshold voltage is the minimum voltage to “turn on” the device that is to induce
mobile charges in the channel.
- Ion/Ioff: The Ion/Ioff ratio is indicative of the commutation performance of the device and is the
ratio between the drain current in the on state at a particular Vg and the drain current in the
off state.
The preparation and characterization of OFETs reported in chapter 6 was performed in collaboration
with Thomas Mosciatti. The electrical characterization was performed with a Keithley 2636A dual
channel sourcemeter controlled by its software. The devices were connected to the Keithley by
means of a Casacade Microotech M150 probe station using Süss probes with the help of a
microscope. All the measurements were performed in nitrogen atmosphere in a Jacomex glovebox.
3.6. Raman spectroscopy
Raman spectroscopy16 is a two-photon inelastic light-scattering event. Light scattered photons
usually include mainly Rayleigh scattered light and a minority of Raman scattering. Rayleigh
scattering is an elastic scattering which does not involve any loss in energy. The incident photon is
momentarily absorbed by a transition from the ground state into a virtual state and a new photon is
created by a transition from the virtual state back to the ground state and scattered (Figure 3.11 in
red). The intensity of the Rayleigh scatter is 10-3 lower than the incident beam. In Raman scattering
the scattered photon is created by a transition from the virtual state to the first excited state of the
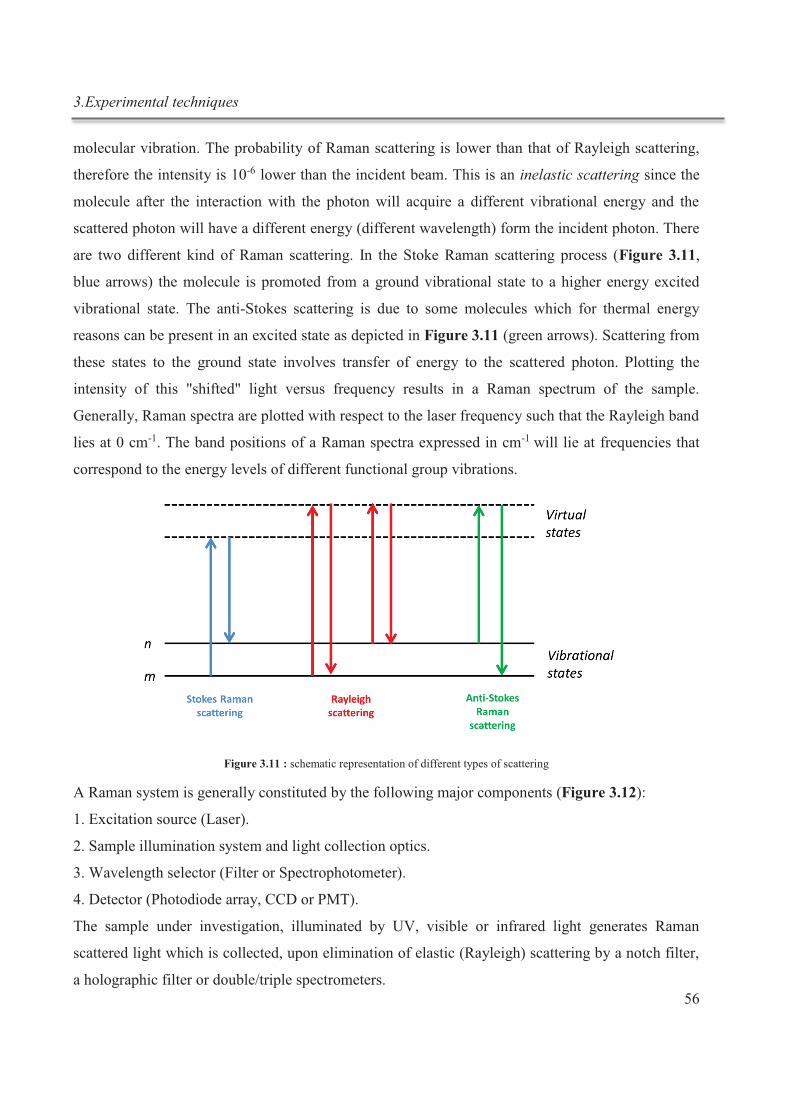
3.Experimental techniques
56
molecular vibration. The probability of Raman scattering is lower than that of Rayleigh scattering,
therefore the intensity is 10-6 lower than the incident beam. This is an inelastic scattering since the
molecule after the interaction with the photon will acquire a different vibrational energy and the
scattered photon will have a different energy (different wavelength) form the incident photon. There
are two different kind of Raman scattering. In the Stoke Raman scattering process (Figure 3.11,
blue arrows) the molecule is promoted from a ground vibrational state to a higher energy excited
vibrational state. The anti-Stokes scattering is due to some molecules which for thermal energy
reasons can be present in an excited state as depicted in Figure 3.11 (green arrows). Scattering from
these states to the ground state involves transfer of energy to the scattered photon. Plotting the
intensity of this "shifted" light versus frequency results in a Raman spectrum of the sample.
Generally, Raman spectra are plotted with respect to the laser frequency such that the Rayleigh band
lies at 0 cm-1. The band positions of a Raman spectra expressed in cm-1 will lie at frequencies that
correspond to the energy levels of different functional group vibrations.
Figure 3.11 : schematic representation of different types of scattering
A Raman system is generally constituted by the following major components (Figure 3.12):
1. Excitation source (Laser).
2. Sample illumination system and light collection optics.
3. Wavelength selector (Filter or Spectrophotometer).
4. Detector (Photodiode array, CCD or PMT).
The sample under investigation, illuminated by UV, visible or infrared light generates Raman
scattered light which is collected, upon elimination of elastic (Rayleigh) scattering by a notch filter,
a holographic filter or double/triple spectrometers.
3.Experimental techniques
57
The wavelength selector is constituted by either dispersive spectrophotometers Czerny–Turner (CT)
(which can be triple or double and in this case the notch filter is not necessary), or FT (Fourier
transform spectroscopy based).Finally the Raman signal is detected by a photodiode array, charge-
coupled devices (CCD) or photomultiplier tubes (PMT) in older apparatus.
Figure 3.12: schematization of an apparatus for Raman spectrosocopy. Reproduced from http://www.chem.umd.edu/sharedinstrumentation/surface-analysis-center/.
In our studies a Renishaw microspectrometer in confocal mode and backscattering geometry with
excitation energy of 488 nm, 514.5 nm and 633 nm was used . A Raman microspectrometer consists
of a specially designed Raman spectrometer integrated with an optical microscope. With such an
instrument the acquisition of spectra of microscopic samples or microscopic areas of larger samples
is possible. A 100X objective with a numerical aperture (NA) of 0.95 was used for the
characterization. This ensures a small laser spot size of less than 400 nm. The spectral resolution of
the spectrometer is 2-3 cm-1. The laser power was always below 1 mW to avoid damage. Raman
measurements were performed and analyzed by Y. Shin at University of Manchester (group of Dr.
Cinzia Casiraghi).
3.7. Scanning Electron Microscopy (SEM)
In scanning electron microscopy, a beam of electrons, generated thermoionically by a tungsten
filament, with an energy ranging from 0.5 keV to 40 keV, is focused by two condenser lenses. Then
the beam passes through scan coils which deflect the beam in the x and y axes so that it scans in a
raster fashion over a rectangular area of the sample surface. Finally the beam goes through an
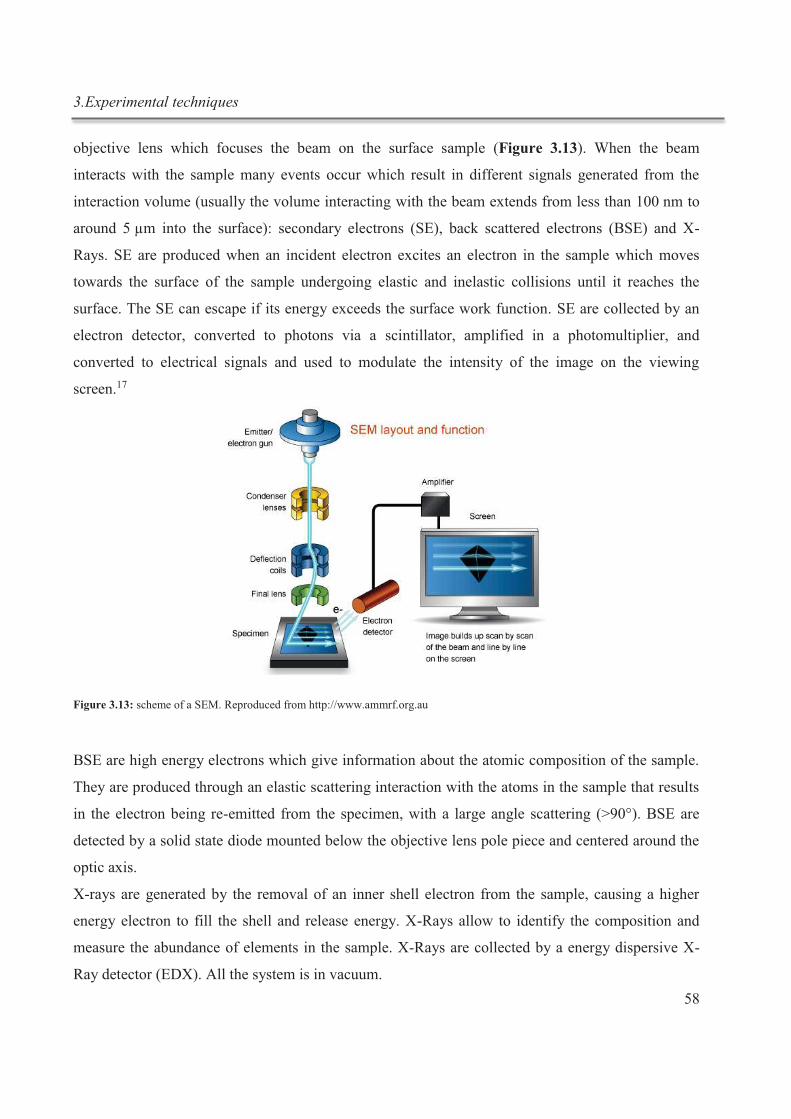
3.Experimental techniques
58
objective lens which focuses the beam on the surface sample (Figure 3.13). When the beam
interacts with the sample many events occur which result in different signals generated from the
interaction volume (usually the volume interacting with the beam extends from less than 100 nm to
around 5 µm into the surface): secondary electrons (SE), back scattered electrons (BSE) and X-
Rays. SE are produced when an incident electron excites an electron in the sample which moves
towards the surface of the sample undergoing elastic and inelastic collisions until it reaches the
surface. The SE can escape if its energy exceeds the surface work function. SE are collected by an
electron detector, converted to photons via a scintillator, amplified in a photomultiplier, and
converted to electrical signals and used to modulate the intensity of the image on the viewing
screen.17
Figure 3.13: scheme of a SEM. Reproduced from http://www.ammrf.org.au
BSE are high energy electrons which give information about the atomic composition of the sample.
They are produced through an elastic scattering interaction with the atoms in the sample that results
in the electron being re-emitted from the specimen, with a large angle scattering (>90°). BSE are
detected by a solid state diode mounted below the objective lens pole piece and centered around the
optic axis.
X-rays are generated by the removal of an inner shell electron from the sample, causing a higher
energy electron to fill the shell and release energy. X-Rays allow to identify the composition and
measure the abundance of elements in the sample. X-Rays are collected by a energy dispersive X-
Ray detector (EDX). All the system is in vacuum.
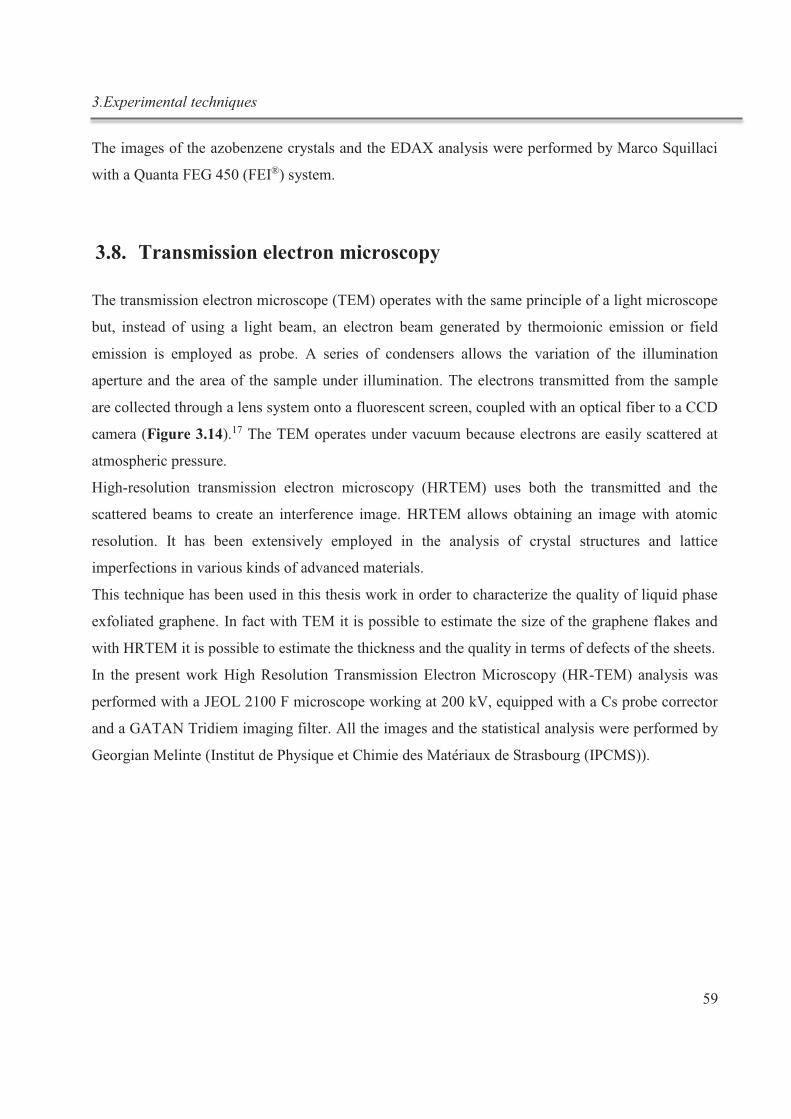
3.Experimental techniques
59
The images of the azobenzene crystals and the EDAX analysis were performed by Marco Squillaci
with a Quanta FEG 450 (FEI®) system.
3.8. Transmission electron microscopy
The transmission electron microscope (TEM) operates with the same principle of a light microscope
but, instead of using a light beam, an electron beam generated by thermoionic emission or field
emission is employed as probe. A series of condensers allows the variation of the illumination
aperture and the area of the sample under illumination. The electrons transmitted from the sample
are collected through a lens system onto a fluorescent screen, coupled with an optical fiber to a CCD
camera (Figure 3.14).17 The TEM operates under vacuum because electrons are easily scattered at
atmospheric pressure.
High-resolution transmission electron microscopy (HRTEM) uses both the transmitted and the
scattered beams to create an interference image. HRTEM allows obtaining an image with atomic
resolution. It has been extensively employed in the analysis of crystal structures and lattice
imperfections in various kinds of advanced materials.
This technique has been used in this thesis work in order to characterize the quality of liquid phase
exfoliated graphene. In fact with TEM it is possible to estimate the size of the graphene flakes and
with HRTEM it is possible to estimate the thickness and the quality in terms of defects of the sheets.
In the present work High Resolution Transmission Electron Microscopy (HR-TEM) analysis was
performed with a JEOL 2100 F microscope working at 200 kV, equipped with a Cs probe corrector
and a GATAN Tridiem imaging filter. All the images and the statistical analysis were performed by
Georgian Melinte (Institut de Physique et Chimie des Matériaux de Strasbourg (IPCMS)).
3.Experimental techniques
60
Figure 3.14: TEM scheme. Reproduced from Ref. 17.
3.9. Thermal desorption spectroscopy
Thermal desorption spectroscopy (TDS)18 also known as Temperature programmed desorption
(TPD) is a technique employed in order to determine kinetic and thermodynamic parameters
concerning desorption processes. Molecules previously adsorbed on a particular surface are
desorbed applying a programmed temperature rate on the substrate in ultra-high vacuum
environment. The partial pressures of atoms and the mass of molecules evolving from the sample
are measured by means of an ion gauge and a mass spectrometer (usually a quadrupole mass
spectrometer is employed) respectively. The TPD measurement showed in chapter 7 were performed
and analyzed by Dr. Artur Böttcher from Karlsruhe Institute of Technology.
3.Experimental techniques
61
3.10. References
1. Schmidtchen, F. P., Isothermal Titration Calorimetry in Supramolecular Chemistry. In Analytical Methods in
Supramolecular Chemistry, Wiley-VCH Verlag GmbH & Co. KGaA: 2007; pp 55-78. 2. Freyer, M. W.; Lewis, E. A., Isothermal Titration Calorimetry: Experimental Design, Data Analysis, and Probing Macromolecule/Ligand Binding and Kinetic Interactions. In Method Cell Biol., Dr. John, J. C.; Dr. H. William Detrich, III, Eds. Academic Press: 2008; Vol. Volume 84, pp 79-113. 3. (a) García-Fuentes, L.; Barón, C.; Quesada-Soriano, I.; Ramiro; Téllez-Sanz, Thermodynamics of Molecular
Recognition by Calorimetry. INTECH Open Access Publisher: 2011; (b) MicroCal . ITC Data Analysis in Origin ® Tutorial Guide. MicroCal, L. N., MA 2004.
4. Turnbull, W. B.; Daranas, A. H., On the Value of c: Can Low Affinity Systems Be Studied by Isothermal
Titration Calorimetry? J. Am. Chem. Soc. 2003, 125 (48), 14859-14866. 5. Schwarz Frederick, P.; Reinisch, T.; Hinz, H.-J.; Surolia, A., Recommendations on measurement and analysis of results obtained on biological substances using isothermal titration calorimetry (IUPAC Technical Report). In Pure
Appl. Chem., 2008; Vol. 80, p 2025. 6. Indyk, L.; Fisher, H. F., [17] Theoretical aspects of isothermal titration calorimetry. In Methods Enzymol., Gary K. Ackers, M. L. J., Ed. Academic Press: 1998; Vol. Volume 295, pp 350-364. 7. Wiseman, T.; Williston, S.; Brandts, J. F.; Lin, L.-N., Rapid measurement of binding constants and heats of binding using a new titration calorimeter. Anal. Biochem. 1989, 179 (1), 131-137. 8. Freire, E.; Schön, A.; Velazquez Campoy, A., Chapter 5 Isothermal Titration Calorimetry: General Formalism Using Binding Polynomials. In Methods Enzymol., Michael L. Johnson, J. M. H.; Gary, K. A., Eds. Academic Press: 2009; Vol. Volume 455, pp 127-155. 9. Gans, P.; Sabatini, A.; Vacca, A., Simultaneous Calculation of Equilibrium Constants and Standard Formation Enthalpies from Calorimetric Data for Systems with Multiple Equilibria in Solution. J Solution Chem 2008, 37 (4), 467-476. 10. van der Heide, P., X-ray Photoelectronm Spectroscopy. An Introduction to Principles and Practice. Wiley: 2012. 11. Baikie, I. D.; Estrup, P. J., Low cost PC based scanning Kelvin probe. Rev. Sci. Instrum. 1998, 69 (11), 3902-3907. 12. Kirihata, H.; Uda, M., Externally quenched air counter for low energy electron emission measurements. Rev.
Sci. Instrum. 1981, 52 (1), 68-70. 13. Epifani, M.; Melissano, E.; Pace, G.; Schioppa, M., Precursors for the combustion synthesis of metal oxides from the sol-gel processing of metal complexes. J. Eur. Ceram. Soc. 2007, 27 (1), 115-123. 14. Noguchi, T.; Nagashima, S.; Uda, M., An electron counting mechanism for the open counter operated in air. Nuclear Instruments and Methods in Physics Research Section A: Accelerators, Spectrometers, Detectors and
Associated Equipment 1994, 342 (2–3), 521-526. 15. (a) Zaumseil, J.; Sirringhaus, H., Electron and Ambipolar Transport in Organic Field-Effect Transistors. Chem. Rev. 2007, 107 (4), 1296-1323; (b) Singh, T. B.; Sariciftci, N. S., PROGRESS IN PLASTIC ELECTRONICS DEVICES. Annu. Rev. Mater. Res. 2006, 36 (1), 199-230. 16. Larkin, P. J., INFRARED AND RAMAN SPECTROSCOPY: PRINCIPLES AND SPECTRAL
INTERPRETATION. Elsevier: 2011. 17. Lavina, S.; Negro, E.; Gliubizzi, R.; Depaoli, G.; Pace, G.; Di Noto, V., New hybrid inorganic-organic complexes based on poly (3-butylthiophene) and titanium tetrachloride: Synthesis, structure and conductivity. Electrochim. Acta 2007, 52 (15), 5062-5070. 18. Schroeder, L. M. S.; Gottfried, M. Temperature-Programmed Desorption (TPD)_Thermal Desorption Spectroscopy (TDS). http://www.chemie.fu-berlin.de/~pcprakt/tds.pdf.
4.Complexation of cryptand 2.2.2: a bistable supramolecular switch studied by ITC
62
4. Complexation of cryptand 2.2.2: a
bistable supramolecular switch studied
by ITC
4.1. Introduction
One among the challenges in supramolecular chemistry1 and more generally in the chemistry of
complex multicomponent systems, is to quantify the contribution of non-covalent interactions to the
free energy landscape of a given molecule upon its interaction with a binding partner. Such
information is of paramount importance in biology and pharmacology, where the search is for the
design of drugs binding to a given target in a reaction and giving a product of optimal stability.2
Being able to correlate enthalpy and entropy changes to the binding affinity of investigated
molecules when interacting with their binding partners can offer a clear picture of structure-energy
relationships, which is particularly important for the design of new drugs and of functional
supramolecular systems.3
The advent of highly sensitive titration micro-calorimeters in the late ‘80s opened the door to the
successful extraction of thermodynamic parameters from simple experiments.4 Isothermal titration
calorimetry (ITC) is now an established and invaluable method for determining with a high degree
of precision the thermodynamic parameters, association constants and stoichiometry of molecular
interactions at equilibrium in solution.5 Unlike other methods commonly employed for the
characterization of equilibria (e.g. NMR, Raman, electronic absorption and fluorescence
spectroscopy), ITC makes it possible to determine simultaneously and with high degree of precision
the thermodynamic parameters and stoichiometry of a ligand-receptor interaction in a single
experiment by measuring the increments of heat occurring during stepwise titration experiments.6
ITC enables avoidance of the time consuming process of van ‘t Hoff analysis based on the
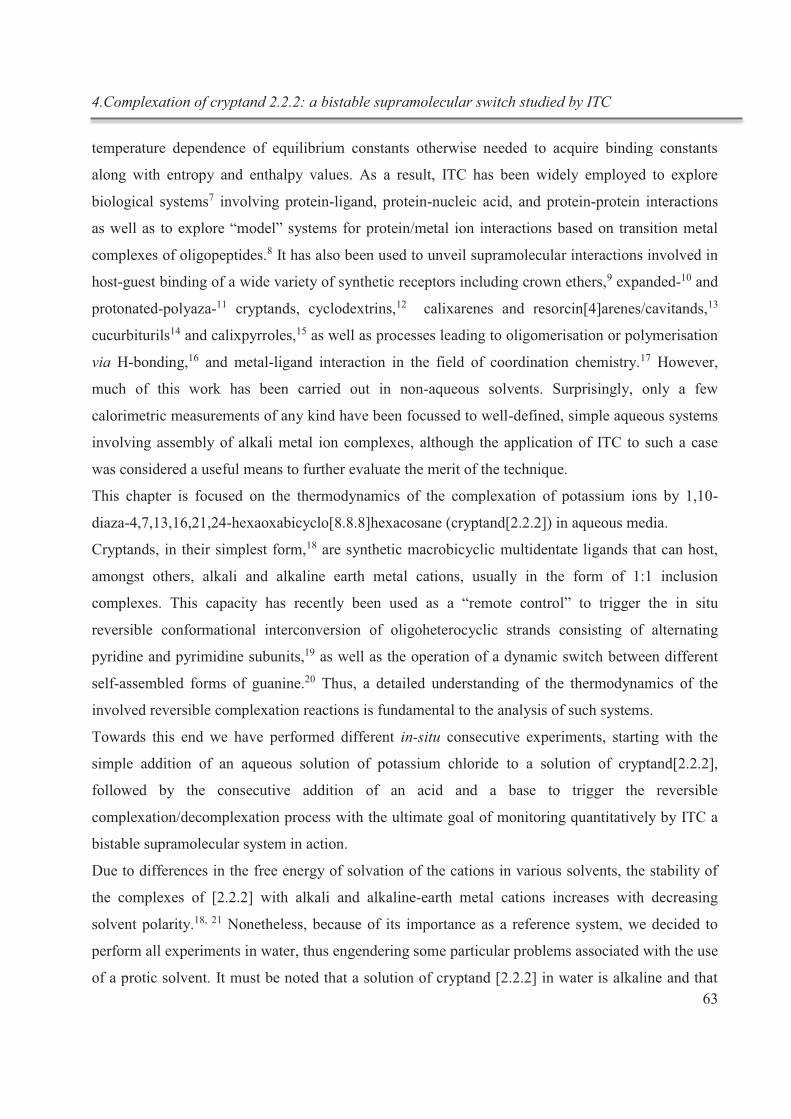
4.Complexation of cryptand 2.2.2: a bistable supramolecular switch studied by ITC
63
temperature dependence of equilibrium constants otherwise needed to acquire binding constants
along with entropy and enthalpy values. As a result, ITC has been widely employed to explore
biological systems7 involving protein-ligand, protein-nucleic acid, and protein-protein interactions
as well as to explore “model” systems for protein/metal ion interactions based on transition metal
complexes of oligopeptides.8 It has also been used to unveil supramolecular interactions involved in
host-guest binding of a wide variety of synthetic receptors including crown ethers,9 expanded-10 and
protonated-polyaza-11 cryptands, cyclodextrins,12 calixarenes and resorcin[4]arenes/cavitands,13
cucurbiturils14 and calixpyrroles,15 as well as processes leading to oligomerisation or polymerisation
via H-bonding,16 and metal-ligand interaction in the field of coordination chemistry.17 However,
much of this work has been carried out in non-aqueous solvents. Surprisingly, only a few
calorimetric measurements of any kind have been focussed to well-defined, simple aqueous systems
involving assembly of alkali metal ion complexes, although the application of ITC to such a case
was considered a useful means to further evaluate the merit of the technique.
This chapter is focused on the thermodynamics of the complexation of potassium ions by 1,10-
diaza-4,7,13,16,21,24-hexaoxabicyclo[8.8.8]hexacosane (cryptand[2.2.2]) in aqueous media.
Cryptands, in their simplest form,18 are synthetic macrobicyclic multidentate ligands that can host,
amongst others, alkali and alkaline earth metal cations, usually in the form of 1:1 inclusion
complexes. This capacity has recently been used as a “remote control” to trigger the in situ
reversible conformational interconversion of oligoheterocyclic strands consisting of alternating
pyridine and pyrimidine subunits,19 as well as the operation of a dynamic switch between different
self-assembled forms of guanine.20 Thus, a detailed understanding of the thermodynamics of the
involved reversible complexation reactions is fundamental to the analysis of such systems.
Towards this end we have performed different in-situ consecutive experiments, starting with the
simple addition of an aqueous solution of potassium chloride to a solution of cryptand[2.2.2],
followed by the consecutive addition of an acid and a base to trigger the reversible
complexation/decomplexation process with the ultimate goal of monitoring quantitatively by ITC a
bistable supramolecular system in action.
Due to differences in the free energy of solvation of the cations in various solvents, the stability of
the complexes of [2.2.2] with alkali and alkaline-earth metal cations increases with decreasing
solvent polarity.18, 21 Nonetheless, because of its importance as a reference system, we decided to
perform all experiments in water, thus engendering some particular problems associated with the use
of a protic solvent. It must be noted that a solution of cryptand [2.2.2] in water is alkaline and that
4.Complexation of cryptand 2.2.2: a bistable supramolecular switch studied by ITC
64
the hydrolysis reaction involved means that in a dilute aqueous solution of [2.2.2] a significant
fraction of the ligand is present in its monoprotonated form. Protonation is of course one means of
inhibiting metal cation binding by the cryptand. Thus, in the present work we have defined the
optimum conditions for determination of the complexation constant for a ligand which may undergo
significant hydrolysis in water.
Experimental details
All reagents were purchased from Sigma-Aldrich and were of the highest purity available, and
solutions were prepared with Millipore water (Milli-Q). Stock solutions of 4,7,13,16,21,24-hexaoxa-
1,10-diazabicyclo[8.8.8]hexacosane (cryptand [2.2.2]), potassium chloride (KCl), hydrochloric acid
(HCl) and 1,1,3,3-Tetramethylguanidine (TMG) were prepared in volumetric flasks to give a
concentration of 1.0 M and further diluted to give the desired concentrations. KCl was dried by
vacuum desiccation prior to use. 1H NMR spectra were recorded and analysed by Dr. Silvia Colella
at 295 K using a Bruker Avance 400 spectrometer. The chemical shifts (δ) are given in ppm and the
residual solvent peak was used as reference for calibration. Peaks are described as singlet (s),
doublet (d), triplet (t), quartet (q), multiplet (m) or broad (b).
Isothermal titration calorimetry experiments were performed using a VP-ITC MicroCal titration
calorimeter. Data fitting was performed using the HypΔH program.22
All experiments were performed at 298 K using degassed solutions. The concentration of the titrant
has to be always at least 10 times higher than that of the titrand because the volume of the
calorimetric pipette that contains the titrant is smaller than that of the sample cell. Heats of dilution
for all reagents were determined in separate experiments and used to correct the raw ITC data. In all
cases, tip diffusion errors required the first and sometimes the second titration points to be
discarded.
In consecutive in-situ titration experiments for the second and third titration the concentration of the
components present in the cell has to be calculated by taking into account that the VP-ITC works in
overfilled mode and the concentrations of the components in the cell changes after every injection
from the pipette into the cell (see section 4.5.2 of Appendix 1).
4.Complexation of cryptand 2.2.2: a bistable supramolecular switch studied by ITC
65
In appendix 1 it is possible to find all details of the experimental conditions used, the NMR
experiments performed and the procedure employed in order to calculate the concentration for the
consecutive titrations experiments.
4.2. Results and discussion
Determination of the starting conditions
Self-assembly of the complex K[2.2.2]+ was studied initially as a direct reaction between the two
components, that is, K+ and cryptand [2.2.2], and also as a competition between potassium ion and
the proton for the cryptand. This was done by firstly measuring the heat changes in the direct
reaction of K+ with [2.2.2], treating the resulting solution with a strong acid (HCl) to destroy the
complex, and finally treating this solution with a strong base (1,1,3,3-tetramethylguanidine, TMG,
pKa = 13.923) to restore the complex along the path portrayed in Figure 4.1. The choice of HCl and
TMG was aimed at avoiding further complications in the experiment since, neither chloride nor
TMG or its conjugated acid can be included in the protonated cryptand.
The initial titrand was a solution 1.1 mM of cryptand [2.2.2] which was loaded in the sample cell
while the titrants for the consecutive experiments were in the order: a solution 22 mM of potassium
chloride, a solution 11.5 mM of HCl and a 20 mM solution of TMG.
Fitting of ITC data using the program HypDH requires the development of a chemical model for the
system studied.
While various crystal structure determinations on acid salts of [2.2.2] have shown that in the solid
state the proton attached to cryptand-N may be directed exo or endo with respect to the cavity, in
solution it is known that inversion at these centres (in the unprotonated species as well) is fast,18, 24
so that the assumption was made that [2.2.2], H[2.2.2]+ and H2[2.2.2]2+ could each be treated as a
single species for a “slow” technique such as ITC. Since monoprotonation is considered to involve
only one of the possible coordination sites of [2.2.2], it is conceivable that the species KH[2.2.2]2+
could be formed but 1H NMR spectroscopic monitoring of the titration of a solution of K[2.2.2]+ in
D2O with DCl (see section 4.5.3 of appendix) showed that all changes could be accounted for in
terms of the spectra of K[2.2.2]+ and the two protonated forms of [2.2.2] only. Hence, the scheme
reported in Figure 4.1 is considered to fully describe the chemistry studied in the present work.
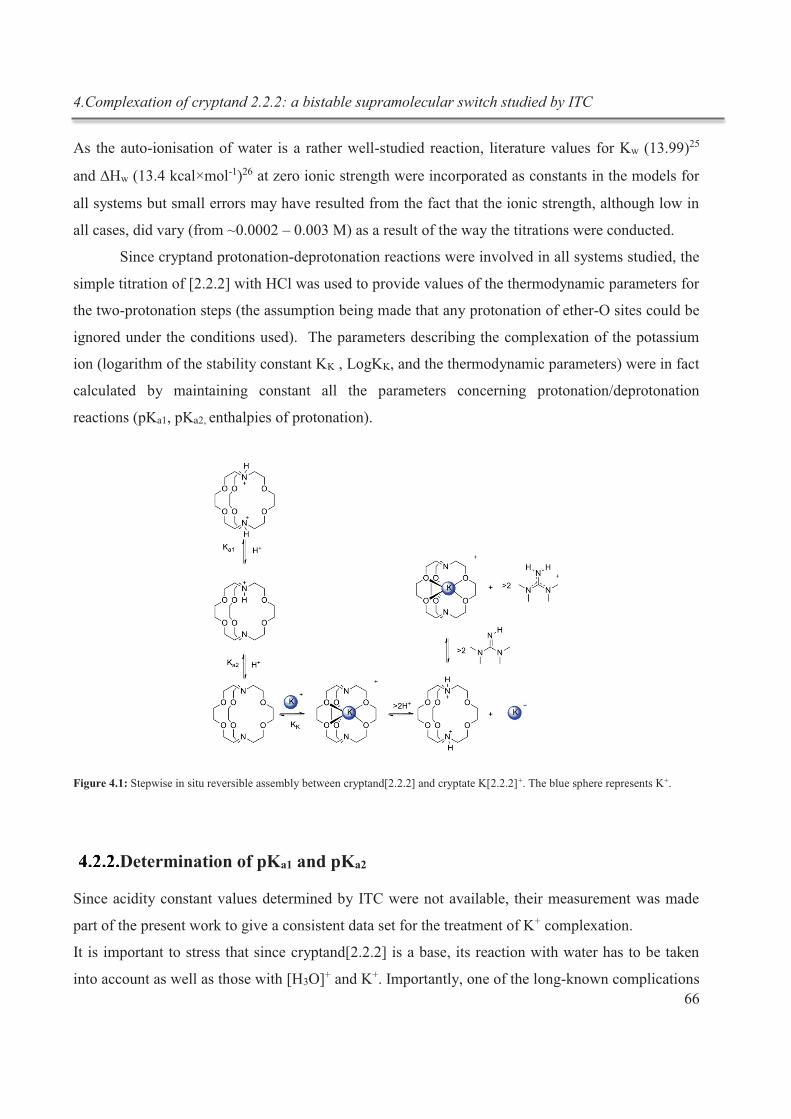
4.Complexation of cryptand 2.2.2: a bistable supramolecular switch studied by ITC
66
As the auto-ionisation of water is a rather well-studied reaction, literature values for Kw (13.99)25
and DHw (13.4 kcal×mol-1)26 at zero ionic strength were incorporated as constants in the models for
all systems but small errors may have resulted from the fact that the ionic strength, although low in
all cases, did vary (from ~0.0002 – 0.003 M) as a result of the way the titrations were conducted.
Since cryptand protonation-deprotonation reactions were involved in all systems studied, the
simple titration of [2.2.2] with HCl was used to provide values of the thermodynamic parameters for
the two-protonation steps (the assumption being made that any protonation of ether-O sites could be
ignored under the conditions used). The parameters describing the complexation of the potassium
ion (logarithm of the stability constant KK , LogKK, and the thermodynamic parameters) were in fact
calculated by maintaining constant all the parameters concerning protonation/deprotonation
reactions (pKa1, pKa2, enthalpies of protonation).
Figure 4.1: Stepwise in situ reversible assembly between cryptand[2.2.2] and cryptate K[2.2.2]+. The blue sphere represents K+.
Determination of pKa1 and pKa2
Since acidity constant values determined by ITC were not available, their measurement was made
part of the present work to give a consistent data set for the treatment of K+ complexation.
It is important to stress that since cryptand[2.2.2] is a base, its reaction with water has to be taken
into account as well as those with [H3O]+ and K+. Importantly, one of the long-known complications
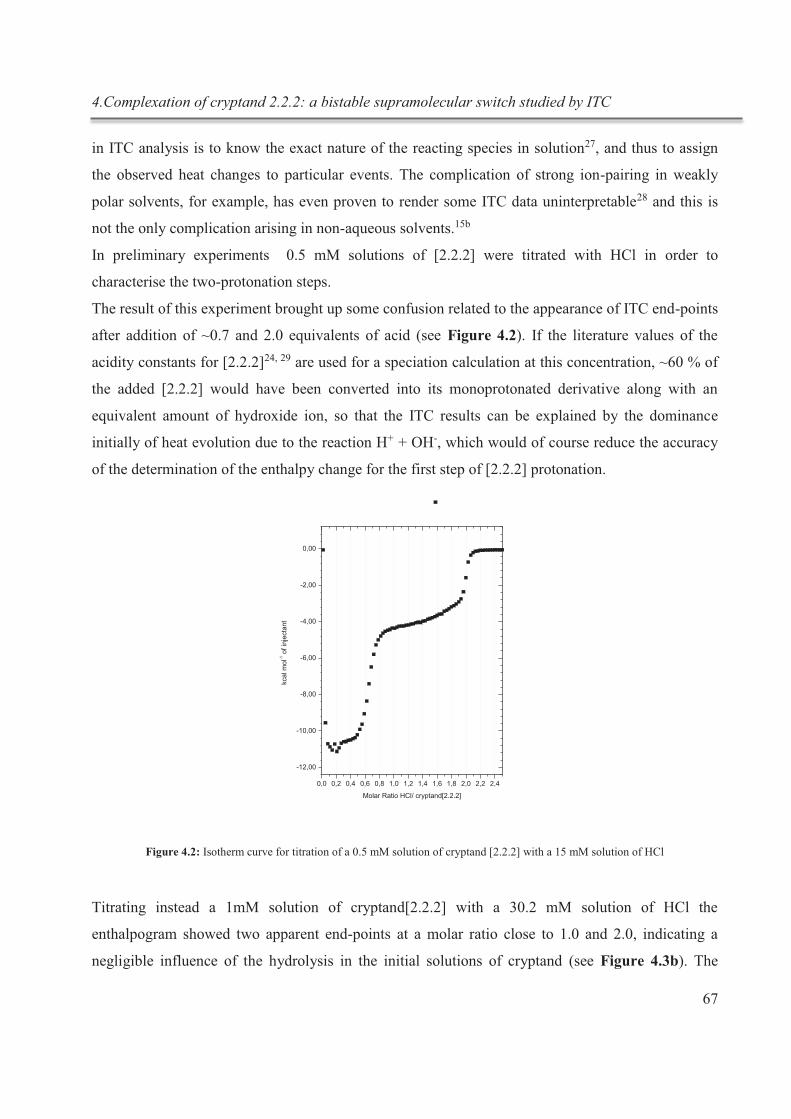
4.Complexation of cryptand 2.2.2: a bistable supramolecular switch studied by ITC
67
in ITC analysis is to know the exact nature of the reacting species in solution27, and thus to assign
the observed heat changes to particular events. The complication of strong ion-pairing in weakly
polar solvents, for example, has even proven to render some ITC data uninterpretable28 and this is
not the only complication arising in non-aqueous solvents.15b
In preliminary experiments 0.5 mM solutions of [2.2.2] were titrated with HCl in order to
characterise the two-protonation steps.
The result of this experiment brought up some confusion related to the appearance of ITC end-points
after addition of ~0.7 and 2.0 equivalents of acid (see Figure 4.2). If the literature values of the
acidity constants for [2.2.2]24, 29 are used for a speciation calculation at this concentration, ~60 % of
the added [2.2.2] would have been converted into its monoprotonated derivative along with an
equivalent amount of hydroxide ion, so that the ITC results can be explained by the dominance
initially of heat evolution due to the reaction H+ + OH-, which would of course reduce the accuracy
of the determination of the enthalpy change for the first step of [2.2.2] protonation.
Figure 4.2: Isotherm curve for titration of a 0.5 mM solution of cryptand [2.2.2] with a 15 mM solution of HCl
Titrating instead a 1mM solution of cryptand[2.2.2] with a 30.2 mM solution of HCl the
enthalpogram showed two apparent end-points at a molar ratio close to 1.0 and 2.0, indicating a
negligible influence of the hydrolysis in the initial solutions of cryptand (see Figure 4.3b). The
0,0 0,2 0,4 0,6 0,8 1,0 1,2 1,4 1,6 1,8 2,0 2,2 2,4
-12,00
-10,00
-8,00
-6,00
-4,00
-2,00
0,00
Molar Ratio HCl/ cryptand[2.2.2]
kcal m
ol-1
of in
jecta
nt
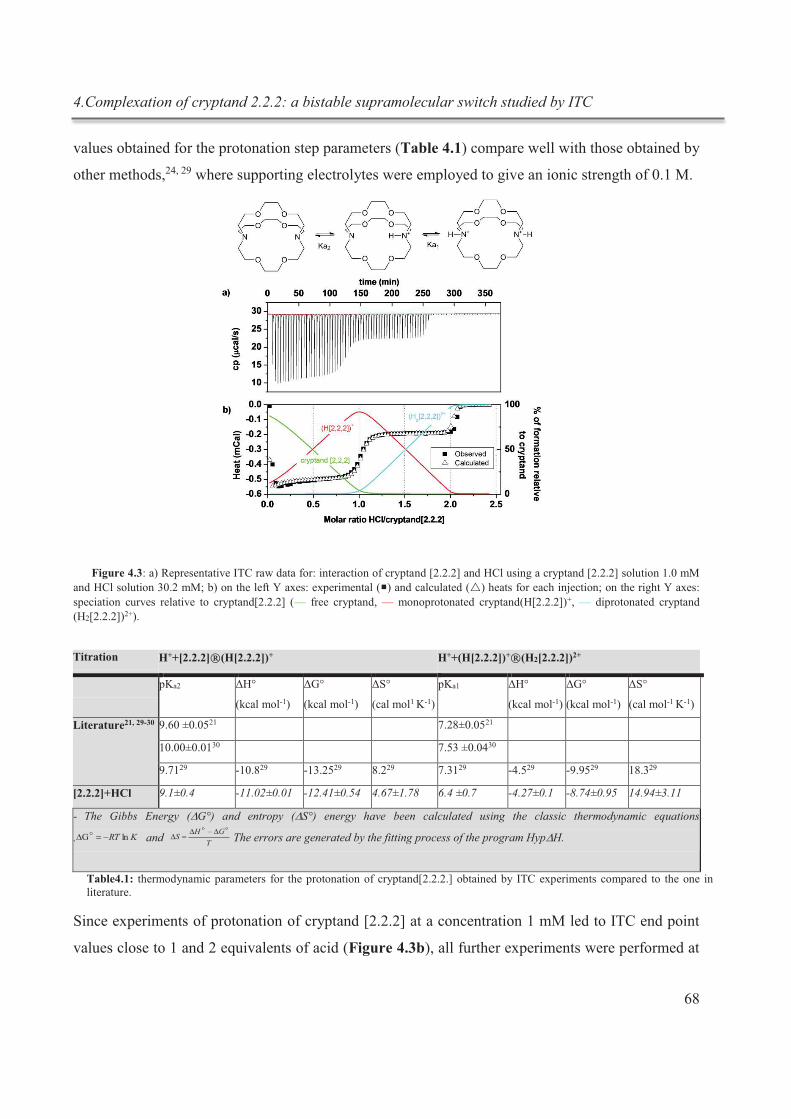
4.Complexation of cryptand 2.2.2: a bistable supramolecular switch studied by ITC
68
values obtained for the protonation step parameters (Table 4.1) compare well with those obtained by
other methods,24, 29 where supporting electrolytes were employed to give an ionic strength of 0.1 M.
Figure 4.3: a) Representative ITC raw data for: interaction of cryptand [2.2.2] and HCl using a cryptand [2.2.2] solution 1.0 mM and HCl solution 30.2 mM; b) on the left Y axes: experimental (¡) and calculated (r) heats for each injection; on the right Y axes: speciation curves relative to cryptand[2.2.2] (— free cryptand, — monoprotonated cryptand(H[2.2.2])+, — diprotonated cryptand (H2[2.2.2])2+).
Since experiments of protonation of cryptand [2.2.2] at a concentration 1 mM led to ITC end point
values close to 1 and 2 equivalents of acid (Figure 4.3b), all further experiments were performed at
Titration H++[2.2.2]®(H[2.2.2])+ H++(H[2.2.2])+®(H2[2.2.2])2+
pKa2 ΔH°
(kcal mol-1)
ΔG°
(kcal mol-1)
ΔS°
(cal mol1 K-1)
pKa1 ΔH°
(kcal mol-1)
ΔG°
(kcal mol-1)
ΔS°
(cal mol-1 K-1)
Literature21, 29-30 9.60 ±0.0521 7.28±0.0521
10.00±0.0130 7.53 ±0.0430
9.7129 -10.829 -13.2529 8.229 7.3129 -4.529 -9.9529 18.329
[2.2.2]+HCl 9.1±0.4 -11.02±0.01 -12.41±0.54 4.67±1.78 6.4 ±0.7 -4.27±0.1 -8.74±0.95 14.94±3.11
- The Gibbs Energy (DG°) and entropy (DS°) energy have been calculated using the classic thermodynamic equations
. and The errors are generated by the fitting process of the program HypDH.
Table4.1: thermodynamic parameters for the protonation of cryptand[2.2.2.] obtained by ITC experiments compared to the one in literature.
KRT lnG -=D o
T
GHS
oo D-D=D
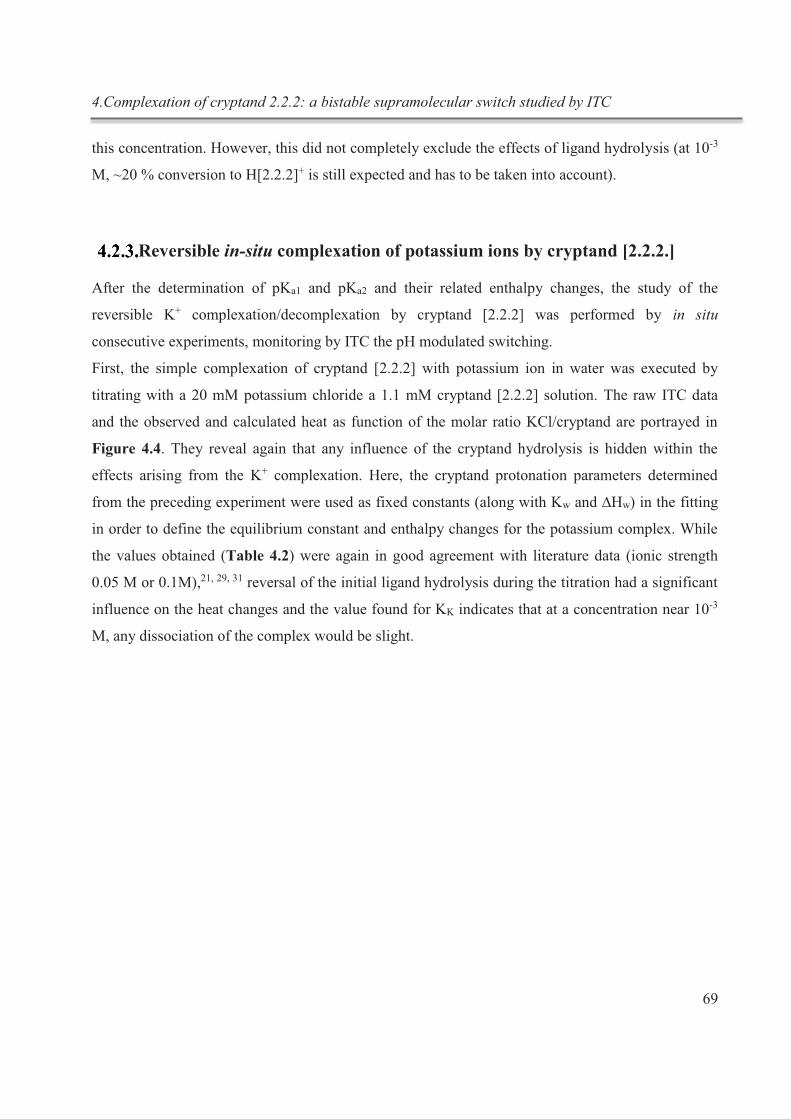
4.Complexation of cryptand 2.2.2: a bistable supramolecular switch studied by ITC
69
this concentration. However, this did not completely exclude the effects of ligand hydrolysis (at 10-3
M, ~20 % conversion to H[2.2.2]+ is still expected and has to be taken into account).
Reversible in-situ complexation of potassium ions by cryptand [2.2.2.]
After the determination of pKa1 and pKa2 and their related enthalpy changes, the study of the
reversible K+ complexation/decomplexation by cryptand [2.2.2] was performed by in situ
consecutive experiments, monitoring by ITC the pH modulated switching.
First, the simple complexation of cryptand [2.2.2] with potassium ion in water was executed by
titrating with a 20 mM potassium chloride a 1.1 mM cryptand [2.2.2] solution. The raw ITC data
and the observed and calculated heat as function of the molar ratio KCl/cryptand are portrayed in
Figure 4.4. They reveal again that any influence of the cryptand hydrolysis is hidden within the
effects arising from the K+ complexation. Here, the cryptand protonation parameters determined
from the preceding experiment were used as fixed constants (along with Kw and ∆Hw) in the fitting
in order to define the equilibrium constant and enthalpy changes for the potassium complex. While
the values obtained (Table 4.2) were again in good agreement with literature data (ionic strength
0.05 M or 0.1M),21, 29, 31 reversal of the initial ligand hydrolysis during the titration had a significant
influence on the heat changes and the value found for KK indicates that at a concentration near 10-3
M, any dissociation of the complex would be slight.
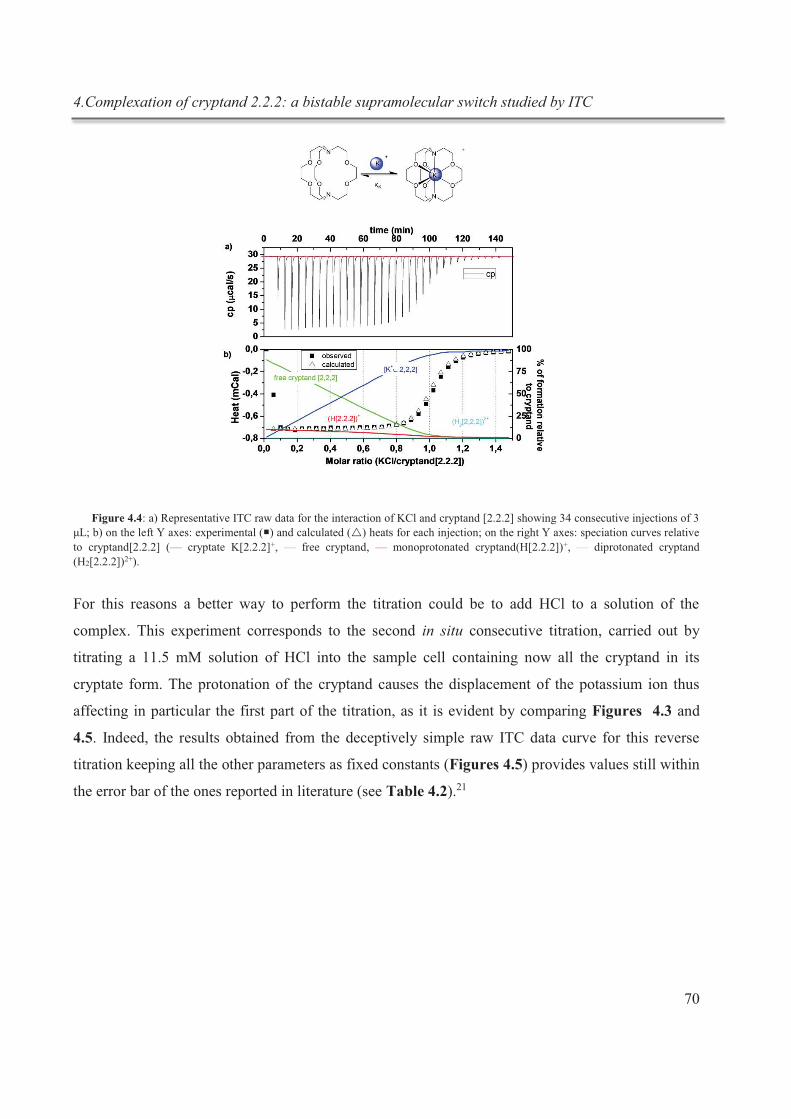
4.Complexation of cryptand 2.2.2: a bistable supramolecular switch studied by ITC
70
Figure 4.4: a) Representative ITC raw data for the interaction of KCl and cryptand [2.2.2] showing 34 consecutive injections of 3 μL; b) on the left Y axes: experimental (¡) and calculated (r) heats for each injection; on the right Y axes: speciation curves relative to cryptand[2.2.2] (— cryptate K[2.2.2]+, — free cryptand, — monoprotonated cryptand(H[2.2.2])+, — diprotonated cryptand (H2[2.2.2])2+).
For this reasons a better way to perform the titration could be to add HCl to a solution of the
complex. This experiment corresponds to the second in situ consecutive titration, carried out by
titrating a 11.5 mM solution of HCl into the sample cell containing now all the cryptand in its
cryptate form. The protonation of the cryptand causes the displacement of the potassium ion thus
affecting in particular the first part of the titration, as it is evident by comparing Figures 4.3 and
4.5. Indeed, the results obtained from the deceptively simple raw ITC data curve for this reverse
titration keeping all the other parameters as fixed constants (Figures 4.5) provides values still within
the error bar of the ones reported in literature (see Table 4.2).21
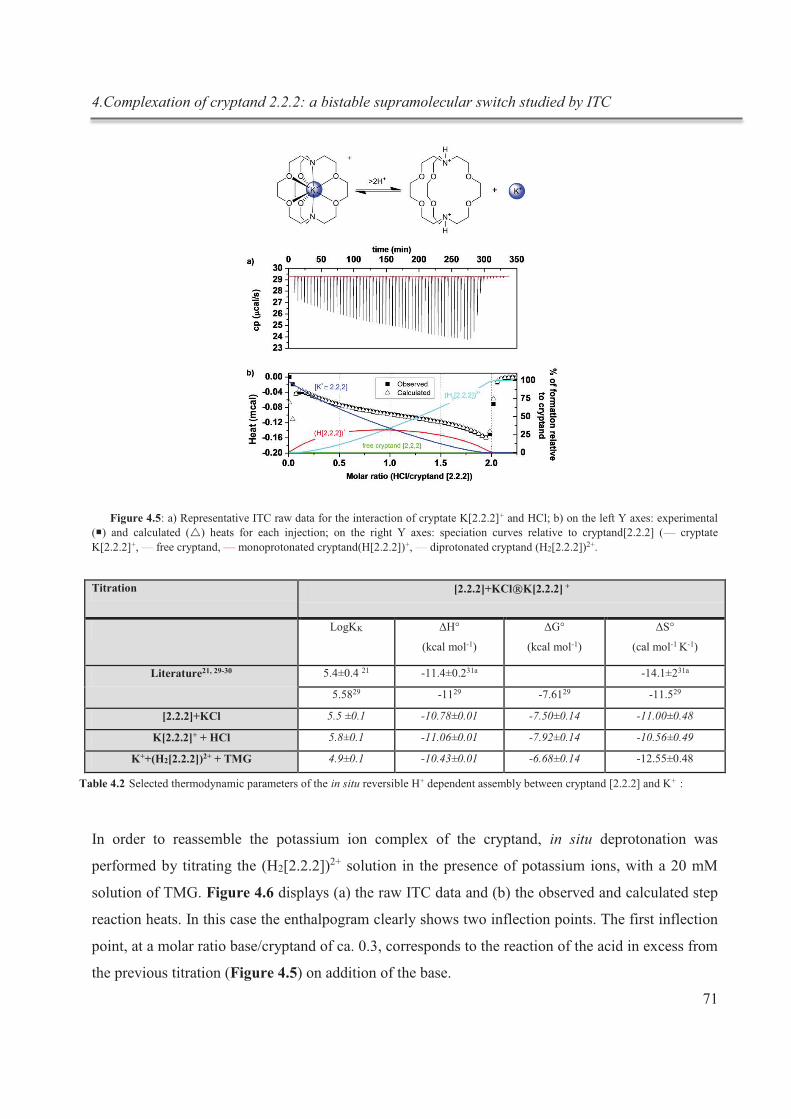
4.Complexation of cryptand 2.2.2: a bistable supramolecular switch studied by ITC
71
Figure 4.5: a) Representative ITC raw data for the interaction of cryptate K[2.2.2]+ and HCl; b) on the left Y axes: experimental (¡) and calculated (r) heats for each injection; on the right Y axes: speciation curves relative to cryptand[2.2.2] (— cryptate K[2.2.2]+, — free cryptand, — monoprotonated cryptand(H[2.2.2])+, — diprotonated cryptand (H2[2.2.2])2+.
In order to reassemble the potassium ion complex of the cryptand, in situ deprotonation was
performed by titrating the (H2[2.2.2])2+ solution in the presence of potassium ions, with a 20 mM
solution of TMG. Figure 4.6 displays (a) the raw ITC data and (b) the observed and calculated step
reaction heats. In this case the enthalpogram clearly shows two inflection points. The first inflection
point, at a molar ratio base/cryptand of ca. 0.3, corresponds to the reaction of the acid in excess from
the previous titration (Figure 4.5) on addition of the base.
Titration [2.2.2]+KCl®K[2.2.2] +
LogKK ΔH°
(kcal mol-1)
ΔG°
(kcal mol-1)
ΔS°
(cal mol-1 K-1)
Literature21, 29-30 5.4±0.4 21 -11.4±0.231a -14.1±231a
5.5829 -1129 -7.6129 -11.529
[2.2.2]+KCl 5.5 ±0.1 -10.78±0.01 -7.50±0.14 -11.00±0.48
K[2.2.2]+ + HCl 5.8±0.1 -11.06±0.01 -7.92±0.14 -10.56±0.49
K++(H2[2.2.2])2+ + TMG 4.9±0.1 -10.43±0.01 -6.68±0.14 -12.55±0.48
Table 4.2 Selected thermodynamic parameters of the in situ reversible H+ dependent assembly between cryptand [2.2.2] and K+ :
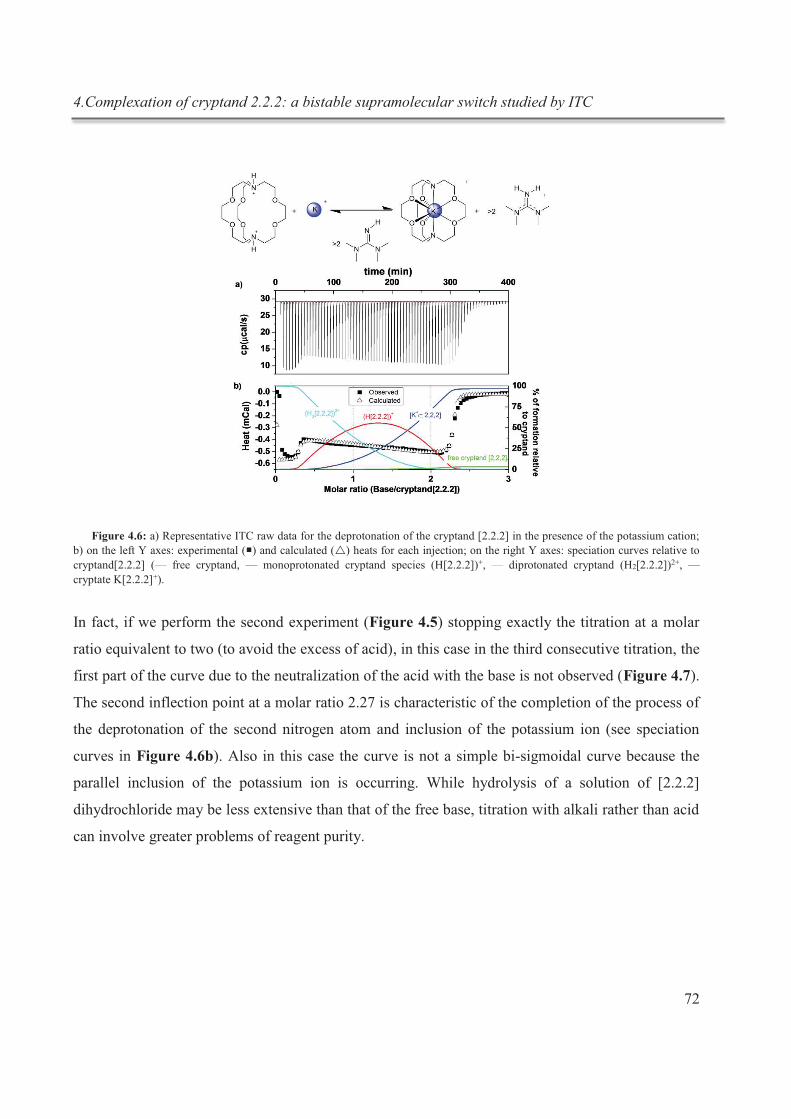
4.Complexation of cryptand 2.2.2: a bistable supramolecular switch studied by ITC
72
Figure 4.6: a) Representative ITC raw data for the deprotonation of the cryptand [2.2.2] in the presence of the potassium cation; b) on the left Y axes: experimental (¡) and calculated (r) heats for each injection; on the right Y axes: speciation curves relative to cryptand[2.2.2] (— free cryptand, — monoprotonated cryptand species (H[2.2.2])+, — diprotonated cryptand (H2[2.2.2])2+, — cryptate K[2.2.2]+).
In fact, if we perform the second experiment (Figure 4.5) stopping exactly the titration at a molar
ratio equivalent to two (to avoid the excess of acid), in this case in the third consecutive titration, the
first part of the curve due to the neutralization of the acid with the base is not observed (Figure 4.7).
The second inflection point at a molar ratio 2.27 is characteristic of the completion of the process of
the deprotonation of the second nitrogen atom and inclusion of the potassium ion (see speciation
curves in Figure 4.6b). Also in this case the curve is not a simple bi-sigmoidal curve because the
parallel inclusion of the potassium ion is occurring. While hydrolysis of a solution of [2.2.2]
dihydrochloride may be less extensive than that of the free base, titration with alkali rather than acid
can involve greater problems of reagent purity.
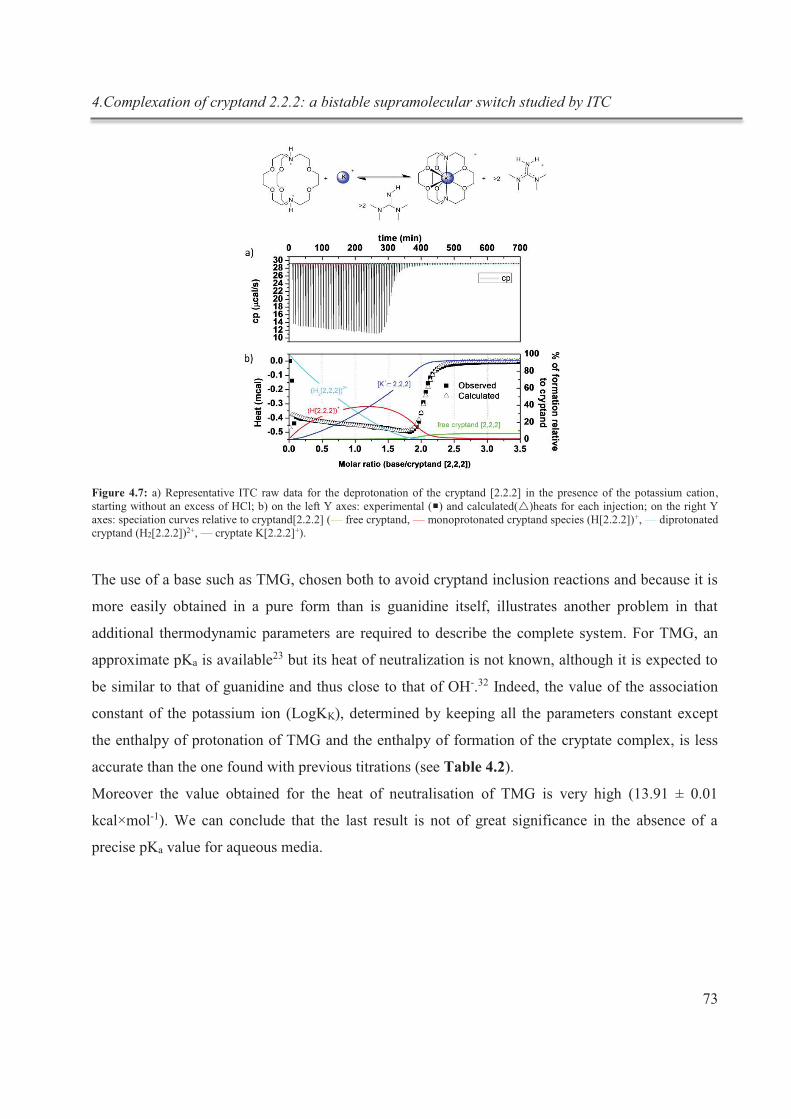
4.Complexation of cryptand 2.2.2: a bistable supramolecular switch studied by ITC
73
Figure 4.7: a) Representative ITC raw data for the deprotonation of the cryptand [2.2.2] in the presence of the potassium cation, starting without an excess of HCl; b) on the left Y axes: experimental (¡) and calculated(r)heats for each injection; on the right Y axes: speciation curves relative to cryptand[2.2.2] (— free cryptand, — monoprotonated cryptand species (H[2.2.2])+, — diprotonated cryptand (H2[2.2.2])2+, — cryptate K[2.2.2]+).
The use of a base such as TMG, chosen both to avoid cryptand inclusion reactions and because it is
more easily obtained in a pure form than is guanidine itself, illustrates another problem in that
additional thermodynamic parameters are required to describe the complete system. For TMG, an
approximate pKa is available23 but its heat of neutralization is not known, although it is expected to
be similar to that of guanidine and thus close to that of OH-.32 Indeed, the value of the association
constant of the potassium ion (LogKK), determined by keeping all the parameters constant except
the enthalpy of protonation of TMG and the enthalpy of formation of the cryptate complex, is less
accurate than the one found with previous titrations (see Table 4.2).
Moreover the value obtained for the heat of neutralisation of TMG is very high (13.91 ± 0.01
kcal×mol-1). We can conclude that the last result is not of great significance in the absence of a
precise pKa value for aqueous media.
4.Complexation of cryptand 2.2.2: a bistable supramolecular switch studied by ITC
74
4.3. Conclusions
We have shown that ITC can be used to monitor the reversible process of
complexation/decomplexation in a genuinely bistable supramolecular system in which the pH
change is used as a remote control. As a model system we have chosen the complexation of 1,10-
diaza-4,7,13,16,21,24-hexaoxabicyclo[8.8.8] hexacosane (cryptand [2.2.2]) by potassium ion. Its
decomplexation followed by a recomplexation was triggered by subsequent addition of a strong acid
and a strong base, respectively. In all the subsequent titrations it was possible to determine the
association constant and the thermodynamic parameters relative to the process of complexation of
potassium ion by cryptand [2.2.2]. We emphasize that the protic nature of water as a medium
engenders complications in the analysis of equilibria involving the binding of acidic and basic
substrates which mean that in the present case a cryptand concentration of at least 1 mM is
necessary to obtain optimum precision of the derived thermodynamic parameters.
The results obtained by ITC for the protonation and complexation (by K+) of cryptand [2.2.2] are in
agreement with those reported in the literature, based on studies carried out with other techniques.
Even though it is known that the precision reached by other methods in the calculation of the
stability constant (i.e. potentiometric methods) can be higher, the big advantage of ITC is the
possibility to determine all the thermodynamics parameters in a single set of measurements. The
separation of enthalpic and entropic contributions to a reaction free energy that is readily obtained
by ITC measurements is instrumental for assessing the factors that may influence host-guest
recognition. Unfortunately, where only free energies (equilibrium constants) are known, there is a
tendency to emphasize influences such as bonding and solvation considered as contributions to an
enthalpy change, whereas there are actually many instances where the entropy change dominates
that of enthalpy as a contribution to the overall Gibbs free energy.33 Recognition of this can provide
a rather different perspective on the nature of the equilibrium involved. A comparison of the binding
of one proton or one potassium ion by [2.2.2] is interesting in that even though the guest binding
interactions are rather different, the enthalpy change in the reactions is similar while the entropy
change is positive for protonation and negative for K+ binding. The entropy decrease on K+ binding
has been ascribed to enhanced solvent structuring about the cation masked by the organic sheath of
the cryptand ligand,18 an argument which implies that K+ binding might be simply enhanced by
functionalising the exterior of [2.2.2] with hydrophilic units.
4.Complexation of cryptand 2.2.2: a bistable supramolecular switch studied by ITC
75
4.4. References
1. (a) Lehn, J. M., Supramolecular Chemistry. Science 1993, 260 (5115), 1762-1763; (b) de Greef, T. F. A.; Meijer, E. W., Materials science: Supramolecular polymers. Nature 2008, 453 (7192), 171-173; (c) Desiraju, G. R., Hydrogen bridges in crystal engineering: Interactions without borders. Acc. Chem. Res. 2002, 35 (7), 565-573. 2. Freire, E.; Ruben, A. J.; Kiso, Y., Overcoming roadblocks in lead optimization: A thermodynamic perspective. Chem Biol Drug Des 2006, 67 (1), 2-4. 3. (a) Riley, K. E.; Hobza, P., On the Importance and Origin of Aromatic Interactions in Chemistry and Biodisciplines. Acc. Chem. Res. 2012, 46 (4), 927-936; (b) Asensio, J. L.; Ardá, A.; Cañada, F. J.; Jiménez-Barbero, J., Carbohydrate–Aromatic Interactions. Acc. Chem. Res. 2012, 46 (4), 946-954. 4. (a) Wiseman, T.; Williston, S.; Brandts, J. F.; Lin, L. N., Rapid Measurement of Binding Constants and Heats of Binding Using a New Titration Calorimeter. Anal Biochem 1989, 179 (1), 131-137; (b) Brandts, J. F.; Lin, L. N.; Wiseman, T.; Williston, S.; Yang, C. P., An Instrument for Rapid-Determination of Binding Constants for Biomolecules. Am Lab 1990, 22 (8), 30-41; (c) Wadso, I., Trends in isothermal microcalorimetry. Chem. Soc. Rev. 1997, 26 (2), 79-86. 5. (a) Falconer, R. J.; Collins, B. M., Survey of the year 2009: applications of isothermal titration calorimetry. J Mol Recognit 2011, 24 (1), 1-16; (b) Arranz-Mascaros, P.; Bazzicalupi, C.; Bianchi, A.; Giorgi, C.; Godino-Salido, M. L.; Gutierrez-Valero, M. D.; Lopez-Garzon, R.; Savastano, M., Thermodynamics of Anion-pi Interactions in Aqueous Solution. J Am Chem Soc 2013, 135 (1), 102-105. 6. Schmidtchen, F. P., Isothermal Titration Calorimetry in Supramolecular Chemistry. In Analytical Methods in
Supramolecular Chemistry, Wiley-VCH Verlag GmbH & Co. KGaA: 2007; pp 55-78. 7. (a) Ball, V.; Maechling, C., Isothermal Microcalorimetry to Investigate Non Specific Interactions in Biophysical Chemistry. Int J Mol Sci 2009, 10 (8), 3283-3315; (b) Ladbury, J.; Haq, I., Drug-DNA recognition: energetics and implications for design. J Mol Recognit 2000, 13 (4), 188-197. 8. (a) Grossoehme, N.; Spuches, A.; Wilcox, D., Application of isothermal titration calorimetry in bioinorganic chemistry. J Biol Inorg Chem 2010, 15 (8), 1183-1191; (b) Hatcher, L. Q.; Hong, L.; Bush, W. D.; Carducci, T.; Simon, J. D., Quantification of the binding constant of copper(II) to the amyloid-beta peptide. J Phys Chem B 2008, 112 (27), 8160-8164; (c) Hong, L. A.; Carducci, T. M.; Bush, W. D.; Dudzik, C. G.; Millhauser, G. L.; Simon, J. D., Quantification of the Binding Properties of Cu2+ to the Amyloid Beta Peptide: Coordination Spheres for Human and Rat Peptides and Implication on Cu2+-Induced Aggregation. J Phys Chem B 2010, 114 (34), 11261-11271. 9. (a) Turnbull, W. B.; Daranas, A. H., On the value of c: Can low affinity systems be studied by isothermal titration calorimetry? J Am Chem Soc 2003, 125 (48), 14859-14866; (b) Rawat, N.; Gujar, R. B.; Murali, M. S.; Tomar, B. S.; Manchanda, V. K., Thermodynamics of complexation of Sr(II) and Ba(II) by 18 crown 6 in water–ethanol binary mixture using titration calorimetry. Thermochim. Acta 2009, 488 (1–2), 21-26; (c) Izatt, R. M.; Bradshaw, J. S.; Nielsen, S. A.; Lamb, J. D.; Christensen, J. J., Thermodynamic and Kinetic Data for Cation Macrocycle Interaction. Chem Rev
1985, 85 (4), 271-339. 10. (a) Pederson, A. M. P.; Ward, E. M.; Schoonover, D. V.; Slebodnick, C.; Gibson, H. W., High-Yielding, Regiospecific Synthesis of cis(4,4 ')-Di(carbomethoxybenzo)-30-crown-10, Its Conversion to a Pyridyl Cryptand and Strong Complexation of 2,2 '- and 4,4 '-Bipyridinium Derivatives. J Org Chem 2008, 73 (22), 9094-9101; (b) Pederson, A. M. P.; Vetor, R. C.; Rouser, M. A.; Huang, F.; Slebodnick, C.; Schoonover, D. V.; Gibson, H. W., A new functional bis(m-phenylene)-32-crown-10-based cryptand host for paraquats. J Org Chem 2008, 73 (14), 5570-5573. 11. (a) Amendola, V.; Alberti, G.; Bergamaschi, G.; Biesuz, R.; Boiocchi, M.; Ferrito, S.; Schmidtchen, F. P., Cavity Effect on Perrhenate Recognition by Polyammonium Cages. Eur J Inorg Chem 2012, (21), 3410-3417; (b) Mateus, P.; Bernier, N.; Delgado, R., Recognition of anions by polyammonium macrocyclic and cryptand receptors: Influence of the dimensionality on the binding behavior. Coord. Chem. Rev. 2010, 254 (15–16), 1726-1747. 12. (a) Inoue, Y.; Rekharsky, M. V., Complexation thermodynamics of cyclodextrins. Chem Rev 1998, 98 (5), 1875-1917; (b) Bouchemal, K.; Mazzaferro, S., How to conduct and interpret ITC experiments accurately for cyclodextrin–guest interactions. Drug Discovery Today 2012, 17 (11–12), 623-629. 13. (a) Danil de Namor, A. F.; Cleverley, R. M.; Zapata-Ormachea, M. L., Thermodynamics of Calixarene Chemistry. Chem Rev 1998, 98 (7), 2495-2526; (b) Hornung, J.; Fankhauser, D.; Shirtcliff, L. D.; Praetorius, A.; Schweizer, W. B.; Diederich, F., Cycloalkane and Alicyclic Heterocycle Complexation by New Switchable Resorcin[4]arene-Based Container Molecules: NMR and ITC Binding Studies. Chem.-Eur. J. 2011, 17 (44), 12362-12371; (c) Corbellini, F.; Di Costanzo, L.; Crego-Calama, M.; Geremia, S.; Reinhoudt, D. N., Guest Encapsulation in a Water-Soluble Molecular Capsule Based on Ionic Interactions. J Am Chem Soc 2003, 125 (33), 9946-9947; (d) Sgarlata,
4.Complexation of cryptand 2.2.2: a bistable supramolecular switch studied by ITC
76
C.; Bonaccorso, C.; Gulino, F. G.; Zito, V.; Arena, G.; Sciotto, D., Stereochemistry and thermodynamics of the inclusion of aliphatic and aromatic anionic guests in a tetracationic calix[4]arene in acidic and neutral aqueous solutions. New J Chem 2009, 33 (5), 991-997; (e) Dionisio, M.; Oliviero, G.; Menozzi, D.; Federici, S.; Yebeutchou, R. M.; Schmidtchen, F. P.; Dalcanale, E.; Bergese, P., Nanomechanical Recognition of N-Methylammonium Salts. J Am Chem Soc 2012, 134 (4), 2392-2398. 14. (a) Biedermann, F.; Uzunova, V. D.; Scherman, O. A.; Nau, W. M.; De Simone, A., Release of High-Energy Water as an Essential Driving Force for the High-Affinity Binding of Cucurbit[n]urils. J Am Chem Soc 2012, 134 (37), 15318-15323; (b) Biedermann, F.; Vendruscolo, M.; Scherman, O. A.; De Simone, A.; Nau, W. M., Cucurbit[8]uril and Blue-Box: High-Energy Water Release Overwhelms Electrostatic Interactions. J Am Chem Soc 2013, 135 (39), 14879-14888. 15. (a) Sessler, J. L.; Gross, D. E.; Cho, W. S.; Lynch, V. M.; Schmidtchen, F. P.; Bates, G. W.; Light, M. E.; Gale, P. A., Calix[4]pyrrole as a chloride anion receptor: Solvent and countercation effects. J Am Chem Soc 2006, 128 (37), 12281-12288; (b) Valik, M.; Kral, V.; Herdtweck, E.; Schmidtchen, F. P., Sulfoniumcalixpyrrole: the decoration of a calix[4] pyrrole host with positive charges boosts affinity and selectivity of anion binding in DMSO solvent. New J Chem 2007, 31 (5), 703-710. 16. De Greef, T. F. A.; Smulders, M. M. J.; Wolffs, M.; Schenning, A. P. H. J.; Sijbesma, R. P.; Meijer, E. W., Supramolecular Polymerization. Chem Rev 2009, 109 (11), 5687-5754. 17. Ostermeier, M.; Berlin, M. A.; Meudtner, R. M.; Demeshko, S.; Meyer, F.; Limberg, C.; Hecht, S., Complexes of Click-Derived Bistriazolylpyridines: Remarkable Electronic Influence of Remote Substituents on Thermodynamic Stability as well as Electronic and Magnetic Properties. Chem.-Eur. J. 2010, 16 (33), 10202-10213. 18. Lehn, J.-M., Cryptates - Chemistry of Macropolycyclic Inclusion Complexes. Acc. Chem. Res. 1978, 11 (2), 49-57. 19. Barboiu, M.; Lehn, J.-M., Dynamic chemical devices: Modulation of contraction/extension molecular motion by coupled-ion binding/pH change-induced structural switching. P Natl Acad Sci USA 2002, 99 (8), 5201-5206. 20. (a) Spada, G. P.; Pieraccini, S.; Masiero, S.; Pandoli, O.; Samori, P., Reversible interconversion between a supramolecular polymer and a discrete octameric species from a guanosine derivative by dynamic cation binding and release. Org Lett 2006, 8 (14), 3125-3128; (b) Ciesielski, A.; Lena, S.; Masiero, S.; Spada, G. P.; Samori, P., Dynamers at the Solid-Liquid Interface: Controlling the Reversible Assembly/Reassembly Process between Two Highly Ordered Supramolecular Guanine Motifs. Angew Chem Int Edit 2010, 49 (11), 1963-1966. 21. Lehn, J.-M.; Sauvage, J. P., [2]-Cryptates - Stability and Selectivity of Alkali and Alkaline-Earth Macrobicyclic Complexes. J Am Chem Soc 1975, 97 (23), 6700-6707. 22. Gans, P.; Sabatini, A.; Vacca, A., Simultaneous calculation of equilibrium constants and standard formation enthalpies from calorimetric data for systems with multiple equilibria in solution. J Solution Chem 2008, 37 (4), 467-476. 23. Taft, R. W.; Yang, H. B., Concerning contrasting effects of base structure on hydrogen-bonded ion-pair and hydrogen-bonded complex formation. J Am Chem Soc 1971, 93 (5), 1310-1311. 24. Pizer, R., The dynamics of cryptand protonation. J Am Chem Soc 1978, 100 (13), 4239-4241. 25. Bandura, A. V.; Lvov, S. N., The Ionization Constant of Water over Wide Ranges of Temperature and Density. J. Phys. Chem. Ref. Data 2006, 35 (1), 15-30. 26. Grenthe, I.; Ots, H.; Ginstrupp, M., Acta Chem. Scand. 1970, 24, 1067-1080. 27. Zhang, Y.; Akilesh, S.; Wilcox, D. E., Isothermal titration calorimetry measurements of Ni(II) and Cu(II) binding to His, GlyGlyHis, HisGlyHis, and bovine serum albumin: A critical evaluation. Inorg Chem 2000, 39 (14), 3057-3064. 28. Gross, D. E.; Schmidtchen, F. P.; Antonius, W.; Gale, P. A.; Lynch, V. M.; Sessler, J. L., Cooperative binding of calix[4]pyrrole-anion complexes and alkylammonium cations in halogenated solvents. Chem.-Eur. J. 2008, 14 (26), 7822-7827. 29. Anderegg, G., Thermodynamics of Metal Complexing with Polyoxadiazamacrocyclic Compounds. Helv Chim
Acta 1975, 58 (4), 1218-1225. 30. Arnaud-Neu, F.; Spiess, B.; Schwing-Weill, M.-J., Stabilité en solution aqueuse de complexes de métaux lourds avec des ligands diaza-polyoxamacrocycliques. Helv Chim Acta 1977, 60 (8), 2633-2643. 31. (a) Kauffmann, E.; Lehn, J.-M.; Sauvage, J. P., Enthalpy and Entropy of Formation of Alkali and Alkaline-Earth Macrobicyclic Cryptate Complexes. Helv Chim Acta 1976, 59 (4), 1099-1111; (b) Gutknecht, J.; Schneider, H.; Stroka, J., Cryptate Formation in Non-Aqueous Solvents - New Aspects in Single-Ion Thermodynamics. Inorg Chem
1978, 17 (12), 3326-3329. 32. Fabbrizzi, L.; Micheloni, M.; Paoletti, P.; Schwarzenbach, G., Protonation processes of unusual exothermicity. J Am Chem Soc 1977, 99 (17), 5574-5576.
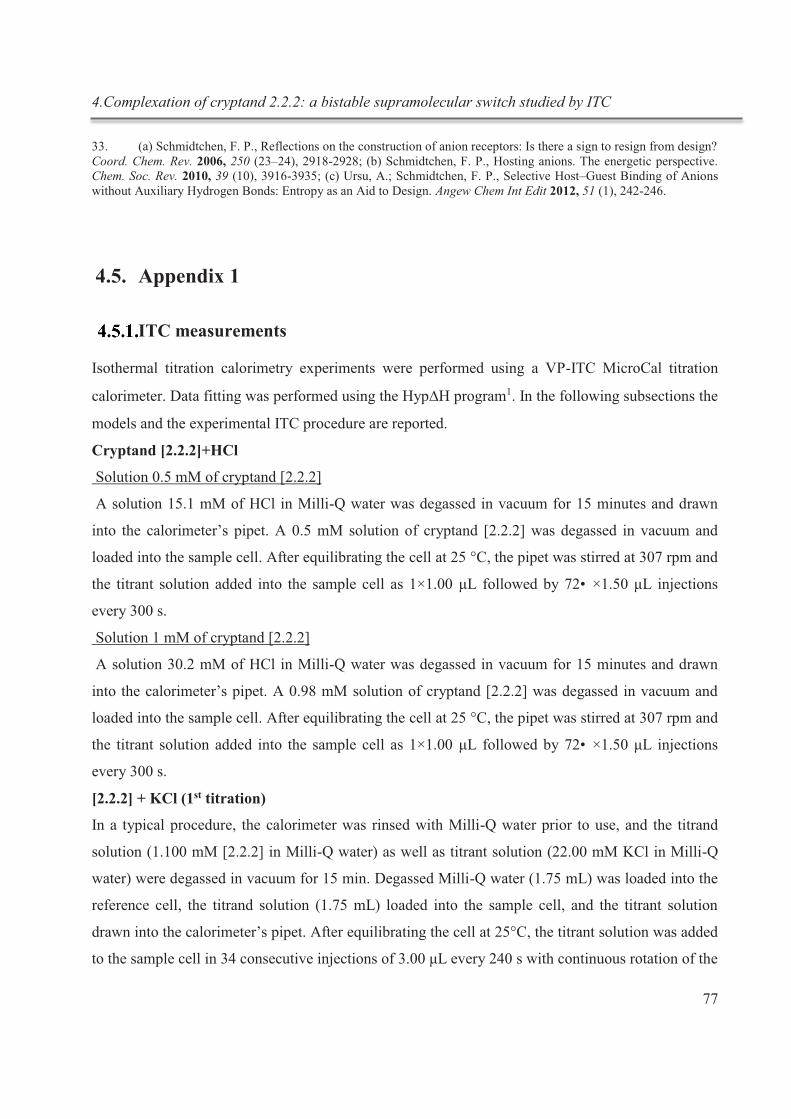
4.Complexation of cryptand 2.2.2: a bistable supramolecular switch studied by ITC
77
33. (a) Schmidtchen, F. P., Reflections on the construction of anion receptors: Is there a sign to resign from design? Coord. Chem. Rev. 2006, 250 (23–24), 2918-2928; (b) Schmidtchen, F. P., Hosting anions. The energetic perspective. Chem. Soc. Rev. 2010, 39 (10), 3916-3935; (c) Ursu, A.; Schmidtchen, F. P., Selective Host–Guest Binding of Anions without Auxiliary Hydrogen Bonds: Entropy as an Aid to Design. Angew Chem Int Edit 2012, 51 (1), 242-246.
4.5. Appendix 1
ITC measurements
Isothermal titration calorimetry experiments were performed using a VP-ITC MicroCal titration
calorimeter. Data fitting was performed using the HypDH program1. In the following subsections the
models and the experimental ITC procedure are reported.
Cryptand [2.2.2]+HCl
Solution 0.5 mM of cryptand [2.2.2]
A solution 15.1 mM of HCl in Milli-Q water was degassed in vacuum for 15 minutes and drawn
into the calorimeter’s pipet. A 0.5 mM solution of cryptand [2.2.2] was degassed in vacuum and
loaded into the sample cell. After equilibrating the cell at 25 °C, the pipet was stirred at 307 rpm and
the titrant solution added into the sample cell as 1×1.00 μL followed by 72• ×1.50 μL injections
every 300 s.
Solution 1 mM of cryptand [2.2.2]
A solution 30.2 mM of HCl in Milli-Q water was degassed in vacuum for 15 minutes and drawn
into the calorimeter’s pipet. A 0.98 mM solution of cryptand [2.2.2] was degassed in vacuum and
loaded into the sample cell. After equilibrating the cell at 25 °C, the pipet was stirred at 307 rpm and
the titrant solution added into the sample cell as 1×1.00 μL followed by 72• ×1.50 μL injections
every 300 s.
[2.2.2] + KCl (1st titration)
In a typical procedure, the calorimeter was rinsed with Milli-Q water prior to use, and the titrand
solution (1.100 mM [2.2.2] in Milli-Q water) as well as titrant solution (22.00 mM KCl in Milli-Q
water) were degassed in vacuum for 15 min. Degassed Milli-Q water (1.75 mL) was loaded into the
reference cell, the titrand solution (1.75 mL) loaded into the sample cell, and the titrant solution
drawn into the calorimeter’s pipet. After equilibrating the cell at 25°C, the titrant solution was added
to the sample cell in 34 consecutive injections of 3.00 μL every 240 s with continuous rotation of the
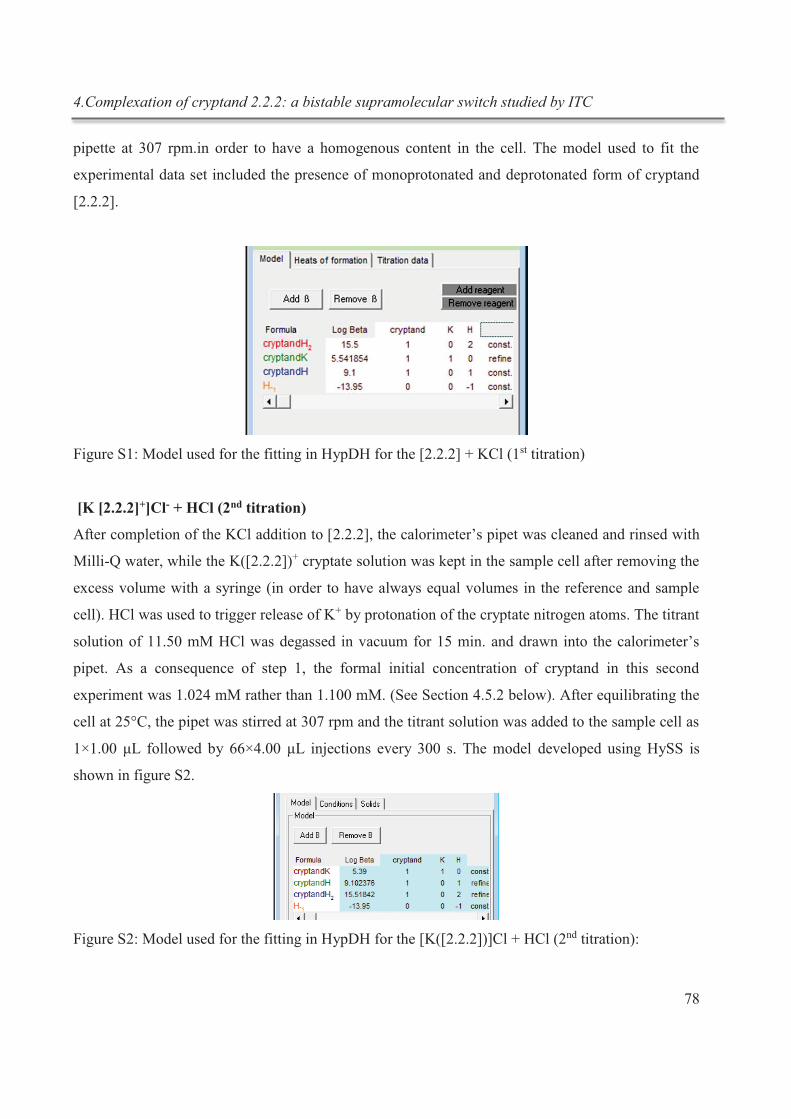
4.Complexation of cryptand 2.2.2: a bistable supramolecular switch studied by ITC
78
pipette at 307 rpm.in order to have a homogenous content in the cell. The model used to fit the
experimental data set included the presence of monoprotonated and deprotonated form of cryptand
[2.2.2].
Figure S1: Model used for the fitting in HypDH for the [2.2.2] + KCl (1st titration)
[K [2.2.2]+]Cl- + HCl (2nd titration)
After completion of the KCl addition to [2.2.2], the calorimeter’s pipet was cleaned and rinsed with
Milli-Q water, while the K([2.2.2])+ cryptate solution was kept in the sample cell after removing the
excess volume with a syringe (in order to have always equal volumes in the reference and sample
cell). HCl was used to trigger release of K+ by protonation of the cryptate nitrogen atoms. The titrant
solution of 11.50 mM HCl was degassed in vacuum for 15 min. and drawn into the calorimeter’s
pipet. As a consequence of step 1, the formal initial concentration of cryptand in this second
experiment was 1.024 mM rather than 1.100 mM. (See Section 4.5.2 below). After equilibrating the
cell at 25°C, the pipet was stirred at 307 rpm and the titrant solution was added to the sample cell as
1×1.00 μL followed by 66×4.00 μL injections every 300 s. The model developed using HySS is
shown in figure S2.
Figure S2: Model used for the fitting in HypDH for the [K([2.2.2])]Cl + HCl (2nd titration):
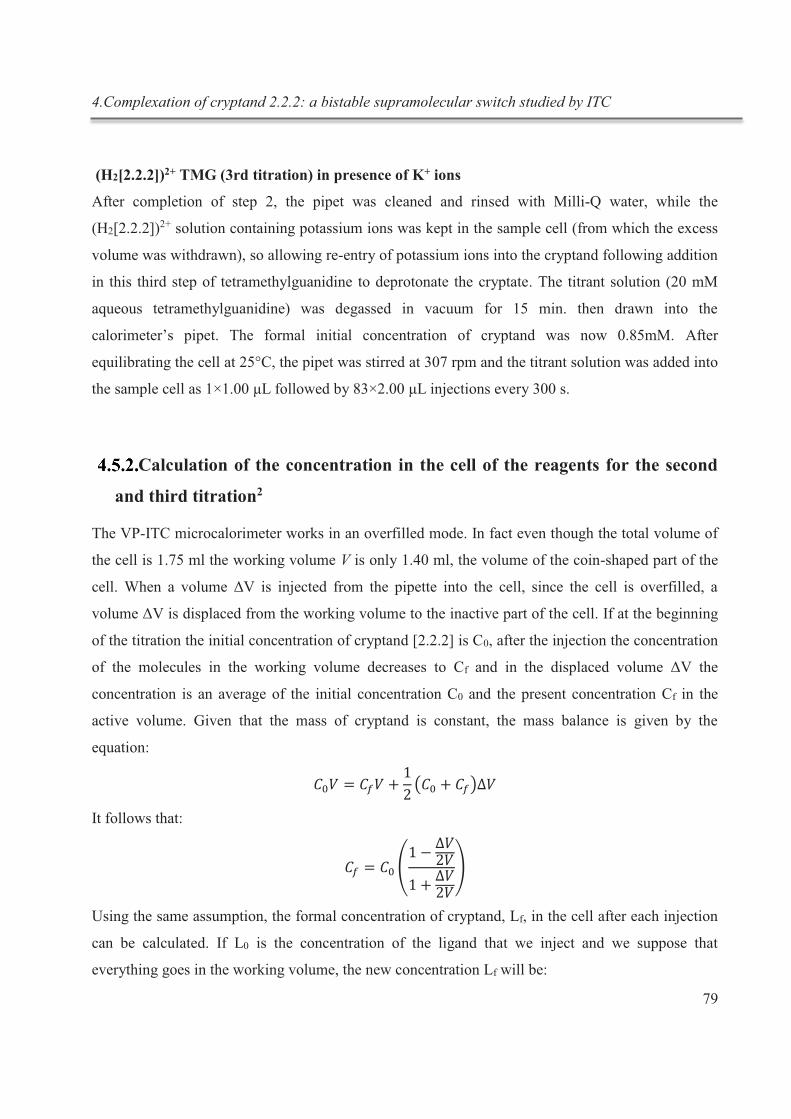
4.Complexation of cryptand 2.2.2: a bistable supramolecular switch studied by ITC
79
(H2[2.2.2])2+ TMG (3rd titration) in presence of K+ ions
After completion of step 2, the pipet was cleaned and rinsed with Milli-Q water, while the
(H2[2.2.2])2+ solution containing potassium ions was kept in the sample cell (from which the excess
volume was withdrawn), so allowing re-entry of potassium ions into the cryptand following addition
in this third step of tetramethylguanidine to deprotonate the cryptate. The titrant solution (20 mM
aqueous tetramethylguanidine) was degassed in vacuum for 15 min. then drawn into the
calorimeter’s pipet. The formal initial concentration of cryptand was now 0.85mM. After
equilibrating the cell at 25°C, the pipet was stirred at 307 rpm and the titrant solution was added into
the sample cell as 1×1.00 μL followed by 83×2.00 μL injections every 300 s.
Calculation of the concentration in the cell of the reagents for the second
and third titration2
The VP-ITC microcalorimeter works in an overfilled mode. In fact even though the total volume of
the cell is 1.75 ml the working volume V is only 1.40 ml, the volume of the coin-shaped part of the
cell. When a volume ΔV is injected from the pipette into the cell, since the cell is overfilled, a
volume ΔV is displaced from the working volume to the inactive part of the cell. If at the beginning
of the titration the initial concentration of cryptand [2.2.2] is C0, after the injection the concentration
of the molecules in the working volume decreases to Cf and in the displaced volume ΔV the
concentration is an average of the initial concentration C0 and the present concentration Cf in the
active volume. Given that the mass of cryptand is constant, the mass balance is given by the
equation:
It follows that:
Using the same assumption, the formal concentration of cryptand, Lf, in the cell after each injection
can be calculated. If L0 is the concentration of the ligand that we inject and we suppose that
everything goes in the working volume, the new concentration Lf will be:

4.Complexation of cryptand 2.2.2: a bistable supramolecular switch studied by ITC
80
NMR studies
[2.2.2] 1H-NMR (D2O, δ): 3.65 (t, broad, 12H, -OCH2-), 3.63 (s, 12H, -CH2CH2O-), 2.83 (t, 12H, J
=5.6Hz, -NCH2-).
[2.2.2] + 1eqHCl 1H-NMR (D2O, δ): 3.67 (t, broad, 12H, -OCH2-), 3.64 (s, 12H, -CH2CH2O-), 2.97 (s, broad, 12H, -
NCH2-).
[2.2.2] + 2eqHCl 1H-NMR (D2O, δ): 3.87 (t, 12H, J = 4.8Hz, -OCH2-), 3.74 (s, 12H, -CH2CH2O-), 3.59 (t, 12H, J
=4.8Hz, -NCH2-).
[2.2.2] + 1eqKCl 1H-NMR (D2O, δ): 3.61 (s, 12H, -CH2CH2O-), 3.56 (t, broad, 12H, -OCH2-), 2.52 (t, broad, 12H, -
NCH2-).
[2.2.2] + 1eqKCl + 1eqHCl 1H-NMR (D2O, δ): 3.84 (s, broad), 3.71 (s, broad), 3.60 (s), 3.56 (t), 3.52 (s, broad), 2.52 (t).
[2.2.2] + 1eqKCl + 2eqHCl 1H-NMR (D2O, δ): 3.87 (t, 12H, J = 4.8Hz, -OCH2-), 3.74 (s, 12H, -CH2CH2O-), 3.59 (t, 12H, J =
4.8Hz, -NCH2-)
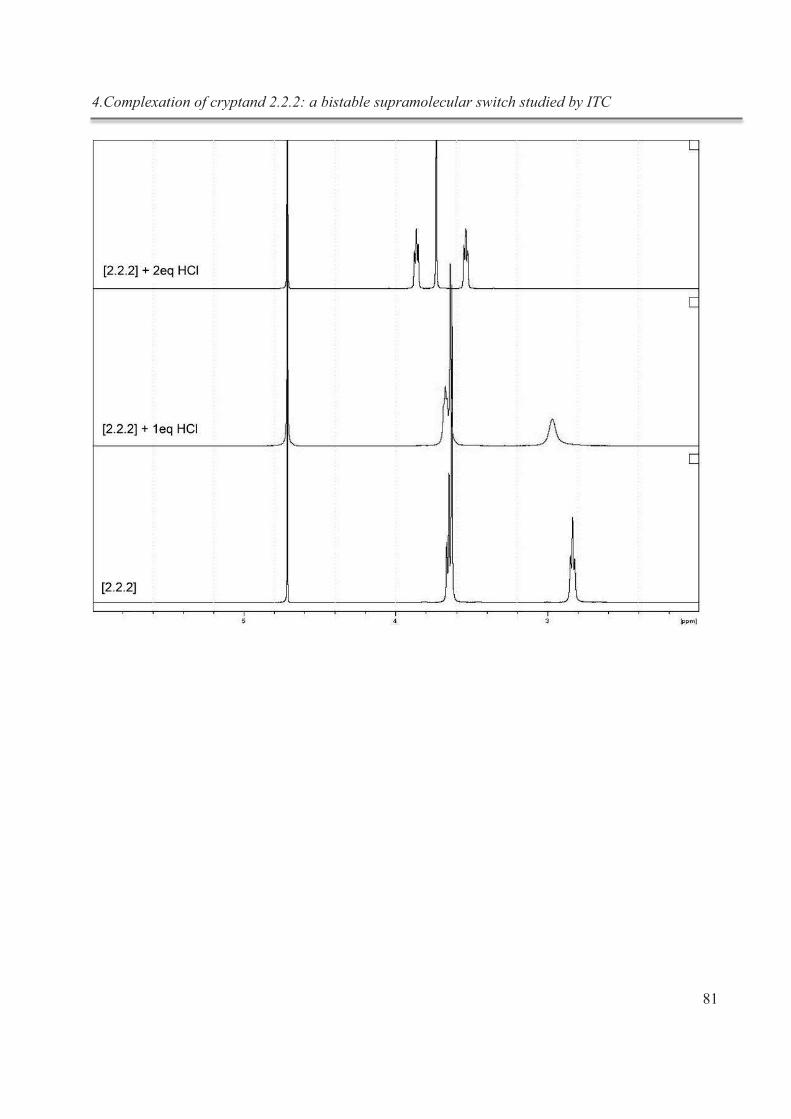
4.Complexation of cryptand 2.2.2: a bistable supramolecular switch studied by ITC
81
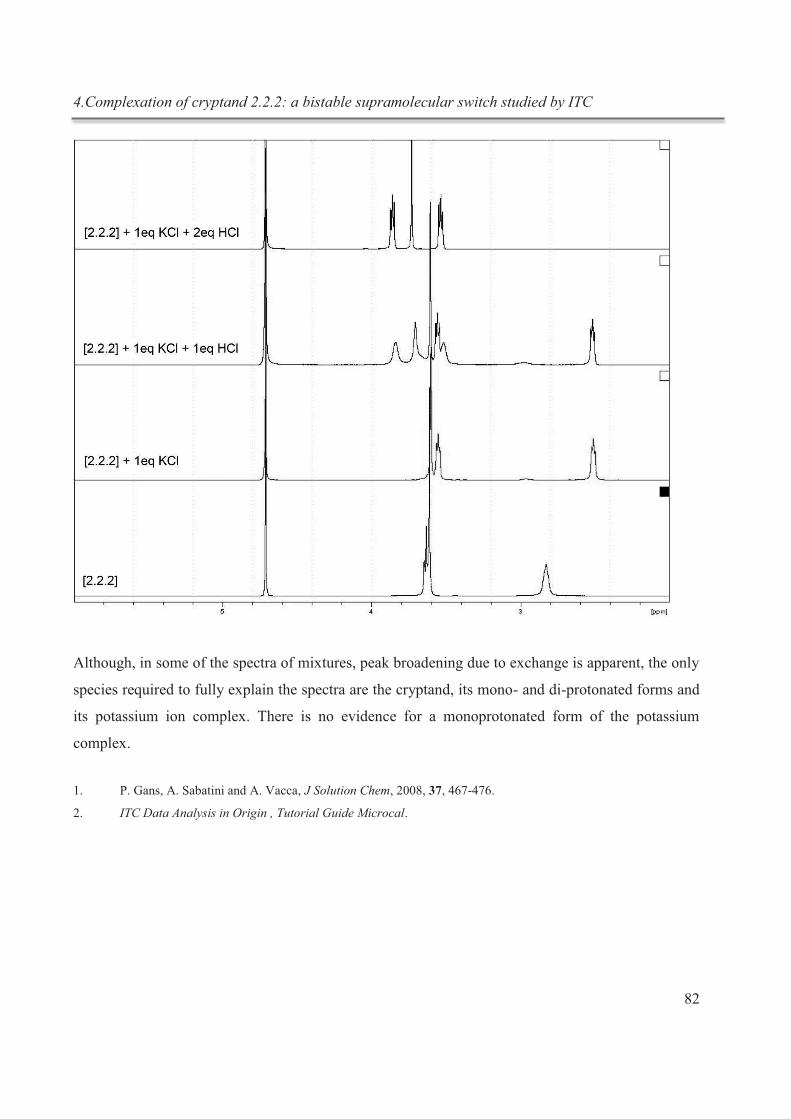
4.Complexation of cryptand 2.2.2: a bistable supramolecular switch studied by ITC
82
Although, in some of the spectra of mixtures, peak broadening due to exchange is apparent, the only
species required to fully explain the spectra are the cryptand, its mono- and di-protonated forms and
its potassium ion complex. There is no evidence for a monoprotonated form of the potassium
complex.
1. P. Gans, A. Sabatini and A. Vacca, J Solution Chem, 2008, 37, 467-476.
2. ITC Data Analysis in Origin , Tutorial Guide Microcal.
5.Exploitation of supramolecular interactions for the production of liquid-phase exfoliated graphene
83
5. Exploitation of supramolecular
interactions for the production of
liquid-phase exfoliated graphene
5.1. Introduction
Graphene is a two dimensional material possessing unique optical, electrical1 and mechanical2
properties. Two approaches are possible for the production of graphene: a bottom-up approach
starting from smaller building blocks or a top-down approach which exploits graphite as starting
material.3 Among the top-down approaches, an easily up-scalable one consists of the exfoliation of
graphite in liquid media by making use of ultrasonication.4 The liquid-phase exfoliation (LPE)
method is becoming more and more interesting and popular because it is extremely versatile: it can
be used to deposit graphene in a variety of environments and on different substrates not accessible
using mechanical cleavage or growth methods.5 The LPE process consists of three stages: (i)
dispersion of graphite in the chosen solvent, (ii) sonication, and (iii) purification through
centrifugation.6 Exfoliation of graphite occurs thanks to shear forces and cavitation, acting on the
bulk material during ultrasonication.7 The choice of the solvent is crucial since, after exfoliation, the
solvent–graphene interaction needs to balance the attractive forces between graphene sheets.
It has been widely studied and proved that liquid media having surface tension around 40 mJ m-2,4
like N-Methyl-2-pyrrolidone (NMP), are the best choice for exfoliation technique, since they
minimize the interfacial energy between the solvent and graphene and thus allowing for the
overcoming of the van der Waals forces between adjacent graphene layers. Recently, it has been
shown that the addition of small organic molecules and/or polymers,8 featuring a high affinity for
the surface of graphene, during LPE of graphite can harness both the yield of exfoliation and quality
of graphene and, in particular cases can confer additional properties to the exfoliated material.9 In
particular in our group it was possible to obtain an improvement in the exfoliation yield and in the
percentage of mono- and bilayer graphene flakes produced by addition of simple alkane molecules
5.Exploitation of supramolecular interactions for the production of liquid-phase exfoliated graphene
84
such as 1-phenyloctane and arachidic acid.10 This was possible by mastering the supramolecular
approach since it is known that the correspondence between the zig-zag alternation of methylene
group of alkanes and the honeycomb structure of graphene leads to a stabilization energy of 64meV
for each methylene group.11
A deeper study revealed that, by employing fatty acids with different lengths as stabilizing agents
during the exfoliation process, the efficiency of the exfoliation in terms of concentration of
exfoliated graphene was proportional to the length of the employed fatty acid.12
In view of the fact that in a recent computational prediction our collaborators Conti and Cecchini
had reported that fully chlorinated compounds could exhibit a greater energy of adsorption on
graphene than the respective hydrogenated derivatives,13 we decided to investigate if the use of
perchlorinated molecules as exfoliating agents could further improve the quality of the LPE
graphene.
Since long perchlorinated hydrocarbons are unstable at room temperature and ambient pressure and
because of this reason in literature only chains up to butane are possible to find,14 we decided to
explore the use of aromatic stabilizing agents. π-π interactions have been already exploited in order
to stabilize graphene in aqueous solvents by making use of aromatic molecules bearing amphiphilic
moieties.15
Therefore in this work we have explored the possibility of taking advantage of π-π interactions to
improve the quality and quantity of graphene dispersions. We have employed in particular a
coronene molecule, one of the most common polycyclic aromatic hydrocarbon (PAH) 16 and we
have investigated how the functionalization of these molecules with chlorine atoms could affect the
exfoliation process, improving the interactions with graphene sheets. For this purpose, a
perchlorinated coronene synthetized by the group of Prof. K. Müllen (Max Planck Institute, Mainz)
has been employed as surfactant in comparison to a simple coronene molecule. The LPE
experimental work has been preceded by theoretical calculations performed by the group of Dr. M.
Cecchini at I.S.I.S., Strasbourg.
Thermal desorption spectroscopy (TDS) performed by Dr. A. Böttcher, in the group of Prof.
Manfred Kappes at the Karlsruhe Institute of Technology (KIT) has been employed to measure
experimentally the desorption energy of the molecules from the graphene/graphite surface in order
to confirm the theoretical experiments.
5.Exploitation of supramolecular interactions for the production of liquid-phase exfoliated graphene
85
5.2. Experimental details
Coronene and perchlorinated coronene used for exfoliation were synthetized by the group of Prof.
K. Müllen. Graphite powder (product number (p.n.) 332461), ortho-dichlorobenzene
(o-DCB, p.n.240664) were acquired from Sigma-Aldrich and used without further treatment.
Preparation of Graphene by Exfoliation of Graphite: Graphite flakes were sonicated for 6 hours in
o-DCB in presence of the PAHs in a thermostated bath at 40 °C keeping the percentage of graphite
flakes always constant (1% weight). At the end of sonication the samples were decanted for 20 min
and the upper part of each dispersion was collected and centrifuged for 30 min at 5000 rpm, 15 min
at 8000 rpm and finally 15 min at 10000 rpm (Eppendorf 5804, rotor F-34-6-38) obtaining
homogeneous dispersions.
Characterization of LPE graphene: The dispersions and the starting solutions of PAHs were
characterized by UV-Vis absorption and fluorescence spectroscopy using a Jasco V670
spectrophotometer and a Jobyn Hivon Horiba Fluorolog®-3 employing microquartz cuvette in order
to decrease the optical pathway and avoid inner filter effects. For dilutions experiments cuvettes
with 1 cm optical pathway were used.
High Resolution Transmission Electron Microscopy (HR-TEM) analysis was performed with a
JEOL 2100 F microscope working at 200 kV, equipped with a Cs probe corrector and a GATAN
Tridiem imaging filter by G. Melinte member of Prof. O. Ersen group (Institut de Physique et
Chimie des Matériaux de Strasbourg (IPCMS)). For the analyses, for each sample, a drop of
graphene dispersion was deposited on a TEM grid covered by a lacey carbon membrane. The as-
prepared grids were kept overnight under high vacuum to allow the evaporation of the solvent.
Micro Raman measurements were carried out with a Witec spectrometer in confocal mode and
backscattering geometry with excitation energy of 488 nm, 514.5 nm and 633 nm. A 100X objective
with a NA of 0.95 was used for the characterization. This ensures a small laser spot size of around
400 nm. The spectral resolution of the spectrometer amounts to 2–3 cm−1. The laser power was well
below 1 mW to avoid damage. Around 50 flakes drop-cast on a silicon substrates were analyzed and
the shape of the 2D peak and intensity (as height) ratio between D and G peak, I(D)/I(G) were
analyzed. In particular, the 2D peak was fitted with a Lorentzian lineshape and the coefficient of
determination, R2, was used to discriminate between 1 layer (symmetric peak) and restacked or thin
layers (asymmetric 2D peak). This allows deriving qualitative information on the thickness
5.Exploitation of supramolecular interactions for the production of liquid-phase exfoliated graphene
86
distribution and the amount of defects. The Raman characterization was carried out by Y. Shin at the
Nanoscience and Spectroscopy Lab of Dr. C. Casiraghi at University of Manchester.
The concentration of the dispersions was determined by heating the graphene dispersion previously
mixed with chloroform at 50°C in order to desorb the molecules from the graphene sheets and
filtering the mixture through a polytetrafluoroethylene (PTFE) membrane with 0.1µm pore size.
Theoretical calculations: Modeling was performed to study in which extend the chlorination of
polycyclic aromatic hydrocarbons improves the affinity for graphene. The adsorption energy for
graphene of hydrogenated and PAHs was evaluated using a force field model of interactions.17 The
atom typing of hydrogenated and perchlorinated PAHs was performed via the ParamChem Web
server (version 0.9.7),18 which generates parameters for CGenFF version 2b8.17 The graphene
substrate was modeled using a squared 610 carbons polyaromatic molecule with dangling
hydrogens. The carbon atoms of graphene were parameterized using the atom type CG2R61
(aromatic carbon) with zero charge if internal and −0.115 e.u. on the edge. Hydrogens were
parameterized with the atom type HGR61 (aromatic hydrogen) with a partial charge of +0.115 e.u..
For the calculation of the desorption energy, the adsorbate in complex with the substrate was energy
minimized by 1000steps of the steepest descent (SD) followed by an adopted basis
Newton−Raphson (ABNR) optimization until convergence to an energy gradient of 10−8 kcal mol−1
Å−1. All calculations were performed using the CHARMM software.19
Thermal desorption spectroscopy: Thermal desorption of coronene and perchlorocoronene from
freshly cleaved HOPG was studied by temperature resolved mass spectrometry (quadrupole mass
spectrometer, Extrel, 70 eV electron impact ionization, typical mass resolution m/ m 300). For
this, the flux of desorbed species was monitored while linearly increasing the sample temperature at
a constant heating rate ( = 2.5 K s-1). TDS measurements were performed and analyzed by
Dr. A. Böttcher, in the group of Prof. Manfred Kappes at the Karlsruhe Institute of Technology
(KIT).
5.3. Results and discussion
Theoretical calculations
Müllen and coworkers recently showed a general protocol for the controlled edge chlorination of
nanographenes (i.e.PAHs) and graphene nanoribbons20. The chlorination confers to these materials a
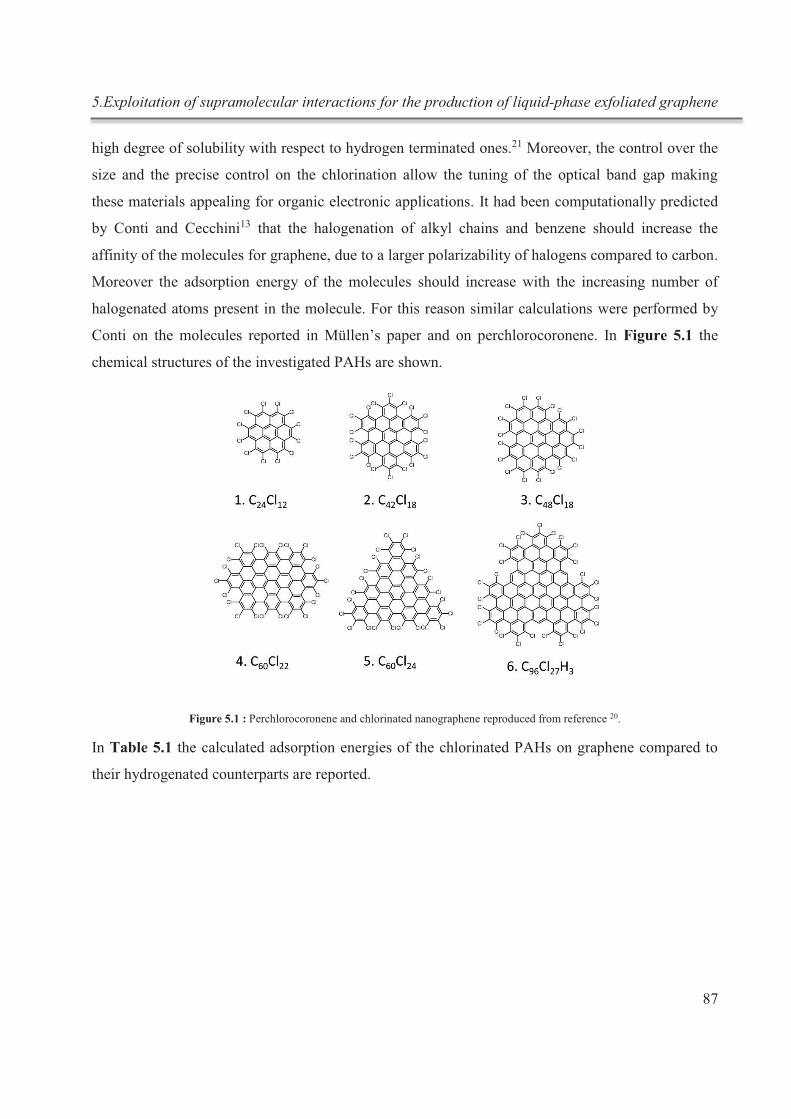
5.Exploitation of supramolecular interactions for the production of liquid-phase exfoliated graphene
87
high degree of solubility with respect to hydrogen terminated ones.21 Moreover, the control over the
size and the precise control on the chlorination allow the tuning of the optical band gap making
these materials appealing for organic electronic applications. It had been computationally predicted
by Conti and Cecchini13 that the halogenation of alkyl chains and benzene should increase the
affinity of the molecules for graphene, due to a larger polarizability of halogens compared to carbon.
Moreover the adsorption energy of the molecules should increase with the increasing number of
halogenated atoms present in the molecule. For this reason similar calculations were performed by
Conti on the molecules reported in Müllen’s paper and on perchlorocoronene. In Figure 5.1 the
chemical structures of the investigated PAHs are shown.
Figure 5.1 : Perchlorocoronene and chlorinated nanographene reproduced from reference 20.
In Table 5.1 the calculated adsorption energies of the chlorinated PAHs on graphene compared to
their hydrogenated counterparts are reported.
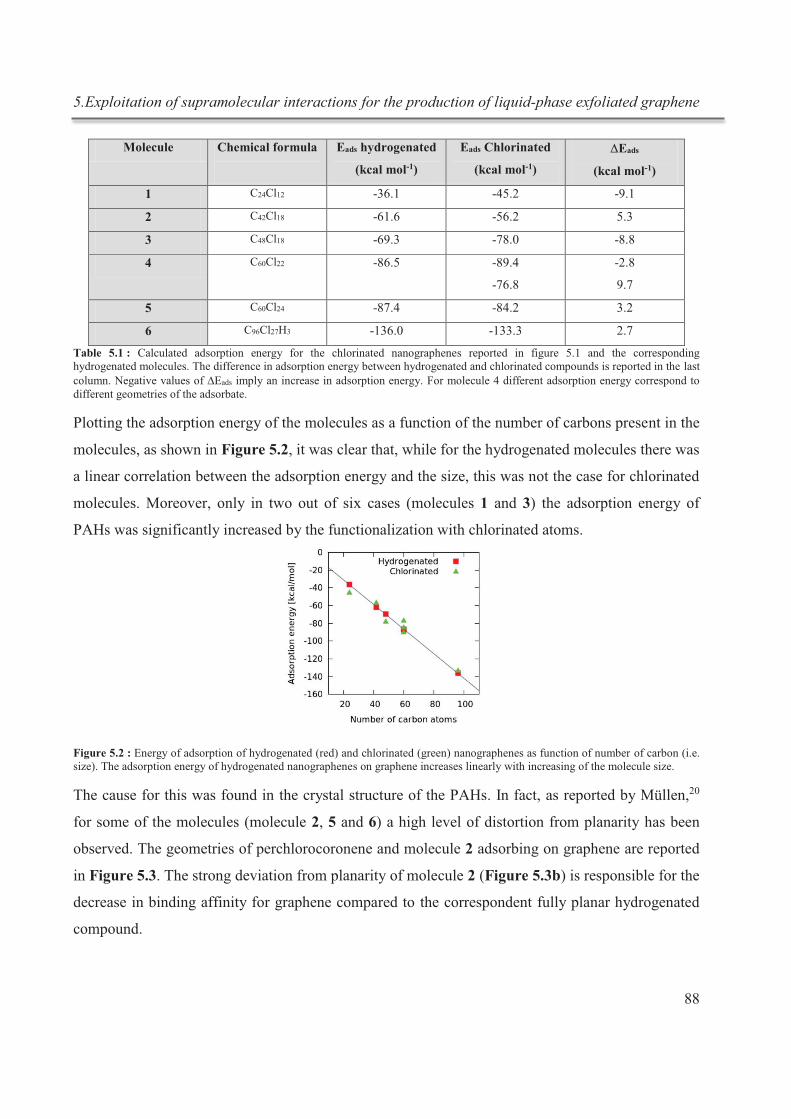
5.Exploitation of supramolecular interactions for the production of liquid-phase exfoliated graphene
88
Molecule Chemical formula
Eads hydrogenated
(kcal mol-1)
Eads Chlorinated
(kcal mol-1)
DEads
(kcal mol-1)
1 C24Cl12 -36.1 -45.2 -9.1
2 C42Cl18 -61.6 -56.2 5.3
3 C48Cl18 -69.3 -78.0 -8.8
4 C60Cl22 -86.5 -89.4
-76.8
-2.8
9.7
5 C60Cl24 -87.4 -84.2 3.2
6 C96Cl27H3 -136.0 -133.3 2.7
Table 5.1 : Calculated adsorption energy for the chlorinated nanographenes reported in figure 5.1 and the corresponding hydrogenated molecules. The difference in adsorption energy between hydrogenated and chlorinated compounds is reported in the last column. Negative values of DEads imply an increase in adsorption energy. For molecule 4 different adsorption energy correspond to different geometries of the adsorbate.
Plotting the adsorption energy of the molecules as a function of the number of carbons present in the
molecules, as shown in Figure 5.2, it was clear that, while for the hydrogenated molecules there was
a linear correlation between the adsorption energy and the size, this was not the case for chlorinated
molecules. Moreover, only in two out of six cases (molecules 1 and 3) the adsorption energy of
PAHs was significantly increased by the functionalization with chlorinated atoms.
Figure 5.2 : Energy of adsorption of hydrogenated (red) and chlorinated (green) nanographenes as function of number of carbon (i.e. size). The adsorption energy of hydrogenated nanographenes on graphene increases linearly with increasing of the molecule size.
The cause for this was found in the crystal structure of the PAHs. In fact, as reported by Müllen,20
for some of the molecules (molecule 2, 5 and 6) a high level of distortion from planarity has been
observed. The geometries of perchlorocoronene and molecule 2 adsorbing on graphene are reported
in Figure 5.3. The strong deviation from planarity of molecule 2 (Figure 5.3b) is responsible for the
decrease in binding affinity for graphene compared to the correspondent fully planar hydrogenated
compound.
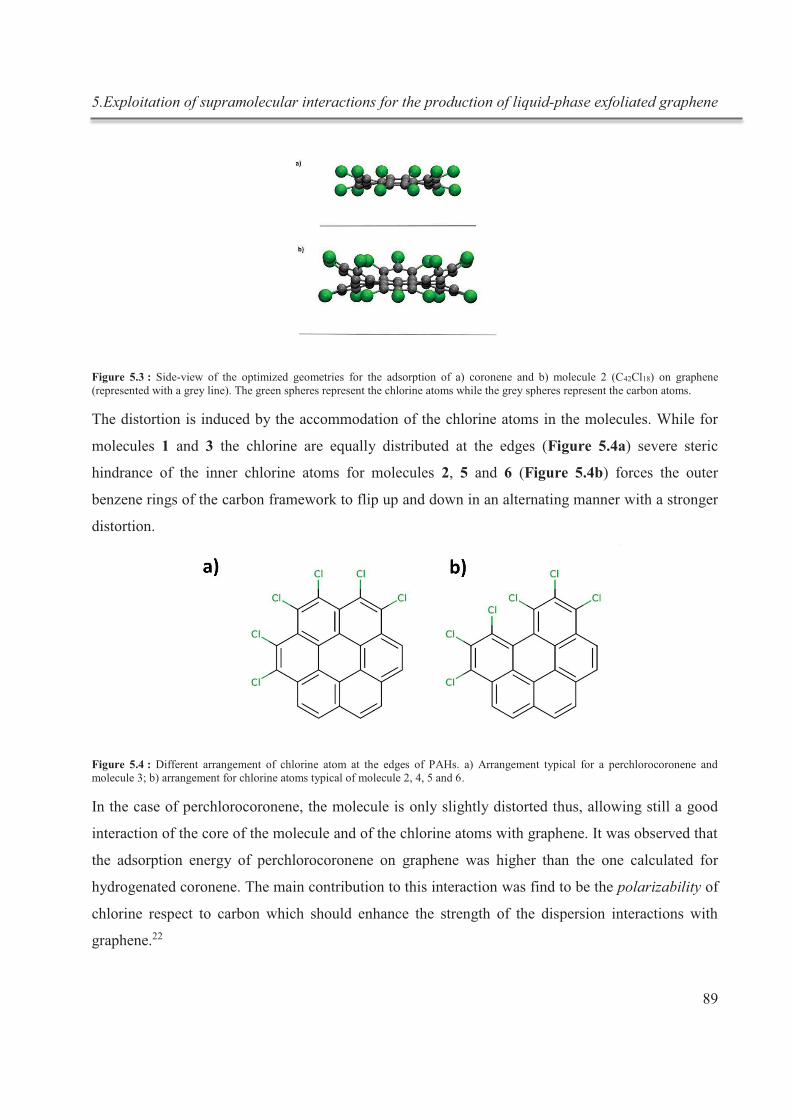
5.Exploitation of supramolecular interactions for the production of liquid-phase exfoliated graphene
89
Figure 5.3 : Side-view of the optimized geometries for the adsorption of a) coronene and b) molecule 2 (C42Cl18) on graphene (represented with a grey line). The green spheres represent the chlorine atoms while the grey spheres represent the carbon atoms.
The distortion is induced by the accommodation of the chlorine atoms in the molecules. While for
molecules 1 and 3 the chlorine are equally distributed at the edges (Figure 5.4a) severe steric
hindrance of the inner chlorine atoms for molecules 2, 5 and 6 (Figure 5.4b) forces the outer
benzene rings of the carbon framework to flip up and down in an alternating manner with a stronger
distortion.
Figure 5.4 : Different arrangement of chlorine atom at the edges of PAHs. a) Arrangement typical for a perchlorocoronene and molecule 3; b) arrangement for chlorine atoms typical of molecule 2, 4, 5 and 6.
In the case of perchlorocoronene, the molecule is only slightly distorted thus, allowing still a good
interaction of the core of the molecule and of the chlorine atoms with graphene. It was observed that
the adsorption energy of perchlorocoronene on graphene was higher than the one calculated for
hydrogenated coronene. The main contribution to this interaction was find to be the polarizability of
chlorine respect to carbon which should enhance the strength of the dispersion interactions with
graphene.22
5.Exploitation of supramolecular interactions for the production of liquid-phase exfoliated graphene
90
We decided to employ perchlorocoronene and coronene as exfoliating agents in order to find out if
the difference in adsorption energy on graphene could be translated in a difference in the quality and
quantity of the exfoliation outcome. Among all the chlorinated/hydrogenated pairs studied, we
specifically chose this couple in view of the higher solubility of this molecule due to the small size.
Exfoliation
To test the effective improvement given by the presence of coronene and perchlorocoronene in the
exfoliation process, we prepared LPE dispersions by adding in a vial graphite powder in orto-
dichlorobenzene (o-DCB) solvent in presence of the two PAHs. o-DCB was chosen due to the good
solubility of both coronene and perchlorocoronene in this solvent. Moreover blank experiments, i.e.
dispersions prepared in absence of surfactants were performed. The calculation of the approximate
amount of molecules to add for the exfoliation was made on the assumption that graphite powder is
a single rectangular graphene sheet with area Sgraphene. Scanning tunneling microscopy (STM)
studies were reported in literature23 on the coronene self-assembly on highly oriented pyrolytic
graphite (HOPG) revealing that this molecules adopt a supramolecular structure characterized by a
6-fold geometry and the area occupied by each coronene molecule is 1.09±0.19 nm2.
From this we calculated the mass of molecules necessary to form a densely packed
monolayer on graphene as:
where:
being =0.052±0.004 nm2 the unit cell of graphene, the mass of carbon,
the molecular weight of the coronene and perchlorocoronene, the mass of graphite
and the Avogadro number. Despite several attempts to perform STM of perchlorocoronene on
HOPG no clear evidence of the self-assembly of the chlorinated molecules was obtained. Therefore
we used for our calculations the same unit cell of simple coronene. In Table 5.2 the quantities of
material employed are reported. Given that the effective surface area of graphene is much less than
the unreal hypothesis of a single graphene sheet, we used only 2% of molecules needed to cover the
“ideal” graphene surface.
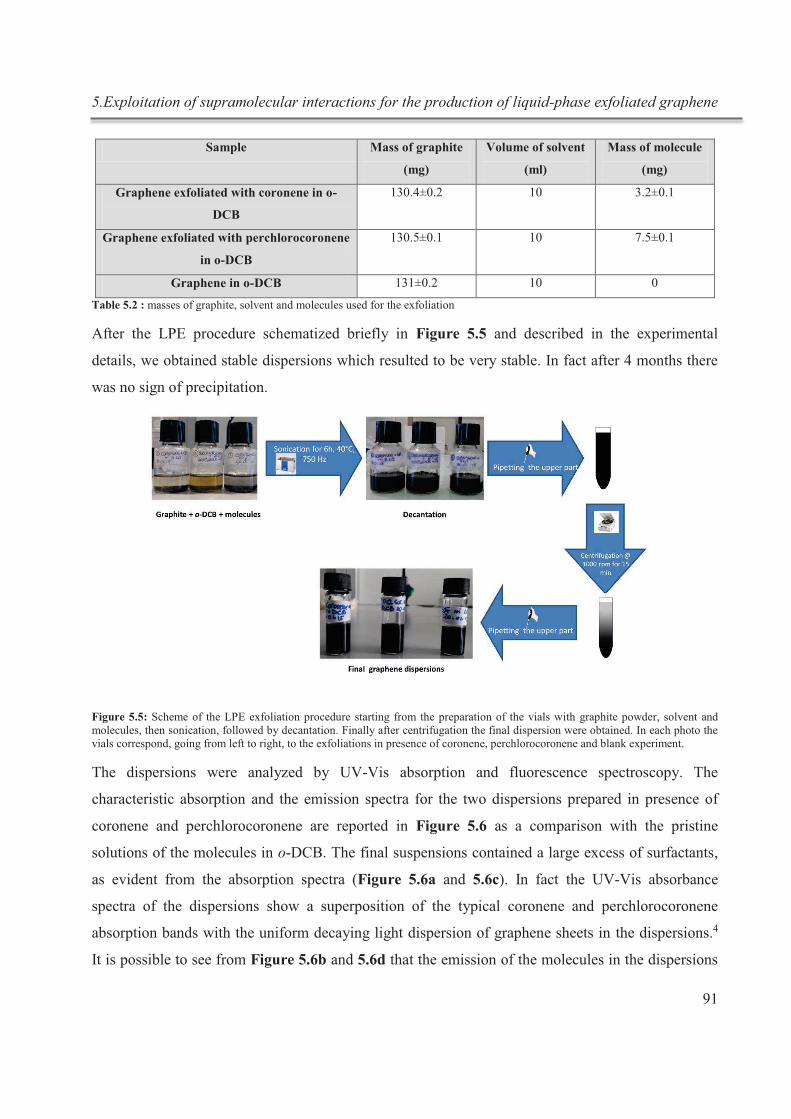
5.Exploitation of supramolecular interactions for the production of liquid-phase exfoliated graphene
91
Sample Mass of graphite
(mg)
Volume of solvent
(ml)
Mass of molecule
(mg)
Graphene exfoliated with coronene in o-
DCB
130.4±0.2 10 3.2±0.1
Graphene exfoliated with perchlorocoronene
in o-DCB
130.5±0.1 10 7.5±0.1
Graphene in o-DCB 131±0.2 10 0
Table 5.2 : masses of graphite, solvent and molecules used for the exfoliation
After the LPE procedure schematized briefly in Figure 5.5 and described in the experimental
details, we obtained stable dispersions which resulted to be very stable. In fact after 4 months there
was no sign of precipitation.
Figure 5.5: Scheme of the LPE exfoliation procedure starting from the preparation of the vials with graphite powder, solvent and molecules, then sonication, followed by decantation. Finally after centrifugation the final dispersion were obtained. In each photo the vials correspond, going from left to right, to the exfoliations in presence of coronene, perchlorocoronene and blank experiment.
The dispersions were analyzed by UV-Vis absorption and fluorescence spectroscopy. The
characteristic absorption and the emission spectra for the two dispersions prepared in presence of
coronene and perchlorocoronene are reported in Figure 5.6 as a comparison with the pristine
solutions of the molecules in o-DCB. The final suspensions contained a large excess of surfactants,
as evident from the absorption spectra (Figure 5.6a and 5.6c). In fact the UV-Vis absorbance
spectra of the dispersions show a superposition of the typical coronene and perchlorocoronene
absorption bands with the uniform decaying light dispersion of graphene sheets in the dispersions.4
It is possible to see from Figure 5.6b and 5.6d that the emission of the molecules in the dispersions
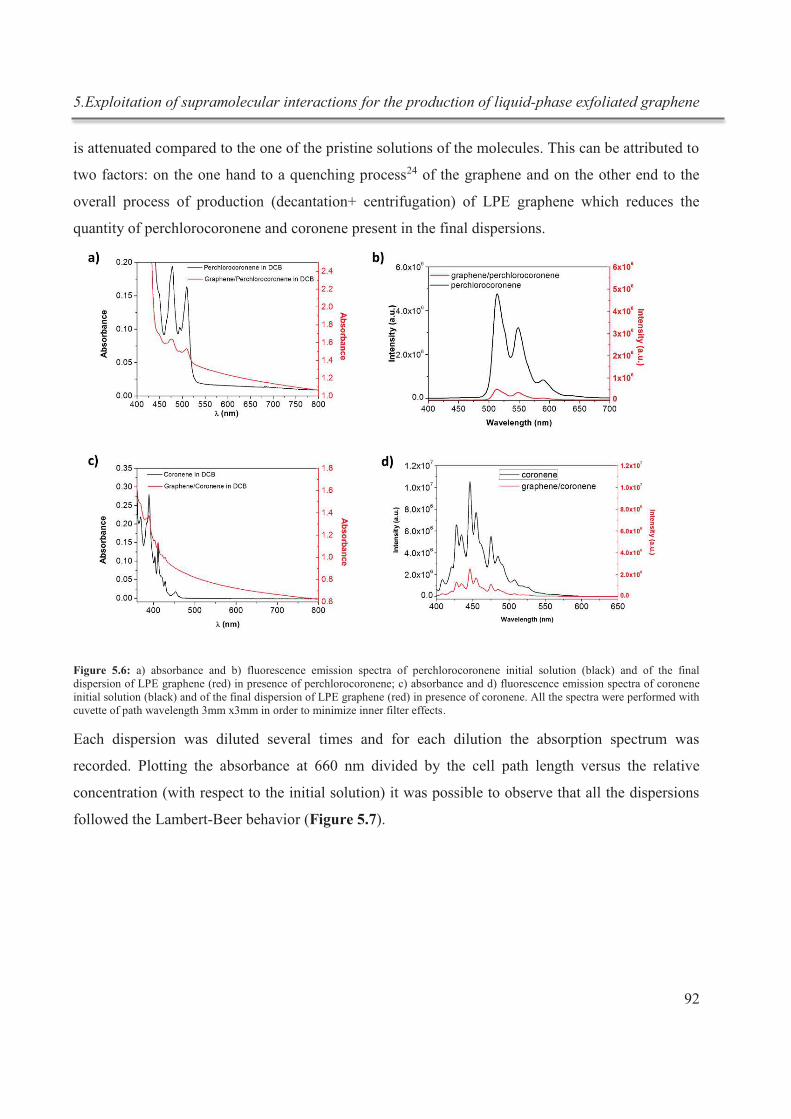
5.Exploitation of supramolecular interactions for the production of liquid-phase exfoliated graphene
92
is attenuated compared to the one of the pristine solutions of the molecules. This can be attributed to
two factors: on the one hand to a quenching process24 of the graphene and on the other end to the
overall process of production (decantation+ centrifugation) of LPE graphene which reduces the
quantity of perchlorocoronene and coronene present in the final dispersions.
Figure 5.6: a) absorbance and b) fluorescence emission spectra of perchlorocoronene initial solution (black) and of the final dispersion of LPE graphene (red) in presence of perchlorocoronene; c) absorbance and d) fluorescence emission spectra of coronene initial solution (black) and of the final dispersion of LPE graphene (red) in presence of coronene. All the spectra were performed with cuvette of path wavelength 3mm x3mm in order to minimize inner filter effects.
Each dispersion was diluted several times and for each dilution the absorption spectrum was
recorded. Plotting the absorbance at 660 nm divided by the cell path length versus the relative
concentration (with respect to the initial solution) it was possible to observe that all the dispersions
followed the Lambert-Beer behavior (Figure 5.7).
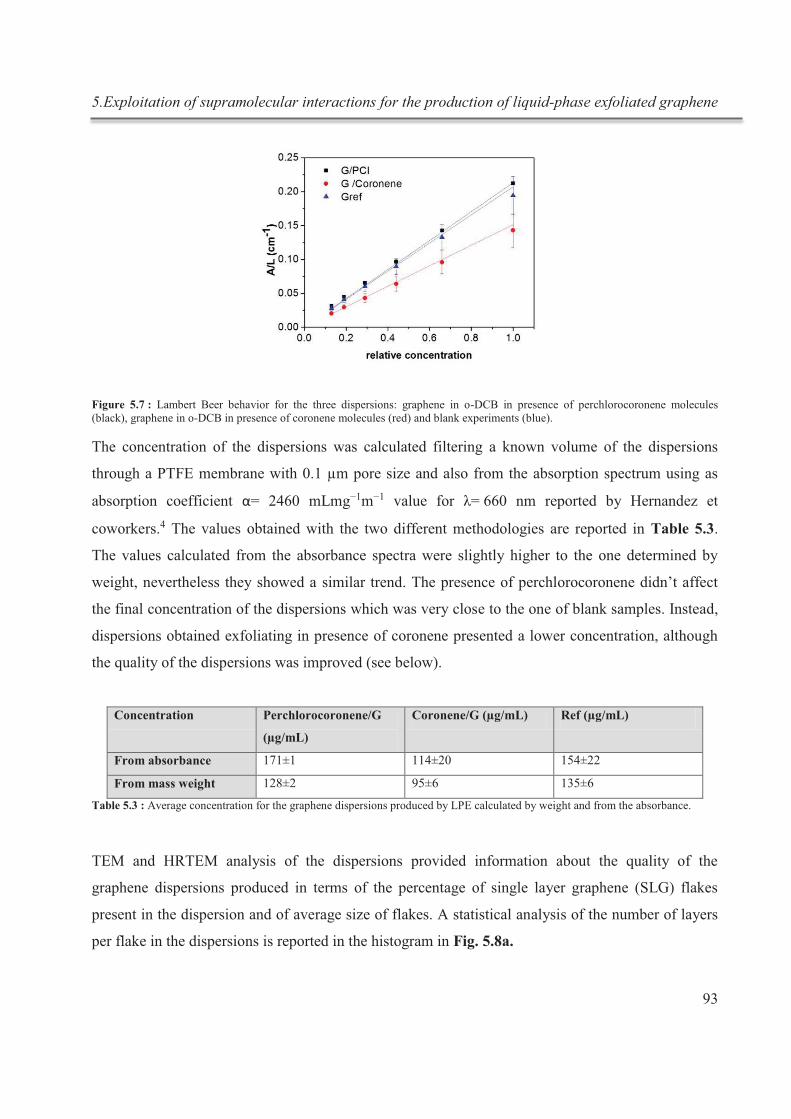
5.Exploitation of supramolecular interactions for the production of liquid-phase exfoliated graphene
93
Figure 5.7 : Lambert Beer behavior for the three dispersions: graphene in o-DCB in presence of perchlorocoronene molecules (black), graphene in o-DCB in presence of coronene molecules (red) and blank experiments (blue).
The concentration of the dispersions was calculated filtering a known volume of the dispersions
through a PTFE membrane with 0.1 µm pore size and also from the absorption spectrum using as
absorption coefficient α= 2460 mLmg−1m−1 value for λ= 660 nm reported by Hernandez et
coworkers.4 The values obtained with the two different methodologies are reported in Table 5.3.
The values calculated from the absorbance spectra were slightly higher to the one determined by
weight, nevertheless they showed a similar trend. The presence of perchlorocoronene didn’t affect
the final concentration of the dispersions which was very close to the one of blank samples. Instead,
dispersions obtained exfoliating in presence of coronene presented a lower concentration, although
the quality of the dispersions was improved (see below).
Concentration Perchlorocoronene/G
(µg/mL)
Coronene/G (µg/mL) Ref (µg/mL)
From absorbance 171±1 114±20 154±22
From mass weight 128±2 95±6 135±6
Table 5.3 : Average concentration for the graphene dispersions produced by LPE calculated by weight and from the absorbance.
TEM and HRTEM analysis of the dispersions provided information about the quality of the
graphene dispersions produced in terms of the percentage of single layer graphene (SLG) flakes
present in the dispersion and of average size of flakes. A statistical analysis of the number of layers
per flake in the dispersions is reported in the histogram in Fig. 5.8a.
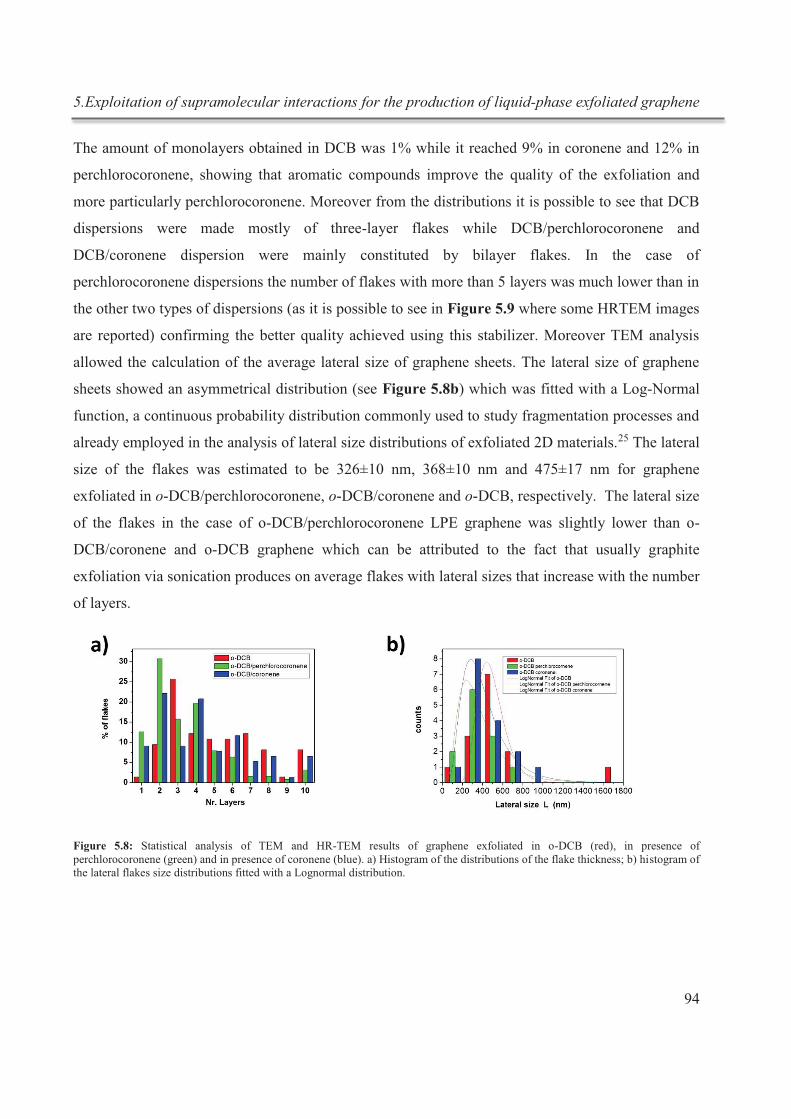
5.Exploitation of supramolecular interactions for the production of liquid-phase exfoliated graphene
94
The amount of monolayers obtained in DCB was 1% while it reached 9% in coronene and 12% in
perchlorocoronene, showing that aromatic compounds improve the quality of the exfoliation and
more particularly perchlorocoronene. Moreover from the distributions it is possible to see that DCB
dispersions were made mostly of three-layer flakes while DCB/perchlorocoronene and
DCB/coronene dispersion were mainly constituted by bilayer flakes. In the case of
perchlorocoronene dispersions the number of flakes with more than 5 layers was much lower than in
the other two types of dispersions (as it is possible to see in Figure 5.9 where some HRTEM images
are reported) confirming the better quality achieved using this stabilizer. Moreover TEM analysis
allowed the calculation of the average lateral size of graphene sheets. The lateral size of graphene
sheets showed an asymmetrical distribution (see Figure 5.8b) which was fitted with a Log-Normal
function, a continuous probability distribution commonly used to study fragmentation processes and
already employed in the analysis of lateral size distributions of exfoliated 2D materials.25 The lateral
size of the flakes was estimated to be 326±10 nm, 368±10 nm and 475±17 nm for graphene
exfoliated in o-DCB/perchlorocoronene, o-DCB/coronene and o-DCB, respectively. The lateral size
of the flakes in the case of o-DCB/perchlorocoronene LPE graphene was slightly lower than o-
DCB/coronene and o-DCB graphene which can be attributed to the fact that usually graphite
exfoliation via sonication produces on average flakes with lateral sizes that increase with the number
of layers.
Figure 5.8: Statistical analysis of TEM and HR-TEM results of graphene exfoliated in o-DCB (red), in presence of perchlorocoronene (green) and in presence of coronene (blue). a) Histogram of the distributions of the flake thickness; b) histogram of the lateral flakes size distributions fitted with a Lognormal distribution.
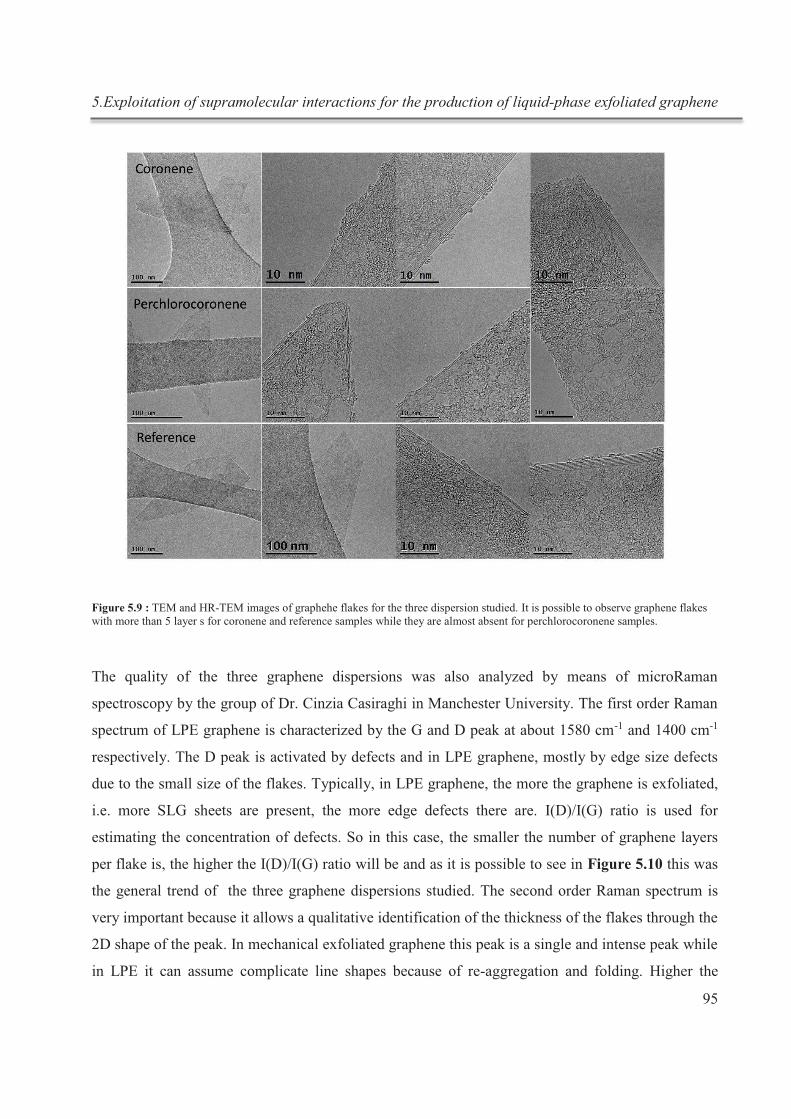
5.Exploitation of supramolecular interactions for the production of liquid-phase exfoliated graphene
95
Figure 5.9 : TEM and HR-TEM images of graphehe flakes for the three dispersion studied. It is possible to observe graphene flakes with more than 5 layer s for coronene and reference samples while they are almost absent for perchlorocoronene samples.
The quality of the three graphene dispersions was also analyzed by means of microRaman
spectroscopy by the group of Dr. Cinzia Casiraghi in Manchester University. The first order Raman
spectrum of LPE graphene is characterized by the G and D peak at about 1580 cm-1 and 1400 cm-1
respectively. The D peak is activated by defects and in LPE graphene, mostly by edge size defects
due to the small size of the flakes. Typically, in LPE graphene, the more the graphene is exfoliated,
i.e. more SLG sheets are present, the more edge defects there are. I(D)/I(G) ratio is used for
estimating the concentration of defects. So in this case, the smaller the number of graphene layers
per flake is, the higher the I(D)/I(G) ratio will be and as it is possible to see in Figure 5.10 this was
the general trend of the three graphene dispersions studied. The second order Raman spectrum is
very important because it allows a qualitative identification of the thickness of the flakes through the
2D shape of the peak. In mechanical exfoliated graphene this peak is a single and intense peak while
in LPE it can assume complicate line shapes because of re-aggregation and folding. Higher the
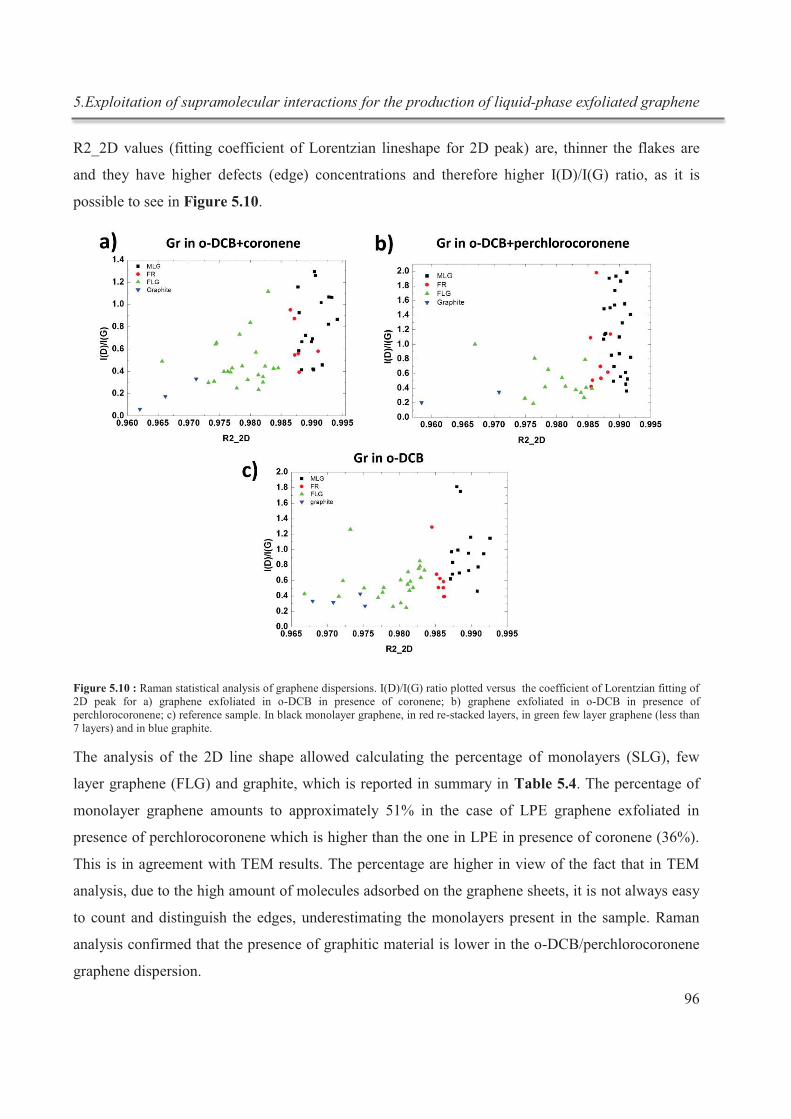
5.Exploitation of supramolecular interactions for the production of liquid-phase exfoliated graphene
96
R2_2D values (fitting coefficient of Lorentzian lineshape for 2D peak) are, thinner the flakes are
and they have higher defects (edge) concentrations and therefore higher I(D)/I(G) ratio, as it is
possible to see in Figure 5.10.
Figure 5.10 : Raman statistical analysis of graphene dispersions. I(D)/I(G) ratio plotted versus the coefficient of Lorentzian fitting of 2D peak for a) graphene exfoliated in o-DCB in presence of coronene; b) graphene exfoliated in o-DCB in presence of perchlorocoronene; c) reference sample. In black monolayer graphene, in red re-stacked layers, in green few layer graphene (less than 7 layers) and in blue graphite.
The analysis of the 2D line shape allowed calculating the percentage of monolayers (SLG), few
layer graphene (FLG) and graphite, which is reported in summary in Table 5.4. The percentage of
monolayer graphene amounts to approximately 51% in the case of LPE graphene exfoliated in
presence of perchlorocoronene which is higher than the one in LPE in presence of coronene (36%).
This is in agreement with TEM results. The percentage are higher in view of the fact that in TEM
analysis, due to the high amount of molecules adsorbed on the graphene sheets, it is not always easy
to count and distinguish the edges, underestimating the monolayers present in the sample. Raman
analysis confirmed that the presence of graphitic material is lower in the o-DCB/perchlorocoronene
graphene dispersion.
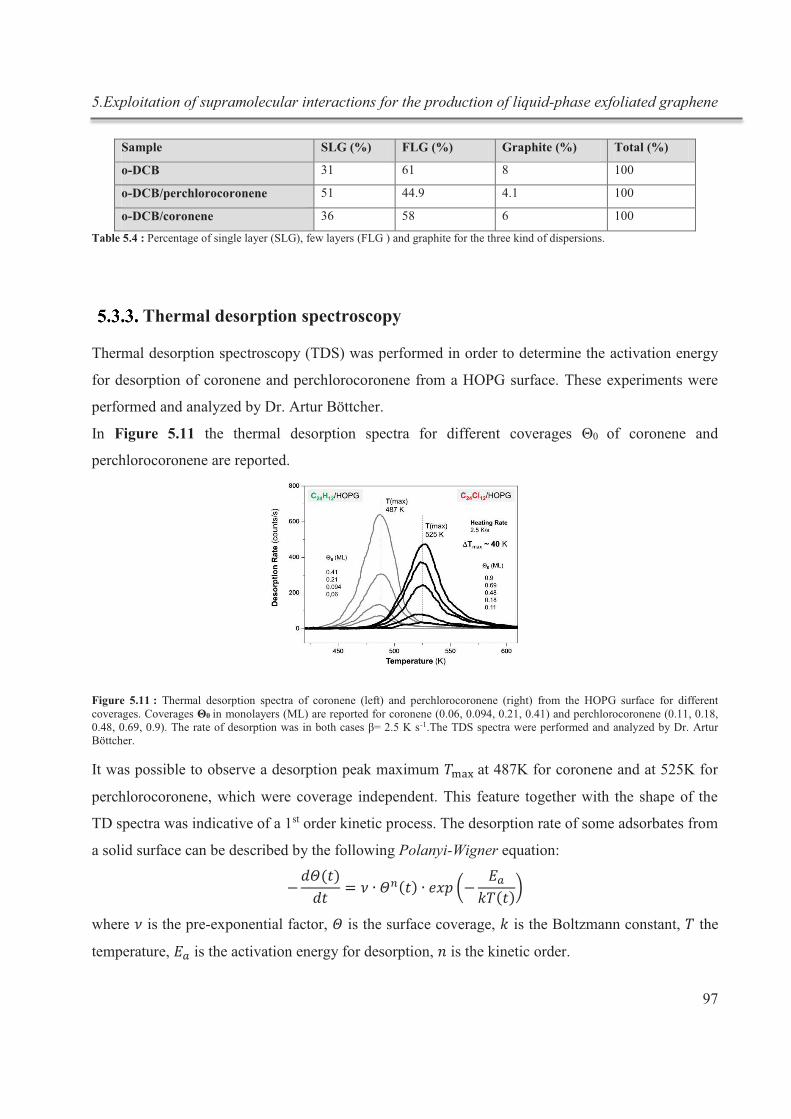
5.Exploitation of supramolecular interactions for the production of liquid-phase exfoliated graphene
97
Sample SLG (%) FLG (%) Graphite (%) Total (%)
o-DCB 31 61 8 100
o-DCB/perchlorocoronene 51 44.9 4.1 100
o-DCB/coronene 36 58 6 100
Table 5.4 : Percentage of single layer (SLG), few layers (FLG ) and graphite for the three kind of dispersions.
Thermal desorption spectroscopy
Thermal desorption spectroscopy (TDS) was performed in order to determine the activation energy
for desorption of coronene and perchlorocoronene from a HOPG surface. These experiments were
performed and analyzed by Dr. Artur Böttcher.
In Figure 5.11 the thermal desorption spectra for different coverages Θ0 of coronene and
perchlorocoronene are reported.
Figure 5.11 : Thermal desorption spectra of coronene (left) and perchlorocoronene (right) from the HOPG surface for different coverages. Coverages Θ0 in monolayers (ML) are reported for coronene (0.06, 0.094, 0.21, 0.41) and perchlorocoronene (0.11, 0.18, 0.48, 0.69, 0.9). The rate of desorption was in both cases β= 2.5 K s-1.The TDS spectra were performed and analyzed by Dr. Artur Böttcher.
It was possible to observe a desorption peak maximum at 487K for coronene and at 525K for
perchlorocoronene, which were coverage independent. This feature together with the shape of the
TD spectra was indicative of a 1st order kinetic process. The desorption rate of some adsorbates from
a solid surface can be described by the following Polanyi-Wigner equation:
where is the pre-exponential factor, is the surface coverage, is the Boltzmann constant, the
temperature, is the activation energy for desorption, is the kinetic order.
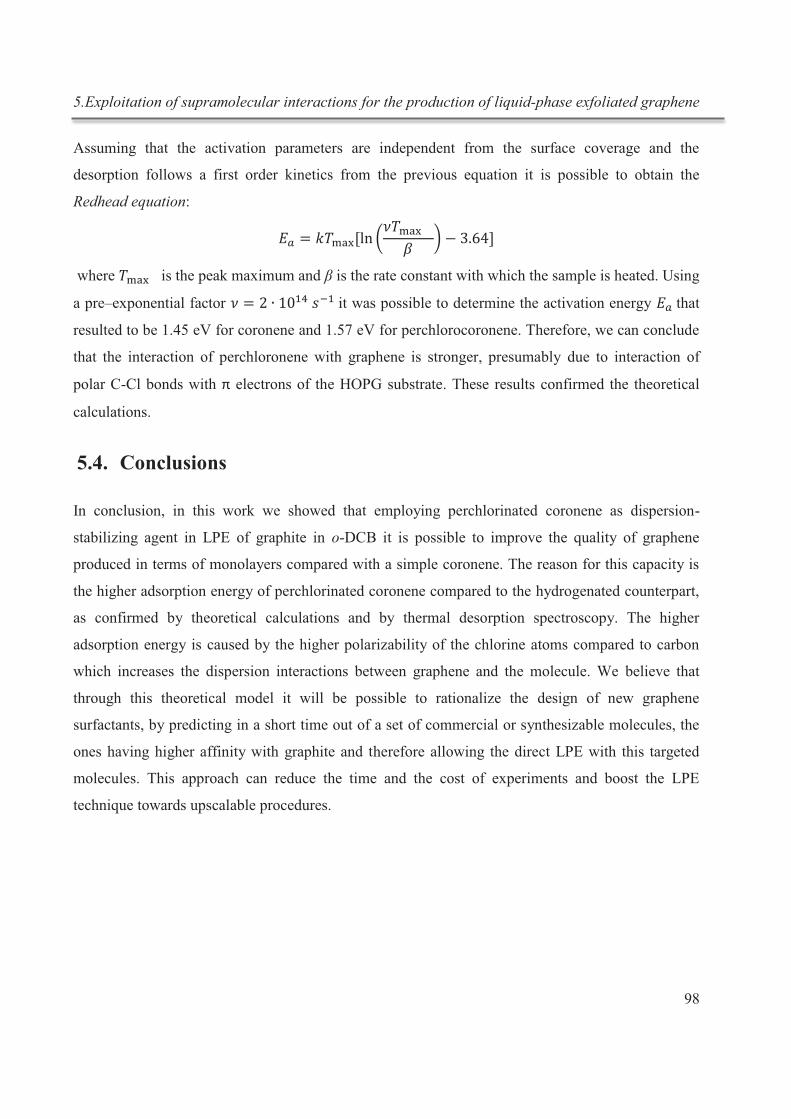
5.Exploitation of supramolecular interactions for the production of liquid-phase exfoliated graphene
98
Assuming that the activation parameters are independent from the surface coverage and the
desorption follows a first order kinetics from the previous equation it is possible to obtain the
Redhead equation:
where is the peak maximum and β is the rate constant with which the sample is heated. Using
a pre–exponential factor it was possible to determine the activation energy that
resulted to be 1.45 eV for coronene and 1.57 eV for perchlorocoronene. Therefore, we can conclude
that the interaction of perchloronene with graphene is stronger, presumably due to interaction of
polar C-Cl bonds with π electrons of the HOPG substrate. These results confirmed the theoretical
calculations.
5.4. Conclusions
In conclusion, in this work we showed that employing perchlorinated coronene as dispersion-
stabilizing agent in LPE of graphite in o-DCB it is possible to improve the quality of graphene
produced in terms of monolayers compared with a simple coronene. The reason for this capacity is
the higher adsorption energy of perchlorinated coronene compared to the hydrogenated counterpart,
as confirmed by theoretical calculations and by thermal desorption spectroscopy. The higher
adsorption energy is caused by the higher polarizability of the chlorine atoms compared to carbon
which increases the dispersion interactions between graphene and the molecule. We believe that
through this theoretical model it will be possible to rationalize the design of new graphene
surfactants, by predicting in a short time out of a set of commercial or synthesizable molecules, the
ones having higher affinity with graphite and therefore allowing the direct LPE with this targeted
molecules. This approach can reduce the time and the cost of experiments and boost the LPE
technique towards upscalable procedures.
5.Exploitation of supramolecular interactions for the production of liquid-phase exfoliated graphene
99
5.5. References
1. (a) Morozov, S. V.; Novoselov, K. S.; Katsnelson, M. I.; Schedin, F.; Elias, D. C.; Jaszczak, J. A.; Geim, A. K., Giant intrinsic carrier mobilities in graphene and its bilayer. Phys Rev Lett 2008, 100 (1), 016602; (b) Bolotin, K. I.; Sikes, K. J.; Jiang, Z.; Klima, M.; Fudenberg, G.; Hone, J.; Kim, P.; Stormer, H. L., Ultrahigh electron mobility in suspended graphene. Solid State Commun. 2008, 146 (9–10), 351-355. 2. Frank, I. W.; Tanenbaum, D. M.; van der Zande, A. M.; McEuen, P. L., Mechanical properties of suspended graphene sheets. J. Vac. Sci. Technol., B 2007, 25 (6), 2558-2561. 3. Ciesielski, A.; Samorì, P., Graphene via sonication assisted liquid-phase exfoliation. Chem Soc Rev 2014, 43 (1), 381-98. 4. Hernandez, Y.; Nicolosi, V.; Lotya, M.; Blighe, F. M.; Sun, Z.; De, S.; McGovern, I. T.; Holland, B.; Byrne, M.; Gun'Ko, Y. K.; Boland, J. J.; Niraj, P.; Duesberg, G.; Krishnamurthy, S.; Goodhue, R.; Hutchison, J.; Scardaci, V.; Ferrari, A. C.; Coleman, J. N., High-yield production of graphene by liquid-phase exfoliation of graphite. Nat Nano
2008, 3 (9), 563-568. 5. Bonaccorso, F.; Lombardo, A.; Hasan, T.; Sun, Z.; Colombo, L.; Ferrari, A. C., Production and processing of graphene and 2d crystals. Mater. Today 2012, 15 (12), 564-589. 6. Ciesielski, A.; Samori, P., Graphene via sonication assisted liquid-phase exfoliation. Chem. Soc. Rev. 2014, 43 (1), 381-98. 7. Cravotto, G.; Cintas, P., Sonication-Assisted Fabrication and Post-Synthetic Modifications of Graphene-Like Materials. Chem.–Eur. J. 2010, 16 (18), 5246-5259. 8. (a) Liang, Y. T.; Hersam, M. C., Highly Concentrated Graphene Solutions via Polymer Enhanced Solvent Exfoliation and Iterative Solvent Exchange. J. Am. Chem. Soc. 2010, 132 (50), 17661-17663; (b) Xu, L.; McGraw, J.-W.; Gao, F.; Grundy, M.; Ye, Z.; Gu, Z.; Shepherd, J. L., Production of High-Concentration Graphene Dispersions in Low-Boiling-Point Organic Solvents by Liquid-Phase Noncovalent Exfoliation of Graphite with a Hyperbranched Polyethylene and Formation of Graphene/Ethylene Copolymer Composites. J. Phys. Chem. C 2013, 117 (20), 10730-10742. 9. Schlierf, A.; Samorì, P.; Palermo, V., Graphene-organic composites for electronics: optical and electronic interactions in vacuum, liquids and thin solid films. J. Mater. Chem. C 2014, 2 (17), 3129-3143. 10. Ciesielski, A.; Haar, S.; El Gemayel, M.; Yang, H.; Clough, J.; Melinte, G.; Gobbi, M.; Orgiu, E.; Nardi, M. V.; Ligorio, G.; Palermo, V.; Koch, N.; Ersen, O.; Casiraghi, C.; Samorì, P., Harnessing the Liquid-Phase Exfoliation of Graphene Using Aliphatic Compounds: A Supramolecular Approach. Angew. Chem. Int. Ed. 2014, 53 (39), 10355-10361. 11. Bléger, D.; Kreher, D.; Mathevet, F.; Attias, A.-J.; Schull, G.; Huard, A.; Douillard, L.; Fiorini-Debuischert, C.; Charra, F., Surface Noncovalent Bonding for Rational Design of Hierarchical Molecular Self-Assemblies. Angew.
Chem. 2007, 119 (39), 7548-7551. 12. Haar, S.; Ciesielski, A.; Clough, J.; Yang, H.; Mazzaro, R.; Richard, F.; Conti, S.; Merstorf, N.; Cecchini, M.; Morandi, V.; Casiraghi, C.; Samorì, P., A Supramolecular Strategy to Leverage the Liquid-Phase Exfoliation of Graphene in the Presence of Surfactants: Unraveling the Role of the Length of Fatty Acids. Small 2015, 11 (14), 1691-1702. 13. Conti, S.; Cecchini, M., Accurate and Efficient Calculation of the Desorption Energy of Small Molecules from Graphene. J. Phys. Chem. C 2015, 119 (4), 1867-1879. 14. Cioslowski, J.; Liu, G. H.; Moncrieff, D., Theoretical thermochemistry of homolytic C-C and C-Cl bond dissociations in unbranched perchloroalkanes. J. Phys. Chem. A 1998, 102 (48), 9965-9969. 15. (a) Schlierf, A.; Yang, H.; Gebremedhn, E.; Treossi, E.; Ortolani, L.; Chen, L.; Minoia, A.; Morandi, V.; Samori, P.; Casiraghi, C.; Beljonne, D.; Palermo, V., Nanoscale insight into the exfoliation mechanism of graphene with organic dyes: effect of charge, dipole and molecular structure. Nanoscale 2013, 5 (10), 4205-4216; (b) Yang, H.; Hernandez, Y.; Schlierf, A.; Felten, A.; Eckmann, A.; Johal, S.; Louette, P.; Pireaux, J. J.; Feng, X.; Müllen, K.; Palermo, V.; Casiraghi, C., A simple method for graphene production based on exfoliation of graphite in water using 1-pyrenesulfonic acid sodium salt. Carbon 2013, 53, 357-365; (c) Schlierf, A.; Cha, K.; Schwab, M. G.; Samorì, P.; Palermo, V., Exfoliation of graphene with an industrial dye: teaching an old dog new tricks. 2D Mater. 2014, 1 (3), 035006. 16. Randić, M., Aromaticity of Polycyclic Conjugated Hydrocarbons. Chem. Rev. 2003, 103 (9), 3449-3606. 17. Vanommeslaeghe, K.; Hatcher, E.; Acharya, C.; Kundu, S.; Zhong, S.; Shim, J.; Darian, E.; Guvench, O.; Lopes, P.; Vorobyov, I.; Mackerell, A. D., CHARMM general force field: A force field for drug-like molecules compatible with the CHARMM all-atom additive biological force fields. J. Comput. Chem. 2010, 31 (4), 671-690.
5.Exploitation of supramolecular interactions for the production of liquid-phase exfoliated graphene
100
18. (a) Vanommeslaeghe, K.; MacKerell, A. D., Automation of the CHARMM General Force Field (CGenFF) I: Bond Perception and Atom Typing. J. Chem. Inf. Model. 2012, 52 (12), 3144-3154; (b) Vanommeslaeghe, K.; Raman, E. P.; MacKerell, A. D., Automation of the CHARMM General Force Field (CGenFF) II: Assignment of Bonded Parameters and Partial Atomic Charges. J. Chem. Inf. Model. 2012, 52 (12), 3155-3168. 19. Brooks, B. R.; Brooks, C. L.; Mackerell, A. D.; Nilsson, L.; Petrella, R. J.; Roux, B.; Won, Y.; Archontis, G.; Bartels, C.; Boresch, S.; Caflisch, A.; Caves, L.; Cui, Q.; Dinner, A. R.; Feig, M.; Fischer, S.; Gao, J.; Hodoscek, M.; Im, W.; Kuczera, K.; Lazaridis, T.; Ma, J.; Ovchinnikov, V.; Paci, E.; Pastor, R. W.; Post, C. B.; Pu, J. Z.; Schaefer, M.; Tidor, B.; Venable, R. M.; Woodcock, H. L.; Wu, X.; Yang, W.; York, D. M.; Karplus, M., CHARMM: The biomolecular simulation program. J. Comput. Chem. 2009, 30 (10), 1545-1614. 20. Tan, Y.-Z.; Yang, B.; Parvez, K.; Narita, A.; Osella, S.; Beljonne, D.; Feng, X.; Müllen, K., Atomically precise edge chlorination of nanographenes and its application in graphene nanoribbons. Nat Commun 2013, 4. 21. Hughes, J. M.; Hernandez, Y.; Aherne, D.; Doessel, L.; Müllen, K.; Moreton, B.; White, T. W.; Partridge, C.; Costantini, G.; Shmeliov, A.; Shannon, M.; Nicolosi, V.; Coleman, J. N., High Quality Dispersions of Hexabenzocoronene in Organic Solvents. J. Am. Chem. Soc. 2012, 134 (29), 12168-12179. 22. Israelachvili, J., Intermolecular and Surface Forces, Third Edition. Academic Press: 2010. 23. Zhang, H.-X.; Chen, Q.; Wen, R.; Hu, J.-S.; Wan, L.-J., Effect of Polycyclic Aromatic Hydrocarbons on Detection Sensitivity of Ultratrace Nitroaromatic Compounds. Anal. Chem. 2007, 79 (5), 2179-2183. 24. Kim, J.; Cote, L. J.; Kim, F.; Huang, J., Visualizing Graphene Based Sheets by Fluorescence Quenching Microscopy. J. Am. Chem. Soc. 2010, 132 (1), 260-267. 25. Kouroupis-Agalou, K.; Liscio, A.; Treossi, E.; Ortolani, L.; Morandi, V.; Pugno, N. M.; Palermo, V., Fragmentation and exfoliation of 2-dimensional materials: a statistical approach. Nanoscale 2014, 6 (11), 5926-5933.
6.Preparation of optically switchable asymmetric electrodes: towards multifunctional devices
101
6. Preparation of optically switchable
asymmetric electrodes: towards
multifunctional devices
6.1. Introduction
In the past years the performances of organic field-effect transistors (OFETs) have improved
considerably through careful synthesis of ad-hoc organic/polymeric semiconductors, the control
over their self-assembly on surfaces via solution processing using sophisticated approaches, the
tailoring of all interfaces of a device via chemical functionalization and the optimization of the
energetics of all components reaching field-effect mobilities exceeding 45 cm2 V-1 s-1.1
Such high mobilities indeed require an optimal charge injection at the electrode-semiconductor
interface which can be achieved by tuning the Schottky barrier through a modification of the work
function of the electrodes.2 Among the various strategies employed to optimize the work function,
the functionalization of the electrodes with self-assembled monolayers (SAMs) of polar molecules is
particularly versatile considering the wide range of molecules available and their ability to modify
not only the electrode work function but also its wettability.3
Another great possibility of OFETs is the potential to incorporate stimuli responsive components
(light, magnetic field, environment), paving the way towards multi-responsive devices.4
It has been demonstrated that incorporation of photochromic molecules in the device can confer a
light responsive nature to OFETs, by modulation of different types of physico-chemical properties.5
Photochromic molecules are in fact extensively studied organic molecules which upon application
of specific light stimuli can undergo isomerization between at least two (meta)stable states, which
6.Preparation of optically switchable asymmetric electrodes: towards multifunctional devices
102
exhibit, in addition to different spectral features, very different chemico-physical properties at the
molecular level (refractive index, dielectric constant, oxidation/reduction potential, and geometrical
structure).6
For example upon blending the organic semiconductor with diarylethenes, a well-known class of
photochromic molecules, it is possible to modulate the charge transport by tuning the energy levels
of the molecule in the film by light irradiation at different wavelengths thereby creating/removing
traps from the semiconductor blend.7
The incorporation of photochromic molecules at the electrode-semiconductor interface by
functionalizing the electrode with a SAM comprising photochromic molecules allows instead a
tuning of the charge injection. It has been shown that by functionalizing source and drain electrodes
with an azobenzene SAM the injection can be modulated through a variation of the tunneling barrier
switching the molecule from the trans to the cis state and viceversa.8 Molecular junctions with a
SAM of diarylethene based-switches9 showed a modulation of the current upon light illumination,
due to a change in the conjugation of diarylethene from the open (not-conjugated) to the closed form
(conjugated form), which could let think to a possible application in OFETs.
Another further step in order to increase the number of tuning functionalities in the same device
could be the possibility to modulate in an independent way the injection of source and drain
electrode. Liscio et al. have demonstrated that an easy and potentially up-scalable way to
functionalize source and drain electrode pairs with two different SAMs is a three steps process
which involves the adsorption of the most stable SAM forming molecule on the gold electrodes, the
electrochemical desorption of the SAM from one of the two electrodes and the successive
adsorption of the second SAM on the gold electrode left exposed by desorption.10 In this way it is
possible to produce asymmetric electrode pairs having different charge injection properties.
In the present work we will show the possibility of combining the two strategies described above in
order to increase the possible switching combinations in the same device. We will demonstrate, in
particular, that it is possible to functionalize adjacent interdigitated electrodes with two different
photochromic SAMs by a process combining chemisorption and selective electrochemical
desorption. The molecules designed for this purpose belong to two different photochromic classes,
azobenzene and diarylethene.
Through UV-Vis absorption experiments of mixtures of the two photochromic molecules in solution
we will show the possibility of switching one type of molecule without affecting the other.
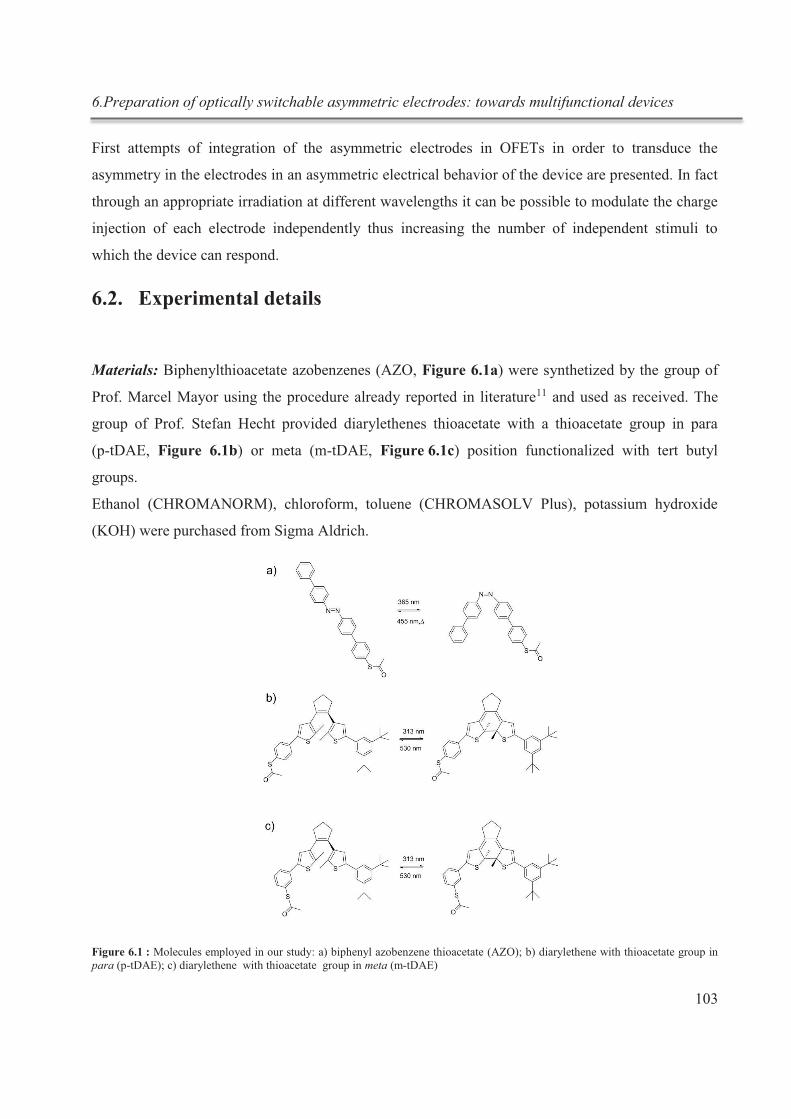
6.Preparation of optically switchable asymmetric electrodes: towards multifunctional devices
103
First attempts of integration of the asymmetric electrodes in OFETs in order to transduce the
asymmetry in the electrodes in an asymmetric electrical behavior of the device are presented. In fact
through an appropriate irradiation at different wavelengths it can be possible to modulate the charge
injection of each electrode independently thus increasing the number of independent stimuli to
which the device can respond.
6.2. Experimental details
Materials: Biphenylthioacetate azobenzenes (AZO, Figure 6.1a) were synthetized by the group of
Prof. Marcel Mayor using the procedure already reported in literature11 and used as received. The
group of Prof. Stefan Hecht provided diarylethenes thioacetate with a thioacetate group in para
(p-tDAE, Figure 6.1b) or meta (m-tDAE, Figure 6.1c) position functionalized with tert butyl
groups.
Ethanol (CHROMANORM), chloroform, toluene (CHROMASOLV Plus), potassium hydroxide
(KOH) were purchased from Sigma Aldrich.
Figure 6.1 : Molecules employed in our study: a) biphenyl azobenzene thioacetate (AZO); b) diarylethene with thioacetate group in para (p-tDAE); c) diarylethene with thioacetate group in meta (m-tDAE)
6.Preparation of optically switchable asymmetric electrodes: towards multifunctional devices
104
Preparation of the substrates: The interdigitated electrodes for desorption experiments and XPS
analysis were prepared evaporating on Sin++/SiO2 substrates (Fraunhofer institute) 1.5 nm of an
adhesion layer of chromium followed by 30 nm of gold using a shadow mask.
Semi-transparent substrates were prepared for UV-Vis absorption experiments evaporating 3 nm of
chromium followed by 15 nm of gold on quartz slides (SCIENCE SERVICES GmbH).
Semitransparent interdigitated electrodes were prepared in the same way by application of a shadow
mask.
Both Sin++/SiO2 and quartz substrate were cleaned by sonication in acetone, isopropanol and UV-
ozone treatment prior to use.
Substrates of epitaxial Au(111) (300 nm) on mica were purchased from Georg Albert PVD and
ozone treated prior to use.
Preparation of solutions for UV-Vis spectroscopy: 1.25×10⁻⁵ M solution of m-tDAE in opened
form in toluene was prepared drying the THF mother solution, adding toluene and diluting to the
desired concentration. A 1 mM solution of p-tDAE in chloroform was prepared in the same way. A
1.25 ×10⁻⁵ M solution of biphenyl-AZO in trans form was prepared from a 0.5 mM mother solution.
The mixed solution (1.25×10⁻⁵ M m-tDAE + 1.25×10⁻⁵ M biphenyl-AZO) in toluene is prepared
mixing two solution of DAE and AZO of doubled concentration in ratio 1:1.
Preparation of the Azobenzene SAMs:
In a 50 ml round bottom flask a small quantity (~ 0.25 mg) of byphenyl azobenzene and 20 mL of
ethanol are added. Byphenyl azobenzene is not soluble in ethanol at room temperature).
Immediately after a UV-Ozone cleaning treatment (5 min of ozone generation + 25 minutes of
incubation) the substrate is immersed in the flask and the flask is kept for 24 hours at 70 °C under
reflux in a dark environment. The azobenzene at this temperature partially dissolves in ethanol and a
SAM of biphenyl azobenzene molecules forms on the gold. The sample is then removed from the
flask, rinsed with warm ethanol and chloroform and sonicated for 15 minutes in chloroform in order
to be sure to have removed all the physisorbed molecules and crystals and dried under nitrogen flux.
Preparation of t-DAE SAM: The substrate is immersed in a 1 mM solution of t-DAE for at least 36
hours. Subsequently it is rinsed with warm ethanol, chloroform and dried under nitrogen flux.
6.Preparation of optically switchable asymmetric electrodes: towards multifunctional devices
105
UV-Vis experiments: UV-Vis absorbance spectra of solutions and SAMs were recorded with a UV-
Vis Jasco V-650 spectrophotometer. The spectra concerning the switching of the self-assembled
monolayers were recorded in nitrogen atmosphere irradiating the sample in-situ.
Irradiation was performed using the following light sources.
- LED with wavelength 310 ± 5 nm (UVTOP310 by Roithner Laser Technik Gmbh);
- UV lamp with centered wavelength 312 nm;
- Fiber coupled LEDs with wavelengths 365 nm, 455 nm, 530 nm (ThorLabs).
Electrochemical desorption experiments: The electrochemical desorption was performed with a
homemade set-up using a probe station and applying different potentials (using a Keithley 2636A
dual channel sourcemeter controlled by the associate software) from a gold tip connected to the
electrode using as counter electrode a gold coil and as electrolyte a 50mM solution of potassium
hydroxide in Ethanol.
XPS experiments: XPS analyses were carried out on a Thermo Scientific K-Alpha X-ray
photoelectron spectrometer with a base pressure of ~10-8 mbar and an Al anode as the X-ray source
(x-ray radiation of 1486 eV). Spot sizes between 30 µm and 400 µm were used. Survey spectra are
an average of 10 scans with a pass energy of 200.00 eV and a step size of 1 eV. High-resolution
spectra are an average of 10 scans (or even 50 or 100 when needed) with a pass energy of 50.00 eV
and a step size of 0.10 or 0.05 eV.
SEM characterization: SEM images were acquired with Quanta FEG(FEI®) using the secondary
electron detector with 5 kV acceleration.
Device fabrication: Semi-transparent interdigitated electrodes on quartz slides were prepared
evaporating 3 nm of chromium followed by 15 nm of gold (SCIENCE SERVICES GmbH) by
means of a shadow mask. In each sample there are 8 pairs of interdigitated electrodes with channel
lengths of 120, 100, 80 and 60 µm and channel width W=10000 µm.
After being ozone treated they underwent the procedure for the formation of an AZO SAM. Then,
for each pair of interdigitated electrodes an electrochemical desorption experiment was performed
on one of the two electrodes as described in detail in section 6.3.4. The substrate was then immersed
in a 1mM p-tDAE solution for 36 h. After cleaning, the substrates were transferred to the glovebox
6.Preparation of optically switchable asymmetric electrodes: towards multifunctional devices
106
and 520µl of a 5mg/ml solution of P(NDI2OD-T2) (purchased from Polyera) in chloroform were
spin coated on it. Then the sample was annealed at 60° for 2h and cooled down at room temperature.
Afterwards, 1020 µl of Cytop/Cytop-solvent (purchased from Asahi glass, code: CTL-809M)
solution in ratio 9/1 were deposited on top of the organic semiconductor and the sample was
annealed for 4 h at 70 °C. Profilometer measurements revealed that the average film thickness of
P(NDI2OD-T2) film was 60 nm while Cytop layer was 700 nm thick. Finally 100 nm of aluminum
were deposited on top as gate electrode. As reference samples also devices bearing AZO SAMs, p-
tDAE SAMs and monophenylthiol (MPT) SAMs on both electrodes were prepared. MPT SAM was
formed on the electrodes immersing the sample in a 5 mM solution of MPT in EtOH for 12 hours.
Samples without any functionalization of the electrodes were also prepared.
The electrical characterization was performed with a Keithley 2636A dual channel sourcemeter
controlled by the proprietary software.
Irradiation of devices was performed from the underside with a Polychrome V (Till Photonics)
tunable light source providing a monochromatic light beam (± 15 nm) for different wavelengths.
The device fabrication, the electrical characterization and the workfunction measurements were
performed in collaboration with Thomas Mosciatti.
6.3. Experimental results and discussion
Independent switching of AZO and tDAE in solution: proof of concept
The UV-Vis spectra of the switching in solution of m-tDAE, are reported in Figure 6.2.
The m-t DAE in the open form is characterized by the presence of a shoulder peak at 310 nm.
Irradiating at this wavelength it is possible to convert the open form to the fully conjugated closed
form which shows a peak in the visible region at ca. 530 nm and a double peak in the UV region at
ca. 365 nm. This form can be converted back to the open form just by irradiation with light in the
range of the band centered at 530 nm.
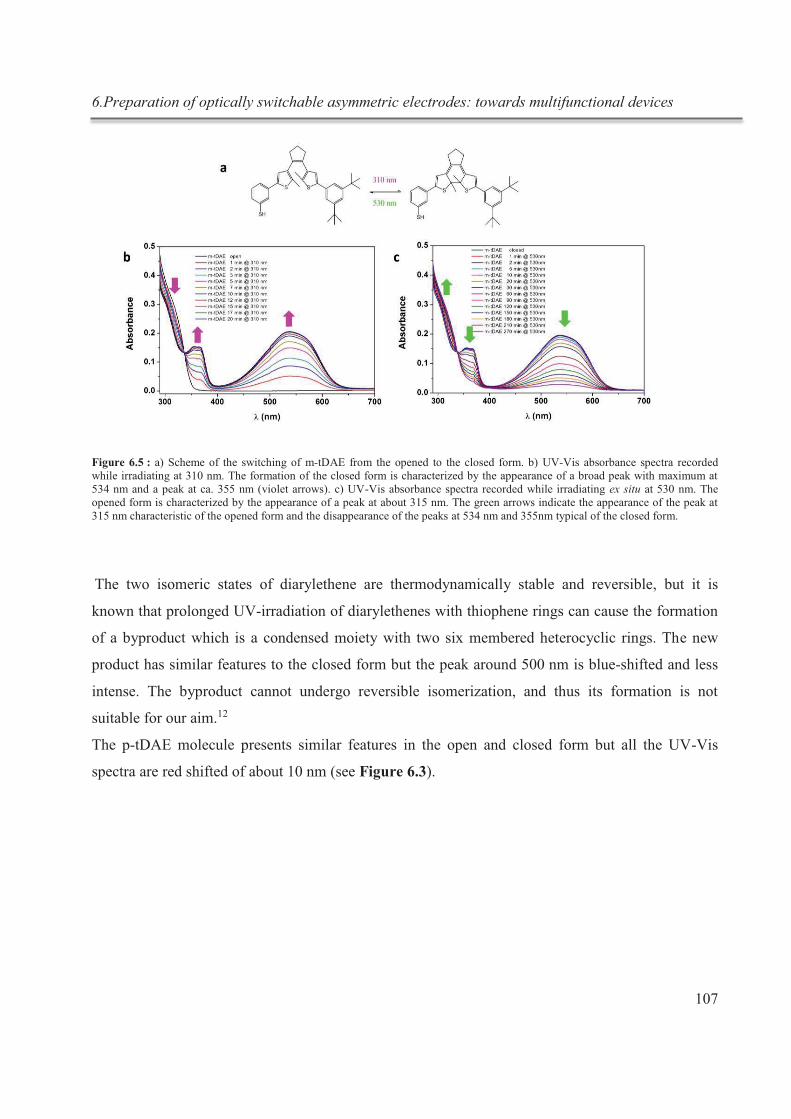
6.Preparation of optically switchable asymmetric electrodes: towards multifunctional devices
107
Figure 6.5 : a) Scheme of the switching of m-tDAE from the opened to the closed form. b) UV-Vis absorbance spectra recorded while irradiating at 310 nm. The formation of the closed form is characterized by the appearance of a broad peak with maximum at 534 nm and a peak at ca. 355 nm (violet arrows). c) UV-Vis absorbance spectra recorded while irradiating ex situ at 530 nm. The opened form is characterized by the appearance of a peak at about 315 nm. The green arrows indicate the appearance of the peak at 315 nm characteristic of the opened form and the disappearance of the peaks at 534 nm and 355nm typical of the closed form.
The two isomeric states of diarylethene are thermodynamically stable and reversible, but it is
known that prolonged UV-irradiation of diarylethenes with thiophene rings can cause the formation
of a byproduct which is a condensed moiety with two six membered heterocyclic rings. The new
product has similar features to the closed form but the peak around 500 nm is blue-shifted and less
intense. The byproduct cannot undergo reversible isomerization, and thus its formation is not
suitable for our aim.12
The p-tDAE molecule presents similar features in the open and closed form but all the UV-Vis
spectra are red shifted of about 10 nm (see Figure 6.3).
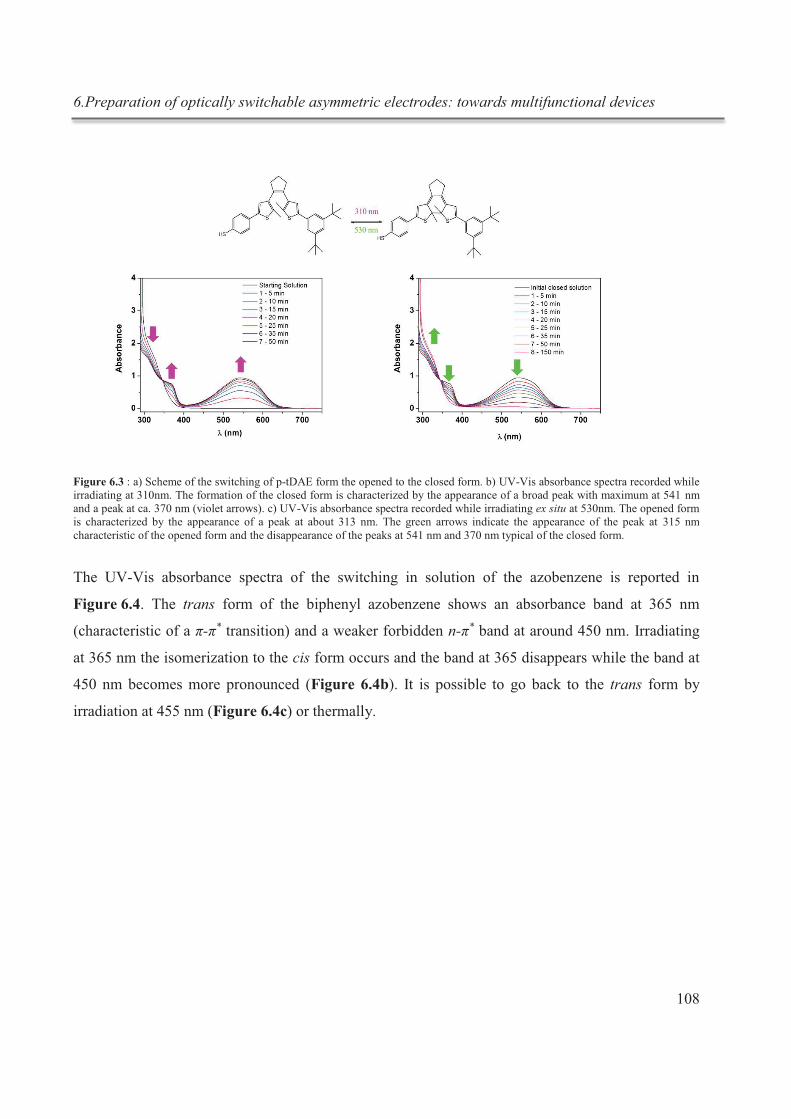
6.Preparation of optically switchable asymmetric electrodes: towards multifunctional devices
108
Figure 6.3 : a) Scheme of the switching of p-tDAE form the opened to the closed form. b) UV-Vis absorbance spectra recorded while irradiating at 310nm. The formation of the closed form is characterized by the appearance of a broad peak with maximum at 541 nm and a peak at ca. 370 nm (violet arrows). c) UV-Vis absorbance spectra recorded while irradiating ex situ at 530nm. The opened form is characterized by the appearance of a peak at about 313 nm. The green arrows indicate the appearance of the peak at 315 nm characteristic of the opened form and the disappearance of the peaks at 541 nm and 370 nm typical of the closed form.
The UV-Vis absorbance spectra of the switching in solution of the azobenzene is reported in
Figure 6.4. The trans form of the biphenyl azobenzene shows an absorbance band at 365 nm
(characteristic of a π-π* transition) and a weaker forbidden n-π* band at around 450 nm. Irradiating
at 365 nm the isomerization to the cis form occurs and the band at 365 disappears while the band at
450 nm becomes more pronounced (Figure 6.4b). It is possible to go back to the trans form by
irradiation at 455 nm (Figure 6.4c) or thermally.
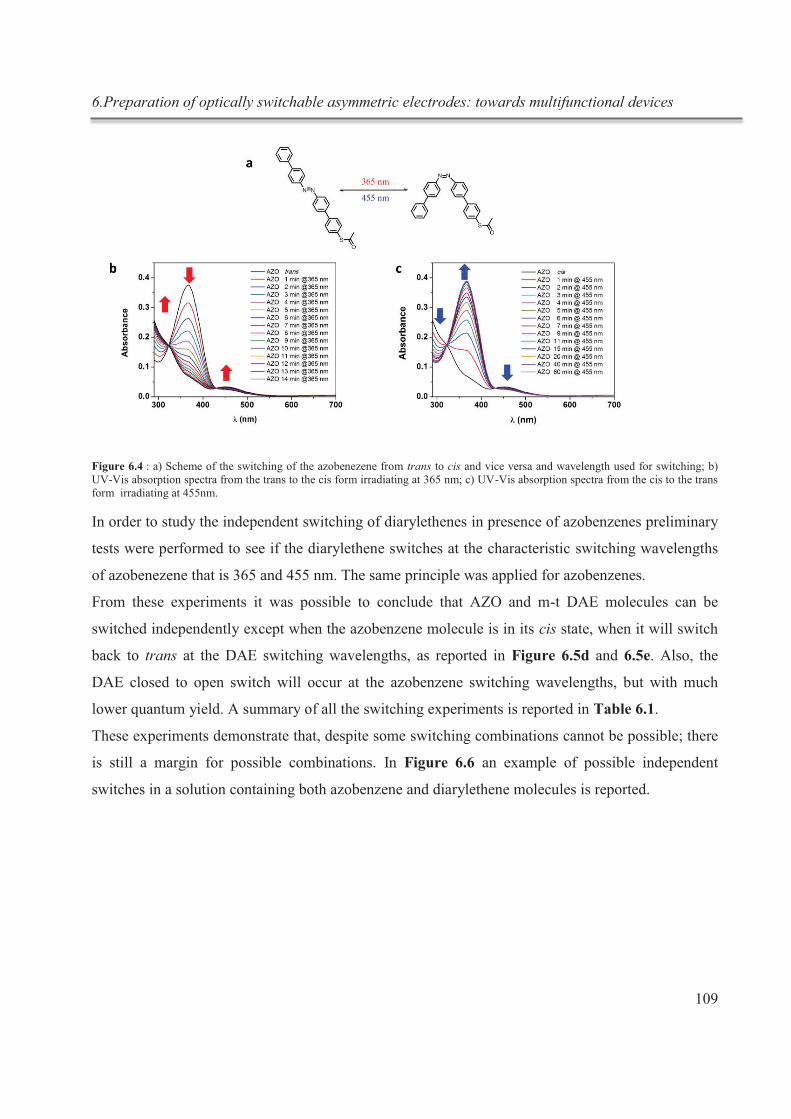
6.Preparation of optically switchable asymmetric electrodes: towards multifunctional devices
109
Figure 6.4 : a) Scheme of the switching of the azobenezene from trans to cis and vice versa and wavelength used for switching; b) UV-Vis absorption spectra from the trans to the cis form irradiating at 365 nm; c) UV-Vis absorption spectra from the cis to the trans form irradiating at 455nm.
In order to study the independent switching of diarylethenes in presence of azobenzenes preliminary
tests were performed to see if the diarylethene switches at the characteristic switching wavelengths
of azobenezene that is 365 and 455 nm. The same principle was applied for azobenzenes.
From these experiments it was possible to conclude that AZO and m-t DAE molecules can be
switched independently except when the azobenzene molecule is in its cis state, when it will switch
back to trans at the DAE switching wavelengths, as reported in Figure 6.5d and 6.5e. Also, the
DAE closed to open switch will occur at the azobenzene switching wavelengths, but with much
lower quantum yield. A summary of all the switching experiments is reported in Table 6.1.
These experiments demonstrate that, despite some switching combinations cannot be possible; there
is still a margin for possible combinations. In Figure 6.6 an example of possible independent
switches in a solution containing both azobenzene and diarylethene molecules is reported.
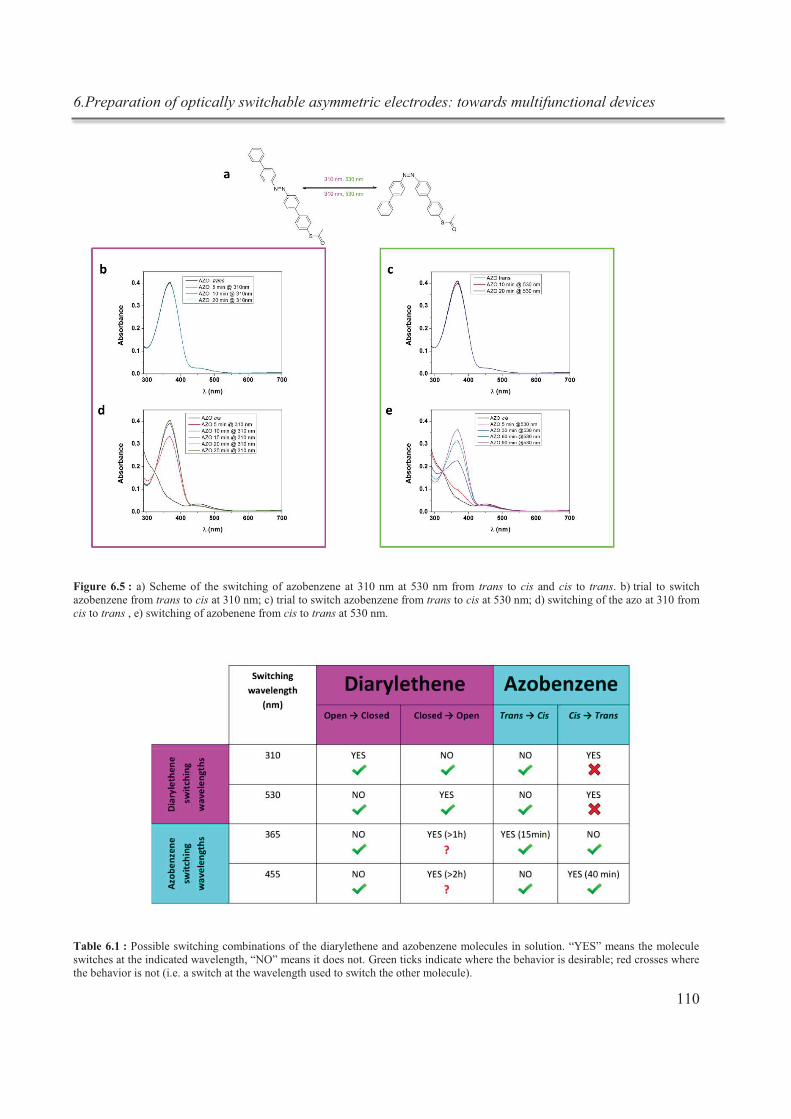
6.Preparation of optically switchable asymmetric electrodes: towards multifunctional devices
110
Figure 6.5 : a) Scheme of the switching of azobenzene at 310 nm at 530 nm from trans to cis and cis to trans. b) trial to switch azobenzene from trans to cis at 310 nm; c) trial to switch azobenzene from trans to cis at 530 nm; d) switching of the azo at 310 from cis to trans , e) switching of azobenene from cis to trans at 530 nm.
Table 6.1 : Possible switching combinations of the diarylethene and azobenzene molecules in solution. “YES” means the molecule
switches at the indicated wavelength, “NO” means it does not. Green ticks indicate where the behavior is desirable; red crosses where the behavior is not (i.e. a switch at the wavelength used to switch the other molecule).
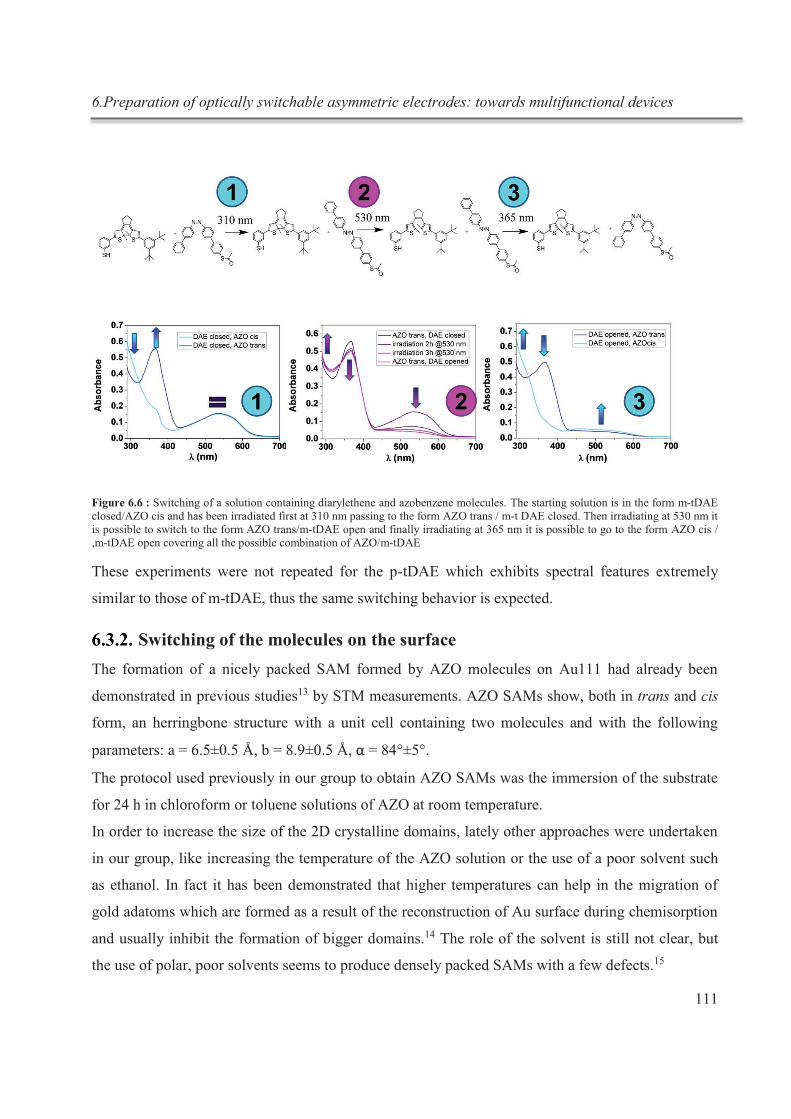
6.Preparation of optically switchable asymmetric electrodes: towards multifunctional devices
111
Figure 6.6 : Switching of a solution containing diarylethene and azobenzene molecules. The starting solution is in the form m-tDAE closed/AZO cis and has been irradiated first at 310 nm passing to the form AZO trans / m-t DAE closed. Then irradiating at 530 nm it is possible to switch to the form AZO trans/m-tDAE open and finally irradiating at 365 nm it is possible to go to the form AZO cis / ,m-tDAE open covering all the possible combination of AZO/m-tDAE
These experiments were not repeated for the p-tDAE which exhibits spectral features extremely
similar to those of m-tDAE, thus the same switching behavior is expected.
Switching of the molecules on the surface
The formation of a nicely packed SAM formed by AZO molecules on Au111 had already been
demonstrated in previous studies13 by STM measurements. AZO SAMs show, both in trans and cis
form, an herringbone structure with a unit cell containing two molecules and with the following
parameters: a = 6.5±0.5 Å, b = 8.9±0.5 Å, α = 84°±5°.
The protocol used previously in our group to obtain AZO SAMs was the immersion of the substrate
for 24 h in chloroform or toluene solutions of AZO at room temperature.
In order to increase the size of the 2D crystalline domains, lately other approaches were undertaken
in our group, like increasing the temperature of the AZO solution or the use of a poor solvent such
as ethanol. In fact it has been demonstrated that higher temperatures can help in the migration of
gold adatoms which are formed as a result of the reconstruction of Au surface during chemisorption
and usually inhibit the formation of bigger domains.14 The role of the solvent is still not clear, but
the use of polar, poor solvents seems to produce densely packed SAMs with a few defects.15
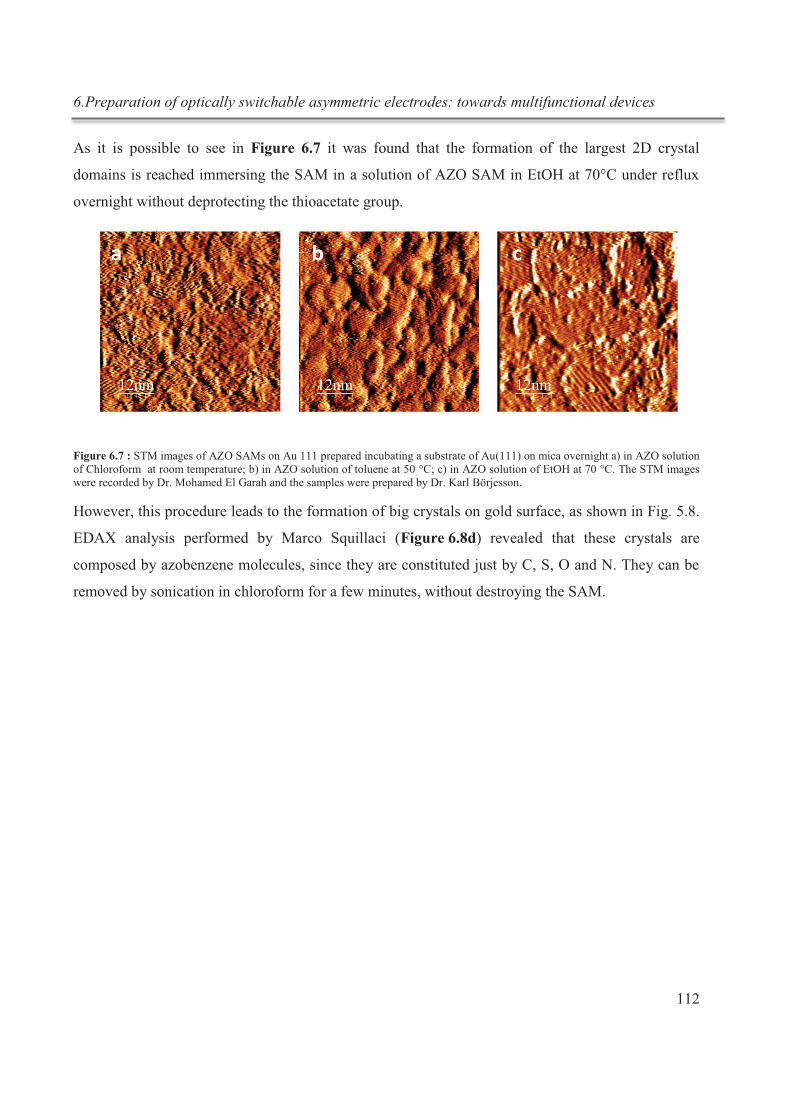
6.Preparation of optically switchable asymmetric electrodes: towards multifunctional devices
112
As it is possible to see in Figure 6.7 it was found that the formation of the largest 2D crystal
domains is reached immersing the SAM in a solution of AZO SAM in EtOH at 70°C under reflux
overnight without deprotecting the thioacetate group.
Figure 6.7 : STM images of AZO SAMs on Au 111 prepared incubating a substrate of Au(111) on mica overnight a) in AZO solution of Chloroform at room temperature; b) in AZO solution of toluene at 50 °C; c) in AZO solution of EtOH at 70 °C. The STM images were recorded by Dr. Mohamed El Garah and the samples were prepared by Dr. Karl Börjesson.
However, this procedure leads to the formation of big crystals on gold surface, as shown in Fig. 5.8.
EDAX analysis performed by Marco Squillaci (Figure 6.8d) revealed that these crystals are
composed by azobenzene molecules, since they are constituted just by C, S, O and N. They can be
removed by sonication in chloroform for a few minutes, without destroying the SAM.
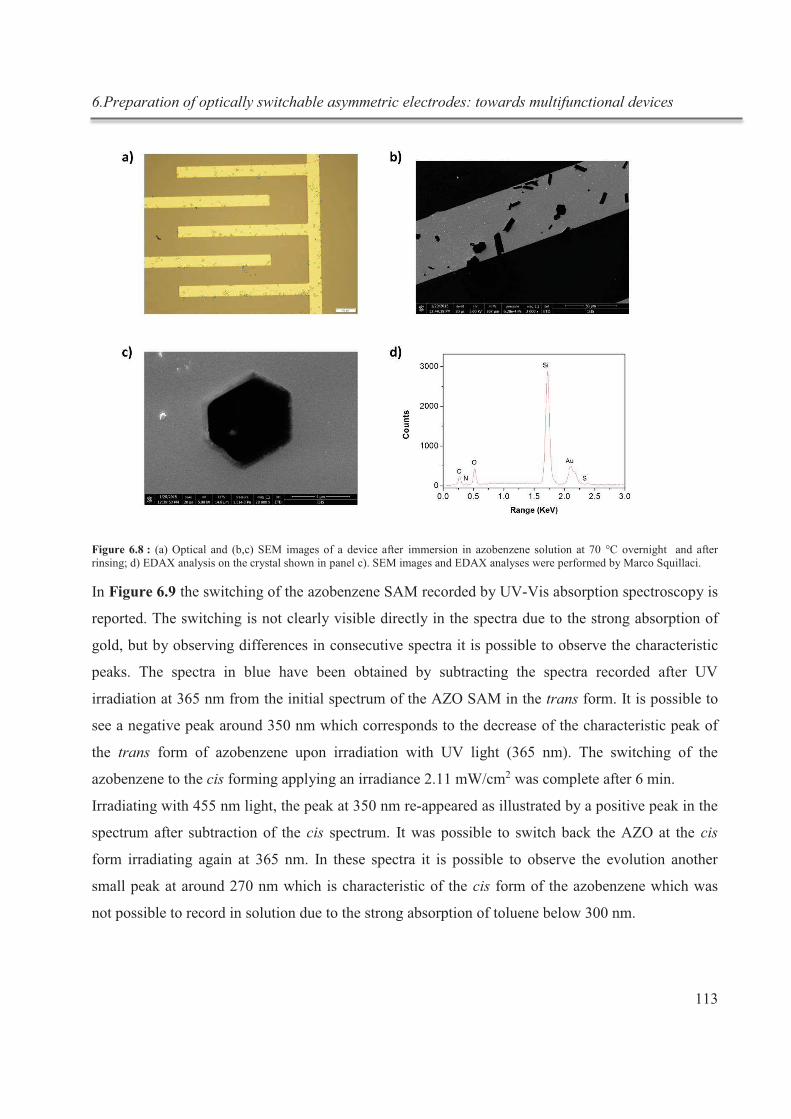
6.Preparation of optically switchable asymmetric electrodes: towards multifunctional devices
113
Figure 6.8 : (a) Optical and (b,c) SEM images of a device after immersion in azobenzene solution at 70 °C overnight and after rinsing; d) EDAX analysis on the crystal shown in panel c). SEM images and EDAX analyses were performed by Marco Squillaci.
In Figure 6.9 the switching of the azobenzene SAM recorded by UV-Vis absorption spectroscopy is
reported. The switching is not clearly visible directly in the spectra due to the strong absorption of
gold, but by observing differences in consecutive spectra it is possible to observe the characteristic
peaks. The spectra in blue have been obtained by subtracting the spectra recorded after UV
irradiation at 365 nm from the initial spectrum of the AZO SAM in the trans form. It is possible to
see a negative peak around 350 nm which corresponds to the decrease of the characteristic peak of
the trans form of azobenzene upon irradiation with UV light (365 nm). The switching of the
azobenzene to the cis forming applying an irradiance 2.11 mW/cm2 was complete after 6 min.
Irradiating with 455 nm light, the peak at 350 nm re-appeared as illustrated by a positive peak in the
spectrum after subtraction of the cis spectrum. It was possible to switch back the AZO at the cis
form irradiating again at 365 nm. In these spectra it is possible to observe the evolution another
small peak at around 270 nm which is characteristic of the cis form of the azobenzene which was
not possible to record in solution due to the strong absorption of toluene below 300 nm.
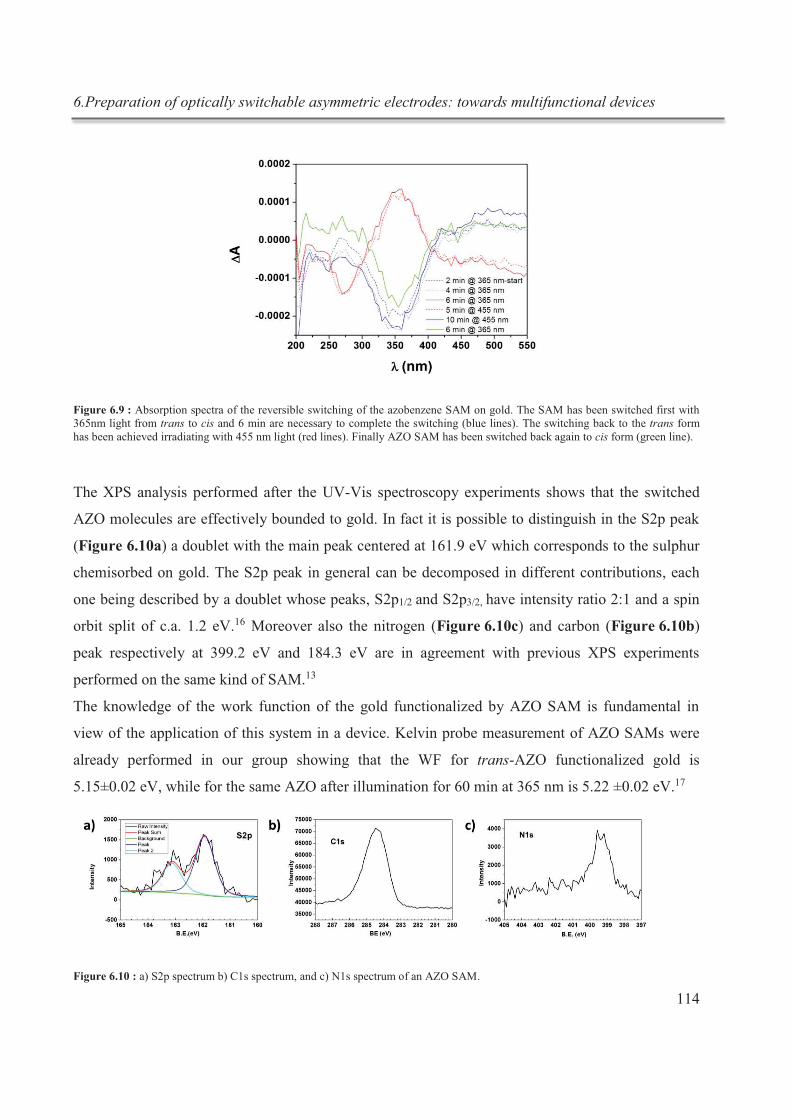
6.Preparation of optically switchable asymmetric electrodes: towards multifunctional devices
114
Figure 6.9 : Absorption spectra of the reversible switching of the azobenzene SAM on gold. The SAM has been switched first with 365nm light from trans to cis and 6 min are necessary to complete the switching (blue lines). The switching back to the trans form has been achieved irradiating with 455 nm light (red lines). Finally AZO SAM has been switched back again to cis form (green line).
The XPS analysis performed after the UV-Vis spectroscopy experiments shows that the switched
AZO molecules are effectively bounded to gold. In fact it is possible to distinguish in the S2p peak
(Figure 6.10a) a doublet with the main peak centered at 161.9 eV which corresponds to the sulphur
chemisorbed on gold. The S2p peak in general can be decomposed in different contributions, each
one being described by a doublet whose peaks, S2p1/2 and S2p3/2, have intensity ratio 2:1 and a spin
orbit split of c.a. 1.2 eV.16 Moreover also the nitrogen (Figure 6.10c) and carbon (Figure 6.10b)
peak respectively at 399.2 eV and 184.3 eV are in agreement with previous XPS experiments
performed on the same kind of SAM.13
The knowledge of the work function of the gold functionalized by AZO SAM is fundamental in
view of the application of this system in a device. Kelvin probe measurement of AZO SAMs were
already performed in our group showing that the WF for trans-AZO functionalized gold is
5.15±0.02 eV, while for the same AZO after illumination for 60 min at 365 nm is 5.22 ±0.02 eV.17
Figure 6.10 : a) S2p spectrum b) C1s spectrum, and c) N1s spectrum of an AZO SAM.
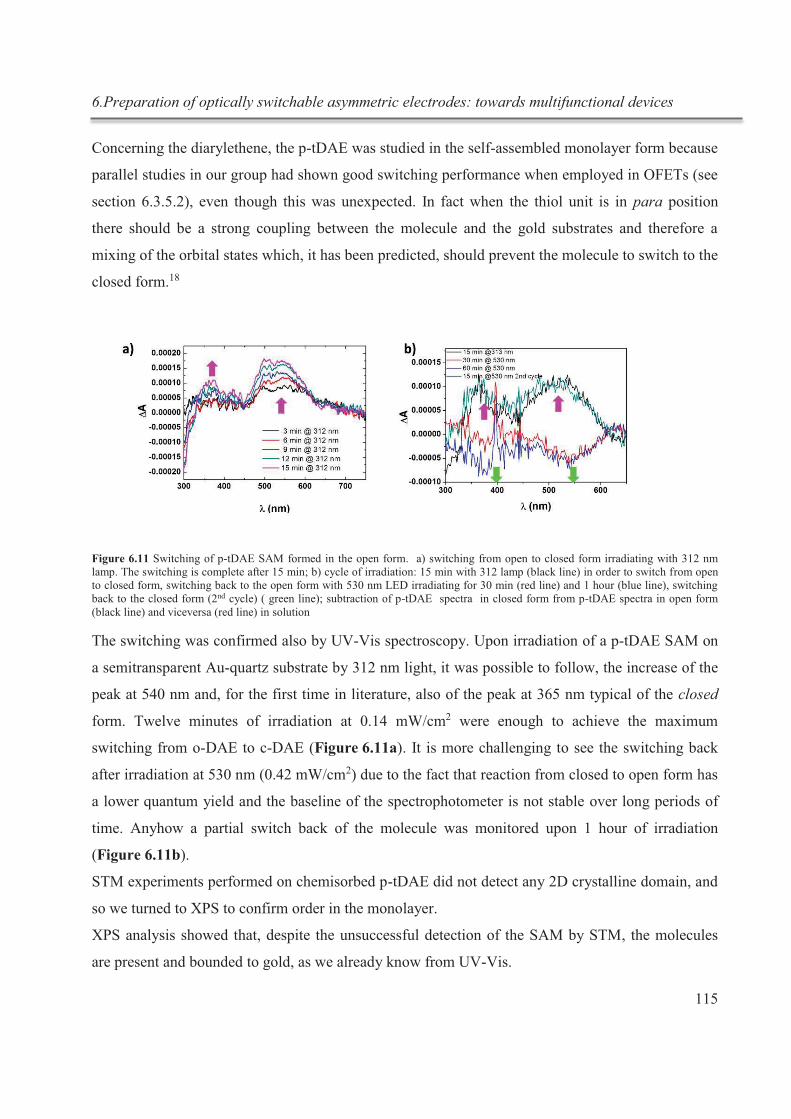
6.Preparation of optically switchable asymmetric electrodes: towards multifunctional devices
115
Concerning the diarylethene, the p-tDAE was studied in the self-assembled monolayer form because
parallel studies in our group had shown good switching performance when employed in OFETs (see
section 6.3.5.2), even though this was unexpected. In fact when the thiol unit is in para position
there should be a strong coupling between the molecule and the gold substrates and therefore a
mixing of the orbital states which, it has been predicted, should prevent the molecule to switch to the
closed form.18
Figure 6.11 Switching of p-tDAE SAM formed in the open form. a) switching from open to closed form irradiating with 312 nm lamp. The switching is complete after 15 min; b) cycle of irradiation: 15 min with 312 lamp (black line) in order to switch from open to closed form, switching back to the open form with 530 nm LED irradiating for 30 min (red line) and 1 hour (blue line), switching back to the closed form (2nd cycle) ( green line); subtraction of p-tDAE spectra in closed form from p-tDAE spectra in open form (black line) and viceversa (red line) in solution
The switching was confirmed also by UV-Vis spectroscopy. Upon irradiation of a p-tDAE SAM on
a semitransparent Au-quartz substrate by 312 nm light, it was possible to follow, the increase of the
peak at 540 nm and, for the first time in literature, also of the peak at 365 nm typical of the closed
form. Twelve minutes of irradiation at 0.14 mW/cm2 were enough to achieve the maximum
switching from o-DAE to c-DAE (Figure 6.11a). It is more challenging to see the switching back
after irradiation at 530 nm (0.42 mW/cm2) due to the fact that reaction from closed to open form has
a lower quantum yield and the baseline of the spectrophotometer is not stable over long periods of
time. Anyhow a partial switch back of the molecule was monitored upon 1 hour of irradiation
(Figure 6.11b).
STM experiments performed on chemisorbed p-tDAE did not detect any 2D crystalline domain, and
so we turned to XPS to confirm order in the monolayer.
XPS analysis showed that, despite the unsuccessful detection of the SAM by STM, the molecules
are present and bounded to gold, as we already know from UV-Vis.
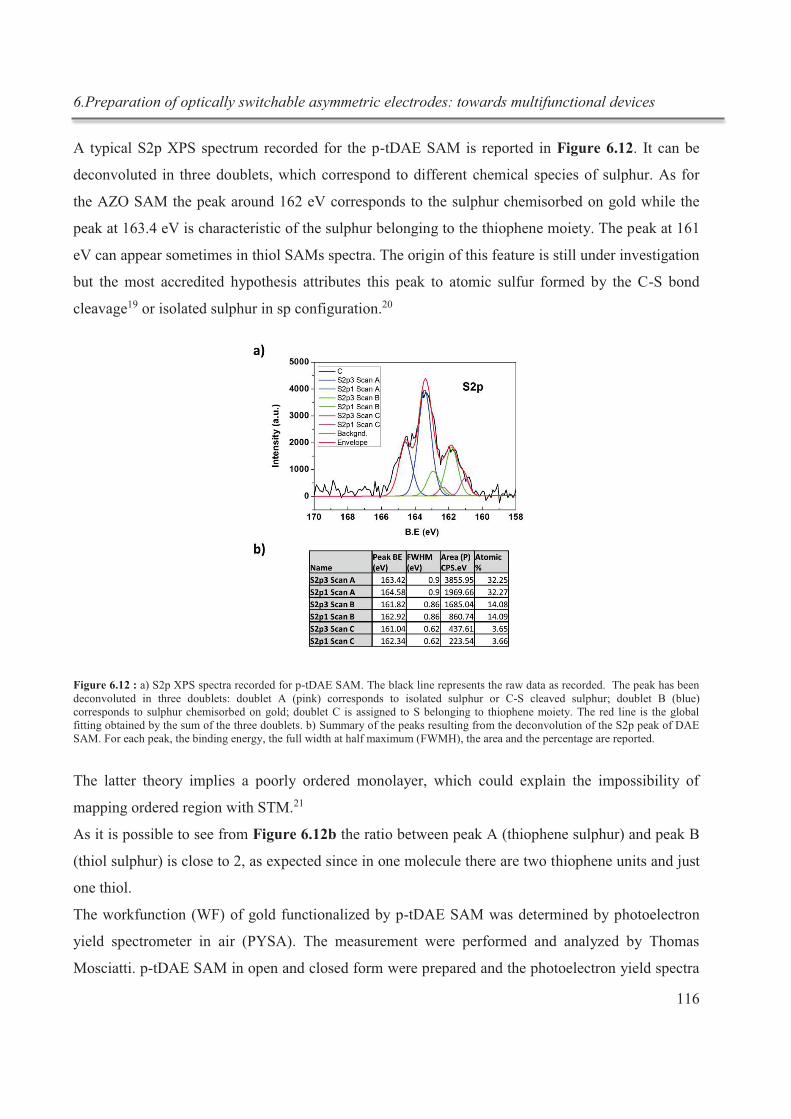
6.Preparation of optically switchable asymmetric electrodes: towards multifunctional devices
116
A typical S2p XPS spectrum recorded for the p-tDAE SAM is reported in Figure 6.12. It can be
deconvoluted in three doublets, which correspond to different chemical species of sulphur. As for
the AZO SAM the peak around 162 eV corresponds to the sulphur chemisorbed on gold while the
peak at 163.4 eV is characteristic of the sulphur belonging to the thiophene moiety. The peak at 161
eV can appear sometimes in thiol SAMs spectra. The origin of this feature is still under investigation
but the most accredited hypothesis attributes this peak to atomic sulfur formed by the C-S bond
cleavage19 or isolated sulphur in sp configuration.20
Figure 6.12 : a) S2p XPS spectra recorded for p-tDAE SAM. The black line represents the raw data as recorded. The peak has been deconvoluted in three doublets: doublet A (pink) corresponds to isolated sulphur or C-S cleaved sulphur; doublet B (blue) corresponds to sulphur chemisorbed on gold; doublet C is assigned to S belonging to thiophene moiety. The red line is the global fitting obtained by the sum of the three doublets. b) Summary of the peaks resulting from the deconvolution of the S2p peak of DAE SAM. For each peak, the binding energy, the full width at half maximum (FWMH), the area and the percentage are reported.
The latter theory implies a poorly ordered monolayer, which could explain the impossibility of
mapping ordered region with STM.21
As it is possible to see from Figure 6.12b the ratio between peak A (thiophene sulphur) and peak B
(thiol sulphur) is close to 2, as expected since in one molecule there are two thiophene units and just
one thiol.
The workfunction (WF) of gold functionalized by p-tDAE SAM was determined by photoelectron
yield spectrometer in air (PYSA). The measurement were performed and analyzed by Thomas
Mosciatti. p-tDAE SAM in open and closed form were prepared and the photoelectron yield spectra
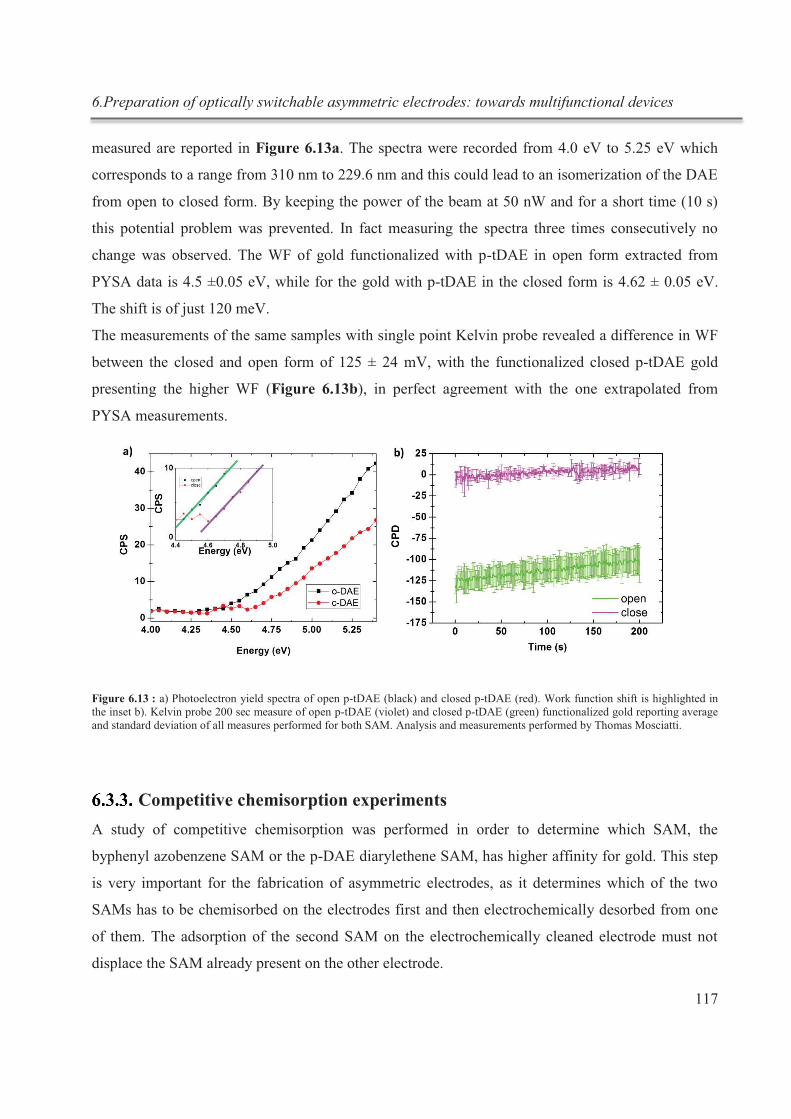
6.Preparation of optically switchable asymmetric electrodes: towards multifunctional devices
117
measured are reported in Figure 6.13a. The spectra were recorded from 4.0 eV to 5.25 eV which
corresponds to a range from 310 nm to 229.6 nm and this could lead to an isomerization of the DAE
from open to closed form. By keeping the power of the beam at 50 nW and for a short time (10 s)
this potential problem was prevented. In fact measuring the spectra three times consecutively no
change was observed. The WF of gold functionalized with p-tDAE in open form extracted from
PYSA data is 4.5 ±0.05 eV, while for the gold with p-tDAE in the closed form is 4.62 ± 0.05 eV.
The shift is of just 120 meV.
The measurements of the same samples with single point Kelvin probe revealed a difference in WF
between the closed and open form of 125 ± 24 mV, with the functionalized closed p-tDAE gold
presenting the higher WF (Figure 6.13b), in perfect agreement with the one extrapolated from
PYSA measurements.
Figure 6.13 : a) Photoelectron yield spectra of open p-tDAE (black) and closed p-tDAE (red). Work function shift is highlighted in the inset b). Kelvin probe 200 sec measure of open p-tDAE (violet) and closed p-tDAE (green) functionalized gold reporting average and standard deviation of all measures performed for both SAM. Analysis and measurements performed by Thomas Mosciatti.
Competitive chemisorption experiments
A study of competitive chemisorption was performed in order to determine which SAM, the
byphenyl azobenzene SAM or the p-DAE diarylethene SAM, has higher affinity for gold. This step
is very important for the fabrication of asymmetric electrodes, as it determines which of the two
SAMs has to be chemisorbed on the electrodes first and then electrochemically desorbed from one
of them. The adsorption of the second SAM on the electrochemically cleaned electrode must not
displace the SAM already present on the other electrode.
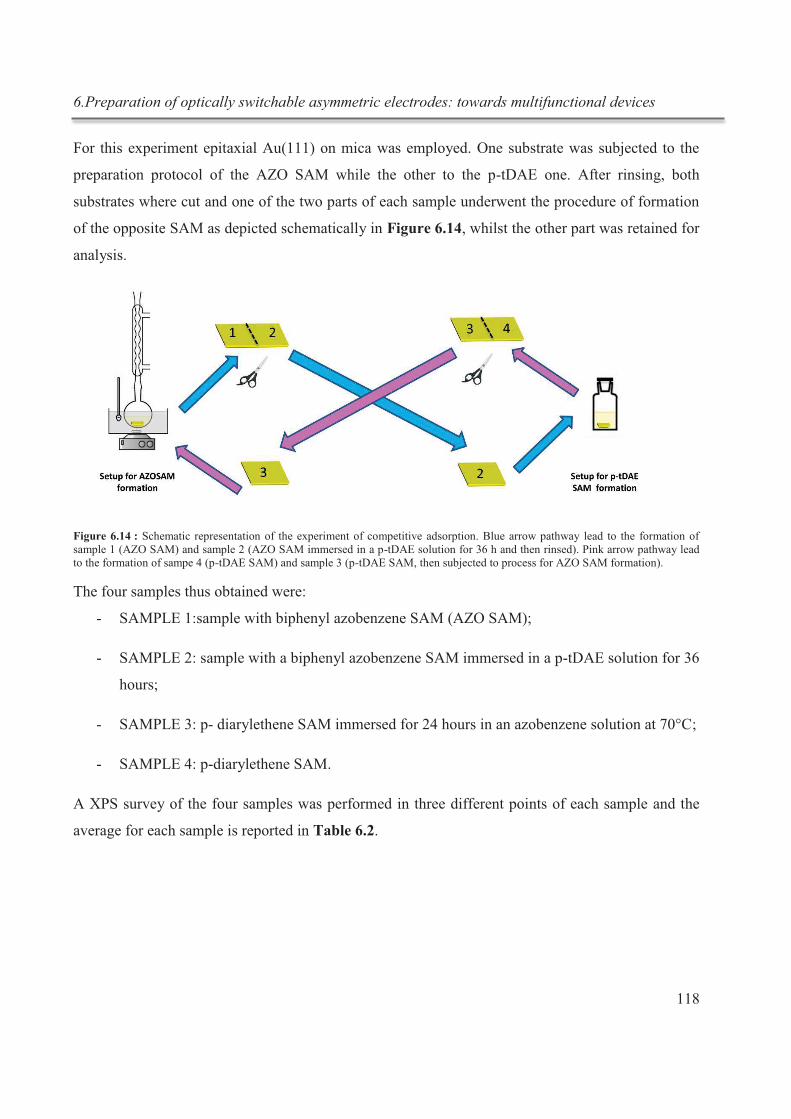
6.Preparation of optically switchable asymmetric electrodes: towards multifunctional devices
118
For this experiment epitaxial Au(111) on mica was employed. One substrate was subjected to the
preparation protocol of the AZO SAM while the other to the p-tDAE one. After rinsing, both
substrates where cut and one of the two parts of each sample underwent the procedure of formation
of the opposite SAM as depicted schematically in Figure 6.14, whilst the other part was retained for
analysis.
Figure 6.14 : Schematic representation of the experiment of competitive adsorption. Blue arrow pathway lead to the formation of sample 1 (AZO SAM) and sample 2 (AZO SAM immersed in a p-tDAE solution for 36 h and then rinsed). Pink arrow pathway lead to the formation of sampe 4 (p-tDAE SAM) and sample 3 (p-tDAE SAM, then subjected to process for AZO SAM formation).
The four samples thus obtained were:
- SAMPLE 1:sample with biphenyl azobenzene SAM (AZO SAM);
- SAMPLE 2: sample with a biphenyl azobenzene SAM immersed in a p-tDAE solution for 36
hours;
- SAMPLE 3: p- diarylethene SAM immersed for 24 hours in an azobenzene solution at 70°C;
- SAMPLE 4: p-diarylethene SAM.
A XPS survey of the four samples was performed in three different points of each sample and the
average for each sample is reported in Table 6.2.
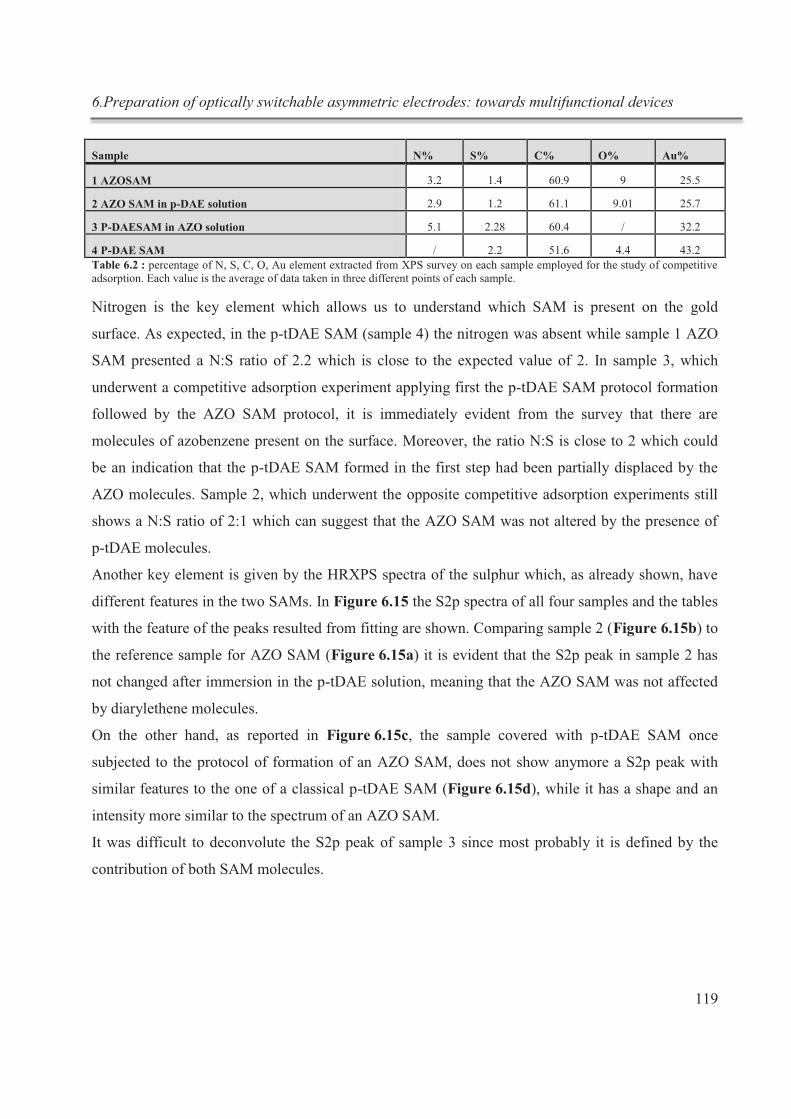
6.Preparation of optically switchable asymmetric electrodes: towards multifunctional devices
119
Sample N% S% C% O% Au%
1 AZOSAM 3.2 1.4 60.9 9 25.5
2 AZO SAM in p-DAE solution 2.9 1.2 61.1 9.01 25.7
3 P-DAESAM in AZO solution 5.1 2.28 60.4 / 32.2
4 P-DAE SAM / 2.2 51.6 4.4 43.2 Table 6.2 : percentage of N, S, C, O, Au element extracted from XPS survey on each sample employed for the study of competitive adsorption. Each value is the average of data taken in three different points of each sample.
Nitrogen is the key element which allows us to understand which SAM is present on the gold
surface. As expected, in the p-tDAE SAM (sample 4) the nitrogen was absent while sample 1 AZO
SAM presented a N:S ratio of 2.2 which is close to the expected value of 2. In sample 3, which
underwent a competitive adsorption experiment applying first the p-tDAE SAM protocol formation
followed by the AZO SAM protocol, it is immediately evident from the survey that there are
molecules of azobenzene present on the surface. Moreover, the ratio N:S is close to 2 which could
be an indication that the p-tDAE SAM formed in the first step had been partially displaced by the
AZO molecules. Sample 2, which underwent the opposite competitive adsorption experiments still
shows a N:S ratio of 2:1 which can suggest that the AZO SAM was not altered by the presence of
p-tDAE molecules.
Another key element is given by the HRXPS spectra of the sulphur which, as already shown, have
different features in the two SAMs. In Figure 6.15 the S2p spectra of all four samples and the tables
with the feature of the peaks resulted from fitting are shown. Comparing sample 2 (Figure 6.15b) to
the reference sample for AZO SAM (Figure 6.15a) it is evident that the S2p peak in sample 2 has
not changed after immersion in the p-tDAE solution, meaning that the AZO SAM was not affected
by diarylethene molecules.
On the other hand, as reported in Figure 6.15c, the sample covered with p-tDAE SAM once
subjected to the protocol of formation of an AZO SAM, does not show anymore a S2p peak with
similar features to the one of a classical p-tDAE SAM (Figure 6.15d), while it has a shape and an
intensity more similar to the spectrum of an AZO SAM.
It was difficult to deconvolute the S2p peak of sample 3 since most probably it is defined by the
contribution of both SAM molecules.
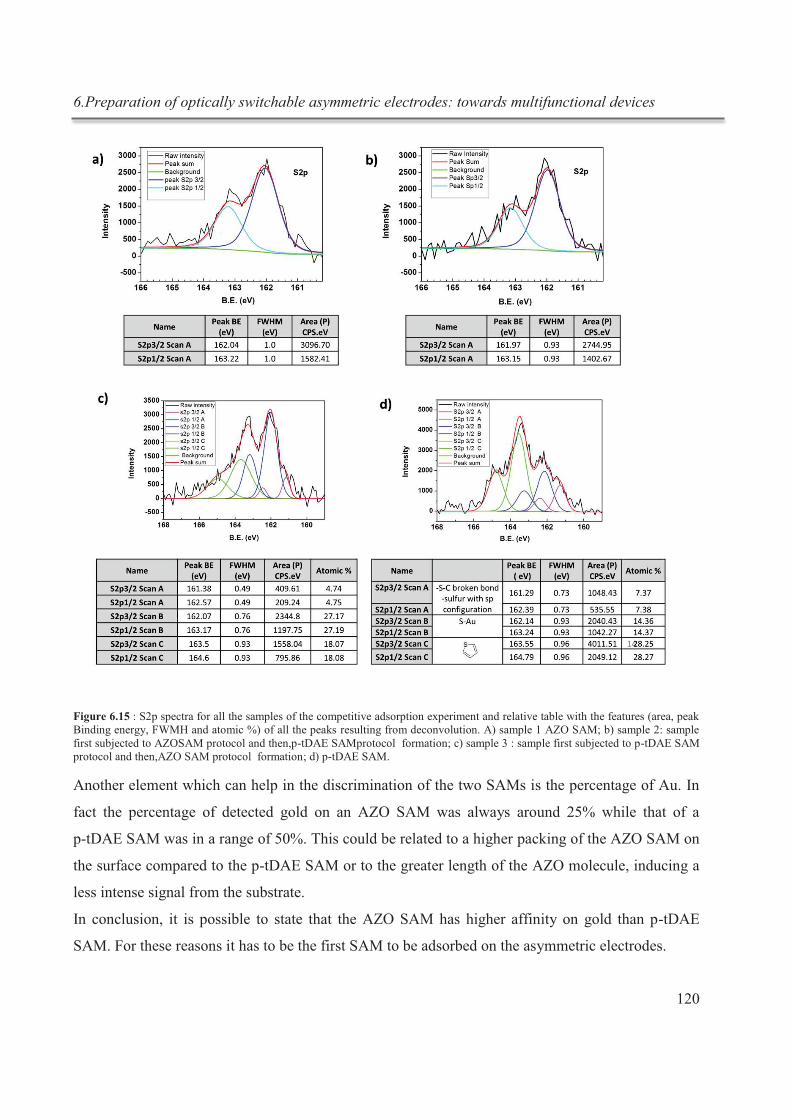
6.Preparation of optically switchable asymmetric electrodes: towards multifunctional devices
120
Figure 6.15 : S2p spectra for all the samples of the competitive adsorption experiment and relative table with the features (area, peak Binding energy, FWMH and atomic %) of all the peaks resulting from deconvolution. A) sample 1 AZO SAM; b) sample 2: sample first subjected to AZOSAM protocol and then,p-tDAE SAMprotocol formation; c) sample 3 : sample first subjected to p-tDAE SAM protocol and then,AZO SAM protocol formation; d) p-tDAE SAM.
Another element which can help in the discrimination of the two SAMs is the percentage of Au. In
fact the percentage of detected gold on an AZO SAM was always around 25% while that of a
p-tDAE SAM was in a range of 50%. This could be related to a higher packing of the AZO SAM on
the surface compared to the p-tDAE SAM or to the greater length of the AZO molecule, inducing a
less intense signal from the substrate.
In conclusion, it is possible to state that the AZO SAM has higher affinity on gold than p-tDAE
SAM. For these reasons it has to be the first SAM to be adsorbed on the asymmetric electrodes.
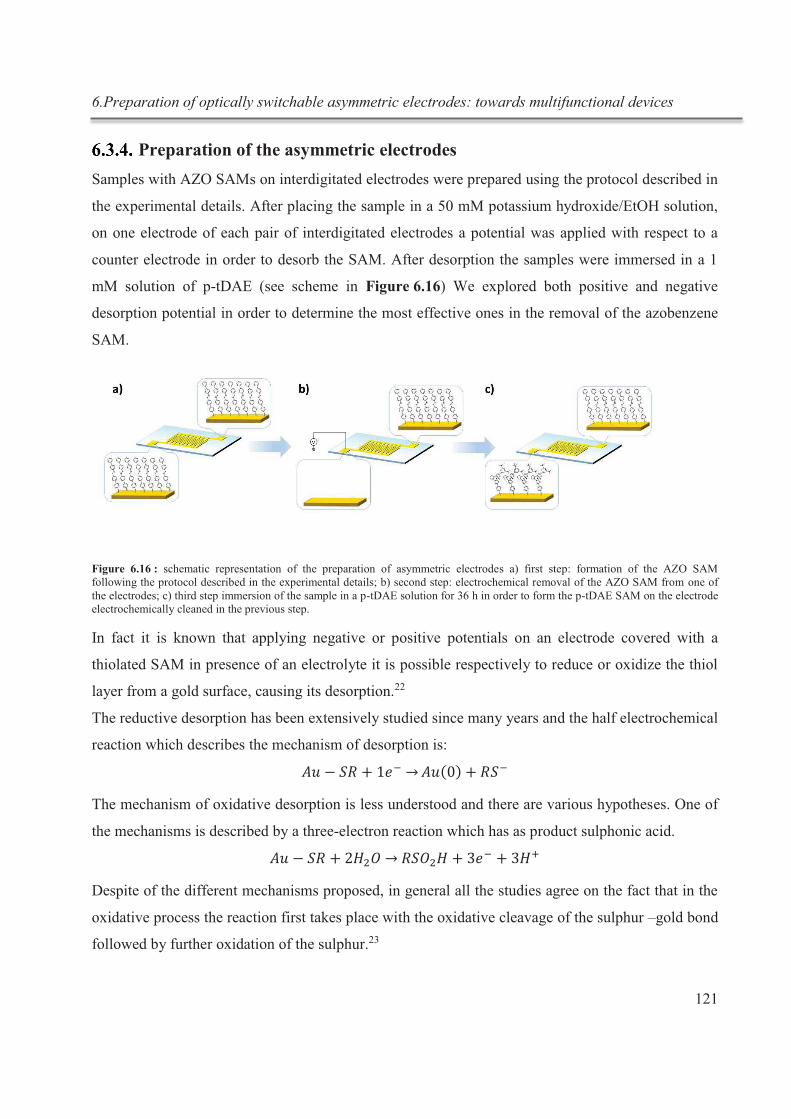
6.Preparation of optically switchable asymmetric electrodes: towards multifunctional devices
121
Preparation of the asymmetric electrodes
Samples with AZO SAMs on interdigitated electrodes were prepared using the protocol described in
the experimental details. After placing the sample in a 50 mM potassium hydroxide/EtOH solution,
on one electrode of each pair of interdigitated electrodes a potential was applied with respect to a
counter electrode in order to desorb the SAM. After desorption the samples were immersed in a 1
mM solution of p-tDAE (see scheme in Figure 6.16) We explored both positive and negative
desorption potential in order to determine the most effective ones in the removal of the azobenzene
SAM.
Figure 6.16 : schematic representation of the preparation of asymmetric electrodes a) first step: formation of the AZO SAM following the protocol described in the experimental details; b) second step: electrochemical removal of the AZO SAM from one of the electrodes; c) third step immersion of the sample in a p-tDAE solution for 36 h in order to form the p-tDAE SAM on the electrode electrochemically cleaned in the previous step.
In fact it is known that applying negative or positive potentials on an electrode covered with a
thiolated SAM in presence of an electrolyte it is possible respectively to reduce or oxidize the thiol
layer from a gold surface, causing its desorption.22
The reductive desorption has been extensively studied since many years and the half electrochemical
reaction which describes the mechanism of desorption is:
The mechanism of oxidative desorption is less understood and there are various hypotheses. One of
the mechanisms is described by a three-electron reaction which has as product sulphonic acid.
Despite of the different mechanisms proposed, in general all the studies agree on the fact that in the
oxidative process the reaction first takes place with the oxidative cleavage of the sulphur –gold bond
followed by further oxidation of the sulphur.23
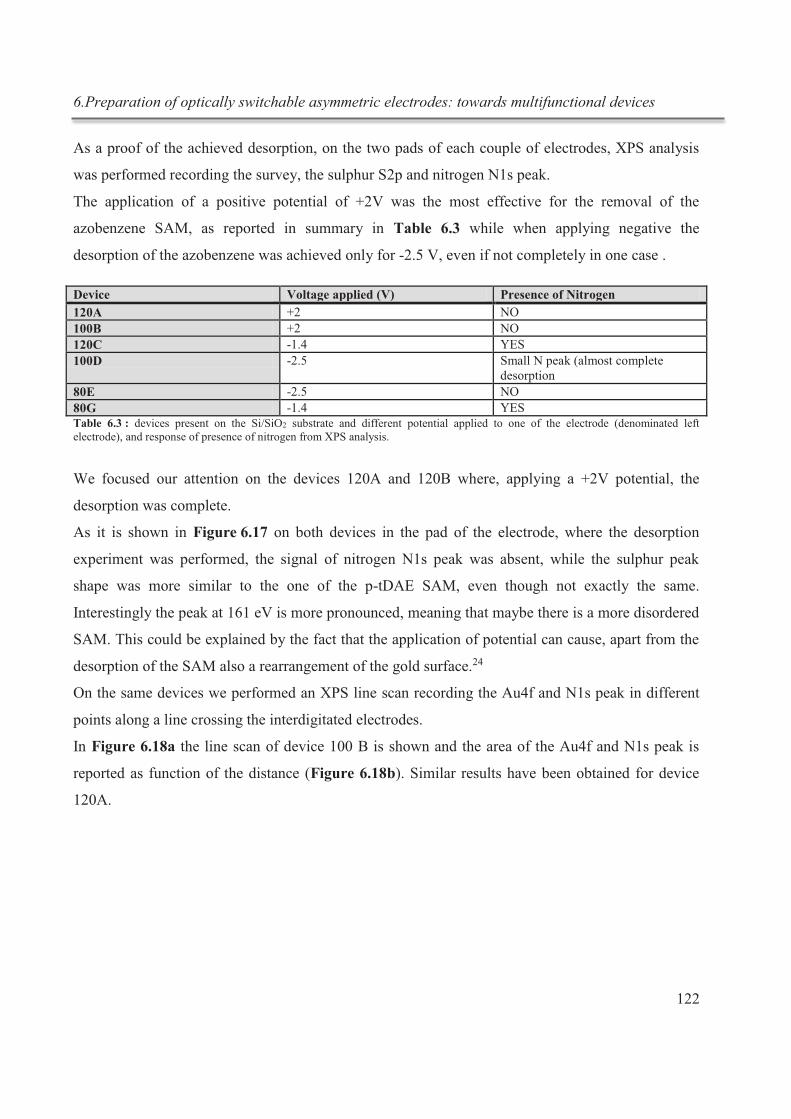
6.Preparation of optically switchable asymmetric electrodes: towards multifunctional devices
122
As a proof of the achieved desorption, on the two pads of each couple of electrodes, XPS analysis
was performed recording the survey, the sulphur S2p and nitrogen N1s peak.
The application of a positive potential of +2V was the most effective for the removal of the
azobenzene SAM, as reported in summary in Table 6.3 while when applying negative the
desorption of the azobenzene was achieved only for -2.5 V, even if not completely in one case .
Device Voltage applied (V) Presence of Nitrogen
120A +2 NO 100B +2 NO 120C -1.4 YES 100D -2.5 Small N peak (almost complete
desorption 80E -2.5 NO 80G -1.4 YES Table 6.3 : devices present on the Si/SiO2 substrate and different potential applied to one of the electrode (denominated left electrode), and response of presence of nitrogen from XPS analysis.
We focused our attention on the devices 120A and 120B where, applying a +2V potential, the
desorption was complete.
As it is shown in Figure 6.17 on both devices in the pad of the electrode, where the desorption
experiment was performed, the signal of nitrogen N1s peak was absent, while the sulphur peak
shape was more similar to the one of the p-tDAE SAM, even though not exactly the same.
Interestingly the peak at 161 eV is more pronounced, meaning that maybe there is a more disordered
SAM. This could be explained by the fact that the application of potential can cause, apart from the
desorption of the SAM also a rearrangement of the gold surface.24
On the same devices we performed an XPS line scan recording the Au4f and N1s peak in different
points along a line crossing the interdigitated electrodes.
In Figure 6.18a the line scan of device 100 B is shown and the area of the Au4f and N1s peak is
reported as function of the distance (Figure 6.18b). Similar results have been obtained for device
120A.
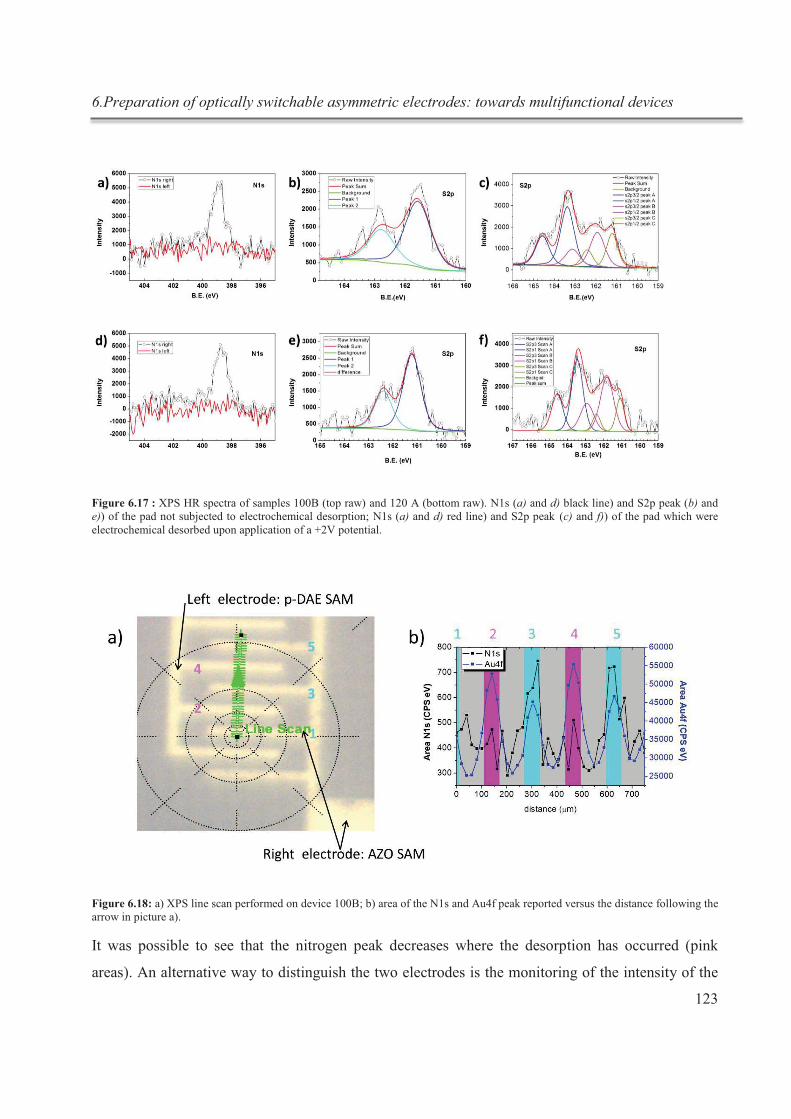
6.Preparation of optically switchable asymmetric electrodes: towards multifunctional devices
123
Figure 6.17 : XPS HR spectra of samples 100B (top raw) and 120 A (bottom raw). N1s (a) and d) black line) and S2p peak (b) and e)) of the pad not subjected to electrochemical desorption; N1s (a) and d) red line) and S2p peak (c) and f)) of the pad which were electrochemical desorbed upon application of a +2V potential.
Figure 6.18: a) XPS line scan performed on device 100B; b) area of the N1s and Au4f peak reported versus the distance following the arrow in picture a).
It was possible to see that the nitrogen peak decreases where the desorption has occurred (pink
areas). An alternative way to distinguish the two electrodes is the monitoring of the intensity of the
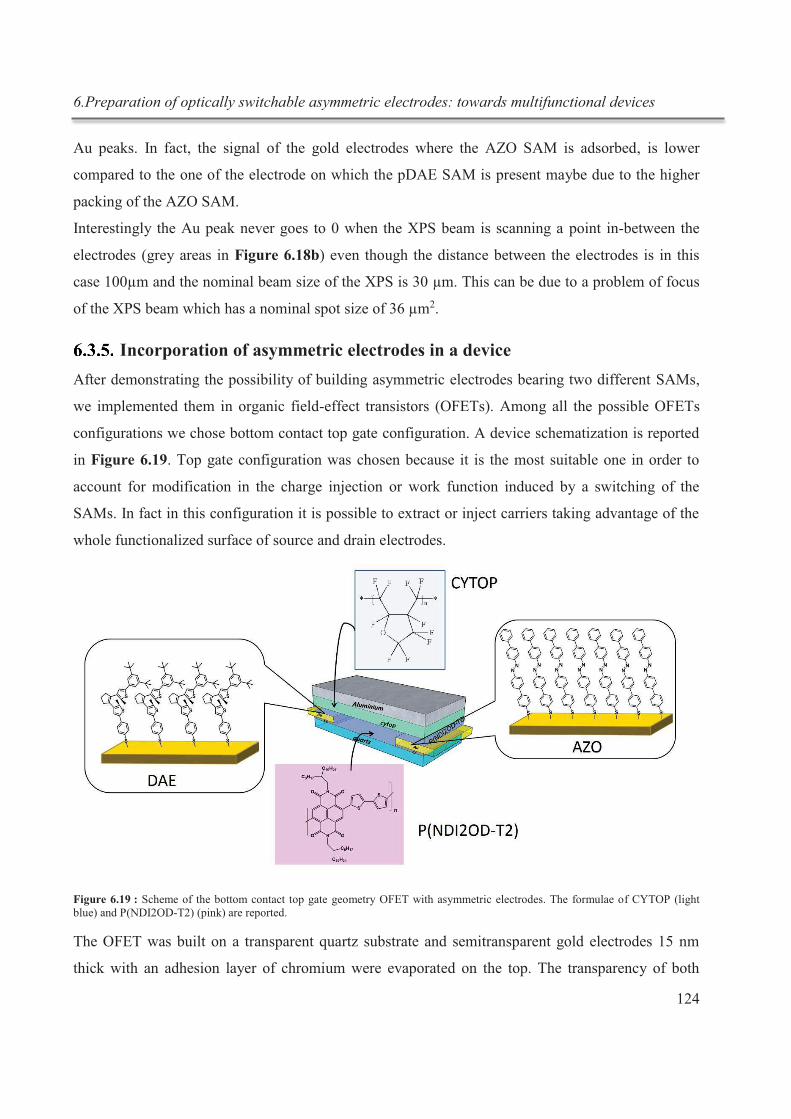
6.Preparation of optically switchable asymmetric electrodes: towards multifunctional devices
124
Au peaks. In fact, the signal of the gold electrodes where the AZO SAM is adsorbed, is lower
compared to the one of the electrode on which the pDAE SAM is present maybe due to the higher
packing of the AZO SAM.
Interestingly the Au peak never goes to 0 when the XPS beam is scanning a point in-between the
electrodes (grey areas in Figure 6.18b) even though the distance between the electrodes is in this
case 100µm and the nominal beam size of the XPS is 30 µm. This can be due to a problem of focus
of the XPS beam which has a nominal spot size of 36 µm2.
Incorporation of asymmetric electrodes in a device
After demonstrating the possibility of building asymmetric electrodes bearing two different SAMs,
we implemented them in organic field-effect transistors (OFETs). Among all the possible OFETs
configurations we chose bottom contact top gate configuration. A device schematization is reported
in Figure 6.19. Top gate configuration was chosen because it is the most suitable one in order to
account for modification in the charge injection or work function induced by a switching of the
SAMs. In fact in this configuration it is possible to extract or inject carriers taking advantage of the
whole functionalized surface of source and drain electrodes.
Figure 6.19 : Scheme of the bottom contact top gate geometry OFET with asymmetric electrodes. The formulae of CYTOP (light blue) and P(NDI2OD-T2) (pink) are reported.
The OFET was built on a transparent quartz substrate and semitransparent gold electrodes 15 nm
thick with an adhesion layer of chromium were evaporated on the top. The transparency of both
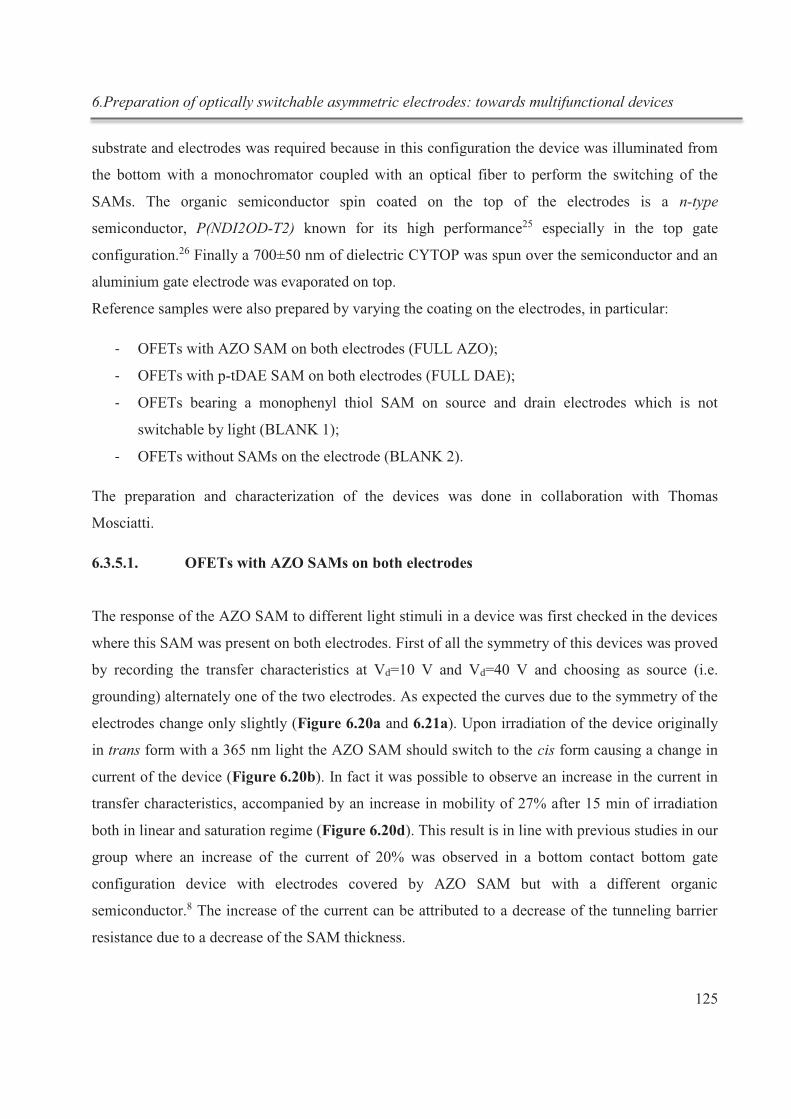
6.Preparation of optically switchable asymmetric electrodes: towards multifunctional devices
125
substrate and electrodes was required because in this configuration the device was illuminated from
the bottom with a monochromator coupled with an optical fiber to perform the switching of the
SAMs. The organic semiconductor spin coated on the top of the electrodes is a n-type
semiconductor, P(NDI2OD-T2) known for its high performance25 especially in the top gate
configuration.26 Finally a 700±50 nm of dielectric CYTOP was spun over the semiconductor and an
aluminium gate electrode was evaporated on top.
Reference samples were also prepared by varying the coating on the electrodes, in particular:
- OFETs with AZO SAM on both electrodes (FULL AZO);
- OFETs with p-tDAE SAM on both electrodes (FULL DAE);
- OFETs bearing a monophenyl thiol SAM on source and drain electrodes which is not
switchable by light (BLANK 1);
- OFETs without SAMs on the electrode (BLANK 2).
The preparation and characterization of the devices was done in collaboration with Thomas
Mosciatti.
6.3.5.1. OFETs with AZO SAMs on both electrodes
The response of the AZO SAM to different light stimuli in a device was first checked in the devices
where this SAM was present on both electrodes. First of all the symmetry of this devices was proved
by recording the transfer characteristics at Vd=10 V and Vd=40 V and choosing as source (i.e.
grounding) alternately one of the two electrodes. As expected the curves due to the symmetry of the
electrodes change only slightly (Figure 6.20a and 6.21a). Upon irradiation of the device originally
in trans form with a 365 nm light the AZO SAM should switch to the cis form causing a change in
current of the device (Figure 6.20b). In fact it was possible to observe an increase in the current in
transfer characteristics, accompanied by an increase in mobility of 27% after 15 min of irradiation
both in linear and saturation regime (Figure 6.20d). This result is in line with previous studies in our
group where an increase of the current of 20% was observed in a bottom contact bottom gate
configuration device with electrodes covered by AZO SAM but with a different organic
semiconductor.8 The increase of the current can be attributed to a decrease of the tunneling barrier
resistance due to a decrease of the SAM thickness.
6.Preparation of optically switchable asymmetric electrodes: towards multifunctional devices
126
Surprisingly, irradiating the same device with 455 nm light for more than one hour did not lead to
any switch back (Figure 6.20c) which could be explained by a mechanical interference with the
back-reaction. The molecules switching from the trans to the cis form leave some empty space
which can be filled by the alkyl chains of P(NDI2OD-T2) , being morphologically a rather
amorphous material.27
After 44 hours in the dark the same OFET was tested again. A recover of almost 50% towards the
starting maximum IDS current was observed. This corroborates our hypothesis of structural
impediment which with time was overcome slightly.
Figure 6.20 : Electrical characterization of a device with both electrodes covered by AZO SAMs of channel length 80 µm. a) transfer characteristics in linear (Vd=10 V) and saturation regime (Vd=40 V) grounding alternatively one of the two electrodes; b) transfer characteristics before and after irradiation of the device with 365 nm light ; c) transfer characteristic in linear and saturation regime starting from trans form, after 15 min irradiation with 365 nm, after irradiation with 455 nm light for 80 min and finally after 32 and 44 hours in the dark; d) mobility and maximum drain current in saturation regime plotted for all the transfer curves depicted in fig.c).
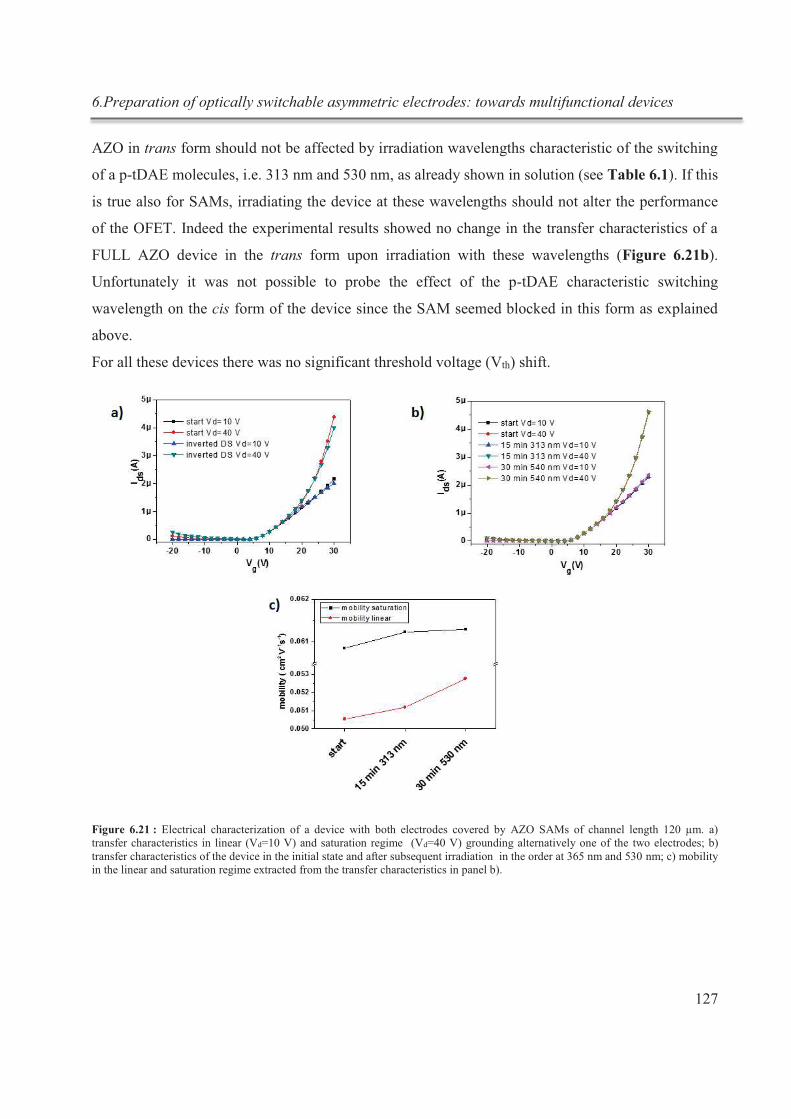
6.Preparation of optically switchable asymmetric electrodes: towards multifunctional devices
127
AZO in trans form should not be affected by irradiation wavelengths characteristic of the switching
of a p-tDAE molecules, i.e. 313 nm and 530 nm, as already shown in solution (see Table 6.1). If this
is true also for SAMs, irradiating the device at these wavelengths should not alter the performance
of the OFET. Indeed the experimental results showed no change in the transfer characteristics of a
FULL AZO device in the trans form upon irradiation with these wavelengths (Figure 6.21b).
Unfortunately it was not possible to probe the effect of the p-tDAE characteristic switching
wavelength on the cis form of the device since the SAM seemed blocked in this form as explained
above.
For all these devices there was no significant threshold voltage (Vth) shift.
Figure 6.21 : Electrical characterization of a device with both electrodes covered by AZO SAMs of channel length 120 µm. a) transfer characteristics in linear (Vd=10 V) and saturation regime (Vd=40 V) grounding alternatively one of the two electrodes; b) transfer characteristics of the device in the initial state and after subsequent irradiation in the order at 365 nm and 530 nm; c) mobility in the linear and saturation regime extracted from the transfer characteristics in panel b).
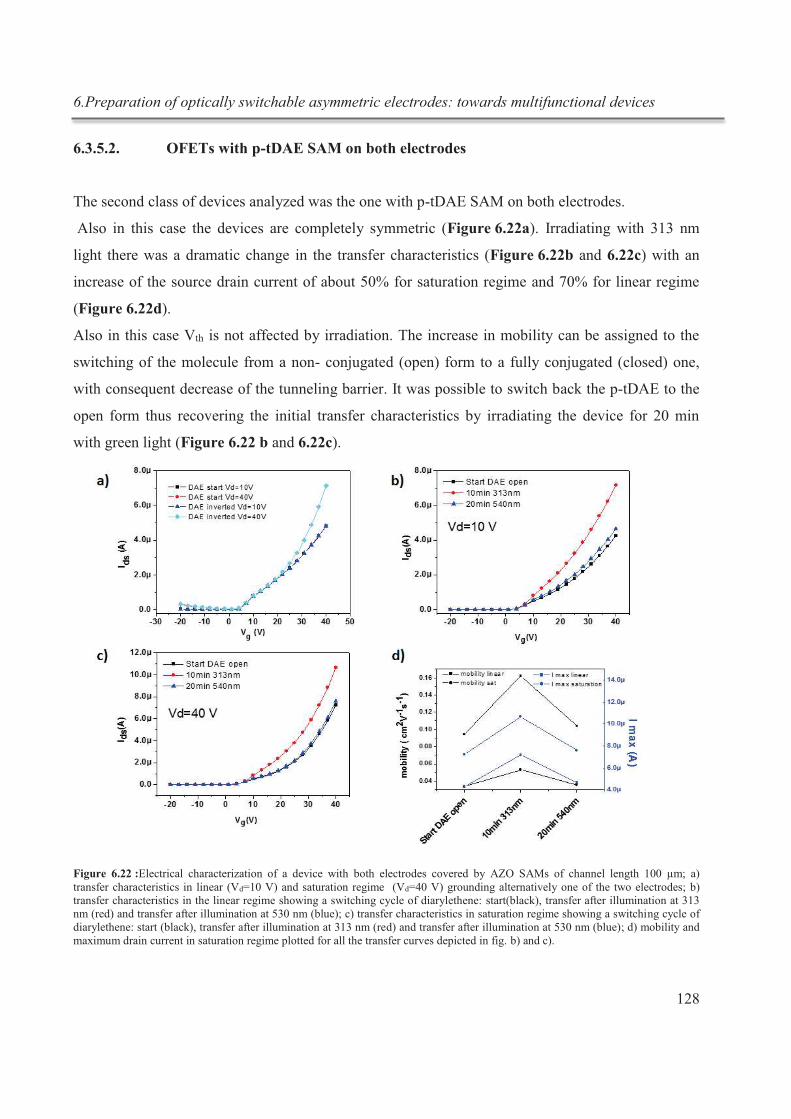
6.Preparation of optically switchable asymmetric electrodes: towards multifunctional devices
128
6.3.5.2. OFETs with p-tDAE SAM on both electrodes
The second class of devices analyzed was the one with p-tDAE SAM on both electrodes.
Also in this case the devices are completely symmetric (Figure 6.22a). Irradiating with 313 nm
light there was a dramatic change in the transfer characteristics (Figure 6.22b and 6.22c) with an
increase of the source drain current of about 50% for saturation regime and 70% for linear regime
(Figure 6.22d).
Also in this case Vth is not affected by irradiation. The increase in mobility can be assigned to the
switching of the molecule from a non- conjugated (open) form to a fully conjugated (closed) one,
with consequent decrease of the tunneling barrier. It was possible to switch back the p-tDAE to the
open form thus recovering the initial transfer characteristics by irradiating the device for 20 min
with green light (Figure 6.22 b and 6.22c).
Figure 6.22 :Electrical characterization of a device with both electrodes covered by AZO SAMs of channel length 100 µm; a) transfer characteristics in linear (Vd=10 V) and saturation regime (Vd=40 V) grounding alternatively one of the two electrodes; b) transfer characteristics in the linear regime showing a switching cycle of diarylethene: start(black), transfer after illumination at 313 nm (red) and transfer after illumination at 530 nm (blue); c) transfer characteristics in saturation regime showing a switching cycle of diarylethene: start (black), transfer after illumination at 313 nm (red) and transfer after illumination at 530 nm (blue); d) mobility and maximum drain current in saturation regime plotted for all the transfer curves depicted in fig. b) and c).
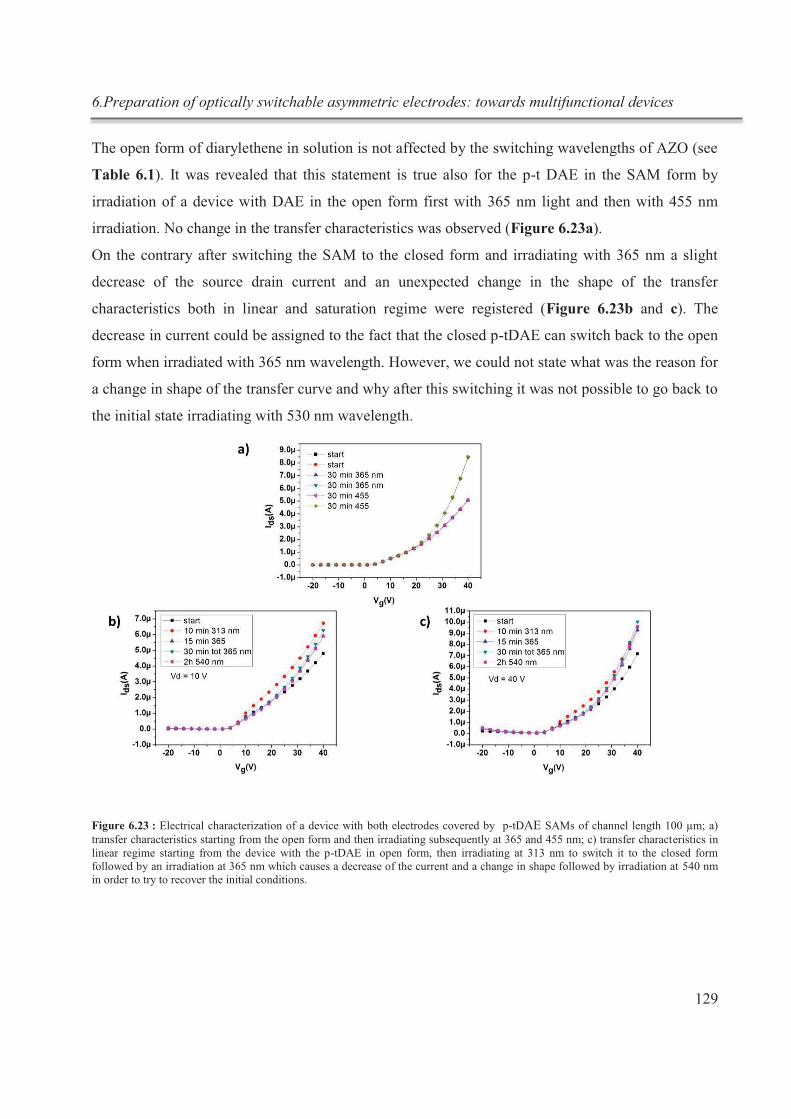
6.Preparation of optically switchable asymmetric electrodes: towards multifunctional devices
129
The open form of diarylethene in solution is not affected by the switching wavelengths of AZO (see
Table 6.1). It was revealed that this statement is true also for the p-t DAE in the SAM form by
irradiation of a device with DAE in the open form first with 365 nm light and then with 455 nm
irradiation. No change in the transfer characteristics was observed (Figure 6.23a).
On the contrary after switching the SAM to the closed form and irradiating with 365 nm a slight
decrease of the source drain current and an unexpected change in the shape of the transfer
characteristics both in linear and saturation regime were registered (Figure 6.23b and c). The
decrease in current could be assigned to the fact that the closed p-tDAE can switch back to the open
form when irradiated with 365 nm wavelength. However, we could not state what was the reason for
a change in shape of the transfer curve and why after this switching it was not possible to go back to
the initial state irradiating with 530 nm wavelength.
Figure 6.23 : Electrical characterization of a device with both electrodes covered by p-tDAE SAMs of channel length 100 µm; a) transfer characteristics starting from the open form and then irradiating subsequently at 365 and 455 nm; c) transfer characteristics in linear regime starting from the device with the p-tDAE in open form, then irradiating at 313 nm to switch it to the closed form followed by an irradiation at 365 nm which causes a decrease of the current and a change in shape followed by irradiation at 540 nm in order to try to recover the initial conditions.
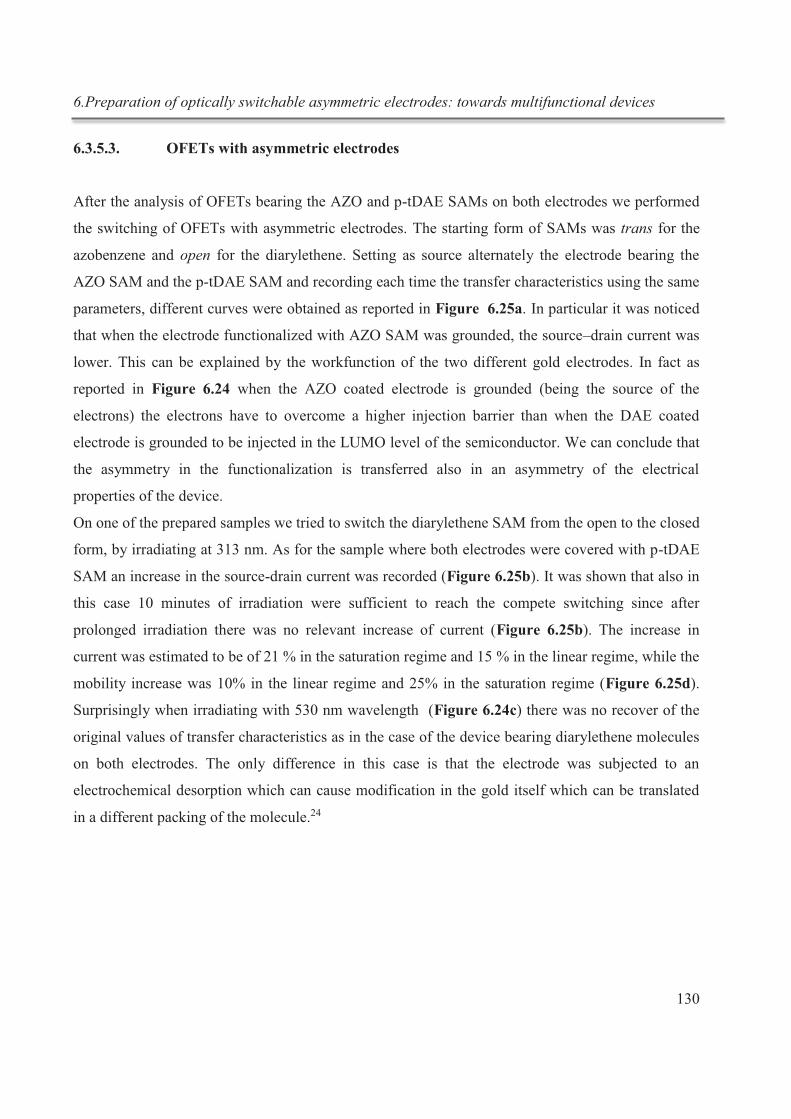
6.Preparation of optically switchable asymmetric electrodes: towards multifunctional devices
130
6.3.5.3. OFETs with asymmetric electrodes
After the analysis of OFETs bearing the AZO and p-tDAE SAMs on both electrodes we performed
the switching of OFETs with asymmetric electrodes. The starting form of SAMs was trans for the
azobenzene and open for the diarylethene. Setting as source alternately the electrode bearing the
AZO SAM and the p-tDAE SAM and recording each time the transfer characteristics using the same
parameters, different curves were obtained as reported in Figure 6.25a. In particular it was noticed
that when the electrode functionalized with AZO SAM was grounded, the source–drain current was
lower. This can be explained by the workfunction of the two different gold electrodes. In fact as
reported in Figure 6.24 when the AZO coated electrode is grounded (being the source of the
electrons) the electrons have to overcome a higher injection barrier than when the DAE coated
electrode is grounded to be injected in the LUMO level of the semiconductor. We can conclude that
the asymmetry in the functionalization is transferred also in an asymmetry of the electrical
properties of the device.
On one of the prepared samples we tried to switch the diarylethene SAM from the open to the closed
form, by irradiating at 313 nm. As for the sample where both electrodes were covered with p-tDAE
SAM an increase in the source-drain current was recorded (Figure 6.25b). It was shown that also in
this case 10 minutes of irradiation were sufficient to reach the compete switching since after
prolonged irradiation there was no relevant increase of current (Figure 6.25b). The increase in
current was estimated to be of 21 % in the saturation regime and 15 % in the linear regime, while the
mobility increase was 10% in the linear regime and 25% in the saturation regime (Figure 6.25d).
Surprisingly when irradiating with 530 nm wavelength (Figure 6.24c) there was no recover of the
original values of transfer characteristics as in the case of the device bearing diarylethene molecules
on both electrodes. The only difference in this case is that the electrode was subjected to an
electrochemical desorption which can cause modification in the gold itself which can be translated
in a different packing of the molecule.24
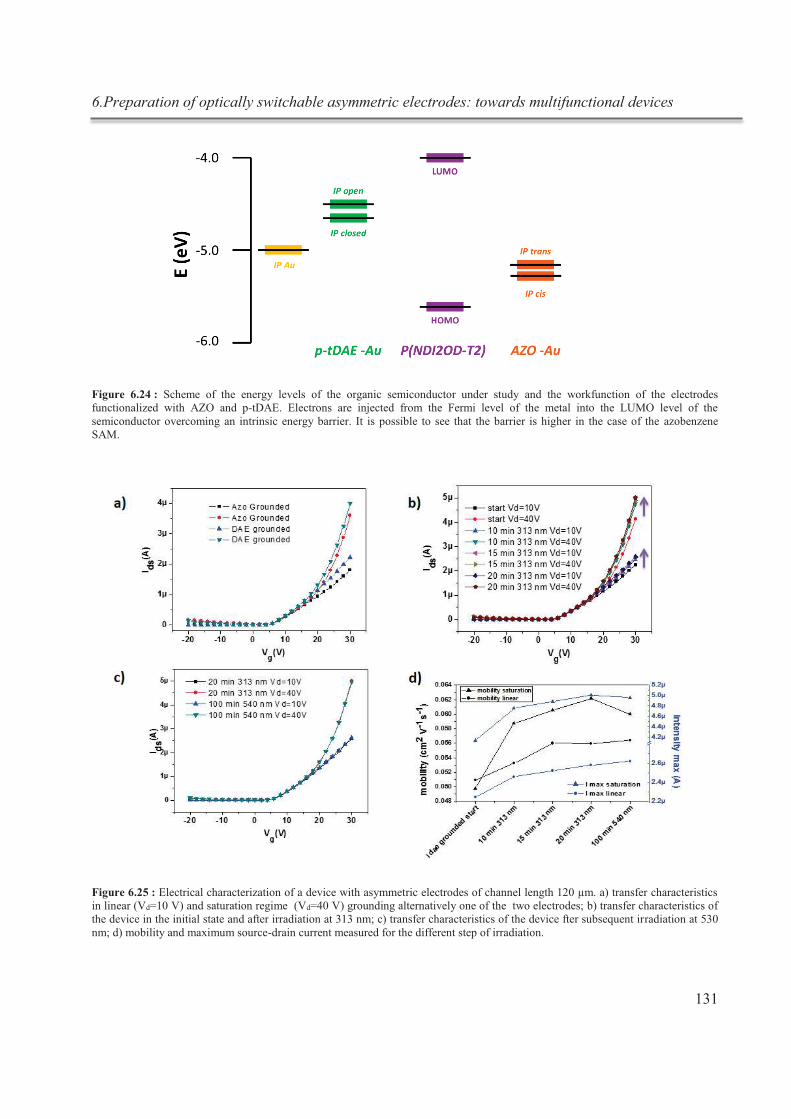
6.Preparation of optically switchable asymmetric electrodes: towards multifunctional devices
131
Figure 6.24 : Scheme of the energy levels of the organic semiconductor under study and the workfunction of the electrodes functionalized with AZO and p-tDAE. Electrons are injected from the Fermi level of the metal into the LUMO level of the semiconductor overcoming an intrinsic energy barrier. It is possible to see that the barrier is higher in the case of the azobenzene SAM.
Figure 6.25 : Electrical characterization of a device with asymmetric electrodes of channel length 120 µm. a) transfer characteristics in linear (Vd=10 V) and saturation regime (Vd=40 V) grounding alternatively one of the two electrodes; b) transfer characteristics of the device in the initial state and after irradiation at 313 nm; c) transfer characteristics of the device fter subsequent irradiation at 530 nm; d) mobility and maximum source-drain current measured for the different step of irradiation.
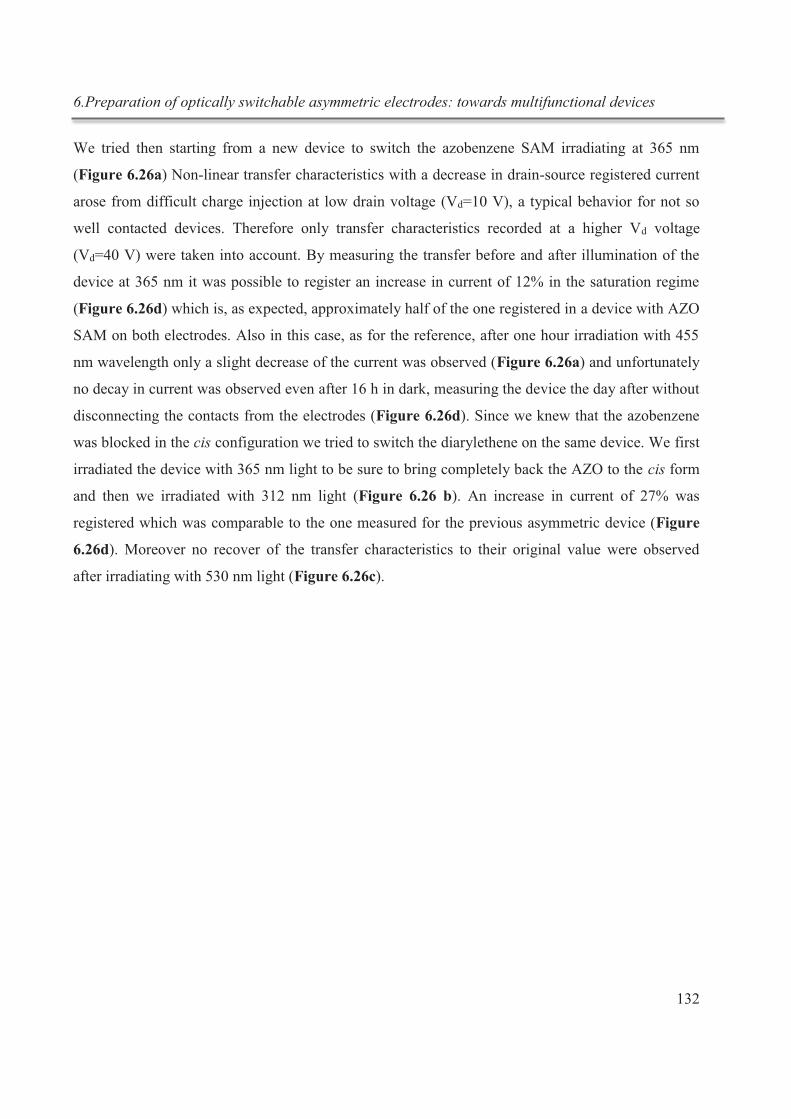
6.Preparation of optically switchable asymmetric electrodes: towards multifunctional devices
132
We tried then starting from a new device to switch the azobenzene SAM irradiating at 365 nm
(Figure 6.26a) Non-linear transfer characteristics with a decrease in drain-source registered current
arose from difficult charge injection at low drain voltage (Vd=10 V), a typical behavior for not so
well contacted devices. Therefore only transfer characteristics recorded at a higher Vd voltage
(Vd=40 V) were taken into account. By measuring the transfer before and after illumination of the
device at 365 nm it was possible to register an increase in current of 12% in the saturation regime
(Figure 6.26d) which is, as expected, approximately half of the one registered in a device with AZO
SAM on both electrodes. Also in this case, as for the reference, after one hour irradiation with 455
nm wavelength only a slight decrease of the current was observed (Figure 6.26a) and unfortunately
no decay in current was observed even after 16 h in dark, measuring the device the day after without
disconnecting the contacts from the electrodes (Figure 6.26d). Since we knew that the azobenzene
was blocked in the cis configuration we tried to switch the diarylethene on the same device. We first
irradiated the device with 365 nm light to be sure to bring completely back the AZO to the cis form
and then we irradiated with 312 nm light (Figure 6.26 b). An increase in current of 27% was
registered which was comparable to the one measured for the previous asymmetric device (Figure
6.26d). Moreover no recover of the transfer characteristics to their original value were observed
after irradiating with 530 nm light (Figure 6.26c).
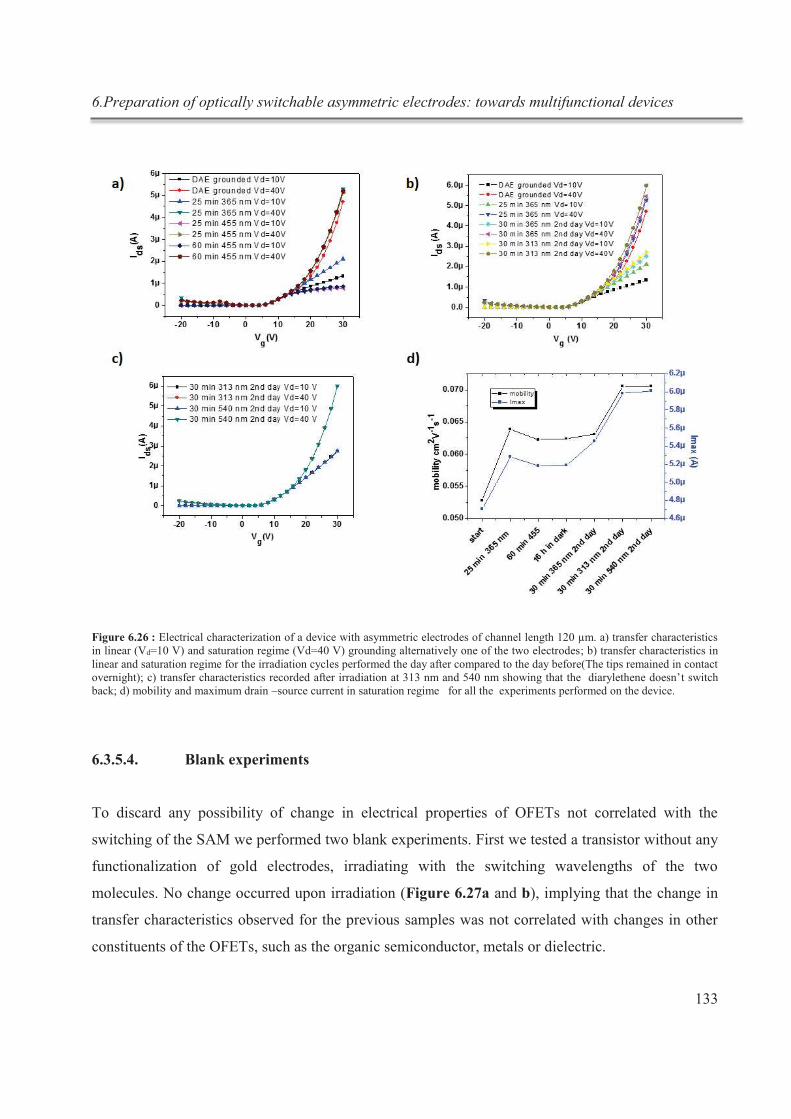
6.Preparation of optically switchable asymmetric electrodes: towards multifunctional devices
133
Figure 6.26 : Electrical characterization of a device with asymmetric electrodes of channel length 120 µm. a) transfer characteristics in linear (Vd=10 V) and saturation regime (Vd=40 V) grounding alternatively one of the two electrodes; b) transfer characteristics in linear and saturation regime for the irradiation cycles performed the day after compared to the day before(The tips remained in contact overnight); c) transfer characteristics recorded after irradiation at 313 nm and 540 nm showing that the diarylethene doesn’t switch back; d) mobility and maximum drain –source current in saturation regime for all the experiments performed on the device.
6.3.5.4. Blank experiments
To discard any possibility of change in electrical properties of OFETs not correlated with the
switching of the SAM we performed two blank experiments. First we tested a transistor without any
functionalization of gold electrodes, irradiating with the switching wavelengths of the two
molecules. No change occurred upon irradiation (Figure 6.27a and b), implying that the change in
transfer characteristics observed for the previous samples was not correlated with changes in other
constituents of the OFETs, such as the organic semiconductor, metals or dielectric.
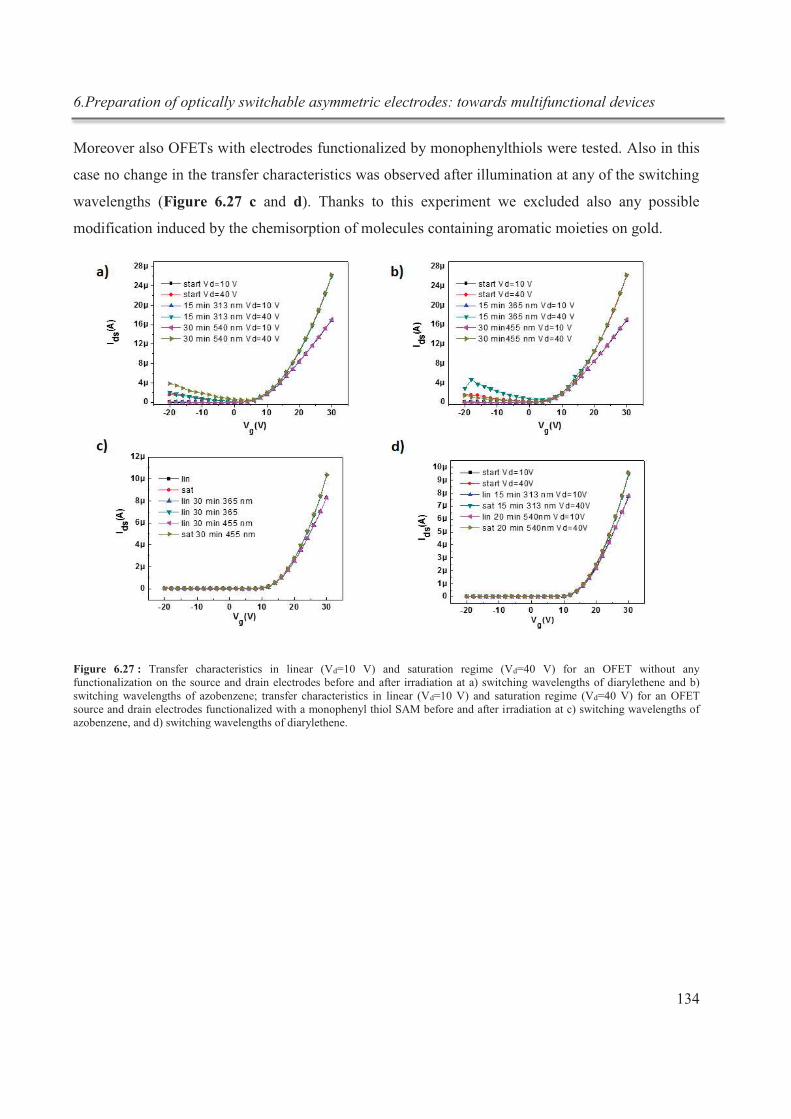
6.Preparation of optically switchable asymmetric electrodes: towards multifunctional devices
134
Moreover also OFETs with electrodes functionalized by monophenylthiols were tested. Also in this
case no change in the transfer characteristics was observed after illumination at any of the switching
wavelengths (Figure 6.27 c and d). Thanks to this experiment we excluded also any possible
modification induced by the chemisorption of molecules containing aromatic moieties on gold.
Figure 6.27 : Transfer characteristics in linear (Vd=10 V) and saturation regime (Vd=40 V) for an OFET without any functionalization on the source and drain electrodes before and after irradiation at a) switching wavelengths of diarylethene and b) switching wavelengths of azobenzene; transfer characteristics in linear (Vd=10 V) and saturation regime (Vd=40 V) for an OFET source and drain electrodes functionalized with a monophenyl thiol SAM before and after irradiation at c) switching wavelengths of azobenzene, and d) switching wavelengths of diarylethene.
6.Preparation of optically switchable asymmetric electrodes: towards multifunctional devices
135
6.4. Conclusions
In this chapter we have demonstrated that it is possible to functionalize two fully interdigitated
electrodes with two different photochromic self-assembled monolayers, thus creating asymmetric
electrodes which can respond to different light stimuli. First attempts have been done in order to
integrate the asymmetric electrodes in OFETs with bottom contact top gate geometry. The
independent switching of the two electrodes has been proven on reference samples bearing the same
type of SAM (i.e. AZO or p-t DAE) on both electrodes. When applied in a device, the AZO SAM is
blocked in the cis form after switching from the trans to the cis form. We attribute this behavior to
the rearrangement of the organic polymer. The p-tDAE SAM switching behavior is ideal in OFETs
with both electrodes functionalized with such a molecule forming SAM, while in devices with
asymmetric electrodes the p-tDAE SAM becomes blocked in the closed form after the first
switching from open to close. The only difference between the two devices could be a different
reorganization of gold after electrochemical desorption which could cause a different packing of the
SAM. We believe that though a careful design of the photoswitching molecules it will be possible to
overcome these problems and the implementation of this technique will generate new functionalities
in devices.
6.5. References
1. Yuan, Y.; Giri, G.; Ayzner, A. L.; Zoombelt, A. P.; Mannsfeld, S. C. B.; Chen, J.; Nordlund, D.; Toney, M. F.; Huang, J.; Bao, Z., Ultra-high mobility transparent organic thin film transistors grown by an off-centre spin-coating method. Nat Commun 2014, 5. 2. Liu, C.; Xu, Y.; Noh, Y.-Y., Contact engineering in organic field-effect transistors. Mater. Today 2015, 18 (2), 79-96. 3. (a) de Boer, B.; Hadipour, A.; Mandoc, M. M.; van Woudenbergh, T.; Blom, P. W. M., Tuning of Metal Work
Functions with Self-Assembled Monolayers. Adv. Mater. 2005, 17 (5), 621-625; (b) Campbell, I. H.; Kress, J. D.; Martin, R. L.; Smith, D. L.; Barashkov, N. N.; Ferraris, J. P., Controlling charge injection in organic electronic devices using self-assembled monolayers. Appl. Phys. Lett. 1997, 71 (24), 3528-3530. 4. Di, C.-a.; Zhang, F.; Zhu, D., Multi-Functional Integration of Organic Field-Effect Transistors (OFETs): Advances and Perspectives. Adv. Mater. 2013, 25 (3), 313-330. 5. Orgiu, E.; Samorì, P., 25th Anniversary Article: Organic Electronics Marries Photochromism: Generation of Multifunctional Interfaces, Materials, and Devices. Adv. Mater. 2014, 26 (12), 1827-1845. 6. Irie, M., Photochromism: Memories and SwitchesIntroduction. Chem. Rev. 2000, 100 (5), 1683-1684. 7. (a) Borjesson, K.; Herder, M.; Grubert, L.; Duong, D. T.; Salleo, A.; Hecht, S.; Orgiu, E.; Samori, P., Optically switchable transistors comprising a hybrid photochromic molecule/n-type organic active layer. J. Mater. Chem. C 2015; (b) Gemayel, M. E.; Börjesson, K.; Herder, M.; Duong, D. T.; Hutchison, J. A.; Ruzié, C.; Schweicher, G.; Salleo, A.; Geerts, Y.; Hecht, S.; Orgiu, E.; Samorì, P., Optically switchable transistors by simple incorporation of photochromic systems into small-molecule semiconducting matrices. Nat Commun 2015, 6; (c) Orgiu, E.; Crivillers, N.; Herder, M.; Grubert, L.; Pätzel, M.; Frisch, J.; Pavlica, E.; Duong, D. T.; Bratina, G.; Salleo, A.; Koch, N.; Hecht, S.; Samorì, P.,
6.Preparation of optically switchable asymmetric electrodes: towards multifunctional devices
136
Optically switchable transistor via energy-level phototuning in a bicomponent organic semiconductor. Nat Chem 2012, 4 (8), 675-679. 8. Crivillers, N.; Orgiu, E.; Reinders, F.; Mayor, M.; Samori, P., Optical Modulation of the Charge Injection in an Organic Field-Effect Transistor Based on Photochromic Self-Assembled-Monolayer-Functionalized Electrodes. Adv.
Mater. 2011, 23 (12), 1447-1452. 9. Kronemeijer, A. J.; Akkerman, H. B.; Kudernac, T.; van Wees, B. J.; Feringa, B. L.; Blom, P. W. M.; de Boer, B., Reversible Conductance Switching in Molecular Devices. Adv. Mater. 2008, 20 (8), 1467-1473. 10. Liscio, A.; Orgiu, E.; Mativetsky, J. M.; Palermo, V.; Samorì, P., Bottom-Up Fabricated Asymmetric Electrodes for Organic Electronics. Adv. Mater. 2010, 22 (44), 5018-5023. 11. Elbing, M.; Błaszczyk, A.; von Hänisch, C.; Mayor, M.; Ferri, V.; Grave, C.; Rampi, M. A.; Pace, G.; Samorì,
P.; Shaporenko, A.; Zharnikov, M., Single Component Self-Assembled Monolayers of Aromatic Azo-Biphenyl: Influence of the Packing Tightness on the SAM Structure and Light-Induced Molecular Movements. Adv. Funct. Mater.
2008, 18 (19), 2972-2983. 12. (a) Bonacchi, S.; El Garah, M.; Ciesielski, A.; Herder, M.; Conti, S.; Cecchini, M.; Hecht, S.; Samorì, P., Surface-Induced Selection During In Situ Photoswitching at the Solid/Liquid Interface. Angew. Chem. Int. Ed. 2015, n/a-n/a; (b) Irie, M.; Lifka, T.; Uchida, K.; Kobatake, S.; Shindo, Y., Fatigue resistant properties of photochromic dithienylethenes: by-product formation. Chem. Commun. 1999, (8), 747-750. 13. Pace, G.; Ferri, V.; Grave, C.; Elbing, M.; von Hanisch, C.; Zharnikov, M.; Mayor, M.; Rampi, M. A.; Samori, P., Cooperative light-induced molecular movements of highly ordered azobenzene self-assembled monolayers. Proc.
Natl. Acad. Sci. U. S. A. 2007, 104 (24), 9937-9942. 14. (a) Yang, G.; Liu, G.-y., New Insights for Self-Assembled Monolayers of Organothiols on Au(111) Revealed by Scanning Tunneling Microscopy. J. Phys. Chem. B 2003, 107 (34), 8746-8759; (b) Poirier, G. E., Mechanism of Formation of Au Vacancy Islands in Alkanethiol Monolayers on Au(111). Langmuir 1997, 13 (7), 2019-2026. 15. (a) Ishida, T.; Mizutani, W.; Azehara, H.; Sato, F.; Choi, N.; Akiba, U.; Fujihira, M.; Tokumoto, H., Adsorption Processes of Self-Assembled Monolayers Made from Terphenyl Thiols. Langmuir 2001, 17 (24), 7459-7463; (b) Love, J. C.; Estroff, L. A.; Kriebel, J. K.; Nuzzo, R. G.; Whitesides, G. M., Self-assembled monolayers of thiolates on metals as a form of nanotechnology. Chem Rev 2005, 105 (4), 1103-69. 16. Vericat, C.; Vela, M. E.; Benitez, G.; Carro, P.; Salvarezza, R. C., Self-assembled monolayers of thiols and dithiols on gold: new challenges for a well-known system. Chem. Soc. Rev. 2010, 39 (5), 1805-1834. 17. Crivillers, N.; Liscio, A.; Di Stasio, F.; Van Dyck, C.; Osella, S.; Cornil, D.; Mian, S.; Lazzerini, G. M.; Fenwick, O.; Orgiu, E.; Reinders, F.; Braun, S.; Fahlman, M.; Mayor, M.; Cornil, J.; Palermo, V.; Cacialli, F.; Samori, P., Photoinduced work function changes by isomerization of a densely packed azobenzene-based SAM on Au: a joint experimental and theoretical study. Phys. Chem. Chem. Phys. 2011, 13 (32), 14302-14310. 18. (a) Zhuang, M.; Ernzerhof, M., Reversibility and transport properties of dithienylethene photoswitches. J.
Chem. Phys. 2009, 130 (11), 114704; (b) Dulić, D.; van der Molen, S. J.; Kudernac, T.; Jonkman, H. T.; de Jong, J. J. D.; Bowden, T. N.; van Esch, J.; Feringa, B. L.; van Wees, B. J., One-Way Optoelectronic Switching of Photochromic Molecules on Gold. Phys. Rev. Lett. 2003, 91 (20), 207402. 19. Noh, J.; Jeong, Y.; Ito, E.; Hara, M., Formation and Domain Structure of Self-Assembled Monolayers by Adsorption of Tetrahydrothiophene on Au(111). J. Phys. Chem. C 2007, 111 (6), 2691-2695. 20. (a) Ishida, T.; Hara, M.; Kojima, I.; Tsuneda, S.; Nishida, N.; Sasabe, H.; Knoll, W., High resolution x-ray photoelectron spectroscopy measurements of octadecanethiol self-assembled monolayers on Au(111). Langmuir 1998, 14 (8), 2092-2096; (b) Ishida, T.; Choi, N.; Mizutani, W.; Tokumoto, H.; Kojima, I.; Azehara, H.; Hokari, H.; Akiba, U.; Fujihira, M., High-Resolution X-ray Photoelectron Spectra of Organosulfur Monolayers on Au(111): S(2p) Spectral
Dependence on Molecular Species. Langmuir 1999, 15 (20), 6799-6806. 21. Mamun, A. H. A.; Hahn, J. R., Effects of Solvent on the Formation of Octanethiol Self-Assembled Monolayers on Au(111) at High Temperatures in a Closed Vessel: A Scanning Tunneling Microscopy and X-ray Photoelectron Spectroscopy Study. J. Phys. Chem. C 2012, 116 (42), 22441-22448. 22. Sun, K.; Jiang, B.; Jiang, X., Electrochemical desorption of self-assembled monolayers and its applications in surface chemistry and cell biology. J. Electroanal. Chem. 2011, 656 (1–2), 223-230. 23. (a) Yang, D. F.; Al-Maznai, H.; Morin, M., Vibrational Study of the Fast Reductive and the Slow Oxidative Desorptions of a Nonanethiol Self-Assembled Monolayer from a Au(111) Single Crystal Electrode. J. Phys. Chem. B
1997, 101 (7), 1158-1166; (b) Sheridan, A. K.; Ngamukot, P.; Bartlett, P. N.; Wilkinson, J. S., Waveguide surface plasmon resonance sensing: Electrochemical desorption of alkane thiol monolayers. Sens. Actuator B-Chem. 2006, 117 (1), 253-260. 24. Carvalhal, R. F.; Sanches Freire, R.; Kubota, L. T., Polycrystalline Gold Electrodes: A Comparative Study of Pretreatment Procedures Used for Cleaning and Thiol Self-Assembly Monolayer Formation. Electroanalysis 2005, 17 (14), 1251-1259.

6.Preparation of optically switchable asymmetric electrodes: towards multifunctional devices
137
25. Yan, H.; Chen, Z. H.; Zheng, Y.; Newman, C.; Quinn, J. R.; Dotz, F.; Kastler, M.; Facchetti, A., A high-mobility electron-transporting polymer for printed transistors. Nature 2009, 457 (7230), 679-U1. 26. Luzio, A.; Criante, L.; D'Innocenzo, V.; Caironi, M., Control of charge transport in a semiconducting copolymer by solvent-induced long-range order. Sci. Rep. 2013, 3. 27. Noriega, R.; Rivnay, J.; Vandewal, K.; Koch, F. P.; Stingelin, N.; Smith, P.; Toney, M. F.; Salleo, A., A general relationship between disorder, aggregation and charge transport in conjugated polymers. Nat. Mater. 2013, 12 (11), 1038-44.
7.Conclusion and perspectives
138
7. Conclusion and perspectives
In this thesis we investigated supramolecular interactions with the objective of exploring them as a
tool towards the development of functional supramolecular architectures useful in nanotechnology.
In the first part of the thesis we studied a well-known host-guest system, the complexation of
potassium ions (K+) by cryptand [2.2.2], using an analytical tool explored only recently by
supramolecular chemists, the isothermal titration calorimetry (ITC). We demonstrated that by means
of ITC it is possible to follow with in-situ experiments the reversible complexation / decomplexation
of the system cryptand-K+ by subsequent in-situ titrations adding after the formation of the cryptate,
first a strong acid and then a strong base. In each titration it was possible to determine the
thermodynamic parameters relative to the process of complexation of potassium ions by cryptand
[2.2.2].The choice of water as a medium can lead to some complications in the analysis of equilibria
involving the binding of acidic or basic substrates because in water a significant fraction of cryptand
[2.2.2] is present in the monoprotonated form. We showed that optimum condition for the
determination of the thermodynamic parameters is a concentration at least of 1 mM.
We believe that ITC is a very useful analytical tool to be still fully explored in supramolecular
chemistry, given that with one experiment it is possible to gain knowledge of the entropic and
enthalpic contributions of a binding event.
In the second part, we showed that it is possible to exploit supramolecular interactions in order to
improve the quality of graphene produced by liquid-phase exfoliation (LPE). In particular, we
compared the dispersions produced in presence of two stabilizing agents, a simple coronene
molecule and a perchlorinated coronene. Theoretical calculations predicted that chlorine can atoms
increase the polarizability of the molecule therefore improving the interaction with graphene. This
result was confirmed by thermal desorption spectroscopy where the activation energy for desorption
of perchlorocoronene from graphite was found to be higher than the one of simple coronene. In
general, the use of these two stabilizing agents during exfoliation in o-DCB solvent resulted in an
improvement in the quality of the graphene produced. The higher interaction of chlorinated
coronene however produced a higher number of monolayers in the final dispersion compared to
7.Conclusion and perspectives
139
coronene. This study showed that supramolecular interactions are useful in order to produce good
quality LPE graphene and the more suitable exfoliators/stabilizing agents can be predicted using a
simple theoretical model. This model still needs to be improved in order to take into account
different liquid media. Successful exfoliations are strictly dependent on the solvent choice with
appropriate surface tension, which dictates solvent-molecules and solvent–graphene interactions.
The exploitation of ad-hoc molecules and the choice of the correct solvent to promote the
exfoliation of graphite in liquid media through non-covalent interactions can lead to upscalable
production of graphene, which can be used in composites or in organic electronics.
We finally demonstrated that it is possible to prepare asymmetric interdigitated electrodes bearing
self-assembled monolayers of two different photochromic switches families on each electrode, i.e.
azobenzene and diarylethene. The formation of asymmetric electrodes was proved by XPS and the
retained switching properties of the molecules once immobilized on the surface were proved by UV-
Vis spectroscopy. First attempts of implementation of these electrodes in organic field-effect
transistors were performed in order to show that self-assembled monolayer can be used as active
material in a device, to increase the number of functionalities of the device itself. In fact through an
appropriate irradiation at different wavelengths it could be possible to modulate the charge injection
of each electrode independently thus increasing the number of independent stimuli to which the
device can respond. However in our case the switching in the asymmetric device was irreversible for
both diarylethene and azobenzene SAMs, showing that in a device structure there can be complex
interplays between the different components. An effort in research of suitable device geometries and
in the molecular design has to be made in order to overcome these problems.
In summary this thesis shows how supramolecular interactions can be exploited to tune the
properties of multicomponent thus multifunctional materials of special interest for fundamental
studies in materials and nanosciences towards technological applications in nanotechnology.
Regarding the first section, analytical tools such as ITC are the basis for further developments of
supramolecular chemistry. As Cram explained in his Nobel lecture, “evolution has produced
chemical compounds exquisitely organized to accomplish the most complicated and delicate of
tasks. Many organic chemists viewing crystal structures of enzyme systems or nucleic acids and
knowing the marvels of specificity of the immune systems must dream of designing and
synthesizing simpler organic compounds that imitate working features of these naturally occurring
7.Conclusion and perspectives
140
compounds.” Therefore, bio-inspired supramolecular approaches leading to functional architectures
with features similar to the one observed in nature are since ever the goal of synthetic chemists.
However, tailoring synthetic receptors to a target analyte requires the perfect understanding of the
molecular interactions governing the recognition processes. In this context, ITC is an extremely
powerful tool for elucidating the interactions involved in supramolecular recognition and assembly
events, thus being an important aid in the design of new receptors. Once designed, these receptors
can be employed in nanotechnology in real devices for sensing application.
We have shown that the exploitation of different non-covalent interactions can boost the production
of liquid phase exfoliated graphene, and in general of 2-D materials. The intrinsic complexity of all
interactions at work in an exfoliation procedure still needs a higher knowledge of fundamental
parameters. Adsorption energy and interactions of the surfactant molecules with graphene in
presence of the solvent are key parameters for the future design of new efficient stabilizing agents.
Thermal desorption spectroscopy and simple theoretical calculations, however, do not take into
account the role of the solvent. Therefore ITC is an ideal technique to understand and measure the
interaction of potential stabilizing agents with graphene in a specific solvent, therefore being a
complementary driving tool in design, choice and exploitation on exfoliating agents beside
theoretical calculations.
Graphene and in general 2-D materials hold the future of nanotechnology with their exceptional
properties. It is predictable that the applicability of this material will span in every field of
nanotechnology, from composites to organic electronics to biomedical applications. However, the
current and future market for graphene applications is strictly connected to the production strategies
for these materials. The first application available in the market will probability be the one involving
graphene inks, since it is at present one of the few kind of graphene potentially producible on a large
scale. However, the not highest grade of this graphene will limit its application to flexible electronic
devices, such as solar cells and supercapacitors. An effort in improving the quality of produced
graphene will lead to further applications of this material in other nanotechnology fields such as
biosensors. In this contest supramolecular chemistry can also play an important role. For many
biological and analytical applications, graphene surface needs to be functionalized with
biomolecules or receptors. Covalent strategies are detrimental for graphene electronic properties
since they notch the so desired conductance properties. On this regard, supramolecular chemistry
7.Conclusion and perspectives
141
can have a fundamental role in designing receptors which contain moieties interacting with graphene
through non-covalent interactions.
Concerning the last part of this work, the application of photoswitchable self-assembled monolayers
in real devices has been shown to be promising for the realization of multi-responsive organic
field-effect transistors. More in general, smart surfaces, made of functional molecular units arranged
in ordered architectures which are able to respond to a certain stimulus (pH, light, heat, electric or
magnetic field) can be integrated in electronic devices, since they are able to change their structure
and therefore switching their molecular properties. The application of these functional structures can
involve different areas of organic electronics such as chemical sensors, data storage devices,
transistors. The demonstration carried out in this thesis is of great importance since transistors are
basic components in integrated circuits. Therefore the application of multi-responsive fashion to
OFETs is an important step towards integration in market-ready devices.
8.Acknowledgements
142
8. Acknowledgements
The journey towards the thesis completion has not always been smooth and easy and, without the
help of many people who deserve my gratitude, I would never have reached the final goal.
First of all, I want to thank Prof. Paolo Samorì for giving me the opportunity to perform the PhD in
the Nanochemistry Lab. I want to thank him for his advices, his patience and support and for giving
me the opportunity to work in the framework of a European project, GENIUS, therefore having the
chance to collaborate with scientist from all over Europe in a multidisciplinary environment. Grazie
Paolo!
I express all my gratitude to Prof. Jack Harrowfield for his precious help and for the stimulating
scientific discussions, which introduced me in the supramolecular chemistry world. I really
appreciated the time he spent with me, giving me useful tips and advices, believing that the ITC
project could be completed despite all the obstacles. Grazie mille Jack per il tuo prezioso aiuto!
In the framework of the graphene project I want to thank Prof. Klaus Mullen and Prof. Xinliang
Feng (Max-Planck Institute for Polymer research, Mainz) for providing me with the chlorinated and
hydrogenated aromatic compounds, Dr. Marco Cecchini and Simone Conti (ISIS-Strabourg) for the
theoretical calculations and for the useful explanations, Prof. Ovidiu Ersen and Georgian Melinte
(IPCMS-Strasbourg) for the TEM analysis, Dr. Cinzia Casiraghi and Yuyoung Shin (University of
Manchester) for the Raman characterization and Prof. Manfred Kappes and Dr. Böttcher (KIT-
Karlsruhe) for the TPD measurements.
I acknowledge Prof. Marcel Mayor and Dr Federica Reinders (University of Basel) for the synthesis
of the biphenyl azobenzene thioacetate and Prof. Stefan Hecht and Dr. Martin Herder (Humboldt
University- Berlin) for diarylethenes thioacetate synthesis, Dr. Fanny Richard for the XPS
measurements.
I am really grateful to my colleagues which helped me and supported me. From each one of them I
learned something not only from the scientific point of you but also most importantly from the
human point of you.
8.Acknowledgements
143
I wish to thank Dr. Artur Ciesielski and Dr. Oliver Fenwick for supervising me during these four
years of PhD giving me useful advices and tips. I thank Dr. Emanuele Orgiu and Dr. Sara Bonacchi
for the useful scientific discussions and help. Thanks to Dr. Alexander Klekachev, Dr. Marco Gobbi,
Dr. Lei Zhang, Dr. Fanny Richard, Dr. Corinna Raimondo, Dr. Andrea Cadeddu, Dr. Silvia Colella,
Dr. Markus Döbellin, Dr. Jorn-Oliver Vogel, Dr. Appan Merari Masillamani, Dr. Mohamed El
Garah, Dr. Karl Börjesson, Dr. Matthias Treier, Dr. Songlin Li, Dr. Xiaoyan Zhang, Dr. Lili Hou,
Dr. Anna Llanes-Pallas, Dr. Gareth Nealon, Dr. Nicolas Weibel.
All my gratitude to my PhD colleagues Dr. Laura Ferlauto, Dr. Lucia Gramigna, Marco Squillaci,
Tim Leydecker, Wassima Rekab, Sébastien Haar, Tindara Verduci, Dr. Gabriella Zappalà,
Agostino Galanti, Matilde Eredia, Serena Morselli and Karima Bouras. I acknowledge in particular
Marc-Antoine Stoeckel for the help with the French resumée. I also acknowledge Alessandro
Aliprandi for his advices concerning photochemistry. Without your help, the support and the funny
moments spent inside and outside the lab these four years would not have been the same. Grazie
mille ragazzi!
There are two special girls with whom I started this PhD adventure, Chiara Musumeci and Mirella
El Gemayel. Thank you Chiara and Mirella for being always by my side and encouraging me every
day, for the laughing and the beautiful days spent together.
I thank Corinne Cledger, Marie-Claude Jouaiti and Axel Duthey for all the administrative help and
ISIS staff, in particular Fabien, Muriel, Fabienne, Thierry and Philippe.
In these four years, I met many friends in Strasbourg, which made my stay here constellated of
beautiful moments and souvenirs: Gaëlle, Claudio, José, Mihai, Giangi, Enrica, Greta, Dario, Nadia,
Petr, Kaca, Federica, Elena, Beatrice, Irene, Alessandro, Pierre, Gareth, Ylenia, Jennie, Lars,…
Thank you Gaëlle and Claudio for supporting me and for the funny moments spent together. Giangi
you were the best guide ever in the first year of PhD and you encouraged me not to give up
soon…grazie mille. Nadia, we shared the “love and hate” parts of a PhD, we gave each other
support, and finally we made it! Enrica thanks for the nice promenades together discussing about
life, the time spent with you was precious. I thank you all guys!
The most important acknowledgment goes to my family: my parents, my sister Teresa, my
grandparents, my uncles Carmela and Vincenzo, my cousins Annamaria and Roberto and my best
friend Katiana that always supported me and believed in me.

8.Acknowledgements
144
Words cannot express how grateful I am to Thomas. You were always there by my side, helping me
inside and outside the lab, telling me that I could make it despite all the difficulties, always being
able to dry my tears and transform them into a smile. You are a great person and a great scientist and
you deserve all the best! I do not know how to thank you for all these beautiful two years of love
and happiness. Meeting you is the best gift that Strasbourg could give me. We will leave this
beautiful city but TOGETHER towards a new chapter of our life.
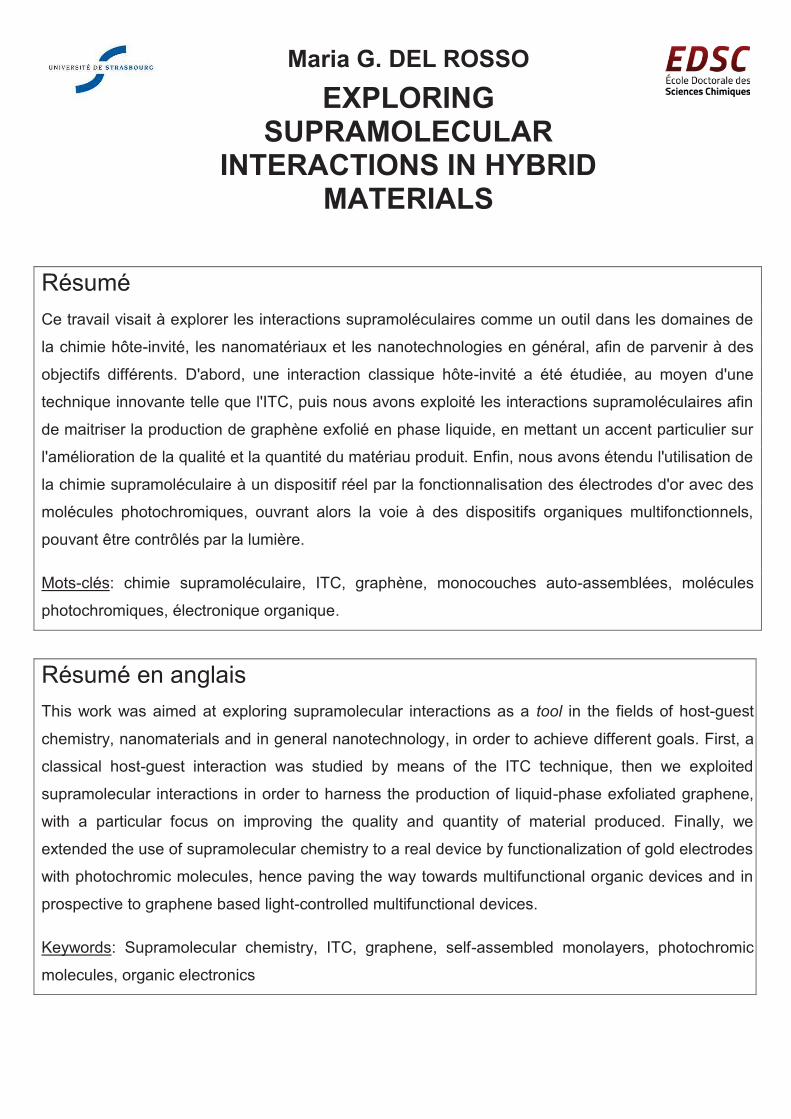
Maria G. DEL ROSSO
EXPLORING SUPRAMOLECULAR
INTERACTIONS IN HYBRID MATERIALS
Résumé
Ce travail visait à explorer les interactions supramoléculaires comme un outil dans les domaines de
la chimie hôte-invité, les nanomatériaux et les nanotechnologies en général, afin de parvenir à des
objectifs différents. D'abord, une interaction classique hôte-invité a été étudiée, au moyen d'une
technique innovante telle que l'ITC, puis nous avons exploité les interactions supramoléculaires afin
de maitriser la production de graphène exfolié en phase liquide, en mettant un accent particulier sur
l'amélioration de la qualité et la quantité du matériau produit. Enfin, nous avons étendu l'utilisation de
la chimie supramoléculaire à un dispositif réel par la fonctionnalisation des électrodes d'or avec des
molécules photochromiques, ouvrant alors la voie à des dispositifs organiques multifonctionnels,
pouvant être contrôlés par la lumière.
Mots-clés: chimie supramoléculaire, ITC, graphène, monocouches auto-assemblées, molécules
photochromiques, électronique organique.
Résumé en anglais
This work was aimed at exploring supramolecular interactions as a tool in the fields of host-guest
chemistry, nanomaterials and in general nanotechnology, in order to achieve different goals. First, a
classical host-guest interaction was studied by means of the ITC technique, then we exploited
supramolecular interactions in order to harness the production of liquid-phase exfoliated graphene,
with a particular focus on improving the quality and quantity of material produced. Finally, we
extended the use of supramolecular chemistry to a real device by functionalization of gold electrodes
with photochromic molecules, hence paving the way towards multifunctional organic devices and in
prospective to graphene based light-controlled multifunctional devices.
Keywords: Supramolecular chemistry, ITC, graphene, self-assembled monolayers, photochromic
molecules, organic electronics