Embed Size (px)
Citation preview
Combining Mahalanobis and Jaccard Distance to
Overcome Similarity Measurement Constriction on
Geometrical Shapes
Siti Salwa Salleh1, Noor Aznimah Abdul Aziz1, Daud Mohamad1 and Megawati Omar2
1Faculty of Computer and Mathematical Sciences
University Technology MARA
Shah Alam, Malaysia
2Research Management Institute
University Technology MARA
Shah Alam, Malaysia
Abstract In this study Jaccard Distance was performed by measuring the
asymmetric information on binary variable and the comparison
between vectors component. It compared two objects and notified
the degree of similarity of these objects. After thorough pre-
processing tasks; like translation, rotation, invariance scale
content and noise resistance done onto the hand sketch object,
Jaccard distance still did not show significance improvement.
Hence this paper combined Mahalanobis measure with Jaccard
distance to improve the similarity performances. It started with
the same pre-processing tasks and feature analysis, shape
normalization, shape perfection and followed with binary data
conversion. Then each edge of the geometric shape was separated
and measured using Jaccard distance. The shapes that passed the
threshold value were measured by Mahalanobis distance. The
results showed that the similarity percentage had increased from
61% to 84%, thus accrued an improved average of 21.6%
difference.
Keywords - Jaccard Distance, Mahalanobis distance, distance
measures, shape recognition, similarity measurement
1. Introduction
Similarity measure using distance measure techniques is
one of the popular methods that are able to evaluate the
similarity between two objects. It works in the manner that
small distances correspond to large similarities and large
distances do the small. Similarity measure has been used
widely in the shape recognition classifier. Recently,
recognition, which is based on shape, has been used in
image processing, medical diagnosis, trademarks, shape
retrieval, image retrieval, and industrial parts. Shape
features have been used to measure similarity between
objects [1] as it is a dominant feature of an object as it
consist lines, contours, curves, and vertices. It is normally
presented by discrete sets of points or sets of pixels value
which are sampled from the regions or internal and external
contours of the object [2].
It is widely used for measuring the similarity between
patterns as reported in [1, 3, 4, 5, 6, 7], where patterns that
are similar will have a small distance. While uncorrelated
pattern in the feature space will have a far apart distance.
The best way to select a distance or similarity measure is
by identifying the most minimum vector space values by a
simple function [7]. Another factor to consider is how
close one point in the vector is to another between the two
points [8], working on vector model and classification, to
measure the similarity between two feature matrices of
objects.
This measure is extensively employed in content-based
image retrieval, shape-based image retrieval, and planar
object recognition. It contributes to an accurate automatic
retrieving system for trademark images [4], handwritten
digit recognition [3], automatic bank cheque processing
application [5], and texture [8].
To date, various distance measures techniques have been
proposed and investigated theoretically. Distance measures
that provide reasonable results for images comparison
includes Euclidean Distance [6], Mahalanobis Distance [5],
Chord Distance [1], Cosine Distance [4], Trigonometric
Distance [7], Jaccard Distance [3] and others. Among
these, the Jaccard Distance is the simplest and effective
since it is based on the shape features and comparison [3].
Furthermore, the computation involved in the Jaccard
Distance is simple, which leads to low computation time.
The next section of this paper briefly describes the sketch
property and issues, Mahalanobis and Jaccard distances
measures and their semantics. Section 3 discusses the
feature analysis and transformation, and the methodology
of combining the Mahalanobis and Jaccard distance
measures. Section 4 explains the results and discussions.
IJCSI International Journal of Computer Science Issues, Vol. 9, Issue 4, No 1, July 2012 ISSN (Online): 1694-0814 www.IJCSI.org 124
Copyright (c) 2012 International Journal of Computer Science Issues. All Rights Reserved.
Along the way, a few interesting findings were discovered
which are presented in Section 4. Finally Section 5
concludes and discusses future work.
2. Problem Statement and Objectives
Each distance function has its own strength and weakness;
therefore researchers must take extra care to select distance
measures to match their needs and applications.
In this case a preliminary experiment [9] was conducted to
identify the Jaccard Distance similarity measurement
capability and to learn how the preprocessing tasks can
improve its recognition performance. Briefly, the Jaccard
Distance is performed by measuring the asymmetric
information on binary variables and the comparison
between vectors components. Further explanation on
Jaccard Distance is presented in the later section.
This study evaluated the recognition performance on
isolated digits hand writing using a pen-based device. The
outcome of the experiment showed that low recognition was
achieved by the conventional Jaccard Distance when there
was no preprocessing task done on the input. However, after
translation, rotation, invariance scale content and noise
resistance (ROITRS) were added, the recognition progress
showed a little improvement. But, the improvement was not
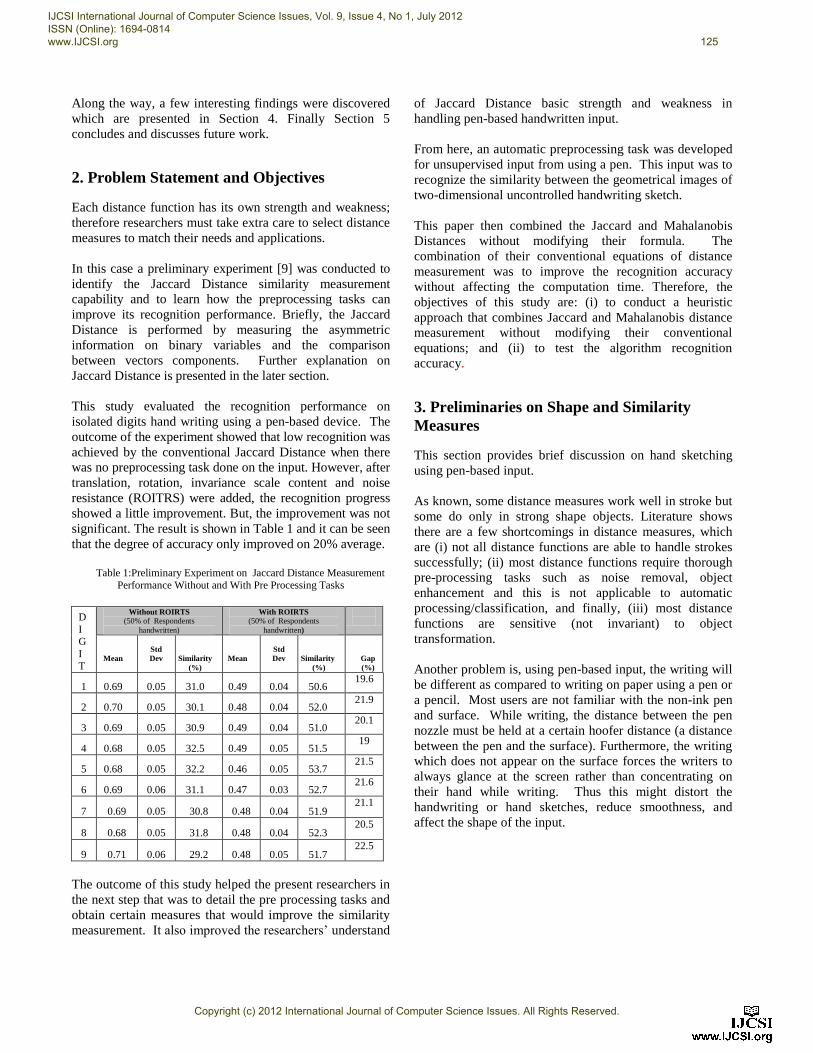
significant. The result is shown in Table 1 and it can be seen
that the degree of accuracy only improved on 20% average.
Table 1:Preliminary Experiment on Jaccard Distance Measurement
Performance Without and With Pre Processing Tasks
D
I G
I
T
Without ROIRTS
(50% of Respondents
handwritten)
With ROIRTS
(50% of Respondents
handwritten)
Mean
Std
Dev
Similarity
(%)
Mean
Std
Dev
Similarity
(%)
Gap
(%)
1 0.69 0.05 31.0 0.49 0.04 50.6 19.6
2 0.70 0.05 30.1 0.48 0.04 52.0 21.9
3 0.69 0.05 30.9 0.49 0.04 51.0 20.1
4 0.68 0.05 32.5 0.49 0.05 51.5 19
5 0.68 0.05 32.2 0.46 0.05 53.7 21.5
6 0.69 0.06 31.1 0.47 0.03 52.7 21.6
7 0.69 0.05 30.8 0.48 0.04 51.9 21.1
8 0.68 0.05 31.8 0.48 0.04 52.3 20.5
9 0.71 0.06 29.2 0.48 0.05 51.7 22.5
The outcome of this study helped the present researchers in
the next step that was to detail the pre processing tasks and
obtain certain measures that would improve the similarity
measurement. It also improved the researchers’ understand
of Jaccard Distance basic strength and weakness in
handling pen-based handwritten input.
From here, an automatic preprocessing task was developed
for unsupervised input from using a pen. This input was to
recognize the similarity between the geometrical images of
two-dimensional uncontrolled handwriting sketch.
This paper then combined the Jaccard and Mahalanobis
Distances without modifying their formula. The
combination of their conventional equations of distance
measurement was to improve the recognition accuracy
without affecting the computation time. Therefore, the
objectives of this study are: (i) to conduct a heuristic
approach that combines Jaccard and Mahalanobis distance
measurement without modifying their conventional
equations; and (ii) to test the algorithm recognition
accuracy.
3. Preliminaries on Shape and Similarity
Measures
This section provides brief discussion on hand sketching
using pen-based input.
As known, some distance measures work well in stroke but
some do only in strong shape objects. Literature shows
there are a few shortcomings in distance measures, which
are (i) not all distance functions are able to handle strokes
successfully; (ii) most distance functions require thorough
pre-processing tasks such as noise removal, object
enhancement and this is not applicable to automatic
processing/classification, and finally, (iii) most distance
functions are sensitive (not invariant) to object
transformation.
Another problem is, using pen-based input, the writing will
be different as compared to writing on paper using a pen or
a pencil. Most users are not familiar with the non-ink pen
and surface. While writing, the distance between the pen
nozzle must be held at a certain hoofer distance (a distance
between the pen and the surface). Furthermore, the writing
which does not appear on the surface forces the writers to
always glance at the screen rather than concentrating on
their hand while writing. Thus this might distort the
handwriting or hand sketches, reduce smoothness, and
affect the shape of the input.
IJCSI International Journal of Computer Science Issues, Vol. 9, Issue 4, No 1, July 2012 ISSN (Online): 1694-0814 www.IJCSI.org 125
Copyright (c) 2012 International Journal of Computer Science Issues. All Rights Reserved.
3.1 Shape Properties and Issues
In this study, a shape is defined as a spatial information of
an object which is determined by its external boundary. It
can be categorized as geometrical or organic shapes.
Geometric shapes are usually angular and appearing
frequently in man-made objects, which also posses
orientation. Each shape is precise. Basic geotmeric shapes
in mathematics are square, triangle and circle where others
are of these variations or combinations. They are diamond,
oval, rectangle, parallelogram, trapezoid, pentagon,
pentagram, hexagon and octagon.
In current advancement, mobile devices input surfaces
allow users to draw or sketch objects shapes using a stylus
of which has become free-hand drawing or sketching.
However, the most crucial issue in designing new
application falls on the strikes or line variations of the
shapes. Even though holding a stylus is similar to holding a
pen, the users will still produce variations in stroke size,
density, length, width, continuity, smoothness, and pointing
connection [12]. Thus this may produce unintended shapes
of drawing. Other challenges are on input surface
calibration and surface sensitivity. Users do not calibrate
their surface coordinate in a regular basis. Likewise, users
who are not familiar with technicalities may also do not
realize that the calibration does not fit. This will also lead
to variations in the sketched objects and shapes. Since this
variability stems from several distinct sources, a reliable
algorithm is highly required in recognizing sketches [14].
Therefore, in relation to the shortcomings mentioned
above, this study analyzed how well Jaccard Distance
measures the similarity of pen-based input handwriting
shape that contains strokes. The required pre-processing
tasks to support Jaccard Distance in improving the
similarity measurements was also studied. Secondly, the
study observed how far Jaccard Distance could improve the
measurement. Finally, since most distance measures are
variant to transformation, this study also helped us learn
how sensitive the Jaccard Distance is to object
transformations.
3.2 Jaccard Distance
Jaccard Distance is basically employed to compare two
objects in a binary format and it also does not require a
large set of data for training and testing purposes. It works
by measuring the asymmetric information on binary
variables, the comparison between two vector components.
The computation of the Jaccard Distance measure
determines the correlated or uncorrelated patterns based on
pixel-based description where it takes into account the
number of pixels in the foreground and the background of
both patterns that lead to similar or dissimilar patterns.
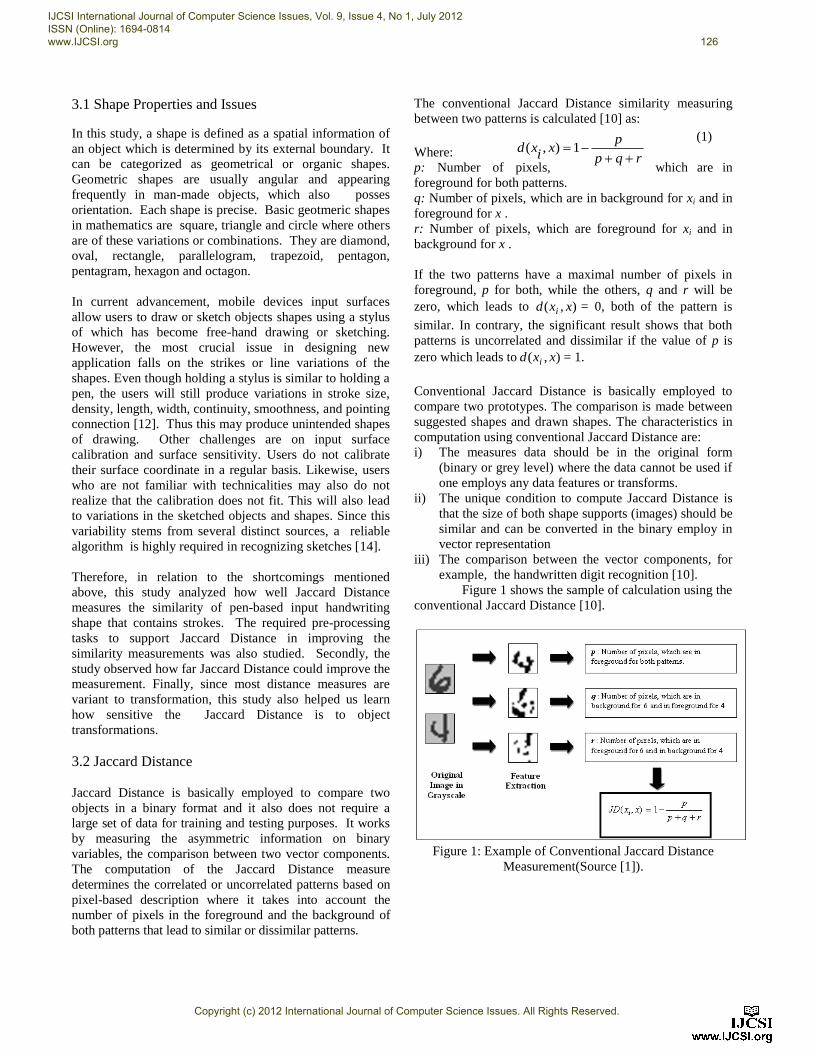
The conventional Jaccard Distance similarity measuring
between two patterns is calculated [10] as:
(1)
Where:
p: Number of pixels, which are in
foreground for both patterns. q: Number of pixels, which are in background for xi and in
foreground for x .
r: Number of pixels, which are foreground for xi and in
background for x .
If the two patterns have a maximal number of pixels in
foreground, p for both, while the others, q and r will be
zero, which leads to ),( xxd i = 0, both of the pattern is
similar. In contrary, the significant result shows that both
patterns is uncorrelated and dissimilar if the value of p is
zero which leads to ),( xxd i = 1.
Conventional Jaccard Distance is basically employed to
compare two prototypes. The comparison is made between
suggested shapes and drawn shapes. The characteristics in
computation using conventional Jaccard Distance are:
i) The measures data should be in the original form
(binary or grey level) where the data cannot be used if
one employs any data features or transforms.
ii) The unique condition to compute Jaccard Distance is
that the size of both shape supports (images) should be
similar and can be converted in the binary employ in
vector representation
iii) The comparison between the vector components, for
example, the handwritten digit recognition [10].
Figure 1 shows the sample of calculation using the
conventional Jaccard Distance [10].
Figure 1: Example of Conventional Jaccard Distance
Measurement(Source [1]).
rqp
px
ixd
1),(
IJCSI International Journal of Computer Science Issues, Vol. 9, Issue 4, No 1, July 2012 ISSN (Online): 1694-0814 www.IJCSI.org 126
Copyright (c) 2012 International Journal of Computer Science Issues. All Rights Reserved.
Basically, the Jaccard Distance consists of a simple
distance function and requires a minimal computation time.
In this sense, Jaccard Distance is better than the other
distance measurement in shape recognition. However,
despite its strength and wide use, Jaccard Distance’s
disadvantage is its variant to image transformations. This
distance function is commonly applied on binary data
where the similarity computation computes the values of 0
and 1. The input object must be in binary form and
therefore, Jaccard’s method cannot be used if any
transformations are employed to the object features.
Another requirement is that the size of both binary object
and shapes must be of similar size. However, Jaccard’s
limitation can be improved by adding pre-processing tasks
prior to the computation.
3.3 Mahalanobis Distance
While Mahalanobis distance is always used for data
clustering, calculated by measuring two data points in the
space defined by relevant features, clustering technique
groups data into clusters so that the data objects within a
cluster have high similarity to one another. This process is
not easy as the data objects will be dissimilar to those in
other clusters. As it describes unequal variances and
correlations between features, it will adequately evaluate
the distance by giving different weights to the features of
data points [14].
Mahalanobis Distance between two points
and is defined as:
(2)
Where,
and is means of two groups of data
is the transpose of mean difference
is the inverse of the covariance matrix of group
The Mahalanobis distance is quadratic multiplication of
mean difference and inverse of pooled covariance matrix.
Despite its strength in clustering data, Mahalanobis is
always known for its major weakness of computation times
and its requirements for large number of samples for
training. To overcome Mahalanobis weaknesses, quasi-
Mahalanobis distance (QMD), Modified Mahalanobis
distance (MMD), Simplified Mahalanobis distance (SMD)
and incremental Mahalanobis distance (cited in [11]) have
been proposed by previous researches. Those approaches
are effective to reduce computation time since they use
only parts of the dimensions or incrementally compute the
distance. Hence, in this present study sees that a low
computation time pertaining Mahalanobis can be obtained
by only taking the most extreme points or vertices of the
shapes.
4. Experiment
4.1 Dataset
The dataset was obtained from the sketches produced by 10
male and 10 female university students ranging from 23 to
26 years of age. The students (respondents) were identified
as regular stylus users of mobile phones. They were
instructed without guidance to draw basic geometric shapes
of triangle, square and diamond (TSD) ten times; therefore
their handwriting was considered uncontrolled data. The
devices used to obtain data were laptops and tablets and
(for stylus). Data collection was conducted in a parallel
mode where the respondents were in a sitting position at
their convenience time. During the data collection, the
respondents were not supervised, nor did they train or have
any opportunity to use the pen in prior to the sketching in
the data collection session. And the end of the data
collection session we managed to collect 200 triangle, 200
square and 200 diamond hand sketching objects. In this
experiment, the dataset were divided into training and
testing data sets to ensure consistency throughout the
experiment.
4.2 Feature Analysis and Transformations
All sketches of 350 X 1180 pixel size were cleaned from
noises. Next, the shapes size and orientations were
normalized and transformed into a 150 X 150 pixel format.
The corner points of each shape were located and identified
as extreme vertices. Based on the extreme vertices, the
staggered edges drawn by the respondents were
straightened or perfected. But even though every edge of
the shape was straightened, the shape was still neither
identical nor perfect [13].
Next, the shapes were divided into two data sets. The first
group of data contained strokes or edges of the shape
without corner points or edge intersections. The removal
of edges was conducted by applying a 6 X 6 pixel mask at
the intersection points. The remaining pixels were taken as
strokes. In the first dataset, the triangle possessed two
diagonal strokes and one horizontal; the square two
horizontal and two vertical edges; and diamond four
diagonal edges. Another set of data consisted extreme
vertices of the shapes. These intersection points of each
shape were defined as extreme vertices. The triangle had
three extreme vertices, the squares and diamonds four
extreme vertices.
1
Tyx
x y
IJCSI International Journal of Computer Science Issues, Vol. 9, Issue 4, No 1, July 2012 ISSN (Online): 1694-0814 www.IJCSI.org 127
Copyright (c) 2012 International Journal of Computer Science Issues. All Rights Reserved.
4.3 The Combined Mahalanobis and Jaccard
Distance
In common practice, Mahalanobis distance is only used to
cluster or find similarity of a group of data. To date, little
effort has been tried to measure shape similarity of strokes
or lines using the Mahalanobis Distance. On the other
hand, as mentioned, Jaccard is inflexible which works
based on overlapping binary. However, despite being time
consuming and inflexibility in computing overlapping
vertices, both pose a great strength in terms of computation
simplicity. This prompted an approach to combine both
measures (which is named by this paper JM Approach)
without modifying their formula. The sequence of
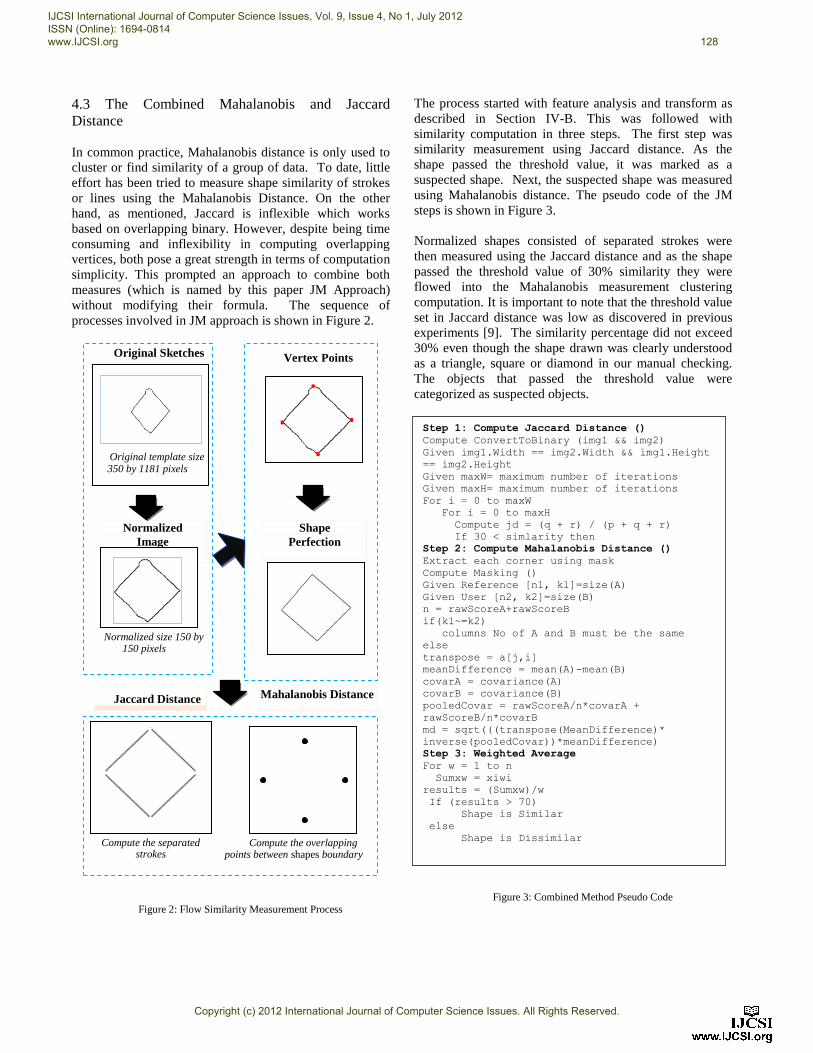
processes involved in JM approach is shown in Figure 2.
Figure 2: Flow Similarity Measurement Process
The process started with feature analysis and transform as
described in Section IV-B. This was followed with
similarity computation in three steps. The first step was
similarity measurement using Jaccard distance. As the
shape passed the threshold value, it was marked as a
suspected shape. Next, the suspected shape was measured
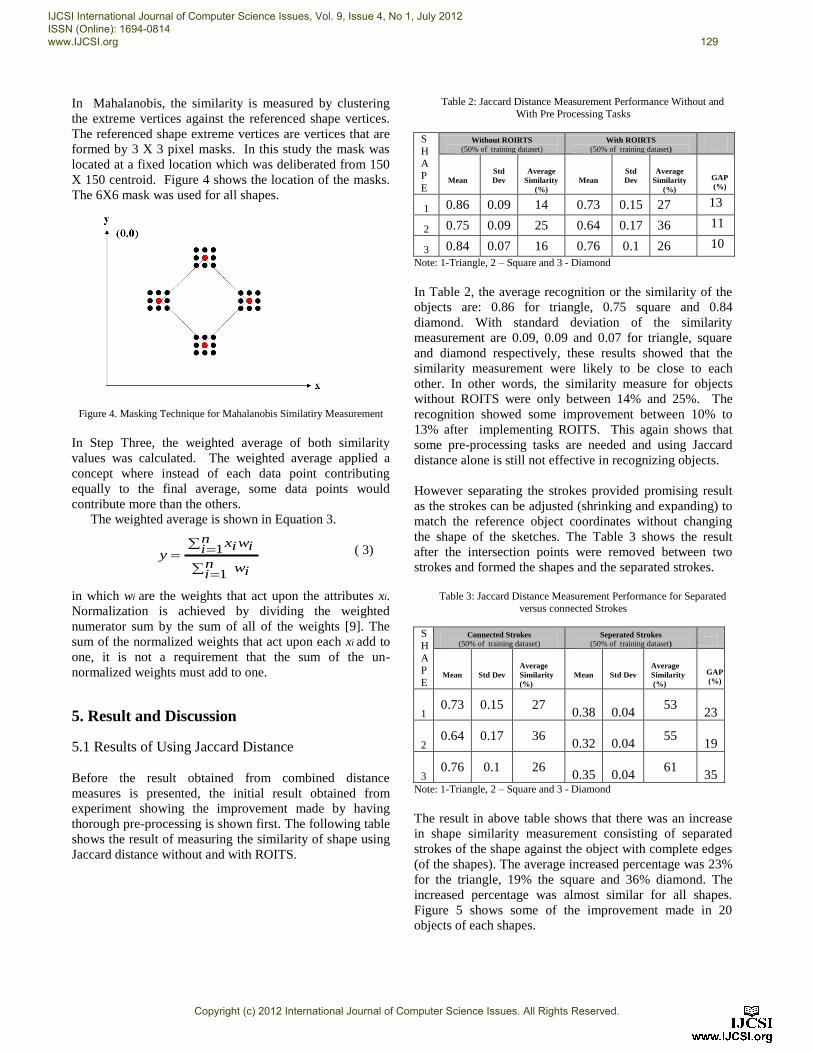
using Mahalanobis distance. The pseudo code of the JM
steps is shown in Figure 3.
Normalized shapes consisted of separated strokes were
then measured using the Jaccard distance and as the shape
passed the threshold value of 30% similarity they were
flowed into the Mahalanobis measurement clustering
computation. It is important to note that the threshold value
set in Jaccard distance was low as discovered in previous
experiments [9]. The similarity percentage did not exceed
30% even though the shape drawn was clearly understood
as a triangle, square or diamond in our manual checking.
The objects that passed the threshold value were
categorized as suspected objects.
Figure 3: Combined Method Pseudo Code
Original Sketches Vertex Points
Normalized
Image
Jaccard Distance Mahalanobis Distance
Shape
Perfection
Normalized size 150 by 150 pixels
Beautified Image
Compute the overlapping points between shapes boundary
Compute the separated strokes
Original template size 350 by 1181 pixels
Step 1: Compute Jaccard Distance ()
Compute ConvertToBinary (img1 && img2)
Given img1.Width == img2.Width && img1.Height
== img2.Height
Given maxW= maximum number of iterations
Given maxH= maximum number of iterations
For i = 0 to maxW
For i = 0 to maxH
Compute jd = (q + r) / (p + q + r)
If 30 < simlarity then
Step 2: Compute Mahalanobis Distance ()
Extract each corner using mask
Compute Masking ()
Given Reference [n1, k1]=size(A)
Given User [n2, k2]=size(B)
n = rawScoreA+rawScoreB
if(k1~=k2)
columns No of A and B must be the same
else
transpose = a[j,i]
meanDifference = mean(A)-mean(B)
covarA = covariance(A)
covarB = covariance(B)
pooledCovar = rawScoreA/n*covarA +
rawScoreB/n*covarB
md = sqrt(((transpose(MeanDifference)*
inverse(pooledCovar))*meanDifference)
Step 3: Weighted Average
For w = 1 to n
Sumxw = xiwi
results = (Sumxw)/w
If (results > 70)
Shape is Similar
else
Shape is Dissimilar
IJCSI International Journal of Computer Science Issues, Vol. 9, Issue 4, No 1, July 2012 ISSN (Online): 1694-0814 www.IJCSI.org 128
Copyright (c) 2012 International Journal of Computer Science Issues. All Rights Reserved.
In Mahalanobis, the similarity is measured by clustering
the extreme vertices against the referenced shape vertices.
The referenced shape extreme vertices are vertices that are
formed by 3 X 3 pixel masks. In this study the mask was
located at a fixed location which was deliberated from 150
X 150 centroid. Figure 4 shows the location of the masks.
The 6X6 mask was used for all shapes.
Figure 4. Masking Technique for Mahalanobis Similatiry Measurement
In Step Three, the weighted average of both similarity
values was calculated. The weighted average applied a
concept where instead of each data point contributing
equally to the final average, some data points would
contribute more than the others.
The weighted average is shown in Equation 3.
( 3)
in which wi are the weights that act upon the attributes xi.
Normalization is achieved by dividing the weighted
numerator sum by the sum of all of the weights [9]. The
sum of the normalized weights that act upon each xi add to
one, it is not a requirement that the sum of the un-
normalized weights must add to one.
5. Result and Discussion
5.1 Results of Using Jaccard Distance
Before the result obtained from combined distance
measures is presented, the initial result obtained from
experiment showing the improvement made by having
thorough pre-processing is shown first. The following table
shows the result of measuring the similarity of shape using
Jaccard distance without and with ROITS.
Table 2: Jaccard Distance Measurement Performance Without and
With Pre Processing Tasks
S
H A
P
E
Without ROIRTS
(50% of training dataset)
With ROIRTS
(50% of training dataset)
Mean
Std
Dev
Average
Similarity
(%)
Mean
Std
Dev
Average
Similarity
(%)
GAP
(%)
1 0.86 0.09 14 0.73 0.15 27 13
2 0.75 0.09 25 0.64 0.17 36 11
3 0.84 0.07 16 0.76 0.1 26 10
Note: 1-Triangle, 2 – Square and 3 - Diamond
In Table 2, the average recognition or the similarity of the
objects are: 0.86 for triangle, 0.75 square and 0.84
diamond. With standard deviation of the similarity
measurement are 0.09, 0.09 and 0.07 for triangle, square
and diamond respectively, these results showed that the
similarity measurement were likely to be close to each
other. In other words, the similarity measure for objects
without ROITS were only between 14% and 25%. The
recognition showed some improvement between 10% to
13% after implementing ROITS. This again shows that
some pre-processing tasks are needed and using Jaccard
distance alone is still not effective in recognizing objects.
However separating the strokes provided promising result
as the strokes can be adjusted (shrinking and expanding) to
match the reference object coordinates without changing
the shape of the sketches. The Table 3 shows the result
after the intersection points were removed between two
strokes and formed the shapes and the separated strokes.
Table 3: Jaccard Distance Measurement Performance for Separated
versus connected Strokes
S
H
A P
E
Connected Strokes
(50% of training dataset) Seperated Strokes
(50% of training dataset)
Mean
Std Dev
Average
Similarity
(%)
Mean
Std Dev
Average
Similarity
(%)
GAP
(%)
1 0.73 0.15 27
0.38 0.04 53
23
2 0.64 0.17 36
0.32 0.04 55
19
3 0.76 0.1 26
0.35 0.04 61
35 Note: 1-Triangle, 2 – Square and 3 - Diamond
The result in above table shows that there was an increase
in shape similarity measurement consisting of separated
strokes of the shape against the object with complete edges
(of the shapes). The average increased percentage was 23%
for the triangle, 19% the square and 36% diamond. The
increased percentage was almost similar for all shapes.
Figure 5 shows some of the improvement made in 20
objects of each shapes.
iwni
iwni ix
y
1
1
IJCSI International Journal of Computer Science Issues, Vol. 9, Issue 4, No 1, July 2012 ISSN (Online): 1694-0814 www.IJCSI.org 129
Copyright (c) 2012 International Journal of Computer Science Issues. All Rights Reserved.
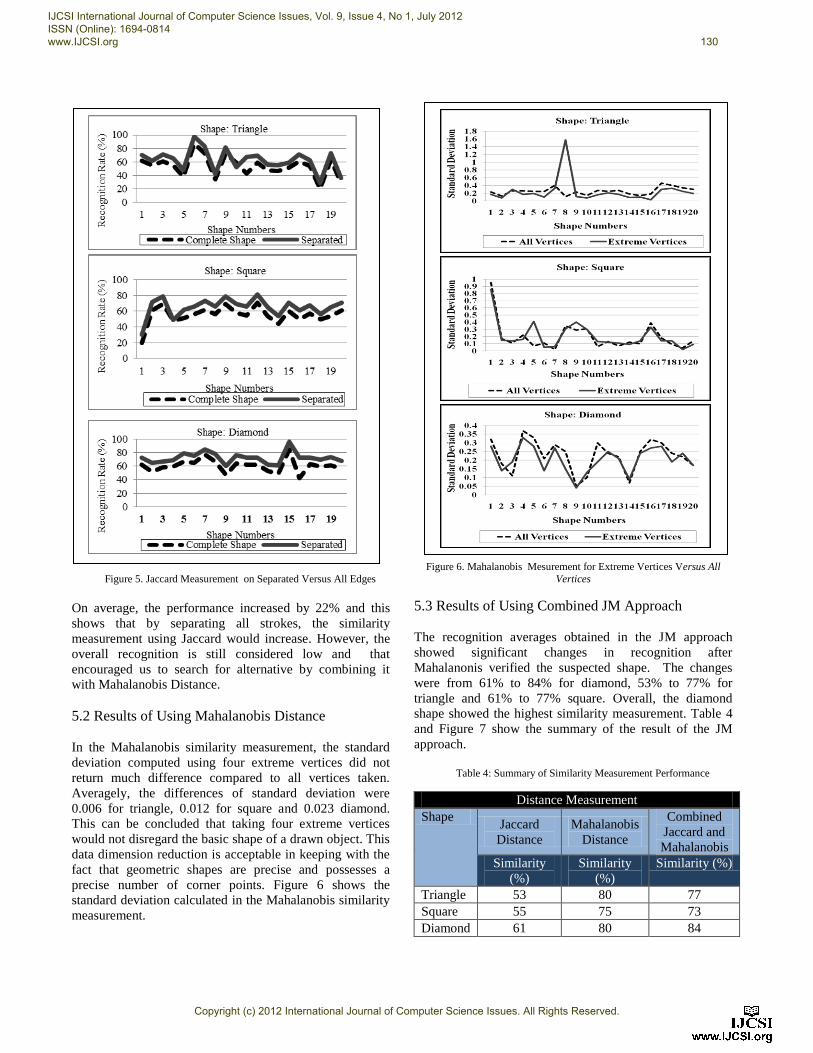
Figure 5. Jaccard Measurement on Separated Versus All Edges
On average, the performance increased by 22% and this
shows that by separating all strokes, the similarity
measurement using Jaccard would increase. However, the
overall recognition is still considered low and that
encouraged us to search for alternative by combining it
with Mahalanobis Distance.
5.2 Results of Using Mahalanobis Distance
In the Mahalanobis similarity measurement, the standard
deviation computed using four extreme vertices did not
return much difference compared to all vertices taken.
Averagely, the differences of standard deviation were
0.006 for triangle, 0.012 for square and 0.023 diamond.
This can be concluded that taking four extreme vertices
would not disregard the basic shape of a drawn object. This
data dimension reduction is acceptable in keeping with the
fact that geometric shapes are precise and possesses a
precise number of corner points. Figure 6 shows the
standard deviation calculated in the Mahalanobis similarity
measurement.
Figure 6. Mahalanobis Mesurement for Extreme Vertices Versus All
Vertices
5.3 Results of Using Combined JM Approach
The recognition averages obtained in the JM approach
showed significant changes in recognition after
Mahalanonis verified the suspected shape. The changes
were from 61% to 84% for diamond, 53% to 77% for
triangle and 61% to 77% square. Overall, the diamond
shape showed the highest similarity measurement. Table 4
and Figure 7 show the summary of the result of the JM
approach.
Table 4: Summary of Similarity Measurement Performance
Distance Measurement
Shape Jaccard
Distance
Mahalanobis
Distance
Combined
Jaccard and
Mahalanobis
Similarity
(%)
Similarity
(%)
Similarity (%)
Triangle 53 80 77
Square 55 75 73
Diamond 61 80 84
IJCSI International Journal of Computer Science Issues, Vol. 9, Issue 4, No 1, July 2012 ISSN (Online): 1694-0814 www.IJCSI.org 130
Copyright (c) 2012 International Journal of Computer Science Issues. All Rights Reserved.
Improvement of each shape was also observed. The
following figure (Figure 8) depicts the improvement
imposed by each shape. We found that the triangle shape
showed the highest improvement of 24%, followed closely
by diamond which with 23% improvement and finally the
diamond 23%. The square had only 18% improvement.
Figure 7: Summary of Results
Figure 8. Improvement Made Using Combined Apporach
To justify the triangle’s highest improvement, the sketches
were manually checked. The manual checking showed that
only 55% of the sketches were drawn in an acceptable
shape and orientation. However, due to the inflexibility of
Jaccard, the preliminary measurement of a complete shape
with all three intersect edges had gained a low percentage
of similarity. This is due to the fact that geometric shapes
such as a triangle have perfect and uniform angular
measurements and orientation. In addition, when drawing
triangles, the respondents had to combine two diagonal
lines with 45-degree angle edges and one horizontal line
moving from left or right or vice versa. Orientation would
change while one was drawing the edge or stroke which
made the line distort.
5.4 Discussion
Again, the outcome of the experiment shows that low
recognition were achieved by the conventional Jaccard
Distance when there was no pre processing task done onto
the input. However, after translation, rotation, invariance
scale content and noise resistance (ROITRS) were applied,
little improvement on the recognition progress can be seen
with degree of accuracy improve averagely by 11.3%.
However, the improvement was also not very significance.
To overcome that we separated the shape strokes and some
promising improvement made in average by 25%. As
mentioned previously, it is almost impossible for users to
redraw shapes exactly like their previous sketches.
There have been attempts to combine techniques where [2]
recognition modules were designed based on a single
stroke method. The like of excluding the intersection
points in this study was in most data inspected, they were
always not perfectly drawn and intersected. But using
separated strokes in Jaccard is considered new as certain
edges deployed can be shrunk or stretched to make each
shape overlap without changing its original shape. This
approach is proposed knowing that it is very difficult for
the users to re-point on the same end point of the lines
drawn. The users cannot press on the previous point (or
dot) as the glass surface of an input device is normally
glossy. Furthermore, if the point tips do not perfectly stand
between 80 – 90 degree, the neighboring pixel might be
activated instead of the intended pixel. In this study, in
Mahalanobis, only the extreme points of the object shapes
were extracted to reduce its computation time. The most
extreme points for common geometrical shapes of four or
six or eight, using extreme point masking in Mahalonobis
measurement greatly affect the processing time.
The present work may open a window to discoveries such
as:
a) Sketching by stylus is very different from a pen or a
pensil sketching. Therefore geometrical shapes
produced in the sketching are rarely connected perfectly
at the intersection points. Therefore, the shape should
be manipulated and transformed into a proper shape in
order to improve the similarity measurement. This may
also increase the recognition accuracy.
b) Whenever simple similarity measures like Jaccard and
Mahalanobis distance are to be used in recognition
process, the object should be simplified too.
6. Conclusion
This paper studied how to measure the stylus-drawn or
stylus-sketched shape efficiently. We found that the
combination of Mahalanobis and the Jaccard measures is
IJCSI International Journal of Computer Science Issues, Vol. 9, Issue 4, No 1, July 2012 ISSN (Online): 1694-0814 www.IJCSI.org 131
Copyright (c) 2012 International Journal of Computer Science Issues. All Rights Reserved.
comparatively effective to sketch shape similarity
measurement. Mahalanobis distance is effective in
clustering the extreme points of shapes that produce high
probability of similarity for Jaccard to confirm the shapes.
We can see that the combination of both measures
improved the accuracy. Both similarity calculations are
brief and this makes the computations involved low and
suitable for mobile application with a low memory and low
processing power. Two contributions were made in this
study. First, it studied how Jaccard and Mahalanobis
distance can be used effectively where strokes separation
and masking make the clustering measures useable
effectively. Second, an algorithm that combined
Mahalanobis with Jaccard distance was designed. The
study also showed that Jaccard and Mahalanobis can be
used together judiciously, since the manner of combination
can greatly affect the performance. For future work, real-
time captured sketches will be tested which may tell us its
computation time in real practice.
Acknowledgments
This research is sponsored by Fundamental Research Grant
Scheme of the Ministry of Higher Education, Malaysia.
References [1] Y. Mingqiang, K. Kidiyo, and R. Joseph, 2008. Shape
Matching and Object Recognition Using Chord Contexts. In
Proceedings of the 2008 International Conference
Visualisation, 2008. Washington, DC, USA: IEEE Computer
Society, pp. 63-69.
[2] S. Belongie., G. Mori., and J. Malik, 2002. Shape Matching
and Object Recognition Using Shape Contexts. IEEE
Transaction on Pattern Analysis and Machine Intelligence,
April 2002. pp. 509-522.
[3] H. Nemmour and Y. Chibani, 2008. New Jaccard-Distance
Based Support Vector Machine Kernel for Handwritten Digit
Recognition. ICTTA 2008. 3rd International Conference.
IEEE Computer Society, pp. 1-4.
[4] B. J. Zou and M. P. Umugwaneza, 2008. Shape-based
Trademark Retrieval using Cosine Distance Method.
Proceedings 2002 IEEE International Conference, 26-28
Nov. 2008. Washington, DC, USA: IEEE Computer Society,
pp. 498- 504.
[5] G. Chen, H. G. Zhang, and Jun Guo, 2007. Efficient
Computation of Mahalanobis Distance in Financial Efficient
Hand-Written Chinese Character Recognition. In Proceedings
of the Sixth International Conference on Machine Learning
and Cybernetics, 19-22 August 2007, Hong Kong. IEEE, pp.
2198-2201.
[6] L. Wang, Y. Zhang, and J. Feng, 2005.On the Euclidean
Distance of Images. IEEE Transactions on Pattern Analysis
and Machine Intelligence Aug 2005. IEEE Computer Society,
pp. 1334-1339.G.
[7] Z. Li., K. Houl, and H. Li, 2006. Similarity Measurement
Based on Trigonometric Function Distance. Pervasive
Computing and Applications, 2006 1st International
Symposium. IEEE Computer Society, pp. 227-231.
[8] C. C. Chen. And H. T. Chu, 2005. Similarity Measurement
between Images. In Proceedings of the 29th Annual
International Computer Software and Applications
Conference (COMPSAC’05), 2005. Washington, DC, USA:
IEEE Computer Society, pp. 41-42.
[9] N.A. Abdul Aziz, S.S. Salleh, D. Mohamad and M. Omar,
2010. Investigating Jaccard Distance Similarity Measurement
Constriction on Handwritten Pen-based Input Digit. In
Proceedings of the International Conference on Science and
Social Research. CSSR 2010. pp. 1-5.
[10]N.A. Abdul Aziz, S.S. Salleh, D. Mohamad and M. Omar,
2010. A Review on The Use of Similarity Distance
Measurement in Shape Recognition. In Proceedings of the 1st
National Postgraduate Seminar 2010. NAPAS 2010. pp. 1-8.
[11]B. J. Zou and M. P. Umugwaneza, 2008. Shape-based
Trademark Retrieval using Cosine Distance Method. In
Proceedings of the 2002 IEEE International Conference, 26-
28 Nov. 2008. Washington, DC, USA: IEEE Computer
Society, pp. 498- 504.
[12]A. Suebsing and N. Hiransakolwong, 2009. Feature Selection
Using Euclidean Distance and Cosine Similarity for Intrusion
Detection Model. In Proceedings of the 2009 1st Asian
Conference on Intelligent Information and Database Systems,
1-3 April 2009, Donghoi. pp. 86-91
[13]H. Nemmour and Y. Chibani, 2008. New Jaccard-Distance
Based Support Vector Machine Kernel for Handwritten Digit
Recognition. 3rd International Conference. ICTTA 2008.
IEEE Computer Society, pp. 1-4.
[14] G. Chen, H. Zhang and J. Guo, 2008. Efficient
Computation of Mahalanobis Distance in Financial Hand-
Written Chinese Character Recognition. In Proceedings of the
Sixth International Conference On Machine Learning and
Cybernetics, Hong Kong. pp. 317-32.
[15]D. Wu and J.M. Mendel, 2006. The Linguistic Weighted
Average. In Proceedings of the IEEE International
Conference on Fuzzy Systems, 2006. Vancouver, BC,
Canada, pp. 566-573.
IJCSI International Journal of Computer Science Issues, Vol. 9, Issue 4, No 1, July 2012 ISSN (Online): 1694-0814 www.IJCSI.org 132
Copyright (c) 2012 International Journal of Computer Science Issues. All Rights Reserved.


![Application of thrombelastography (TEG) for safety ... … · primary total joint arthroplasty ... clinically important differences and reach a firm conclu-sion [12–14]. To overcome](https://img.pdfslide.fr/doc/110x75/60b794c23bd96d7bce088759/application-of-thrombelastography-teg-for-safety-primary-total-joint-arthroplasty.jpg)