Embed Size (px)
Citation preview
Elucidating the Origin of the Toxicity of Nano-CeO2 to Chlorella pyrenoidosa:the Role of Specific Surface Area and Chemical Composition
Changjian Xieab, Yuhui Mab, Peng Zhangc, Junzhe Zhangb, Xiaowei Lia, Kang Zhenga, Ao Lia, Weiwei Wua, Qiuxiang Panga, Xiao Heb, Zhiyong Zhangbd*
aSchool of life Sciences, Shandong University of Technology, No.266 Xincun West Road, Zibo255000, Shandong, China.bKey Laboratory for Biomedical Effects of Nanomaterials and Nanosafety, Institute of High Energy Physics, Chinese Academy of Sciences, Beijing 100049, China. cSchool of Geography, Earth and Environmental Sciences, University of Birmingham, Birmingham B15 2TT, UKdSchool of Nuclear Science and Technology, University of Chinese Academy of Sciences, Beijing 100049, China
* Email of corresponding author: [email protected]
1. Synthesis and Characterization of nano-CeO2 and CePO4
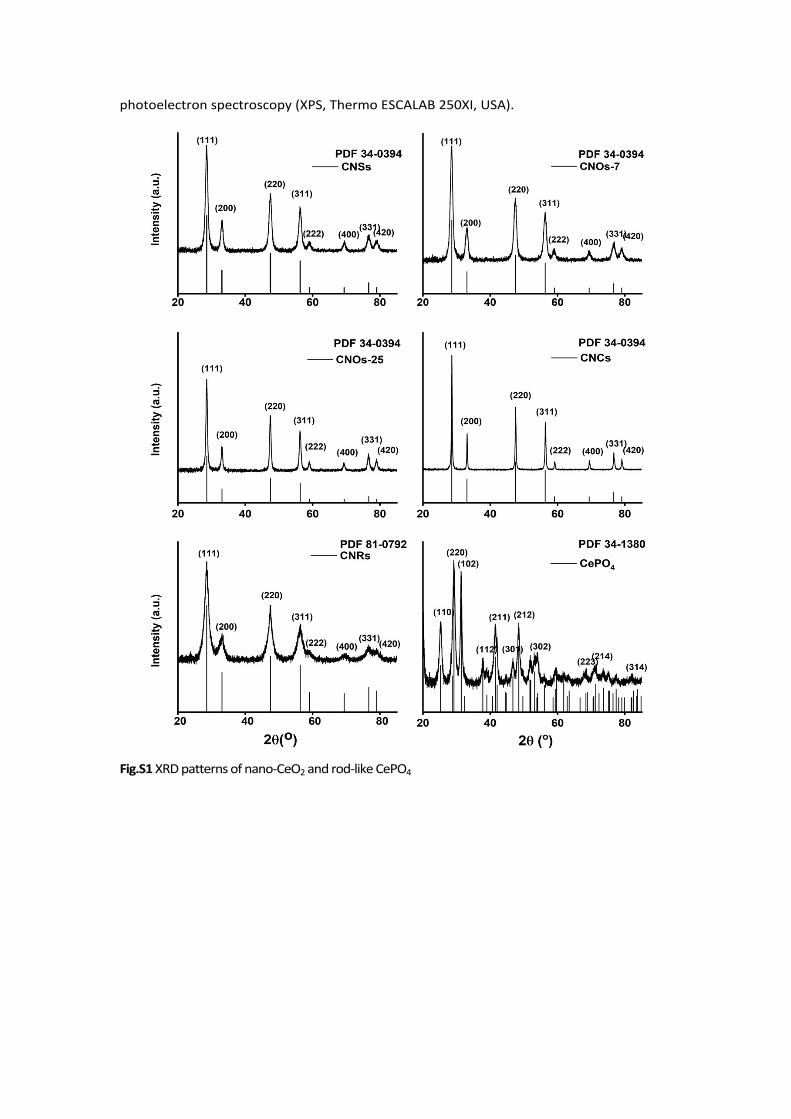
A precipitation method was sued to synthesize CNOs-7 and CNOs-25 CNPs1. A 0.0375 M Ce(NO3)3·6H2O solution and a 0.5 or 0.05 M hexamethylenetetramine (HMT) solution were prepared and stirred separately for 30 min. Then the two solutions were combined and
mixed for 3 h at 75 ℃. The precipitation was separated by centrifugation at 10000 g for 30 min and washed with DI water for 6 times. Nano-CeO2 with sizes of ca. CNOs-7 (0.5 M HMT) and CNOs-25 (0.05 M HMT) were obtained respectively. CNCs and CNRs were synthesized according to hydrothermal methods with modifications. To synthesize CNRs, 0.694 g Ce(NO3)3·6H2O were dissolved in 4 mL DI water in a Teflon bottle. 7.68 g NaOH was dissolved in 28 mL DI water and added into the Teflon bottle. The mixture was stirred immediately and rapidly with a glass stick for 2 min. The bottle was then sealed in a stainless
steel vessel, placed at 100 ℃ in an electric oven, and allow for reaction for 24 h. Same materials and procedures were used for CNCs synthesis, while the reaction proceeded at
180 ℃. Obtained precipitates (CNCs and CNRs) were washed, separated, and suspended in deionized water for further usage. For CNSs, 1.736 g Ce(NO3)3·6H2O were dissolved in 8 mL DI water. 0.4 g NaOH were dissolved in 120 mL DI water, then mixed these two solutions with stirring at room temperature for 48 h. Obtained precipitates (3 nm-CNPs) were washed, separated (15000 g), and suspended in deionized water for further usage. For rod-like CePO4, 0.5 M CeCl3·7H2O were dissolved in 20 mL DI water and 0.5 M KH2PO4 were dissolved in 25 mL DI water. Then mixed two solutions at RT for 30 min. Obtained precipitates (CePO4) were washed, separated (10000 g), and suspended in deionized water for further usage.The particle morphology, size, crystal structure, hydrodynamic diameter and zeta potential of NPs in DI water and OECD medium, surface chemical valence states were characterized using Scanning electron microscopy (SEM, Hitachi S4800, Japan), Transmission electron microscopy (TEM, JEM 200CX, Japan), Brunauer Emmett Teller (BET, Autosorb-iQ-C, Quantachrome, USA), powder X-ray diffraction (XRD, X’pert PRO MPD, Holland), and X-ray
Electronic Supplementary Material (ESI) for Environmental Science: Nano.This journal is © The Royal Society of Chemistry 2021
photoelectron spectroscopy (XPS, Thermo ESCALAB 250XI, USA).
Fig.S1 XRD patterns of nano-CeO2 and rod-like CePO4
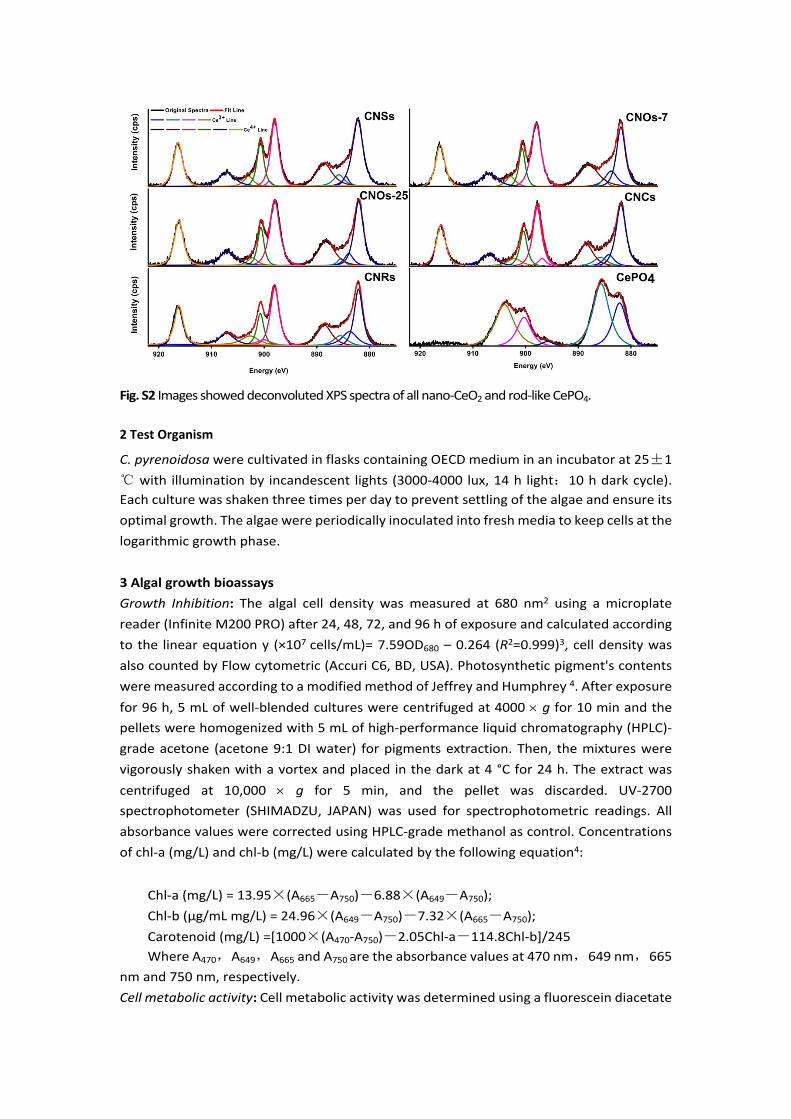
Fig. S2 Images showed deconvoluted XPS spectra of all nano-CeO2 and rod-like CePO4.
2 Test Organism
C. pyrenoidosa were cultivated in flasks containing OECD medium in an incubator at 25±1 ℃ with illumination by incandescent lights (3000-4000 lux, 14 h light:10 h dark cycle). Each culture was shaken three times per day to prevent settling of the algae and ensure its optimal growth. The algae were periodically inoculated into fresh media to keep cells at the logarithmic growth phase.
3 Algal growth bioassaysGrowth Inhibition: The algal cell density was measured at 680 nm2 using a microplate reader (Infinite M200 PRO) after 24, 48, 72, and 96 h of exposure and calculated according to the linear equation y (×107 cells/mL)= 7.59OD680 – 0.264 (R2=0.999)3, cell density was also counted by Flow cytometric (Accuri C6, BD, USA). Photosynthetic pigment's contents were measured according to a modified method of Jeffrey and Humphrey 4. After exposure for 96 h, 5 mL of well-blended cultures were centrifuged at 4000 g for 10 min and the pellets were homogenized with 5 mL of high-performance liquid chromatography (HPLC)-grade acetone (acetone 9:1 DI water) for pigments extraction. Then, the mixtures were vigorously shaken with a vortex and placed in the dark at 4 °C for 24 h. The extract was centrifuged at 10,000 g for 5 min, and the pellet was discarded. UV-2700 spectrophotometer (SHIMADZU, JAPAN) was used for spectrophotometric readings. All absorbance values were corrected using HPLC-grade methanol as control. Concentrations of chl-a (mg/L) and chl-b (mg/L) were calculated by the following equation4:
Chl-a (mg/L) = 13.95×(A665-A750)-6.88×(A649-A750);Chl-b (μg/mL mg/L) = 24.96×(A649-A750)-7.32×(A665-A750);Carotenoid (mg/L) =[1000×(A470-A750)-2.05Chl-a-114.8Chl-b]/245Where A470,A649,A665 and A750 are the absorbance values at 470 nm,649 nm,665
nm and 750 nm, respectively.Cell metabolic activity: Cell metabolic activity was determined using a fluorescein diacetate
(FDA) probe. The algal cell suspensions were centrifuged and washed three times with OECD medium. Subsequently, 1 μM FDA was incubated with algal cells for 30 min under dark conditions at room temperature. The samples were centrifuged and washed three times with OECD medium. The fluorescence intensity was measured using a microplate reader (Infinite M200 PRO) at an excitation wavelength of 485 nm and an emission wavelength of 530 nm. ROS, SOD, MDA, mitochondrial membrane potential and membrane integrity detection: For the intracellular ROS, the 2, 7-dichlorodihydrofluorescein diacetate (H2DCFDA) stock solution was prepared in OECD medium. Briefly, algal cells were centrifuged and washed three times with OECD medium after exposure for 24, 48, 72, and 96 h, then the algal cells were incubated in H2DCFDA solution (10 μM) for 20 min in the dark at 37 °C, followed by washing three times with OECD medium. Intracellular H2DCFDA could be deacetylated and then oxidized to the highly fluorescent dichlorofluorescein (DCF) when intracellular ROS was generated. The fluorescence intensity of DCF was measured using a microplate reader (Infinite 200 Pro, Tecan, Switzerland). The excitation and emission wavelengths were 488 and 525-nm, respectively. Relative ROS levels were calculated by the relative fluorescence ratio of the treatments to the control.In each group, algal cells from 100 mL of culture were collected by centrifugation at 4000g for 10 min after the 96 h exposure. The algal cells were then washed an additional three
times with PBS buffer and lysed by French press (4 ℃, 5000 Pa), then the lysate was centrifuged at 10000 × g for 30 min, the supernatant was collected and divided for subsequent experiments. The SOD activity was spectrophotometrically determined using a SOD assay kit (A001-2, Nanjing Jiancheng Bioengineering Institute, Nanjing, China) according to the manufacturer’s instructions. The absorbance was read at 450 nm using a UV-vis spectrophotometer (UV2700, Shimadzu, Japan). MDA is a product of lipid peroxidation and an indicator of cell membrane peroxidation. The level of MDA was determined using the thiobarbituric acid reactive substance (TBARS) assay with the MDA assay kit (Nanjing Jiancheng Bioengineering Institute, Nanjing, China) with procedures detailed in a previous study 5. Results of SOD activity and MDA content are given as units of enzyme activity per milligram of total soluble protein (U/mg proteins) and nanomole per milligram of total soluble protein (nmol/mg proteins), respectively.To detect mitochondrial membrane potential loss, 1 mL of an algal suspension was collected after centrifugation (4000 g, 10 min, 4 °C), washed three times with OECD medium, and then incubated with 10 μM JC-1 ((tetrachloro-tetraethyl benzimidazol carbocyanine iodide) at 37 °C for 15 min in the dark by washing with JC-1 staining buffer for three times. Before observation, the algal cells were washed three times with OECD medium. The fluorescence was measured using a microplate reader (Infinite 200 Pro, Tecan, Switzerland) with the filters 490/20 (excitation) and 530/20 (emission) for green and 525/20 (excitation) and 590/35 (emission) for red. The JC-1-stained algal cells were also observed by a confocal microscope (Nikon, Japan).To detect algal cell membrane integrity, PI stain was added to determine the level of membrane damage. Algal cells were exposed to 30 mg/L (IC50) nano-CeO2 and CePO4 under dark condition for 24 h. The fluorescence intensity was measured using a microplate reader (Infinite M200 PRO) at an excitation wavelength of 535 nm and an emission wavelength of
617 nm.Determination of extracellular proteins and carbohydrates: The total extracellular carbohydrate and protein content of the culture media after centrifugation of the algal cells (4000 RPM, 10 min) was described by Malina, et al6. The quantities of the reagents were chosen based on the volume of cells in the plates used for the absorbance measurements; a 33 μL sample was mixed with 33 μL of a 5% phenol solution and 170 μL H2SO4. After adding the reagents, the mixture was left to stand for 15 min and then its absorbance was measured at 490 nm by a microplate reader (Infinite 200 Pro, Tecan, Switzerland). A calibration curve was generated using glucose as a standard by starting with a 1000 mg/mL solution and performing a two-fold serial dilution. For the production of extracellular proteins, briefly, extracellular proteins in 50 mL of algal suspension were collected by
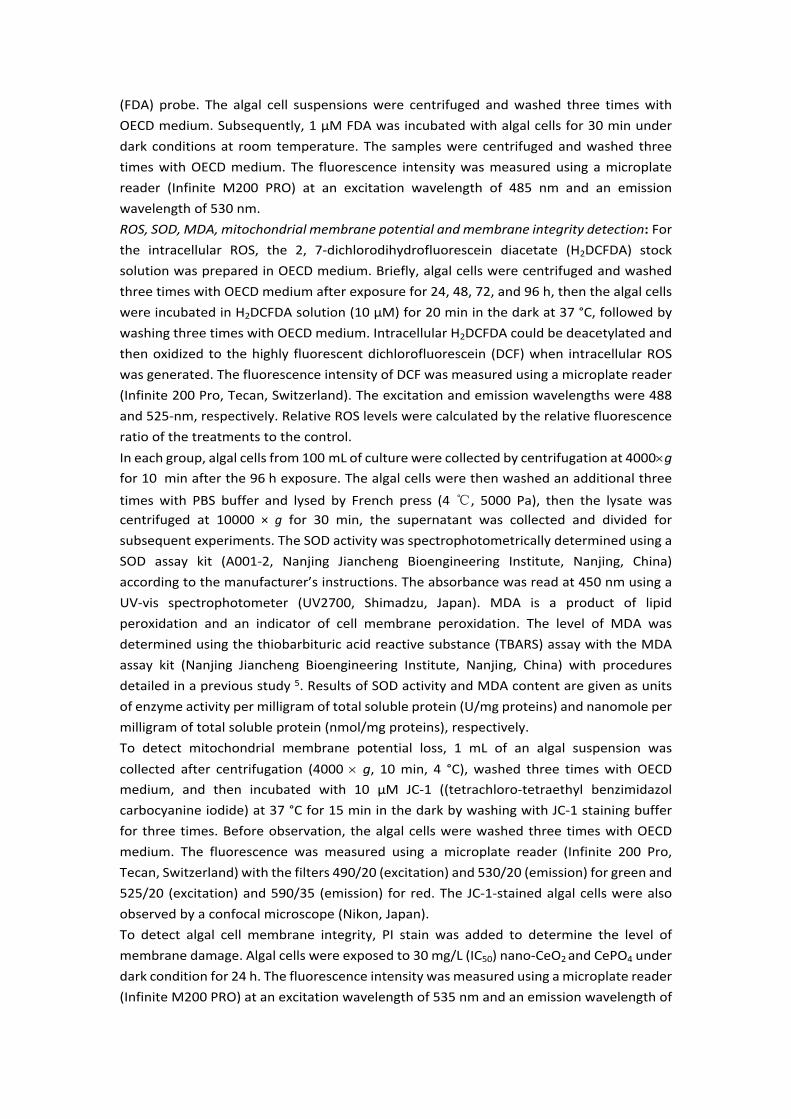
centrifugation (10 min at 4000 RPM at 4 ℃). The concentration of protein in the supernatant was then measured by BCA kits; BSA was used as a standard for protein calibration.Shading Effect of NPs on Algal Growth: The shading effect of nano-CeO2/CePO4 at 30 mg/L on the growth of C. pyrenoidosa for 96 h was investigated by using a sandwich assay with a minor modification 7,8. The design involved two 6-well plates stacked on top of each other and surrounded by aluminum foil except the surface where the light was allowed to penetrate through the 6-well plates. The top 6-well plate contained C. pyrenoidosa cells with 30 mg/L of nano-CeO2/CePO4 in OECD medium as treatment groups and C. pyrenoidosa cells in OECD medium as control, respectively (Fig. S1). The bottom 6-well plate contained C. pyrenoidosa at the density of 5×10⁵ cell/mL. The cultures were grown in triplicate for each treatment.
Fig.S3 Schematic illustration on the shading effect of nano-CeO2 and rod-like CePO4 on C. pyrenoidosa cells growth inhibition tests.
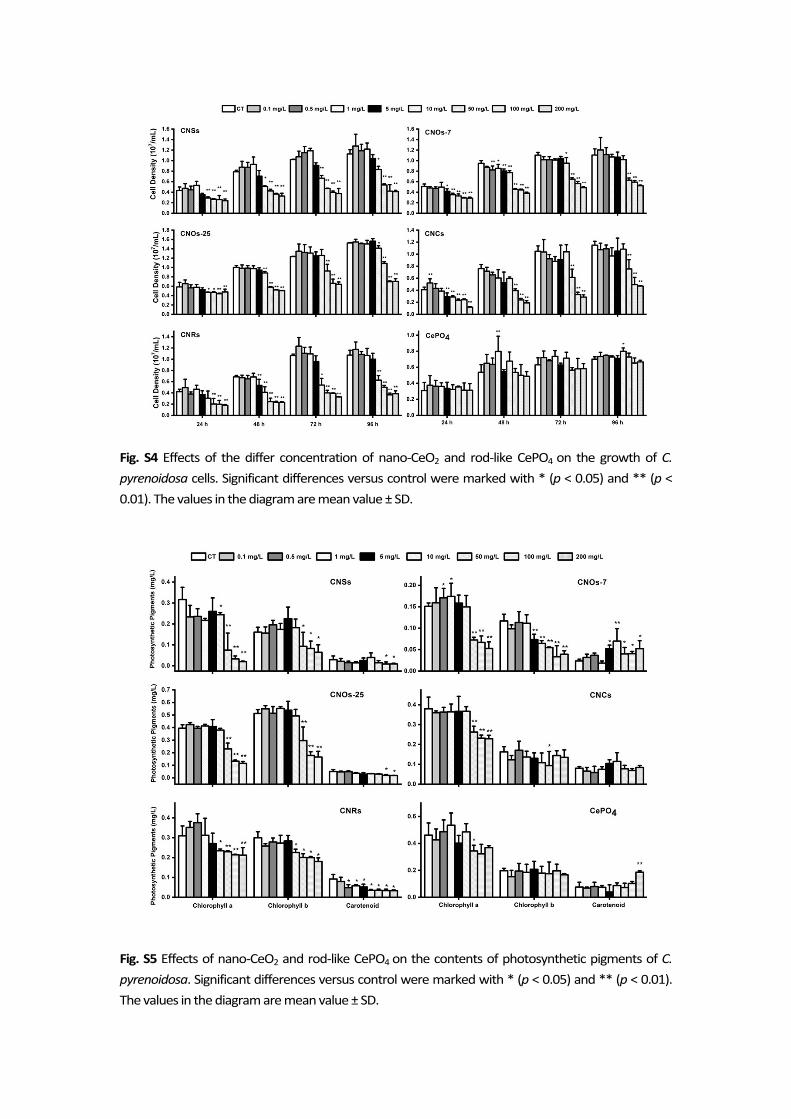
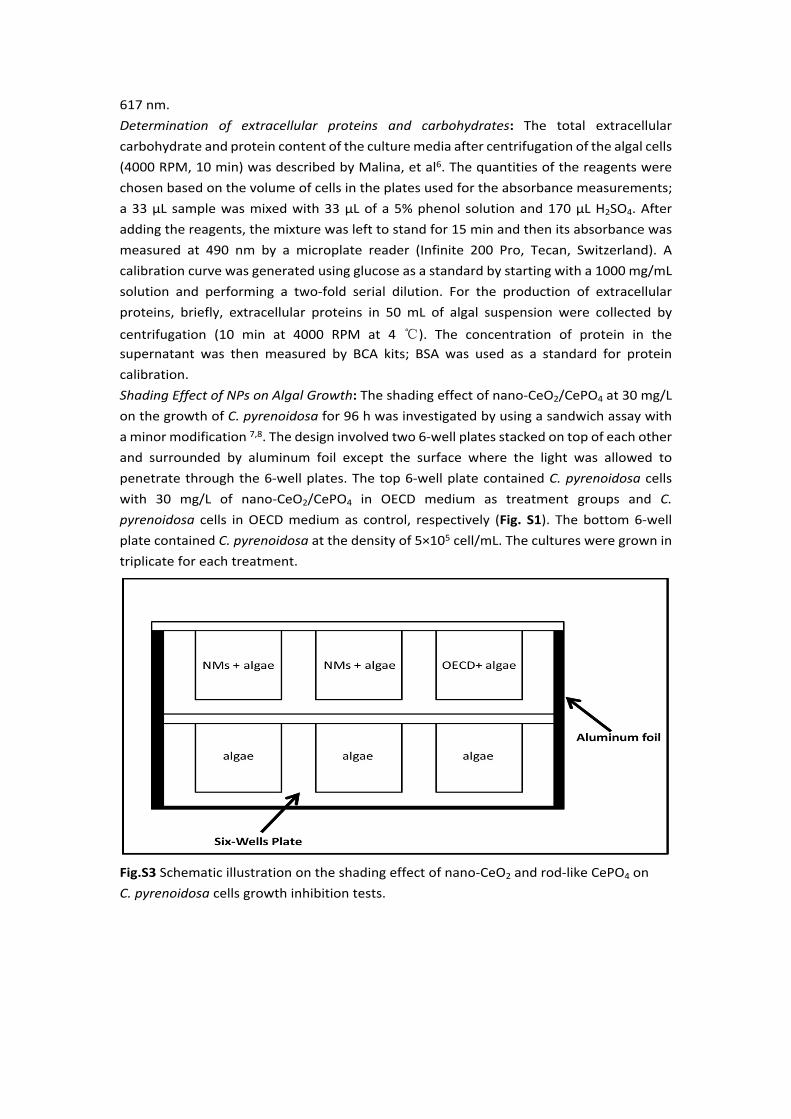
Fig. S4 Effects of the differ concentration of nano-CeO2 and rod-like CePO4 on the growth of C. pyrenoidosa cells. Significant differences versus control were marked with * (p < 0.05) and ** (p < 0.01). The values in the diagram are mean value ± SD.
Fig. S5 Effects of nano-CeO2 and rod-like CePO4 on the contents of photosynthetic pigments of C. pyrenoidosa. Significant differences versus control were marked with * (p < 0.05) and ** (p < 0.01). The values in the diagram are mean value ± SD.
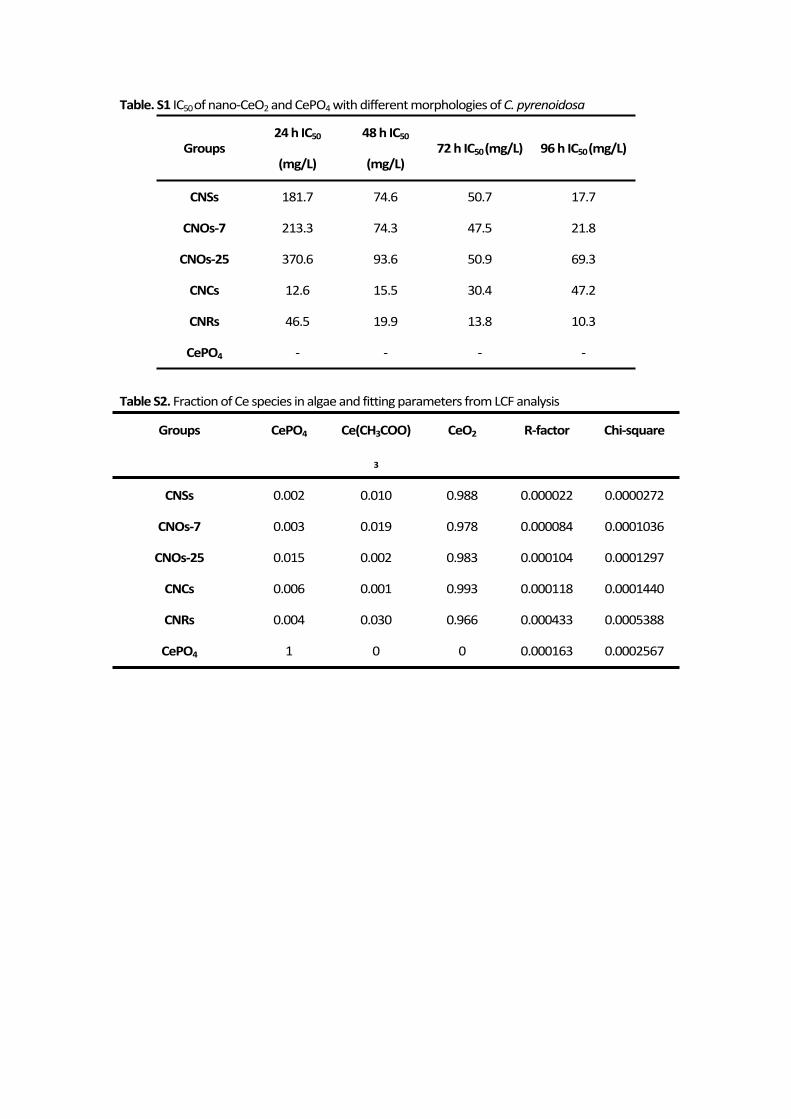
Table. S1 IC50 of nano-CeO2 and CePO4 with different morphologies of C. pyrenoidosa
Groups24 h IC50
(mg/L)
48 h IC50
(mg/L)72 h IC50 (mg/L) 96 h IC50 (mg/L)
CNSs 181.7 74.6 50.7 17.7
CNOs-7 213.3 74.3 47.5 21.8
CNOs-25 370.6 93.6 50.9 69.3
CNCs 12.6 15.5 30.4 47.2
CNRs 46.5 19.9 13.8 10.3
CePO4 - - - -
Table S2. Fraction of Ce species in algae and fitting parameters from LCF analysis
Groups CePO4 Ce(CH3COO)
3
CeO2 R-factor Chi-square
CNSs 0.002 0.010 0.988 0.000022 0.0000272
CNOs-7 0.003 0.019 0.978 0.000084 0.0001036
CNOs-25 0.015 0.002 0.983 0.000104 0.0001297
CNCs 0.006 0.001 0.993 0.000118 0.0001440
CNRs 0.004 0.030 0.966 0.000433 0.0005388
CePO4 1 0 0 0.000163 0.0002567
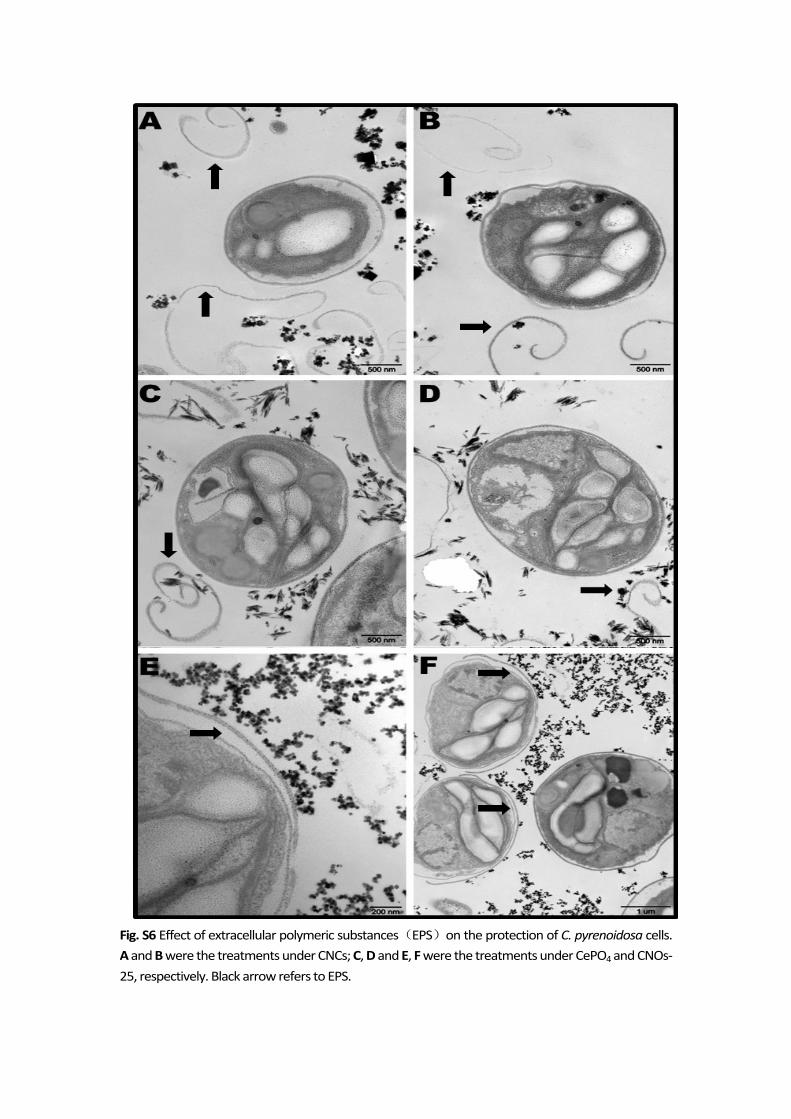
Fig. S6 Effect of extracellular polymeric substances(EPS)on the protection of C. pyrenoidosa cells. A and B were the treatments under CNCs; C, D and E, F were the treatments under CePO4 and CNOs-25, respectively. Black arrow refers to EPS.
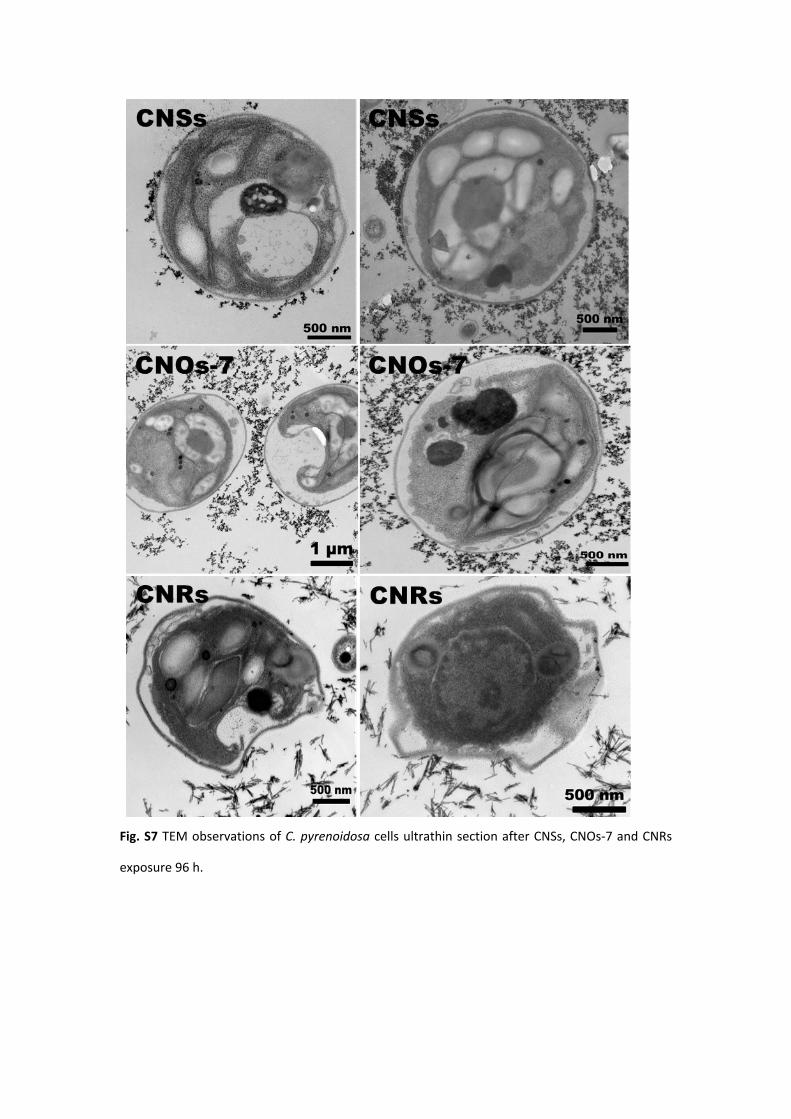
Fig. S7 TEM observations of C. pyrenoidosa cells ultrathin section after CNSs, CNOs-7 and CNRs
exposure 96 h.
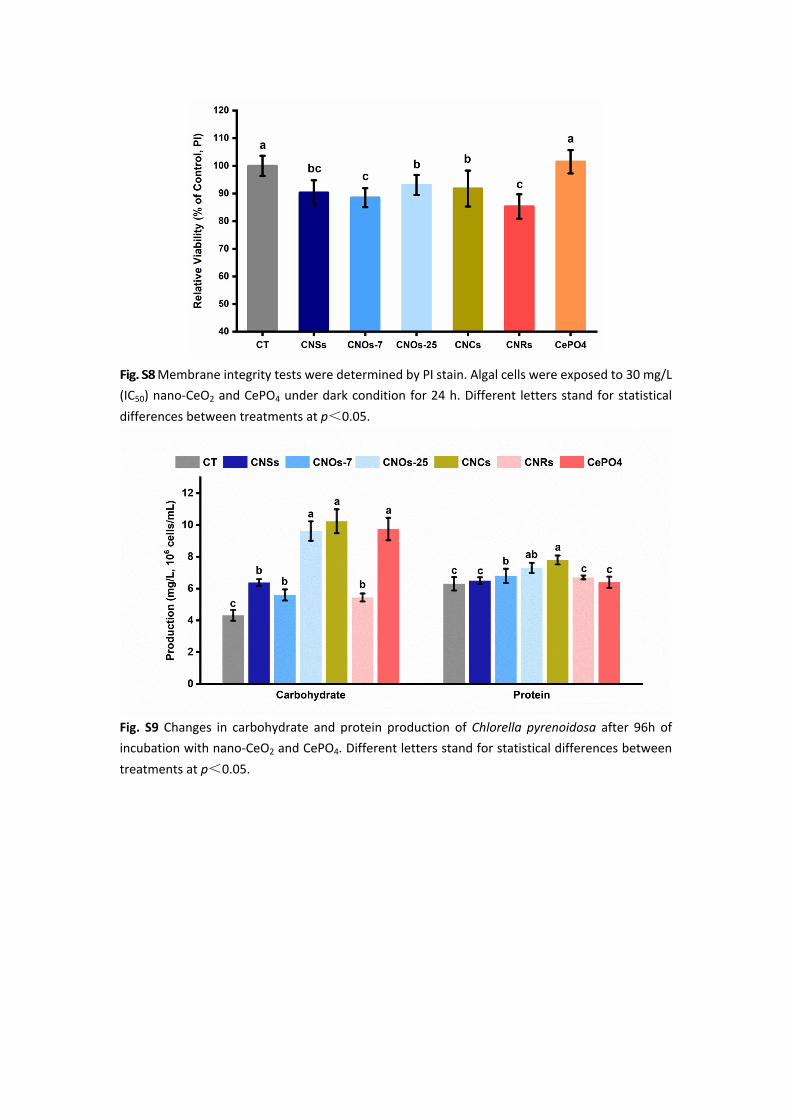
Fig. S8 Membrane integrity tests were determined by PI stain. Algal cells were exposed to 30 mg/L (IC50) nano-CeO2 and CePO4 under dark condition for 24 h. Different letters stand for statistical differences between treatments at p<0.05.
Fig. S9 Changes in carbohydrate and protein production of Chlorella pyrenoidosa after 96h of incubation with nano-CeO2 and CePO4. Different letters stand for statistical differences between treatments at p<0.05.
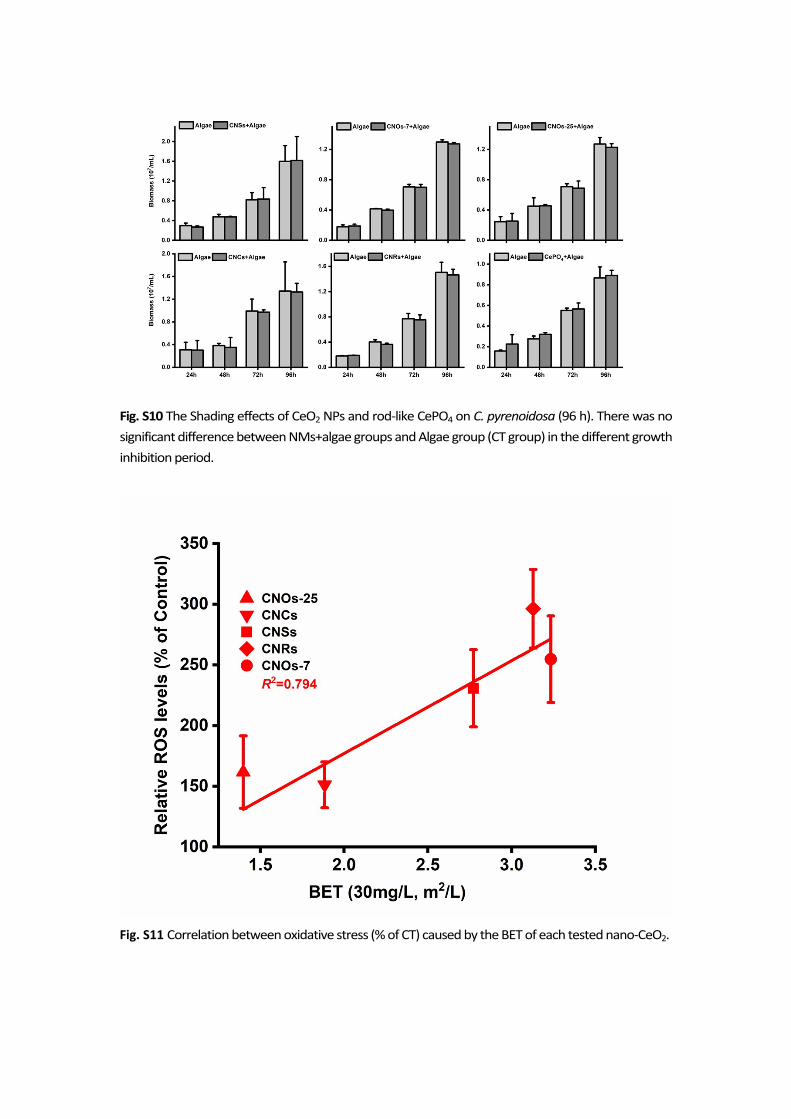
Fig. S10 The Shading effects of CeO2 NPs and rod-like CePO4 on C. pyrenoidosa (96 h). There was no significant difference between NMs+algae groups and Algae group (CT group) in the different growth inhibition period.
Fig. S11 Correlation between oxidative stress (% of CT) caused by the BET of each tested nano-CeO2.
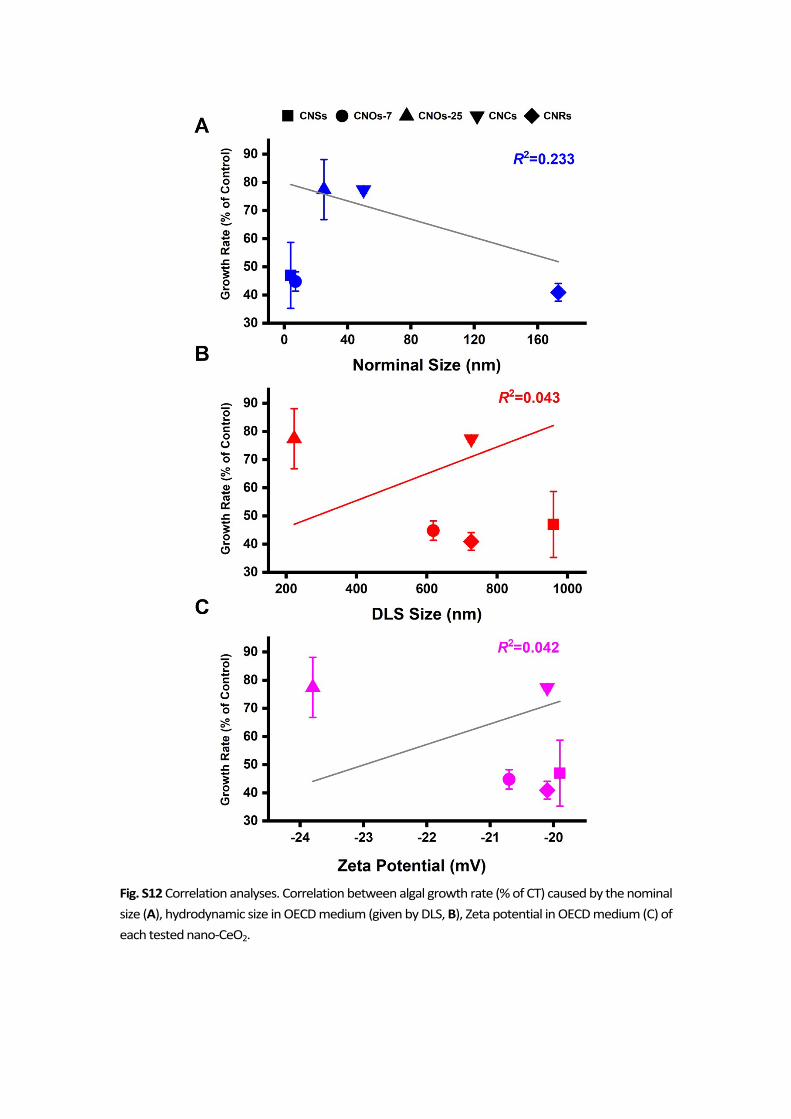
Fig. S12 Correlation analyses. Correlation between algal growth rate (% of CT) caused by the nominal size (A), hydrodynamic size in OECD medium (given by DLS, B), Zeta potential in OECD medium (C) of each tested nano-CeO2.
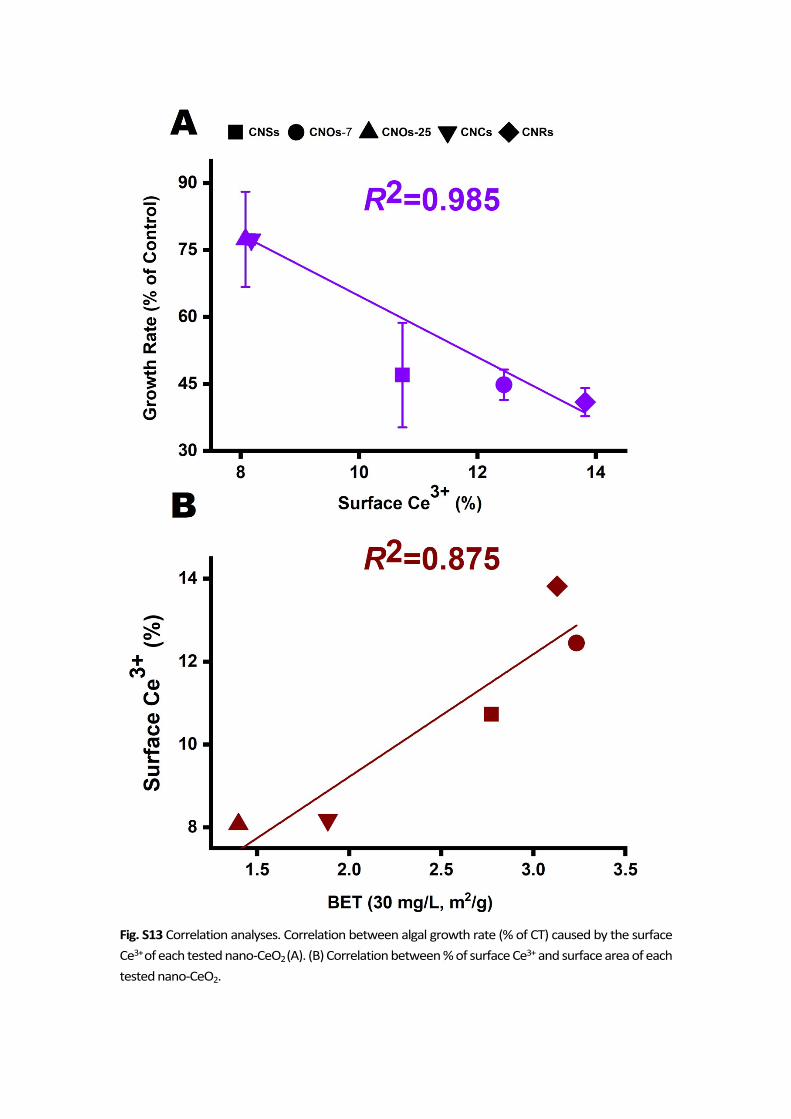
Fig. S13 Correlation analyses. Correlation between algal growth rate (% of CT) caused by the surface Ce3+ of each tested nano-CeO2 (A). (B) Correlation between % of surface Ce3+ and surface area of each tested nano-CeO2.
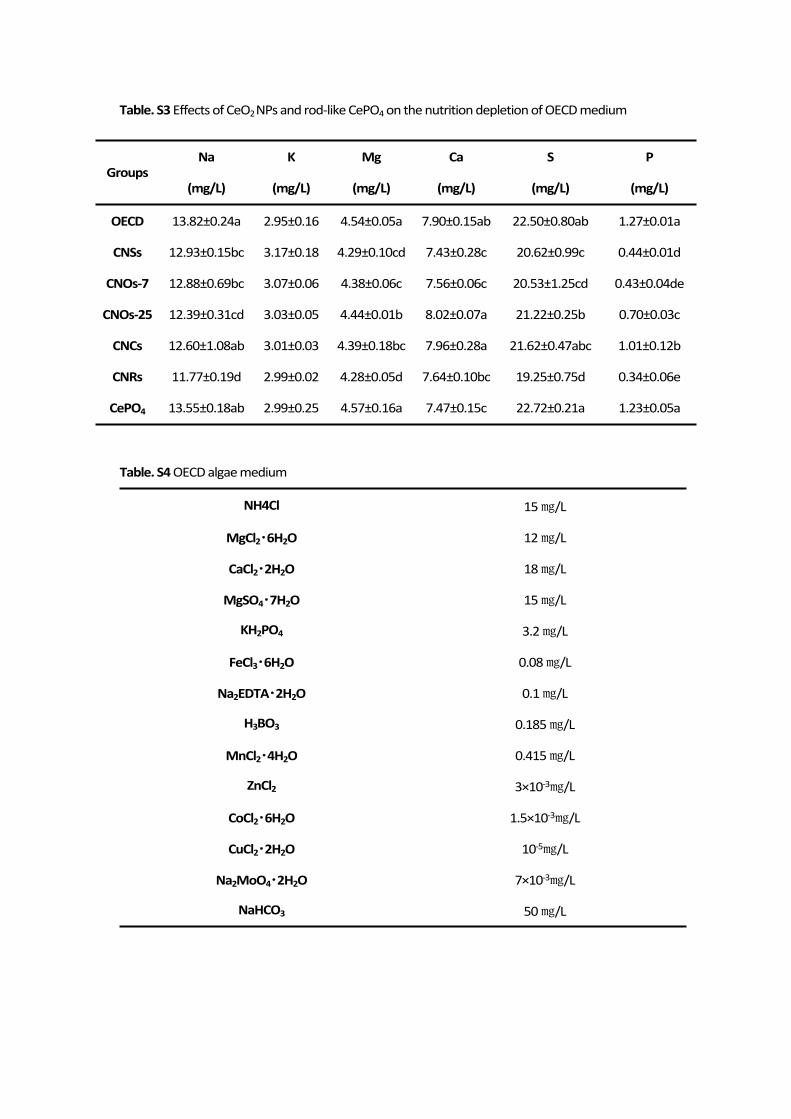
Table. S3 Effects of CeO2 NPs and rod-like CePO4 on the nutrition depletion of OECD medium
Table. S4 OECD algae medium
NH4Cl 15 ㎎/L
MgCl2・6H2O 12 ㎎/L
CaCl2・2H2O 18 ㎎/L
MgSO4・7H2O 15 ㎎/L
KH2PO4 3.2 ㎎/L
FeCl3・6H2O 0.08 ㎎/L
Na2EDTA・2H2O 0.1 ㎎/L
H3BO3 0.185 ㎎/L
MnCl2・4H2O 0.415 ㎎/L
ZnCl2 3×10⁻³㎎/L
CoCl2・6H2O 1.5×10⁻³㎎/L
CuCl2・2H2O 10-5㎎/L
Na2MoO4・2H2O 7×10⁻³㎎/L
NaHCO3 50 ㎎/L
GroupsNa
(mg/L)
K
(mg/L)
Mg
(mg/L)
Ca
(mg/L)
S
(mg/L)
P
(mg/L)
OECD 13.82±0.24a 2.95±0.16 4.54±0.05a 7.90±0.15ab 22.50±0.80ab 1.27±0.01a
CNSs 12.93±0.15bc 3.17±0.18 4.29±0.10cd 7.43±0.28c 20.62±0.99c 0.44±0.01d
CNOs-7 12.88±0.69bc 3.07±0.06 4.38±0.06c 7.56±0.06c 20.53±1.25cd 0.43±0.04de
CNOs-25 12.39±0.31cd 3.03±0.05 4.44±0.01b 8.02±0.07a 21.22±0.25b 0.70±0.03c
CNCs 12.60±1.08ab 3.01±0.03 4.39±0.18bc 7.96±0.28a 21.62±0.47abc 1.01±0.12b
CNRs 11.77±0.19d 2.99±0.02 4.28±0.05d 7.64±0.10bc 19.25±0.75d 0.34±0.06e
CePO4 13.55±0.18ab 2.99±0.25 4.57±0.16a 7.47±0.15c 22.72±0.21a 1.23±0.05a
ReferenceZ. Zhang, X. He, H. Zhang, Y. Ma, P. Zhang, Y. Ding, Y. Zhao, Uptake and distribution of ceria nanoparticles in cucumber plants, Metallomics Integrated Biometal Science 2011, 3, 816.W. Yuezhong, C. Hui, S. Chensi, Z. Meirong, L. Weiping, Enantioselectivity tuning of chiral herbicide dichlorprop by copper: roles of reactive oxygen species, Environ. Sci. Technol. 2011, 45, 4778.X. He, C. Xie, Y. Ma, L. Wang, X. He, W. Shi, X. Liu, Y. Liu, Z. Zhang, Size-dependent toxicity of ThO2 nanoparticles to green algae Chlorella pyrenoidosa, Aquatic Toxicology 2019.S. W. Jeffrey, G. F. Humphrey, NEW SPECTROPHOTOMETRIC EQUATIONS FOR DETERMINING CHLOROPHYLLS A, B, C1 AND C2 IN HIGHER-PLANTS, ALGAE AND NATURAL PHYTOPLANKTON, Biochemie Und Physiologie Der Pflanzen 1975, 167, 191.S. Zhang, R. Deng, D. Lin, F. Wu, Distinct toxic interactions of TiO2 nanoparticles with four coexisting organochlorine contaminants on algae, Nanotoxicology 2017, 11, 1.T. Malina, E. Maršálková, K. Holá, J. Tuček, M. Scheibe, R. Zbořil, B. Maršálek, Toxicity of graphene oxide against algae and cyanobacteria: Nanoblade-morphology-induced mechanical injury and self-protection mechanism, Carbon 2019, 155, 386.J. Zhao, Y. Dai, Z. Wang, W. Ren, Y. Wei, X. Cao, B. Xing, Toxicity of GO to Freshwater Algae in the Presence of Al2O3 Particles with Different Morphologies: Importance of Heteroaggregation, Environ. Sci. Technol. 2018, 52, 13448. DOI 10.1021/acs.est.8b00815.J.-K. Wan, W.-L. Chu, Y.-Y. Kok, K.-W. Cheong, Assessing the toxicity of copper oxide nanoparticles and copper sulfate in a tropical Chlorella, Journal of Applied Phycology 2018, 30, 3153. DOI 10.1007/s10811-018-1408-3.