Embed Size (px)
Citation preview
Int. J. Electrochem. Sci., 7 (2012) 1443 - 1458
International Journal of
ELECTROCHEMICAL SCIENCE
www.electrochemsci.org
Corrosion Behaviour of Amorphous Niobium Oxide Coatings
P. N. Rojas, S. E. Rodil
Instituto de Investigaciones en Materiales, Universidad Nacional Autónoma de México, Ciudad
Universitaria, México D. F. *E-mail: [email protected]
Received: 21 September 2011 / Accepted: 14 January 2012 / Published: 1 February 2012
Niobium oxide films were evaluated as possible candidates for corrosion resistant biomedical coatings
using electrochemical methods. The films were deposited on medical grade stainless steel using a
reactive magnetron sputtering system starting from a pure Nb target. The long-term stability of the
films was evaluated by electrochemical impedance spectroscopy (EIS) as a function of time up to 500
hrs using two different simulated body fluids. The results indicated that the electrochemical stability of
the coatings is highly dependent upon the chemical composition of the solution. In 0.89% NaCl, the
coating failed by delamination, while in the Hartman solution, the niobium oxide film was very stable
providing protection to the stainless steel substrate.
Keywords: Corrosion; Impedance Spectroscopy; Niobium oxide; Thin Films
1. INTRODUCTION
Several metallic alloys fulfill the mechanical requirements of orthopedic prosthesis and fixation
devices. However, only few of them offer the required biocompatibility and corrosion resistance in the
physiological medium, as for example Co–Cr alloys, titanium alloys or certain stainless steels[1]. The
AISI 316L stainless steel is often used for temporary devices in orthopedic surgery such as plates,
nails, etc due to their lower cost and availability. However, it is well known that the presence of Cl-
ions in human body stimulates pitting and crevice corrosion attack [2], especially dangerous for
stainless steel. It corrodes in the body environment and release iron, chromium and nickel ions and
these ions are found to be powerful allergens and carcinogens [3]. In order to solve the problems
associated to these localized corrosion attacks and leaching of metallic ions, it is necessary to improve
the corrosion resistance of currently used type 316L SS. Different alternatives to improve the corrosion
response of stainless steel have been proposed, where surface modifications is one of the most
promising [4,5].
Int. J. Electrochem. Sci., Vol. 7, 2012
1444
Surface modification for corrosion and oxidation protection can be achieved by physical vapor
deposition (PVD) of ceramic coatings on the steel and, different functional and protective coatings
have been developed so far [6]. Particularly interesting are those based on transition metal ceramics;
nitrides and oxides, due to their enhanced surface hardness and wear resistance. In this work, we
evaluate the corrosion resistance of amorphous niobium oxide films using two different electrolytes
that simulates body fluid conditions.
The biocompatibility of niobium oxide films prepared by different techniques has been
previously evaluated [7]. In all cases, the biological results suggested that the material is a potential
candidate for surface modification of metallic implants and it would be more attractive if the film
provides both corrosion resistance and biocompatibility.
The amorphous niobium oxide films were deposited by magnetron sputtering on AISI 316L
steel. The corrosion resistance was evaluated in solutions simulating the mineral concentration of body
fluids; 0.89 wt% NaCl and Hartman solution. The latter contains, apart from similar Na and Cl ionic
concentrations, an organic molecule; the lactic acid.
The Hartman solution is a medical liquid used to replace body fluid and mineral salts, it is
isotonic with blood and thus will give us information about the corrosion response of the samples in an
electrolyte that simulates the mineral concentration of the physiological fluids. Basically, it contains
sodium (131 mEq), chloride (111 mEq), potassium (5 mEq) and calcium (4 mEq) ions plus lactic acid.
Lactic acid (2-hydroxypropanoic acid) is a chemical compound involved in a variety of biochemical
processes. In solution, the lactic acid can lose a proton from the acidic groups producing the lactate ion
(CH3CH(OH)COO). The blood lactate concentration in humans changes from 1-2 mmol/L at rest, to
20 mmol/L during extreme exercise. The lactate concentration in Hartman solution is slightly higher,
29 mmol/L, but very similar to the concentration of lactated Ringer´s solution, another solution
commonly used to simulate corrosion processes in physiological fluids. The use of a solution
containing an organic acid also allows us to elucidate the effect of the adsorption of the organic
molecule on the corrosion phenomena. In order to simulate the in vivo conditions, we should use
electrolytes containing proteins. However, the proteins are highly complex organic molecules
compared to the low molecular weight lactic acid and their adsorption mechanisms depend on too
many external factors. Therefore, as an initial stage of the research where the purpose is to evaluate the
material (amorphous niobium oxide films), a more simple and well-controlled electrolyte containing
organic molecules was chosen to study the electrochemical response in electrolytes containing salt
concentrations similar to body fluids and at least one organic component. Qualitatively, the adsorption
process of the organic molecule on the surfaces was evaluated by ellipsometry kinetic spectra.
2. EXPERIMENTAL DETAILS
2.1 Materials
Pieces of medical grade stainless steel (AISI316L) with dimensions of 10 x 10 x 1 mm3 were
used as the substrate material for the electrochemical studies. The surface was prepared with SiC grits
up to 600grade and then cleaned using an ultrasonic bath during 15 minutes using consecutively
Int. J. Electrochem. Sci., Vol. 7, 2012
1445
acetone, ethanol and deionized water. The nominal composition of the stainless steel (SS) substrates
was given by the steel-company (Tyysenkrup Mexinox) as 0.0019%C, 0.22%Si, 1.38%Mn,
17.21%Cr, 10.60%Ni, 2.05%Mo, 0.004%Ti, 0.043%N, 0.31%Cu, 0.085Co, 0.026%P, 0.026%S,
balance Fe.
Pure Nb metal (99.9%) was used as the target material in a reactive magnetron-sputtering
deposition system. The deposition conditions for the electrochemical evaluation were chosen
previously, as reported in another paper [8]. Briefly, the pressure and Ar/O2flow ratios were varied,
while the other deposition conditions were fixed. The whole set of samples were tested by
potentiodynamic polarization and polarization resistance. Analyzing these data and using as criteria
lower corrosion current densities and larger polarization resistances, the best deposition conditions
were selected. Using these conditions, a set of about 30 samples (150 nm thick) were deposited for
further electrochemical tests. In the present paper, the electrochemical characterization using
electrochemical impedance spectroscopy (EIS) after long-term immersion periods is presented. There
is very few information concerning the electrochemical response of Nb-based thin films and none
concerning its evaluation using electrolytes that simulate physiological fluids.
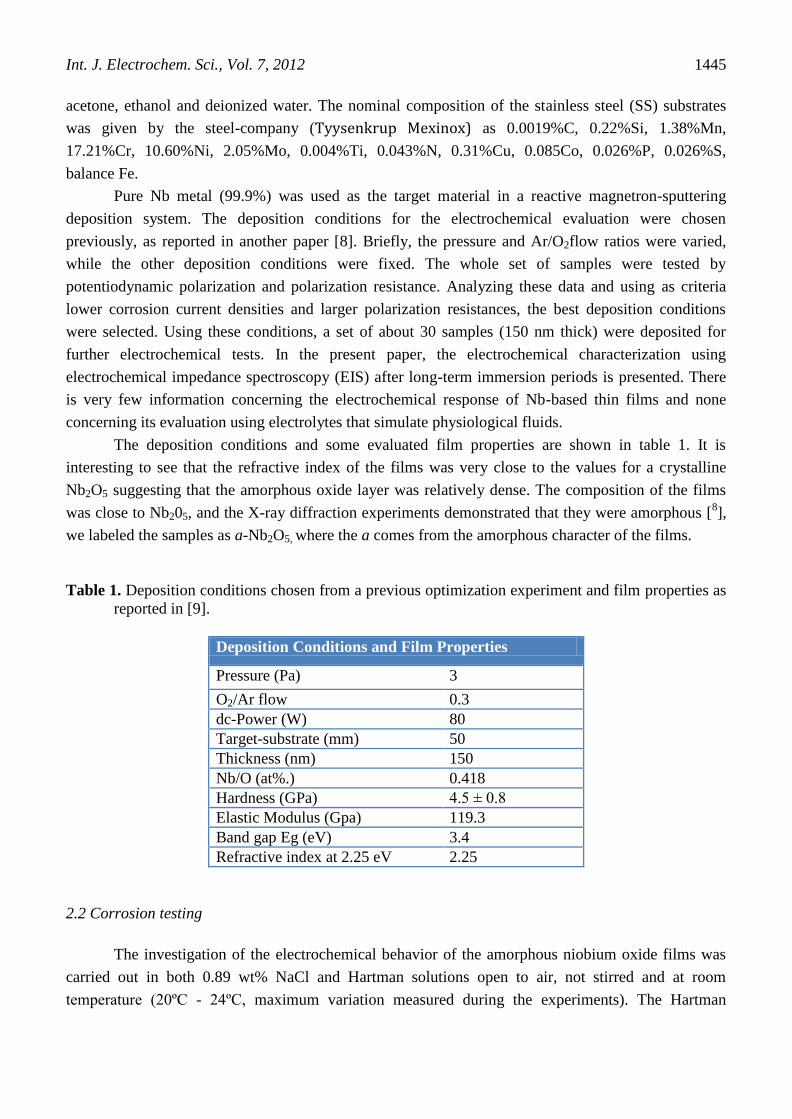
The deposition conditions and some evaluated film properties are shown in table 1. It is
interesting to see that the refractive index of the films was very close to the values for a crystalline
Nb2O5 suggesting that the amorphous oxide layer was relatively dense. The composition of the films
was close to Nb205, and the X-ray diffraction experiments demonstrated that they were amorphous [8],
we labeled the samples as a-Nb2O5, where the a comes from the amorphous character of the films.
Table 1. Deposition conditions chosen from a previous optimization experiment and film properties as
reported in [9].
Deposition Conditions and Film Properties
Pressure (Pa) 3
O2/Ar flow 0.3
dc-Power (W) 80
Target-substrate (mm) 50
Thickness (nm) 150
Nb/O (at%.) 0.418
Hardness (GPa) 4.5 ± 0.8
Elastic Modulus (Gpa) 119.3
Band gap Eg (eV) 3.4
Refractive index at 2.25 eV 2.25
2.2 Corrosion testing
The investigation of the electrochemical behavior of the amorphous niobium oxide films was
carried out in both 0.89 wt% NaCl and Hartman solutions open to air, not stirred and at room
temperature (20ºC - 24ºC, maximum variation measured during the experiments). The Hartman
Int. J. Electrochem. Sci., Vol. 7, 2012
1446
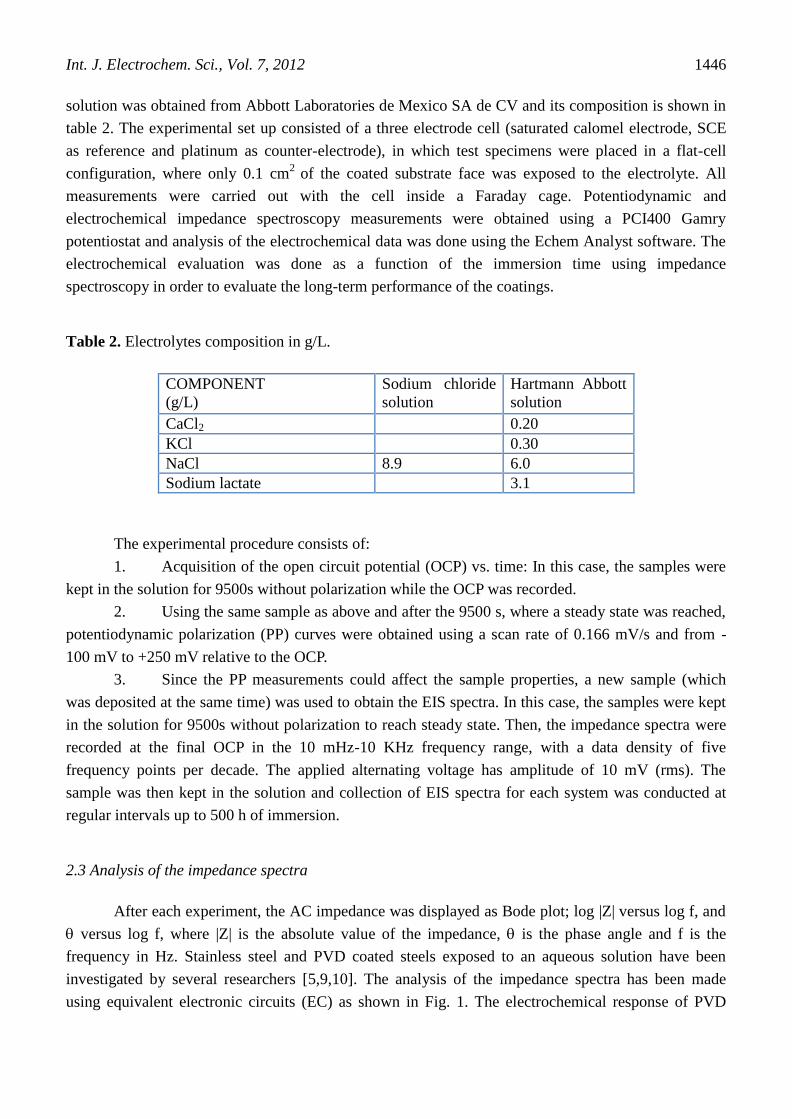
solution was obtained from Abbott Laboratories de Mexico SA de CV and its composition is shown in
table 2. The experimental set up consisted of a three electrode cell (saturated calomel electrode, SCE
as reference and platinum as counter-electrode), in which test specimens were placed in a flat-cell
configuration, where only 0.1 cm2
of the coated substrate face was exposed to the electrolyte. All
measurements were carried out with the cell inside a Faraday cage. Potentiodynamic and
electrochemical impedance spectroscopy measurements were obtained using a PCI400 Gamry
potentiostat and analysis of the electrochemical data was done using the Echem Analyst software. The
electrochemical evaluation was done as a function of the immersion time using impedance
spectroscopy in order to evaluate the long-term performance of the coatings.
Table 2. Electrolytes composition in g/L.
COMPONENT
(g/L)
Sodium chloride
solution
Hartmann Abbott
solution
CaCl2 0.20
KCl 0.30
NaCl 8.9 6.0
Sodium lactate 3.1
The experimental procedure consists of:
1. Acquisition of the open circuit potential (OCP) vs. time: In this case, the samples were
kept in the solution for 9500s without polarization while the OCP was recorded.
2. Using the same sample as above and after the 9500 s, where a steady state was reached,
potentiodynamic polarization (PP) curves were obtained using a scan rate of 0.166 mV/s and from -
100 mV to +250 mV relative to the OCP.
3. Since the PP measurements could affect the sample properties, a new sample (which
was deposited at the same time) was used to obtain the EIS spectra. In this case, the samples were kept
in the solution for 9500s without polarization to reach steady state. Then, the impedance spectra were
recorded at the final OCP in the 10 mHz-10 KHz frequency range, with a data density of five
frequency points per decade. The applied alternating voltage has amplitude of 10 mV (rms). The
sample was then kept in the solution and collection of EIS spectra for each system was conducted at
regular intervals up to 500 h of immersion.
2.3 Analysis of the impedance spectra
After each experiment, the AC impedance was displayed as Bode plot; log |Z| versus log f, and
versus log f, where |Z| is the absolute value of the impedance, is the phase angle and f is the
frequency in Hz. Stainless steel and PVD coated steels exposed to an aqueous solution have been
investigated by several researchers [5,9,10]. The analysis of the impedance spectra has been made
using equivalent electronic circuits (EC) as shown in Fig. 1. The electrochemical response of PVD
Int. J. Electrochem. Sci., Vol. 7, 2012
1447
coatings have been studied by different research groups showing that there is a characteristic response,
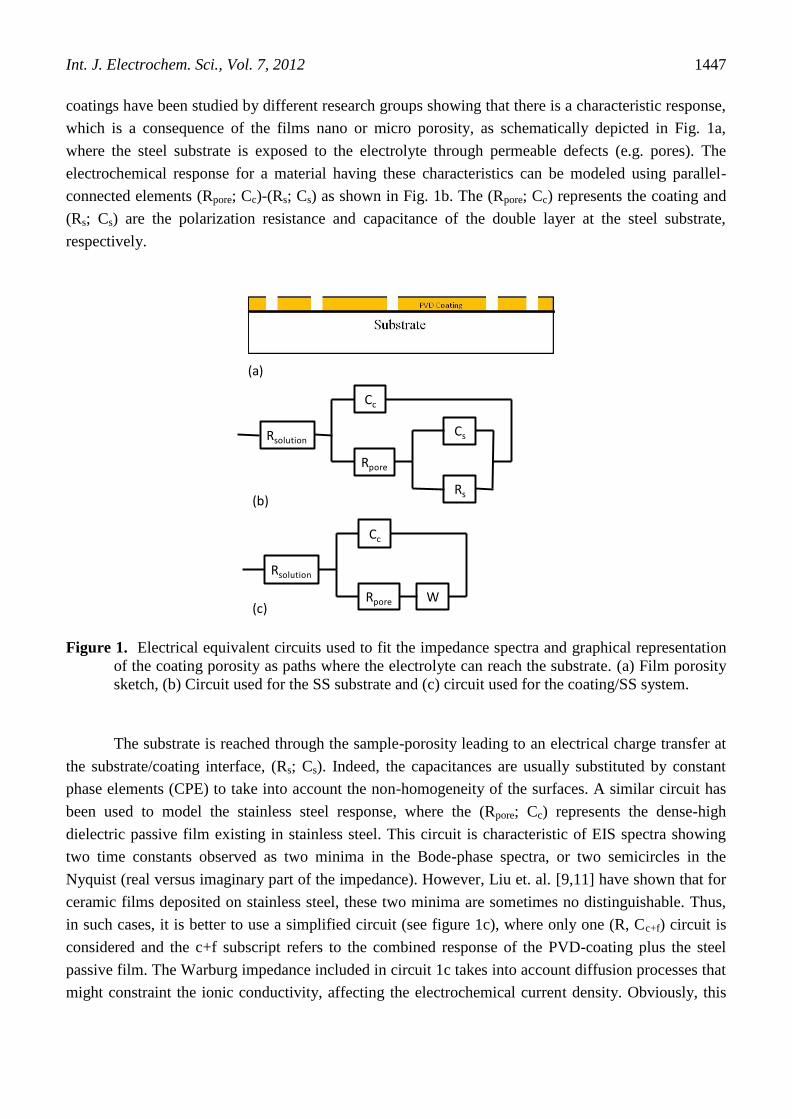
which is a consequence of the films nano or micro porosity, as schematically depicted in Fig. 1a,
where the steel substrate is exposed to the electrolyte through permeable defects (e.g. pores). The
electrochemical response for a material having these characteristics can be modeled using parallel-
connected elements (Rpore; Cc)-(Rs; Cs) as shown in Fig. 1b. The (Rpore; Cc) represents the coating and
(Rs; Cs) are the polarization resistance and capacitance of the double layer at the steel substrate,
respectively.
Rsolution
Cc
Rpore
Cs
Rs
Rsolution
Cc
Rpore W
(a)
(b)
(c)
Figure 1. Electrical equivalent circuits used to fit the impedance spectra and graphical representation
of the coating porosity as paths where the electrolyte can reach the substrate. (a) Film porosity
sketch, (b) Circuit used for the SS substrate and (c) circuit used for the coating/SS system.
The substrate is reached through the sample-porosity leading to an electrical charge transfer at
the substrate/coating interface, (Rs; Cs). Indeed, the capacitances are usually substituted by constant
phase elements (CPE) to take into account the non-homogeneity of the surfaces. A similar circuit has
been used to model the stainless steel response, where the (Rpore; Cc) represents the dense-high
dielectric passive film existing in stainless steel. This circuit is characteristic of EIS spectra showing
two time constants observed as two minima in the Bode-phase spectra, or two semicircles in the
Nyquist (real versus imaginary part of the impedance). However, Liu et. al. [9,11] have shown that for
ceramic films deposited on stainless steel, these two minima are sometimes no distinguishable. Thus,
in such cases, it is better to use a simplified circuit (see figure 1c), where only one (R, Cc+f) circuit is
considered and the c+f subscript refers to the combined response of the PVD-coating plus the steel
passive film. The Warburg impedance included in circuit 1c takes into account diffusion processes that
might constraint the ionic conductivity, affecting the electrochemical current density. Obviously, this
Int. J. Electrochem. Sci., Vol. 7, 2012
1448
limited diffusion, which occurs through the coating defects, is strongly correlated to the film
microstructure. Thus, the use of the Warburg impedance as part of the electronic circuit depends on the
film’s response.
For this work, the substrates (AISI316L) were modeled using the circuit in figure 1b and the a-
Nb2O5 coatings deposited on stainless steel were modeled using the circuit in figure 1c, including the
Warburg impedance, as explained in more detail later.
2.4 Adsorption kinetics
Ellipsometry was used as a technique to monitor in time the adsorption of the organic
molecules (lactic acid) on both surfaces. For these kinetic spectra, a phase modulated ellipsometer
(HORIBA-JobinYvon UVISEL) was used. Ellipsometry is a sensitive optical technique that measures
the change in the state of the polarization of light upon reflection from a planar interface in order to
gain information about the structure of that interface. The technique has matured over the last four
decades owing to a combination of instrumental developments such as laser sources and phase-
modulated polarizers and advances in data analysis derived from theoretical insights and faster
computers. In any ellipsometry experiment, upon reflection of the polarized light at a known angle-of-
incidence and with a known wavelength , the relative change in the amplitude of the polarized light
(expressed as ) and the relative change in the phase difference between the parallel and perpendicular
components of the light (expressed as ) are determined.
These angle parameters are extremely sensible to any variation in the surface (changes of the
order of 0.001° are detectable), including an adsorbed layer of organic molecules due to the different
refractive index and the thickness of the adsorbed layer. Ellipsometry have been used to perform
adsorption experiments in situ and real time demonstrating being a precise analysis of adsorption
kinetic [12] . In this work, we measured the kinetic adsorption spectra using ellipsometry to
qualitatively confirm the adsorption of the organic molecule (lactic acid) on the surfaces and if the
differences in such adsorption could be correlated to the electrochemical response.
3. RESULTS
3.1 Open Circuit Potential (OCP)
Figure 2 shows the continuous variation of the open circuit potential during the first 2.5 hours
of immersion. It might be observed that there are large differences in the response of the same material
to the different electrolytes, even though the Cl- ionic concentration is similar for both electrolytes. The
most noble and stable potential was obtained for the coating in the Hartman solution (-0.05V),
reaching a fairly steady value after few minutes of immersion. This is not the case for the coating in
the NaCl solution, where a fast decreased in the potential was observed during the initial minutes of
the test, which suggested film breakdown.
Int. J. Electrochem. Sci., Vol. 7, 2012
1449
0.0 0.5 1.0 1.5 2.0 2.5
-0.4
-0.3
-0.2
-0.1
0.0
SS NaCl
a-Nb2O
5 NaCl
Eo
cp(V
) vs. S
CE
Time (h)
a-Nb2O
5 Hartman
SS Hartman
?
pitting
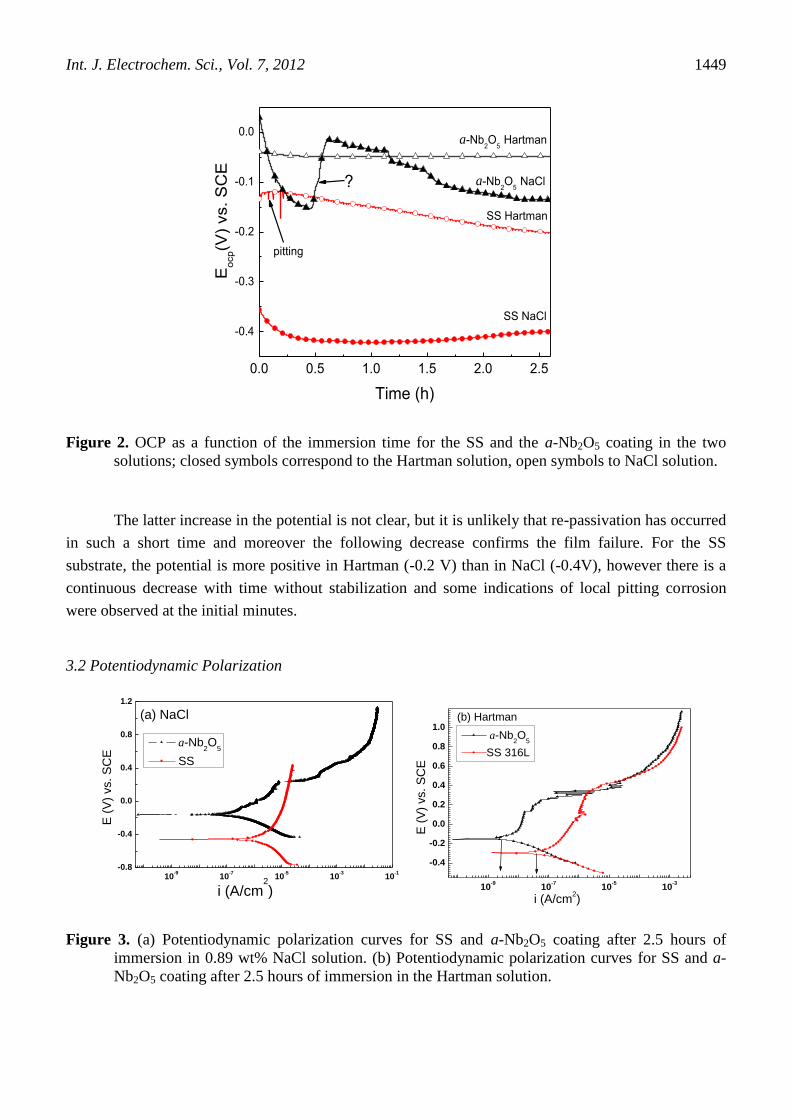
Figure 2. OCP as a function of the immersion time for the SS and the a-Nb2O5 coating in the two
solutions; closed symbols correspond to the Hartman solution, open symbols to NaCl solution.
The latter increase in the potential is not clear, but it is unlikely that re-passivation has occurred
in such a short time and moreover the following decrease confirms the film failure. For the SS
substrate, the potential is more positive in Hartman (-0.2 V) than in NaCl (-0.4V), however there is a
continuous decrease with time without stabilization and some indications of local pitting corrosion
were observed at the initial minutes.
3.2 Potentiodynamic Polarization
10-9
10-7
10-5
10-3
10-1
-0.8
-0.4
0.0
0.4
0.8
1.2
E (
V)
vs.
SC
E
i (A/cm2
)
a-Nb2O
5
SS
(a) NaCl
10-9
10-7
10-5
10-3
-0.4
-0.2
0.0
0.2
0.4
0.6
0.8
1.0 a-Nb
2O
5
SS 316L
E (
V)
vs. S
CE
i (A/cm2)
(b) Hartman
Figure 3. (a) Potentiodynamic polarization curves for SS and a-Nb2O5 coating after 2.5 hours of
immersion in 0.89 wt% NaCl solution. (b) Potentiodynamic polarization curves for SS and a-
Nb2O5 coating after 2.5 hours of immersion in the Hartman solution.
Int. J. Electrochem. Sci., Vol. 7, 2012
1450
Figures 3 show the polarization curves for both the SS and the coating after 2.5 hrs of
immersion in 3(a) NaCl and 3(b) Hartman. The behaviors are not strictly Tafel-like, so no calculations
were done. Qualitatively, we can see that in both cases, the corrosion potential is more positive for the
coating than for the steel and the approximate corrosion current densities (~Icorr) are very low, typical
of passive materials (range between 10-7
-10-9
A/cm2). The ~Icorr (black arrow) is much lower for the
coating than for the steel substrate and this difference is larger in the Hartman solution, which is again
an indication of the larger corrosion resistance of the coating compared to the SS. However, for the
NaCl solution, the film breaks down at a potential (0.23 V) where the SS substrate is still passive, in
agreement with the observed failure of the a-Nb2O5 in NaCl during the OCP experiments.
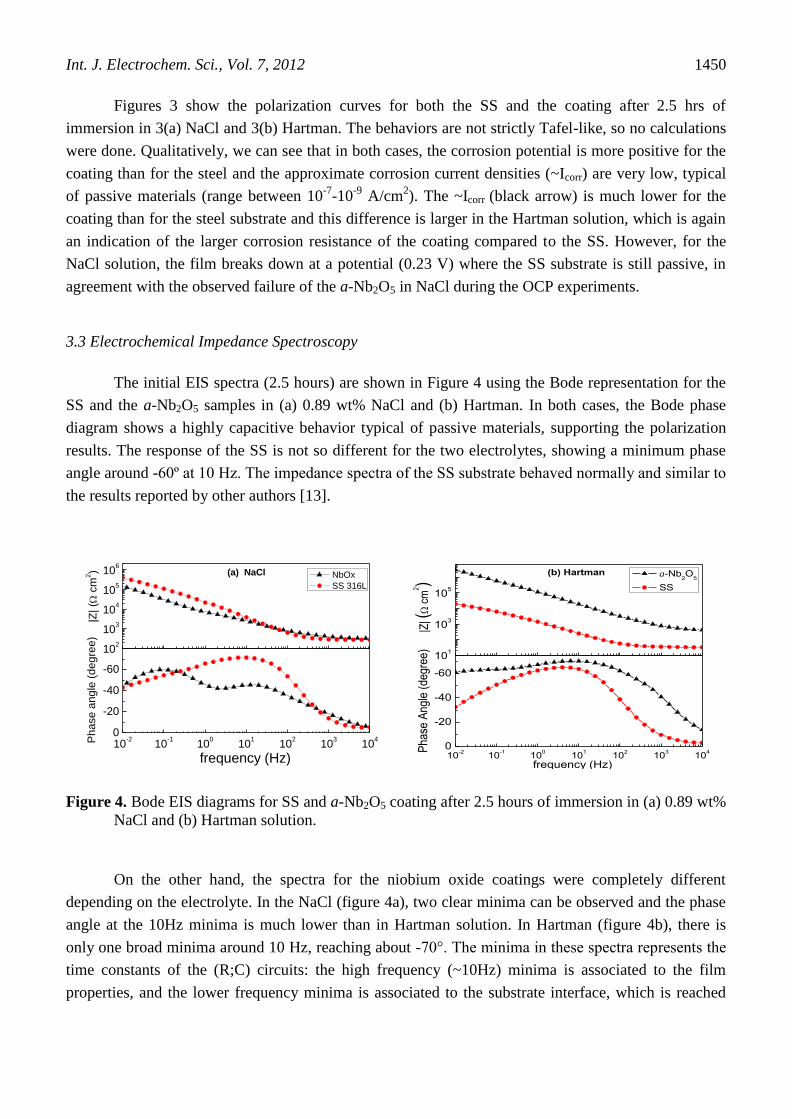
3.3 Electrochemical Impedance Spectroscopy
The initial EIS spectra (2.5 hours) are shown in Figure 4 using the Bode representation for the
SS and the a-Nb2O5 samples in (a) 0.89 wt% NaCl and (b) Hartman. In both cases, the Bode phase
diagram shows a highly capacitive behavior typical of passive materials, supporting the polarization
results. The response of the SS is not so different for the two electrolytes, showing a minimum phase
angle around -60º at 10 Hz. The impedance spectra of the SS substrate behaved normally and similar to
the results reported by other authors [13].
102
103
104
105
106
NbOx
SS 316L
Phase a
ng
le (
deg
ree)
|Z
| (
cm
2)
10-2
10-1
100
101
102
103
104
0
-20
-40
-60
frequency (Hz)
(a) NaCl
101
103
105
a-Nb2O
5
SS
(b) Hartman
10-2
10-1
100
101
102
103
104
0
-20
-40
-60
Pha
se A
ngle
(de
gree
)
frequency (Hz)
|Z| (
c
m2 )
Figure 4. Bode EIS diagrams for SS and a-Nb2O5 coating after 2.5 hours of immersion in (a) 0.89 wt%
NaCl and (b) Hartman solution.
On the other hand, the spectra for the niobium oxide coatings were completely different
depending on the electrolyte. In the NaCl (figure 4a), two clear minima can be observed and the phase
angle at the 10Hz minima is much lower than in Hartman solution. In Hartman (figure 4b), there is
only one broad minima around 10 Hz, reaching about -70°. The minima in these spectra represents the
time constants of the (R;C) circuits: the high frequency (~10Hz) minima is associated to the film
properties, and the lower frequency minima is associated to the substrate interface, which is reached
Int. J. Electrochem. Sci., Vol. 7, 2012
1451
through the film porosity. Therefore, the spectra observed in figure 4a for the coating in the NaCl
solution indicated that at the initial exposure (2.5 hours) the electrolyte had already penetrated the
coating reaching the underlying metal through the porosity. The spectra acquired at longer immersion
times, confirmed such penetration and the film-failure was evident by scanning electron microscope
(SEM) images obtained after the immersion experiments.
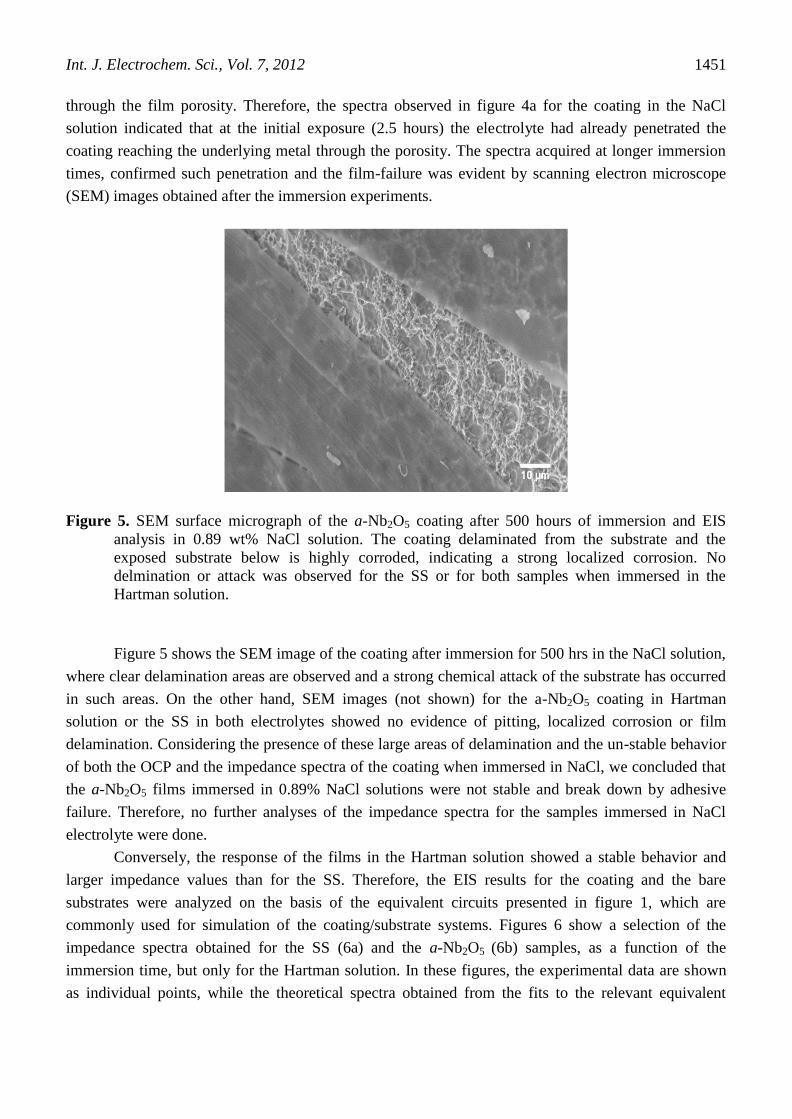
Figure 5. SEM surface micrograph of the a-Nb2O5 coating after 500 hours of immersion and EIS
analysis in 0.89 wt% NaCl solution. The coating delaminated from the substrate and the
exposed substrate below is highly corroded, indicating a strong localized corrosion. No
delmination or attack was observed for the SS or for both samples when immersed in the
Hartman solution.
Figure 5 shows the SEM image of the coating after immersion for 500 hrs in the NaCl solution,
where clear delamination areas are observed and a strong chemical attack of the substrate has occurred
in such areas. On the other hand, SEM images (not shown) for the a-Nb2O5 coating in Hartman
solution or the SS in both electrolytes showed no evidence of pitting, localized corrosion or film
delamination. Considering the presence of these large areas of delamination and the un-stable behavior
of both the OCP and the impedance spectra of the coating when immersed in NaCl, we concluded that
the a-Nb2O5 films immersed in 0.89% NaCl solutions were not stable and break down by adhesive
failure. Therefore, no further analyses of the impedance spectra for the samples immersed in NaCl
electrolyte were done.
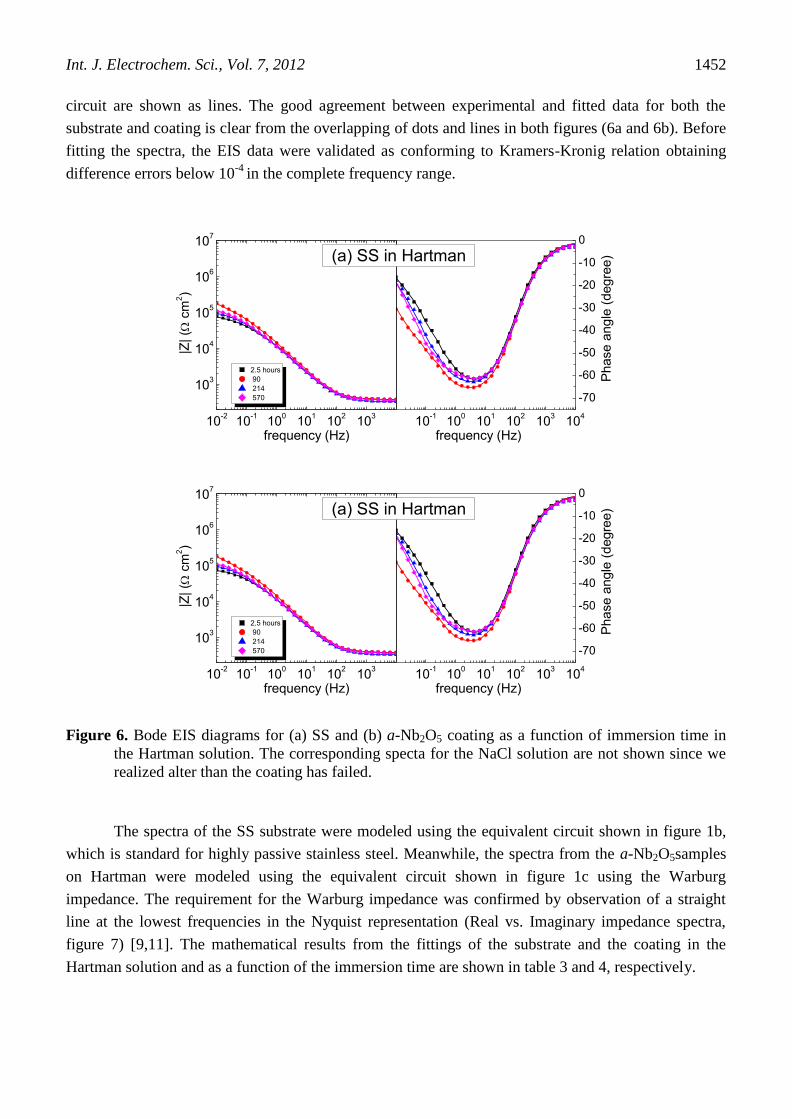
Conversely, the response of the films in the Hartman solution showed a stable behavior and
larger impedance values than for the SS. Therefore, the EIS results for the coating and the bare
substrates were analyzed on the basis of the equivalent circuits presented in figure 1, which are
commonly used for simulation of the coating/substrate systems. Figures 6 show a selection of the
impedance spectra obtained for the SS (6a) and the a-Nb2O5 (6b) samples, as a function of the
immersion time, but only for the Hartman solution. In these figures, the experimental data are shown
as individual points, while the theoretical spectra obtained from the fits to the relevant equivalent
Int. J. Electrochem. Sci., Vol. 7, 2012
1452
circuit are shown as lines. The good agreement between experimental and fitted data for both the
substrate and coating is clear from the overlapping of dots and lines in both figures (6a and 6b). Before
fitting the spectra, the EIS data were validated as conforming to Kramers-Kronig relation obtaining
difference errors below 10-4
in the complete frequency range.
10-2
10-1
100
101
102
103
103
104
105
106
107
2.5 hours
90
214
570
frequency (Hz)
|Z| (
cm
2)
10-1
100
101
102
103
104
-70
-60
-50
-40
-30
-20
-10
0
Phase a
ngle
(degre
e)
frequency (Hz)
(a) SS in Hartman
10-2
10-1
100
101
102
103
103
104
105
106
107
2.5 hours
90
214
570
frequency (Hz)
|Z| (
cm
2)
10-1
100
101
102
103
104
-70
-60
-50
-40
-30
-20
-10
0
Phase a
ngle
(degre
e)
frequency (Hz)
(a) SS in Hartman
Figure 6. Bode EIS diagrams for (a) SS and (b) a-Nb2O5 coating as a function of immersion time in
the Hartman solution. The corresponding specta for the NaCl solution are not shown since we
realized alter than the coating has failed.
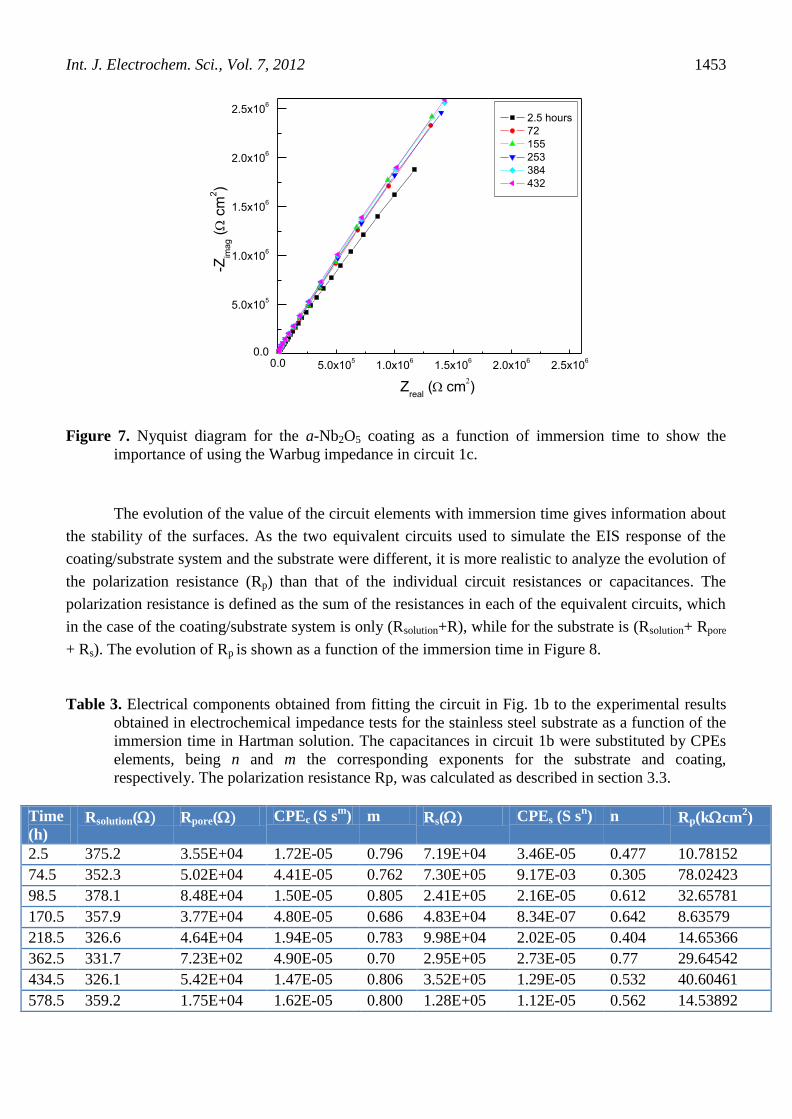
The spectra of the SS substrate were modeled using the equivalent circuit shown in figure 1b,
which is standard for highly passive stainless steel. Meanwhile, the spectra from the a-Nb2O5samples
on Hartman were modeled using the equivalent circuit shown in figure 1c using the Warburg
impedance. The requirement for the Warburg impedance was confirmed by observation of a straight
line at the lowest frequencies in the Nyquist representation (Real vs. Imaginary impedance spectra,
figure 7) [9,11]. The mathematical results from the fittings of the substrate and the coating in the
Hartman solution and as a function of the immersion time are shown in table 3 and 4, respectively.
Int. J. Electrochem. Sci., Vol. 7, 2012
1453
0.0 5.0x10⁵
1.0x10⁶
1.5x10⁶
2.0x10⁶
2.5x10⁶
0.0
5.0x10⁵
1.0x10⁶
1.5x10⁶
2.0x10⁶
2.5x10⁶
-Zim
ag (
cm
2)
Zreal
(cm)
2.5 hours
72
155
253
384
432
Figure 7. Nyquist diagram for the a-Nb2O5 coating as a function of immersion time to show the
importance of using the Warbug impedance in circuit 1c.
The evolution of the value of the circuit elements with immersion time gives information about
the stability of the surfaces. As the two equivalent circuits used to simulate the EIS response of the
coating/substrate system and the substrate were different, it is more realistic to analyze the evolution of
the polarization resistance (Rp) than that of the individual circuit resistances or capacitances. The
polarization resistance is defined as the sum of the resistances in each of the equivalent circuits, which
in the case of the coating/substrate system is only (Rsolution+R), while for the substrate is (Rsolution+ Rpore
+ Rs). The evolution of Rp is shown as a function of the immersion time in Figure 8.
Table 3. Electrical components obtained from fitting the circuit in Fig. 1b to the experimental results
obtained in electrochemical impedance tests for the stainless steel substrate as a function of the
immersion time in Hartman solution. The capacitances in circuit 1b were substituted by CPEs
elements, being n and m the corresponding exponents for the substrate and coating,
respectively. The polarization resistance Rp, was calculated as described in section 3.3.
Time
(h) Rsolution( Rpore( CPEc (S s
m) m Rs( CPEs (S s
n) n Rp(kcm
2)
2.5 375.2 3.55E+04 1.72E-05 0.796 7.19E+04 3.46E-05 0.477 10.78152
74.5 352.3 5.02E+04 4.41E-05 0.762 7.30E+05 9.17E-03 0.305 78.02423
98.5 378.1 8.48E+04 1.50E-05 0.805 2.41E+05 2.16E-05 0.612 32.65781
170.5 357.9 3.77E+04 4.80E-05 0.686 4.83E+04 8.34E-07 0.642 8.63579
218.5 326.6 4.64E+04 1.94E-05 0.783 9.98E+04 2.02E-05 0.404 14.65366
362.5 331.7 7.23E+02 4.90E-05 0.70 2.95E+05 2.73E-05 0.77 29.64542
434.5 326.1 5.42E+04 1.47E-05 0.806 3.52E+05 1.29E-05 0.532 40.60461
578.5 359.2 1.75E+04 1.62E-05 0.800 1.28E+05 1.12E-05 0.562 14.53892
Int. J. Electrochem. Sci., Vol. 7, 2012
1454
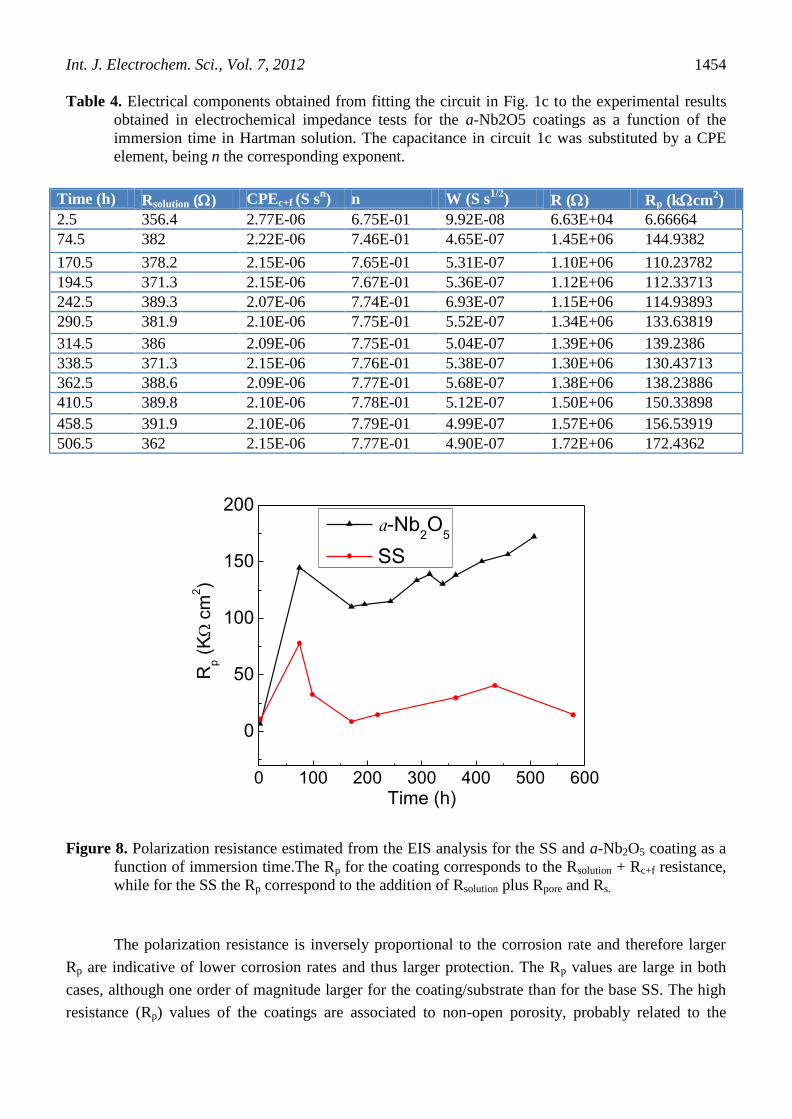
Table 4. Electrical components obtained from fitting the circuit in Fig. 1c to the experimental results
obtained in electrochemical impedance tests for the a-Nb2O5 coatings as a function of the
immersion time in Hartman solution. The capacitance in circuit 1c was substituted by a CPE
element, being n the corresponding exponent.
Time (h) Rsolution () CPEc+f (S sn) n W (S s
1/2) R () Rp (kcm
2)
2.5 356.4 2.77E-06 6.75E-01 9.92E-08 6.63E+04 6.66664
74.5 382 2.22E-06 7.46E-01 4.65E-07 1.45E+06 144.9382
170.5 378.2 2.15E-06 7.65E-01 5.31E-07 1.10E+06 110.23782
194.5 371.3 2.15E-06 7.67E-01 5.36E-07 1.12E+06 112.33713
242.5 389.3 2.07E-06 7.74E-01 6.93E-07 1.15E+06 114.93893
290.5 381.9 2.10E-06 7.75E-01 5.52E-07 1.34E+06 133.63819
314.5 386 2.09E-06 7.75E-01 5.04E-07 1.39E+06 139.2386
338.5 371.3 2.15E-06 7.76E-01 5.38E-07 1.30E+06 130.43713
362.5 388.6 2.09E-06 7.77E-01 5.68E-07 1.38E+06 138.23886
410.5 389.8 2.10E-06 7.78E-01 5.12E-07 1.50E+06 150.33898
458.5 391.9 2.10E-06 7.79E-01 4.99E-07 1.57E+06 156.53919
506.5 362 2.15E-06 7.77E-01 4.90E-07 1.72E+06 172.4362
0 100 200 300 400 500 600
0
50
100
150
200
Rp (
Kc
m2)
Time (h)
a-Nb2O
5
SS
Figure 8. Polarization resistance estimated from the EIS analysis for the SS and a-Nb2O5 coating as a
function of immersion time.The Rp for the coating corresponds to the Rsolution + Rc+f resistance,
while for the SS the Rp correspond to the addition of Rsolution plus Rpore and Rs.
The polarization resistance is inversely proportional to the corrosion rate and therefore larger
Rp are indicative of lower corrosion rates and thus larger protection. The Rp values are large in both
cases, although one order of magnitude larger for the coating/substrate than for the base SS. The high
resistance (Rp) values of the coatings are associated to non-open porosity, probably related to the
Int. J. Electrochem. Sci., Vol. 7, 2012
1455
amorphous nature of the oxide film, but also to a certain effect of the components of the electrolyte.
Figure 8 shows a rapid decrease in time of the Rp for the coating during the first hours of immersion
(from 150 to 100 kcm2 during the first 100 hours) that illustrates some penetration within the
confined nanoporous to the substrate.
Nevertheless, for longer immersion times, the Rp do not decrease any longer and a small
recovery can be observed.
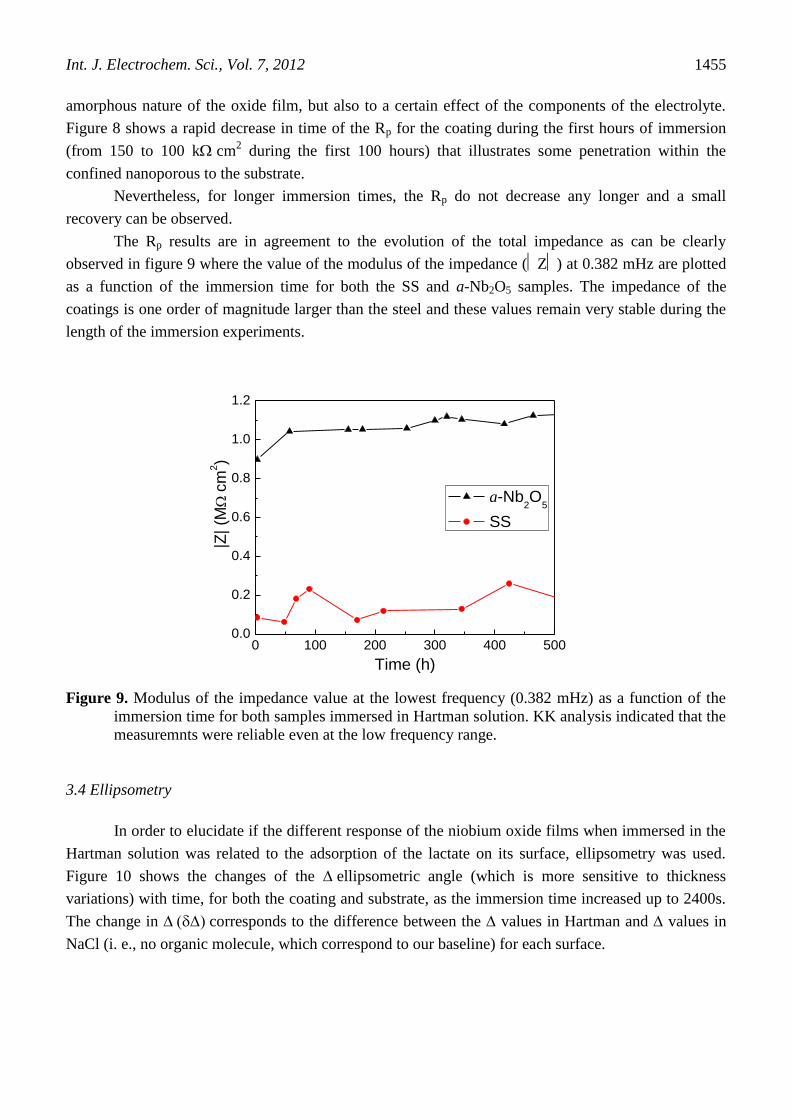
The Rp results are in agreement to the evolution of the total impedance as can be clearly
observed in figure 9 where the value of the modulus of the impedance (Z) at 0.382 mHz are plotted
as a function of the immersion time for both the SS and a-Nb2O5 samples. The impedance of the
coatings is one order of magnitude larger than the steel and these values remain very stable during the
length of the immersion experiments.
0 100 200 300 400 5000.0
0.2
0.4
0.6
0.8
1.0
1.2
|Z| (M
c
m2)
Time (h)
a-Nb2O
5
SS
Figure 9. Modulus of the impedance value at the lowest frequency (0.382 mHz) as a function of the
immersion time for both samples immersed in Hartman solution. KK analysis indicated that the
measuremnts were reliable even at the low frequency range.
3.4 Ellipsometry
In order to elucidate if the different response of the niobium oxide films when immersed in the
Hartman solution was related to the adsorption of the lactate on its surface, ellipsometry was used.
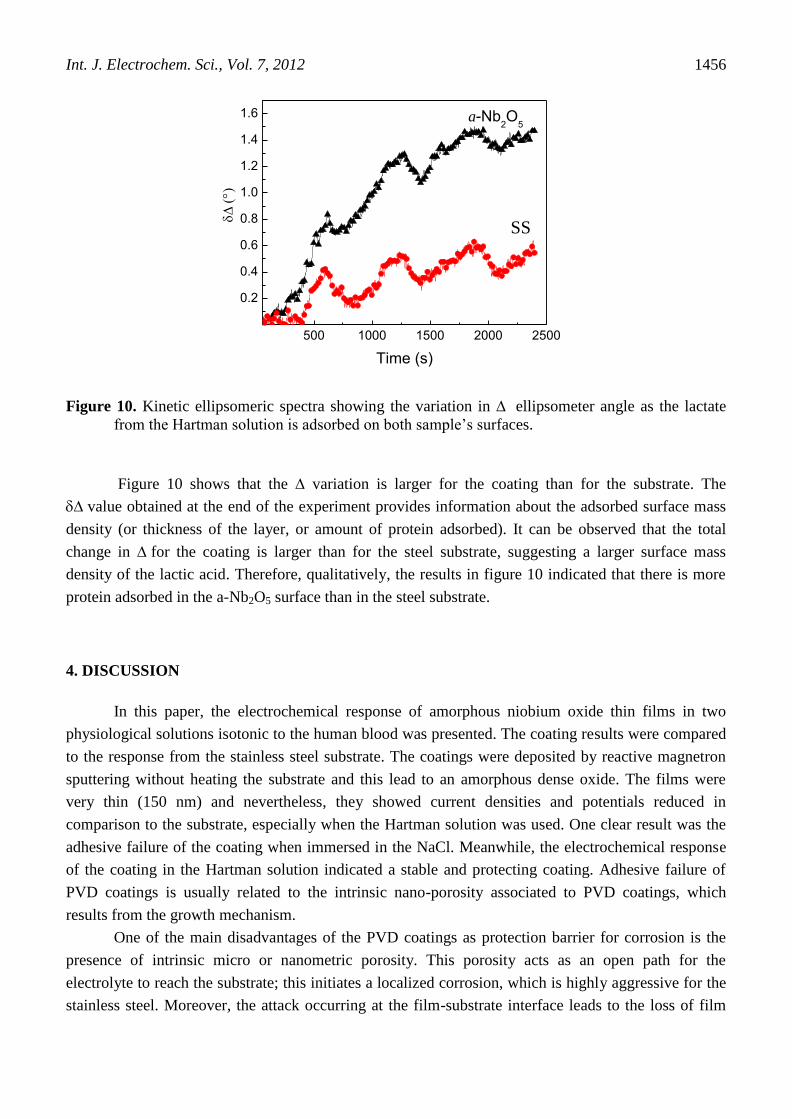
Figure 10 shows the changes of the ellipsometric angle (which is more sensitive to thickness
variations) with time, for both the coating and substrate, as the immersion time increased up to 2400s.
The change in corresponds to the difference between the values in Hartman and values in
NaCl (i. e., no organic molecule, which correspond to our baseline) for each surface.
Int. J. Electrochem. Sci., Vol. 7, 2012
1456
500 1000 1500 2000 2500
0.2
0.4
0.6
0.8
1.0
1.2
1.4
1.6
SS
Time (s)
a-Nb2O
5
Figure 10. Kinetic ellipsomeric spectra showing the variation in ellipsometer angle as the lactate
from the Hartman solution is adsorbed on both sample’s surfaces.
Figure 10 shows that the variation is larger for the coating than for the substrate. The
value obtained at the end of the experiment provides information about the adsorbed surface mass
density (or thickness of the layer, or amount of protein adsorbed). It can be observed that the total
change in for the coating is larger than for the steel substrate, suggesting a larger surface mass
density of the lactic acid. Therefore, qualitatively, the results in figure 10 indicated that there is more
protein adsorbed in the a-Nb2O5 surface than in the steel substrate.
4. DISCUSSION
In this paper, the electrochemical response of amorphous niobium oxide thin films in two
physiological solutions isotonic to the human blood was presented. The coating results were compared
to the response from the stainless steel substrate. The coatings were deposited by reactive magnetron
sputtering without heating the substrate and this lead to an amorphous dense oxide. The films were
very thin (150 nm) and nevertheless, they showed current densities and potentials reduced in
comparison to the substrate, especially when the Hartman solution was used. One clear result was the
adhesive failure of the coating when immersed in the NaCl. Meanwhile, the electrochemical response
of the coating in the Hartman solution indicated a stable and protecting coating. Adhesive failure of
PVD coatings is usually related to the intrinsic nano-porosity associated to PVD coatings, which
results from the growth mechanism.
One of the main disadvantages of the PVD coatings as protection barrier for corrosion is the
presence of intrinsic micro or nanometric porosity. This porosity acts as an open path for the
electrolyte to reach the substrate; this initiates a localized corrosion, which is highly aggressive for the
stainless steel. Moreover, the attack occurring at the film-substrate interface leads to the loss of film
Int. J. Electrochem. Sci., Vol. 7, 2012
1457
adhesion and in some cases catastrophic delamination occurs. This can be seen in figure 5, where
extensive film delamination was observed for the a-Nb2O5/SS systems when a NaCl solution was used
as the electrolyte. Surprisingly, this was not the case when the physiological solution containing lactic
acid was used to study the electrochemical response of the coatings/SS systems. In the later case, the
results showed that the a-Nb2O5 coating was stable for immersion times up to 500 hours; no strong
variations in the modulus of the impedance or the phase angle were observed. This demonstrates high
stability of the electrochemical system with no formation of active corrosion sites, either at the
coating-electrolyte interface or the substrate-electrolyte interface, which can be reached through the
small pores in the coating. The presence of any of these active corrosion sites would significantly
lower the modulus of the impedance and the phase angle especially at the low frequency range.
Moreover, there was a good agreement between the polarization resistance results and the corrosion
current density of the a-Nb2O5 coating, indicating an improvement in the corrosion resistance of the
coated-steel.
The difference between the response on NaCl and in the Hartman solution can be explained
examining the ellipsometric results; there is a fast adsorption of the organic molecule on both surfaces,
but the amount adsorbed on the coating is larger than on the steel. Moreover, the electrochemical
stability observed for the coating in the Hartman solution, as opposite to the catastrophic effect
observed in the NaCl, might be explained assuming that the lactic acid molecules block-out the
porosity of the coatings. Therefore, there is synergetic effect which leads to the observed high
corrosion resistance of the coatings in Hartman; this may also explain the more negative phase angle
showed for the samples after 155 hours of immersion, i. e. after completed blocking of the pores has
occurred. The lactate molecule is able to cover the surface and also penetrate into the pores due to its
small size, about 0.5 nm along the larger axis impeding the pass of the electrolyte. A similar
phenomenon was proposed by Assis et al.[14] to explain the corrosion behavior of a Ti-Nb alloy when
immersed in three different physiological simulated fluids, the adsorption and penetration into the
porous oxide layer of the organic molecules was confirmed by surface analysis. The adsorption of
organic molecules on metal oxides can occur by chemisorption or physisorption, and once they are
adsorbed they can interact to form precipitates as well as ternary surface complexes with cations,
giving an absorbed passive layer, which will also enhanced the corrosion resistance of the material.
The contradiction between the catastrophic fail of the films when immersed in pure NaCl
solutions and the good resistance presented in the Hartman solution shows the importance of
evaluating the materials in appropriate electrolytes [15].
5. CONCLUSIONS
Amorphous niobium oxide films deposited on stainless steel substrates were produced by
magnetron sputtering to evaluate the corrosion resistance provided by the coating when immersed in
simulated physiological fluids. The results obtained in this work suggested that the adsorption of small
organic molecules on the surface of the a-Nb2O5 forms a passive layer, which blocks-out the intrinsic
porosity of the coatings, leading to large impedance values of the coatings even after large immersion
Int. J. Electrochem. Sci., Vol. 7, 2012
1458
times. The EIS analysis showed that the polarization resistance of the coatings was one order of
magnitude larger than the SS, and therefore the corrosion rate of coated-SS should be significantly
reduced. Note that even with such good behavior in Hartman, we cannot conclude that the coating is a
good candidate for corrosion protection of biomedical implants, analysis using more complex
electrolytes or electrolytes containing larger organic molecules or concentrations should be done
before reaching any conclusion. However, a relevant result from this research was to establish the large
differences in the corrosion behavior of the surfaces depending on the medium composition, striking
the importance of in-vitro testing biomaterials using electrolytes that really simulated the functional
environment for a particular application.
ACKNOWLEDGEMENTS
Financial support from DGAPA-PAPIIT projects IN102907-IN103910 and CONACYT P45833 is
gratefully acknowledged. P.N. Rojas acknowledges to the CONACYT for a PhD scholarship. Special
thanks to the technicians O. Novelo and H. Zarco.
References
1. A. Balamurugan, S. Rajeswari, G. Balossier, A. H. S. Rebelo, and J. M. F. Ferreira, Materials and
Corrosion-Werkstoffe Und Korrosion 59, 855-869 (2008).
2. M. Sivakumar, U. K. Mudali, and S. Rajeswari, Steel Res 65, 76-79 (1994).
3. M. A. Malik, P. J. Kulesza, and G. Pawlowska, Electrochimica Acta 54, 5537-5543 (2009
4. M. T. Duffy, Zaininge.Kh, and C. C. Wang, Journal of the Electrochemical Society 115, (1968).
5. A. Shahryari, S. Omanovic, and J. A. Szpunar, Materials Science & Engineering C-Biomimetic and
Supramolecular Systems 28, 94-106 (2008).
6. M. Fenker, M. Balzer, H. Kappl, and O. Banakh, Surface & Coatings Technology 200, 227-231
(2005).
7. E. Eisenbarth, D. Velten, M. Müller, R. Thull, and J. Breme, Journal of Biomedical Materials
Research Part A 79A, 166-175 (2006).
8. G. Ramirez, S. E. Rodil, S. Muhl, D. Turcio-Ortega, J. J. Olaya, M. Rivera, E. Camps, and L.
Escobar-Alarcon, Journal of Non-Crystalline Solids 356, 2714-2721 (2010).
9. C. Liu, Q. Bi, A. Leyland, and A. Matthews, Corrosion Science 45, 1243-1256 (2003).
10. E. J. Giordano, N. Alonso-Falleiros, I. Ferreira, and O. Balancin, Rem-Revista Escola De Minas 63,
159-166 (2010).
11. C. Liu, Q. Bi, A. Leyland, and A. Matthews, Corrosion Science 45, 1257-1273 (2003).
12. P. A. Cuypers, J. W. Corsel, G. M. Willems, and W. T. Hermens, Abstr Pap Am Chem S 192, 32-
Coll (1986).
13. B. Tutunaru, A. Patru, I. Bibicu, and M. Preda, J Optoelectron Adv M 9, 3400-3404 (2007).
14. S. L. Assis, S. Wolynec, and I. Costa, Materials and Corrosion-Werkstoffe Und Korrosion 59, 739-
743 (2008).
15. S. Virtanen, I. Milosev, E. Gomez-Barrena, R. Trebse, J. Salo, and Y. T. Konttinen, Acta
Biomaterialia 4, 468-476 (2008).
© 2012 by ESG (www.electrochemsci.org)