Embed Size (px)
Citation preview
UNIVERSITÉ DU QUÉBEC À MONTRÉAL
DÉVELOPPEMENT DES NANOÉLECTRODES ET UTILISATION DE LA MICROSCOPIE ÉLECTROCHIMIQUE À BALAYAGE POUR LA DÉTECTION
DU PEROXYDE D'HYDROGÈNE
MÉMOIRE
PRÉSENTÉ
COMME EXIGENCE PARTIELLE DE
LA MAÎTRISE EN CHIMIE
PAR
MOHAMED AMINE MEZOUR
SEPTEMBRE 20 l0
UNIVERSITÉ DU QUÉBEC À MONTRÉAL Service des bibliothèques
Avertissement
La diffusion de ce mémoire se fait dans le respect des droits de son auteur, qui a signé le formulaire Autorisation de reproduire et de diffuser un travail de recherche de cycles supérieurs (SDU-522 - Rév.01-2006). Cette autorisation stipule que «conformément à l'article 11 du Règlement no 8 des études de cycles supérieurs, [l'auteur] concède à l'Université du Québec à Montréal une licence non exclusive d'utilisation et de publication de la totalité ou d'une partie importante de [son] travail de recherche pour des fins pédagogiques et non commerciales. Plus précisément, [l'auteur] autorise l'Université du Québec à Montréal à reproduire, diffuser, prêter, distribuer ou vendre des copies de [son] travail de recherche à des fins non commerciales sur quelque support que ce soit, y compris l'Internet. Cette licence et cette autorisation n'entraînent pas une renonciation de [la] part [de l'auteur] à [ses] droits moraux ni à [ses] droits de propriété intellectuelle. Sauf entente contraire, [l'auteur] conserve la liberté de diffuser et de commercialiser ou non ce travail dont [il] possède un exemplaire.»
REMERCIEMENTS
En premier lieu, je tiens à remercier sincèrement mes deux directeurs de thèse, Mario
Morin et Janine Mauzeroll pour m'avoir accueilli dans leur équipe de recherche. Je
les remercie pour leur encadrement, les discussions fructueuses qui m'ont permis
d'avancer dans mon projet et ainsi que pour leurs judicieux conseils.
Je tiens à remercier mes collègues de l'équipe de recherche du Professeur Mario
Morin, particulièrement, Christelle Médard et Héloïse Hannah De Paz pour leur
collaboration concernant la partie catalyse du projet.
Je remercie également mes collègues de l'équipe de recherche de la Professeure
Janine Mauzeroll, plus particulièrement Renaud Cornut et Emad Mohamed Hussien
pour leur participation dans le projet.
Je voudrais remercier également tous les gens qui ont participé de près ou de loin à ce
projet.
Je souhaiterais remercIer profondément mes parents, ma conjointe et toute ma
famille.
TABLE DES MATIÈRES
LISTE DES FIGURES v
LISTE DES ABRÉVIATIONS
GÉNÉRALITÉS SUR LA SECM, LES NANOÉLECTEDES ET LES
vi
RÉSUMÉ vii
CHAPITRE 1
MÉTALLOPORPHYRINES 1
Introduction 1
2 Microscopie électrochimique à balayage (SECM) ; 3
2.1 Instrument de la SECM 3
2.2 Microélectrodes 5
2.3 Les modes d'utilisation de la SECM 8
3 Électrocatalyse de O2 12
3.1 Processus de réduction de O2 et catalyseur utilisés 12
3.2 Métalloporphyrines 14
3.3 La porphyrine comme catalyseur pour la réduction de O2 17
4 Application de la SECM en électrocatalyse de O2 18
RÉFÉRENCES 21
CHAPITRE II
FABRICATION ET CARACTÉRISATION DES MICROÉLECTRODES 29
Résumé 29
2 Article: (annexe A) 30
iv
CHAPITRE III
DÉTECTION DU PEROXYDE D'HYDROGÈNE SUR UNE ÉLÉCTRODE D'OR
MODIFIÉE PAR UNE COUCHE AUTOASSEMBLÉE DE THIOL-PORPHYRfNE
DE COBALT AVEC LA MICROSCOPIE ÉLECTROCHIMIQUE À BALAYAGE
..................................................................................................................................... 31
Résumé 31
2 Article: (annexe B) 31
CONCLUSION 32
ANNEXE A
Fabrication and Characterization of Microelectrodes 37
Al'Jl\JEXE B
Detection of Hydrogen Peroxide Produced during the Oxygen Reduction Reaction at
Self- Assembled Thiol-Porphyrin Monolayers on Gold using SECM and
l\Janoelectrodes 59
LISTE DES FIGURES
Figure 1. Schéma de l'instrument SECM.(Cougnon el al., 2009) 4
Figure 2. Schéma représentatif de la couche de diffusion établie sur une macroélectrode (a) et une microélectrode (b) 6
Figure 3. Schéma représentatif des géométries de microélectrode. De gauche à droite; 1ère ligne: vue de dessous des microélectrodes disque, anneau, anneau-disque, bande. i me ligne: vue de face des microélectrodes cône, hémisphère, sphère et cylindre. a, b, c, h et r sont les dimensions critiques de chaque géométrie. (référence [(Zoski, 2002)] modifiée) 7
Figure 4. Schéma représentative des principaux modes de la SECM. (a) mode feedback, (b) TO/SC et (c) SO/TC 9
Figure 5. Exemples de macrocycles tétrapyrroliques naturels. a) Hème. b) Chlorophylles. c) Vitamine 8 12 15
Figure 6. Schéma de la molécule de porphyrine avec la numérotation de Fisher. 16
RRO
SECM
SPM
AFM
STM
XPS
SNOM
ECL
UME
SG/TC
SC/TG
CE
NHE
LISTE DES ABRÉVIATIONS
Réaction électrochimique de réduction d'oxygène
Microscopie électrochimique à balayage
Microscopie de balayage à champs proche
Microscopie à force atomique
Microscopie à effet tunnel
Spectrométrie de photoélectron X
Microscopie optique à champs proche
Chimiluminescence électrogénérée
Ultra-microélectrode (microélectrode)
Substrat génération/ Microélectrode collection
Substrat collection / Microélectrode génération
Efficacité de collection
Électrode normale d'hydrogène
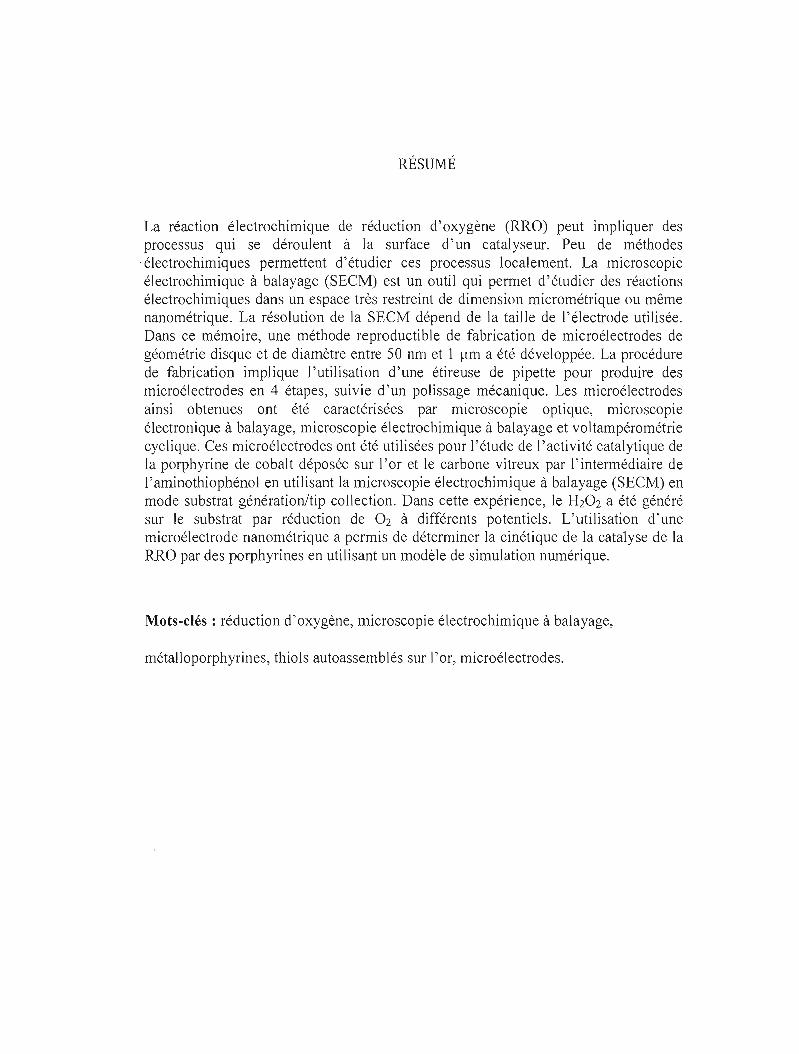
RÉSUMÉ
La réaction électrochimique de réduction d'oxygène (RRO) peut impliquer des processus qui se déroulent à la surface d'un catalyseur. Peu de méthodes
.électrochimiques permettent d'étudier ces processus localement. La microscopie électrochimique à balayage (SECM) est un outil qui permet d'étudier des réactions électrochimiques dans un espace très restreint de dimension micrométrique ou même nanométrique. La résolution de la SECM dépend de la taille de l'électrode utilisée. Dans ce mémoire, une méthode reproductible de fabrication de microélectrodes de géométrie disque et de diamètre entre 50 nm et 1 flm a été développée. La procédure de fabrication implique l'utilisation d'une étireuse de pipette pour produire des microélectrodes en 4 étapes, suivie d'un polissage mécanique. Les microélectrodes ainsi obtenues ont été caractérisées par microscopie optique, microscopie électronique à balayage, microscopie électrochimique à balayage et voltampérométrie cyclique. Ces microélectrodes ont été utilisées pour l'étude de l'activité catalytique de la porphyrine de cobalt déposée sur l'or et le carbone vitreux par l'intermédiaire de l'aminothiophénol en utilisant la microscopie électrochimique à balayage (SECM) en mode substrat générationltip collection. Dans cette expérience, le H20 2 a été généré sur le substrat par réduction de O2 à différents potentiels. L'utilisation d'une microélectrode nanométrique a permis de déterminer la cinétique de la catalyse de la RRO par des porphyrines en utilisant un modèle de simulation numérique.
Mots-clés: réduction d'oxygène, microscopie électrochimique à balayage,
métalloporphyrines, thiols autoassemblés sur l'or, microélectrodes.
CHAPITRE 1
GÉNÉRALITÉS SUR LA SECM, LES NANüÉLECTEDES ET LES
MÉTALLOPORPHYRlNES
1 Introduction
La réduction d'oxygène (RRO) est parmi les réactions les plus importantes dans les
processus biologiques et électrochimiques.(Lipkowski, 1998) La RRO est
caractérisée par une cinétique lente d'où la nécessité d'utiliser un catalyseur pour
faciliter les échanges électroniques. Dans les technologies de conversion d'énergie
électrochimique comme les piles à combustible, le platine est le catalyseur le plus
utilisé.(Yuan et Wang, 2008) Vu son coùt élevé, les chercheurs ont tenté de le
remplacer par un catalyseur aussi efficace et moins onéreux. Une des approches
possible consiste à utiliser les métaUoporphyrines.(Song et Zhang, 2008)
Après la première étude de l'activité catalytique de phthalocyanine de cobalt
(Jasinski, 1964), le nombre d'études sur les métalloporphyrines a COlUlU une
croissance importante. Globalement ces recherches visent à améliorer le pouvoir
catalytique des métalloporphyrines en agissant sur la structure de la porphyrine, le
substrat sur lequel eUe est adsorbée et la méthode de modification du substrat elle
même.(Kadish, 2003) Dans ce contexte, l'autoassemblage des molécules de
porphyrine sur un substrat très connu comme par exemple l'or peut aider à mieux
comprendre ce mécanisme et amsl améliorer les performances du
catalyseur.(Xiaoquan et al., 2006) Les monocouches de thiol autoassemblées sur l'or
constituent un moyen de contrôle de l'orientation et du recouvrement des
porphyrines.(Lu et al., 2006)
2
Plusieurs méthodes de caractérisation ont été utilisées dans la littérature pour l'étude
de l'arrangement de ces molécules comme l'AFM,(Kalyuzhny et al., 2000 ; Lu et al.,
2005) STM,(Arima et al., 2005 ; Yoshimoto et al., 2004) XPS(Arima et al., 2005 ;
Kalyuzhny et al., 2000) et les techniques spectroscopiques comme le Raman,(Li Zhu
et al., ; Zhang et al.) IR(Kurtikyan et al., 2003) et UV-visible.(Kalyuzhny et al., 2000
; Kurtikyan et al., 2003 ; Zhi et al., 2009) Dans d'autres publications des études
électrochimiques conventionnelles ont été utilisées pour caractériser l'activité
électrochimique des couches de métalloporphyrine par la voltampérométrie cyclique,
(Mohammad et al., 2007 ; Yoshimoto et al., 2004 ; Zhang et al., 2007 ; Zhi et al.,
2009) RDE(Chung et Anson, 2001) et la spectroscopie d'impédance électrochimique.
(Zhang et al., 2007 ; Zhi et al., 2009) La SECM est une nouvelle technique qui
commence à être de plus en plus utilisé pour étudier l'électrocatalyse de 02. Elle
permet d'étudier simultanément et localement la morphologie et les paramètres
cinétiques des catalyseurs.
Le principe de la SECM est basé sur la mesure des phénomènes électrochimiques très
près du substrat par l'intermédiaire d'une microélectrode. La résolution des images
obtenues par SECM dépend de la taille de la microélectrode utilisée. La fabrication
des microélectrodes à l'aide d'une étireuse de pipette permet de faire des géométries
de disque, de taille sub-micrométrique avec une grande reproductibilité.(Sun et
Mirkin, 2006)
Le mémoire est ainsi organisé: Après une brève présentation de la technique SECM,
les techniques de fabrication des microélectrodes et un survol sur les propriétés
électrocatalytiques des métalloporphyrines dans le chapitre 1, le chapitre 2 décrit les
étapes de fabrication des microélectrodes avec une étireuse de pipette et la
caractérisation par microscopie électronique et méthodes électrochimiques des
microélectrodes obtenues. Dans le chapitre 3, l'étude de la détection du peroxyde
d'hydrogène sur une électrode d'or et une autre de carbone vitreux modifiée avec une
3
couche de thiol- porphyrine de cobalt avec la microscopie électrochimique à balayage
sera présentée.
2 Microscopie électrochimique à balayage (SECM)
La SECM a été mise au point par Bard et son groupe dans la fin des années 80. Son
principe est basé sur la mesure des phénomènes électrochimiques à proximité d'un
substrat par l'intermédiaire d'une microélectrode. Plusieurs descriptions détaillées de
cette technique ont été publiées.(Bard et Mirkin, 2001 ; Sun et al., 2007 ; Zoski,
2007)
Dans les paragraphes suivants un survol sur l'instrumentation de la SECM et plus
particulièrement sur sa sonde détectrice (microélectrode), ses modes d'utilisations et
ses applications en imagerie des système catalytiques seront présentés.
2.1 Instrument de la SECM
La SECM fait partie des techniques de balayage à champ proche (SPM), d'où vient sa
grande ressemblance avec la microscopie à force atomique (AFM) et la microscopie à
effet tunnel (STM). La SECM est basée sur le balayage du substrat étudié par la
sonde (microélectrode) à l'aide d'un système de positionnement en 3 dimensions et
d'un scanner piézoélectrique (résolution de quelques nanomètres) en direction du
substrat. Les autres éléments de l'appareil sont: un bipotentiostat, un système
d'acquisition et de traitement des données, des filtres électroniques ainsi que d'autres
accessoires pour les applications particulières (microscope, table anti-vibration,
système de force de cisaillement pour l'imagerie SECM à distance constante ... ). La
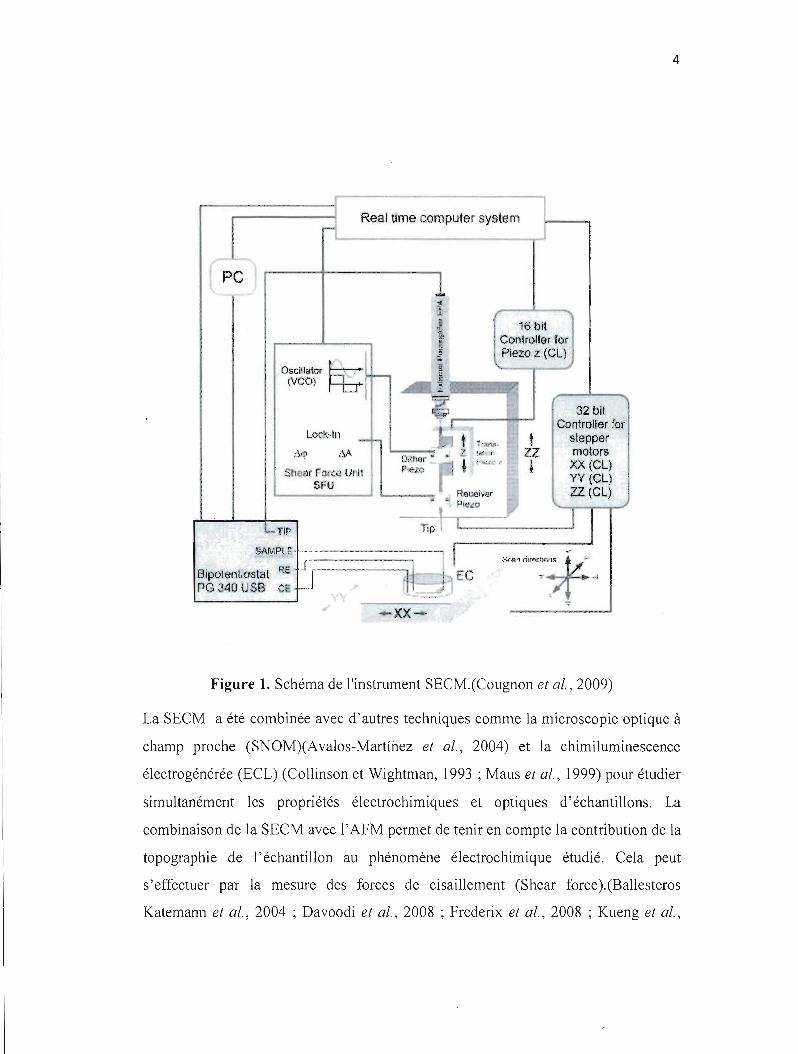
figure 1 présente le schéma d'un appareil SECM développé dans notre laboratoire en
collaboration avec la compagnie HEKA Elektronics.(Cougnon et al., 2009)
4
Real time computer system
r
PC
·E 16 bit t ContrQ>lIar fOf ~ Piezo z (CL} .
Obdllatàr ~ (\lCO) ~
32 bit l L-
Controlfer for Lock-In s.lappert
c'lq ,I.,A Zl motors Dithor • 1 1 f- ':0 (
• XX (CL) F"ero 'fShoo( rCUCè Uni' YY {CL) SFU
Recai'.'er ZZ tCl)• ~ Pi,uQ
\ Ipt- TIP
S/IMPLE.+-----------,
Bipotentiostat RE c --'il--" -,1
Pc. 340 USB te
-xx-
Figure 1. Schéma de l'instrument SECM.(Cougnon et al., 2009)
La SECM a été combinée avec d'autres techniques comme la microscopie optique à
champ proche (SNOM)(Avalos-Martînez et al., 2004) et la chimiluminescence
électrogénérée (ECL) (ColEnson et Wightman, 1993 ; Maus et al., 1999) pour étudier
simultanément les propriétés électrochimiques et optiques d'échantillons. La
combinaison de la SECM avec l'AFM permet de tenir en compte la contribution de la
topographie de l'échantillon au phénomène électrochimique étudié. Cela peut
s'effectuer par la mesure des forces de cisaillement (Shear force).(Ballesteros
Katemann et al., 2004 ; Davoodi et al., 2008 ; Frederix et al., 2008 ; Kueng et al.,
5
2003) Ces idées novatrices font souvent face à plusieurs difficultés techniques,
notamment au niveau de la complexité des montages expérimentaux et de la
fabrication des microélectrodes. Vue l'effet de la microélectrode sur le phénomène de
diffusion et de transfert de charge, une panoplie de dimensions et de géométries de
microélectrode ont été conçues.(Arrigan, 2004 ; Zoski, 2002, 2007)
2.2 Microélectrodes
Les premières études effectuées avec des microélectrodes étaient en neurophysiologie
et elles consistaient à stimuler l'excitation des neurones individuels ln
vivo.(Christensen et Teubl, 1979) Les électrochimistes n'ont utilisés les
microélectrodes qu'au début des années 80 avec les travaux de Wightman, Engstrom
et Fleischmann.(Amatore et al., 1988 ; Engstrom et Strasser, 1984 ; Kampas et al.,
1980 ; Kelly et Wightman, 1986) Quelques années plus tard, Bard et al(Kwak et
Bard, 1989) ont développés la SECM en se basant sur l'utilisation de la
microélectrode comme sonde de détection.
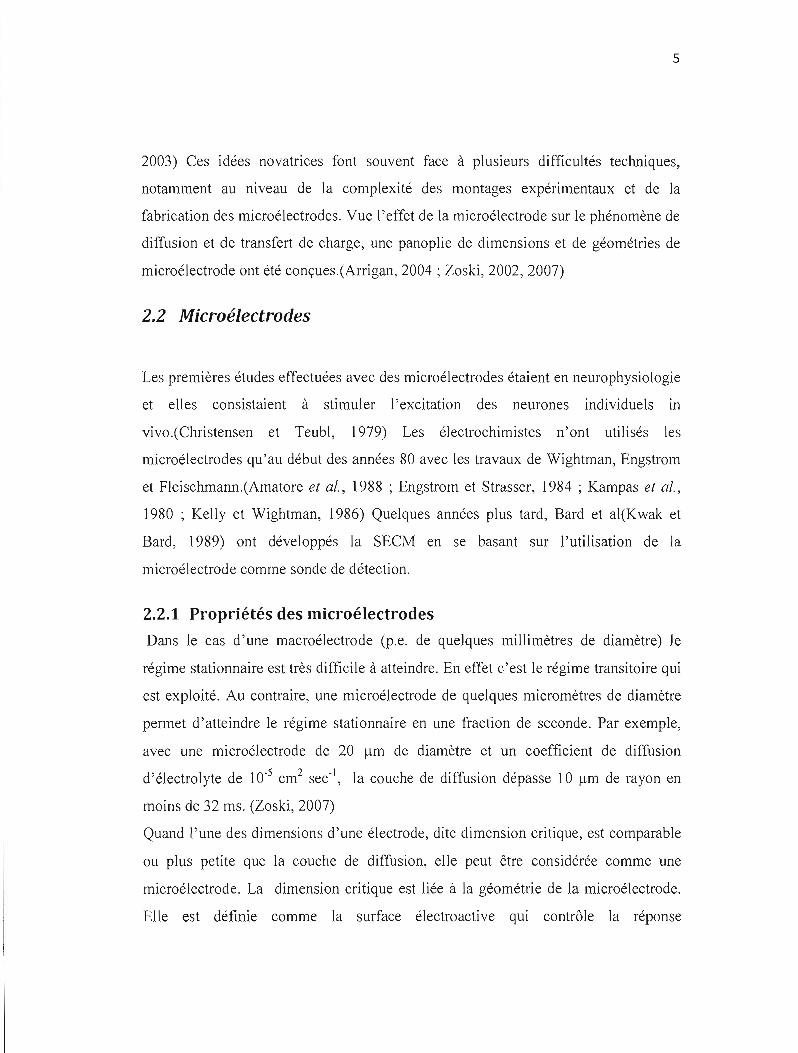
2.2.1 Propriétés des microélectrodes
Dans le cas d'une macroélectrode (p.e. de quelques millimètres de diamètre) le
régime stationnaire est très difficile à atteindre. En effet c'est le régime transitoire qui
est exploité. Au contraire, une microélectrode de quelques micromètres de diamètre
permet d'atteindre le régime stationnaire en une fraction de seconde. Par exemple,
avec une microélectrode de 20 flm de diamètre et un coefficient de diffusion
d'électrolyte de 10'5 cm 2 sec' I, la couche de diffusion dépasse 10 flm de rayon en
moins de 32 ms. (Zoski, 2007)
Quand l'une des dimensions d'une électrode, dite dimension critique, est comparable
ou plus petite que la couche de diffusion, elle peut être considérée comme une
microélectrode. La dimension critique est liée à la géométrie de la microélectrode.
Elle est définie comme la surface électroactive qui contrôle la réponse
6
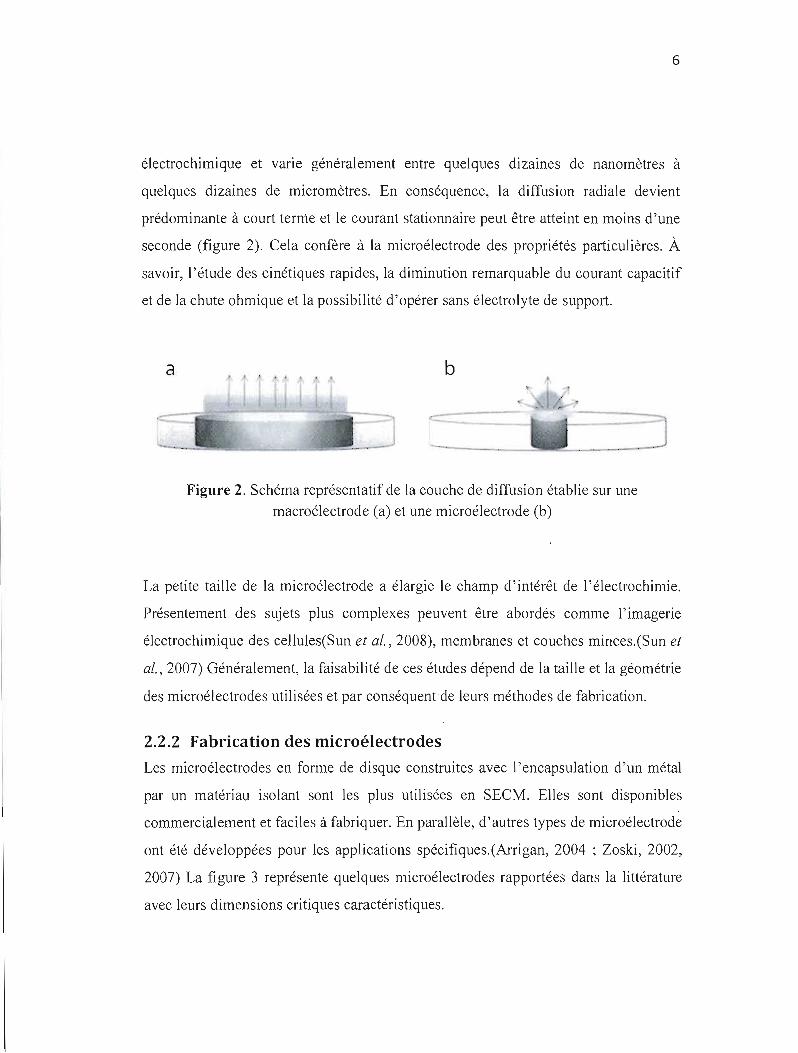
électrochimique et vane généralement entre quelques dizaines de nanomètres à
quelques dizaines de micromètres. En conséquence, la diffusion radiale devient
prédominante à court terme et le courant stationnaire peut être atteint en moins d'une
seconde (figure 2). Cela confère à la microélectrode des propriétés particulières. À
savoir, l'étude des cinétiques rapides, la diminution remarquable du courant capacitif
et de la chute ohmique et la possibilité d'opérer sans électrolyte de support.
b
Figure 2. Schéma représentatif de la couche de diffusion établie sur une
macroélectrode (a) et une microélectrode (b)
La petite taille de la microélectrode a élargie le champ d'intérêt de l'électrochimie.
Présentement des sujets plus complexes peuvent être abordés comme l'imagerie
électrochimique des celiules(Sun et al., 2008), membranes et couches minces.(Sun et
al., 2007) Généralement, la faisabilité de ces études dépend de la taille et la géométrie
des microélectrodes utilisées et par conséquent de leurs méthodes de fabrication.
2.2.2 Fabrication des microélectrodes
Les microélectrodes en forme de disque construites avec l'encapsulation d'un métal
par un matériau isolant sont les plus utilisées en SECM. Elles sont disponibles
commercialement et faciles à fabriquer. En parallèle, d'autres types de microélectrode
ont été développées pour les applications spécifiques.(Arrigan, 2004 ; Zoski, 2002,
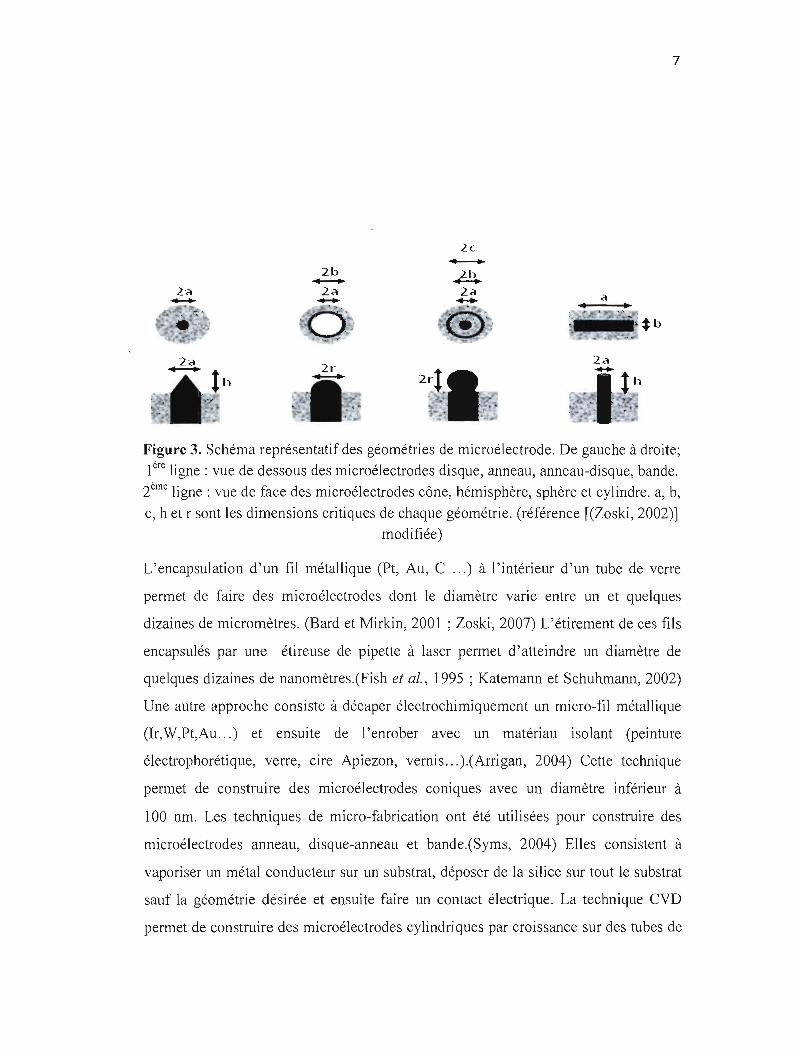
2007) La figure 3 représente quelques microélectrodes rapportées dans la littérature
avec leurs dimensions critiques caractéristiques.
7
2c-2a-
2b-2a- A 2a- a
O, '.... ~ŒY... :o..,. t b
2a- 2r-Figure 3. Schéma représentatif des géométries de microélectrode. De gauche à droite;
1ère ligne: vue de dessous des microélectrodes disque, anneau, anneau-disque, bande.
2ème ligne: vue de face des microélectrodes cône, hémisphère, sphère et cylindre. a, b,
c, h et r sont les dimensions critiques de chaque géométrie. (référence [(Zoski, 2002)]
modifiée)
L'encapsulation d'un fil métallique (Pt, Au, C ... ) à l'intérieur d'un tube de verre
permet de faire des microélectrodes dont le diamètre varie entre un et quelques
dizaines de micromètres. (Bard et Mirkin, 2001 ; Zoski, 2007) L'étirement de ces fils
encapsulés par une étireuse de pipette à laser permet d'atteindre un diamètre de
quelques dizaines de nanomètres.(Fish et al., 1995 ; Katemann et Schuhmann, 2002)
Une autre approche consiste à décaper électrochimiquement un micro-fil métallique
(Ir,W,Pt,Au ... ) et ensuite de l'enrober avec un matériau isolant (peinture
électrophorétique, verre, cire Apiezon, vernis ... ).(Arrigan, 2004) Cette technique
permet de construire des microélectrodes coniques avec un diamètre inférieur à
100 nm. Les techniques de micro-fabrication ont été utilisées pour construire des
microélectrodes anneau, disque-anneau et bande.(Syms, 2004) Elles consistent à
vaporiser un métal conducteur sur un substrat, déposer de la silice sur tout le substrat
sauf la géométrie désirée et ensuite faire un contact électrique. La technique CVD
permet de construire des microélectrodes cylindriques par croissance sur des tubes de
8
carbone.(Lin et al., 2009 ; Lynam et al., 2009) La microélectrode semi-sphérique a
été fabriquée en utilisant le mercure(Mauzeroll et al., 2003) et la microélectrode
sphérique a été obtenue par auto-assemblage de nanoparticules d'or sur le bout d'un
capillaire contenant des molécules de thiols.(Abbou et al., 2002)
2.2.3 Utilisation des microélectrodes en imagerie SECM
Les microélectrodes utilisées en imagerie électrochimique doivent aVOir une
géométrie bien définie où le régime stationnaire est rapidement établi. Les
microélectrodes disques développées avec la méthode d'encapsulation sont les plus
adaptées. Cependant, pour avoir une meilleure résolution ou utiliser la SECM-shear
force, ces microélectrodes doivent être étirées avec une étireuse de pipette. Dans ce
cas, les deux modes d'imagerie électrochimique à distance constante et à hauteur
constante peuvent être réalisées (voir paragraphe 2.3). Récemment, Mirkin et
collaborateurs ont utilisés des Pt-UME avec des diamètres inférieurs à 200 nm pour
imager des substrats solides et des cellules humaines en mode courant et distance
constantes.(Sun et al., 2008 ; Velmurugan et al., 2008) Shuhmann et collaborateurs
utilisent les microélectrodes en mode shear force pour étudier simultanément
l'électrochimie et la topographie des substrats solides.(Ballesteros Katemann et al.,
2004 ; Katemann et Schuhmann, 2002) Heinz et al ont utilisé des microélectrodes
disques avec un diamètre de quelques centaines de nanomètres pour la lithographie et
l'imagerie électrochimique sur un substrat d'AgCl.(Baltes et al., 2004 ; Ufheil et al.,
2005)
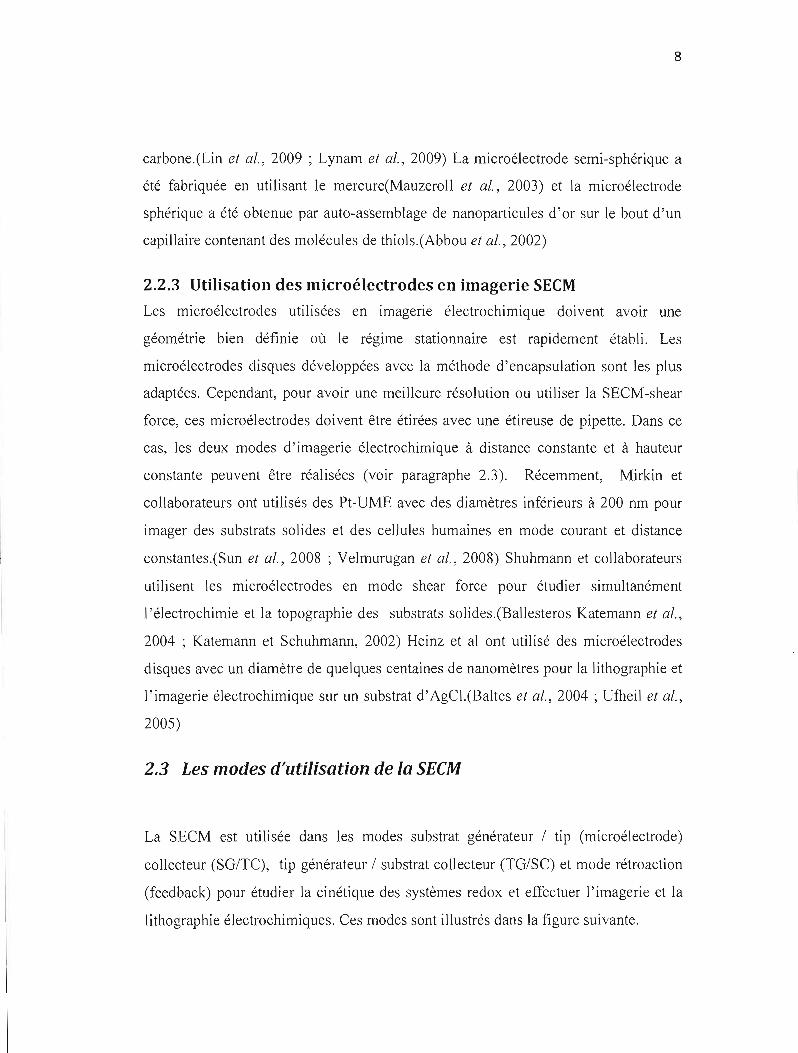
2.3 Les modes d'utilisation de la SECM
La SECM est utilisée dans les modes substrat générateur / tip (microélectrode)
collecteur (SO/TC), tip générateur / substrat collecteur (TO/SC) et mode rétroaction
(feedback) pour étudier la cinétique des systèmes redox et effectuer l'imagerie et la
lithographie électrochimiques. Ces modes sont illustrés dans la figure suivante.
9
a b c
IF; dback Collection
o . ..
R 0
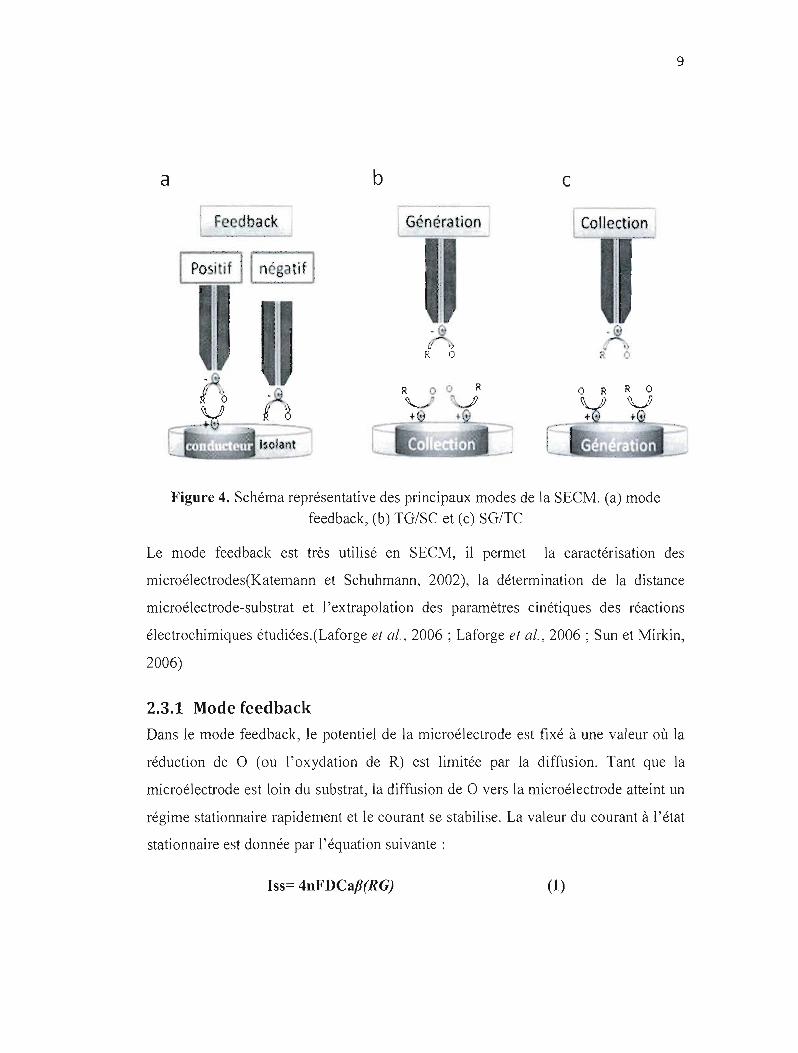
Figure 4. Schéma représentative des principaux modes de la SECM. (a) mode
feedback, (b) TG/SC et (c) SG/TC
Le mode feedback est très utilisé en SECM, il permet la caractérisation des
microélectrodes(Katemann et Schuhmann, 2002), la détermination de la distance
microélectrode-substrat et l'extrapolation des paramètres cinétiques des réactions
électrochimiques étudiées.(Laforge el al., 2006; Laforge el al., 2006 ; Sun et Mirkin,
2006)
2.3.1 Mode feedhack
Dans le mode feedback, le potentiel de la microélectrode est fixé à une valeur où la
réduction de 0 (ou l'oxydation de R) est limitée par la diffusion. Tant que la
microélectrode est loin du substrat, la diffusion de 0 vers la microélectrode atteint un
régime stationnaire rapidement et le courant se stabilise. La valeur du courant à l'état
stationnaire est donnée par l'équation suivante:
Iss= 4nFDCap(RG) (1)
10
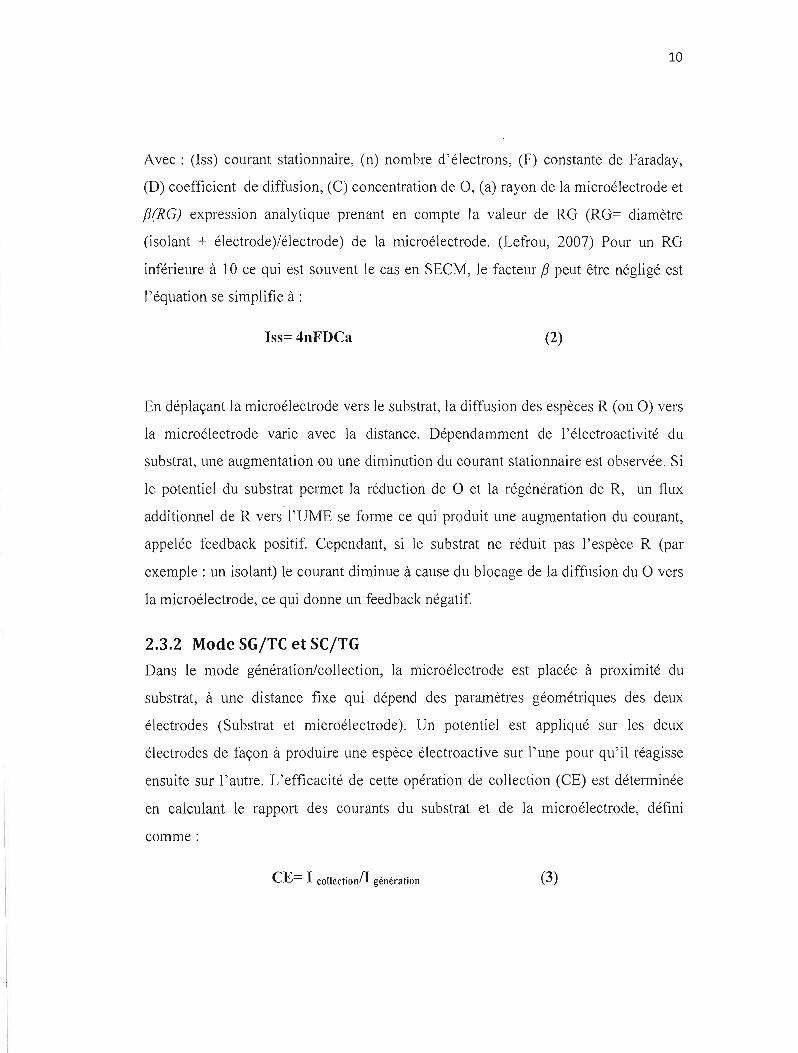
Avec: (lss) courant stationnaire, (n) nombre d'électrons, (F) constante de Faraday,
(D) coefficient de diffusion, (C) concentration de 0, (a) rayon de la microélectrode et
j3(RG) expression analytique prenant en compte la valeur de RG (RG= diamètre
(isolant + électrode)/électrode) de la microélectrode. (Lefrou, 2007) Pour un RG
inférieure à 10 ce qui est souvent le cas en SECM, le facteur j3 peut être négligé est
l'équation se simplifie à :
Iss= 4nFDCa (2)
En déplaçant la microélectrode vers le substrat, la diffusion des espèces R (ou 0) vers
la microélectrode varie avec la distance. Dépendamment de l'électroactivité du
substrat, une augmentation ou une diminution du courant stationnaire est observée. Si
le potentiel du substrat permet la réduction de 0 et la régénération de R, un flux
additionnel de R vers l'UME se forme ce qui produit une augmentation du courant,
appelée feedback positif. Cependant, si le substrat ne réduit pas l'espèce R (par
exemple: un isolant) le courant diminue à cause du blocage de la diffusion du 0 vers
la microéJectrode, ce qui donne un feedback négatif.
2.3.2 Mode SG/TC et SC/TG
Dans le mode génération/collection, la microélectrode est placée à proximité du
substrat, à une distance fixe qui dépend des paramètres géométriques des deux
électrodes (Substrat et microélectrode). Un potentiel est appliqué sur les deux
électrodes de façon à produire une espèce électroactive sur l'une pour qu'il réagisse
ensuite sur l'autre. L'efficacité de cette opération de collection (CE) est déterminée
en calculant le rapport des courants du substrat et de la microélectrode, défini
comme:
CE= 1 collectionlI génération (3)
11
Dans le mode substrat génération/tip collection (SG/TC), l'espèce R est générée au
niveau du substrat puis elle diffuse et s'oxyde au niveau de lamicroélectrode. Ce
mode a été utilisé pour étudier l' électrocatalyse de H2 (Zhou et al., 2000), la réduction
de 02 par différents catalyseurs(Sanchez-Sanchez et al., 2008) et l'étude des
métabolites produites par les cellules.(Gao et al., 2007) Il permet l'étude des
paramètres cinétiques et d'effectuer de l'imagerie électrochimique, cependant il est
limité par la contribution de la diffusion du substrat au courant mesuré et la
perturbation de la diffusion par le mouvement de la microélectrode.
Dans le mode tip génération! substrat collection (TG/SC), c'est la microélectrode qui
produit l'espèce 0 localement, puis elle diffuse et réagit au niveau du substrat qui
joue le rôle du collecteur. Le courant mesuré comprend le courant faradique et le
courant capacitif (background). Ce dernier doit être soustrait du courant mesuré au
substrat pour en déduire le vrai courant associé à la collection de O. Le mode
(SG/TC) a été utilisé en combinaison avec le mode feedback pour étudier le transfert
d'électrons de réactions homogènes et en imagerie électrochimique. (Femàndez et
Bard, 2003 ; Fernàndez et al., 2005) Également des modifications ont été apportées à
ces 3 principaux modes dans le but de surmonter leur limitations et de les adapter à
des applications plus complexes. Faire des mesures électrochimiques à l'intérieur des
cellules, des liposomes et des fines couche de polymère,(Sun et al., 2008 ; Sun et al.,
2007) l'étude du transfert électronique hétérogène entre deux liquides
immiscible(Laforge et al., 2006) et l'étude de la compétition du substrat et de l'UME
envers une espèce l'électroactive,(Okunola et a!., 2009) sont quelques nouvelles
études qui ont été effectués après avoir modifier ces 3 modes de la SECM.
12
3 Électrocatalyse de 02
3.1 Processus de réduction de 02 et catalyseur utilisés
L'oxygène est un élément abondant sur la planète. La réduction d'oxygène est
impliquée dans plusieurs processus biologiques et industriels. Cette réaction a été
intensivement étudiée et plusieurs mécanismes ont été observés(Song et Zhang,
2008). Cette complexité vient du fait que la réduction de O2 peut produire différents
intermédiaires et donner différents produits en fonction du pH, du catalyseur et du
matériau de l'électrode.
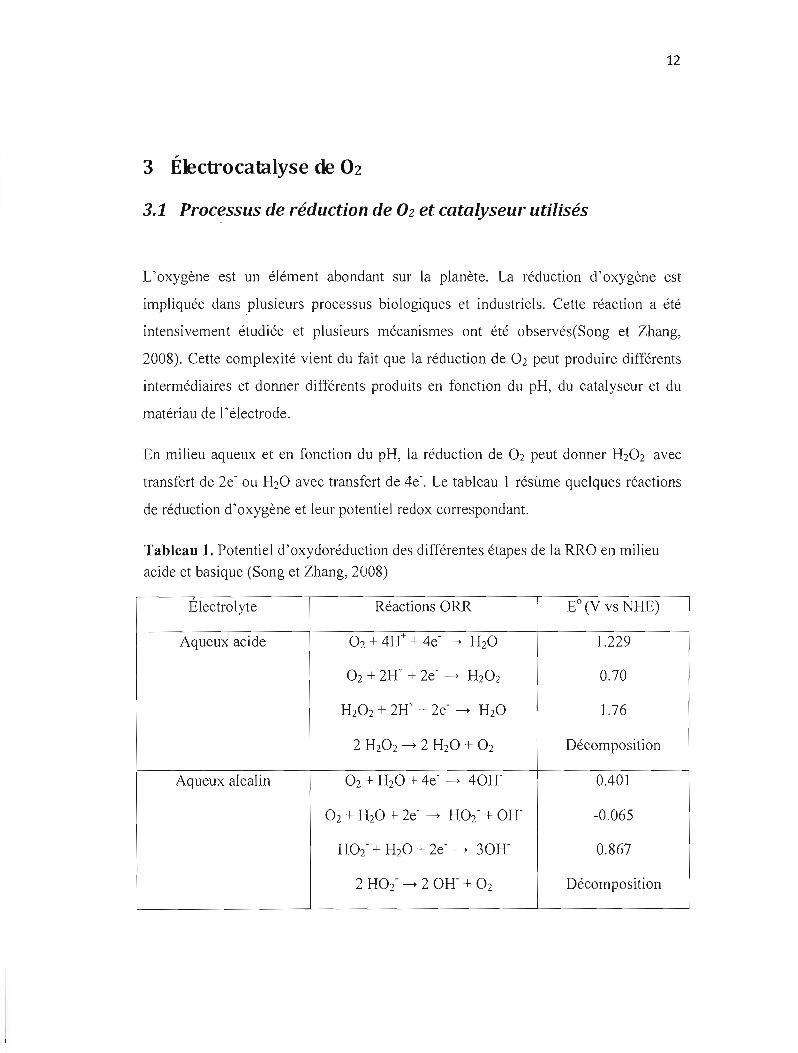
En milieu aqueux et en fonction du pH, la réduction de 02 peut donner H202 avec
transfert de 2e' ou H20 avec transfert de 4e'. Le tableau 1 résume quelques réactions
de réduction d'oxygène et leur potentiel redox correspondant.
Tableau 1. Potentiel d'oxydoréduction des différentes étapes de la RRO en milieu
acide et basique (Song et Zhang, 2008)
Electrolyte Réactions ORR EO(V vs NHE)
Aqueux acide 02 + 4H+ + 4e' - H20 1.229
O2 + 2H+ + 2e" - HzOz 0.70
H202+ 2H+ + 2e' - H20 1.76
2 H20 2 - 2 H20 + O2 Décomposition
Aqueux alcalin 02 + H20 + 4e' - 40R 0.401
O2 + H20 + 2e' - H02' + OR -0.065
H02" + H20 + 2e' - 30R 0.867
2 H02' - 2 OH' + O2 Décomposition
13
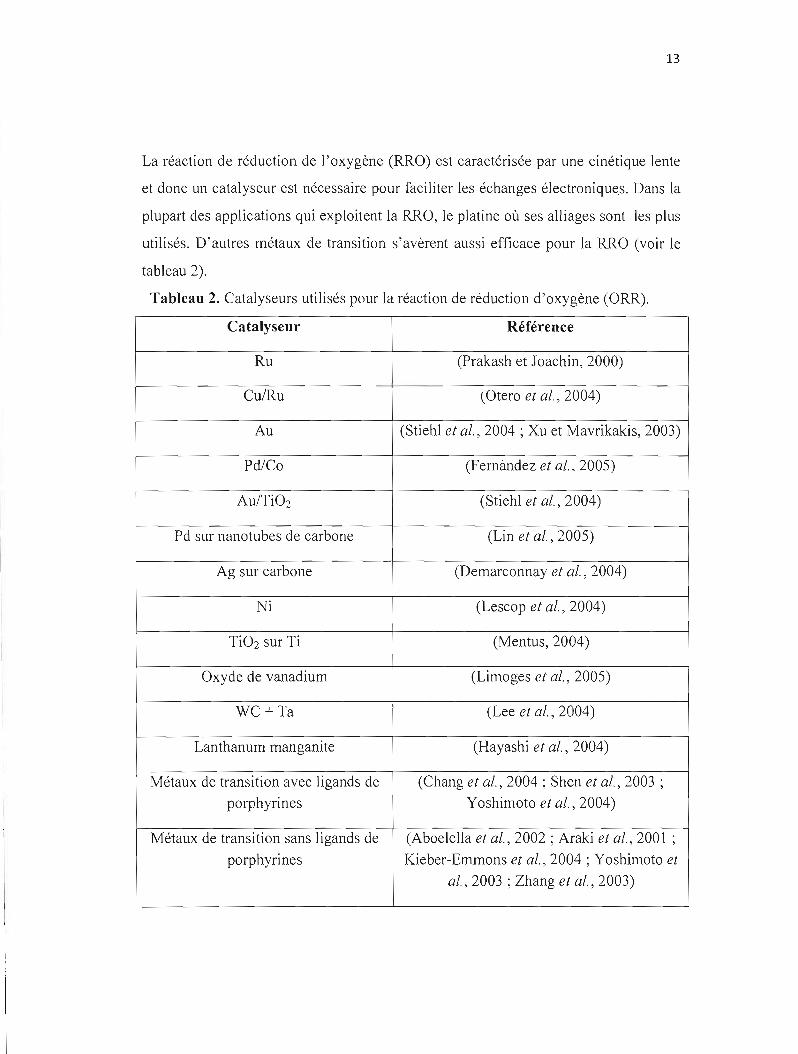
La réaction de réduction de l'oxygène (RRO) est caractérisée par une cinétique lente
et donc un catalyseur est nécessaire pour faciliter les échanges électroniques. Dans la
plupart des applications qui exploitent la RRO, le platine où ses alliages sont les plus
utilisés. D'autres métaux de transition s'avèrent aussi efficace pour la RRO (voir le
tableau 2).
Tableau 2. Catalyseurs utilisés pour la réaction de réduction d'oxygène (ORR).
Catalyseur
Ru
Cu/Ru
Au
Pd/Co
Au/TiOz
Pd sur nanotubes de carbone
Ag sur carbone
Ni
TiOz sur Ti
Oxyde de vanadium
WC+Ta
Lanthanum manganite
Métaux de transition avec ligands de
porphyrines
Métaux de transition sans ligands de
porphyrines
Référence
(Prakash et Joachin, 2000)
(Otero et al., 2004)
(Stiehl et al., 2004 ; Xu et Mavrikakis, 2003)
(Fernàndez et al., 2005)
(Stiehl et al., 2004)
(Lin et al., 2005)
(Demarconnay et al., 2004)
(Lescop et al., 2004)
(Mentus,2004)
(Limoges et al., 2005)
(Lee el al., 2004)
(Hayashi et al., 2004)
(Chang et al., 2004 ; Shen et al., 2003 ;
Yoshimoto et al., 2004)
(Aboelella et al., 2002 ; Araki et al., 2001 ;
Kieber-Emmons et al., 2004 ; Yoshimoto el
al., 2003 ; Zhang et al., 2003)
14
L'amélioration de l'efficacité et l'abaissement du coût de la catalyse du RRü doit
passer nécessairement par le développement de nouveaux catalyseurs qui sont moins
onéreux, disponibles et aussi efficace que le platine. L'une des options consiste à
remplacer le platine par les métalloporphyrines.
3.2 Métalloporphyrines
3.2.1 Porphyrines naturelles
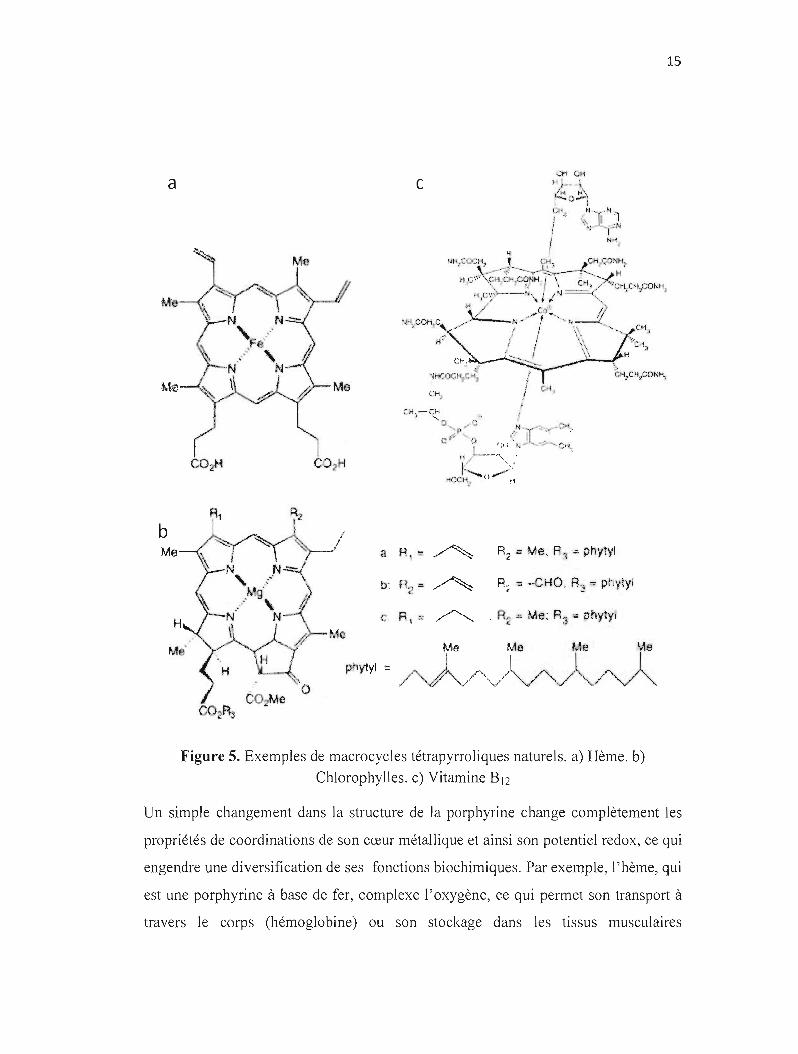
Dans les organismes vivants, les porphyrines participent à une variété de processus
d'oxydoréduction impliquant leur cœur métallique et leur environnement protéinique.
La figure (5) représente quelques porphyrines naturelles essentielles pour la vie
(pigments de la vie) :
15
a
R~ ;::; ··CHO, R;:: ". phytyl
phytyl
Figure 5. Exemples de macrocycles tétrapyrroliques naturels. a) Hème. b)
Chlorophylles. c) Vitamine B I2
Un simple changement dans la structure de la porphyrine change complètement les
propriétés de coordinations de son cœur métallique et ainsi son potentiel redox, ce qui
engendre une diversification de ses fonctions biochimiques. Par exemple, l'hème, qui
est une porphyrine à base de fer, complexe l'oxygène, ce qui permet son transport à
travers le corps (hémoglobine) ou son stockage dans les tissus musculaires
16
(myoglobine). La vitamine B I2 dont la structure est celle d'une corrine (même
structure que la porphyrine avec un pont méthine de moins) métallée par un atome de
cobalt, permet la réduction des composées organiques et ainsi assurer le transfert
d'hydrogène. Dans la chlorophylle, le macrocycle porphyriné complexe l'atome de
manganèse pour activer le cycle photosynthétique.
3.2.2 Porphyrines synthétiques
La structure chimique de la porphyrine a été proposée initialement en 1912 par
Küster.(Milgrom, 1997) Elle a été considérée comme une molécule instable jusqu'au
1929, quand le chimiste allemand Hans Fisher a réussi la première synthèse d'une
porphyrine de fer.(Milgrom, 1997) La caractérisation par cristallographie des rayons
X montre qu'une telle molécule est stable, généralement planaire avec quelques
distorsions qui permettent de complexer une variété de métaux (Fe, Ni, Mg, Co ... )
par les atomes d'azote de la porphyrine.;
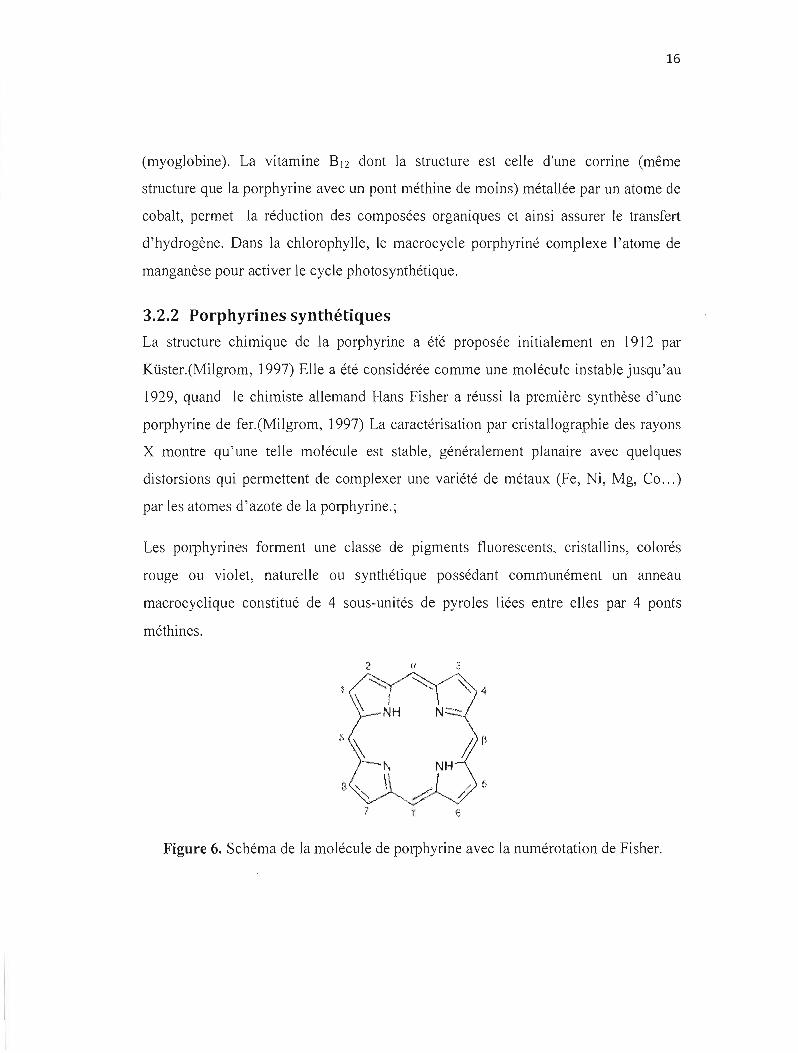
Les porphyrines forment une classe de pigments fluorescents, cristallins, colorés
rouge ou violet, naturelle ou synthétique possédant communément un anneau
macrocyclique constitué de 4 sous-unités de pyroles liées entre elles par 4 ponts
méthines.
7 6
Figure 6. Schéma de la molécule de porphyrine avec la numérotation de Fisher.
17
La figure 7 montre la structure d'une molécule de porphyrine, elle peut être substituée
au niveau des carbones tétrapyn"oliques (de 1 à 8) ou des positions méthine (méso),
symbolisées par les lettres a, ~,y et o.
3.2.3 L'électrochimie des porphyrines
De nombreuses porphyrines ont été caractérisées électrochimiquement, ceci inclus
différents ligands coordonnés au métal central de la porphyrine, plusieurs éléments
ont été insérés dans le cœur de la porphyrine avec 3 ou 4 états d'oxydation différents
et des centaines de molécules ont été attachées au macrocycle de la porphyrine. Une
base de données des résultats électrochimiques obtenus pour ces porphyrines a été
publiée par Kadish. (Kadish, 2003)
Les facteurs stériques et électroniques des substituants et des ligands, la taille et l'état
d'oxydation de l'ion métallique sont tous des éléments qui influencent directement
les propriétés électrochimiques de la porphyrine et plus particulièrement son potentiel
redox.
Le potentiel redox de la porphyrine (E",) est défini comme la différence entre le
premier potentiel d'oxydation et de réduction (E,!, (Ox,) - E,!, (Red,)). La majorité des
réactions redox des porphyrines sont réversibles et implique le transfert d'un seul
électron entre les orbitales HOMO et LUMO. Ce transfert peut être localisé sur l'un
ou les deux sites suivants: Le premier consiste en l'oxydation ou la réduction du
macrocycle ce qui produit des n-cations ou des n-anions, le deuxième est de ou vers
l'ion métallique ce qui change son état d'oxydation.
3.3 La porphyrine comme catalyseur pour la réduction de 02
La première étude de réduction de O2 sur une porphyrine a été publiée par Jasinsky en
1964. Depuis ce temps, plusieurs chercheurs ont étudié l'activité catalytique des
phalocyanines dont le métal est entouré par 4 ligands azotés en milieu acide, dans le
18
but de développer un nouveau catalyseur pour les piles à combustible. Le carbone a
été généralement utilisé comme substrat dans ces études. Le traitement thermique de
ce matériau a permis une amélioration de la durée de vie du catalyseur même en
présence du H202 produit comme intermédiaire par certaines porphyrines. Une revue
détaillée des avancés effectuées dans ce domaine a été publiée récemment (Zagal et
al., 2006)
La réduction O2 sur les porphyrines est complexe. Différents facteurs interviennent
dans ce mécanisme, notamment la nature de l'électrode, les conditions
expérimentales et la structure de la porphyrine elle-même. Le cœur métallique de la
porphyrine est aussi un facteur déterminant lors de la réduction d'oxygène. Par
exemple, la porphyrine de fer permet de réduire O2 par un mécanisme à 4 électrons et
ainsi produire H20. La porphyrine de cobalt produit H20 2 en réduisant O2, cependant
une di-porphyrine contenant 2 atomes de cobalt dans la même molécule permet de
faire une réduction à 4 électrons et donc obtenir H20.(Zagal et al., 2006)
Différentes méthodes électrochimiques ont été utilisées pour caractériser l'activité
électrochimique de films de métaJJoporphyrine comme la voltampérométrie cyclique,
RDE et l'impédance. Ces méthodes s'avèrent pertinentes pour l'étude macroscopique
cependant, les processus catalytiques s'effectuent souvent à l'échelle nanométrique.
La SECM est une technique de balayage électrochimique qui permet d'étudier
localement l'activité des catalyseurs. Cette technique commence à être de plus en plus
utilisée pour la caractérisation de l'activité catalytique, surtout en mode
génération/collection pour l'imagerie catalytique et en mode feedback pour l'étude de
la cinétique de la catalyse.
4 Application de la SECM en électrocatalyse de 02
L'imagerie de l'activité électrocatalytique par SECM est effectuée généralement par
mode génération/collection. Ce mode, contrairement au mode feedback, est moins
19
sensible à la distance microélectrode-substrat et à la vitesse de balayage de la
microélectrode. Fernàndez et al, ont étudié la réduction de O2 par mode SCI TG en
milieu acide, initialement sur l'or et le platine(Fernàndez et Bard, 2003) et ensuite sur
une série de combinaison binaires et tertiaires des métaux Co, Pd, Au et Ag déposés
sur du carbone.(Fernàndez et al., 2005) Le mode SGI TC a été utilisé par Wittstock et
al, afin de détecter le H202 produit par la réduction de l'oxygène sur des particules
de Pt et Pd électrodéposées sur des multicouches de film polyélectrolytiques.(Shen et
al., 2008) Le même mode a été utilisé par Minguzzi et al pour étudier la réduction de
O2 en milieu acide sur des mélanges de Ir02 et Snl-xlrx02 préparés par sol
gel.(Minguzzi et al., 2008) Des modifications ont été apportées au mode
génération/collection par Euckland et al dans le but de détecter simultanément H202
et H20 produit par la réduction d'oxygène sur différents catalyseurs.(Eckhard et
Schuhmann, 2007) Dans ce mode, appelée RC-SECM ou compétition SECM, la
réduction 02 s'effectue d'une façon compétitive entre la microélectrode et le substrat
où différents catalyseurs ont été déposés. Avec ce mode la réduction de O2 a été
étudiée sur des dépôts d'or et de platine déposé sur le carbone, des combinaisons de
nanoparticules de métaux (Pt, Au, Ru et Rh) déposés sur des nanotubes de carbone,
différentes compositions du mélange de nanoparticules Pt-Ag électrodéposées sur du
carbone vitreux et des porphyrines de Fe, Mn, Co sous forme de films
électropolymérisés sur des nanotubes de carbone.(Chen et al., 2009 ; Okunola et al.,
2009) Cependant le principal désavantage du mode RC-SECM est sa grande
sensibilité au pH. En effet, l'étude de l'activité catalytique en mode RC-SECM doit
être effectuée au voisinage de pH neutre à cause de la possibilité de changement local
de la concentration de H+, conséquence de l'oxydation de H20 et génération de O2 à
la la microélectrode .(Eckhard et Schuhmann, 2007)
20
Dans le chapitre 2 la méthode de fabrication des microélectrodes avec une étireuse de
pipette sera présentée. Les microélectrodes développées seront utilisées comme
électrode de travail en SECM pour la détection du peroxyde d'hydrogène sur des
électrodes d'or et de carbone vitreux modifiées avec une couche de thiol-porphyrine
de cobalt. (chapitre 3). L'utilisation de ces microélectrodes permet d'éviter la
perturbation de la solution et ainsi d'utiliser un modèle cinétique simplifié qui ne tient
pas en compte de la présence de la sonde. L'imagerie de l'activité électrocatalytique
par SECM sera effectuée en mode génération/collection. Ce mode, contrairement au
mode feedback, est moins sensible à la distance microélectrode-substrat et à la vitesse
de balayage de la microélectrode.
21
RÉFÉRENCES
Abbou, 1., C. Demaille.M.Druetet1.Moiroux. 2002. «Fabrication of submicrometer-sized gold electrodes of controlled geometry for scanning electrochemical-atomic force microscopy». Analytical Chemistry. vol. 74, no 24, p. 6355-6363.
Aboelella, N. W., E. A. Lewis, A. M. Reynolds, W. W. Brennessel, C. 1. Cramer et W. B. Tolman. 2002. «Snapshots of dioxygen activation by copper: The structure of al: 1 Cu/02 adduct and its use in syntheses of asymmetric bis(lloxo) complexes». Journal ofthe American Chemical Society. vol. 124, no 36, p. 10660-10661.
Amatore, C., B. Fosset, 1. Bartelt, M. R. Deakin et R. M. Wightman. 1988. «Electrochemical kinetics at microelectrodes. Part V. Migrational effects on steady or quasi-steady-state voltammograms». Journal ofElectroanalytical Chemistry. vol. 256, no 2, p. 255-268.
Araki, K., S. Dovidauskas, H. Winnischofer, A. D. P. Alexiou et H. E. Toma. 2001. «A new highly efficient tetra-electronic catalyst based on a cobalt porphyrin bound to four 1l3-oxo-ruthenium acetate clusters». Journal ofElectroanalytical Chemistry. vol. 498, no 1-2, p. 152-160.
Arima, V., F. Matino, 1. Thompson, R. Cingolani, R. Rinaldi et R. 1. R. Blyth. 2005. «Ex-situ prepared films of 4-aminothiophenol on Au(1 1 1): photoemission, NEXAFS and STM measurements». Surface Science. vol. 580, no 1-3, p. 6370.
Arrigan, D. W. M. 2004. «Nanoelectrodes, nanoelectrode arrays and their applications». Analyst. vol. 129, no 12,p.1157-1165.
Avalos-Martinez, 1., 1. Villatoro, 1. L. Flores, G. Garcia-Torales, M. Barcena-Soto et N. Casillas. 2004. Proceedings ofSPIE - The International Society for Optical Engineering. 350-358 p.
Ballesteros Katemann, B., A. Schulte et W. Schuhmann. 2004. «Constant-Distance Mode Scanning Electrochemical Microscopy. Part II: High-Resolution SECM Imaging Employing Pt Nanoelectrodes as Miniaturized Scanning Probes». Electroanalysis. vol. 16, no 1-2, p. 60-65.
Baltes, N., L. Thouin, C. Amatore et 1. Heinze. 2004. «Imaging concentration profiles of redox-active species with nanometric amperometric probes: Effect of natural convection on transport at microdisk electrodes». Angewandte Chemie - International Edition. vol. 43, no Il, p. 1431-1435.
22
Bard, A. 1., et M. V. Mirkin. 2001. Scanning Electrochemical Microscopy. New York : Marcel Dekker.
Chang, C. 1., Z. H. Loh, C. Shi, F. C. Anson et D. G. Nocera. 2004. «Targeted proton delivery in the catalyzed reduction of oxygen to water by bimetallic pacman porphyrins». Journal ofthe American Chemical Society. vol. 126, no 32, p. 10013-10020.
Chen, X., K. Eckhard, M. Zhou, M. Bron et W. Schuhmann. 2009. «Electrocatalytic activity of spots of electrodeposited noble-metal catalysts on carbon nanotubes modified glassy carbon». Analytical Chemistry. vol. 81, no 18, p. 7597-7603.
Christensen, B. N., et W. P. Teubl. 1979. «Estimates ofcable parameters in lamprey spinal cord neurones». Journal ofPhysiology. vol. Vol. 297, p. 299-318.
Chung, T. D., et F. C. Anson. 2001. «Catalysis of the electroreduction of O2 by cobalt 5,10, 15,20-tetraphenylporphyrin dissolved in thin layers of benzonitrile on graphite electrodes». Journal ofElectroanalytical Chemistry. vol. 508, no 1-2, p.115-122.
Collinson, M. M., et R. M. Wightman. 1993. «High-frequency generation of electrochemiluminescence at microelectrodes». Analytical Chemistry. vol. 65, no 19, p. 2576-2582.
Cougnon, c., K. Bauer-Espindola, D. S. Fabre et 1. Mauzeroll. 2009. «Development of a Phase-Controlled Constant-Distance Scanning Electrochemical Microscope». Analytical Chemistry. vol. 81, no 9, p. 3654-3659.
Davoodi, A., A. Farzadi, 1. Pan, C. Leygraf et Y. Zhu. 2008. «Developing an AFMbased SECM system; Instrumental setup, SECM simulation, characterization, and calibration». Journal ofthe Electrochemical Society. vol. 155, no 8.
Demarconnay, L., C. Coutanceau et J. M. Léger. 2004. «Electroreduction of dioxygen (ORR) in alkaline medium on Ag/C and PtiC nanostructured catalysts - Effect of the presence of methanol». Electrochimica Acta. vol. 49, no 25, p. 45134521.
Eckhard, K., et W. Schuhmann. 2007. «Localised visualisation of O2 consumption and H202 formation by means of SECM for the characterisation of fuel cell catalyst activity». Electrochimica Acta. vol. 53, no 3 SPEC. ISS., p. 11641169.
Engstrom, R. c., et V. A. Strasser. 1984. «Characterization of electrochemically pretreated glassy carbon electrodes». Analytical Chemistry. vol. 56, no 2, p. 136-141.
23
Fernàndez, J. L., et A. 1. Bard. 2003. «Scanning Electrochemical Microscopy. 47. Imaging Electrocatalytic Activity for Oxygen Reduction in an Acidic Medium by the Tip Generation Substrate Collection Mode». Analytical Chemistry. vol. 75, no 13, p. 2967-2974.
Fernàndez,1. L., D. A. Walsh et A. 1. Bard. 2005. «Thermodynamic guidelines for the design of bimetallic catalysts for oxygen electroreduction and rapid screening by scanning electrochemical microscopy. M-Co (M: Pd, Ag, Au)>>. Journal ofthe American Chemical Society. vol. 127, no 1, p. 357-365.
Fish, G., O. Bouevitch, S. Kokotov, K. Lieberman, D. Palanker, 1. Turovets et A. Lewis. 1995. «Ultrafast response micropipette-based submicrometer thermocouple». Review ofScient(fic Instruments. vol. 66, no 5, p. 3300-3306.
Frederix, P. L. T. M., P. D. Bosshart, T. Akiyama, M. Chami, M. R. Gullo, 1. 1. Blackstock, K. Dooleweerdt, N. F. De Rooij, U. Staufer et A. Engel. 2008. «Conductive supports fOf combined AFM-SECM on biological membranes». Nanotechnology. vol. 19, no 38.
Gao, N., X. Wang, L. Li, X. Zhang et W. Jin. 2007. «Scanning electrochemical microscopy coupled with intracellular standard addition method for quantification of enzymeactivity in single intact cells». Analyst. vol. 132, no Il,p.1139-1146.
Hayashi, M., H. Uemura, K. Shimanoe, N. Miura et N. Yamazoe. 2004. «Reverse micelle assisted dispersion of lanthanum manganite on carbon support for oxygen reduction cathode». Journal ofthe Electrochemical Society. vol. 151, no 1.
Jasinski, R. 1964. «A New Fuel Cell Cathode Catalyst». Nature. vol. 201, no 4925, p. 1212-1213.
Kadish, K. M. 2003. Phthalocyanines spectroscopic and electrochemical charaterization. Coll. «The Porphyrin handbook, 16». San Diego: Academic Press.
Kalyuzhny, G., A. Vaskevich, G. Ashkenasy, A. Shanzer et 1. Rubinstein. 2000. «UVIVis Spectroscopy of Metalloporphyrin and Metallophthalocyanine Monolayers Self-Assembled on Ultrathin Gold Films». The Journal of Physical Chemistry B. vol. 104, no 34, p. 8238-8244.
Kampas, F. 1., K. Yamashita et 1. Fajer. 1980. «Photoelectrochemical properties of metalloporphyrins». Nature. vol. 284, no 5751, p. 40-44.
24
Katemann, B. B., et W. Schuhmann. 2002. «Fabrication and characterization of needle-type Pt-disk nanoelectrodes». Electroanalysis. vol. 14, no l, p. 22-28.
Kelly, R. S., et R. M. Wightman. 1986. «Bevelled carbon-fiber ultramicroelectrodes». Analytica Chimica Acta. vol. 187, no C, p. 79-87.
Kieber-Emmons, M. T., R. Schenker, G. P. A. Yap, T. C. Brunold et C. G. Riordan. 2004. «Spectroscopic elucidation of a peroxo Ni2(,..t.-02) intermediate derived from a nickel(I) complex and dioxygen». Angewandte Chemie -International Edition. vol. 43, no 48, p. 6716-6718.
Kueng, A., C. Kranz, A. Lugstein, E. Bertagnolli et B. Mizaikoff. 2003. «Integrated AFM-SECM in tapping mode: Simultaneous topographical and electrochemical imaging of enzyme activity». Angewandte Chemie International Edition. vol. 42, no 28, p. 3238-3240.
Kurtikyan, T. S., A. N. Mardyukov, R. K. Kazaryan et 1. A. Goodwin. 2003. «Microporous porphyrin assemblies. Interaction ofN02 gas with sublimed layers of meso-mono-4-pyridyl-triphenylporphyrinatocobalt(II)>>. Journal of Porphyrins and Phthalocyanines. vol. 7, no 11-12, p. 775-779.
Kwak, 1., et A. 1. Bard. 1989. «Scanning electrochemical microscopy. Theory of the feedback mode». Analytical Chemistry. vol. 61, no Il, p. 1221-1227.
Laforge, F. O., T. Kakiuchi, F. Shigematsu et M. V. Mirkin. 2006. «SECM study of solute partitioning and electron transfer at the ionic liquid/water interface». Langmuir. vol. 22, no 25, p. 10705-10710.
Laforge, F. O., P. Sun et M. V. Mirkin. 2006. «Shuttling mechanism ofion transfer at the interface between two immiscible liquids». Journal ofthe American Chemical Society. vol. 128, no 46, p. 15019-15025.
Lee, K., A. Ishihara, S. Mitsushima, N. Kamiya et K. 1. Ota. 2004. «Stability and electrocatalytic activity for oxygen reduction in WC + Ta catalyst». Electrochimica Acta. vol. 49, no 21, p. 3479-3485.
Lefrou, C. 2007. «A very easy kinetics determination for feedback curves with a microdisk SECM tip and rather rapid substrate reaction». Journal of Electroanalytical Chemistry. vol. 60 1, no 1-2, p. 94-100.
Lescop, B., 1. Ph Jay et G. Fanjoux. 2004. «Reduction of oxygen pre-treated Ni(l 1 1) by H2exposure: UPS and MIES studies compared with Monte Carlo simulations». Surface Science. vol. 548, no 1-3, p. 83-94.
25
Li Zhu, A., H. Wang, W. Qu, X. Li, Z. Jong et H. Li. «Low temperature pyrolyzed cobalt tetramethoxy phenylporphyrin catalyst and its applications as an improved catalyst for metal air batteries». Journal ofPower Sources. vol. 195, no 17, p. 5587-5595.
Limoges, B. R., R. 1. Stanis,1. A. Turner et A. M. Herring. 2005. «Electrocatalyst materials for fuel cells based on the polyoxometalates [PMO(12 _n) Vn04o](3 + n)
(n = 0-3)>>. Electrochimica Acta. vol. 50, no 5, p. 1169-1179.
Lin, C. M., Y. T. Lee, S. R. Yeh et W. Fang. 2009. «Flexible carbon nanotubes e1ectrode for neural recording». Biosensors and Bioelectronics. vol. 24, no 9, p.2791-2797.
Lin, Y., X. Cui et X. Ye. 2005. «Electrocatalytic reactivity for oxygen reduction of palladium-modified carbon nanotubes synthesized in supercritical fluid». Electrochemistry Communications. vol. 7, no 3, p. 267-274.
Lipkowski, 1. 1998. Electrocatalysis. Coll. «Frontiers in electrochemistry». New York, NY: Wiley-VCH.
Lu, x., M. Li, C. Yang, L. Zhang, y. Li, L. Jiang, H. Li, L. Jiang, C. Liu et W. Hu. 2006. «Electron Transport through a Se1f-Assemb1ed Mono1ayer ofThio1End-Functionalized Tetraphenylporphines and Metal Tetraphenylporphines». Langmuir. vol. 22, no 7, p. 3035-3039.
Lu, X., B. Lv, Z. Xue, M. Li, L. Zhang et 1. Kang. 2005. «Self-assembled mono1ayers of a thiol-derivatized porphyrin on gold electrode: Film formation and e1ectrocata1ytic dioxygen reaction». Thin Solid Films. vol. 488, no 1-2, p. 230235.
Lynam, c., W. Grosse et G. G. Wallace. 2009. «Carbon-nanotube biofiber microelectrodes». Journal ofthe Electrochemical Society. vol. 156, no 7.
Maus, R. G., E. M. McDonald et R. M. Wightman. 1999. «Imaging of nonuniform current density at microelectrodes by electrogenerated chemiluminescence». Analytical Chemistry. vol. 71, no 21, p. 4944-4950.
Mauzeroll, 1., E. A. Hueske et A. 1. Bard. 2003. «Scanning electrochemicai microscopy. 48. HglPt hemispherical ultramicroelectrodes: Fabrication and characterization». Analytical Chemistry. vol. 75, no 15, p. 3880-3889.
Médard, C., et M. Morin. 2009. «Chemisorption of aromatic thiols onto a glassy carbon surface». Journal ofEleClroanalylical Chemistry. vol. 632, no 1-2, p. 120-126.
26
Mentus, S. V. 2004. «Oxygen reduction on anodically formed titanium dioxide». Electrochimica Acta. vol. 50, no l, p. 27-32.
Milgrom, L. R.. 1997. The Colours of Life: An Introduction to the Chemistry of Porphyrins and Related Compounds. New York: Oxford University Press.
Minguzzi, A, M. A Alpuche'-Aviles, 1. R. L6pez, S. Rondinini et A 1. Bard. 2008. «Screening of Oxygen Evolution Electrocatalysts by Scanning Electrochemical Microscopy Using a Shielded Tip Approach». Analytical Chemistry. vol. 80, no Il, p. 4055-4064.
Mohammad, M. A, R. Parvaneh, D. Hossein, K. Payam Ebrahimi, Z. Hamid Reza et K. Somayeh. 2007. «Electrocatalytic Reduction of Dioxygen on the Surface of Glassy Carbon Electrodes Modified with Cobalt Porphyrin Complexes». Electroanalysis. vol. 19, no 21, p. 2258-2263.
Okunola, A O., T. C. Nagaiah, X. Chen, K. Eckhard, W. Schllhmann et M. Bron. 2009. «Visualization oflocal electrocatalytic activity of metalloporphyrins towards oxygen reduction by means of redox competition scanning electrochemical microscopy (RC-SECM)>>. Electrochimica Acta. vol. 54, no 22, p. 4971-4978.
Otero, R., F. Calleja, V. M. Garcia-Suarez, 1. 1. Hinarejos, 1. De la Figuera, 1. Ferrer, AL. Vâzquez de Parga et R. Miranda. 2004. «Tailoring surface electronic states via strain to control adsorption: O/Cu/Ru(O 0 0 1)>>. Surface Science. vol. 550, no 1-3, p. 65-72.
Prakash, 1., et H. Joachin. 2000. «Electrocatalytic activity of ruthenium for oxygen reduction in alkaline solution». Electrochimica Acta. vol. 45, no 14, p. 22892296.
Sânchez-Sânchez, C. M., 1. Rodrîguez-L6pez et A. 1. Bard. 2008. «Scanning Electrochemical Microscopy. 60. Quantitative Calibration of the SECM Substrate GenerationiTip Collection Mode and Its Use for the Study of the Oxygen Reduction Mechanism». Analytical Chemistry. vol. 80, no 9, p. 32543260.
Shen, Y., 1. Liu, 1. Jiang, B. Liu et S. Dong. 2003. «Fabrication of a Metalloporphyrin-Polyoxometalate Hybrid Film by a Layer-by-Layer Method and Its Catalysis for Hydrogen Evolution and Dioxygen Reduction». Journal ofPhysical Chemistry B. vol. 107, no 36, p. 9744-9748.
Shen, Y., M. Trauble et G. Wittstock. 2008. «Electrodeposited noble metal particles in polyelectrolyte multilayer matrix as electrocatalyst for oxygen reduction
27
studied using SECM». Physical Chemistry Chemical Physics. vol. 10, no 25, p. 3635-3644.
Song, Chaojie, et Jiujun Zhang. 2008. «Electrocatalytic Oxygen Reduction Reaction». In PEM Fuel Cel! Electrocatalysts and Catalyst Layers, p. 89-134.
Stiehl, 1 D., T. S. Kim, S. M. McClure et C. B. Mullins. 2004. «Evidence for Molecularly Chemisorbed Oxygen on Ti02 Supported Gold Nanoclusters and Au(lll)>>. Journal ofthe American Chemical Society. vol. 126, no 6, p. 16061607.
Sun, P., F. O. Laforge, T. P. Abeyweera, S. A. Rotenberg, 1 Carpino et M. V. Mirkin. 2008. «Nanoe1ectrochemistry of mammalian cells». Proceedings ofthe National Academy ofSciences ofthe United States ofAmerica. vol. 105, no 2, p.443-448.
Sun, P., F. O. Laforge et M. V. Mirkin. 2007. «Scanning electrochemical microscopy in the 21 st century». Physical Chemistry Chemical Physics. vol. 9, no 7, p. 802-823.
Sun, P., et M. V. Mirkin. 2006. «Kinetics of Electron-Transfer Reactions at Nanoelectrodes». Analytical Chemistry. vol. 78, no 18, p. 6526-6534.
Syms, R. R. A. 2004. «Sub-micron structuring at mesa edges». Microelectronic Engineering. vol. 73-74, p. 295-300.
Ufheil, l, C. HeJ3, K. Borgwarth et 1. Heinze. 2005. «Nanostructuring and nanoanalysis by scanning electrochemical microscopy (SECM)>>. Physical Chemistry Chemical Physics. vol. 7, no 17, p. 3185-3190.
Velmurugan, J., P. Sun et M. V. Mirkin. 2008. «Scanning Electrochemical Microscopy with Gold Nanotips: The Effect of Electrode Material on Electron Transfer Rates». The Journal ofPhysical Chemistry C. vol. 113, no l, p. 459464.
Xiaoquan, L., Z. Limin, L. Minrui, W. Xiaoqiang, Z. Yan, L. Xiuhui et Z. Guofang. 2006. «Electrochemical Characterization of Self-Assembled Thiol-Porphyrin Monolayers on Gold Electrodes by SECM13». ChemPhysChem. vol. 7, no 4, p.854-862.
Xu, Y., et M. Mavrikakis. 2003. «Adsorption and dissociation of O2 on gold surfaces: Effect of steps and strain». Journal ofPhysical Chemistry B. vol. 107, no 35, p. 9298-9307.
28
Yoshimoto, S., J. Inukai, A. Tada, T. Abe, T. Morimoto, A. Osuka, H. Furuta et K. Itaya. 2004. «Adlayer Structure of and Electrochemical O2 Reduction on Cobalt Porphine-Modified and Cobalt Octaethylporphyrin-Modified Au(111) in HCl04». Journal ofPhysical Chemistry B. vol. 108, no 6, p. 1948-1954.
Yoshimoto, S., A. Tada, K. Suto et K. Itaya. 2003. «Adlayer structures and electrocatalytic activity for O2 of metal!ophthalocyanines on Au(111): In situ scanning tunneling microscopy study». Journal ofPhysical Chemistry B. vol. 107, no 24, p. 5836-5843.
Yuan, X. Zi., et H. Wang. 2008. «PEM Fuel Cel! Fundamentals». In PEM Fuel Cel! Electrocatalysts and Catalyst Layers, p. 1-87.
Zagal, J. H., F. Bedioui et J. P. Dodelet. 2006. N4-macrocyclic metalcomplexes. New York: Springer.
Zhang, C. X., H. C. Liang, E. I. Kim, J. Shearer, M. E. Helton, E. Kim, S. Kaderli, C. D. Incarvito, A. D. Zuberbühler, A. L. Rheingold et K. D. Karlin. 2003. «Tuning copper-dioxygen reactivity and exogenous substrate oxidations via alterations in ligand electronics». Journal ofthe American Chemical Society. vol. 125, no 3, p. 634-635.
Zhang, Y. H., W. Zhao, J. Wang et P. Jiang. «Experimental and theoretical study on vibrational spectra of nickel and zinc complexes of 5,1 O-diphenylporphyrin». Spectrochimica Acta - Part A: Molecular and Biomolecular Spectroscopy. vol. 75, no 2, p. 499-506.
Zhang, Y., X. Lu, T. Liao, Y. Cheng, X. Liu et L. Zhang. 2007. «Studies on interaction of porphyrin and its complexes with DNA at interface on gold electrode modified by thiol-porphyrin self-assembled monolayer». Journal of SoUd State Electrochemistry. vol. Il, no 9, p. 1303-1312.
Zhi, F., X. Lu, J. Yang, X. Wang, H. Shang, S. Zhang et Z. Xue. 2009. «Selective Anion Sensing through a Self-Assembled Monolayer ofThiol-EndFunctionalized Porphyrin». The Journal ofPhysical Chemistry C.
Zhou, J., Y. Zu et A. J. Bard. 2000. «Scanning electrochemical microscopy - Part 39. The protonlhydrogen mediator system and its application to the study of the electrocatalysis ofhydrogen oxidation». Journal ofElectroanalytical Chemistry. vol. 491, no 1-2, p. 22-29.
Zoski, C. G. 2002. «Ultramicroelectrodes: Design, fabrication, and characterizatiom>. Electroanalysis. vol. 14, no 15-16, p. 1041-1051.
Zoski, C. G. 2007. Handbook ofelectrochemistry. Amsterdam; Boston: Elsevier.
CHAPITRE II
FABRICATION ET CARACTÉRISATION DES MICROÉLECTRODES
1 Résumé
Dans ce chapitre la méthode de fabrication des microélectrodes avec une étireuse de
pipette sera détaillée. La compréhension de l'effet des paramètres expérimentaux sur
les étapes de fabrication est primordiale pour un meilleur contrôle de la taille et de la
géométrie des microélectrodes développées.
L'introduction d'une étape d'amincissement au début du protocole de fabrication
permet de diminuer le RG (RG= diamètre (isolant + électrode)/électrode) des
microélectrodes. La deuxième étape consiste à sceller le platine à l'intérieur du
capillaire amincie, ensuite l'étape d'étirement permet de faire deux microélectrodes
qui vont subir un polissage mécanique avant leur utilisation finale.
Les microélectrodes obtenues ont été caractérisées par microscopie optique,
microscopie électronique à balayage, microscopie électrochimique à balayage et
voltampérométrie cyclique. Les résultats montrent que ces microélectrodes possèdent
une distribution de diamètre et de RG que l'on catégorise en trois classes soit; 1-5
flm (RG= 4-7), Iflm-100 nm (RG= 4-10), et <100 nm (RG >10).
Finalement un exemple d'image SECM d'un substrat modifiée par des dépôts d'or
sera présenté. Ces microélectrodes seront utilisées pour l'étude de l'activité
catalytique des porphyrines présentée au chapitre
30
2 Article: (annexe A)
Mezour, M. A.; Morin, M.; Mauzeroll, J. Fabrication and Characterization of
Microelectrodes. (En voie de soumission au journal Analytical Chemistry)
CHAPITRE III
DÉTECTION DU PEROXYDE D'HYDROGÈNE SUR UNE ÉLÉCTRODE D'OR MODIFIÉE PAR UNE COUCHE AUTOASSEMBLÉE DE THIOL-PORPHYRIN
DE COBALT AVEC LA MICROSCOPIE ÉLECTROCHIMIQUE À BALAYAGE
1 Résumé
Dans le chapitre 3, la détection du peroxyde d'hydrogène sur une électrode d'or et
de carbone vitreux modifiée avec une couche de thiol- porphyrine de cobalt avec la
microscopie électrochimique à balayage sera présentée. Des mesures AFM et par
voltamétrie cycliques ont permis de vérifier la présence du catalyseur sur les substrats
d'or et de carbone vitreux. Des mesures SECM en mode substrat génération/tip
collection (SG/TC) ont illustré l'effet catalytique des porphyrines à des potentiels
moins négatifs. Le balayage à 2 dimensions (ligne scan) et 3 dimensions (image) de la
surface modifiée a dévoilé une présence homogène du catalyseur sur le substrat d'or,
ce qui n'est pas le cas pour un substrat de carbone vitreux. L'uti.risation des
microélectrodes (présenté en chapitre 2) va permettre d'éviter la perturbation de la
solution et ainsi d'utiliser un modèle cinétique qui ne tient pas en compte de la
présence de la sonde.
2 Article: (annexe B)
Mezour, M. A.; Cornut, R.; Hussien, E. M.; Morin, M.; Mauzeroll, 1. Langmuir
2010,26 (15), 13000-13006.
CONCLUSION
L'étude de la réaction de réduction d'oxygène est d'une grande importance dans le
domaine de la conversion d'énergie électrochimique. Cependant, peu de méthodes
permettent d'évaluer l'activité catalytique des catalyseurs potentiels pour la RRO
d'une façon locale et donc pertinente dans le cas où la distribution et l'environnement
du catalyseur est non homogène. Ce mémoire présente les résultats de l'étude de
l'activité catalytique de 5,10,15,20-tetraphenyl-21H,23H-porphine de cobalt (II)
coordonnée à une couche de 4-aminothiophenol déposée sur une électrode d'or ou de
carbone vitreux avec la technique SECM en mode substrat génération /tip collection.
Dans ce mode l'oxygène est réduit sur le catalyseur pour produire du peroxyde qui est
oxydé ensuite sur la microélectrode. L'utilisation des microélectrodes développées
avec la méthode de l'étireuse de pipette permet d'avoir une meilleure résolution en
imagerie SECM et plus de précision sur l'extrapolation des données cinétiques du
catalyseur.
Dans la première partie de ce mémoire le protocole de fabrication des
microélectrodes en utilisant l'étireuse de pipette à été présenté. L'étude de l'influence
des paramètres de fabrication (Heat, Filament, Pull. 00) ainsi que l'introduction d'une
étape d'amincissement au début du protocole de fabrication permet de mieux
contrôler le RG et le diamètre des microélectrodes fabriquées. Les résultats de la
caractérisation par MEE, voltampérométrie cyclique et SECM montrent que ces
microélectrodes possèdent une large distribution de diamètre et de RG. Trois classes
peuvent être obtenues: 1-5 ~m (RG= 4-7), 1 ~m-l00 nm (RG= 4-10), et <100 nm
(RG >10). L'acquisition d'une image SECM des dépôts d'or de 20 ~m sur un substrat
de verre montre un bon contraste entre les deux matériaux vis-à-vis l'oxydoréduction
du férrocène méthanol. Cela démontre la possibilité d'utiliser ces microélectrodes
pour les dépôts de catalyseurs sur le substrat d'or.
33
Dans le 3ème chapitre, la détection du peroxyde d'hydrogène sur une électrode d'or et
de carbone vitreux modifiée avec une monocouche de thiol- porphyrine de cobalt en
utilisant la microscopie électrochimique à balayage a été présentée. Les analyses
AFM effectuées sur le substrat d'or avant et après modification avec le catalyseur
confirment l'attachement du catalyseur au substrat avec une distribution uniforme,
expérience non effectuée sur le substrat de carbone vitreux à cause de sa grande
rugosité. La voltampérométrie cyclique confirme l'effet catalytique du catalyseur sur
les deux substrats avec l'obtention d'un grand déplacement du pic de réduction
d'oxygène vers des potentiels moins négatifs sur le carbone vitreux et un déplacement
moins important sur le substrat d'or. Le choix des potentiels appliqués aux substrats a
été optimisé en fonction des CVs. Les mesures SECM en mode substrat
générationltip collection (SG/TC) confirment l'effet catalytique des porphyrines à des
potentiels moins négatifs. En effet, le balayage à 2-dimension (ligne scan) et
3- dimension (image) du catalyseur dévoilent une distribution hétérogène sur les
substrats d'or et de carbone. L'utilisation des microélectrodes (présentée en
chapitre 2) a permis d'éviter la perturbation de la solution et ainsi d'utiliser un
modèle cinétique qui ne prend pas en compte la présence de la sonde lors de
l'extraction des paramètres cinétique de la RRü sur le catalyseur. Cette étude
présente une nouvelle façon d'aborder la RRü. En effet, l'utilisation des
microélectrodes permet non seulement d'avoir une meilleure résolution sur l'imagerie
SECM mais aussi d'éviter les phénomènes de convection lors de la modélisation de la
RRü sur des systèmes électrocatalytiques.
Dans les travaux futurs, la fabrication de la microélectrode anneau-disque s'avère
pertinente pour la détermination du mécanisme de la RRü. Par application de deux
potentiels différents sur la microélectrode, l'eau et le peroxyde peuvent être détectés
simultanément sur le micro-anneau et le micro-disque. La microélectrode anneau
disque peut être aussi utilisée pour sa grande efficacité lors de l'opération génération
collection. En effet, la géométrie de la microélectrode avec un disque au centre
34
entouré par un anneau dont le diamètre ne dépasse pas 1 à 2 micron petmet d'avoir un
meilleur coeffi~ient de collection. Si le disque est utilisé pour générer une espèce (par
exemple: Où elle va réagir et donner un produit (par exemple: H20 2) qui sera
détecté sur l'anneau avec une grande précision.
Présentement des travaux sont en cours au laboratoire pour le développement de ces
microélectrodes. En tirant profit des microélectrodes disque développées dans le
chapitre 2, une couche d'or ou de platine sera déposée par évaporation sur la
microélectrode disque, ensuite un polymère non conducteur sera utilisé pour isoler le
dépôt du métal, et finalement un décapage chimique et lou polissage mécanique
seront effectués au besoin pour exposer le bout de la microélectrode anneau-disque.
Le chapitre 3 constitue un exemple d'étude catalytique avec la SECM en mode
génération-collection qui peut être élargie à d'autres systèmes catalytiques. Par
exemple, la combinaison de certains métaux comme le cobalt, le fer et le palladium
permet de développer des catalyseurs pour la réduction d'oxygène.(Fernàndez et al.,
2005) Une autre étude intéressante consisterait à étudier l'effet de la structure et le
métal central des molécules organométalliques sur leur activité catalytiques. D'autres
catalyseurs potentiels pour la RRO sont résumés dans le tableau 2 du chapitre 1.
Le substrat sur lequel le catalyseur est fixé s'avère aussi détetminant lors de
l'opération de la catalyse. Le traitement du substrat de carbone avec des méthodes
électrochimiques et thermiques est un moyen efficace pour améliorer son efficacité
catalytique. Des mesures entamées au laboratoire montrent l'effet de la présence des
molécules de quinone obtenues par activation électrochimique sur la production de
peroxyde lors de la RRO. Une étude effectuée dans notre laboratoire prévoie la
possibilité de modifier la surface de carbone vitreux par des molécules de thiol. Cette
étude envisage un mécanisme d'addition de Michael.(Médard et Morin, 2009) La
cinétique de cette réaction peut être élucidée par SECM en mode feedback. La SECM
pourrait être aussi utilisée comme moyen de modification de surface de carbone par

35
des catalyseurs par la suite. Des courbes d'approches préliminaires montrent
l'influence des phénomènes d'absorption-désorption sur la RRü en fonction du
potentiel appliqué sur le substrat de carbone.

36
ANNEXE A
37
Fabrication and Characterization of Microelectrodes
Mohamed A. Mezour, Mario Morin, Janine Mauzeroll*
Laboratory for Electrochemical Reactive Imaging and Detection for Biological
Systems, Department ofChemistry, NanoQAM Research Centre, Université du
Québec à Montréal, c.P. 8888, Suce. Centre-ville, Montréal, QC, Canada, H3C 3P8.
*Correspondence should be addressed to: Professor Janine Mauzeroll, Université du
Québec à Montréal, c.P. 8888, Suce. Centre-ville, Montréal, QC, Canada, H3C 3P8,
Phone: 514-987-3000 ext. 0895, Fax: 514-987-4054
Email: [email protected]
TITLE RUNNING HEAD
Fabrication and Characterization of Microelectrodes
38
Abstract
Development of a reproducible procedure for the fabrication of Pt disk-shaped UMEs
with characteristic dimensions ranging from 50 nm to 1 llm diameter was carried out
using a laser pulling technique. The goveming physical phenomena involved in their
fabrication were discussed and the importance of adding a critical quartz thinning
step in the general procedure was showed. The preparation ofUMEs involves sealing
a platinum wire inside a quartz tubing using a pipette pu11er, thinning the composite
material (platinum/quartz assembly), and laser pulling it to obtain two UMEs that
have a ratio of the radius of the external UME diameter and that of the active
electrode material below 5. Mechanical polishing is required and remains the critical
step in the fabrication of nanometer size electrodes. Following production, the UMEs
are characterized by electron microscopy, scanning electrochemical microscopy and
cyc1ic voltammetry. Development of these UMEs is motivated by their subsequent
application to electrocatalysis and their potential in theoretical study because of their
weil defined geometry.
Introduction
The use of microelectrodes lS of great importance in electrochemistry,
neurophysiology and scanning probe microscopy (SPM) techniques. 1-5 In many
studies, the microelectrode was the key to extend the conventional electrochemical
methodology to more complicated systems as in single cells,6 neurons,7 membrane
39
pores8 and liposome.9 Another motivation for the development of microelectrodes is
their potential to be used as scanned probe in scanning electrochemical microscopy
(SECM).IO,II This technique is very dependent on the size of the microelectrode,
generally a 25 ~m diameter platinum wire isolated with a borosilicate frame is the
most used microelectrode. 5 Reducing the platinum and the glass diameter are
extremely advantageous when a high SECM image resolution is needed; such
microelectrode has a nanometric diameter and known as nanoelectrode. A second
benefit of using nanoelectrodes is their local concentration gradients. This means that
the nanometric probe is monitoring the true local concentration of a species and is
almost immune to any side effects. 12 In consequence no perturbations of solution or
convection are observed and the extraction of kinetics parameters may be done with
high accuracy if a numerical model of the studied electrochemical system was
performed.
Nanoelectrode fabrication has been widely investigated. Several approaches were
Scarried out and described in details in many reviews.3- Lithography techniques
and/or chemical vapour deposition (CVD), electrochemical etching and laser puller
technique are the most promising procedures. Lithography techniques were used to
produce platinum or gold band nanoelectrode by metal films deposition of
thicknesses between 2 and 100 nm. 13,14 The CVD technique was more used in case of
carbon nanotubes and carbon fibres electrodes. IS-17
The second approach consists on etching microwires to a fine tip or cone and
insulation of ail but the very tip of the cone using a suitable insulator. This method is
40
an adaptation of the previously used method for the preparation of conducting tips for
scanning tunnelling microscopy (STM) when applied in liquid environments. The
etching/insulation approach, produces nanoelectrodes with a diameter of sorne
nanometers, however, their geometry are conic and approximated by a hemisphere.4
Weil defined disk geometry of nanoelectrode was obtained by pulling glass
capillaries containing sealed microwires using a commercially-available laser pipette
pu11er. Both the thickness of the eventual wire and its glass sUITound can be
manipulated by controlling the conditions during the pulling procedure.
This strategy has been achieved by few laboratories and their potential for application
24has clearly been demonstrated. 18- Development of reproducible procedure for
fabrication of Pt disk-shape nano- and micro- electrodes using laser pullers remains
technically challenging and is often the limiting step in performing electrochemical
studies. This can be explained by the empirical nature of protocol development and
difficulties in polishing the pulled electrodes. The former has not been thoroughly
discussed in existing studies and is critical to the development of a reproducible
fabrication procedure where the dimensions of the metal and insulating material need
to be controlled. We therefore propose a method for the fabrication of disk shaped Pt
electrodes of sub-micrometer dimensions and weil controlled glass to platinum
diameter ratio, RG, with a high reproducibility.
41
Experimental section
Materials and Reagents. Electrochemical measurements were performed in
nanopure water solutions, purified with a Millipore Milli-Q Biocel Ultrapure water
system (Fisher, Ottawa, ON), ferrocenemethanol (FcCH20H) (97%, Aldrich, Canada)
and potassium chloride (KCl). Electrode fabrication materials used were 25 ~m
diameter Pt-wire (purity 99.9%; hard) (Goodfellow, USA), quartz capil1aries (L: 150
mm, 0.0.: 1 mm, 1.0.: 0.3 mm) (Sutter Instrument, USA), electrically conductive
silver epoxy (EPO-TEK® H20E) (Epoxy Technology Inc, Canada ) and standard
cupper connection wires (diameter < 0.3 mm). Polishing materials (Buehler, Canada)
used were abrasive dises (800, 1200 grit), diamond lapping film discs (1, 0.3, 0.05
~m diamond size) and alumina suspensions (l, 0.3, 0.05 flm particie diameter).
Electrochemical Cel!. The conductive substrate and the patterned aITay used in the
approach curve and the SECM image were a 3 mm diameter glassy carbon electrode
(Bioanalytical Systems Inc, Canada), and a 20 ~m diameter gold disks pattemed array
deposited on silicon (a gracious gift from Dr. Matthias Geissler of the Industrial
Materials Institute-National Research Council of Canada). The counter electrode was
a platinum wire. Ali potentials were relative to AgiAgCl pseudo-reference electrode
that was calibrated in FcCH20H.
Apparatus. A laser puller (P-2000; Sutter Instrument Company, Novato, CA, USA)
was used to produce the nano- and micro-electrodes. The CVs, SECM images and
42
approach curves were performed using either a biological EIProScan system (HEKA,
Germany)25 or a 100 nm ELPro Scan system (HEKA; model PG 340). Scanning
electron microscopy (SEM) was perforrned in the Institute of Environmental Sciences
of the Université de Québec à Montréal (UQAM, Montreal, Canada) using a
HITACHI S-4300SEIN (VP-SEM) with a voltage of 15 kV using an environmental
secondary electron detector (ESED).
Microelectrode Fabrication. Quartz capillaries were cleaned with a di lute Cl 0%
v/v) nitric acid solution, rinsed with water, and allowed to dry in an oven. The 25 ~m
diameter Pt wire was cleaned with acetone, rinsed with deionized water and
COIll1ected to a 0.2 mm copper wire with silver epoxy before heat curing. In a first
step, the empty quartz capillary is pre-thinned using a single line program (Heat: 600,
Filament: 3, Velocity: 60, Delay: 140, Pull: 0). The Pt assembly is then inserted in the
center of the capillary. Both ends of the capillary are connected to a vacuum pump
via flexible silicone tubes and a Y-connector. During sealing, weak pulling forces on
the glass capillary are avoided using two stoppers that fix the puller bars. Sealing of
the Pt-wire into the quartz capillary was achieved using a single line program (Heat:
540, Filament: 5, Velocity: 60, Delay: 140, Pull: 0), repeated for five cycles. A cycle
consists of 40 s of heating followed by a 20 s cooling period. Following the removal
of the stoppers and silicon tubes, the pulling program (Heat: 780, Filament: 12,
Velocity: 160, Delay: 100, Pull: 200) is applied. The resulting microelectrodes were
polishing with 0.3 and 0.05 ~m diamond lapping film.
43
SECM Procedures. Nano- and micro- electrodes were characterized using steady
state voltammograms in bulk solution by scanning the potential anodically in the 0 to
600 mV range. The feedback approach curves recorded while approaching carbon
and gold pattern array substrates were acquired while the nano- and micro- electrode
was poised at 400 mV. The approach rate to the substrate surface varied, as they were
adapted to the microelectrode diameter. T0 record the SECM image, the
microelectrode, positioned a few micrometers above the gold array, was biased at 400
mV and scanned in an X and Y plan parallel to the substrate at 25 ~m·s·l over a 120
~m x 120 ~m scan area.
Results and discussion
Nanoelectrode fabrication. To produce disk shaped Pt nano- and micro-electrodes
having a small RG and well-defined geometry, we have developed a general
procedure that adds a critical quartz thinning step prior to the application of the Pt
sealing and composite pulling programs, which is followed by a final polishing step.
Reduction of the outer diameter is important for achieving small RG electrodes while
increasing the critica1 mass of quartz sea1ed on the platinum enab1es e10ngation of the
Pt wire to smaller dimensions. Z6 During the thinning program (Figure la), the COz
laser irradiates the middle section of the quartz capillary while a tensile stress is
applied at the capillary extremities by the puller bars. The rate of supplied heat to the
44
capillary per unit time and space is dependent on the isotropie absorption of the IR
emission of the CO2 laser by the quartz. The heat flow rate in the capillary is
,dependent on quartz's thermal conductivity (1.38-2.68 W'm-'X- J), average density
and specifie heat. As the supplied heat propagates through the capillary wall, a
temperature gradient is established that results in viscosity variations of the outer and
inner quartz layers. The outer quartz layer becomes less viscous and more susceptible
to deformation than the internaI, more viscous, one. The tensile stress at the capillary
extremities is directly dependent on the applied force of the puller bars and inversely
proportional to the cross-sectional area of the quartz capillary. As the outer quartz
layers reaches the softening temperature (~J 71 0 oC), the force on the resulting inner
layers will increase, which leads to plastic deformation i. e. elongation of the
capillary. Under the conditions of the qualiz thinning program, the plastic
defonnation of the quartz capillary allows a reduction of the outer diameter of the
capillary that is larger than the inner diameter reduction. (Figure 2). Optimized
thinning is best achieved by controlling the ratio of supplied heat per unit area and
heating time required to defonn the glass under constant force. To produce RG < 10
electrodes with the present quartz capillary, the ratio of the quartz outer diameter to
inner diameter should decrease by a factor of two.
During the sealing program (Figure 1b), the Pt wire is sealed inside the thinned
quartz capillary under vacuum and without the use of a pulling force. This step is
required in order to obtain a homogeneous strain of the Pt-quartz composite during
45
the hard pull that produces the electrodes. The progressive heat gradients, used to
melt the surrounding quartz until intimate contact with the Pt wire, require
comparatively less supplied heat per unit area than that used in the quartz thinning
program. Given the similarity between the melting point of Pt (1772 OC) and the
softening temperature (1710 oC) of quartz, care must be taken not to establish a
temperature gradient where the internai quartz layer temperature wouId reach the Pt
melting point. This results in spheration of the metal wire and produces discontinuous
electrodes. lt is therefore important' to match the thermal properties of the glass and
sealed wire. 23
Even when the temperature is carefully controlled, problems still arise due to thermal
transfer. The higher thermal conductivity of Pt (71.6 Wom-'X- I) as compared to
quartz means that a single contact point of the metal wire with the quartz internai
layer will instantaneously increase the temperature of the metal and dissipate heat
through the length of the wire. To limit this non-uniform heating of the quartz
capillary during sealing, the Pt wire is therefore straightened and connected to a
thicker copper wire with silver epoxy and then inserted into the pre-thinned quartz
capillary, carefully avoiding any contact with the quartz within the heated region.
Finally, to uniformly seal the quartz onto the Pt wire, a vacuum is applied at the
capillary extremities. The established pressure gradient across the quartz capillary
wall, applies an internai stress that leads to cavitation of the quartz ante the Pt wire.
46
At the first point of contact with the wire, the quartz is cooled through the metal wire
heat sink as the neighbouring warmer quartz homogenously wets the wire.
Once sealed, the materials can be treated as a fiber reinforced composite and can be
pulled (Figure 1c) to produce two microelectrodes with diameter values ranging
between 2 flm and 100 nm and an RG less than 10. The distribution of stress and
strain in the co-existing phases is strongly dependent on the geometry of the two
phases, which evolves with the strain. Empirically, it was previously reported 19 that,
when the ratio of the diameters of the Pt wire and the quartz capillary ranges between
0.2 and 0.4, one can pull the quartz tube and platinum wire to dimensions as small as
50 nm. In the present study, the observed ratio of the diameters of platinum/quartz is
~0.2. Under such conditions, the quartz acts as insulator and reinforcing material. Its
thermal properties will dictate the overall viscosity of the system while its mechanical
strength and shear mass will absorb most of the strain. As such, during the pulling
program, the composite is subjected to the highest ratio of supplied heat per unit area.
The heating time is increased to reach a high trip point temperature. This lowers the
viscosity of the composite in order to promote uniform elongation. Following a short
cooling delay, a tensile stress exceeding the yield strength of the molten composite is
applied. On a true stress-strain curve this would correspond to the necking region
where the cross-sectional area of the composite decreases. In this regime, the true
strain is now related to the natural logarithm of the cross-sectional area differential.
Subsequent elongation of the composite material therefore continues until the
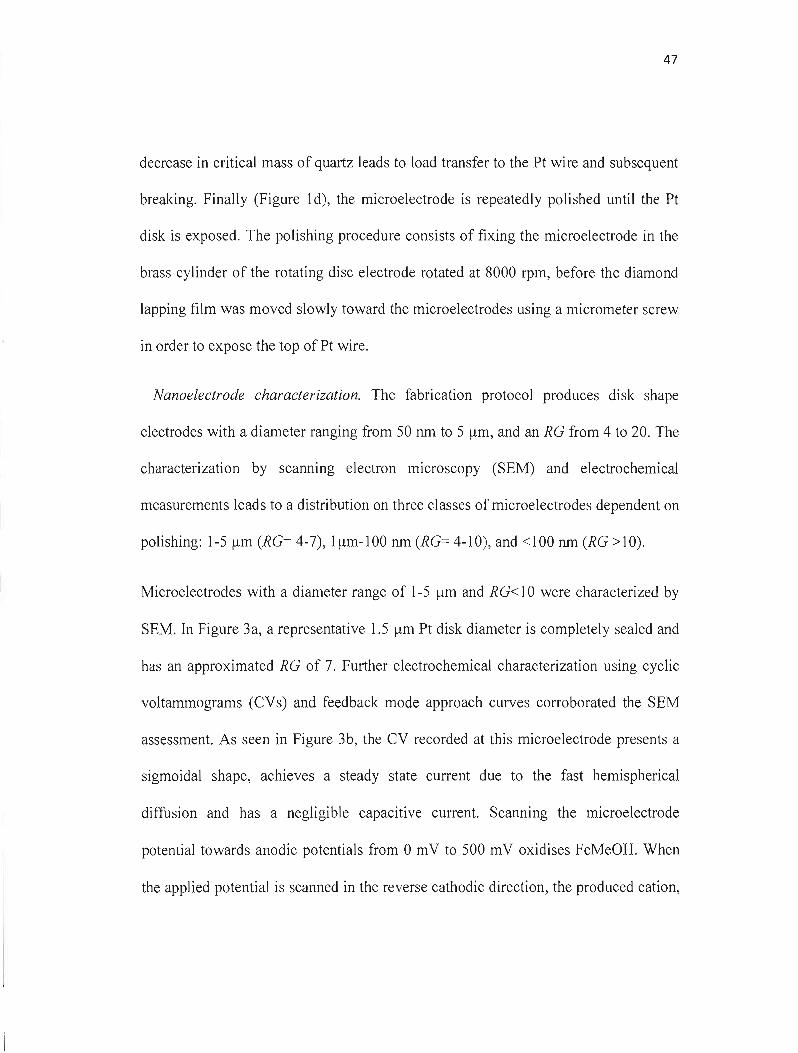
47
decrease in critical mass of quartz leads to load transfer to the Pt wire and subsequent
breaking. Finally (Figure 1d), the microelectrode is repeatedly polished until the Pt
disk is exposed. The polishing procedure consists of fixing the microelectrode in the
brass cylinder of the rotating disc electrode rotated at 8000 rpm, before the diamond
lapping film was moved slowly toward the microelectrodes using a micrometer screw
in order to expose the top of Pt wire.
Nanoelectrode characterization. The fabrication protocol produces disk shape
electrodes with a diameter ranging from 50 nm to 5 ~m, and an RG from 4 to 20. The
characterization by scanning electron microscopy (SEM) and electrochemical
measurements leads to a distribution on three classes of microelectrodes dependent on
polishing: 1-5 ~m (RG= 4-7), 1~m-1 00 nm (RG= 4-10), and <100 nm (RG >10).
Microelectrodes with a diameter range of 1-5 ~m and RG< 10 were characterized by
SEM. In Figure 3a, a representative 1.5 ~m Pt disk diameter is completely sealed and
has an approximated RG of 7. Further electrochemical characterization using cyclic
voltammograms (CVs) and feedback mode approach curves corroborated the SEM
assessment. As seen in Figure 3b, the CV recorded at this microelectrode presents a
sigmoidal shape, achieves a steady state current due to the fast hemispherical
diffusion and has a negligible capacitive current. Scanning the microelectrode
potential towards anodic potentials from 0 mV to 500 mV oxidises FcMeOH. When
the applied potential is scarmed in the reverse cathodic direction, the produced cation,
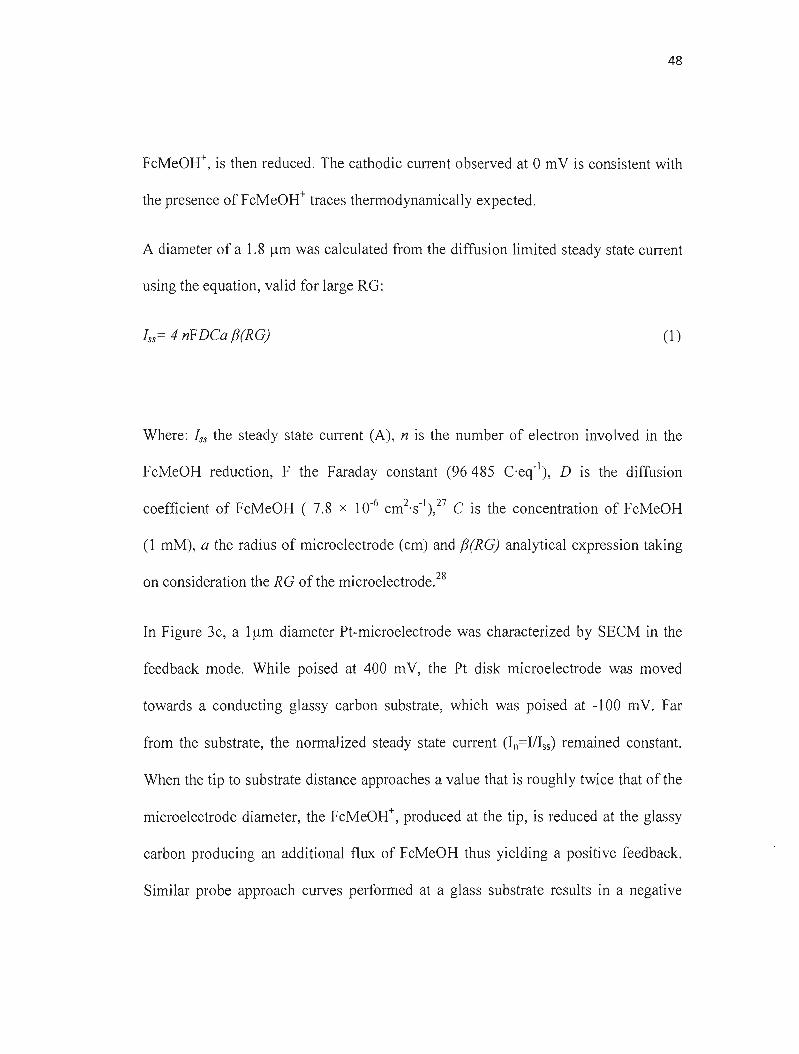
48
FcMeOH+, is then reduced. The cathodic CUITent observed at 0 mV is consistent with
the presence of FcMeOH+ traces thermodynamically expected.
A diameter of a 1.8 ~m was calculated from the diffusion limited steady state CUITent
using the equation, valid for large RG:
Iss = 4 nFDCa j3(RG) (1)
Where: Iss the steady state CUITent (A), n is the number of electron involved in the
FcMeOH reduction, F the Faraday constant (96485 Ceq-\ D is the diffusion
coefficient of FcMeOH ( 7.8 x 10⁻⁶ cm2's- I),27 C is the concentration of FcMeOH
(l mM), a the radius of microelectrode (cm) and j3(RG) analytical expression taking
on consideration the RG of the microelectrode.28
In Figure 3c, a 1~m diameter Pt-microelectrode was characterized by SECM in the
feedback mode. While poised at 400 mV, the Pt disk microelectrode was moved
towards a conducting glassy carbon substrate, which was poised at -100 mV. Far
from the substrate, the normalized steady state current (ln=I/Iss) remained constant.
When the tip to substrate distance approaches a value that is roughly twice that of the
microelectrode diameter, the FcMeOH+, produced at the tip, is reduced at the glassy
carbon producing an additional flux of FcMeOH thus yielding a positive feedback.
Similar probe approach curves performed at a glass substrate results in a negative
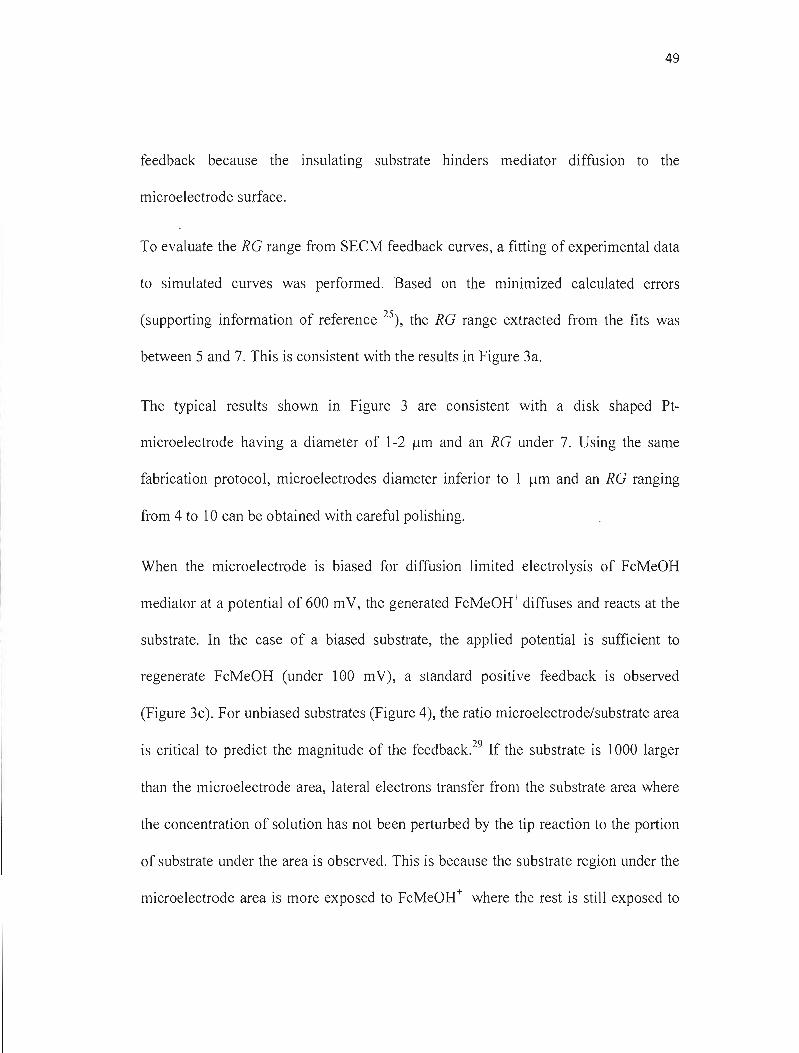
49
feedback because the insulating substrate hinders mediator diffusion to the
microelectrode surface.
To evaluate the RG range from SECM feedback curves, a fitting of experimental data
to simulated curves was performed. Based on the minimized calculated errors
(supporting information of reference 25), the RG range extracted from the fits was
between 5 and 7. This is consistent with the results in Figure 3a.
The typical results shown in Figure 3 are consistent with a disk shaped Pt
microelectrode having a diameter of 1-2 ~m and an RG under 7. Using the same
fabrication protocol, microelectrodes diameter inferior to 1 ~m and an RG ranging
from 4 to 10 can be obtained with careful polishing.
When the microelectrode is biased for diffusion limited electrolysis of FcMeOH
mediator at a potential of 600 mV, the generated FcMeOH+ diffuses and reacts at the
substrate. In the case of a biased substrate, the applied potential is sufficient to
regenerate FcMeOH (under 100 mV), a standard positive feedback is observed
(Figure 3c). For unbiased substrates (Figure 4), the ratio microelectrode/substrate area
is critical to predict the magnitude of the feedback. 29 If the substrate is 1000 larger
than the microelectrode area, lateral electrons transfer from the substrate area where
the concentration of solution has not been perturbed by the tip reaction to the portion
of substrate under the area is observed. This is because the substrate region under the
microelectrode area is more exposed to FcMeOH+ where the rest is still exposed to
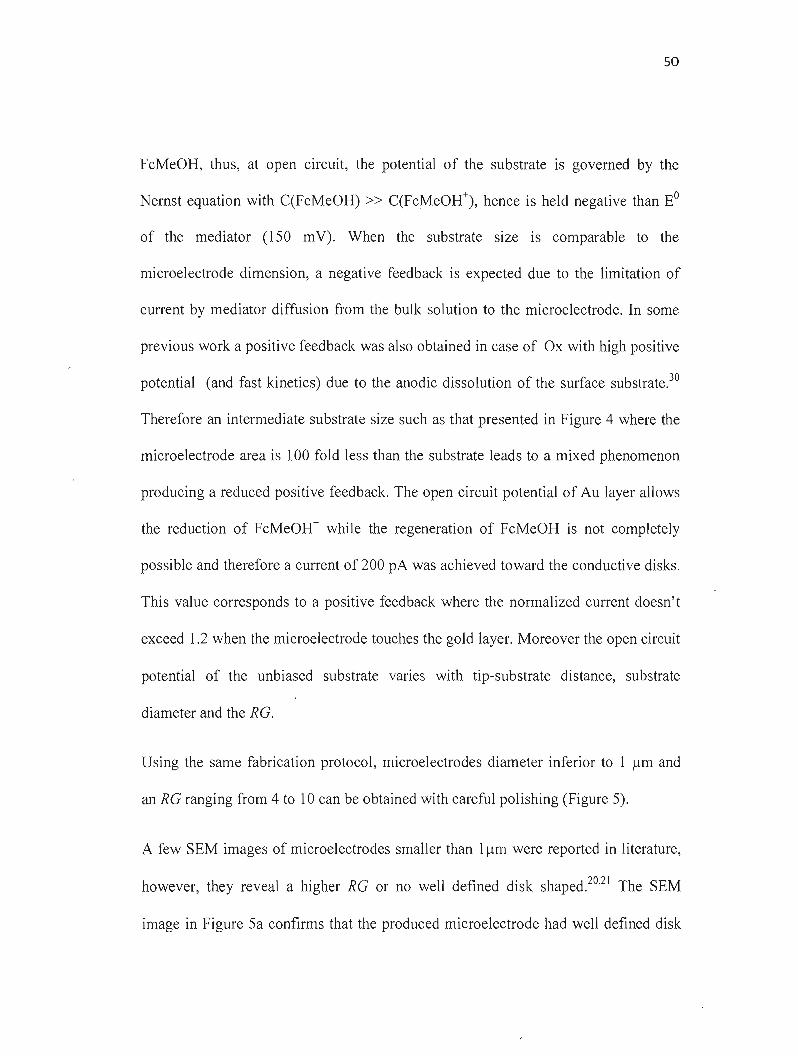
50
FcMeOH, thus, at open circuit, the potential of the substrate is governed by the
Nernst equation with C(FcMeOH) » C(FcMeOH+), hence is held negative than EO
of the mediator (ISO mV). When the substrate size is comparable to the
microelectrode dimension, a negative feedback is expected due to the limitation of
CUlTent by mediator diffusion from the bulk solution to the microelectrode. In sorne
previous work a positive feedback was also obtained in case of Ox with high positive
potential (and fast kinetics) due to the anodic dissolution of the surface substrate?O
Therefore an intermediate substrate size such as that presented in Figure 4 where the
microelectrode area is 100 fold less than the substrate leads to a mixed phenomenon
producing a reduced positive feedback. The open circuit potential of Au layer allows
the reduction of FcMeOH+ while the regeneration of FcMeOH is not completely
possible and therefore a CUITent of 200 pA was achieved toward the conductive disks.
This value corresponds to a positive feedback where the normalized CUITent doesn't
exceed 1.2 when the microelectrode touches the gold layer. Moreover the open circuit
potential of the unbiased substrate varies with tip-substrate distance, substrate
diameter and the RG.
Using the same fabrication protocol, microelectrodes diameter inferior to 1 /lm and
an RG ranging from 4 to 10 can be obtained with careful polishing (Figure S).
A few SEM images of microelectrodes smaller than l/lm were reported in literature,
however, they reveal a higher RG or no weB defined disk shaped.20,21 The SEM
image in Figure Sa confirms that the produced microelectrode had weB defined disk
51
geometry where the Pt disk is centered in the quartz capillary. The Pt diameter is
approx. 100 nm and the RG is about 10. The lack of planarity observed is
representative of the challenges attributed to the polishing step (Figure 1d), thus, the
perpendicular a1ignment of the microelectrode in the axis of the rotating electrode is
very critical in ensuring a uniform polishing and in removing any undesirable
vibration when po1ishing. To ensure a clear disk shape and an RG less than 10, the
microelectrodes diameter inferior to 100 nm requires more care on the polishing step.
As seen in Figure Sb, the CV recorded at this microelectrode presents a sigmoidal
shape and has a negligible capacitive current. The observed cathodic current fromm
-100 mV to 100 mV is due to the presence of sorne FcMeOH in equilibrium with
FcMeOH+. Based on the recorded CV and eq 1, a diameter of 32 nm Pt-disk
microelectrodes was calculated.
Conclusion
The production of disk shaped Pt-UME using a laser puller is described in detail. The
different steps for preparing the UMEs were optimized using optical microscopy.
With a thinning step diameter ranging from 50 nm to 5 /lm, and an RG from 4 to 20
were obtained. The SEM images and the voltammograms obtained reveal disk shaped
electrodes with a distribution on three classes of microelectrodes dependent on
polishing: 1-5 /lm (RG== 4-7), 1/lm-100 nm (RG== 4-10), and <100 nm (RG >10).
Finally, an example of SECM imaging was obtained using a gold disk pattern. Future
work will be focused on the application of these nanoelectrodes for high-resolution
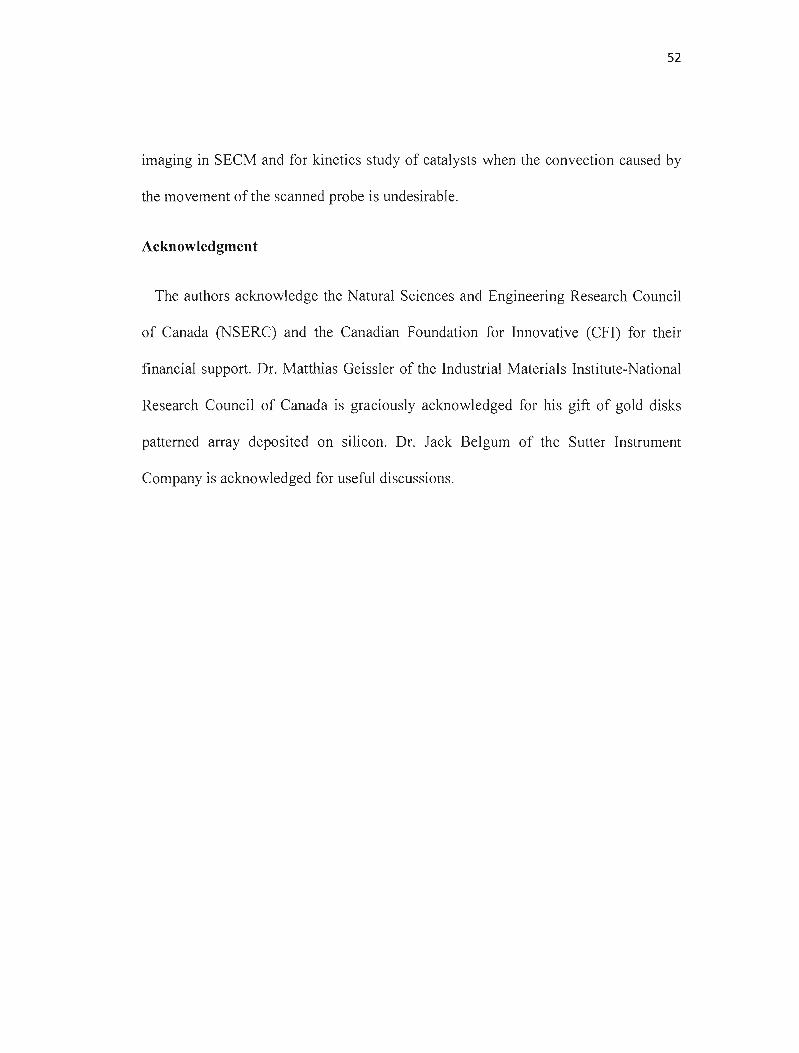
52
imaging in SECM and for kinetics study of catalysts when the convection caused by
the movement of the scanned probe is undesirable.
Acknowledgment
The authors acknowledge the Natural Sciences and Engineering Research Council
of Canada (NSERC) and the Canadian Foundation for Innovative (CFI) for their
financial support. Dr. Matthias Geissler of the Industrial Materials Institute-National
Research Council of Canada is graciously acknowledged for his gift of gold disks
pattemed array deposited on silicon. Dr. Jack Belgum of the Sutter Instrument
Company is acknowledged for useful discussions.
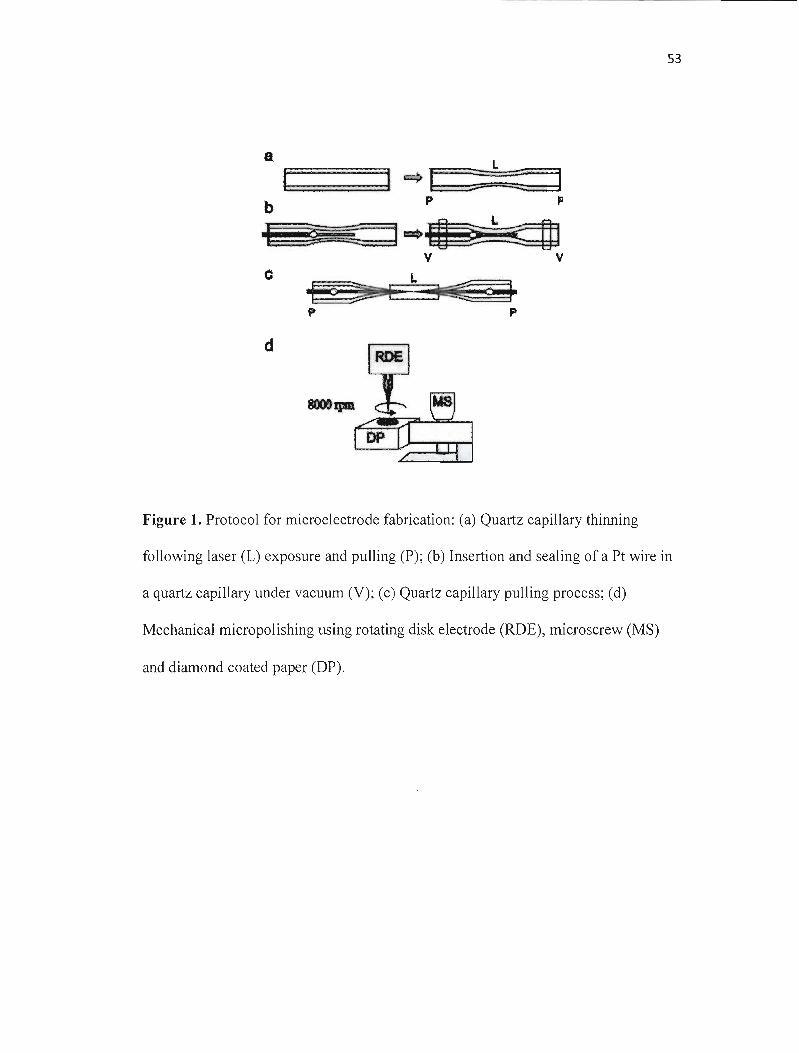
53
a L
1=·===1 ~l .:c:c::d p p
~._~ v v
c €:-.~iiiiIIIIIP
d
Figure 1. Protocol for microelectrode fabrication: (a) Quartz capillary thiIming
following laser (L) exposure and pulling (P); (b) Insertion and sealing of a Pt wire in
a quartz capillary under vacuum (V); (c) Quartz capillary pulling process; (d)
Mechanical micropolishing using rotating disk electrode (ROE), microscrew (MS)
and diamond coated paper (OP).
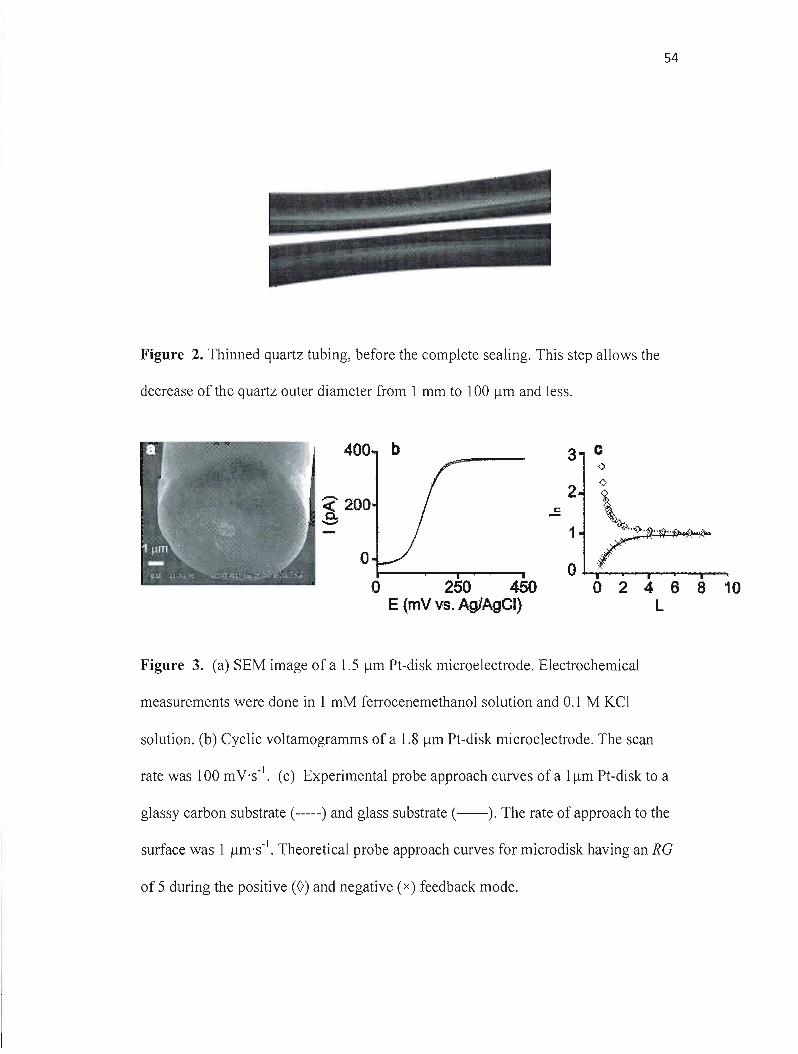
54
Figure 2. Thinned quartz tubing, before the complete sealing. This step allows the
decrease of the quartz outer diameter from 1 mm to 100 /lm and less.
400 3 c <)
<' 200 S
o
..5
2
1
0
0
'~
;>o 250 450 0 2 4 6 8 10
E (mV vs. Ag/Agel) L
Figure 3. (a) SEM image of a 1.5 /lm Pt-disk microelectrode. Electrochemical
measurements were done in 1 mM ferrocenemethanol solution and 0.1 M KCl
solution. (b) Cyclic voltamogramms of a 1.8 /lm Pt-disk microelectrode. The scan
rate was 100 mV·s". (c) Experimental probe approach curves ofa l/lm Pt-disk to a
glassy carbon substrate (-----) and glass substrate (--). The rate of approach to the
surface was 1 /lm·s' I . Theoretical probe approach curves for microdisk having an RG
of 5 during the positive (0) and negative (x) feedback mode.
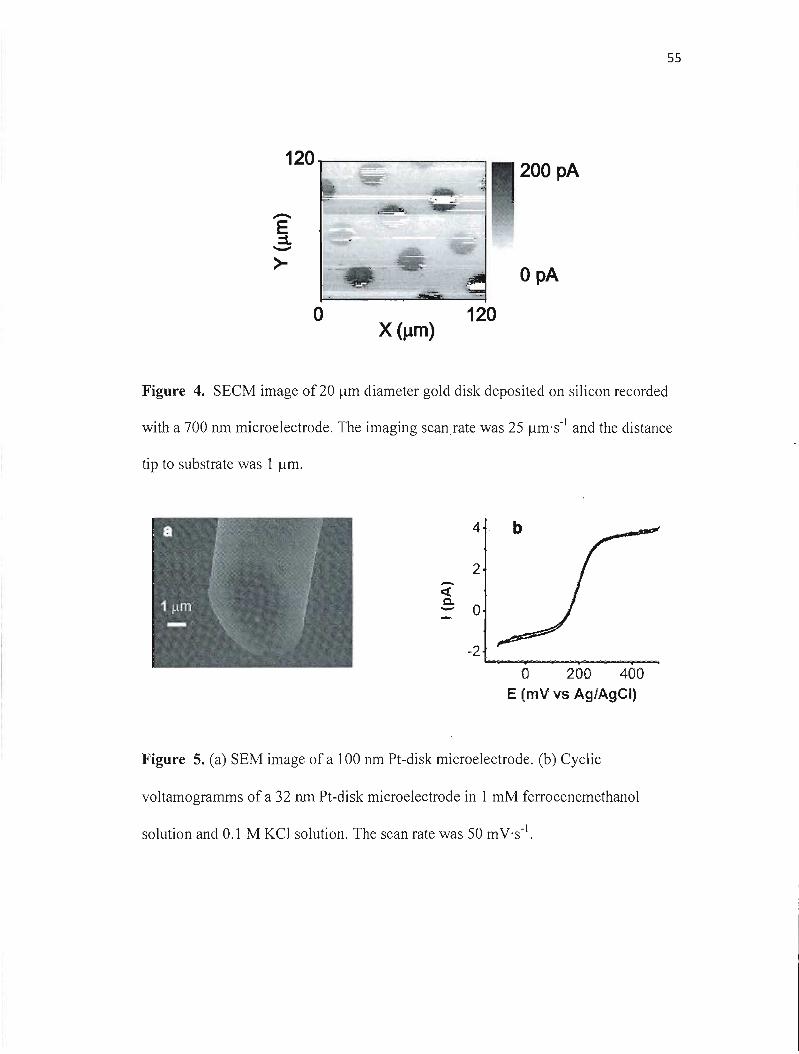
55
120,------;-----, 200 pA
-E ~->- OpA
o 120 X (J-lm)
Figure 4. SECM image of 20 flm diameter gold disk deposited on silicon recorded
with a 700 nm microelectrode. The imaging scanrate was 25 flm's-I and the distance
tip to substrate was 1 flm.
o 200 400 E (mV vs Ag/Agel)
Figure 5. (a) SEM image ofa 100 nm Pt-disk microelectrode. (b) Cyclic
voltamogramms of a 32 nm Pt-disk microelectrode in 1 mM ferrocenemethanol
solution and 0.1 M KCl solution. The scan rate was 50 mY·s-l.
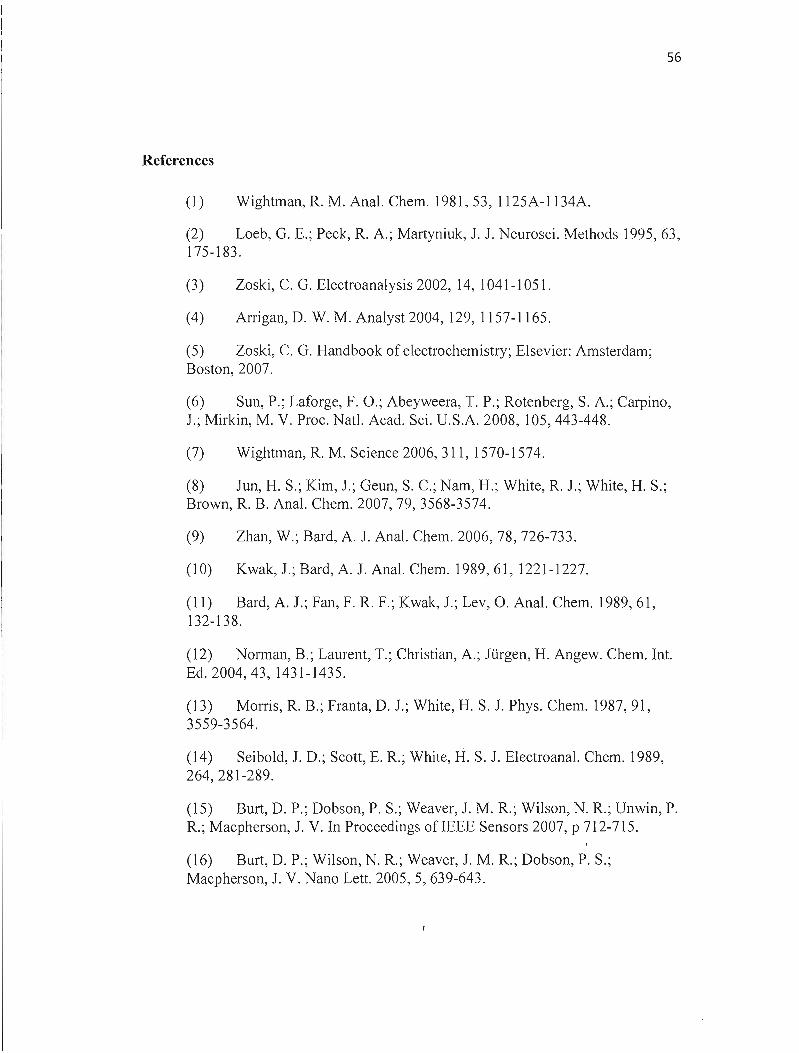
56
References
(1) Wightman, R. M. Anal. Chem. 1981,53, 1125A-1134A.
(2) Loeb, G. E.; Peck, R. A.; Martyniuk, 1. 1. Neurosci. Methods 1995, 63, 175-183.
(3) Zoski, C. G. Electroanalysis 2002,14,1041-1051.
(4) Arrigan, D. W. M. Analyst 2004,129,1157-1165.
(5) Zoski, C. G. Handbook of electrochemistry; Elsevier: Amsterdam; Boston, 2007.
(6) Sun, P.; Laforge, F. O.; Abeyweera, T. P.; Rotenberg, S. A.; Carpino, J.; Mirkin, M. V. Proc. Natl. Acad. Sei. U.S.A. 2008, 105,443-448.
(7) Wightman, R. M. Science 2006, 311, 1570-1574.
(8) Jun, H. S.; Kim, 1.; Geun, S. c.; Nam, H.; White, R. 1.; White, H. S.; Brown, R. B. Anal. Chem. 2007, 79, 3568-3574.
(9) Zhan, W.; Bard, A. 1. Anal. Chem. 2006, 78, 726-733.
(10) Kwak, J.; Bard, A. J. Anal. Chem. 1989,61,1221-1227.
(11) Bard, A. 1.; Fan, F. R. F.; Kwak, 1.; Lev, O. Anal. Chem. 1989,61, 132-138.
(12) Norman, B.; Laurent, T.; Christian, A.; Jürgen, H. Angew. Chem. Int. Ed. 2004,43,1431-1435.
(13) Morris, R. B.; Franta, D. 1.; White, H. S. 1. Phys. Chem. 1987,91, 3559-3564.
(14) Seibold,1. D.; Scott, E. R.; White, H. S. J. Electroanal. Chem. 1989, 264, 281-289.
(15) Burt, D. P.; Dobson, P. S.; Weaver, 1. M. R.; Wilson, N. R.; Unwin, P. R.; Macpherson, 1. V. In Proceedings of IEEE Sensors 2007, P 712-715.
(16) Burt, D. P.; Wilson, N. R.; Weaver, 1. M. R.; Dobson, P. S.; Macpherson, 1. V. Nano Lett. 2005, 5,639-643.
57
(17) Campbell, J. K.; Sun, L.; Craoks, R. M. 1. Am. Chem. Soc. 1999, 121, 3779-3780.
(18) Pendley, B. D.; Abruna, H. D. Anal. Chem. 1990,62, 782-784.
(19) Fish, G.; Bouevitch, O.; Kokotov, S.; Lieberman, K.; Palanker, D.; Turovets, 1.; Lewis, A. Rev. Sei. Instrum. 1995,66, 3300-3306.
(20) Shao, Y; Mirkin, M. V.; Fish, G.; Kokotov, S.; Palanker, D.; Lewis, A. Anal. Chem 1997,69,1627-1634.
(21) Katemann, B. B.; Schuhmann, W. Electroanalysis 2002,14,22-28.
(22) Sun, P.; Mirkin, M. V. Anal. Chem. 2006, 78, 6526-6534.
(23) Mauzeroll, 1.; LeSuer, R. 1. In Handbook of Electrochemistry; Zosky, C. G., Ed.; Elsevier: Oxford, 2007, p 199-211.
(24) Zhang, B.; Galusha, 1.; Shiozawa, P. G.; Wang, G.; Bergren, A. 1.; Jones, R. M.; White, R. 1.; Ervin, E. N.; Cauley, C. C.; White, H. S. Anal. Chem. 2007, 79, 4778-4787.
(25) Cougnon, C.; Bauer-Espindola, K.; Fabre, D. S.; Mauzeroll, 1. Anal. Chem. 2009, 81, 3654-3659.
(26) Li, Y; Bergman, D.; Zhang, B. Anal. Chem. 2009, 81, 5496-5502.
(27) Miao, W.; Ding, Z.; Bard, A. 1. 1. Phys. Chem. B 2002,106,13921398.
(28) Lefrou, C. 1. Electroanal. Chem. 2007, 60 l, 94-100.
(29) Whitworth, A. L.; Mandler, D.; Unwin, P. R. PCCP. 2005, 7, 356-365.
(30) Macpherson,1. V.; Unwin, P. R. 1. Phys. Chem. 1996,100,1947519483.

58
ANNEXE B
59
Detection of Hydrogen Peroxide
Produced during the Oxygen Reduction
Reaction at Self- Assembled Thiol-
Porphyrin Monolayers on Gold using
SECM and Nanoelectrodes.
Mohamed A. Mezour, Renaud Cornut, Emad Mohamed Hussien, Mario Morin, Janine Mauzeroll*
Laboratory for Electrochemical Reactive Imaging and Detection for Biological
Systems, Department of Chemistry, NanoQAM Research Centre, Université du
Québec à Montréal, C.P. 8888, Suce. Centre-ville, Montréal, QC, Canada, H3C 3P8.
*Correspondenee should be addressed to: Professor Janine Mauzeroll, Université du
Québec à Montréal, C.P. 8888, Suce. Centre-ville, Montréal, QC, Canada, H3C 3P8,
Phone: 514-987-3000 ext. 0895, Fax: 514-987-4054
Email: [email protected]
60
TITLE RUNNING HEAD
Hydrogen Peroxide Produced at Self- Assembled Thiol-Porphyrin Monolayers on
Gold using SECM
ABSTRACT
Porphyrin molecules were immobilized on polycrystalline gold and glassy carbon
by coordinating cobalt (II) 5,lO,15,20-tetraphenyl-21H,23H-porphine to 4
aminothiophenol self-assembled monolayer. The resulting electrocatalytic activity of
the metalloporphyrins-modified substrates with regards to the oxygen reduction
reaction were characterized by means of cyclic voltammetry and scanning
electrochemical microscopy (SECM) using nanoelectrodes of well-defined geometry.
From substrate generation tip collection (SG-TC) mode SECM measurements
performed under steady-state conditions and at different applied substrate potential, it
is possible to extract kinetic information relevant to electrocatalyst substrates such as
metalloporphyrin modified gold and glassy-carbon electrodes. Such an approach
allows for isolation of the unique contribution of the electrocatalyst to the oxygen
reduction reaction and peroxide formation.
61
KEYWORDS
Sca1U1ing Electrochemical Microscopy; Nanoelectrode; Metalloporphyrin; Thiol
Monolayers on Gold; Oxygen Reduction Reaction.
INTRODUCTION
Metalloporphyrins are k4-N,N,N,N transition metals complexes that are known to
catalyze several redox reactions including the oxygen reduction reaction (ORR). In
such Nrchelates, molecular oxygen binds reversibly to the central metal ion and is
reduced through at least one two-electron transfer. There have been continuous
efforts towards the preparation of solid films of porphyrins because of their use as
3models for electron transfer and electrocatalysis reactions. 1- Langmuir-Blodgett4,5,
. . 7 . 9dip-coating6
, spm-coatmg , electropolymerization8, thermoevaporatlOn ,
electrodeposition lO , and self-assembled monolayers (SAMs)11 are examples of the
many techniques used to fabricate porphyrin films on solid substrates. Among them,
the self-assembled monolayer approach has a competitive advantage since it yields
ultrathin solid films with well-controlled structures and superior thermal and
mechanical stability. 5
In order to immobilize porphyrin molecules on a surface, 4-aminothiophenol (4
ATP) SAM on solid supports were formed followed by axial coordination of the
aromatic amino group to cobalt (II) 5,10,1 5,20-tetraphenyl-2 1H,23H-porphine. Such
surface modification has been attempted on both glassy carbon and gold
62
macroelectrodes. The use of glassy carbon as a solid support surfaces is not as
frequently used because the exact attachment mechanism to the carbon surface
remains ill-defined and this method generally produces films with large
heterogeneities. 12-
14 On the contrary, gold substrates are commonly used and STM
experiments have provided direct evidence that a complete monolayer of 4-ATP on
Au can be formed. 15 The complete self-assembly process produces a stable, highly
ordered, conducting film, where the porphyrins are parallel to the gold surface. Il The
porphyrin is generally oriented parallel to the surface, due to the densely packed 4
ATP monolayer onto which the CoTPP is adsorbed. 11 Furthermore, a concentration of
4.86x 10- 11 mol'cm-2 for CoTPP fixed on self assembled 4-mercaptopyridine on gold
was obtained. 16 It was also shown that the reduction of O2 by this catalyst involves a
two-electron mechanism and that hydrogen peroxide is produced. IO,17,18
Even in well-ordered systems such as SAMs, surface heterogeneities may lead to
local variation of surface coverage. For that reason, conventional electrochemical
measurements based on the measure of substrate CUITent may not uniquely isolate the
contribution of the attached-to-substrate specie. In this context, Scanning
Electrochemical Microscopy (SECM) is an interesting option, as it allows local
characterization of substrate's reactivity. SECM is being used in an increasing
number of applications for the study of different electrocatalytic processes, such as
ORR, methanol interference during ORR, and oxygen evolution. 19 In particular,
SECM has been used to study H20 2 production during the ORR. H20 2 formation
during the ORR is generally undesirable because it lowers the efficiency of the
63
material and can lead to electrocatalyst COlTosion. As such, the preferred reaction for
practical application is direct reduction of oxygen to water. However, this involves
four electrons, four protons and molecular oxygen bond c1eavage, and is thus unlikely
to proceed in a single elementary step. H20 2 is therefore consistently present in low
pH ORR either as a reaction byproduct or as an intermediate, depending on the
electrocatalytic material employed. In literature, the H20 2 generation from
electrocatalysts has been studied locally using different SECM approaches. In many
enzymatic studies H20 2 detection using SECM was done in SG-TC as reported by
Horrocks et al 20, Wittstock21 ,22 et al and Denuault et al. 23
In the steady-state SG-TC method, the substrate material was a microelectrode
undergoing the ORR and the tip detected H202 by its oxidation. 19 In later studies, the
same method was extended in order to quantify H20 2 generation during the ORR in
acidic solution for several different electrocatalysts. Another useful approach,
developed by the Wittstock group24, relied on a transient SG-TC mode of SECM to
detect H20 2 during the ORR at macroscopic electrodes. Importantly, this study was
successful in evaluating the kinetic constants of the underlying catalyst spot by
comparing oxidation current at microelectrode obtained through a pulse sequence
experiment, at short electrolysis times, to the H20 2 concentration profiles calculated
from an analytical expression.
The redox competition mode of scanning electrochemical microscopy (RC-SECM)
was used to visualize the local electrocatalytic activity of metalloporphyrin spots
towards ORR. IO This approach was developed25 in order to overcome a significant
64
drawback of the tip generation-substrate collection (TG-SC) SECM mode, whereby
the background current observed at large substrate distances prevented acquisition of
high resolution SECM imaging?6
All of the above SECM approaches use 25 j..lm diameter microelectrodes. The use of
such probes can render kinetic constants extraction difficult at short tip to substrate
distances, given their large overall dimensions (75-250 j..lm diameters) that can trap
and/or regenerate diffusing species from the catalyst layer. Herein, we propose that
the use of nanoelectrodes in a SG-TC SECM would be advantageous when studying
self-assembled catalysts on gold because they do not disturb significantly the
diffusion layer of the substrate, and the feedback between the tip and substrate can be
neglected. As illustrated in the theoretical section, these two advantages are in fact
requisites if one would like to easily extract catalyst kinetics based on SECM line
scans performed at close tip to substrate distances.
In the present study SG-TC measurements have been performed with
nanoelectrodes. For long electrolysis times, the concentration profiles are stationary
and similar to that of a Nernst-layer, even in the absence of forced convection, as
extensively discussed in literature. 27,28 As illustrated in the theoretical section, this
study enables sorne kinetic quantification across the surface of a catalyst. The
proposed method thus allows differentiation between catalyst regions homogeneously
modified from mixed response regions where both catalyst and underlying gold
contribute to the measured signal.
65
EXPERIMENTAL SECTION
Materials and Reagents. Electrochemical measurements were performed in
nanopure water solutions, purified with a Millipore Milli-Q Biocel Ultrapure water
system (Fisher, Ottawa, ON), ferrocenemethanol (FcCH20H) (97%, Aldrich, Canada)
and potassium chloride (KCl) or 0.5 M sulfuric acid (H2S04) (Fisherbrand, Canada).
Electrochemical solutions were oxygenated for 10 min with oxygen (Praxair oxygen,
Canada) prior to each measurement giving a concentration of 1.2 mM at ambient
temperature and pressure. The 5,10,15 ,20-tetraphenyl-21 H,23H-porphine cobalt (II)
(Co-TPP) and the 4-aminothiophenol 97% (4-ATP) were purchased from Sigma.
Electrode fabrication materials used were 25 flm diameter Pt-wire (purity 99.9%;
hard) (Goodfellow, USA), quartz capillaries (L: 150 mm, O.D.: 1 mm, I.D.: 0.3 mm)
(Sutter Instrument, USA), electrically conductive silver epoxy (EPO-TEK® H20E)
(Epoxy Technology Inc, Canada) and standard copper connection wires (O.D. < 0.3
mm). Polishing materials (Buehler, Canada) used were abrasive discs (800, 1200
grit) , diamond lapping film discs (1, 0.3, 0.05 flm diamond size) and alumina
suspensions (1, 0.3, 0.05 flm partic1e diameter).
Electrochemical Cel!. The substrates used in the approach curve and the SECM
image were 3 mm, 2 mm diameter gold electrodes and a 3 mm diameter glassy
66
carbon electrode (Bioanalytical Systems Inc, Canada). The counter electrode was a
platinum wire. All potentials were relative to AgIAgCI (3M NaCI) pseudo-reference
electrode that was calibrated in FcCH20H.
Apparatus. A laser puller (P-2000; Sutter Instrument Company, Novato, CA, USA)
was used to produce the nanoelectrodes. The CYs, SECM images and approach
curves were perfonned using either a biological EIProScan system (HEKA,
Germany)29 or a 100 nm ELPro Scan system (HEKA; model PG 340).
Nanoelectrode Fabrication. Many laboratories achieved development of
reproducible procedure for fabrication of Pt disk nanoelectrodes using laser
36pullers.30- In our protocol, an additional thinning step was added to better control
the resulting RG ratio of the nanoelectrodes.
Quartz capillaries were cleaned with a di1ute (l0% v/v) nitric acid solution, rinsed
with water, and allowed to dry in an oven. The 25 !lm diameter Pt wire was cleaned
with acetone, rinsed with deionized water and connected to a 0.2 mm copper wire
with silver epoxy before heat curing. In a first step, the empty quartz capillary is pre
thinned using a.single line program (Heat: 600, Filament: 3, Yelocity: 60, Delay: 140,
Pull: 0). The Pt assembly is then inserted in the center of the capillary. Both ends of
the capillary are connected to a vacuum pump via flexible silicone tubes and a Y
connector. During sealing, weak pulling forces on the glass capillary are avoided
using two stoppers that fix the puller bars. Sealing of the Pt-wire into the quartz
67
capillary was achieved using a single line program (Heat: 540, Filament: 5, Velocity:
60, Delay: 140, Pull: 0), repeated for five cycles. A cycle consists of 40 s of heating
followed by a 20 s cooling period. Following the removal of the stoppers and silicon
tubes, the pulling program (Heat: 780, Filament: 12, Velocity: 160, Delay: 100, Pull:
200) is applied. The resulting microelectrodes were polishing with 0.3 and 0.05 f.!m
diamond lapping film. The polishing procedure consists of fixing the microelectrode
in the brass cylinder of the rotating disc electrode rotated at 8000 rpm, before the
diamond lapping fdm was moved slowly toward the microelectrodes using a
micrometer screw in order to expose the top of Pt wire.33
Metalloporphyrin-Modified Substrales. A gold electrode and a GC electrode
(Bioanalytical Systems Ine., Canada) were polished on a microcloth (Buehler,
Canada) in combination with 1 and then 0.3 f.!m alumina slurries (Buehler, Canada).
Both electrodes were rinsed with deionized water in the ultrasonic bath for 10 min.
The GC electrode was electrochemically oxidized by cycling the potential 15 times
between -0.45 and 1.85V vs Ag/AgCl (3M NaCl) at 100mVs-',37 before
modification with the catalyst. In case of the Au electrode, the porphyrin modification
was performed after the polishing procedure. The porphyrin modification process
consists in immersing the electrodes in a 10 mM ethanol solution of 4-ATP for 2 h,
rinsing, and then, immersing in a chloroform solution containing 1 mM of CoTPP for
18 h.'2
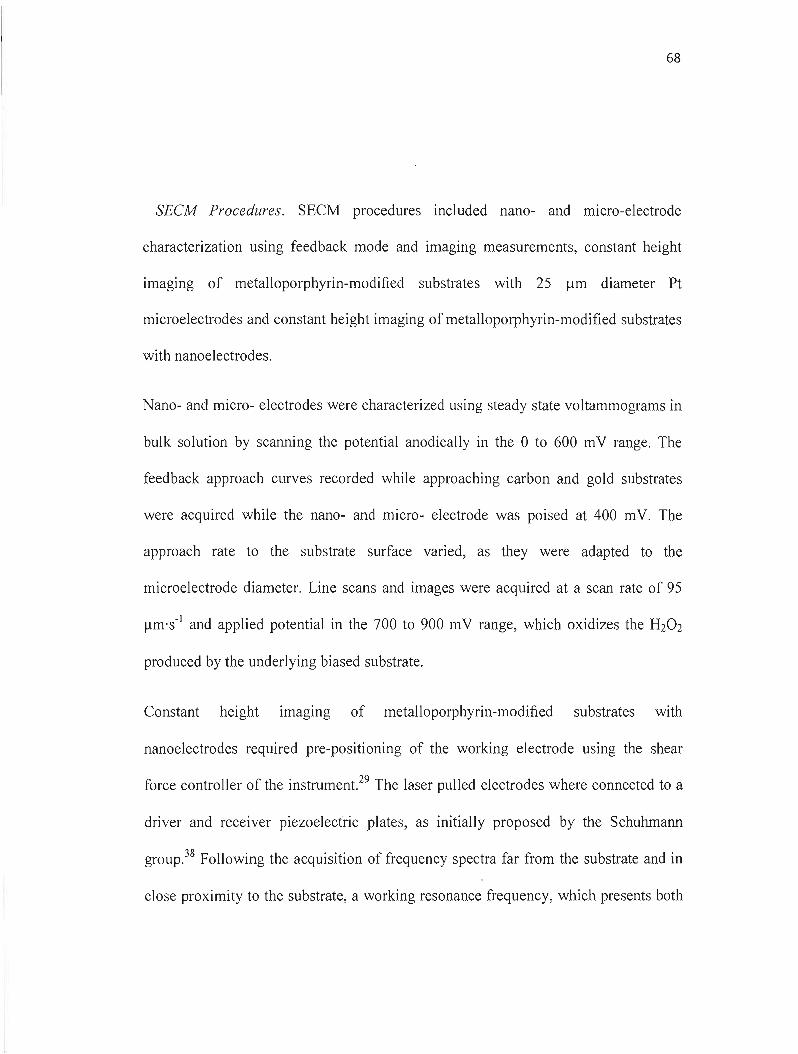
68
SECM Procedures. SECM procedures included nano- and micro-electrode
characterization using feedback mode and imaging measurements, constant height
imaging of metalloporphyrin-modified substrates with 25 ~m diameter Pt
microelectrodes and constant height imaging of metalloporphyrin-modified substrates
with nanoelectrodes.
Nano- and micro- electrodes were characterized using steady state voltammograms in
bulk solution by scanning the potential anodically in the 0 to 600 mV range. The
feedback approach curves recorded while approaching carbon and gold substrates
were acquired while the nano- and micro- electrode was poised at 400 mV. The
approach rate to the substrate surface varied, as they were adapted to the
microelectrode diameter. Line scans and images were acquired at a scan rate of 95
/lm's- I and applied potential in the 700 to 900 mV range, which oxidizes the H20 2
produced by the underlying biased substrate.
Constant height Imagmg of metalloporphyrin-modified substrates with
nanoelectrodes required pre-positioning of the working electrode usmg the shear
force controller of the instrument,29 The laser pulled electrodes where connected to a
driver and receiver piezoelectric plates, as initially proposed by the Schuhmann
group.38 Following the acquisition of frequency spectra far from the substrate and in
close proximity to the substrate, a working resonance frequency, which presents both
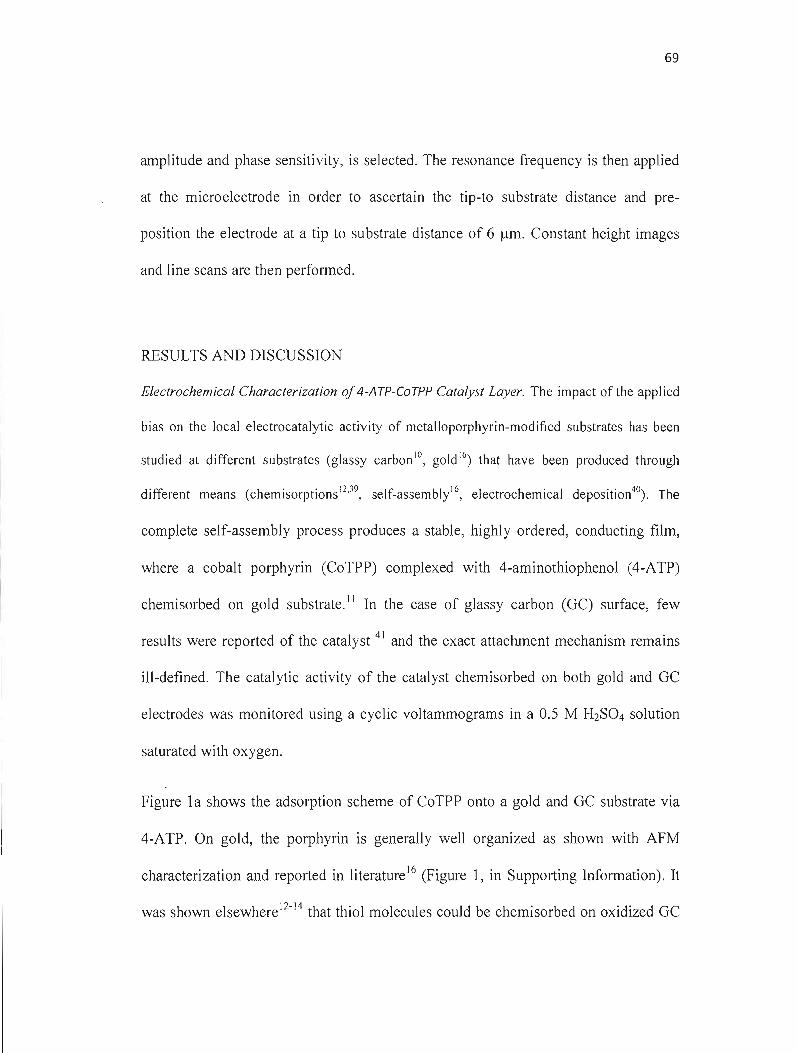
69
amplitude and phase sensitivity, is selected. The resonance frequency is then applied
at the microelectrode in order to ascertain the tip-to substrate distance and pre
position the electrode at a tip to substrate distance of 6 ~m. Constant height images
and line scans are then performed.
RESULTS AND DISCUSSION
Electrochemical Characterization of4-ATP-CoTPP Catalyst Layer. The impact of the applied
bias on the local electrocatalytic activity of metalloporphyrin-modified substrates has been
stud ied at different substrates (glassy carbon 10, gold 16) that have been produced through
different means (chemisorptions I2,39, self-assembl/6, electrochemical deposition40
). The
complete self-assembly process produces a stable, highly ordered, conducting film,
where a cobalt porphyrin (CoTPP) complexed with 4-aminothiophenol (4-ATP)
chemisorbed on gold substrate. " In the case of glassy carbon (GC) surface, few
results were reported of the catalyst 41 and the exact attachment mechanism remains
ill-defined. The catalytic activity of the catalyst chemisorbed on both gold and GC
electrodes was monitored using a cyclic voltammograms in a 0.5 M H2S04 solution
saturated with oxygen.
Figure la shows the adsorption scheme of CoTPP onto a gold and GC substrate via
4-ATP. On gold, the porphyrin is generally weil organized as shown with AFM
characterization and reported in literature l6 (Figure 1, in Supporting Information). It
was shown elsewhere l2-
14 that thiol molecules could be chemisorbed on oxidized GC
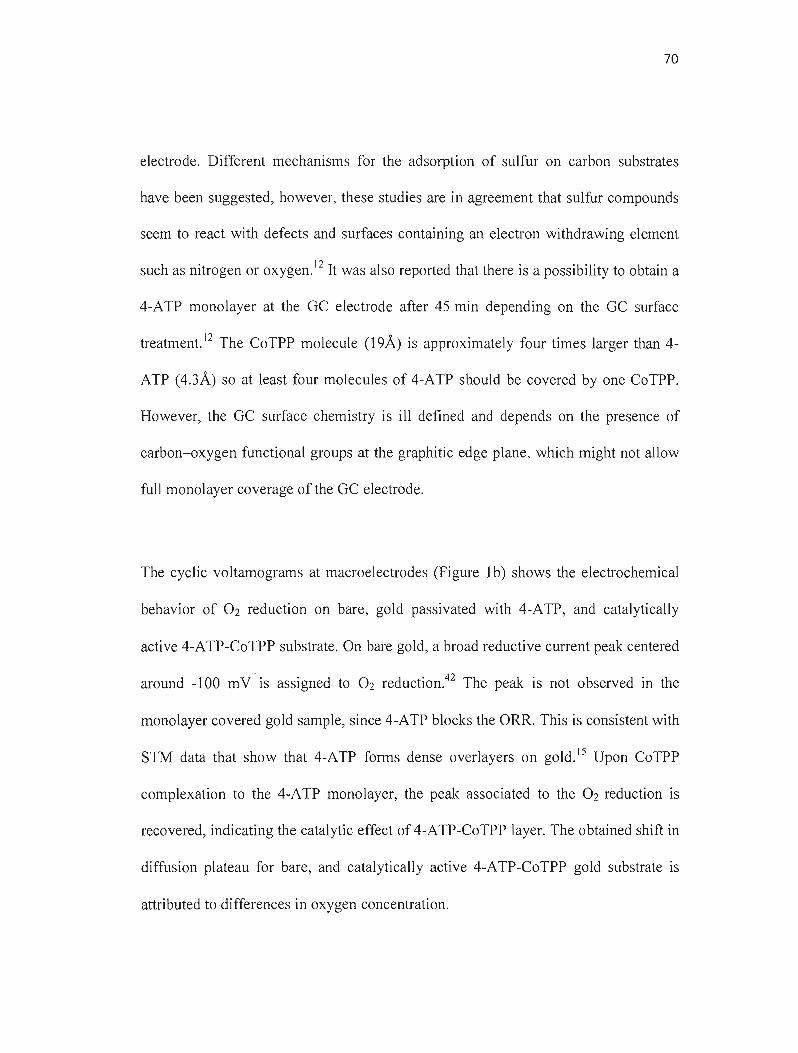
70
electrode. Different mechanisms for the adsorption of sulfur on carbon substrates
have been suggested, however, these studies are in agreement that sulfur compounds
seem to react with defects and surfaces containing an electron withdrawing element
such as nitrogen or oxygen. 12 It was also reported that there is a possibility to obtain a
4-ATP monolayer at the GC electrode after 45 min depending on the GC surface
12treatment. The CoTPP molecule (l9Â) is approximately four times larger than 4
ATP (4.3Â) so at least four molecules of 4-ATP should be covered by one CoTPP.
However, the GC surface chemistry is ill defined and depends on the presence of
carbon-oxygen functional groups at the graphitic edge plane, which might not allow
full monolayer coverage of the GC electrode.
The cyclic voltamograms at macroelectrodes (Figure 1b) shows the electrochemical
behavior of O2 reduction on bare, gold passivated with 4-ATP, and catalytically
active 4-ATP-CoTPP substrate. On bare gold, a broad reductive current peak centered
around -100 mV . is assigned to O2 reduction.42 The peak is not observed in the
monolayer covered gold sample, since 4-ATP blocks the ORR. This is consistent with
STM data that show that 4-ATP forms dense overlayers on gold. 15 Upon CoTPP
complexation to the 4-ATP mono layer, the peak associated to the O2 reduction is
recovered, indicating the catalytic effect of 4-ATP-CoTPP layer. The obtained shift in
diffusion plateau for bare, and catalytically active 4-ATP-CoTPP gold substrate is
attributed todifferences in oxygen concentration.

71
Figure 1c shows CYs ofbare GC electrode and modified with 4-ATP-CoTPP in a 0.5
M H2S04 solution saturated with oxygen. The unmodified GC shows an obvious peak
near -450 mY characteristics to 02 reduction. When the GC electrode is chemically
modified with 4-ATP-CoTPP, O2 reduction occurs at a more cathodic potential, 150
mY, and H202 is predominantly produced. The mechanisms of the catalytically effect
of CoTPP-GC electrode is weil known in literature. 16-
18
As such, macroelectrode cyclic voltametry experiments give global information on
the electrocatalytic activity of the substrate. Therefore, the homogeneity of the
catalyst reactivity on substrate cannot be easily identified. Local kinetics
characterization through scanning electrochemical microscopy measurements has
thus been performed.
SECM Measurements of4-ATP-CoTPP Catalyst Layer. The substrate's response towards üRR
was stlldied by SG-TC SECM llsing a classical 25 !lm diameter microelectrodes, having an
RG of 10, in a 0.5 M H2S04 solution saturated with O2. As the studied substrate did
not present significant topographical features or tilt, constant height measurements
were performed. During SECM measurements, à potential of 700 mY was applied at
the tip in order to oxidize the peroxide produced at the underlying substrate, which is
biased at different potentials. Following a prepositioning of the microelectrode at a
tip to substrate distance of 30 flm,the microelectrode was moved in a plane parallel
to the substrate at scan rate of95 flm·s-I.
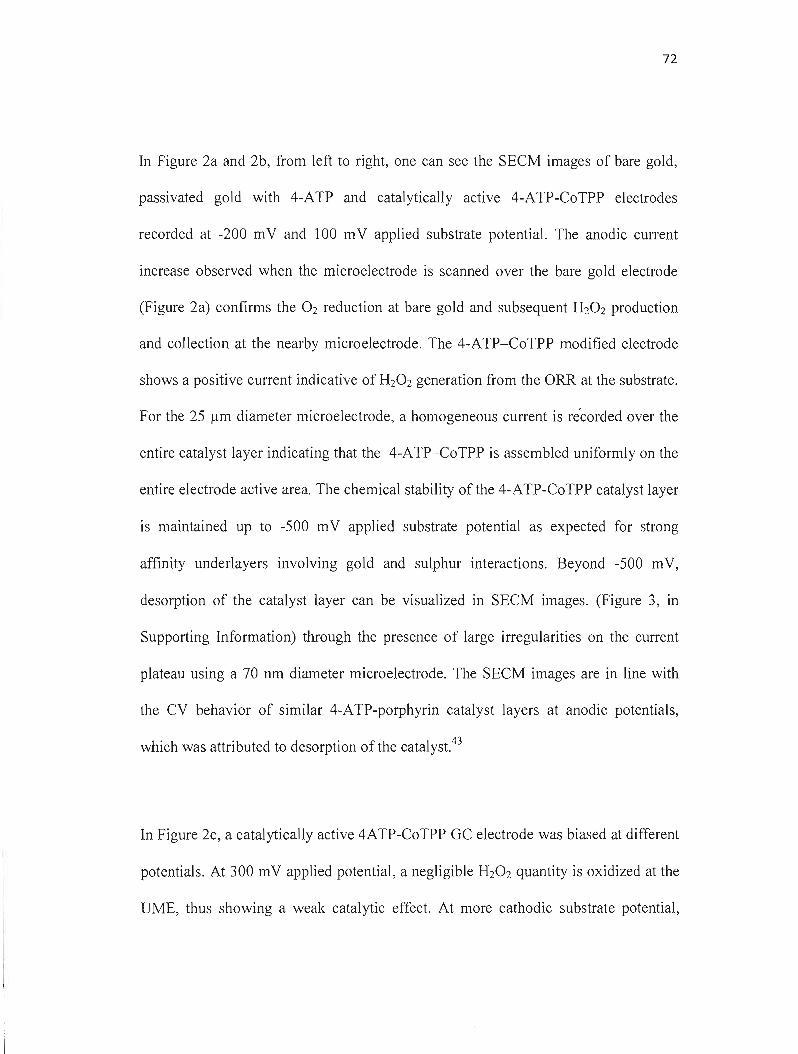
72
In Figure 2a and 2b, from left to right, one can see the SECM images of bare gold,
passivated gold with 4-ATP and catalytically active 4-ATP-CoTPP electrodes
recorded at -200 mV and 100 mV applied substrate potential. The anodic current
increase observed when the microelectrode is scanned over the bare gold electrode
(Figure 2a) confirms the Oz reduction at bare gold and subsequent HzOz production
and collection at the nearby microelectrode. The 4-ATP-CoTPP modified electrode
shows a positive CUITent indicative of HzOz generation from the ORR at the substrate.
For the 25 ~m diameter microelectrode, a homogeneous current is récorded over the
entire catalyst layer indicating that the 4-ATP-CoTPP is assembled uniformly on the
entire electrode active area. The chemical stability of the 4-ATP-CoTPP catalyst layer
is maintained up to -500 mV applied substrate potential as expected for strong
affinity underlayers involving gold and sulphur interactions. Beyond -500 mV,
desorption of the catalyst layer can be visualized in SECM images. (Figure 3, in
Supporting Information) through the presence of large irregularities on the current
plateau using a 70 nm diameter microelectrode. The SECM images are in line with
the CV behavior of similar 4-ATP-porphyrin catalyst layers at anodic potentials,
which was attributed to desorption of the catalyst.43
In Figure 2c, a catalytically active 4ATP-CoTPP GC electrode was biased at different
potentials. At 300 mV applied potential, a negligible HZ0 2 quantity is oxidized at the
UME, thus showing a weak catalytic effect. At more cathodic substrate potential,
73
such as 200 mV and 100 mV, a higher oxidation current was measured at the UME.
The increase in CUiTent is obtained over the entire GC electrode diameter (3 mm) and
suggests a homogeneous distribution of the catalyst. Small current variations between
the two extremities of GC electrode can be explained by the substrate tilt.
The use of nanometer-scale electrodes (radius between 20 nm and 1flm) are
advantageous when studying self-assembled catalysts on gold because they do not
disturb significantly the diffusion layer of the substrate, the feedback between the tip
and substrate is neglected, and they allow high lateral resolution imaging. This is
important in when studying metalloporphyrin-modified gold substrates because the
underlying gold substrate can generate an additional interfering H20 2 flux. A method
for developing Pt disk nano- and micro- electrodes using laser pullers was perforrned.
The technical details and characterization results will be published elsewhere.
These laser pulled nanoelectrodes were used to study the homogeneity of the
porphyrin catalyst and to extract kinetic parameters. A probe diameter of 460 nm was
used to scan the electrocatalytic activity of the substrate coating, which minimize
physical perturbations related to the presence of the probe.
Eleclrochemical Characterizalion of 4-ATP-CoTPP Calalyst Layer using Nano
Electrode. The laser pulied microelectrodes were used to acquire SECM image and
74
line scans of Au-4-ATP-CoTPP catalysts in Figure 3. Positioning of the electrode tip
at a known distance above the substrate has been achieved by shear-force constant
distance SECM 29(Figure 4, in Supporting Information). Consistent with the results
obtained at a 25 !lm diameter microelectrodes, the extent of ORR increases when the
applied substrate potential decreases. The largest CUITent recorded is inferiDr to 2 pA
and was obtained at a substrate potential of 0 mV.
Despite the symmetric substrate and tip geometries, an inhomogeneous increase of
CUITent is obtained on the left hand-side of the line scans. Given the overall 2 !lm
diameter of the scanned tip, convection effects are not dominant. The asymmetry of
the electrochemical images observed under substrate generation collection conditions
is related to differences in the diffusion field of the scanning tip. As the substrate is
biased at a fixed potential and the electrocatalytic layer is on the order of a monolayer
of porphyrin molecules, we postulate that the observed asymmetry results from
inhomogeneity in the adsorbed porphyrin layer resulting in the combined CUITent
contribution of gold and porphyrin at the applied substrate potentials. The applied
substrate potential dependence on the presence of the asymmetric current collection
also implies that to uniquely isolate the contribution of the porphyrin electrocatalyst
towards ORR, measurements should be perforrned at an applied substrate potential of
200 mV.
The effect of tip scan-rate on feedback CUITent measurements were reported. The
substrates used in these studies were unbiased carbon fiber44 and platinum substrates
75
having dimensions on the order or smaller than that of the scanned tip.45 It is unlikely
that the present observed asymmetry is related to scan rate because with decreasing
cathodic substrate potential, the extent of ORR decreases, leading to decreases in the
peroxide concentration profile generated at the substrate. Also had the scan rate been
the dominant effect, the dependence on substrate potential would not have been as
important.
To probe the homogeneity of the electrocatalyst on a large scale, an SECM image of
the 2 mm modified gold biased substrate at 0 mV was acquired using a 460 nm
diameter microelectrode with RG of 8 under the same conditions as the lines scan
(Figure 3b). As expected, the Au electrode was modified with 4-ATP-CoTPP and
then, displayed activity towards ORR. The asymmetric shape of the acquired image is
in concordance with line scan results.
THEORETICAL STUDY
SG-TC SECM measurements performed at long electrolysis time produce steady
state concentration profiles similar to that of a Nernst-layer, even in the absence of
forced convection.n . l8 This enables extraction of kinetic constants across the surface
of a catalyst. In the present model special care is given to the influence of the probe
used to perform measurements. The model used to describe the processes involved is
mainly taken from literature. Specifically, the substrate behavior is modeled
76
according to the work of Shen et al. 24 while the transport in solution is modeled
according to the work of Amatore et al. 27 and Baltes et al. 28
Concentration of H20 2 and O2 are noted [02] and [H20 2]. At the substrate of radius
noted r5, a complex process occurs whereby O2 is consumed and H20 2 is produced.
The main reaction pathways are:
Reduction of O2 into H20 2
(2)
Reduction of O2 into H20
O2 +4H+ +4e- ~2H20 (3)
Reduction of H20 2 into H20
H 20 2 +2H+ +2e- ~2H20 (4)
Such processes consisting of several elementary steps are assumed to follow first
order kinetics towards electroactive reactant concentration. 24 The effective rate
constants, k;, provides information on the reaction paths.
In the absence of macroscopic movement of the solution, the transport of O2 and
H202 is dominated by hydrodynamic conditions where the complex transport of
solutes to the electrode surface area involves both diffusion and convection, even if
the solution is macroscopically still.27,28 This cornes from microscopie movements of
the solution, and has been calIed spontaneous convection. According to the work
77
from Amatore et al 27,28 and Baltes et a129 , in such a case, it is possible to obtain a
stationary concentration profile. In contrast to the transient study performed by Shen
et a12\ the present model, consistent with the above SECM experiments, will then
involve steady-state conditions. The breath of the kinetic studies performed with the
steady state approach is not as far reaching as the original transient method. However,
it readily allows one to extract catalyst kinetic constants at different tip positions
during SECM line scans, evaluate the homogeneity of the surface modification and
optimize the applied substrate potential for a given catalyst layer.
According to previously cited work28 the distance where concentration gradients
occur (noted ID), has a value of around 230 microns, that is much smaller than
substrate size (millimeter range). In such a case, in the absence of a SECM probe, the
diffusion is planaI', and one dimension reasoning is possible to evaluate the
concentration profiles. In addition, according to the same work, the obtained
concentration profile is linear over 60 percent of the reglon where the diffusion
occurs, and the Nernst layer model can then be used to evaluate the concentration
variation in this region.
These hypothesis lead to the following conditions on flux densities of 02 and H20 2
at the substrate:
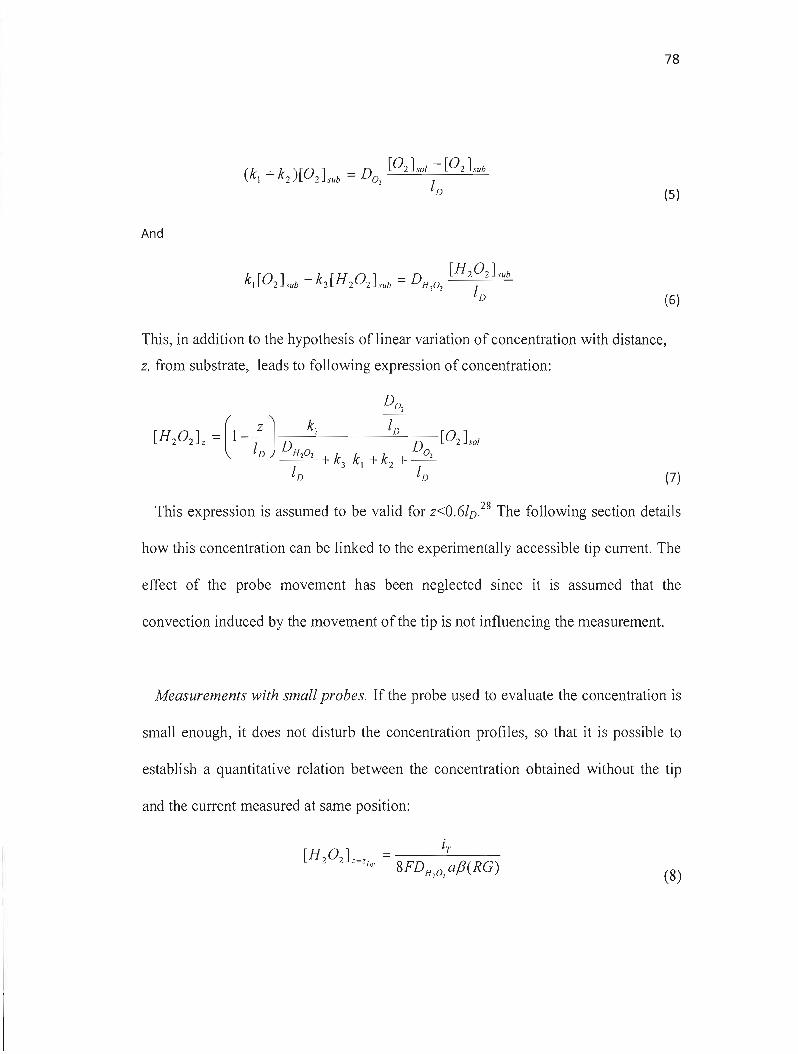
78
(k + k )[0] = D [02Lol -[021"'b 1 2 2 sLlb 0, 1
/) (5)
And
(6)
This, in addition to the hypothesis of linear variation of concentration with distance,
z, from substrate, leads to fol1owing expression of concentration:
(7)
This expression is assumed to be valid for z<O.6ID.28 The following section details
how this concentration can be linked to the experimentally accessible tip CUITent. The
effect of the probe movement has been neglected since it is assumed that the
convection induced by the movement of the tip is not influencing the measurement.
Measurements with smalt probes. If the probe used to evaluate the concentration is
small enough, it does not disturb the concentration profiles, so that it is possible to
establish a quantitative relation between the concentration obtained without the tip
and the current measured at same position:
(8)
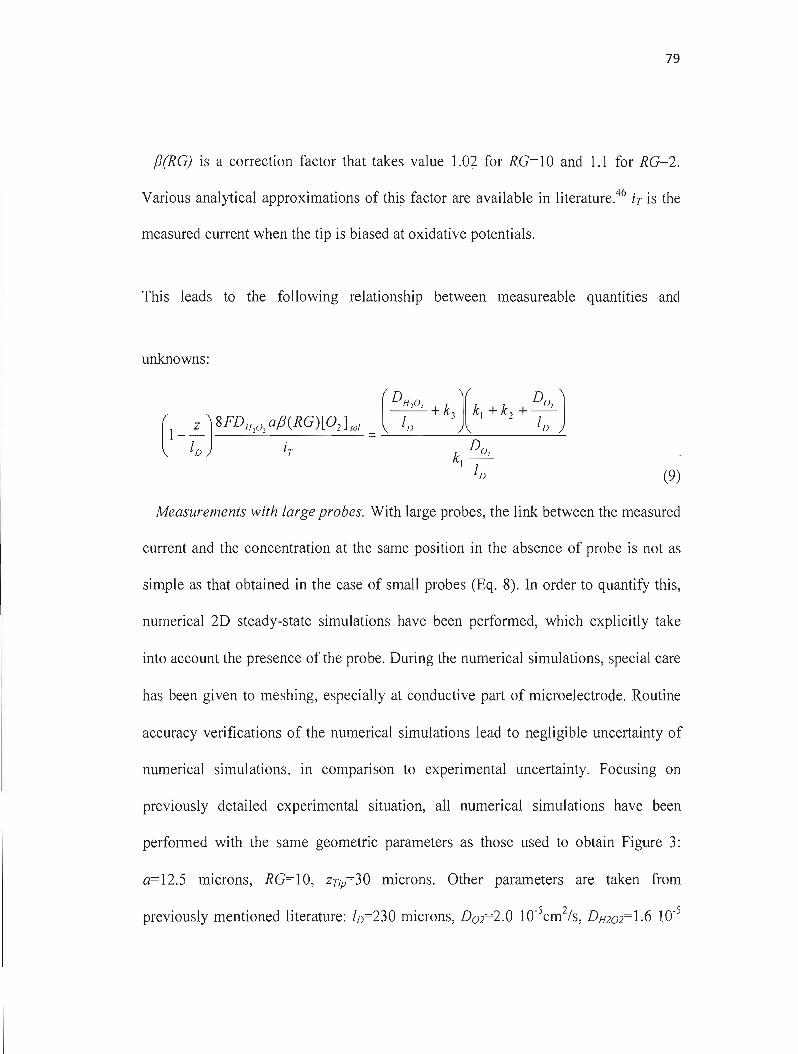
79
fJ(RG) is a correction factor that takes value 1.02 for RG=10 and 1.1 for RG=2.
Various analytical approximations of thi? factor are available in literature.46 iT is the
measured CUITent when the tip is biased at oxidative potentials.
This leads to the following relationship between measureable quantities and
unknowns:
(9)
Measurements with large probes. With large probes, the link between the measured
current and the concentration at the same position in the absence of probe is not as
simple as that obtained in the case of small probes (Eq. 8). In order to quantify this,
numerical 2D steady-state simulations have been performed, which explicitly take
into account the presence of the probe. During the numerical simulations, special care
has been given to meshing, especially at conductive part of microelectrode. Routine
accuracy verifications of the numerical simulations lead to negligible uncertainty of
numerical simulations, in comparison to experimental uncertainty. Focusing on
previously detailed experimental situation, aH numerical simulations have been
perforrned with the same geometric parameters as those used to obtain Figure 3:
a=12.5 microns, RG=10, zTip=30 microns. Other parameters are taken from
previously mentioned literature: ID=230 microns, D02=2.0 1O-5cm 2/s, DH202=1.6 10-5
80
cm2/s, and [02]501=0.27 mmol/L. Figure 6 shows the deduced concentration from
current measurements, by directly using the previously presented equation (Eq. 8)
valid for small probes, as a function of kinetics constant kt, for different values of k3
(k2 is taken equal to 0). In addition, for each case, the concentration that would be
obtained at the same position in the absence of the probe (according to Eq. 7) is
presented. The kinetics constant axis is in logarithmic scale, in order to coyer the
whole range of kinetics behavior: small kinetics constants values, where the substrate
can be considered as non reactive, and the produced quantity of H20 2 is small' and
large kinetics constants, where the production of H20 2 is limited by the transport of
matter (concentration of O2 at substrate is then O.)
In ail cases, there is a significant difference between the curves. Moreover, as
shown for the curves obtained for k3=0.1 rn/s, in the case of an altemating pathway
consuming H20 2, the relation between measured signal and expected one can be
complicated. The difference between the two is due to two main effects: first, the
consumption of H20 2 at probe produces O2. This produced O2 is an additional
contributing flux to that coming from bulk, and thus increases the H20 2 produced by
the substrate. This is the feedback effect. In addition to this, one has to be aware of
the fact that the presence of the probe, including the surrounding glass thickness,
hinders diffusion, and may lead to inappropriate evaluation of current. As such, the
various processes occurring at substrate lead to the introduction of a correction factor
that has to be considered when data are obtained with micrometer large probes:
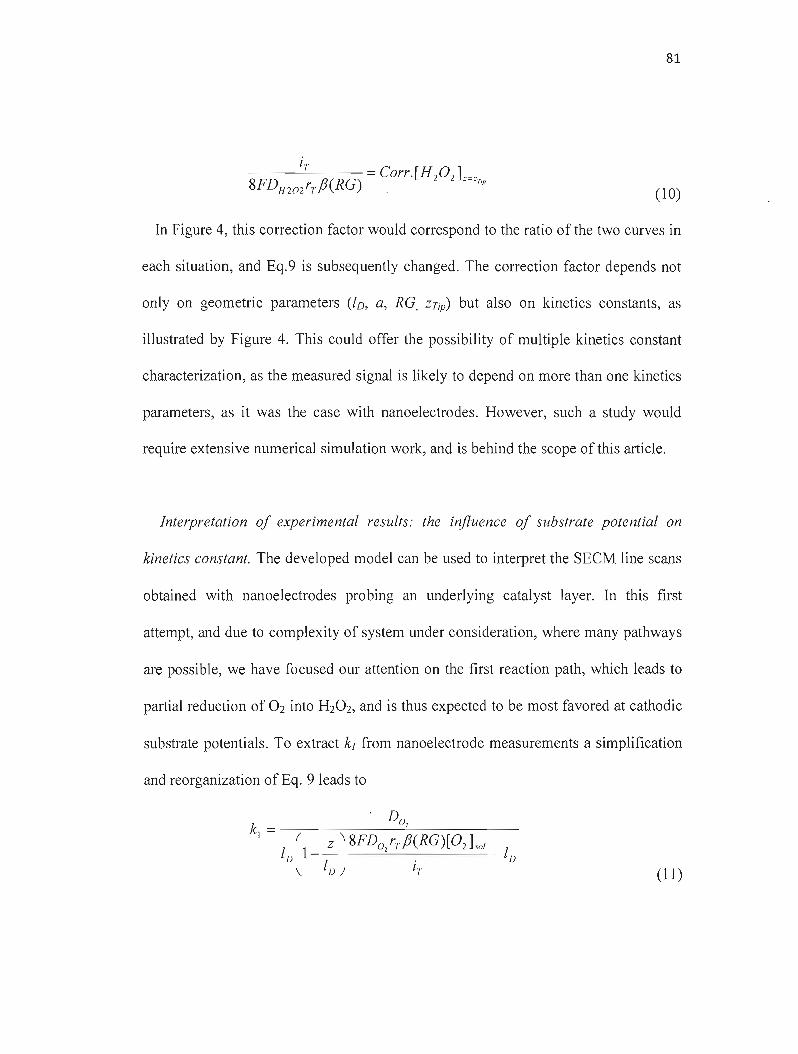
81
(10)
In Figure 4, this correction factor would correspond to the ratio of the two curves in
each situation, and Eq.9 is subsequently changed. The correction factor depends not
only on geometric parameters (ID, a, RG, ZTip) but also on kinetics constants, as
illustrated by Figure 4. This could offer the possibility of multiple kinetics constant
characterization, as the measured signal is likely to depend on more than one kinetics
parameters, as it was the case with nanoelectrodes. However, such a study would
require extensive numerical simulation work, and is behind the scope ofthis article.
Interpretation of experimental results: the influence of substrate potential on
kinetics constant. The developed model can be used to interpret the SECM line scans
obtained with nanoelectrodes probing an underlying catalyst layer. In this first
attempt, and due to complexity of system under consideration, where many pathways
are possible, we have focused our attention on the first reaction path, which leads to
partial reduction of O2 into H20 2, and is thus expected to be most favored at cathodic
substrate potentials. To extract kt from nanoelectrode measurements a simplification
and reorganization of Eq. 9 leads to
(11 )
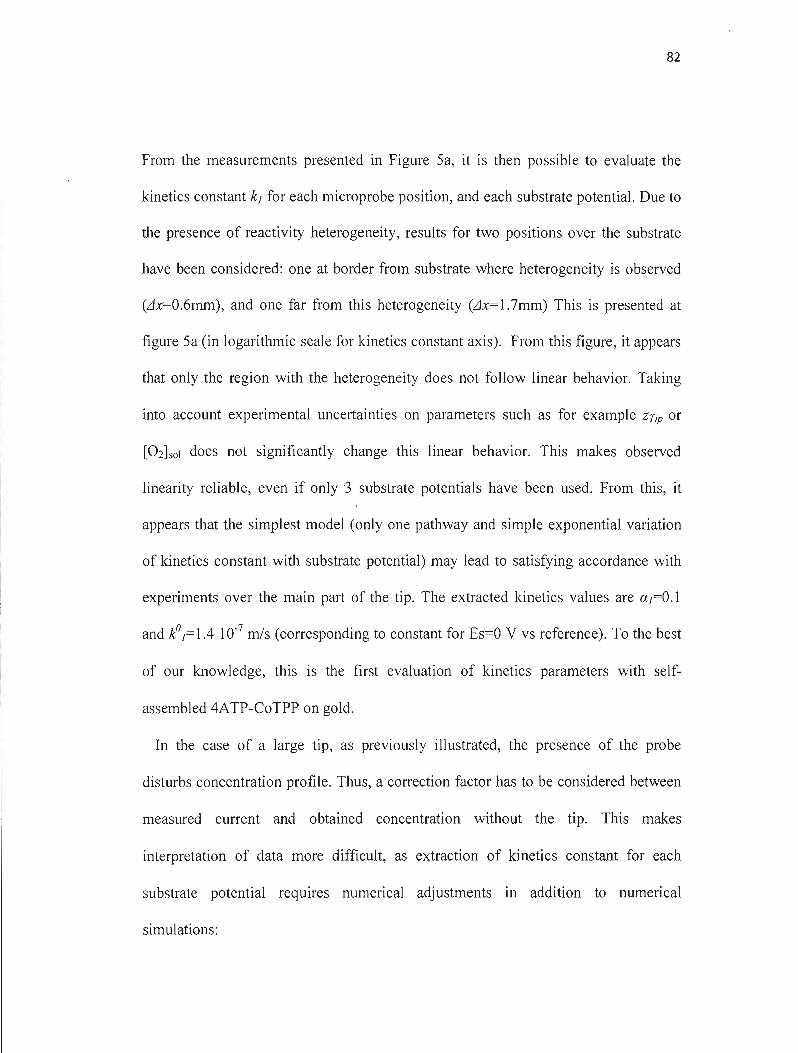
82
From the measurements presented in Figure Sa, it is then possible to evaluate the
kinetics constant kj for each microprobe position, and each substrate potential. Due to
the presence of reactivity heterogeneity, results for two positions over the substrate
have been considered: one at border from substrate where heterogeneity is observed
(L1x=O.6mm), and one far from this heterogeneity (L1x=1.7mm) This is presented at
figure Sa (in logarithmic scale for kinetics constant axis). From this figure, it appears
that only the region with the heterogeneity does not follow linear behavior. Taking
into account experimental uncertainties on parameters such as for example ZTip or
[02]501 does not significantly change this linear behavior. This makes observed
linearity reliable, even if only 3 substrate potentials have been used. From this, it
appears that the simplest model (only one pathway and simple exponential variation
of kinetics constant with substrate potential) may lead to satisfying accordance with
experiments over the main pal1 of the tip. The extracted kinetics values are aj=O.l
and kOj=lA JO-7 mis (corresponding to constant for Es=O V vs reference). To the best
of our knowledge, this is the first evaluation of kinetics parameters with self
assembled 4ATP-CoTPP on gold.
In the case of a large tip, as previously illustrated, the presence of the probe
disturbs concentration profile. Thus, a correction factor has to be considered between
measured CUITent and obtained concentration without the tip. This makes
interpretation of data more difficuit, as extraction of kinetics constant for each
substrate potential requires numerical adjustments in addition to numerical
simulations:
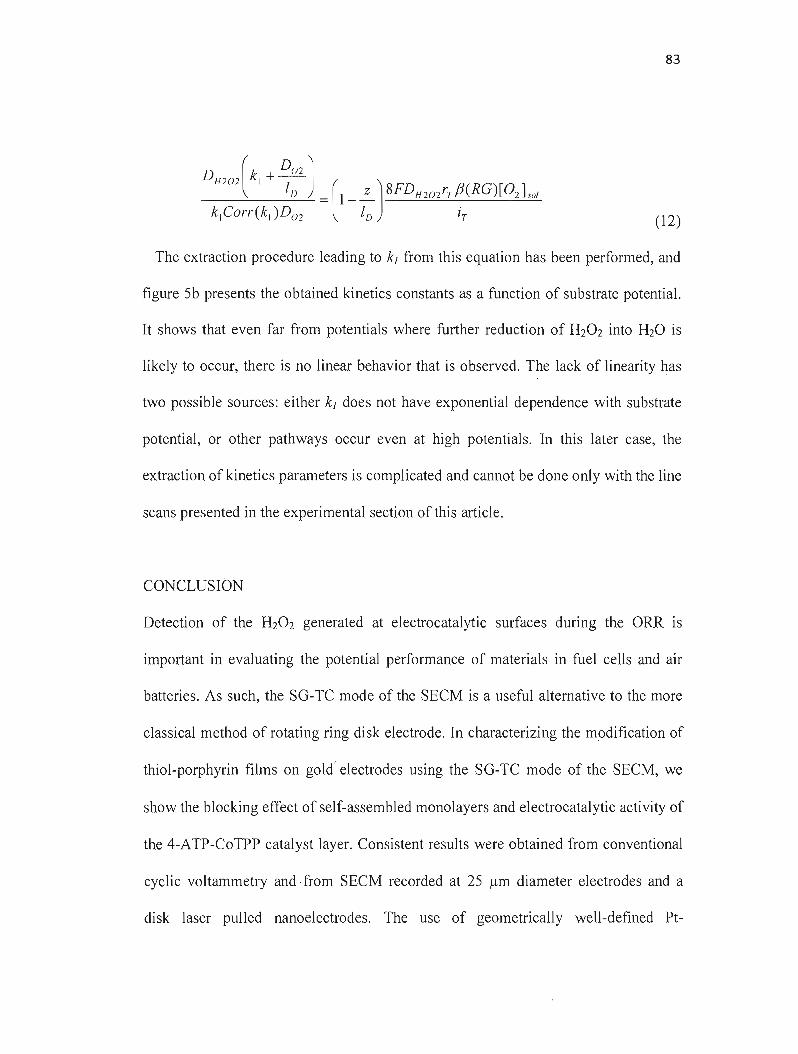
83
(12)
The extraction procedure leading to kt from this equation has been performed, and
figure 5b presents the obtained kinetics constants as a function of substrate potential.
It shows that even far from potentials where further reduction of H202 into H20 is
likely to occur, there is no linear behavior that is observed. The lack of linearity has
two possible sources: either kt does not have exponential dependence with substrate
potential, or other pathways occur even at high potentials. In this later case, the
extraction of kinetics parameters is complicated and cannot be done only with the line
scans presented in the experimental section of this article.
CONCLUSION
Detection of the H202 generated at electrocatalytic surfaces during the ORR is
important in evaluating the potential performance of materials in fuel cells and air
batteries. As such, the SG-TC mode of the SECM is a useful alternative to the more
classical method of rotating ring disk electrode. In characterizing the modification of
thiol-porphyrin films on gold' electrodes using the SG-TC mode of the SECM, we
show the blocking effect of self-assembled monolayers and electrocatalytic activity of
the 4-ATP-CoTPP catalyst layer. Consistent results were obtained from conventional
cyclic voltammetry and· from SECM recorded at 25 flm diameter electrodes and a
disk laser pulled nanoelectrodes. The use of geometrically well-defined Pt
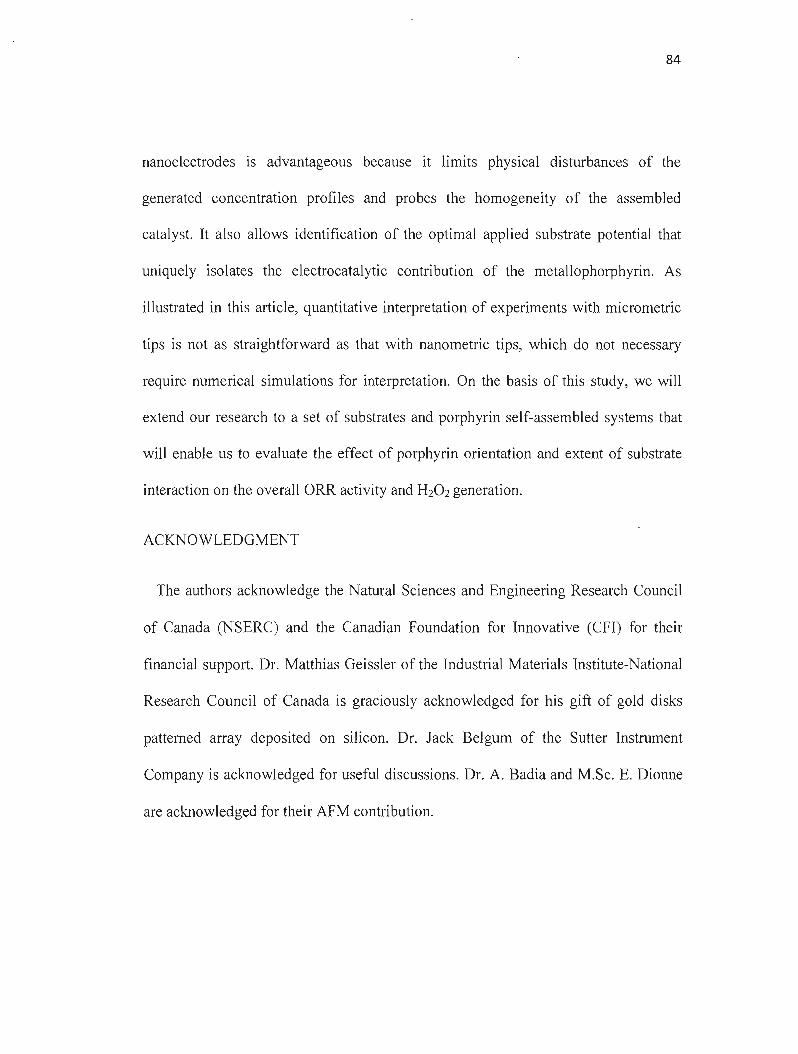
84
nanoelectrodes is advantageous because it limits physical disturbances of the
generated concentration profiles and probes the homogeneity of the assembled
catalyst. It also allows identification of the optimal applied substrate potential that
uniquely isolates the electrocatalytic contribution of the metallophorphyrin. As
illustrated in this article, quantitative interpretation of experiments with micrometric
tips is not as straightforward as that with nanometric tips, which do not necessary
require numerical simulations for interpretation. On the basis of this study, we will
extend our research to a set of substrates and porphyrin self-assembled systems that
will enable us to evaluate the effect of porphyrin orientation and extent of substrate
interaction on the overall ORR activity and H202 generation.
ACKNOWLEDGMENT
The authors acknowledge the Natural Sciences and Engineering Research Council
of Canada (NSERC) and the Canadian Foundation for Innovative (CFI) for their
financial support. Dr. Matthias Geissler of the Industrial Materials Institute-National
Research Council of Canada is graciously acknowledged for his gift of gold disks
patterned array deposited on silicon. Dr. Jack Belgum of the Sutter Instrument
Company is acknowledged for useful discussions. Dr. A. Badia and M.Sc. E. Dionne
are acknowledged for their AFM contribution.
85
SUPPORTING INFORMATION PARAGRAPH
(1) AFM images of bare Au substrate and catalytically active Au-4-ATP-CoTPP
substrate
(2) Figure showing the SECM image of the catalyst with a 25 /-lm diameter
electrode.
(3) Figure related to thiol desorption SECM image.
(4) Figure of Distance calibration of the phase and amplitude rectification prior to
constant-height microscopy.
(5) Figure presenting the axis orientations and geometric parameter of modeled
system.
86
FIGURES CAPTIONS
Figure 1. (a) Scheme of the 4-ATP-CoTPP deposited on Au and Glassy Carbon (GC)
substrate. (b) Cyclic voltamogramms of: bare gold (--); passivated gold with
4-ATP (------); and catalytically active Au-4-ATP-CoTPP substrate (- -). (c)
Cyclic voltamogramms of bare GC (--) and catalytically active GC-4-ATP-CoTPP
substrate (------). The Cyclic voltamogramms were recorded in O2 saturated 0.5 M
H2S04 at a scan rate of 100 mY·s· l •
Figure 2. Line scans of: bare gold (------); passivated gold with 4-ATP (- -); and
catalytically active 4-ATP-CoTPP substrate (--) recorded at (a) -200 mY and (b)
100 mY. (c) Line scans of catalytically active GC-4-ATP-CoTPP substrate recorded
at 100 mY (--), 200 mY (- -) and 300 mY (------). The line scans were recorded
with a 25 /lm microelectrode, having an RG of lOin O2 saturated 0.5 M H2S04. The
potential applied at the microelectrode was 700 mY. The scan rate was 95 /lm's' l and
the distance tip to substrate was 30 ~m.
Figure 3. (a) Lines scan of: AuA-ATP-CoTPP substrate recorded at 0 mY (black
line); 100 mY (red line); and 200 mY (green line). (b) SECM image of Au-4-ATP
CoTPP substrate recorded at a potential of 0 mY. A 460 nm diameter microelectrode
with RG of 8 was biased at 900 mY and positioned 6 /lm from the substrate. The
measurements were recorded in O2 saturated 0.5 M H2S04 at scan rate of 90 ~m's'I .
87
Figure 4: Expected concentration in the absence of probe (empty symbols) according
to Eq. 8, or deduced from CUITent measurements concentration using Eq. 9, (filled
symbols) as a function of kinetics constant k,(m/s). Squares: for k]=O rn/s, Triangles:
for k]=O.O 1 rn/s, Circles: for k]=O.l rn/s. Other conditions: Probe radius 12.5 microns,
RG=10, zTip=30 microns, /0=230 microns, DQ2=2.0 1O-5cm2/s, DH2Q2=1.6 10-5 cm2/s,
and [02]sol=0.27 mmol/L.
Figure 5: Extracted kinetics constants as a function of substrate potential (a) From
measurements presented in Figure Sa, using Eq. Il. (b) From measurements in Figure
3c, using Eq. 12. For both figures, the extracted kinetics near the border of substrate
(empty circles), and at the center of substrate (filled squares) are presented.
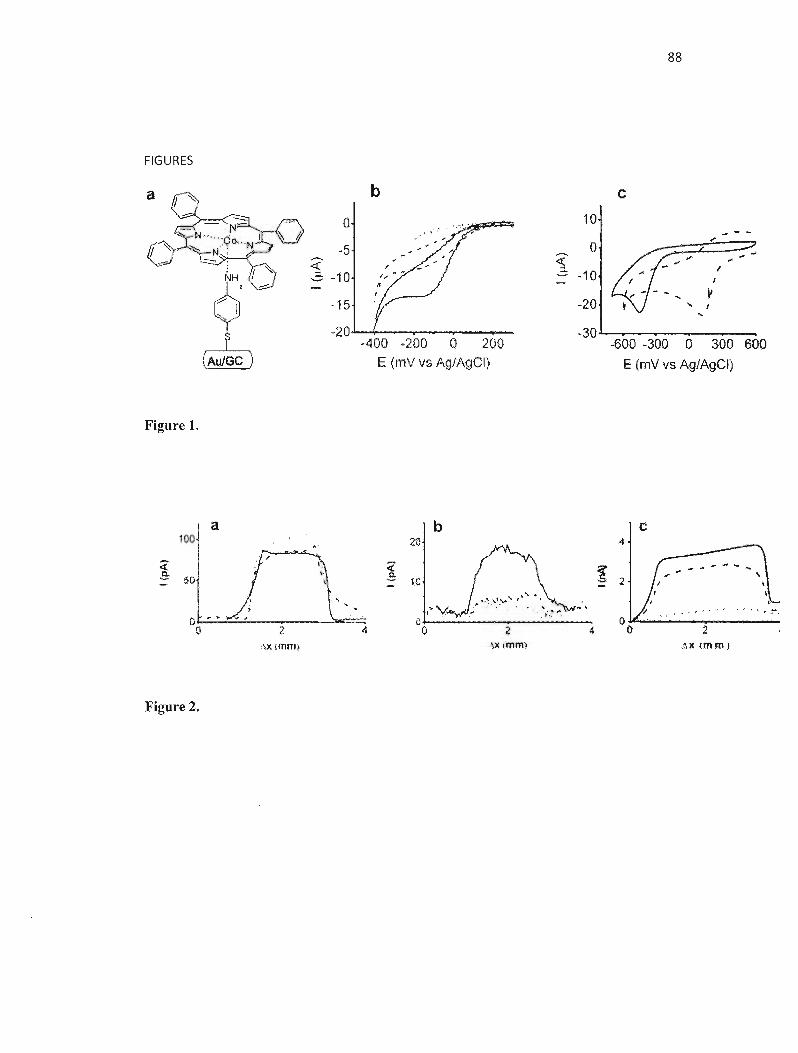
88
FIGURES
b C
o 10
0 ..
~ ~. -10
-20 "
1 1
V J
1 \ tAu/Ge}
·400 ~200 0 200 E (rnV vs Ag/Agel)
-30 -600 -300 0 300
E (mV vs Ag/Agel)
600
Figure 1.
-! 100
50
a
,\Xtmm)
~ b
~
t:..~_, ~ o 2 4
.\X (mmt
c 4
'u:-....__.,_,._.._._.._.._:-. 2
Figure 2.
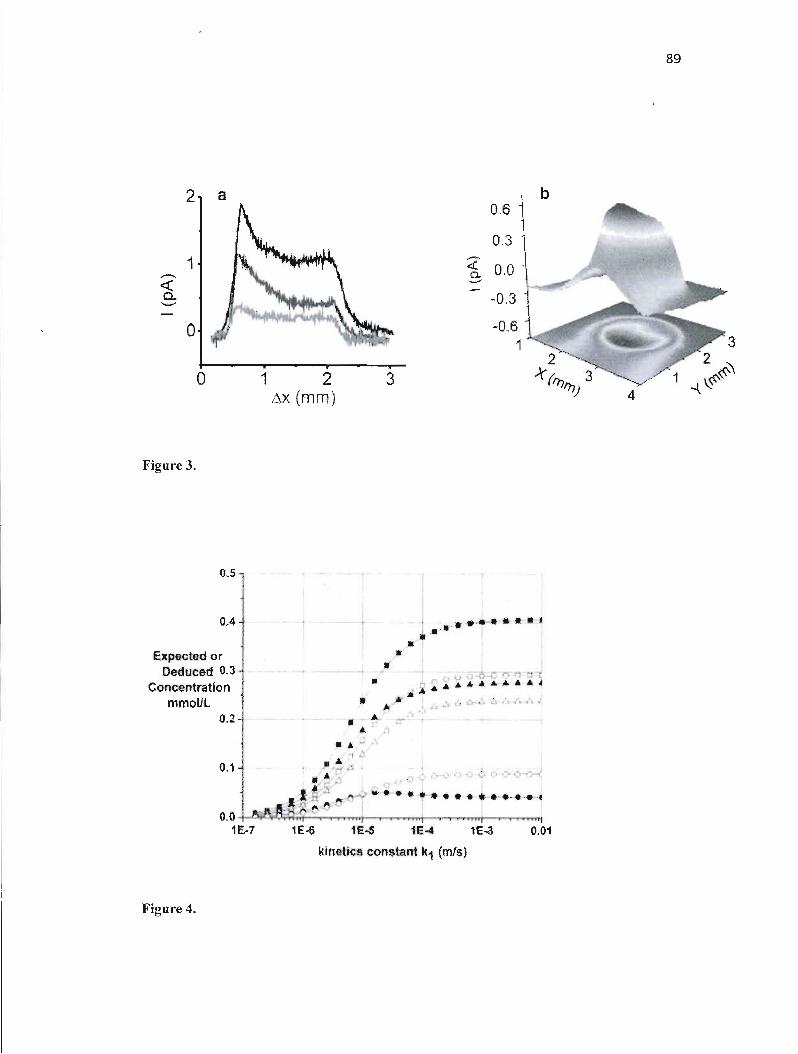
89
2 a l b 0.6 i
03 j1 :z ..-... a. « -- 00 i
0...-, -0.3
-0.61<0 1 2.........~.....
0 1 2 3 -t(rr, 3 y"/ ,'<'
1 "n)
,':\X (mm) 4
Figure 3.
0.5
.. .OA •••••
,-Expected or ,"
•Deduced 0.3 '.-1 I:l·- : .............................. ~Conc~mtration
~*mmollt • .'.. "
0.2 '"
0.1 :. J .~ ...
(). 0 ~~~~;';''''''''''''''''''''''''''T"--'--'--'",,"",",---'-'--''''''''''''''-''-'-'''''''''''''' 1E-7 1E-6 1E-5 1E-4 1E-3 0.01
kinetics constant k1 (mIs)
Figure 4.
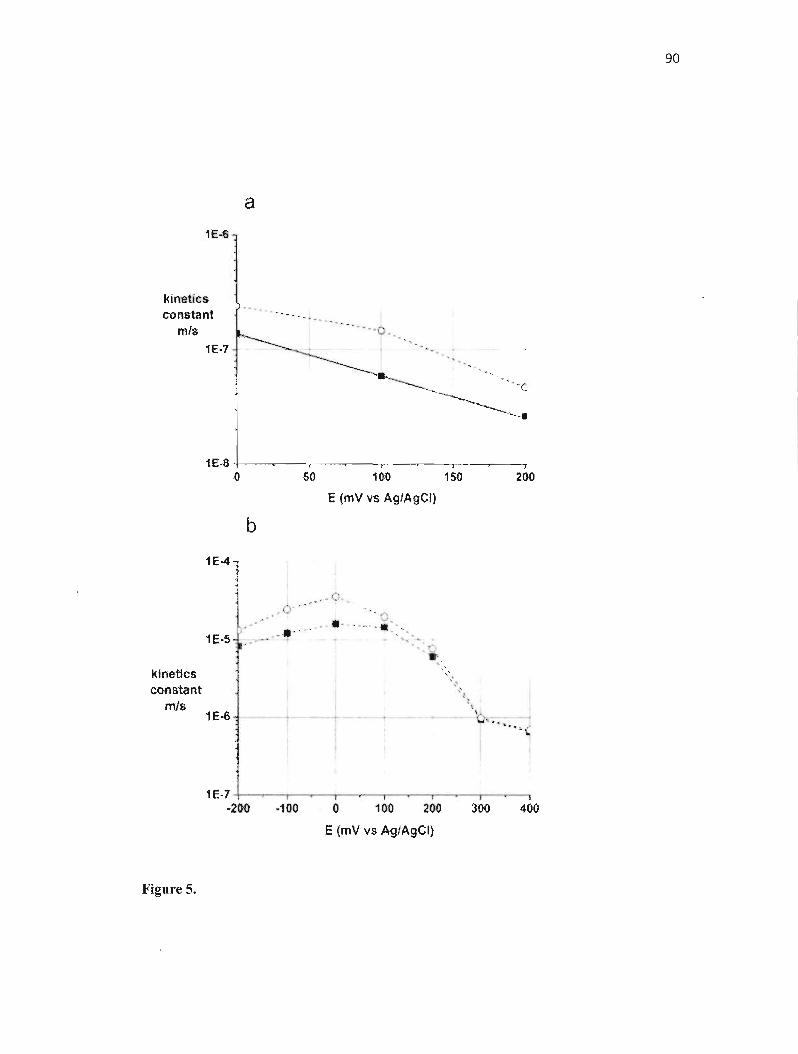
90
a 1E·6
kînetics ...constant
mis 1E·7
1E·8 -1--~--'----.----.----r---r-----"---. () SO 10:0 150 200
E (mV vs Ag/AgCI)
b
1E-4
1 le-5L::::~-:_·;:
kinetics constant
mIs 1E-6
1E·7 +--...--r---.----,r--.----r--.---,--~_,_--r_.
·200 ·100 o 100 200 300 400
E (mV vs Ag/AgCI)
Figure 5.
91
REFERENCES
(1) Zak, J.; Yuan, H.; Ho, M.; Woo, L. K.; Porter, M. D. Langmuir 1993, 9,2772-2774.
(2) Hutchison,1. E.; Postlethwaite, T. A; Chen, C.-h.; Hathcock, K. W.; Ingram, R. S.; Ou, W.; Linton, R. W.; Murray, R. W.; Tyvoll, D. A.; Chng, L. L.; Collman, J. P. Langmuir 1997,13,2143-2148.
(3) Uosaki, K.; Kondo, T.; Zhang, X-Q.; Yanagida, M. 1. Am. Chem. Soc. 1997, 119,8367-8368.
(4) Petty, M. C. Langmuir-Blodgett Films.; Roberts, G. G. ed.; Plenum Press: New York and London, 1990.
(5) Ulman, A An Introduction to Ultrathin Organic Films, from Langmuir-Blodgett Films to Self-Assembly.; Academie Press: SanDiego, CA, 1991.
(6) 5398.
Araki, K.; Wagner, M. 1.; Wrighton, M. S. Langmuir 1996, 12,5393
(7) Kampas, F. J.; Yamashita, K.; Fajer, 1. Nature 1980,284,40-44.
(8) Curran, D.; Grimshaw, 1.; Perera, S. D.; Chem. Soc. Rev. 1991,20, 391- 404.
(9) Manivannan, A; Nagahara, L. A; Hashimoto, K.; Fujishima, A.; Yanagi, H.; Kouzeki, T.; Ashida, M. Langmuir 1993,9,771-775.
(10) Okunola, A. O.; Nagaiah, T. C.; Chen, X.; Eckhard, K.; Schuhmann, W.; Bron, M. Electrochim. Acta 2009,54,4971-4978.
(11) Zhang, Z.; Hou, S.; Zhu, Z.; Liu, Z. Langmuir 1999, 16,537-540.
(12) Médard, C.; Morin, M. 1. Electroana1. Chem. 2009, 632, 120-126.
(13) Bashkova, S.; Bagreev, A; Bandosz, T. 1. Langmuir 2003, 19,61156121.
(14) Bashkova, S.; Bagreev, A; Bandosz, T. 1. Ind. Eng. Chem. Res. 2002, 41,4346-4352.
92
(15) Rosink,1. 1. W. M.; Blauw, M. A.; Geerligs, L. 1.; van der Drift, E.; Rousseeuw, B. A. c.; Radelaar, S.; Sloof, W. G.; Fakkeldij, E. J. M. Langmuir 2000,16,4547-4553.
(16) Lu, X.; Lv, B.; Xue, Z.; Li, M.; Zhang, L.; Kang, 1. Thin Solid Films 2005,488,230-235.
(17) Mohammad Mazloum, A.; Parvaneh, R.; Hossein, D.; Payam Ebrahimi, K.; Hamid Reza, Z.; Somayeh, K. Electroanalysis 2007, 19, 2258-2263.
(18) Chung, T. D.; Anson, F. C. 1. Electroanal. Chem. 2001, 508,115-122.
(19) Sanchez-Sanchez, c. M.; Rodriguez-L6pez, J.; Bard, A. 1. Anal. Chem. 2008, 80, 3254-3260.
(20) Horroeks, B. R.; Sehmidtke, D.; HelIer, A.; Bard, A. 1. Anal. Chem. 1993,65,3605-3614.
(21) Wittstock, G.; Strübing, A.; Szargan, R.; Werner, G. 1. Eleetroanal. Chem. 1998, 444, 61-73.
(22) Wittstoek, G. Anal. Chem. 1997,69,5059-5066.
(23) Evans, S. A. G.; Brakha, K.; Billon, M.; Mailley, P.; Denuault, G. Eleetrochem. Commun. 2005, 7,135-140.
(24) Shen, Y; Trauble, M.; Wittstock, G. Anal. Chem. 2008, 80, 750-759.
(25) Eckhard, K.; Sehuhmann, W. Eleetrochim. Aeta 2007,53,1164-1169.
(26) Fernandez, J. L.; Bard, A. 1. Anal. Chem. 2003, 75,2967-2974.
(27) Amatore, C.; Szunerits, S.; Thouin, L.; Warkoez, 1. S. 1. Eleetroanal. Chem. 2001, 500, 62-70.
(28) Baltes, N.; Thouin, L.; Amatore, C.; Heinze, J. Angew. Chem. Int. Ed. 2004,43,1431-1435.
(29) Cougnon, C.; Bauer-Espindola, K.; Fabre, D. S.; Mauzeroll, 1. Anal. Chem. 2009, 81, 3654-3659.
(30) Pendley, B. D.; Abruna, H. D. Anal. Chem. 1990,62,782-784.
(31) Fish, G.; Boueviteh, O.; Kokotov, S.; Lieberman, K.; Palanker, D.; Turovets, 1.; Lewis, A. Rev. Sei. Instrum. 1995,66,3300-3306.
93
(32) Shao, Y.; Mirkin, M. V.; Fish, G.; Kokotov, S.; Palanker, D.; Lewis, A Anal. Chem 1997,69, 1627-1634.
(33) Katemann, B. B.; Schuhmann, W. Electroanalysis 2002, 14,22-28.
(34) Sun, P.; Mirkin, M. V. Anal. Chem. 2006, 78, 6526-6534.
(35) Mauzeroll, 1.; LeSuer, R. 1. In Handbook of Electrochemistry; Zosky, C. G., Ed.; Elsevier: Oxford, 2007, p 199-211.
(36) Zhang, B.; Galusha, 1.; Shiozawa, P. G.; Wang, G.; Bergren, A 1.; Jones, R. M.; White, R. 1.; Ervin, E. N.; Cauley, C. c.; White, H. S. Anal. Chem. 2007, 79, 4778-4787.
(37) Barbero, C.; Silber, 1. J.; Sereno, L. 1. Electroanal. Chem. 1988,248, 321-340.
(38) Ballesteros Katemann, B.; Schulte, A; Schuhmann, W. Electroanalysis 2004, 16, 60-65.
(39) Yoshimoto, S.; Inukai, 1.; Tada, A; Abe, T.; Morimoto, T.; Osuka, A; Furuta, H.; Itaya, K. 1. Phys. Chem. B 2004, 108, 1948-1954.
(40) Karolien, De W.; Philippe, W.; Eduard, T. Electroanalysis 2005, 17, 263-268.
(41) Ramirez, G.; Goya, M. c.; Mendoza, L.; Matsuhiro, B.; Isaacs, M.; Chen, Y. Y.; Arévalo, M.; Henrique, 1.; Cheuquepàn, W.; Aguirre, M. 1. J. Coord. Chem. 2009, 62,2782-2791.
(42) Genshaw, M. A; Damjanovic, A; Bockris, 1. O. M. 1. Electroanal. Chem. 1967, 15, 163-172.
(43) Xiaoquan, L.; Limin, Z.; Minrui, L.; Xiaoqiang, W.; Yan, Z.; Xiuhui, L.; Guofang, Z. ChemPhysChem 2006, 7, 854-862.
(44) Xiong, H.; Guo, 1.; Amemiya, S. Anal. Chem. 2007, 79, 2735-2744.
(45) Macpherson, 1. V.; Slevin, C. 1.; Unwin, P. R. 1. Chem. Soc., Faraday Trans. 1996,92,3799-3805.
(46) Lefrou, c.; Cornut, R. ChemPhysChem 2010, Il,547-556.
94
Supporting Information
Detection of Hydrogen Peroxide Produced during the
Oxygen Reduction Reaction at Self- Assembled Thiol-
Porphyrin Monolayers on Gold using SECM and
Nanoelectrodes
Mohamed A. Mezour, Renaud Cornut, Emad Mohamed Hussien, Mario Morin, Janine Mauzeroll*
Laboratory for Electrochemical Reactive Imaging and Detection for Biological
Systems, Department of Chemistry, NanoQAM Research Centre, Université du
Québec à Montréal, C.P. 8888, Succ. Centre-ville, Montréal, QC, Canada, H3C 3P8.
1. Experimental section
AFM characterisation. The gold substrates used in AFM measurements were
prepared as mention in literature l (a gracious gift from Professor Antonella Badia at
Montreal University). The AFM images were recorded under ambient conditions
using an extended Dimension 3100 scanning probe microscope and a Nanoscope IlIa
controller (Digital Instruments/Veeco, Santa Barbara, CA). Height images were
acquired in intermittent-contact (tapping) mode with silicon probes (NCHR-type
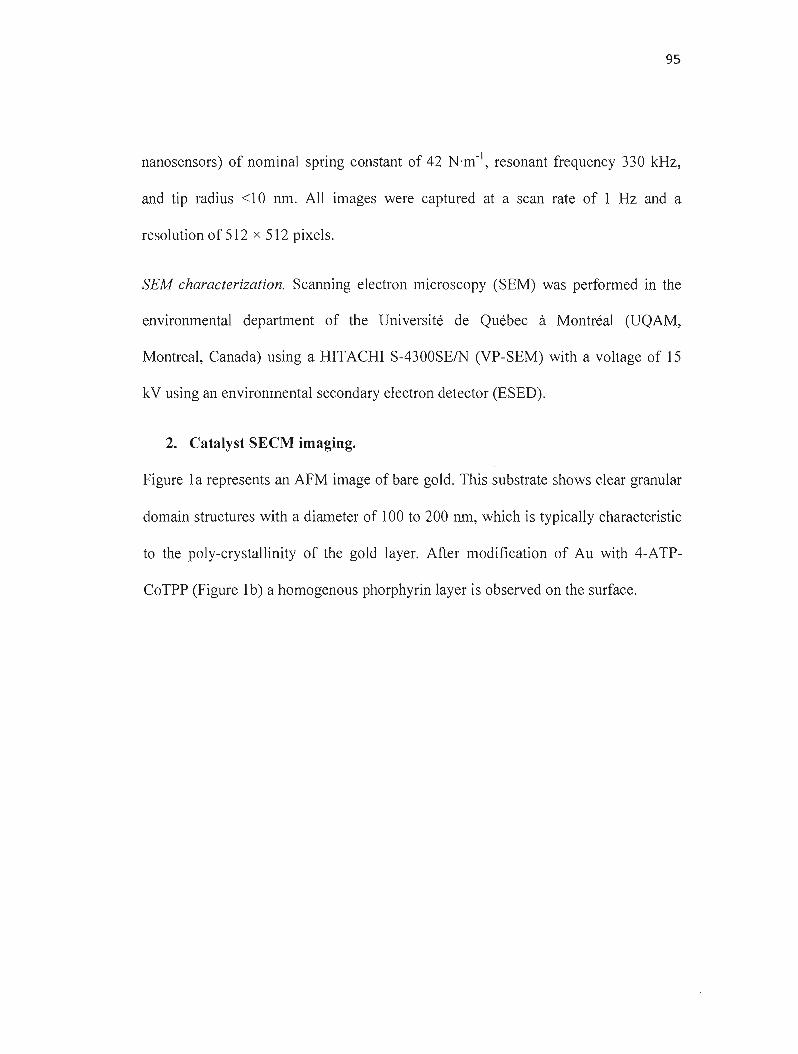
95
nanosensors) of nominal spring constant of 42 N'm- I, resonant frequency 330 kHz,
and tip radius <10 nm. Ali images were captured at a scan rate of 1 Hz and a
resolution of 512 x 512 pixels.
SEM characterization. Scanning electron microscopy (SEM) was performed in the
environmental department of the Université de Québec à Montréal (UQAM,
Montreal, Canada) using a HITACHI S-4300SEIN (VP-SEM) with a voltage of 15
kV using an environmental secondary electron detector (ESED).
2. Catalyst SECM imaging.
Figure 1a represents an AFM image of bare gold. This substrate shows clear granular
domain structures with a diameter of 100 to 200 nm, which is typically characteristic
to the poly-crystallinity of the gold layer. After modification of Au with 4-ATP
CoTPP (Figure 1b) a homogenous phorphyrin layer is observed on the surface.
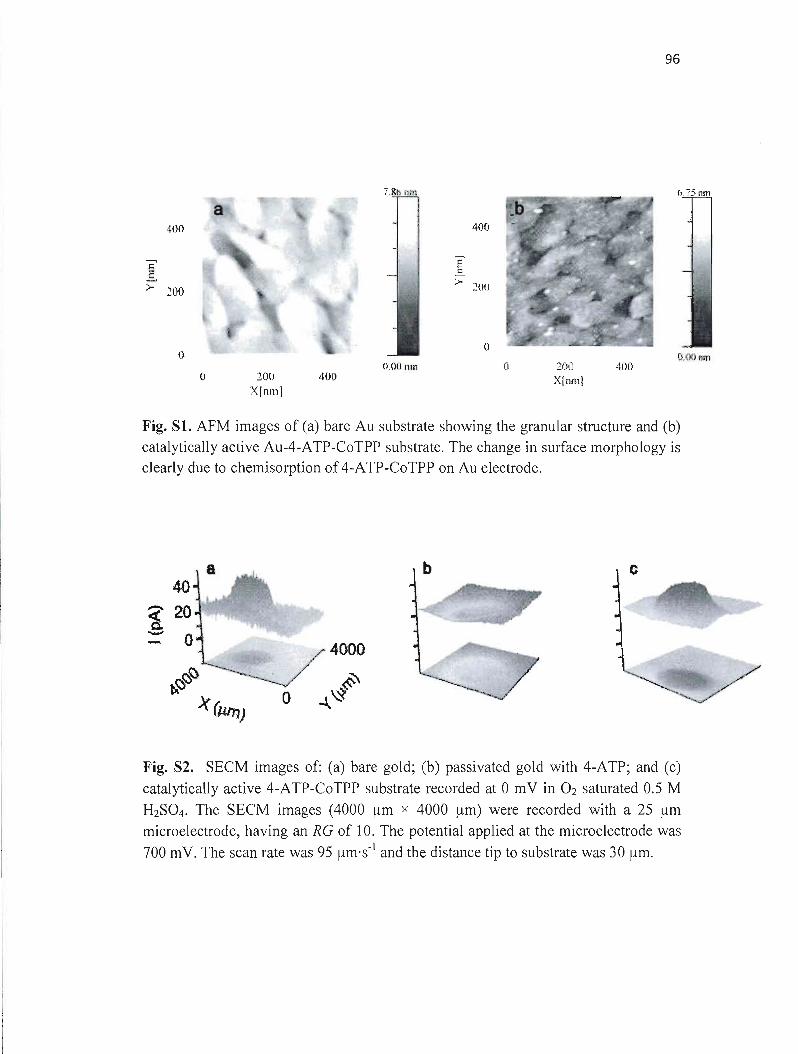
96
i.&b nm b.75nll1
a 40ü 400
E .s. ;;.- 200
1) 0.00 !lm (Ulllllll1 o ::00 4()()
o lOti 400 X[ml1l Xfnm]
Fig. SI. AFM images of (a) bare Au substrate showing the granular structure and (b)
catalytically active Au-4-ATP-CoTPP substrate. The change in surface morphology is
clearly due to chemisorption of 4-ATP-CoTPP on Au electrode.
b ç
Fig. S2. SECM images of: (a) bare gold; (b) passivated gold with 4-ATP; and (c)
catalytically active 4-ATP-CoTPP substrate recorded at 0 mV in O2 saturated 0.5 M
H2S04. The SECM images (4000 ~m x 4000 /lm) were recorded with a 25 /lm
microelectrode, having an RG of 10. The potential applied at the microelectrode was
700 mV. The scan rate was 95 /lm's- I and the distance tip to substrate was 30 /lm.
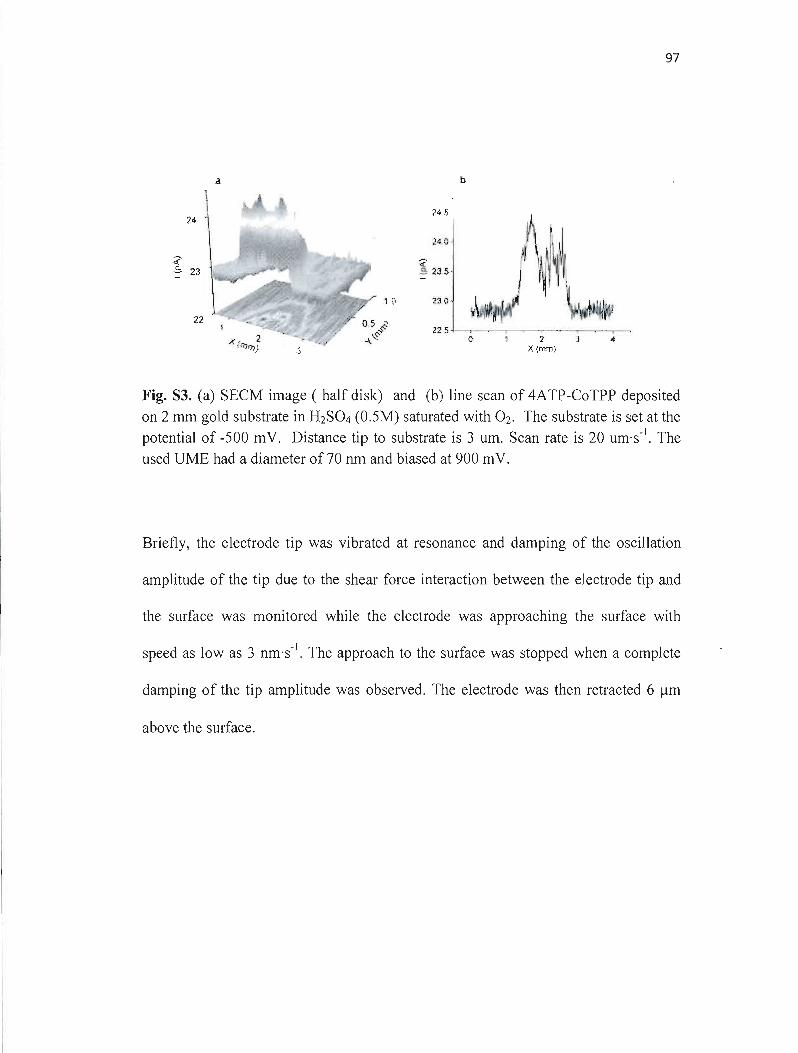
97
a b
245 24
1 () Z30
22
Fig. 83. (a) 8ECM image ( half disk) and (b) line scan of 4ATP-CoTPP deposited
on 2 mm gold substrate in H2S04 (0.5M) saturated with O2. The substrate is set at the potential of -500 mV. Distance tip to substrate is 3 um. Scan rate is 20 um·s-'. The
used UME had a diameter of70 nm and biased at 900 mV.
Briefly, the electrode tip was vibrated at resonance and damping of the oscillation
amplitude of the tip due to the shear force interaction between the electrode tip and
the surface was monitored while the electrode was approaching the surface with
speed as low as 3 nm·s- l. The approach to the surface was stopped when a complete
damping of the tip amplitude was observed. The electrode was then retracted 6 /lm
above the surface.
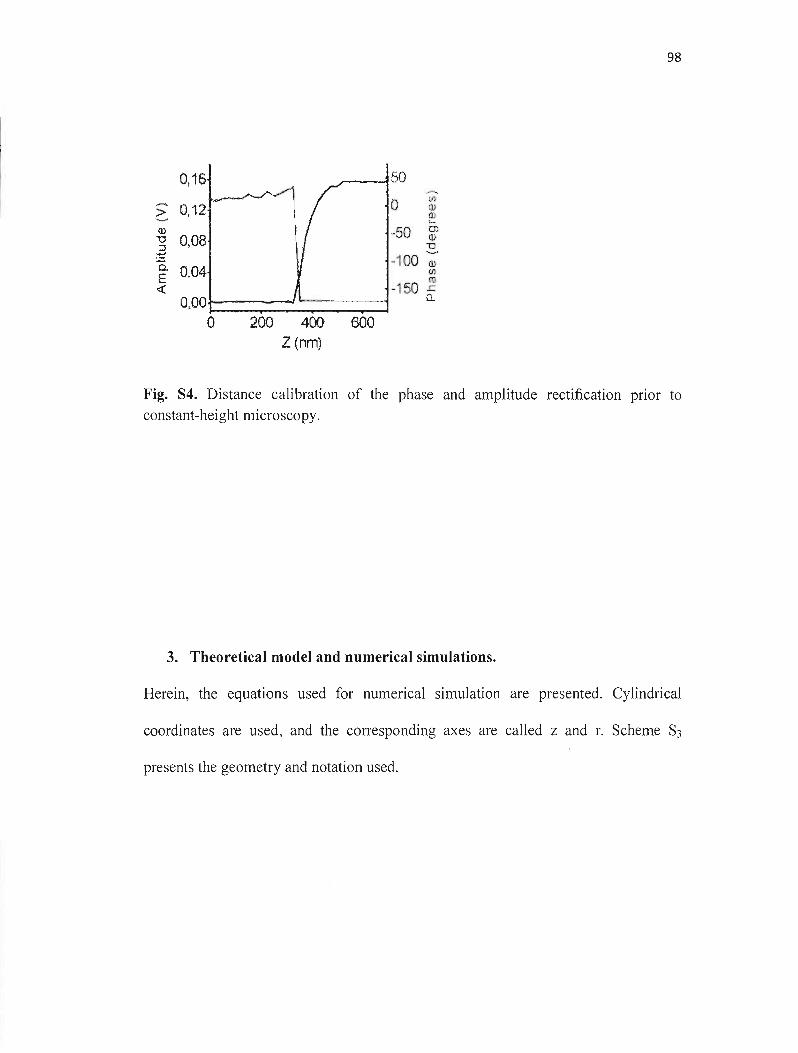
98
0,16 50 Ul
0 (J)> 0,12 0)'-" <
<1) OJ "U
--50 ai ::l
O,û8 u "--r'
Q.) = ·100a. (Jj0,04E ru « -150 .r::.
0,00 Cl..
0 200 400 600 Z (nm)
Fig. 84. Distance calibration of the phase and amplitude rectification pnor to
constant-height microscopy.
3. Theoretical model and numerical simulations.
Herein, the equations used for numerical simulation are presented. Cylindrical
coordinates are used, and the corresponding axes are called z and r. Scheme S3
presents the geometry and notation used.
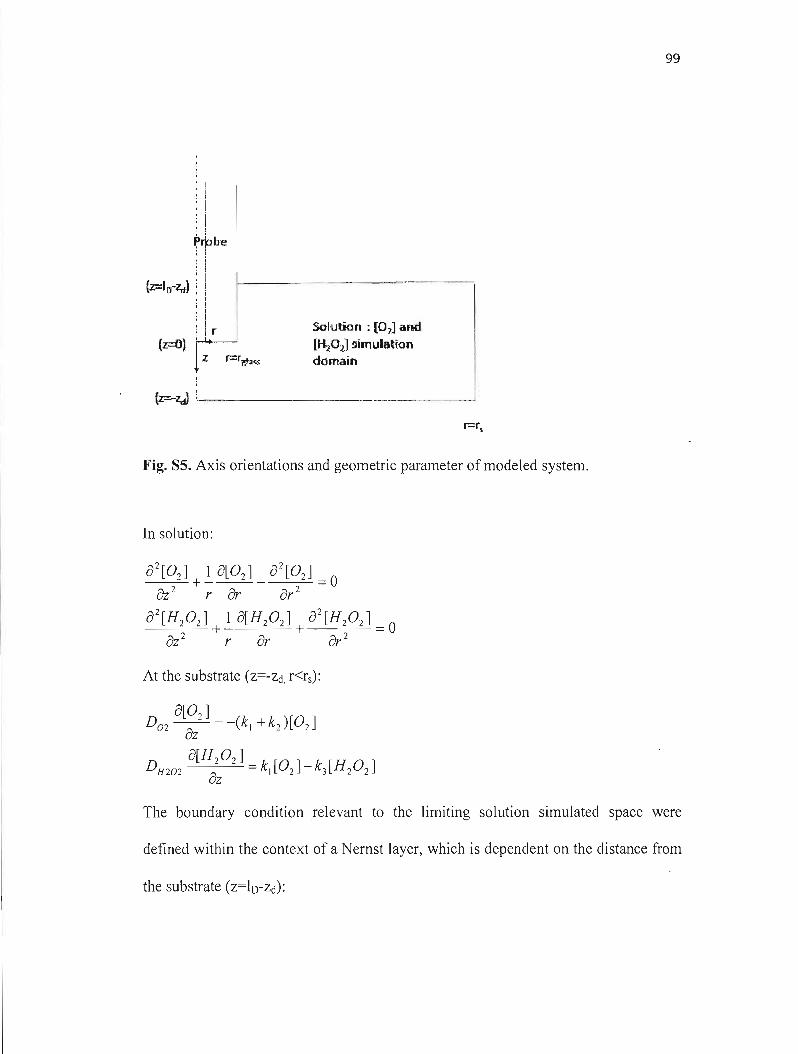
99
, 1
: 1
: 1
~~be ; 1
: i : 1
(z=Irrz.t) : 1 . '1
, 1
i ! : 1 , 1
1 1 r Solution : [O~] aFKI
(Z~) ~ [H-i0z] simulation ~ z r=rr}iO<S domain
._.. .. _ __ 1(z= z.J ;,---------
Fig. 85. Axis orientations and geometric parameter of modeled system.
In solution:
202[02]+! 0[02]+ 0 [02 ] =0
2OZ2 r Or or
02[H20 2]+! 0[H20 2]+02[H20 2] =0 OZ2 r or or 2
At the substrate (Z=-Zd. r<rs):
The boundary condition relevant ta the limiting solution simulated space were
defined within the context of a Nernst layer, which is dependent on the distance from
the substrate (z=lo-zd):
100
[°2 ] =[02 Loi [H 2 0 2 ]=0
At the tip (z=O, r.sa):
[H 20 2 ]=Û
D 0[02] - -'-D 0[H20 2]O2 oZ - H 20 2 oz
Along the insulating regions of the tip
(z=O, a<r.srglasS) :
0[H20 2] = 0[°2] = 0 oz oz
And (F rglass , Z20) :
0[H20 2 ] = 0[°2] =0 or or
The Comsol report corresponding to previously detailed equations where the probe
radius is a=12.5 microns, the surrounding glass thickness rglass=125 microns, the
substrate radius rs=1.5 mm, tip substrate distance d=30 microns, Nersnt layer
thickness 10 =230 microns, Oz diffusion coefficient, Do, =2.0 1O-5cmz/s, HzOz
diffusion coefficient DH 0 =1.6 10-5 cmz/s, and Oz concentration in solution 22
[Oz]sol=0.27 mmol/L is provided below.
COMSOL Model Report
Table of Contents
-Constants
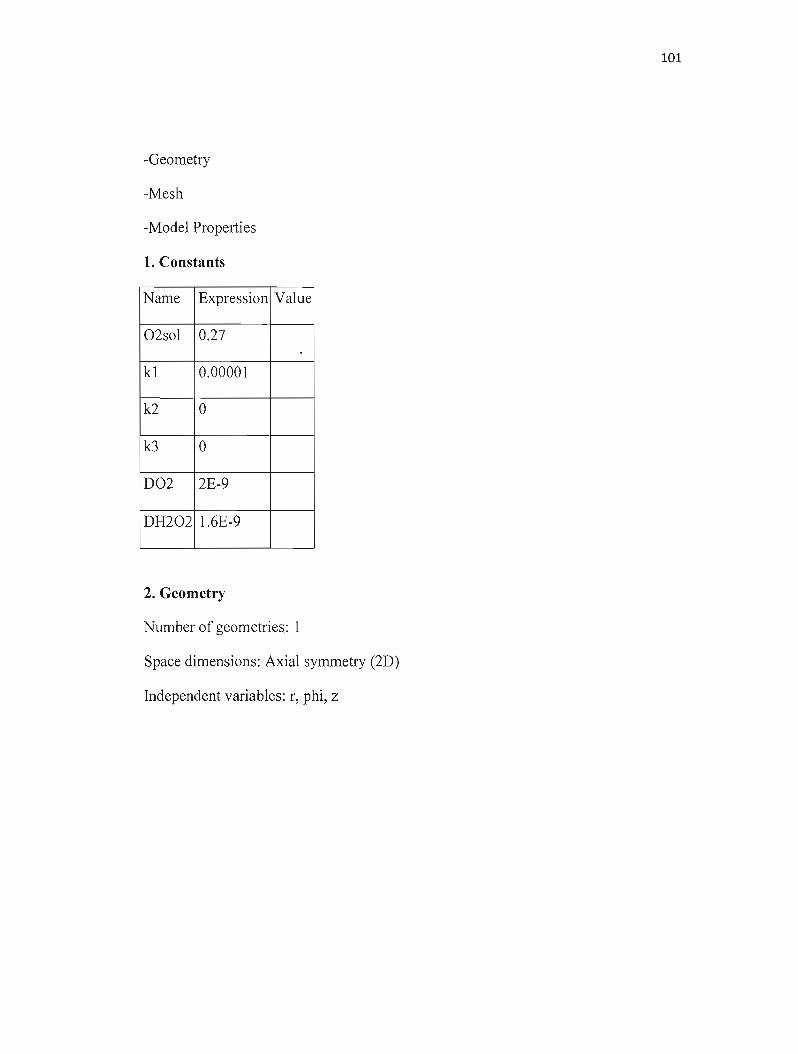
101
-Geometry
-Mesh
-Model Properties
1. Constants
Name Expression Value
02s01 0.27
k1 0.00001
k2 0
k3 0
D02 2E-9
DH202 1.6E-9
2. Geometry
Number of geometries: 1
Space dimensions: Axial symmetry (2D)
Independent variables: r, phi, Z
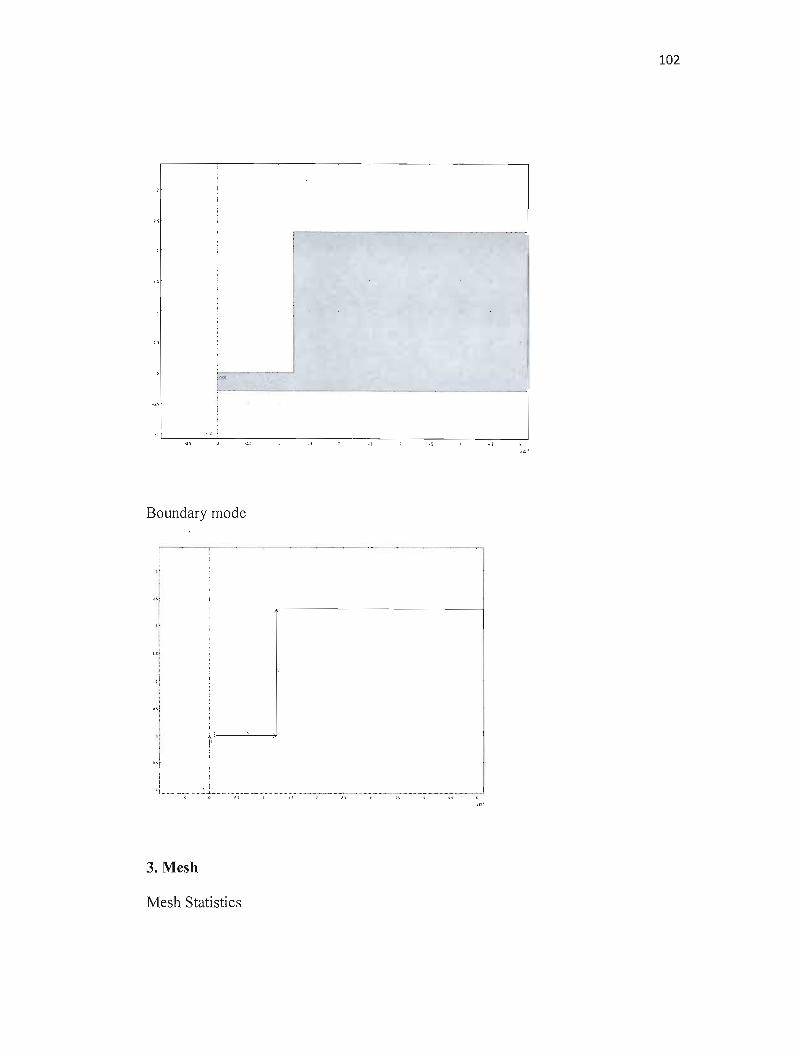
102
L_i'"'.._ .__..__.
! i
".::: i
Boundary mode
i
..1 ! !
,1 !
.... '
3. Mesh
Mesh Statistics
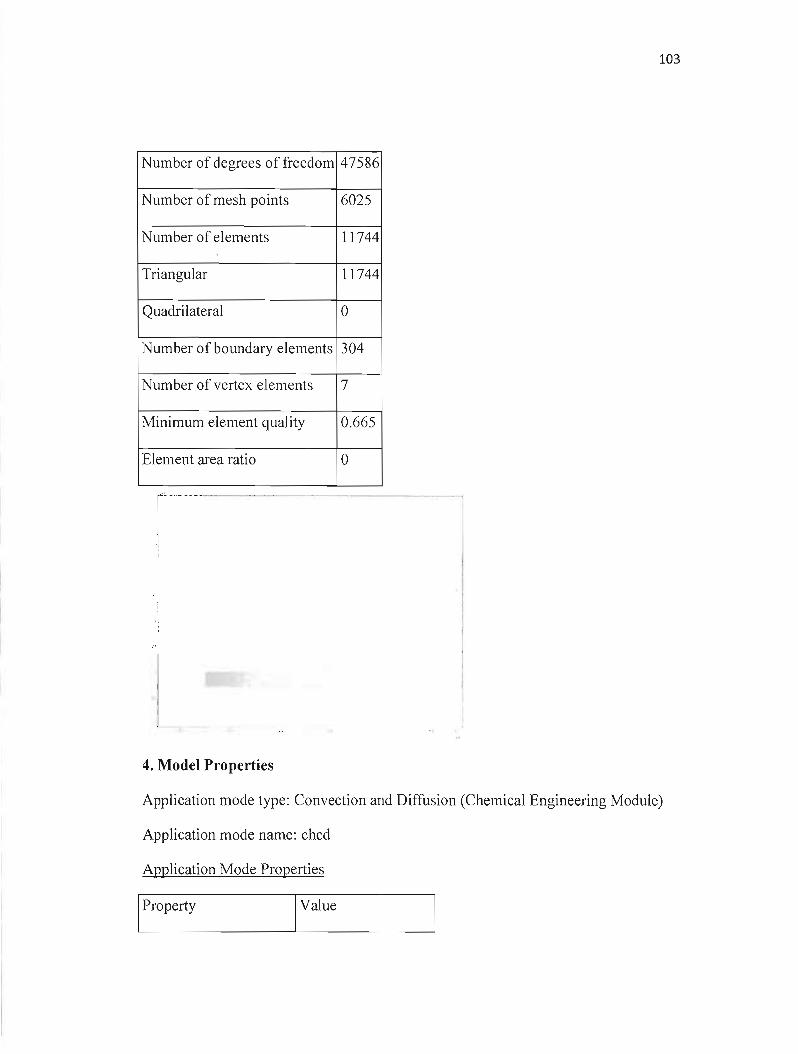
103
Number of degrees of freedom 47586
Number of mesh points 6025
Number of elements 11744
Triangular 11744
Quadrilateral 0
Number of boundary elements 304
Number of vertex elements 7
Minimum element quality 0.665
Element area ratio 0
-_._-- .__ ..__.._r"'--!1
4. Model Properties
Application mode type: Convection and Diffusion (Chemical Engineering Module)
Application mode name: chcd
Application Mode Properties
l_p_ro_p_e_rt_y I_v_a_lu_e _

104
Default element type Lagrange - Quadratic
Analysis type Stationary
Equation form Non-conservative
Equilibrium assumption Off
Frame Frame (ref)
Weak constraints Off
Constraint type Ideal
Variables
Dependent variables: 02, H202
Shape functions: shlag(2,'02'), shlag(2,'H202')
105�
Boundary Settings
Boundary 1,4-5,7� 2 3 6
Type InsulationiSy� Flux Flux Concentration
rnrnetry
Inward flux mol/(rn2 , f {{O'Ol {ndflux_H202_chcd {O;O}
(N)� (k1 +k2)*02;k1 *02- ;q} k3*H202}
·s)
Concentrati mol/rn3 {O;O} {O;O} {O;O} {02sol;0}
on (cO)
Subdomain Settings�
Subdomain 1�
Diffusion coefficient (D) m2/s {D02;DH202}�
Reference
(1) Norman, L. L.; Badia, A. Langmuir 2007, 23,10198-10208.
(2) Lu, X.; Lv, B.; Xue, Z.; Li, M.; Zhang, L.; Kang, 1. Thin Solid Films 2005,488,230-235.