Embed Size (px)
Citation preview
lable at ScienceDirect
Dyes and Pigments 110 (2014) 72e79
Contents lists avai
Dyes and Pigments
journal homepage: www.elsevier .com/locate/dyepig
Spectroscopic and photothermal characterization of annatto:Applications in functional foods
Letícia F. Santos a, Vanessa M. Dias b, Viviane Pilla a, *, Ac�acio A. Andrade a,Leandro P. Alves c, Egberto Munin c, Viviane S. Monteiro b, S�ergio C. Zilio a, 1
a Universidade Federal de Uberlandia e UFU, Av. Jo~ao Naves de �Avila 2121, CEP 38.400-902 Uberlandia, MG, Brazilb Universidade do Vale do Paraíba e UNIVAP, Av. Shishima Hifumi 2911, CEP 12244-000 S~ao Jos�e dos Campos, SP, Brazilc Universidade Camilo Castelo Branco e UNICASTELO, Rodovia Presidente Dutra Km 138, CEP 12247-004 S~ao Jos�e dos Campos, SP, Brazil
a r t i c l e i n f o
Article history:Available online 21 May 2014
Keywords:AnnattoSpectroscopyFluorescenceThermal effectsFunctional foodColorific
* Corresponding author. Tel.: þ55 34 32394190.E-mail addresses: [email protected], viviane
1 Instituto de Física de S~ao Carlos-USP, Av. TraCEP13560-970 S~ao Carlos, SP, Brazil (Permanent addr
http://dx.doi.org/10.1016/j.dyepig.2014.05.0180143-7208/© 2014 Elsevier Ltd. All rights reserved.
a b s t r a c t
Dyes are among the most common additives used primarily to intensify, compensate or add color tomanufactured products. The major color detected in annatto seeds comes from carotenoids bixin(C25H30O4) and norbixin (C24H28O4), depending on the extraction method. This article presents ab-sorption and fluorescence spectroscopic characterizations of annatto extracted in aqueous solutionsfrom seeds of the tropical shrub Bixa orellana L. Extractions from seeds were performed using aqueoussolution (at 98 �C) with different potential of hydrogen values (pH 6.5e11.2), and the results werecompared to those obtained with chemical extraction methods using other solvents. Thermo-opticalparameters, such as refractive index temperature coefficient (dn/dT), thermal diffusivity (D), fractionthermal load (4) and quantum yield (h) were determined for annatto solutions. Finally, the effectivenessof using of different concentrations of annatto dye in bread preparation is investigated as a functionalfood possibility.
© 2014 Elsevier Ltd. All rights reserved.
1. Introduction
Foods provide the necessary nutrients for human developmentand maintenance and are, therefore, of vital importance to humanexistence. The nutritional and functional properties of foodsdepend on active compounds that generate beneficial health effects[1,2]. One of the most important aspects of food marketing is itsvisual appearance, as depicted via the color and appearance of theproduct. Additives are applied to foods for numerous reasons,including prolonging durability, enriching aroma, imparting anattractive color or impeding the proliferation of microorganisms[3e5]. Among the most common additives used in the food in-dustry, synthetic and natural dyes are used to intensify, compensateor add color to a manufactured product, thereby maintaining apleasant and attractive appearance that resembles the naturalproduct. Synthetic dyes, such as eritrosine, ponceau and tartrazine,remain in wide use, despite ongoing controversies arising from
[email protected] (V. Pilla).balhador S~ao Carlense 400,ess).
their possible noxious effects, including toxic and mutagenic ac-tions [6e11]. However, the demand for natural dyes, such as cur-cumin, paprika, carmine and annatto, has increased due to theglobal trend of maintaining good health and reducing the risk ofdisease.
Annatto pigment is an important source of natural colorant usedin food industries, textiles, and cosmetic and pharmaceuticalproducts [1,3,12e16]. Commonly used in foods, the annatto dye isextensively applied in form of a colorific that is composed of maizeflour mixed with powdered annatto or an oily extract of annattothat may or may not contain salt and edible oils [12]. The red resinthat can be found in the pericarp of annatto seeds derived from fruitof the tropical tree Bixa orellana L. is themain substance responsiblefor the yellow-orange-red range of the dye [6,12,16e18]. Severalcarotenoids, including bixin and norbixin, can be obtained fromannatto seeds, depending on the extraction method used[1,5,6,17,19]. The following three commercial processes have beenapplied to extract carotenoid pigment from dehydrated annattoseeds: indirect extraction with solvents, direct extraction usingaqueous alkali solutions and direct extraction using oil [1,5,6]. Theindirect extraction method produces concentrated extracts thatcontain mainly cis-bixin (C25H30O4) and much lesser quantities of
L.F. Santos et al. / Dyes and Pigments 110 (2014) 72e79 73
trans-bixin and cis-norbixin (C24H28O4) [20,21]. The oil extractionproduces a dye that is primarily in the form of bixin [1,5]. Aqueousalkali extraction saponifies the methyl group of the bixin, produc-ing norbixin as the principal natural dye [4,5,22,23]. An intense redcoloration indicates the presence of concentrated bixin, which isliposoluble, while yellow coloration indicates predominance ofnorbixin. Bixin is a carotenoid with high antioxidant propertiesbecause its conjugated double-bond system constitutes an excel-lent captor of free radicals [24e26]. Bixin may have great potentialfor improving human health because it is easily absorbed and is aneffective biological singlet molecular-oxygen quencher, which mayprovide protection for cells and tissues [10,27,28]. Annatto has alsobeen reported to exhibit antimicrobial activity [29]. Furthermore,bixin and norbixin produce opposite effects on glycemia and lip-idemia in diabetic rats [30].
The chemical environment involved in the extraction of dyepigments can have important effects on their absorption andemission spectra, their stabilization and thermal parameters, andother properties [5,31]. Therefore, it is important to obtainextraction-specific spectroscopic and thermo-optical character-izations for natural dyes. The present work reports the absorptionand fluorescence spectroscopic and thermo-optical properties ofannatto extracted from seeds of the tropical shrub Bixa orellana L.Spectroscopic measurements were obtained for different concen-trations of annatto extracts in aqueous solutions with differentpotential of hydrogen (pH) values. The annatto samples' thermo-optical properties, such as the refractive index temperature co-efficients (dn/dT) and the thermal diffusivity (D), fraction thermalload (4) and radiative quantum efficiency (h) values, were deter-mined using photothermal techniques. The results obtained forannatto extracted in aqueous solutions are compared with thoseobtained for cis-bixin extracted from annatto seeds and com-mercial colorifics using other solvents (acetone, toluene andchloroform). In addition, we investigated the functional food po-tential in applying different colorant concentrations to breadpreparation.
IðtÞ ¼ Ið0Þh1� ðq=2Þtan�1
�2mV
h�ð1þ 2mÞ2 þ V2
�tc
.2t þ 1þ 2mþ V2
i�1�i2; (3)
2. Photothermal technique
The thermal lens (TL) effect is created when the excitation laserbeam passes through a sample of thickness L, and the absorbedenergy is converted into heat. In TL experiments [32,33] employinga two-beam (pump and probe) configuration, the heat sourceprofile, Q(r), is proportional to the Gaussian intensity profile of theexcitation beam, which is expressed as Ie(r) ¼ (2Pe/pwe
2) exp(�2r2/we
2), where Pe is the power of the excitation beamwith radius we atthe sample. The temporal evolution of the temperature profile,DT(r, t), of the sample can be obtained by the heat conductionequation. In experiments that use short excitation pulses, heatdiffusion can be neglected, and DT(r, t) is proportional to theGaussian intensity profile of the excitation beam, Ie(r). For long-pulse or continuous-wave (cw) experiments, however, the effectof heat diffusion is important, and, consequently, DT(r, t) is widerthan Ie(r). For t » tc (where tc is the characteristic heat diffusiontime), the on-axis temperature rise is proportional to the absorbedexcitation power (Pe,abs) and inversely proportional to the thermalconductivity K(DT(0, t)f Pe,abs/K) but is independent ofwe. Heatingchanges the refractive index of the material and causes a thermallyinduced phase change, DfTH, expressed as follows [32]:
Zt
0 �1
DfTH ¼ðq=tcÞ0
ð1þ 2t =tcÞh1� exp
���2r2
.w2
e
�.ð1þ 2t0=tcÞ
�idt0;
(1a)
and q ¼ �4Pe;abs�Klp
��1ðdn=dTÞ; (1b)
where Pe,abs ¼ PeaLeff, a (cm�1) is the optical absorption coefficientat the excitation wavelength (le), Leff ¼ (1 � e�aL)/a is the effectivelength, lp is the wavelength of the probe beam, dn/dT is therefractive index temperature coefficient, and 4 is the absolutenonradiative quantum efficiency, which represents the fraction ofthe absorbed energy converted into heat. The characteristic ther-mal time constant tc is expressed as follows [32,33]:
tc ¼ w2e
.4D; (2)
where we is the excitation beam radius at the sample, D ¼ K/rCis the thermal diffusivity (cm2/s), K is the thermal conductivity(W/cm K), r is the density (g/cm3), and C is the specific heat (J/g K).
The electric field of the probe beam as it leaves the sample canbe expressed as 3S(r1) ¼ 3(r1) � exp(�iDfNL), where DfNL is thephase change caused by the nonlinearity of the sample (which mayinclude Kerr and thermal components), 3(r1) is the field of theprobe beam at the entrance face of the sample, r1 ¼ [(x12 þ y1
2)/w12]1/
2, and w1 is the beam radius. In this case, DfNL is approximatelyequal to DfTH and is expressed by Eq. (1a) and (1b). The field 3(r2) ata point (x2, y2, zþ d) in the observation plane P, located at a distanced away from the sample, is given by the sum of the optical fieldscaused by all points in the P plane [34]. The variation in the probebeam on-axis intensity, IðtÞzj 3ðr2 ¼ 0Þj2, can be calculated at r2 ¼ 0(central part of the probe laser beam) in the cw excitation regime,as follows [32,33]:
where I(0) is the on-axis intensity when t is zero; m ¼ (w1/we)2,V ¼ z1/zop, z1 is the distance between the sample and probe beamwaist, zop ¼ pwop
2 /lp is the probe beam Rayleigh range, zop « z2(where z2 (cm) is the distance between the sample and TL de-tector) and wop is the probe beam radius at the focus withwavelength lp.
The thermally induced distortion of the laser beam as it passesthrough the sample is described by the optical path-length (S)change (ds/dT ¼ L�1 dS/dT), which results in lensing at the sample.The propagation of a probe laser beam through the TL will result ineither spreading (ds/dT < 0) or focusing (ds/dT > 0) of the beam,depending mainly on the temperature coefficients of the electronicpolarizability of the sample, stress and thermal expansion (in thecase of liquid samples, ds/dT z dn/dT).
In the dual beam mode-mismatched configuration withexcitation and probe beams, the normalized transient signalamplitude is approximately the phase difference (q) of the probebeam between r ¼ 0 and r ¼
ffiffiffi2
pwe that is induced by the pump
beam, given by Eq. (1b). The normalized parameter, Q ¼ �q/PeaLeff, for liquid samples can be expressed using Eq. (1b) asfollows [35,36]:
L.F. Santos et al. / Dyes and Pigments 110 (2014) 72e7974
Q ¼ 4�Klp
��1dn=dT; (4a)
and 4 ¼ 1� hle=⟨lem⟩; (4b)
where <lem> is the average emission wavelength and h is thefluorescence quantum efficiency or quantum yield.
Under conditions utilizing relatively high excitation beam po-wer, analysis of the ring patterns generated in a laser beam (atobservation plane P) due to thermally induced self-phase-modulation (TSPM) effects, denominated as the conical diffraction(CD) technique [31,37,38], was employed as a simple alternativemethod for nonradiative quantum efficiency measurements. SPMeffects can be understood from the ability of the excitation beam toinduce spatial variations in the refractive index, which leads to aphase shift that depends on the transverse distance from the beamaxis. This transverse self-phase modulation [34,37,39,40] is alsoimplicated in the emergence of rings in the pattern of transmittedlight upon the change of phase that occurs when the nonlinearityDfNL » 2p. When the nonlinearity is a thermally induced phasechange (DfTH), i.e., DfNL ¼ DfTH, the number of rings N z DfNL/2p[39,41] can be determined as a function of Pe using the followingexpression [42,43]:
N ¼�4aLeff
��2pKlp
��1ðdn=dTÞPe: (5)
After traversing the nonlinear medium, interference occurs suchthat rays within the laser beam that have the same wave vectorcome out parallel with different phases. The interference will beconstructive or destructive in the plane of the observation ifDfNL(r1) � DfNL(r2) ¼ pp, where p is an even or odd integer; this isthe origin of the diffraction rings [39,40].
Table 1Ingredients for the preparation of bread with annatto.
Ingredients (%) F1Reference
F2 F3 F4
Wheat flour 60.0 59.5 59.0 57.0Sugar 3.6 3.6 3.6 3.6Fat 1.8 1.8 1.8 1.8Yeast biological 0.6 0.6 0.6 0.6Salt 1.0 1.0 1.0 1.0Water 33.0 33.0 33.0 33.0Colorific [12] e 0.5 1.0 3.0Water lost 8.4 7.5 6.4 5.8
3. Experimental
3.1. Annatto extracted from seeds of the tropical shrub Bixa orellanaL. and commercial colorant
The experiments herein used seeds from the fruit of urucum(Bixa orellana) trees from Jacareí city (state of S~ao Paulo/Brazil) andUberlandia city (state of Minas Gerais/Brazil) and commercialcolorific. After opening the fruits to assess the seeds and remove thepericarp, the seeds were collected and cleansed, and those seedsselected were macerated for the experiment. For indirect extrac-tion, 3.5mg of the powdermass was added to 0.5mL of acetone and4.5 mL of chloroform at room temperature. The resulting solutionwas filtered, and the final volume was obtained by adding 5 mL ofchloroform. Samples of different concentrations were obtainedfrom aliquots of the concentrated solution in chloroform. The sameextraction processes were applied to extract annatto using tolueneor acetone in the place of chloroform. For direct extraction inaqueous solutions, 3 mg of the urucum powder was added to 10 mLof distilled water (~98 �C), and the solution was filtered. Samples ofdifferent concentrations were obtained using 0.4, 0.8, 1.5, 3, 6, 9, 12,15, 18 and 21 mg of urucum, each extracted separately in 10 mL ofaqueous solution, and the solution was filtered. Another set ofsamples were extracted in aqueous solution towhich the hydroxideof ammonium was added (NH4OH, pH 12.81 and molarity 4), andthe solution was filtered. These samples were prepared usingdifferent amounts of NH4OH (0.001, 0.005, 0.025, 0.05, 0.5, 0.1, 0.3,0.5, 0.7, 0.9 and 1 mL) while maintaining a fixed mass of annatto(15 mg) as well as using different annatto masses (0.4, 0.8, 1.5, 3, 6,9, 12, 15, 18 and 21 mg) with a fixed value of NH4OH (0.5 mL).
The commercial colorifics were obtained in S~ao Jos�e dos Camposand Jacareí cities in S~ao Paulo/Brazil. Five different batches of the
commercial brand were analyzed and the results presented. Thepowdermass of each commercial samplewasmeasured (~14.3mg),and each annatto extraction was performed with acetone (0.5 mL)and chloroform (4.5 mL) at room temperature. A paper filter wasused to separate the filtrate and the solution, which was brought toits final volume by adding 5 mL of chloroform.
3.2. Spectroscopic characterization
Absorption and fluorescence spectra were obtained using a 1-cm quartz cuvette, a Carry 50 Bio Varian UV-VIS-NIR from Shi-madzu UV-3600, a Jobin-Yvon Spex Fluoro Max-2 spectrofluorim-eter and an Eclipse from Varian. The commercial refractometer wasfrom Atago RX-5000a. For pH measurements, a pH-meter HI 2221from Hanna Instruments was used. A Leica microscope (DMLB2,Heidelberg, Germany) was used for seed imaging. For imageacquisition, a digital camera (LEICA DFC280, Heidelberg, Germany)controlled by a software (LEICA IM50, version 4.0, Heidelberg,Germany) was used.
3.3. Thermo-optical measurements
The thermo-optical properties of natural dye solutions wereinvestigated using TL [36-38] and CD [31,37,38] methods. TL tran-sient measurements were performed in the mode-mismatcheddual-beam (excitation and probe) configuration. A HeeNe laser(lp¼ 632.8 nm)was used as the probe beam, and an Argon ion laser(le¼ 514.5 nm)was used as the excitation beam. The excitation andprobe beam radii at the sample were measured aswe ¼ (24.5 ± 0.5)mm at 514.5 nm and w1 ¼ (123 ± 3) mm, respectively. Absorption ofthe excitation beam generated a TL heat profile and induced aphase shift proportional to q. Modulation of the pump beamwith amechanical chopper allowed for time-resolved measurements. Thetransient curve was obtained from the weak probe beam, whichcounter-propagated in a direction that was nearly collinear withthe excitation beam. On the other hand, the conical diffractiontechnique employed a single laser beam as the excitation atle ¼ 514.5 nm. Typical ring patterns were observed when thesample was positioned at the focus of the pump beam due tothermal self-phase-modulation (TSPM) effects [31,37,38].
3.4. Bread preparation
Bread production was developed using four formulations. Thefirst was a standard or reference (F1) bread without colorific, andthe other three formulations were modified by adding colorific atconcentrations of 0.5% (F2), 1.0% (F3) and 3.0% (F4) (Table 1). Thebreads were processed using the G. Paniz method for mass ho-mogenizing (mass AR15 series 291198cd90024), fermented in afermentation cabinet and baked in an oven of the Venancio cilonedigital brand.
L.F. Santos et al. / Dyes and Pigments 110 (2014) 72e79 75
Production consisted of mixing the ingredients (Table 1) in themachine and adding small portions of water until the total mass ofthe mixture and the gluten network were obtained. The mass wasweighed and fractionated into four samples, the first of which wascalled F1. Each of the other three masses was weighed, and colorificwas added (Table 1), after which the masses, in sequence, weresubmitted to the rolling process for homogenization. Each masswas then divided to obtain a weight ranging between 400 and420 g, modeled and placed into greased shapes and taken to thefermentation chamber. The time period for mass growth was 1.5 h,and the oven temperature was 160 �C for a period of 0.5 h. Aftercompletion, the breads were stored and refrigerated at roomtemperature for a period of 21 h, after which each bread was slicedand packed.
4. Results and discussion
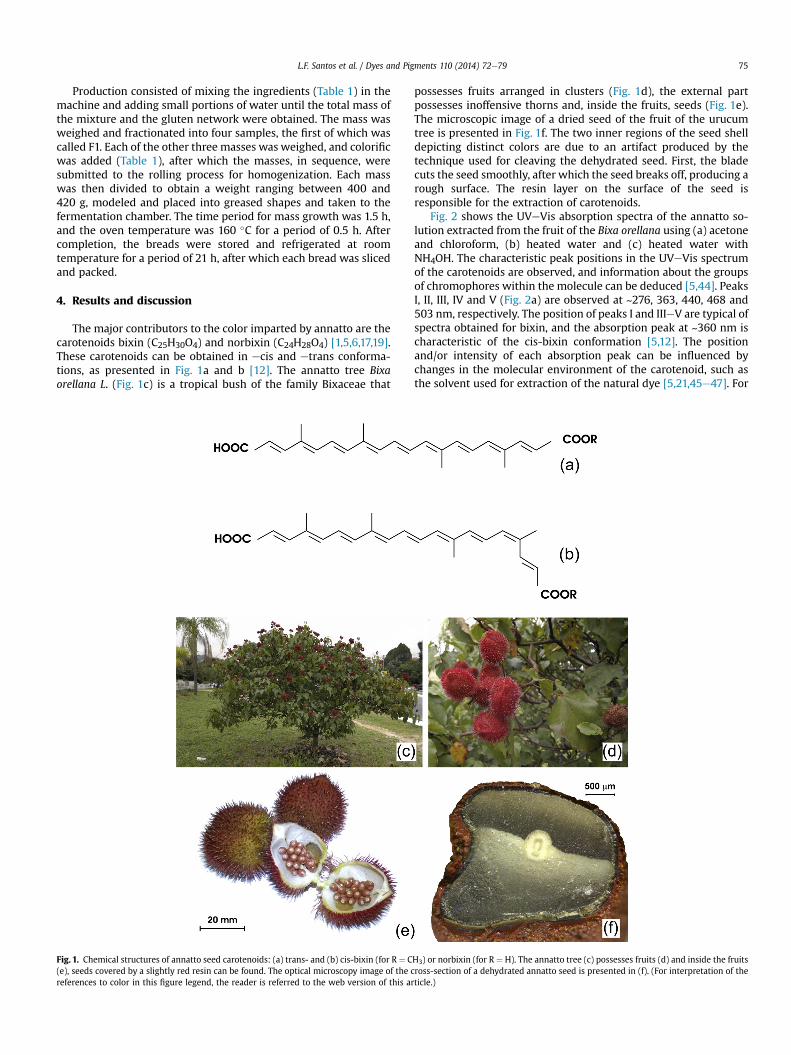
The major contributors to the color imparted by annatto are thecarotenoids bixin (C25H30O4) and norbixin (C24H28O4) [1,5,6,17,19].These carotenoids can be obtained in ecis and etrans conforma-tions, as presented in Fig. 1a and b [12]. The annatto tree Bixaorellana L. (Fig. 1c) is a tropical bush of the family Bixaceae that
Fig. 1. Chemical structures of annatto seed carotenoids: (a) trans- and (b) cis-bixin (for R ¼ C(e), seeds covered by a slightly red resin can be found. The optical microscopy image of the creferences to color in this figure legend, the reader is referred to the web version of this ar
possesses fruits arranged in clusters (Fig. 1d), the external partpossesses inoffensive thorns and, inside the fruits, seeds (Fig. 1e).The microscopic image of a dried seed of the fruit of the urucumtree is presented in Fig. 1f. The two inner regions of the seed shelldepicting distinct colors are due to an artifact produced by thetechnique used for cleaving the dehydrated seed. First, the bladecuts the seed smoothly, after which the seed breaks off, producing arough surface. The resin layer on the surface of the seed isresponsible for the extraction of carotenoids.
Fig. 2 shows the UVeVis absorption spectra of the annatto so-lution extracted from the fruit of the Bixa orellana using (a) acetoneand chloroform, (b) heated water and (c) heated water withNH4OH. The characteristic peak positions in the UVeVis spectrumof the carotenoids are observed, and information about the groupsof chromophores within the molecule can be deduced [5,44]. PeaksI, II, III, IV and V (Fig. 2a) are observed at ~276, 363, 440, 468 and503 nm, respectively. The position of peaks I and IIIeV are typical ofspectra obtained for bixin, and the absorption peak at ~360 nm ischaracteristic of the cis-bixin conformation [5,12]. The positionand/or intensity of each absorption peak can be influenced bychanges in the molecular environment of the carotenoid, such asthe solvent used for extraction of the natural dye [5,21,45e47]. For
H3) or norbixin (for R ¼ H). The annatto tree (c) possesses fruits (d) and inside the fruitsross-section of a dehydrated annatto seed is presented in (f). (For interpretation of theticle.)
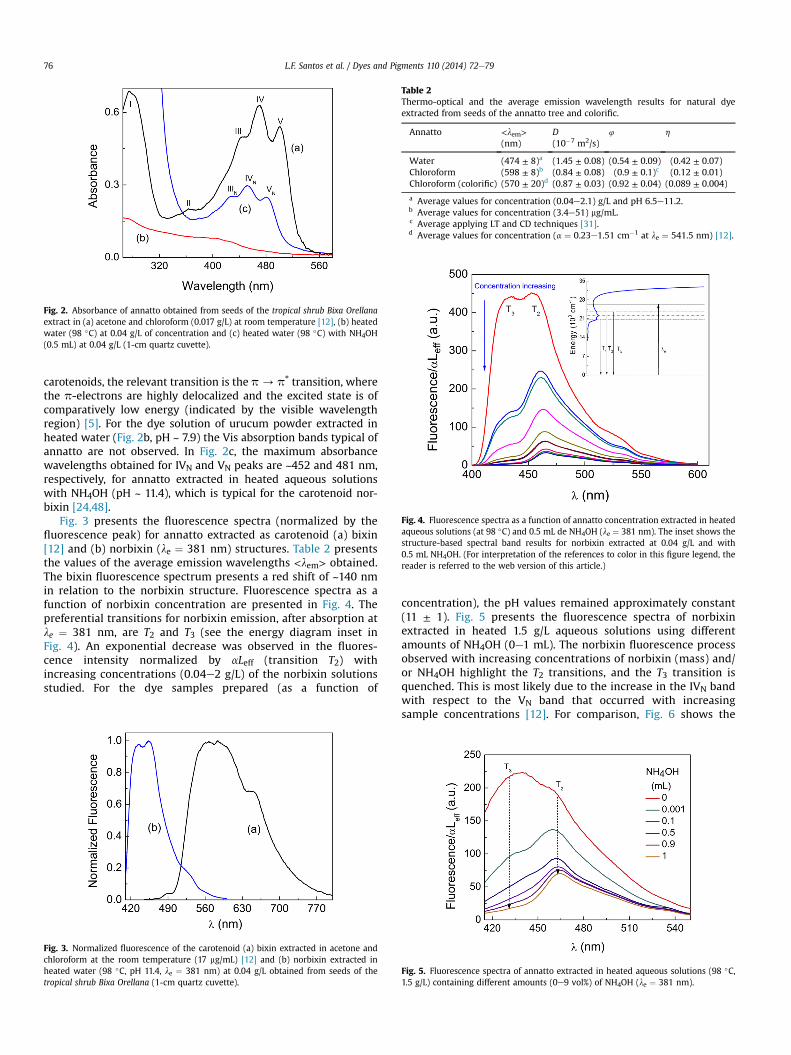
Table 2Thermo-optical and the average emission wavelength results for natural dyeextracted from seeds of the annatto tree and colorific.
Annatto <lem>(nm)
D(10�7 m2/s)
4 h
Water (474 ± 8)a (1.45 ± 0.08) (0.54 ± 0.09) (0.42 ± 0.07)Chloroform (598 ± 8)b (0.84 ± 0.08) (0.9 ± 0.1)c (0.12 ± 0.01)Chloroform (colorific) (570 ± 20)d (0.87 ± 0.03) (0.92 ± 0.04) (0.089 ± 0.004)
a Average values for concentration (0.04e2.1) g/L and pH 6.5e11.2.b Average values for concentration (3.4e51) mg/mL.c Average applying LT and CD techniques [31].d Average values for concentration (a ¼ 0.23e1.51 cm�1 at le ¼ 541.5 nm) [12].
Fig. 4. Fluorescence spectra as a function of annatto concentration extracted in heatedaqueous solutions (at 98 �C) and 0.5 mL de NH4OH (le ¼ 381 nm). The inset shows thestructure-based spectral band results for norbixin extracted at 0.04 g/L and with0.5 mL NH4OH. (For interpretation of the references to color in this figure legend, thereader is referred to the web version of this article.)
Fig. 2. Absorbance of annatto obtained from seeds of the tropical shrub Bixa Orellanaextract in (a) acetone and chloroform (0.017 g/L) at room temperature [12], (b) heatedwater (98 �C) at 0.04 g/L of concentration and (c) heated water (98 �C) with NH4OH(0.5 mL) at 0.04 g/L (1-cm quartz cuvette).
L.F. Santos et al. / Dyes and Pigments 110 (2014) 72e7976
carotenoids, the relevant transition is the p / p* transition, wherethe p-electrons are highly delocalized and the excited state is ofcomparatively low energy (indicated by the visible wavelengthregion) [5]. For the dye solution of urucum powder extracted inheated water (Fig. 2b, pH ~ 7.9) the Vis absorption bands typical ofannatto are not observed. In Fig. 2c, the maximum absorbancewavelengths obtained for IVN and VN peaks are ~452 and 481 nm,respectively, for annatto extracted in heated aqueous solutionswith NH4OH (pH ~ 11.4), which is typical for the carotenoid nor-bixin [24,48].
Fig. 3 presents the fluorescence spectra (normalized by thefluorescence peak) for annatto extracted as carotenoid (a) bixin[12] and (b) norbixin (le ¼ 381 nm) structures. Table 2 presentsthe values of the average emission wavelengths <lem> obtained.The bixin fluorescence spectrum presents a red shift of ~140 nmin relation to the norbixin structure. Fluorescence spectra as afunction of norbixin concentration are presented in Fig. 4. Thepreferential transitions for norbixin emission, after absorption atle ¼ 381 nm, are T2 and T3 (see the energy diagram inset inFig. 4). An exponential decrease was observed in the fluores-cence intensity normalized by aLeff (transition T2) withincreasing concentrations (0.04e2 g/L) of the norbixin solutionsstudied. For the dye samples prepared (as a function of
Fig. 3. Normalized fluorescence of the carotenoid (a) bixin extracted in acetone andchloroform at the room temperature (17 mg/mL) [12] and (b) norbixin extracted inheated water (98 �C, pH 11.4, le ¼ 381 nm) at 0.04 g/L obtained from seeds of thetropical shrub Bixa Orellana (1-cm quartz cuvette).
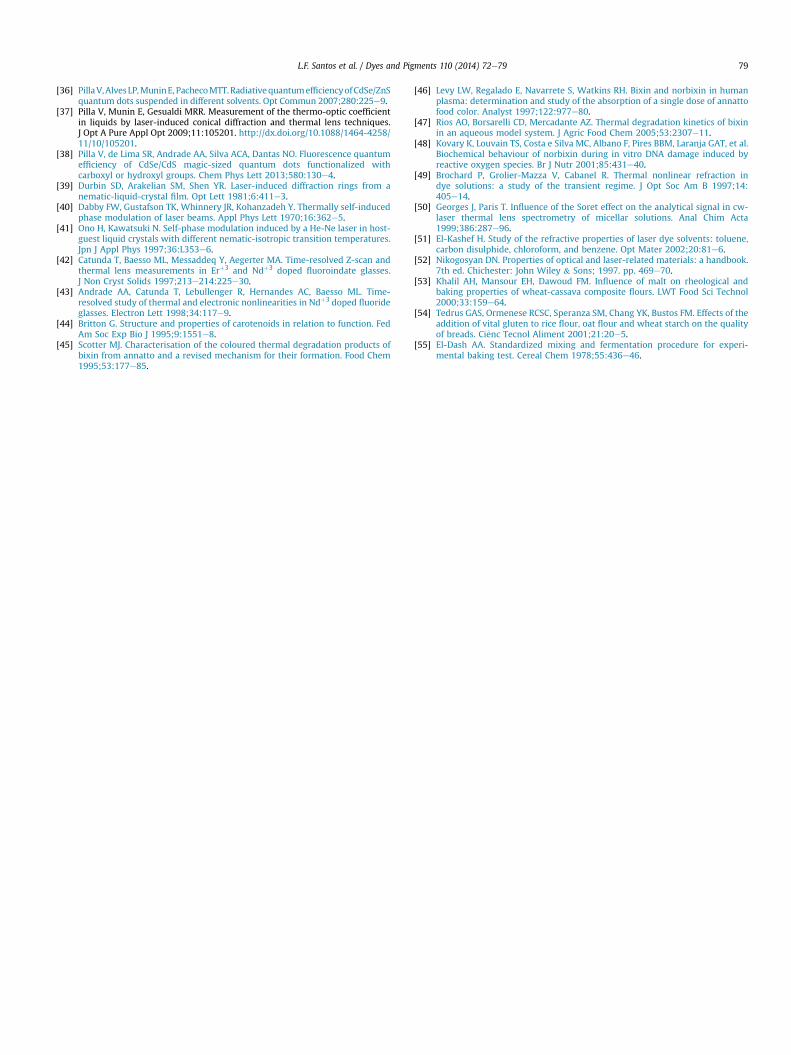
concentration), the pH values remained approximately constant(11 ± 1). Fig. 5 presents the fluorescence spectra of norbixinextracted in heated 1.5 g/L aqueous solutions using differentamounts of NH4OH (0e1 mL). The norbixin fluorescence processobserved with increasing concentrations of norbixin (mass) and/or NH4OH highlight the T2 transitions, and the T3 transition isquenched. This is most likely due to the increase in the IVN bandwith respect to the VN band that occurred with increasingsample concentrations [12]. For comparison, Fig. 6 shows the
Fig. 5. Fluorescence spectra of annatto extracted in heated aqueous solutions (98 �C,1.5 g/L) containing different amounts (0e9 vol%) of NH4OH (le ¼ 381 nm).
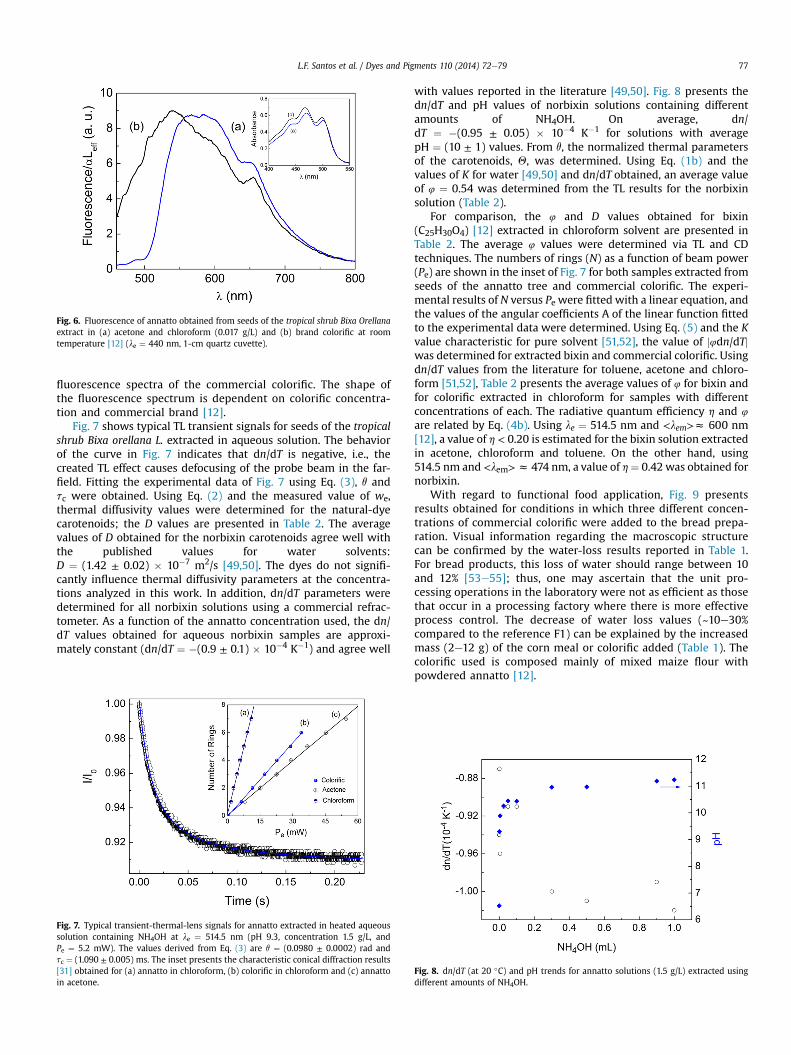
Fig. 6. Fluorescence of annatto obtained from seeds of the tropical shrub Bixa Orellanaextract in (a) acetone and chloroform (0.017 g/L) and (b) brand colorific at roomtemperature [12] (le ¼ 440 nm, 1-cm quartz cuvette).
L.F. Santos et al. / Dyes and Pigments 110 (2014) 72e79 77
fluorescence spectra of the commercial colorific. The shape ofthe fluorescence spectrum is dependent on colorific concentra-tion and commercial brand [12].
Fig. 7 shows typical TL transient signals for seeds of the tropicalshrub Bixa orellana L. extracted in aqueous solution. The behaviorof the curve in Fig. 7 indicates that dn/dT is negative, i.e., thecreated TL effect causes defocusing of the probe beam in the far-field. Fitting the experimental data of Fig. 7 using Eq. (3), q andtc were obtained. Using Eq. (2) and the measured value of we,thermal diffusivity values were determined for the natural-dyecarotenoids; the D values are presented in Table 2. The averagevalues of D obtained for the norbixin carotenoids agree well withthe published values for water solvents:D ¼ (1.42 ± 0.02) � 10�7 m2/s [49,50]. The dyes do not signifi-cantly influence thermal diffusivity parameters at the concentra-tions analyzed in this work. In addition, dn/dT parameters weredetermined for all norbixin solutions using a commercial refrac-tometer. As a function of the annatto concentration used, the dn/dT values obtained for aqueous norbixin samples are approxi-mately constant (dn/dT ¼ �(0.9 ± 0.1) � 10�4 K�1) and agree well
Fig. 7. Typical transient-thermal-lens signals for annatto extracted in heated aqueoussolution containing NH4OH at le ¼ 514.5 nm (pH 9.3, concentration 1.5 g/L, andPe ¼ 5.2 mW). The values derived from Eq. (3) are q ¼ (0.0980 ± 0.0002) rad andtc ¼ (1.090 ± 0.005) ms. The inset presents the characteristic conical diffraction results[31] obtained for (a) annatto in chloroform, (b) colorific in chloroform and (c) annattoin acetone.
with values reported in the literature [49,50]. Fig. 8 presents thedn/dT and pH values of norbixin solutions containing differentamounts of NH4OH. On average, dn/dT ¼ �(0.95 ± 0.05) � 10�4 K�1 for solutions with averagepH ¼ (10 ± 1) values. From q, the normalized thermal parametersof the carotenoids, Q, was determined. Using Eq. (1b) and thevalues of K for water [49,50] and dn/dT obtained, an average valueof 4 ¼ 0.54 was determined from the TL results for the norbixinsolution (Table 2).
For comparison, the 4 and D values obtained for bixin(C25H30O4) [12] extracted in chloroform solvent are presented inTable 2. The average 4 values were determined via TL and CDtechniques. The numbers of rings (N) as a function of beam power(Pe) are shown in the inset of Fig. 7 for both samples extracted fromseeds of the annatto tree and commercial colorific. The experi-mental results of N versus Pe were fitted with a linear equation, andthe values of the angular coefficients A of the linear function fittedto the experimental data were determined. Using Eq. (5) and the Kvalue characteristic for pure solvent [51,52], the value of j4dn/dTjwas determined for extracted bixin and commercial colorific. Usingdn/dT values from the literature for toluene, acetone and chloro-form [51,52], Table 2 presents the average values of 4 for bixin andfor colorific extracted in chloroform for samples with differentconcentrations of each. The radiative quantum efficiency h and 4
are related by Eq. (4b). Using le ¼ 514.5 nm and <lem>z 600 nm[12], a value of h < 0.20 is estimated for the bixin solution extractedin acetone, chloroform and toluene. On the other hand, using514.5 nm and <lem>z 474 nm, a value of h¼ 0.42 was obtained fornorbixin.
With regard to functional food application, Fig. 9 presentsresults obtained for conditions in which three different concen-trations of commercial colorific were added to the bread prepa-ration. Visual information regarding the macroscopic structurecan be confirmed by the water-loss results reported in Table 1.For bread products, this loss of water should range between 10and 12% [53e55]; thus, one may ascertain that the unit pro-cessing operations in the laboratory were not as efficient as thosethat occur in a processing factory where there is more effectiveprocess control. The decrease of water loss values (~10e30%compared to the reference F1) can be explained by the increasedmass (2e12 g) of the corn meal or colorific added (Table 1). Thecolorific used is composed mainly of mixed maize flour withpowdered annatto [12].
Fig. 8. dn/dT (at 20 �C) and pH trends for annatto solutions (1.5 g/L) extracted usingdifferent amounts of NH4OH.
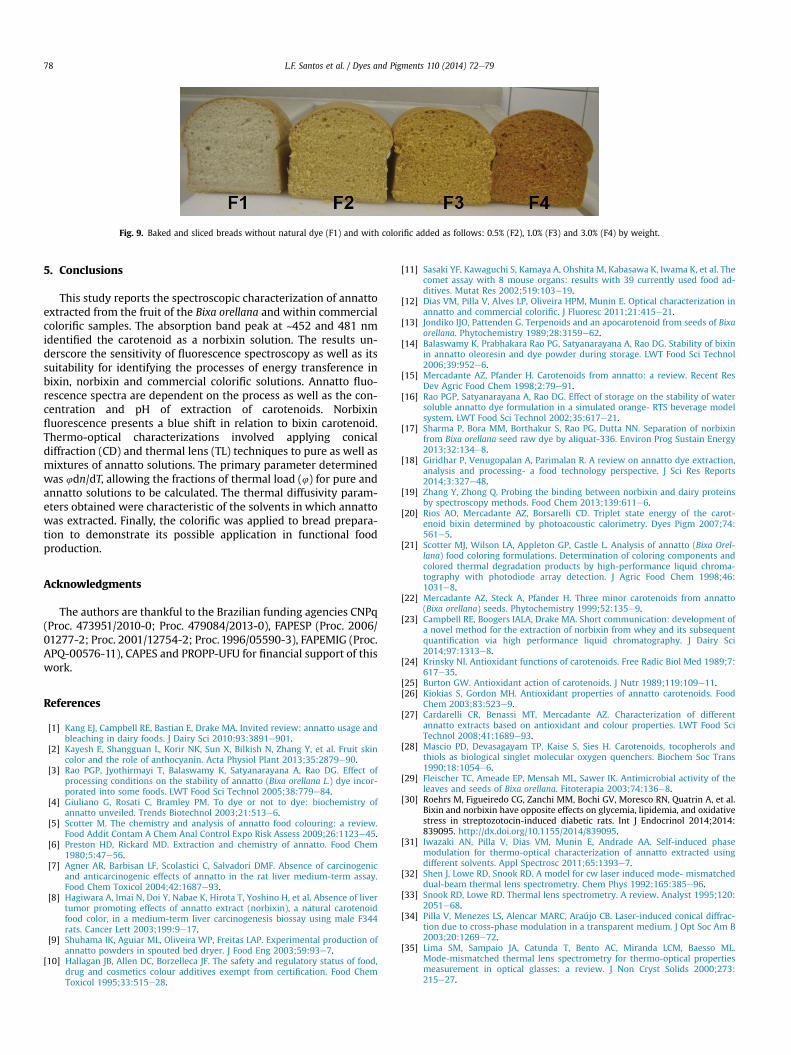
Fig. 9. Baked and sliced breads without natural dye (F1) and with colorific added as follows: 0.5% (F2), 1.0% (F3) and 3.0% (F4) by weight.
L.F. Santos et al. / Dyes and Pigments 110 (2014) 72e7978
5. Conclusions
This study reports the spectroscopic characterization of annattoextracted from the fruit of the Bixa orellana and within commercialcolorific samples. The absorption band peak at ~452 and 481 nmidentified the carotenoid as a norbixin solution. The results un-derscore the sensitivity of fluorescence spectroscopy as well as itssuitability for identifying the processes of energy transference inbixin, norbixin and commercial colorific solutions. Annatto fluo-rescence spectra are dependent on the process as well as the con-centration and pH of extraction of carotenoids. Norbixinfluorescence presents a blue shift in relation to bixin carotenoid.Thermo-optical characterizations involved applying conicaldiffraction (CD) and thermal lens (TL) techniques to pure as well asmixtures of annatto solutions. The primary parameter determinedwas 4dn/dT, allowing the fractions of thermal load (4) for pure andannatto solutions to be calculated. The thermal diffusivity param-eters obtained were characteristic of the solvents in which annattowas extracted. Finally, the colorific was applied to bread prepara-tion to demonstrate its possible application in functional foodproduction.
Acknowledgments
The authors are thankful to the Brazilian funding agencies CNPq(Proc. 473951/2010-0; Proc. 479084/2013-0), FAPESP (Proc. 2006/01277-2; Proc. 2001/12754-2; Proc. 1996/05590-3), FAPEMIG (Proc.APQ-00576-11), CAPES and PROPP-UFU for financial support of thiswork.
References
[1] Kang EJ, Campbell RE, Bastian E, Drake MA. Invited review: annatto usage andbleaching in dairy foods. J Dairy Sci 2010;93:3891e901.
[2] Kayesh E, Shangguan L, Korir NK, Sun X, Bilkish N, Zhang Y, et al. Fruit skincolor and the role of anthocyanin. Acta Physiol Plant 2013;35:2879e90.
[3] Rao PGP, Jyothirmayi T, Balaswamy K, Satyanarayana A, Rao DG. Effect ofprocessing conditions on the stability of annatto (Bixa orellana L.) dye incor-porated into some foods. LWT Food Sci Technol 2005;38:779e84.
[4] Giuliano G, Rosati C, Bramley PM. To dye or not to dye: biochemistry ofannatto unveiled. Trends Biotechnol 2003;21:513e6.
[5] Scotter M. The chemistry and analysis of annatto food colouring: a review.Food Addit Contam A Chem Anal Control Expo Risk Assess 2009;26:1123e45.
[6] Preston HD, Rickard MD. Extraction and chemistry of annatto. Food Chem1980;5:47e56.
[7] Agner AR, Barbisan LF, Scolastici C, Salvadori DMF. Absence of carcinogenicand anticarcinogenic effects of annatto in the rat liver medium-term assay.Food Chem Toxicol 2004;42:1687e93.
[8] Hagiwara A, Imai N, Doi Y, Nabae K, Hirota T, Yoshino H, et al. Absence of livertumor promoting effects of annatto extract (norbixin), a natural carotenoidfood color, in a medium-term liver carcinogenesis biossay using male F344rats. Cancer Lett 2003;199:9e17.
[9] Shuhama IK, Aguiar ML, Oliveira WP, Freitas LAP. Experimental production ofannatto powders in spouted bed dryer. J Food Eng 2003;59:93e7.
[10] Hallagan JB, Allen DC, Borzelleca JF. The safety and regulatory status of food,drug and cosmetics colour additives exempt from certification. Food ChemToxicol 1995;33:515e28.
[11] Sasaki YF, Kawaguchi S, Kamaya A, Ohshita M, Kabasawa K, Iwama K, et al. Thecomet assay with 8 mouse organs: results with 39 currently used food ad-ditives. Mutat Res 2002;519:103e19.
[12] Dias VM, Pilla V, Alves LP, Oliveira HPM, Munin E. Optical characterization inannatto and commercial colorific. J Fluoresc 2011;21:415e21.
[13] Jondiko IJO, Pattenden G. Terpenoids and an apocarotenoid from seeds of Bixaorellana. Phytochemistry 1989;28:3159e62.
[14] Balaswamy K, Prabhakara Rao PG, Satyanarayana A, Rao DG. Stability of bixinin annatto oleoresin and dye powder during storage. LWT Food Sci Technol2006;39:952e6.
[15] Mercadante AZ, Pfander H. Carotenoids from annatto: a review. Recent ResDev Agric Food Chem 1998;2:79e91.
[16] Rao PGP, Satyanarayana A, Rao DG. Effect of storage on the stability of watersoluble annatto dye formulation in a simulated orange- RTS beverage modelsystem. LWT Food Sci Technol 2002;35:617e21.
[17] Sharma P, Bora MM, Borthakur S, Rao PG, Dutta NN. Separation of norbixinfrom Bixa orellana seed raw dye by aliquat-336. Environ Prog Sustain Energy2013;32:134e8.
[18] Giridhar P, Venugopalan A, Parimalan R. A review on annatto dye extraction,analysis and processing- a food technology perspective. J Sci Res Reports2014;3:327e48.
[19] Zhang Y, Zhong Q. Probing the binding between norbixin and dairy proteinsby spectroscopy methods. Food Chem 2013;139:611e6.
[20] Rios AO, Mercadante AZ, Borsarelli CD. Triplet state energy of the carot-enoid bixin determined by photoacoustic calorimetry. Dyes Pigm 2007;74:561e5.
[21] Scotter MJ, Wilson LA, Appleton GP, Castle L. Analysis of annatto (Bixa Orel-lana) food coloring formulations. Determination of coloring components andcolored thermal degradation products by high-performance liquid chroma-tography with photodiode array detection. J Agric Food Chem 1998;46:1031e8.
[22] Mercadante AZ, Steck A, Pfander H. Three minor carotenoids from annatto(Bixa orellana) seeds. Phytochemistry 1999;52:135e9.
[23] Campbell RE, Boogers IALA, Drake MA. Short communication: development ofa novel method for the extraction of norbixin from whey and its subsequentquantification via high performance liquid chromatography. J Dairy Sci2014;97:1313e8.
[24] Krinsky NI. Antioxidant functions of carotenoids. Free Radic Biol Med 1989;7:617e35.
[25] Burton GW. Antioxidant action of carotenoids. J Nutr 1989;119:109e11.[26] Kiokias S, Gordon MH. Antioxidant properties of annatto carotenoids. Food
Chem 2003;83:523e9.[27] Cardarelli CR, Benassi MT, Mercadante AZ. Characterization of different
annatto extracts based on antioxidant and colour properties. LWT Food SciTechnol 2008;41:1689e93.
[28] Mascio PD, Devasagayam TP, Kaise S, Sies H. Carotenoids, tocopherols andthiols as biological singlet molecular oxygen quenchers. Biochem Soc Trans1990;18:1054e6.
[29] Fleischer TC, Ameade EP, Mensah ML, Sawer IK. Antimicrobial activity of theleaves and seeds of Bixa orellana. Fitoterapia 2003;74:136e8.
[30] Roehrs M, Figueiredo CG, Zanchi MM, Bochi GV, Moresco RN, Quatrin A, et al.Bixin and norbixin have opposite effects on glycemia, lipidemia, and oxidativestress in streptozotocin-induced diabetic rats. Int J Endocrinol 2014;2014:839095. http://dx.doi.org/10.1155/2014/839095.
[31] Iwazaki AN, Pilla V, Dias VM, Munin E, Andrade AA. Self-induced phasemodulation for thermo-optical characterization of annatto extracted usingdifferent solvents. Appl Spectrosc 2011;65:1393e7.
[32] Shen J, Lowe RD, Snook RD. A model for cw laser induced mode- mismatcheddual-beam thermal lens spectrometry. Chem Phys 1992;165:385e96.
[33] Snook RD, Lowe RD. Thermal lens spectrometry. A review. Analyst 1995;120:2051e68.
[34] Pilla V, Menezes LS, Alencar MARC, Araújo CB. Laser-induced conical diffrac-tion due to cross-phase modulation in a transparent medium. J Opt Soc Am B2003;20:1269e72.
[35] Lima SM, Sampaio JA, Catunda T, Bento AC, Miranda LCM, Baesso ML.Mode-mismatched thermal lens spectrometry for thermo-optical propertiesmeasurement in optical glasses: a review. J Non Cryst Solids 2000;273:215e27.
L.F. Santos et al. / Dyes and Pigments 110 (2014) 72e79 79
[36] PillaV,AlvesLP,MuninE,PachecoMTT.RadiativequantumefficiencyofCdSe/ZnSquantum dots suspended in different solvents. Opt Commun 2007;280:225e9.
[37] Pilla V, Munin E, Gesualdi MRR. Measurement of the thermo-optic coefficientin liquids by laser-induced conical diffraction and thermal lens techniques.J Opt A Pure Appl Opt 2009;11:105201. http://dx.doi.org/10.1088/1464-4258/11/10/105201.
[38] Pilla V, de Lima SR, Andrade AA, Silva ACA, Dantas NO. Fluorescence quantumefficiency of CdSe/CdS magic-sized quantum dots functionalized withcarboxyl or hydroxyl groups. Chem Phys Lett 2013;580:130e4.
[39] Durbin SD, Arakelian SM, Shen YR. Laser-induced diffraction rings from anematic-liquid-crystal film. Opt Lett 1981;6:411e3.
[40] Dabby FW, Gustafson TK, Whinnery JR, Kohanzadeh Y. Thermally self-inducedphase modulation of laser beams. Appl Phys Lett 1970;16:362e5.
[41] Ono H, Kawatsuki N. Self-phase modulation induced by a He-Ne laser in host-guest liquid crystals with different nematic-isotropic transition temperatures.Jpn J Appl Phys 1997;36:L353e6.
[42] Catunda T, Baesso ML, Messaddeq Y, Aegerter MA. Time-resolved Z-scan andthermal lens measurements in Erþ3 and Ndþ3 doped fluoroindate glasses.J Non Cryst Solids 1997;213e214:225e30.
[43] Andrade AA, Catunda T, Lebullenger R, Hernandes AC, Baesso ML. Time-resolved study of thermal and electronic nonlinearities in Ndþ3 doped fluorideglasses. Electron Lett 1998;34:117e9.
[44] Britton G. Structure and properties of carotenoids in relation to function. FedAm Soc Exp Bio J 1995;9:1551e8.
[45] Scotter MJ. Characterisation of the coloured thermal degradation products ofbixin from annatto and a revised mechanism for their formation. Food Chem1995;53:177e85.
[46] Levy LW, Regalado E, Navarrete S, Watkins RH. Bixin and norbixin in humanplasma: determination and study of the absorption of a single dose of annattofood color. Analyst 1997;122:977e80.
[47] Rios AO, Borsarelli CD, Mercadante AZ. Thermal degradation kinetics of bixinin an aqueous model system. J Agric Food Chem 2005;53:2307e11.
[48] Kovary K, Louvain TS, Costa e Silva MC, Albano F, Pires BBM, Laranja GAT, et al.Biochemical behaviour of norbixin during in vitro DNA damage induced byreactive oxygen species. Br J Nutr 2001;85:431e40.
[49] Brochard P, Grolier-Mazza V, Cabanel R. Thermal nonlinear refraction indye solutions: a study of the transient regime. J Opt Soc Am B 1997;14:405e14.
[50] Georges J, Paris T. Influence of the Soret effect on the analytical signal in cw-laser thermal lens spectrometry of micellar solutions. Anal Chim Acta1999;386:287e96.
[51] El-Kashef H. Study of the refractive properties of laser dye solvents: toluene,carbon disulphide, chloroform, and benzene. Opt Mater 2002;20:81e6.
[52] Nikogosyan DN. Properties of optical and laser-related materials: a handbook.7th ed. Chichester: John Wiley & Sons; 1997. pp. 469e70.
[53] Khalil AH, Mansour EH, Dawoud FM. Influence of malt on rheological andbaking properties of wheat-cassava composite flours. LWT Food Sci Technol2000;33:159e64.
[54] Tedrus GAS, Ormenese RCSC, Speranza SM, Chang YK, Bustos FM. Effects of theaddition of vital gluten to rice flour, oat flour and wheat starch on the qualityof breads. Cienc Tecnol Aliment 2001;21:20e5.
[55] El-Dash AA. Standardized mixing and fermentation procedure for experi-mental baking test. Cereal Chem 1978;55:436e46.