Embed Size (px)
Citation preview

Evolution de la structure et de la permeabilite d’un sol
en contexte de non labour associe a l’apport d’effluent
d’elevage : role de l’activite lombricienne.
Nicolas Bottinelli
To cite this version:
Nicolas Bottinelli. Evolution de la structure et de la permeabilite d’un sol en contexte denon labour associe a l’apport d’effluent d’elevage : role de l’activite lombricienne.. Sciencesde la Terre. Agrocampus - Ecole nationale superieure d’agronomie de rennes, 2010. Francais.<tel-00546269>
HAL Id: tel-00546269
https://tel.archives-ouvertes.fr/tel-00546269
Submitted on 14 Dec 2010
HAL is a multi-disciplinary open accessarchive for the deposit and dissemination of sci-entific research documents, whether they are pub-lished or not. The documents may come fromteaching and research institutions in France orabroad, or from public or private research centers.
L’archive ouverte pluridisciplinaire HAL, estdestinee au depot et a la diffusion de documentsscientifiques de niveau recherche, publies ou non,emanant des etablissements d’enseignement et derecherche francais ou etrangers, des laboratoirespublics ou prives.

THESE / AGROCAMPUS OUEST Sous le sceau de l’Université Européenne de Bretagne
Pour obtenir le diplôme de :
DOCTEUR DE L'INSTITUT SUPERIEUR DES SCIENCES AGRON OMIQUES, AGRO-ALIMENTAIRES, HORTICOLES ET DU PAYSAGE
Spécialité : Sciences de l’environnement
Ecole Doctorale : Vie-Agro-Santé
Présentée par :
Nicolas BOTTINELLI
Evolution de la structure et de la perméabilité d’u n sol en contexte de non labour associé à l’apport d’effluent d’éleva ge : rôle de
l’activité lombricienne
Soutenue le 1er février 2010 devant la commission d’examen Composition du jury : Président : Christian Walter, Professeur, Agrocampus Ouest Rennes Rapporteur : Joann K. Whalen , Professeur, Université de McGill Montréal Rapporteur : Guy Richard , Directeur de recherche, INRA Orléans Membre : Guénola Pérès , Ingénieur de recherche, Université de Rennes 1 Membre : Eric Blanchart , Directeur de recherche, IRD Montpellier Directeur de thèse : Vincent Hallaire , Chargé de recherche, INRA Rennes
N° ordre : 2010-4 N° Série : D-56

Avant-propos
Ce mémoire de thèse est le résultat de trois années de travail réalisé au sein de l’Unité
mixte de Recherche Sol, Agro et hydrosystème Spatialisation (SAS) de l’INRA de Rennes. La thèse
a été encadrée par Vincent Hallaire (INRA, UMR SAS), Safya Menasseri-Aubry (Agrocampus Ouest,
UMR SAS) et Daniel Cluzeau (Université Rennes 1, UMR ECOBIO).
Cette thèse a été financée par la région Bretagne. Elle s’inscrit dans le cadre du projet
intitulé « Evaluer et modéliser la gestion des matières organiques associée à une réduction du
travail du sol en vue d’une agriculture durable » coordonné par Safya Menasseri-Aubry et financé
par la région Bretagne.
Ce travail a été suivi par un comité de pilotage composé de Guénola Pérès (Université
Rennes 1, UMR ECOBIO), Isabelle Cousin (INRA, UR Sciences du sol), Stéphane de Tourdonnet
(AgroParisTech, UMR Agronomie), Eric Blanchart (IRD, UR SeqBio) et Denis Angers (Agriculture et
Agroalimentaire Canada).

Remerciements
Ouf… c’est presque terminé. J’en arrive au dernier exercice de ce long travail, le plus
agréable puisqu’il s’agit de remercier tous ceux grâce à qui cette thèse s’est déroulée dans les
meilleures conditions. YOUPI !
Je tiens avant tout à témoigner ma plus vive reconnaissance à mes 3 directeurs de thèse :
Vincent Hallaire, Safya Menasseri-Aubry et Daniel Cluzeau. Je te remercie Vincent pour la
confiance que tu m’as accordée depuis le premier jour de notre rencontre. C’est grâce à toi que ce
travail est ce qu’il est : on a fait un bon duo. Je te remercie Safya, t’as joué un rôle déterminant
dans ce travail jusqu’au dernier instant. Je te remercie Daniel, pour m’avoir donné l’occasion de
réaliser cette thèse : tu m’as fait confiance.
Un grand merci à Joann K. Whalen et Guy Richard d’avoir accepté la tâche de
rapporteur, ainsi qu’à Eric Blanchart, Guénola Pérès et Christian Walter pour avoir bien voulu
participer au jury de cette thèse.
Merci à Isabelle Cousin, Guénola Pérès, Stéphane de Tourdonnet, Eric Blanchart et
Denis Angers pour leur participation aux comités de pilotage et leurs conseils.
Merci à la région Bretagne qui, par la bourse de thèse qui m’a été accordée, m’a permis de
travailler sereinement pendant trois ans.
Merci à Patrice Cotinet, Djilali Heddadj et Alain cottais qui ont assuré la conduite du
site expérimental de Kerguéhennec, support de ce travail.
J’ai eu le privilège de travailler au sein de l’unité dirigée par Chantal Gascuel-Odoux. Je
la remercie chaleureusement pour son accueil et pour l’ambiance qu’elle y fait régner. Je remercie
toutes les personnes de l’UMR qui ont participé de près ou de loin à ce travail. Un immense merci à
Yannick Bénard, pour les journées de folie sur le terrain, les culturales, le salon de l’agriculture :
j’en garde un très bon souvenir. Et puis les résultats présentés dans cette thèse sont en partie
grâce à lui, qui à imprégné un total 364 blocs de sol rien que pour moi. T’assures ma poule. Je
remercie également Sylvain Busnot et Laurence Carteaux pour leur aide technique au niveau
de la stabilité structurale et du dosage des sucres du sol.
Ma pensée va évidemment aux copains doctorants du labo. Un grand merci à Cédric Le
Guillou (Dérick). J’ai adoré discuter avec toi : exposer mes idées, mes manips, puis parler de la
vie, rigoler (petite pensée à Eurosoil). Je te remercie également d’avoir participé à ce travail de
thèse jusqu’au bout : les papiers et l’écriture de la thèse.
Je pense également à Muhammad Bilal (momo), mon collègue doctorant de bureau avec
qui j’ai apprécié de vivre cette belle aventure. Je pense également à Matthieu Rouxel (Mr
vecteur), courage pour la fin, et fais pas trop de graphes.
Un grand merci à mes potes tropicaliste, Pascal Jouquet, Jean Christophe Lata et
Jérôme Mathieu pour m’avoir donné le goût à la recherche. Pascal je ne saurai comment te
remercier, de tout ce que tu m’as appris, les occasions que tu m’as donné de concilier travail,
voyage et plaisir.
Je tiens à remercier mes parents qui ont toujours été présents et qui par l’éducation qu’ils
m’ont donné m’ont permis d’arriver jusque là. Merci maman, merci papa !! YAYA !


Table des matières
Résumé.............................................................................................................................. 1
Abstract ............................................................................................................................. 2
Introduction ................................................................................................................. 5
1. Contexte ..................................................................................................................... 5
2. Objectif général de la thèse et organisation du mémoire .................................................... 6
Partie A : Etat de l’art et site d’étude ................................................................... 9
Chapitre 1 : Relations entre les pratiques culturales, les lombriciens, la structure et la perméabilité du sol ....................................................................................................... 13
1. Définitions .................................................................................................................. 13 1.1. Les pratiques culturales .......................................................................................... 13 1.2. Les lombriciens ..................................................................................................... 15 1.3. La perméabilité et la macroporosité du sol ................................................................ 16
2. Interactions entre les lombriciens, les pratiques culturales, la structure et la perméabilité du sol ................................................................................................................................. 18
2.1. Impact des pratiques culturales sur les communautés et activités lombriciennes ........... 18 2.2. Action des lombriciens sur la structure et la perméabilité du sol .................................. 19 2.3. Impact des pratiques culturales sur la structure et la perméabilité du sol ...................... 21
3. Objectif et démarche ................................................................................................... 23
Chapitre 2 : Le site d’étude.............................................................................................. 27
1. Le contexte pédoclimatique........................................................................................... 27 1.1. Le climat .............................................................................................................. 27 1.2. Le sol ................................................................................................................... 27
2. Le dispositif expérimental ............................................................................................. 28
3. Les communautés lombriciennes ................................................................................... 30
Partie B : Abondance des biostructures lombriciennes ................................. 33
Chapitre 3 : Evaluation de différentes méthodes de quantification des biostructures lombriciennes ............................................................................................................... 37
1. Introduction ................................................................................................................ 37
2. Méthodes ................................................................................................................... 37 2.1. Abondance des déjections à l’échelle des agrégats ..................................................... 37 2.2. Abondance des déjections sur cylindres de sol ........................................................... 38 2.3. Abondance des galeries et des déjections sur lames de sol ......................................... 38 2.4. Analyses statistiques .............................................................................................. 40
3. Résultats et discussion ................................................................................................. 40 3.1. La phase solide ..................................................................................................... 40 3.2. La phase porale ..................................................................................................... 41
4. Conclusions ................................................................................................................ 43
Chapitre 4: Impact des pratiques culturales sur l’abondance des biostructures lombriciennes .......................................................................................... 47
Résumé............................................................................................................................. 47
Abstract. ........................................................................................................................... 48
1. Introduction ........................................................................................... 49
Table des matières
2. Materials and methods ................................................................................................. 49 2.1. Study site, tillage systems and fertilizer inputs .......................................................... 49 2.2. Sampling .............................................................................................................. 51 2.3. Soil water content.................................................................................................. 51 2.4. Abundance of earthworm biostructures .................................................................... 51 2.5. Statistical analysis ................................................................................................. 53
3. Results ....................................................................................................................... 53 3.1. Soil water content.................................................................................................. 53 3.2. Biostructures abundance ........................................................................................ 54
4. Discussion .................................................................................................................. 58 4.1. Effects of management practices on biostructure abundance ....................................... 58 4.2. Seasonal variation in biostructure abundance ............................................................ 59
5. Conclusions ................................................................................................................ 59
Partie C : Fonctionnement physique du sol ....................................................... 61
Chapitre 5 : Impact des lombriciens sur la stabilité structurale des agrégats du sol ....... 65
Résumé............................................................................................................................. 65
Abstract. ........................................................................................................................... 66
1. Introduction ................................................................................................................ 67
2. Materials and methods ................................................................................................. 67 2.1. Site and soil sampling ............................................................................................ 67 2.2. Earthworm cast abundance ..................................................................................... 68 2.3. Physico-chemical properties of casts and bulk soil ...................................................... 69 2.4. Statistical analysis ................................................................................................. 69
3. Results and discussion ................................................................................................. 70 3.1. Relative abundance of subsurface casts .................................................................... 70 3.2 Properties involved in structural stability: casts versus bulk soil ................................... 71 3.3. Structural stability: casts versus bulk soil ................................................................. 73 3.4. Structural stability: casts versus tillage intensity ....................................................... 74
4. Conclusions ................................................................................................................ 74
Chapitre 6 : Impact des pratiques culturales sur la stabilité des agrégats du sol ............ 79
Résumé............................................................................................................................. 79
Abstract. ........................................................................................................................... 80
1. Introduction ................................................................................................................ 81
2. Materials and methods ................................................................................................. 81 2.1. Site, tillage and fertilization practices ....................................................................... 81 2.2. Soil sampling ........................................................................................................ 82 2.3. Soil properties ....................................................................................................... 82 2.4. Soil aggregate stability ........................................................................................... 83 2.5. Statistical analysis ................................................................................................. 83
3. Results and discussion ................................................................................................. 83 3.1. Soil organic matter ................................................................................................ 83 3.2. Soil water content.................................................................................................. 85 3.3. Water repellency of aggregates ............................................................................... 86 3.4. Soil aggregate stability ........................................................................................... 86
4. Conclusions ................................................................................................................ 89
Chapitre 7 : Impact des pratiques culturales sur la macroporosité et la perméabilité du sol ................................................................................................................................ 93
Résumé............................................................................................................................. 93
Abstract. ........................................................................................................................... 94
1. Introduction ................................................................................................................ 95

Table des matières
2. Materials and methods ................................................................................................. 96 2.1. Study site, tillage and fertilization practices .............................................................. 96 2.2. Soil measurements ................................................................................................ 97 2.2. Hydraulic conductivity ............................................................................................ 97 2.3. Macroporosity ....................................................................................................... 97 2.4. Statistical analysis ................................................................................................. 97
3. Results ....................................................................................................................... 98 3.1. Total soil macroporosity ......................................................................................... 98 3.2. Pore shape.......................................................................................................... 100 3.3. Porosity size distribution ....................................................................................... 100 3.4. Hydraulic conductivity .......................................................................................... 102 3.5. Correlations between soil macroporosity and hydraulic conductivity ........................... 103
4. Discussion ................................................................................................................ 103 4.1. Soil macroporosity as influenced by tillage and sampling date ................................... 103 4.2. Soil macroporosity as influenced by fertilization ....................................................... 104 4.3. Consequence of management practices on K(h) ...................................................... 104
5. Conclusions .............................................................................................................. 105
Discussion générale ............................................................................................... 109
1. Comment quantifier les biostructures lombriciennes dans le sol ? .................................... 109
2. Quel est l’impact des pratiques culturales sur l’abondance de ces biostructures ?............... 110
3. Quel est l’impact des pratiques culturales et des lombriciens sur la stabilité structurale des agrégats du sol ? ........................................................................................................... 111
4. Quel est l’impact des pratiques culturales sur la macroporosité et la perméabilité du sol ? .. 112
5. Schéma d’évolution structurale des sols selon les pratiques culturales .............................. 113
Conclusion et perspectives ................................................................................... 117
Références ................................................................................................................ 123
Annexes ..................................................................................................................... 139
Annexe 1. Tableau présentant les données brutes issues du chapitre 4. ............................... 139
Annexe 2. Tableaux présentant les données brutes issues du chapitre 5............................... 143
Annexe 3. Tableau présentant les données brutes issues du chapitre 6. ............................... 145
Annexe 4. Tableaux présentant les données brutes issues du chapitre 7............................... 147


Résumé/abstract

1
Résumé
Alors que les techniques culturales sans labour sont de plus en plus utilisées par les
agriculteurs, leurs effets sur les propriétés physiques du sol restent encore mal documentés en
particulier lorsqu’elles sont associées à des apports d’effluents d’élevage. L’objectif de ce travail
était d’évaluer l’effet du non labour associé à l’apport d’effluent d’élevage sur la structure et la
perméabilité du sol en étudiant plus particulièrement le rôle de l’activité lombricienne.
Ce travail repose sur un dispositif expérimental mis en place à Kerguéhennec (Bretagne,
France) depuis 8 années sur lequel sont comparées six pratiques culturales croisant trois
techniques de travail du sol (le labour conventionnel, le travail superficiel, le semis direct) et deux
types de fertilisation (minérale et fumier de volaille). Dans une première partie de ce travail nous
nous sommes intéressés aux méthodes pour quantifier les biostructures lombriciennes (galeries et
déjections) et à l’impact des pratiques culturales sur leur abondance. Dans une deuxième partie
nous avons mesuré l’effet conjoint des pratiques culturales et des biostructures lombriciennes sur
la stabilité structurale des agrégats, la macroporosité et la perméabilité du sol au cours d’une
année culturale.
Ce travail démontre la difficulté de quantifier les biostructures lombriciennes, en particulier
les déjections. Nous avons proposé différents indicateurs qui, lorsqu’ils sont combinés, permettent
une bonne estimation de l’abondance des déjections. Nos résultats confirment que l’abondance des
biostructures est augmentée en semis direct et sous apport de fumier de volaille ; nous montrons
par ailleurs que ces biostructures évoluent au cours de l’année culturale sous l’effet du climat, du
travail du sol et probablement de l’activité physiologique des lombriciens. Le travail du sol modifie
considérablement les propriétés physiques du sol, alors que l’apport d’effluent d’élevage n’a pas
d’effet. Le non labour (semis direct et travail superficiel) augmente la stabilité structurale des
agrégats du sol : cette augmentation n’est pas expliquée par l’activité lombricienne. Le semis direct
présente les plus faibles valeurs de macroporosité et de perméabilité du sol, alors que l’activité
lombricienne y est la plus importante. Les propriétés physiques du sol évoluent au cours de l’année
culturale au même titre que les biostructures. La stabilité structurale évolue sous l’effet du climat,
de la même façon pour toutes les modalités étudiées. La perméabilité des sols travaillés évolue
sous l’effet du climat, du travail du sol et de l’activité lombricienne. Ces différents facteurs agissent
sur une classe de pores du sol, les macropores inter-agrégats de forme complexe. La perméabilité
du sol sous semis direct évolue sous l’effet du climat et de l’abondance des déjections
lombriciennes, sans modification significative de la taille et forme de la macroporosité du sol.
Ainsi dans les conditions expérimentales de cette étude, le travail superficiel est la modalité
qui présente les meilleures propriétés physiques du sol ; l’apport d’effluent d’élevage n’agit pas sur
celles-ci. Ce travail met aussi en évidence le rôle important des déjections lombriciennes sur les
variations à court terme de la perméabilité du sol.
Mots clés : non labour ; stabilité structurale ; macroporosité ; conductivité hydraulique ;
déjections ; galeries ; activité lombricienne ; évolution temporelle ; analyse d’image.

2
Abstract
Conservation tillage practices are increasingly being used by the farmers; however, their
impacts on soil physical properties remain poorly documented, especially when they are combined
to manure fertilization. This study aimed at evaluating the effect of reduced tillage and manure
fertilization on soil structure and its permeability, particularly in relation with earthworm activity.
This study was conducted at the Kerguéhennec experimental station, established in 2000,
located in Brittany, France. Three tillage treatments were compared (moldboard plowing, surface
tillage and no-tillage) along with two types of fertilizers (poultry manure and mineral). In the first
part of this work, we were interested on methodologies to quantify earthworm biostructures
(burrows and casts) and the impact of cultural practices on their abundance. In a second part, we
have measured the combined effect of cultural practices and earthworm biostructures on the
structural stability of aggregates, macroporosity and permeability of soil during one growing
season.
This work demonstrates the difficulty of quantify earthworm biostructures, particularly
earthworm casts. We proposed various indicators, that, when combined provide a good estimate of
the abundance of casts. Our results confirm that the abundance of biostructures increases under
no-tillage and with manure fertilisation. We also showed that these biostructures evolved during
the crop year as a result of climate, tillage and probably the physiological activity of earthworms.
Tillage practices alone had a strong impact on soil physical properties in comparison to manure
fertilization. Reduced tillage increased soil aggregate stability: this increase was not explained by
earthworm activity. No tillage had the lowest soil macroporosity and permeability but the
earthworm activity was highest in that treatment. Soil physical properties have changed during the
cropping year. The dynamics of soil aggregate stability was affected by the climate with similar
fashion in all treatments. Earthworm activity, tillage events and climate were linked closely to the
dynamics of soil permeability under tilled treatments. Theses factors influence mainly one class of
porosity, the inter-aggregate complex macropores. Under no-tillage, the dynamics of soil
permeability was affected by the climate and the abundance of earthworm casts, without
significant modification of soil macroporosity (size and shape).
Thus, in the experimental conditions of this work, the surface tillage practice has reflected
the best soil physical properties, while manure fertilization does not show any obvious impact on
the studied soil physical properties. Moreover, our study highlights the importance of earthworm
casts on the short term soil permeability variations.
Key words : reduced tillage; structural stability; macroporosity; hydraulic conductivity;
earthworm casts; burrows; earthworm activity; temporal dynamics; image analysis.

Introduction

5
Introduction
1. Contexte
Le labour est une pratique agricole ancestrale, dont un des buts premiers est de créer une
structure du sol favorable à la germination des graines et au développement des racines (Köller,
2003). La charrue moderne fut créée en 1784 ; son utilisation s'est ensuite largement répandue et
devint rapidement un des symboles de l’agriculture moderne (Lal et al., 2007). Les problèmes de
fertilité communs aux sols labourés (baisse des teneurs en matière organique, érosion éolienne et
hydrique) ont conduit au développement de techniques alternatives au labour, regroupées sous le
terme de techniques culturales sans labour (TCSL). Ces techniques couvrent une large gamme
d'opérations sans retournement du sol, allant du pseudo-labour au semis direct en passant par le
travail superficiel. Les TCSL se sont fortement développées depuis une trentaine d’années dans
certaines régions du monde comme l’Amérique du nord, du sud ou l’Australie pour représenter
aujourd’hui environ 95 millions d’hectares (Derpch, 2005). L’extension des TCSL en France est
beaucoup plus récente : elles représentent environ un tiers des surfaces françaises de grandes
cultures en 2005, avec une forte progression ces 4 dernières années (Labreuche et al., 2007). En
Bretagne, les TCSL représentaient 21% des surfaces cultivées en 2006 (Heddadj, 2008). Or c’est
en Bretagne que se concentre la majorité de l’élevage agricole français. De ce fait, la pratique du
non labour y est généralement associée à l’apport d’effluent d’élevage.
La conductivité hydraulique est un paramètre communément utilisé pour exprimer la
perméabilité d’un sol, dont les conséquences sont importantes, puisqu’une réduction de ce
paramètre augmente le risque de ruissellement de surface. Elle s’exprime par un coefficient
caractérisant la vitesse à laquelle l’eau s’infiltre dans le sol, selon son état hydrique. Elle est
principalement contrôlée par la macroporosité du sol : taille, connectivité et stabilité des vides
agencés entre les agrégats (Vervoort and Cattle, 2003; Lipiec et al., 2006; Sasal et al., 2006). La
macroporosité est elle-même influencée par les pratiques culturales (Pagliai et al., 2004; Hubert et
al., 2007) qui modifient la structure du sol.
De nombreux auteurs ont montré que l’effet des pratiques culturales sur la macroporosité
et la conductivité hydraulique n’était pas constant au cours de l’année culturale. En effet, la
macroporosité du sol évolue à très court terme : (i) sous l’effet du travail du sol qui produit
rapidement une forte macroporosité ou à l’inverse (ii) sous l’effet de la pluie qui peut entrainer une
prise en masse du sol lorsque la macroporosité est peu stable (Moret and Arrue, 2007) ; (iii) sous
l’effet de cycles humectation et dessiccation (Dasgupta et al., 2006), gel et dégel (Sveistrup et al.,
2005) ou encore (iv) sous l’effet de l’activité biologique (Meek et al., 1992 ; Hubert et al., 2007;
Álvaro-Fuentes et al., 2008). En conséquence, les variations intra-annuelles de la structure du sol
peuvent être plus grandes que l’effet des pratiques culturale et même masquer l’effet de celles ci
(Perfect et al., 1990; Chan et al., 1994; Lampurlanés and Cantero-Martínez, 2006) ; la conductivité
hydraulique suit également une forte dynamique intra-annuelle (Strudley et al., 2008).
Nous sommes particulièrement intéressés aux effets de la simplification du travail du sol et
de l’apport d’effluent d’élevage sur l’activité lombricienne dans le sol, à l’origine de l’évolution de la
macroporosité du sol et donc de la conductivité hydraulique. La diminution de l’intensité du travail
du sol associée à une augmentation de matière organique dans les couches superficielles du sol
profite aux communautés lombriciennes : les lombriciens sont donc favorisés en non labour et avec
apport d’effluent d’élevage (Lee, 1985; Kladivko, 2001). Les lombriciens sont des organismes
ingénieurs de l’écosystème (Jones et al., 1994 ; Lavelle et al., 1997). Les déjections qu’ils
Introduction
6
produisent sont généralement enrichies en matière organique : elles participent à la stabilisation
des sols (Tomlin et al., 1995). L’agencement des déjections dans le sol produit une porosité
d’assemblage qui affecte la macroporosité du sol (Hallaire et al., 2000; Vandenbygaart et al.,
2000; Bottinelli et al., 2010b). Les lombriciens creusent également des réseaux de galeries qui
participent à la macroporosité du sol (Tomlin et al., 1995). La production de telles biostructures
(galeries et déjections) peut engendrer une augmentation et une réorganisation de la
macroporosité du sol voire une décompaction des sols tassés (Tisdall, 1985; Zund et al., 1997;
Langmaack et al., 1999). De ce fait, de nombreux auteurs ont mis en exergue le rôle significatif de
l’activité lombricienne sur les propriétés hydriques du sol et notamment sur sa perméabilité
(Ehlers, 1975; Francis and Fraser, 1998; Lamandé et al., 2004; Capowiez et al., 2009b).
Toutefois, l’effet du non travail du sol sur la conductivité hydraulique reste controversé car
s’il augmente le nombre de biostructures lombriciennes (Ehlers, 1975; Tebrügge and Düring, 1999;
Vandenbygaart et al., 2000; Capowiez et al., 2009b), il entraîne généralement une diminution de la
macroporosité (Kay and Vandenbygaart, 2002). En conséquence selon le nombre d’années depuis
lequel le sol n’est plus travaillé ou encore selon ses propriétés intrinsèques, les valeurs de
conductivité hydraulique peuvent être supérieures, similaires ou inférieures à celles d’un sol
travaillé (Strudley et al., 2008). En revanche les effets de l’apport d’effluent d’élevage sur les
propriétés du sol sont moins variables: l’apport d’effluent augmente l’agrégation des sols (Haynes
and Naidu, 1998) et le nombre de biostructures lombriciennes (Jongmans et al., 2003; Pulleman et
al., 2003). La macroporosité peut alors être augmentée (Pagliai et al., 1987; Marinari et al., 2000;
Miller et al., 2002) et les valeurs de conductivité hydraulique sont généralement plus fortes que
sous fertilisation minérale (Haynes and Naidu, 1998; Pagliai et al., 2004).
S’il est clair que le non labour ou l’apport de fertilisant organique modifie l’activité
lombricienne, la macroporosité du sol et sa conductivité hydraulique, aucune étude à notre
connaissance n’a jusqu’à présent analysé leurs effets conjoints sur le fonctionnement physique du
sol. Nous émettons donc comme question principale : la combinaison du non labour et de l’apport
d’effluent d’élevage, en favorisant l’activité lombricienne, augmente-t-elle la macroporosité et la
conductivité hydraulique du sol ?
2. Objectif général de la thèse et organisation du mémoire
L’objectif de ce travail est d’évaluer l’impact des pratiques culturales, lorsque l’on associe le
non labour et l’apport d’effluent, sur la structure et la conductivité hydraulique du sol, en étudiant
plus particulièrement le rôle de l’activité lombricienne.
Nous avons comparé six pratiques culturales, croisant trois techniques de travail du sol
(labour conventionnel, travail superficiel, semis direct) et deux types de fertilisation (minérale ou
fumier de volaille). Au cours d’une année culturale ont été mesurées l’abondance et la stabilité
structurale des déjections lombriciennes. Nous avons également évalué l’effet des pratiques
culturales sur la stabilité structurale des agrégats du sol, la macroporosité et la conductivité
hydraulique du sol. La diversité des situations nous permettra ainsi d’estimer l’impact de l’activité
lombricienne sur le fonctionnement physique du sol.
Le mémoire s’articule autour de sept chapitres, organisés en 3 parties :
- dans la première partie nous présenterons une analyse bibliographique (chapitre 1) portant sur
les interactions entre les pratiques culturales, l’activité des lombriciens, et les propriétés physiques
du sol; nous permettant ainsi de justifier les objectifs de ce travail. Le chapitre 2 décrira le site
d’étude et les parcelles expérimentales étudiées.
Introduction
7
- La deuxième partie sera consacrée à l’abondance des biostructures lombriciennes: dans le
chapitre 3, nous évaluerons différentes méthodes originales de quantification de l’activité des
lombriciens dans le sol. Dans le chapitre 4, nous décrirons l’impact des pratiques culturales sur
l’abondance des biostructures lombriciennes.
- La troisième partie de ce travail portera sur le fonctionnement physique du sol : dans le chapitre
5, nous évaluerons l’impact des lombriciens sur la stabilité structurale du sol. Dans le chapitre 6,
nous présenterons la stabilité des agrégats du sol selon les pratiques culturales. Enfin, dans le
chapitre 7 nous présenterons l’impact des pratiques culturales sur la macroporosité et la
perméabilité du sol.
A la suite de ces trois parties, nous tenterons dans une discussion générale de croiser ces
informations, et nous proposerons par des scénarios les schémas d’évolution du sol, de montrer
comment l’activité lombricienne, selon les pratiques culturales, a contribué à ses propriétés
structurales et hydriques.

9
Partie A
Etat de l’art et site d’étude


Chapitre 1
Relations entre les pratiques culturales, les
lombriciens, la structure et la perméabilité du sol

13
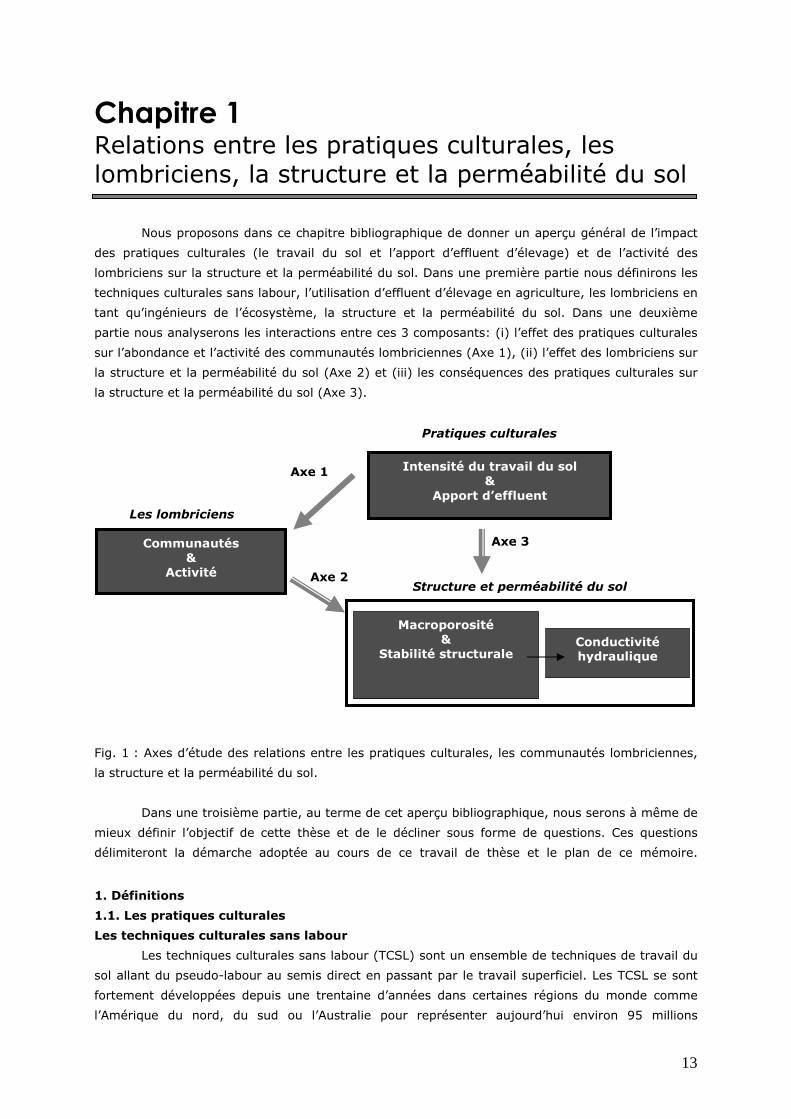
Chapitre 1
Relations entre les pratiques culturales, les lombriciens, la structure et la perméabilité du sol
Nous proposons dans ce chapitre bibliographique de donner un aperçu général de l’impact
des pratiques culturales (le travail du sol et l’apport d’effluent d’élevage) et de l’activité des
lombriciens sur la structure et la perméabilité du sol. Dans une première partie nous définirons les
techniques culturales sans labour, l’utilisation d’effluent d’élevage en agriculture, les lombriciens en
tant qu’ingénieurs de l’écosystème, la structure et la perméabilité du sol. Dans une deuxième
partie nous analyserons les interactions entre ces 3 composants: (i) l’effet des pratiques culturales
sur l’abondance et l’activité des communautés lombriciennes (Axe 1), (ii) l’effet des lombriciens sur
la structure et la perméabilité du sol (Axe 2) et (iii) les conséquences des pratiques culturales sur
la structure et la perméabilité du sol (Axe 3).
Fig. 1 : Axes d’étude des relations entre les pratiques culturales, les communautés lombriciennes,
la structure et la perméabilité du sol.
Dans une troisième partie, au terme de cet aperçu bibliographique, nous serons à même de
mieux définir l’objectif de cette thèse et de le décliner sous forme de questions. Ces questions
délimiteront la démarche adoptée au cours de ce travail de thèse et le plan de ce mémoire.
1. Définitions
1.1. Les pratiques culturales
Les techniques culturales sans labour
Les techniques culturales sans labour (TCSL) sont un ensemble de techniques de travail du
sol allant du pseudo-labour au semis direct en passant par le travail superficiel. Les TCSL se sont
fortement développées depuis une trentaine d’années dans certaines régions du monde comme
l’Amérique du nord, du sud ou l’Australie pour représenter aujourd’hui environ 95 millions
Intensité du travail du sol &
Apport d’effluent
Communautés &
Activité Structure et perméabilité du sol
Pratiques culturales
Axe 1
Axe 2
Axe 3
Les lombriciens
Macroporosité &
Stabilité structurale Conductivité hydraulique

Chapitre 1
14
d’hectares (Derpsch, 2005). L’extension des TCSL en France est beaucoup plus récente : elles
représentent environ un tiers des surfaces françaises de grandes cultures en 2005, avec une forte
progression ces 4 dernières années. Les TCSL ne sont pas mises en œuvre de manière uniforme en
France. Environ 45% des surfaces de colza et blé sont conduites sans retournement, alors que
cette proportion oscille entre 10 et 30% pour les principales cultures de printemps (Labreuche et
al., 2007). Les TCSL sont développées un peu partout en France mais dans des proportions
variables selon le contexte agronomique. Les enquêtes montrent que certaines situations les
favorisent, par exemple les colzas et blés cultivés dans le grand sud-ouest ou sur sols argilo-
calcaires. A l’inverse, les régions avec des climats humides, des sols peu argileux et une forte
proportion de cultures de printemps sont peu favorables aux TCSL (Labreuche et al., 2007). Les
TCSL en France sont très diverses dans leur mise en œuvre, avec des itinéraires en vrai semis
direct et d’autres intégrant du travail superficiel et du travail profond. Le semis direct est encore
peu répandu. Sur cultures d’automne, les itinéraires les plus répandus font le plus souvent appel à
une ou plusieurs opérations de travail superficiel alors qu’ils combinent fréquemment travail
superficiel et travail profond avant les cultures de printemps. L’abandon du labour a deux
conséquences directes :
(i) l’absence de retournement du sol, qui va profondément modifier son fonctionnement. Le
non retournement du sol entraîne l’apparition de gradients dans la couche arable qui était
auparavant mélangée par l’action de la charrue (Guerif, 1991). Cela concerne en premier lieu la
matière organique qui s’accumule en surface (mulch issu des résidus de culture ou des
amendements) et dans les premiers centimètres de sol. Cette matière organique joue un rôle très
important dans la protection de la surface du sol, la stabilisation de la structure, la rétention d’eau
et d’éléments et sert d’abri et de nourriture aux organismes du sol (Rasmussen, 1999; Tebrügge
and Düring, 1999; Kladivko, 2001). Beaucoup de ces organismes profitent de l’absence de
perturbation de leur milieu par la charrue conduisant à une activité biologique souvent plus
intense. C’est notamment le cas des lombriciens (anéciques en particulier) qui ont une activité
accrue de création de porosité et d’enfouissement de la matière organique (Lavelle and Spain,
2001). C’est également le cas des champignons qui peuvent participer à la stabilisation de la
structure du sol par le réseau d’hyphes qu’ils développent (Beare et al., 1997). Mais c’est
également le cas de certains bio-agresseurs qui exercent une pression plus intense en l’absence de
labour : adventices qui ne sont plus détruites et dont les graines ne sont plus enfouies par le
labour, agents pathogènes qui restent en surface, limaces protégées par le mulch, rongeurs dont
les terriers ne sont plus détruits, etc. (Holland, 2004) ;
(ii) l’absence de fragmentation du sol par la charrue. Cela signifie une diminution de la
création de porosité d’origine mécanique qui peut être très variable selon les systèmes de TCSL :
on observe encore beaucoup de création de porosité par les outils en travail superficiel mais
pratiquement plus en semis direct. Cela peut être compensé par une création de porosité d’origine
biologique (par les lombriciens notamment) mais on observe progressivement des modifications
d’architecture porale (moins de macropores, meilleure connectivité…) qui peuvent avoir des
conséquences importantes sur la croissance racinaire, les flux d’eau, de gaz, le micro-climat du sol
et donc l’activité des organismes et le comportement du sol (Kay and Vandenbygaart, 2002;
Holland, 2004). Finalement, ces modifications sont susceptibles de jouer sur les cycles des
éléments (notamment C et N), les transferts d’eau, de sol (érosion) et de polluants, la fertilité du
milieu, l’activité biologique et la biodiversité (Holland, 2004).

Chapitre 1
15
L’utilisation d’effluent d’élevage en agriculture
Un effluent produit à partir de déjections animales peut être liquide (lisier) ou solide car
mélangé avec une litière végétale (fumier). Les effluents sont épandus dans les parcelles agricoles
pour améliorer la fertilité du sol. Les quantités produites par l’ensemble du cheptel français en
2000 représentaient environ 300 millions de tonnes dont 80% sont d’origine bovine (MEDD, 2002).
Ces effluents sont émis pour moitié au champ quand les animaux sont en pâture ; la rotation des
prairies pâturées et les durées de pâture permettent de gérer ces émissions. L’épandage des 50%
récupérés dans les bâtiments d’élevage doit être géré par rapport aux parcelles cultivées ou
prairies non pâturées. La répartition des zones d’élevage est très hétérogène au niveau du
territoire français avec des régions comme le centre du Bassin parisien où l’élevage a quasiment
disparu et d’autres où se concentre l’élevage comme la Bretagne, la Normandie, la Mayenne. La
Bretagne, première région agricole, concentre à elle seule 50 % de la production de porcs, 41 % de
celle des volailles et de l’élevage laitier sur seulement 7 % de territoire. Les effluents ont une
valeur agronomique : en fonction de leur composition chimique, les épandages d’effluents
d’élevage apportent aux sols des quantités d’éléments fertilisants équivalents à une fertilisation
minérale classique (N, P, K, oligo-éléments) ; ils sont alors utilisés comme engrais. Les effluents
présentent également une valeur d’amendement car ils améliorent les propriétés physiques,
chimiques et biologiques des sols. Ils peuvent augmenter la teneur en matière organique des sols
et contribuer à un meilleur fonctionnement physique du sol (stabilité des agrégats, rétention d’eau,
perméabilité…)
1.2. Les lombriciens
Dès la fin du XIXème siècle, Darwin (1881) évoquait l’importance des lombriciens dans la
formation, la dynamique et la fertilité des sols: “The plough is one of the most ancient and most
valuable of man’s inventions; but long before he existed the land was regularly ploughed and still
continued to be thus ploughed by earthworms”. En raison de leur omniprésence et de leurs
multiples activités, ces invertébrés provoquent des changements au niveau des propriétés
physiques et chimiques du sol facilement observables et mesurables, conduisant à leur tour à des
modifications des activités microbiologiques. Les lombriciens sont qualifiés d’organismes ingénieurs
de l’écosystème (Jones et al., 1994 ; Lavelle et al., 1997) dans la mesure où ils influencent la
diversité et l’activité des organismes appartenant à des groupes fonctionnels subordonnés
(transformateurs de litières, microprédateurs et microorganismes) régulant ainsi les
transformations des nutriments. Ainsi les deux activités mécaniques principales des lombriciens
reposent sur (i) l’élaboration de réseaux de galeries dans lesquelles ils se déplacent (Fig. 2a) et (ii)
l’excrétion de déjections dans les galeries ou vides du sol (Fig. 2b) ou en surface du sol (turricules)
(Fig. 2c).
Tous les lombriciens n’ont pas le même mode d’action dans les sols et Bouché (1977)
propose une classification en relation avec la morphologie et le comportement de chacun d’eux. Les
épigés sont des vers pigmentés de petite taille (10 à 30 mm) qui vivent dans la litière de surface
et se nourrissent des matières organiques en décomposition. Ils ne creusent pas, même si
certaines espèces intermédiaires peuvent créer de petites galeries très superficielles. Les
anéciques sont des vers pigmentés de grande taille (10 à 110 cm) qui vivent dans des galeries
sub-verticales permanentes plus ou moins ramifiées s’ouvrant à la surface du sol. Au cours de
l’ingestion de sol et de l’enfouissement de matière organique, ces organismes assurent un mélange
intime de la matière organique et de la fraction minérale provenant de différents horizons du sol.
Les endogés ont une taille variable (1 à 20 cm) et creusent des galeries d’orientation quelconque.
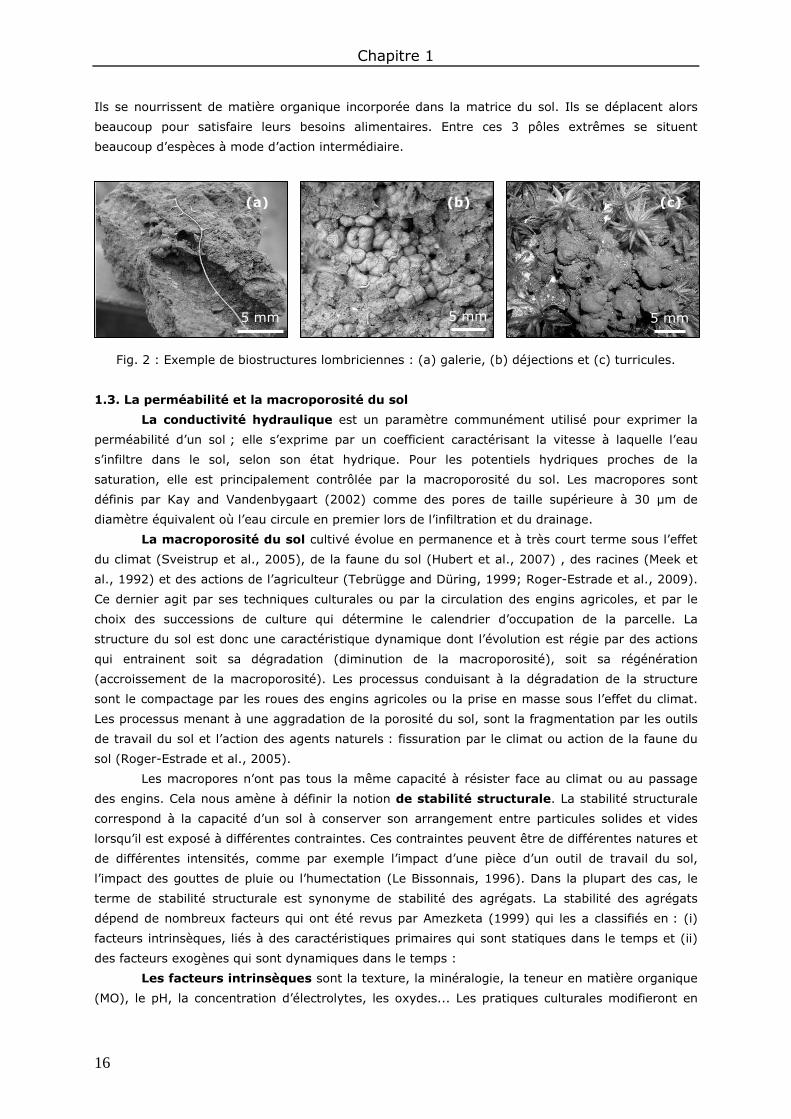
Chapitre 1
16
Ils se nourrissent de matière organique incorporée dans la matrice du sol. Ils se déplacent alors
beaucoup pour satisfaire leurs besoins alimentaires. Entre ces 3 pôles extrêmes se situent
beaucoup d’espèces à mode d’action intermédiaire.
Fig. 2 : Exemple de biostructures lombriciennes : (a) galerie, (b) déjections et (c) turricules.
1.3. La perméabilité et la macroporosité du sol
La conductivité hydraulique est un paramètre communément utilisé pour exprimer la
perméabilité d’un sol ; elle s’exprime par un coefficient caractérisant la vitesse à laquelle l’eau
s’infiltre dans le sol, selon son état hydrique. Pour les potentiels hydriques proches de la
saturation, elle est principalement contrôlée par la macroporosité du sol. Les macropores sont
définis par Kay and Vandenbygaart (2002) comme des pores de taille supérieure à 30 µm de
diamètre équivalent où l’eau circule en premier lors de l’infiltration et du drainage.
La macroporosité du sol cultivé évolue en permanence et à très court terme sous l’effet
du climat (Sveistrup et al., 2005), de la faune du sol (Hubert et al., 2007) , des racines (Meek et
al., 1992) et des actions de l’agriculteur (Tebrügge and Düring, 1999; Roger-Estrade et al., 2009).
Ce dernier agit par ses techniques culturales ou par la circulation des engins agricoles, et par le
choix des successions de culture qui détermine le calendrier d’occupation de la parcelle. La
structure du sol est donc une caractéristique dynamique dont l’évolution est régie par des actions
qui entrainent soit sa dégradation (diminution de la macroporosité), soit sa régénération
(accroissement de la macroporosité). Les processus conduisant à la dégradation de la structure
sont le compactage par les roues des engins agricoles ou la prise en masse sous l’effet du climat.
Les processus menant à une aggradation de la porosité du sol, sont la fragmentation par les outils
de travail du sol et l’action des agents naturels : fissuration par le climat ou action de la faune du
sol (Roger-Estrade et al., 2005).
Les macropores n’ont pas tous la même capacité à résister face au climat ou au passage
des engins. Cela nous amène à définir la notion de stabilité structurale. La stabilité structurale
correspond à la capacité d’un sol à conserver son arrangement entre particules solides et vides
lorsqu’il est exposé à différentes contraintes. Ces contraintes peuvent être de différentes natures et
de différentes intensités, comme par exemple l’impact d’une pièce d’un outil de travail du sol,
l’impact des gouttes de pluie ou l’humectation (Le Bissonnais, 1996). Dans la plupart des cas, le
terme de stabilité structurale est synonyme de stabilité des agrégats. La stabilité des agrégats
dépend de nombreux facteurs qui ont été revus par Amezketa (1999) qui les a classifiés en : (i)
facteurs intrinsèques, liés à des caractéristiques primaires qui sont statiques dans le temps et (ii)
des facteurs exogènes qui sont dynamiques dans le temps :
Les facteurs intrinsèques sont la texture, la minéralogie, la teneur en matière organique
(MO), le pH, la concentration d’électrolytes, les oxydes... Les pratiques culturales modifieront en
(a) (b) (c)
5 mm 5 mm 5 mm
Chapitre 1
17
particulier la MO (qualité et quantité). Cette dernière influence la stabilité structurale par plusieurs
mécanismes : elle joue le rôle de liant entre les particules et modifie l’hydrophobicité des agrégats.
De nombreuses études ont mis en relation une augmentation de la stabilité structurale avec la
teneur en carbone organique (Carter, 1992; Haynes and Francis, 1993; Angers et al., 1999; Six et
al., 1999; Bissonnette et al., 2001; Le Bissonnais et al., 2002), ou plus particulièrement avec les
polysaccharides produits par les microorganismes et les racines (Cheshire et al., 1979; Angers et
al., 1993b; Haynes and Francis, 1993), la biomasse microbienne (Álvaro-Fuentes et al., 2008) ou
encore la longueur des hyphes fongiques (Jastrow et al., 1998; Bissonnette et al., 2001).
Les facteurs exogènes sont les variables climatiques, biologiques et les systèmes de
cultures. Ces facteurs vont affecter la dynamique de la stabilité structurale. En effet, au même titre
que la porosité du sol, la stabilité structurale exhibe fréquemment une grande variabilité intra-
annuelle qui peut être bien plus grande que les variations entre différents systèmes de culture
(Perfect et al., 1990; Chan et al., 1994; Angers et al., 1999; Plante and McGill, 2002; Álvaro-
Fuentes et al.,2008 ; Daraghmeh et al., 2009). Le climat modifie directement la stabilité de la
structure principalement par l’action sur la teneur en eau (Perfect et al., 1990; Angers et al.,
1993b) et indirectement par la stimulation saisonnière de l’activité biologique (Marinissen, 1994;
Álvaro-Fuentes et al., 2008a). L’incorporation de MO peut également contribuer à la variation intra-
annuelle de la structure. C’est grâce à la stimulation de micro-organismes que la stabilité de la
structure augmente rapidement après apports organiques (Abiven et al., 2009). Cette dynamique à
court terme a été mise en avant par des modèles qui intègrent la dynamique de la MO avec la
formation, la stabilisation et la désagrégation de la structure du sol (Annabi et al., 2007; Abiven et
al., 2008)
Etudier l’évolution de la macroporosité du sol oblige à disposer d’une méthode de
caractérisation. Il existe un très grand nombre de ces méthodes, qui diffèrent par les objectifs
poursuivis, le niveau d’organisation abordé, les procédures utilisées (Dexter, 1988; Young et al.,
2001). Les études dont l’objectif est de comprendre l’évolution de la structure et de la perméabilité
du sol sous l’effet des systèmes de culture privilégient les méthodes de description basées sur
l’observation morphologique. Parmi celles-ci, l’étude du profil cultural (Gautronneau and Manichon,
1987) permet une description stratifiée de la structure des horizons qui constituent le profil
cultural, l’analyse d’image en 2 dimensions d’échantillons de sol permet une quantification fine de
la forme, de la taille et de l’origine des pores (Ringrose-Voase and Bullock, 1984; Vandenbygaart et
al., 2000), l’analyse d’image en 3 dimensions d’échantillons de sol par tomographie permet une
quantification du volume des pores et de leur connectivité (Perret et al., 1999). L’analyse en 2
dimensions de la porosité par analyse d’image sur lames minces de sol est appropriée pour
déterminer l’effet des pratiques culturales sur la porosité du sol (Kribaa et al., 2001; Lamandé et
al., 2003; Pagliai et al., 2004). Elle permet une caractérisation non seulement quantitative de la
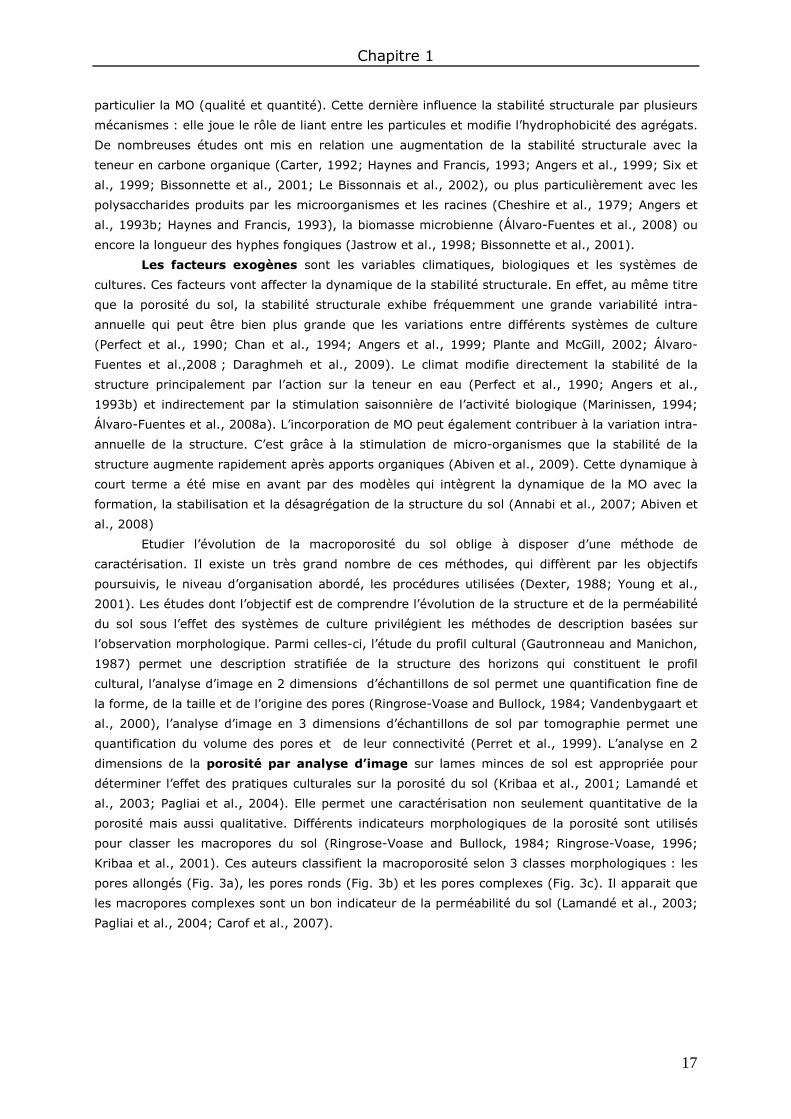
porosité mais aussi qualitative. Différents indicateurs morphologiques de la porosité sont utilisés
pour classer les macropores du sol (Ringrose-Voase and Bullock, 1984; Ringrose-Voase, 1996;
Kribaa et al., 2001). Ces auteurs classifient la macroporosité selon 3 classes morphologiques : les
pores allongés (Fig. 3a), les pores ronds (Fig. 3b) et les pores complexes (Fig. 3c). Il apparait que
les macropores complexes sont un bon indicateur de la perméabilité du sol (Lamandé et al., 2003;
Pagliai et al., 2004; Carof et al., 2007).

Chapitre 1
18
Fig. 3 : Exemple de classification de la porosité du sol selon leur forme : (a) pores allongés, (b)
pores ronds, (c) pores complexes.
Certains auteurs ont présenté de nouveaux modèles typologiques de la porosité du sol
rendant compte de l’origine de la macroporosité du sol. Citons les travaux de Vandenbygaart et al.
(2000) lesquels se sont intéressés à la porosité agencée entre les déjections lombriciennes (Fig .
4a) et les travaux d’Hubert et al. (2007) qui ont classé les pores du sol selon leur origine :
biologique, climatique ou anthropique (Fig. 4b).
Fig. 4 : Exemple de classification de la porosité du sol selon son origine : (a) pores agencées entre
les déjections lombriciennes (Vandenbygaart et al., 2000) et (b) pores crées par la charrue (Hubert
et al., 2007).
2. Interactions entre les lombriciens, les pratiques culturales, la structure et la
perméabilité du sol
2.1. Impact des pratiques culturales sur les communautés et activités lombriciennes
Les communautés lombriciennes – L’abondance des lombriciens augmente dans un sol
en non labour par rapport à un sol travaillé conventionnellement (Chan, 2001; Kladivko, 2001).
Cette augmentation s’explique par des conditions climatiques plus favorables, par l’absence de
dommages occasionnés par la charrue et par la présence d’une litière en surface. L’écart entre les
situations culturales est d’autant plus grand que l’ancienneté du système sans travail du sol est
importante. Les espèces anéciques sont les plus affectées par le travail du sol : leurs populations
croissent considérablement après l’abandon du labour (Kladivko, 2001).
L’apport d’amendements organiques augmente la quantité de biomasse produite et donc
de résidus disponibles pour les lombriciens. L’épandage de matières organiques sur les sols cultivés
permet d’atténuer les impacts négatifs d’une acidification des sols liée à une limitation du chaulage
et/ou à l’utilisation de fertilisation minérale. D’après Cluzeau et al. (1994), des apports de
composts urbains sur 12 ans, dans une vigne expérimentale du Comité Interprofessionnel des Vins
(a) (b)
5 mm
(c)
(a) (b)
5 mm
Chapitre 1
19
de Champagne, entraînent une augmentation de 30 % des biomasses lombriciennes, anéciques en
particulier. Curry (1976) et Anderson et al. (1983) ont montré qu’un apport de lisier ou de fumier
augmentait rapidement les populations de lombriciens. Cependant, certains lisiers peuvent avoir
des effets néfastes liés à la présence d’ammoniac (Curry, 1976).
L’abondance des biostructures lombriciennes - De nombreuses études ont mis en
évidence le rôle de la mésologie du sol (qualité et quantité de matière organique, compacité,
teneur en eau, température, pH) et de l’assemblage des communautés lombriciennes sur la
production des biostructures (Martin, 1982; Stovold et al., 2004; Whalen et al., 2004; Capowiez et
al., 2009a). De ce fait, une augmentation de lombriciens dans le sol n’implique pas forcément une
augmentation de biostructures dans le sol (Pérès, 2003). Par ailleurs, divers travaux soulignent les
variations temporelles de ces biostructures. La morphologie des réseaux de galeries évolue à
l'échelle saisonnière (Kretzschmar, 1982; Capowiez et al., 1998) ainsi qu'à l'échelle interannuelle
(Ligthart, 1997) ; la production des turricules est plus importante au printemps et en automne
lorsque les lombriciens sont actifs physiologiquement (Binet and Le Bayon, 1999; Perreault et al.,
2007). On peut supposer une dynamique similaire des déjections dans le sol, mais cela n’a encore
jamais été étudié en milieu tempéré. Malgré les différents facteurs cités ci-dessus, dans la majorité
des cas l’abondance des biostructures lombriciennes suit l’abondance des communautés
lombriciennes : un plus grand nombre de biostructures est observé dans un sol en non labour par
rapport à un sol travaillé conventionnellement et sous apport de matière organique exogène. Cette
augmentation est expliquée soit par un nombre plus important des communautés lombriciennes,
une augmentation de leur activité et/ou une pérennité plus importante de ces structures au regard
des impacts de l’outil lors de la mise en place de la culture. Si nous disposons de nombreuses
références concernant l’abondance des galeries (Ehlers, 1975; Trojan and Linden, 1998; Tebrügge
and Düring, 1999; McGarry et al., 2000; Vandenbygaart et al., 2000; Wuest, 2001; Hubert et al.,
2007; Riley et al., 2008; Capowiez et al., 2009a), ce n’est pas le cas pour les déjections (Drees et
al., 1994; Vandenbygaart et al., 2000; Pulleman et al., 2003).
2.2. Action des lombriciens sur la structure et la perméabilité du sol
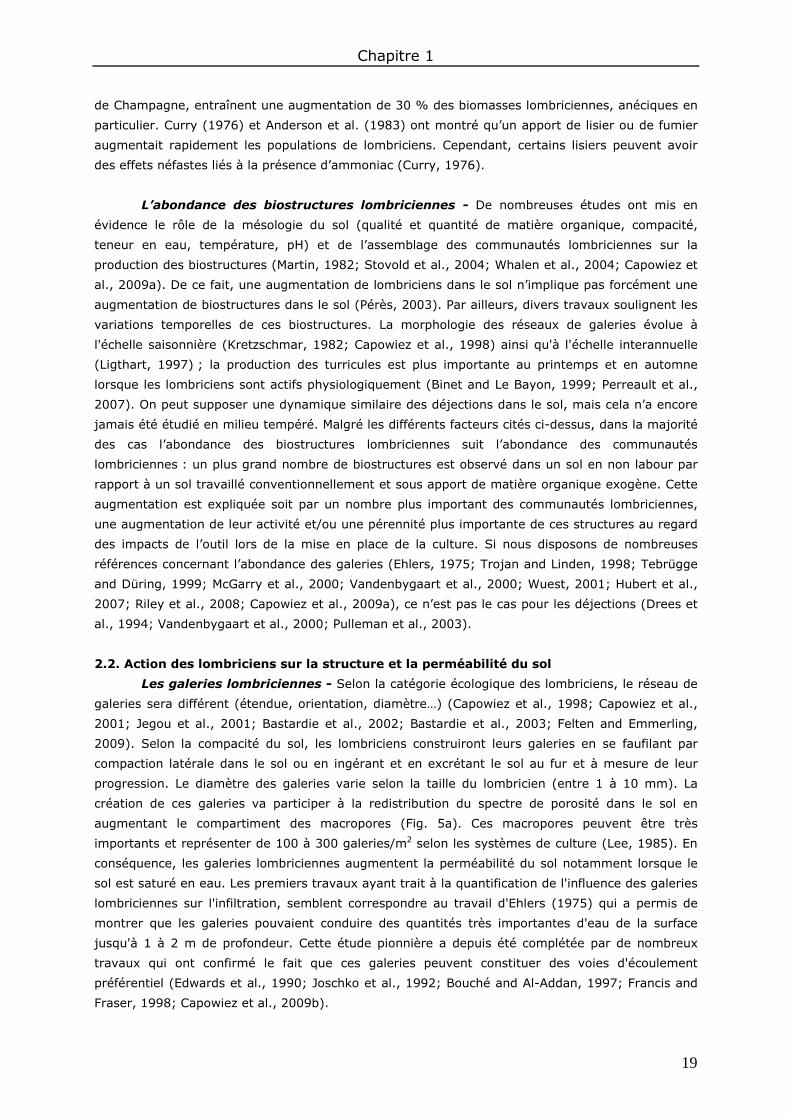
Les galeries lombriciennes - Selon la catégorie écologique des lombriciens, le réseau de
galeries sera différent (étendue, orientation, diamètre…) (Capowiez et al., 1998; Capowiez et al.,
2001; Jegou et al., 2001; Bastardie et al., 2002; Bastardie et al., 2003; Felten and Emmerling,
2009). Selon la compacité du sol, les lombriciens construiront leurs galeries en se faufilant par
compaction latérale dans le sol ou en ingérant et en excrétant le sol au fur et à mesure de leur
progression. Le diamètre des galeries varie selon la taille du lombricien (entre 1 à 10 mm). La
création de ces galeries va participer à la redistribution du spectre de porosité dans le sol en
augmentant le compartiment des macropores (Fig. 5a). Ces macropores peuvent être très
importants et représenter de 100 à 300 galeries/m2 selon les systèmes de culture (Lee, 1985). En
conséquence, les galeries lombriciennes augmentent la perméabilité du sol notamment lorsque le
sol est saturé en eau. Les premiers travaux ayant trait à la quantification de l'influence des galeries
lombriciennes sur l'infiltration, semblent correspondre au travail d'Ehlers (1975) qui a permis de
montrer que les galeries pouvaient conduire des quantités très importantes d'eau de la surface
jusqu'à 1 à 2 m de profondeur. Cette étude pionnière a depuis été complétée par de nombreux
travaux qui ont confirmé le fait que ces galeries peuvent constituer des voies d'écoulement
préférentiel (Edwards et al., 1990; Joschko et al., 1992; Bouché and Al-Addan, 1997; Francis and
Fraser, 1998; Capowiez et al., 2009b).
Chapitre 1
20
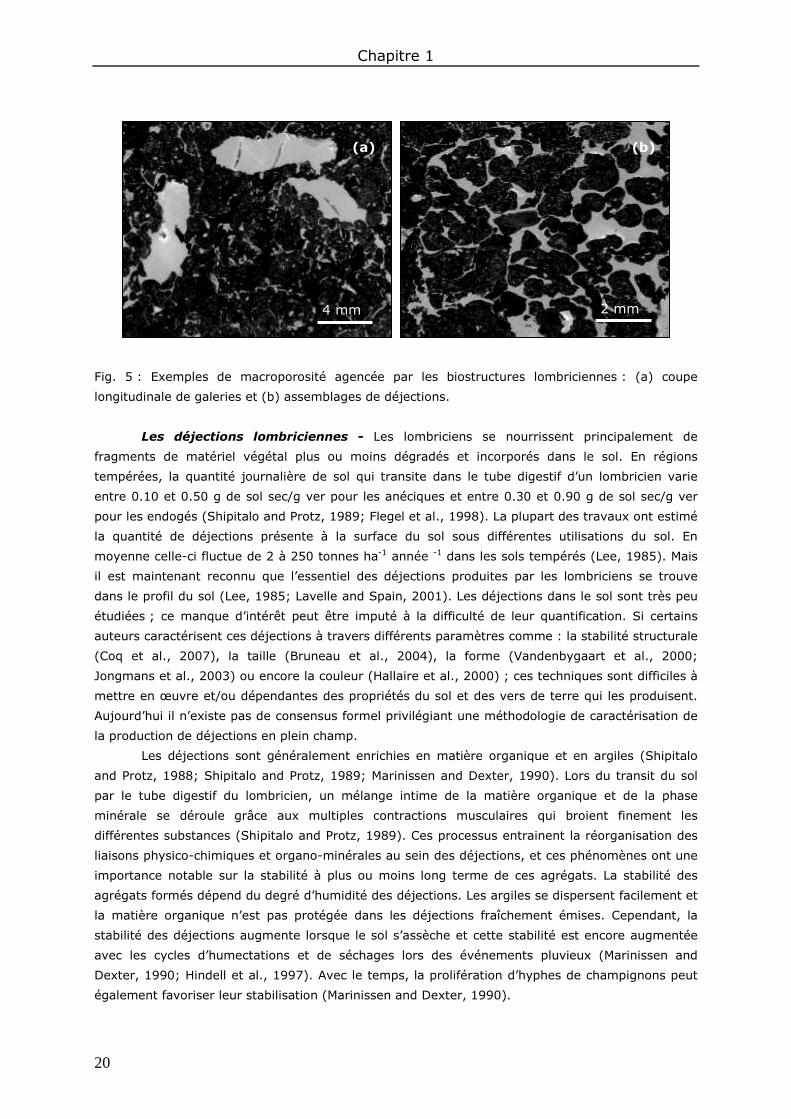
Fig. 5 : Exemples de macroporosité agencée par les biostructures lombriciennes : (a) coupe
longitudinale de galeries et (b) assemblages de déjections.
Les déjections lombriciennes - Les lombriciens se nourrissent principalement de
fragments de matériel végétal plus ou moins dégradés et incorporés dans le sol. En régions
tempérées, la quantité journalière de sol qui transite dans le tube digestif d’un lombricien varie
entre 0.10 et 0.50 g de sol sec/g ver pour les anéciques et entre 0.30 et 0.90 g de sol sec/g ver
pour les endogés (Shipitalo and Protz, 1989; Flegel et al., 1998). La plupart des travaux ont estimé
la quantité de déjections présente à la surface du sol sous différentes utilisations du sol. En
moyenne celle-ci fluctue de 2 à 250 tonnes ha-1 année -1 dans les sols tempérés (Lee, 1985). Mais
il est maintenant reconnu que l’essentiel des déjections produites par les lombriciens se trouve
dans le profil du sol (Lee, 1985; Lavelle and Spain, 2001). Les déjections dans le sol sont très peu
étudiées ; ce manque d’intérêt peut être imputé à la difficulté de leur quantification. Si certains
auteurs caractérisent ces déjections à travers différents paramètres comme : la stabilité structurale
(Coq et al., 2007), la taille (Bruneau et al., 2004), la forme (Vandenbygaart et al., 2000;
Jongmans et al., 2003) ou encore la couleur (Hallaire et al., 2000) ; ces techniques sont difficiles à
mettre en œuvre et/ou dépendantes des propriétés du sol et des vers de terre qui les produisent.
Aujourd’hui il n’existe pas de consensus formel privilégiant une méthodologie de caractérisation de
la production de déjections en plein champ.
Les déjections sont généralement enrichies en matière organique et en argiles (Shipitalo
and Protz, 1988; Shipitalo and Protz, 1989; Marinissen and Dexter, 1990). Lors du transit du sol
par le tube digestif du lombricien, un mélange intime de la matière organique et de la phase
minérale se déroule grâce aux multiples contractions musculaires qui broient finement les
différentes substances (Shipitalo and Protz, 1989). Ces processus entrainent la réorganisation des
liaisons physico-chimiques et organo-minérales au sein des déjections, et ces phénomènes ont une
importance notable sur la stabilité à plus ou moins long terme de ces agrégats. La stabilité des
agrégats formés dépend du degré d’humidité des déjections. Les argiles se dispersent facilement et
la matière organique n’est pas protégée dans les déjections fraîchement émises. Cependant, la
stabilité des déjections augmente lorsque le sol s’assèche et cette stabilité est encore augmentée
avec les cycles d’humectations et de séchages lors des événements pluvieux (Marinissen and
Dexter, 1990; Hindell et al., 1997). Avec le temps, la prolifération d’hyphes de champignons peut
également favoriser leur stabilisation (Marinissen and Dexter, 1990).
2 mm
(a)
4 mm
(b)
Chapitre 1
21
Le dépôt de déjections dans le sol crée une macroporosité d’assemblage plus ou moins
grande selon la taille et l’état de dégradation de celles-ci. La porosité créée a une forme
mamelonnée et se distingue facilement du sol environnant (Bullock et al., 1985; Vandenbygaart et
al., 2000) (Fig. 5b). L’assemblage des déjections participe à la macroporosité du sol (Blanchart,
1992; Hallaire et al., 2000; Vandenbygaart et al., 2000; Bottinelli et al., 2010b) mais son effet sur
la porosité du sol reste encore très peu étudié. Selon leurs caractéristiques, les dépôts de
déjections peuvent s'accompagner d'une augmentation de la structure grumeleuse (Pérès et al.,
1998; Vandenbygaart et al., 1999b). A l’inverse si ces déjections sont instables vis-à-vis de l’action
de l’eau ou présentent un trop fort degré de compaction, l’activité des vers de terre peut mener à
une diminution de la macroporosité du sol (Blanchart et al., 1997; Hallaire et al., 2000 ; Bottinelli
et al., 2010b). En conséquence, l’effet des déjections sur la perméabilité du sol est controversé et
reste là encore très peu décrit. Lorsque les déjections dégradent la structure du sol, la perméabilité
est réduite (Blanchart et al., 1999) ; à l’inverse lorsque la macroporosité du sol est augmentée, la
perméabilité du sol augmente (Lamandé et al., 2003; Lamandé et al., 2004).
2.3. Impact des pratiques culturales sur la structure et la perméabilité du sol
Effet du travail du sol - Dans les couches où se concentrent les résidus de récolte en non
labour, la matière organique du sol augmente (Angers et al., 1993a; Six et al., 1999; Daraghmeh
et al., 2009). En conséquence la stabilité structurale augmente de manière importante (Angers et
al., 1993b; Tebrügge and Düring, 1999; Sasal et al., 2006; Álvaro-Fuentes et al., 2008;
Daraghmeh et al., 2009). L’augmentation de la stabilité structurale en non labour est généralement
bien corrélée à l’augmentation des teneurs en carbone organique (Whalen et al., 2003; Jiao et al.,
2006) et à l’augmentation de l’activité biologique : biomasse microbienne (Angers et al., 1993b;
Álvaro-Fuentes et al., 2008) et polysaccharides microbiens et racinaires (Angers et al., 1993b).
L’absence de travail du sol conduit généralement à une compaction de l’horizon de surface.
De nombreuses études réalisées dans des conditions pédoclimatiques variées concluent à une
augmentation de la densité apparente en semis direct dans les 20 premiers centimètres de sol
(Hussain et al., 1998; Vandenbygaart et al., 1999a; Schjønning and Rasmussen, 2000; Kushwaha
et al., 2001; Dam et al., 2005). La comparaison d’un sol labouré à un sol travaillé superficiellement
ne montre généralement pas de différences significatives (Azooz et al., 1996; Yang and Kay,
2001). D’autre part, il est remarqué dans de nombreux cas que les différences entre modalités de
travail du sol sont maximales après le passage de la charrue puis diminuent au cours de la saison
culturale (Tebrügge and Düring, 1999; Daraghmeh et al., 2008).
Concernant la macroporosité du sol, on constate que celle-ci décroit quel que soit le
nombre d’années de non travail du sol (Drees et al., 1994; Miller et al., 1998a; Vandenbygaart et
al., 1999b; Schjønning and Rasmussen, 2000; Lipiec et al., 2006; Hubert et al., 2007). L’ensemble
des travaux montre que sous semis direct les pores complexes diminuent (Miller et al., 1998a;
Hubert et al., 2007) au dépens des pores ronds qui augmentent, de taille < 500 µm (Miller et al.,
1998a; Vandenbygaart et al., 1999b) et de taille > 500 µm (Shipitalo and Protz, 1987;
Vandenbygaart et al., 1999b; Vandenbygaart et al., 2000). Ces auteurs associent ces pores,
respectivement à des pores racinaires ou à des galeries lombriciennes qui s’accumulent au cours
des années de non travail du sol. Récemment Vandenbygaart et al. (2000) ont mis en évidence
que des pores de formes complexe à arrondie correspondaient aux pores agencés entre les
déjections lombriciennes ; le nombre de ces pores était plus important en semis direct comparé à
un labour. La comparaison d’un sol sous labour et soumis à un travail superficiel ne montre pas de
différence de macroporosité (Pagliai et al., 1995). De nombreux travaux ont montré, au même titre

Chapitre 1
22
que les mesures de densité apparente, que l’écart de macroporosité entre un labour et un semis
direct est maximum après le travail du sol (Pierce et al., 1994). Les travaux d’Hubert et al. (2007)
ont suggéré qu’en fin d’année culturale les pores créés par la charrue étaient remplacés par des
pores complexes dont l’origine était lombricienne.
La conductivité hydraulique du sol (K) dépend du volume poral. Plus ce dernier augmente
et plus la conductivité hydraulique est susceptible d’augmenter. Elle dépend également de la
continuité, donc de la morphologie de l’espace macroporal. Les résultats apparaissent très
variables selon les sites d’études, et les méthodes mises en œuvre (Green et al., 2003). Comparé à
un sol travaillé, K dans un sol en semis direct peut être augmentée (Miller et al., 1998a; Arshad et
al., 1999), similaire (Blanco-Canqui et al., 2002; Fuentes et al., 2004) ou diminuée (Lampurlanés
and Cantero-Martínez, 2006; Carof et al., 2007). En fait, cette variabilité s’explique par les
différences d’évolution du réseau poral au cours du temps entre un sol labouré et un sol en semis
direct. Si des macropores sont créés juste après le labour, ce qui améliore temporairement la
vitesse d’infiltration de l’eau (Lin et al., 1999; Coquet et al., 2005), l’action mécanique de la
charrue peut détruire la continuité des galeries lombriciennes formées pendant le cycle cultural
précédent (Shipitalo and Protz, 1987; Logsdon et al., 1993). A l’inverse, la réduction du nombre de
macropores du sol après l’abandon du labour peut être contrebalancée par un accroissement de la
quantité de galeries lombriciennes lors de la pratique à long terme du semis direct (McGarry et al.,
2000).
Effet de l’apport d’effluent d’élevage - L’apport d’effluent d’élevage améliore la stabilité
de la structure via son effet sur l’augmentation des teneurs en carbone organique du sol (Albiach et
al., 2001; Nyamangara et al., 2001; Barzegar et al., 2002; Pulleman et al., 2003; Celik et al.,
2004; Mikha and Rice, 2004; Jiao et al., 2006; Bhattacharyya et al., 2007; Hati et al., 2007) et sur
l’augmentation de la concentration du sol en polysaccharides microbiens et racinaires (Albiach et
al., 2001; Grandy et al., 2002; Yousefi et al., 2008). Ces effets sont d’autant plus importants que
les doses apportées sont importantes. Cela est vérifié également pour les mesures de
macroporosité et de conductivité hydraulique (Schjønning et al., 1994; Miller et al., 1998b; Shirani
et al., 2002; Jiao et al., 2006).
Un grand nombre d’études montre que l’apport d’effluent d’élevage provoque une
diminution de la densité apparente des sols (Edmeades, 2003; Celik et al., 2004; Pagliai et al.,
2004; Bhattacharyya et al., 2007; Hati et al., 2007; Khan et al., 2007) et une augmentation de la
macroporosité du sol (Pagliai et al., 1987; Marinari et al., 2000; Miller et al., 2002). De façon
surprenante, les auteurs ne justifient que très rarement l’augmentation de la porosité suite à
l’apport d’effluent ; il est alors courant de dire que la porosité du sol augmente suite à un
phénomène de dilution (la matière organique ayant une faible densité) ou encore par
l’augmentation de l’agrégation par les micro-organismes (Khaleel et al., 1981; Haynes and Naidu,
1998). Aucune de ces études réalisées en plein champ n’évoquent l’effet de la macrofaune sur ces
propriétés structurales.
En conséquence la conductivité hydraulique est très souvent augmentée (Mbagwu, 1992;
Miller et al., 2002; Schjønning et al., 2002; Khan et al., 2007). Néanmoins certains auteurs ne
remarquent pas d’effet sur K soit parce que la quantité d’effluent apportée est faible, ou que la
variabilité de K est importante (Shirani et al., 2002; Arriaga and Lowery, 2003), ou encore que
l’effet dépend de la saturation du sol en eau (Miller et al., 2002).
Chapitre 1
23
3. Objectif et démarche
L’objectif de cette thèse est d’évaluer l’impact de pratiques culturales combinant le non
travail du sol et l’apport d’effluent sur les propriétés physiques du sol, en analysant le rôle de
l’activité lombricienne.
Cette étude est menée sur un site expérimental où sont croisés trois techniques de travail
du sol (labour conventionnel, travail superficiel, semis direct) et deux types de fertilisation
(minérale ou fumier de volaille) depuis 8 ans.
Pour répondre à cet objectif, et après avoir décrit le site d’étude (chapitre 2), nous
répondrons successivement à différentes questions, classées en deux parties :
• une partie qui abordera les biostructures lombriciennes, à travers 2 questions :
- comment quantifier les biostructures lombriciennes ? (chapitre 3)
- quel est l’impact des pratiques culturales sur l’abondance de ces biostructures ? (chapitre
4)
• une partie qui abordera le fonctionnement physique du sol, à travers 2 questions :
- Quel est l’impact des pratiques culturales et des lombriciens sur la stabilité structurale des
agrégats du sol ? (chapitre 5 et chapitre 6)
- Comment la macroporosité et la perméabilité du sol varient-elles selon les pratiques
culturales ? (chapitre 7)
Ayant répondu à ces questions, nous tenterons dans une discussion générale de croiser ces
données, de décrire les dynamiques saisonnière des propriétés du sol, et de proposer des schémas
d’évolution du sol selon les pratiques culturales, prenant en compte le rôle de l’activité
lombricienne.

Chapitre 2
Le site d’étude


27
Chapitre 2 Le site d’étude
Les mesures sont réalisées à la station expérimentale de Kerguéhennec (N 47°53, W
02°44), située dans le centre du Morbihan (56) à 30 km au Nord de Vannes en Bretagne.
Fig. 1: Localisation du domaine expérimentale de Kerguéhennec dans la région Bretagne.
1. Le contexte pédoclimatique
1.1. Le climat
Le climat est océanique, généralement doux et humide. La pluviométrie moyenne annuelle
est de 890 mm pour 171 jours de pluie (1968-1996), caractérisée par un hiver humide et un été
sec. Les températures sont relativement douces, de 5.4 °C en février, à 17.4 °C en juillet (la
moyenne annuelle étant de 10.8 °C). Le nombre moyen de jours de gelées est de 47, avec un
risque important de novembre à mars.
1.2. Le sol
En 2000, lors de la mise en place de l’essai, le sol de la parcelle a été caractérisé à partir
de sondages à la tarière, d’une fosse pédologique, et d’analyses physico-chimiques (Viaud, 2000).
Le sol en place est un Cambisol Humique selon la classification FAO, moyennement profond à
profond (80 cm) sur micaschistes. Le profil moyen du sol de cette parcelle comporte 3 horizons :
KKeerrgguuééhheennnneecc
- Horizon organo-minéral A (0-45 cm) : horizon brun (10 YR 4/3), de texture
limono-sablo-argileuse, sans trace d’hydromorphie. Le taux de matière organique
est élevé (jusque 4.3%) et l’activité lombricienne est importante. La structure est
grumeleuse en surface et polyédrique en profondeur avec certaines zones
compactées. Limite inférieure : fond de labour.
- Horizon structural S (45-90 cm) : horizon organo-minéral brun jaunâtre (10 YR
5/6), de texture limono-sablo-argileuse sans trace d’hydromorphie. La matière
organique est concentrée dans des pédotubules (10 YR 4/3) ou incorporée dans
de plus larges zones de couleur brun foncée (10 YR 4/4). Cet horizon est
caractérisé par une charge importante en graviers de schiste et en cailloux de
quartz.
- Horizon d’altération C (90+) : Roche mère altérée (micaschiste) sous forme de
feuillets friables. Couleur brun foncé avec des taches plus claires (10 YR 5/6).
A
S
C

Chapitre 2
28
Le sol du site présente une granulométrie équilibrée depuis la surface jusqu’à l’horizon S
(Tableau 1). Le pH est acide dès la surface. En 2000, le taux de MO est élevé (4.3% sur l’horizon
de surface), et se situe à un niveau intermédiaire entre la teneur en MO moyenne du bassin de
Rennes (2%) et celle du Finistère (7-8%). La CEC est assez faible (9.5 meq/100g), liée à la faible
proportion d’argiles, elle reste suffisante pour alimenter convenablement les cultures
(recommandations 8-20 meq/100g).
Profondeur (cm)
Granulométrie (g kg-1) pH eau
MO (g kg-1)
P (Dyer) (g kg-1) 200-2000
µm 50-200
µm 20-50
µm 2-20 µm
<2 µm
0-30 15 26 19.1 23.3 16.6 6 43 0.48 30-60 14.4 26.5 17.9 25 16 5.4 25.2 0.10 60-80 21.6 28 15.7 19.9 13.7 5 12 0.45
Profondeur (cm)
CEC (meq/100g)
Cations échangeables (g kg-1) Oligo-éléments (mg kg-1)
Ca Na Mg K
Cu (EDTA)
Mn (EDTA)
Zn (EDTA)
0-30 9.5 1.59 0.02 0.16 0.31 4.4 9.1 2.2 30-60 6.8 0.6 0.10 0.06 0.17 4.0 4 0.7 60-80 5.1 0.19 0.01 0.03 0.11 1.5 10.8 1.1
Tableau 1 : Caractéristiques analytiques moyennes du sol. 2. Le dispositif expérimental
Il s’agit d’un dispositif en split-plot constitué de 18 parcelles élémentaires de 300 m² (25 m
sur 12 m), disposées en 3 blocs sur lesquels sont croisés deux facteurs : le travail du sol comme
facteur principal (le labour conventionnel (MP : moldboard plowing), le travail superficiel (ST :
surface tillage) et le semis direct (NT : no-tillage) ; la fertilisation comme facteur secondaire
(apport d’engrais minéral (M) ou de fumier de volaille (O)) (Fig. 2). La rotation est quadriennale :
maïs grain-blé-colza-blé. Entre la récolte de la culture d’hiver et le semis de la culture de
printemps, une interculture de phacélie est mise en place.
Fig. 2 : Représentation du dispositif expérimentale. MP : labour conventionnel, ST : travail
superficiel, NT : semis direct. M : fertilisation minérale et O : fertilisation organique par apport de
fumier de volaille.
Blo
c 1
Blo
c 2
Blo
c 3
Bande enherbée 12 m
Bande enherbée
25 m
M O O M O M
O M O M O M
O M M O M O
MP
ST
NT
Nord

Chapitre 2
29
Le labour conventionnel (MP) est réalisé à l’aide d’une charrue classique travaillant sur
environ 25 cm. Le lit de semence, « reprise de labour », est préparé avec une herse rotative
travaillant sur 5 à 10 cm. La modalité MP est assimilée à une pratique conventionnelle, en
opposition aux techniques culturales sans labour représentées dans cette étude par le travail
superficiel et le semis direct. Sous blé 2006-2007 et interculture de phacélie, Le travail superficiel
(ST), est réalisé à l’aide d’un chisel qui travaille toute la surface sur 12-15 cm de profondeur. Le
semis direct (NT), est réalisé avec un SD 3000 (KUHN) qui ne travaille que la ligne de semis sur 2-
3 cm de large. La graine est insérée dans un sillon tracé par un disque ouvreur et refermé par un
double disque semeur. Sous maïs 2008, la modalité ST est mise en place à l’aide d’un chisel qui
travaille toute la surface sur 12-15 cm de profondeur suivi d’un travail du lit de semence par une
herse rotative sur 5 à 10 cm de profondeur. La mise en place de la modalité NT est réalisée par un
cultivateur rotatif qui travaille la bande de semis sur 20 cm de large et 8 cm de profondeur. L’inter-
rang reste intact sur une largeur d’au moins 50 cm ce qui permet d’effectuer les mesures sur un
sol non travaillé.
Qu’elle soit minérale ou organique, la fertilisation est ajustée selon les besoins en azote de
la plante calculée à partir d’un bilan prévisionnel de l’azote (120 unités par hectare). Ainsi l’apport
de fumier de volaille au sol fluctue entre 4 à 17 tonnes ha-1 an-1. Le tableau 2 décrit la composition
chimique d’un fumier de volaille moyen. Les pailles n’étant jamais exportées, elles constituent un
apport annuel de 2 tonnes de C ha-1 au sol.
Composants (g kg-1)
Résultats sur sec
Résultats sur brut
Composants (g kg-1)
Résultats sur sec
Résultats sur brut
Matières sèches - 671 Cendres 201 135 Cuivre 86 58 Matières organiques 799 536 Zinc 308 206 Carbone 375 252 Manganèse 432 290 Azote total - 30.6 pH - 8.02 Azote ammoniacal - 8.9 C/N - 8.2 Fibres NDF
ADF Hémicellulose
Cellulose Lignine
475 295 181 225 69
319 198 122 151 46
Phosphore (P2o5) 45.8 30.7 Potassium(K205) 34.1 22.9 Calcium (CaO) 40.3 27.1 Magnésium (MgO) 8.4 5.6 Sodium (Na2O) 5.8 3.9
Tableau 2: Caractéristiques analytiques du fumier de volaille. NDF: Neutral Detergent Fibre, ADF:
Acid Detergent Fibre.
Les mesures présentées dans ce travail ont été réalisées entre 2 et 7 cm de profondeur au
cours de 7 dates d’échantillonnage de 2006 à 2008, sous cultures de blé et maïs et sous
interculture de phacélie. L’itinéraire technique correspondant à cette étude est présenté dans le
tableau ci-dessous.
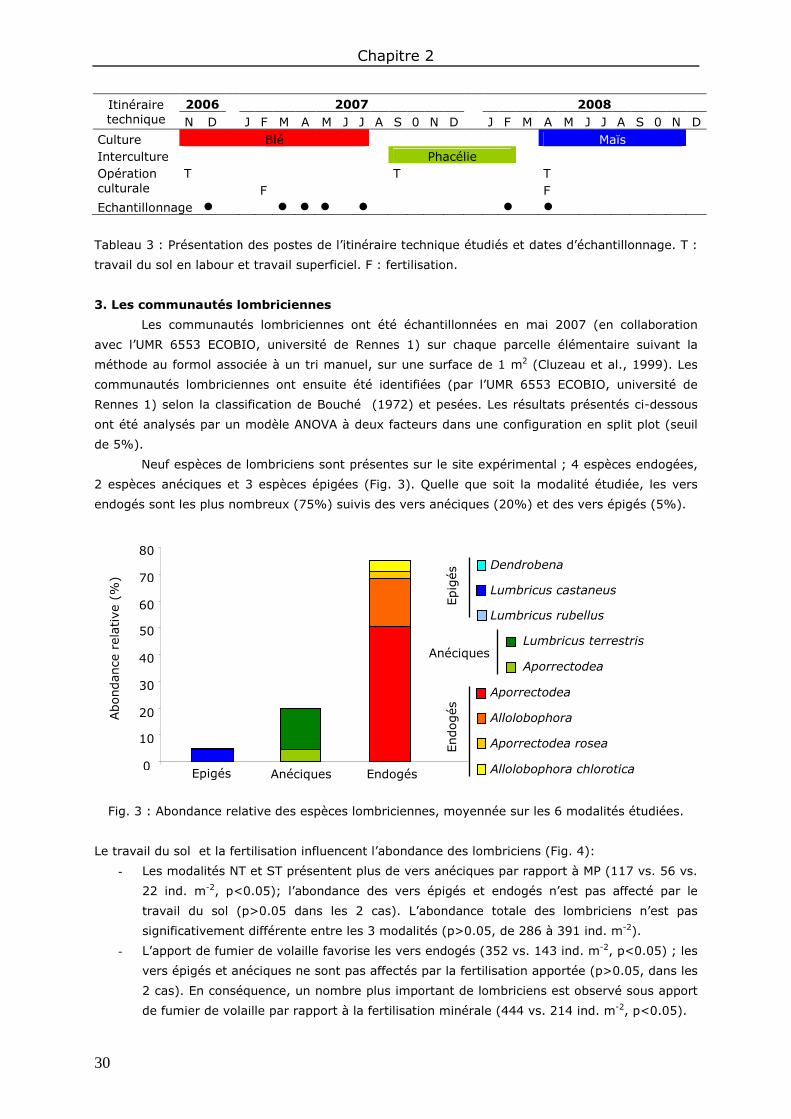
Chapitre 2
30
Itinéraire technique
2006 2007 2008
N D J F M A M J J A S 0 N D J F M A M J J A S 0 N D Culture Blé Maïs Interculture Phacélie Opération culturale
T T T F F
Echantillonnage � � � � � � � Tableau 3 : Présentation des postes de l’itinéraire technique étudiés et dates d’échantillonnage. T :
travail du sol en labour et travail superficiel. F : fertilisation.
3. Les communautés lombriciennes
Les communautés lombriciennes ont été échantillonnées en mai 2007 (en collaboration
avec l’UMR 6553 ECOBIO, université de Rennes 1) sur chaque parcelle élémentaire suivant la
méthode au formol associée à un tri manuel, sur une surface de 1 m2 (Cluzeau et al., 1999). Les
communautés lombriciennes ont ensuite été identifiées (par l’UMR 6553 ECOBIO, université de
Rennes 1) selon la classification de Bouché (1972) et pesées. Les résultats présentés ci-dessous
ont été analysés par un modèle ANOVA à deux facteurs dans une configuration en split plot (seuil
de 5%).
Neuf espèces de lombriciens sont présentes sur le site expérimental ; 4 espèces endogées,
2 espèces anéciques et 3 espèces épigées (Fig. 3). Quelle que soit la modalité étudiée, les vers
endogés sont les plus nombreux (75%) suivis des vers anéciques (20%) et des vers épigés (5%).
Fig. 3 : Abondance relative des espèces lombriciennes, moyennée sur les 6 modalités étudiées.
Le travail du sol et la fertilisation influencent l’abondance des lombriciens (Fig. 4):
- Les modalités NT et ST présentent plus de vers anéciques par rapport à MP (117 vs. 56 vs.
22 ind. m-2, p<0.05); l’abondance des vers épigés et endogés n’est pas affecté par le
travail du sol (p>0.05 dans les 2 cas). L’abondance totale des lombriciens n’est pas
significativement différente entre les 3 modalités (p>0.05, de 286 à 391 ind. m-2).
- L’apport de fumier de volaille favorise les vers endogés (352 vs. 143 ind. m-2, p<0.05) ; les
vers épigés et anéciques ne sont pas affectés par la fertilisation apportée (p>0.05, dans les
2 cas). En conséquence, un nombre plus important de lombriciens est observé sous apport
de fumier de volaille par rapport à la fertilisation minérale (444 vs. 214 ind. m-2, p<0.05).
0
10
20
30
40
50
60
70
80
Epigés Allolobophora chlorotica typica
Aporrectodea rosea
Allolobophora icterica
Aporrectodea caliginosa
Endogés
Aporrectodea giardi
Lumbricus terrestris Anéciques
Lumbricus rubellus
Lumbricus castaneus
Dendrobena mammalis
Epig
és
Abondan
ce r
elat
ive
(%)
Anéciques Endogés

Chapitre 2
31
Fig. 4 : Abondance des trois catégories écologiques lombriciennes : (a) en labour conventionnel
(MP), travail superficiel (ST), semis direct (NT) et (b) sous fertilisation minérale (M) et organique
(O).
Endogés
Anéciques
Epigés
0
100
200
300
400
500
MP ST NT
M O
Abondan
ce (
ind.
m-2
)
(a) (b)

33
Partie B
Abondance des biostructures lombriciennes


Chapitre 3
Evaluation de différentes méthodes de
quantification des biostructures lombriciennes


37
Chapitre 3 Evaluation de différentes méthodes de quantification des biostructures lombriciennes
1. Introduction
Dans de nombreuses expérimentations réalisées en plein champ, les auteurs tentent
d’associer les propriétés du sol à l’abondance des lombriciens (Marinissen, 1994; Pérès, 2003;
Johnson-Maynard et al., 2007; Peigné et al., 2009), pourtant il est clairement établi que la
mésologie du sol (température, humidité, teneur et qualité de la matière organique et porosité) ou
l’assemblage des communautés lombriciennes déterminent la production de galeries et des
déjections (biostructures) (Martin, 1982; Pérès et al., 1998; Stovold et al., 2004; Whalen et al.,
2004; Felten and Emmerling, 2009).
Les biostructures lombriciennes participent à l’élaboration de la structure du sol : ces
biostructures peuvent augmenter la stabilité structurale, la macroporosité ou encore la perméabilité
du sol (Tomlin et al., 1995). Si la quantification des galeries apparait « simple » du fait de leur
forme plus ou moins régulière et leur grande taille ; ce n’est pas le cas pour les déjections
déposées dans le sol. Les déjections sont des boulettes de 1 à 2 mm, généralement agencées à
plusieurs dans les vides du sol (galeries ou autre). Lorsque ces boulettes sont jeunes, elles
agencent une porosité d’assemblage lâche, mamelonnée, puis au cours de leur dégradation, ces
déjections fusionnent entre elles puis avec la matrice du sol, créant une porosité en forme de
croissant plus ou moins fin.
Certaines études ont permis de quantifier manuellement les déjections dans le sol, mais
généralement ces méthodes sont dépendantes du type de sol, du type de ver ; elles sont longues à
mettre en œuvre et nécessitent un œil d’expert (Hallaire et al., 2000; Jongmans et al., 2001;
Jongmans et al., 2003; Pulleman et al., 2005; Piron, 2008). L’analyse d’image est apparue comme
un outil apte à décrire la structure du sol (Pagliai et al., 1983; Lamandé et al., 2003) ; elle permet
une caractérisation non seulement quantitative de la porosité, mais également qualitative. Les
travaux de Vandebygaart et al. (2000) ont présenté un modèle typologique de la porosité du sol
permettant de quantifier automatiquement la porosité agencée entre les déjections.
Nous proposons dans ce chapitre d’évaluer différentes méthodes de quantification des
biostructures lombriciennes afin d’identifier celles qui seront utilisées dans la suite de la thèse.
Deux méthodes originales sont développées par analyse d’image et comparées avec des méthodes
connues de la littérature. Ces méthodes sont testées sous 3 modalités de travail du sol (labour,
travail superficiel et semis direct) à une même date.
2. Méthodes
Toutes les mesures ont été réalisées juste après la récolte du blé, en août 2007. Les
modalités étudiées sont le labour (MP), le travail superficiel (ST) et le semis direct (NT), sous
fertilisation minérale entre 2 et 7 cm de profondeur. Nous avons mis en œuvre différentes
méthodes de quantification des biostructures lombriciennes.
2.1. Abondance des déjections à l’échelle des agrégats
Sur chaque parcelle élémentaire, trois prélèvements ont été réalisés pour constituer un
échantillon composite de 50g. L’abondance des déjections est estimée sur les agrégats de 3-5 mm
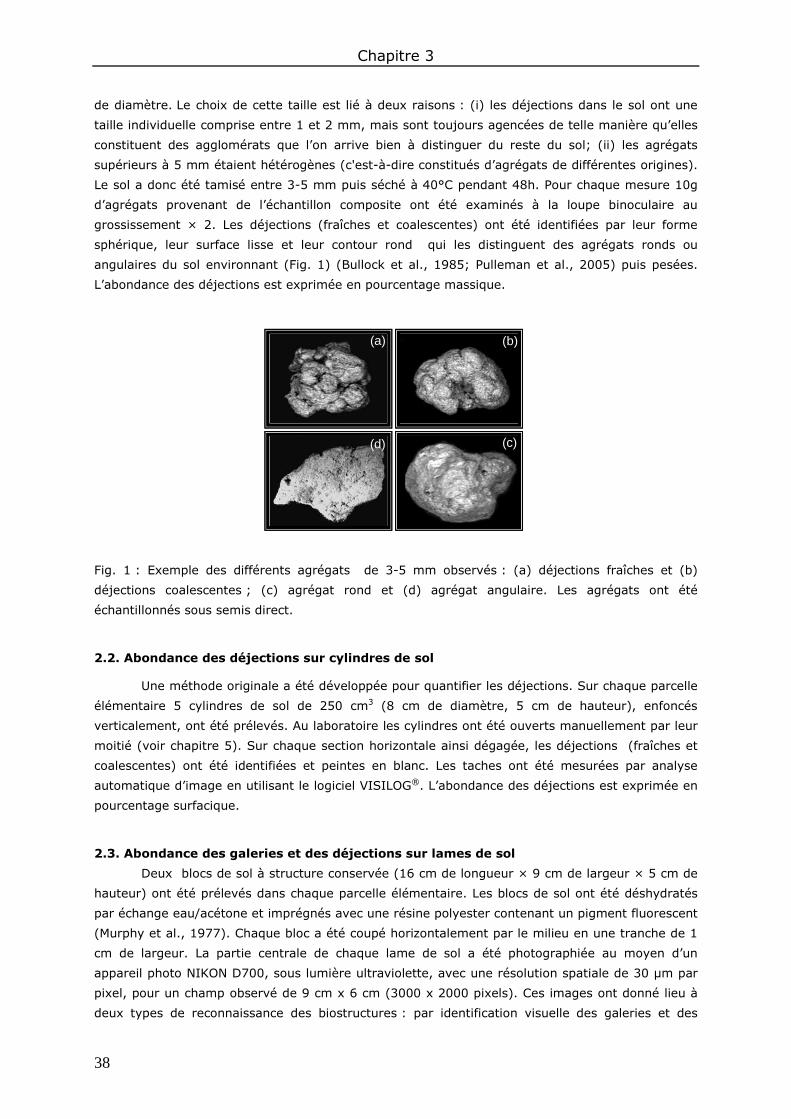
Chapitre 3
38
de diamètre. Le choix de cette taille est lié à deux raisons : (i) les déjections dans le sol ont une
taille individuelle comprise entre 1 et 2 mm, mais sont toujours agencées de telle manière qu’elles
constituent des agglomérats que l’on arrive bien à distinguer du reste du sol; (ii) les agrégats
supérieurs à 5 mm étaient hétérogènes (c'est-à-dire constitués d’agrégats de différentes origines).
Le sol a donc été tamisé entre 3-5 mm puis séché à 40°C pendant 48h. Pour chaque mesure 10g
d’agrégats provenant de l’échantillon composite ont été examinés à la loupe binoculaire au
grossissement × 2. Les déjections (fraîches et coalescentes) ont été identifiées par leur forme
sphérique, leur surface lisse et leur contour rond qui les distinguent des agrégats ronds ou
angulaires du sol environnant (Fig. 1) (Bullock et al., 1985; Pulleman et al., 2005) puis pesées.
L’abondance des déjections est exprimée en pourcentage massique.
(a) (b)
(c)(d)
(a) (b)
(c)(d)
Fig. 1 : Exemple des différents agrégats de 3-5 mm observés : (a) déjections fraîches et (b)
déjections coalescentes ; (c) agrégat rond et (d) agrégat angulaire. Les agrégats ont été
échantillonnés sous semis direct.
2.2. Abondance des déjections sur cylindres de sol
Une méthode originale a été développée pour quantifier les déjections. Sur chaque parcelle
élémentaire 5 cylindres de sol de 250 cm3 (8 cm de diamètre, 5 cm de hauteur), enfoncés
verticalement, ont été prélevés. Au laboratoire les cylindres ont été ouverts manuellement par leur
moitié (voir chapitre 5). Sur chaque section horizontale ainsi dégagée, les déjections (fraîches et
coalescentes) ont été identifiées et peintes en blanc. Les taches ont été mesurées par analyse
automatique d’image en utilisant le logiciel VISILOG®. L’abondance des déjections est exprimée en
pourcentage surfacique.
2.3. Abondance des galeries et des déjections sur lames de sol
Deux blocs de sol à structure conservée (16 cm de longueur × 9 cm de largeur × 5 cm de
hauteur) ont été prélevés dans chaque parcelle élémentaire. Les blocs de sol ont été déshydratés
par échange eau/acétone et imprégnés avec une résine polyester contenant un pigment fluorescent
(Murphy et al., 1977). Chaque bloc a été coupé horizontalement par le milieu en une tranche de 1
cm de largeur. La partie centrale de chaque lame de sol a été photographiée au moyen d’un
appareil photo NIKON D700, sous lumière ultraviolette, avec une résolution spatiale de 30 µm par
pixel, pour un champ observé de 9 cm x 6 cm (3000 x 2000 pixels). Ces images ont donné lieu à
deux types de reconnaissance des biostructures : par identification visuelle des galeries et des
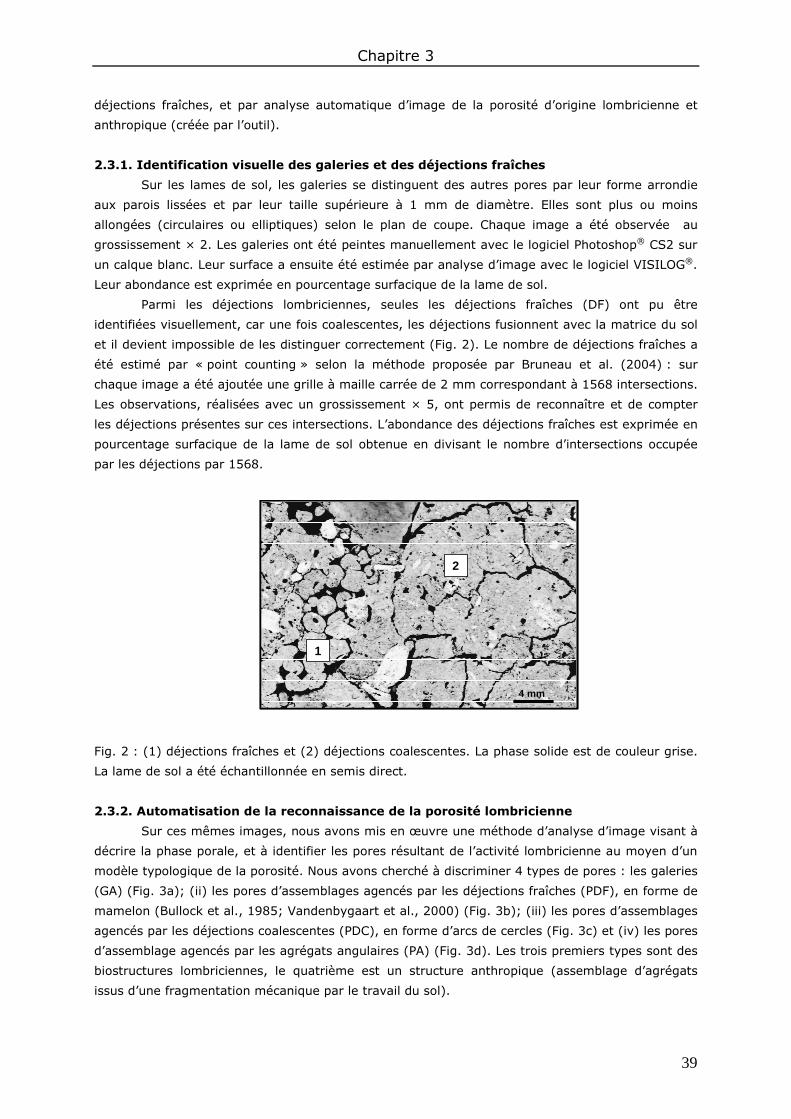
Chapitre 3
39
déjections fraîches, et par analyse automatique d’image de la porosité d’origine lombricienne et
anthropique (créée par l’outil).
2.3.1. Identification visuelle des galeries et des déjections fraîches
Sur les lames de sol, les galeries se distinguent des autres pores par leur forme arrondie
aux parois lissées et par leur taille supérieure à 1 mm de diamètre. Elles sont plus ou moins
allongées (circulaires ou elliptiques) selon le plan de coupe. Chaque image a été observée au
grossissement × 2. Les galeries ont été peintes manuellement avec le logiciel Photoshop® CS2 sur
un calque blanc. Leur surface a ensuite été estimée par analyse d’image avec le logiciel VISILOG®.
Leur abondance est exprimée en pourcentage surfacique de la lame de sol.
Parmi les déjections lombriciennes, seules les déjections fraîches (DF) ont pu être
identifiées visuellement, car une fois coalescentes, les déjections fusionnent avec la matrice du sol
et il devient impossible de les distinguer correctement (Fig. 2). Le nombre de déjections fraîches a
été estimé par « point counting » selon la méthode proposée par Bruneau et al. (2004) : sur
chaque image a été ajoutée une grille à maille carrée de 2 mm correspondant à 1568 intersections.
Les observations, réalisées avec un grossissement × 5, ont permis de reconnaître et de compter
les déjections présentes sur ces intersections. L’abondance des déjections fraîches est exprimée en
pourcentage surfacique de la lame de sol obtenue en divisant le nombre d’intersections occupée
par les déjections par 1568.
1
2
4 mm
1
2
1
2
4 mm
Fig. 2 : (1) déjections fraîches et (2) déjections coalescentes. La phase solide est de couleur grise.
La lame de sol a été échantillonnée en semis direct.
2.3.2. Automatisation de la reconnaissance de la porosité lombricienne
Sur ces mêmes images, nous avons mis en œuvre une méthode d’analyse d’image visant à
décrire la phase porale, et à identifier les pores résultant de l’activité lombricienne au moyen d’un
modèle typologique de la porosité. Nous avons cherché à discriminer 4 types de pores : les galeries
(GA) (Fig. 3a); (ii) les pores d’assemblages agencés par les déjections fraîches (PDF), en forme de
mamelon (Bullock et al., 1985; Vandenbygaart et al., 2000) (Fig. 3b); (iii) les pores d’assemblages
agencés par les déjections coalescentes (PDC), en forme d’arcs de cercles (Fig. 3c) et (iv) les pores
d’assemblage agencés par les agrégats angulaires (PA) (Fig. 3d). Les trois premiers types sont des
biostructures lombriciennes, le quatrième est un structure anthropique (assemblage d’agrégats
issus d’une fragmentation mécanique par le travail du sol).
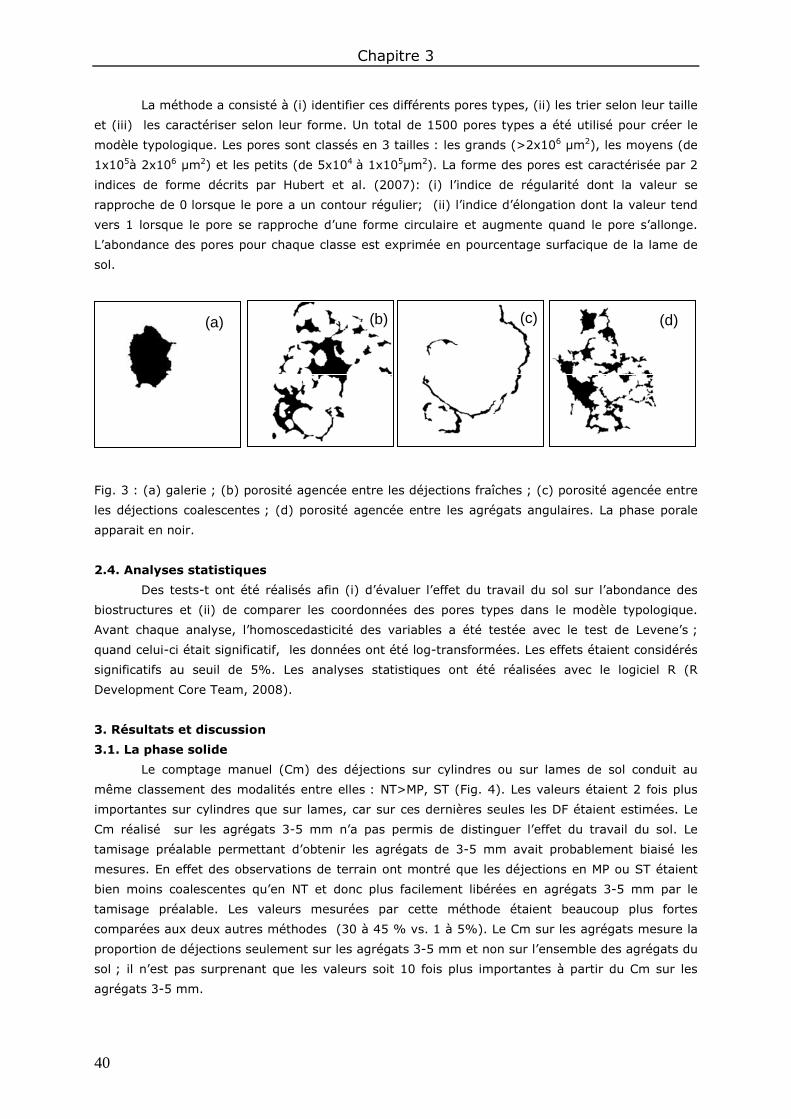
Chapitre 3
40
La méthode a consisté à (i) identifier ces différents pores types, (ii) les trier selon leur taille
et (iii) les caractériser selon leur forme. Un total de 1500 pores types a été utilisé pour créer le
modèle typologique. Les pores sont classés en 3 tailles : les grands (>2x106 µm2), les moyens (de
1x10⁵à 2x106 µm2) et les petits (de 5x10⁴ à 1x105µm2). La forme des pores est caractérisée par 2
indices de forme décrits par Hubert et al. (2007): (i) l’indice de régularité dont la valeur se
rapproche de 0 lorsque le pore a un contour régulier; (ii) l’indice d’élongation dont la valeur tend
vers 1 lorsque le pore se rapproche d’une forme circulaire et augmente quand le pore s’allonge.
L’abondance des pores pour chaque classe est exprimée en pourcentage surfacique de la lame de
sol.
(a) (d)(b) (c)(a) (d)(b) (c)
Fig. 3 : (a) galerie ; (b) porosité agencée entre les déjections fraîches ; (c) porosité agencée entre
les déjections coalescentes ; (d) porosité agencée entre les agrégats angulaires. La phase porale
apparait en noir.
2.4. Analyses statistiques
Des tests-t ont été réalisés afin (i) d’évaluer l’effet du travail du sol sur l’abondance des
biostructures et (ii) de comparer les coordonnées des pores types dans le modèle typologique.
Avant chaque analyse, l’homoscedasticité des variables a été testée avec le test de Levene’s ;
quand celui-ci était significatif, les données ont été log-transformées. Les effets étaient considérés
significatifs au seuil de 5%. Les analyses statistiques ont été réalisées avec le logiciel R (R
Development Core Team, 2008).
3. Résultats et discussion
3.1. La phase solide
Le comptage manuel (Cm) des déjections sur cylindres ou sur lames de sol conduit au
même classement des modalités entre elles : NT>MP, ST (Fig. 4). Les valeurs étaient 2 fois plus
importantes sur cylindres que sur lames, car sur ces dernières seules les DF étaient estimées. Le
Cm réalisé sur les agrégats 3-5 mm n’a pas permis de distinguer l’effet du travail du sol. Le
tamisage préalable permettant d’obtenir les agrégats de 3-5 mm avait probablement biaisé les
mesures. En effet des observations de terrain ont montré que les déjections en MP ou ST étaient
bien moins coalescentes qu’en NT et donc plus facilement libérées en agrégats 3-5 mm par le
tamisage préalable. Les valeurs mesurées par cette méthode étaient beaucoup plus fortes
comparées aux deux autres méthodes (30 à 45 % vs. 1 à 5%). Le Cm sur les agrégats mesure la
proportion de déjections seulement sur les agrégats 3-5 mm et non sur l’ensemble des agrégats du
sol ; il n’est pas surprenant que les valeurs soit 10 fois plus importantes à partir du Cm sur les
agrégats 3-5 mm.
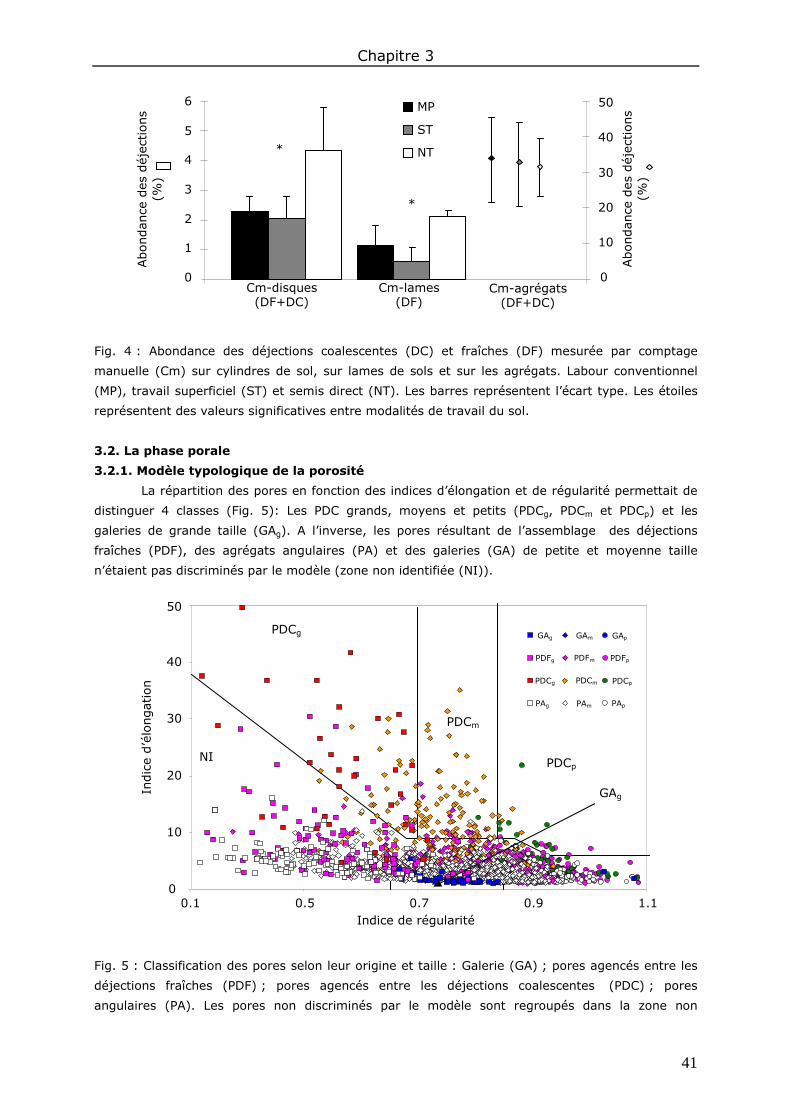
Chapitre 3
41
Fig. 4 : Abondance des déjections coalescentes (DC) et fraîches (DF) mesurée par comptage
manuelle (Cm) sur cylindres de sol, sur lames de sols et sur les agrégats. Labour conventionnel
(MP), travail superficiel (ST) et semis direct (NT). Les barres représentent l’écart type. Les étoiles
représentent des valeurs significatives entre modalités de travail du sol.
3.2. La phase porale
3.2.1. Modèle typologique de la porosité
La répartition des pores en fonction des indices d’élongation et de régularité permettait de
distinguer 4 classes (Fig. 5): Les PDC grands, moyens et petits (PDCg, PDCm et PDCp) et les
galeries de grande taille (GAg). A l’inverse, les pores résultant de l’assemblage des déjections
fraîches (PDF), des agrégats angulaires (PA) et des galeries (GA) de petite et moyenne taille
n’étaient pas discriminés par le modèle (zone non identifiée (NI)).
Fig. 5 : Classification des pores selon leur origine et taille : Galerie (GA) ; pores agencés entre les
déjections fraîches (PDF) ; pores agencés entre les déjections coalescentes (PDC) ; pores
angulaires (PA). Les pores non discriminés par le modèle sont regroupés dans la zone non
50
0
10
20
30
40
0.1 0.5 0.7 0.9 1.1
Indic
e d’é
longat
ion
PDCg
PDCm
PDCp
GAg
Indice de régularité
GAp
PDFp
PDCp
PAp
GAm
PDFm
PDCm
PAm
GAg
PDFg
PDCg
PAg
NI
0
1
2
3
4
5
6
0
10
20
30
40
50
Abondan
ce d
es d
éjec
tions
(%)
Abondan
ce d
es d
éjec
tions
(%)
MP
ST
NT *
*
Cm-agrégats (DF+DC)
Cm-lames (DF)
Cm-disques (DF+DC)

Chapitre 3
42
identifiée (NI). Les indices g, m et p correspondent à la taille des pores : g (>2x106 µm2), m
(1x10⁵ à 2x106 µm2) et p (5x10⁴ à 1x105 µm2).
3.2.2. Application du modèle typologique
Les PDCg, PDCm et PDCp étaient toujours plus importants en NT comparé à MP et ST (Fig.
6). Ces résultats sont en accord avec les données obtenues ci-dessus, par Cm, montrant plus de
déjections sous NT. Des observations en laboratoire ont permis de valider le bon classement de ces
pores par le modèle typologique.
Fig. 6 : Abondance des pores agencés par l’assemblage des déjections coalescentes (PDCg, PDCm
et PDCp). MP (labour conventionnel) ; ST (travail superficiel) ; NT (semis direct). Les barres
représentent l’écart-type. Les étoiles représentent des valeurs significatives entre modalités de
travail du sol pour chaque taille de pore.
L’abondance des GA mesurée par le modèle typologique était trois fois plus faible que par
Cm sur lames de sol (0.5 vs. 1.5%) (Fig. 7) ; néanmoins le classement des modalités était
semblable, ne montrant aucune différence significative entre les modalités. Une sous-estimation de
l’abondance des GA résulte d’un mauvais classement de ces pores par le modèle. Nous supposons
que les pores GA types choisis pour la création du modèle, ne reflétaient pas la diversité des
galeries observées dans les sols. En effet nous avions fait le choix de sélectionner des galeries très
rondes sans trace de fissurations laissées par l’action racinaire ou pédoclimatique.
0
0.2
0.4
0.6
0.8
PDCp PDCm PDCg
Abondan
ce d
es P
DC (
%)
MP
ST
NT * * *

Chapitre 3
43
Fig. 7 : Abondance des galeries (GA) mesurée par le modèle typologique et par comptage manuel
(Cm) sur lames de sol. MP (labour conventionnel) ; ST (travail superficiel) ; NT (semis direct). Les
barres représentent l’écart type.
4. Conclusions
Cette étude a permis de comparer différentes techniques destinées à mesurer les biostructures
lombriciennes dans le sol :
- Sur la phase solide, seul le comptage manuel à l’échelle du cylindre ou de la lame de sol
mesurait correctement les déjections.
- Sur la phase porale, à partir de lames de sol, la porosité agencée entre les déjections
coalescentes était correctement mesurée par le modèle typologique de la porosité tandis
que les galeries étaient mieux estimées par comptage manuel.
Dans les 2 prochains chapitres nous évaluerons l’effet du travail du sol, de la fertilisation, de la
profondeur et de la date d’échantillonnage sur l’abondance : (i) des déjections fraiches, (ii) des
galeries et (iii) de la porosité agencée par les déjections coalescentes. Ces biostructures seront
estimées par comptage manuel à l’échelle du cylindre, de la lame de sol et par analyse d’image
sur la base du modèle typologique.
Cm-lames
0
0.5
1
1.5
2
Modèle
Abondan
ce d
es G
A (
%)
MP
ST
NT

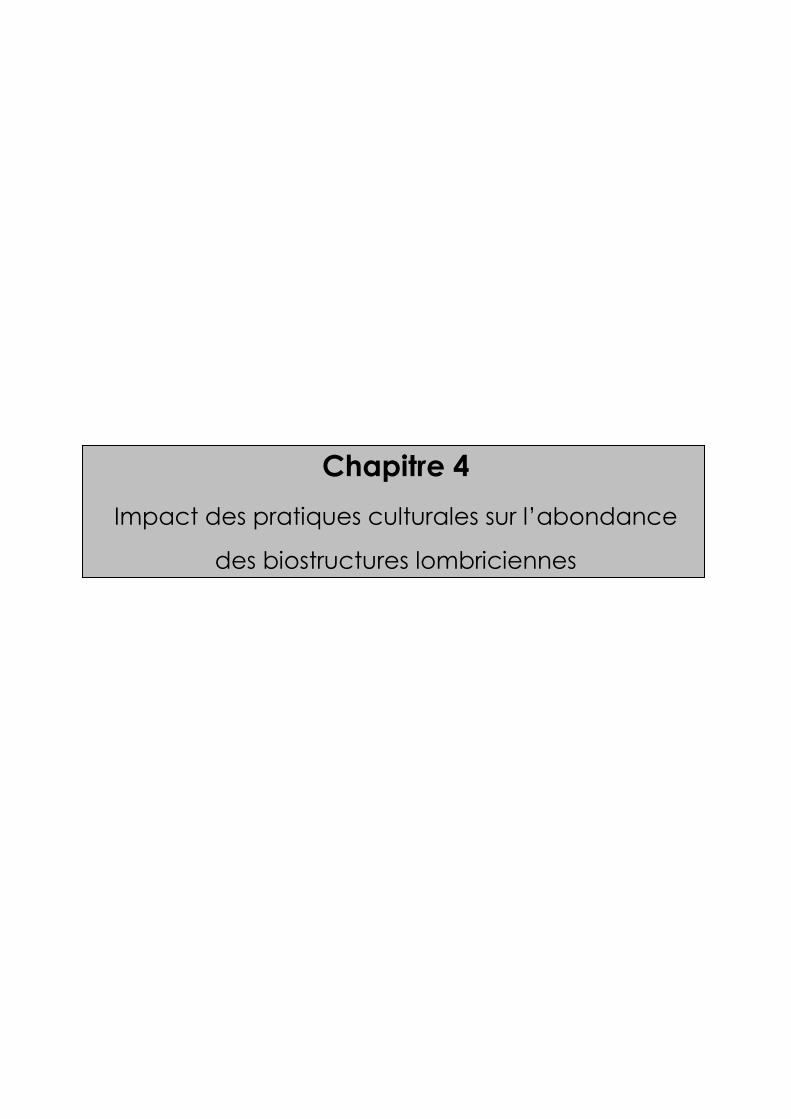
Chapitre 4
Impact des pratiques culturales sur l’abondance
des biostructures lombriciennes


47
Chapitre 4 Impact des pratiques culturales sur l’abondance des biostructures lombriciennes
Résumé - Si le non labour et l’apport de fertilisant organique sont reconnus pour favoriser les
communautés lombriciennes, nous disposons de peu de références sur l’abondance des
biostructures qu’ils produisent dans le sol. L’objectif de ce travail était d’évaluer l’impact du travail
du sol associé à l’apport de fertilisant sur l’activité des lombriciens.
Trois modalités de travail du sol ont été comparées (MP : labour conventionnel, ST : travail
superficiel, NT : semis direct) et 2 types de fertilisation (minérale et organique). Au cours de 5
dates décrivant une culture de blé et de maïs, trois types de biostructures ont été quantifiées sur
lames de sol : (i) les galeries (BU), (ii) les déjections fraîches (FC) et la porosité agencée entre les
déjections coalescentes (PCC). Les BU et FC ont été évaluées visuellement, tandis que les PCC ont
été mesurées par analyse d’image sur la base d’un modèle typologique original.
Toutes dates confondues, la modalité NT présentait 2 fois plus de FC et 4 fois plus de PCC
comparée aux modalités MP et ST. L’abondance des BU était similaire pour chaque modalité de
travail du sol en fin d’année culturale, tandis que de plus fortes valeurs étaient observées sous NT
après chaque semis. L’apport de fumier de volaille augmentait l’abondance des BU et FC pour
toutes les modalités de travail du sol. L’abondance des biostructures présentait une forte variabilité
saisonnière. Les FC diminuaient en hiver/été et augmentaient au printemps. Ces phases de
dégradation et production étaient contrôlées par le climat. La comparaison inter-dates a mis en
évidence un passage rapide de FC à PCC. Les BU présentaient une évolution temporelle
dépendante du travail du sol. Dans les horizons travaillés les BU augmentaient linéairement tout au
long de l’année culturale de blé tandis qu’aucune variation n’était observée en NT.
Cette étude démontre l’importance de mesurer les biostructures à plusieurs dates pour
rendre compte de l’effet des pratiques culturales sur l’activité des lombriciens. D’autre part les trois
indicateurs biologiques présentés dans ce travail ont démontré leur sensibilité face aux pratiques
culturales et aux variations saisonnières.
Mots clés: activité lombricienne ; déjections ; galeries ; évolution temporelle ; non labour ;
analyse d’image.
Chapitre 4
48
The abundance of belowground earthworm biostructures is
influenced by tillage and manure amendment
N. Bottinellia, b, V. Hallairea, b, H. El Housnia, b, S. Menasseri-Aubrya, b, c, D. Cluzeaud
aINRA, UMR 1069 Sol Agro et hydrosystème Spatialisation, F-35000 Rennes, France ; bAgrocampus Ouest, UMR 1069 Sol Agro et hydrosystème Spatialisation, F-35000 Rennes, France ; cUniversité européenne de Bretagne, France ; dUniversité Rennes 1, UMR CNRS ECOBIO, IFR CAREN, Station Biologique, 35380 Paimpont, France
Abstract - Although conservation tillage and organic fertilization are known to favor earthworm
communities, there are very few reports on the earthworm activity in the soil on theses topics. The
aim of this study was to evaluate the effect of reduced tillage and manure fertilization on the
abundance of structures produced by earthworms.
Three types of tillage were compared (MP: moldboard plowing, ST: surface tillage, NT: no-
tillage) and two types of fertilization (mineral and poultry manure). Three types of biostructures
were quantified in soil thin sections: (i) burrows (BU), (ii) fresh casts (FC) and porosity between
coalescent casts (PCC) of sub-surface (2-7cm) soil samples taken in 5 periods of a wheat/maize
crops succession. The BU and FC were evaluated visually, whereas the PCC were measured by
image analysis using a novel typological model.
Regardless of date, there were two times more FC and four times more PCC under NT than
under MP and ST. BU abundance was similar for the three tillage treatments at the end of the
cropping year, whereas higher values were observed under NT after each sowing. Poultry manure
fertilization increased the abundance of BU and FC in all conditions. Biostructure abundance
showed considerable seasonal variation. FC declined in winter and summer and increased in spring.
Inter-date comparisons suggested a rapid transformation of FC to PCC. The temporal dynamics of
BU abundance depended on the tillage treatment. In tilled treatments the BU increased throughout
the wheat-cropping season whereas no variation was observed under NT.
In conclusion, the abundance of biostructures increases under NT with poultry manure
fertilization. Because the abundance of biostructures evolves in the short-term, this study suggests
that for an accurate evaluation of the effects of earthworms on soil functioning, more than one
sampling date is necessary.
Key words: Earthworm activity; casts; burrows; seasonal variation; conservation tillage; image
analysis.

Chapitre 4
49
1. Introduction
In the last fifty years, there has been a return to conservation tillage (surface tillage or no-
tillage); although these practices increase soil aggregation, earthworm abundance and diversity
(Chan, 2001), soil macroporosity is generally reduced (reviewed in Kay and Vandenbygaart, 2002)
leading to surface runoff (Heddadj et al., 2005) and poor rooting (Ehlers et al., 1983). The north
west of France is an important agricultural region where reduced tillage systems are often
combined with manure amendment, which also favors earthworm communities (Lee, 1985).
Earthworms create burrows and casts, which modify the soil structure: these biostructures
are generally richer in organic carbon and can be more structurally stable than the surrounding soil
(Tomlin et al., 1995). The porosity created between casts contributes to both soil meso- and
macroporosity (Vandenbygaart et al., 2000; Lamandé et al., 2003) whereas burrows principally
influence macroporosity (Tomlin et al., 1995). The production of these biostructures therefore leads
to an increase in soil macroporosity and even loosens compact soil (Tisdall, 1985; Zund et al.,
1997; Langmaack et al., 1999).
Although there have been numerous reports on the effects of cultivation practices on
earthworm communities, there has been very few studies on the abundance of biostructures in
soils. Several studies showed that the abundance of biostructures increased with conservation
tillage (Ehlers, 1975; Vandenbygaart et al., 2000; Wuest, 2001; Capowiez et al., 2009b; Bottinelli
et al., 2010a) or with organic fertilization (Pulleman et al., 2003; van Eekeren et al., 2009); but to
date no studies considered the combine effects of both these management (conservation tillage
practices associated with organic fertilization) on biostructure quantities.
The effects of cultivation practices on the abundance of biostructures were almost always
characterized at only one measurement date. This approach does not take into account possible
interactions with the climatic or soil conditions. These factors affect earthworm physiological
activity/inactivity and the processes of biostructure production/degradation. Nevertheless strong
short-term fluctuations (at the monthly scale) in the abundance of biostructures were previously
observed at the soil surface (Binet and Le Bayon, 1999; Perreault et al., 2007) and in the soil
(Kretzschmar, 1982; Ligthart, 1997). The main hypothesis tested in this study is the presence of a
strong interaction between soil cultivation practices and the sampling date on the abundance of
belowground biostructures.
Thus, the overall objective of this study was to evaluate the impact of eight years of
combined reduced tillage practices and manure amendment on the abundance of earthworm
biostructures at different times throughout the cropping year.
2. Materials and methods
2.1. Study site, tillage systems and fertilizer inputs
This study was carried out from 2006 to 2008 at the experimental field station of
Kerguéhennec (N 47°53, W 02°44) in Brittany (France). The climate is oceanic with average annual
temperatures and rainfall of 10.8°C and 1060 mm, respectively (Fig. 1).

Chapitre 4
50
Fig.1: Daily rainfall (white histogram) and monthly temperatures (black line) at the experimental
site during the study period. The solid arrows indicate the different technical (tillage, fertilizer
application and harvest) events that took place. The empty arrows indicate the sampling dates.
The soil, derived from a mica schist, is a Humic Cambisol (according to FAO classification)
with a loamy texture (17% clay, 42% silt, 41% sand), an organic carbon content of 21 g kg-1, a
pH(H20) of 6 and a CEC of 10 meq/100g in the first 25 cm. The experiment to test the interaction
effects between of tillage and fertilizer was set up in the year 2000 in a split plot design with three
blocks. Each plot was 25 m in long × 12 m wide. The crop rotation set up was the following:
wheat-maize-wheat-rape. The tillage treatments were (i) moldboard plowing (MP, at a depth of
25 cm and rotary harrowing at a depth of 7 cm before sowing); (ii) surface tillage (ST, with chisel
plowing at a depth of 12 cm under Wheat crop and followed by a rotary harrowing at a depth of 7
cm under maize crop) and (iii) no-tillage (NT).
The fertilizers sources were (i) mineral fertilization and (ii) poultry manure, applied each
year at a rate of 4-17 Mg ha-1 year-1 calculated on a nitrogen fertilization basis. In all poultry
manure treatments an annual additional average of 2 Mg C ha-1 was incorporated to the soil.
Previous work (Table 1) carried out in May 2007 showed that: (i) the tillage had a significant effect
on the organic carbon content, the soil bulk density and the abundance of anecic earthworms and
(ii) poultry manure fertilization led to an increase in endogeic earthworms.
Rai
nfa
ll (m
m)
Tem
per
ature
(°C
)
0
2
4
6
8
10
12
14
16
18
0
10
20
30
40
50
60
OCT-06 NOV-06 DEC-06 JAN-07 APR-07 MAY-07 JUN-07 JUL-07 FEB-07 MAR-07 MAY-08
Autumn Winter Summer Spring Spring
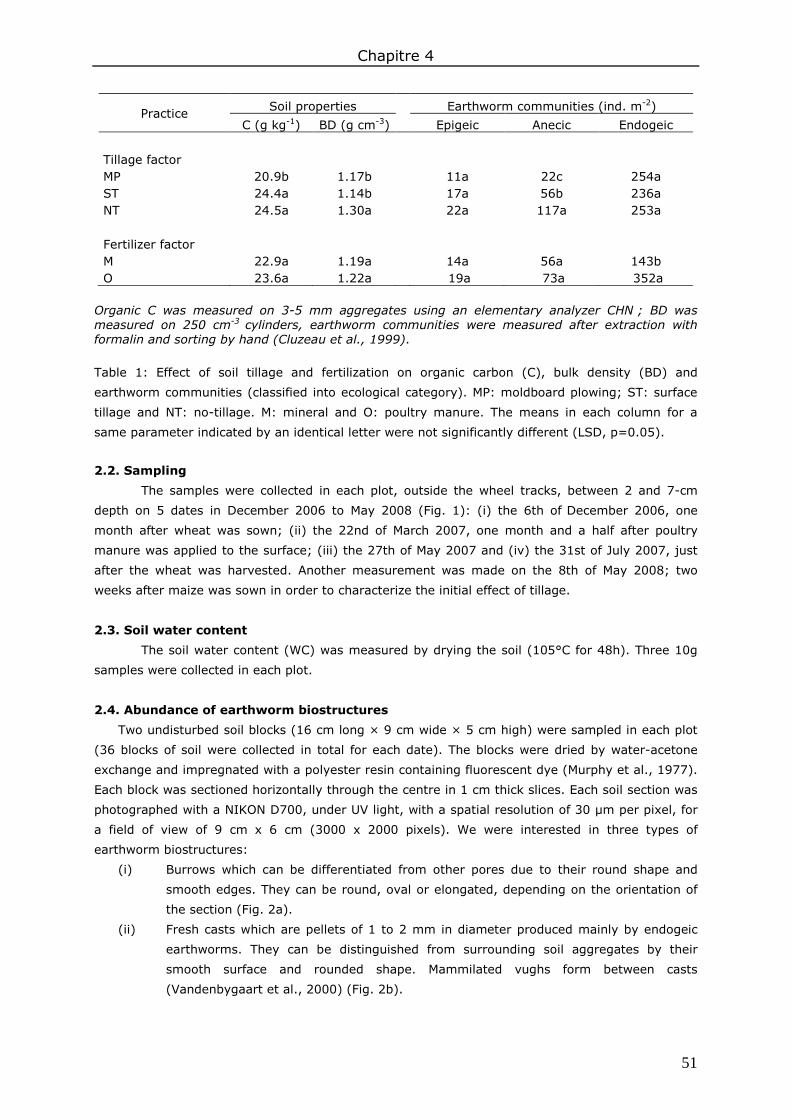
Chapitre 4
51
Practice Soil properties Earthworm communities (ind. m-2)
C (g kg-1) BD (g cm-3) Epigeic Anecic Endogeic Tillage factor MP 20.9b 1.17b 11a 22c 254a ST 24.4a 1.14b 17a 56b 236a NT 24.5a 1.30a 22a 117a 253a Fertilizer factor M 22.9a 1.19a 14a 56a 143b O 23.6a 1.22a 19a 73a 352a
Organic C was measured on 3-5 mm aggregates using an elementary analyzer CHN ; BD was measured on 250 cm-3 cylinders, earthworm communities were measured after extraction with formalin and sorting by hand (Cluzeau et al., 1999).
Table 1: Effect of soil tillage and fertilization on organic carbon (C), bulk density (BD) and
earthworm communities (classified into ecological category). MP: moldboard plowing; ST: surface
tillage and NT: no-tillage. M: mineral and O: poultry manure. The means in each column for a
same parameter indicated by an identical letter were not significantly different (LSD, p=0.05).
2.2. Sampling
The samples were collected in each plot, outside the wheel tracks, between 2 and 7-cm
depth on 5 dates in December 2006 to May 2008 (Fig. 1): (i) the 6th of December 2006, one
month after wheat was sown; (ii) the 22nd of March 2007, one month and a half after poultry
manure was applied to the surface; (iii) the 27th of May 2007 and (iv) the 31st of July 2007, just
after the wheat was harvested. Another measurement was made on the 8th of May 2008; two
weeks after maize was sown in order to characterize the initial effect of tillage.
2.3. Soil water content
The soil water content (WC) was measured by drying the soil (105°C for 48h). Three 10g
samples were collected in each plot.
2.4. Abundance of earthworm biostructures
Two undisturbed soil blocks (16 cm long × 9 cm wide × 5 cm high) were sampled in each plot
(36 blocks of soil were collected in total for each date). The blocks were dried by water-acetone
exchange and impregnated with a polyester resin containing fluorescent dye (Murphy et al., 1977).
Each block was sectioned horizontally through the centre in 1 cm thick slices. Each soil section was
photographed with a NIKON D700, under UV light, with a spatial resolution of 30 µm per pixel, for
a field of view of 9 cm x 6 cm (3000 x 2000 pixels). We were interested in three types of
earthworm biostructures:
(i) Burrows which can be differentiated from other pores due to their round shape and
smooth edges. They can be round, oval or elongated, depending on the orientation of
the section (Fig. 2a).
(ii) Fresh casts which are pellets of 1 to 2 mm in diameter produced mainly by endogeic
earthworms. They can be distinguished from surrounding soil aggregates by their
smooth surface and rounded shape. Mammilated vughs form between casts
(Vandenbygaart et al., 2000) (Fig. 2b).
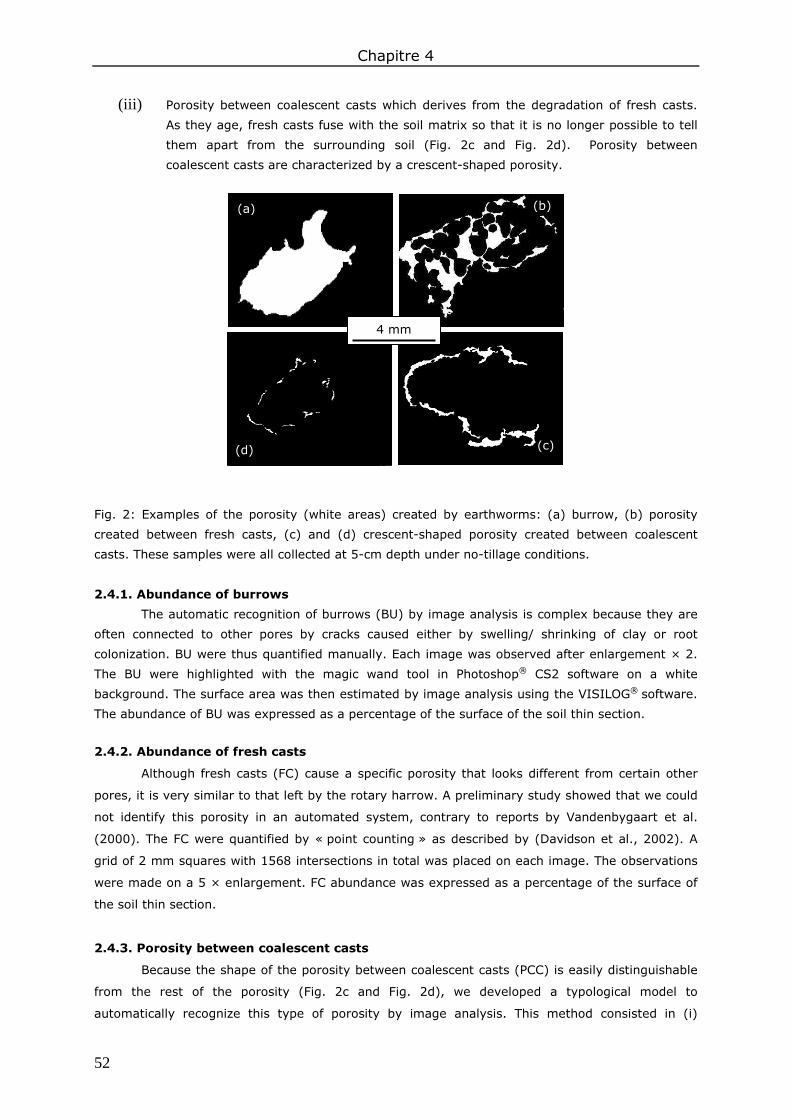
Chapitre 4
52
(iii) Porosity between coalescent casts which derives from the degradation of fresh casts.
As they age, fresh casts fuse with the soil matrix so that it is no longer possible to tell
them apart from the surrounding soil (Fig. 2c and Fig. 2d). Porosity between
coalescent casts are characterized by a crescent-shaped porosity.
Fig. 2: Examples of the porosity (white areas) created by earthworms: (a) burrow, (b) porosity
created between fresh casts, (c) and (d) crescent-shaped porosity created between coalescent
casts. These samples were all collected at 5-cm depth under no-tillage conditions.
2.4.1. Abundance of burrows
The automatic recognition of burrows (BU) by image analysis is complex because they are
often connected to other pores by cracks caused either by swelling/ shrinking of clay or root
colonization. BU were thus quantified manually. Each image was observed after enlargement × 2.
The BU were highlighted with the magic wand tool in Photoshop® CS2 software on a white
background. The surface area was then estimated by image analysis using the VISILOG® software.
The abundance of BU was expressed as a percentage of the surface of the soil thin section.
2.4.2. Abundance of fresh casts
Although fresh casts (FC) cause a specific porosity that looks different from certain other
pores, it is very similar to that left by the rotary harrow. A preliminary study showed that we could
not identify this porosity in an automated system, contrary to reports by Vandenbygaart et al.
(2000). The FC were quantified by « point counting » as described by (Davidson et al., 2002). A
grid of 2 mm squares with 1568 intersections in total was placed on each image. The observations
were made on a 5 × enlargement. FC abundance was expressed as a percentage of the surface of
the soil thin section.
2.4.3. Porosity between coalescent casts
Because the shape of the porosity between coalescent casts (PCC) is easily distinguishable
from the rest of the porosity (Fig. 2c and Fig. 2d), we developed a typological model to
automatically recognize this type of porosity by image analysis. This method consisted in (i)
(b)
(c)
(a)
(d)
4 mm
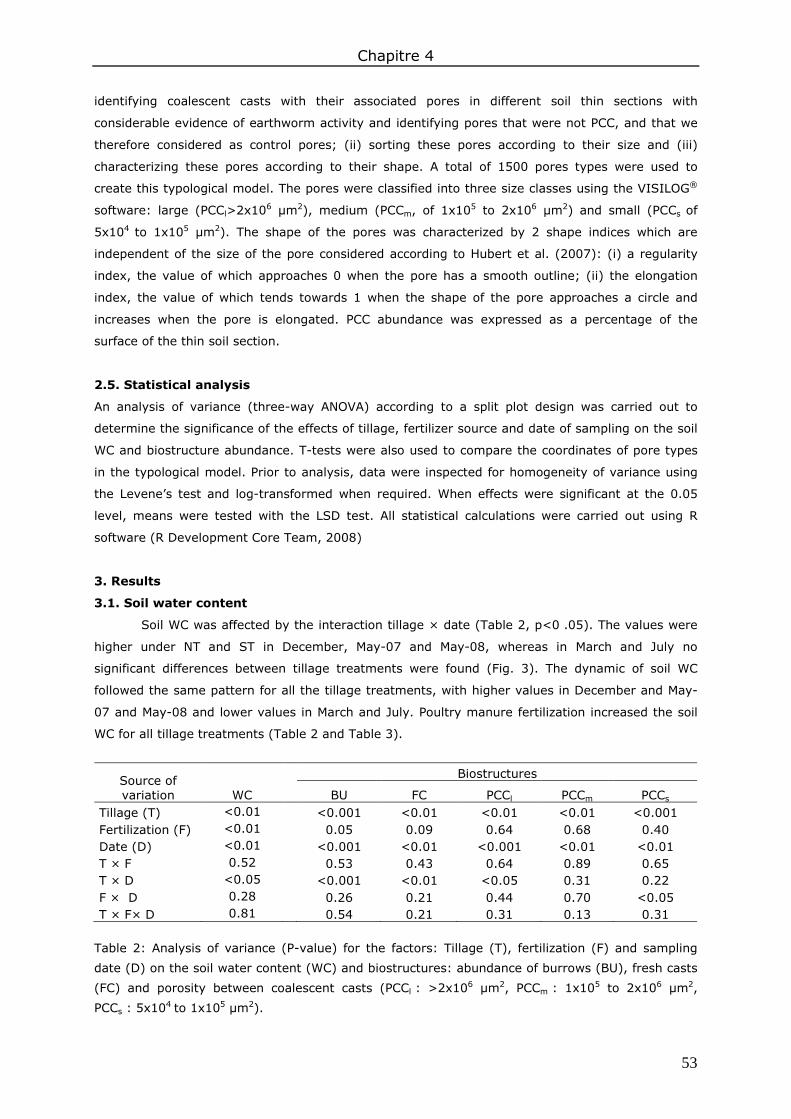
Chapitre 4
53
identifying coalescent casts with their associated pores in different soil thin sections with
considerable evidence of earthworm activity and identifying pores that were not PCC, and that we
therefore considered as control pores; (ii) sorting these pores according to their size and (iii)
characterizing these pores according to their shape. A total of 1500 pores types were used to
create this typological model. The pores were classified into three size classes using the VISILOG®
software: large (PCCl>2x106 µm2), medium (PCCm, of 1x10⁵ to 2x106 µm2) and small (PCCs of
5x10⁴ to 1x105 µm2). The shape of the pores was characterized by 2 shape indices which are
independent of the size of the pore considered according to Hubert et al. (2007): (i) a regularity
index, the value of which approaches 0 when the pore has a smooth outline; (ii) the elongation
index, the value of which tends towards 1 when the shape of the pore approaches a circle and
increases when the pore is elongated. PCC abundance was expressed as a percentage of the
surface of the thin soil section.
2.5. Statistical analysis
An analysis of variance (three-way ANOVA) according to a split plot design was carried out to
determine the significance of the effects of tillage, fertilizer source and date of sampling on the soil
WC and biostructure abundance. T-tests were also used to compare the coordinates of pore types
in the typological model. Prior to analysis, data were inspected for homogeneity of variance using
the Levene’s test and log-transformed when required. When effects were significant at the 0.05
level, means were tested with the LSD test. All statistical calculations were carried out using R
software (R Development Core Team, 2008)
3. Results
3.1. Soil water content
Soil WC was affected by the interaction tillage × date (Table 2, p<0 .05). The values were
higher under NT and ST in December, May-07 and May-08, whereas in March and July no
significant differences between tillage treatments were found (Fig. 3). The dynamic of soil WC
followed the same pattern for all the tillage treatments, with higher values in December and May-
07 and May-08 and lower values in March and July. Poultry manure fertilization increased the soil
WC for all tillage treatments (Table 2 and Table 3).
Source of variation WC
Biostructures
BU FC PCCl PCCm PCCs Tillage (T) <0.01 <0.001 <0.01 <0.01 <0.01 <0.001 Fertilization (F) <0.01 0.05 0.09 0.64 0.68 0.40 Date (D) <0.01 <0.001 <0.01 <0.001 <0.01 <0.01 T × F 0.52 0.53 0.43 0.64 0.89 0.65 T × D <0.05 <0.001 <0.01 <0.05 0.31 0.22 F × D 0.28 0.26 0.21 0.44 0.70 <0.05 T × F× D 0.81 0.54 0.21 0.31 0.13 0.31
Table 2: Analysis of variance (P-value) for the factors: Tillage (T), fertilization (F) and sampling
date (D) on the soil water content (WC) and biostructures: abundance of burrows (BU), fresh casts
(FC) and porosity between coalescent casts (PCCl : >2x106 µm2, PCCm : 1x10⁵ to 2x106 µm2,
PCCs : 5x10⁴ to 1x105 µm2).
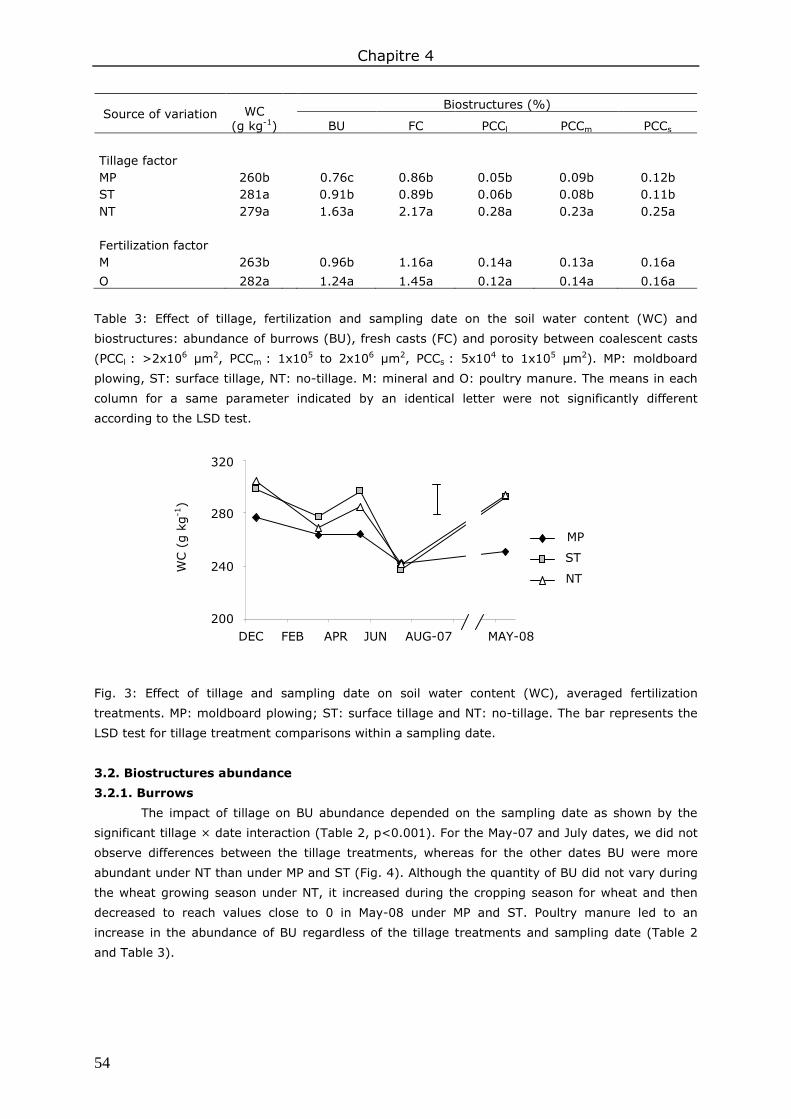
Chapitre 4
54
Source of variation WC (g kg-1)
Biostructures (%)
BU FC PCCl PCCm PCCs Tillage factor MP 260b 0.76c 0.86b 0.05b 0.09b 0.12b ST 281a 0.91b 0.89b 0.06b 0.08b 0.11b NT 279a 1.63a 2.17a 0.28a 0.23a 0.25a Fertilization factor M 263b 0.96b 1.16a 0.14a 0.13a 0.16a
O 282a 1.24a 1.45a 0.12a 0.14a 0.16a Table 3: Effect of tillage, fertilization and sampling date on the soil water content (WC) and
biostructures: abundance of burrows (BU), fresh casts (FC) and porosity between coalescent casts
(PCCl : >2x106 µm2, PCCm : 1x10⁵ to 2x106 µm2, PCCs : 5x10⁴ to 1x105 µm2). MP: moldboard
plowing, ST: surface tillage, NT: no-tillage. M: mineral and O: poultry manure. The means in each
column for a same parameter indicated by an identical letter were not significantly different
according to the LSD test.
Fig. 3: Effect of tillage and sampling date on soil water content (WC), averaged fertilization
treatments. MP: moldboard plowing; ST: surface tillage and NT: no-tillage. The bar represents the
LSD test for tillage treatment comparisons within a sampling date.
3.2. Biostructures abundance
3.2.1. Burrows
The impact of tillage on BU abundance depended on the sampling date as shown by the
significant tillage × date interaction (Table 2, p<0.001). For the May-07 and July dates, we did not
observe differences between the tillage treatments, whereas for the other dates BU were more
abundant under NT than under MP and ST (Fig. 4). Although the quantity of BU did not vary during
the wheat growing season under NT, it increased during the cropping season for wheat and then
decreased to reach values close to 0 in May-08 under MP and ST. Poultry manure led to an
increase in the abundance of BU regardless of the tillage treatments and sampling date (Table 2
and Table 3).
200
240
280
320
DEC FEB APR JUN AUG-07 MAY-08
MP
ST
NT
WC (
g k
g-1
)

Chapitre 4
55
Fig. 4: Effect of tillage and sampling date on the abundance of burrows (BU), averaged fertilization
treatments. MP: moldboard plowing; ST: surface tillage and NT: no-tillage. The bar represents the
LSD test tillage treatment comparisons within a sampling date.
3.2.2. Fresh Casts
FC abundance was affected by the tillage × date interaction (Table 2, p<0.01), which was
constantly greater under NT than MP and ST (Fig. 5). Under NT, the FC abundance fluctuated
sharply with the seasons: characterized by a decline from December to March then a rise from
March to May-07 and another fall from May-07 to July. Under MP and ST we observed the same
fluctuation pattern as for NT from March to July. However, the differences were less pronounced
and there was then a large decrease in May-08 to reach values close to 0. Poultry manure
fertilization tended to increase the amount of FC regardless of tillage treatments and sampling date
(p=0.09, Table 2 and Table 3).
Fig. 5: Effect of tillage and sampling date on the abundance of fresh casts (FC), averaged
fertilization treatments. MP: moldboard plowing; ST: surface tillage and NT: no-tillage. The bar
represents the LSD test tillage treatment comparisons within a sampling date.
3.2.3. Porosity between coalescent casts
Typological model
The PCC showed a significantly higher elongation index than the control pores (Fig.6,
p<0.01). Furthermore, small sized pores had a higher regularity index than large pores (p<0.01).
Thus, the combination of these two shape indices allowed three types of PCC: PCCl, PCCm and
PCCs, to be distinguished, which are morphologically distinct from the control pores.
0
1
2
0.5
1.5
2.5
3
DEC FEB APR JUN AUG-07 MAY-08
MP
ST
NT
FC (
%)
0
0.5
1
1.5
2
2.5
DEC FEB APR JUN AUG-07 MAY-08
MP
ST
NT
BU
(%
)
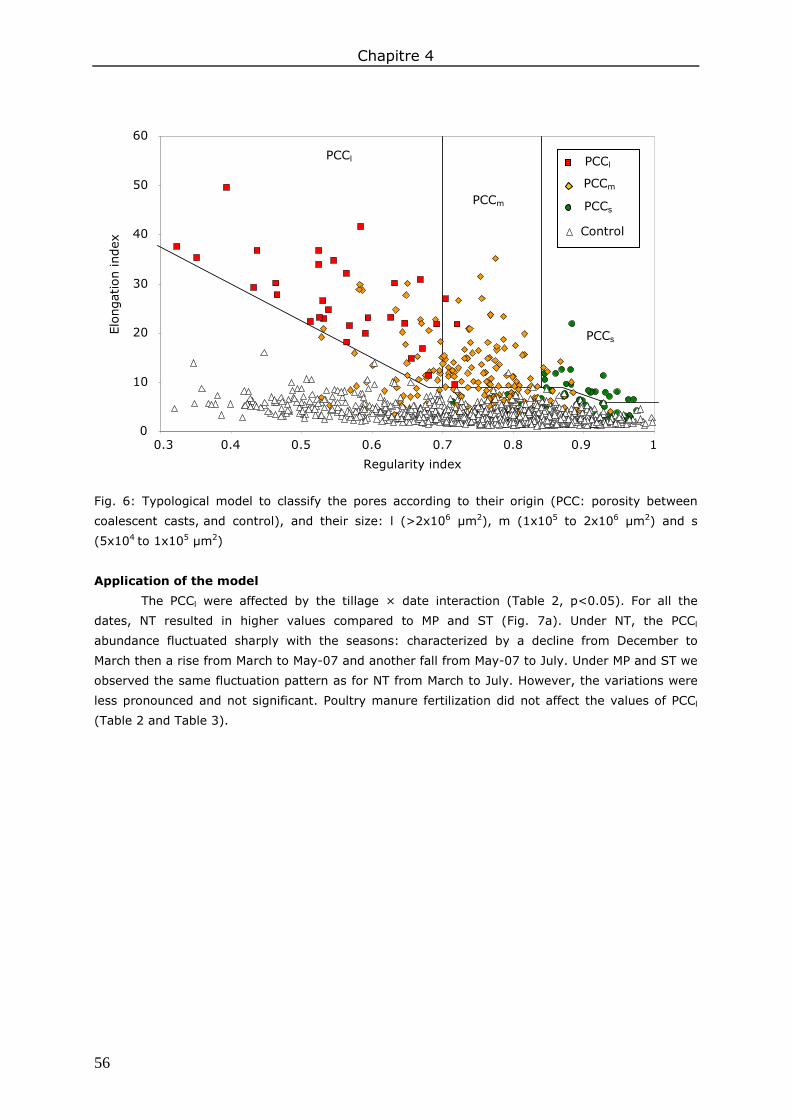
Chapitre 4
56
Fig. 6: Typological model to classify the pores according to their origin (PCC: porosity between
coalescent casts, and control), and their size: l (>2x106 µm2), m (1x10⁵ to 2x106 µm2) and s
(5x10⁴ to 1x105 µm2)
Application of the model
The PCCl were affected by the tillage × date interaction (Table 2, p<0.05). For all the
dates, NT resulted in higher values compared to MP and ST (Fig. 7a). Under NT, the PCCl
abundance fluctuated sharply with the seasons: characterized by a decline from December to
March then a rise from March to May-07 and another fall from May-07 to July. Under MP and ST we
observed the same fluctuation pattern as for NT from March to July. However, the variations were
less pronounced and not significant. Poultry manure fertilization did not affect the values of PCCl
(Table 2 and Table 3).
Regularity index
Elo
ngat
ion index
PCCl
PCCm
PCCs
PCCl
PCCm
PCCs
Control
0.3 0.4 0.5 0.6 0.7 0.8 0.9 1 0
10
20
30
40
50
60

Chapitre 4
57
Fig. 7: (a) Effect of tillage and sampling date on the abundance of PCCl averaged fertilization
treatments. MP: moldboard plowing; ST: surface tillage and NT: no-tillage. The bar represents the
LSD test for tillage treatment comparisons within sampling date. (b) Variation with time in PCCm ,
all tillage treatments are mixed. The bars represent the LSD test for sampling date comparisons.
(c) Effect of fertilization and sampling date on the abundance of PCCs averaged tillage treatments.
M: mineral and O: poultry manure. The bar represents the LSD test fertilization treatment
comparisons within sampling date.
The type of tillage and the sampling date affected PCCm abundance (Table 2). NT always
showed higher values compared with the tilled treatments (Table 3). For the three tillage
treatments, PCCm decreased significantly from December to March and increased significantly from
March to May-07 (Fig. 7b). Poultry manure fertilization did not affect PCCm abundance (Table 2 and
Table 3).
The abundance of PCCs was affected by the tillage factor (Table 2, p<0.001). NT always
showed higher values than the tilled treatments (Table 3). PCCs were also affected by the fertilizer
× date interaction (Table 2, p<0.05). Although the number of PCCs under mineral fertilizer did not
0
0.2
0.4
0.6
0
0.1
0.2
0.3
0
0.1
0.2
0.3
M
O
DEC FEB APR JUN AUG-07 MAY-08
MP
ST
NT PCC
l (%
) PC
Cm (
%)
PCC
s (%
)
(a)
(b)
(c)
Chapitre 4
58
vary throughout the study, there were significantly more under poultry manure from March to July
and then less until May-08 (Fig. 7c).
4. Discussion
4.1. Effects of management practices on biostructure abundance
4.1.1. Tillage effect
Although a large number of studies quantified casts produced at the soil surface (Binet and
Le Bayon, 1999; Perreault et al., 2007; Scullion et al., 2007), few measured those in the soil. We
found, for all sampling dates, that FC were twice as abundant under NT compared to MP and ST
(2% vs. 1%). Our results confirm the observations made by Bottinelli et al. (2010a) at the same
study site in the month of August 2007, who found that the abundance of total casts, both fresh
and coalescent, was twice as high under NT compared with MP and ST (4% vs. 2%). Our findings
are also in agreement with those of Vandenbygaart et al. (2000) who also estimated that the
number of pores created by casts was twice as great under NT than MP. This result may be
explained as follows: (i) under NT, earthworms are probably forced to eat the soil to move around
(Whalley et al., 1995) due to the higher bulk density compared to tilled treatments (Table 1) and
(ii) the casts were not destroyed by tillage events.
Once casts become coalescent due to rainfall events, they create a particular type of
crescent-shaped porosity. All sizes of PCC were always more abundant under NT than in tilled
treatments. This result, therefore, appears to be related to the abundance of FC and can be
explained by the same hypothesis mentioned above. The values obtained under MP and ST were
particularly low. Bottinelli et al. (2010a) demonstrated that casts have a similar structural stability
under NT and ST. The low values for PCC are therefore not easily explained by a possible decrease
in the resistance of the casts to water. We propose that in the tilled treatments some of the FC are
destroyed and so do not produce PCC. In fact, the degradation of FC can lead to another type of
porosity, different from the PCC, which would be very difficult to characterize (indiscernible from
the rest of the porosity).
The effect of soil tillage on the abundance of BU was dependent on the sampling date.
Following tillage events, almost no BU were observed under MP and ST. At the end of the cropping
year, in July, however, the abundance of BU was similar for all tillage treatments (1.5%). Our
results show: (i) the destructive effect of soil tillage and (ii) the strong capacity of earthworms to
recreate, at the scale of a cropping season, a quantity of BU similar to that present under NT. Our
results are not consistent with the literature, which constantly reports a higher number or volume
of BU under NT compared to tilled treatments (Ehlers, 1975; Tebrügge and Düring, 1999; Wuest,
2001). In these studies, the BU were quantified on only one sampling date and not necessary at
the end of the cropping year.
4.1.2. Fertilization effect
No interaction was observed between tillage and fertilizer application. Poultry manure
fertilization increased the abundance of BU and FC. This result is not surprising and is in agreement
with the literature (Pulleman et al., 2003; van Eekeren et al., 2009). Several hypotheses can be
proposed to explain this result: (i) larger endogeic communities under poultry manure (Table 1)
and (ii) a probable increased structural stability of the biostructures. Surprisingly, we did not see
an influence of the poultry manure on the amount of PCC. We suggest that the small increase in FC
under poultry manure was too small to observe an increase of PCC.
Chapitre 4
59
4.2. Seasonal variation in biostructure abundance
4.2.1. Casts
FC abundance fluctuated sharply with the seasons; it decreased in winter, increased in
spring and decreased again in summer. This variation pattern was similar for all tillage treatments
but much more pronounced under NT. Winter and summer correspond to periods of cast
degradation and/or earthworm physiological inactivity; whereas in the springtime earthworms
produce casts and/or there is less degradation of existing casts. These results are consistent with
the periods of earthworm physiological activity observed in a temperate environment by Bouché
(1977).
The typological model was based on the hypothesis that a cycle of successive degradation
exists with FC transformed into PCCl, or PCCm or PCCs. A comparison of the seasonal variation of
these different biostructures allowed us to examine this hypothesis in more detail. The PCCl
followed the same seasonal pattern as the FC. This implies that rapid degradation of FC leads to
PCCl type porosity. The abundance of PCCm also followed the same pattern as FC except in summer.
This also suggests a rapid transformation of FC or PCCl to PCCm. We also observed seasonal
variation in PCCs abundance but it was dependent on fertilizer inputs: it only increased during the
cropping year under poultry manure. We suppose that this class of small pore is not exclusively
due to earthworm activity but also corresponds to porosity created by roots, which would explain
the lack of consistency with the other results.
4.2.2. Burrows
BU abundance did not follow the same type of seasonal variation as FC: it increased from
December to July in the tilled treatments but no variation was observed under NT during the
growing season of wheat. An increase in BU in the tilled treatments is not surprising considering
that the values were close to 0 after sowing. Different variations in BU amounts depending on the
soil cultivation practice may be related to the soil structure: (i) the lower soil bulk density under MP
and ST does not reduce earthworm activity and force the worms to fill their burrows with casts,
contrary to NT conditions; Ligthart (1997) and Kretzschmar (1982) showed that the accumulation
of casts in burrows is the principle cause of degradation (apart from human activity); (ii) the soil
structure in the tilled treatments is a lot more heterogeneous than under NT (Roger-Estrade et al.,
2004). This heterogeneity in the soil structure can lead to an increase in the creation of BU as
shown by Stovold et al. (2004) and (iii) under NT, earthworms prefer to use preexisting spaces in
the soil that is any preexisting burrows, to move around. Our results thus confirm the studies
carried out by Felten and Emmerling (2009) who demonstrated the commensal behavior of
earthworms. Finally, another hypothesis is that burrow lifespan, if they are not blocked by casts, is
longer than that of casts. However, we did not found any reference to support this proposition.
5. Conclusions
Several important insights into the impact of cultivation practices on earthworm activity
were gained from this study, within reduced tillage with poultry manure fertilization:
- We confirmed the strong effect of cultivation practices on soil biostructures. The abundance of
fresh casts (FC) and coalescent casts (PCC) was higher under NT. The abundance of burrows (BU)
was similar or even higher under NT depending on the time since the soil was last tilled. The
application of poultry manure increased the amount of BU and FC.
- We also showed a strong seasonal variation of the abundance of biostructures. FC were less
abundant in winter and summer and more common in spring. The comparison of these seasonal

Chapitre 4
60
changes demonstrated that FC are rapidly transformed to PCC. In the tilled treatments, BU
abundance increased linearly throughout the wheat- cropping year whereas no variation was
observed under NT.
- The three structures (BU, FC and PCC) examined in this study were pertinent for obtaining
information about earthworm activity depending on cultivation practices and seasons. These
indicators could be useful in the future for relating soil structure changes with its hydrological
functioning.
Acknowledgments
We thank Y. Benard for the preparation of soil thin sections and are grateful to A. Cottais,
P. Cotinet and D. Heddadj for allowing us to work at the Kerguéhennec experimental site (CRAB).
The Brittany region financed this project (project PRIR).

61
Partie C
Fonctionnement physique du sol


Chapitre 5 Impact des lombriciens sur la stabilité structurale
des agrégats du sol


65
Chapitre 5 Impact des lombriciens sur la stabilité structurale des agrégats du sol
Ce chapitre correspond à un article publié dans la revue Soil and Tillage Research.
Résumé - Bien que l’activité lombricienne soit considérée comme un élément majeur de la
structuration des sols, nous disposons, en milieu tempéré, de peu de références reliant le nombre
de déjections lombriciennes, leurs stabilités et les pratiques culturales. L’objectif de cette étude
était d’évaluer selon différentes intensités de travail du sol l’effet des lombriciens sur la stabilité
des agrégats du sol.
Trois types de travail du sol sont comparés : le labour (MP), le travail superficiel (ST) et le
semis direct (NT). Nous avons mesuré l’abondance relative de déjections produites dans le sol par
une méthode originale via l’analyse d’image sur des échantillons de sol prélevés à 2 cm et 12 cm
de profondeur. Sur les déjections et leurs sols environnants respectifs ont été mesurés : la stabilité
structurale, exprimée par le diamètre moyen pondéral des agrégats (MWD) et certains facteurs
responsables de la stabilisation des agrégats du sol tel que la teneur en carbone organique, la
teneur en sucres extraits à l’eau chaude (HWEC) et l’hydrophobicité des agrégats (WR).
A 2 cm de profondeur, l’abondance relative des déjections est faible (entre 2 et 4%), elle
est deux fois plus importante sous NT comparé à MP et ST. A 12 cm de profondeur, l’abondance
relative des déjections double quelque soit le type de travail du sol. Elle tendait à être plus
importante dans les horizons non travaillés (NT et ST). La stabilité des déjections était plus
importante que le sol environnant exclusivement à 12 cm de profondeur, en raison de plus fortes
teneurs en matière organique (le carbone et HWEC) et de plus fortes valeurs d’hydrophobicité.
Pour les deux profondeurs considérées, on a également mis en évidence une relation positive
entre le MWD du sol environnant et le MWD des déjections.
Nous concluons de cette étude, que les déjections produites à 2 cm de profondeur ne
participent pas à la stabilisation des agrégats du sol, tandis qu’à 12 cm de profondeur, les plus
fortes stabilités structurales observées en non labour sont expliquées en partie par l’activité des
lombriciens.
Mots clés : activité lombricienne ; non labour ; hydrophobicité ; sucres solubles.
Chapitre 5
66
Abundance and stability of belowground earthworm casts is influenced by tillage intensity and depth
N. Bottinellia, b, V. Hallairea, b, S. Menasseri-Aubrya, b, C. Le Guilloua, b, D. Cluzeauc
aINRA, UMR 1069 Sol Agro et hydrosystème Spatialisation, F-35000 Rennes, France ; bAgrocampus Ouest, UMR 1069 Sol Agro et hydrosystème Spatialisation, F-35000 Rennes, France ; cUniversité Rennes 1, UMR CNRS ECOBIO, IFR CAREN, Station Biologique, 35380 Paimpont, France
Abstract - In temperate soils, there has been little study of the abundance and water stability of
belowground earthworm casts under different tillage systems and soil depths. The aim of this study
was to determine the effects of earthworm activity on soil aggregate stability under various tillage
systems.
Three tillage treatments were compared (moldboard plowing (MP), surface tillage (ST) and
no-tillage (NT)). We present here an original method by which earthworm casts were quantified via
image analysis at 2- and 12-cm depths. In addition, soil aggregate stability expressed as the mean
weight diameter (MWD) and factors involved in soil aggregate stabilization such as soil organic
carbon, hot-water extractable carbohydrate content (HWEC) and water repellency (WR) of
aggregates were measured in earthworm casts and bulk soil.
In superficial soil layers, the relative cast abundance was small and more abundant under
NT than the ST and MP treatments. At 12 cm, the relative cast abundance doubled irrespective of
the tillage treatment and tended to be higher with conservation tillage (i.e., NT and ST). Moreover,
the MWD increased in casts compared to the bulk soil in this deeper layer. The increase in MWD in
casts was explained in part by the increase in soil organic matter (carbon content and HWEC) and
the WR. For the two depths, we found a positive relation between the MWD from the bulk soil and
casts among the tillage treatments.
We conclude from this study that casts located at a 2-cm depth did not participate in soil
aggregate stabilization, while at 12 cm the greatest structural stability observed under
conservation tillage was explained in part by the production of casts.
Key words: earthworm activity; conservation tillage; water repellency; carbohydrates.

Chapitre 5
67
1. Introduction
With the intensification of agriculture over the last five decades, deterioration in soil
structure and increases in soil erosion have emerged as major issues. Therefore, new cultural
practices such as conservation tillage (i.e., no-tillage or surface tillage) have been developed.
Because soil aggregates are less disrupted and soil organic matter (SOM) is concentrated near the
surface in this system, soil structural stability increases (Six et al., 1999). Soil aggregate stability
refers to the capacity of aggregates to conserve their structural organization during water
disturbance events. A decline in structural stability increases aggregate slaking and induces the
clogging of soil pore spaces. Consequently, soil aggregate stability in the topsoil is closely linked to
runoff rates and mean annual soil losses at the landscape scale (Barthès and Roose, 2002). In
conservation tillage systems, many reports have documented higher earthworm numbers and
biomasses compared to those observed under conventional tillage systems (reviewed in Chan,
2001).
Through their casting activities, earthworms significantly affect soil aggregate processing
within the top layers of soil (Lavelle and Spain, 2001). The accumulation of casts below the soil
surface results in modification of soil matrix properties with the formation of granular aggregates
(Jongmans et al., 2001) and “mammilated vughs” (Vandenbygaart et al., 2000). Many workers
agree that earthworm casts, when aged or dried, contain more stable micro-aggregates than the
surrounding soil (Shipitalo and Protz, 1988; Marinissen and Dexter, 1990). This increase is usually
explained by SOM and especially microbial polysaccharides (Zhang and Schrader, 1993; Flegel et
al., 1998; Oyedele et al., 2006). These act as binding agents (Tisdall and Oades, 1982) and/or
increase the water repellency of aggregates and the extent of slaking (Jouquet et al., 2008).
There is a surprising dearth of information on how tillage intensity influences the capacity
of earthworms to stabilize soil aggregates. We hypothesized that tillage intensity, by affecting the
dynamics of casts (i.e., production and degradation processes) and the SOM, controls the
abundance of belowground casts and their structural stability, and consequently the potential effect
of earthworms to stabilize soil. Hence, the aim of this study was to determine the effects of
earthworm activity on soil aggregate stability under different tillage systems. Soil samples were
collected in two depths from fields under three different tillage systems (moldboard plowing,
surface tillage and no-tillage). This was done by (i) using an original method for quantification of
belowground casts, (ii) comparing the aggregate stability of casts with the bulk soil and (iii)
determining factors involved in the stabilization of casts.
2. Materials and methods
2.1. Site and soil sampling
The study was conducted after the wheat crop harvest in August 2007 at the experimental
station of Kerguéhennec (N 47°53, W 02°44), located in Brittany (France). Selected attributes of
the climate and soil in the first 25 cm are presented in Table 1. The tillage system was established
in 2000 in a randomized complete block design with three replicates. Each treatment plot size was
25 m × 12 m. The crop rotation was wheat-maize-wheat-rape. Three tillage treatments were
studied: (i) moldboard plowing (MP, at a depth of 25 cm and rotary harrowing at a depth of 7 cm
before sowing), (ii) surface tillage (ST, with chisel plowing at a depth of 12 cm) and (iii) no-tillage
(NT).
Chapitre 5
68
Mean annual air temperature (°C) 10.8 Mean annual precipitation (mm) 1060 Soil classification (a) Humic Cambisol Particle size distribution (%) Sand (2000 > Θ > 50 µm) 41 Silt (50 > Θ > 2 µm) 42 Clay (Θ < 2 µm) 17 pH (H20, 1 : 2.5) 6 C (g kg-1) 21 CEC (mequiv/100 g) 10
(a) FAO
Table 1: Climate and soil properties at the experimental site.
In August 2007, measurements of soil bulk density by cylinder method (250 cm3) showed
that NT had the highest values in the first 15cm (on average 1.30 g cm-3), while MP had the lowest
values in that depth (on average 1.15 g cm-3). Under ST, values were as low as those of MP on the
first 5 cm and were as high as those of NT at 15 cm. In April 2007, earthworms were sampled
using the formalin extraction technique (Cluzeau et al., 1999); the dominant species were the
endogeic species Aporrectodea caliginosa (49%) and the anecic species Lumbricus terrestris
(21%). Earthworm density was greater under NT (297 specimens per m2) compared to ST (210
specimens per m2) and MP (134 specimens per m2). The proportion of endogeic species was higher
under MP (75%) than ST (57%) and NT (50%). On the other hand, the proportion of anecic species
was higher under NT (42%) and ST (32%) compared to MP (18%). Soils samples for analysis were
collected from 2-7- and 12-17 cm depths.
2.2. Earthworm cast abundance
We developed an original method for quantification of earthworm casts because methods
found in the literature are either time-consuming (Topoliantz et al., 2000; Jongmans et al., 2001;
Velasquez et al., 2007) or cannot quantify all visible casts (Pulleman et al., 2005). Our method
consists in sampling five cylinders of 250 cm3 (8 cm diameter, 5 cm height) sampled at each plot
and depth. The cylinders were broken in half by hand (Fig. 1a): thus, soil structure was not
disturbed and earthworm casts kept their natural pattern. According to the definition of Bullock et
al. (1985) and Pulleman et al. (2005), we distinguished earthworm casts (fresh and welded) under
a stereomicroscope (magnification 2×) according their spherical shape, smooth surface and the
rounded contours of individual fecal pellets, which were arranged in “mammilated” and tuberose
shapes (Fig. 1b). Casts were meticulously painted in white on each side, and digital photos were
taken (Fig. 1c). With OPTIMAS software each picture was transformed into a binary image (Fig.
1d). The areas of each white patch were determined. This method yielded the relative cast
abundance as the percentage of cross-sectional area that consisted of casts.

Chapitre 5
69
Fig. 1: (a) Broken surface of soil cylinder for quantification of casts. (b) Earthworm subsurface
casts found at 2- and 12-cm depths. (c) Casts painted white on broken surface of cylinder. (d)
Binary image from broken surface of soil cylinder with casts in white.
2.3. Physico-chemical properties of casts and bulk soil
For the analysis below, eight cylinders of 250 cm3 from each plot were gently broken. We
collected 3-5-mm aggregates identified as casts using the definition given above. As a control soil,
we collected 3-5-mm aggregates that were not identified as casts.
2.3.1. Chemical properties of casts and bulk soil
Total organic carbon in 3-5-mm aggregates was measured with a CHN analyzer. Hot-water
extractable carbohydrate content (HWEC) was obtained from extracts of 1 g of 3-5-mm aggregate
suspended in 20 ml of hot water (80 °C) for 24 h. The carbohydrate content of the extract was
analyzed via the H2SO4/phenol method (Dubois et al., 1956).
2.3.2. Physical properties of casts and bulk soil
Soil structural stability was measured according to Le Bissonnais (1996). The test is
performed on 3–5-mm aggregates dried at 40 °C for 48 h. It involves three pre-treatments with
different subsamples before sieving in ethanol at 50 µm and dry sieving of the resulting fraction
(>50 µm): (i) slow-wetting, where 2 g of aggregates is capillary rewetted; (ii) fast-wetting, where
2 g of aggregates is immersed in deionized water for 10 min; and (iii) mechanical breakdown,
where 2 g of aggregates is saturated in ethanol for 30 min, then shaken in deionized water in an
Erlenmeyer end over end 20 times. Dry sieving was performed by hand with a nest of six sieves
(2000, 1000, 500, 200, 100 and 50 µm). The mean weight diameter (MWD), which is the sum of
the mass fraction of soil remaining in each sieve multiplied by the mean aperture of the adjacent
meshes, was calculated from the aggregate-size distribution. The method yields MWD, which is the
mean of the three MWD values (slow-wetting, fast-wetting and mechanic breakdown tests).
The water repellency (WR) of 3-5-mm aggregates was assessed by measuring the water drop
penetration time (adapted from Letey, 1969). Drops of 3 µl de-ionized water were deposited with a
micro-syringe on the surface of individual air-dried aggregates, and the time required for a drop to
penetrate into the aggregate was recorded.
2.4. Statistical analysis
Prior to analysis, data were inspected for homogeneity of variance using the Levene’s test
and transformed when required. When effects were significant at a level of 0.05, means were
tested with an LSD test. Pearson’s correlations were made among variables at 2- and 12-cm
depths. All statistical calculations were carried out using R software (R Development Core Team,
2008).
2 mm
(a) (b) (c) (d)
2 cm

Chapitre 5
70
3. Results and discussion
3.1. Relative abundance of subsurface casts
At a 2-cm depth, the relative cast abundance was low (less than 5%) (Fig. 2). It was
affected by the interaction of tillage × depth (p<0.05) (Table 2). Casts were more abundant under
NT compared to other tillage treatments (4.2% vs. 2.1%) (Fig. 2). Our results tended to be lower
than those from a study carried out on thin sections by Jongmans et al. (2001), who found that
10% of the soil volume was worked by earthworms under conventional tillage. In the above study,
all casts were quantified with more accuracy on thin section. In addition, the carbon content of
their soil was lower compared to our soil (0.9% vs. 2.3%).
Soil property Relative cast abundance
Tillage (T) 0.35
Depth (D) <0.001
T*D <0.05 Table 2: Analysis of variance (P>F) for the effects of Tillage (T) and Depth (D) on the relative cast
abundance.
Fig. 2: Relative abundance of casts per surface area according to three tillage treatments (MP,
moldboard plowing; ST, surface tillage; NT, no-tillage) and two depths. The asterisk represents the
LSD (0.05) for treatment comparisons within depths (means ± S.D; n=15).
We suggest that the method used and the carbon content explain in part the lower
percentage of casts observed in our study. In fact, Martin (1982) and Pérès et al. (1998)
highlighted that earthworms search for food for longer periods in soils without organic matter
enrichment. The increase in casts under NT could be explained by some interacting mechanisms:
(i) the number of endogeic and anecic earthworms is higher under NT; (ii) the NT system is never
tilled, unlike other tillage treatments, so casts are not destroyed and (iii) the higher bulk density
under NT may prevent degradation of casts by water. Nevertheless, our results are in agreement
with Vandenbygaart et al. (2000), who indicated that the NT system at 0-5 cm depth had more
than twice the number of “mammilated vughs” produced by the packing of earthworm casts (just
after the tillage operation).
At a 12-cm depth, the relative cast abundance greatly increased compared to that at 2 cm;
it doubled for all tillage treatments without any significant difference between treatments (Table 2),
even if the ST and NT tended to have a higher area of casts (Fig. 2). This increase may be related
Rel
ativ
e ca
st a
bundan
ce (
%)
MP ST NT
2 cm 12 cm 0
2
4
6
8
10
12
14
*
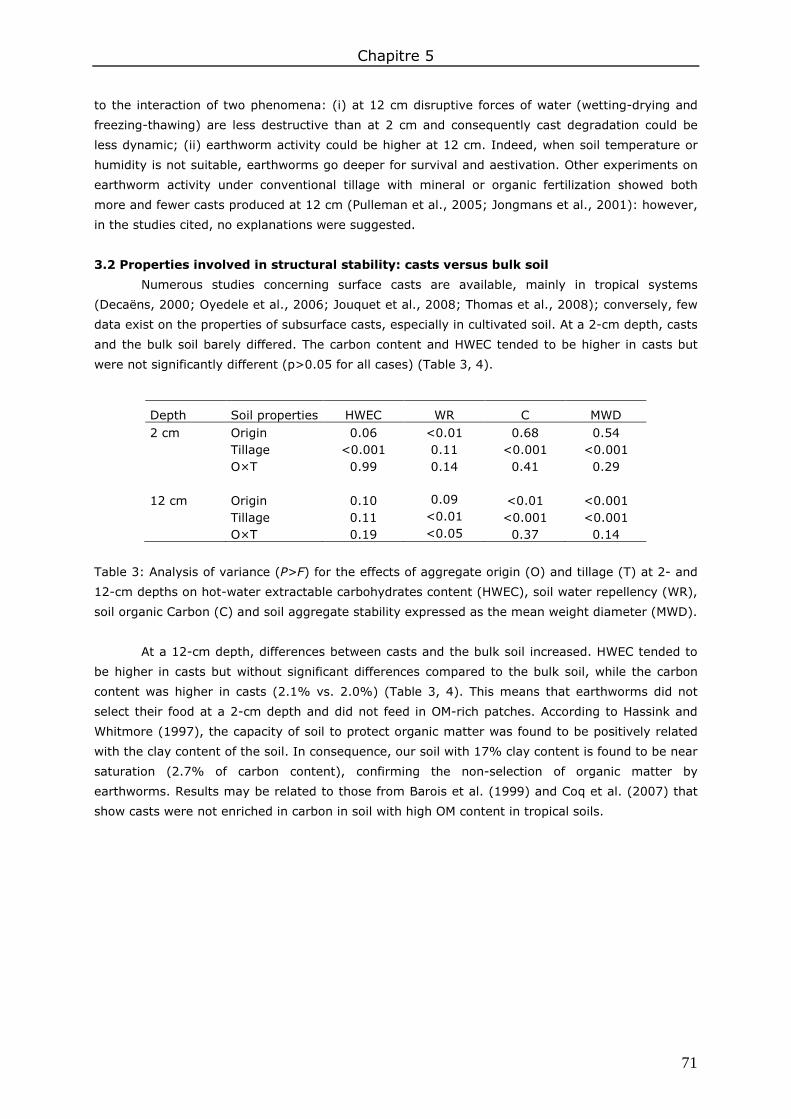
Chapitre 5
71
to the interaction of two phenomena: (i) at 12 cm disruptive forces of water (wetting-drying and
freezing-thawing) are less destructive than at 2 cm and consequently cast degradation could be
less dynamic; (ii) earthworm activity could be higher at 12 cm. Indeed, when soil temperature or
humidity is not suitable, earthworms go deeper for survival and aestivation. Other experiments on
earthworm activity under conventional tillage with mineral or organic fertilization showed both
more and fewer casts produced at 12 cm (Pulleman et al., 2005; Jongmans et al., 2001): however,
in the studies cited, no explanations were suggested.
3.2 Properties involved in structural stability: casts versus bulk soil
Numerous studies concerning surface casts are available, mainly in tropical systems
(Decaëns, 2000; Oyedele et al., 2006; Jouquet et al., 2008; Thomas et al., 2008); conversely, few
data exist on the properties of subsurface casts, especially in cultivated soil. At a 2-cm depth, casts
and the bulk soil barely differed. The carbon content and HWEC tended to be higher in casts but
were not significantly different (p>0.05 for all cases) (Table 3, 4).
Depth Soil properties HWEC WR C MWD 2 cm Origin 0.06 <0.01 0.68 0.54 Tillage <0.001 0.11 <0.001 <0.001 O×T 0.99 0.14 0.41 0.29 12 cm Origin 0.10 0.09 <0.01 <0.001 Tillage 0.11 <0.01 <0.001 <0.001 O×T 0.19 <0.05 0.37 0.14
Table 3: Analysis of variance (P>F) for the effects of aggregate origin (O) and tillage (T) at 2- and
12-cm depths on hot-water extractable carbohydrates content (HWEC), soil water repellency (WR),
soil organic Carbon (C) and soil aggregate stability expressed as the mean weight diameter (MWD).
At a 12-cm depth, differences between casts and the bulk soil increased. HWEC tended to
be higher in casts but without significant differences compared to the bulk soil, while the carbon
content was higher in casts (2.1% vs. 2.0%) (Table 3, 4). This means that earthworms did not
select their food at a 2-cm depth and did not feed in OM-rich patches. According to Hassink and
Whitmore (1997), the capacity of soil to protect organic matter was found to be positively related
with the clay content of the soil. In consequence, our soil with 17% clay content is found to be near
saturation (2.7% of carbon content), confirming the non-selection of organic matter by
earthworms. Results may be related to those from Barois et al. (1999) and Coq et al. (2007) that
show casts were not enriched in carbon in soil with high OM content in tropical soils.
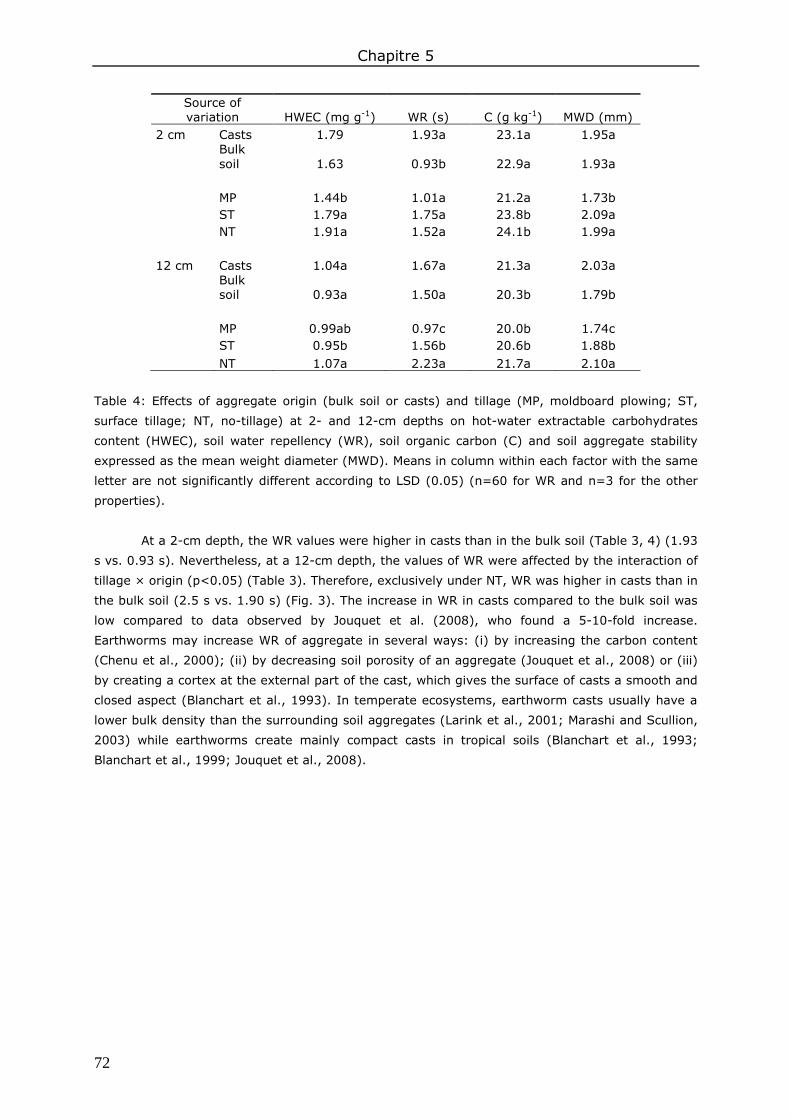
Chapitre 5
72
Source of variation HWEC (mg g-1) WR (s) C (g kg-1) MWD (mm)
2 cm Casts 1.79 1.93a 23.1a 1.95a
Bulk soil 1.63 0.93b 22.9a 1.93a
MP 1.44b 1.01a 21.2a 1.73b ST 1.79a 1.75a 23.8b 2.09a NT 1.91a 1.52a 24.1b 1.99a 12 cm Casts 1.04a 1.67a 21.3a 2.03a
Bulk soil 0.93a 1.50a 20.3b 1.79b
MP 0.99ab 0.97c 20.0b 1.74c ST 0.95b 1.56b 20.6b 1.88b NT 1.07a 2.23a 21.7a 2.10a
Table 4: Effects of aggregate origin (bulk soil or casts) and tillage (MP, moldboard plowing; ST,
surface tillage; NT, no-tillage) at 2- and 12-cm depths on hot-water extractable carbohydrates
content (HWEC), soil water repellency (WR), soil organic carbon (C) and soil aggregate stability
expressed as the mean weight diameter (MWD). Means in column within each factor with the same
letter are not significantly different according to LSD (0.05) (n=60 for WR and n=3 for the other
properties).
At a 2-cm depth, the WR values were higher in casts than in the bulk soil (Table 3, 4) (1.93
s vs. 0.93 s). Nevertheless, at a 12-cm depth, the values of WR were affected by the interaction of
tillage × origin (p<0.05) (Table 3). Therefore, exclusively under NT, WR was higher in casts than in
the bulk soil (2.5 s vs. 1.90 s) (Fig. 3). The increase in WR in casts compared to the bulk soil was
low compared to data observed by Jouquet et al. (2008), who found a 5-10-fold increase.
Earthworms may increase WR of aggregate in several ways: (i) by increasing the carbon content
(Chenu et al., 2000); (ii) by decreasing soil porosity of an aggregate (Jouquet et al., 2008) or (iii)
by creating a cortex at the external part of the cast, which gives the surface of casts a smooth and
closed aspect (Blanchart et al., 1993). In temperate ecosystems, earthworm casts usually have a
lower bulk density than the surrounding soil aggregates (Larink et al., 2001; Marashi and Scullion,
2003) while earthworms create mainly compact casts in tropical soils (Blanchart et al., 1993;
Blanchart et al., 1999; Jouquet et al., 2008).
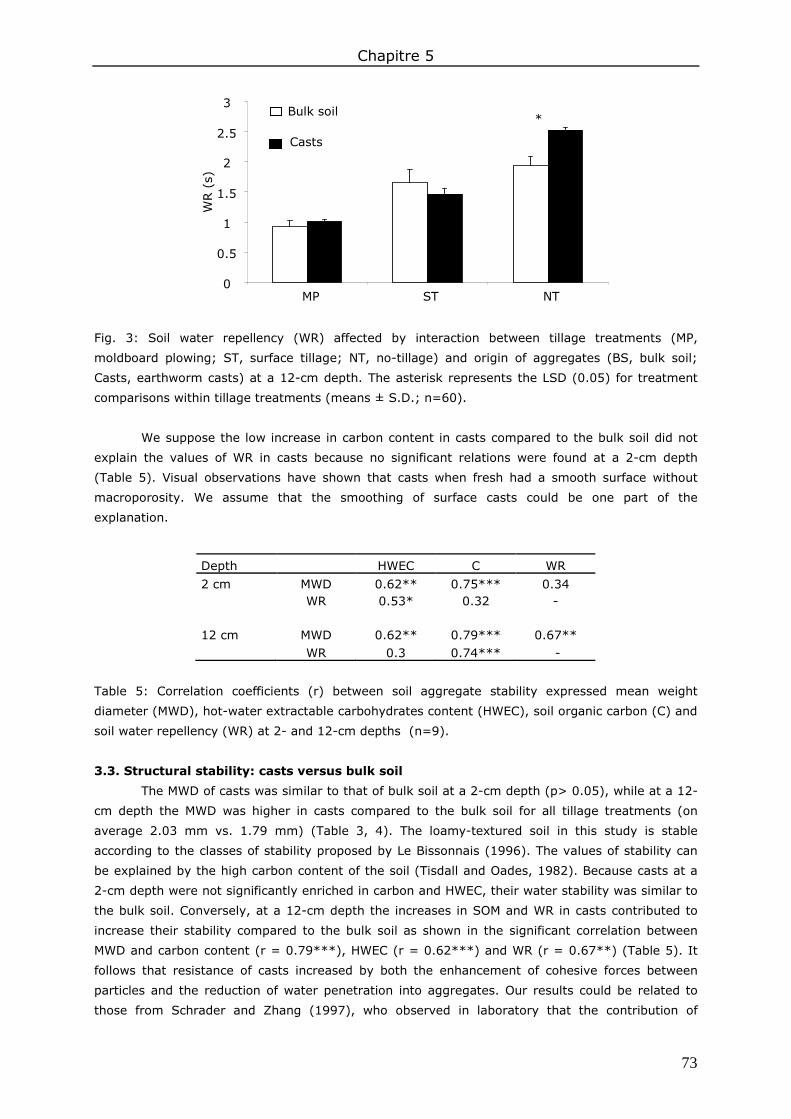
Chapitre 5
73
Fig. 3: Soil water repellency (WR) affected by interaction between tillage treatments (MP,
moldboard plowing; ST, surface tillage; NT, no-tillage) and origin of aggregates (BS, bulk soil;
Casts, earthworm casts) at a 12-cm depth. The asterisk represents the LSD (0.05) for treatment
comparisons within tillage treatments (means ± S.D.; n=60).
We suppose the low increase in carbon content in casts compared to the bulk soil did not
explain the values of WR in casts because no significant relations were found at a 2-cm depth
(Table 5). Visual observations have shown that casts when fresh had a smooth surface without
macroporosity. We assume that the smoothing of surface casts could be one part of the
explanation.
Depth HWEC C WR
2 cm MWD 0.62** 0.75*** 0.34 WR 0.53* 0.32 - 12 cm MWD 0.62** 0.79*** 0.67** WR 0.3 0.74*** -
Table 5: Correlation coefficients (r) between soil aggregate stability expressed mean weight
diameter (MWD), hot-water extractable carbohydrates content (HWEC), soil organic carbon (C) and
soil water repellency (WR) at 2- and 12-cm depths (n=9).
3.3. Structural stability: casts versus bulk soil
The MWD of casts was similar to that of bulk soil at a 2-cm depth (p> 0.05), while at a 12-
cm depth the MWD was higher in casts compared to the bulk soil for all tillage treatments (on
average 2.03 mm vs. 1.79 mm) (Table 3, 4). The loamy-textured soil in this study is stable
according to the classes of stability proposed by Le Bissonnais (1996). The values of stability can
be explained by the high carbon content of the soil (Tisdall and Oades, 1982). Because casts at a
2-cm depth were not significantly enriched in carbon and HWEC, their water stability was similar to
the bulk soil. Conversely, at a 12-cm depth the increases in SOM and WR in casts contributed to
increase their stability compared to the bulk soil as shown in the significant correlation between
MWD and carbon content (r = 0.79***), HWEC (r = 0.62***) and WR (r = 0.67**) (Table 5). It
follows that resistance of casts increased by both the enhancement of cohesive forces between
particles and the reduction of water penetration into aggregates. Our results could be related to
those from Schrader and Zhang (1997), who observed in laboratory that the contribution of
0
0.5
1
1.5
2
2.5
3
MP ST NT
Bulk soil
Casts
WR (
s)
*
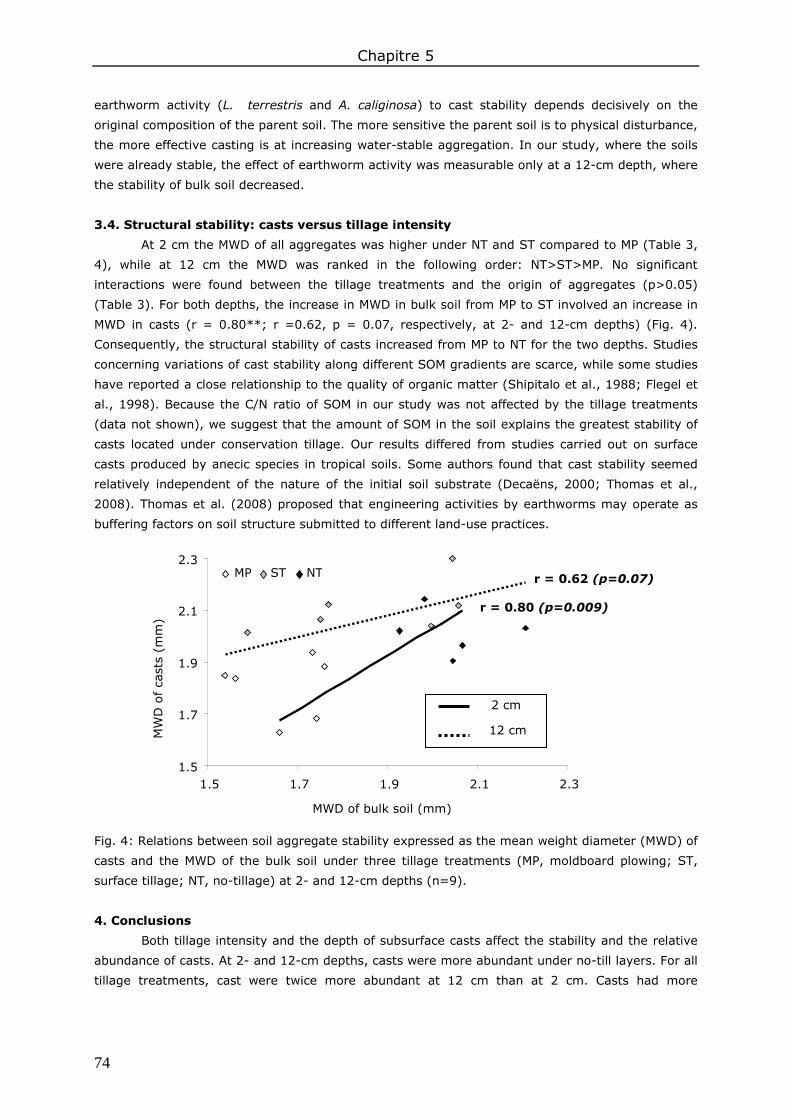
Chapitre 5
74
earthworm activity (L. terrestris and A. caliginosa) to cast stability depends decisively on the
original composition of the parent soil. The more sensitive the parent soil is to physical disturbance,
the more effective casting is at increasing water-stable aggregation. In our study, where the soils
were already stable, the effect of earthworm activity was measurable only at a 12-cm depth, where
the stability of bulk soil decreased.
3.4. Structural stability: casts versus tillage intensity
At 2 cm the MWD of all aggregates was higher under NT and ST compared to MP (Table 3,
4), while at 12 cm the MWD was ranked in the following order: NT>ST>MP. No significant
interactions were found between the tillage treatments and the origin of aggregates (p>0.05)
(Table 3). For both depths, the increase in MWD in bulk soil from MP to ST involved an increase in
MWD in casts (r = 0.80**; r =0.62, p = 0.07, respectively, at 2- and 12-cm depths) (Fig. 4).
Consequently, the structural stability of casts increased from MP to NT for the two depths. Studies
concerning variations of cast stability along different SOM gradients are scarce, while some studies
have reported a close relationship to the quality of organic matter (Shipitalo et al., 1988; Flegel et
al., 1998). Because the C/N ratio of SOM in our study was not affected by the tillage treatments
(data not shown), we suggest that the amount of SOM in the soil explains the greatest stability of
casts located under conservation tillage. Our results differed from studies carried out on surface
casts produced by anecic species in tropical soils. Some authors found that cast stability seemed
relatively independent of the nature of the initial soil substrate (Decaëns, 2000; Thomas et al.,
2008). Thomas et al. (2008) proposed that engineering activities by earthworms may operate as
buffering factors on soil structure submitted to different land-use practices.
Fig. 4: Relations between soil aggregate stability expressed as the mean weight diameter (MWD) of
casts and the MWD of the bulk soil under three tillage treatments (MP, moldboard plowing; ST,
surface tillage; NT, no-tillage) at 2- and 12-cm depths (n=9).
4. Conclusions
Both tillage intensity and the depth of subsurface casts affect the stability and the relative
abundance of casts. At 2- and 12-cm depths, casts were more abundant under no-till layers. For all
tillage treatments, cast were twice more abundant at 12 cm than at 2 cm. Casts had more
r = 0.62 (p=0.07)
r = 0.80 (p=0.009)
2 cm
12 cm 1.7
1.9
2.1
2.3
1.5
MWD of bulk soil (mm)
1.5 1.7 1.9 2.1 2.3
MW
D o
f ca
sts
(mm
)
MP ST NT
Chapitre 5
75
structural stability than the bulk soil exclusively at 12 cm. Moreover, casts under conservation
tillage were more stable than casts under moldboard plowing.
Consequently, casts located at 2 cm did not participate in soil aggregate stabilization. On
the other hand, at 12 cm the highest structural stability observed under conservation tillage was
explained in part by the production of casts. Further studies are needed to determine the impact of
casts on soil structure, especially under conservation tillage where soil is naturally compacted.
Acknowledgements
We would like to thank P. Cotinet, D. Heddadj and A. Cottais, who allow us to work at the
experimental site at Kerguéhennec (CRAB). This project was financially supported by the Brittany
region project (PRIR).


Chapitre 6 Impact des pratiques culturales sur la stabilité des
agrégats du sol

79
Chapitre 6 Impact des pratiques culturales sur la stabilité des agrégats du sol
Résumé – La stabilité structurale, classiquement utilisée comme indicateur de l’érosion hydrique
et du ruissellement, est influencée par les pratiques culturales. L’objectif de ce travail était
d’évaluer l’effet du non labour et de l’apport de fertilisation organique sur la stabilité des agrégats
d’un sol limoneux.
Trois types de travail du sol sont comparés : le labour conventionnel (MP), le travail
superficiel (ST) et le semis direct (NT) ainsi que 2 types de fertilisation (fumier de volaille et
fertilisation minérale). La stabilité des agrégats a été mesurée entre 2 et 7 cm de profondeur à 4
dates d’échantillonnage au cours d’une année culturale de blé et durant l’interculture qui suivait.
Nous avons également mesuré certaines propriétés physico-chimiques responsables de l’agrégation
des sols.
Quelle que soit la date d’échantillonnage, la stabilité structurale était plus forte sous NT et
plus faible sous MP. L’effet du ST sur la stabilité structurale était dépendant de la date
d’échantillonnage: avec des valeurs proches de MP en hiver et au début de printemps, et des
valeurs proches de NT au printemps et en été. L’apport de fumier de volaille appliqué à la dose
agronomique n’augmentait pas significativement la matière organique du sol ni la stabilité
structurale. Les variations de la stabilité structurale étaient positivement corrélées aux teneurs en
carbone organique et en sucres extraits à chauds. La stabilité des agrégats présentait une forte
variation saisonnière : caractérisée par une augmentation au printemps et en été puis une
diminution en hiver. Ces variations étaient expliquées en partie par la teneur en eau du sol au
moment de l’échantillonnage.
En conclusion, nos résultats démontrent la nécessité d’évaluer la stabilité structurale au
cours de différentes dates d’échantillonnage afin d’évaluer l’effet du travail du sol sur la stabilité
structurale. De plus, cette étude démontre le caractère résiliant des agrégats sous ST face à la
stabilité structurale.
Mots clés : stabilité des agrégats ; effluent ; dynamique temporelle, carbone organique ; teneur
en eau ; hydrophobicité ; sucres solubles.
Chapitre 6
80
Dynamics of aggregate stability as influenced by tillage and manure amendment in a humic loamy soil of Northwest France
N. Bottinellia, b, S. Menasseri-Aubrya, b, c, C. Le Guilloua, b, V. Hallairea, b, D. Cluzeaud, S. Busnota, b, c, D.A. Angerse
aINRA, UMR 1069 Sol Agro et hydrosystème Spatialisation, F-35000 Rennes, France ; bAgrocampus Ouest, UMR 1069 Sol Agro et hydrosystème Spatialisation, F-35000 Rennes, France ; cUniversité européenne de Bretagne, France ; dUniversité Rennes 1, UMR CNRS ECOBIO, IFR CAREN, Station Biologique, 35380 Paimpont, France ; eAgriculture et Agroalimentaire Canada, Centre de Recherche sur les Sols et les Grandes Cultures, 2560 Boul. Hochelaga, Ste-Foy, Québec, G1V 2J3, Canada
Abstract - Soil aggregate stability is an indicator of erosion and surface runoff which can be
managed by selecting appropriate agricultural practices. This study aimed at evaluating the effect
of reduced tillage and organic fertilization on the aggregate stability of a loamy soil.
Three tillage treatments were compared (moldboard plowing (MP), surface tillage (ST) and
no-tillage (NT)) along with two types of fertilizers (poultry manure and mineral). Soil aggregate
stability (AS) was measured at the 2- to 7-cm depth on four sampling dates during a wheat crop
and the following inter-cropping seasons. Physico-chemical properties that influence variations in
soil stability were also studied concurrently.
At all four sampling dates, the highest AS were measured under NT and the lowest under
MP. The effect of ST on AS varied with sampling dates with values close to MP in winter and early
spring, and values close to NT in late spring and summer. Poultry manure which was applied at
agronomic rates did not significantly increase neither soil organic matter content nor AS. Variations
in AS were positively correlated with organic C and hot-water extractable carbohydrate contents
suggesting that reduced mineralization and accumulation of residues at the soil surface under
reduced tillage favored biologically-induced aggregate stabilization. Soil AS exhibited a large
seasonal variability, characterized by an increase during the spring/summer period and a decrease
in the winter. These temporal variations were positively related to the soil water content at time of
sampling.
The significant interaction between the effects of tillage and date of sampling suggests that
for an appropriate assessment of the impact of management practices on AS, more than one
sample per year should be obtained. This approach also highlighted the potentially high resiliency
of AS under surface tillage.
Key words: aggregate stability; manure; temporal dynamics; organic carbon; water content;
water repellency; carbohydrates.

Chapitre 6
81
1. Introduction
With the increase in annual cropping, deterioration of soil structure and increasing soil
erosion have emerged as major issues (Lal, 2005). This is also observed in western France where
the intensification of agriculture involving maize, wheat and vegetable cropping has resulted in
increased overland flow and sediment transport (Le Bissonnais et al., 2002). Conservation tillage
practices (surface tillage or no-tillage) are proposed as practices to alleviate soil erosion risks. In
France, their development is relatively recent, with 35% of the annual crop surface cultivated
under reduced tillage in 2005 (Labreuche et al., 2007). Due to the presence of livestock production
in the western part of France, these reduced tillage systems are often combined to manure
amendments.
Soil aggregate stability (AS) at the soil surface is closely linked to runoff rates and mean
annual soil losses at the landscape scale (Le Bissonnais et al., 2002; Le Bissonnais et al., 2007),
and has been shown to be improved under conservation tillage compared to conventional ploughing
(Angers et al., 1993b; Álvaro-Fuentes et al., 2008) and under organic fertilization (Khaleel et al.,
1981; N'dayegamiye and Angers, 1990; Albiach et al., 2001). A number of studies have also
looked at the combined and interactive effects of conservation tillage and organic fertilization on
soil aggregation and AS (Paré et al., 1999; Bissonnette et al., 2001; Whalen et al., 2003; Mikha
and Rice, 2004; Jiao et al., 2006). These studies have shown variable and sometimes contradictory
results depending on the aggregation measurement methodology, soil and climatic conditions, the
nature and quantity of amendment used, duration of the experiment, and the crop rotation under
consideration. Therefore, the magnitude and significance of these interactive effects on soil
aggregation still needs to be determined under various conditions (Pikul et al., 2009).
In general, the long-term effects of management practices on soil AS are related to soil
organic matter (Whalen et al., 2003; Jiao et al., 2006) and related fractions (polysaccharides,
lipids) and processes (microbial activity, water repellency) (Blanco-Canqui and Lal, 2007; Álvaro-
Fuentes et al., 2008; Tejada et al., 2008; Martins et al., 2009).
Soil AS is a dynamic property and its temporal variation has been shown to depend on
tillage practices and fertilizer sources (Kandeler and Murer, 1993; Abiven et al., 2007; Annabi et
al., 2007; Álvaro-Fuentes et al., 2008; Daraghmeh et al., 2009). Short term fluctuations of soil
stability during the growing season (i.e., over a period of one month) can sometimes be even more
important than the effects of the management practices (Perfect et al., 1990; Chan et al., 1994).
Moreover, knowledge of seasonal fluctuation under different tillage and amendment practices must
also be considered to identify periods of low stability when the soil is particularly vulnerable to
structural breakdown (Chan et al., 1994) in order to better adapt conservation management
practices.
The objective of this study was to characterize the effects of 8 years of combined reduced
tillage practices and organic fertilization on AS of a humic loamy soil of western France. The
seasonal variation in AS as well as selected factors believed to determine these effects were also
studied.
2. Materials and methods
2.1. Site, tillage and fertilization practices
The study was conducted at the Kerguéhennec Experimental Station (47°53 N, 02°44 W)
(Chambre Régional d’Agriculture de Bretagne) located in Brittany (western France). The area is
characterized by an oceanic climate with an annual average temperature of 10.8°C and an average
cumulative precipitation of 1060 mm (Fig. 1). The soil, derived from mica schist, is a Humic
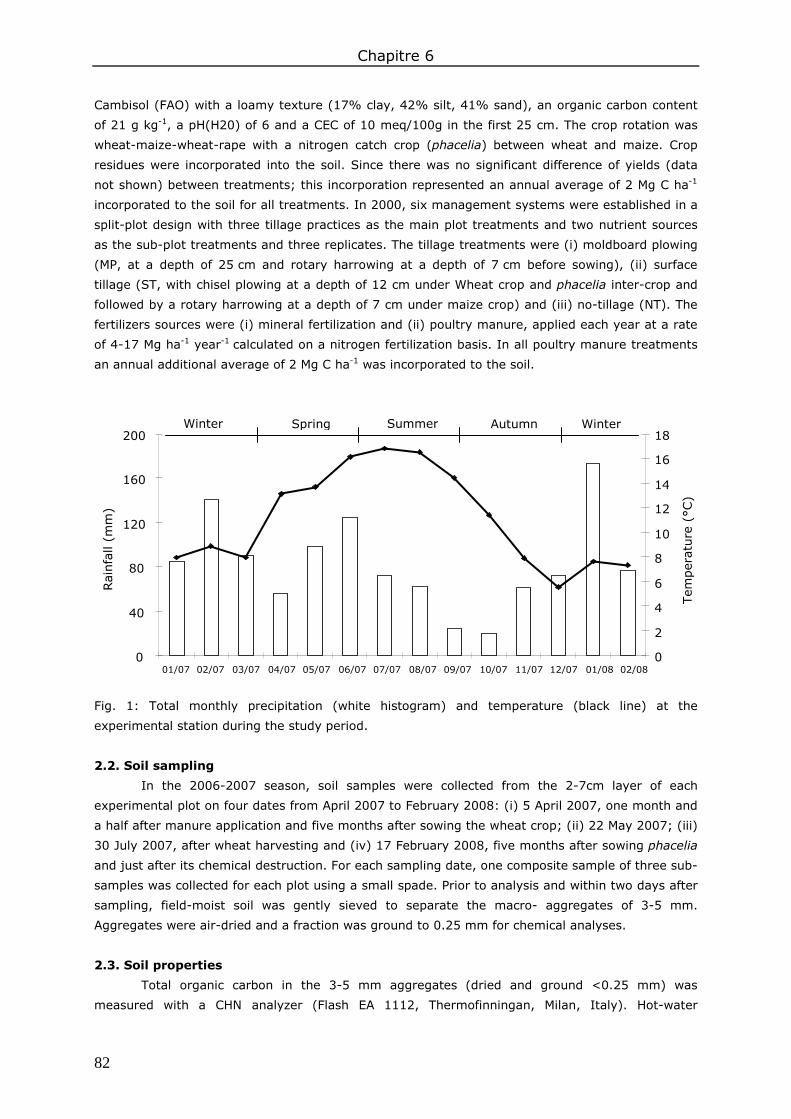
Chapitre 6
82
Cambisol (FAO) with a loamy texture (17% clay, 42% silt, 41% sand), an organic carbon content
of 21 g kg-1, a pH(H20) of 6 and a CEC of 10 meq/100g in the first 25 cm. The crop rotation was
wheat-maize-wheat-rape with a nitrogen catch crop (phacelia) between wheat and maize. Crop
residues were incorporated into the soil. Since there was no significant difference of yields (data
not shown) between treatments; this incorporation represented an annual average of 2 Mg C ha-1
incorporated to the soil for all treatments. In 2000, six management systems were established in a
split-plot design with three tillage practices as the main plot treatments and two nutrient sources
as the sub-plot treatments and three replicates. The tillage treatments were (i) moldboard plowing
(MP, at a depth of 25 cm and rotary harrowing at a depth of 7 cm before sowing), (ii) surface
tillage (ST, with chisel plowing at a depth of 12 cm under Wheat crop and phacelia inter-crop and
followed by a rotary harrowing at a depth of 7 cm under maize crop) and (iii) no-tillage (NT). The
fertilizers sources were (i) mineral fertilization and (ii) poultry manure, applied each year at a rate
of 4-17 Mg ha-1 year-1 calculated on a nitrogen fertilization basis. In all poultry manure treatments
an annual additional average of 2 Mg C ha-1 was incorporated to the soil.
Fig. 1: Total monthly precipitation (white histogram) and temperature (black line) at the
experimental station during the study period.
2.2. Soil sampling
In the 2006-2007 season, soil samples were collected from the 2-7cm layer of each
experimental plot on four dates from April 2007 to February 2008: (i) 5 April 2007, one month and
a half after manure application and five months after sowing the wheat crop; (ii) 22 May 2007; (iii)
30 July 2007, after wheat harvesting and (iv) 17 February 2008, five months after sowing phacelia
and just after its chemical destruction. For each sampling date, one composite sample of three sub-
samples was collected for each plot using a small spade. Prior to analysis and within two days after
sampling, field-moist soil was gently sieved to separate the macro- aggregates of 3-5 mm.
Aggregates were air-dried and a fraction was ground to 0.25 mm for chemical analyses.
2.3. Soil properties
Total organic carbon in the 3-5 mm aggregates (dried and ground <0.25 mm) was
measured with a CHN analyzer (Flash EA 1112, Thermofinningan, Milan, Italy). Hot-water
0
40
80
120
160
200
01/07 02/07 03/07 04/07 05/07 06/07 07/07 08/07 09/07 10/07 11/07 12/07 01/08 02/08 0
2
4
6
8
10
12
14
16
18
Rai
nfa
ll (m
m)
Tem
per
ature
(°C
)
Winter Spring Summer Autumn Winter
Chapitre 6
83
extractable carbohydrate content (HWEC) was obtained from an extract of 1 g of soil (< 0.25 mm)
suspended in 20 ml of hot water (80 °C) for 24 h. The carbohydrate content of the extract was
analyzed by the H2SO4/phenol method (Dubois et al., 1956).
Water repellency of aggregates (WR) was assessed by measuring the water drop
penetration time (adapted from Letey, 1969). Drops of 3 µl deionized water were deposited with a
micro-syringe on the surface of 60 individual air dried aggregates per plot and the time required for
a drop to penetrate into each aggregate was recorded. The gravimetric soil water content (WC)
was measured from each sample, by oven drying a subsample at 105°C for 24h.
2.4. Soil aggregate stability
Soil AS was measured according to the slow-wetting test of Le Bissonnais (1996) which
simulates the behavior of dry soils or soils with low moisture content subjected to moderate
rainfall. This test is less agressive than fast wetting and was found to be more appropriate to
compare silty soils which differ only in organic matter (OM) level (Le Bissonnais et al., 2002) or
subjected to different organic amendments (Abiven et al., 2007). This was confirmed during the
present study (data not shown). Aggregate samples were oven dried at 40°C for 24 hours just
before the test in order to standardize the aggregate moisture content. Five g of aggregate
samples were capillary rewetted with water on a tension table at a potential of −0.3 kPa for
>60 min before sieving in alcohol at 50 µm and dry sieving the resulting fraction (>50 µm). Dry
sieving was performed by hand with a nest of six sieves (2000, 1000, 500, 200, 100 and 50 µm)
and the mean weight diameter was calculated as the sum of the mass fraction remaining on each
sieve after sieving, multiplied by the mean aperture of the adjacent sieves and was used as a
measure of AS.
2.5. Statistical analysis
An analysis of variance using a split plot design was used to determine the significance of
the effects of tillage, fertilizer source and date of sampling. Prior to analyses, the data were tested
for homogeneity of variance using the Levene’s test and transformed when required. When the
effects were significant at a level of 0.05, means were compared with the LSD test. Regression
analyses were performed on reduced-centered values to determine the factors related to changes
in soil AS induced by management:
rcv = (v-µ)/σ
Where rcv is the reduced centered value, v is the initial value, µ is the mean of the variable
for one date and σ is the standard deviation of the variable for one date. Factors controlling the
seasonal variability of soil AS were also studied by regression analyses within tillage treatments
(using uncentered and unreduced data). All statistical calculations were carried out using R
software (R Development Core Team, 2008).
3. Results and discussion
3.1. Soil organic matter
The average soil organic C content of this soil was 22.7 g C kg-1 which is relatively high
compared to other French loamy soils but is in the range of values for soils of southern Brittany
(Arrouays et al., 2001). The HWEC values amounted to about 5% of the total soil organic C, which
is in the high range of values reported for other soils (Cheshire et al., 1979; Angers et al., 1993a).
Tillage practices had a significant effect on the organic C and HWEC contents of the soil but not the
fertilizer source (p<0.001, Table 1). Averaged over all sampling dates and fertilizer source, organic

Chapitre 6
84
C and HWEC were significantly higher under NT and ST treatments, compared to MP (Table 2).
Organic C was 20% greater under NT than MP whereas the difference for carbohydrates was 40%.
This is much greater than relative differences observed in other studies (<15% in Angers et al.,
1993a). Compared to MP, reducing tillage depth and intensity can result in both a reduction in OM
oxidation and erosion and an accumulation of organic residues near the soil surface. Furthermore,
management practices that improve organic C content also improve soil carbohydrates (Cheshire et
al., 1979; Angers et al., 1993a).
Manure is a source of OM which generally increases organic C and HWEC in soils (Angers
and Ndayegamiye, 1991; Albiach et al., 2001). In our case the minimal effects of poultry manure
on soil OM may be due to the relatively small amount of poultry manure that was used. It was
equivalent to the agronomic dose or 4-17 Mg ha-1 year-1, resulting in an average input of C to the
soil of 2 Mg C ha-1 year-1 which may not be sufficient to result in measurable soil C increases
against a relatively high soil organic C background level.
The date of sampling had no significant effect on soil organic C content (p>0.05, Table 1),
while the HWEC varied significantly with time (p<0.001, Table 1). The HWEC content was stable
during the wheat-growing season at 1.13 mg g-1 of carbohydrates and increased in February by
40% (Table 2). The HWEC fraction includes free sugars and microbial gums, which have both a
plant and microbial origin (Cheshire et al., 1979). In February, the highest HWEC content observed
was probably explained either by the higher rooting density of phacelia or by the increase organic
materials released by their roots.
Source of variation
Soil property
C HWEC WC WR AS
T <0.001 <0.001 <0.05 0.56 <0.001 F 0.56 0.69 <0.001 0.8 0.12 D 0.14 <0.001 <0.001 <0.01 <0.001 T*F 0.61 0.76 0.19 0.91 0.41 T*D 0.55 0.74 <0.05 0.42 <0.05 F*D 0.53 0.17 0.15 0.07 0.57 T*F*D 0.27 0.16 0.6 0.76 0.23
Table 1: Analysis of variance (P value) to determine the effects of tillage (T), fertilization (F) and
date of sampling (D) on the total organic C, hot-water extractable carbohydrates (HWEC), water
content (WC), water repellency (WR) and aggregate stability (AS) in the soil.
Chapitre 6
85
Source of variation
C HWEC WC WR AS
(g kg-1) (mg g-1) (g kg-1) (s) (mm)
Tillage factor MP 20.30c 1.03b 276b 1.55a 1.15b ST 23.41b 1.29a 293a 1.53a 1.46a NT 24.42a 1.44a 292a 1.45a 1.55a Fertilization factor Mineral 22.25a 1.21a 278b 1.57a 1.31a Organic 23.17a 1.30a 297a 1.45a 1.47a Date factor April-07 22.19a 1.13b 262b 1.30b 1.21c May-07 23.33a 1.15b 282b 1.86a 1.44b July-07 22.50a 1.11b 241c 1.88a 1.78a February-08 22.83a 1.64a 364a 1.01b 1.12c
Table 2: Effects of tillage, fertilization, and sampling date on the total organic C, hot-water
extractable carbohydrates (HWEC), water content (WC), water repellency (WR) and aggregate
stability (AS) in the soil. MP: moldboard plowing, ST: surface tillage and NT: no-tillage. The means
listed in a column within each factor accompanied by the same letter are not significantly different
according to our LSD test.
3.2. Soil water content
The weather during 2007 was especially humid (Cumulative rainfall – cumulative
evapotranspiration = 257 mm) (Fig. 1). Soil WC was always higher than field capacity (220 g kg-1)
for all tillage treatments (Fig. 2). WC was affected by the type of tillage and the date of sampling
(p<0.05, Table 2). In April and May, WC was the highest under NT and ST, while no significant
effect of tillage was observed in August and February (Fig. 2). Poultry manure significantly
increased soil WC relative to mineral fertilizer (Table 1, Table 2). The generally higher soil WC,
observed either under conservation tillage or with organic fertilizer, has been attributed to the
accumulation of OM and the presence of surface residue cover (Gantzer and Blake, 1978; Blevins
and Frye, 1993). Irrespective to the tillage treatment, WC increased from April to May to 282 g kg-1
(Table 2, Fig. 2), then decreased to 241 g kg-1 in July and finally increased until February when it
reached a value of 364 g kg-1 which is close to saturation.

Chapitre 6
86
Fig. 2: Effect of tillage and sampling date on soil water content (WC), averaged fertilization
treatments. MP: moldboard plowing; ST: surface tillage and NT: no-tillage. The asterisks represent
the LSD (0.05) for tillage treatment comparisons within sampling date.
3.3. Water repellency of aggregates
The aggregates from the soil of this study were highly wettable. Almost all values of WR
were lower than 2s (Table 2), which categorizes this soil as non-hydrophobic according to King
(1981). The high wettability of French silty soil has also been reported by Cosentino et al. (2006)
and Annabi et al. (2007). WR was not significantly affected by tillage practices (p> 0.05, Table 1).
Data on the impacts of NT on WR are few and inconsistent. Hallett et al.(2001) reported that NT
soils were more water repellent than plowed soils in a silty loam. Blanco-Canqui et al. (2007)
showed that soils under 44-yr NT continuous corn had a WR about twice higher than plowed soils
on a sloping silt loam. In contrast, a field study by Eynard et al. (2004) showed no significant
differences in WR between NT and MP across various soils. These inconsistencies suggest the site
specificity of no-till impacts. WR was not significantly affected by the type of fertilization either
(p> 0.05, Table 1) which is in disagreement with Blanco-Canqui et al. (2007) who observed that
soil aggregates from no-till fields receiving 15 Mg ha− 1 of cattle manure each year were slightly
more water repellent that those from unmanured no-till soils. This may be explained by the lack of
effect of poultry manure in our study. For all types of crop treatment (p<0.001, Table 1), we found
a very small temporal variation in WR, which increased from April to May (1.3s to 1.9s, Table 2)
and decreased from July to February (to ~1.0s). It has long been recognized that these temporal
variations in repellency are linked to soil moisture fluctuations. These changes in soil hydrophobic
properties are frequently attributed to conformational changes in soil organic matter (Wallis and
Horne, 1992).
3.4. Soil aggregate stability
3.4.1. Effects of management practices
According to the classification proposed by Le Bissonnais (1996), the AS of this silty soil
would be considered as medium to stable against slow wetting. The effect of tillage on AS was
dependent on the date of sampling, as shown by the significant interaction (p<0.01, Table 1). The
smallest AS was consistently found in soils under MP, and the maximum in soils under NT (1.15 vs.
1.55 mm) (Fig. 3 and Table 2) which is consistent with the literature (Angers et al., 1993b; Álvaro-
Fuentes et al., 2008). Under ST, AS varied between these two extremes with similar values to MP
WC (
g k
g-1
)
200
240
280
320
360
400
Apr-07 Jun-07 Aug-07 Oct-07 Dec-07 Feb-08
Sowing Harvest
MP ST NT
* *
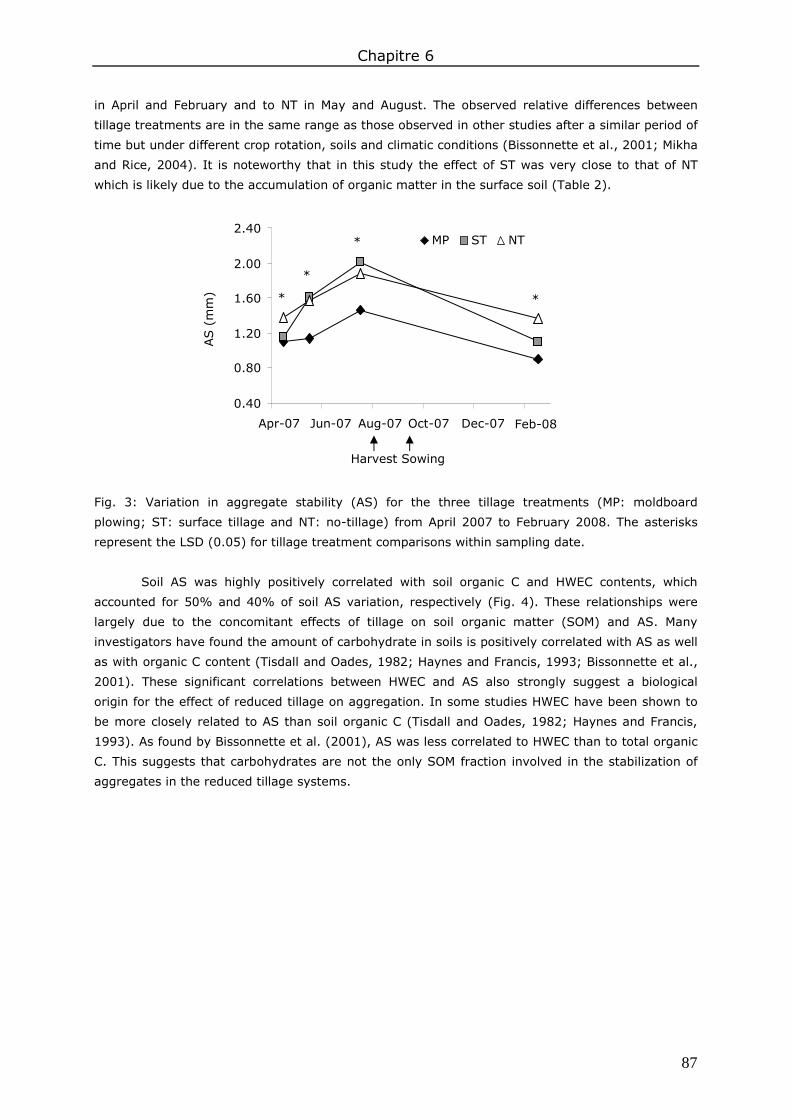
Chapitre 6
87
in April and February and to NT in May and August. The observed relative differences between
tillage treatments are in the same range as those observed in other studies after a similar period of
time but under different crop rotation, soils and climatic conditions (Bissonnette et al., 2001; Mikha
and Rice, 2004). It is noteworthy that in this study the effect of ST was very close to that of NT
which is likely due to the accumulation of organic matter in the surface soil (Table 2).
Fig. 3: Variation in aggregate stability (AS) for the three tillage treatments (MP: moldboard
plowing; ST: surface tillage and NT: no-tillage) from April 2007 to February 2008. The asterisks
represent the LSD (0.05) for tillage treatment comparisons within sampling date.
Soil AS was highly positively correlated with soil organic C and HWEC contents, which
accounted for 50% and 40% of soil AS variation, respectively (Fig. 4). These relationships were
largely due to the concomitant effects of tillage on soil organic matter (SOM) and AS. Many
investigators have found the amount of carbohydrate in soils is positively correlated with AS as well
as with organic C content (Tisdall and Oades, 1982; Haynes and Francis, 1993; Bissonnette et al.,
2001). These significant correlations between HWEC and AS also strongly suggest a biological
origin for the effect of reduced tillage on aggregation. In some studies HWEC have been shown to
be more closely related to AS than soil organic C (Tisdall and Oades, 1982; Haynes and Francis,
1993). As found by Bissonnette et al. (2001), AS was less correlated to HWEC than to total organic
C. This suggests that carbohydrates are not the only SOM fraction involved in the stabilization of
aggregates in the reduced tillage systems.
*
*
*
*
0.40
0.80
1.20
1.60
2.00
2.40
Apr-07 Jun-07 Aug-07 Oct-07 Dec-07 Feb-08
AS (
mm
)
MP ST NT
Sowing Harvest
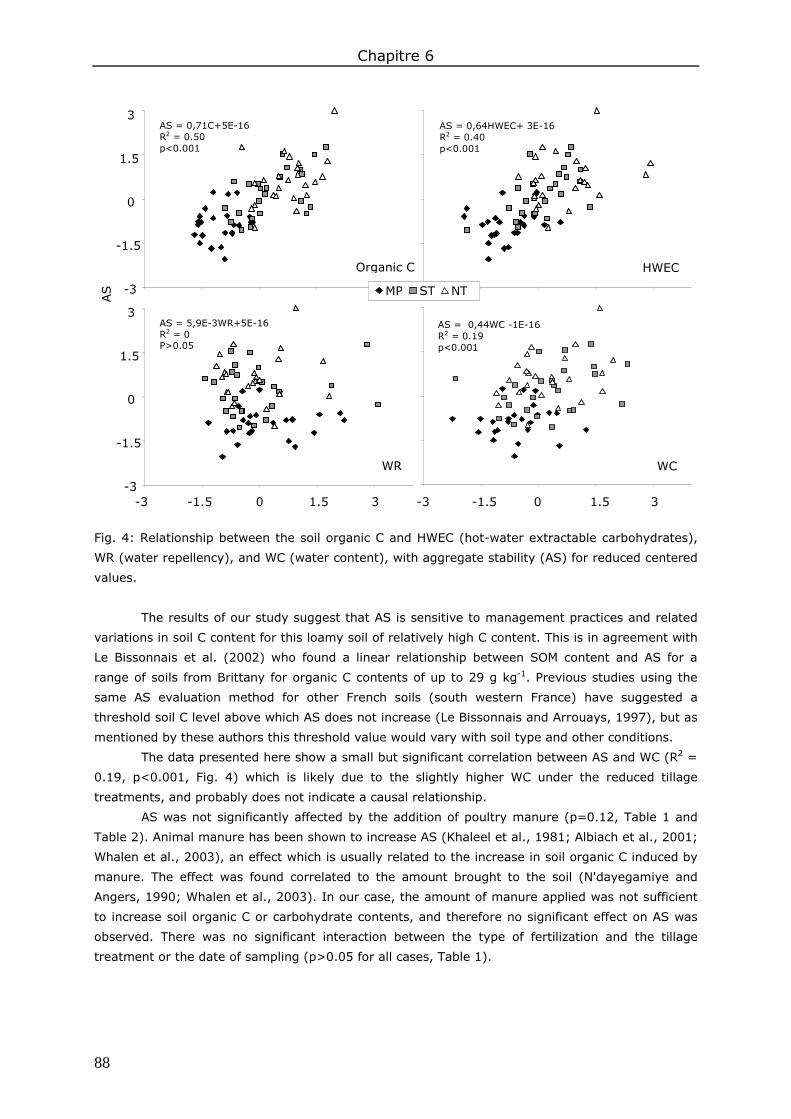
Chapitre 6
88
Fig. 4: Relationship between the soil organic C and HWEC (hot-water extractable carbohydrates),
WR (water repellency), and WC (water content), with aggregate stability (AS) for reduced centered
values.
The results of our study suggest that AS is sensitive to management practices and related
variations in soil C content for this loamy soil of relatively high C content. This is in agreement with
Le Bissonnais et al. (2002) who found a linear relationship between SOM content and AS for a
range of soils from Brittany for organic C contents of up to 29 g kg-1. Previous studies using the
same AS evaluation method for other French soils (south western France) have suggested a
threshold soil C level above which AS does not increase (Le Bissonnais and Arrouays, 1997), but as
mentioned by these authors this threshold value would vary with soil type and other conditions.
The data presented here show a small but significant correlation between AS and WC (R2 =
0.19, p<0.001, Fig. 4) which is likely due to the slightly higher WC under the reduced tillage
treatments, and probably does not indicate a causal relationship.
AS was not significantly affected by the addition of poultry manure (p=0.12, Table 1 and
Table 2). Animal manure has been shown to increase AS (Khaleel et al., 1981; Albiach et al., 2001;
Whalen et al., 2003), an effect which is usually related to the increase in soil organic C induced by
manure. The effect was found correlated to the amount brought to the soil (N'dayegamiye and
Angers, 1990; Whalen et al., 2003). In our case, the amount of manure applied was not sufficient
to increase soil organic C or carbohydrate contents, and therefore no significant effect on AS was
observed. There was no significant interaction between the type of fertilization and the tillage
treatment or the date of sampling (p>0.05 for all cases, Table 1).
-3
-1.5
0
1.5
3
-3
-1.5
0
1.5
3
-3 -1.5 0 1.5 3 -3 -1.5 0 1.5 3
AS = 0,71C+5E-16 R2 = 0.50 p<0.001
AS = 0,64HWEC+ 3E-16 R2 = 0.40 p<0.001
AS = 0,44WC -1E-16 R2 = 0.19 p<0.001
AS
Organic C
MP ST NT
HWEC
WR WC
AS = 5,9E-3WR+5E-16 R2 = 0 P>0.05

Chapitre 6
89
3.4.2. Seasonal effect
Soil AS showed a significant intra-annual variability, with a significant increase in spring,
maximum values in summer, followed by a significant decrease in winter (Table 1, Fig 3). These
temporal variations of AS were similar for each tillage treatment but more pronounced for ST and
NT compared to MP. Similar general patterns have been observed in temperate soils (Chan et al.,
1994; Daraghmeh et al., 2009) as well as under Mediterranean conditions (Álvaro-Fuentes et al.,
2008).
From April to July the observed increase in AS cannot be explained by variations in total
organic C or polysaccharide contents which does not exclude the fact that they may be due to
other SOM fractions such as hydrophobic molecules or hyphal mycelium that can develop during
the growing season. Perfect et al. (1990) and Álvaro-Fuentes et al. (2008) found that AS dynamics
was positively correlated with microbial biomass, since growth of plant and soil moisture during the
growing seasons increased the labile organic C inputs through roots exudates.
The lowest AS level was observed in winter which coincided with the highest values of soil
WC at time of sampling, and partly explains the negative correlation observed between WC and AS
when each tillage treatment is considered separately (Table 3). Soil moisture at time of sampling
has been identified as a significant determining factor in the seasonal variability of AS (Perfect et
al., 1990; Angers et al., 1993b; Chan et al., 1994; Daraghmeh et al., 2009). The relationship
between WC and AS can be either positive (e.g. Angers et al., 1993b), negative (e.g. Perfect et al.,
1990) or not significant (Álvaro-Fuentes et al., 2008). The different responses of AS to variations in
water content is primarily due to the procedure used to determine AS (wet or dry sieving after pre-
wetting or not the air dry or field moist aggregates), soil sampling procedure, physico-chemical and
biological factors (Perfect, 1990), or soil moisture dynamics prior to sampling such as wetting–
drying cycles that influence the formation and destruction of soil structure in a dynamic way
(Amezketa, 1999). During sampling under wet conditions or after a wet period, structural stability
of the aggregate may be reduced due to the aggregate breakdown (Le Bissonnais and Singer,
1992) or simply the compaction by the core sampler (Perfect et al., 1990). Moreover, the reduction
in cohesive strength of particle bonds at water content equal or greater than saturation, can be
explained by the clay dispersion that can occur (Rasiah, 1994), the dissolution of stabilizing
material (Watts et al., 1996) or a lower absorption of the organic fractions to soil particles (Reid
and Goss, 1981).
Tillage treatments Equation R2 P value
MP 1.97-0.03 WC 0.38 <0.01 ST 2.53-0.03 WC 0.21 <0.05 NT 2.65-0.04 WC 0.38 <0.01
Table 3: Relationship between soil aggregate stability (AS) and soil water content (WC) at time of
sampling under the three different tillage systems. MP: moldboard plowing; ST: surface tillage and
NT: no-tillage.
4. Conclusions
For this loamy soil relatively rich in OM, eight years of contrasting tillage practices had a
strong impact on soil AS, while poultry manure application at agronomic rates did not. As expected,
highest values were found under NT and lowest under MP. In the ST treatment AS often reached
levels as high as NT, likely due to the accumulation of organic matter in the surface layer which
may suggest a greater resiliency of the aggregates under this treatment.

Chapitre 6
90
This study confirmed the large intra-annual variability of AS, with an increase in stability
during the spring and summer followed by a decrease in winter, regardless of tillage practices. Part
of this effect was related to variations in soil water content which further suggests the interest in
making more than a single measurement when cropping systems are compared.
Acknowledgements
We are grateful to L. Carteaux for her help in laboratory analyses and to A. Cottais, P.
Cotinet and D. Heddadj who allowed us to work at the experimental site at Kerguéhennec (CRAB).
This project was financially supported by the Brittany region (project PRIR).
Chapitre 7 Impact des pratiques culturales sur la macroporosité et la perméabilité du sol

93
Chapitre 7 Impact des pratiques culturales sur la macroporosité et la perméabilité du sol
Résumé – Une diminution de la conductivité hydraulique proche de la saturation, K(h), peut
entraîner une augmentation du ruissellement de l’eau à la surface du sol. L’objectif de cette étude
était d’évaluer l’effet conjoint du non labour et de l’apport d’effluent d’élevage sur la macroporosité
du sol et K(h).
Trois types de travail du sol sont comparés (le labour conventionnel : MP, le travail
superficiel: ST, le semis direct : NT) ainsi que 2 types de fertilisation (fumier de volaille et
fertilisation minérale). K(h) a été mesurée entre 2 et 7 cm de profondeur au cours de 5 dates de
mesures pendant une culture de blé et de maïs. La forme des pores et la taille de la porosité ont
également été mesurées.
En moyenne la macroporosité totale, l’abondance des 3 classes de forme et de taille de la
porosité était plus importante sous ST et MP comparé à NT. Si les différences de macroporosité
entre les modalités étaient fortes 2 semaines après le semis de maïs au printemps ; 4 semaines
après le semis de blé en automne, elles étaient faibles. Les valeurs de K(h) étaient plus
importantes sous ST, plus faibles sous NT et intermédiaires sous MP. L’apport de fumier de volaille
n’influençait pas la macroporosité totale du sol, ni la forme des pores et avait peu d’effets sur la
taille de la porosité. Par conséquent, K(h) n’était pas influencée par l’apport de fumier de volaille.
K(h) présentait une forte dynamique intra-annuelle : caractérisée par une forte diminution juste
après le travail du sol dans les sols travaillés, suivie par une augmentation au printemps et une
diminution en été pour les trois modalités de travail du sol considérés. Une partie de ces variations
ont été reliées aux événements pluvieux et à l’activité lombricienne lesquels modifiaient la forme,
la taille et la continuité de la porosité.
Il est conclu de cette étude que l’adoption du travail superficiel augmente K(h) tandis que
l’apport de fumier de volaille à la dose agronomique n’avait pas d’influence sur K(h).
Mots clés : porosité ; dynamique temporelle ; semis direct ; fertilisation organique ; analyse
d’image.

Chapitre 7
94
Dynamics of soil macroporosity as influenced by tillage and fertilization in a humic loamy soil: consequences for near-
saturated hydraulic conductivity N. Bottinellia, b, V. Hallairea, b, S. Menasseri-Aubrya, b, c, C. Le Guilloua, b, Y. Benarda, b, D. Cluzeaud aINRA, UMR 1069 Sol Agro et hydrosystème Spatialisation, F-35000 Rennes, France ; bAgrocampus Ouest, UMR 1069 Sol Agro et hydrosystème Spatialisation, F-35000 Rennes, France ; cUniversité européenne de Bretagne, France ; dUniversité Rennes 1, UMR CNRS ECOBIO, IFR CAREN, Station Biologique, 35380 Paimpont, France
Abstract - Information regarding the effects of tillage and manure fertilization on soil hydraulic
conductivity near saturation, K(h), is required to improve decision support systems for soil and
environmental management. This study aimed to evaluate the effects of reduced tillage and
manure fertilization on soil macroporosity and on K(h) of a humic loamy soil.
Three tillage treatments were compared (moldboard plowing (MP), surface tillage (ST) and
no-tillage (NT)) along with two types of fertilizers (poultry manure and mineral). K(h) was
measured in wheat and maize crops at depth of 2- to 7-cm on five sampling dates. Pore shape and
porosity size distribution were studied concurrently using image analysis.
The total soil macroporosity, the abundance of three shape classes and three size classes of
the porosity were higher on average for all of the sampling dates under ST and MP in comparison
to NT. Differences between the tilled and no-tilled treatments were highest two weeks after sowing
maize in spring and lowest four weeks after sowing wheat in autumn. As a result, K(h) was ranked
as follows during all sampling periods: ST>MP>NT. The manure fertilization did not affect the total
soil macroporosity or the shape of the porosity and had a minimal effect on the size of the porosity.
Therefore, K(h) was not affected by manure fertilization. There was a large intra-annual variability
in the K(h) with lower values occurring shortly after tillage events under tilled treatments, followed
by an increase in spring and a decrease in summer for each of the three tillage treatments. Part of
this variation was related to rainfall events and earthworm activity which alter the shape, size and
continuity of the porosity.
In conclusion, surface tillage in a humic loamy soil increased K(h) while no significant effect
of manure fertilization was found at agronomic rates.
Key words: porosity; temporal dynamics; no-tillage; organic fertilization; image analysis.
Chapitre 7
95
1. Introduction
The hydraulic conductivity of near-saturated soil, K(h), is one of the most important soil
properties affecting water infiltration and surface runoff. K(h) depends strongly on soil
macroporosity (Watson and Luxmoore, 1986) and can therefore vary widely with management
practices and the sampling date (Strudley et al., 2008).
The deterioration of soil structure and increasing soil erosion have emerged as major issues
with the increase of continuous arable cultivation (Lal, 2005). Reduced tillage (surface tillage or no-
tillage) is proposed as a practice to alleviate the risk of soil erosion. The development of this
practice in France is relatively recent, with 35% of the annual crop area cultivated under reduced
tillage in 2005 (Labreuche et al., 2007). Due to the presence of livestock production in the western
part of France, these reduced tillage systems are often combined with manure amendments. We
are particularly interested in the interactive effects of reduced tillage and manure fertilization on
K(h).
Conservation tillage practices that are characterized by keeping at least 30% of the soil’s
surface covered with residues, are often associated with an increase in soil organic matter (SOM),
soil aggregation (Angers et al., 1993b) and earthworm abundance (Riley et al., 2008). However,
these practices are also associated with soil compaction (Kay and Vandenbygaart, 2002).
Furthermore, reduced tillage has a variable influence on K(h) (Strudley et al., 2008). On the one
hand, tillage increases soil macroporosity, which temporally enhances K(h) (Coquet et al., 2005;
Lampurlanés and Cantero-Martínez, 2006; Moret and Arrue, 2007), but tillage also destroys
biological macropores created during the cropping period that precedes it (Shipitalo and Protz,
1987; Bottinelli et al., chapter 4). On the other hand, a greater bulk density in the untilled layer
may be counterbalanced by an increase in biological macroporosity and pore continuity (Ehlers,
1975; Tebrügge and Düring, 1999; Capowiez et al., 2009b).
Previous investigations have found that incorporating manure increases SOM and
aggregation (Whalen and Chang, 2002), earthworm communities (Riley et al., 2008), the total
porosity (Haynes and Naidu, 1998; Celik et al., 2004; Zhang et al., 2006) and the macroporosity of
the soil (Marinari et al., 2000; Miller et al., 2002; Pagliai et al., 2004). The magnitude of this effect
may depend on the rate applied (Miller et al., 2002; Celik et al., 2004). Surprisingly, the effect of
manure fertilization on K(h) has been little studied and the results of this treatment have not been
uniform. For example, Miller et al. (2002) showed that manure amendment increased hydraulic
conductivity to saturation in comparison to mineral fertilization but did not affect K(h) because
small macroporosity was not influenced by manure amendment. In other studies, the K(h) values
observed were similar (Schjønning et al., 2005) or lower (Zhang et al., 2006) when manure
fertilization was used in comparison to mineral fertilization. Zhang et al. (2006) hypothesized that
the decomposition of manure may clog the pores, which can lead to a decrease in pore
connectivity.
It is clear that tillage and manure application both influence soil porosity, but the effects of
these factors on K(h) remains unclear. Furthermore, to our knowledge, there are no published
studies examining the interactive effect of reduced tillage with manure application on K(h). These
practices need to be investigated together because crop production systems involve the
simultaneous selection of tillage and fertilizer sources. Hence, the objectives of this study were as
follows: (i) to evaluate the effects of eight years of combined reduced tillage practices and manure
fertilization on soil macroporosity and K(h); and (ii) to study the temporal variation of K(h) due to
changes in soil macroporosity. This study investigated the effects of three tillage treatments

Chapitre 7
96
combined with two types of fertilization. K(h) and soil macroporosity were measured in wheat and
maize crops.
2. Materials and methods
2.1. Study site, tillage and fertilization practices
The study was conducted on wheat and maize crops between 2006 and 2008 at the
Kerguéhennec Experimental Station (N 47°53, W 02°44) in Brittany (France). The climate of this
region is oceanic with an average annual temperature of 10.8°C and an average precipitation of
1060 mm (Fig. 1). The soil, derived from mica schist, is a Humic Cambisol (FAO) with a loamy
texture (17% clay, 42% silt, 41% sand), an organic carbon content of 21 g kg-1, a pH(H20) of 6
and a CEC value of 10 meq/100 g in the upper 25 cm. The experiment was established in 2000 as
a split-plot design with three replicates using tillage practices as the main plots and fertilization as
the subplots. Each treatment plot was 25 m by 12 m. The crop rotation was wheat-maize-wheat-
rape. Three tillage treatments were studied: (i) moldboard plowing (MP, at a depth of 25 cm and
rotary harrowing at a depth of 7 cm before sowing); (ii) surface tillage (ST, with chisel plowing at a
depth of 12 cm under Wheat crop and followed by a rotary harrowing at a depth of 7 cm under
maize crop) and (iii) no-tillage (NT). These tillage treatments were combined with two fertilizers
sources: (i) mineral fertilization; and (ii) poultry manure, which were applied each year at a rate of
4-17 Mg ha-1 year-1 calculated using nitrogen fertilization. From 2000 to 2007, a cumulative total of
18 Mg of carbon ha-1 was provided by poultry manure fertilization. In April 2007, measurements of
soil organic carbon (C) with a CHN analyzer showed that NT and ST had the highest values
compared to MP (23.6, 23.2 vs. 19.8 g kg-1) while soil organic C was not significantly affected by
the fertilization (23 vs. 21.5 g kg-1 using poultry manure and mineral fertilization, respectively).
Fig.1: Daily rainfall (white histogram) and monthly temperatures (black line) at the experimental
site during the study period. The solid arrows indicate the different technical (tillage, fertilizer
application and harvest) events that took place. The empty arrows indicate the sampling dates.
Rai
nfa
ll (m
m)
Tem
per
ature
(°C
)
0
2
4
6
8
10
12
14
16
18
0
10
20
30
40
50
60
OCT-06 NOV-06 DEC-06 JAN-07 APR-07 MAY-07 JUN-07 JUL-07 FEB-07 MAR-07 MAY-08
Autumn Winter Summer Spring Spring
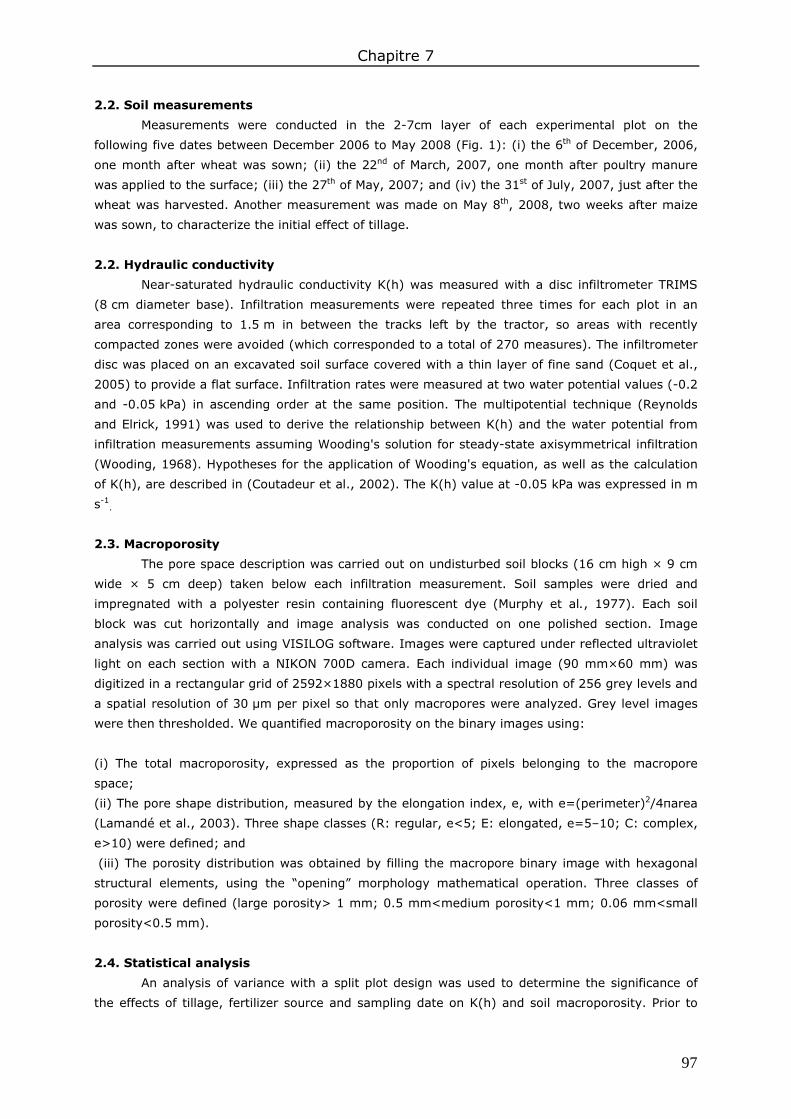
Chapitre 7
97
2.2. Soil measurements
Measurements were conducted in the 2-7cm layer of each experimental plot on the
following five dates between December 2006 to May 2008 (Fig. 1): (i) the 6th of December, 2006,
one month after wheat was sown; (ii) the 22nd of March, 2007, one month after poultry manure
was applied to the surface; (iii) the 27th of May, 2007; and (iv) the 31st of July, 2007, just after the
wheat was harvested. Another measurement was made on May 8th, 2008, two weeks after maize
was sown, to characterize the initial effect of tillage.
2.2. Hydraulic conductivity
Near-saturated hydraulic conductivity K(h) was measured with a disc infiltrometer TRIMS
(8 cm diameter base). Infiltration measurements were repeated three times for each plot in an
area corresponding to 1.5 m in between the tracks left by the tractor, so areas with recently
compacted zones were avoided (which corresponded to a total of 270 measures). The infiltrometer
disc was placed on an excavated soil surface covered with a thin layer of fine sand (Coquet et al.,
2005) to provide a flat surface. Infiltration rates were measured at two water potential values (-0.2
and -0.05 kPa) in ascending order at the same position. The multipotential technique (Reynolds
and Elrick, 1991) was used to derive the relationship between K(h) and the water potential from
infiltration measurements assuming Wooding's solution for steady-state axisymmetrical infiltration
(Wooding, 1968). Hypotheses for the application of Wooding's equation, as well as the calculation
of K(h), are described in (Coutadeur et al., 2002). The K(h) value at -0.05 kPa was expressed in m
s-1.
2.3. Macroporosity
The pore space description was carried out on undisturbed soil blocks (16 cm high × 9 cm
wide × 5 cm deep) taken below each infiltration measurement. Soil samples were dried and
impregnated with a polyester resin containing fluorescent dye (Murphy et al., 1977). Each soil
block was cut horizontally and image analysis was conducted on one polished section. Image
analysis was carried out using VISILOG software. Images were captured under reflected ultraviolet
light on each section with a NIKON 700D camera. Each individual image (90 mm×60 mm) was
digitized in a rectangular grid of 2592×1880 pixels with a spectral resolution of 256 grey levels and
a spatial resolution of 30 µm per pixel so that only macropores were analyzed. Grey level images
were then thresholded. We quantified macroporosity on the binary images using:
(i) The total macroporosity, expressed as the proportion of pixels belonging to the macropore
space;
(ii) The pore shape distribution, measured by the elongation index, e, with e=(perimeter)2/4πarea
(Lamandé et al., 2003). Three shape classes (R: regular, e<5; E: elongated, e=5–10; C: complex,
e>10) were defined; and
(iii) The porosity distribution was obtained by filling the macropore binary image with hexagonal
structural elements, using the “opening” morphology mathematical operation. Three classes of
porosity were defined (large porosity> 1 mm; 0.5 mm<medium porosity<1 mm; 0.06 mm<small
porosity<0.5 mm).
2.4. Statistical analysis
An analysis of variance with a split plot design was used to determine the significance of
the effects of tillage, fertilizer source and sampling date on K(h) and soil macroporosity. Prior to

Chapitre 7
98
analyses, the data were tested for homogeneity of variance using the Levene’s test and were log-
transformed when necessary. When the effects were found to be significant at a level of 0.05,
means were compared using an LSD test. Pearson’s correlations were made between soil porosity
and hydraulic conductivity within tillage treatments. All statistical calculations were carried out
using R software (R Development Core Team, 2008).
3. Results
3.1. Total soil macroporosity
Total soil macroporosity was affected by the interaction between tillage and date (Table 1,
p<0.01). During the entire growing season, MP and ST showed the highest macroporosity
compared to NT (Fig. 2 and Fig. 3), which corresponded on average to values of 18.1, 15.9 and
8.8% in the soil thin section for ST, MP and NT, respectively (Table 2).
Source of variation
Macro-porosity
Pore shape Porosity size K(h)
Regular Elongated Complex Small Medium Large
Tillage (T) <0.01 <0.01 <0.01 <0.01 <0.01 <0..01 <0.05 <0.01 Fertilization (F) 0.92 0.57 0.84 0.82 0.7 0.84 0.79 0.26 Date (D) <0.001 <0.001 0.23 <0.001 <0.001 <0.001 <0.001 <0.001 T * F 0.73 0.26 0.67 0.87 0.36 0.88 0.88 0.52 T * D <0.01 <0.001 0.26 <0.001 <0.001 <0.001 <0.01 0.33 F * D 0.24 0.18 0.1 0.15 0.07 <0.05 <0.05 0.33 T * F * D 0.52 0.98 0.17 0.5 0.92 0.4 0.09 0.86
Table 1: Analysis of variance (P-value) to determine the effects of tillage (T), fertilization (F) and
sampling date (D) on the total macroporosity, pore shape, porosity size and hydraulic conductivity
at -0.05 kPa, K(h) in the soil.
Source of variation
Macro-porosity
(%)
Pore shape (%) Porosity size (%) K(h) (10-6 m s-1)
Regular Elongated Complex Small Medium Large
Tillage factor MP 15.9b 4.4a 3.3a 8.2b 8.4a 3.6a 4.1b 26b ST 18.1a 4.7a 3.1a 10.3a 8.3a 3.8a 6.1a 37a NT 8.8c 2.9b 2.3b 3.6c 4.9b 1.3b 2.5c 12c Fertilization factor M 14.2a 4a 2.9a 7.3a 7.2a 2.9a 4.1a 26a O 14.2a 4a 2.8a 7.5a 7.2a 2.8a 4.3a 23a
Table 2: Effects of tillage and fertilization on the total macroporosity, pore shape, porosity size and
hydraulic conductivity at -0.05 kPa, K(h) in the soil. MP: moldboard plowing, ST: surface tillage and
NT: no-tillage. M: mineral and O: poultry manure. The means listed in a column within each factor
accompanied by the same letter are not significantly different according to our LSD test.
The macroporosity under MP and ST increased from March to May-07 (from 15 to 20%),
decreased in July (to 17%) and increased again in May-08 (to 23%; Fig. 2 and Fig. 3). Under NT,
no significant temporal variation was observed. Therefore, the differences in macroporosity

Chapitre 7
99
between NT and the tilled plots were the highest in May-07 and in May-08. The soil macroporosity
was not affected by the fertilization factor (Table 1 and Table 2).
Fig. 2: Effect of tillage and sampling date on the total macroporosity averaged fertilization
treatments. MP: moldboard plowing; ST: surface tillage; and NT: no-tillage. The bar represents the
LSD (0.05) for tillage treatment comparisons within the sampling date.
Fig. 3: Macroporosity of horizontally-oriented thin sections collected between December, 2006 and
May, 2008. MP: moldboard plowing; ST: surface tillage; and NT: no-tillage.
MP
ST
NT
December May-07 July May-08
8 mm
0
5
10
15
20
25
30
DEC FEB APR JUN AUG-07 MAY-08
Tota
l M
acro
poro
sity
(%
)
MP
ST
NT
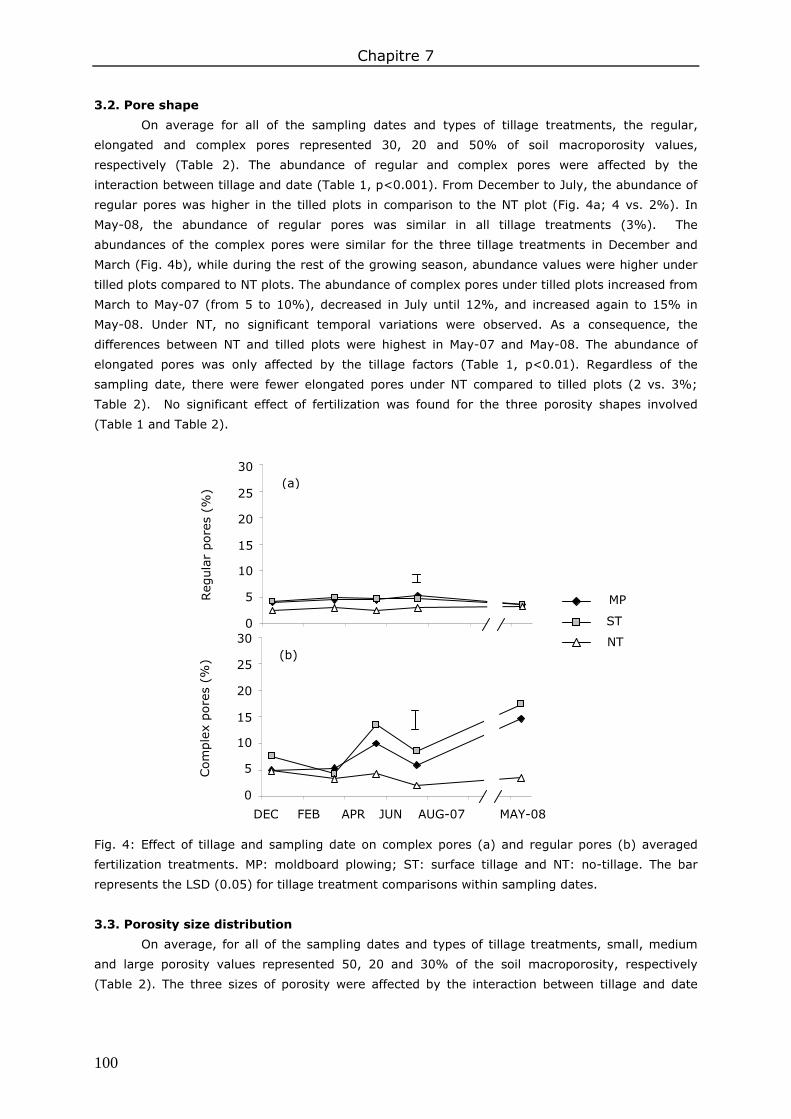
Chapitre 7
100
3.2. Pore shape
On average for all of the sampling dates and types of tillage treatments, the regular,
elongated and complex pores represented 30, 20 and 50% of soil macroporosity values,
respectively (Table 2). The abundance of regular and complex pores were affected by the
interaction between tillage and date (Table 1, p<0.001). From December to July, the abundance of
regular pores was higher in the tilled plots in comparison to the NT plot (Fig. 4a; 4 vs. 2%). In
May-08, the abundance of regular pores was similar in all tillage treatments (3%). The
abundances of the complex pores were similar for the three tillage treatments in December and
March (Fig. 4b), while during the rest of the growing season, abundance values were higher under
tilled plots compared to NT plots. The abundance of complex pores under tilled plots increased from
March to May-07 (from 5 to 10%), decreased in July until 12%, and increased again to 15% in
May-08. Under NT, no significant temporal variations were observed. As a consequence, the
differences between NT and tilled plots were highest in May-07 and May-08. The abundance of
elongated pores was only affected by the tillage factors (Table 1, p<0.01). Regardless of the
sampling date, there were fewer elongated pores under NT compared to tilled plots (2 vs. 3%;
Table 2). No significant effect of fertilization was found for the three porosity shapes involved
(Table 1 and Table 2).
Fig. 4: Effect of tillage and sampling date on complex pores (a) and regular pores (b) averaged
fertilization treatments. MP: moldboard plowing; ST: surface tillage and NT: no-tillage. The bar
represents the LSD (0.05) for tillage treatment comparisons within sampling dates.
3.3. Porosity size distribution
On average, for all of the sampling dates and types of tillage treatments, small, medium
and large porosity values represented 50, 20 and 30% of the soil macroporosity, respectively
(Table 2). The three sizes of porosity were affected by the interaction between tillage and date
Com
ple
x pore
s (%
)
Reg
ula
r pore
s (%
)
MP
ST
NT
DEC FEB APR JUN AUG-07 MAY-08
(b)
(a)
0
5
10
15
20
25
30
0
5
10
15
20
25
30

Chapitre 7
101
(Table 1). The variations in the small and medium porosity values between tillage treatments were
similar (Fig. 5a, 5b).
Fig. 5: Effect of tillage and sampling date on small pores (a), medium pores (b) and large pores (c)
averaged by fertilization treatment. MP: moldboard plowing; ST: surface tillage and NT: no-tillage.
The bar represents the LSD (0.05) for tillage treatment comparisons within sampling dates.
During the entire growing season, both porosity values were higher under tilled plots
compared to the NT plots except in December, whereas the medium porosity values under MP and
NT were not significantly different. No significant temporal variation was found under NT, while in
tilled plots, the abundance of the two types of porosity evolved in shape of saw tooth, similar to the
variation observed for complex pores. As a consequence, the differences in the abundance of both
types of porosity between NT and tilled plots were highest in May-07 and May-08. The large
porosity type was most abundant under ST, lowest under NT and intermediate under MP for all
sampling dates except for those in December, where MP and NT were not significantly different
0
4
8
12
16
20
Sm
all poro
sity
(%
)
MP
ST
NT
0
4
8
12
16
20
Med
ium
poro
sity
(%
)
(b)
0
4
8
12
16
20
DEC FEB APR JUN AUG-07 MAY-08
(c)
Lar
ge
poro
sity
(%
) (a)
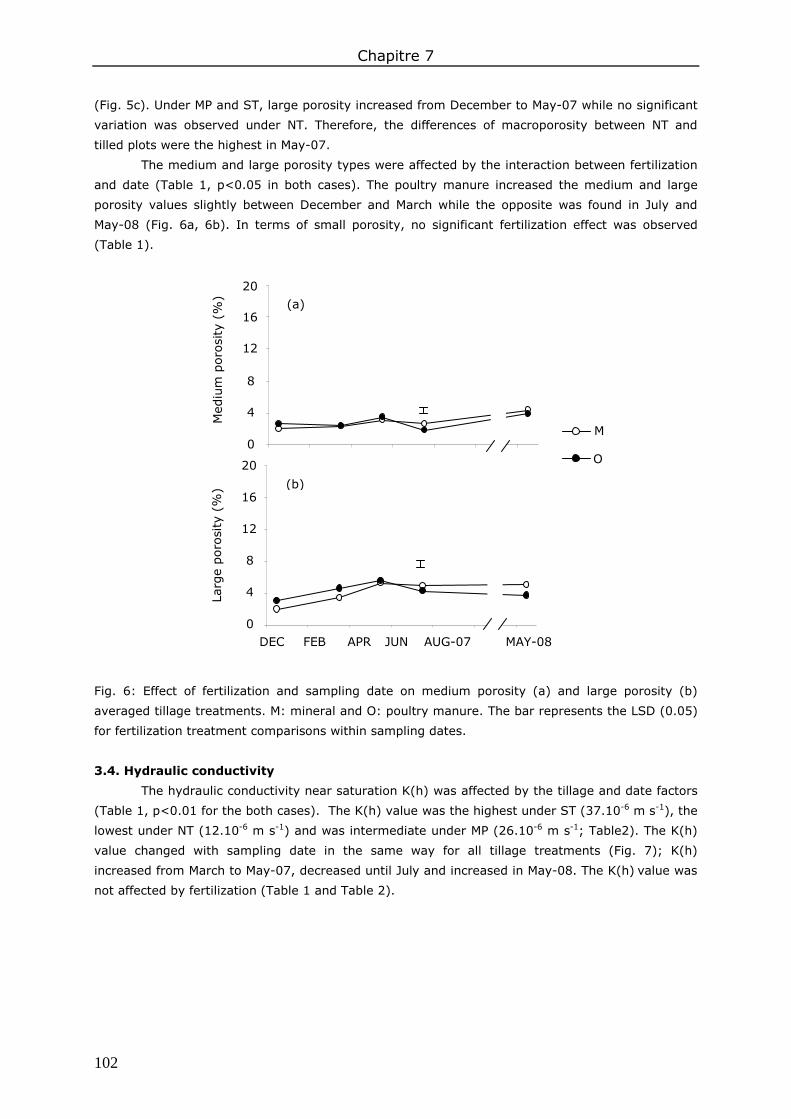
Chapitre 7
102
(Fig. 5c). Under MP and ST, large porosity increased from December to May-07 while no significant
variation was observed under NT. Therefore, the differences of macroporosity between NT and
tilled plots were the highest in May-07.
The medium and large porosity types were affected by the interaction between fertilization
and date (Table 1, p<0.05 in both cases). The poultry manure increased the medium and large
porosity values slightly between December and March while the opposite was found in July and
May-08 (Fig. 6a, 6b). In terms of small porosity, no significant fertilization effect was observed
(Table 1).
Fig. 6: Effect of fertilization and sampling date on medium porosity (a) and large porosity (b)
averaged tillage treatments. M: mineral and O: poultry manure. The bar represents the LSD (0.05)
for fertilization treatment comparisons within sampling dates.
3.4. Hydraulic conductivity
The hydraulic conductivity near saturation K(h) was affected by the tillage and date factors
(Table 1, p<0.01 for the both cases). The K(h) value was the highest under ST (37.10-6 m s-1), the
lowest under NT (12.10-6 m s-1) and was intermediate under MP (26.10-6 m s-1; Table2). The K(h)
value changed with sampling date in the same way for all tillage treatments (Fig. 7); K(h)
increased from March to May-07, decreased until July and increased in May-08. The K(h) value was
not affected by fertilization (Table 1 and Table 2).
M
O 0
4
8
12
16
20 (a)
DEC FEB APR JUN AUG-07 MAY-08
Lar
ge
poro
sity
(%
)
0
4
8
12
16
20
(b)
Med
ium
poro
sity
(%
)
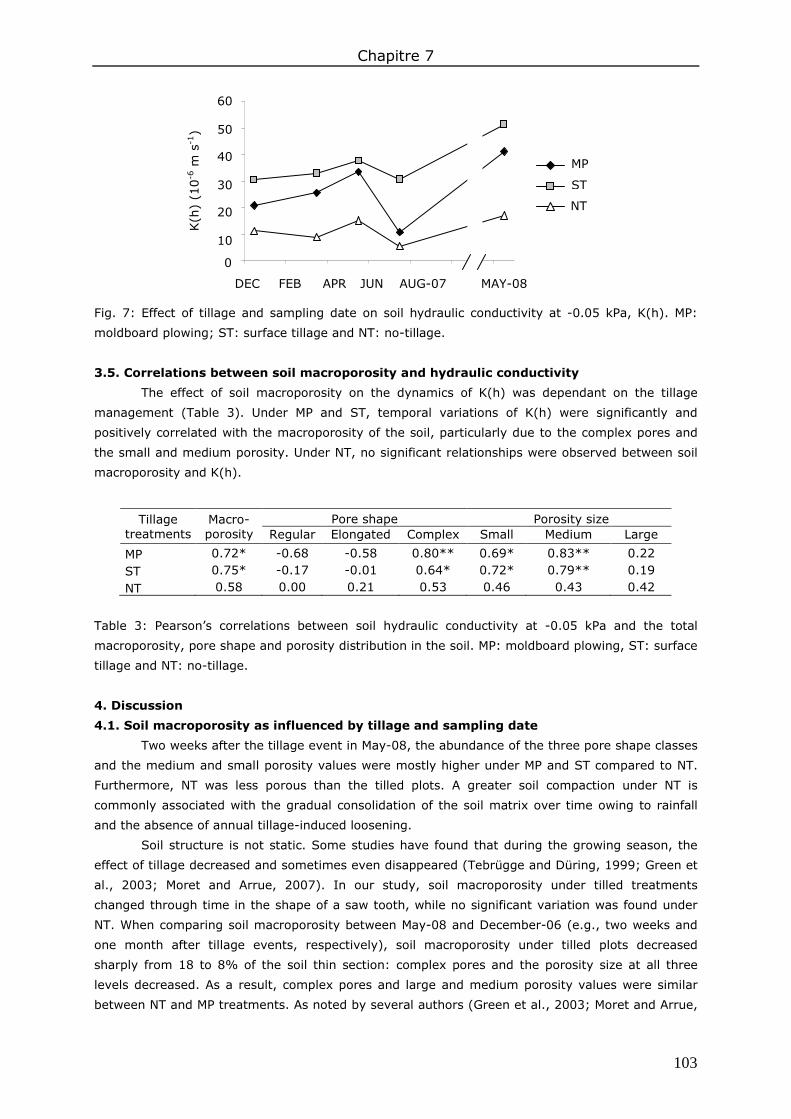
Chapitre 7
103
Fig. 7: Effect of tillage and sampling date on soil hydraulic conductivity at -0.05 kPa, K(h). MP:
moldboard plowing; ST: surface tillage and NT: no-tillage.
3.5. Correlations between soil macroporosity and hydraulic conductivity
The effect of soil macroporosity on the dynamics of K(h) was dependant on the tillage
management (Table 3). Under MP and ST, temporal variations of K(h) were significantly and
positively correlated with the macroporosity of the soil, particularly due to the complex pores and
the small and medium porosity. Under NT, no significant relationships were observed between soil
macroporosity and K(h).
Tillage treatments
Macro-porosity
Pore shape Porosity size Regular Elongated Complex Small Medium Large
MP 0.72* -0.68 -0.58 0.80** 0.69* 0.83** 0.22 ST 0.75* -0.17 -0.01 0.64* 0.72* 0.79** 0.19
NT 0.58 0.00 0.21 0.53 0.46 0.43 0.42
Table 3: Pearson’s correlations between soil hydraulic conductivity at -0.05 kPa and the total
macroporosity, pore shape and porosity distribution in the soil. MP: moldboard plowing, ST: surface
tillage and NT: no-tillage.
4. Discussion
4.1. Soil macroporosity as influenced by tillage and sampling date
Two weeks after the tillage event in May-08, the abundance of the three pore shape classes
and the medium and small porosity values were mostly higher under MP and ST compared to NT.
Furthermore, NT was less porous than the tilled plots. A greater soil compaction under NT is
commonly associated with the gradual consolidation of the soil matrix over time owing to rainfall
and the absence of annual tillage-induced loosening.
Soil structure is not static. Some studies have found that during the growing season, the
effect of tillage decreased and sometimes even disappeared (Tebrügge and Düring, 1999; Green et
al., 2003; Moret and Arrue, 2007). In our study, soil macroporosity under tilled treatments
changed through time in the shape of a saw tooth, while no significant variation was found under
NT. When comparing soil macroporosity between May-08 and December-06 (e.g., two weeks and
one month after tillage events, respectively), soil macroporosity under tilled plots decreased
sharply from 18 to 8% of the soil thin section: complex pores and the porosity size at all three
levels decreased. As a result, complex pores and large and medium porosity values were similar
between NT and MP treatments. As noted by several authors (Green et al., 2003; Moret and Arrue,
DEC FEB APR JUN AUG-07 MAY-08
K(h
) (1
0-6
m s
-1)
0
10
20
30
40
50
60 MP
ST
NT
Chapitre 7
104
2007), soil reconsolidation occurs shortly after tillage events due to the low stability of pore
systems against high cumulative effective rainfall (141 mm, effective rainfall is defined here as
rainfall of > 10 mm day-1; Fig. 1) and associated wetting and drying cycles (Green et al., 2003).
Hence, after a few weeks, the benefits in terms of soil porosity that were gained by tillage were
weak. From December to March, no significant temporal variation in soil macroporosity was
observed, which confirms that the main compaction period occurred shortly after the tillage event
followed by a wet period with high rainfall.
From March to July, soil macroporosity increased and decreased successively. The complex
pores and the three porosity size followed this temporal variation. Since the soil contained a small
amount of clay (17%), the shrinkage and swelling of clay could not support this temporal variation.
Bottinelli et al. (chapter 4) found a significant temporal variation in earthworm biostructures in the
same experimental site during the same wheat growing season as follows: (i) belowground
earthworm casts increased from March to May-07 and decreased until July in the three tillage
treatments; and (ii) earthworm burrows increased significantly from March to July in tilled plots. In
light of these results, we postulate that the significant variation in macroporosity at the end of the
wheat growing season under tilled plots was due to earthworm activity along with the concomitant
effects of a high cumulative effective rainfall (80 mm) from May-07 to July (Fig. 1). In addition, our
results suggest that the short-term earthworm activity did not influence either the soil
macroporosity or the size and shape of the porosity under NT. We suggest that more porous soil is
the more is the impact of earthworm on soil macroporosity (size and shape) is important.
4.2. Soil macroporosity as influenced by fertilization
It is widely recognized that the application of organic materials to the soil increases soil
porosity by increasing SOM, aggregation and biological activity (Haynes and Naidu, 1998;
Shepherd et al., 2002). In our study, total soil macroporosity and the three shape classes of
porosity were not affected by fertilization. In terms of the porosity size, the large and the medium
pores were affected by manure fertilization and sampling date but the effect was poor. There is
little available data in the literature concerning the impact of manure fertilization on soil
macroporosity, and are inconsistent. Miller et al. (2002) reported an increased volume of pores >
1120 µm after manure fertilization but only at high rates of manure application. Schjønning et al.
(2005) found no significant effect of manure application on soil macroporosity at the agronomic
dose. In the present study, we assumed that minimal effects of poultry manure on soil
macroporosity could have been due to the relatively small amount of poultry manure that was
used. The quantity of poultry manure was equivalent to the agronomic dose or 4-17 Mg ha-1 year-1,
resulting in an average input of C to the soil of 2 Mg C ha-1 year-1 which may not have been
sufficient to result in increases in macroporosity against a relatively high soil organic C background
level (on average 22 g kg-1).
4.3. Consequence of management practices on K(h)
The K(h) values were constantly highest under ST, lowest under NT and intermediate under
MP treatments. Soil conditions were less favorable to water movement in NT in comparison to ST
and MP treatments. These findings are similar to those observed in other studies (Sasal et al.,
2006; Carof et al., 2007). In addition, differences between tillage treatments appeared to be most
important in May-08 (e.g., two weeks after tillage events) and lowest in December (e.g., one
month after tillage events) and July when soil consolidation occurred. Our results were in
agreement with the macroporosity measurements. Hence, the change in macroporosity values

Chapitre 7
105
along the three tillage treatments appeared to be one of the main factors explaining the K(h)
values.
The K(h) values observed under the three tillage treatments followed the same seasonal
variation with a decrease in autumn (observed by comparing values from May-08 with those from
December-06), followed by an increase in spring and a decrease in summer. The temporal
variation in K(h) under tilled treatments was related to the dynamics of complex pores and the
medium and small porosity which were attributed to tillage implementations, rainfall events and
earthworm activity. Under NT, the temporal variation of K(h) was not a result of the change in the
shape and size of macroporosity because no significant temporal variation was observed in the
macroporosity. The connectivity of porosity is likely the main factor to be considered. Hence, we
postulate that earthworm casting under NT alters in part the temporal variation of K(h) by
changing the connectivity of the porosity.
Since almost no change in macroporosity was found when manure fertilization was applied,
we did not observe any change in K(h) under manure fertilization. Our results are in agreement
with research by Miller et al. (2002) and Schjønning et al. (2002), which did not find any effect of
manure fertilization on K(h).
5. Conclusions
The main result of this study was that eight years of contrasting tillage practices had a
strong impact on soil macroporosity and K(h), while poultry manure application at agronomic rates
did not. On average, for all sampling dates, the total soil macroporosity and the shape and size of
the porosity were the highest under ST and MP in comparison to NT. Differences between tilled and
no-tilled treatments were highest two weeks after sowing maize and lowest four weeks after
sowing wheat. As a result, K(h) was ranked as follows: ST>MP>NT during all dates of sampling.
The second main result was that K(h) showed a large intra-annual variability, decreasing
shortly after tillage under tilled treatments, followed by an increase in the spring and a decrease in
the summer for the three tillage treatments. Part of this variation was related to rainfall events and
earthworm activity which alter the shape and the size of the macroporosity under till treatments
and the connectivity of the porosity under NT.
Acknowledgements
We thank M. La Coadou for his help with measurements and are grateful to A. Cottais, P.
Cotinet and D. Heddadj, who allowed us to work at the experimental site at Kerguéhennec (CRAB).
This project was financially supported by the Brittany region (project PRIR).


Discussion générale


109
Discussion générale
L’objectif de ce travail était d’évaluer l’impact de pratiques culturales combinant le non
labour et l’apport d’effluent sur les propriétés physiques du sol, en analysant le rôle de l’activité
lombricienne. Cette discussion générale est organisée en 5 parties. Les 4 premières parties
reprennent les 4 questions posées en fin de chapitre 1, en cherchant à croiser les résultats
obtenus. Dans une cinquième partie, nous proposerons des scénarios d’évolution de la couche de
surface selon les pratiques culturales : comment ces pratiques ont-elles permis au sol d’acquérir
ses propriétés physiques ?
1. Comment quantifier les biostructures lombriciennes dans le sol ?
Un défi de ce travail a été de pouvoir évaluer les biostructures lombriciennes présentes
dans le sol : le peu de méthodes existantes sont longues à mettre en œuvre, ne sont pas
normalisées et sont généralement dépendantes du type de sol. Dans notre site d’étude les
déjections et galeries se distinguaient facilement du sol environnant principalement par leur forme
et taille : les déjections sont des boulettes de 1 à 2 mm, généralement assemblées à plusieurs
dans les vides du sol (galeries ou autres vides). Lorsque ces boulettes sont jeunes, elles forment
une porosité d’assemblage lâche mamelonnée. Puis au cours de leur dégradation, ces déjections
fusionnent entre elles puis avec la matrice du sol, créant ainsi une porosité très caractéristique en
forme de croissant ; à ce stade il n’est pas possible visuellement de délimiter les déjections de la
matrice du sol. Concernant les galeries, elles constituent une porosité circulaire ou ovale plus ou
moins étirée selon le plan d’observation (pores ronds et pores allongés).
Nous avons testé différentes méthodes de quantification des biostructures basées sur des
critères de taille et de forme. Les déjections, lorsqu’elles sont fraîches ou peu coalescentes,
peuvent être quantifiées par comptage manuel à l’échelle du cylindre de sol (grossissement × 2)
ou de la lame de sol (grossissement × 5). Ces deux méthodes permettent de mettre en évidence
l’effet du travail du sol : un nombre plus important de déjections est observé sous semis direct
comparé au labour ou au travail superficiel. L’inconvénient majeur de ces deux méthodes est qu’il
est impossible d’estimer l’abondance totale des déjections, puisqu’elles sont en majorité très
coalescentes et qu’il n’est alors plus possible de les distinguer de la matrice du sol. Par conséquent
les valeurs obtenues sont à discuter avec précaution : ce type de mesure peut être un indicateur
de l’activité des lombriciens, mais peut difficilement être proposé pour une quantification absolue
de l’abondance totale des déjections dans le sol.
Pour contourner ce problème nous nous sommes intéressés à la phase porale du sol. Nous
avons créé un modèle typologique basé sur deux indices de formes. Ce modèle ne nous a pas
permis de quantifier correctement la porosité entre les déjections fraîches, en raison de la forte
ressemblance de celle-ci avec la porosité d’assemblage créée par les outils de travail du sol.
Vandenbygaart et al. (2000) avaient pourtant montré qu’il était possible de quantifier
automatiquement ce type de porosité à partir de critères de forme, mais ils n’avaient pas introduit
dans leur modèle des pores contrôles comme nous l’avons fait. Notre modèle nous a permis par
ailleurs d’identifier de façon satisfaisante la porosité agencée par les déjections coalescentes. Ce
type de porosité était en moyenne 3 fois plus important sous semis direct que dans les horizons
travaillés. Il est donc possible d’identifier de façon automatique l’effet du travail du sol sur l’activité
des lombriciens sans quelconque biais de l’expérimentateur. Concernant les galeries, le modèle
typologique n’a pas permis de les quantifier correctement en raison d’une variabilité importante de

Discussion générale
110
ce type de structure : les galeries sont très souvent colonisées par des racines et traversées par de
grandes fissures de formes variables. De nombreux auteurs assimilent aux galeries lombriciennes
les pores arrondis, reconnus par un faible indice d’élongation (Shipitalo and Protz, 1987;
Vandenbygaart et al., 1999b). On peut supposer alors, que dans un grand nombre de cas, celles-ci
sont sous-estimées. Dans notre étude, les galeries ont donc été quantifiées manuellement.
Au final, la question méthodologique apparaît plus importante que la littérature peut le
laisser supposer. Nous ne disposons pas aujourd’hui d’une méthode unique pour quantifier
l’ensemble des biostructures, mais la combinaison de différentes méthodes morphologiques,
automatiques ou non, peut fournir un panel d’indicateurs pour caractériser ces biostructures.
2. Quel est l’impact des pratiques culturales sur l’abondance de ces biostructures ?
Les différents indicateurs de l’activité lombricienne retenus étaient l’abondance des
déjections fraîches, la porosité agencée entre les déjections coalescentes, et l’abondance des
galeries. Ces indicateurs ont été mesurés au cours d’une année culturale dans les 3 modalités de
travail du sol et les 2 types de fertilisation.
Concernant l’activité des lombriciens mesurée par les déjections et la porosité associée : le
semis direct apparaît plus bioturbé que les sols travaillés. Nos résultats rejoignent ceux de
Vandenbygaart et al. (2000), qui estimaient que le nombre de pores agencés par les déjections
étaient deux fois plus importants en semis direct qu’en labour. Différentes raisons peuvent être
avancées : (i) la structure compacte du semis direct contraint les lombriciens à ingérer le sol pour
pouvoir se déplacer (Whalley et al., 1995); (ii) les déjections ne sont pas détruites sous semis
direct du fait de l’absence de travail du sol. Nous pouvons nous étonner des faibles quantités de
déjections mesurées ; leur superficie sur les lames de sol représentait en moyenne 2% et 1%
respectivement en semis direct, et en labour et travail superficiel. Ces valeurs ne reflètent pas,
bien entendu, l’ensemble des déjections du sol mais seulement une petite partie. Nous avons
également mis en évidence que l’abondance des déjections et de la porosité associée évoluaient au
cours de l’année culturale : elles diminuent en hiver, augmentent au printemps puis diminuent de
nouveau en été, pour toutes les modalités de travail du sol. Les périodes hivernales et estivales
correspondent à des périodes de dégradations et/ou d’inactivité physiologique des vers, alors que
la période printanière correspond à une période de production de déjections et/ou de moins forte
dégradation. Ces résultats concordent avec les périodes d’activité physiologique des vers de terre
observées en milieu tempéré par Bouché (1977). Ces résultats suggèrent que les déjections, et par
conséquent la porosité d’assemblage entre elles, évoluent à très court terme.
Concernant l’activité des lombriciens mesurée par l’abondance des galeries : le semis direct
est plus bioturbé que les sols travaillés, mais seulement juste après le travail du sol. Sous labour,
le travail du sol provoque la destruction de toutes les galeries existantes, mais celles-ci sont
rapidement recréées par l’activité des lombriciens tout au long de l’année culturale, tandis qu’en
semis direct, les galeries n’évoluent pas. Nos résultats ne sont pas complètement en accord avec la
littérature qui présente généralement un nombre ou un volume de galeries plus importants sous
semis direct que dans les horizons travaillés (Ehlers, 1975; Tebrügge and Düring, 1999; McGarry
et al., 2000; Wuest, 2001). Cependant, dans ces travaux, les galeries ne sont quantifiées qu’à une
seule date et généralement pas en fin d’année culturale. Le nombre de galeries mesuré varie de 0
à 2% selon les modalités et la date de mesure. Ces valeurs sont difficilement comparables avec la
littérature car celles-ci ne sont jamais exprimées en terme de surface.
Concernant l’évolution temporelle des galeries, nous disposons au même titre que les
déjections de peu de travaux. Citons les travaux de Kretzschmar (1982) et de Ligthart (1997) qui
Discussion générale
111
ont montré en prairie tempérée de fortes dynamiques des galeries, dues principalement au
remplissage de celles-ci par les déjections à certaines périodes de l’année. Différentes raisons
peuvent être avancées pour expliquer les dynamiques des galeries dans notre site expérimental :
(i) la densité apparente plus faible dans les sols travaillés ne réduit pas l’activité des lombriciens et
n’oblige pas ceux-ci à remplir leurs galeries de déjections, contrairement à la modalité semis
direct ; ainsi les galeries sont moins bouchées dans les horizons travaillés (Hirth et al., 1996) ; (ii)
la structure du sol dans les horizons travaillés est bien plus hétérogène qu’en semis direct et cela
peut induire une augmentation de la production de galeries comme l’ont montré les travaux de
Stovold et al. (2004) ; et (iii) sous semis direct, les lombriciens vont préférer utiliser les vides du
sol préexistants, c'est-à-dire les galeries, pour se déplacer (Felten and Emmerling, 2009). En
conséquence, moins de galeries sont produites.
Sous apport de fumier de volaille, l’abondance des galeries et des déjections augmentaient
respectivement de 15% et 20% par rapport aux modalités sous fertilisation minérale. On peut
supposer que la plus forte abondance des vers endogés est en partie responsable de cette
augmentation. On peut aussi émettre l’hypothèse que les biostructures sont plus stables sous
fertilisation organique que sous fertilisation minérale.
3. Quel est l’impact des pratiques culturales et des lombriciens sur la stabilité structurale
des agrégats du sol ?
La stabilité structurale vis-à-vis de l’eau des agrégats du sol (déjections + sol environnant)
a été mesurée au cours d’une année culturale dans les 3 modalités de travail du sol et les 2 types
de fertilisation. A une date, la stabilité structurale a également été mesurée sur les déjections
lombriciennes et sur les agrégats du sol environnant (sans trace de bioturbation) séparément.
Il est bien établi que la stabilité structurale du sol en surface augmente en non labour, car
la matière organique y est plus importante (Angers et al., 1993b). La dynamique des agrégats
étant plus faible, le non labour favorise la création de micro-agrégats stables à l’intérieur des
macro-agrégats (Six et al., 1999). Nos résultats sont en accord avec la littérature : les agrégats
sous semis direct sont enrichis en matière organique comparés à ceux présents sous labour. En
conséquence la stabilité structurale est toujours plus élevée en semis direct (1.55 mm) qu’en
labour (1.15 mm). Concernant la modalité travail superficiel, la stabilité des agrégats est soit
similaire au labour (en hiver et au début du printemps) ou similaire au semis direct (en fin de
printemps et en été). Ces résultats mettent en évidence la forte résilience de la stabilité des
agrégats sous travail superficiel en accord avec de fortes teneurs en matière organique. D’autre
part notre étude confirme la forte variabilité saisonnière de la stabilité structurale, caractérisée par
une augmentation au printemps et en été et une diminution en hiver (Chan et al., 1994;
Daraghmeh et al., 2009).
Il est généralement admis que l’apport d’effluent d’élevage est une source de matière
organique qui augmente la stabilité structurale des sols (Haynes and Naidu, 1998; Whalen et al.,
2003). Dans notre étude l’apport de fumier de volaille n’avait pas d’influence sur les teneurs en
matière organique du sol. Nous expliquons ce résultat par le fait que le sol à texture limono-
sableuse était déjà riche en carbone organique (en moyenne 22 g kg-1), et que la dose
agronomique appliquée, de 4 à 17 tonnes ha-1 an-1, n’était pas suffisante pour entraîner une
augmentation significative de la matière organique du sol. En conséquence la stabilité structurale
n’augmentait pas significativement sous apport de fumier de volaille (1.5 vs. 1.3 mm).
De nombreux auteurs s’accordent à dire que les déjections lombriciennes, lorsqu’elles sont
sèches ou âgées, contiennent plus de micro-agrégats stables que le sol environnant (Shipitalo and
Discussion générale
112
Protz, 1988; Marinissen and Dexter, 1990). Cette augmentation est souvent expliquée par un
enrichissement en matière organique (Zhang and Schrader, 1993; Flegel et al., 1998; Oyedele et
al., 2006). Dans notre étude, les plus fortes valeurs de stabilité structurale mesurées en non labour
ne sont pas expliquées par l’activité des lombriciens. En effet, quelle que soit la modalité de travail
du sol étudiée, les déjections lombriciennes présentaient la même stabilité structurale que le sol
environnant. Nous expliquons ce résultat par le fait que le sol, présentant une teneur en carbone
organique déjà proche de la saturation, n’a pas permis aux vers d’enrichir leurs déjections en
matière organique. Nos résultats sont en accord avec des études réalisées sur des sols tropicaux à
fortes teneurs en carbone organique, lesquels étaient bioturbés par des vers endogés (Barois et al.,
1999; Coq et al., 2007). Nous avons pu confirmer cette dernière hypothèse en prélevant des
déjections à 15 cm de profondeur où les teneurs en carbone organique étaient plus faibles.
4. Quel est l’impact des pratiques culturales sur la macroporosité et la perméabilité du
sol ?
Les macropores, qui régissent en grande partie la perméabilité du sol, ont été caractérisés
par analyse d’image au moyen de 3 indicateurs poraux : (i) la macroporosité totale, (ii) la
distribution de la taille de la porosité et (iii) la forme des pores. La conductivité hydraulique du sol
K(h) a été mesurée en non saturé à -0.05 kPa. Ces propriétés ont été suivies au cours d’une année
culturale sur les 3 modalités de travail du sol et les 2 modalités de fertilisation.
Il est admis que le non travail du sol compacte le sol ; à l’inverse les sols travaillés
présentent une macroporosité importante (Kay and Vandenbygaart, 2002). Nos résultats montrent
qu’en moyenne, la macroporosité totale, l’abondance des 3 formes porales et des 3 tailles de
porosité sont plus importantes dans les sols travaillés. Néanmoins, les différences entre modalités
étaient plus fortes deux semaines après le travail du sol et plus faibles un mois après le travail du
sol. Huit années de semis direct ont créé une structure à faible macroporosité, malgré une activité
lombricienne importante : le pouvoir décompactant des lombriciens n’est donc pas mis en évidence
dans ce contexte. Les valeurs de K(h) étaient les plus élevées sous travail superficiel (37.10-6 m s-
1), les plus faibles sous semis direct (12.10-6 m s-1) et intermédiaires sous labour (26.10-6 m s-1).
Ce classement correspond bien aux données de macroporosité mesurées. Deux types de
macropores peuvent être incriminés : les galeries, et les pores d’assemblage inter-agrégats.
Certains auteurs ont clairement mis en évidence que les galeries lombriciennes
participaient aux transferts hydriques en condition de saturation (Francis and Fraser, 1998;
Pitkanen and Nuutinen, 1998; Capowiez et al., 2009b). Nos mesures étant réalisées en non saturé,
il est probable que nous sous-estimions l’impact des galeries lombriciennes sur la perméabilité du
sol sous semis direct.
Nous avons également montré que la macroporosité des sols travaillés évoluait au cours de
l’année culturale. Trois principaux processus de modification de la structure du sol ont été
identifiés. Il s’agit : (i) de la fragmentation des mottes par la herse rotative, (ii) de la prise en
masse du sol sous l’effet de la pluie et (iii) de la fragmentation et l’agrégation du sol dues à
l’activité lombricienne. Ces 3 processus ont un point commun : ils concernent principalement la
macroporosité de forme complexe (pores d’assemblage inter-agrégats) et les pores de petite et
moyenne taille. Juste après le travail du sol les pores d’assemblages produits par l’outil diminuaient
sous l’action des pluies. Ces résultats confirment que la porosité créée par le travail du sol n’est
pas stable ; en conséquence les valeurs de K(h) diminuaient. La porosité d’assemblage augmentait
au printemps puis diminuait en été ; les valeurs de K(h) suivaient sensiblement cette évolution.
Nous attribuons cette dynamique de la macroporosité et des valeurs de K(h) à la production de
Discussion générale
113
déjections au printemps et à la diminution de celles-ci, associée à l’impact de la pluie, en été. Nos
résultats confirment les travaux de Lamandé et al. (2004) qui suggéraient que l’évolution de la
macroporosité d’assemblage était contrôlée en partie par les déjections lombriciennes. Sous semis
direct, la macroporosité totale, la forme et la taille de la porosité ne variaient pas significativement
au cours de l’année culturale malgré la forte variation temporelle des déjections lombriciennes.
Concernant les valeurs de K(h), celles-ci suivaient la même dynamique temporelle que les
déjections lombriciennes. Ces résultats amènent à deux conclusions importantes : (i) la production
de déjections dans le sol au cours d’une année culturale n’augmente pas la macroporosité du sol et
(ii) l’agencement de ces déjections modifie probablement la connectivité de la macroporosité,
influant alors directement sur les valeurs de K(h). Une augmentation de la connectivité de la
porosité induite par les déjections lombriciennes a également été montrée par Hallaire et al.
(2000).
L’apport de fumier de volaille n’influençait pas la macroporosité totale ni la forme de la
porosité et n’avait que peu d’effets sur la taille de la porosité. Ces résultats sont en accord avec les
effets observés sur l’agrégation des sols. En revanche ces résultats ne reflètent pas les faibles
augmentations de biostructures sous cette modalité. En conséquence les valeurs de K(h) ne sont
pas influencées par le type de fertilisation.
5. Schéma d’évolution structurale des sols selon les pratiques culturales
Au terme de cette discussion, nous sommes à même de proposer un schéma synthétique
montrant comment, selon les pratiques culturales, le sol a acquis ses propriétés physiques
(structure, perméabilité). Nous proposons ce schéma en faisant plus particulièrement appel aux
résultats obtenus sur le rôle de l’activité lombricienne.
Dans ce schéma, nous focaliserons notre analyse sur le type de travail du sol ; l’effet
apport d’effluent d’élevage n’intervient qu’en deuxième plan, à travers l’augmentation des
communautés lombriciennes (endogés). Mais, comme nous l’avons signalé plus haut, les faibles
doses apportées dans un sol déjà riche en carbone organique ne permettent pas de mettre en
évidence un effet significatif et direct sur les propriétés physiques.
Le labour conventionnel - Chaque année, au moment de l’implantation de la culture, le
sol est retourné sur les 25 premiers centimètres, puis les 5-10 premiers centimètres sont repris par
une herse rotative. Les résidus de culture et/ ou les effluents d’élevage sont incorporés dans le sol.
Après huit années de labour conventionnel, le sol présente les plus faibles valeurs de stabilité
structurale. En revanche, la macroporosité et la perméabilité du sol y sont élevées. Ces propriétés
ne sont pas statiques : elles évoluent à court terme sous l’effet du travail du sol, du climat et des
lombriciens. La stabilité structurale augmente au printemps et en été puis diminue en hiver sous
l’effet du climat. Juste après le travail du sol l’ensemble de la macroporosité est d’origine physique
(créée par les outils de travail du sol), la perméabilité du sol est à son plus haut niveau. Une prise
en masse rapide, sous l’effet de la pluie, réduit ensuite de moitié la macroporosité en l’espace d’un
mois. Puis, sous l’effet de l’activité des lombriciens, cette porosité « physique » est remplacée par
une porosité « biologique », résultant de la production de déjections ; la macroporosité augmente
ainsi au printemps, puis diminue soudainement en été. Au regard de ces variations, la perméabilité
du sol suit la même dynamique. Ces résultats mettent en évidence que la circulation de l’eau est
augmentée quand les macropores sont d’origine physique ou biologique et que, quelle que soit
l’origine de la porosité, elle fluctue rapidement.
Discussion générale
114
Le semis direct – La graine est ici semée sans travail du sol préalable. Les résidus de
culture et/ ou les effluents d’élevage sont laissés à la surface du sol. La fragmentation du sol est
alors assurée exclusivement par le climat et l’activité biologique. Huit années de semis direct ont
abouti à une augmentation significative de la stabilité structurale des agrégats du sol, mais en
revanche à une diminution sévère de la perméabilité du sol par rapport aux modalités soumises à
un travail du sol. La macroporosité est également réduite, tandis que l’activité lombricienne y est la
plus importante : on y a mesuré jusqu’à trois fois plus de déjections et deux fois plus de galeries
par rapport aux modalités travaillées. Ces résultats démontrent que l’augmentation de la
macroporosité ou de la connectivité de la macroporosité induite par l’activité lombricienne n’est pas
suffisante pour rendre le sol aussi perméable que dans les modalités travaillées. Pourtant de
nombreux auteurs montrent que les galeries agissent comme des voies préférentielles de l’eau
(Ehlers, 1975; Capowiez et al., 2009b). Dans notre étude, n’ayant pas réalisé les mesures à
saturation, il est possible que nous ayons sous-estimé l’effet des galeries. Comme sous labour, ces
propriétés sont dynamiques : la stabilité structurale augmente au printemps et en été puis diminue
en hiver sous l’effet du climat. La perméabilité du sol augmente au printemps puis diminue en été,
de la même façon que l’abondance des déjections lombriciennes : nous émettons l’hypothèse que
cette évolution de perméabilité est liée à la connectivité des pores d’assemblage entre les
déjections, qui évoluent à court terme. Par contre la macroporosité est constante au cours de
l’année culturale. Ces résultats démontrent alors que la production des déjections lombriciennes en
semis direct à l’échelle d’une année culturale ne modifie pas la macroporosité du sol. Il est ainsi
clairement démontré qu’une activité lombricienne plus importante ne suffit pas à régénérer une
structure tassée : une production intense de déjections lombriciennes, dans un milieu contraint, ne
permet pas une augmentation de la macroporosité.
Le travail superficiel – Le travail du sol est ici limité aux 15 premiers centimètres avec
un passage de chisel suivi ou non d’une une herse rotative sur les 5 à 10 premiers centimètres. Les
résidus de culture et/ ou les effluents d’élevage sont incorporés en partie dans le sol. Cette
modalité se comporte comme un labour si l’on s’intéresse à la macroporosité, à l’abondance des
biostructures ou à la perméabilité du sol, si bien que les valeurs se trouvent généralement
augmentées. Elle se comporte également comme le semis direct au regard de la matière organique
et de la stabilité structurale. L’activité lombricienne peut donc ainsi s’exprimer de façon favorable
pour les propriétés physiques du sol : la fragmentation par les lombriciens et la production de
déjections se traduisent par une amélioration de la macroporosité et de la perméabilité du sol.

Conclusion et perspectives


117
Conclusion et perspectives
L’objectif de ce travail était d’évaluer l’impact des pratiques culturales, lorsque l’on associe
le non labour et l’apport d’effluent, sur la structure et la perméabilité du sol, en estimant plus
particulièrement le rôle de l’activité lombricienne. L’étude a été réalisée sur un site expérimental en
Centre Bretagne, où sont comparées depuis 8 ans six pratiques culturales, croisant trois techniques
de travail du sol (labour conventionnel, travail superficiel, semis direct) et deux types de
fertilisation (minérale ou fumier de volaille).
Une analyse bibliographique nous a permis de repérer que la littérature est abondante,
concernant l’impact du non labour ou celui de l’apport d’effluent d’élevage sur les propriétés
physiques du sol. Par contre aucune étude à ce jour ne considère l’association des deux,
notamment sur la macroporosité et la perméabilité du sol. Ces deux pratiques doivent être
étudiées ensemble, car la production d’une culture implique nécessairement le choix du travail du
sol et du type de fertilisation. Nous avons également montré, que si les galeries lombriciennes sont
souvent invoquées pour moduler le fonctionnement hydrique des sols en non labour,
presqu’aucune étude ne concerne l’effet des déjections lombriciennes. En ingérant le sol, puis en
déposant dans le sol ses déjections, les lombriciens modifient la structure du sol et influencent les
transferts hydriques, sans que l’on sache encore bien déterminer comment cette structure se
constitue et évolue, selon les pratiques culturales. Evaluer l’impact du non labour associé à un
apport d’effluent suppose donc que l’on sache mieux estimer le rôle de cette activité lombricienne
sur le sol. Partant de ce constat, notre travail s’est articulé autour de 4 grandes questions :
- Comment quantifier les biostructures lombriciennes ?
- Quel est l’impact des pratiques culturales sur l’abondance de ces biostructures ?
- Quel est l’impact des pratiques culturales et de l’activité lombricienne sur la stabilité des
agrégats du sol ?
- Comment la macroporosité et la conductivité hydraulique du sol varient-elles selon les
pratiques culturales ?
Ces questions ont sous-tendu notre démarche et défini le plan de ce mémoire. Nous les
reprenons ici rapidement, pour en rappeler les résultats essentiels et proposer les perspectives sur
lesquelles ils débouchent.
Comment quantifier les biostructures lombriciennes ?
Ce travail confirme la difficulté de quantifier de façon précise les déjections lombriciennes
dans le sol. Nous avons proposé différents indicateurs, manuels et automatisés, lesquels lorsqu’ils
sont combinés donnent un bon aperçu de l’abondance des déjections dans le sol. Une limite
importante de ce travail et qu’il n’est pas possible aujourd’hui d’identifier qui crée ces déjections.
La spectroscopie infrarouge pourrait être utilisée dans de futures expérimentations pour répondre à
cette question.
Quel est l’impact des pratiques culturales sur l’abondance de ces biostructures ?
Nos résultats confirment que l’abondance des biostructures lombriciennes est influencée
par les pratiques culturales. Lorsque les communautés lombriciennes (endogés) sont favorisées et
que les biostructures ne sont pas détruites par le travail du sol, celles-ci sont plus importantes,
c’est le cas en semis direct ou sous apport d’effluent d’élevage. Nous ne savons pas cependant si la
bioturbation des sols a atteint aujourd’hui, après 8 années de non labour, son état d’équilibre : si
Conclusion et perspectives
118
oui depuis quand, si non dans combien de temps ? Nous proposons d’utiliser nos indicateurs sur les
lames de sols échantillonnées les années précédentes et de continuer le prélèvement de sol, tous
les 2 ans. Aujourd’hui, nous ne connaissons toujours pas la durée de vie de ces déjections dans le
sol. Nous suggérons dans ce travail que les déjections fraîches se transforment vite en déjections
coalescentes. Aussi, à partir de quand une ancienne déjection ne doit-elle plus être considérée
comme une biostructure, mais comme un élément de la matrice du sol ? Une meilleure
quantification de la dynamique de ces biostructures dans le sol est un véritable défi et apparaît
nécessaire pour évaluer l’effet des lombriciens sur la macroporosité du sol, notamment sous semis
direct. Pour répondre à cette question, nous proposons une expérimentation de terrain au cours de
laquelle des assemblages de déjections pourront être insérés dans le sol, puis récoltés à différents
pas de temps et caractérisés par analyse d’image.
Quel est l’impact des pratiques culturales et de l’activité lombricienne sur la stabilité des
agrégats du sol ?
Les plus fortes valeurs de stabilité structurale observées en non labour sont dues à
l’accumulation de matière organique du sol et non à l’activité lombricienne. L’apport d’effluent
d’élevage n’avait pas d’effet significatif sur la stabilité structurale. Nous avons également mis en
évidence la forte dynamique saisonnière de la stabilité structurale, confirmant ainsi la nécessité
d’évaluer cette propriété du sol à différentes dates d’échantillonnage.
Comment la macroporosité et la conductivité hydraulique du sol varient-elles selon les
pratiques culturales ?
La pratique du semis direct compacte le sol et diminue la perméabilité du sol. Une plus
forte activité lombricienne sous cette modalité ne permet pas d’atteindre des propriétés physiques
équivalentes aux sols travaillés. En travail superficiel les valeurs de macroporosité tendent à être
plus importantes qu’en labour conventionnel. La perméabilité du sol y est la plus forte. Nos
résultats ne montrent pas d’augmentation de ces propriétés sous apport d’effluent d’élevage. Nous
confirmons les fortes variations intra-annuelles de ces propriétés physiques du sol. Dans les sols
travaillés, l’action de l’outil et des lombriciens provoquent une fragmentation du sol ; ils créent une
porosité d’assemblage complexe, laquelle influe sur la perméabilité du sol. En semis direct, la
perméabilité du sol évolue sous l’effet des déjections lombriciennes, qui ne modifient pas le volume
poral du sol mais peuvent jouer sur la connectivité des macropores. Des expérimentations en
condition semi-contrôlée (in situ) devront être mises en œuvre pour tester l’effet des lombriciens
sur la macroporosité et sa connectivité.
Au terme de ce travail, nous avons pu proposer des scénarios d’évolution des propriétés
physiques des couches de surface du sol, en mettant en évidence le rôle de l’activité lombricienne
dans l’acquisition par le sol de ces propriétés. Ce rôle se manifeste par une dynamique saisonnière
de ces propriétés, liée aux périodes de production de déjections par les lombriciens ; cette
dynamique saisonnière se superpose à une évolution interannuelle, qui a conduit à une
différenciation des sols en 8 années de pratiques culturales. Les variations saisonnières pour une
modalité donnée peuvent être plus importantes que les différences entre modalités, mais nous
montrons que, lorsque ce sol est conduit en semis direct, et même s’il bénéficie d’un apport
d’effluent, l’activité lombricienne importante ne suffit pas à créer une structure aussi favorable que
dans les horizons travaillés. Ce travail a montré que, pour répondre à une question agronomique
(comment évaluer des pratiques culturales), il était nécessaire de pouvoir d’abord répondre, en

Conclusion et perspectives
119
amont, à des questions relatives aux processus (comment les biostructures sont-elles produites,
évoluent-elles, influencent-elles le fonctionnement du sol). Notre démarche a ainsi aidé à faire
sauter des « verrous de connaissance » ; une autre étape serait de tester la généricité de nos
résultats, sur d’autres types de sol, dans d’autres contextes.


Références

123
Références Abiven, S., Menasseri, S., Angers, D.A. and Leterme, P., 2007. Dynamics of aggregate stability and
biological binding agents during decomposition of organic materials. Eur. J. Soil Sci., 58(1):
239-247.
Abiven, S., Menasseri, S., Angers, D.A. and Leterme, P., 2008. A model to predict soil aggregate
stability dynamics following organic residue incorporation under field conditions. Soil Sci.
Soc. Am. J., 72(1): 119-125.
Abiven, S., Menasseri, S. and Chenu, C., 2009. The effects of organic inputs over time on soil
aggregate stability - A literature analysis. Soil Biol. Biochem., 41(1): 1-12.
Albiach, R., Canet, R., Pomares, F. and Ingelmo, F., 2001. Organic matter components and
aggregate stability after the application of different amendments to a horticultural soil.
Bioresour. Technol., 76(2): 125-129.
Álvaro-Fuentes, J., Arrue, J.L., Gracia, R. and Lopez, M.V., 2008. Tillage and cropping
intensification effects on soil aggregation: Temporal dynamics and controlling factors under
semiarid conditions. Geoderma, 145(3-4): 390-396.
Amezketa, E., 1999. Soil aggregate stability: A review. J. Sustain. Agric, 14(2-3): 83-151.
Anderson, J.M., Ineson, P. and Huish, S.A., 1983. Nitrogen and cation mobilization by soil fauna
feeding on leaf litter and soil organic matter from deciduous woodlands. Soil Biol.
Biochem., 15(4): 463-467.
Angers, D.A. and Ndayegamiye, A., 1991. Effects of Manure Application on Carbon, Nitrogen, and
Carbohydrate Contents of a Silt Loam and Its Particle-Size Fractions. Biol. Fertil. Soils,
11(1): 79-82.
Angers, D.A., Bissonnette, N., Legere, A. and Samson, N., 1993a. Microbial and biochemical
changes induced by rotation and tillage in a soil under barley production. Can. J. Soil Sci.,
73(1): 39-50.
Angers, D.A., Samson, N. and Legere, A., 1993b. Early changes in water-stable aggregation
induced by rotation and tillage in a soil under barley production. Can. J. Soil Sci., 73(1):
51-59.
Angers, D.A., Edwards, L.M., Sanderson, J.B. and Bissonnette, N., 1999. Soil organic matter quality
and aggregate stability under eight potato cropping sequences in a fine sandy loam of
Prince Edward Island. Can. J. Soil Sci., 79(3): 411-417.
Annabi, M., Houot, S., Francou, F., Poitrenaud, M. and Le Bissonnais, Y., 2007. Soil aggregate
stability improvement with urban composts of different maturities. Soil Sci. Soc. Am. J.,
71(2): 413-423.
Arriaga, F.J. and Lowery, B., 2003. Soil physical properties and crop productivity of an eroded soil
amended with cattle manure. Soil Sci., 168(12): 888-899.
Arrouays, D., Deslais, W. and Badeau, V., 2001. The carbon content of topsoil and its geographical
distribution in France. Soil Use Manag., 17(1): 7-11.
Arshad, M.A., Franzluebbers, A.J. and Azooz, R.H., 1999. Components of surface soil structure
under conventional and no-tillage in northwestern Canada. Soil Tillage Res., 53(1): 41-47.
Azooz, R.H., Arshad, M.A. and Franzleubbers, A.J., 1996. Pore size distribution and hydraulic
conductivity affected by tillage in northwestern Canada. Soil Sci. Soc. Am. J., 60(4): 1197-
1201.

Références
124
Barois, I., Lavelle, P., Brossard, M., Tondoh, J., Martinez, M.A., Rossi, J.P., Senapati, B.K., Angeles,
A., Fragoso, C., Jimenez, J.J., Decaens, T., Lattaud, C., Kanyonyo, J., Blanchart, E.,
Chapuis, L., Brown, G. and Moreno, A., 1999. Ecology of earthworm species with large
environmental tolerance and/or extended distributions. In: P. Lavelle, L. Brussaard and P.
Hendrix (Editors), Earthworm Management in Tropical Agroecosystems. CAB International,
Wallingford, UK.
Barthès, B. and Roose, E., 2002. Aggregate stability as an indicator of soil susceptibility to runoff
and erosion; validation at several levels. CATENA, 47(2): 133-149.
Barzegar, A.R., Yousefi, A. and Daryashenas, A., 2002. The effect of addition of different amounts
and types of organic materials on soil physical properties and yield of wheat. Plant and Soil,
247(2): 295-301.
Bastardie, F., Cannavacciuolo, M., Capowiez, Y., Dreuzy, J.R.d., Bellido, A. and Cluzeau, D., 2002.
A new simulation for modelling the topology of earthworm burrow systems and their effects
on macropore flow in experimental soils. Biol. Fertil. Soils, 36(2): 161-169.
Bastardie, F., Capowiez, Y. and Cluzeau, D., 2003. Burrowing behaviour of radio-labelled
earthworms revealed by analysis of 3D-trajectories in artificial soil cores: The 7th
international symposium on earthworm ecology � Cardiff � Wales � 2002. Pedobiologia,
47(5-6): 554-559.
Beare, M.H., Hus, S., Coleman, D.C. and Hendrix, P.F., 1997. Influences of mycelial fungi on soil
aggregation and organic matter storage in conventional and no-tillage soils. Appl. Soil
Ecol., 5(3): 211-219.
Bhattacharyya, R., Chandra, S., Singh, R.D., Kundu, S., Srivastva, A.K. and Gupta, H.S., 2007.
Long-term farmyard manure application effects on properties of a silty clay loam soil under
irrigated wheat-soybean rotation. Soil Tillage Res., 94(2): 386-396.
Binet, F. and Le Bayon, R.C., 1999. Space-time dynamics in situ of earthworm casts under
temperate cultivated soils. Soil Biol. Biochem., 31(1): 85-93.
Bissonnette, N., Angers, D.A., Simard, R.R. and Lafond, J., 2001. Interactive effects of
management practices on water-stable aggregation and organic matter of a Humic Gleysol.
Can. J. Soil Sci., 81(5): 545-551.
Blanchart, E., 1992. Restoration by earthworms (megascolecidae) of the macroaggregate structure
of a destructured savanna soil under field conditions. Soil Biol. Biochem., 24(12): 1587-
1594.
Blanchart, E., Bruand, A. and Lavelle, P., 1993. The physical structure of cast of Millsonia anomala
(Oligochaeta : Megascolecidae) in shrub savanna soils (Côte d'Ivoire). Geoderma, 56: 119-
132.
Blanchart, E., Lavelle, P., Braudeau, E., Le Bissonnais, Y. and Valentin, C., 1997. Regulation of soil
structure by geophagous earthworm activities in humid savannas of Côte d'Ivoire. Soil Biol.
Biochem., 29(3-4): 431-439.
Blanchart, E., Albrecht, A., Alegre, J., Duboisset, A., Gilot, C., Pashanashi, B., Lavelle, P. and
Brussaard, L., 1999. Effects of earthworms on soil structure and physical properties. In: P.
Lavelle, L. Brussaard and P. Hendrix (Editors), Earthworrm management in tropical
agroecosystems. CAB International, Wallingford, UK.
Blanco-Canqui, H., Gantzer, C.J., Anderson, S.H., Alberts, E.E. and Ghidey, F., 2002. Saturated
Hydraulic Conductivity and Its Impact on Simulated Runoff for Claypan Soils. Soil Sci. Soc.
Am. J., 66(5): 1596-1602.
Références
125
Blanco-Canqui, H. and Lal, R., 2007. Soil structure and organic carbon relationships following 10
years of wheat straw management in no-till. Soil Tillage Res., 95(1-2): 240-254.
Blanco-Canqui, H., Lal, R. and Shipitalo, M.J., 2007. Aggregate disintegration and wettability for
long-term management systems in the northern Appalachians. Soil Sci. Soc. Am. J., 71(3):
759-765.
Blevins, R.L. and Frye, W.W., 1993. Conservation tillage: an ecological approach to soil
management. Adv. Agron., 54: 33-78.
Bottinelli, N., Hallaire, V., Menasseri, S., Le Guillou, C. and Cluzeau, D., 2010a. Abundance and
stability of belowground earthworm casts influenced by tillage intensity and depth. Soil
Tillage Res., 106(2): 263-267.
Bottinelli, N., Henry-des-Tureaux, T., Hallaire, V., Mathieu, J., Benard, Y., Duc Tranc, T. and
Jouquet, P., 2010b. Earthworms accelerate soil porosity turnover under watering
conditions. Geoderma, 156(1-2): 43-47.
Bouché, M., 1972. Lombriciens de France. Ecologie et Systèmatique. INRA Annales de Zoologie,
Ecologie Animale, Paris.
Bouché, M.B., 1977. Stratégies lombriciennes. In: U. Lohm and T. Persson (Editors), Soil
Organisms as Components of Ecosystems. Ecology Bulletin/NFR, Stockholm, pp. 122-132.
Bouché, M.B. and Al-Addan, F., 1997. Earthworms, water infiltration and soil stability : some new
assessments. Soil Biol. Biochem., 29(3-4): 441-452.
Bruneau, P.M.C., Davidson, D.A. and Grieve, I.C., 2004. An evaluation of image analysis for
measuring changes in void space and excremental features on soil thin sections in an
upland grassland soil. Geoderma, 120(3-4): 165-175.
Bullock, P., Federoff, N., Jongerius, A., Stoops, G. and Tursina, T., 1985. Handbook for Soil Thin
Section Description. Waine Research Publication, Albrighton, England.
Capowiez, Y., Pierret, A., Daniel, O., Monestiez, P. and Kretzschmar, A., 1998. 3D skeleton
reconstructions of natural earthworm burrow systems using CAT scan images of soil cores.
Biol. Fertil. Soils, 27(1): 51-59.
Capowiez, Y., Monestiez, P. and Belzunces, L., 2001. Burrow systems made by Aporrectodea
nocturna and Allolobophora chlorotica in artificial cores: morphological differences and
effects of interspecific interactions. Appl. Soil Ecol., 16(2): 109-120.
Capowiez, Y., Cadoux, S., Bouchand, P., Roger-Estrade, J., Richard, G. and Boizard, H., 2009a.
Experimental evidence for the role of earthworms in compacted soil regeneration based on
field observations and results from a semi-field experiment. Soil Biol. Biochem., 41(4):
711-717.
Capowiez, Y., Cadoux, S., Bouchant, P., Ruy, S., Roger-Estrade, J., Richard, G. and Boizard, H.,
2009b. The effect of tillage type and cropping system on earthworm communities,
macroporosity and water infiltration. Soil Tillage Res., 105(2): 209-216.
Carof, M., De Tourdonnet, S., Coquet, Y., Hallaire, V. and Roger-Estrade, J., 2007. Hydraulic
conductivity and porosity under conventional and no-tillage and the effect of three species
of cover crop in northern France. Soil Use Manag., 23(3): 230-237.
Carter, M.R., 1992. Characterizing the Soil Physical Condition in Reduced Tillage Systems for
Winter-Wheat on a Fine Sandy Loam Using Small Cores. Can. J. Soil Sci., 72(4): 395-402.
Celik, I., Ortas, I. and Kilic, S., 2004. Effects of compost, mycorrhiza, manure and fertilizer on
some physical properties of a Chromoxerert soil. Soil Tillage Res., 78(1): 59-67.
Chan, K.Y., Heenan, D.P. and Ashley, R., 1994. Seasonal changes in surface aggregate stability
under different tillage and crops. Soil Tillage Res., 28(3-4): 301-314.

Références
126
Chan, K.Y., 2001. An overview of some tillage impacts on earthworm population abundance and
diversity -- implications for functioning in soils. Soil Tillage Res., 57(4): 179-191.
Chenu, C., Le Bissonnais, Y. and Arrouays, D., 2000. Organic matter influence on clay wettability
and soil aggregate stability. Soil Sci. Soc. Am. J., 64(4): 1479-1486.
Cheshire, M.V., Bracewell, J.M., Mundie, C.M., Robertson, G.W., Russell, J.D. and Fraser, A.R.,
1979. Structural Studies on Soil Polysaccharide. J. Soil. Sci., 30(2): 315-326.
Cluzeau, D., Guo, Z.T., Chaussod, D., Federoff, N., Normand, M. and Perraud, A., 1994. Interaction
between soil, biological activities and organic matter enrichments in Champagne soils,
Transactions of the XV World Congress of Soil Sc. INEG and CNA publishing, Mexico.
Cluzeau, D., Cannavacciulo, M. and Pérès, G., 1999. Indicateurs macrobiologiques des sols: les
lombriciens-Méthode d'échantillonnage dans les agrosystèmes en zone tempéree. In: I.T.d.
Vin (Editor), 12ème Colloque Viticole et Œnologique. ITV Paris.
Coq, S., Barthes, B.G., Oliver, R., Rabary, B. and Blanchart, E., 2007. Earthworm activity affects
soil aggregation and organic matter dynamics according to the quality and localization of
crop residues - An experimental study (Madagascar). Soil Biol. Biochem., 39(8): 2119-
2128.
Coquet, Y., Vachier, P. and Labat, C., 2005. Vertical variation of near-saturated hydraulic
conductivity in three soil profiles. Geoderma, 126(3-4): 181-191.
Cosentino, D., Chenu, C. and Le Bissonnais, Y., 2006. Aggregate stability and microbial community
dynamics under drying-wetting cycles in a silt loam soil. Soil Biol. Biochem., 38(8): 2053-
2062.
Coutadeur, C., Coquet, Y. and Roger-Estrade, J., 2002. Variation of hydraulic conductivity in a tilled
soil. Eur. J. Soil Sci., 53(4): 619-628.
Curry, J.P., 1976. Some effects of animal manures on earthworms in grassland. Pedobiologia, 16:
425-438.
Dam, R.F., Mehdi, B.B., Burgess, M.S.E., Madramootoo, C.A., Mehuys, G.R. and Callum, I.R., 2005.
Soil bulk density and crop yield under eleven consecutive years of corn with different tillage
and residue practices in a sandy loam soil in central Canada. Soil Tillage Res., 84(1): 41-
53.
Daraghmeh, O.A., Jensen, J.R. and Petersen, C.T., 2008. Near-saturated hydraulic properties in the
surface layer of a sandy loam soil under conventional and reduced tillage. Soil Sci. Soc.
Am. J., 72(6): 1728-1737.
Daraghmeh, O.A., Jensen, J.R. and Petersen, C.T., 2009. Soil structure stability under conventional
and reduced tillage in a sandy loam. Geoderma, 150(1-2): 64-71.
Darwin, C., 1881. The Formation of Vegetable Mould Through the Action of Worms, with Some
Observations of Their Habits, London.
Dasgupta, S., Mohanty, B.P. and Kohne, J.M., 2006. Soil Hydraulic Conductivities and their Spatial
and Temporal Variations in a Vertisol. Soil Sci. Soc. Am. J., 70(6): 1872-1881.
Davidson, D.A., Bruneau, P.M.C., Grieve, I.C. and Young, I.M., 2002. Impacts of fauna on an
upland grassland soil as determined by micromorphological analysis. Appl. Soil Ecol.,
20(2): 133-143.
Decaëns, T., 2000. Degradation dynamics of surface earthworm casts in grasslands of the eastern
plains of Colombia. Biol. Fertil. Soils, 32(2): 149-156.
Derpch, R., 2005. The Extent of CA Adoption worldwide : Implications and Impact, Key noote paper
presented at the III World Congress on Conservation Agriculture, Nairobi, Kenya.
Références
127
Dexter, A.R., 1988. Advances in Characterization of Soil Structure. Soil Tillage Res., 11(3-4): 199-
238.
Drees, L.R., karathanasis, A.D., Wilding, L.P. and Blevins, R.L., 1994. Micromorphological
characteristics of long term no till and conventionally tilled soils. Soil Sci. Soc. Am. J., 58:
508-517.
Dubois, M., Gilles, K.A., Hamilton, J.K., Rebers, P.A. and Smith, F., 1956. Colorimetric method for
determination of sugars and related substances. Anal. Chem., 28: 350-356.
Edmeades, D.C., 2003. The long-term effects of manures and fertilisers on soil productivity and
quality: a review. Nutr. Cycl. Agroecosyst., 66(2): 165-180.
Edwards, W.M., Shipitalo, M.J., Owens, L.B. and Norton, L.D., 1990. Effect of Lumbricus terrestris L
burrows on hydrology of continuous no-till corn fields. Geoderma, 46(1-3): 73-84.
Ehlers, W., 1975. Observations on earthworm channels and infiltration on tilled and untilled loess
soil. Soil Sci., 119(3): 242-248.
Ehlers, W., Kopke, U., Hesse, F. and Bohm, W., 1983. Penetration resistance and root growth of
oats in tilled and untilled loess soil. Soil Tillage Res., 3(3): 261-275.
Eynard, A., Schumacher, T.E., Lindstrom, M.J., Malo, D.D. and Kohl, R.A., 2004. Wettability of soil
aggregates from cultivated and uncultivated Ustolls and Usterts. Aust. J. Soil Res., 42(2):
163-170.
Felten, D. and Emmerling, C., 2009. Earthworm burrowing behaviour in 2D terraria with single-
and multi-species assemblages. Biol. Fertil. Soils, 45(8): 789-797.
Flegel, M., Schrader, S. and Zhang, H., 1998. Influence of food quality on the physical and
chemical properties of detritivorous earthworm casts. Appl. Soil Ecol., 9(1-3): 263-269.
Francis, G.S. and Fraser, P.M., 1998. The effects of three earthworm species on soil macroporosity
and hydraulic conductivity. Appl. Soil Ecol., 10(1-2): 11-19.
Fuentes, J.P., Flury, M. and Bezdicek, D.F., 2004. Hydraulic properties in a silt loam soil under
natural prairie, conventional till, and no-till. Soil Sci. Soc. Am. J., 68(5): 1679-1688.
Gantzer, C.J. and Blake, G.R., 1978. Physical Characteristics of Le-Sueur-Clay Loam Soil Following
No-Till and Conventional Tillage. Agron. J., 70(5): 853-857.
Gautronneau, Y. and Manichon, H., 1987. Guide méthodique du profil cultural, CEREF/GEARA.
Grandy, A.S., Porter, G.A. and Erich, M.S., 2002. Organic amendment and rotation crop effects on
the recovery of soil organic matter and aggregation in potato cropping systems. Soil Sci.
Soc. Am. J., 66(4): 1311-1319.
Green, T.R., Ahuja, L.R. and Benjamin, J.G., 2003. Advances and challenges in predicting
agricultural management effects on soil hydraulic properties. Geoderma, 116(1-2): 3-27.
Guerif, J., 1991. Influence de la simplification du travail du sol sur l'état structural des horizons de
surface: conséquences sur leurs propriétés physiques et leurs comportements mécaniques.
In: G. Monnier, G. Thevenet and B. Lesaffre (Editors), Simplification du travail du sol. INRA
editions, "les colloques", Paris.
Hallaire, V., Curmi, P., Duboisset, A., Lavelle, P. and Pashanasi, B., 2000. Soil structure changes
induced by the tropical earthworm Pontoscolex corethrurus and organic inputs in a
Peruvian ultisol. Eur. J. Soil Biol., 36(1): 35-44.
Hallett, P.D., Baumgartl, T. and Young, I.M., 2001. Subcritical Water Repellency of Aggregates
from a Range of Soil Management Practices. Soil Sci. Soc. Am. J., 65(1): 184-190.
Hassink, J. and Whitmore, A.P., 1997. A model of the physical protection of organic matter in soils.
Soil Sci. Soc. Am. J., 61(1): 131-139.

Références
128
Hati, K.M., Swarup, A., Dwivedi, A.K., Misra, A.K. and Bandyopadhyay, K.K., 2007. Changes in soil
physical properties and organic carbon status at the topsoil horizon of a vertisol of central
India after 28 years of continuous cropping, fertilization and manuring. Agric. Environ.,
119(1-2): 127-134.
Haynes, R.J. and Francis, G.S., 1993. Changes in microbial biomass C, soil carbohydrate
composition and aggregate stability induced by growth of selected crop and forage species
under field conditions. J. Soil. Sci., 44(4): 665-675.
Haynes, R.J. and Naidu, R., 1998. Influence of lime, fertilizer and manure applications on soil
organic matter content and soil physical conditions: a review. Nutr. Cycl. Agroecosyst.,
51(2): 123-137.
Heddadj, D., 2008. Etats des lieux sur les pratiques du non labour en Bretagne, Space 2008 "sols
agricoles et développement durable", Rennes.
Heddadj, D., gascuel-Odoux, C., Cotinet, P. and Hamon, Y., 2005. Mode de travail du sol,
ruissellement et propriétés hydrodynamiques sur un dispositif experimental de l'ouest de la
France. Etude et gestion des sols, 12(1): 53-66.
Hindell, R.P., McKenzie, B.M. and Tisdall, J.M., 1997. Destabilization of soil during the production of
earthworm (Lumbricidae) and artificial casts. Biol. Fertil. Soils, 24(2): 153-163.
Hirth, J.R., McKenzie, B.M. and Tisdall, J.M., 1996. Volume density of earthworm burrows in
compacted cores of soil as estimated by direct and indirect methods. Biol. Fertil. Soils, 21:
171-176.
Holland, J.M., 2004. The environmental consequences of adopting conservation tillage in Europe:
reviewing the evidence. Agric. Environ., 103(1): 1-25.
Hubert, F., Hallaire, V., Sardini, P., Caner, L. and Heddadj, D., 2007. Pore morphology changes
under tillage and no-tillage practices. Geoderma, 142(1-2): 226-236.
Hussain, I., Olson, K.R. and Siemens, J.C., 1998. long-term tillage effects on physical propertyies
of eroded soil. Soil Sci.: 970-981.
Jastrow, J.D., Miller, R.M. and Lussenhop, J., 1998. Contributions of interacting biological
mechanisms to soil aggregate stabilization in restored prairie. Soil Biol. Biochem., 30(7):
905-916.
Jegou, D., Capowiez, Y. and Cluzeau, D., 2001. Interactions between earthworm species in artificial
soil cores assessed through the 3D reconstruction of the burrow systems. Geoderma,
102(1-2): 123-137.
Jiao, Y., Whalen, J.K. and Hendershot, W.H., 2006. No-tillage and manure applications increase
aggregation and improve nutrient retention in a sandy-loam soil. Geoderma, 134(1-2): 24-
33.
Johnson-Maynard, J.L., Umiker, K.J. and Guy, S.O., 2007. Earthworm dynamics and soil physical
properties in the first three years of no-till management. Soil Tillage Res., 94(2): 338-345.
Jones, C.G., Lawton, J.H. and Shachak, M., 1994. Organisms as ecosystem engineers. Oikos,
69(3): 373-386.
Jongmans, A.G., Pulleman, M.M. and Marinissen, J.C.Y., 2001. Soil structure and earthworm
activity in a marine silt loam under pasture versus arable land. Biol. Fertil. Soils, 33(4):
279-285.
Jongmans, A.G., Pulleman, M.M., Balabane, M., van Oort, F. and Marinissen, J.C.Y., 2003. Soil
structure and characteristics of organic matter in two orchards differing in earthworm
activity. Appl. Soil Ecol., 24(3): 219-232.
Références
129
Joschko, M., Söchtig, W. and Larink, O., 1992. Functional relationship between earthworm burrows
and soil water movement in column experiments. Soil Biol. Biochem., 24(12): 1545-1547.
Jouquet, P., Bottinelli, N., Podwojewski, P., Hallaire, V. and Tran Duc, T., 2008. Chemical and
physical properties of earthworm casts as compared to bulk soil under a range of different
land-use systems in Vietnam. Geoderma, 146(1-2): 231-238.
Kandeler, E. and Murer, E., 1993. Aggregate Stability and Soil Microbial Processes in a Soil with
Different Cultivation. Geoderma, 56(1-4): 503-513.
Kay, B.D. and Vandenbygaart, A.J., 2002. Conservation tillage and depth stratification of porosity
and soil organic matter. Soil Tillage Res., 66(2): 107-118.
Khaleel, R., Reddy, K.R. and Overcash, M.R., 1981. Changes in Soil Physical-Properties Due to
Organic Waste Applications - a Review. J. Environ. Qual., 10(2): 133-141.
Khan, A.U.H., Iqbal, M. and Islam, K.R., 2007. Dairy manure and tillage effects on soil fertility and
corn yields. Bioresour. Technol., 98(10): 1972-1979.
King, P.M., 1981. Comparison of Methods for Measuring Severity of Water Repellence of Sandy
Soils and Assessment of Some Factors That Affect Its Measurement. Aust. J. Soil Res.,
19(4): 275-285.
Kladivko, E.J., 2001. Tillage systems and soil ecology. Soil Tillage Res., 61(1-2): 61-76.
Köller, K., 2003. Techniques of Soil Tillage. In: E. Titi (Editor), Soil Tillage in Agroecosystems. CRC
Press LLC, Boca Raton.
Kretzschmar, A., 1982. Description des galeries de vers de terre et variation saisonnière des
réseaux (observations en conditions naturelles). Ecol. Biol. Sol, 19(4): 579-591.
Kribaa, M., Hallaire, V., Curmi, P. and Lahmar, R., 2001. Effect of various cultivation methods on
the structure and hydraulic properties of a soil in a semi-arid climate. Soil Tillage Res.,
60(1-2): 43-53.
Kushwaha, C.P., Tripathi, S.K. and Singh, K.P., 2001. Soil organic matter and water-stable
aggregates under different tillage and residue conditions in a tropical dryland
agroecosystem. Appl. Soil Ecol., 16(3): 229-241.
Labreuche, J., Viloingt, T., Caboulet, D., Daouze, J.P., Duval, R., Ganteil, A., Jouy, L., Quere, L.,
Boizard, H. and Roger-Estrade, J., 2007. Assessment of the environmental impact of non-
inversion tillage methods in France – La pratique des TCSL en France. Terminologie des
pratiques de travail du sol. Développement des TCSL et modifications du système de
culture. ADEME Report.
Lal, R., 2005. Soil erosion and carbon dynamics. Soil Tillage Res., 81(2): 137-142.
Lal, R., Reicosky, D.C. and Hanson, J.D., 2007. Evolution of the plow over 10,000 years and the
rationale for no-till farming. Soil Tillage Res., 93(1): 1-12.
Lamandé, M., Hallaire, V., Curmi, P., Pérès, G. and Cluzeau, D., 2003. Changes of pore
morphology, infiltration and earthworm community in a loamy soil under different
agricultural managements. CATENA, 54(3): 637-649.
Lamandé, M., Pérès, G., Hallaire, V., Curmi, P. and Cluzeau, D., 2004. Action combinée des
pratiques culturales et des lombriciens sur le sol : Morphologie porale, conductivité
hydraulique et communautés lombriciennes suivant trois systèmes de culture. Etude et
gestion des sols, 11(4): 393-402.
Lampurlanés, J. and Cantero-Martínez, C., 2006. Hydraulic conductivity, residue cover and soil
surface roughness under different tillage systems in semiarid conditions. Soil Tillage Res.,
85(1-2): 13-26.
Références
130
Langmaack, M., Schrader, S., Rapp-Bernhardt, U. and Kotzke, K., 1999. Quantitative analysis of
earthworm burrow systems with respect to biological soil-structure regeneration after soil
compaction. Biol. Fertil. Soils, 28(3): 219-229.
Larink, O., Werner, D., Langmaack, M. and Schrader, S., 2001. Regeneration of compacted soil
aggregates by earthworm activity. Biol. Fertil. Soils, 33(5): 395-401.
Lavelle, P., Bignell, D., Lepage, M., Wolters, V., Roger, P., Ineson, P., Heal, O.W. and Dhillion, S.,
1997. Soil function in a changing world: the role of invertebrate ecosystem engineers. Eur.
J. Soil Biol., 33(4): 159-193.
Lavelle, P. and Spain, A.V., 2001. Soil Ecology. Dordrecht, Kluwer Academic Publishers,
Netherlands.
Le Bissonnais, Y. and Singer, M.J., 1992. Crusting, runoff, and erosion response to soil water
content and successive rainfalls. Soil Sci. Soc. Am. J., 56(6): 1898-1903.
Le Bissonnais, Y., 1996. Aggregate stability and assessment of soil crustability and erodibility: I.
Theory and methodology. Eur. J. Soil Sci., 47(4): 425-437.
Le Bissonnais, Y. and Arrouays, D., 1997. Aggregate stability and assessment of soil crustability
and erodibility: II. Application to humic loamy soils with various organic carbon contents.
Eur. J. Soil Sci., 48(1): 39-48.
Le Bissonnais, Y., Cros-Cayot, S. and Gascuel-Odoux, C., 2002. Topographic dependence of
aggregate stability, overland flow and sediment transport. Agronomie, 22(5): 489-501.
Le Bissonnais, Y., Blavet, D., De Noni, G., Laurent, J.Y., Asseline, J. and Chenu, C., 2007.
Erodibility of Mediterranean vineyard soils: Relevant aggregate stability methods and
significant soil variables. Eur. J. Soil Sci., 58(1): 188-195.
Lee, K.E., 1985. Earthworms: Their Ecology and Relationships with Soil and Land Use. Academic
Press, New York.
Letey, J., 1969. Measurement of the contact angle, water drop penetration time, and critical
surface tensions, Proceedings of the Symposium on Water-Repellent Soils, University of
California, Riverside.
Ligthart, T.N., 1997. Thin section analysis of earthworm burrow disintegration in a permanent
pasture. Geoderma, 75: 135-148.
Lin, H.S., McInnes, K.J., Wilding, L.P. and Hallmark, C.T., 1999. Effects of soil morphology on
hydraulic properties: I. Quantification of soil morphology. Soil Sci. Soc. Am. J., 63(4): 948-
954.
Lipiec, J., Kus, J., Slowinska-Jurkiewicz, A. and Nosalewicz, A., 2006. Soil porosity and water
infiltration as influenced by tillage methods. Soil Tillage Res., 89(2): 210-220.
Logsdon, S.D., McCoy, E.L., Allmaras, R.R. and Linden, D.R., 1993. Macropore characterization by
indirect methods. Soil Sci., 155(5): 316-324.
Marashi, A.R.A. and Scullion, J., 2003. Earthworm casts form stable aggregates in physically
degraded soils. Biol. Fertil. Soils, 37(6): 375-380.
Marinari, S., Masciandaro, G., Ceccanti, B. and Grego, S., 2000. Influence of organic and mineral
fertilisers on soil biological and physical properties. Bioresour. Technol., 72(1): 9-17.
Marinissen, J.C.Y. and Dexter, A.R., 1990. Mechanisms of stabilization of earthworm casts and
artificial casts. Biol. Fertil. Soils, 9(2): 163-167.
Marinissen, J.C.Y., 1994. Earthworm populations and stability of soil structure in a silt loam soil of a
recently reclaimed polder in the Netherlands. Agric. Environ., 51(1-2): 75-87.
Martin, N.A., 1982. The interaction between organic matter in soil and the burrowing activity of
three species of earthworms (Oligochaeta : Lumbricidae). Pedobiologia, 24(4): 185-190.
Références
131
Martins, M.d.R., Cora, J.E., Jorge, R.F. and Marcelo, A.V., 2009. Crop type influences soil
aggregation and organic matter under no-tillage. Soil Tillage Res., 104(1): 22-29.
Mbagwu, J.S.C., 1992. Improving the productivity of a degraded ultisol in Nigeria using organic and
inorganic amendments. Part 2: Changes in physical properties. Bioresour. Technol., 42(3):
167-175.
McGarry, D., Bridge, B.J. and Radford, B.J., 2000. Contrasting soil physical properties after zero
and traditional tillage of an alluvial soil in the semi-arid subtropics. Soil Tillage Res., 53(2):
105-115.
MEDD, 2002. Evaluation des quantités actuelles et future des déchets épandus sur les sols
agricoles en provenant de certaines activités.
Meek, B.D., Rechel, E.R., Carter, L.M., DeTar, W.R. and Urie, A.L., 1992. Infiltration Rate of a
Sandy Loam Soil: Effects of Traffic, Tillage, and Plant Roots. Soil Sci. Soc. Am. J., 56(3):
908-913.
Mikha, M.M. and Rice, C.W., 2004. Tillage and Manure Effects on Soil and Aggregate-Associated
Carbon and Nitrogen. Soil Sci. Soc. Am. J., 68(3): 809-816.
Miller, J.J., Kokko, E.G. and Kozub, G.C., 1998a. Comparison of porosity in a Chernozemic clay
loam soil under long-term conventional tillage and no-till. Can. J. Soil Sci., 78(4): 619-629.
Miller, J.J., Sweetland, N.J., Larney, F.J. and Volkmar, K.M., 1998b. Unsaturated hydraulic
conductivity of conventional and conservation tillage soils in southern Alberta. Can. J. Soil
Sci., 78(4): 643-648.
Miller, J.J., Sweetland, N.J. and Chang, C., 2002. Hydrological Properties of a Clay Loam Soil after
Long-Term Cattle Manure Application. J Environ Qual, 31(3): 989-996.
Moret, D. and Arrue, J.L., 2007. Dynamics of soil hydraulic properties during fallow as affected by
tillage. Soil Tillage Res., 96(1-2): 103-113.
Murphy, C.P., Bullock, P. and Turner, R.H., 1977. The measurement and characterisation of voids
in soil. Thin sections by image analysis. Part I. Principles and techniques. Eur. J. Soil Sci.,
28(3): 498-508.
N'dayegamiye, A. and Angers, D.A., 1990. Effects of long-term cattle manure application on
physical and biological properties of a neubois silty loam cropped to corn. Can. J. Soil Sci.,
70(2): 259-262.
Nyamangara, J., Gotosa, J. and Mpofu, S.E., 2001. Cattle manure effects on structural stability and
water retention capacity of a granitic sandy soil in Zimbabwe. Soil Tillage Res., 62(3-4):
157-162.
Oyedele, D.J., Schjonning, P. and Amusan, A.A., 2006. Physicochemical properties of earthworm
casts and uningested parent soil from selected sites in southwestern Nigeria. Ecological
Engineering, 28(2): 106-113.
Pagliai, M., La Marca, M. and Lucamante, G., 1983. Micromorphometric and micromorphological
investigations of a clay loam soil in viticulture under zero and conventionnal tillage. J. Soil.
Sci., 34: 391-403.
Pagliai, M., Lamarca, M. and Lucamante, G., 1987. Changes in soil porosity in remolded soils
treated with poultry manure. Soil Sci., 144(2): 128-140.
Pagliai, M., Raglione, M., panini, T., maletta, M. and La Marca, M., 1995. The structure of two
alluvial soils in Italy after 10 years of conventional and minimum tillage. Soil Tillage Res.,
34(4): 209-223.
Pagliai, M., Vignozzi, N. and Pellegrini, S., 2004. Soil structure and the effect of management
practices. Soil Tillage Res., 79(2): 131-143.

Références
132
Paré, T., Dinel, H., Moulin, A.P. and Townley-Smith, L., 1999. Organic matter quality and structural
stability of a Black Chernozemic soil under different manure and tillage practices.
Geoderma, 91(3-4): 311-326.
Peigné, J., Cannavaciuolo, M., Gautronneau, Y., Aveline, A., Giteau, J.L. and Cluzeau, D., 2009.
Earthworm populations under different tillage systems in organic farming. Soil Tillage Res.,
104(2): 207-214.
Pérès, G., Cluzeau, D., Curmi, P. and Hallaire, V., 1998. Earthworm activity and soil structure
changes due to organic enrichments in vineyard systems. Biol. Fertil. Soils, 27(4): 417-
424.
Pérès, G., 2003. Identification et qualification in-situ des interactions entre la diversité
lombricienne et la macro-bioporosité dans le contexte cultural breton. Influence sur le
fonctionnement hydrique du sol, Thèse, Université Rennes 1.
Perfect, E., Kay, B.D., Loon, W.K.P.v., Sheard, R.W. and Pojasok, T., 1990. Factors influencing soil
structural stability within a growing season. Soil Sci. Soc. Am. J., 54(1): 173-179.
Perreault, J.M., Eriksen-Hamel, N.S. and Whalen, J.K., 2007. Temporal and spatial dynamics of
earthworm surface casting in a temperate soybean agroecosystem. Appl. Soil Ecol., 37(1-
2): 10-17.
Perret, J., Prasher, S.O., Kantzas, A. and Langford, C., 1999. Three-Dimensional Quantification of
Macropore Networks in Undisturbed Soil Cores. Soil Sci. Soc. Am. J., 63(6): 1530-1543.
Pierce, F.J., Fortin, M.C. and Staton, M.J., 1994. Periodic Plowing Effects on Soil Properties in a No-
Till Farming System. Soil Sci. Soc. Am. J., 58(6): 1782-1787.
Pikul, J.L., Jr., Chilom, G., Rice, J., Eynard, A., Schumacher, T.E., Nichols, K., Johnson, J.M.F.,
Wright, S., Caesar, T. and Ellsbury, M., 2009. Organic matter and water stability of field
aggregates affected by tillage in South Dakota. Soil Sci. Soc. Am. J., 73(1): 197-206.
Piron, D., 2008. Distribution de la drilosphère lombricienne et caractérisation bio-physique des
faciès de bioturbation sous gradient de désintensification du travail mécanique des sols,
Thèse, Université Rennes 1.
Pitkanen, J. and Nuutinen, V., 1998. Earthworm contribution to infiltration and surface runoff after
15 years of different soil management. Appl. Soil Ecol., 9(1-3): 411-415.
Plante, A.F. and McGill, W.B., 2002. Intraseasonal Soil Macroaggregate Dynamics in Two
Contrasting Field Soils Using Labeled Tracer Spheres. Soil Sci. Soc. Am. J., 66(4): 1285-
1295.
Pulleman, M., Jongmans, A., Marinissen, J. and Bouma, J., 2003. Effects of organic versus
conventional arable farming on soil structure and organic matter dynamics in a marine
loam in the Netherlands. Soil Use Manag., 19(2): 157-165.
Pulleman, M.M., Six, J., Uyl, A., Marinissen, J.C.Y. and Jongmans, A.G., 2005. Earthworms and
management affect organic matter incorporation and microaggregate formation in
agricultural soils. Appl. Soil Ecol., 29(1): 1-15.
R Development Core Team, R., 2008. R: A Language and Environment for Statistical Computing. R
Foundation for Statistical Computing. Vienne, Austria.
Rasiah, V., 1994. Equations to predict measures of structural stability at minimum strength. Soil
Sci., 158(3): 170-173.
Rasmussen, K.J., 1999. Impact of ploughless soil tillage on yield and soil quality: A Scandinavian
review. Soil Tillage Res., 53(1): 3-14.
Reid, J.B. and Goss, M.J., 1981. Effect of living roots of different plant species on the aggregate
stability of two arable soils. J. Soil. Sci., 32(4): 521-541.

Références
133
Reynolds, W.D. and Elrick, D.E., 1991. Determination of hydraulic conductivity using a tension
infiltrometer. Soil Sci. Soc. Am. J., 55(3): 633-639.
Riley, H., Pommeresche, R., Eltun, R., Hansen, S. and Korsaeth, A., 2008. Soil structure, organic
matter and earthworm activity in a comparison of cropping systems with contrasting
tillage, rotations, fertilizer levels and manure use. Agric. Environ., 124(3-4): 275-284.
Ringrose-Voase, A.J. and Bullock, A.J., 1984. The automatic recognition and measurement of soil
pore types by image analysis and computer programs. J. Soil. Sci., 35: 673-684.
Ringrose-Voase, A., 1996. Measurement of soil macropore geometry by image analysis of sections
through impregnated soil. Plant and Soil, 183(1): 27-47.
Roger-Estrade, J., Richard, G., Caneill, J., Boizard, H., Coquet, Y., Defossez, P. and Manichon, H.,
2004. Morphological characterisation of soil structure in tilled fields: from a diagnosis
method to the modelling of structural changes over time. Soil Tillage Res., 79(1): 33-49.
Roger-Estrade, J., Hallaire, V., Boizard, H., Cluzeau, D., Défossez, P., Pérès, G. and Richard, G.,
2005. Dégradation et régénration de la structure des sols cultivés. In: M.C. giraud, C.
Walter, J.C. Rémy, J. Bethelin and J.L. Morel (Editors), Sols et Environnement. Dunod.
Roger-Estrade, J., Richard, G., Dexter, A.R., Boizard, H., De Tourdonnet, S., Bertrand, M. and
Caneill, J., 2009. Integration of soil structure variations with time and space into models
for crop management. A review. Agronomy for Sustainable Development, 29(1): 135-142.
Sasal, M.C., Andriulo, A.E. and Taboada, M.A., 2006. Soil porosity characteristics and water
movement under zero tillage in silty soils in Argentinian Pampas. Soil Tillage Res., 87(1):
9-18.
Schjønning, P., Christensen, B.T. and Carstensen, B., 1994. Physical and chemical properties of a
sandy loam receiving animal manure, mineral fertilizer or no fertilizer for 90 years. Eur. J.
Soil Sci., 45(3): 257-268.
Schjønning, P. and Rasmussen, K.J., 2000. Soil strength and soil pore characteristics for direct
drilled and ploughed soils. Soil Tillage Res., 57(1-2): 69-82.
Schjønning, P., Elmholt, S., Munkholm, L.J. and Debosz, K., 2002. Soil quality aspects of humid
sandy loams as influenced by organic and conventional long-term management. Agric.
Environ., 88(3): 195-214.
Schjønning, P., Iversen, B.V., Munkholrn, L.J., Labouriau, R. and Jacobsen, O.H., 2005. Pore
characteristics and hydraulic properties of a sandy loam supplied for a century with either
animal manure or mineral fertilizers. Soil Use Manag., 21(3): 265-275.
Schrader, S. and Zhang, H., 1997. Earthworm casting: stabilization or destabilization of soil
structure. Soil Biol. Biochem., 29(3-4): 469-475.
Scullion, J., Neale, S. and Philips, L., 2007. Earthworm casting and burrowing activity in
conventional and organic grass-arable rotations. Eur. J. Soil Biol., 43(Supplement 1):
S216-S221.
Shepherd, M.A., Harrison, R. and Webb, J., 2002. Managing soil organic matter - implications for
soil structure on organic farms. Soil Use Manag., 18(1): 284-292.
Shipitalo, M.J. and Protz, R., 1987. Comparison of morphology and porosity of a soil under
conventional and zero tillage. Can. J. Soil Sci., 67(3): 445-456.
Shipitalo, M.J. and Protz, R., 1988. Factors influencing the dispersibility of clay in worm casts. Soil
Sci. Soc. Am. J., 52(3): 764-769.
Shipitalo, M.J., Protz, R. and Tomlin, A.D., 1988. Effect of diet on the feeding and casting activity
of Lumbricus terrestris and L. rubellus in laboratory culture. Soil Biol. Biochem., 20(2):
233-237.

Références
134
Shipitalo, M.J. and Protz, R., 1989. Chemistry and micromorphology of aggregation in earthworm
casts. Geoderma, 45(3-4): 357-374.
Shirani, H., Hajabbasi, M.A., Afyuni, M. and Hemmat, A., 2002. Effects of farmyard manure and
tillage systems on soil physical properties and corn yield in central Iran. Soil Tillage Res.,
68(2): 101-108.
Six, J., Elliott, E.T. and Paustian, K., 1999. Aggregate and soil organic matter dynamics under
conventional and no-tillage systems. Soil Sci. Soc. Am. J., 63(5): 1350-1358.
Stovold, R.J., Whalley, W.R., Harris, P.J. and White, R.P., 2004. Spatial variation in soil
compaction, and the burrowing activity of the earthworm Aporrectodea caliginosa. Biol.
Fertil. Soils, 39(5): 360-365.
Strudley, M.W., Green, T.R. and Ascough Ii, J.C., 2008. Tillage effects on soil hydraulic properties
in space and time: State of the science. Soil Tillage Res., 99(1): 4-48.
Sveistrup, T.E., Haraldsen, T.K., Langohr, R., Marcelino, V. and Kvaerner, J., 2005. Impact of land
use and seasonal freezing on morphological and physical properties of silty Norwegian soils.
Soil Tillage Res., 81(1): 39-56.
Tebrügge, F. and Düring, R.A., 1999. Reducing tillage intensity -- a review of results from a long-
term study in Germany. Soil Tillage Res., 53(1): 15-28.
Tejada, M., Gonzalez, J.L., García-Martínez, A.M. and Parrado, J., 2008. Application of a green
manure and green manure composted with beet vinasse on soil restoration: Effects on soil
properties. Bioresour. Technol., 99(11): 4949-4957.
Thomas, F., Rossi, J.P., Decaens, T., Grimaldi, M., Lavelle, P., Martins, P. and Garnier-Zarli, E.,
2008. Comparative analysis of Andiodrilus pachoensis casts in forests and pastures of
South-Eastern Amazon (Brazil). Eur. J. Soil Biol., 44(5-6): 545-553.
Tisdall, J.M. and Oades, J.M., 1982. Organic matter and water-stable aggregates in soils. Eur. J.
Soil Sci., 33(2): 141-163.
Tisdall, J.M., 1985. earthworm activity in irrigated red-brown used for annual crops in Victoria.
Aust. J. Soil Res., 23(2): 291-299.
Tomlin, A.D., Shipitalo, M.J., Edwards, W.M. and Protz, R., 1995. Earthworms and their influence
on soil structure and infiltration. In: P.F. Hendrix (Editor), Earthworm Ecology and
Biogeography in North America. CRC Press, Boca Raton, pp. 159-183.
Topoliantz, S., Ponge, J.F. and Viaux, P., 2000. Earthworm and enchytraeid activity under different
arable farming systems, as exemplified by biogenic structures. Plant and Soil, 225(1-2):
39-51.
Trojan, M.D. and Linden, D.R., 1998. Macroporosity and hydraulic properties of earthworm-affected
soils as influenced by tillage and residue management. Soil Sci. Soc. Am. J., 62(6): 1687-
1692.
van Eekeren, N., de Boer, H., Bloem, J., Schouten, T., Rutgers, M., de Goede, R. and Brussaard, L.,
2009. Soil biological quality of grassland fertilized with adjusted cattle manure slurries in
comparison with organic and inorganic fertilizers. Biol. Fertil. Soils, 45(6): 595-608.
Vandenbygaart, A.J., Protz, R. and Tomlin, A.D., 1999a. Changes in pore structure in a no-till
chronosequence of silt loam soils, southern Ontario. Can. J. Soil Sci., 79(1): 149-160.
Vandenbygaart, A.J., Protz, R., Tomlin, A.D. and Miller, J.J., 1999b. Tillage system effects on near-
surface soil morphology : observations from the landscape to micro-scale in silt loam soils
of southwestern Ontario. Soil Tillage Res., 51: 139-149.
Vandenbygaart, A.J., Fox, C.A., Fallow, D.J. and Protz, R., 2000. Estimating earthworm-influenced
soil structure by morphometric image analysis. Soil Sci. Soc. Am. J., 64(3): 982-988.
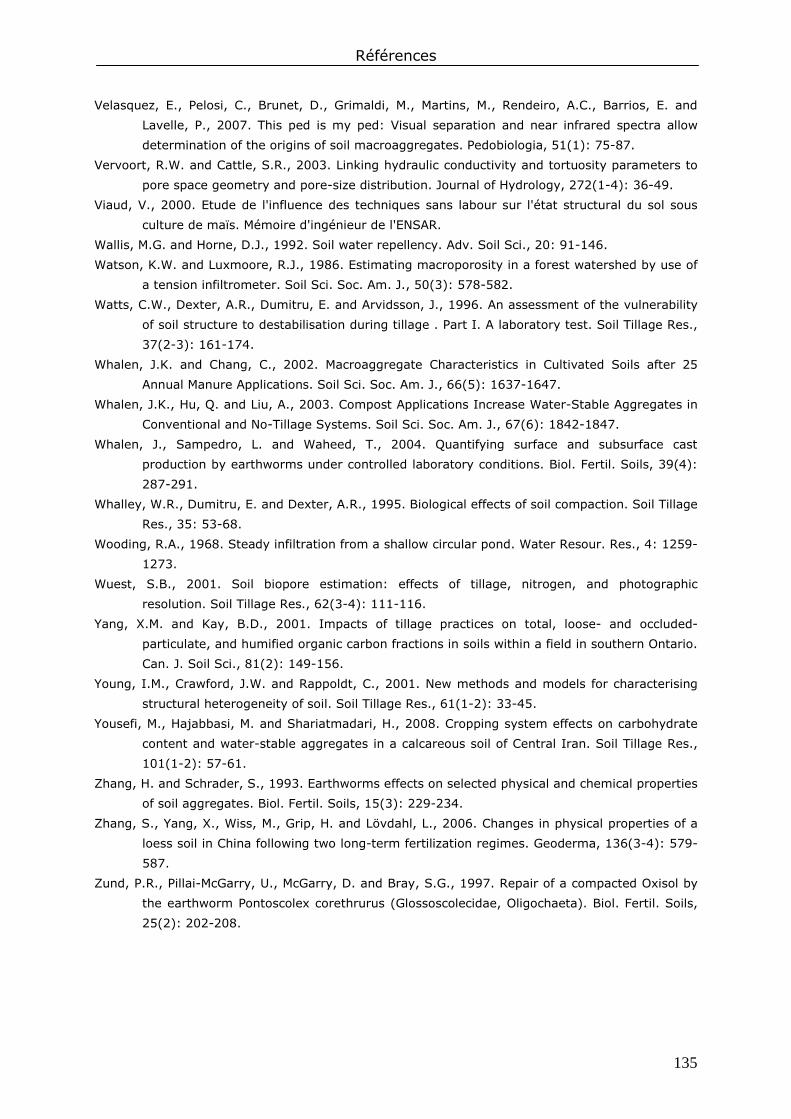
Références
135
Velasquez, E., Pelosi, C., Brunet, D., Grimaldi, M., Martins, M., Rendeiro, A.C., Barrios, E. and
Lavelle, P., 2007. This ped is my ped: Visual separation and near infrared spectra allow
determination of the origins of soil macroaggregates. Pedobiologia, 51(1): 75-87.
Vervoort, R.W. and Cattle, S.R., 2003. Linking hydraulic conductivity and tortuosity parameters to
pore space geometry and pore-size distribution. Journal of Hydrology, 272(1-4): 36-49.
Viaud, V., 2000. Etude de l'influence des techniques sans labour sur l'état structural du sol sous
culture de maïs. Mémoire d'ingénieur de l'ENSAR.
Wallis, M.G. and Horne, D.J., 1992. Soil water repellency. Adv. Soil Sci., 20: 91-146.
Watson, K.W. and Luxmoore, R.J., 1986. Estimating macroporosity in a forest watershed by use of
a tension infiltrometer. Soil Sci. Soc. Am. J., 50(3): 578-582.
Watts, C.W., Dexter, A.R., Dumitru, E. and Arvidsson, J., 1996. An assessment of the vulnerability
of soil structure to destabilisation during tillage . Part I. A laboratory test. Soil Tillage Res.,
37(2-3): 161-174.
Whalen, J.K. and Chang, C., 2002. Macroaggregate Characteristics in Cultivated Soils after 25
Annual Manure Applications. Soil Sci. Soc. Am. J., 66(5): 1637-1647.
Whalen, J.K., Hu, Q. and Liu, A., 2003. Compost Applications Increase Water-Stable Aggregates in
Conventional and No-Tillage Systems. Soil Sci. Soc. Am. J., 67(6): 1842-1847.
Whalen, J., Sampedro, L. and Waheed, T., 2004. Quantifying surface and subsurface cast
production by earthworms under controlled laboratory conditions. Biol. Fertil. Soils, 39(4):
287-291.
Whalley, W.R., Dumitru, E. and Dexter, A.R., 1995. Biological effects of soil compaction. Soil Tillage
Res., 35: 53-68.
Wooding, R.A., 1968. Steady infiltration from a shallow circular pond. Water Resour. Res., 4: 1259-
1273.
Wuest, S.B., 2001. Soil biopore estimation: effects of tillage, nitrogen, and photographic
resolution. Soil Tillage Res., 62(3-4): 111-116.
Yang, X.M. and Kay, B.D., 2001. Impacts of tillage practices on total, loose- and occluded-
particulate, and humified organic carbon fractions in soils within a field in southern Ontario.
Can. J. Soil Sci., 81(2): 149-156.
Young, I.M., Crawford, J.W. and Rappoldt, C., 2001. New methods and models for characterising
structural heterogeneity of soil. Soil Tillage Res., 61(1-2): 33-45.
Yousefi, M., Hajabbasi, M. and Shariatmadari, H., 2008. Cropping system effects on carbohydrate
content and water-stable aggregates in a calcareous soil of Central Iran. Soil Tillage Res.,
101(1-2): 57-61.
Zhang, H. and Schrader, S., 1993. Earthworms effects on selected physical and chemical properties
of soil aggregates. Biol. Fertil. Soils, 15(3): 229-234.
Zhang, S., Yang, X., Wiss, M., Grip, H. and Lövdahl, L., 2006. Changes in physical properties of a
loess soil in China following two long-term fertilization regimes. Geoderma, 136(3-4): 579-
587.
Zund, P.R., Pillai-McGarry, U., McGarry, D. and Bray, S.G., 1997. Repair of a compacted Oxisol by
the earthworm Pontoscolex corethrurus (Glossoscolecidae, Oligochaeta). Biol. Fertil. Soils,
25(2): 202-208.

Annexes


139
Annexes
Se référer aux chapitres pour la signification des abréviations
Annexe 1. Tableau présentant les données brutes issues du chapitre 4 (Impact des
pratiques culturales sur l’abondance des biostructures lombriciennes).
Factor Earthworm biostructures (%)
D T F Bloc BU FC PCCs PCCm PCCl
DEC-06 MP M 1 0.45 0.77 0.07 0.05 0.00
DEC-06 MP M 1 0.45 0.70 0.12 0.13 0.04
DEC-06 MP M 2 1.58 0.13 0.09 0.08 0.04
DEC-06 MP M 2 0.25 0.57 0.10 0.01 0.02
DEC-06 MP M 3 0.62 0.00 0.08 0.03 0.05
DEC-06 MP M 3 0.18 0.51 0.08 0.04 0.03
DEC-06 MP O 1 0.31 0.77 0.08 0.10 0.12
DEC-06 MP O 1 0.11 0.96 0.15 0.11 0.12
DEC-06 MP O 2 0.73 0.00 0.15 0.04 0.01
DEC-06 MP O 3 0.07 0.51 0.11 0.04 0.73
DEC-06 MP O 3 0.13 0.26 0.14 0.20 0.04
DEC-06 NT M 1 0.68 2.23 0.41 0.48 0.62
DEC-06 NT M 2 2.14 2.49 0.31 0.35 0.62
DEC-06 NT M 3 0.63 2.23 0.11 0.06 0.12
DEC-06 NT O 1 1.53 4.21 0.19 0.22 0.21
DEC-06 NT O 1 2.60 2.30 0.23 0.29 0.13
DEC-06 NT O 2 1.02 1.15 0.22 0.12 0.02
DEC-06 NT O 2 0.47 0.26 0.20 0.11 0.22
DEC-06 NT O 3 1.71 2.23 0.21 0.18 0.14
DEC-06 ST M 1 0.56 0.64 0.09 0.05 0.04
DEC-06 ST M 1 0.21 1.15 0.09 0.04 0.02
DEC-06 ST M 2 0.09 0.38 0.06 0.00 0.03
DEC-06 ST M 3 0.79 1.21 0.08 0.02 0.05
DEC-06 ST O 1 0.51 2.87 0.10 0.09 0.08
DEC-06 ST O 1 1.69 0.89 0.10 0.06 0.05
DEC-06 ST O 2 0.34 0.32 0.04 0.03 0.06
DEC-06 ST O 2 0.00 2.10 0.11 0.11 0.21
DEC-06 ST O 3 0.00 1.21 0.12 0.03 0.01
DEC-06 ST O 3 0.28 1.47 0.07 0.02 0.00
MAR-07 MP M 1 0.30 0.06 0.10 0.02 0.00
MAR-07 MP M 1 0.54 0.45 0.09 0.05 0.02
MAR-07 MP M 2 0.63 0.83 0.11 0.03 0.06
MAR-07 MP M 2 0.57 0.38 0.11 0.13 0.02
MAR-07 MP M 3 0.99 0.70 0.07 0.05 0.02
MAR-07 MP M 3 0.61 0.51 0.11 0.09 0.05
MAR-07 MP O 1 1.19 2.10 0.07 0.10 0.02
MAR-07 MP O 1 0.93 0.77 0.10 0.02 0.00
MAR-07 MP O 2 1.54 0.89 0.07 0.10 0.03
MAR-07 MP O 2 0.66 1.66 0.11 0.08 0.06
MAR-07 MP O 3 0.75 0.57 0.08 0.10 0.06
MAR-07 MP O 3 0.38 0.32 0.06 0.00 0.00

Annexes
140
Factor Earthworm biostructures (%)
D T F Bloc BU FC PCCs PCCm PCCl
MAR-07 NT M 1 1.18 1.66 0.23 0.18 0.15
MAR-07 NT M 1 0.89 3.32 0.28 0.17 0.00
MAR-07 NT M 2 1.00 0.57 0.34 0.25 0.23
MAR-07 NT M 2 1.29 1.66 0.25 0.17 0.18
MAR-07 NT M 3 2.07 0.89 0.34 0.14 0.16
MAR-07 NT M 3 1.12 0.45 0.25 0.26 0.22
MAR-07 NT O 1 1.65 0.89 0.28 0.22 0.20
MAR-07 NT O 1 2.20 1.79 0.22 0.14 0.14
MAR-07 NT O 2 0.34 3.57 0.25 0.18 0.07
MAR-07 NT O 2 3.73 0.57 0.22 0.14 0.05
MAR-07 NT O 3 1.83 1.59 0.16 0.07 0.15
MAR-07 NT O 3 2.06 1.40 0.18 0.10 0.08
MAR-07 ST M 1 0.38 0.26 0.08 0.02 0.00
MAR-07 ST M 2 1.21 0.51 0.14 0.06 0.11
MAR-07 ST M 3 0.09 0.13 0.07 0.03 0.08
MAR-07 ST O 1 0.69 0.77 0.13 0.02 0.00
MAR-07 ST O 1 0.69 1.02 0.11 0.15 0.00
MAR-07 ST O 2 0.90 0.57 0.05 0.02 0.02
MAR-07 ST O 2 1.45 1.08 0.11 0.02 0.00
MAR-07 ST O 3 1.05 0.70 0.09 0.08 0.20
MAR-07 ST O 3 1.85 0.26 0.09 0.00 0.00
MAY-07 MP M 1 1.31 1.21 0.09 0.07 0.09
MAY-07 MP M 1 0.73 0.70 0.17 0.09 0.66
MAY-07 MP M 2 1.08 1.15 0.10 0.01 0.00
MAY-07 MP M 2 0.29 0.96 0.12 0.11 0.03
MAY-07 MP M 3 0.16 1.21 0.06 0.09 0.20
MAY-07 MP O 1 1.35 2.81 0.17 0.09 0.06
MAY-07 MP O 1 1.00 3.95 0.15 0.09 0.03
MAY-07 MP O 2 0.65 2.55 0.13 0.08 0.05
MAY-07 MP O 2 2.31 1.15 0.10 0.10 0.05
MAY-07 MP O 3 1.69 0.83 0.08 0.03 0.32
MAY-07 MP O 3 0.73 1.47 0.10 0.03 0.08
MAY-07 NT M 1 1.04 4.15 0.23 0.36 0.00
MAY-07 NT M 1 1.38 1.28 0.33 0.38 0.27
MAY-07 NT M 2 1.20 1.91 0.16 0.18 1.31
MAY-07 NT M 3 0.74 2.30 0.13 0.14 0.22
MAY-07 NT M 3 2.62 2.81 0.20 0.10 0.23
MAY-07 NT O 1 1.19 5.23 0.28 0.36 0.47
MAY-07 NT O 2 0.66 1.98 0.20 0.24 0.33
MAY-07 NT O 3 0.93 1.59 0.35 0.34 0.36
MAY-07 NT O 3 2.11 2.10 0.29 0.41 0.60
MAY-07 ST M 1 1.22 1.72 0.15 0.10 0.05
MAY-07 ST M 1 1.26 0.26 0.12 0.07 0.17
MAY-07 ST M 2 0.48 0.38 0.15 0.22 0.12
MAY-07 ST M 3 0.43 1.15 0.14 0.03 0.01
MAY-07 ST O 1 1.09 0.83 0.27 0.17 0.31
MAY-07 ST O 2 0.00 1.40 0.08 0.04 0.18
MAY-07 ST O 3 0.82 1.28 0.14 0.09 0.05
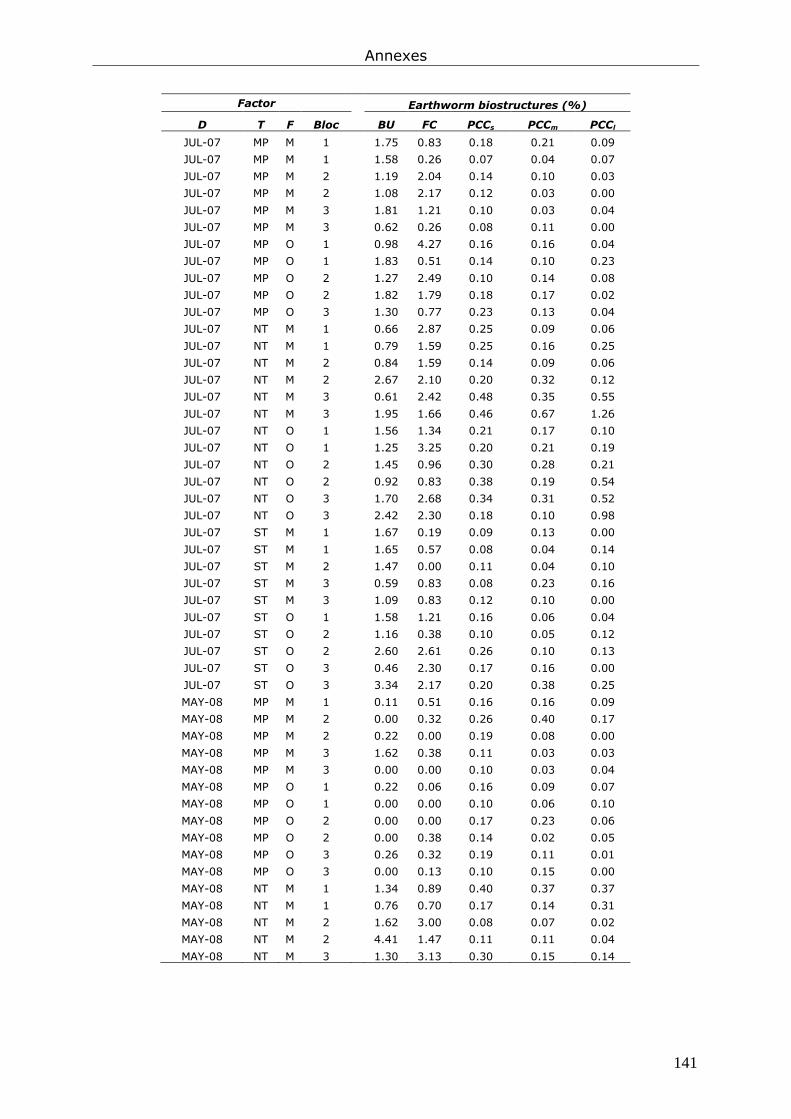
Annexes
141
Factor Earthworm biostructures (%)
D T F Bloc BU FC PCCs PCCm PCCl
JUL-07 MP M 1 1.75 0.83 0.18 0.21 0.09
JUL-07 MP M 1 1.58 0.26 0.07 0.04 0.07
JUL-07 MP M 2 1.19 2.04 0.14 0.10 0.03
JUL-07 MP M 2 1.08 2.17 0.12 0.03 0.00
JUL-07 MP M 3 1.81 1.21 0.10 0.03 0.04
JUL-07 MP M 3 0.62 0.26 0.08 0.11 0.00
JUL-07 MP O 1 0.98 4.27 0.16 0.16 0.04
JUL-07 MP O 1 1.83 0.51 0.14 0.10 0.23
JUL-07 MP O 2 1.27 2.49 0.10 0.14 0.08
JUL-07 MP O 2 1.82 1.79 0.18 0.17 0.02
JUL-07 MP O 3 1.30 0.77 0.23 0.13 0.04
JUL-07 NT M 1 0.66 2.87 0.25 0.09 0.06
JUL-07 NT M 1 0.79 1.59 0.25 0.16 0.25
JUL-07 NT M 2 0.84 1.59 0.14 0.09 0.06
JUL-07 NT M 2 2.67 2.10 0.20 0.32 0.12
JUL-07 NT M 3 0.61 2.42 0.48 0.35 0.55
JUL-07 NT M 3 1.95 1.66 0.46 0.67 1.26
JUL-07 NT O 1 1.56 1.34 0.21 0.17 0.10
JUL-07 NT O 1 1.25 3.25 0.20 0.21 0.19
JUL-07 NT O 2 1.45 0.96 0.30 0.28 0.21
JUL-07 NT O 2 0.92 0.83 0.38 0.19 0.54
JUL-07 NT O 3 1.70 2.68 0.34 0.31 0.52
JUL-07 NT O 3 2.42 2.30 0.18 0.10 0.98
JUL-07 ST M 1 1.67 0.19 0.09 0.13 0.00
JUL-07 ST M 1 1.65 0.57 0.08 0.04 0.14
JUL-07 ST M 2 1.47 0.00 0.11 0.04 0.10
JUL-07 ST M 3 0.59 0.83 0.08 0.23 0.16
JUL-07 ST M 3 1.09 0.83 0.12 0.10 0.00
JUL-07 ST O 1 1.58 1.21 0.16 0.06 0.04
JUL-07 ST O 2 1.16 0.38 0.10 0.05 0.12
JUL-07 ST O 2 2.60 2.61 0.26 0.10 0.13
JUL-07 ST O 3 0.46 2.30 0.17 0.16 0.00
JUL-07 ST O 3 3.34 2.17 0.20 0.38 0.25
MAY-08 MP M 1 0.11 0.51 0.16 0.16 0.09
MAY-08 MP M 2 0.00 0.32 0.26 0.40 0.17
MAY-08 MP M 2 0.22 0.00 0.19 0.08 0.00
MAY-08 MP M 3 1.62 0.38 0.11 0.03 0.03
MAY-08 MP M 3 0.00 0.00 0.10 0.03 0.04
MAY-08 MP O 1 0.22 0.06 0.16 0.09 0.07
MAY-08 MP O 1 0.00 0.00 0.10 0.06 0.10
MAY-08 MP O 2 0.00 0.00 0.17 0.23 0.06
MAY-08 MP O 2 0.00 0.38 0.14 0.02 0.05
MAY-08 MP O 3 0.26 0.32 0.19 0.11 0.01
MAY-08 MP O 3 0.00 0.13 0.10 0.15 0.00
MAY-08 NT M 1 1.34 0.89 0.40 0.37 0.37
MAY-08 NT M 1 0.76 0.70 0.17 0.14 0.31
MAY-08 NT M 2 1.62 3.00 0.08 0.07 0.02
MAY-08 NT M 2 4.41 1.47 0.11 0.11 0.04
MAY-08 NT M 3 1.30 3.13 0.30 0.15 0.14
Annexes
142
Factor Earthworm biostructures (%)
D T F Bloc BU FC PCCs PCCm PCCl
MAY-08 NT O 1 2.51 2.55 0.32 0.41 0.39
MAY-08 NT O 1 1.44 5.61 0.22 0.16 0.18
MAY-08 NT O 2 2.11 1.79 0.21 0.17 0.10
MAY-08 NT O 2 2.31 1.53 0.28 0.34 0.07
MAY-08 NT O 3 3.73 2.61 0.17 0.20 0.21
MAY-08 NT O 3 2.45 0.38 0.31 0.28 0.13
MAY-08 ST M 1 0.21 0.19 0.12 0.08 0.10
MAY-08 ST M 1 1.06 0.57 0.11 0.14 0.10
MAY-08 ST M 2 1.18 0.00 0.08 0.05 0.00
MAY-08 ST M 3 0.15 0.70 0.11 0.08 0.07
MAY-08 ST M 3 0.11 0.00 0.07 0.00 0.01
MAY-08 ST O 1 1.34 0.13 0.11 0.05 0.11
MAY-08 ST O 1 0.65 0.13 0.10 0.11 0.11
MAY-08 ST O 2 0.80 0.00 0.17 0.07 0.03
MAY-08 ST O 2 1.24 0.51 0.19 0.26 0.03
MAY-08 ST O 3 0.00 0.00 0.12 0.06 0.05
MAY-08 ST O 3 0.19 0.13 0.10 0.07 0.01
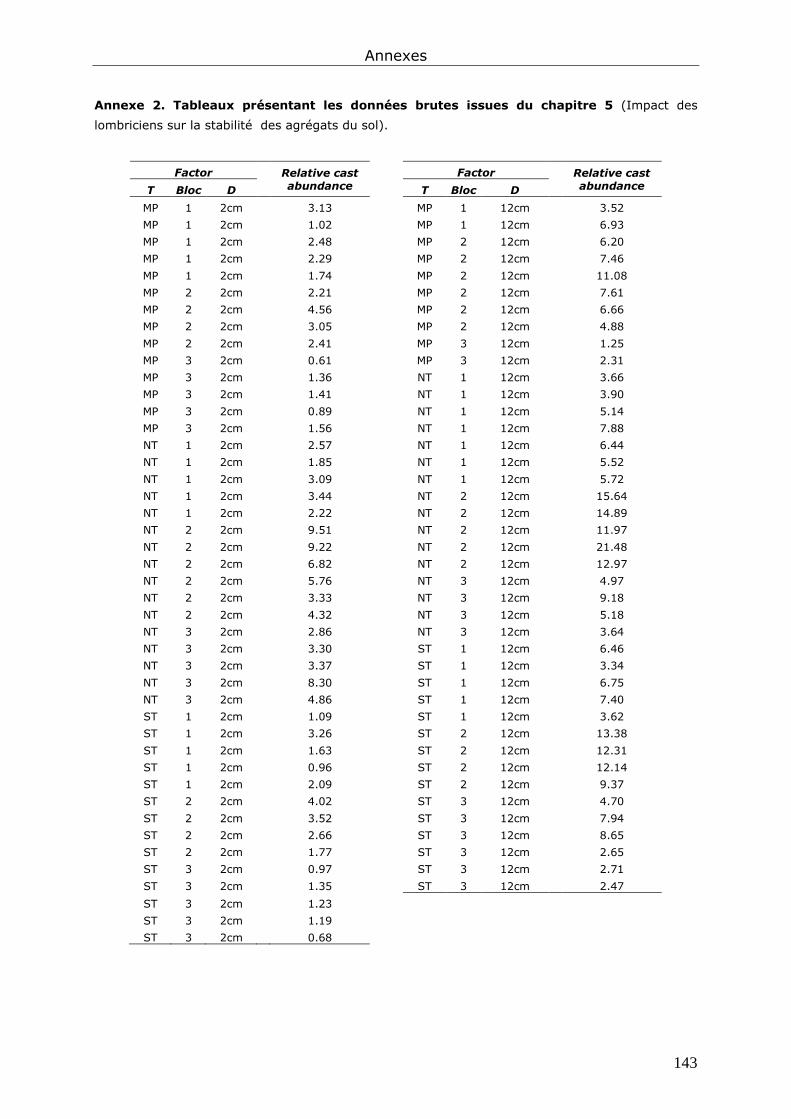
Annexes
143
Annexe 2. Tableaux présentant les données brutes issues du chapitre 5 (Impact des
lombriciens sur la stabilité des agrégats du sol).
Factor Relative cast abundance
Factor Relative cast abundance T Bloc D T Bloc D
MP 1 2cm 3.13 MP 1 12cm 3.52
MP 1 2cm 1.02 MP 1 12cm 6.93
MP 1 2cm 2.48 MP 2 12cm 6.20
MP 1 2cm 2.29 MP 2 12cm 7.46
MP 1 2cm 1.74 MP 2 12cm 11.08
MP 2 2cm 2.21 MP 2 12cm 7.61
MP 2 2cm 4.56 MP 2 12cm 6.66
MP 2 2cm 3.05 MP 2 12cm 4.88
MP 2 2cm 2.41 MP 3 12cm 1.25
MP 3 2cm 0.61 MP 3 12cm 2.31
MP 3 2cm 1.36 NT 1 12cm 3.66
MP 3 2cm 1.41 NT 1 12cm 3.90
MP 3 2cm 0.89 NT 1 12cm 5.14
MP 3 2cm 1.56 NT 1 12cm 7.88
NT 1 2cm 2.57 NT 1 12cm 6.44
NT 1 2cm 1.85 NT 1 12cm 5.52
NT 1 2cm 3.09 NT 1 12cm 5.72
NT 1 2cm 3.44 NT 2 12cm 15.64
NT 1 2cm 2.22 NT 2 12cm 14.89
NT 2 2cm 9.51 NT 2 12cm 11.97
NT 2 2cm 9.22 NT 2 12cm 21.48
NT 2 2cm 6.82 NT 2 12cm 12.97
NT 2 2cm 5.76 NT 3 12cm 4.97
NT 2 2cm 3.33 NT 3 12cm 9.18
NT 2 2cm 4.32 NT 3 12cm 5.18
NT 3 2cm 2.86 NT 3 12cm 3.64
NT 3 2cm 3.30 ST 1 12cm 6.46
NT 3 2cm 3.37 ST 1 12cm 3.34
NT 3 2cm 8.30 ST 1 12cm 6.75
NT 3 2cm 4.86 ST 1 12cm 7.40
ST 1 2cm 1.09 ST 1 12cm 3.62
ST 1 2cm 3.26 ST 2 12cm 13.38
ST 1 2cm 1.63 ST 2 12cm 12.31
ST 1 2cm 0.96 ST 2 12cm 12.14
ST 1 2cm 2.09 ST 2 12cm 9.37
ST 2 2cm 4.02 ST 3 12cm 4.70
ST 2 2cm 3.52 ST 3 12cm 7.94
ST 2 2cm 2.66 ST 3 12cm 8.65
ST 2 2cm 1.77 ST 3 12cm 2.65
ST 3 2cm 0.97 ST 3 12cm 2.71
ST 3 2cm 1.35 ST 3 12cm 2.47
ST 3 2cm 1.23
ST 3 2cm 1.19
ST 3 2cm 0.68

Annexes
144
Factor FW* (mm)
MB* (mm)
SW* (mm)
MWD (mm)
C
(g kg-1)
HWEC (mg g-1)
WR (s)
O T Bloc D
Casts MP 1 2 cm 0.35 3.22 1.47 1.68 20.58 1.72 1.09
Casts MP 2 2 cm 0.32 3.08 1.49 1.63 21.41 1.36 1.11
Casts MP 3 2 cm 0.59 2.99 2.07 1.88 22.51 1.51 1.19
Casts ST 1 2 cm 0.80 2.98 2.34 2.04 24.33 2.00 2.97
Casts ST 2 2 cm 0.64 2.95 2.76 2.12 23.51 1.73 3.29
Casts ST 3 2 cm 0.81 3.20 2.89 2.30 24.03 1.85 1.45
Casts NT 1 2 cm 0.70 3.01 2.36 2.02 23.64 1.81 1.53
Casts NT 2 2 cm 0.52 3.03 2.35 1.96 23.61 2.14 3.19
Casts NT 3 2 cm 0.60 3.06 2.07 1.91 24.17 2.00 1.51
Bulk soil MP 1 2 cm 0.35 2.98 1.90 1.74 19.93 1.36 0.85
Bulk soil MP 2 2 cm 0.38 3.10 1.50 1.66 20.64 1.41 0.90
Bulk soil MP 3 2 cm 0.33 3.20 1.75 1.76 22.28 1.30 0.92
Bulk soil ST 1 2 cm 0.74 3.21 2.04 2.00 23.53 1.76 1.00
Bulk soil ST 2 2 cm 0.71 3.21 2.25 2.06 23.60 1.65 0.89
Bulk soil ST 3 2 cm 0.64 3.25 2.24 2.04 23.57 1.70 0.92
Bulk soil NT 1 2 cm 0.64 3.12 2.03 1.93 23.96 1.66 0.86
Bulk soil NT 2 2 cm 0.82 3.06 2.32 2.07 23.93 1.73 0.92
Bulk soil NT 3 2 cm 0.67 3.03 2.45 2.05 25.09 2.13 1.07
Casts MP 1 12 cm 0.62 3.05 2.13 1.94 23.72 1.87 0.97
Casts MP 2 12 cm 0.42 3.13 1.96 1.84 22.31 1.56 1.01
Casts MP 3 12 cm 0.37 3.28 1.89 1.85 21.35 0.92 1.07
Casts ST 1 12 cm 0.46 3.22 2.52 2.07 21.03 0.93 1.47
Casts ST 2 12 cm 0.40 3.26 2.71 2.12 20.95 1.01 1.33
Casts ST 3 12 cm 0.43 3.28 2.33 2.02 21.09 1.12 1.60
Casts NT 1 12 cm 0.62 3.30 2.52 2.15 23.28 1.06 2.48
Casts NT 2 12 cm 0.77 3.33 2.83 2.31 22.70 1.20 2.56
Casts NT 3 12 cm 0.41 3.15 2.53 2.03 21.61 1.02 2.54
Bulk soil MP 1 12 cm 0.45 2.70 2.04 1.73 20.46 1.01 0.83
Bulk soil MP 2 12 cm 0.51 2.77 1.41 1.56 19.79 0.89 0.89
Bulk soil MP 3 12 cm 0.40 2.85 1.37 1.54 18.96 1.04 1.08
Bulk soil ST 1 12 cm 0.51 3.09 1.65 1.75 19.93 0.83 2.00
Bulk soil ST 2 12 cm 0.64 3.15 1.51 1.77 20.19 0.85 1.65
Bulk soil ST 3 12 cm 0.40 3.22 1.14 1.59 20.60 0.95 1.29
Bulk soil NT 1 12 cm 0.61 2.98 2.36 1.98 20.22 1.05 1.68
Bulk soil NT 2 12 cm 0.48 3.02 2.40 1.97 21.13 0.91 1.98
Bulk soil NT 3 12 cm 0.67 3.08 2.87 2.21 21.57 1.16 2.12
* Soil aggregate stability expressed as the mean weight diameter according to the fast wetting test
(FW), the mechanical breakdown test (MB) and the slow wetting test (SW).

Annexes
145
Annexe 3. Tableau présentant les données brutes issues du chapitre 6 (Impact des
pratiques culturales sur la stabilité des agrégats du sol).
Factor C (g kg-1)
HWEC (mg g-1)
WR (S)
WC (g kg-1)
AS (mm)
D T F Bloc
APR-07 MP M 1 19.98 0.81 0.83 245 0.88
APR-07 MP M 2 19.76 0.93 1.02 248 0.95
APR-07 MP M 3 18.57 0.82 1.17 218 1.01
APR-07 MP O 1 20.18 1.10 1.54 260 1.24
APR-07 MP O 2 20.77 0.90 1.08 252 1.25
APR-07 MP O 3 19.24 1.11 1.30 236 1.25
APR-07 ST M 1 22.17 1.05 0.98 238 1.20
APR-07 ST M 2 21.71 1.18 0.97 262 1.10
APR-07 ST M 3 20.00 0.93 1.46 241 1.16
APR-07 ST O 1 25.46 1.46 2.79 324 1.17
APR-07 ST O 2 25.19 1.10 1.08 286 1.13
APR-07 ST O 3 24.85 1.17 0.84 258 1.20
APR-07 NT M 1 23.40 1.15 1.22 255 1.34
APR-07 NT M 2 24.00 1.11 1.25 272 1.32
APR-07 NT M 3 21.89 1.09 1.25 241 1.30
APR-07 NT O 1 24.68 1.85 2.09 317 1.41
APR-07 NT O 2 21.06 1.15 0.97 289 1.50
APR-07 NT O 3 26.49 1.37 1.54 281 1.42
MAY-07 MP M 1 19.79 0.74 2.23 257 1.01
MAY-07 MP M 2 21.30 0.96 1.76 276 1.11
MAY-07 MP M 3 19.45 0.79 2.55 257 1.09
MAY-07 MP O 1 20.57 0.80 1.73 268 1.25
MAY-07 MP O 2 22.92 0.84 2.19 272 1.21
MAY-07 MP O 3 21.81 1.20 1.19 257 1.19
MAY-07 ST M 1 23.38 1.25 2.04 291 1.54
MAY-07 ST M 2 27.30 1.42 3.24 311 1.94
MAY-07 ST M 3 22.81 0.99 1.78 268 1.16
MAY-07 ST O 1 24.52 1.39 1.56 314 1.65
MAY-07 ST O 2 25.79 1.50 1.84 313 1.72
MAY-07 ST O 3 22.71 1.11 1.89 284 1.58
MAY-07 NT M 1 25.63 2.03 1.40 275 1.68
MAY-07 NT M 2 22.84 1.14 1.50 260 1.35
MAY-07 NT M 3 24.16 1.18 1.43 271 1.48
MAY-07 NT O 1 27.07 0.99 1.42 318 1.66
MAY-07 NT O 2 23.03 1.16 1.53 306 1.38
MAY-07 NT O 3 24.78 1.29 2.13 278 1.91
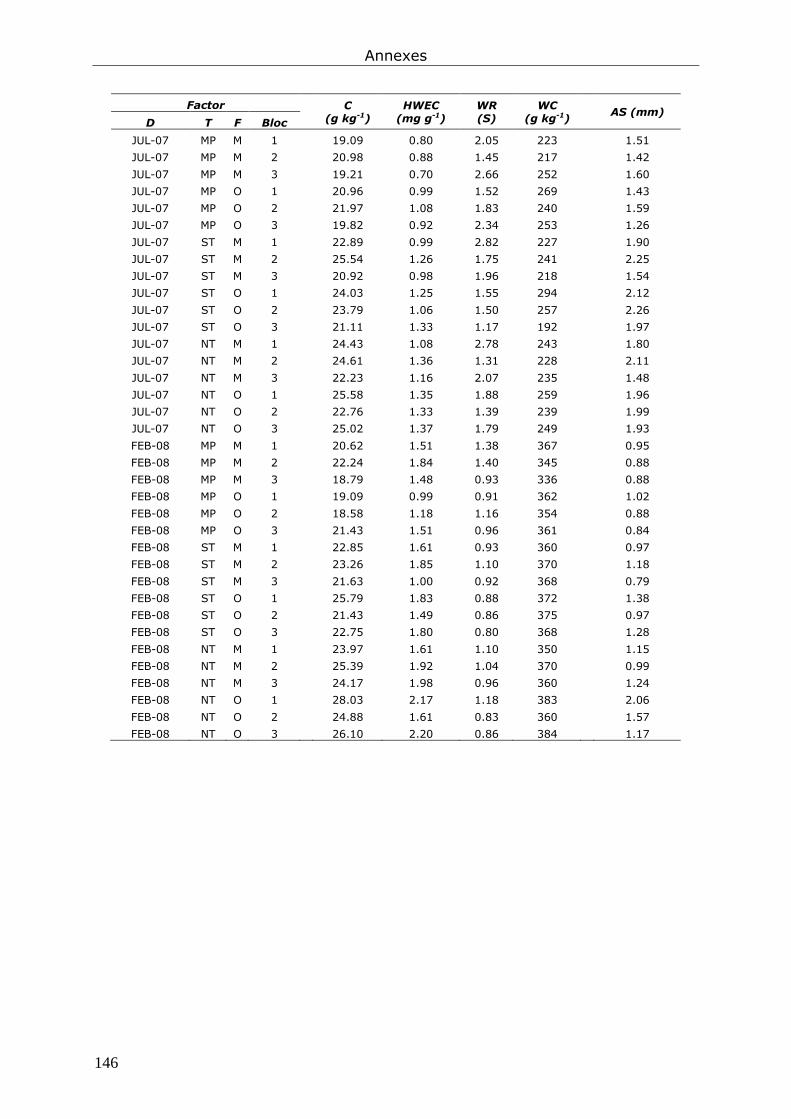
Annexes
146
Factor C (g kg-1)
HWEC (mg g-1)
WR (S)
WC (g kg-1)
AS (mm)
D T F Bloc
JUL-07 MP M 1 19.09 0.80 2.05 223 1.51
JUL-07 MP M 2 20.98 0.88 1.45 217 1.42
JUL-07 MP M 3 19.21 0.70 2.66 252 1.60
JUL-07 MP O 1 20.96 0.99 1.52 269 1.43
JUL-07 MP O 2 21.97 1.08 1.83 240 1.59
JUL-07 MP O 3 19.82 0.92 2.34 253 1.26
JUL-07 ST M 1 22.89 0.99 2.82 227 1.90
JUL-07 ST M 2 25.54 1.26 1.75 241 2.25
JUL-07 ST M 3 20.92 0.98 1.96 218 1.54
JUL-07 ST O 1 24.03 1.25 1.55 294 2.12
JUL-07 ST O 2 23.79 1.06 1.50 257 2.26
JUL-07 ST O 3 21.11 1.33 1.17 192 1.97
JUL-07 NT M 1 24.43 1.08 2.78 243 1.80
JUL-07 NT M 2 24.61 1.36 1.31 228 2.11
JUL-07 NT M 3 22.23 1.16 2.07 235 1.48
JUL-07 NT O 1 25.58 1.35 1.88 259 1.96
JUL-07 NT O 2 22.76 1.33 1.39 239 1.99
JUL-07 NT O 3 25.02 1.37 1.79 249 1.93
FEB-08 MP M 1 20.62 1.51 1.38 367 0.95
FEB-08 MP M 2 22.24 1.84 1.40 345 0.88
FEB-08 MP M 3 18.79 1.48 0.93 336 0.88
FEB-08 MP O 1 19.09 0.99 0.91 362 1.02
FEB-08 MP O 2 18.58 1.18 1.16 354 0.88
FEB-08 MP O 3 21.43 1.51 0.96 361 0.84
FEB-08 ST M 1 22.85 1.61 0.93 360 0.97
FEB-08 ST M 2 23.26 1.85 1.10 370 1.18
FEB-08 ST M 3 21.63 1.00 0.92 368 0.79
FEB-08 ST O 1 25.79 1.83 0.88 372 1.38
FEB-08 ST O 2 21.43 1.49 0.86 375 0.97
FEB-08 ST O 3 22.75 1.80 0.80 368 1.28
FEB-08 NT M 1 23.97 1.61 1.10 350 1.15
FEB-08 NT M 2 25.39 1.92 1.04 370 0.99
FEB-08 NT M 3 24.17 1.98 0.96 360 1.24
FEB-08 NT O 1 28.03 2.17 1.18 383 2.06
FEB-08 NT O 2 24.88 1.61 0.83 360 1.57
FEB-08 NT O 3 26.10 2.20 0.86 384 1.17

Annexes
147
Annexe 4. Tableaux présentant les données brutes issues du chapitre 7 (Impact des
pratiques culturales sur la macroporosité et la perméabilité du sol).
Factor Porosity size (%) Pore shape (%) Macro-porosity (%) D T F Bloc Small Medium Large Regular Elongated Complex
DEC-06 MP M 1 9.00 2.06 1.21 4.81 3.55 2.82 12.27 DEC-06 MP M 1 9.42 1.84 0.43 4.07 3.57 3.33 11.69 DEC-06 MP M 2 8.49 3.49 2.37 3.17 4.72 6.69 14.35 DEC-06 MP M 2 10.37 3.32 1.77 4.55 3.39 7.51 15.45 DEC-06 MP M 3 8.60 1.89 1.06 3.34 3.46 4.74 11.55 DEC-06 MP M 3 7.39 1.49 0.66 4.15 2.53 2.85 9.54 DEC-06 MP O 1 10.19 2.75 1.37 3.50 3.94 6.87 14.31 DEC-06 MP O 1 10.96 2.53 0.90 4.52 2.58 7.29 14.39 DEC-06 MP O 2 6.73 1.43 1.08 4.81 2.84 1.58 9.24 DEC-06 MP O 3 8.74 3.08 2.38 4.64 2.69 6.87 14.20 DEC-06 MP O 3 5.56 2.72 2.94 3.29 3.40 4.53 11.21 DEC-06 NT M 1 5.65 0.64 0.79 2.72 2.18 2.18 7.08 DEC-06 NT M 1 6.13 1.50 2.11 3.22 2.84 3.68 9.74 DEC-06 NT M 3 4.95 1.89 2.46 1.99 1.50 5.82 9.31 DEC-06 NT O 1 8.38 2.79 4.53 3.15 3.13 9.42 15.70 DEC-06 NT O 1 9.47 2.80 5.01 3.41 3.63 10.25 17.29 DEC-06 NT O 2 2.65 0.51 0.78 1.69 1.34 0.90 3.93 DEC-06 NT O 2 2.70 1.82 2.65 1.40 0.50 5.28 7.18 DEC-06 NT O 3 5.15 1.15 1.58 3.44 1.58 2.85 7.87 DEC-06 ST M 1 8.11 0.63 1.24 4.99 1.49 3.50 9.98 DEC-06 ST M 1 8.77 1.92 1.11 3.99 2.23 5.59 11.80 DEC-06 ST M 2 10.43 5.53 7.57 4.12 4.59 14.82 23.53 DEC-06 ST M 3 6.01 1.89 1.35 3.98 1.58 3.70 9.25 DEC-06 ST O 1 8.35 4.46 6.10 4.66 2.49 11.75 18.90 DEC-06 ST O 1 9.05 2.85 7.12 5.26 3.43 10.34 19.02 DEC-06 ST O 2 8.50 3.32 4.40 5.09 3.81 7.31 16.22 DEC-06 ST O 2 7.45 3.24 4.33 3.47 2.85 8.70 15.02 DEC-06 ST O 3 5.58 3.87 2.96 3.19 3.14 6.08 12.41 DEC-06 ST O 3 4.92 2.83 2.65 3.46 2.50 4.44 10.40 MAR-07 MP M 1 6.92 1.87 1.98 4.23 3.29 1.85 10.77 MAR-07 MP M 1 5.45 1.28 1.10 4.19 1.97 0.68 7.84 MAR-07 MP M 2 6.60 2.94 3.37 4.28 3.56 4.63 12.91 MAR-07 MP M 2 8.81 4.38 4.57 3.67 4.52 9.90 17.75 MAR-07 MP M 3 7.65 2.52 7.51 4.98 3.78 8.91 17.67 MAR-07 MP M 3 9.52 4.05 3.63 6.00 3.65 7.55 17.20 MAR-07 MP O 1 4.48 1.22 2.54 4.42 1.47 1.60 8.24 MAR-07 MP O 1 5.94 2.73 3.13 5.84 3.23 1.91 11.80 MAR-07 MP O 2 5.43 2.45 6.24 4.01 5.42 4.02 14.12 MAR-07 MP O 3 9.50 4.55 4.67 5.00 3.57 10.15 18.72 MAR-07 MP O 3 3.96 3.08 5.30 3.13 1.83 7.38 12.34 MAR-07 NT M 1 4.54 1.31 1.60 3.01 1.68 2.43 7.45 MAR-07 NT M 1 5.18 2.19 3.42 3.96 3.24 2.82 10.79 MAR-07 NT M 2 4.24 1.19 1.01 2.59 1.44 2.41 6.44 MAR-07 NT M 2 5.30 1.40 2.84 3.03 1.83 4.68 9.54 MAR-07 NT M 3 3.63 0.92 2.52 2.62 2.56 1.88 7.07 MAR-07 NT M 3 4.35 0.76 1.48 2.61 1.47 2.51 6.59
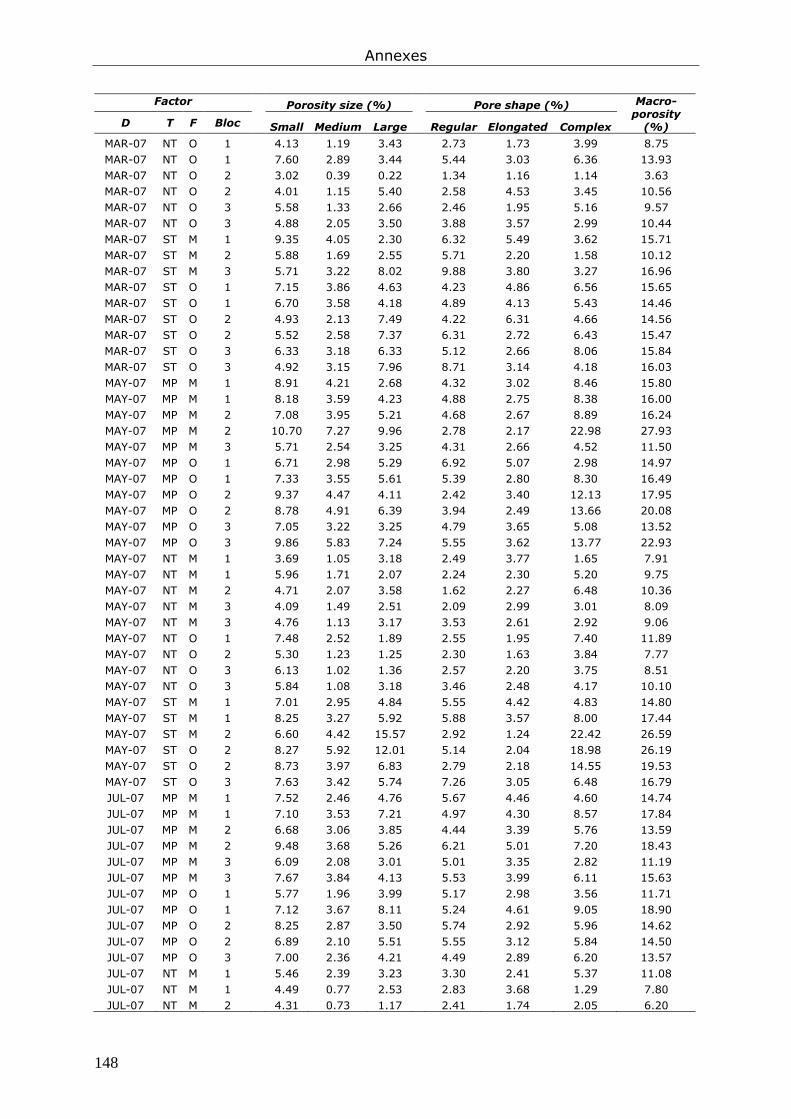
Annexes
148
Factor Porosity size (%) Pore shape (%) Macro-porosity (%) D T F Bloc Small Medium Large Regular Elongated Complex
MAR-07 NT O 1 4.13 1.19 3.43 2.73 1.73 3.99 8.75 MAR-07 NT O 1 7.60 2.89 3.44 5.44 3.03 6.36 13.93 MAR-07 NT O 2 3.02 0.39 0.22 1.34 1.16 1.14 3.63 MAR-07 NT O 2 4.01 1.15 5.40 2.58 4.53 3.45 10.56 MAR-07 NT O 3 5.58 1.33 2.66 2.46 1.95 5.16 9.57 MAR-07 NT O 3 4.88 2.05 3.50 3.88 3.57 2.99 10.44 MAR-07 ST M 1 9.35 4.05 2.30 6.32 5.49 3.62 15.71 MAR-07 ST M 2 5.88 1.69 2.55 5.71 2.20 1.58 10.12 MAR-07 ST M 3 5.71 3.22 8.02 9.88 3.80 3.27 16.96 MAR-07 ST O 1 7.15 3.86 4.63 4.23 4.86 6.56 15.65 MAR-07 ST O 1 6.70 3.58 4.18 4.89 4.13 5.43 14.46 MAR-07 ST O 2 4.93 2.13 7.49 4.22 6.31 4.66 14.56 MAR-07 ST O 2 5.52 2.58 7.37 6.31 2.72 6.43 15.47 MAR-07 ST O 3 6.33 3.18 6.33 5.12 2.66 8.06 15.84 MAR-07 ST O 3 4.92 3.15 7.96 8.71 3.14 4.18 16.03 MAY-07 MP M 1 8.91 4.21 2.68 4.32 3.02 8.46 15.80 MAY-07 MP M 1 8.18 3.59 4.23 4.88 2.75 8.38 16.00 MAY-07 MP M 2 7.08 3.95 5.21 4.68 2.67 8.89 16.24 MAY-07 MP M 2 10.70 7.27 9.96 2.78 2.17 22.98 27.93 MAY-07 MP M 3 5.71 2.54 3.25 4.31 2.66 4.52 11.50 MAY-07 MP O 1 6.71 2.98 5.29 6.92 5.07 2.98 14.97 MAY-07 MP O 1 7.33 3.55 5.61 5.39 2.80 8.30 16.49 MAY-07 MP O 2 9.37 4.47 4.11 2.42 3.40 12.13 17.95 MAY-07 MP O 2 8.78 4.91 6.39 3.94 2.49 13.66 20.08 MAY-07 MP O 3 7.05 3.22 3.25 4.79 3.65 5.08 13.52 MAY-07 MP O 3 9.86 5.83 7.24 5.55 3.62 13.77 22.93 MAY-07 NT M 1 3.69 1.05 3.18 2.49 3.77 1.65 7.91 MAY-07 NT M 1 5.96 1.71 2.07 2.24 2.30 5.20 9.75 MAY-07 NT M 2 4.71 2.07 3.58 1.62 2.27 6.48 10.36 MAY-07 NT M 3 4.09 1.49 2.51 2.09 2.99 3.01 8.09 MAY-07 NT M 3 4.76 1.13 3.17 3.53 2.61 2.92 9.06 MAY-07 NT O 1 7.48 2.52 1.89 2.55 1.95 7.40 11.89 MAY-07 NT O 2 5.30 1.23 1.25 2.30 1.63 3.84 7.77 MAY-07 NT O 3 6.13 1.02 1.36 2.57 2.20 3.75 8.51 MAY-07 NT O 3 5.84 1.08 3.18 3.46 2.48 4.17 10.10 MAY-07 ST M 1 7.01 2.95 4.84 5.55 4.42 4.83 14.80 MAY-07 ST M 1 8.25 3.27 5.92 5.88 3.57 8.00 17.44 MAY-07 ST M 2 6.60 4.42 15.57 2.92 1.24 22.42 26.59 MAY-07 ST O 2 8.27 5.92 12.01 5.14 2.04 18.98 26.19 MAY-07 ST O 2 8.73 3.97 6.83 2.79 2.18 14.55 19.53 MAY-07 ST O 3 7.63 3.42 5.74 7.26 3.05 6.48 16.79 JUL-07 MP M 1 7.52 2.46 4.76 5.67 4.46 4.60 14.74 JUL-07 MP M 1 7.10 3.53 7.21 4.97 4.30 8.57 17.84 JUL-07 MP M 2 6.68 3.06 3.85 4.44 3.39 5.76 13.59 JUL-07 MP M 2 9.48 3.68 5.26 6.21 5.01 7.20 18.43 JUL-07 MP M 3 6.09 2.08 3.01 5.01 3.35 2.82 11.19 JUL-07 MP M 3 7.67 3.84 4.13 5.53 3.99 6.11 15.63 JUL-07 MP O 1 5.77 1.96 3.99 5.17 2.98 3.56 11.71 JUL-07 MP O 1 7.12 3.67 8.11 5.24 4.61 9.05 18.90 JUL-07 MP O 2 8.25 2.87 3.50 5.74 2.92 5.96 14.62 JUL-07 MP O 2 6.89 2.10 5.51 5.55 3.12 5.84 14.50 JUL-07 MP O 3 7.00 2.36 4.21 4.49 2.89 6.20 13.57 JUL-07 NT M 1 5.46 2.39 3.23 3.30 2.41 5.37 11.08 JUL-07 NT M 1 4.49 0.77 2.53 2.83 3.68 1.29 7.80 JUL-07 NT M 2 4.31 0.73 1.17 2.41 1.74 2.05 6.20
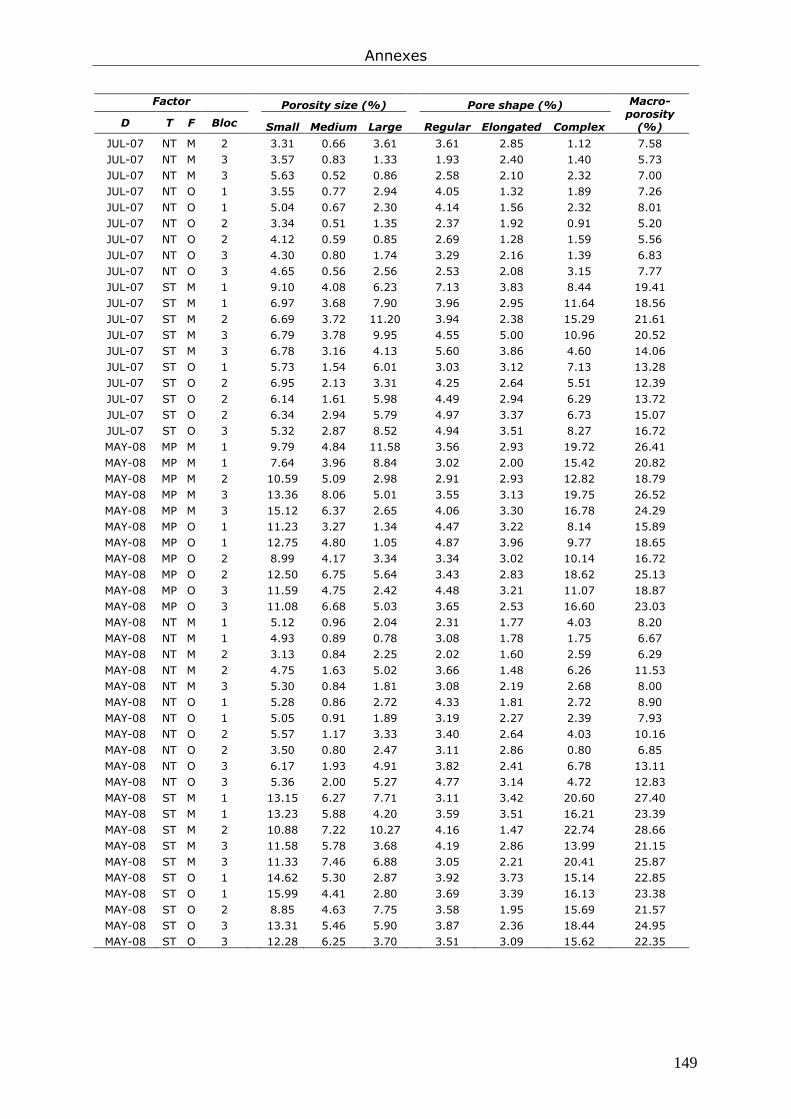
Annexes
149
Factor Porosity size (%) Pore shape (%) Macro-porosity (%) D T F Bloc Small Medium Large Regular Elongated Complex
JUL-07 NT M 2 3.31 0.66 3.61 3.61 2.85 1.12 7.58 JUL-07 NT M 3 3.57 0.83 1.33 1.93 2.40 1.40 5.73 JUL-07 NT M 3 5.63 0.52 0.86 2.58 2.10 2.32 7.00 JUL-07 NT O 1 3.55 0.77 2.94 4.05 1.32 1.89 7.26 JUL-07 NT O 1 5.04 0.67 2.30 4.14 1.56 2.32 8.01 JUL-07 NT O 2 3.34 0.51 1.35 2.37 1.92 0.91 5.20 JUL-07 NT O 2 4.12 0.59 0.85 2.69 1.28 1.59 5.56 JUL-07 NT O 3 4.30 0.80 1.74 3.29 2.16 1.39 6.83 JUL-07 NT O 3 4.65 0.56 2.56 2.53 2.08 3.15 7.77 JUL-07 ST M 1 9.10 4.08 6.23 7.13 3.83 8.44 19.41 JUL-07 ST M 1 6.97 3.68 7.90 3.96 2.95 11.64 18.56 JUL-07 ST M 2 6.69 3.72 11.20 3.94 2.38 15.29 21.61 JUL-07 ST M 3 6.79 3.78 9.95 4.55 5.00 10.96 20.52 JUL-07 ST M 3 6.78 3.16 4.13 5.60 3.86 4.60 14.06 JUL-07 ST O 1 5.73 1.54 6.01 3.03 3.12 7.13 13.28 JUL-07 ST O 2 6.95 2.13 3.31 4.25 2.64 5.51 12.39 JUL-07 ST O 2 6.14 1.61 5.98 4.49 2.94 6.29 13.72 JUL-07 ST O 2 6.34 2.94 5.79 4.97 3.37 6.73 15.07 JUL-07 ST O 3 5.32 2.87 8.52 4.94 3.51 8.27 16.72 MAY-08 MP M 1 9.79 4.84 11.58 3.56 2.93 19.72 26.41 MAY-08 MP M 1 7.64 3.96 8.84 3.02 2.00 15.42 20.82 MAY-08 MP M 2 10.59 5.09 2.98 2.91 2.93 12.82 18.79 MAY-08 MP M 3 13.36 8.06 5.01 3.55 3.13 19.75 26.52 MAY-08 MP M 3 15.12 6.37 2.65 4.06 3.30 16.78 24.29 MAY-08 MP O 1 11.23 3.27 1.34 4.47 3.22 8.14 15.89 MAY-08 MP O 1 12.75 4.80 1.05 4.87 3.96 9.77 18.65 MAY-08 MP O 2 8.99 4.17 3.34 3.34 3.02 10.14 16.72 MAY-08 MP O 2 12.50 6.75 5.64 3.43 2.83 18.62 25.13 MAY-08 MP O 3 11.59 4.75 2.42 4.48 3.21 11.07 18.87 MAY-08 MP O 3 11.08 6.68 5.03 3.65 2.53 16.60 23.03 MAY-08 NT M 1 5.12 0.96 2.04 2.31 1.77 4.03 8.20 MAY-08 NT M 1 4.93 0.89 0.78 3.08 1.78 1.75 6.67 MAY-08 NT M 2 3.13 0.84 2.25 2.02 1.60 2.59 6.29 MAY-08 NT M 2 4.75 1.63 5.02 3.66 1.48 6.26 11.53 MAY-08 NT M 3 5.30 0.84 1.81 3.08 2.19 2.68 8.00 MAY-08 NT O 1 5.28 0.86 2.72 4.33 1.81 2.72 8.90 MAY-08 NT O 1 5.05 0.91 1.89 3.19 2.27 2.39 7.93 MAY-08 NT O 2 5.57 1.17 3.33 3.40 2.64 4.03 10.16 MAY-08 NT O 2 3.50 0.80 2.47 3.11 2.86 0.80 6.85 MAY-08 NT O 3 6.17 1.93 4.91 3.82 2.41 6.78 13.11 MAY-08 NT O 3 5.36 2.00 5.27 4.77 3.14 4.72 12.83 MAY-08 ST M 1 13.15 6.27 7.71 3.11 3.42 20.60 27.40 MAY-08 ST M 1 13.23 5.88 4.20 3.59 3.51 16.21 23.39 MAY-08 ST M 2 10.88 7.22 10.27 4.16 1.47 22.74 28.66 MAY-08 ST M 3 11.58 5.78 3.68 4.19 2.86 13.99 21.15 MAY-08 ST M 3 11.33 7.46 6.88 3.05 2.21 20.41 25.87 MAY-08 ST O 1 14.62 5.30 2.87 3.92 3.73 15.14 22.85 MAY-08 ST O 1 15.99 4.41 2.80 3.69 3.39 16.13 23.38 MAY-08 ST O 2 8.85 4.63 7.75 3.58 1.95 15.69 21.57 MAY-08 ST O 3 13.31 5.46 5.90 3.87 2.36 18.44 24.95 MAY-08 ST O 3 12.28 6.25 3.70 3.51 3.09 15.62 22.35
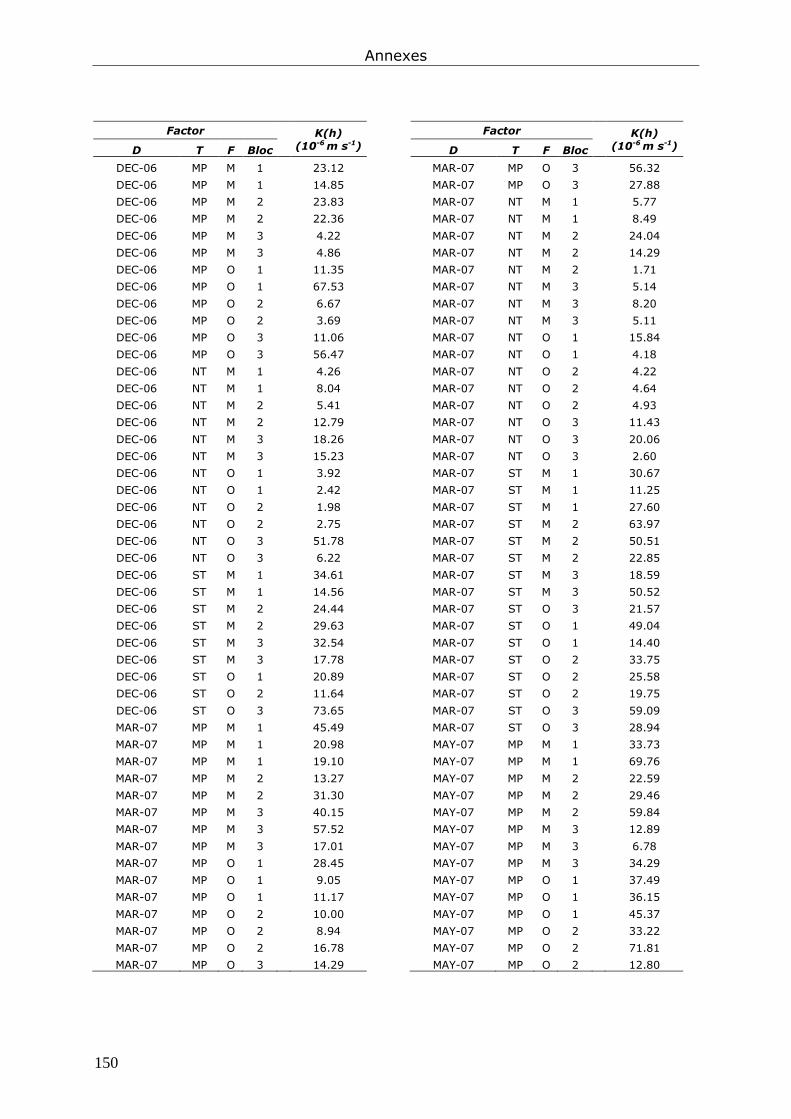
Annexes
150
Factor K(h) (10-6 m s-1)
Factor K(h) (10-6 m s-1) D T F Bloc D T F Bloc
DEC-06 MP M 1 23.12 MAR-07 MP O 3 56.32
DEC-06 MP M 1 14.85 MAR-07 MP O 3 27.88
DEC-06 MP M 2 23.83 MAR-07 NT M 1 5.77
DEC-06 MP M 2 22.36 MAR-07 NT M 1 8.49
DEC-06 MP M 3 4.22 MAR-07 NT M 2 24.04
DEC-06 MP M 3 4.86 MAR-07 NT M 2 14.29
DEC-06 MP O 1 11.35 MAR-07 NT M 2 1.71
DEC-06 MP O 1 67.53 MAR-07 NT M 3 5.14
DEC-06 MP O 2 6.67 MAR-07 NT M 3 8.20
DEC-06 MP O 2 3.69 MAR-07 NT M 3 5.11
DEC-06 MP O 3 11.06 MAR-07 NT O 1 15.84
DEC-06 MP O 3 56.47 MAR-07 NT O 1 4.18
DEC-06 NT M 1 4.26 MAR-07 NT O 2 4.22
DEC-06 NT M 1 8.04 MAR-07 NT O 2 4.64
DEC-06 NT M 2 5.41 MAR-07 NT O 2 4.93
DEC-06 NT M 2 12.79 MAR-07 NT O 3 11.43
DEC-06 NT M 3 18.26 MAR-07 NT O 3 20.06
DEC-06 NT M 3 15.23 MAR-07 NT O 3 2.60
DEC-06 NT O 1 3.92 MAR-07 ST M 1 30.67
DEC-06 NT O 1 2.42 MAR-07 ST M 1 11.25
DEC-06 NT O 2 1.98 MAR-07 ST M 1 27.60
DEC-06 NT O 2 2.75 MAR-07 ST M 2 63.97
DEC-06 NT O 3 51.78 MAR-07 ST M 2 50.51
DEC-06 NT O 3 6.22 MAR-07 ST M 2 22.85
DEC-06 ST M 1 34.61 MAR-07 ST M 3 18.59
DEC-06 ST M 1 14.56 MAR-07 ST M 3 50.52
DEC-06 ST M 2 24.44 MAR-07 ST O 3 21.57
DEC-06 ST M 2 29.63 MAR-07 ST O 1 49.04
DEC-06 ST M 3 32.54 MAR-07 ST O 1 14.40
DEC-06 ST M 3 17.78 MAR-07 ST O 2 33.75
DEC-06 ST O 1 20.89 MAR-07 ST O 2 25.58
DEC-06 ST O 2 11.64 MAR-07 ST O 2 19.75
DEC-06 ST O 3 73.65 MAR-07 ST O 3 59.09
MAR-07 MP M 1 45.49 MAR-07 ST O 3 28.94
MAR-07 MP M 1 20.98 MAY-07 MP M 1 33.73
MAR-07 MP M 1 19.10 MAY-07 MP M 1 69.76
MAR-07 MP M 2 13.27 MAY-07 MP M 2 22.59
MAR-07 MP M 2 31.30 MAY-07 MP M 2 29.46
MAR-07 MP M 3 40.15 MAY-07 MP M 2 59.84
MAR-07 MP M 3 57.52 MAY-07 MP M 3 12.89
MAR-07 MP M 3 17.01 MAY-07 MP M 3 6.78
MAR-07 MP O 1 28.45 MAY-07 MP M 3 34.29
MAR-07 MP O 1 9.05 MAY-07 MP O 1 37.49
MAR-07 MP O 1 11.17 MAY-07 MP O 1 36.15
MAR-07 MP O 2 10.00 MAY-07 MP O 1 45.37
MAR-07 MP O 2 8.94 MAY-07 MP O 2 33.22
MAR-07 MP O 2 16.78 MAY-07 MP O 2 71.81
MAR-07 MP O 3 14.29 MAY-07 MP O 2 12.80

Annexes
151
Factor K(h) (10-6 m s-1)
Factor K(h) (10-6 m s-1) D T F Bloc D T F Bloc
MAY-07 MP O 3 40.11 JUL-07 MP O 3 3.14
MAY-07 MP O 3 9.71 JUL-07 MP O 3 21.41
MAY-07 MP O 3 12.30 JUL-07 ST M 1 19.86
MAY-07 NT M 1 29.78 JUL-07 ST M 1 15.58
MAY-07 NT M 1 9.50 JUL-07 ST M 2 13.59
MAY-07 NT M 1 58.73 JUL-07 ST M 2 73.50
MAY-07 NT M 2 4.91 JUL-07 ST M 2 28.52
MAY-07 NT M 2 2.56 JUL-07 ST M 3 122.96
MAY-07 NT M 2 11.65 JUL-07 ST M 3 29.83
MAY-07 NT M 3 2.37 JUL-07 ST M 3 28.28
MAY-07 NT M 3 8.90 JUL-07 ST O 1 9.01
MAY-07 NT M 3 7.44 JUL-07 ST O 1 14.21
MAY-07 NT O 1 13.02 JUL-07 ST O 1 7.68
MAY-07 NT O 1 12.19 JUL-07 ST O 2 13.12
MAY-07 NT O 1 16.50 JUL-07 ST O 2 6.25
MAY-07 NT O 2 24.41 JUL-07 ST O 3 23.30
MAY-07 NT O 2 24.23 JUL-07 ST O 3 46.95
MAY-07 NT O 2 14.45 JUL-07 ST O 3 39.64
MAY-07 NT O 3 10.48 JUL-07 NT M 1 12.36
MAY-07 NT O 3 6.70 JUL-07 NT M 1 7.60
MAY-07 NT O 3 14.76 JUL-07 NT M 1 7.50
MAY-07 ST M 1 31.06 JUL-07 NT M 2 9.36
MAY-07 ST M 1 27.19 JUL-07 NT M 2 3.80
MAY-07 ST M 1 61.76 JUL-07 NT M 2 6.06
MAY-07 ST M 2 36.21 JUL-07 NT M 3 8.57
MAY-07 ST M 2 94.04 JUL-07 NT O 1 3.04
MAY-07 ST M 2 42.26 JUL-07 NT O 1 2.92
MAY-07 ST M 3 14.67 JUL-07 NT O 1 4.20
MAY-07 ST O 1 40.82 JUL-07 NT O 2 1.61
MAY-07 ST O 1 82.89 JUL-07 NT O 2 3.78
MAY-07 ST O 2 12.84 JUL-07 NT O 2 1.85
MAY-07 ST O 2 48.40 JUL-07 NT O 3 3.63
MAY-07 ST O 2 11.09 JUL-07 NT O 3 3.96
MAY-07 ST O 3 9.44 JUL-07 NT O 3 1.63
MAY-07 ST O 3 12.55 MAY-08 MP M 1 44.60
JUL-07 MP M 1 7.25 MAY-08 MP M 1 44.02
JUL-07 MP M 1 5.02 MAY-08 MP M 2 49.80
JUL-07 MP M 2 26.47 MAY-08 MP M 3 24.99
JUL-07 MP M 2 3.71 MAY-08 MP M 3 30.27
JUL-07 MP M 2 20.10 MAY-08 MP M 3 57.03
JUL-07 MP M 3 12.52 MAY-08 MP O 1 45.25
JUL-07 MP O 1 10.19 MAY-08 MP O 1 29.05
JUL-07 MP O 1 3.02 MAY-08 MP O 1 34.22
JUL-07 MP O 1 4.83 MAY-08 MP O 2 31.00
JUL-07 MP O 2 10.68 MAY-08 MP O 2 62.36
JUL-07 MP O 2 13.84 MAY-08 MP O 2 72.61
JUL-07 MP O 2 6.06 MAY-08 MP O 3 22.71
JUL-07 MP O 3 4.81 MAY-08 MP O 3 25.88

Annexes
152
Factor K(h)
(10-6 m s-1) D T F Bloc
MAY-08 NT M 1 17.91
MAY-08 NT M 1 9.12
MAY-08 NT M 1 10.27
MAY-08 NT M 2 19.24
MAY-08 NT M 2 16.81
MAY-08 NT M 2 15.47
MAY-08 NT M 3 17.33
MAY-08 NT M 3 36.89
MAY-08 NT M 3 7.74
MAY-08 NT O 1 27.92
MAY-08 NT O 1 34.75
MAY-08 NT O 1 27.48
MAY-08 NT O 2 16.46
MAY-08 NT O 2 7.52
MAY-08 NT O 2 18.17
MAY-08 NT O 3 8.32
MAY-08 NT O 3 5.02
MAY-08 NT O 3 12.29
MAY-08 ST M 1 72.63
MAY-08 ST M 1 78.15
MAY-08 ST M 1 50.52
MAY-08 ST M 2 27.71
MAY-08 ST M 2 32.85
MAY-08 ST M 2 53.45
MAY-08 ST O 1 62.15
MAY-08 ST O 1 46.38
MAY-08 ST O 1 70.06
MAY-08 ST O 2 40.56
MAY-08 ST O 2 81.34
MAY-08 ST O 2 38.35
MAY-08 ST O 3 29.84
MAY-08 ST O 3 43.16
MAY-08 ST O 3 35.70