Embed Size (px)
Citation preview
FACULTAD DE FARMACIA
Contribution of Phenolics and Maillard Reaction Products to the Antioxidant Capacity of Coffee
Brews
Contribución de los compuestos fenólicos y producto s de la reacción de Maillard a la capacidad antioxida nte
de bebida de café
Iziar Amaia Ludwig Sanz-Orrio
Pamplona, Junio de 2013

Facultad de Farmacia
Contribution of Phenolics and Maillard Reaction Products to the Antioxidant Capacity of Coffee
Brews
Contribución de los compuestos fenólicos y producto s de la reacción de Maillard a la capacidad antioxidante de bebidas de café
Memoria presentada por Dña. Iziar Amaia Ludwig Sanz-Orrio para aspirar al grado de Doctor
por la Universidad de Navarra.
El presente trabajo ha sido realizado bajo la dirección de la Dra. Mª de la Concepción Cid
Canda y la co-dirección de la Dra. Mª Paz de Peña Fariza en el Departamento de Ciencias de
la Alimentación y Fisiología y autorizamos su presentación ante el Tribunal que lo ha de juzgar.
Pamplona, 10 Junio de 2013
Dra. Mª de la Concepción Cid Canda Dra. Mª Paz de Peña Fariza

La directora del Departamento, Dra. Diana Ansorena Artieda, CERTIFICA que el presente
trabajo de investigación ha sido realizado por la Licenciada Dña. Iziar Amaia Ludwig Sanz-
Orrio, en el Departamento de Ciencias de la Alimentación y Fisiología de la Facultad de
Farmacia de la Universidad de Navarra.
Dra. Diana Ansorena Artieda
En Pamplona, a 10 de Junio de 2013
Facultad de Farmacia Departamento de Ciencias de la Alimentación y Fisiología

Los datos presentados en este trabajo son el resultado de las investigaciones llevadas a cabo
dentro del proyecto “Evaluación de la actividad funcional in vitro de extractos bioactivos de café
y sus subproductos” del que es investigador principal la Dra. Mª de la Concepción Cid Canda, y
financiado por el Ministerio de Economía y Competitividad de España (AGL2009-12052)

AGRADECIMIENTOS/ACKNOWLEDGEMENTS
A las directoras de este trabajo Dña. Mª de la Concepción Cid Canda y Dña. Mª Paz de Peña
Fariza por el interés y el tiempo que han dedicado a su desarrollo.
A la Universidad de Navarra por haberme proporcionado los medios técnicos y humanos
necesarios para mi formación investigadora.
A la Asociación de Amigos de la Universidad de Navarra y al Departamento de Educación del
Gobierno de Navarra por las becas que me han concedido a lo largo de estos años. Gracias a
ellos pude llevar a cabo este proyecto de tesis y realizar una estancia pre-doctoral en el
extranjero.
A la Unión Tostadora S.A. y al Grupo Azkoyen por el suministro de las muestras de café.
I am especially grateful to Prof. Alan Crozier who welcomed me at the University of Glasgow
and gave me the wonderful opportunity to work with his research group. Furthermore I owe him
a thank you for his expert guidance and the supervision of my research work during this stay. I
wish to extend my gratitude to all the other people of the Plant Products and Human Nutrition
Group of the University of Glasgow, who always offered me advice and support.
A todos los miembros del Departamento de Ciencias de la Alimentación y Fisiología por los
momentos inolvidables que hemos pasado juntos, y de manera especial al “Coffee Team”, a las
que están y a las que vi marchar. Gracias por hacer estos años más agradables y enseñarme a
sonreir incluso en los momentos más difíciles.
Y sobre todo, a mi familia. Nada de esto hubiera sido posible sin vuestro apoyo.

A mis padres y hermanos

ABSTRACT
Coffee is one of the most consumed beverages in the world and a rich source of antioxidants.
The amounts of these antioxidants are influenced by several technological factors. Besides,
antioxidants identified in coffee (chlorogenic acids, volatile and non-volatile Maillard reaction
products) may contribute to the overall antioxidant capacity in different proportions. Therefore
the aim of this research was to evaluate the actual contribution to the overall antioxidant
capacity of coffee brews by the most relevant coffee compounds (phenolics and Maillard
reaction products). To achieve this aim, radical scavenging assays were applied to assess
overall antioxidant capacity. Qualitative and quantitative analysis of coffee components were
carried out by chromatographic methods (HPLC-PDA, HPLC-PDA-MS and GC-MS). Model
systems and the on-line ABTS-HPLC technique were used for the assessment of the
contribution of coffee compounds to the overall antioxidant capacity.
Firstly, the influence of: variety, roasting degree and roasting technique (conventional and
torrefacto), on antioxidant compounds (phenolics and Maillard reaction products) and overall
antioxidant capacity of coffee was studied. Results showed that among technological factors,
torrefacto roast increased radical scavenging capacity but had no influence on the amounts and
composition of phenolic compounds, which were more affected by the roasting degree and
variety.
Secondly, the extractability of these compounds in the most commonly used coffeemakers
(espresso and filter) and the contribution of coffee antioxidants to the overall antioxidant
capacity of the coffee brews were assessed. Brewing time and conditions have a great impact
on the extraction of antioxidants. High water pressure during the brewing process increases the
extraction speed. Nevertheless parameters like turbulence during extraction and longer contact
time favour the extraction efficacy. Volatile Maillard reaction products contribute very little to the
antioxidant capacity of coffee compared to high molecular weight Maillard reaction products
(melanoidins) and phenolic compounds. Among 22 identified coffee phenolics, caffeoylquinic
acids showed the highest contribution to the overall antioxidant capacity, whereas feruloylquinic
acids and their lactones did not have any radical scavenging capacity. Moreover, the antioxidant
capacity of the chlorogenic acids was highly dependent on their chemical structure. However,
antioxidant capacity of chlorogenic acids accounted only for 7-16 % of the overall capacity of
coffee.
Additionally, to go deeper into the fate of coffee antioxidants in the human body (after
ingestion/during passage through the gastrointestinal tract), in vitro faecal fermentation was
carried out to study the influence of the colonic microbiota on these compounds. In vitro faecal
fermentation of espresso coffee showed that chlorogenic acids are rapidly and extensively
metabolized by the human colonic microflora, leading to the formation of up to 11 degradation
products, which are better absorbed in the colon than their parent compounds.

ABREVIATIONS
ABTS 2,2’-Azino-bis(3-ethylbenzothiazonile-6-sulfonic acid) diammonium salt
CFQA Caffeoylferuloylquinic acid
CGA Chlorogenic acid
CQA Caffeoylquinic acid
CQL Caffeoylquinic acid lactone/Caffeoylquinide
dB Decibel
DiCQA Dicaffeoylquinic acid
DiFQA Diferuloylquinic acid
DPPH 2,2-Diphenyl-1-picrylhydrazyl
ESR Electron spin resonance
FC Folin-Ciocalteau
FCQA Feruloylcaffeoylquinic acid
FQA Feruloylquinic acid
FQL Feruloylquinc acid lactone/feruloylquinide
GA Gallic acid
GC Gas chromatography
HPLC High performance liquid chromatography
MR Maillard reaction
MRP Maillard reaction product
MS Mass spectrometry
mV Millivolt
pCoQA p-Coumaroylquinic acid
PDA Photodiode array
SD Standard deviation
TEAC Trolox equivalent antioxidant capacity
TEMPO 2,2,6,6-Tetramethyl-1-piperidin-1-oxyl

CONTENTS
INTRODUCTION
OBJECTIVES
EXPERIMENTAL DESIGN
RESULTS
OBJECTIVE 1
Effect of sugar addition (torrefacto) during roasting process on antioxidant capacity
and phenolics of coffee
OBJECTIVE 2
Extraction of coffee antioxidants: impact of brewing time and method
OBJECTIVE 3
Modelling the contribution of volatile compounds to the antioxidant capacity of coffee
OBJECTIVE 4
OBJECTIVE 5
Catabolism of coffee polyphenols by human colonic microbiota
GENERAL DISCUSSION
CONCLUSIONS
DISSEMINATION OF RESULTS
ANNEX
1
17
21
25
27
29
37
39
47
49
67
83
85
107
135
141
145


INTRODUCTION

Introduction
3
Coffee is the most traded commodity in the world after oil. Although native to Africa (Ethiopia,
Abyssinia), nowadays it is cultivated in regions between the Tropic of Cancer and the Tropic of
Capricorn, from 23.5 degrees above the equator to 23.5 degrees below it, also known as the
coffee belt (Illy & Viani, 2005). The generic name Coffea covers approximately 70 species, but
only two of them are economically important: Coffea arabica, commonly known as Arabica
coffee, which accounts for three quarters of world production, and Coffea canephora var.
Robusta, commonly known as Robusta coffee, with one quarter of world production. Differences
between these two species include: ideal growing climate, physical aspects, chemical
composition, and characteristics of the brew made with the ground roasted seeds. In general,
Arabica coffee brew is appreciated for its superior cup quality and aroma, whereas Robusta
brew possesses a more aggressive flavour but contains higher amounts of soluble solids,
antioxidants, and caffeine (Farah, 2012).
Green coffee composition is dominated by carbohydrates (~60 % dry matter), including soluble
and insoluble polysaccharides (cellulose, arabinogalactane, and galactomannane),
disaccharides (sucrose) and monosaccharides (glucose, galactose, arabinose, fructose,
mannose, manitol, xylose, and ribose) (Mazzafera, 1999; Hu et al., 2001). The lipid content of
green coffee account for 8-18 % of its dry matter. The coffee lipid fraction consists to 75 % of
triglyceride, other lipids are sterols (stigmasterol, sitosterol), fatty acids (linoleic, linolenic, oleic,
palmitic, stearic, araquidic, lignoceric and behenic), and pentacyclic diterpenes (methylcafestol,
cafestol, kawheol) (Kurzrock & Speer, 2001). Proteins, peptides, and free amino acids account
for 9-16% of the green coffee dry matter. The main amino acids, both protein-bound and free,
are asparagine, glutamic acid, alanine, aspartic acid and lysine (Hu et al., 2001). Several other
N-compounds are present in coffee, such as caffeine, trigonelline and nicotinic acid. The
caffeine concentration in Robusta coffee is approximately twice that of Arabica.
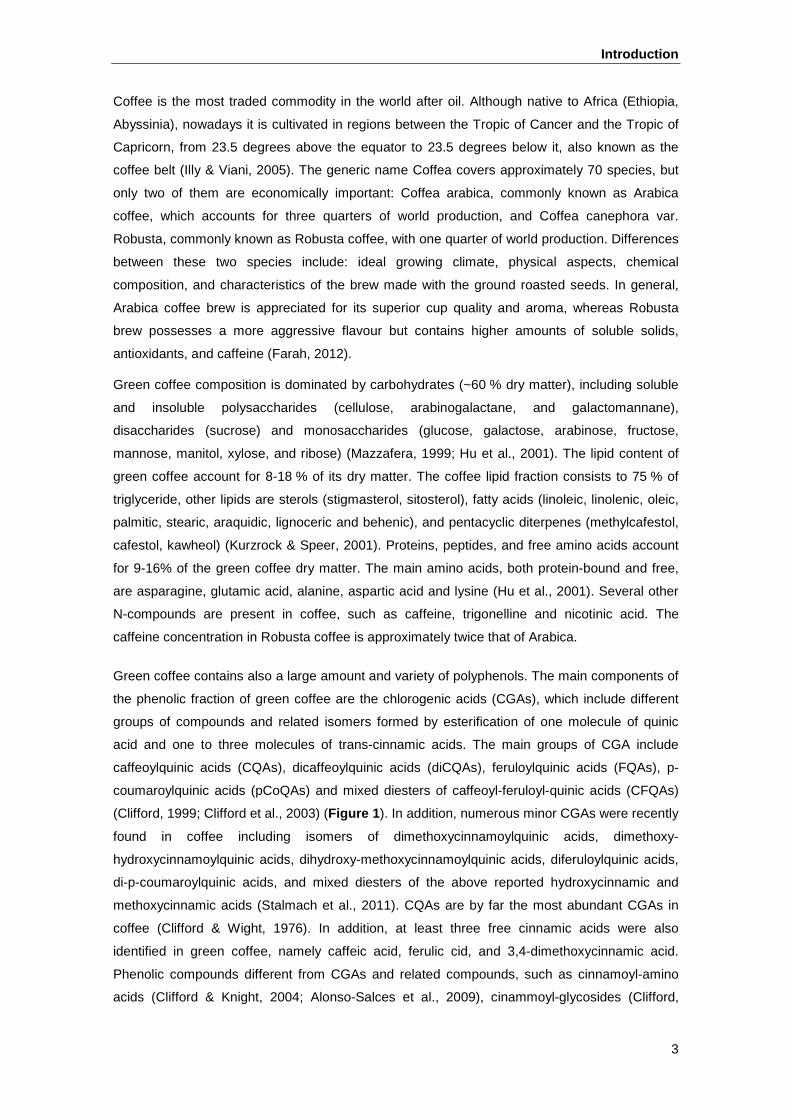
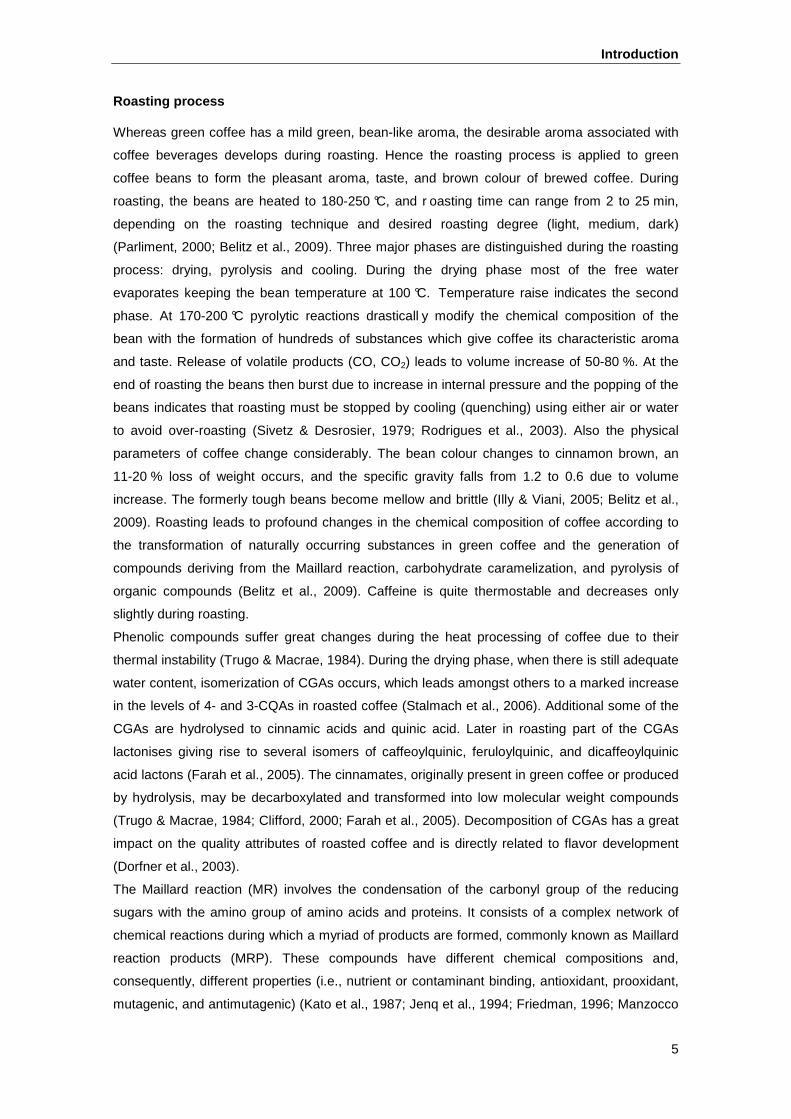
Green coffee contains also a large amount and variety of polyphenols. The main components of
the phenolic fraction of green coffee are the chlorogenic acids (CGAs), which include different
groups of compounds and related isomers formed by esterification of one molecule of quinic
acid and one to three molecules of trans-cinnamic acids. The main groups of CGA include
caffeoylquinic acids (CQAs), dicaffeoylquinic acids (diCQAs), feruloylquinic acids (FQAs), p-
coumaroylquinic acids (pCoQAs) and mixed diesters of caffeoyl-feruloyl-quinic acids (CFQAs)
(Clifford, 1999; Clifford et al., 2003) (Figure 1 ). In addition, numerous minor CGAs were recently
found in coffee including isomers of dimethoxycinnamoylquinic acids, dimethoxy-
hydroxycinnamoylquinic acids, dihydroxy-methoxycinnamoylquinic acids, diferuloylquinic acids,
di-p-coumaroylquinic acids, and mixed diesters of the above reported hydroxycinnamic and
methoxycinnamic acids (Stalmach et al., 2011). CQAs are by far the most abundant CGAs in
coffee (Clifford & Wight, 1976). In addition, at least three free cinnamic acids were also
identified in green coffee, namely caffeic acid, ferulic cid, and 3,4-dimethoxycinnamic acid.
Phenolic compounds different from CGAs and related compounds, such as cinnamoyl-amino
acids (Clifford & Knight, 2004; Alonso-Salces et al., 2009), cinammoyl-glycosides (Clifford,
Introduction
4
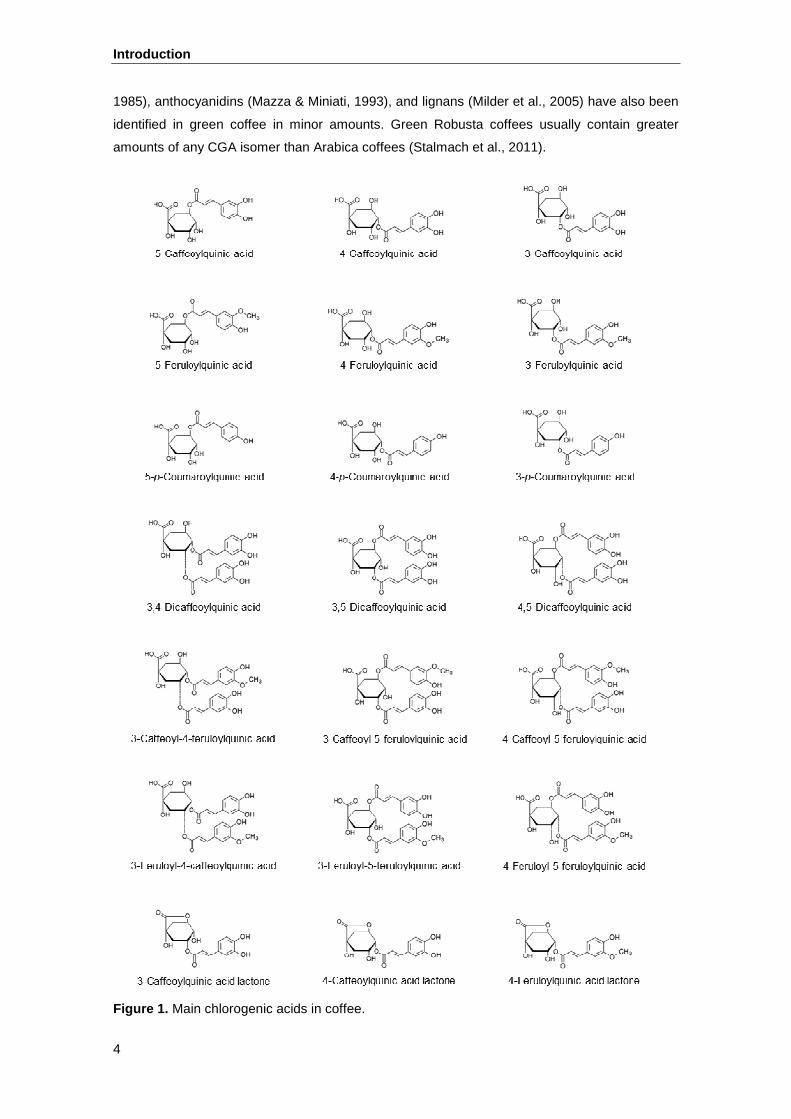
1985), anthocyanidins (Mazza & Miniati, 1993), and lignans (Milder et al., 2005) have also been
identified in green coffee in minor amounts. Green Robusta coffees usually contain greater
amounts of any CGA isomer than Arabica coffees (Stalmach et al., 2011).
Figure 1. Main chlorogenic acids in coffee.
Introduction
5
Roasting process
Whereas green coffee has a mild green, bean-like aroma, the desirable aroma associated with
coffee beverages develops during roasting. Hence the roasting process is applied to green
coffee beans to form the pleasant aroma, taste, and brown colour of brewed coffee. During
roasting, the beans are heated to 180-250 °C, and r oasting time can range from 2 to 25 min,
depending on the roasting technique and desired roasting degree (light, medium, dark)
(Parliment, 2000; Belitz et al., 2009). Three major phases are distinguished during the roasting
process: drying, pyrolysis and cooling. During the drying phase most of the free water
evaporates keeping the bean temperature at 100 °C. Temperature raise indicates the second
phase. At 170-200 °C pyrolytic reactions drasticall y modify the chemical composition of the
bean with the formation of hundreds of substances which give coffee its characteristic aroma
and taste. Release of volatile products (CO, CO2) leads to volume increase of 50-80 %. At the
end of roasting the beans then burst due to increase in internal pressure and the popping of the
beans indicates that roasting must be stopped by cooling (quenching) using either air or water
to avoid over-roasting (Sivetz & Desrosier, 1979; Rodrigues et al., 2003). Also the physical
parameters of coffee change considerably. The bean colour changes to cinnamon brown, an
11-20 % loss of weight occurs, and the specific gravity falls from 1.2 to 0.6 due to volume
increase. The formerly tough beans become mellow and brittle (Illy & Viani, 2005; Belitz et al.,
2009). Roasting leads to profound changes in the chemical composition of coffee according to
the transformation of naturally occurring substances in green coffee and the generation of
compounds deriving from the Maillard reaction, carbohydrate caramelization, and pyrolysis of
organic compounds (Belitz et al., 2009). Caffeine is quite thermostable and decreases only
slightly during roasting.
Phenolic compounds suffer great changes during the heat processing of coffee due to their
thermal instability (Trugo & Macrae, 1984). During the drying phase, when there is still adequate
water content, isomerization of CGAs occurs, which leads amongst others to a marked increase
in the levels of 4- and 3-CQAs in roasted coffee (Stalmach et al., 2006). Additional some of the
CGAs are hydrolysed to cinnamic acids and quinic acid. Later in roasting part of the CGAs
lactonises giving rise to several isomers of caffeoylquinic, feruloylquinic, and dicaffeoylquinic
acid lactons (Farah et al., 2005). The cinnamates, originally present in green coffee or produced
by hydrolysis, may be decarboxylated and transformed into low molecular weight compounds
(Trugo & Macrae, 1984; Clifford, 2000; Farah et al., 2005). Decomposition of CGAs has a great
impact on the quality attributes of roasted coffee and is directly related to flavor development
(Dorfner et al., 2003).
The Maillard reaction (MR) involves the condensation of the carbonyl group of the reducing
sugars with the amino group of amino acids and proteins. It consists of a complex network of
chemical reactions during which a myriad of products are formed, commonly known as Maillard
reaction products (MRP). These compounds have different chemical compositions and,
consequently, different properties (i.e., nutrient or contaminant binding, antioxidant, prooxidant,
mutagenic, and antimutagenic) (Kato et al., 1987; Jenq et al., 1994; Friedman, 1996; Manzocco
Introduction
6
et al., 2000). The polymeric brown coloured final products of the MR are called melanoidins, and
result from cyclization, dehydration, retroaldolization, rearrangements, isomerization, and
condensation of MRP. Phenolic compounds also participate in the Maillard reaction and are at
least partly incorporated in coffee melanoidins through non-covalent or covalent bounds.
Melanoidins are one of the major components of coffee, accounting for up to 25 % of dry mater
(Belitz et al., 2009). Beside colour development, Maillard reaction plays a key role in aroma
generation. Pyrazines, resulting from degradation of unstable MRP, are potent odorants in
roasted coffee. Other main classes of aromatic compounds formed during MR are aldehydes,
ketones, pyridines, oxazoles, thiazoles, and thiophenes. In addition to MR, volatile compounds
in roasted coffee are also formed via caramelization and degradation of carbohydrates (mainly
aldehydes and volatile acids), and denaturation of proteins (thiophenes, thiols, etc.) (Flament,
2001; Illy & Viani, 2005).
In contrast to the above described conventional coffee roasting, torrefacto is a roasting process
in which sugar is added to coffee, normally Robusta. This roasting technique is used in several
Southern European and South American countries where some segments of the population
prefer coffees with a dark brown, intense aroma and a strong taste with a tendency to
bitterness. This kind of roasting process was initially used to mask negative sensorial attributes
in Robusta coffees. Nowadays, torrefacto roasted coffee is usually blended with conventional
roasted coffee (Arabica or Robusta) to be commercialized. The addition of sugar at the end of
the torrefacto roasting process might intensify the development of Maillard reactions and,
consequently, increase the antioxidant capacity of coffee (Nicoli et al., 1997; López-Galilea et
al., 2006; Lopez Galilea et al., 2008). However, torrefacto samples analysed in these previous
works were blends of conventional and torrefacto roasted coffees from different varieties, and
unknown origins, percentages and roasting degrees. Thus, differences in the antioxidant
capacity reported so far for torrefacto coffee might well be a consequence of other paramenters
(coffee variety, origin, and roasting degree) rather than the addition of sugar during roasting.
Coffee brew and antioxidants
The antioxidant capacity of coffee can be influenced by several factors, such as the variety and
origin of the coffee (Parras et al., 2007), the roasting degree (Nicoli et al., 1997), the type of
roast (natural or torrefacto) and the blend (López-Galilea et al., 2006; Lopez Galilea et al.,
2008). Besides, the brewing process is essential to the antioxidant composition and health
properties of a coffee brew, because the contact of water with roasted coffee grounds is the
crucial step for extraction of coffee compounds. The preparation of a cup of coffee can be made
by several extraction methods. Filter coffee (drip filter) is the most widely used coffee brew
obtained by infusion method, whereas espresso coffee is the most appreciated coffee brew
produced by pressure method. In drip filtration methods, water at 92-96 °C flows through a
hardly compressed ground coffee bed and the extract drips from the brewing chamber into the
pot. Turbulence in the brewing chamber prevents water from becoming saturated (Lingle, 1996).
In pressure methods, water at approximately 9 bars and 88-92 °C is forced to go through coffee
Introduction
7
grounds compacted in a small brewing chamber (coffee cake). Also rapid brewing time and fine
particle size are necessary (Lingle, 1996). Many chemical species identified in roasted coffee,
including antioxidants, exhibit different extraction rates that may also be influenced by the
choice of brewing technique and conditions (Peters, 1991; Petracco, 2001; Petracco, 2005). In
each case, the technical conditions applied, such as the coffee/water ratio, water temperature,
and water pressure, contribute to the different chemical composition of coffee brews. In this
regard, Andueza et al. (2007) observed increased extraction of caffeine and 5-CQA in espresso
coffee brews prepared with high coffee/water rations. The extraction of these two compounds
also increased with temperature and pressure but only up to 92 °C and 9 bar, while further
increase of these parameters led to lower amounts of caffeine and 5-CQA (Andueza et al.,
2002; Andueza et al.; 2003). Taking all these facts into account, the knowledge of the extraction
behaviour of coffee antioxidants may help to increase their amounts in the beverage and thus
improve the health benefits associated with coffee consumption.
Several studies have indicated potential health benefits associated with coffee consumption
(Higdon & Frei, 2006; Nkondjock, 2009; Bøhn et al., 2012; Williamson & Stalmach, 2012).
These benefits might be ascribed in part to the antioxidant capacity reported for coffee brews
(Richelle et al., 2001; Parras et al., 2007). In fact, chronic diseases, such as cancer,
cardiovascular, inflammatory, and neurogenerative pathologies are associated with oxidative
stress (Beal, 1995; Aruoma, 1999; Dorea & da Costa, 2005), and coffee brew has been
proposed as an important source of antioxidants in human diet (Pulido et al., 2003; Svilaas et
al., 2004).
The antioxidant capacity of coffee brew is attributed to both antioxidants originally present in
coffee beans, like phenolic compounds, and roasting-induced antioxidants, like melanoidins and
other Maillard reaction products (MRP) (Del Castillo et al., 2002; Borrelli et al., 2002; Crozier et
al., 2009).
Coffee is one of the richest sources of chlorogenic acids (Clifford, 1985), which are considered
to be powerful antioxidants. Several authors have studied their antioxidant activity using pure
reference standards. In vitro CQAs scavenge radicals (Rice-Evans et al., 1996; Foley et al.,
1999), increase the resistance of LDL to lipid peroxidation (Nardini et al., 1995; Abu Amsha et
al., 1996) and inhibit DNA damage (Shibata et al., 1999; Kasai et al., 2000), and in vivo have
anticarcinogenic effects in animal models (Huang et al., 1988; Tanaka et al., 1993). Antioxidant
capacity of caffeic and ferulic acid, hydrolysis products of CGAs formed during the roasting, has
also been demonstrated in vitro (Nardini et al., 1995; Daglia et al., 2000) and in vivo (Nardini et
al., 1997).
However, due to the coffee roasting process, natural phenolic compounds can be lost by
progressive thermal degradation. Nevertheless, the loss of antioxidant capacity due to the
degradation of phenolics has been found to be minimized by the formation of melanoidins and
other Maillard reaction products (Nicoli et al., 1997; Daglia et al., 2000). Beside its contribution
to flavor and colour, one of the important functional properties of melanoidins is its antioxidant
Introduction
8
activity (Delgado-Andrade & Morales, 2005; Caemmerer & Kroh, 2006; López-Galilea et al.,
2006; Rufián-Henares & Morales, 2007), which may be enhanced due to the at least partly
incorporation of CGAs into their structure (Bekedam et al., 2008; Nunes & Coimbra, 2010). The
simultaneous presence of phenolic hydroxyl groups, reductones, enaminols, and other potential
active scavenging groups, which are typical of MRP, could explain the strong antioxidant action
of these polymers. These compounds were found to break the radical chain reactions by
donation of a hydrogen atom (Eichner, 1981; Yen & Hsieh, 1995), to reduce hydroperoxide to
non-radical products and to act as effective metal chelating agents (Gomyo & Horikoshi, 1976;
Eichner, 1981; Asakura et al., 1990; Takenaka et al., 2005). Thus, a simultaneous antioxidant
action by antioxidants having different mechanisms can be hypothesized for these high-
molecular weight compounds.
Furthermore, several volatile heterocyclic compounds present in coffee, which are major flavour
components formed by the Maillard reaction (Shibamoto, 1983; Flament, 2001), such as
pyrroles, furans, thiophenes, thiazoles and imidazoles have been suggested as antioxidant
compounds. Fuster et al. (2000) and Yanagimoto et al. (2002) analyzed one by one the
inhibitory effect of isolated volatile compounds towards hexanal oxidation and reported
considerable antioxidant capacity for some pyrrols, furans and thiophenes. Later Yanagimoto et
al. (2004) analyzed the antioxidant activity of chromatographic fractions obtained from a
dichloromethane extract of coffee brew. This study suggested that some volatile compounds
were responsible for the antioxidant activity exhibited by dichloromethane fractions.
Nevertheless, contradictory findings were reported by other authors. More recently (Lopez-
Galilea et al. (2008) studied the correlation between total antioxidant capacity of coffee and
some selected constituents, including heterocyclic volatile compounds, and found that these
latter were negatively correlated with radical quenching activity. However, in this latter study,
those coffees that exhibited higher antioxidant activity showed lower amounts of volatile
compounds due to botanic variety and roasting process.
Several other minor components are found to act as antioxidants in coffee, such as
methylpyridinium ion, generated upon the decarboxylation of trigonelline during roasting. This
compound was found to be a powerful coffee-derived inductor of the chemopreventive
gluthation-S-transferase in Caco-2-cells (Stadler et al., 2002; Somoza et al., 2003). Also
caffeine, beside its tonifying qualities, which activate nervous system, enhancing perception and
reduce fatigue, seems to contribute to the overall antioxidant capacity of coffee. In fact,
Devasagayam et al. (1996) studied caffeine as a protector agent of cell membranes against
oxidative damage. Lee (2000) suggested as a source of caffeine’s antioxidant capacity its
degradation into the metabolites methylxantine and methyluric acid. Nevertheless, its potential
antioxidant activity may be overshadowed by phenolic compounds and MRP.
However, it should be noted that the health effects of coffee antioxidants in vivo are not
necessarily a consequence of their antioxidant activity. To exert activity in vivo, coffee
antioxidants must be bioavailable. Although there is still a discussion about the bioavailability of
Introduction
9
melanoidins, it is clear that at least they may act as prebiotics or even antimicrobials depending
on their nature and concentration (Borrelli & Fogliano, 2005; Rufian-Henares & de la Cueva,
2009). In the case of chlorogenic acids, several studies have indicated that the large intestine is
the most likely site for CGAs absorption (Spencer et al., 1999; Olthof et al., 2001; Stalmach et
al., 2010). As they pass along the gastrointestinal tract some of them may be metabolised and it
is their metabolites rather than the parent compounds which predominate in the circulatory
system (Stalmach et al., 2009; Stalmach et al., 2010).
In a study using an in vitro model with rat small intestine, very little absorption of 5-CQA was
observed (Spencer et al., 1999), pointing towards the large intestine as the most likely site for
CQA absorption and metabolism. The important involvement of the colon is also supported by
studies on humans with an ileostomy. Levels of ingested CGAs recovered in ileal fluid indicate
that about one-third is absorbed in the stomach and/or small intestine (Olthof et al., 2001;
Stalmach et al., 2010). In subjects with an intact functioning colon the remaining two-thirds will
reach the large intestine, where the gut microbiota will mediate breakdown to a wide range of
low-molecular catabolites. Because the fate of (poly)phenols is very much dependent upon any
structural changes that occur during the passage through the gastrointestinal tract (Selma et al.,
2009; Williamson & Clifford, 2010), the identification and quantification of microbial catabolites
produced in the large intestine are of importance in the context of overall bioavailability and
potential health benefits of dietary (poly)phenolics.
Introduction
10
REFERENCES
Abu Amsha, R., Croft, K. D., Puddey, I. B., Proudfoot, J. M., & Beilin, L. J. (1996). Phenolic content of various beverages determines the extent of inhibition of human serum and low-density lipoprotein oxidation in vitro: identification and mechanism of action of some cinnamic acid derivatives from red wine. Clinical Science, 91(4), 449-458.
Alonso-Salces, R. M., Guillou, C., & Berrueta, L. A. (2009). Liquid chromatography coupled with ultraviolet absorbance detection, electrospray ionization, collision-induced dissociation and tandem mass spectrometry on a triple quadrupole for the on-line characterization of polyphenols and methylxanthines in green coffee beans. Rapid Communications in Mass Spectrometry, 23(3), 363-383.
Andueza, S., Maeztu, L., Dean, B., De Peña, M., Bello, J., & Cid, C. (2002). Influence of water pressure on the final quality of arabica espresso coffee. Application of multivariate analysis. Journal of Agricultural and Food Chemistry, 50(25), 7426-7431.
Andueza, S., De Pena, M. P., Vila, M., & Cid, C. (2007). Influence of coffee/water ratio on the final quality of espresso coffee. Journal of the science of food and agriculture, 87(4), 586-592.
Andueza, S., Maeztu, L., Pascual, L., Ibañez, C., De Peña, M. P., & Cid, C. (2003). Influence of extraction temperature on the final quality of espresso coffee. Journal of the Science of Food and Agriculture, 83(3), 240-248.
Aruoma, O. (1999). Antioxidant actions of plant foods: Use of oxidative DNA damage as a tool for studying antioxidant efficacy. Free Radical Research, 30(6), 419-427.
Asakura, T., Nakamura, Y., Inoue, N., Murata, M., & Homma, S. (1990). Characterization of zink chelationg compounds in instant coffee. Agricultural and Biological Chemistry, 54(4), 855-862.
Beal, M. (1995). Aging, energy, and oxidative stress in neurodegenerative diseases. Annals of Neurology, 38(3), 357-366.
Bekedam, E. K., Schols, H. A., Van Boekel, M. A. J. S., & Smit, G. (2008). Incorporation of chlorogenic acids in coffee brew melanoidins. Journal of Agricultural and Food Chemistry, 56(6), 2055-2063.
Belitz, H., Grosch, W., & Schieberle, P. (2009). Coffee, Tea, Cocoa. In Food Chemistry, (4 th ed.) Berlin: Springer-Verlag.
Bøhn, S. K., Ward, N. C., Hodgson, J. M., & Croft, K. D. (2012). Effects of tea and coffee on cardiovascular disease risk. Food & Function, 3(6), 575-591.
Borrelli, R. C., & Fogliano, V. (2005). Bread crust melanoldins as potential prebiotic ingredients. Molecular Nutrition & Food Research, 49(7), 673-678.
Borrelli, R. C., Visconti, A., Mennella, C., Anese, M., & Fogliano, V. (2002). Chemical characterization and antioxidant properties of coffee melanoidins. Journal of Agricultural and Food Chemistry, 50(22), 6527-6533.
Caemmerer, B., & Kroh, L. W. (2006). Antioxidant activity of coffee brews. European Food Research and Technology, 223(4), 469-474.
Clifford, M. N. (2000). Chlorogenic acids and other cinnamates - nature, occurrence, dietary burden, absorption and metabolism. Journal of the Science of Food and Agriculture, 80(7), 1033-1043.
Clifford, M. N. (1999). Chlorogenic acids and other cinnamates - nature, occurrence and dietary burden. Journal of the Science of Food and Agriculture, 79(3), 362-372.
Clifford, M. N. (1985). Chlorogenic acids. In R. J. Clark & R. Macrae, Coffee Volume 1: Chemistry (pp. 153-202). London, UK: Elsevier Applied Science Publisher.
Introduction
11
Clifford, M. N., Johnston, K. L., Knight, S., & Kuhnert, N. (2003). Hierarchical scheme for LC-MSn identification of chlorogenic acids. Journal of Agricultural and Food Chemistry, 51(10), 2900-2911.
Clifford, M. N., & Knight, S. (2004). The cinnamoyl–amino acid conjugates of green robusta coffee beans. Food Chemistry, 87(3), 457-463.
Clifford, M. N., & Wight, J. (1976). The measurement of feruloylquinic acids and caffeoylquinic acids in coffee beans. Development of the technique and its preliminary application to green coffee beans. Journal of the Science of Food and Agriculture, 27(1), 73-84.
Crozier, A., Jaganath, I., & Clifford, M. (2009). Dietary phenolics: chemistry, bioavailability and effects on health. Natural Product Reports, 26(8), 1001-1043.
Daglia, M., Papetti, A., Gregotti, C., Bertè, F., & Gazzani, G. (2000). In vitro antioxidant and ex vivo protective activities of green and roasted coffee. Journal of Agricultural and Food Chemistry, 48(5), 1449-1454.
Del Castillo, M. D., Ames, J. M., & Gordon, M. H. (2002). Effect of roasting on the antioxidant activity of coffee brews. Journal of Agricultural and Food Chemistry, 50(13), 3698-3703.
Delgado-Andrade, C., & Morales, F. J. (2005). Unraveling the contribution of melanoidins to the antioxidant activity of coffee brews. Journal of Agricultural and Food Chemistry, 53(5), 1403-1407.
Devasagayam, T., Kamat, J., Mohan, H., & Kesavan, P. (1996). Caffeine as an antioxidant: Inhibition of lipid peroxidation induced by reactive oxygen species. Biochimica et Biophysica Acta - Biomembranes, 1282(1), 63-70.
Dorea, J., & Da Costa, T. (2005). Is coffee a functional food? British Journal of Nutrition, 93(6), 773-782.
Dorfner, R., Ferge, T., Kettrup, A., Zimmermann, R., & Yeretzian, C. (2003). Real-time monitoring of 4-vinylguaiacol, guaiacol, and phenol during coffee roasting by resonant laser ionization time-of-flight mass spectrometry. Journal of Agricultural and Food Chemistry, 51(19), 5768-5773.
Eichner, K. (1981). Antioxidative effect of Maillard reaction intermediates. Progress in Food and Nutrition Science, 5, 441-457.
Farah, A., De Paulis, T., Trugo, L. C., & Martin, P. R. (2005). Effect of roasting on the formation of chlorogenic acid lactones in coffee. Journal of Agricultural and Food Chemistry, 53(5), 1505-1513.
Farah, A. (2012). Coffee Constituents. In Y. Chu, Coffee: Emerging Health Effects and Disease Prevention (pp. 21-58). Oxford, UK: Wiley-Blackwell.
Flament, I. (2001). Coffee flavor chemistry. Chichester, UK: John Wiley & Sons Ltd.
Foley, S., Navaratnam, S., McGarvey, D. J., Land, E. J., Truscott, T. G., & Rice-Evans, C. A. (1999). Singlet oxygen quenching and the redox properties of hydroxycinnamic acids. Free Radical Biology and Medicine, 26(9–10), 1202-1208.
Friedman, M. (1996). Food browning and its prevention: An overview. Journal of Agricultural and Food Chemistry, 44(3), 631-653.
Fuster, M. D., Mitchell, A. E., Ochi, H., & Shibamoto, T. (2000). Antioxidative activities of heterocyclic compounds formed in brewed coffee. Journal of Agricultural and Food Chemistry, 48(11), 5600-5603.
Gomyo, T., & Horikoshi, M. (1976). Interaction of melanoidin with metallic-ions. Agricultural and Biological Chemistry, 40(1), 33-40.
Introduction
12
Higdon, J., & Frei, B. (2006). Coffee and health: A review of recent human research. Critical Reviews in Food Science and Nutrition, 46(2), 101-23.
Hu, Q., Zhou, T., Zhang, L., & Fang, Y. (2001). Study of the separation and determination of monosaccharides in soluble coffee by capillary zone electrophoresis with electrochemical detection. Analyst, 126(3), 298-301.
Huang, M., Smart, R. C., Wong, C., & Conney, A. H. (1988). Inhibitory effect of curcumin, chlorogenic acid, caffeic acid, and ferulic acid on tumor promotion in mouse skin by 12-O-tetradecanoylphorbol-13-acetate. Cancer Research, 48(21), 5941-5946.
Illy, A., & Viani, R. (2005). Espresso Coffee: The science of Quality. London, UK: Elsevier Academic Press.
Jenq, S. N., Lee, H., & Tsai, S. J. (1994). Antimutagenicity of Maillard reaction products from amino acid/sugar model systems against 2-amino-3-methylimidazo-[4,5-f]quinoline: The role of pyrazines. Mutagenesis, 9(5), 483-488.
Kasai, H., Fukada, S., Yamaizumi, Z., Sugie, S., & Mori, H. (2000). Action of chlorogenic acid in vegetables and fruits as an inhibitor of 8-hydroxydeoxyguanosine formation in vitro and in a rat carcinogenesis model. Food and Chemical Toxicology, 38(5), 467-471.
Kato, H., Lee, I. E., Vanchuyen, N., Kim, S. B., & Hayase, F. (1987). Inhibition of nitrosamine formation by nondialyzable melanoidins. Agricultural and Biological Chemistry, 51(5), 1333-1338.
Kurzrock, T., & Speer, K. (2001). Diterpenes and diterpene esters in coffee. Food Reviews International, 17(4), 433-450.
Lee, C. (2000). Antioxidant ability of caffeine and its metabolites based on the study of oxygen radical absorbing capacity and inhibition of LDL peroxidation. Clinica Chimica Acta, 295(1-2), 141-154.
Lingle, T. R. (1996). The Coffee Brewing Handbook. Long Beach, California: Specialty Coffee Association.
Lopez Galilea, I., De Peña, M. P., & Cid, C. (2008). Application of multivariate analysis to investigate potential antioxidants in conventional and torrefacto roasted coffee. European Food Research and Technology, 227(1), 141-149.
López-Galilea, I., Andueza, S., Leonardo, I. D., De Peña, M. P., & Cid, C. (2006). Influence of torrefacto roast on antioxidant and pro-oxidant activity of coffee. Food Chemistry, 94(1), 75-80.
Manzocco, L., Calligaris, S., Mastrocola, D., Nicoli, M. C., & Lerici, C. R. (2000). Review of non-enzymatic browning and antioxidant capacity in processed foods. Trends in Food Science & Technology, 11(9–10), 340-346.
Mazza, G., & Miniati, E. (1993). Anthocyanins in fruits, vegetables, and grains. Boca Raton, US: CRC Press.
Mazzafera, P. (1999). Chemical composition of defective coffee beans. Food Chemistry, 64(4), 547-554.
Milder, I. E. J., Feskens, E. J. M., Arts, I. C. W., Bueno de Mesquita, H. B., Hollman, P. C. H., & Kromhout, D. (2005). Intake of the plant lignans secoisolariciresinol, matairesinol, lariciresinol and pinoresinol in Dutch men and women. The Journal of Nutrition, 135, 1201-1207.
Nardini, M., D'Aquino, M., Tomassi, G., Gentili, V., Di Felice, M., & Scaccini, C. (1995). Inhibition of human low-density lipoprotein oxidation by caffeic acid and other hydroxycinnamic acid derivatives. Free Radical Biology and Medicine, 19(5), 541-552.
Introduction
13
Nardini, M., Natella, F., Gentili, V., Felice, M. D., & Scaccini, C. (1997). Effect of caffeic acid dietary supplementation on the antioxidant defense system in rat: An in vivo Study. Archives of Biochemistry and Biophysics, 342(1), 157-160.
Nicoli, M. C., Anese, M., Manzocco, L., & Lerici, C. R. (1997). Antioxidant properties of coffee brews in relation to the roasting degree. LWT - Food Science and Technology, 30(3), 292-297.
Nkondjock, A. (2009). Coffee consumption and the risk of cancer: An overview. Cancer Letters, 277(2), 121-125.
Nunes, F. M., & Coimbra, M. A. (2010). Role of hydroxycinnamates in coffee melanoidin formation. Phytochemistry Reviews, 9(1), 171-185.
Olthof, M. R., Hollman, P. C. H., & Katan, M. B. (2001). Chlorogenic acid and caffeic acid are absorbed in humans. The Journal of Nutrition, 131(1), 66-71.
Parliment, T. H. (2000). An overview of coffee roasting. In T. H. Parliment, C. T. Ho, & P. Schieberle, Caffeinated beverages: Health benefits, physiological effects and chemistry (pp. 188-201). Washington, DC, US: American Chemical Society.
Parras, P., Martínez-Tomé, M., Jiménez, A. M., & Murcia, M. A. (2007). Antioxidant capacity of coffees of several origins brewed following three different procedures. Food Chemistry, 102(3), 582-592.
Peters, A. (1991). Brewing makes the difference. Proceedings of the 14th ASIC Colloquium, San Francisco, USA, pp. 97-106.
Petracco, M. (2005). Percolation. In A. Illy & R. Viani, Espresso Coffee: The Science of Quality (pp. 259-289), (2 nd ed.). London: Elsevier Academic Press.
Petracco, M. (2001). Technology IV: Beverage Preparation: Brewing Trends for the New Millenium. In R. J. Clark & O. G. Vitzthum, Coffee: Recent Developments. Oxford, UK: Blackwell Science.
Pulido, R., Hernandez Garcia, M., & Saura Calixto, F. (2003). Contribution of beverages to the intake of lipophilic and hydrophilic antioxidants in the Spanish diet. European Journal of Clinical Nutrition, 57(10), 1275-1282.
Rice-Evans, C. A., Miller, N. J., & Paganga, G. (1996). Structure-antioxidant activity relationships of flavonoids and phenolic acids. Free Radical Biology and Medicine, 20(7), 933-956.
Richelle, M., Tavazzi, I., & Offord, E. (2001). Comparison of the antioxidant activity of commonly consumed polyphenolic beverages (coffee, cocoa, and tea) prepared per cup serving. Journal of Agricultural and Food Chemistry, 49(7), 3438-3422.
Rodrigues, M. A. A., Borges, M. L. A., Franca, A. S., Oliveira, L. S., & Correa, P. C. (2003). Evaluation of physical properties of coffee during roasting. Agricultural Engineering International: CIGR Journal, 5, 1-12.
Rufian-Henares, J. A., & de la Cueva, S. P. (2009). Antimicrobial Activity of Coffee Melanoidins-A study of their metal-chelating properties. Journal of Agricultural and Food Chemistry, 57(2), 432-438.
Rufián-Henares, J. A., & Morales, F. J. (2007). Effect of in vitro enzymatic digestion on antioxidant activity of coffee melanoidins and fractions. Journal of Agricultural and Food Chemistry, 55(24), 10016-10021.
Selma, M. V., Espin, J. C., & Tomas-Barberan, F. A. (2009). Interaction between phenolics and gut microbiota: Role in human health. Journal of Agricultural and Food Chemistry, 57(15), 6485-6501.
Introduction
14
Shibamoto, T. (1983). Heterocyclic compounds in browning and browning/nitrite model systems: Occurrence, formation mechanisms, flavor characteristics and mutagenic activity. In I. G. Charalambous, Inglett, & G., Instrumental Analysis of food (pp. 229-278). New York,US: Academic Press.
Shibata, H., Sakamoto, Y., Oka, M., & Kono, Y. (1999). Natural antioxidant, chlorogenic acid, protects against DNA breakage caused by monochloramine. Bioscience, Biotechnology, and Biochemistry, 63(7), 1295-1297.
Sivetz, M., & Desrosier, N. W. (1979). Coffee technology. Westport, US: The Avi Publishing Company.
Somoza, V., Lindenmeier, M., Wenzel, E., Frank, O., Erbersdobler, H., & Hofmann, T. (2003). Activity-guided identification of a chemopreventive compound in coffee beverage using in vitro and in vivo techniques. Journal of Agricultural and Food Chemistry, 51(23), 6861-6869.
Spencer, J. P. E., Chowrimootoo, G., Choudhury, R., Debnam, E. S., Srai, S. K., & Rice-Evans, C. (1999). The small intestine can both absorb and glucuronidate luminal flavonoids. FEBS letters, 458(2), 224-230.
Stadler, R., Varga, N., Hau, J., Vera, F., & Welti, D. (2002). Alkylpyridiniums. 1. Formation in model systems via thermal degradation of trigonelline. Journal of Agricultural and Food Chemistry, 50(5), 1192-1199.
Stalmach, A., Mullen, W., Nagai, C., & Crozier, A. (2006). On-line HPLC analysis of the antioxidant activity of phenolic compounds in brewed, paper-filtered coffee. Brazilian Journal of Plant Physiology, 18(1), 253-262.
Stalmach, A., Clifford, M. N., Williamson, G., & Crozier, A. (2011). Phytochemicals in coffee and the bioavailability of chlorogenic acids. In Teas, Cocoa and Coffee: Plant Secondary Metabolites and Health (pp. 143-168). Oxford, UK: Wiley-Blackwell.
Stalmach, A., Mullen, W., Barron, D., Uchida, K., Yokota, T., Cavin, C., Steiling, H., Williamson, G., & Crozier, A. (2009). Metabolite profiling of hydroxycinnamate derivatives in plasma and urine after the ingestion of coffee by humans: Identification of biomarkers of coffee consumption. Drug Metabolism and Disposition, 37(8), 1749-1758.
Stalmach, A., Steiling, H., Williamson, G., & Crozier, A. (2010). Bioavailability of chlorogenic acids following acute ingestion of coffee by humans with an ileostomy. Archives of Biochemistry and Biophysics, 501(1), 98-105.
Svilaas, A., Sakhi, A., Andersen, L., Svilaas, T., Strom, E., & Jacobs, D. (2004). Intakes of antioxidants in coffee, wine, and vegetables are correlated with plasma carotenoids in humans. The Journal of Nutrition, 134(3), 562-567.
Takenaka, M., Sato, N., Asakawa, H., Wen, X., Murata, M., & Homma, S. (2005). Characterization of a metal-chelating substance in coffee. Bioscience, Biotechnology, and Biochemistry, 69(1), 26-30.
Tanaka, T., Kojima, T., Kawamori, T., Wang, A., Suzui, M., Okamoto, K., & Mori, H. (1993). Inhibition of 4-nitroquinoline-1-oxide-induced rat tongue carcinogenesis by the naturally occurring plant phenolics caffeic, ellagic, chlorogenic and ferulic acids. Carcinogenesis, 14(7), 1321-1325.
Trugo, L. C., & Macrae, R. (1984). A study of the effect of roasting on the chlorogenic acid composition of coffee using HPLC. Food Chemistry, 15(3), 219-227.
Williamson, G., & Clifford, M. N. (2010). Colonic metabolites of berry polyphenols: the missing link to biological activity? British Journal of Nutrition, 104(S3), S48-S66.
Introduction
15
Williamson, G., & Stalmach, A. (2012). Absorption and metabolism of dietary chlorogenic acids and procyanidins. In V. Cheynier, P. Sarni-Manchado, & S. Quideau, Recent Advances in Polyphenol Research (pp. 209-222). Oxford, UK.: Wiley-Blackwell.
Yanagimoto, K., Lee, K., Ochi, H., & Shibamoto, T. (2002). Antioxidative activity of heterocyclic compounds found in coffee volatiles produced by Maillard reaction. Journal of Agricultural and Food Chemistry, 50(19), 5480-4.
Yanagimoto, K., Ochi, H., Lee, K., & Shibamoto, T. (2004). Antioxidative activities of fractions obtained from brewed coffee. Journal of Agricultural and Food Chemistry, 52(3), 592-596.
Yen, G., & Hsieh, P. (1995). Antioxidative activity and scavenging effects on active oxygen of xylose-lysine maillard reaction products. Journal of the Science of Food and Agriculture, 67(3), 415-420.


OBJECTIVES

Objectives
19
Coffee has been proposed as one of the main sources of antioxidants in the diet. Roasting and
brewing processes are two necessary steps before having a good cup of coffee. Roasting
causes loss of natural antioxidants, mainly polyphenols, but induces formation of Maillard
reaction products, such as melanoidins and volatiles, some of which also act as antioxidants.
Previous studies at the University of Navarra showed that commercial Torrefacto coffee blends
have a higher antioxidant capacity, but other factors, like coffee origin and roasting degree play
an important role. Also, coffee antioxidant extraction might be modulated by the brewing
process. Despite technological factors, various coffee antioxidants (chlorogenic acids, volatile
and non-volatile Maillard reaction products) may contribute in different proportions to the overall
antioxidant capacity. Last, but not least, to be of benefit to human health, coffee antioxidants
and/or their metabolites must be present at a gastrointestinal level.
For all these reasons, the general aim of this PhD thesis was to evaluate the actual
contribution to the overall antioxidant capacity of coffee brews by the most relevant
coffee compounds (phenolics and Maillard reaction p roducts) and to study their colonic
catabolism.
To achieve this aim, the following objectives were established:
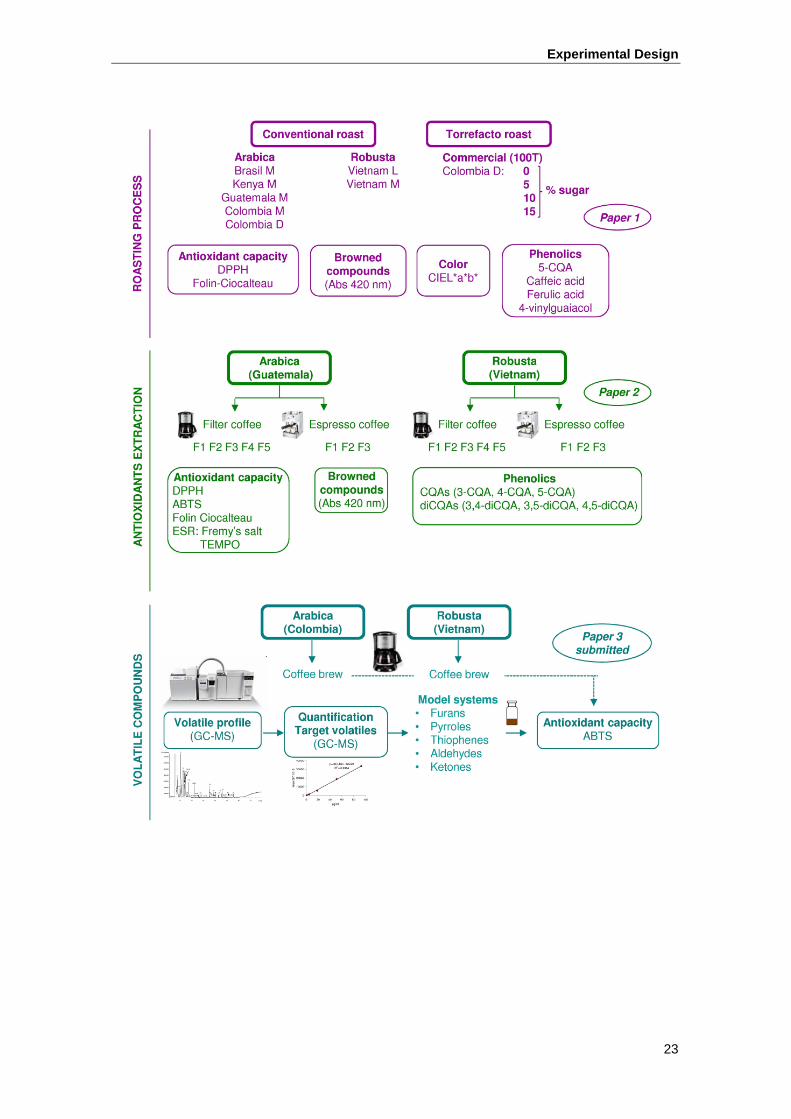
1. To study the influence of roasting techniques (conventional and torrefacto) and degree
of roast on the main coffee antioxidant compounds (phenolics and Maillard reaction
products) and overall antioxidant capacity. (Paper 1)
2. To study the extractability of the main coffee antioxidant compounds during the most
common brewing processes (espresso and filter coffeemakers) (Paper 2).
3. To evaluate the contribution of volatile Maillard reaction products, generated during
roasting, to the antioxidant capacity of coffee. (Paper 3, submitted).
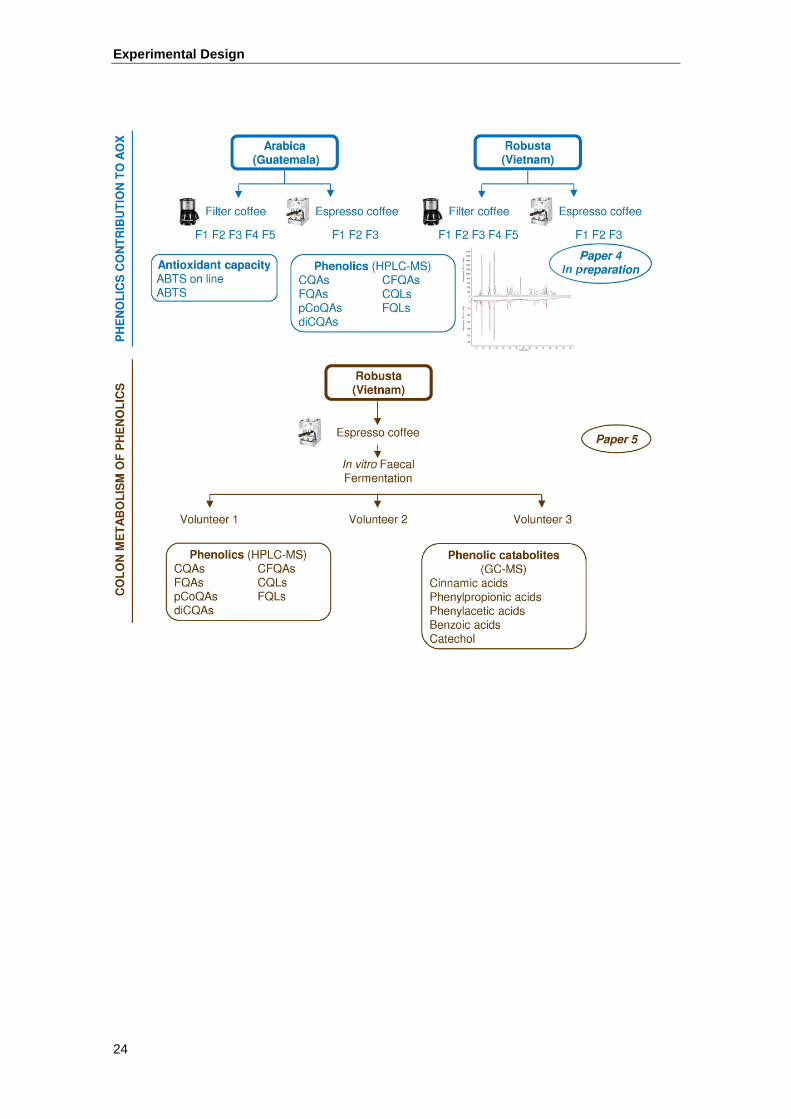
4. To evaluate the contribution of phenolic and non-phenolic compounds to the antioxidant
capacity of coffee brews (espresso and filter). (Paper 4, in preparation).
5. To study the fate of coffee phenolics at colon level as influenced by the metabolism of
human colonic microbiota (Paper 5).
Objectives
20
El café se ha propuesto como una de las principales fuentes de antioxidantes en la dieta. La
obtención de una buena taza de café implica que previamente ha sido sometido a un proceso
de tueste y a la extracción del café molido con agua en una cafetera. Durante el tueste, parte
de los antioxidantes naturales (compuestos polifenólicos) se degradan, pero se forman
productos de la reacción de Maillard, como las melanoidinas y muchos compuestos volátiles,
que también presentan actividad antioxidante. Estudios previos de la Universidad de Navarra
mostraron que cafés comerciales con mezcla de torrefacto presentan mayor capacidad
antioxidante que los de tueste natural, sin embargo otros factores como el origen del café y el
grado de tueste también influyen en las propiedades antioxidantes. Además, la extracción de
los compuestos antioxidantes del café podría ser modulada por el proceso de preparación de la
bebida de café. Aparte de los factores tecnológicos, los diferentes compuestos antioxidantes
del café (ácidos clorogénicos, compuestos volátiles y no volátiles producto de la reacción de
Maillard) pueden contribuir en diferente grado a la capacidad antioxidante global de la bebida
de café. Por último, y no por ello menos importante, es preciso considerar que para poder
ejercer sus potenciales cualidades saludables en el hombre, los compuestos antioxidantes del
café y/o sus metabolitos deben estar al menos presentes a nivel gastrointestinal.
Por estas razones, el objetivo general de la presente tesis doctoral es evaluar la contribución
de los compuestos más relevantes del café (compuest os fenólicos y productos de la
reacción de Maillard) a la capacidad antioxidante g lobal de la bebida de café y estudiar
las reacciones catabólicas por la microbiota intest inal.
Para lograr este objetivo general se plantearon los siguientes objetivos parciales:
1. Estudio de la influencia del tipo de tueste (natural y torrefacto) y del grado de tueste
sobre los compuestos antioxidantes del café (fenólicos y productos de la reacción de
Maillard) y la capacidad antioxidante global. (Publicación 1).
2. Estudio de la extracción de los principales compuestos antioxidantes durante la
preparación de la bebida de café mediante los sistemas de extracción más
habitualmente utilizados (cafeteras expreso y de filtro) (Publicación 2).
3. Evaluación de la contribución de los compuestos volátiles, resultantes de la reacción de
Maillard y generados durante el tueste, sobre la capacidad antioxidante de café.
(Publicación 3, enviada).
4. Evaluación de la contribución de los compuestos fenólicos y no-fenólicos a la
capacidad antioxidante de la bebida de café (expreso y de filtro) (Publicación 4, en
preparación).
5. Estudio de la influencia del metabolismo de la microbiota intestinal humana sobre los
compuestos fenólicos a nivel del colon.(Publicación 5).

EXPERIMENTAL DESIGN

Experimental Design
23
Experimental Design
24

RESULTS

Results
27
Objective 1
Study of the influence of roasting techniques (conv entional and torrefacto) and degree of
roast on the main coffee antioxidant compounds (phe nolics and Maillard reaction
products) and overall antioxidant capacity.
Estudio de la influencia del tipo de tueste (natura l y torrefacto) y del grado de tueste
sobre los compuestos antioxidantes del café (fenóli cos y productos de la reacción de
Maillard) y la capacidad antioxidante global.
Paper 1:
Effect of sugar addition (torrefacto) during roasting process on antioxidant capacity and
phenolics of coffee
Iziar A. Ludwig, Jimena Bravo, M. Paz De Peña, Concepción Cid
LWT – Food Science and Technology, 2013, 51, 553-559
Impact factor (JCR, 2011): 2.545
Journal Rank in category:
• Food Science and Technology: 18/128 (Q1)

TITLE: Effect of sugar addition (torrefacto) during roasting process on
antioxidant capacity and phenolics of coffee
AUTHORS: Iziar A. Ludwig, Jimena Bravo, M. Paz De Peña*, Concepción Cid
Published in LWT-Food Science and Technology 51, 553-559 (2013)
Department of Nutrition, Food Science, and Physiology, School of Pharmacy,
University of Navarra, E-31080-Pamplona, Spain
*Corresponding author: M. Paz de Peña. Tel: +34 948 425600 (806580); Fax: +34 948
425740. E-mail address: [email protected]
1
ABSTRACT
The addition of sugar during roasting (torrefacto) has been proposed as a technique to
increase the antioxidant capacity. However, other factors such as roasting degree and
coffee origin also play a key role. Two batches of Colombian green coffee were roasted
adding increased amounts of sucrose (0-15 g per 100 g of coffee) to reach the same
roasting degree than a commercial Colombian coffee. Moreover, seven conventional
roasted coffees from different origins (Colombia, Brazil, Kenya, Guatemala and
Vietnam) and roasting degrees (Dark, Medium and Light), and one 100% Torrefacto
roasted coffee were analyzed. Although the addition of sugar during roasting increased
the DPPH quenching activity, phenolic compounds (5-caffeoylquinic, caffeic and
ferulic acids, and 4-vinylguaiacol) were hardly affected by torrefacto roasting process,
showing that Maillard and other roasting reactions products, such as browned-colored
compounds including melanoidins (Abs 420nm), have an important role as antioxidants.
Principal Component Analysis (PCA) showed that roasting degree also plays a key role
on overall antioxidant activity. Moreover, the Absorbance at 420nm has been proposed
as a good marker of torrefacto roasting process, whereas the roasting degree might be
better characterized by L* values.
KEYWORDS: Coffee, roasting, antioxidant, phenolic compounds, Maillard Reaction
Products
2
1. INTRODUCTION
During last few years, roasted coffee has been proposed as one of the main source of
antioxidants in the diet (Svilaas et al., 2004; Pulido, Hernandez-Garcia, & Saura-
Calixto, 2003). The roasting of coffee is a complex process where the loss of
antioxidant activity due to natural antioxidants – mainly represented by polyphenols –
by progressive thermal degradation has been found to be minimized by the formation of
Maillard reaction products (MRPs) (Nicoli, Anese, Manzocco, & Lerici, 1997).
Torrefacto is a roasting process in which sugar is added to coffee, normally Robusta.
This roasting technique is used in several countries of Southern Europe and South
America where some segments of the population prefer coffees with a dark brown,
intense aroma and a strong taste with a tendency to bitterness. This kind of roasting
process was initially used to mask negative sensorial attributes in Robusta coffees.
Nowadays, Torrefacto roasted coffee is usually blended with conventional roasted
coffee (Arabica or Robusta) to be commercialized. The addition of sugar at the end of
the torrefacto roasting process might intensify the development of Maillard reactions
and, consequently, increase the antioxidant capacity of coffee (Lopez-Galilea, Andueza,
di Leonardo, de Peña, & Cid, 2006; Lopez-Galilea, de Peña, & Cid, 2008; Andueza,
Cid, & Nicoli, 2004). However, the analyzed samples in these works were commercial
coffees in which Arabica and Robusta coffees from different unknown origins,
percentages and roasting degrees were blended.
Nicoli et al. (1997) reported that dark-medium roasted coffee had the highest
antioxidant capacity showing that roasting degree is a key factor. But, the origin and the
variety of coffee (Arabica and Robusta) with different amounts of phenolics in green
coffee also can play an important role. Consequently, the different antioxidant capacity
of commercial Torrefacto roasted coffee blends previously studied by our research
3
group (Lopez-Galilea et al., 2006; Lopez-Galilea et al., 2008) can not be attributed only
to Torrefacto roasting process. Thus, the influence of the sugar addition during
torrefacto roasting process on the antioxidant capacity of coffee should be deeper
studied controlling the other parameters. So that, the aim of this work was to know
whether the addition of increased amounts of sugar to coffee during roasting process
(torrefacto) could be a key factor to increase the antioxidant capacity, and to know its
influence on the most relevant coffee antioxidant compounds (phenolic compounds and
melanoidins). And secondly, whether the addition of sugar during roasting had higher or
lower influence than the roasting degree and the origin of coffee.
2. MATERIALS AND METHODS
2.1 Chemicals and reagents. The methanol (spectrophotometric grade), Folin-
Ciocalteau reagent and sodium carbonate were obtained from Panreac (Barcelona,
Spain). Gallic acid, 2,2-Diphenyl-1-picrylhydrazyl (DPPH•), Trolox (6-hydroxy-2,5,7,8-
tetramethyl-chroman-2-carboxylic acid) 5-caffeoylquinic acid (5-CQA), caffeic acid,
ferulic acid, 4-vinylguaiacol, were obtained from Sigma-Aldrich (Steinheim, Germany).
Acetonitrile, HPLC, grade was provided by Scharlau (Barcelona, Spain).
2.2 Coffee samples. Seven conventional roasted vacuum-packed coffee samples from
different origins (5 Arabica coffees from Colombia, Brazil, Kenya and Guatemala and 2
Robusta coffees from Vietnam), and one commercial 100% Torrefacto roasted coffee
(T100 Light) were selected. Roasted coffee samples were classified into 3 roasting
degrees according to the L* color parameter results: Dark (L*<23), Medium (L*23-26)
and Light (L*>26) following similar criteria of other authors (Nicoli et al., 1997;
Vignoli, Bassoli, & Benassi, 2011). Colombia Dark and T100 Light coffee samples of
the same brand were purchased in a local market. Colombia Medium, Brazil Medium,
4
Kenya Medium, Guatemala Medium, Vietnam Medium and Vietnam Light roasted
coffee samples and green coffee beans (variety Coffea arabica, from Colombia) were
supplied by two roasting companies.
2.3 Coffee roasting process. Two batches (I and II) of Colombian green coffee beans
were roasted adding increased amounts of sucrose (0, 5, 10 and 15 g per 100 g of
coffee) to reach the same roasting degree (L* 19-23, Dark) than the selected commercial
Colombian coffee sample (Colombia Dark). The amount of added sugar must not
exceed 15g/100g coffee beans as regulated by law in Spain (Real Decreto 1231/1988).
Roasting process was developed following the time and temperature conditions
presented in Figure 1. Sucrose was dissolved in the minimum volume of water and
homogenously spread out to the coffee beans at 21 min of roasting. During the roasting
process, pan surface and air temperatures were controlled. Each batch of coffee was
roasted in duplicate. At the end of the process, coffee samples were controlled by the L*
value (19-23, Dark) and weight loss (18-19 g per 100 g). Weight loss was calculated by
the difference between green and roasted coffee weights and expressed as g per 100 g.
After 4 hours of degassing, 60 g of roasted coffee were packed in plastic bags (type
160*300 PA/PE 90 μm, Vaessen-Schoemaker Industrial S.A.U., Barcelona, Spain) and
sealed under vacuum (Ramon Serie VP Mod.450, Barcelona, Spain). Samples were
named with the amount of added sugar followed by the roasting degree and the batch
number (0 Dark I, 5 Dark I, 10 Dark I, 15 Dark I, 0 Dark II, 5 Dark II, 10 Dark II and 15
Dark II). All coffee samples were stored in darkness and at 4 ºC up to the coffee
analysis (<1 month after roasting or purchasing).
2.4 Sample preparation. Coffee packages were opened immediately before the
preparation of the coffee extracts in order to avoid oxidative damage. Sixty g of roasted
coffee beans were ground in a Moulinex coffee grinder (model Super Junior “s”, Paris,
5
France) for 30 seconds. Coffee extracts were obtained by solid-liquid extraction, using
deionized water at 100 ºC. The ratio between coffee and water was 10/100 (g/mL). The
extraction time was 10 min. The extracts were immediately cooled with cold running
water and filtered through Whatman No. 1 filter paper.
2.5 Color analysis. Color analysis was carried out on ground roasted coffees by means
of a tristimulus colorimeter (Chromameter-2 CR-200, Minolta, Osaka, Japan) using the
D65 illuminant. The instrument was standardized against a white tile before sample
measurements. Ground roasted coffee was spread out in an l cm Petri plate, and the
color measured was expressed in L*, a* and b* CIELab scale parameters.
2.6 Browned compounds (Abs 420 nm). Fifty microliters of coffee extract were
diluted up to 2 mL with deionized water. Browned compounds were quantified by
measuring the absorbance of the sample at 420 nm after exactly 1 min, in a 3 mL
capacity cuvette (1 cm length) with a spectrophotometer Lambda 25 UV-VIS (Perkin-
Elmer Instruments, Madrid, Spain) connected to a thermostatically controlled chamber
(25 ºC) and equipped with UV Win- Lab software (Perkin Elmer).
2.7 Antioxidant capacity by DPPH assay. The antioxidant capacity was measured
using the 2,2-diphenyl-1-picrylhydrazyl (DPPH•) decolourization assay (Brand-
Williams, Cuvelier, & Berset, 1995) A 6.1x10⁻⁵ mol/L DPPH• methanolic solution was
prepared immediately before use. The DPPH• solution was adjusted with methanol to an
absorbance of 0.7 (±0.02) at 515 nm in a 3 mL capacity cuvette (1 cm length) at 25 ºC
(Lambda 25 UV, VIS spectrophotometer, Perkin Elmer Instruments). Coffee extracts
(50 µL) were added to DPPH• solution (1.95 mL). After mixing, the absorbance was
measured at 515 nm after exactly 1 min, and then every minute for 18 min at 25 ºC.
Calibration was performed with Trolox solution (a water-soluble vitamin E analogue)
and Total antioxidant capacity was expressed as µmol Trolox per g of ground coffee.
6
2.8 Folin-Ciocalteau (FC) assay. The Folin-Ciocalteau reducing capacity of coffee was
performed according to the Singleton´s method (Singleton, Orthofer, & Lamuela-
Raventos, 1999). For every coffee sample extract, 1:10 dilutions with demineralized
water were prepared and 500 μL of Folin-Ciocalteau reagent were added to 100 μL of
the coffee sample solution. After 2 min 1.5 mL a 7.5 g/100g sodium carbonate solution
was added. Next, the sample was incubated in darkness at room temperature for 90 min.
The absorbance of the sample was measured at 765 nm in a spectrophotometer (Lambda
25 UV, VIS spectrophotometer, Perkin Elmer Instruments). Gallic acid (GA) was used
as reference, and the results were expressed as g GA per 100 g of ground coffee.
2.9 5-Caffeoylquinic acid (5-CQA). A 500 μL amount of the coffee brew was diluted
up to 50 mL with milliQ water. HPLC analysis was carried out with an analytical HPLC
unit model 1100 (Agilent Technologies, Palo Alto, CA), equipped with a binary pump
and an automated sample injector. A Hypersil-ODS column (5 μm particle size,
250 mm × 4.6 mm) was used. The chromatographic separation was achieved at 25 ºC by
using a gradient solvent system with acetonitrile/water adjusted to pH 3.0 with a
phosphoric acid solution according to the method described by Perez-Martinez,
Sopelana, De Peña, & Cid (2008). The wavelength of detection was 325 nm.
2.10 Hydroxycinnamic acids (caffeic acid and ferulic acid) and 4-vinylguaiacol. The
extraction, clean-up and HPLC analysis of these three compounds were performed
simultaneously, according to the method developed in our department (Alvarez-
Vidaurre, Perez-Martinez, De Peña, & Cid, 2005). The HPLC analysis was carried out
with the same equipment and column described above. The chromatographic separation
was achieved at 25 ºC by using a gradient solvent system with acetonitrile/water
adjusted to pH 2.5 with a phosphoric acid solution according to the procedure published
7
by Perez-Martinez et al. (2008). The wavelengths of detection were 314 nm for caffeic
acid, 325 nm for ferulic acid and 210 nm for 4-vinylguaiacol.
2.11 Statistical analysis. Each parameter was analyzed in triplicate. Results are shown
as means ± standard deviations. Analysis of variance (ANOVA) was applied to the
parameters. Tukey test was applied as test a posteriori with a level of significance of
95%. Correlations among variables were assessed by means of the Pearson Correlation
test. Principal component analysis (PCA) was applied to the analytical data (based on
the Pearson correlation matrix) to observe differences among coffees samples. Principal
components (PC) with eigenvalues greater than 1 were selected. All statistical analyses
were performed using the SPSS v.15.0 software package.
3. RESULTS AND DISCUSSION
3.1 Influence of torrefacto roasting process on coffee color
Brown color development is one of the most visual changes in heat-treated foods, such
as coffee, cereal, cookies, etc. during processing. In the present work, the color of
ground roasted coffees was measured by means of the CIELab parameters (L* or
lightness, and a* and b* as the chromaticity parameters) and the Absorbance at 420nm
(Table 1). Although Torrefacto coffee samples were roasted to reach the same roasting
degree that Colombia Dark, a slight tendency to increase L* value with the addition of
sugar can be observed in the lab roasted coffee samples, except in 15 Dark II. However,
this increase was not significant and, in fact, no significant correlation (p>0.05) between
L* value and the amount of added sugar has been found. These results are in agreement
with those reported previously by Lopez-Galilea et al. (2006) who observed a similar
L* increase with the amount of torrefacto roasted coffee in commercial blends, but only
8
in two of the three analyzed brands. Consequently, L* value is clearly related with
roasting degree, but not with the torrefacto roasting process.
In Table 1, it can also be observed that the Light roasted coffees showed significantly
higher a* (+red) and b* (+yellow) values than Medium and Dark roasted coffees. In
fact, significant correlations (0.786 and 0.912, p<0.05) between chromaticity parameters
(a* and b*, respectively) and lightness (L*) have been found. Other authors also
obtained similar results and correlations in conventional roasted coffees and in
conventional/torrefacto coffee blends (Lopez-Galilea et al., 2006; Summa, de la Calle,
Brohee, Stadler, & Anklam, 2007). However, no significant correlations have been
found between any of the chromaticity parameters (a* or b*) and the amount of added
sugar during roasting. Thus, the CIELab parameters seem to be independent of the type
of roasting process (conventional or torrefacto), maybe because torrefacto roasting
process only induces the formation of an external caramel coating and hardly affects the
interior of the coffee beans.
The absorbance at 420nm has been commonly used to characterize melanoidins, which
are mainly originated by Maillard Reactions during roasting process of coffee and other
heat-treated foods (Morales, 2005; Nunes & Coimbra, 2007). However, it has been
reported that melanoidins accounted for only 65 % of color potency of the high
molecular weight fraction obtained from light roasted coffee, and for only 39 % from
dark roasted coffee (Nunes & Coimbra, 2007). Many other brown-colored products
appear to be sugar (retro)aldolization/dehydratation and carbohydrate condensation
products, which may or may not be attached to proteins or other structures of amino
nitrogen in a similar way to the Maillard Reactions (Rizzi, 1997; Hofmann, 1999). So
that, hypothetically, the addition of sugar to coffee during Torrefacto roasting process
might induce a higher formation of brown-colored Maillard Reactions and
9
caramelization products that are water soluble and can be measured by the Absorbance
at 420nm. In Table 1, it can be observed that those coffees with sugar added during
roasting (torrefacto) showed significantly (p<0.05) higher Absorbance at 420nm than
those roasted conventionally with the same roasting degree (Torrefacto lab roasted
coffees versus 0 Dark and Colombia Dark, or T100 Light versus Vietnam Light).
Moreover, commercial torrefacto coffee (T100 Light) showed similar results (p>0.05)
to those coffees roasted with 15g sugar per 100g coffee. In fact, highly significant
(p<0.001) and excellent correlation (0.876) between the Absorbance at 420nm and the
amount of sugar added during roasting process has been found showing that this
parameter might be proposed as a marker of torrefacto roasting process. The highest
Absorbances at 420nm in Torrefacto coffees also explain that caramelization products
in torrefacto roasted coffee are mainly water soluble.
Principal Component Analysis (PCA) has been applied to evaluate at a glance the
influence of the roasting type (conventional or torrefacto) and roasting degree (Dark,
Medium and Light) on the antioxidant activity and color of coffee samples. Figure 2
shows the bidimensional representation of all the variables and coffee samples
according to the two selected Principal Components (PC). PC1 (65.2% of the total
variance) was mainly characterized by the CIELab color parameters (L*, a* and b*) and
the Folin-Ciocalteau reducing capacity. It could be observed that PC1 distributed all the
coffee samples according to the roasting degree, being the dark samples on the left half-
part of the graphic, but independently of the origin, variety and type of roasting process
(conventional or torrefacto). PC2 (19.2% of the total variance) was mainly and
positively characterized by the Absorbance at 420nm. So that, those coffees roasted
with sugar addition (torrefacto) were mapped in the top half-part of the graphic.
Roasting degree also exerts influence on brown compounds formation because dark
10
roasted coffees showed significantly (p<0.05) higher Absorbances at 420nm than
medium and light conventional coffees (Table 1). However, this influence was much
lower than that induced by torrefacto roast because (1) there were no significant
differences between medium and light conventional coffees in agreement with other
authors (del Castillo, Ames, & Gordon, 2002), and (2) PC2 can not discriminate among
different roasting degree coffees. In conclusion, the Absorbance at 420nm might be
proposed as a good marker of torrefacto roasting process, whereas the roasting degree
might be better characterized by L* values.
3.2 Influence of torrefacto roasting process on phenolic compounds and
antioxidant capacity. The antioxidant capacity of coffee was evaluated by two
colorimetric assays, the chain-breaking activity by DPPH· radical quenching assay and
the Folin-Ciocalteau assay.
Figure 3 shows the antioxidant capacity, measured by the DPPH quenching assay, of the
Torrefacto roasted coffees in comparison with conventional roasted coffees of different
origins (Colombia, Brazil, Kenya, Guatemala, and Vietnam) and different roasting
degrees (Dark, Medium and Light). Commercial conventional roasted coffees showed
lower DPPH results than lab-roasted torrefacto roasted coffees. This might be explained
by a longer storage (from roasting to purchase) under less controlled conditions (room
temperature) in commercial samples, because during storage the antioxidant capacity
decreases due to the presence of residual oxygen, and other radicals or pro-oxidant
compounds formed during the roasting process (Manzocco, Calligaris, & Nicoli, 2002).
According to the DPPH quenching activity, conventional roasted coffees of different
origins and the same roasting degree (Medium) can be ranked in increasing order as
Brazil < Vietnam < Colombia < Guatemala < Kenya. However, roasting degree seems
to influence conventional roasted coffees in different way depending on the origin or
11
variety because DPPH increased with a higher roasting degree (Dark vs Medium) for
Colombia coffee (Arabica), but decreased for Vietnam one (Robusta) (Medium vs
Light). This could be due to the fact that although Robusta coffee has higher amounts of
phenolic compounds than Arabica ones, roasting induces a higher loss of these
antioxidant compounds in Robusta coffees (Clifford, 1997; Perrone, Donangelo,
Donangelo, & Farah, 2010). In fact, only moderate correlation between DPPH and L*
values (-0.483, p<0.001) has been found.
Focusing into the influence of the sugar addition during roasting process, correlation
results show a clear and significant (0.701, p<0.001) tendency to increase the DPPH
antioxidant capacity with the amount of sugar added during roasting process. Also
T100L coffee exhibited higher DPPH results than the commercial conventional roasted
coffees. A significant and good correlation between DPPH and Absorbance at 420nm,
proposed as a good marker of torrefacto roasting process, has been found (0.721,
p<0.001). Moreover, DPPH quenching activity contributed partially to the PC2 in
Principal Component Analysis (Figure 2) that mapped those coffees roasted with sugar
addition (torrefacto) in the top half-part of the graphic. These findings are in agreement
with those obtained in commercial torrefacto roasted coffee blends (Lopez-Galilea et
al., 2006; Lopez-Galilea, de Peña & Cid, 2007). The higher DPPH quenching activity
can be attributed mainly to the formation of Maillard Reactions and caramelization
antioxidant products ((Manzocco, Calligaris, Mastrocola, Nicoli, & Lerici, 2001), but
the influence of torrefacto roasting on phenolic compounds should be deeper studied in
those coffees roasted with increasing amounts of sugar addition.
Figure 4 shows the FC results of the Torrefacto roasted coffees in comparison with
conventional roasted coffees of different origins (Colombia, Brazil, Kenya, Guatemala,
and Vietnam) and different roasting degrees (Dark, Medium and Light). The Folin
12
Ciocalteau method is traditionally used to measure phenolic compounds, but several
authors have reported that this method also evaluates other reducing nonphenolic
compounds, such as melanoidins, proteins and thiols, and thus should be seen as a
measure of total antioxidant capacity rather than phenolic content (Perez-Martinez,
Caemmerer, De Peña, Cid, & Kroh, 2010; Caemmerer & Kroh, 2006; Everette, Bryant,
Green, Abbey, Wangila, & Walker, 2010). A decrease of the antioxidant capacity
measured by Folin-Ciocalteau technique with the increase of roasting degree can be
observed. A highly significant (p<0.001) and good correlation (0.785) with L* values
has been found. Moreover, FC values also contributed to the PC1 in Principal
Component Analysis (Figure 2) together with the CIELab parameters and, then, to the
distribution of coffees according to the roasting degree. Similar patterns were reported
by other authors (Bekedam, Loots, Schols, Van Boekel, & Smit, 2008; Sacchetti, Di
Mattia, Pittia, & Mastrocola, 2009) in conventional roasted coffees, mainly due to a
higher degradation of chlorogenic acids, the most abundant phenolic compounds in
coffee. Loss of phenolic compounds during roasting is very well known and losses of 8-
10% for every 1% loss of dry matter (Clifford, 1997; Clifford, 1999; Clifford, 2000) up
to 95% of the chlorogenic acid content in green coffee with drastic roasting conditions
(Trugo & Macrae, 1984) were reported.
Higher FC reducing capacities were found in those coffees roasted with sugar
(torrefacto) in comparison with their respective conventional roasted ones (0 Dark I and
0 Dark II) (Figure 4), but only were statistically significant in the batch II. For that
reason, 5-caffeoylquinic, caffeic and ferulic acids, and 4-vinylguaiacol were quantified
in lab-roasted coffees by HPLC analyses (Table 2). Little differences among lab-roasted
coffees in the four phenolic compounds (3.48-6.34 mg 5-CQA, 4.03-5.16 μg caffeic
acid, 37.22-49.15 μg ferulic acid, and 6.60-7.87 μg 4-vinylguaiacol per g of coffee)
13
were observed. These differences, most of them statistically non-significant (p<0.05),
seem to be due to the normal variations during roasting process, but not to the addition
of sugar during torrefacto roasting process. The most abundant chlorogenic acid in
coffee, 5-caffeoylquinic acid, and caffeic acid that is a hydroxycinnamic acid partially
originated by hydrolysis of caffeoylquinic and dicaffeoylquinic acids during roasting
process, were found in similar amounts than in commercial Colombian coffees (4.3
mg/g for 5-CQA and 5.5 µg/g for caffeic acid) (Lopez-Galilea et al., 2008). However, in
commercial torrefacto coffee blends in the latter study (Lopez-Galilea et al., 2008)
ferulic acid was found in lower amounts (12.8-19.3 µg/g), whereas 4-vinylguaiacol was
higher (30.6-57.6 µg/g). Ferulic acid is a hydroxycinnamic acid mainly derived from the
roasting degradation of feruloylquinic acids (FQAs) that only account for a 5-13% of
total chlorogenic acids in green coffee (Farah, Monteiro, Calado, Franca, & Trugo,
2006). And 4-vinylguaiacol is a degradation product of ferulic acid. So that, both
compounds might be present in different amounts depending on the initial content of
feruloylquinic acids in green coffee and roasting process conditions.
According to the results of Table 2, the addition of sugar during torrefacto roasting
process did not reduce the decrease of the main phenolic compounds caused by heat
treatment as it was suggested by the Folin-Ciocalteau technique if it is used as a
measurement of the total phenolic compounds. This discrepancy in the results might be
explained by the formation of other reducing nonphenolic compounds that react with
the Folin Ciocalteau reagent during torrefacto roasting process, but not by a protective
effect of torrefacto roasting against the degradation of phenolic compounds. This agrees
with the results of Lopez-Galilea et al. (2008) who do not find any correlations between
phenolic compounds and torrefacto roast in commercial coffee blends. Thus, it could be
said that torrefacto roasting process hardly affects the final content of phenolic
14
compounds that seems to be more influenced by other factors such as roasting degree,
the variety of coffee, etc. (Farah et al., 2006).
In conclusion, although the addition of sugar during roasting increases the antioxidant
properties of coffee measured as radical quenching capacity, roasting degree and other
factors, such as coffee variety, origin or also storage conditions, influence overall
antioxidant activity as well. Moreover, in this study, the Absorbance at 420 nm has been
proposed as a good marker of torrefacto roasting process, whereas the roasting degree
might be better characterized by L* values.
ACKNOWLEDGEMENTS
We thank the Spanish Ministerio de Economía y Competitividad (AGL 2009-12052),
the Departamento de Educación, Cultura y Deporte of the Gobierno de Navarra, and
PIUNA (Plan de Investigación de la Universidad De Navarra) for the financial support.
The Departamento de Educación, Cultura y Deporte of the Gobierno de Navarra, and
the Asociación de Amigos of the University of Navarra are gratefully acknowledged for
the grants given to I.A. and J.B. We also thank the Unión Tostadora and Azkoyen, S.A.
for providing the coffee samples.
This work was carried out in the framework of COST 927-Thermally processed foods:
possible health implication, and part of these results were presented in the COST
Meeting in Ebersberg (September 2007, Germany).
Part of this paper was presented at the FESNAD International Conference, March 2010,
Barcelona (Spain).
15
REFERENCES
Alvarez-Vidaurre, P., Perez-Martinez, M., de Peña, M. P., Cid, C. (2005). Development, validation and application of a new analytical method of caffeic acid, ferulic acid and 4-vinylguaiacol in coffee brews. Proceedings of the 13th Euro Food Chem., Hamburg, Germany, pp. 684-687.
Andueza, S., Cid, C., & Nicoli, M. C. (2004). Comparison of Antioxidant and Pro-Oxidant Activity in Coffee Beverages Prepared with Conventional and "Torrefacto" Coffee. Lebensmittel-Wissenschaft Und-Technologie-Food Science and Technology, 37(8), 893-897.
Bekedam, E. K., Loots, M. J., Schols, H. A., Van Boekel, M. A. J. S., & Smit, G. (2008). Roasting Effects on Formation Mechanisms of Coffee Brew Melanoidins. Journal of Agricultural and Food Chemistry, 56(16), 7138-7145.
Brand-Williams, W., Cuvelier, M. E., & Berset, C. (1995). Use of a Free Radical Method to Evaluate Antioxidant Activity. LWT - Food Science and Technology, 28(1), 25-30.
Caemmerer, B. & Kroh, L. W. (2006). Antioxidant Activity of Coffee Brews. European Food Research and Technology, 223(4), 469-474.
Clifford, M. N. (2000). Chlorogenic Acids and Other Cinnamates - Nature, Occurrence, Dietary Burden, Absorption and Metabolism. Journal of the science of food and agriculture, 80(7), 1033-1043.
Clifford, M. N. (1999). Chlorogenic Acids and Other Cinnamates - Nature, Occurrence and Dietary Burden. Journal of the science of food and agriculture, 79(3), 362-372.
Clifford, M. N. (1997). The Nature of Chlorogenic Acids. are they Advantageous Compounds in Coffee? Seventeenth international scientific colloquium on coffee, Nairobi, July 20-25, 1997, 79-91.
del Castillo, M. D., Ames, J., & Gordon, M. H. (2002). Effect of Roasting on the Antioxidant Activity of Coffee Brews. Journal of Agricultural and Food Chemistry, 50(13), 3698-3703.
Everette, J., Bryant, Q., Green, A., Abbey, Y., Wangila, G., & Walker, R. (2010). Thorough Study of Reactivity of various Compound Classes Toward the Folin-Ciocalteu Reagent. Journal of Agricultural and Food Chemistry, 58(14), 8139-8144.
Farah, A., Monteiro, M. C., Calado, V., Franca, A. S., & Trugo, L. C. (2006). Correlation between Cup Quality and Chemical Attributes of Brazilian Coffee. Food Chemistry, 98(2), 373-380.
16
Hofmann, T. (1999). Quantitative Studies on the Role of Browning Precursors in the Maillard Reaction of Pentoses and Hexoses with L-alanine. European food research and technology, 209, 113-21.
Lopez-Galilea, I., Andueza, S., di Leonardo, I., de Peña, M. P., & Cid, C. (2006). Influence of Torrefacto Roast on Antioxidant and Pro-Oxidant Activity of Coffee. Food Chemistry, 94(1), 75-80.
Lopez-Galilea, I., de Peña, M. P., & Cid, C. (2008). Application of Multivariate Analysis to Investigate Potential Antioxidants in Conventional and Torrefacto Roasted Coffee. European Food Research and Technology, 227(1), 141-149.
Lopez-Galilea, I., de Peña, M. P., & Cid, C. (2007). Correlation of Selected Constituents with the Total Antioxidant Capacity of Coffee Beverages: Influence of the Brewing Procedure. Journal of Agricultural and Food Chemistry, 55(15), 6110-6117.
Manzocco, L., Calligaris, S., Mastrocola, D., Nicoli, M. C., & Lerici, C. R. (2001). Review of Non-Enzymatic Browning and Antioxidant Capacity in Processed Foods. Trends in Food Science & Technology, 11(9-10), 340-346.
Manzocco, L., Calligaris, S., & Nicoli, M. (2002). Assessment of Pro-Oxidant Activity of Foods by Kinetic Analysis of Crocin Bleaching. Journal of Agricultural and Food Chemistry, 50(10), 2767-2771.
Morales, F. J. (2005). Assessing the Non-Specific Hydroxyl Radical Scavenging Properties of Melanoidins in a Fenton-Type Reaction System. Analytica Chimica Acta, 534(1), 171-176.
Nicoli, M. C., Anese, M., Manzocco, L., & Lerici, C. R. (1997). Antioxidant Properties of Coffee Brews in Relation to the Roasting Degree. Food Science and Technology-Lebensmittel-Wissenschaft & Technologie, 30(3), 292-297.
Nunes, F. & Coimbra, M. (2007). Melanoidins from Coffee Infusions. Fractionation, Chemical Characterization, and Effect of the Degree of Roast. Journal of Agricultural and Food Chemistry, 55(10), 3967-3977.
Perez-Martinez, M., Caemmerer, B., De Pena, M. P., Cid, C., & Kroh, L. (2010). Influence of Brewing Method and Acidity Regulators on the Antioxidant Capacity of Coffee Brews. Journal of Agricultural and Food Chemistry, 58(5), 2958-2965.
Perez-Martinez, M., Sopelana, P., De Peña, M. P., & Cid, C. (2008). Application of Multivariate Analysis to the Effects of Additives on Chemical and Sensory Quality of Stored Coffee Brew. Journal of Agricultural and Food Chemistry, 56(24), 11845-11853.
Perrone, D., Donangelo, R., Donangelo, C., & Farah, A. (2010). Modeling Weight Loss and Chlorogenic Acids Content in Coffee during Roasting. Journal of Agricultural and Food Chemistry, 58(23), 12238-12243.
17
Pulido, R., Hernandez-Garcia, M., & Saura-Calixto, F. (2003). Contribution of Beverages to the Intake of Lipophilic and Hydrophilic Antioxidants in the Spanish Diet. European journal of clinical nutrition, 57(10), 1275-1282.
Real Decreto 1231/1988 (1988) BOE no. 252, 20 Octubre 1988.
Rizzi, G. P. (1997). Chemical Structure of Colored Maillard Reaction Products. Food Reviews International, 13(1), 1.
Sacchetti, G., Di Mattia, C., Pittia, P., & Mastrocola, D. (2009). Effect of Roasting Degree, Equivalent Thermal Effect and Coffee Type on the Radical Scavenging Activity of Coffee Brews and their Phenolic Fraction. Journal of Food Engineering, 90(1), 74-80.
Singleton, V. L., Orthofer, R., & Lamuela-Raventos, R. M. (1999). Analysis of Total Phenols and Other Oxidation Substrates and Antioxidants by Means of Folin-Ciocalteu Reagent. Oxidants and Antioxidants, Pt a, 299, 152-178.
Summa, C., de la Calle, B., Brohee, M., Stadler, R., & Anklam, E. (2007). Impact of the Roasting Degree of Coffee on the in Vitro Radical Scavenging Capacity and Content of Acrylamide. LWT - Food Science and Technology, 40(10), 1849-1854.
Svilaas, A., Sakhi, A. K., Andersen, L. F., Svilaas, T., Strom, E. C., Jacobs, D. R., Ose, L., & Blomhoff, R. (2004). Intakes of Antioxidants in Coffee, Wine, and Vegetables are Correlated with Plasma Carotenoids in Humans. Journal of Nutrition, 134(3), 562-567.
Trugo, L. C. & Macrae, R. (1984). A Study of the Effect of Roasting on the Chlorogenic Acid Composition of Coffee using HPLC. Food Chemistry, 15(3), 219-227.
Vignoli, J. A., Bassoli, D. G., & Benassi, M. T. (2011). Antioxidant Activity, Polyphenols, Caffeine and Melanoidins in Soluble Coffee: The Influence of Processing Conditions and Raw Material. Food Chemistry, 124(3), 863-868.
18
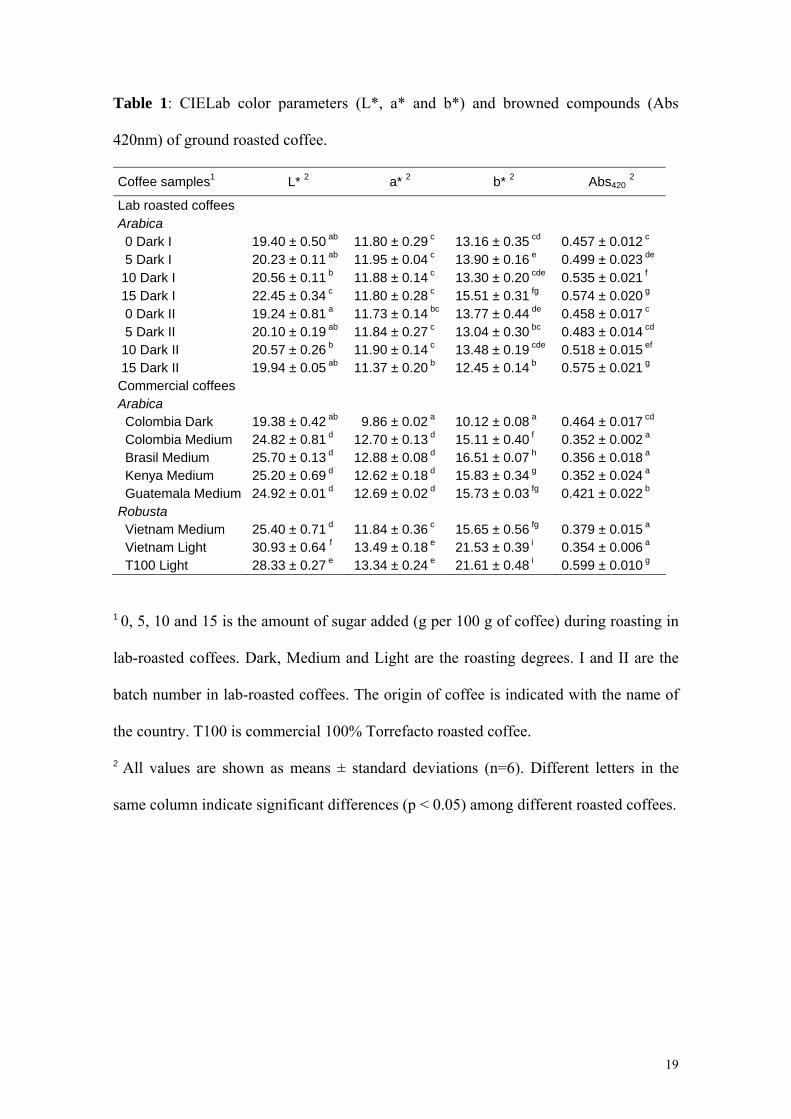
Table 1: CIELab color parameters (L*, a* and b*) and browned compounds (Abs
420nm) of ground roasted coffee.
Coffee samples1 L* 2 a* 2 b* 2 Abs420 2
Lab roasted coffees Arabica 0 Dark I 19.40 ± 0.50 ab 11.80 ± 0.29 c 13.16 ± 0.35 cd 0.457 ± 0.012 c
5 Dark I 20.23 ± 0.11 ab 11.95 ± 0.04 c 13.90 ± 0.16 e 0.499 ± 0.023 de
10 Dark I 20.56 ± 0.11 b 11.88 ± 0.14 c 13.30 ± 0.20 cde 0.535 ± 0.021 f
15 Dark I 22.45 ± 0.34 c 11.80 ± 0.28 c 15.51 ± 0.31 fg 0.574 ± 0.020 g
0 Dark II 19.24 ± 0.81 a 11.73 ± 0.14 bc 13.77 ± 0.44 de 0.458 ± 0.017 c
5 Dark II 20.10 ± 0.19 ab 11.84 ± 0.27 c 13.04 ± 0.30 bc 0.483 ± 0.014 cd
10 Dark II 20.57 ± 0.26 b 11.90 ± 0.14 c 13.48 ± 0.19 cde 0.518 ± 0.015 ef
15 Dark II 19.94 ± 0.05 ab 11.37 ± 0.20 b 12.45 ± 0.14 b 0.575 ± 0.021 g
Commercial coffees Arabica Colombia Dark 19.38 ± 0.42 ab 9.86 ± 0.02 a 10.12 ± 0.08 a 0.464 ± 0.017 cd
Colombia Medium 24.82 ± 0.81 d 12.70 ± 0.13 d 15.11 ± 0.40 f 0.352 ± 0.002 a
Brasil Medium 25.70 ± 0.13 d 12.88 ± 0.08 d 16.51 ± 0.07 h 0.356 ± 0.018 a
Kenya Medium 25.20 ± 0.69 d 12.62 ± 0.18 d 15.83 ± 0.34 g 0.352 ± 0.024 a
Guatemala Medium 24.92 ± 0.01 d 12.69 ± 0.02 d 15.73 ± 0.03 fg 0.421 ± 0.022 b
Robusta Vietnam Medium 25.40 ± 0.71 d 11.84 ± 0.36 c 15.65 ± 0.56 fg 0.379 ± 0.015 a
Vietnam Light 30.93 ± 0.64 f 13.49 ± 0.18 e 21.53 ± 0.39 i 0.354 ± 0.006 a
T100 Light 28.33 ± 0.27 e 13.34 ± 0.24 e 21.61 ± 0.48 i 0.599 ± 0.010 g
1 0, 5, 10 and 15 is the amount of sugar added (g per 100 g of coffee) during roasting in
lab-roasted coffees. Dark, Medium and Light are the roasting degrees. I and II are the
batch number in lab-roasted coffees. The origin of coffee is indicated with the name of
the country. T100 is commercial 100% Torrefacto roasted coffee.
2 All values are shown as means ± standard deviations (n=6). Different letters in the
same column indicate significant differences (p < 0.05) among different roasted coffees.
19
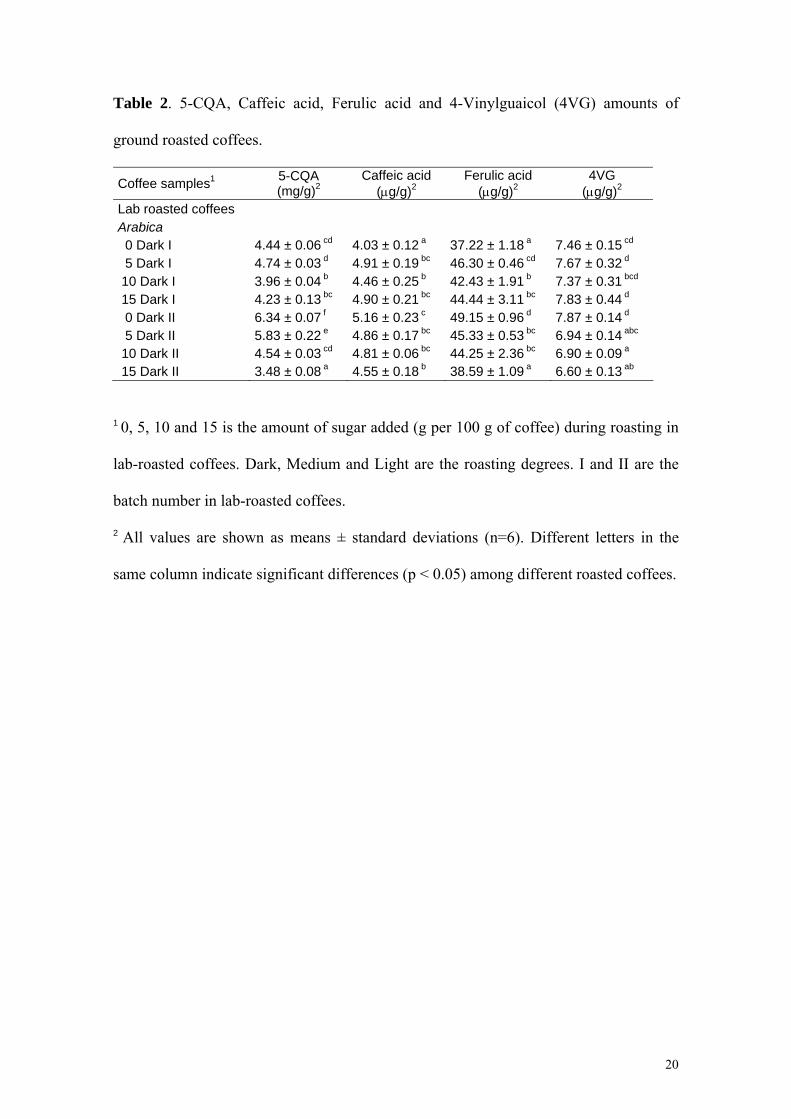
Table 2. 5-CQA, Caffeic acid, Ferulic acid and 4-Vinylguaicol (4VG) amounts of
ground roasted coffees.
Coffee samples1 5-CQA (mg/g)2
Caffeic acid (μg/g)2
Ferulic acid (μg/g)2
4VG (μg/g)2
Lab roasted coffees Arabica 0 Dark I 4.44 ± 0.06 cd 4.03 ± 0.12 a 37.22 ± 1.18 a 7.46 ± 0.15 cd
5 Dark I 4.74 ± 0.03 d 4.91 ± 0.19 bc 46.30 ± 0.46 cd 7.67 ± 0.32 d
10 Dark I 3.96 ± 0.04 b 4.46 ± 0.25 b 42.43 ± 1.91 b 7.37 ± 0.31 bcd
15 Dark I 4.23 ± 0.13 bc 4.90 ± 0.21 bc 44.44 ± 3.11 bc 7.83 ± 0.44 d
0 Dark II 6.34 ± 0.07 f 5.16 ± 0.23 c 49.15 ± 0.96 d 7.87 ± 0.14 d
5 Dark II 5.83 ± 0.22 e 4.86 ± 0.17 bc 45.33 ± 0.53 bc 6.94 ± 0.14 abc
10 Dark II 4.54 ± 0.03 cd 4.81 ± 0.06 bc 44.25 ± 2.36 bc 6.90 ± 0.09 a
15 Dark II 3.48 ± 0.08 a 4.55 ± 0.18 b 38.59 ± 1.09 a 6.60 ± 0.13 ab
1 0, 5, 10 and 15 is the amount of sugar added (g per 100 g of coffee) during roasting in
lab-roasted coffees. Dark, Medium and Light are the roasting degrees. I and II are the
batch number in lab-roasted coffees.
2 All values are shown as means ± standard deviations (n=6). Different letters in the
same column indicate significant differences (p < 0.05) among different roasted coffees.
20
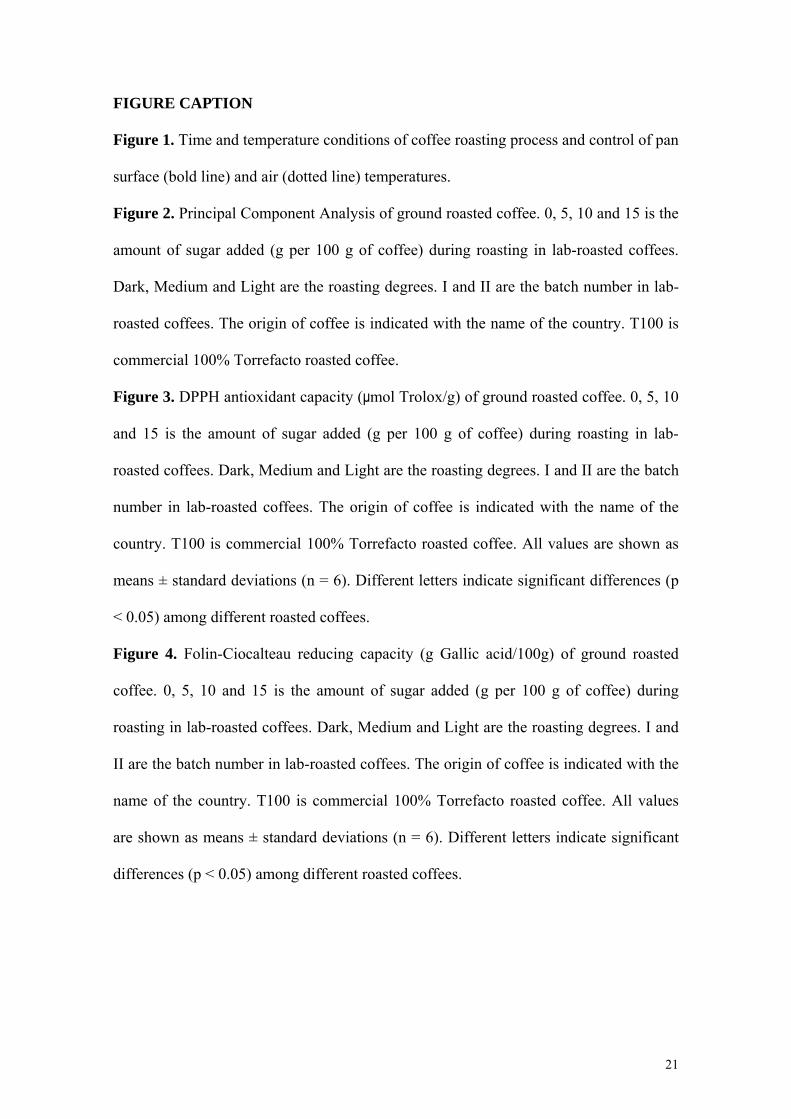
FIGURE CAPTION
Figure 1. Time and temperature conditions of coffee roasting process and control of pan
surface (bold line) and air (dotted line) temperatures.
Figure 2. Principal Component Analysis of ground roasted coffee. 0, 5, 10 and 15 is the
amount of sugar added (g per 100 g of coffee) during roasting in lab-roasted coffees.
Dark, Medium and Light are the roasting degrees. I and II are the batch number in lab-
roasted coffees. The origin of coffee is indicated with the name of the country. T100 is
commercial 100% Torrefacto roasted coffee.
Figure 3. DPPH antioxidant capacity (μmol Trolox/g) of ground roasted coffee. 0, 5, 10
and 15 is the amount of sugar added (g per 100 g of coffee) during roasting in lab-
roasted coffees. Dark, Medium and Light are the roasting degrees. I and II are the batch
number in lab-roasted coffees. The origin of coffee is indicated with the name of the
country. T100 is commercial 100% Torrefacto roasted coffee. All values are shown as
means ± standard deviations (n = 6). Different letters indicate significant differences (p
< 0.05) among different roasted coffees.
Figure 4. Folin-Ciocalteau reducing capacity (g Gallic acid/100g) of ground roasted
coffee. 0, 5, 10 and 15 is the amount of sugar added (g per 100 g of coffee) during
roasting in lab-roasted coffees. Dark, Medium and Light are the roasting degrees. I and
II are the batch number in lab-roasted coffees. The origin of coffee is indicated with the
name of the country. T100 is commercial 100% Torrefacto roasted coffee. All values
are shown as means ± standard deviations (n = 6). Different letters indicate significant
differences (p < 0.05) among different roasted coffees.
21
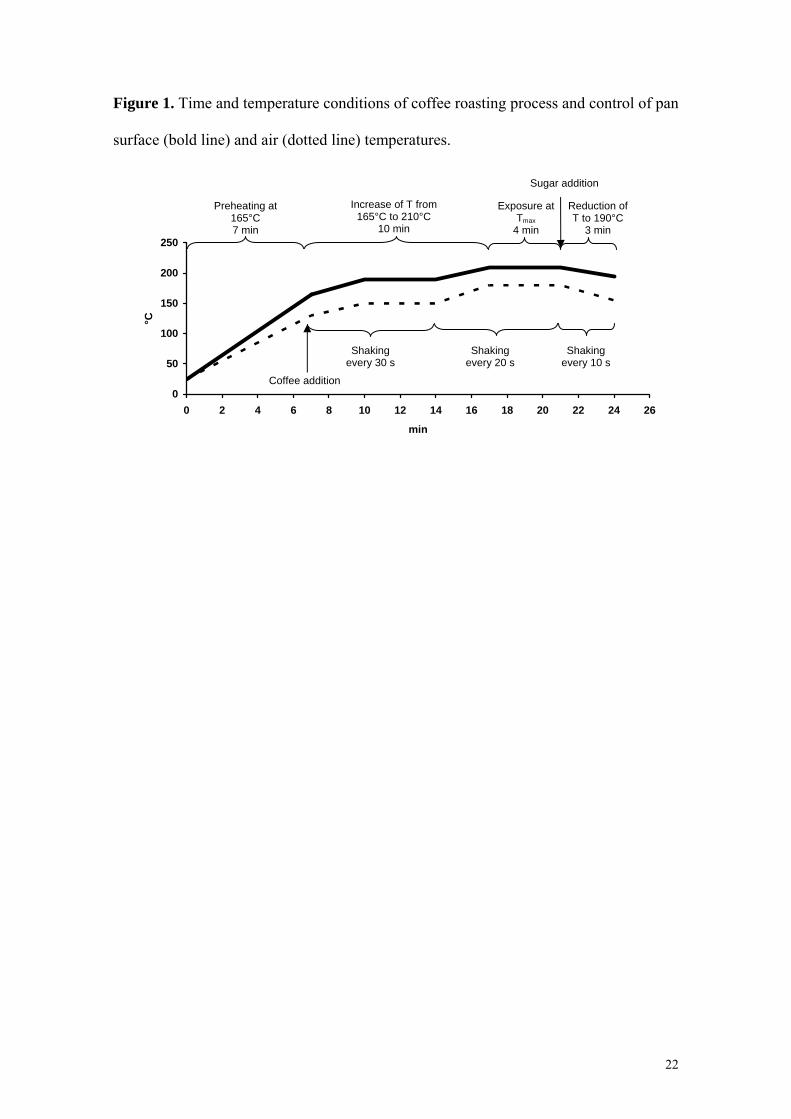
Figure 1. Time and temperature conditions of coffee roasting process and control of pan
surface (bold line) and air (dotted line) temperatures.
0
50
100
150
200
250
0 2 4 6 8 10 12 14 16 18 20 22 24 26
min
°C
Preheating at 165°C 7 min
Increase of T from 165°C to 210°C
10 min
Exposure at Tmax
4 min
Reduction of T to 190°C
3 min
Shaking every 30 s
Shaking every 20 s
Shaking every 10 s
Sugar addition
Coffee addition
22
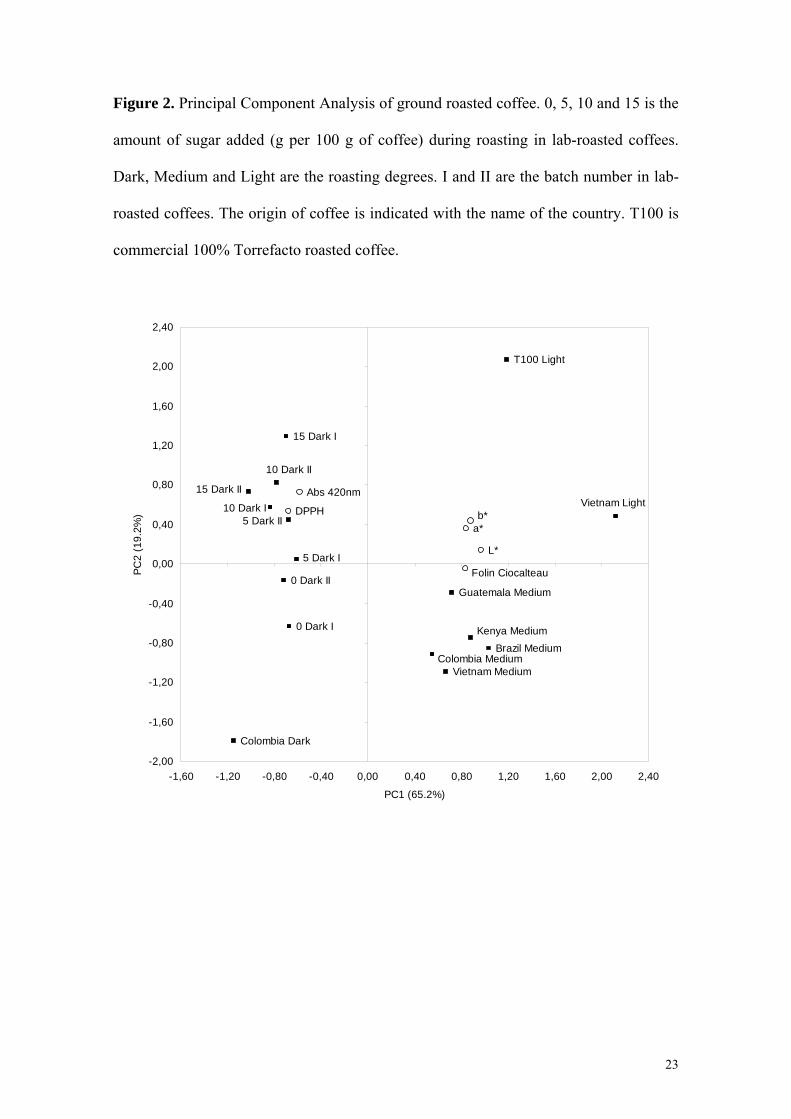
Figure 2. Principal Component Analysis of ground roasted coffee. 0, 5, 10 and 15 is the
amount of sugar added (g per 100 g of coffee) during roasting in lab-roasted coffees.
Dark, Medium and Light are the roasting degrees. I and II are the batch number in lab-
roasted coffees. The origin of coffee is indicated with the name of the country. T100 is
commercial 100% Torrefacto roasted coffee.
0 Dark I
5 Dark I
10 Dark I
15 Dark I
Colombia Dark
T100 Light
Vietnam Medium
Brazil MediumKenya Medium
Guatemala Medium
Colombia Medium
Vietnam Light
L*
b*a*
Folin Ciocalteau
DPPH
Abs 420nm
0 Dark II
5 Dark II
10 Dark II
15 Dark II
-2,00
-1,60
-1,20
-0,80
-0,40
0,00
0,40
0,80
1,20
1,60
2,00
2,40
-1,60 -1,20 -0,80 -0,40 0,00 0,40 0,80 1,20 1,60 2,00 2,40
PC1 (65.2%)
PC2
(19.
2%)
23
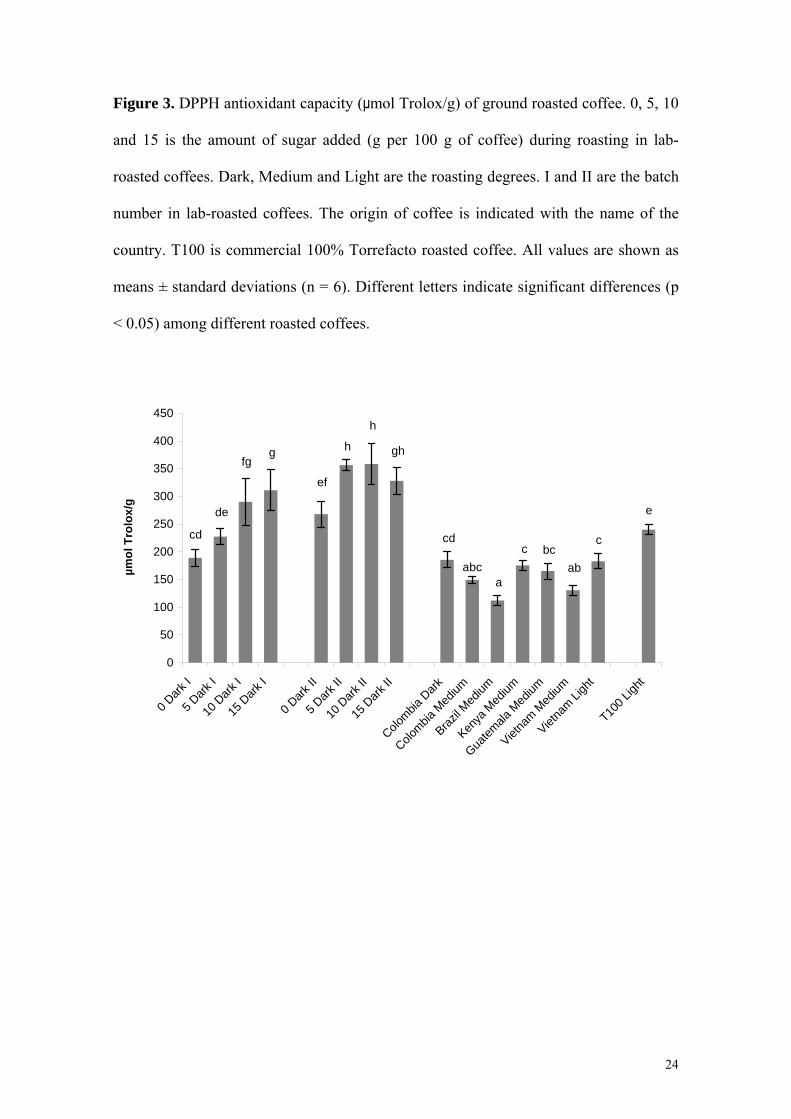
Figure 3. DPPH antioxidant capacity (μmol Trolox/g) of ground roasted coffee. 0, 5, 10
and 15 is the amount of sugar added (g per 100 g of coffee) during roasting in lab-
roasted coffees. Dark, Medium and Light are the roasting degrees. I and II are the batch
number in lab-roasted coffees. The origin of coffee is indicated with the name of the
country. T100 is commercial 100% Torrefacto roasted coffee. All values are shown as
means ± standard deviations (n = 6). Different letters indicate significant differences (p
< 0.05) among different roasted coffees.
e
c
abbcc
aabc
cd
gh
h
h
ef
gfg
de
cd
0
50
100
150
200
250
300
350
400
450
0 Dark
I
5 Dark
I
10 D
ark I
15 D
ark I
0 Dark
II
5 Dark
II
10 D
ark II
15 D
ark II
Colombia
Dark
Colombia
Med
ium
Brazil M
edium
Kenya
Med
ium
Guatem
ala M
edium
Vietna
m Med
ium
Vietna
m Ligh
t
T100 L
ight
µmol
Tro
lox/
g
24
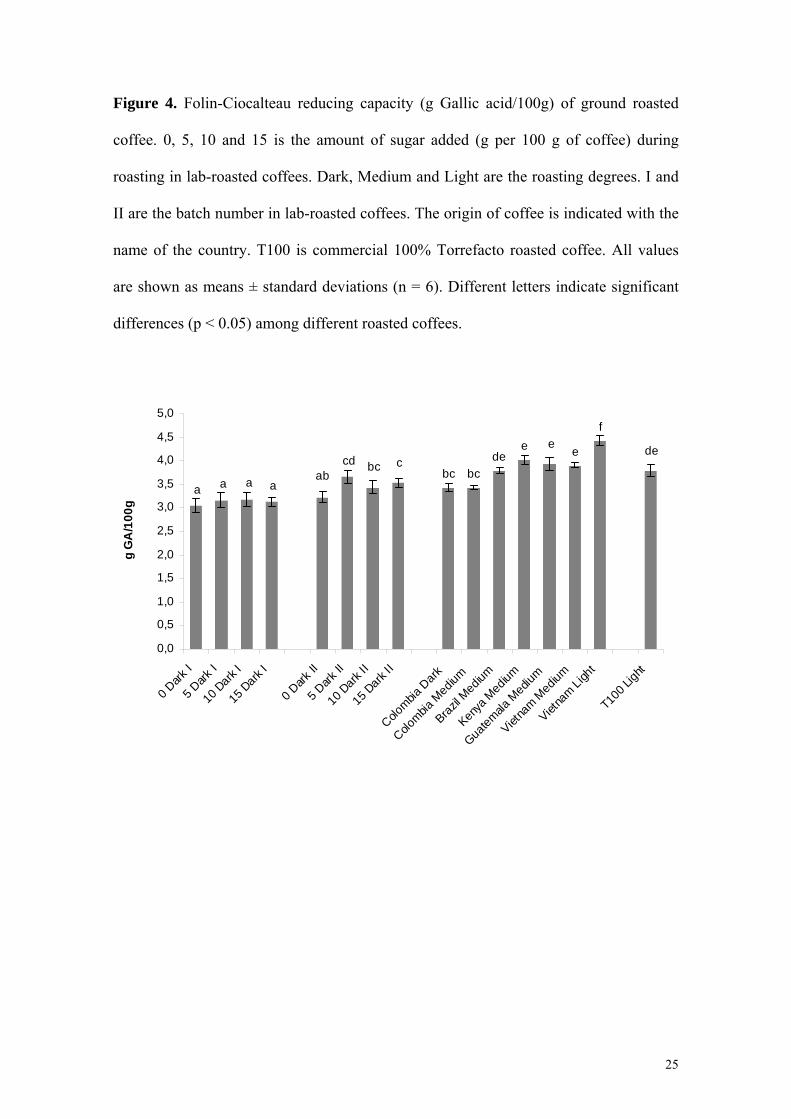
Figure 4. Folin-Ciocalteau reducing capacity (g Gallic acid/100g) of ground roasted
coffee. 0, 5, 10 and 15 is the amount of sugar added (g per 100 g of coffee) during
roasting in lab-roasted coffees. Dark, Medium and Light are the roasting degrees. I and
II are the batch number in lab-roasted coffees. The origin of coffee is indicated with the
name of the country. T100 is commercial 100% Torrefacto roasted coffee. All values
are shown as means ± standard deviations (n = 6). Different letters indicate significant
differences (p < 0.05) among different roasted coffees.
de
f
eee
debcbc
cbccdab
aaaa
0,0
0,5
1,0
1,5
2,0
2,5
3,0
3,5
4,0
4,5
5,0
0 Dark
I
5 Dark
I
10 D
ark I
15 D
ark I
0 Dark
II
5 Dark
II
10 D
ark II
15 D
ark II
Colombia
Dark
Colombia
Med
ium
Brazil M
edium
Kenya
Med
ium
Guatem
ala M
edium
Vietna
m Med
ium
Vietna
m Ligh
t
T100
Ligh
t
g G
A/1
00g
25

Results
37
Objective 2
Study of the extractability of the main coffee anti oxidant compounds during the most
common brewing process (espresso and filter coffeem akers).
Estudio de la extracción de los principales compues tos antioxidantes durante la
preparación de la bebida de café mediante los siste mas de extracción más habitualmente
utilizados (cafeteras expreso y de filtro).
Paper 2:
Extraction of coffee antioxidants: impact of brewing time and method
Iziar A. Ludwig , Lidia Sanchez, Bettina Caemmerer, Lothar W. Kroh, M. Paz De Peña,
Concepción Cid
Food Research International, 2012, 48, 57-64
Impact factor (JCR, 2011): 3.150
Journal Rank in category:
• Food Science and Technology: 11/128 (Q1)

TITLE: Extraction of coffee antioxidants: impact of brewing time and method
ARTICLE TYPE: Research article
AUTHORS: Iziar A. Ludwiga, Lidia Sancheza, Bettina Caemmererb, Lothar W.
Krohb, M. Paz De Peñaa*, Concepción Cida
a Department of Nutrition, Food Science, Physiology, and Toxicology, School of
Pharmacy, University of Navarra, E-31080-Pamplona, Spain
b Institut für Lebensmittelchemie, Technische Universität Berlin, Gustav-Meyer-Allee
25, D-13355 Berlin, Germany
Published in Food Research International 48, 57-64 (2012)
*Corresponding author:
M. Paz De Peña
Department of Nutrition, Food Science, Physiology, and Toxicology
School of Pharmacy, University of Navarra
C/ Irunlarrea 1
E-31080-Pamplona, Spain
Tel: +34 948 425600 (806580)
Fax: +34 948 425740
E-mail address: [email protected]
ABSTRACT
The aim of this work was to study the extraction behavior of the main coffee
antioxidants (caffeoylquinic acids, melanoidins and caffeine) and the antioxidant
capacity, during brewing time in the most widely consumed coffee brew methods (filter
and espresso) in coffee. Antioxidant capacity by colorimetric assays (Folin-Ciocalteau,
ABTS and DPPH) and electron spin resonance spectroscopy techniques (Fremy’s salt
and TEMPO) were analyzed. In espresso coffee, more than 70% of the antioxidants
(except dicaffeoylquinic acids, diCQA) of a coffee brew were extracted during the first
8 s. In filter coffee, a U-shape antioxidants extraction profile was observed, starting later
(after 75s) in Vietnam coffee than in Guatemala one, probably due to different
wettability. Other technological parameters, such as turbulences and a longer contact
time between water and ground coffee in filter coffeemaker, increased extraction
efficiency, mainly in less polar antioxidant compounds as diCQA. In conclusion, these
technological factors should be considered to optimize coffee antioxidants extraction
that can be used as ingredients for functional foods.
KEYWORDS: Antioxidants, brewing time, coffee, Maillard reaction products,
phenolics.
1. INTRODUCTION
Several chronic diseases, such as cancer, cardiovascular, inflammatory, and
neurogenerative pathologies are associated with oxidative stress (Aruoma, 1999; Beal,
1995; Dorea & da Costa, 2005). Beside fruits and vegetables, plant beverages such as
coffee brew have been proposed as an important source of antioxidants in human diet
(Pulido, Hernandez Garcia, & Saura Calixto, 2003; Svilaas, Sakhi, Andersen, Svilaas,
Strom, & Jacobs, 2004). The antioxidant capacity of coffee brew is attributed to both
antioxidants originally present in coffee beans, like phenolic compounds, and roasting-
induced antioxidants, like melanoidins and other Maillard Reaction Products (MRP)
(Borrelli, Visconti, Mennella, Anese, & Fogliano, 2002; Crozier, Jaganath, & Clifford,
2009; del Castillo, Ames, & Gordon, 2002).
The most abundant phenolic compounds of coffee are chlorogenic acids (CGA). CGA
are known for their contribution to the final acidity, astringency, and bitterness of the
coffee brew, but also for their potent antioxidant properties (Moreira, Monteiro,
Ribeiro-Alves, Donangelo, & Trugo, 2005; Natella, Nardini, Giannetti, Dattilo, &
Scaccini, 2002; Trugo & Macrae, 1984; Variyar, Ahmad, Bhat, Niyas, & Sharma,
2003). During roasting, CGA are partially degraded and at least partly incorporated in
coffee melanoidins through non-covalent or covalent bounds (Bekedam, Schols, van
Boekel, & Smit, 2008; Nunes & Coimbra, 2010). Melanoidins are generally defined as
the browned-colored, high-molecular-weight, nitrogenous end products of the Maillard
reaction. They are formed during roasting process of coffee. Beside its contribution to
flavor and color, one of the important functional properties of melanoidins is its
antioxidant activity (Caemmerer & Kroh, 2006; C. Delgado-Andrade & Morales, 2005;
López-Galilea, Andueza, Leonardo, de Peña, & Cid, 2006; Rufián-Henares & Morales,
2007). Although there is still a discussion about their bioavailability, it is clear that at
least they may act as prebiotic or even antimicrobial depending on their nature and
concentration (Borrelli & Fogliano, 2005; Rufián-Henares & de la Cueva, 2009). Also
caffeine or its metabolites in humans have been proposed as antioxidant compounds
against lipid peroxidation induced by reactive oxygen species (Devasagayam, Kamat,
Mohan, & Kesavan, 1996; Lee, 2000). However, although caffeine has been extensively
studied from the pharmacological point of view, less attention has been paid to its
potential antioxidant activity that may be overshadowed by phenolic compounds and
MRP.
Brewing process is essential for the antioxidant composition and health properties of a
coffee brew, because the contact of water with roasted coffee grounds is the crucial step
for extraction of coffee compounds. Other factors, such as origin or variety of coffee
beans, blending, roasting degree and grinding also play a key role in coffee
composition. Among the several brewing techniques, filter coffee (drip filter) is the
most widely used coffee brew obtained by infusion method, whereas espresso coffee is
the most appreciated coffee brew produced by pressure method. In drip filtration
methods, water at 92-96 ºC flows through a hardly compressed ground coffee bed and
the extract drips from the brewing chamber into the pot. Turbulence in the brewing
chamber prevents water from becoming saturated (Lingle, 1996). In pressure methods,
water at approximately 9 bars and 88-92ºC is forced to go through coffee grounds
compacted in a small brewing chamber (coffee cake). Also rapid brewing time and fine
particle size are necessary (Lingle, 1996). Many chemical species identified in roasted
coffee, including antioxidants, exhibit different extraction rates that may also be
influenced by the choice of brewing technique and conditions (Peters, 1991; Petracco,
2001; Petracco, 2005).
Even though the brewing time is given by the coffee brewing technique, the knowledge
of extraction behavior of the main coffee antioxidants during this time might induce to
know the technological factors with major impact on antioxidants extraction. Thus, it
could be possible to obtain not only coffee brews with higher antioxidant capacity, but
also coffee extracts with health properties that can be used as ingredients in functional
foods. For these reasons, the aim of this work was to study the extraction behavior of
the main coffee antioxidants and the antioxidant capacity, during brewing time in the
most widely consumed coffee brew procedures (filter and espresso).
2. MATERIALS AND METHODS
2.1. Chemicals and reagents. The methanol (spectrophotometric and HPLC grade) and
Folin-Ciocalteau reagent were from Panreac (Barcelona, Spain). ABTS (2,2’-Azino-
bi(3-ethylbenzo-thiazonile-6-sulfonic acid) diammonium salt), potassium persulfate,
DPPH- (2,2-Diphenyl-1-picrylhydrazyl), Trolox (6-hydroxy-2,5,7,8-tetramethyl-
chroman-2-carboxylic acid), dipotassium hydrogen phosphate, potassium dihydrogen
phosphate, sodium chloride, Fremy’s salt (potassium nitrosodisulfonate) and TEMPO
(2,2,6,6-tetramethyl-1-piperidin-1-oxyl) were purchased from Sigma-Aldrich
(Steinheim, Germany). Gallic acid was from Fluka (Madrid, Spain). Pure reference
standards of 5-caffeoylquinic acid (5-CQA) and caffeine were obtained from Sigma-
Aldrich (Steinheim, Germany) and pure reference standards of 3,4-, 3,5- and 4,5-
dicaffeoylquinic acids were purchased from Phytolab (Vestenbergsgreuth, Germany). A
mixture of 3-CQA, 4-CQA, and 5-CQA was prepared from 5-CQA using the
isomerization method of Trugo and Macrae (1984), also described in Farah et al. (2005).
2.2. Coffee brew samples. Roasted coffee from Guatemala (Coffea arabica, 3.03 %
water content, L* = 25.40 ± 0.69, roasted at 219 ºC for 905 s) and Vietnam (Coffea
canephora var. robusta, 1.59 % water content, L* = 24.92 ± 0.01, roasted at 228 ºC for
859 s) was provided by a local factory. The L* value was analyzed by means of a
tristimulus colorimeter (Chromameter-2 CR-200, Minolta, Osaka, Japan) using the D65
illuminant and CIE 1931 standard observer. The instrument was standardized against a
white tile before sample measurements. Ground roasted coffee was spread out in an
l cm Petri plate, and the L* value was measured in triplicate on the CIELab scale.
Roasted coffee beans were ground to a powder in a Moulinex coffee grinder (model
Super Junior “s”, Paris, France) for 20 s immediately before sample preparation. Filter
Coffee Brew was prepared from 36 g of ground roasted coffee for a volume of 600 mL,
using a filter coffee machine (model Avantis 70 Aroma plus, Ufesa, Spain). Extraction
took approx. 6 min at 90 ºC. Five fractions for filter coffee were collected sequentially
every 75 s. Espresso Coffee Brew was prepared from 7 g of ground roasted coffee for a
volume of 45 mL using an espresso coffee machine (model Saeco Aroma, Italy). Three
fractions for espresso coffee were collected sequentially every 8 s. Coffee brews and
fractions were lyophilized using a CRYODOS Telstar (Terrassa, Spain) and stored at -
18ºC until sample analysis.
2.3. pH. The pH measurements of coffee brews and fractions were performed with a
Crison Basic 20pH-meter.
2.4. Browned compounds (Abs 420 nm). Fifty microliters of coffee brew or fraction
were diluted up to 2 mL with deionized water. Browned compounds were quantified by
measuring the absorbance of the sample at 420 nm after exactly 1 min, in a 3 mL
capacity cuvette (1 cm length) with a Lambda 25 UV-VIS spectrophotometer (Perkin-
Elmer Instruments, Madrid, Spain) connected to a thermostatically controlled chamber
(25 ºC) and equipped with UV Win-Lab software (Perkin Elmer).
2.5. Folin-Ciocalteau (FC) assay. The Folin-Ciocalteau reducing capacity of coffee or
fractions was performed according to the Singleton´s method (Singleton & Rossi,
1965). For every coffee sample, 1:10 dilutions with demineralized water were prepared,
and 500 μL of Folin-Ciocalteau reagent were added to 100 μL of the coffee sample
solution. After 2 min delay, 1.5 mL of a 7.5% sodium carbonate solution was added.
Next, the sample was incubated in darkness at room temperature for 90 min. The
absorbance of the sample was measured at 765 nm in a Lambda 25 UV-VIS
spectrophotometer (Perkin Elmer Instruments, Madrid, Spain). Gallic acid (GA) was
used as reference, and the results were expressed as milligrams of GA per mililiter of
coffee brew or fraction.
2.6. Antioxidant capacity by ABTS assay. The antioxidant capacity measured with
ABTS was carried out according to the method described by Re et al. (1999) with some
modifications. The radicals ABTS·+ were generated by the addition of 2.45 mM
potassium persulfate to an 7 mM ABTS solution prepared in phosphate-buffered saline
(PBS, pH 7.4) and allowing the mixture to stand in darkness at room temperature for at
least 12 h before use. The ABTS·+ stock solution was adjusted with PBS to an
absorbance of 0.7 (±0.02) at 734 nm in a 1 cm cuvette at 25 ºC (Lambda 25 UV, VIS
spectrophotometer, Perkin Elmer Instruments, Madrid, Spain). An aliquot of 50 µL of
coffee sample diluted with demineralized water (5:1000 to 15:1000) was added to 2 mL
of ABTS·+ reagent and the absorbance was monitored for 18 min at 25 ºC. Calibration
was performed with Trolox solution (a water-soluble vitamin E analogue) and total
antioxidant capacity was expressed as micromoles (μmol) of Trolox per mililiter of
coffee brew or fraction.
2.7. Antioxidant capacity by DPPH assay. The antioxidant capacity was measured
using the DPPH decolorization assay (Brand-Williams, Cuvelier, & Berset, 1995). A
6.1x10⁻⁵ M DPPH· methanol solution was prepared immediately before use. The DPPH·
solution was adjusted with methanol to an absorbance of 0.7 (±0.02) at 515 nm in a
1 cm cuvette at 25 ºC (Lambda 25 UV, VIS spectrophotometer, Perkin Elmer
Instruments, Madrid, Spain). Fifty microliters of appropriate diluted coffee sample
(1:100 to 3:100) was added to DPPH· solution (1.95 mL). After mixing, the absorbance
was monitored at 515 nm for 18 min at 25 ºC. Calibration was performed with Trolox
solution and the total antioxidant capacity was expressed as micromoles (μmol) of
Trolox per mililiter of coffee brew or fraction.
2.8. Antioxidant capacity by Electro Spin Resonance (ESR) spectroscopy. The ESR
spectroscopy measurements were performed with Fremy´s salt and TEMPO as
stabilized radicals with the same procedure described by Roesch et al. (2003) and
modified by Caemmerer & Kroh (2006). For the investigation with Fremy’s salt,
100 μL of every coffee sample diluted 250-fold with demineralized water was allowed
to react with an equal volume of an aqueous 1 mM Fremy’s salt solution prepared in
50 mM phosphate buffer (pH 7.4). ESR spectra were recorded every 40 s for 30 min.
For the investigation with TEMPO, aliquots of 300 μL of coffee sample were allowed to
react with 100 μL of 1 mM TEMPO solution. ESR spectra were obtained after 120 min,
by which time the reaction was complete. Microwave power was set at 10 dB.
Modulation amplitude, center field, and sweep width were set at 1.5, 3397, and 71 G,
respectively. Both Fremy’s salt and TEMPO antioxidant activity were calculated as
Trolox equivalents and expressed as micromoles (μmol) of Trolox per mililiter of coffee
brew or fraction.
2.9. Chlorogenic acids (CGA) and caffeine. Extract preparation and cleanup were
carried out according to Bicchi et al. (1995). The compounds were analyzed by HPLC
following the method described by Farah et al. (2005), with some modifications. HPLC
analysis was achieved with an analytical HPLC unit model 1100 (Agilent Technologies,
Palo Alto, CA, USA) equipped with a binary pump and an automated sample injector. A
reversed-phase Hypersil-ODS (5 µm particle size, 250 x 4.6 mm) column was used at
25 ºC. The sample injection volume was 100 µL. The chromatographic separation was
performed using a gradient of methanol (solvent A) and Milli-Q water acidulated with
phosphoric acid (pH 3.0, solvent B) at a constant flow of 0.8 mL/min starting with 20%
solvent A. Then solvent A was increased to 50% within 15 min to be maintained at 50%
for 9 min and, finally, to return to initial conditions (20% solvent A) in 3 min. Detection
was accomplished with a diode-array detector, and chromatograms were recorded at
325 nm for CGA and 276 nm for Caffeine. Identification of CGA and caffeine was
performed by comparing the retention time and the photodiode array spectra with those
of their reference compounds. Quantification of 5-caffeoilquinic (5-CQA) and caffeine
was made by comparing the peak areas with those of the standards. Quantification of
the other chlorogenic acids (CGA) was performed using the area of 5-CQA standard
combined with molar extinction coefficients of the respective CGA as reported by
Trugo and Macrae (1984) and Farah et al. (2005).
2.10. Statistical analysis. Each parameter was analyzed in triplicate. Results are shown
as means ± standard deviations. Student’s t-test was applied for each antioxidant
capacity assay to know whether there were differences between both coffees in each
coffee brew. One-way analysis of variance (ANOVA) was applied for each parameter to
compare antioxidants extraction among fractions in each coffee brew sample. A T-
Tukey test was applied as a test a posteriori with a level of significance of 95%. All
statistical analyses were performed using the SPSS v.15.0 software package.
3. RESULTS AND DISCUSSION
3.1. Coffee fractions Volumes
The volumes of the coffee brews and fractions obtained by espresso and filter
coffeemakers are shown in Table 1. The volumes of the three espresso coffee fractions
were quite similar, ranging from 14 to 17 mL. In contrast, the volumes of the filter
coffee fractions increased from F1 (76-80 mL) up to F3 (160-186 mL) and then
decreased to F5 (26-54 mL), showing an inverted U-shape profile.
To extract coffee compounds during the brewing process, the dry coffee grounds must
first absorb water. Once the water has completely surrounded a coffee particle, both
inside and out, the coffee extractable material begins to move out of the bean’s cellular
structure and into the surrounding water. Because espresso coffeemaker applies constant
pressure that forces water through the coffee grounds with a constant flow, the coffee
fraction volumes were similar among each other. However, in filter coffee no
mechanical forces are applied, and the brew volume dripping out from the extraction
chamber depends on the water amount, and consequently on the water pressure in the
extraction chamber of the coffeemaker according to Darcy’s law (Petracco, 2005).
Furthermore, at the beginning of the filter extraction process, part of the water is
absorbed by coffee grounds. In an espresso coffeemaker, water is forced to go through
the coffee cake, but, in a filter coffeemaker, during wettability, 1 g of coffee will absorb
2 mL of water as a general rule (Lingle, 1996). This fact explains the low volume
obtained for F1 (0-75 s). With time, water fills the extraction chamber increasing the
pressure and favoring that water passes through the coffee bed, which leads to higher
volumes in the middle fractions. At the end of the brewing procedure, pressure
decreases when the water reservoir depletes, giving the lowest volume in the last
fraction (F5).
3.2. Antioxidant capacity of coffee fractions
The antioxidant capacity of the coffee brews and fractions obtained by espresso and
filter coffeemakers was measured by means of three colorimetric assays (Folin-
Ciocalteau, ABTS and DPPH) and two electron spin resonance (ESR) spectroscopy
techniques (Fremy´s salt and TEMPO) and the results are shown in Figure 1 to 5.
The Folin-Ciocalteau assay is based on an electron-transfer reaction. Although this is
the most popular method to evaluate the total phenolic compounds, the Folin-Ciocalteau
reagent can be reduced by many electron-donors, not only phenolic compounds (Huang,
Ou, & Prior, 2005). Two different stable radicals (ABTS·+ and DPPH·) were chosen to
assess the radical scavenging activity in coffee fractions. These radicals react
energetically with hydrogen-donors, such as phenolic compounds, being DPPH· likely
more selective in the reaction with H-donors than ABTS·+ (Huang et al., 2005). In these
three colorimetric assays, Vietnam coffee brews showed significantly (p<0.01) higher
antioxidant capacity than Guatemala ones. The results were similar to those reported by
other authors in espresso and filter coffee brews (Pérez-Martinez, Caemmerer, De Peña,
Cid, & Kroh, 2010; Sánchez González, Jiménez Escrig, & Saura Calixto, 2005).
Espresso coffee fractions from both coffees showed a remarkable decrease in
antioxidant capacity with brewing time. More than 70% of the overall antioxidant
capacity of an espresso coffee brew was found in F1 (0-8 s), whereas F3 accounted for
less than 12 %. These results demonstrate that the compounds responsible for the
antioxidant activity of an espresso coffee brew are mainly extracted at the beginning of
the brewing process and, afterwards, are diluted. Similar results were found by Alves et
al (2010) for DPPH antioxidant activity in espresso coffees with different brew lengths
(“short” to “long”). These authors also observed that the antiradical or reducing activity
of espresso coffee brew is not only dependent on total phenolic amounts measured by
Folin-Ciocalteau assay. This may be due to the fact that the Folin-Ciocalteau assay not
only evaluates phenolic compounds, but also because it is well known that roasting-
induced antioxidants like Maillard reaction products (MRP), contribute to the overall
antioxidant capacity of coffee (Delgado-Andrade, Rufián-Henares, & Morales, 2005;
Pérez-Martinez et al., 2010).
To go deeper into the influence of brewing time on antioxidant capacity due to
phenolics or MRP, Electron spin resonance (ESR) spectroscopy was applied using
Fremy’s salt and TEMPO radicals. Mainly phenolic compounds can be detected when
Fremy’s salt is used as the stabilized radical, whereas TEMPO is mainly scavenged by
Maillard reaction products (MRP), such as melanoidins (Caemmerer & Kroh, 2006).
The results obtained with ESR spectroscopy (Figure 4 and 5) showed that Fremy´s salt
scavenging capacity was almost four times higher than TEMPO. Similar results were
reported by other authors who proposed that the phenolic antioxidants evaluated by
Fremy´s salt dominate the overall antioxidant capacity of coffee brews, whereas the
contribution of roasting-induced antioxidants is rather limited (Bekedam, Schols,
Cämmerer, Kroh, van Boekel, & Smit, 2008; Pérez-Martinez et al., 2010).
The ESR antioxidant capacity of espresso coffee fractions showed that F1 (0-8 s)
accounted for 75-81 % and for 86-89 % of the Fremy´s salt and TEMPO scavenging
capacity of an espresso coffee brew, respectively. Although antioxidant capacity due to
phenolics and measured by Fremy’s salt assay was the highest in the first fraction, 20-
25 % of the scavenging capacity was still found in F2 and F3. This could be due to a
slower extraction of those phenolics retained in the inner coffee particles and those
bound to melanoidins that need more time and water pressure to be released. The
highest percentages observed for TEMPO scavenging capacity in F1 indicate that MRP
antioxidants were mainly extracted during the first 8 seconds, whereas the last fraction
(16-24 s) only accounted for 1-2 %. These results agree with the significantly highest
values of Browned compounds (Abs 420 nm) showed in the first fraction (Table 2) that
clearly decreased in the next ones (F2 and F3).
Filter coffee fractions showed different antioxidant capacity extraction behaviors, being
also different in the two coffee samples in comparison to espresso coffee. In Guatemala
filter coffee, all antioxidant capacity assays showed a U-shape profile with the highest
concentration in F1 (0-75 s) and F5 (300-375 s) and the lowest in F3 (150-225 s).
However, in Vietnam coffee the U-shape antioxidant capacity extraction started after
75 s, showing F1 the lowest values. This could be due to a higher water absorption in
Vietnam coffee that leads to a longer wetting stage. The wettability depends on the
particle shape and size that may be different depending on factors like grinding that is
also influenced by coffee origin or variety and roasting degree (Lingle, 1996). In this
work, taking into account that roasting degree and grinding conditions were controlled
to be the same, different wettability may be due to the different brittleness of the coffee
beans. The increase of antioxidant capacity in the last fractions (F4 and F5) of filter
coffee brews could be due to the water pressure decrease that induces a lower flow and
a longer contact time between water and ground coffee. In fact, because the last fraction
(F5) had the lowest volumes (26 mL and 54 mL for Guatemala and Vietnam coffees,
respectively), their contribution to the antioxidant capacity of the overall coffee brew
was rather limited (~9 % and ~14 %, respectively).
The results of the antioxidant capacity due to phenolics and MRP, measured by ESR
spectroscopy in filter coffee fractions using Fremy’s salt and TEMPO as stabilized
radicals (Figures 4 and 5), also corroborate that the antioxidants extraction seems to be
delayed in Vietnam filter coffee. This was more pronounced in TEMPO antioxidant
capacity that mainly evaluates the scavenging activity of melanoidins which are
polymeric compounds with more difficult to be released without water pressure. In fact,
the Absorbance at 420 nm of Vietnam filter F1 fraction was significantly the lowest as
shown in Table 3. Moreover, taking into account the brew volume, only ~3 % of
TEMPO antioxidant capacity of the overall Vietnam filter coffee brew was extracted
during the first 75 seconds (F1), whereas ~37 % was found in F2 (75-150 s). So that, the
contribution of the first two fractions of Vietnam filter coffee to the overall TEMPO
antioxidant capacity was similar to the ~40 % found in Guatemala filter coffee F1.
3.3. Antioxidant compounds extraction
The antioxidant capacity of coffee brew is attributed to both, natural antioxidants, like
phenolic compounds, and roasting-induced antioxidants, like melanoidins and other
MRPs. To know the influence of brewing time on the main antioxidant compounds,
browned compounds (Abs 420 nm), caffeine and caffeoylquinic acids in coffee brews
fractions were quantified and the results are shown in Table 2 and 3. Browned
compounds, as previously discussed, were mainly extracted in those coffee fractions
with high TEMPO antioxidant capacity showing a high correlation (r=0.969, p<0.001).
Also caffeine has been proposed as an antioxidant compound against lipid peroxidation
induced by reactive oxygen species (Lee, 2000). Caffeine was in significantly higher
concentration in Vietnam espresso and filter coffee brews and fractions. It is very well
known that Robusta coffees are richer in caffeine than Arabica ones (Belitz, Grosch, &
Schieberle, 2009). Thus, caffeine might partially explain the higher antioxidant capacity
of Vietnam coffee brews that could not be attributed to the main chlorogenic acids that
were found in lower amounts in these coffee brews, as will be discussed later.
Traditionally, the higher antioxidant capacity of Robusta coffee brews has been
attributed to higher total phenolic compounds (usually measured by Folin Ciocalteau
technique), and then to chlorogenic acids because 5-CQA is the most abundant phenolic
in coffee. However, other authors (López-Galilea, de Peña, & Cid, 2007; Vignoli,
Bassoli, & Benassi, 2011) also observed higher antioxidant capacity but lower 5-CQA
amounts in brews prepared with Robusta coffee or torrefacto blends. These authors
reported high correlations between antioxidant capacity of coffee brews and caffeine,
suggesting that caffeine might be a good contributor to the antioxidant capacity or
reducing power of coffee brews. In the present work, also high correlations have been
found between antioxidant capacity assays and caffeine (r values ranging from 0.906 for
Fremy’s salt assay to 0.968 for DPPH).
Chlorogenic acids (CGA) are water soluble esters formed between trans-cinnamic
acids, such as caffeic acid, and quinic acid. They may be subdivided according to the
nature, number and position of the cinnamic substituents (Clifford, 1999).
Caffeoylquinic acid (CQA) is the most abundant chlorogenic acid class accounting for
76-84% of the total CGA in green coffee (Perrone, Farah, Donangelo, de Paulis, &
Martin, 2008). Although during roasting CGA are lost up to 95%, CQA still are the
predominant CGA in roasted coffee (Trugo & Macrae, 1984). Monocaffeoylquinic acids
(3-CQA, 4-CQA, 5-CQA) and dicaffeoylquinic acids (3,4-diCQA, 3,5-diCQA, 4,5-
diCQA) were identified and quantified by HPLC-DAD in each fraction and coffee
brew, and the results are shown in Tables 4 and 5. 5-CQA was the major compound
among CQAs in all samples, followed by 4-CQA and 3-CQA. The diCQAs were in
lower concentration than CQAs. The abundance of 3,4-diCQA and 4,5-diCQA was
similar in every coffee fractions or brews, whereas 3,5-diCQA was the least abundant
isomer. These results are in agreement with those reported by other authors in roasted
coffee (Perrone et al., 2008) and in coffee brew (Alves et al., 2010). Higher amounts of
CQA in Robusta coffees than in Arabica ones have been extensively reported (Farah et
al., 2005). However, in this study less amounts of CQA were found in Vietnam coffee
than in Guatemala ones. Also Vignoli et al. (2011) observed higher amount of 5-CQA
in Arabica soluble coffee. This could be due to several factors, such as the origin of
coffee and the higher loss of chlorogenic acids in Robusta coffee during roasting
process (Clifford, 1997; Perrone, Donangelo, Donangelo, & Farah, 2010).
Fractions obtained from espresso coffeemaker showed in both coffees a steep decrease
with extraction time in all three CQA isomers (3-, 4-, and 5-CQA). F1 (0-8s) accounted
for about 70 %, F2 (8-16 s) for 17 % and F3 (16-24 s) for less than 14 % of the total
CQA amounts found in an espresso coffee brew. The CQA extraction behavior was
similar to that of the antioxidant capacity measured by colorimetric assays and Fremy´s
salt, showing high correlations (r values ranging from 0.727 for 5-CQA and DPPH to
0.903 for 4-CQA and Fremy’s salt, p<0.001), maybe because monocaffeoylquinic acids
are the most abundant phenolic compounds in coffee. In contrast, diCQAs were
extracted more slowly, accounting F1 for ~50 %, F2 for ~30 % and F3 still for ~20 %,
showing correlations coefficients lower than 0.700 (except for 3,4-diCQA with r values
ranging from 0.906 for Fremy’s salt to 0.968 for DPPH). The esterification of an
additional caffeic acid moiety in diCQA increases the number of hydroxyl groups and
might favor the retention of these compounds by interaction with melanoidins or other
polymeric compounds (Bekedam, Schols, van Boekel et al., 2008; Kroll, Rawel, &
Rohn, 2003), reducing the release of diCQA. In fact, the hydrogen bonding between
hydroxyl groups of the phenolic compounds and the amide carbonyls of the peptide
bond were found to be a common non-covalent interaction between phenolics and
melanoidins (Nunes & Coimbra, 2010). Also the weaker polarity of the diCQA
compared to the CQA might explain the slower release of these compounds during
extraction with water (Kroll et al., 2003). Blumberg et al. (2010) studied the influence
of hot water percolation on the concentration of monocaffeoylquinic acids and
chlorogenic acid lactones and reported that dicaffeoylquinic lactones were extracted
rather slowly in comparison to monocaffeoylquinic ones.
Caffeoylquinic acids extraction behavior was different in filter coffee, as can be seen in
Table 5. Different extraction profiles were also found for the two coffee samples. In
Guatemala filter coffee, CQAs and diCQAs extraction showed a U-shape profile with
the highest concentration in F1 (0-75 s) and F5 (300-375 s) and the lowest in F3 (150-
225 s), similar to that observed for antioxidant capacity according to the correlations
showed before. However, in Vietnam filter coffee the U-shape extraction of
caffeoylquinic acids started after 75 s, and F1 exhibited the significantly lowest
caffeoylquinic acids concentration. The delay in caffeoylquinic acids extraction might
be attributed to the longer wetting stage observed in Vietnam coffee, as described
above. On the other hand, the increased extraction of caffeoylquinic acids in the last
stage of the brewing process, mainly observed in F5 in both coffee samples, could be
due to the water pressure decrease that induces a lower flow and a longer contact time
between water and ground coffee. This might facilitate the hydrolysis of caffeoylquinic
acids bound to melanoidins inducing their release during advanced stages of filter coffee
brewing (Lingle, 1996). However, when the lowest volumes of these fractions are
taking into account, it could be observed that caffeoylquinic acids only accounted for
~8 % and ~11 % of the total in Guatemala and Vietnam filter coffee brews, respectively.
Unlike in espresso coffee, similar extraction percentages among CQAs and diCQAs in
each coffee fraction along the filter brewing process were observed. Moreover, when
the concentration of antioxidants is calculated per gram of coffee taking into account the
different fractions volumes, higher extraction of these phenolic compounds per gram of
coffee was obtained in filter coffee brews than in espresso ones, in agreement with
Pérez-Martinez et al. (2010). This may be due to the technological differences between
espresso and filter coffeemaker. Although the high water pressure applied in espresso
coffeemaker favors the extraction process, the short contact time between water and
coffee grounds, the high coffee/water ratio and the limited space in coffee cake does not
allow equilibrium to be reached (Petracco, 2005). In contrast, longer time and
turbulences in the extraction chamber of the filter coffeemaker allow the water in
immediate contact with the coffee to extract additional compounds when it has not
become so saturated with dissolved material. Thus, both technological factors might
favor the extraction of both CQAs and diCQAs, free and bound with melanoidins. In
fact, turbulences are considered, after time and temperature, the third most important
factor in filter coffee brewing (Lingle, 1996). Less turbulences during sequential coffee
percolation could also be the reason why Blumberg et al. (2010) found that
monocaffeoylquinic acids and monocaffeoyl and dicaffeoyl quinides extraction
behaviors were more similar to those of our espresso coffee fractions than filter ones,
i.e. higher extraction in the first fractions and slower release of dicaffeoyl quinides.
In conclusion, brewing time plays a key role in antioxidants extraction of coffee. To
optimize their extraction in order to obtain antioxidants that can be used as ingredients
for functional foods, several technological factors should be taken into account. Thus,
higher water pressure increases antioxidants extraction speed like in the first fraction of
espresso coffee. Nevertheless, parameters like turbulence and longer contact time,
typically of a filter coffeemaker, should be considered in order to increase extraction
efficiency, mainly in less polar antioxidant compounds as diCQA. Moreover, extraction
conditions should also be adjusted for each coffee because cellular structure of coffee
beans may also influence. Further research in the influence of technological parameters
on chemical composition of coffee brew fractions, as well as their sensory properties,
should be needed before to industrial development.
ACKNOWLEDGEMENTS
This research was funded by the Spanish Ministry of Science and Innovation
(AGL2009-12052). We thank the Spanish Ministry of Education (PR2009-0324) and
the Government of Navarra (Dpt. Education and Dpt. Industry) for the grants given to
M.P.P., I.A.L., and L.S.A and the Unión Tostadora for providing the coffee samples.
This study was partially presented at the First International Congress on Cocoa, Coffee
and Tea, September 2011, Novara (Italy), and at the 5th International Conference on
Polyphenols and Health, October 2011, Sitges (Spain).
REFERENCES
Alves (2007). Factors Influencing the Norharman and Harman Contents in Espresso Coffee. Journal of Agricultural and Food Chemistry, 55(5), 1832-1838.
Alves, R. C., Costa, A. S. G., Jerez, M., Casal, S., Sineiro, J., Nunez, M. J., & Oliveira, B. (2010). Antiradical Activity, Phenolics Profile, and Hydroxymethylfurfural in Espresso Coffee: Influence of Technological Factors. Journal of Agricultural and Food Chemistry, 58(23), 12221-12229.
Aruoma, O. (1999). Antioxidant actions of plant foods: Use of oxidative DNA damage as a tool for studying antioxidant efficacy. FreeRadicalRresearch, 30(6), 419-427.
Beal, M. (1995). Aging, energy, and oxidative stress in neurodegenerative diseases. Annals of Neurology, 38(3), 357-366.
Bekedam, E. K., Schols, H. A., Cämmerer, B., Kroh, L. W., van Boekel, M. A. J. S., & Smit, G. (2008). Electron Spin Resonance (ESR) Studies on the Formation of Roasting-Induced Antioxidative Structures in Coffee Brews at Different Degrees of Roast. Journal of Agricultural and Food Chemistry, 56(12), 4597-4604.
Bekedam, E. K., Schols, H. A., van Boekel, M. A. J. S., & Smit, G. (2008). Incorporation of Chlorogenic Acids in Coffee Brew Melanoidins. Journal of Agricultural and Food Chemistry, 56(6), 2055-2063.
Belitz, H. -., Grosch, W., & Schieberle, P. (2009). Coffee, Tea, Cocoa. In H. Belitz, W. Grosch & P. Schieberle (Eds.), Food Chemistry, (4 th ed.). Berlin: Springer-Verlag.
Bicchi, C. P., Pinello, A. E., Pellegrino, G. M., & Vanni, A. C. (1995). Characterization of Green and Roasted Coffees through the Chlorogenic Acid Fraction by HPLC-UV and Principal Component Analysis. Journal of Agricultural and Food Chemistry, 43(6), 1549-1555.
Blumberg, S., Frank, O., & Hofmann, T. (2010). Quantitative Studies on the Influence of the Bean Roasting Parameters and Hot Water Percolation on the Concentrations of Bitter Compounds in Coffee Brew. Journal of Agricultural and Food Chemistry, 58(6), 3720-3728.
Borrelli, R. C., & Fogliano, V. (2005). Bread crust melanoldins as potential prebiotic ingredients. Molecular Nutrition & Food Research, 49(7), 673-678.
Borrelli, R. C., Visconti, A., Mennella, C., Anese, M., & Fogliano, V. (2002). Chemical characterization and antioxidant properties of coffee melanoidins. Journal of Agricultural and Food Chemistry, 50(22), 6527-6533.
Brand-Williams, W., Cuvelier, M. E., & Berset, C. (1995). Use of a free radical method to evaluate antioxidant activity. LWT - Food Science and Technology, 28(1), 25-30.
Caemmerer, B., & Kroh, L. W. (2006). Antioxidant activity of coffee brews. European Food Research and Technology, 223(4), 469-474.
Clifford, M. (1999). Chlorogenic acids and other cinnamates - nature, occurrence and dietary burden. Journal of the Science of Food and Agriculture, 79(3), 362-372.
Clifford, M. (1997). The nature of chlorogenic acids: Are they advantageous compounds in coffee? In: Proceedings 17th International Scientific Colloquium on Coffee, Nairobi, Kenia, 79-91.
Crozier, A., Jaganath, I., & Clifford, M. (2009). Dietary phenolics: chemistry, bioavailability and effects on health. Natural Product Reports, 26(8), 1001-1043.
del Castillo, M. D., Ames, J. M., & Gordon, M. H. (2002). Effect of Roasting on the Antioxidant Activity of Coffee Brews. Journal of Agricultural and Food Chemistry, 50(13), 3698-3703.
Delgado-Andrade, C., Rufian-Henares, J. A., & Morales, F. J. (2005). Assessing the antioxidant activity of melanoidins from coffee brews by different antioxidant methods. Journal of Agricultural and Food Chemistry, 53(20), 7832-7836.
Delgado-Andrade, C., & Morales, F. J. (2005). Unraveling the Contribution of Melanoidins to the Antioxidant Activity of Coffee Brews. Journal of Agricultural and Food Chemistry, 53(5), 1403-1407.
Devasagayam, T., Kamat, J., Mohan, H., & Kesavan, P. (1996). Caffeine as an antioxidant: Inhibition of lipid peroxidation induced by reactive oxygen species. Biochimica et Biophysica acta.Biomembranes, 1282(1), 63-70.
Dorea, J., & da Costa, T. (2005). Is coffee a functional food? British Journal of Nutrition, 93(06), 773-782.
Farah, A., De Paulis, T., Trugo, L. C., & Martin, P. R. (2005). Effect of Roasting on the Formation of Chlorogenic Acid Lactones in Coffee. Journal of Agricultural and Food Chemistry, 53(5), 1505-1513.
Huang, D. J., Ou, B. X., & Prior, R. L. (2005). The Chemistry behind Antioxidant Capacity Assays. Journal of Agricultural and Food Chemistry, 53(6), 1841-1856.
Kroll, N., Rawel, H., & Rohn, S. (2003). Reactions of plant phenolics with food proteins and enzymes under special consideration of covalent bonds. Food Science and Technology Research, 9(3), 205-218.
Lee, C. (2000). Antioxidant ability of caffeine and its metabolites based on the study of oxygen radical absorbing capacity and inhibition of LDL peroxidation. Clinica Chimica Acta, 295(1-2), 141-154.
Lingle, T. R. (1996). The Coffee Brewing Handbook. Long Beach, California: Spelcialty Coffee Association.
López-Galilea, I., Andueza, S., Leonardo, I. d., de Peña, M. P., & Cid, C. (2006). Influence of torrefacto roast on antioxidant and pro-oxidant activity of coffee. Food Chemistry, 94(1), 75-80.
López-Galilea, I., de Peña, M. P., & Cid, C. (2007). Correlation of Selected Constituents with the Total Antioxidant Capacity of Coffee Beverages: Influence of the Brewing Procedure. Journal of Agricultural and Food Chemistry, 55(15), 6110-6117.
Moreira, D. P., Monteiro, M. C., Ribeiro-Alves, M., Donangelo, C. M., & Trugo, L. C. (2005). Contribution of Chlorogenic Acids to the Iron-Reducing Activity of Coffee Beverages. Journal of Agricultural and Food Chemistry, 53(5), 1399-1402.
Natella, F., Nardini, M., Giannetti, I., Dattilo, C., & Scaccini, C. (2002). Coffee drinking influences plasma antioxidant capacity in humans. Journal of Agricultural and Food Chemistry, 50(21), 6211-6216.
Nunes, F., & Coimbra, M. (2010). Role of hydroxycinnamates in coffee melanoidin formation. Phytochemistry reviews, 9(1, Sp. Iss. SI), 171-185.
Perez-Martinez, M., Caemmerer, B., De Pena, M. P., Cid, C., & Kroh, L. W. (2010). Influence of Brewing Method and Acidity Regulators on the Antioxidant Capacity of Coffee Brews. Journal of Agricultural and Food Chemistry, 58(5), 2958-2965.
Perrone, D., Donangelo, R., Donangelo, C., & Farah, A. (2010). Modeling Weight Loss and Chlorogenic Acids Content in Coffee during Roasting. Journal of Agricultural and Food Chemistry, 58(23), 12238-12243.
Perrone, D., Farah, A., Donangelo, C. M., de Paulis, T., & Martin, P. R. (2008). Comprehensive analysis of major and minor chlorogenic acids and lactones in economically relevant Brazilian coffee cultivars. Food Chemistry, 106(2), 859-867.
Peters, A. (1991). Brewing makes the difference. In: Proceedings of the 14th ASIC Colloquium, San Francisco, USA, pp. 97-106.
Petracco, M. (2005). Percolation. In A. Illy & R. Viani (Eds.), Espresso Coffee: The Chemistry of Quality, (2 nd ed.) London: Elsevier Academic Press.
Petracco, M. (2001). Technology IV: Beverage Preparation: Brewing Trends for the New Millenium. In R. J. Clark & O. G. Vitzthum (Eds.), Coffee: Recent Developments. Oxford, U.K.: Blackwell Science.
Pulido, R., Hernandez Garcia, M., & Saura Calixto, F. (2003). Contribution of beverages to the intake of lipophilic and hydrophilic antioxidants in the Spanish diet. European Journal of Clinical Nutrition, 57(10), 1275-1282.
Re, R., Pellegrini, N., Proteggente, A., Pannala, A., Yang, M., & Rice-Evans, C. (1999). Antioxidant activity applying an improved ABTS radical cation decolorization assay. Free Radical Biology and Medicine, 26(9-10), 1231-1237.
Roesch, D., Bergmann, M., Knorr, D., & Kroh, L. W. (2003). Structure-Antioxidant Efficiency Relationships of Phenolic Compounds and Their Contribution to the Antioxidant Activity of Sea Buckthorn Juice. Journal of Agricultural and Food Chemistry, 51(15), 4233-4239.
Rufian-Henares, J. A., & de la Cueva, S. P. (2009). Antimicrobial Activity of Coffee Melanoidins-A Study of Their Metal-Chelating Properties. Journal of Agricultural and Food Chemistry, 57(2), 432-438.
Rufián-Henares, J. A., & Morales, F. J. (2007). Effect of in vitro enzymatic digestion on antioxidant activity of coffee melanoidins and fractions. Journal of Agricultural and Food Chemistry, 55(24), 10016-10021.
Sanchez Gonzalez, I., Jimenez Escrig, A., & Saura Calixto, F. (2005). In vitro antioxidant activity of coffees brewed using different procedures (Italian, espresso and filter). Food Chemistry, 90(1-2), 133-139.
Singleton, V., & Rossi, J. (1965). Colorimetry of total phenolics with phosphomolybdic-phosphotungstic acid reagents. American Journal of Enology and Viticulture, 16(3), 144-158.
Svilaas, A., Sakhi, A., Andersen, L., Svilaas, T., Strom, E., & Jacobs, D. (2004). Intakes of antioxidants in coffee, wine, and vegetables are correlated with plasma carotenoids in humans. The Journal of Nutrition, 134(3), 562-567.
Trugo, L. C., & Macrae, R. (1984). A study of the effect of roasting on the chlorogenic acid composition of coffee using HPLC. Food Chemistry, 15(3), 219-227.
Variyar, P., Ahmad, R., Bhat, R., Niyas, Z., & Sharma, A. (2003). Flavoring components of raw monsooned arabica coffee and their changes during radiation processing. Journal of Agricultural and Food Chemistry, 51(27), 7945-7950.
Vignoli, J. A., Bassoli, D. G., & Benassi, M. T. (2011). Antioxidant activity, polyphenols, caffeine and melanoidins in soluble coffee: The influence of processing conditions and raw material. Food Chemistry, 124(3), 863-868.
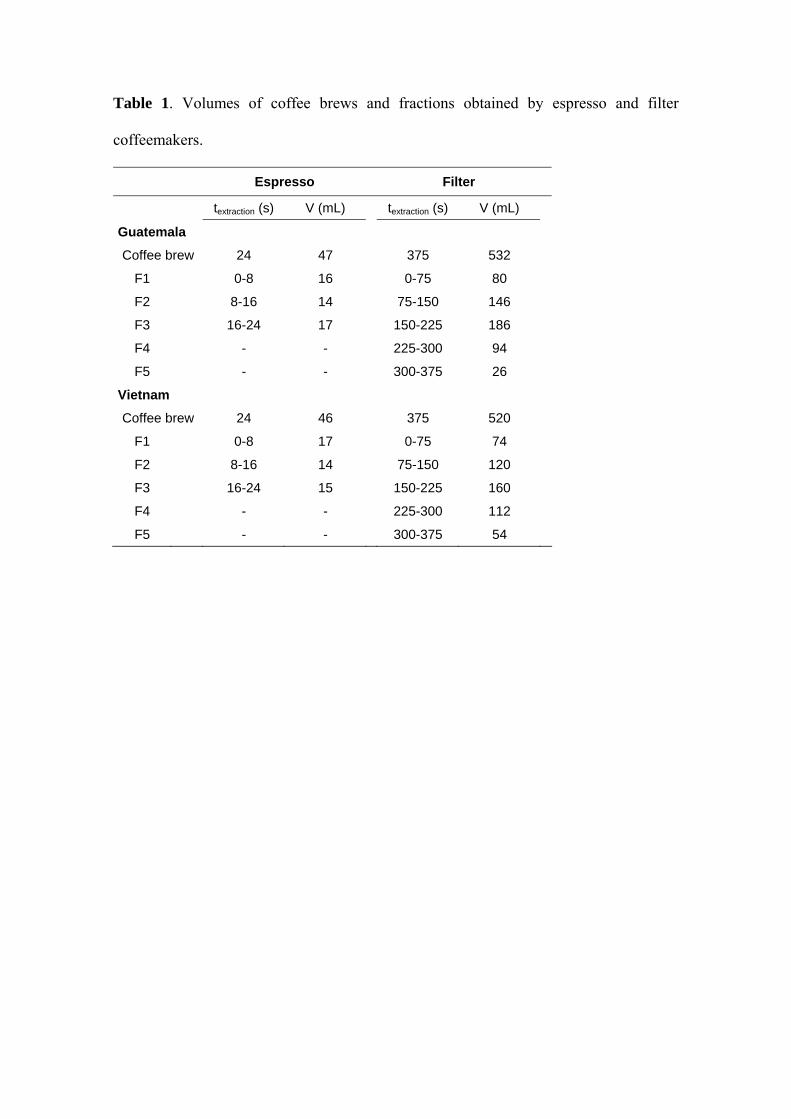
Table 1. Volumes of coffee brews and fractions obtained by espresso and filter
coffeemakers.
Espresso Filter
textraction (s) V (mL) textraction (s) V (mL)
Guatemala
Coffee brew 24 47 375 532
F1 0-8 16 0-75 80
F2 8-16 14 75-150 146
F3 16-24 17 150-225 186
F4 - - 225-300 94
F5 - - 300-375 26
Vietnam
Coffee brew 24 46 375 520
F1 0-8 17 0-75 74
F2 8-16 14 75-150 120
F3 16-24 15 150-225 160
F4 - - 225-300 112
F5 - - 300-375 54
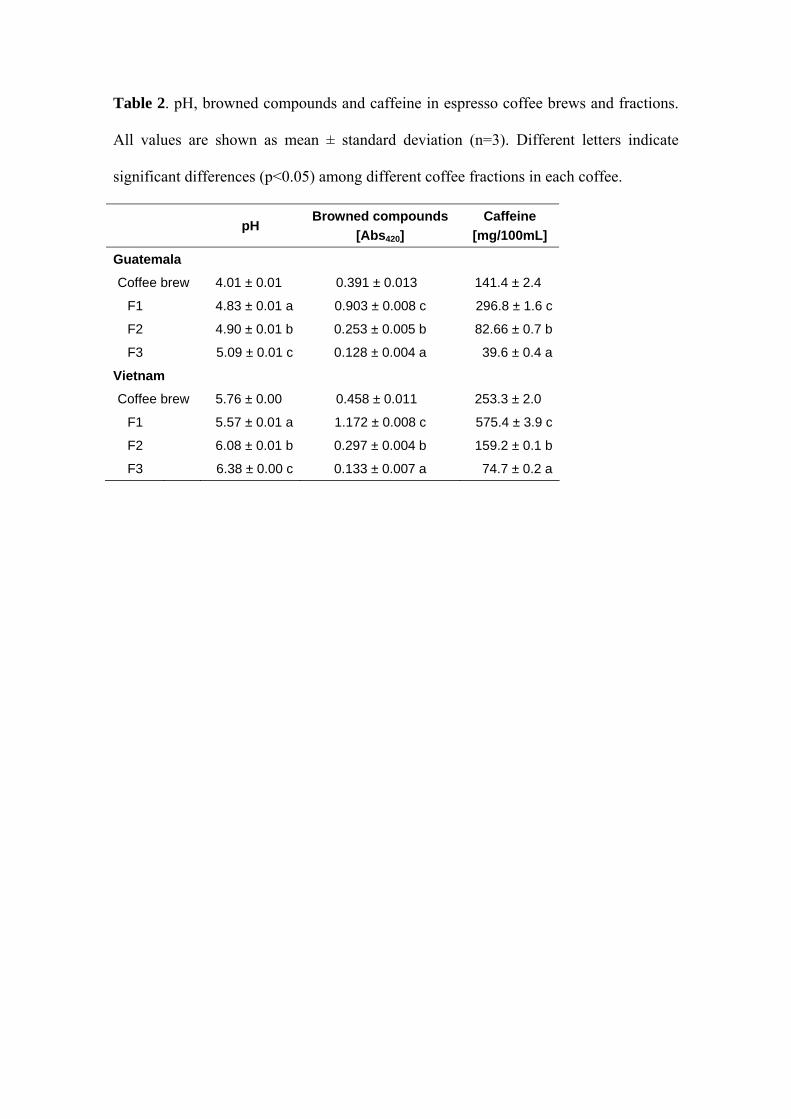
Table 2. pH, browned compounds and caffeine in espresso coffee brews and fractions.
All values are shown as mean ± standard deviation (n=3). Different letters indicate
significant differences (p<0.05) among different coffee fractions in each coffee.
pH
Browned compounds [Abs420]
Caffeine [mg/100mL]
Guatemala
Coffee brew 4.01 ± 0.01 0.391 ± 0.013 141.4 ± 2.4
F1 4.83 ± 0.01 a 0.903 ± 0.008 c 296.8 ± 1.6 c
F2 4.90 ± 0.01 b 0.253 ± 0.005 b 82.66 ± 0.7 b
F3 5.09 ± 0.01 c 0.128 ± 0.004 a 39.6 ± 0.4 a
Vietnam
Coffee brew 5.76 ± 0.00 0.458 ± 0.011 253.3 ± 2.0
F1 5.57 ± 0.01 a 1.172 ± 0.008 c 575.4 ± 3.9 c
F2 6.08 ± 0.01 b 0.297 ± 0.004 b 159.2 ± 0.1 b
F3 6.38 ± 0.00 c 0.133 ± 0.007 a 74.7 ± 0.2 a
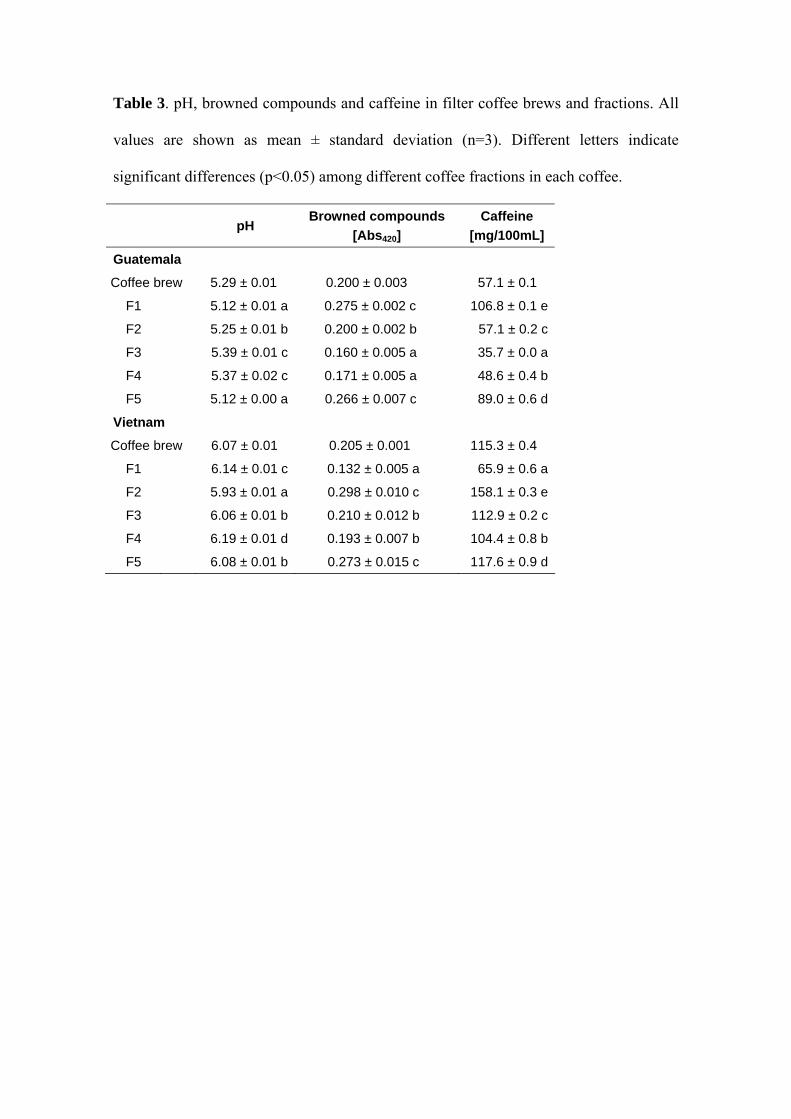
Table 3. pH, browned compounds and caffeine in filter coffee brews and fractions. All
values are shown as mean ± standard deviation (n=3). Different letters indicate
significant differences (p<0.05) among different coffee fractions in each coffee.
pH
Browned compounds [Abs420]
Caffeine [mg/100mL]
Guatemala
Coffee brew 5.29 ± 0.01 0.200 ± 0.003 57.1 ± 0.1
F1 5.12 ± 0.01 a 0.275 ± 0.002 c 106.8 ± 0.1 e
F2 5.25 ± 0.01 b 0.200 ± 0.002 b 57.1 ± 0.2 c
F3 5.39 ± 0.01 c 0.160 ± 0.005 a 35.7 ± 0.0 a
F4 5.37 ± 0.02 c 0.171 ± 0.005 a 48.6 ± 0.4 b
F5 5.12 ± 0.00 a 0.266 ± 0.007 c 89.0 ± 0.6 d
Vietnam
Coffee brew 6.07 ± 0.01 x 0.205 ± 0.001 115.3 ± 0.4
F1 6.14 ± 0.01 c 0.132 ± 0.005 a 65.9 ± 0.6 a
F2 5.93 ± 0.01 a 0.298 ± 0.010 c 158.1 ± 0.3 e
F3 6.06 ± 0.01 b 0.210 ± 0.012 b 112.9 ± 0.2 c
F4 6.19 ± 0.01 d 0.193 ± 0.007 b 104.4 ± 0.8 b
F5 6.08 ± 0.01 b 0.273 ± 0.015 c 117.6 ± 0.9 d
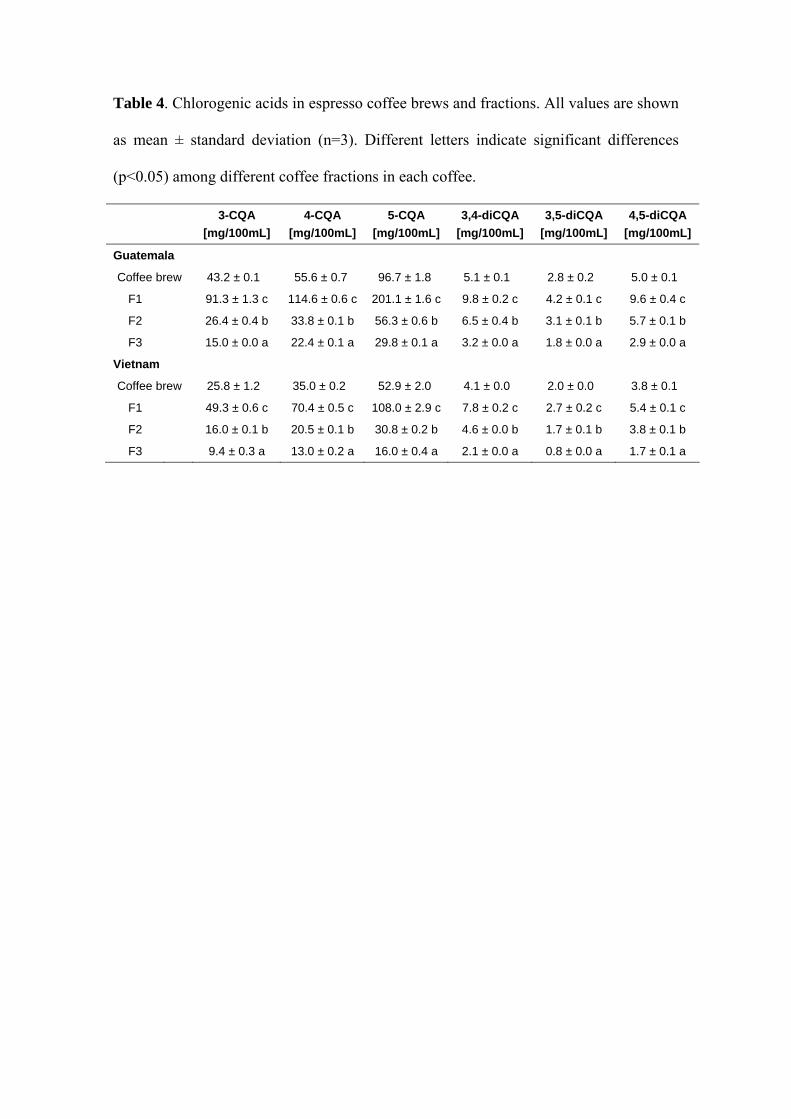
Table 4. Chlorogenic acids in espresso coffee brews and fractions. All values are shown
as mean ± standard deviation (n=3). Different letters indicate significant differences
(p<0.05) among different coffee fractions in each coffee.
3-CQA
[mg/100mL] 4-CQA
[mg/100mL] 5-CQA
[mg/100mL] 3,4-diCQA
[mg/100mL] 3,5-diCQA
[mg/100mL] 4,5-diCQA
[mg/100mL]
Guatemala
Coffee brew 43.2 ± 0.1 55.6 ± 0.7 96.7 ± 1.8 5.1 ± 0.1 2.8 ± 0.2 5.0 ± 0.1
F1 91.3 ± 1.3 c 114.6 ± 0.6 c 201.1 ± 1.6 c 9.8 ± 0.2 c 4.2 ± 0.1 c 9.6 ± 0.4 c
F2 26.4 ± 0.4 b 33.8 ± 0.1 b 56.3 ± 0.6 b 6.5 ± 0.4 b 3.1 ± 0.1 b 5.7 ± 0.1 b
F3 15.0 ± 0.0 a 22.4 ± 0.1 a 29.8 ± 0.1 a 3.2 ± 0.0 a 1.8 ± 0.0 a 2.9 ± 0.0 a
Vietnam
Coffee brew 25.8 ± 1.2 35.0 ± 0.2 52.9 ± 2.0 4.1 ± 0.0 2.0 ± 0.0 3.8 ± 0.1
F1 49.3 ± 0.6 c 70.4 ± 0.5 c 108.0 ± 2.9 c 7.8 ± 0.2 c 2.7 ± 0.2 c 5.4 ± 0.1 c
F2 16.0 ± 0.1 b 20.5 ± 0.1 b 30.8 ± 0.2 b 4.6 ± 0.0 b 1.7 ± 0.1 b 3.8 ± 0.1 b
F3 9.4 ± 0.3 a 13.0 ± 0.2 a 16.0 ± 0.4 a 2.1 ± 0.0 a 0.8 ± 0.0 a 1.7 ± 0.1 a
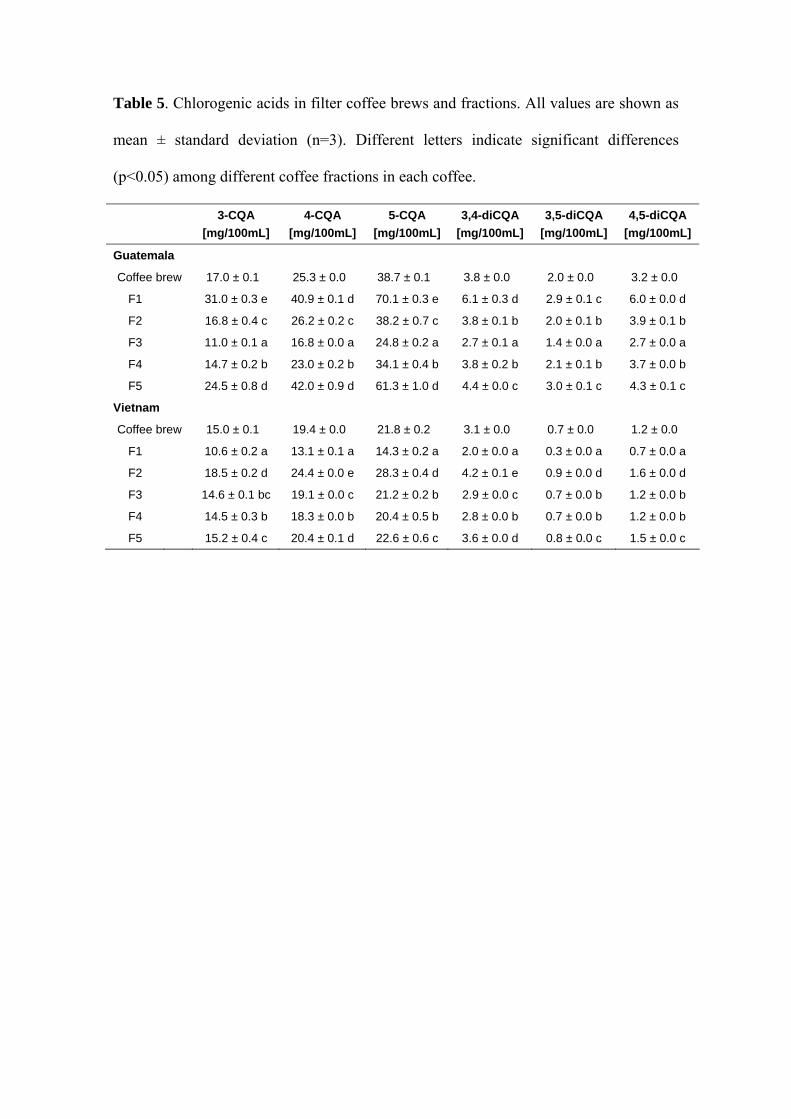
Table 5. Chlorogenic acids in filter coffee brews and fractions. All values are shown as
mean ± standard deviation (n=3). Different letters indicate significant differences
(p<0.05) among different coffee fractions in each coffee.
3-CQA
[mg/100mL] 4-CQA
[mg/100mL] 5-CQA
[mg/100mL] 3,4-diCQA
[mg/100mL] 3,5-diCQA
[mg/100mL] 4,5-diCQA
[mg/100mL]
Guatemala
Coffee brew 17.0 ± 0.1 25.3 ± 0.0 38.7 ± 0.1 3.8 ± 0.0 2.0 ± 0.0 3.2 ± 0.0
F1 31.0 ± 0.3 e 40.9 ± 0.1 d 70.1 ± 0.3 e 6.1 ± 0.3 d 2.9 ± 0.1 c 6.0 ± 0.0 d
F2 16.8 ± 0.4 c 26.2 ± 0.2 c 38.2 ± 0.7 c 3.8 ± 0.1 b 2.0 ± 0.1 b 3.9 ± 0.1 b
F3 11.0 ± 0.1 a 16.8 ± 0.0 a 24.8 ± 0.2 a 2.7 ± 0.1 a 1.4 ± 0.0 a 2.7 ± 0.0 a
F4 14.7 ± 0.2 b 23.0 ± 0.2 b 34.1 ± 0.4 b 3.8 ± 0.2 b 2.1 ± 0.1 b 3.7 ± 0.0 b
F5 24.5 ± 0.8 d 42.0 ± 0.9 d 61.3 ± 1.0 d 4.4 ± 0.0 c 3.0 ± 0.1 c 4.3 ± 0.1 c
Vietnam
Coffee brew 15.0 ± 0.1 19.4 ± 0.0 21.8 ± 0.2 3.1 ± 0.0 0.7 ± 0.0 1.2 ± 0.0
F1 10.6 ± 0.2 a 13.1 ± 0.1 a 14.3 ± 0.2 a 2.0 ± 0.0 a 0.3 ± 0.0 a 0.7 ± 0.0 a
F2 18.5 ± 0.2 d 24.4 ± 0.0 e 28.3 ± 0.4 d 4.2 ± 0.1 e 0.9 ± 0.0 d 1.6 ± 0.0 d
F3 14.6 ± 0.1 bc 19.1 ± 0.0 c 21.2 ± 0.2 b 2.9 ± 0.0 c 0.7 ± 0.0 b 1.2 ± 0.0 b
F4 14.5 ± 0.3 b 18.3 ± 0.0 b 20.4 ± 0.5 b 2.8 ± 0.0 b 0.7 ± 0.0 b 1.2 ± 0.0 b
F5 15.2 ± 0.4 c 20.4 ± 0.1 d 22.6 ± 0.6 c 3.6 ± 0.0 d 0.8 ± 0.0 c 1.5 ± 0.0 c
FIGURE CAPTIONS
Figure 1. Antioxidant capacity (Folin-Ciocalteau method) of coffee brews and fractions
obtained by espresso (a) and filter coffeemaker (b). All values are shown as mean ±
standard deviation (n=3). ** indicates highly significant differences (p<0.01) between
coffee brews. Different letters indicate significant differences (p<0.05) among coffee
fractions in each coffee.
Figure 2. Antioxidant capacity (ABTS method) of coffee brews and fractions obtained
by espresso (a) and filter coffeemaker (b). All values are shown as mean ± standard
deviation (n=3). ** indicates highly significant differences (p<0.01) between coffee
brews. Different letters indicate significant differences (p<0.05) among coffee fractions
in each coffee.
Figure 3. Antioxidant capacity (DPPH method) of coffee brews and fractions obtained
by espresso (a) and filter coffeemaker (b). All values are shown as mean ± standard
deviation (n=3). ** indicates highly significant differences (p<0.01) between coffee
brews. Different letters indicate significant differences (p<0.05) among coffee fractions
in each coffee.
Figure 4. Antioxidant capacity (Fremy’s Salt method) of coffee brews and fractions
obtained by espresso (a) and filter coffeemaker (b). All values are shown as mean ±
standard deviation (n=3). ** indicates highly significant differences (p<0.01) and ns
nonsignificant differences (p>0.05) between coffee brews. Different letters indicate
significant differences (p<0.05) among coffee fractions in each coffee.
Figure 5. Antioxidant capacity (TEMPO method) of coffee brews and fractions
obtained by espresso (a) and filter coffeemaker (b). All values are shown as mean ±
standard deviation (n=3). ** indicates highly significant differences (p<0.01) and ns

nonsignificant differences (p>0.05) between coffee brews. Different letters indicate
significant differences (p<0.05) among coffee fractions in each coffee.
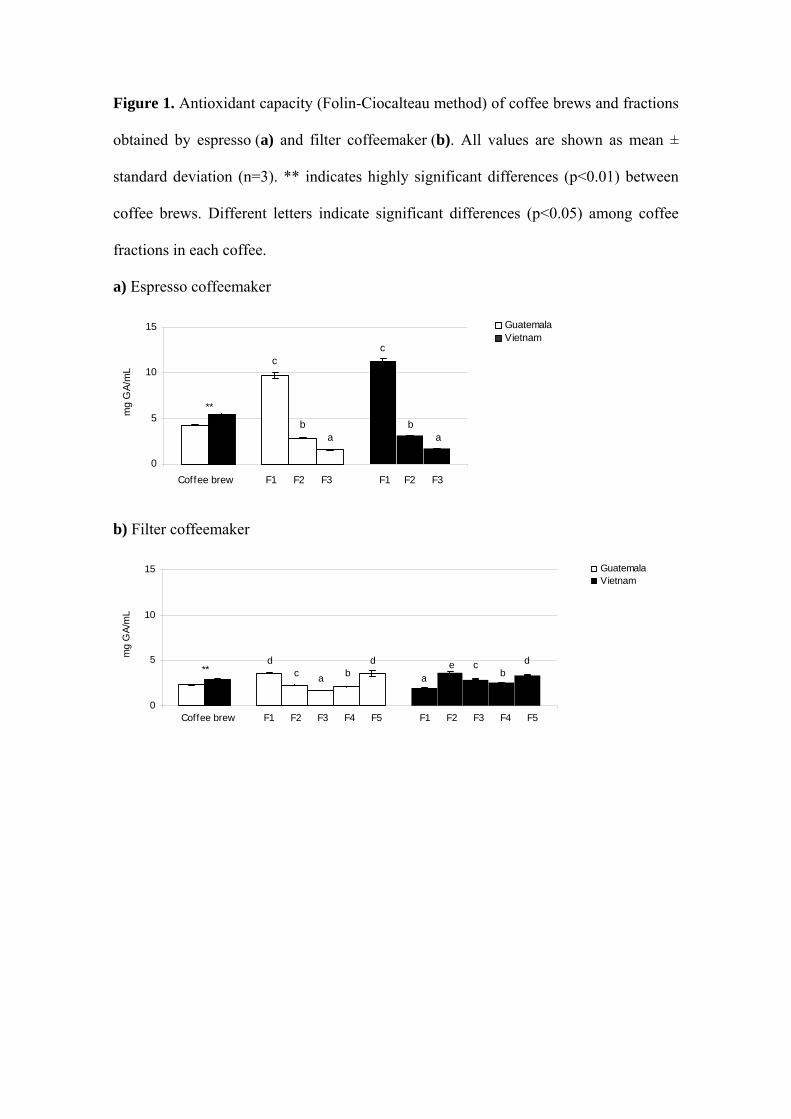
Figure 1. Antioxidant capacity (Folin-Ciocalteau method) of coffee brews and fractions
obtained by espresso (a) and filter coffeemaker (b). All values are shown as mean ±
standard deviation (n=3). ** indicates highly significant differences (p<0.01) between
coffee brews. Different letters indicate significant differences (p<0.05) among coffee
fractions in each coffee.
a) Espresso coffeemaker
0
5
10
15
mg
GA/
mL
GuatemalaVietnam
Coffee brew F1 F2 F3 F1 F2 F3
ab
c
ab
c
**
b) Filter coffeemaker
0
5
10
15
mg
GA/
mL
GuatemalaVietnam
bce
a
dbac
d d
Coffee brew F1 F2 F3 F4 F5 F1 F2 F3 F4 F5
**
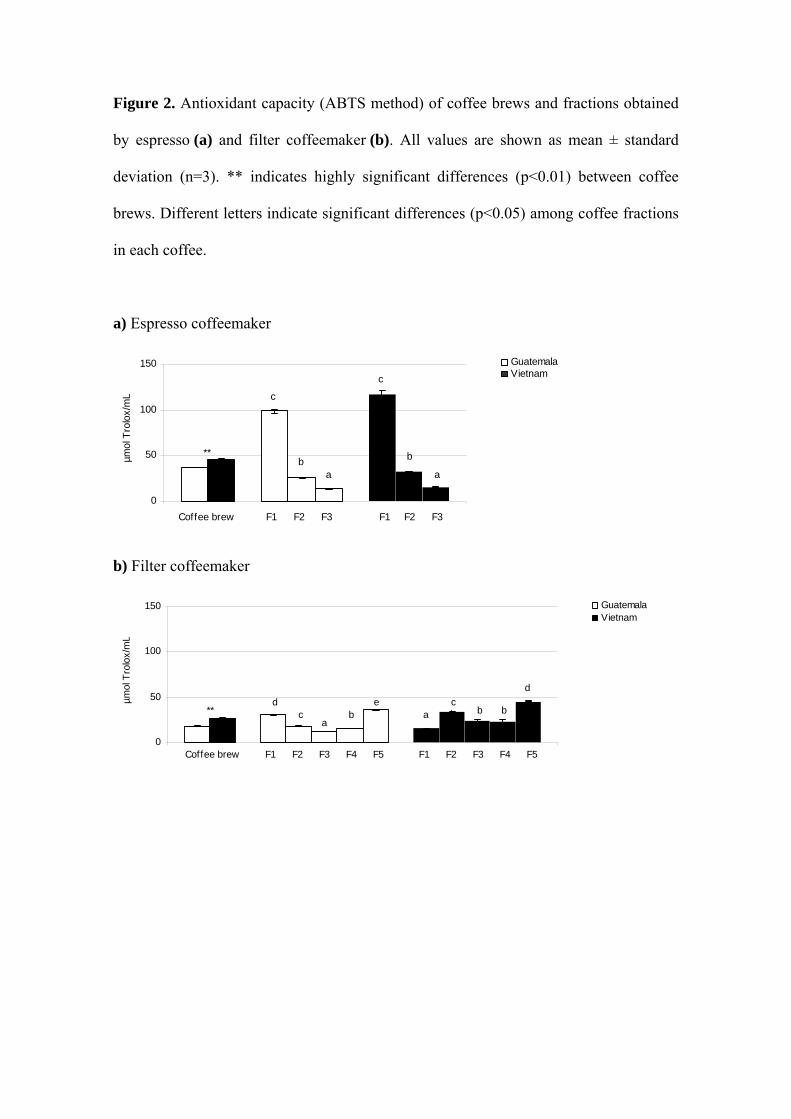
Figure 2. Antioxidant capacity (ABTS method) of coffee brews and fractions obtained
by espresso (a) and filter coffeemaker (b). All values are shown as mean ± standard
deviation (n=3). ** indicates highly significant differences (p<0.01) between coffee
brews. Different letters indicate significant differences (p<0.05) among coffee fractions
in each coffee.
a) Espresso coffeemaker
0
50
100
150
µmol
Tro
lox/
mL
GuatemalaVietnam
a
b
c
ab
c
**
Coffee brew F1 F2 F3 F1 F2 F3
b) Filter coffeemaker
0
50
100
150
µmol
Tro
lox/
mL
GuatemalaVietnam
bbc
ae
ba
cd
d
Coffee brew F1 F2 F3 F4 F5 F1 F2 F3 F4 F5
**
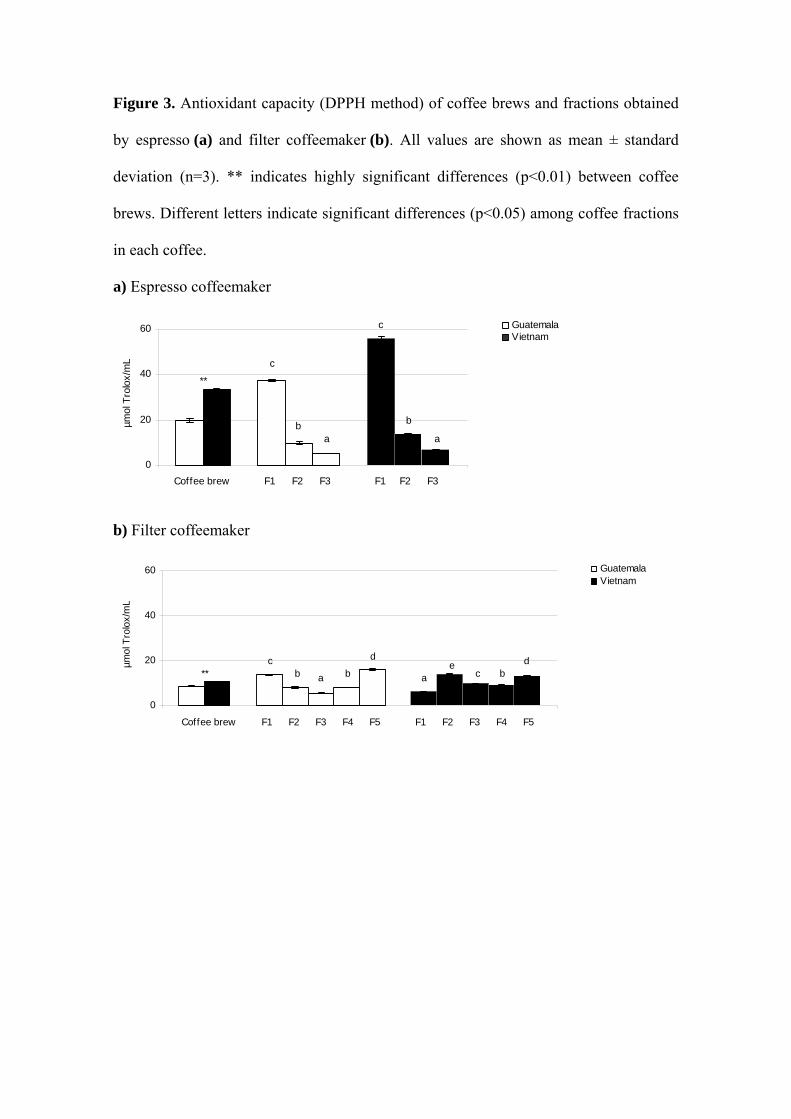
Figure 3. Antioxidant capacity (DPPH method) of coffee brews and fractions obtained
by espresso (a) and filter coffeemaker (b). All values are shown as mean ± standard
deviation (n=3). ** indicates highly significant differences (p<0.01) between coffee
brews. Different letters indicate significant differences (p<0.05) among coffee fractions
in each coffee.
a) Espresso coffeemaker
0
20
40
60
µmol
Tro
lox/
mL
GuatemalaVietnam
a
b
c
ab
c
**
Coffee brew F1 F2 F3 F1 F2 F3
b) Filter coffeemaker
0
20
40
60
µmol
Tro
lox/
mL
GuatemalaVietnam
dbc
ea
d
babc
Coffee brew F1 F2 F3 F4 F5 F1 F2 F3 F4 F5
**
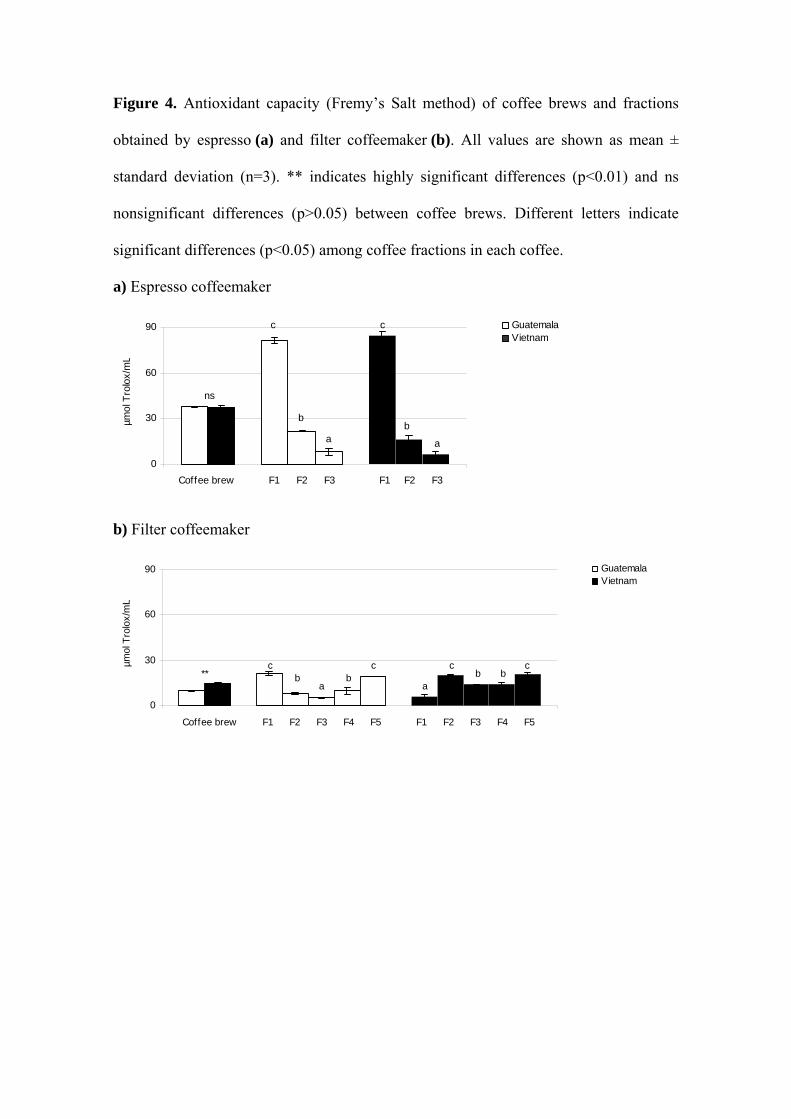
Figure 4. Antioxidant capacity (Fremy’s Salt method) of coffee brews and fractions
obtained by espresso (a) and filter coffeemaker (b). All values are shown as mean ±
standard deviation (n=3). ** indicates highly significant differences (p<0.01) and ns
nonsignificant differences (p>0.05) between coffee brews. Different letters indicate
significant differences (p<0.05) among coffee fractions in each coffee.
a) Espresso coffeemaker
0
30
60
90
µmol
Tro
lox/
mL
GuatemalaVietnam
a
ba
b
cc
ns
Coffee brew F1 F2 F3 F1 F2 F3
b) Filter coffeemaker
0
30
60
90
µmol
Tro
lox/
mL
GuatemalaVietnam
cbb
c
a
cb
ab
c
Coffee brew F1 F2 F3 F4 F5 F1 F2 F3 F4 F5
**
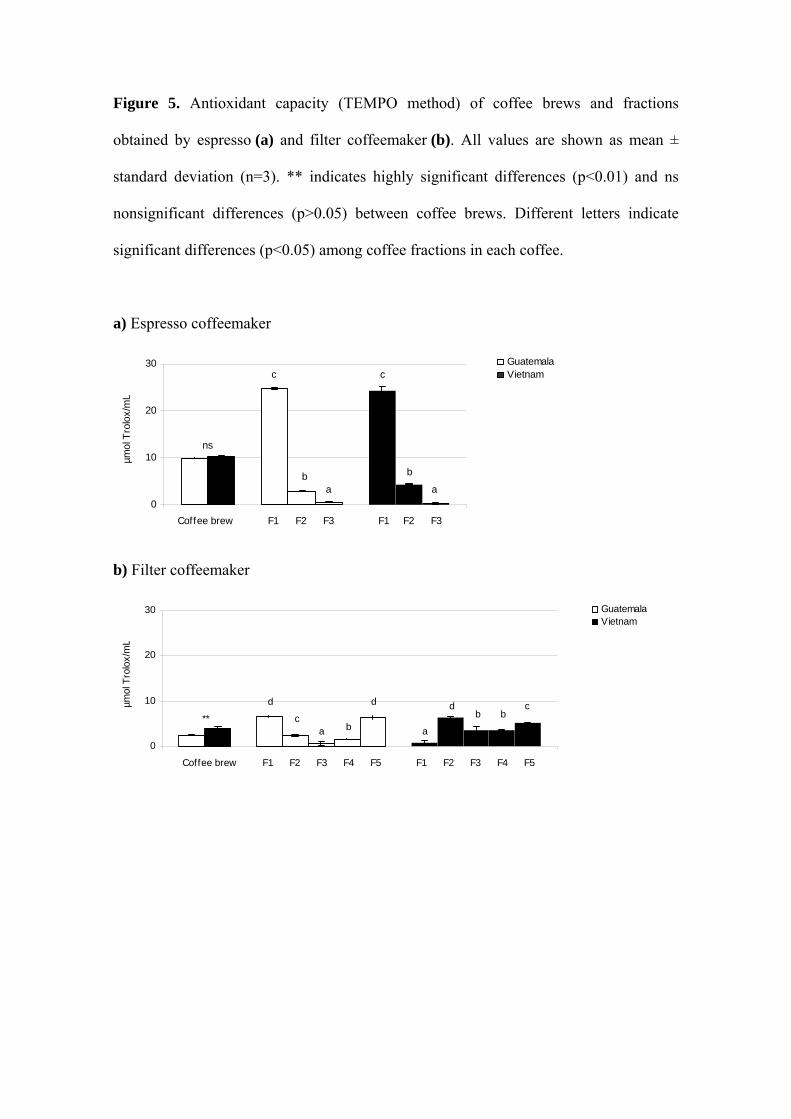
Figure 5. Antioxidant capacity (TEMPO method) of coffee brews and fractions
obtained by espresso (a) and filter coffeemaker (b). All values are shown as mean ±
standard deviation (n=3). ** indicates highly significant differences (p<0.01) and ns
nonsignificant differences (p>0.05) between coffee brews. Different letters indicate
significant differences (p<0.05) among coffee fractions in each coffee.
a) Espresso coffeemaker
0
10
20
30
µmol
Tro
lox/
mL
GuatemalaVietnam
a
b
c
ab
c
ns
Coffee brew F1 F2 F3 F1 F2 F3
b) Filter coffeemaker
0
10
20
30
µmol
Tro
lox/
mL
GuatemalaVietnam
cbb
d
a
d
bac
d
Coffee brew F1 F2 F3 F4 F5 F1 F2 F3 F4 F5
**
Results
47
Objective 3
Evaluation of the contribution of volatile Maillard reaction products generated during
roasting, to the antioxidant capacity of coffee.
Evaluación de la contribución de los compuestos vol átiles, resultantes de la reacción de
Maillard y generados durante el tueste, sobre la ca pacidad antioxidante de café.
Paper 3:
Modelling the contribution of volatile compounds to the antioxidant capacity of coffee
Iziar A. Ludwig, Lidia Sánchez, M. Paz De Peña*, Concepción Cid
Journal of Agricultural and Food Chemistry (submitted)
Impact factor (JCR, 2011): 2.823
Journal Rank in categories:
• Agriculture, Multidisciplinary: 3/57 (Q1)
• Chemistry, applied: 12/71 (Q1)
• Food Science and Technology: 11/128 (Q1)

Results
49
TITLE: Modelling the contribution of volatile compo unds to the antioxidant capacity of
coffee
AUTHORS: Iziar A. Ludwig, Lidia Sánchez, M. Paz De Peña*, Concepción Cid
Department of Nutrition, Food Science and Physiology, School of Pharmacy, University of
Navarra, E-31080-Pamplona, Spain
*Corresponding author:
M. Paz De Peña
Department of Nutrition, Food Science and Physiology
School of Pharmacy, University of Navarra
C/ Irunlarrea 1
E-31080-Pamplona, Spain
Tel: +34 948 425600 (806580)
Fax: +34 948 425740
E-mail address: [email protected]

Results
51
ABSTRACT
Several authors have proposed some volatile compounds present in coffee as potent
antioxidants (Fuster et al., 2000, Yanagimoto et al., 2002). However, the contribution of the
volatile compounds to the antioxidant capacity of coffee is still unclear and controversial mainly
because of their low concentrations in coffee brews (Lopez-Galilea et al., 2007). The aim of this
study was to evaluate the antioxidant capacity of those volatile compounds reported as
antioxidants and present in coffee brews. Seven furans, 3 pyrroles, and 2 thiophenes identified
in filter coffee brews (by SH-GC-MS) were selected to prepare model systems at different
concentrations including those found in coffee. All model systems were analysed using ABTS+
as free stable radical to asses the antioxidant capacity. Results were compared with the
antioxidant capacity of coffee brew. The model system containing all the three chemical groups
(pyrroles, furans and thiophenes) was the most active in scavenging ABTS+, followed by
pyrroles and furans. Thiophenes were ineffective as radical scavengers at all concentrations
including 100-fold. However, in comparison with the antioxidant capacity exhibited by the coffee
brew sample, the contribution of the volatile compounds assayed was insignificant. In addition,
results showed that the heterocyclic compounds analysed exhibited non-linear concentration-
dependent antioxidant capacity.
1 INTRODUCTION
Among other volatiles, heterocyclic compounds formed during the roasting process have been
extensively studied from the viewpoint of flavour chemistry (Flament, 2001). However, recent
research has proposed some heterocyclic compounds formed during heat treatment as being
potentially antioxidant. Severini et al. (2000) observed that certain volatile compounds produced
in the roasting process of almonds displayed an antioxidant effect. Furthermore, typical volatile
compounds formed in Maillard reaction model systems have been reported to inhibit oxidation of
lipids (Elizalde et al., 1992; Osada & Shibamoto, 2006). Besides their contribution to flavour,
some typical volatile heterocyclic compounds found in coffee have been investigated for their
antioxidant properties. Fuster et al. (2000) and Yanagimoto et al. (2002) analyzed one by one
the inhibitory effect of isolated volatile compounds on hexanal oxidation and reported
considerable antioxidant capacity for some pyrrols, furans and thiophenes. Most of these
studies have been carried out at concentration levels higher than those present in coffee. Later
Yanagimoto et al. (2004) analyzed the antioxidant activity of chromatographic fractions obtained
from a dichloromethane extract of coffee brew. This study suggested that some volatile
compounds were responsible for the antioxidant activity exhibited by dichloromethane fractions.
More recently Lopez-Galilea et al. (2008) studied the correlation between total antioxidant
capacity of coffee and some selected constituents, including heterocyclic volatile compounds,
and found that these latter were negatively correlated with radical quenching activity. However,
in this latter study, those coffees that exhibited higher antioxidant activity showed lower amounts
of volatile compounds due to botanic variety and roasting process.
Results
52
For the reasons outlined above, the aim of this study was to assess the actual contribution of
heterocyclic volatile compounds to the total antioxidant activity of coffee. Therefore antioxidant
activity of model systems of potentially antioxidant heterocyclic compounds was analyzed at
different concentration levels including those found in coffee. Furthermore, possible
antagonistic/synergic effects between compound classes were studied.
2 MATERIALS AND METHODS
2.1 Chemicals and reagents. ABTS (2,2’-Azino-bi(3-ethylbenzo-thiazonile-6-sulfonic acid)
diammonium salt), potassium persulfate, Trolox (6-hydroxy-2,5,7,8-tetramethyl-chroman-2-
carboxylic acid), dipotassium hydrogen phosphate, potassium dihydrogen phosphate, sodium
chloride, and pure reference standards for furan, 2-methylfuran, 2,5-dimethylfurane, 2-methyl-
tetrahydrofuran-3-one, furfural, 5-methylfurfural, 2-furfurylacetate, 1-methylpyrrole, pyrrole, 2-
formyl-1-methyl-pyrrole, thiophene and 2-methylthiophene were obtained from Sigma-Aldrich
(Steinheim, Germany).
2.2 Coffee samples. Roasted coffee from Colombia (Coffea arabica, named Arabica, L* =
24.82±0.81, roasted at 219 °C for 905 s) and Vietna m (Coffea canephora var. robusta, named
Robusta, L* = 24.92±0.01, roasted at 228 °C for 859 s) were provided by a local roasting
company. The L* value was analyzed by means of a tristimulus colourimeter (Chromameter-2
CR-200, Minolta, Osaka, Japan) using the D65 illuminant and CIE 1931 standard observer. The
instrument was standardized against a white tile before sample measurements. Ground roasted
coffee was spread out in a 1 cm Petri plate and the L* value was measured in triplicate on the
CIELab scale. Coffee beans were ground for 20 s using a grinder (model Moulinex super junior
“s”, París, France).
Filter Coffee Brew was prepared from 36 g of ground roasted coffee for a volume of 600 mL,
using a filter coffee machine (model Avantis 70 Aroma plus, Ufesa, Spain). Extraction took
approx. 6 min at 90 °C.
2.3 Volatile Compounds Analysis. Volatile compounds were analysed according to the
method described by Maeztu et al. (2001) using static headspace-gas chromatography-mass
spectrometry (SH-GC-MS). Six mL of coffee or volatile compound standard solution was
introduced into a 20 mL vial, which was immediately sealed with a silicone rubber Teflon cap.
Each vial was equilibrated at 40 °C for 15 min in t he headspace sampler (model 7694E, Agilent
Technologies, Palo Alto, CA). Each vial was pressurized with carrier gas for 12 s, and 1 mL of
the headspace sample was injected into an HP-Wax glass capillary column (60 m × 0.25 mm ×
0.5 µm film thickness) in an HP 7890 gas chromatograph (Agilent Technologies). The injector
temperature was 60 °C, and the carrier gas was heli um (1 mL/min linear speed). The oven
temperature was maintained at 40 °C for 3 min and t hen raised at 2.5 °C/min to 205 °C and
maintained for 10 min. Mass spectrometry analysis was performed with a mass selective
detector (model 5975C, Agilent Technologies) operating in the electron impact ionization mode
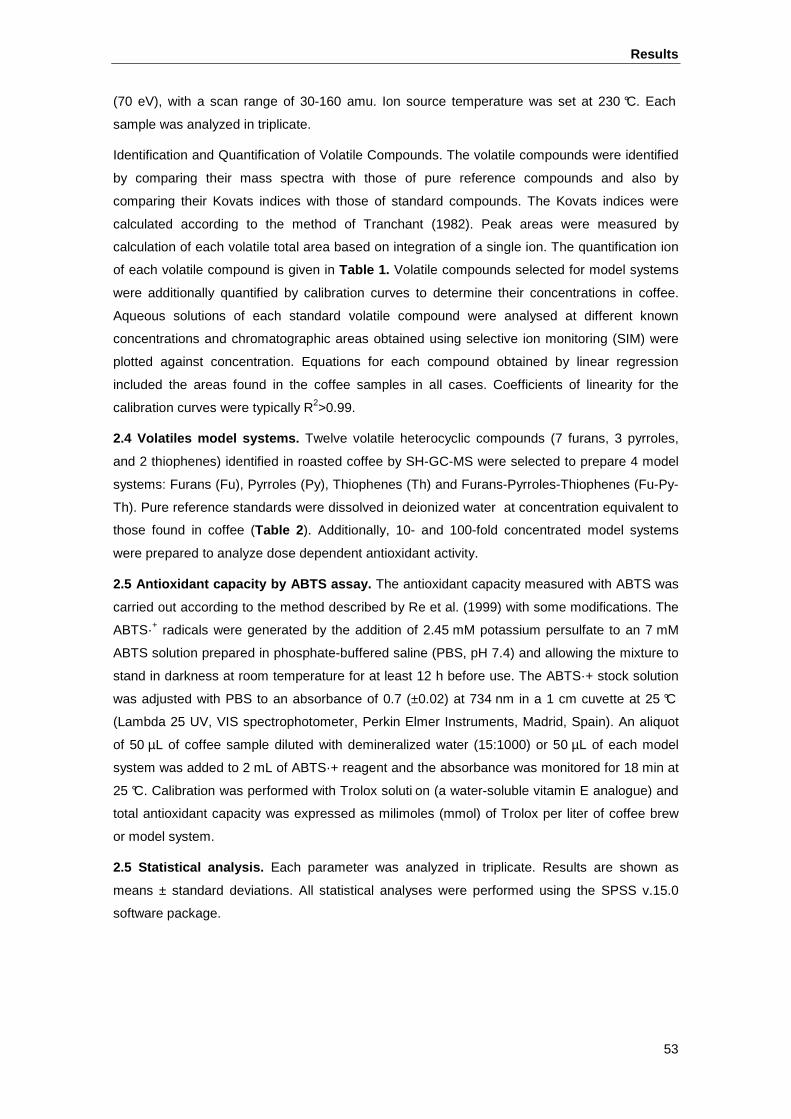
Results
53
(70 eV), with a scan range of 30-160 amu. Ion source temperature was set at 230 °C. Each
sample was analyzed in triplicate.
Identification and Quantification of Volatile Compounds. The volatile compounds were identified
by comparing their mass spectra with those of pure reference compounds and also by
comparing their Kovats indices with those of standard compounds. The Kovats indices were
calculated according to the method of Tranchant (1982). Peak areas were measured by
calculation of each volatile total area based on integration of a single ion. The quantification ion
of each volatile compound is given in Table 1. Volatile compounds selected for model systems
were additionally quantified by calibration curves to determine their concentrations in coffee.
Aqueous solutions of each standard volatile compound were analysed at different known
concentrations and chromatographic areas obtained using selective ion monitoring (SIM) were
plotted against concentration. Equations for each compound obtained by linear regression
included the areas found in the coffee samples in all cases. Coefficients of linearity for the
calibration curves were typically R2>0.99.
2.4 Volatiles model systems. Twelve volatile heterocyclic compounds (7 furans, 3 pyrroles,
and 2 thiophenes) identified in roasted coffee by SH-GC-MS were selected to prepare 4 model
systems: Furans (Fu), Pyrroles (Py), Thiophenes (Th) and Furans-Pyrroles-Thiophenes (Fu-Py-
Th). Pure reference standards were dissolved in deionized water at concentration equivalent to
those found in coffee (Table 2 ). Additionally, 10- and 100-fold concentrated model systems
were prepared to analyze dose dependent antioxidant activity.
2.5 Antioxidant capacity by ABTS assay. The antioxidant capacity measured with ABTS was
carried out according to the method described by Re et al. (1999) with some modifications. The
ABTS·+ radicals were generated by the addition of 2.45 mM potassium persulfate to an 7 mM
ABTS solution prepared in phosphate-buffered saline (PBS, pH 7.4) and allowing the mixture to
stand in darkness at room temperature for at least 12 h before use. The ABTS·+ stock solution
was adjusted with PBS to an absorbance of 0.7 (±0.02) at 734 nm in a 1 cm cuvette at 25 °C
(Lambda 25 UV, VIS spectrophotometer, Perkin Elmer Instruments, Madrid, Spain). An aliquot
of 50 µL of coffee sample diluted with demineralized water (15:1000) or 50 µL of each model
system was added to 2 mL of ABTS·+ reagent and the absorbance was monitored for 18 min at
25 °C. Calibration was performed with Trolox soluti on (a water-soluble vitamin E analogue) and
total antioxidant capacity was expressed as milimoles (mmol) of Trolox per liter of coffee brew
or model system.
2.5 Statistical analysis. Each parameter was analyzed in triplicate. Results are shown as
means ± standard deviations. All statistical analyses were performed using the SPSS v.15.0
software package.
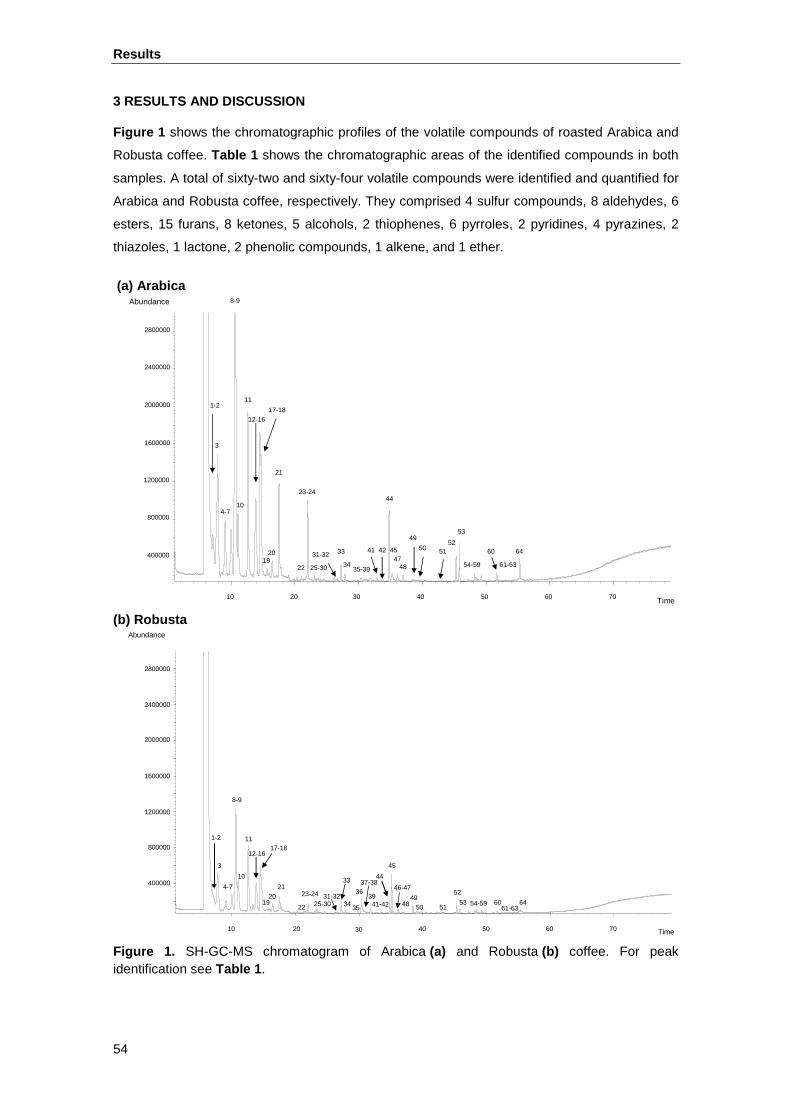
Results
54
3 RESULTS AND DISCUSSION
Figure 1 shows the chromatographic profiles of the volatile compounds of roasted Arabica and
Robusta coffee. Table 1 shows the chromatographic areas of the identified compounds in both
samples. A total of sixty-two and sixty-four volatile compounds were identified and quantified for
Arabica and Robusta coffee, respectively. They comprised 4 sulfur compounds, 8 aldehydes, 6
esters, 15 furans, 8 ketones, 5 alcohols, 2 thiophenes, 6 pyrroles, 2 pyridines, 4 pyrazines, 2
thiazoles, 1 lactone, 2 phenolic compounds, 1 alkene, and 1 ether.
(a) Arabica
(b) Robusta
Figure 1. SH-GC-MS chromatogram of Arabica (a) and Robusta (b) coffee. For peak identification see Table 1 .
Time
Abundance
1-2
3
4-7
8-9
10
11 12-16 17-18
20 19
21
22
23-24
25-30 31-32 33
34 35-39
44
45 49
50 51 52 53
61-63 54-59 60
2800000
2400000
2000000
1600000
1200000
800000
400000
10 20 30 40 50 60 70
47 48
64 41 42
1-2
3
4-7
8-9
10
11
12-16 17-18
19 20
21
22
23-24
25-30 31-32
33
34 35
36 39
41-42
44
45
46-47
49 50 51
52
53 54-59 60 61-63
64
Abundance
2800000
2400000
2000000
1600000
1200000
800000
400000
10 20 30 40 50 60 70 Time
37-38
48
Results
55
Arabica coffee showed a significantly higher total area of volatiles than Robusta (2.1x10⁶ vs
0.7x10⁶), mainly because the most abundant volatile chemical classes (aldehydes, furans,
ketones and esters) were significantly higher in Arabica samples. Aldehydes and esters are
responsible for fruity and malty coffee flavour notes, whereas diketones contribute to the buttery
aroma, and furans are considered to be responsible for the typical roasted coffee aroma
(Semmelroch & Grosch, 1995; Maeztu et al., 2001; Flament, 2001). Similar results were
reported by other authors (Sanz et al., 2002; Lopez Galilea et al., 2008a) when they compare
the volatile compounds of Arabica coffee with those found in Arabica-Robusta coffee blends
roasted by conventional or torrefacto techniques. In contrast, chromatographic areas of
pyrazines and pyridines, and in less proportion thiazoles, were higher in Robusta coffee.
Pyrazines are responsible for roasty, earthy, musty and woody flavour notes characteristic of
Robusta coffee (Blank et al., 1991; Semmelroch & Grosch, 1995; Lopez Galilea et al., 2006)
and pyridines contribute to smoky aroma (Flament, 2001). Also, low molecular weight phenolic
compounds, and mainly 2-methoxyphenol (guaiacol) that is a key odorant (Semmelroch &
Grosch, 1995; Sanz et al., 2002) responsible of phenolic and burnt aroma (Lopez Galilea et al.,
2006), were only detected in Robusta coffee samples at low levels but not in Arabica. Similar
results were found by other authors in conventional roasted Arabica and Robusta coffee
(Semmelroch & Grosch, 1995; Maeztu et al., 2001; Lopez Galilea et al., 2008b) and coffee
brews (Maeztu et al., 2001).
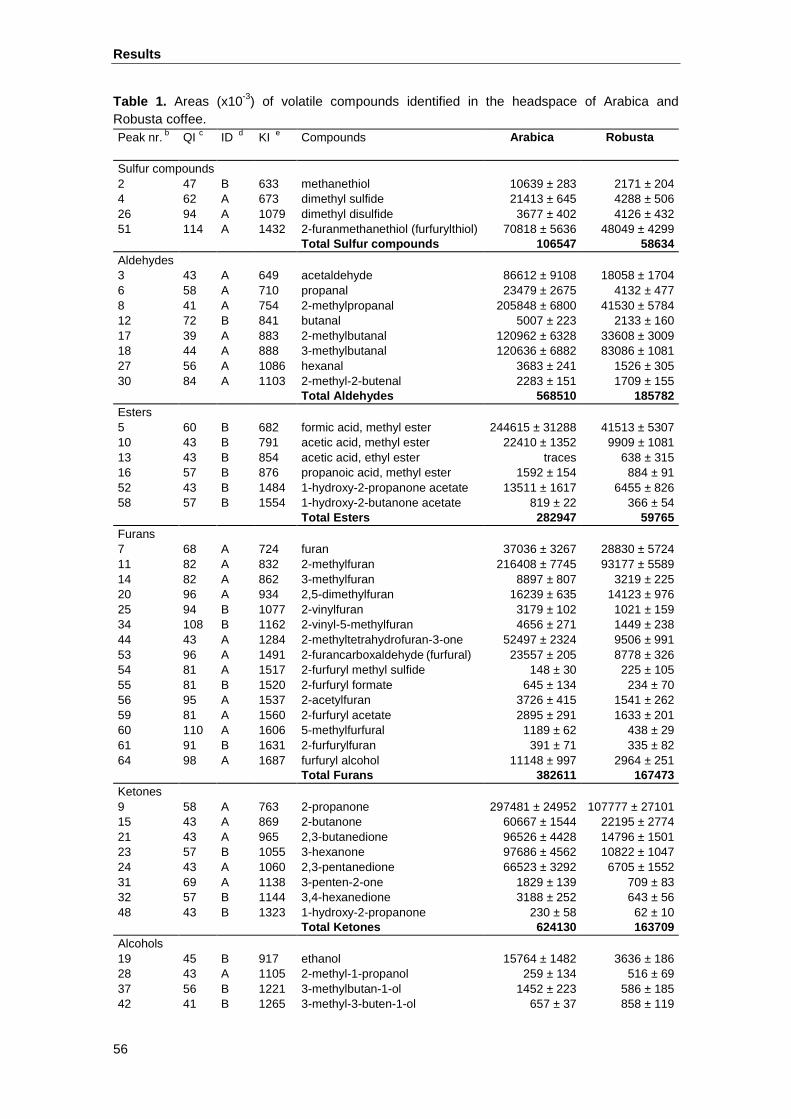
Results
56
Table 1. Areas (x10-3) of volatile compounds identified in the headspace of Arabica and Robusta coffee. Peak nr. b QI c ID d KI e Compounds Arabica Robusta Sulfur compounds 2 47 B 633 methanethiol 10639 ± 283 2171 ± 204 4 62 A 673 dimethyl sulfide 21413 ± 645 4288 ± 506 26 94 A 1079 dimethyl disulfide 3677 ± 402 4126 ± 432 51 114 A 1432 2-furanmethanethiol (furfurylthiol) 70818 ± 5636 48049 ± 4299 Total Sulfur compounds 106547 58634 Aldehydes 3 43 A 649 acetaldehyde 86612 ± 9108 18058 ± 1704 6 58 A 710 propanal 23479 ± 2675 4132 ± 477 8 41 A 754 2-methylpropanal 205848 ± 6800 41530 ± 5784 12 72 B 841 butanal 5007 ± 223 2133 ± 160 17 39 A 883 2-methylbutanal 120962 ± 6328 33608 ± 3009 18 44 A 888 3-methylbutanal 120636 ± 6882 83086 ± 1081 27 56 A 1086 hexanal 3683 ± 241 1526 ± 305 30 84 A 1103 2-methyl-2-butenal 2283 ± 151 1709 ± 155 Total Aldehydes 568510 185782 Esters 5 60 B 682 formic acid, methyl ester 244615 ± 31288 41513 ± 5307 10 43 B 791 acetic acid, methyl ester 22410 ± 1352 9909 ± 1081 13 43 B 854 acetic acid, ethyl ester traces 638 ± 315 16 57 B 876 propanoic acid, methyl ester 1592 ± 154 884 ± 91 52 43 B 1484 1-hydroxy-2-propanone acetate 13511 ± 1617 6455 ± 826 58 57 B 1554 1-hydroxy-2-butanone acetate 819 ± 22 366 ± 54 Total Esters 282947 59765 Furans 7 68 A 724 furan 37036 ± 3267 28830 ± 5724 11 82 A 832 2-methylfuran 216408 ± 7745 93177 ± 5589 14 82 A 862 3-methylfuran 8897 ± 807 3219 ± 225 20 96 A 934 2,5-dimethylfuran 16239 ± 635 14123 ± 976 25 94 B 1077 2-vinylfuran 3179 ± 102 1021 ± 159 34 108 B 1162 2-vinyl-5-methylfuran 4656 ± 271 1449 ± 238 44 43 A 1284 2-methyltetrahydrofuran-3-one 52497 ± 2324 9506 ± 991 53 96 A 1491 2-furancarboxaldehyde (furfural) 23557 ± 205 8778 ± 326 54 81 A 1517 2-furfuryl methyl sulfide 148 ± 30 225 ± 105 55 81 B 1520 2-furfuryl formate 645 ± 134 234 ± 70 56 95 A 1537 2-acetylfuran 3726 ± 415 1541 ± 262 59 81 A 1560 2-furfuryl acetate 2895 ± 291 1633 ± 201 60 110 A 1606 5-methylfurfural 1189 ± 62 438 ± 29 61 91 B 1631 2-furfurylfuran 391 ± 71 335 ± 82 64 98 A 1687 furfuryl alcohol 11148 ± 997 2964 ± 251 Total Furans 382611 167473 Ketones 9 58 A 763 2-propanone 297481 ± 24952 107777 ± 27101 15 43 A 869 2-butanone 60667 ± 1544 22195 ± 2774 21 43 A 965 2,3-butanedione 96526 ± 4428 14796 ± 1501 23 57 B 1055 3-hexanone 97686 ± 4562 10822 ± 1047 24 43 A 1060 2,3-pentanedione 66523 ± 3292 6705 ± 1552 31 69 A 1138 3-penten-2-one 1829 ± 139 709 ± 83 32 57 B 1144 3,4-hexanedione 3188 ± 252 643 ± 56 48 43 B 1323 1-hydroxy-2-propanone 230 ± 58 62 ± 10 Total Ketones 624130 163709 Alcohols 19 45 B 917 ethanol 15764 ± 1482 3636 ± 186 28 43 A 1105 2-methyl-1-propanol 259 ± 134 516 ± 69 37 56 B 1221 3-methylbutan-1-ol 1452 ± 223 586 ± 185 42 41 B 1265 3-methyl-3-buten-1-ol 657 ± 37 858 ± 119
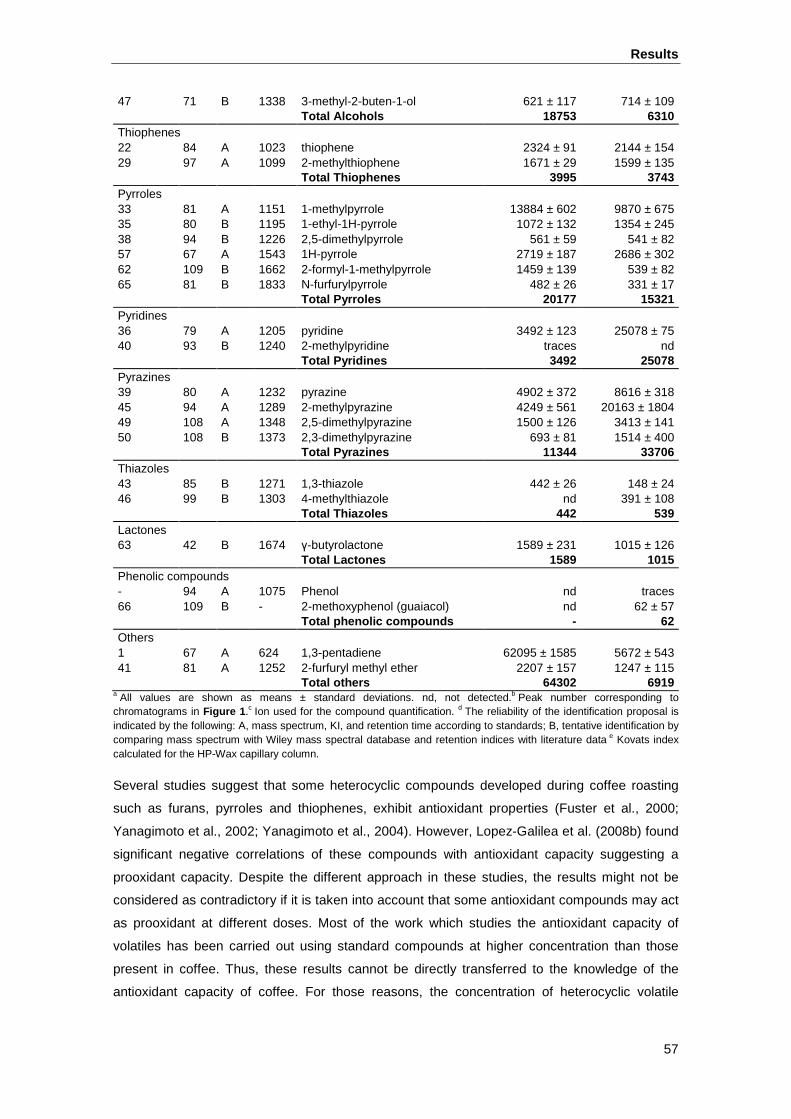
Results
57
47 71 B 1338 3-methyl-2-buten-1-ol 621 ± 117 714 ± 109 Total Alcohols 18753 6310 Thiophenes 22 84 A 1023 thiophene 2324 ± 91 2144 ± 154 29 97 A 1099 2-methylthiophene 1671 ± 29 1599 ± 135 Total Thiophenes 3995 3743 Pyrroles 33 81 A 1151 1-methylpyrrole 13884 ± 602 9870 ± 675 35 80 B 1195 1-ethyl-1H-pyrrole 1072 ± 132 1354 ± 245 38 94 B 1226 2,5-dimethylpyrrole 561 ± 59 541 ± 82 57 67 A 1543 1H-pyrrole 2719 ± 187 2686 ± 302 62 109 B 1662 2-formyl-1-methylpyrrole 1459 ± 139 539 ± 82 65 81 B 1833 N-furfurylpyrrole 482 ± 26 331 ± 17 Total Pyrroles 20177 15321 Pyridines 36 79 A 1205 pyridine 3492 ± 123 25078 ± 75 40 93 B 1240 2-methylpyridine traces nd Total Pyridines 3492 25078 Pyrazines 39 80 A 1232 pyrazine 4902 ± 372 8616 ± 318 45 94 A 1289 2-methylpyrazine 4249 ± 561 20163 ± 1804 49 108 A 1348 2,5-dimethylpyrazine 1500 ± 126 3413 ± 141 50 108 B 1373 2,3-dimethylpyrazine 693 ± 81 1514 ± 400 Total Pyrazines 11344 33706 Thiazoles 43 85 B 1271 1,3-thiazole 442 ± 26 148 ± 24 46 99 B 1303 4-methylthiazole nd 391 ± 108 Total Thiazoles 442 539 Lactones 63 42 B 1674 γ-butyrolactone 1589 ± 231 1015 ± 126 Total Lactones 1589 1015 Phenolic compounds - 94 A 1075 Phenol nd traces 66 109 B - 2-methoxyphenol (guaiacol) nd 62 ± 57 Total phenolic compounds - 62 Others 1 67 A 624 1,3-pentadiene 62095 ± 1585 5672 ± 543 41 81 A 1252 2-furfuryl methyl ether 2207 ± 157 1247 ± 115 Total others 64302 6919
a All values are shown as means ± standard deviations. nd, not detected.b Peak number corresponding to chromatograms in Figure 1 .c Ion used for the compound quantification. d The reliability of the identification proposal is indicated by the following: A, mass spectrum, KI, and retention time according to standards; B, tentative identification by comparing mass spectrum with Wiley mass spectral database and retention indices with literature data e Kovats index calculated for the HP-Wax capillary column.
Several studies suggest that some heterocyclic compounds developed during coffee roasting
such as furans, pyrroles and thiophenes, exhibit antioxidant properties (Fuster et al., 2000;
Yanagimoto et al., 2002; Yanagimoto et al., 2004). However, Lopez-Galilea et al. (2008b) found
significant negative correlations of these compounds with antioxidant capacity suggesting a
prooxidant capacity. Despite the different approach in these studies, the results might not be
considered as contradictory if it is taken into account that some antioxidant compounds may act
as prooxidant at different doses. Most of the work which studies the antioxidant capacity of
volatiles has been carried out using standard compounds at higher concentration than those
present in coffee. Thus, these results cannot be directly transferred to the knowledge of the
antioxidant capacity of coffee. For those reasons, the concentration of heterocyclic volatile
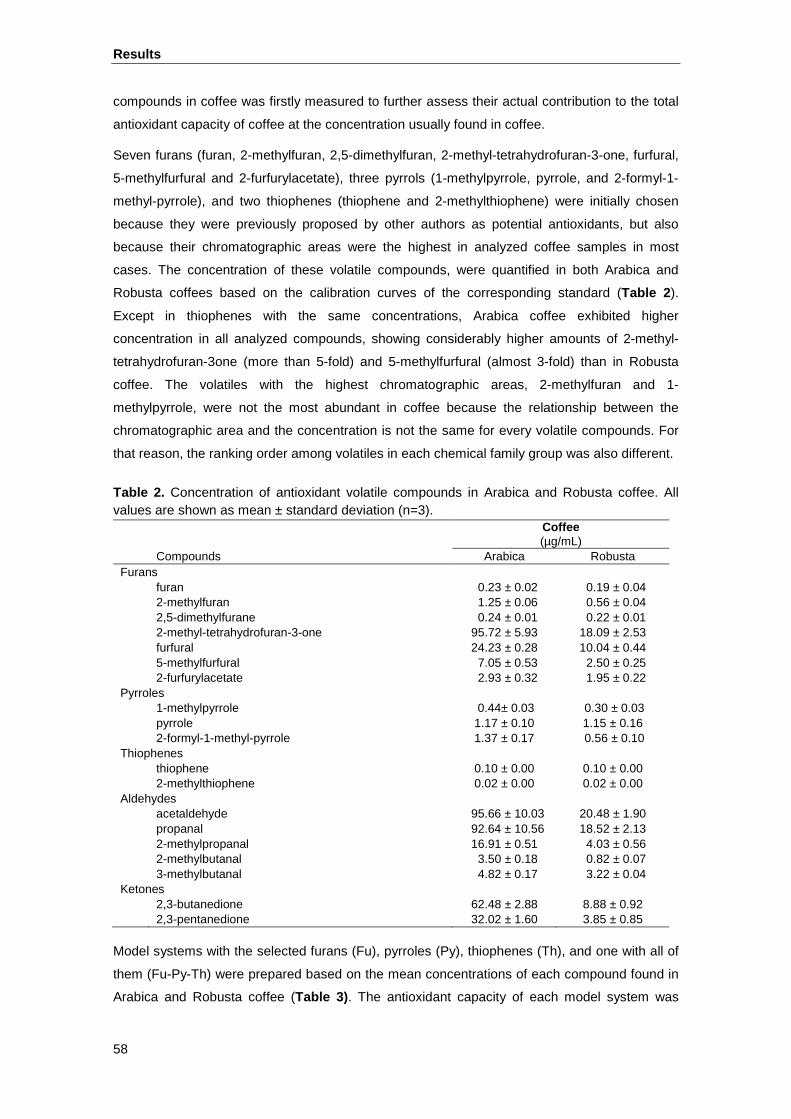
Results
58
compounds in coffee was firstly measured to further assess their actual contribution to the total
antioxidant capacity of coffee at the concentration usually found in coffee.
Seven furans (furan, 2-methylfuran, 2,5-dimethylfuran, 2-methyl-tetrahydrofuran-3-one, furfural,
5-methylfurfural and 2-furfurylacetate), three pyrrols (1-methylpyrrole, pyrrole, and 2-formyl-1-
methyl-pyrrole), and two thiophenes (thiophene and 2-methylthiophene) were initially chosen
because they were previously proposed by other authors as potential antioxidants, but also
because their chromatographic areas were the highest in analyzed coffee samples in most
cases. The concentration of these volatile compounds, were quantified in both Arabica and
Robusta coffees based on the calibration curves of the corresponding standard (Table 2 ).
Except in thiophenes with the same concentrations, Arabica coffee exhibited higher
concentration in all analyzed compounds, showing considerably higher amounts of 2-methyl-
tetrahydrofuran-3one (more than 5-fold) and 5-methylfurfural (almost 3-fold) than in Robusta
coffee. The volatiles with the highest chromatographic areas, 2-methylfuran and 1-
methylpyrrole, were not the most abundant in coffee because the relationship between the
chromatographic area and the concentration is not the same for every volatile compounds. For
that reason, the ranking order among volatiles in each chemical family group was also different.
Table 2. Concentration of antioxidant volatile compounds in Arabica and Robusta coffee. All values are shown as mean ± standard deviation (n=3).
Coffee (µg/mL)
Compounds Arabica Robusta Furans furan 0.23 ± 0.02 0.19 ± 0.04 2-methylfuran 1.25 ± 0.06 0.56 ± 0.04 2,5-dimethylfurane 0.24 ± 0.01 0.22 ± 0.01 2-methyl-tetrahydrofuran-3-one 95.72 ± 5.93 18.09 ± 2.53 furfural 24.23 ± 0.28 10.04 ± 0.44 5-methylfurfural 7.05 ± 0.53 2.50 ± 0.25 2-furfurylacetate 2.93 ± 0.32 1.95 ± 0.22 Pyrroles 1-methylpyrrole 0.44± 0.03 0.30 ± 0.03 pyrrole 1.17 ± 0.10 1.15 ± 0.16 2-formyl-1-methyl-pyrrole 1.37 ± 0.17 0.56 ± 0.10 Thiophenes thiophene 0.10 ± 0.00 0.10 ± 0.00 2-methylthiophene 0.02 ± 0.00 0.02 ± 0.00 Aldehydes acetaldehyde 95.66 ± 10.03 20.48 ± 1.90 propanal 92.64 ± 10.56 18.52 ± 2.13 2-methylpropanal 16.91 ± 0.51 4.03 ± 0.56 2-methylbutanal 3.50 ± 0.18 0.82 ± 0.07 3-methylbutanal 4.82 ± 0.17 3.22 ± 0.04 Ketones 2,3-butanedione 62.48 ± 2.88 8.88 ± 0.92 2,3-pentanedione 32.02 ± 1.60 3.85 ± 0.85
Model systems with the selected furans (Fu), pyrroles (Py), thiophenes (Th), and one with all of
them (Fu-Py-Th) were prepared based on the mean concentrations of each compound found in
Arabica and Robusta coffee (Table 3) . The antioxidant capacity of each model system was
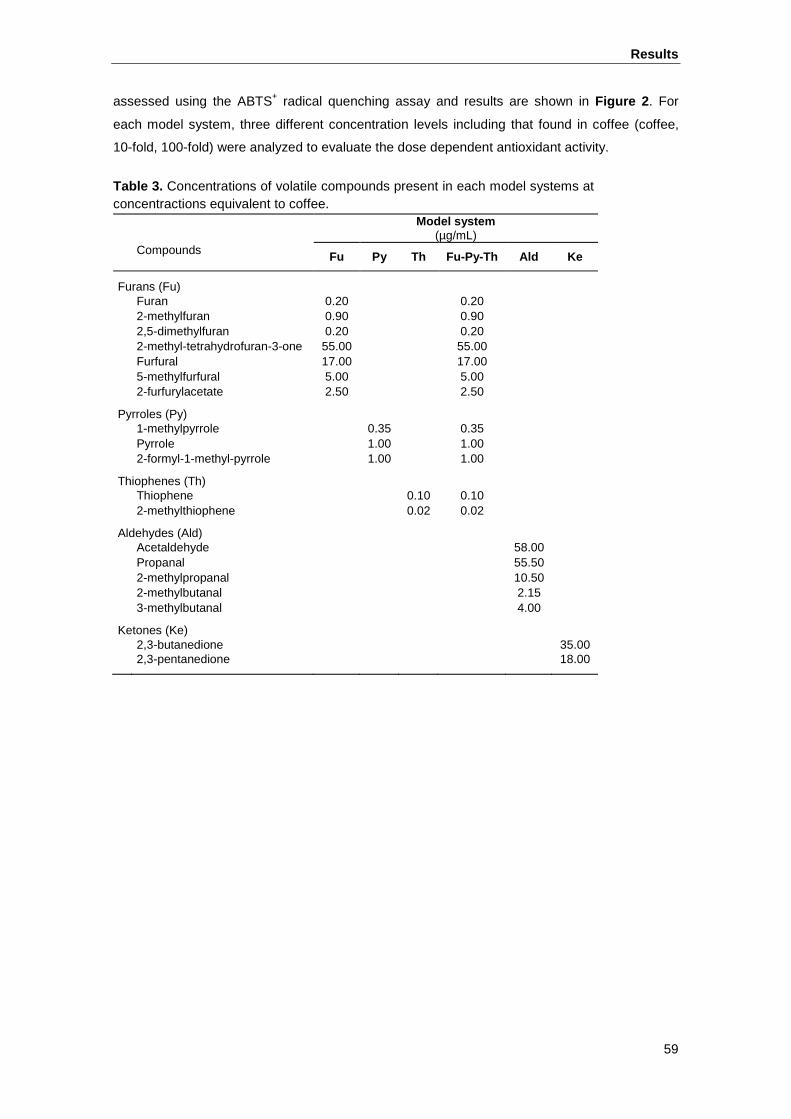
Results
59
assessed using the ABTS+ radical quenching assay and results are shown in Figure 2 . For
each model system, three different concentration levels including that found in coffee (coffee,
10-fold, 100-fold) were analyzed to evaluate the dose dependent antioxidant activity.
Table 3. Concentrations of volatile compounds present in each model systems at concentractions equivalent to coffee.
Model system
(µg/mL)
Compounds
Fu Py Th Fu-Py-Th Ald Ke
Furans (Fu) Furan 0.20 0.20 2-methylfuran 0.90 0.90 2,5-dimethylfuran 0.20 0.20 2-methyl-tetrahydrofuran-3-one 55.00 55.00 Furfural 17.00 17.00 5-methylfurfural 5.00 5.00 2-furfurylacetate 2.50 2.50
Pyrroles (Py) 1-methylpyrrole 0.35 0.35 Pyrrole 1.00 1.00 2-formyl-1-methyl-pyrrole 1.00 1.00
Thiophenes (Th) Thiophene 0.10 0.10 2-methylthiophene 0.02 0.02
Aldehydes (Ald) Acetaldehyde 58.00 Propanal 55.50 2-methylpropanal 10.50 2-methylbutanal 2.15 3-methylbutanal 4.00
Ketones (Ke) 2,3-butanedione 35.00 2,3-pentanedione 18.00
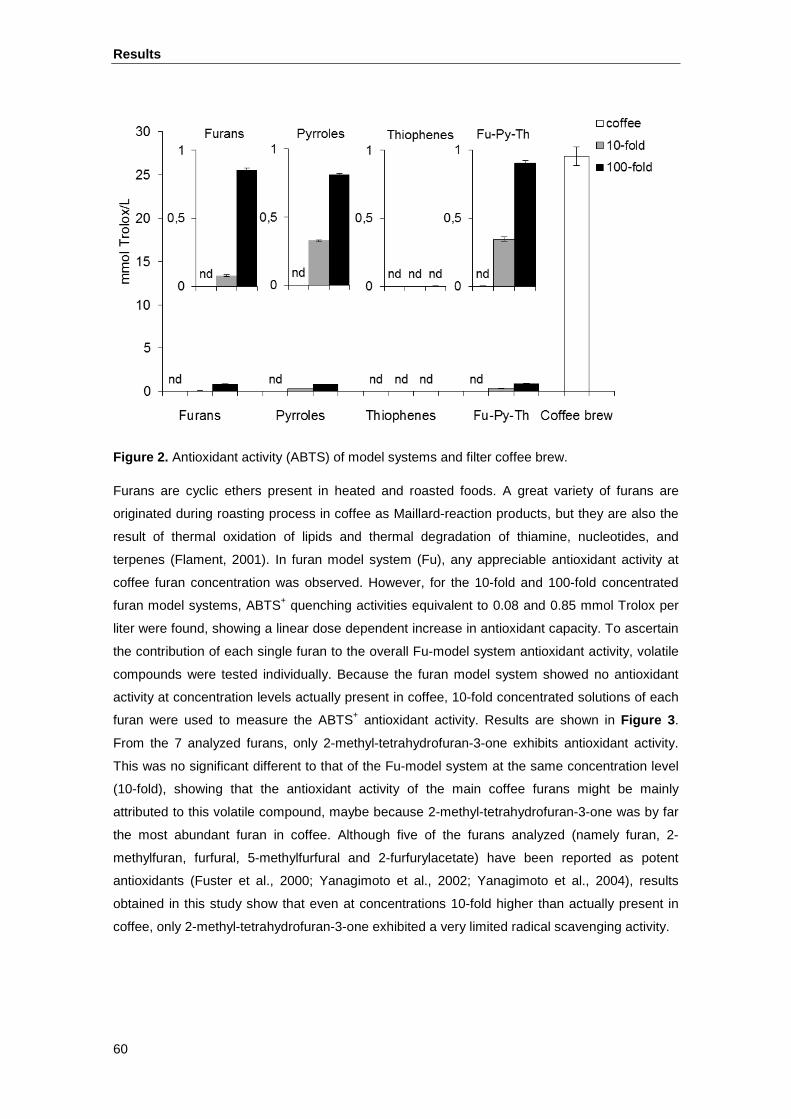
Results
60
Figure 2. Antioxidant activity (ABTS) of model systems and filter coffee brew.
Furans are cyclic ethers present in heated and roasted foods. A great variety of furans are
originated during roasting process in coffee as Maillard-reaction products, but they are also the
result of thermal oxidation of lipids and thermal degradation of thiamine, nucleotides, and
terpenes (Flament, 2001). In furan model system (Fu), any appreciable antioxidant activity at
coffee furan concentration was observed. However, for the 10-fold and 100-fold concentrated
furan model systems, ABTS+ quenching activities equivalent to 0.08 and 0.85 mmol Trolox per
liter were found, showing a linear dose dependent increase in antioxidant capacity. To ascertain
the contribution of each single furan to the overall Fu-model system antioxidant activity, volatile
compounds were tested individually. Because the furan model system showed no antioxidant
activity at concentration levels actually present in coffee, 10-fold concentrated solutions of each
furan were used to measure the ABTS+ antioxidant activity. Results are shown in Figure 3 .
From the 7 analyzed furans, only 2-methyl-tetrahydrofuran-3-one exhibits antioxidant activity.
This was no significant different to that of the Fu-model system at the same concentration level
(10-fold), showing that the antioxidant activity of the main coffee furans might be mainly
attributed to this volatile compound, maybe because 2-methyl-tetrahydrofuran-3-one was by far
the most abundant furan in coffee. Although five of the furans analyzed (namely furan, 2-
methylfuran, furfural, 5-methylfurfural and 2-furfurylacetate) have been reported as potent
antioxidants (Fuster et al., 2000; Yanagimoto et al., 2002; Yanagimoto et al., 2004), results
obtained in this study show that even at concentrations 10-fold higher than actually present in
coffee, only 2-methyl-tetrahydrofuran-3-one exhibited a very limited radical scavenging activity.
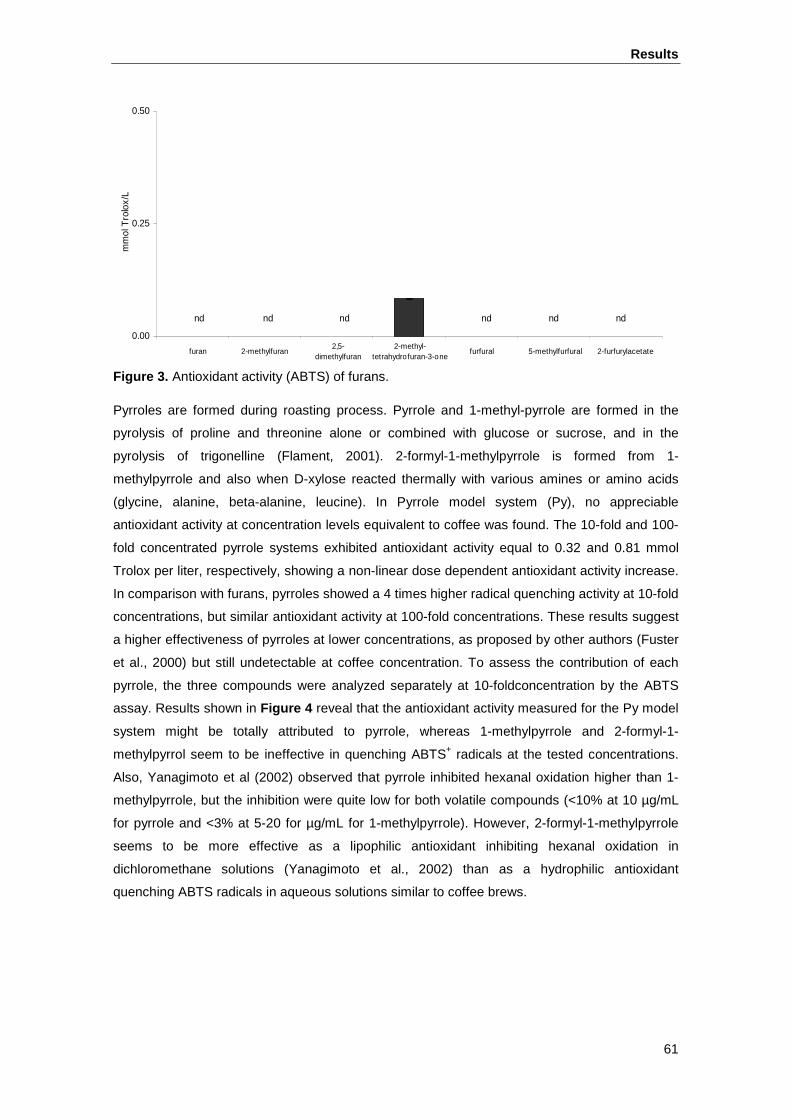
Results
61
Figure 3. Antioxidant activity (ABTS) of furans.
Pyrroles are formed during roasting process. Pyrrole and 1-methyl-pyrrole are formed in the
pyrolysis of proline and threonine alone or combined with glucose or sucrose, and in the
pyrolysis of trigonelline (Flament, 2001). 2-formyl-1-methylpyrrole is formed from 1-
methylpyrrole and also when D-xylose reacted thermally with various amines or amino acids
(glycine, alanine, beta-alanine, leucine). In Pyrrole model system (Py), no appreciable
antioxidant activity at concentration levels equivalent to coffee was found. The 10-fold and 100-
fold concentrated pyrrole systems exhibited antioxidant activity equal to 0.32 and 0.81 mmol
Trolox per liter, respectively, showing a non-linear dose dependent antioxidant activity increase.
In comparison with furans, pyrroles showed a 4 times higher radical quenching activity at 10-fold
concentrations, but similar antioxidant activity at 100-fold concentrations. These results suggest
a higher effectiveness of pyrroles at lower concentrations, as proposed by other authors (Fuster
et al., 2000) but still undetectable at coffee concentration. To assess the contribution of each
pyrrole, the three compounds were analyzed separately at 10-foldconcentration by the ABTS
assay. Results shown in Figure 4 reveal that the antioxidant activity measured for the Py model
system might be totally attributed to pyrrole, whereas 1-methylpyrrole and 2-formyl-1-
methylpyrrol seem to be ineffective in quenching ABTS+ radicals at the tested concentrations.
Also, Yanagimoto et al (2002) observed that pyrrole inhibited hexanal oxidation higher than 1-
methylpyrrole, but the inhibition were quite low for both volatile compounds (<10% at 10 µg/mL
for pyrrole and <3% at 5-20 for µg/mL for 1-methylpyrrole). However, 2-formyl-1-methylpyrrole
seems to be more effective as a lipophilic antioxidant inhibiting hexanal oxidation in
dichloromethane solutions (Yanagimoto et al., 2002) than as a hydrophilic antioxidant
quenching ABTS radicals in aqueous solutions similar to coffee brews.
0.00
0.25
0.50m
mol
Tro
lox/
L
furan 5-methylfurfural 2-furfurylacetatefurfural2,5-
dimethylfuran2-methylfuran
2-methyl-tetrahydrofuran-3-one
nd ndndndndnd
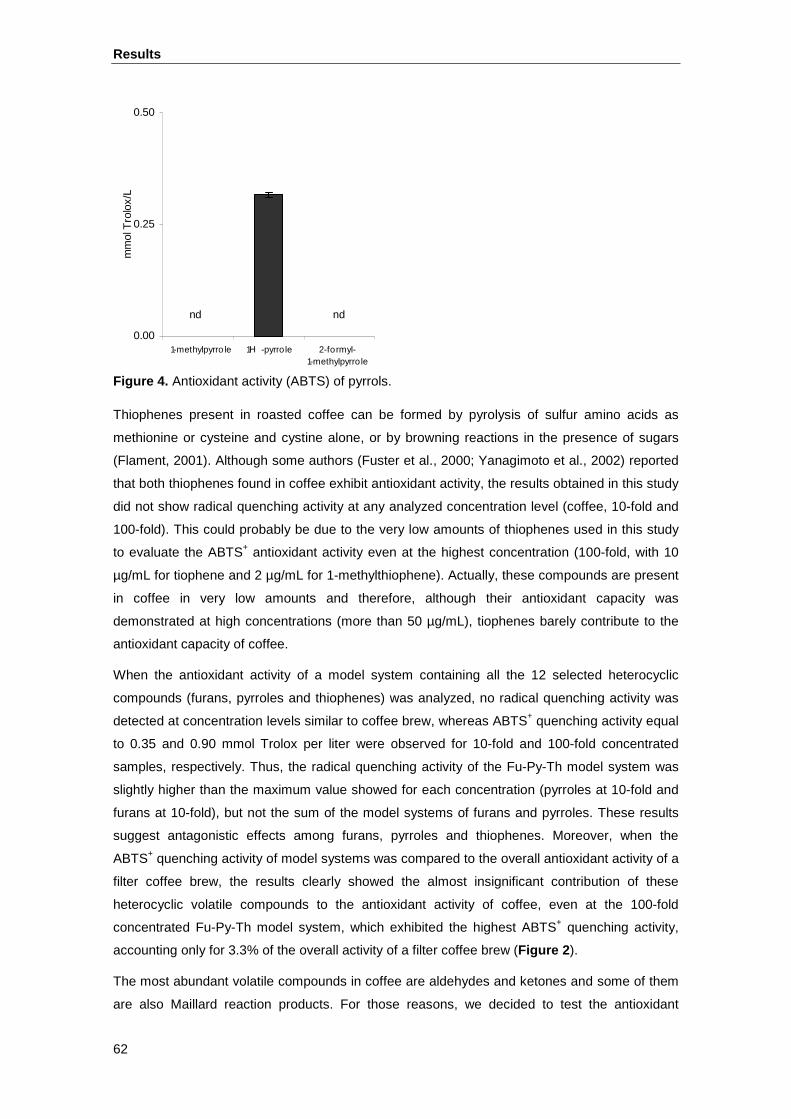
Results
62
Figure 4. Antioxidant activity (ABTS) of pyrrols.
Thiophenes present in roasted coffee can be formed by pyrolysis of sulfur amino acids as
methionine or cysteine and cystine alone, or by browning reactions in the presence of sugars
(Flament, 2001). Although some authors (Fuster et al., 2000; Yanagimoto et al., 2002) reported
that both thiophenes found in coffee exhibit antioxidant activity, the results obtained in this study
did not show radical quenching activity at any analyzed concentration level (coffee, 10-fold and
100-fold). This could probably be due to the very low amounts of thiophenes used in this study
to evaluate the ABTS+ antioxidant activity even at the highest concentration (100-fold, with 10
µg/mL for tiophene and 2 µg/mL for 1-methylthiophene). Actually, these compounds are present
in coffee in very low amounts and therefore, although their antioxidant capacity was
demonstrated at high concentrations (more than 50 µg/mL), tiophenes barely contribute to the
antioxidant capacity of coffee.
When the antioxidant activity of a model system containing all the 12 selected heterocyclic
compounds (furans, pyrroles and thiophenes) was analyzed, no radical quenching activity was
detected at concentration levels similar to coffee brew, whereas ABTS+ quenching activity equal
to 0.35 and 0.90 mmol Trolox per liter were observed for 10-fold and 100-fold concentrated
samples, respectively. Thus, the radical quenching activity of the Fu-Py-Th model system was
slightly higher than the maximum value showed for each concentration (pyrroles at 10-fold and
furans at 10-fold), but not the sum of the model systems of furans and pyrroles. These results
suggest antagonistic effects among furans, pyrroles and thiophenes. Moreover, when the
ABTS+ quenching activity of model systems was compared to the overall antioxidant activity of a
filter coffee brew, the results clearly showed the almost insignificant contribution of these
heterocyclic volatile compounds to the antioxidant activity of coffee, even at the 100-fold
concentrated Fu-Py-Th model system, which exhibited the highest ABTS+ quenching activity,
accounting only for 3.3% of the overall activity of a filter coffee brew (Figure 2 ).
The most abundant volatile compounds in coffee are aldehydes and ketones and some of them
are also Maillard reaction products. For those reasons, we decided to test the antioxidant
0.00
0.25
0.50m
mol
Tro
lox/
L
1-methylpyrro le 2-formyl-1-methylpyrrole
1H -pyrrole
nd nd
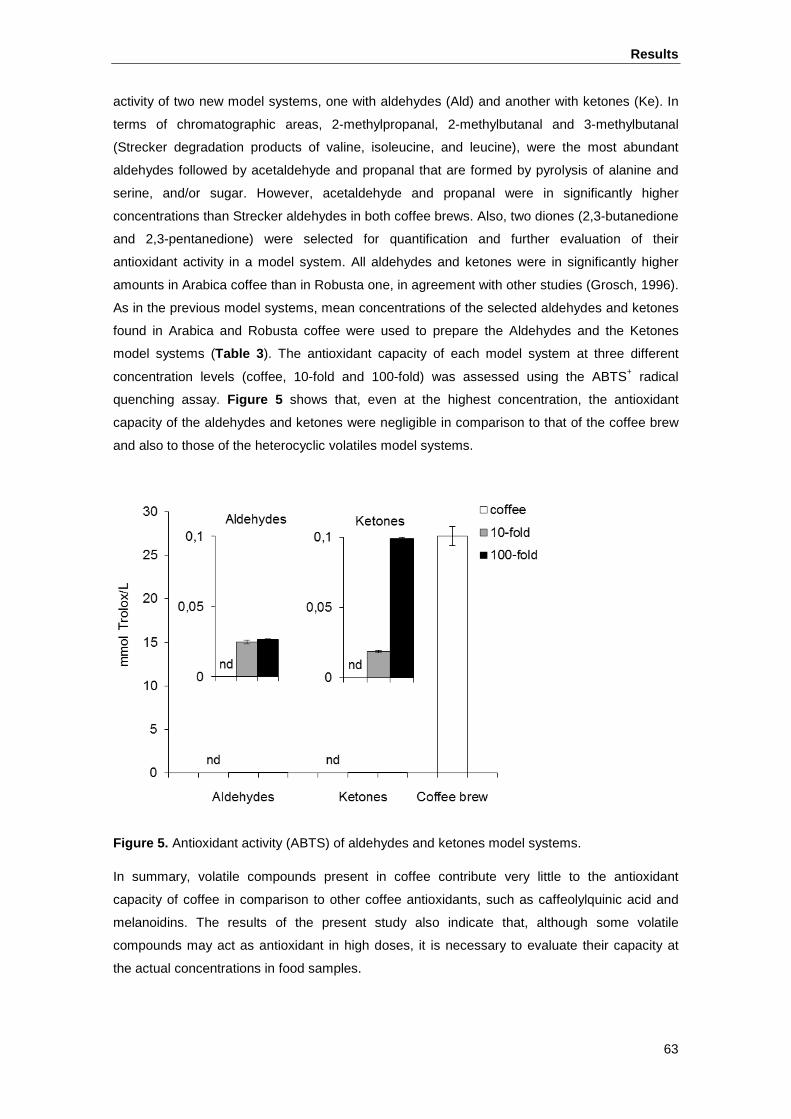
Results
63
activity of two new model systems, one with aldehydes (Ald) and another with ketones (Ke). In
terms of chromatographic areas, 2-methylpropanal, 2-methylbutanal and 3-methylbutanal
(Strecker degradation products of valine, isoleucine, and leucine), were the most abundant
aldehydes followed by acetaldehyde and propanal that are formed by pyrolysis of alanine and
serine, and/or sugar. However, acetaldehyde and propanal were in significantly higher
concentrations than Strecker aldehydes in both coffee brews. Also, two diones (2,3-butanedione
and 2,3-pentanedione) were selected for quantification and further evaluation of their
antioxidant activity in a model system. All aldehydes and ketones were in significantly higher
amounts in Arabica coffee than in Robusta one, in agreement with other studies (Grosch, 1996).
As in the previous model systems, mean concentrations of the selected aldehydes and ketones
found in Arabica and Robusta coffee were used to prepare the Aldehydes and the Ketones
model systems (Table 3 ). The antioxidant capacity of each model system at three different
concentration levels (coffee, 10-fold and 100-fold) was assessed using the ABTS+ radical
quenching assay. Figure 5 shows that, even at the highest concentration, the antioxidant
capacity of the aldehydes and ketones were negligible in comparison to that of the coffee brew
and also to those of the heterocyclic volatiles model systems.
Figure 5. Antioxidant activity (ABTS) of aldehydes and ketones model systems.
In summary, volatile compounds present in coffee contribute very little to the antioxidant
capacity of coffee in comparison to other coffee antioxidants, such as caffeolylquinic acid and
melanoidins. The results of the present study also indicate that, although some volatile
compounds may act as antioxidant in high doses, it is necessary to evaluate their capacity at
the actual concentrations in food samples.
Results
64
4 ACKNOWLEDGEMENTS
We thank the Spanish Ministerio de Economía y Competitividad (AGL 2009-12052), the
Departamento de Educación, Cultura y Deporte of the Gobierno de Navarra, and PIUNA (Plan
de Investigación de la Universidad De Navarra) for their financial support. The Departamento de
Educación, Cultura y Deporte and the Departamento de Innovación, Empresa y Empleo of the
Gobierno de Navarra are gratefully acknowledged for the grants given to I.A.L. and L.S. We also
thank the Unión Tostadora S.A. for providing the coffee samples.
Part of this paper was presented at the CoCoTea2011 International Conference, September
2011, Novara (Italy).
Results
65
5 REFERENCES
Blank, I., Sen, A., & Grosch, W. (1991). Aroma impact compounds of Arabica and Robusta coffee - Qualitative and quantitative investigation. In: Proceedings 17th International Scientific Colloquium on Coffee (pp. 117-129). San Francisco, US.
Elizalde, B., Bressa, F., & Rosa, M. (1992). Antioxidative action of Maillard reaction volatiles - Influence of Maillard solution browning level. Journal of the American Oil Chemists' Society, 69(4), 331-334.
Flament, I. (2001). Coffee flavor chemistry. Chichester, UK: John Wiley & Sons Ltd.
Fuster, M. D., Mitchell, A. E., Ochi, H., & Shibamoto, T. (2000). Antioxidative Activities of Heterocyclic Compounds Formed in Brewed Coffee. Journal of Agricultural and Food Chemistry, 48(11), 5600-5603.
Grosch, W. (1996). Why does coffee smell so good. Chemie in unserer Zeit, 30(3), 126-133.
Lopez Galilea, I., Andriot, I., De Peña, M. P., Cid, C., & Guichard, E. (2008a). How does roasting process influence the retention of coffee aroma compounds by lylophilized coffee extract? Journal of Food Science, 73(3), S165-S171.
Lopez Galilea, I., De Peña, M. P., & Cid, C. (2008b). Application of multivariate analysis to investigate potential antioxidants in conventional and torrefacto roasted coffee. European Food Research and Technology, 227(1), 141-149.
Lopez Galilea, I., Fournier, N., Cid, C., & Guichard, E. (2006). Changes in headspace volatile concentrations of coffee brews caused by the roasting process and the brewing procedure. Journal of Agricultural and Food Chemistry, 54(22), 8560-8566.
Maeztu, L., Sanz, C., Andueza, S., De Peña, M. P., Bello, J., & Cid, C. (2001). Characterization of espresso coffee aroma by static headspace GC-MS and sensory flavor profile. Journal of Agricultural and Food Chemistry, 49(11), 5437-5444.
Osada, Y., & Shibamoto, T. (2006). Antioxidative activity of volatile extracts from Maillard model systems. Food Chemistry, 98(3), 522-528.
Re, R., Pellegrini, N., Proteggente, A., Pannala, A., Yang, M., & Rice-Evans, C. (1999). Antioxidant activity applying an improved ABTS radical cation decolourization assay. Free Radical Biology and Medicine, 26(9-10), 1231-1237.
Sanz, C., Maeztu, L., Zapelena, M. J., Bello, J., & Cid, C. (2002). Profiles of volatile compounds and sensory analysis of three blends of coffee: influence of different proportions of Arabica and Robusta and influence of roasting coffee with sugar. Journal of the Science of Food and Agriculture, 82(8), 840-847.
Semmelroch, P., & Grosch, W. (1995). Analysis of roasted coffee powders and brews by gas chromatography-olfactometry of headspace samples. LWT - Food Science and Technology, 28(3), 310-313.
Severini, C., Gomes, T., De Pilli, T., Romani, S., & Massini, R. (2000). Autoxidation of packed almonds as affected by maillard reaction volatile compounds derived from roasting. Journal of Agricultural and Food Chemistry, 48(10), 4635-4640.
Tranchant, J. (1982). Manuel pratique de chromatographie en phase gazeuse. Paris, France: Masson (pp. 926-926).
Yanagimoto, K., Lee, K., Ochi, H., & Shibamoto, T. (2002). Antioxidative activity of heterocyclic compounds found in coffee volatiles produced by Maillard reaction. Journal of Agricultural and Food Chemistry, 50(19), 5480-5484.
Results
66
Yanagimoto, K., Ochi, H., Lee, K., & Shibamoto, T. (2004). Antioxidative activities of fractions obtained from brewed coffee. Journal of Agricultural and Food Chemistry, 52(3), 592-596.
Results
67
Objective 4
Evaluation of the contribution of phenolic and non- phenolic compounds to the
antioxidant capacity of coffee brews (espresso and filter).
Evaluación de la contribución de los compuestos fen ólicos y no-fenólicos a la capacidad
antioxidante de la bebida de café (expreso y de fil tro).

Results
69
1 INTRODUCTION
In the last years, due to an increasing interest in the health implications of foods, the potential
benefits of coffee consumption on health have been extensively studied. Epidemiological
evidence has shown that moderate coffee consumption is associated with a reduction in the
relative risk of development of several diseases, such as coronary heart disease, type-2
diabetes, liver and colon cancer (Van Dam & Hu, 2005; Bonita et al., 2007; Arab, 2010;
Galeone et al., 2010). These benefits might be ascribed to the brews’ antioxidant activity. The
contribution of different coffee components to the antioxidant activity of the brew is also a topic
of great interest in the literature. Chlorogenic acids (CGA), a group of non-flavonoid
(poly)phenolic compounds, comprising esters of quinic acid with hydroxycinnamic acids (caffeic,
p-coumaric, and ferulic acid), are considered to be major contributors to the antioxidant activity
of coffee brew (Svilaas et al., 2004; Vignoli et al., 2011). Moreover, coffee has been proposed
as the principal source of chlorogenic acids (Clifford, 2000; Pulido et al., 2003) in the human
diet. The amounts of chlorogenic acids present in coffee brew depend on several factors, such
as coffee variety, roasting degree, and brewing procedure (Clifford, 2000; Farah et al., 2005;
Ludwig et al., 2012). Thus, the aim of this study was to study the influence of the coffee species
(Robusta and Arabica) and the coffee making procedure (espresso and filter coffeemaker) on
the CGA composition of coffee brews and to evaluate the contribution of these compounds to
the antioxidant capacity. Furthermore, extraction behaviour of CGAs during the brewing process
was studied for espresso and filter coffeemaker.
MATERIALS AND METHODS
2.1 Chemicals. Pure reference standard of 5-Caffeoylquinic acid, di-ammonium salt of 2,2’-
azinobis-3-ethylbenzothiazoline-6-sulphonic acid (ABTS), potassium persulfate, dipotassium
hydrogen phosphate, potassium dihydrogen phosphate, 6-hydroxy-2,5,7,8-tetramethylchroman-
2-carboxylic acid (TROLOX), and formic acid were purchased from Sigma-Aldrich (Poole,
Dorset, UK). HPLC-grade methanol was obtained from Fisher Scientific (Loughborough UK).
2.2 Coffee. Medium roasted Vietnamese coffee beans (Coffea canephora var. Robusta) and
Guatemalan coffee beans (Coffea Arabica) were provided by Unión Tostadora S.A (Logroño,
Spain). The beans were ground to a powder in a Moulinex coffee grinder for 20 seconds
immediately before sample preparation. Espresso coffee, 45 mL, was prepared from 7 g of
ground roasted coffee (Robusta or Arabica) using an espresso coffee machine (model Saeco
Aroma, Italy). In addition, three fractions for espresso coffee were collected sequentially every 8
s. Filter coffee, 600mL, was prepared from 36 g of ground roasted coffee, using a filter coffee
machine (model Avantis 70 Aroma plus, Ufesa, Spain). Extraction took approx. 6 min at 90 °C.
Five fractions for filter coffee were collected sequentially every 75 s. Coffee brews and fractions
were freeze-dried using a CRYODOS Telstar (Terrassa, Spain) and stored at -18°C until
sample analysis.
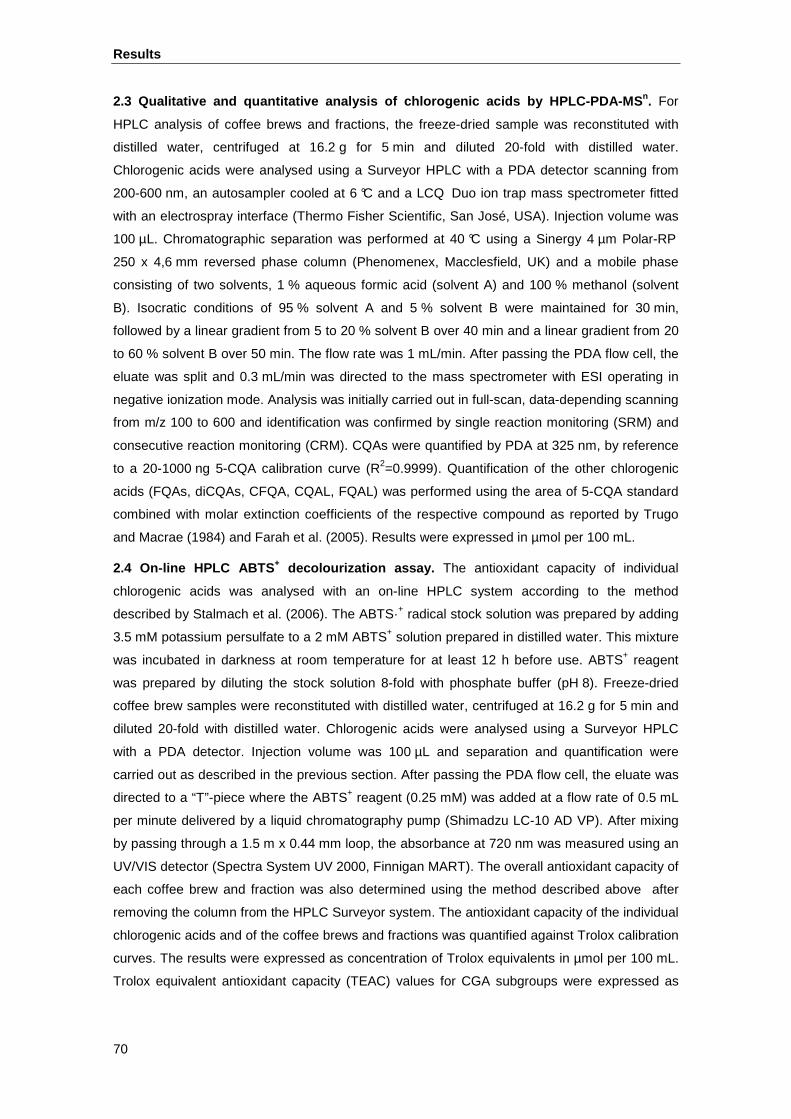
Results
70
2.3 Qualitative and quantitative analysis of chloro genic acids by HPLC-PDA-MS n. For
HPLC analysis of coffee brews and fractions, the freeze-dried sample was reconstituted with
distilled water, centrifuged at 16.2 g for 5 min and diluted 20-fold with distilled water.
Chlorogenic acids were analysed using a Surveyor HPLC with a PDA detector scanning from
200-600 nm, an autosampler cooled at 6 °C and a LCQ Duo ion trap mass spectrometer fitted
with an electrospray interface (Thermo Fisher Scientific, San José, USA). Injection volume was
100 µL. Chromatographic separation was performed at 40 °C using a Sinergy 4 µm Polar-RP
250 x 4,6 mm reversed phase column (Phenomenex, Macclesfield, UK) and a mobile phase
consisting of two solvents, 1 % aqueous formic acid (solvent A) and 100 % methanol (solvent
B). Isocratic conditions of 95 % solvent A and 5 % solvent B were maintained for 30 min,
followed by a linear gradient from 5 to 20 % solvent B over 40 min and a linear gradient from 20
to 60 % solvent B over 50 min. The flow rate was 1 mL/min. After passing the PDA flow cell, the
eluate was split and 0.3 mL/min was directed to the mass spectrometer with ESI operating in
negative ionization mode. Analysis was initially carried out in full-scan, data-depending scanning
from m/z 100 to 600 and identification was confirmed by single reaction monitoring (SRM) and
consecutive reaction monitoring (CRM). CQAs were quantified by PDA at 325 nm, by reference
to a 20-1000 ng 5-CQA calibration curve (R2=0.9999). Quantification of the other chlorogenic
acids (FQAs, diCQAs, CFQA, CQAL, FQAL) was performed using the area of 5-CQA standard
combined with molar extinction coefficients of the respective compound as reported by Trugo
and Macrae (1984) and Farah et al. (2005). Results were expressed in µmol per 100 mL.
2.4 On-line HPLC ABTS + decolourization assay. The antioxidant capacity of individual
chlorogenic acids was analysed with an on-line HPLC system according to the method
described by Stalmach et al. (2006). The ABTS·+ radical stock solution was prepared by adding
3.5 mM potassium persulfate to a 2 mM ABTS+ solution prepared in distilled water. This mixture
was incubated in darkness at room temperature for at least 12 h before use. ABTS+ reagent
was prepared by diluting the stock solution 8-fold with phosphate buffer (pH 8). Freeze-dried
coffee brew samples were reconstituted with distilled water, centrifuged at 16.2 g for 5 min and
diluted 20-fold with distilled water. Chlorogenic acids were analysed using a Surveyor HPLC
with a PDA detector. Injection volume was 100 µL and separation and quantification were
carried out as described in the previous section. After passing the PDA flow cell, the eluate was
directed to a “T”-piece where the ABTS+ reagent (0.25 mM) was added at a flow rate of 0.5 mL
per minute delivered by a liquid chromatography pump (Shimadzu LC-10 AD VP). After mixing
by passing through a 1.5 m x 0.44 mm loop, the absorbance at 720 nm was measured using an
UV/VIS detector (Spectra System UV 2000, Finnigan MART). The overall antioxidant capacity of
each coffee brew and fraction was also determined using the method described above after
removing the column from the HPLC Surveyor system. The antioxidant capacity of the individual
chlorogenic acids and of the coffee brews and fractions was quantified against Trolox calibration
curves. The results were expressed as concentration of Trolox equivalents in µmol per 100 mL.
Trolox equivalent antioxidant capacity (TEAC) values for CGA subgroups were expressed as
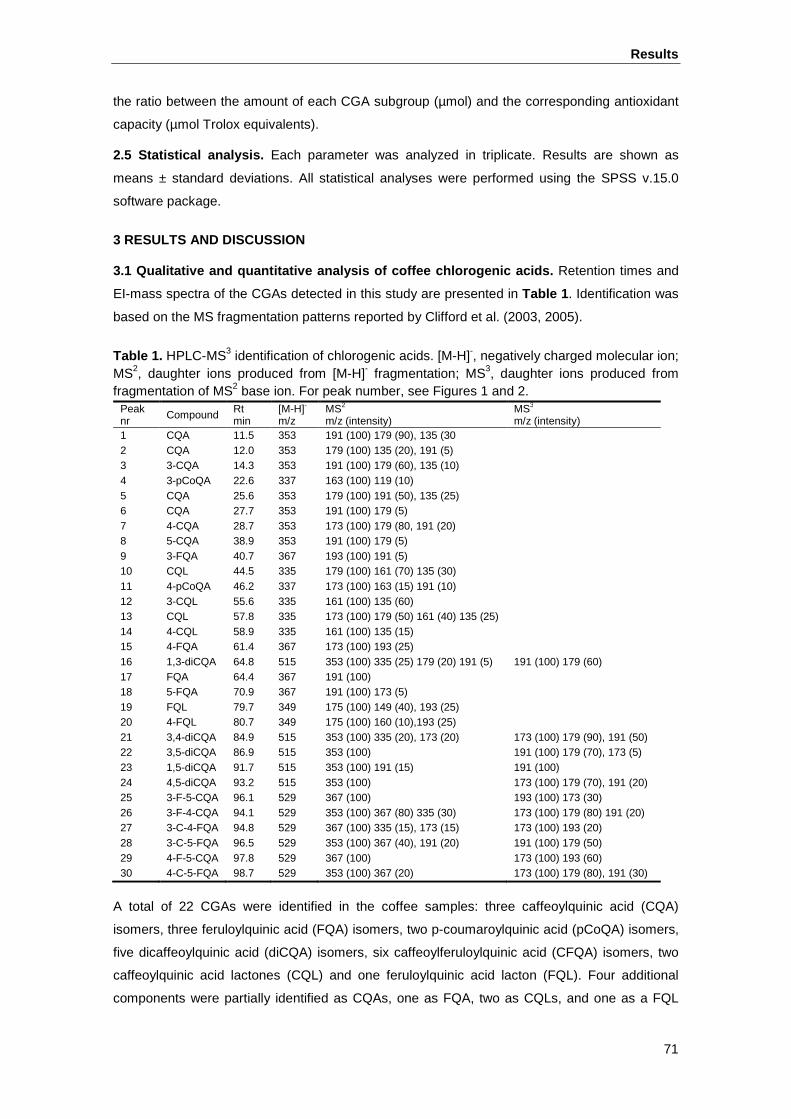
Results
71
the ratio between the amount of each CGA subgroup (µmol) and the corresponding antioxidant
capacity (µmol Trolox equivalents).
2.5 Statistical analysis. Each parameter was analyzed in triplicate. Results are shown as
means ± standard deviations. All statistical analyses were performed using the SPSS v.15.0
software package.
3 RESULTS AND DISCUSSION
3.1 Qualitative and quantitative analysis of coffee chlorogenic acids. Retention times and
EI-mass spectra of the CGAs detected in this study are presented in Table 1 . Identification was
based on the MS fragmentation patterns reported by Clifford et al. (2003, 2005).
Table 1. HPLC-MS3 identification of chlorogenic acids. [M-H]-, negatively charged molecular ion; MS2, daughter ions produced from [M-H]- fragmentation; MS3, daughter ions produced from fragmentation of MS2 base ion. For peak number, see Figures 1 and 2.
Peak nr Compound Rt
min [M-H]-
m/z MS2 m/z (intensity)
MS3 m/z (intensity)
1 CQA 11.5 353 191 (100) 179 (90), 135 (30 2 CQA 12.0 353 179 (100) 135 (20), 191 (5) 3 3-CQA 14.3 353 191 (100) 179 (60), 135 (10) 4 3-pCoQA 22.6 337 163 (100) 119 (10) 5 CQA 25.6 353 179 (100) 191 (50), 135 (25) 6 CQA 27.7 353 191 (100) 179 (5) 7 4-CQA 28.7 353 173 (100) 179 (80, 191 (20) 8 5-CQA 38.9 353 191 (100) 179 (5) 9 3-FQA 40.7 367 193 (100) 191 (5) 10 CQL 44.5 335 179 (100) 161 (70) 135 (30) 11 4-pCoQA 46.2 337 173 (100) 163 (15) 191 (10) 12 3-CQL 55.6 335 161 (100) 135 (60) 13 CQL 57.8 335 173 (100) 179 (50) 161 (40) 135 (25) 14 4-CQL 58.9 335 161 (100) 135 (15) 15 4-FQA 61.4 367 173 (100) 193 (25) 16 1,3-diCQA 64.8 515 353 (100) 335 (25) 179 (20) 191 (5) 191 (100) 179 (60) 17 FQA 64.4 367 191 (100) 18 5-FQA 70.9 367 191 (100) 173 (5) 19 FQL 79.7 349 175 (100) 149 (40), 193 (25) 20 4-FQL 80.7 349 175 (100) 160 (10),193 (25) 21 3,4-diCQA 84.9 515 353 (100) 335 (20), 173 (20) 173 (100) 179 (90), 191 (50) 22 3,5-diCQA 86.9 515 353 (100) 191 (100) 179 (70), 173 (5) 23 1,5-diCQA 91.7 515 353 (100) 191 (15) 191 (100) 24 4,5-diCQA 93.2 515 353 (100) 173 (100) 179 (70), 191 (20) 25 3-F-5-CQA 96.1 529 367 (100) 193 (100) 173 (30) 26 3-F-4-CQA 94.1 529 353 (100) 367 (80) 335 (30) 173 (100) 179 (80) 191 (20) 27 3-C-4-FQA 94.8 529 367 (100) 335 (15), 173 (15) 173 (100) 193 (20) 28 3-C-5-FQA 96.5 529 353 (100) 367 (40), 191 (20) 191 (100) 179 (50) 29 4-F-5-CQA 97.8 529 367 (100) 173 (100) 193 (60) 30 4-C-5-FQA 98.7 529 353 (100) 367 (20) 173 (100) 179 (80), 191 (30)
A total of 22 CGAs were identified in the coffee samples: three caffeoylquinic acid (CQA)
isomers, three feruloylquinic acid (FQA) isomers, two p-coumaroylquinic acid (pCoQA) isomers,
five dicaffeoylquinic acid (diCQA) isomers, six caffeoylferuloylquinic acid (CFQA) isomers, two
caffeoylquinic acid lactones (CQL) and one feruloylquinic acid lacton (FQL). Four additional
components were partially identified as CQAs, one as FQA, two as CQLs, and one as a FQL
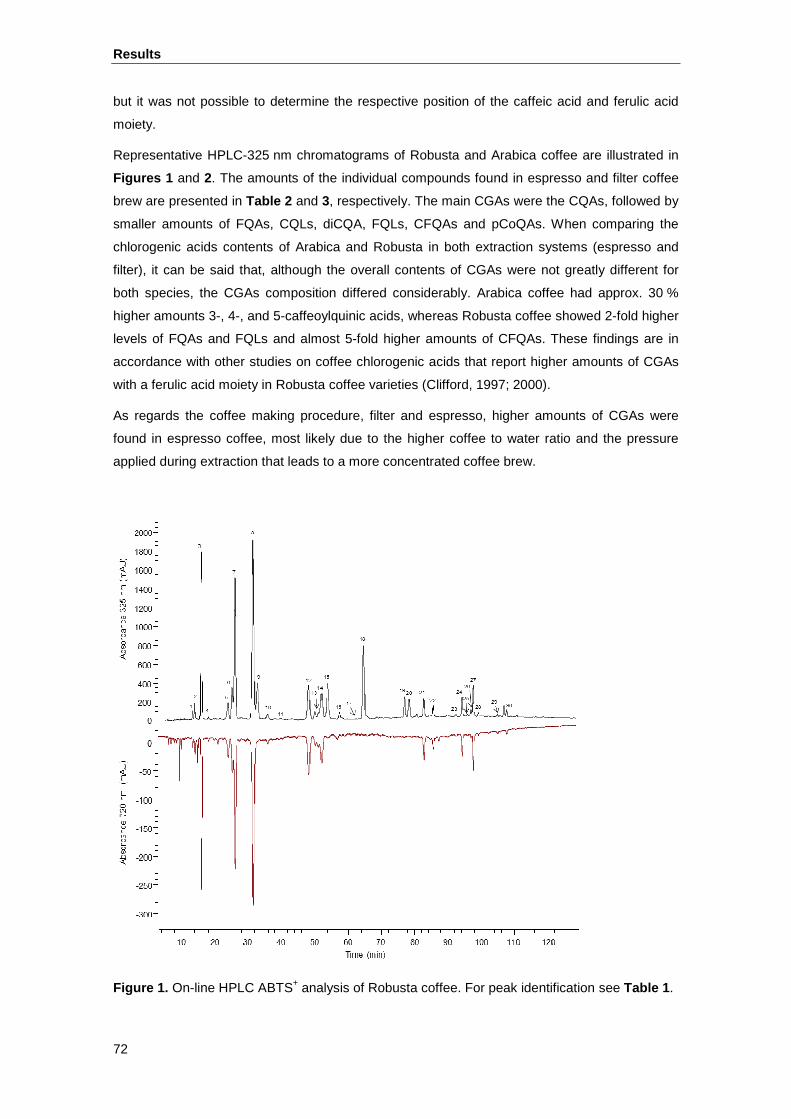
Results
72
but it was not possible to determine the respective position of the caffeic acid and ferulic acid
moiety.
Representative HPLC-325 nm chromatograms of Robusta and Arabica coffee are illustrated in
Figures 1 and 2. The amounts of the individual compounds found in espresso and filter coffee
brew are presented in Table 2 and 3, respectively. The main CGAs were the CQAs, followed by
smaller amounts of FQAs, CQLs, diCQA, FQLs, CFQAs and pCoQAs. When comparing the
chlorogenic acids contents of Arabica and Robusta in both extraction systems (espresso and
filter), it can be said that, although the overall contents of CGAs were not greatly different for
both species, the CGAs composition differed considerably. Arabica coffee had approx. 30 %
higher amounts 3-, 4-, and 5-caffeoylquinic acids, whereas Robusta coffee showed 2-fold higher
levels of FQAs and FQLs and almost 5-fold higher amounts of CFQAs. These findings are in
accordance with other studies on coffee chlorogenic acids that report higher amounts of CGAs
with a ferulic acid moiety in Robusta coffee varieties (Clifford, 1997; 2000).
As regards the coffee making procedure, filter and espresso, higher amounts of CGAs were
found in espresso coffee, most likely due to the higher coffee to water ratio and the pressure
applied during extraction that leads to a more concentrated coffee brew.
Figure 1. On-line HPLC ABTS+ analysis of Robusta coffee. For peak identification see Table 1 .
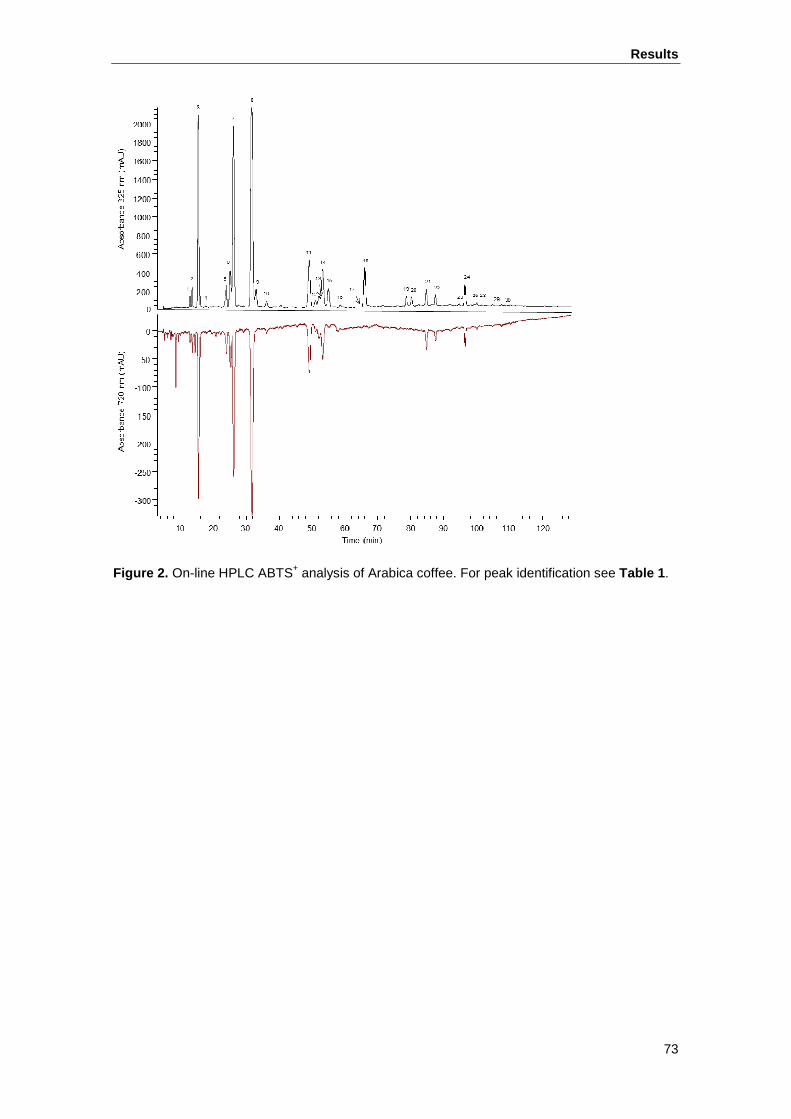
Results
73
Figure 2. On-line HPLC ABTS+ analysis of Arabica coffee. For peak identification see Table 1 .
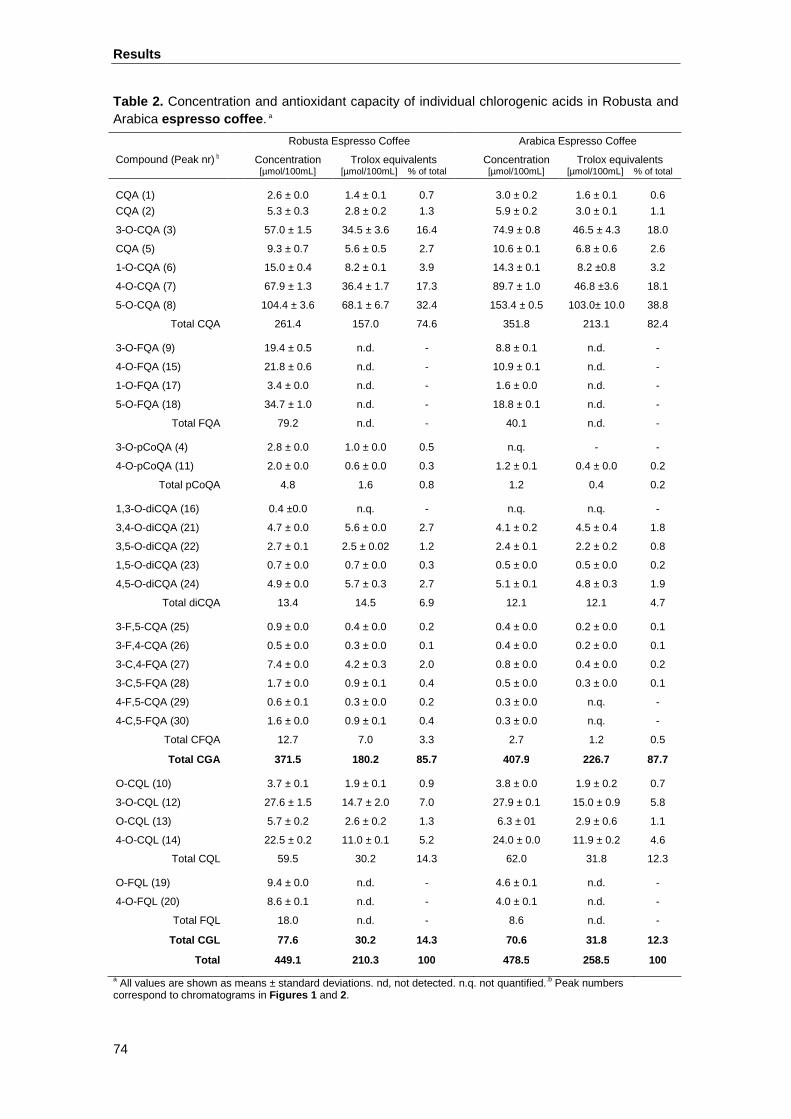
Results
74
Table 2. Concentration and antioxidant capacity of individual chlorogenic acids in Robusta and Arabica espresso coffee . a
a All values are shown as means ± standard deviations. nd, not detected. n.q. not quantified..b Peak numbers correspond to chromatograms in Figures 1 and 2.
Robusta Espresso Coffee Arabica Espresso Coffee
Compound (Peak nr) b Concentration [µmol/100mL]
Trolox equivalents [µmol/100mL] % of total
Concentration [µmol/100mL]
Trolox equivalents [µmol/100mL] % of total
CQA (1) 2.6 ± 0.0 1.4 ± 0.1 0.7 3.0 ± 0.2 1.6 ± 0 .1 0.6
CQA (2) 5.3 ± 0.3 2.8 ± 0.2 1.3 5.9 ± 0.2 3.0 ± 0 .1 1.1
3-O-CQA (3) 57.0 ± 1.5 34.5 ± 3.6 16.4 74.9 ± 0.8 46.5 ± 4.3 18.0
CQA (5) 9.3 ± 0.7 5.6 ± 0.5 2.7 10.6 ± 0.1 6.8 ± 0.6 2.6
1-O-CQA (6) 15.0 ± 0.4 8.2 ± 0.1 3.9 14.3 ± 0.1 8.2 ±0.8 3.2
4-O-CQA (7) 67.9 ± 1.3 36.4 ± 1.7 17.3 89.7 ± 1.0 46.8 ±3.6 18.1
5-O-CQA (8) 104.4 ± 3.6 68.1 ± 6.7 32.4 153.4 ± 0.5 103.0± 10.0 38.8
Total CQA 261.4 157.0 74.6 351.8 213.1 82.4
3-O-FQA (9) 19.4 ± 0.5 n.d. - 8.8 ± 0.1 n.d. -
4-O-FQA (15) 21.8 ± 0.6 n.d. - 10.9 ± 0.1 n.d. -
1-O-FQA (17) 3.4 ± 0.0 n.d. - 1.6 ± 0.0 n.d. -
5-O-FQA (18) 34.7 ± 1.0 n.d. - 18.8 ± 0.1 n.d. -
Total FQA 79.2 n.d. - 40.1 n.d. -
3-O-pCoQA (4) 2.8 ± 0.0 1.0 ± 0.0 0.5 n.q. - -
4-O-pCoQA (11) 2.0 ± 0.0 0.6 ± 0.0 0.3 1.2 ± 0.1 0.4 ± 0.0 0.2
Total pCoQA 4.8 1.6 0.8 1.2 0.4 0.2
1,3-O-diCQA (16) 0.4 ±0.0 n.q. - n.q. n.q. -
3,4-O-diCQA (21) 4.7 ± 0.0 5.6 ± 0.0 2.7 4.1 ± 0.2 4.5 ± 0.4 1.8
3,5-O-diCQA (22) 2.7 ± 0.1 2.5 ± 0.02 1.2 2.4 ± 0.1 2.2 ± 0.2 0.8
1,5-O-diCQA (23) 0.7 ± 0.0 0.7 ± 0.0 0.3 0.5 ± 0.0 0.5 ± 0.0 0.2
4,5-O-diCQA (24) 4.9 ± 0.0 5.7 ± 0.3 2.7 5.1 ± 0.1 4.8 ± 0.3 1.9
Total diCQA 13.4 14.5 6.9 12.1 12.1 4.7
3-F,5-CQA (25) 0.9 ± 0.0 0.4 ± 0.0 0.2 0.4 ± 0.0 0.2 ± 0.0 0.1
3-F,4-CQA (26) 0.5 ± 0.0 0.3 ± 0.0 0.1 0.4 ± 0.0 0.2 ± 0.0 0.1
3-C,4-FQA (27) 7.4 ± 0.0 4.2 ± 0.3 2.0 0.8 ± 0.0 0.4 ± 0.0 0.2
3-C,5-FQA (28) 1.7 ± 0.0 0.9 ± 0.1 0.4 0.5 ± 0.0 0.3 ± 0.0 0.1
4-F,5-CQA (29) 0.6 ± 0.1 0.3 ± 0.0 0.2 0.3 ± 0.0 n.q. -
4-C,5-FQA (30) 1.6 ± 0.0 0.9 ± 0.1 0.4 0.3 ± 0.0 n.q. -
Total CFQA 12.7 7.0 3.3 2.7 1.2 0.5
Total CGA 371.5 180.2 85.7 407.9 226.7 87.7
O-CQL (10) 3.7 ± 0.1 1.9 ± 0.1 0.9 3.8 ± 0.0 1.9 ± 0.2 0.7
3-O-CQL (12) 27.6 ± 1.5 14.7 ± 2.0 7.0 27.9 ± 0.1 15.0 ± 0.9 5.8
O-CQL (13) 5.7 ± 0.2 2.6 ± 0.2 1.3 6.3 ± 01 2.9 ± 0.6 1.1
4-O-CQL (14) 22.5 ± 0.2 11.0 ± 0.1 5.2 24.0 ± 0.0 11.9 ± 0.2 4.6
Total CQL 59.5 30.2 14.3 62.0 31.8 12.3
O-FQL (19) 9.4 ± 0.0 n.d. - 4.6 ± 0.1 n.d. -
4-O-FQL (20) 8.6 ± 0.1 n.d. - 4.0 ± 0.1 n.d. -
Total FQL 18.0 n.d. - 8.6 n.d. -
Total CGL 77.6 30.2 14.3 70.6 31.8 12.3
Total 449.1 210.3 100 478.5 258.5 100
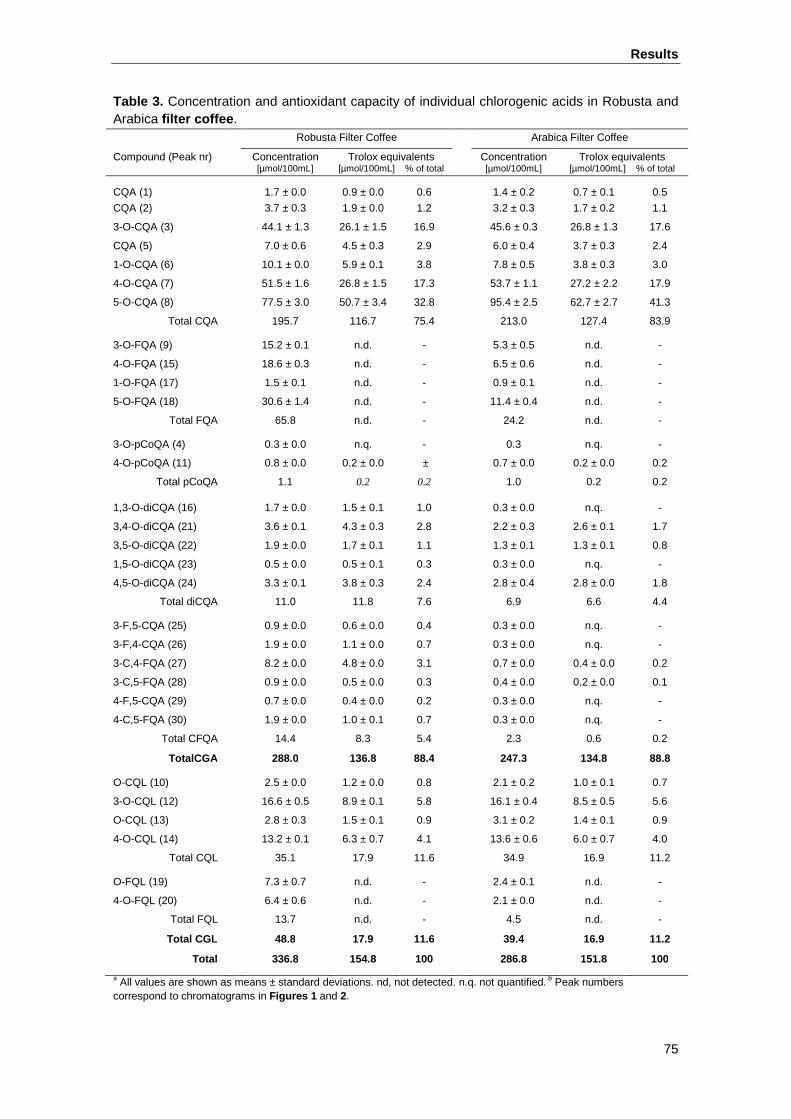
Results
75
Table 3. Concentration and antioxidant capacity of individual chlorogenic acids in Robusta and Arabica filter coffee . Robusta Filter Coffee Arabica Filter Coffee
Compound (Peak nr) Concentration [µmol/100mL]
Trolox equivalents [µmol/100mL] % of total
Concentration [µmol/100mL]
Trolox equivalents [µmol/100mL] % of total
CQA (1) 1.7 ± 0.0 0.9 ± 0.0 0.6 1.4 ± 0.2 0.7 ± 0 .1 0.5
CQA (2) 3.7 ± 0.3 1.9 ± 0.0 1.2 3.2 ± 0.3 1.7 ± 0 .2 1.1
3-O-CQA (3) 44.1 ± 1.3 26.1 ± 1.5 16.9 45.6 ± 0.3 26.8 ± 1.3 17.6
CQA (5) 7.0 ± 0.6 4.5 ± 0.3 2.9 6.0 ± 0.4 3.7 ± 0 .3 2.4
1-O-CQA (6) 10.1 ± 0.0 5.9 ± 0.1 3.8 7.8 ± 0.5 3.8 ± 0.3 3.0
4-O-CQA (7) 51.5 ± 1.6 26.8 ± 1.5 17.3 53.7 ± 1.1 27.2 ± 2.2 17.9
5-O-CQA (8) 77.5 ± 3.0 50.7 ± 3.4 32.8 95.4 ± 2.5 62.7 ± 2.7 41.3
Total CQA 195.7 116.7 75.4 213.0 127.4 83.9
3-O-FQA (9) 15.2 ± 0.1 n.d. - 5.3 ± 0.5 n.d. -
4-O-FQA (15) 18.6 ± 0.3 n.d. - 6.5 ± 0.6 n.d. -
1-O-FQA (17) 1.5 ± 0.1 n.d. - 0.9 ± 0.1 n.d. -
5-O-FQA (18) 30.6 ± 1.4 n.d. - 11.4 ± 0.4 n.d. -
Total FQA 65.8 n.d. - 24.2 n.d. -
3-O-pCoQA (4) 0.3 ± 0.0 n.q. - 0.3 n.q. -
4-O-pCoQA (11) 0.8 ± 0.0 0.2 ± 0.0 ± 0.7 ± 0.0 0.2 ± 0.0 0.2
Total pCoQA 1.1 0.2 0.2 1.0 0.2 0.2
1,3-O-diCQA (16) 1.7 ± 0.0 1.5 ± 0.1 1.0 0.3 ± 0.0 n.q. -
3,4-O-diCQA (21) 3.6 ± 0.1 4.3 ± 0.3 2.8 2.2 ± 0.3 2.6 ± 0.1 1.7
3,5-O-diCQA (22) 1.9 ± 0.0 1.7 ± 0.1 1.1 1.3 ± 0.1 1.3 ± 0.1 0.8
1,5-O-diCQA (23) 0.5 ± 0.0 0.5 ± 0.1 0.3 0.3 ± 0.0 n.q. -
4,5-O-diCQA (24) 3.3 ± 0.1 3.8 ± 0.3 2.4 2.8 ± 0.4 2.8 ± 0.0 1.8
Total diCQA 11.0 11.8 7.6 6.9 6.6 4.4
3-F,5-CQA (25) 0.9 ± 0.0 0.6 ± 0.0 0.4 0.3 ± 0.0 n.q. -
3-F,4-CQA (26) 1.9 ± 0.0 1.1 ± 0.0 0.7 0.3 ± 0.0 n.q. -
3-C,4-FQA (27) 8.2 ± 0.0 4.8 ± 0.0 3.1 0.7 ± 0.0 0.4 ± 0.0 0.2
3-C,5-FQA (28) 0.9 ± 0.0 0.5 ± 0.0 0.3 0.4 ± 0.0 0.2 ± 0.0 0.1
4-F,5-CQA (29) 0.7 ± 0.0 0.4 ± 0.0 0.2 0.3 ± 0.0 n.q. -
4-C,5-FQA (30) 1.9 ± 0.0 1.0 ± 0.1 0.7 0.3 ± 0.0 n.q. -
Total CFQA 14.4 8.3 5.4 2.3 0.6 0.2
TotalCGA 288.0 136.8 88.4 247.3 134.8 88.8
O-CQL (10) 2.5 ± 0.0 1.2 ± 0.0 0.8 2.1 ± 0.2 1.0 ± 0.1 0.7
3-O-CQL (12) 16.6 ± 0.5 8.9 ± 0.1 5.8 16.1 ± 0.4 8.5 ± 0.5 5.6
O-CQL (13) 2.8 ± 0.3 1.5 ± 0.1 0.9 3.1 ± 0.2 1.4 ± 0.1 0.9
4-O-CQL (14) 13.2 ± 0.1 6.3 ± 0.7 4.1 13.6 ± 0.6 6.0 ± 0.7 4.0
Total CQL 35.1 17.9 11.6 34.9 16.9 11.2
O-FQL (19) 7.3 ± 0.7 n.d. - 2.4 ± 0.1 n.d. -
4-O-FQL (20) 6.4 ± 0.6 n.d. - 2.1 ± 0.0 n.d. -
Total FQL 13.7 n.d. - 4.5 n.d. -
Total CGL 48.8 17.9 11.6 39.4 16.9 11.2
Total 336.8 154.8 100 286.8 151.8 100
a All values are shown as means ± standard deviations. nd, not detected. n.q. not quantified..b Peak numbers correspond to chromatograms in Figures 1 and 2.
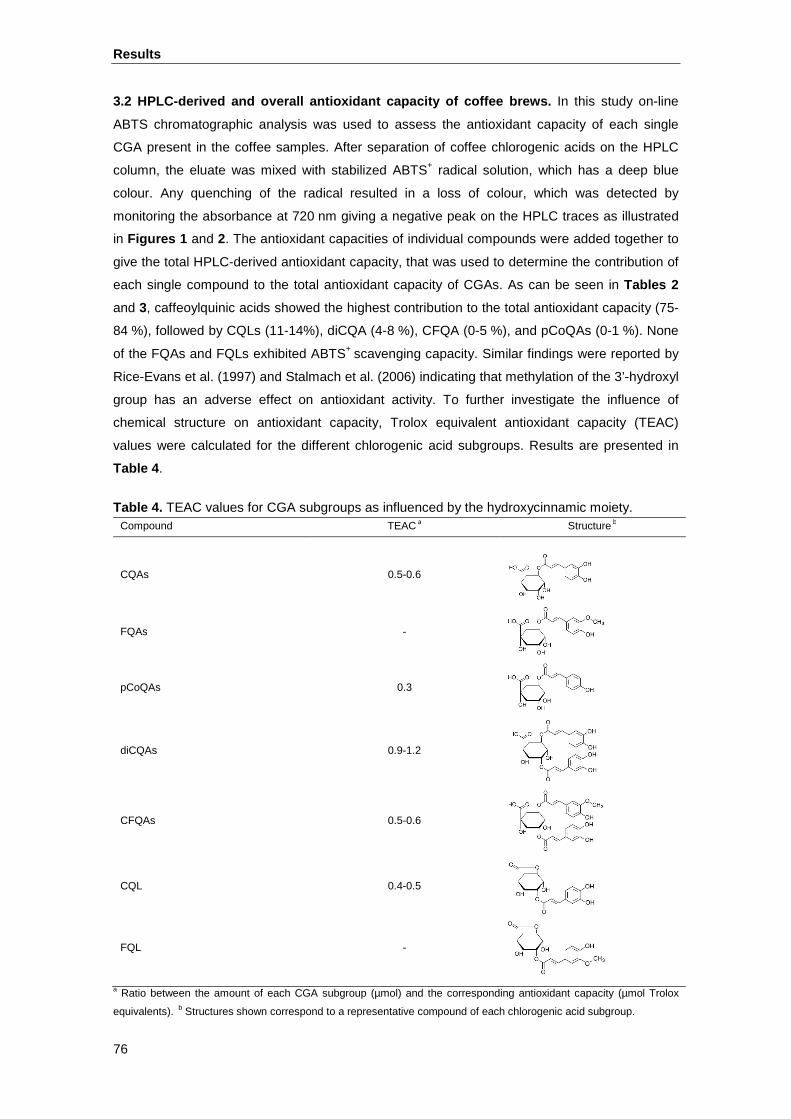
Results
76
3.2 HPLC-derived and overall antioxidant capacity o f coffee brews. In this study on-line
ABTS chromatographic analysis was used to assess the antioxidant capacity of each single
CGA present in the coffee samples. After separation of coffee chlorogenic acids on the HPLC
column, the eluate was mixed with stabilized ABTS+ radical solution, which has a deep blue
colour. Any quenching of the radical resulted in a loss of colour, which was detected by
monitoring the absorbance at 720 nm giving a negative peak on the HPLC traces as illustrated
in Figures 1 and 2. The antioxidant capacities of individual compounds were added together to
give the total HPLC-derived antioxidant capacity, that was used to determine the contribution of
each single compound to the total antioxidant capacity of CGAs. As can be seen in Tables 2
and 3, caffeoylquinic acids showed the highest contribution to the total antioxidant capacity (75-
84 %), followed by CQLs (11-14%), diCQA (4-8 %), CFQA (0-5 %), and pCoQAs (0-1 %). None
of the FQAs and FQLs exhibited ABTS+ scavenging capacity. Similar findings were reported by
Rice-Evans et al. (1997) and Stalmach et al. (2006) indicating that methylation of the 3’-hydroxyl
group has an adverse effect on antioxidant activity. To further investigate the influence of
chemical structure on antioxidant capacity, Trolox equivalent antioxidant capacity (TEAC)
values were calculated for the different chlorogenic acid subgroups. Results are presented in
Table 4 .
Table 4. TEAC values for CGA subgroups as influenced by the hydroxycinnamic moiety. Compound TEAC a Structure b
CQAs 0.5-0.6
FQAs -
pCoQAs 0.3
diCQAs 0.9-1.2
CFQAs 0.5-0.6
CQL 0.4-0.5
FQL -
a Ratio between the amount of each CGA subgroup (µmol) and the corresponding antioxidant capacity (µmol Trolox
equivalents). b Structures shown correspond to a representative compound of each chlorogenic acid subgroup.
Results
77
The antioxidant capacity exhibited by the different chlorogenic acid subgroups depends on the
number of hydroxyl groups in the molecule (Nardini et al., 1995; Rice-Evans et al., 1996). This
was also observed in the current study. Dicaffeoylquinic acids exhibited the highest antioxidant
capacity because of the presence of two caffeic acid moieties, each one with two hydroxyl
groups. CQAs, with only one caffeic acid group exhibited half the antioxidant capacity of
diCQAs. The same values were observed for CFQAs with one caffeic and one ferulic acid
moiety, most likely due to the absence of antioxidant capacity of ferulic acid groups as
discussed above. CQLs, typical products of coffee roasting (Farah et al., 2005) showed slightly
lower TEAC values than their precursors, the CQA. This indicates that lactonization seems to
have a reducing effect on the ABTS+ scavenging capacity of the compound. Chlorogenic acids
with p-coumaroylquinic acid moieties exhibited the lowest TEAC values. The presence of only
one hydroxyl group in the hydroxycinnamic acid moiety of these chlorogenic acids resulted in a
reduction of the antioxidant capacity by 50% compared to CQAs. These results corroborate that
the antioxidant capacity of chlorogenic acids depends primarily on the number of hydroxyl
groups but is also influenced by other structural changes like methylation or lactonization.
Regarding the total antioxidant capacities of CGAs in the two coffee varieties analysed in this
study (Table 2 and 3), the higher values obtained for Arabica coffee could be explained by
differences in the chlorogenic acid composition. As described above, Arabica coffee showed
higher levels of CQAs which possess high TEAC values, whereas Robusta coffee was rich in
FQAs and FQL, which do not exhibit any ABTS+ scavenging activity at all.
To assess the contribution of the CGAs to the overall antioxidant capacity of coffee, samples
were analysed using the on-line ABTS method described above but after removing the column
from the HPLC system. Data obtained allowed us to determine the antioxidant capacity of all
coffee components including those that did not elute from the chromatographic column, such as
high molecular weight Maillard reaction products. Results are shown in Table 5 .
The comparison of the overall antioxidant capacity with the HPLC-derived antioxidant capacity
revealed that only 7-16 % of the antioxidant capacity of coffee brews corresponds to the
chlorogenic acids (Table 4 ). These values were lower for espresso coffee brews (7-11 %) than
those for filter coffee brews (12-16 %). Moreover, Robusta coffee exhibited lower values than
Arabica coffee when the same extraction procedure (espresso or filter coffeemaker) was used.
The results obtained in the current study indicate that the remaining 84-93% of the overall
antioxidant capacity must be ascribed to other compounds different to chlorogenic acids that did
not elute from the HPLC column. These compounds were extracted in higher amounts by the
espresso coffeemaker and were present in higher amounts in Robusta coffee. As mentioned
previously, those compounds that did not elute from the HPLC column might correspond to the
high molecular weight Maillard reaction products (MRPs) resulting from the coffee roasting
process. MRPS exhibit antioxidant capacity and depending on the roasting degree may
contribution to higher degree to the overall antioxidant capacity of coffee than chlorogenic acids
(Smrke et al., 2013).
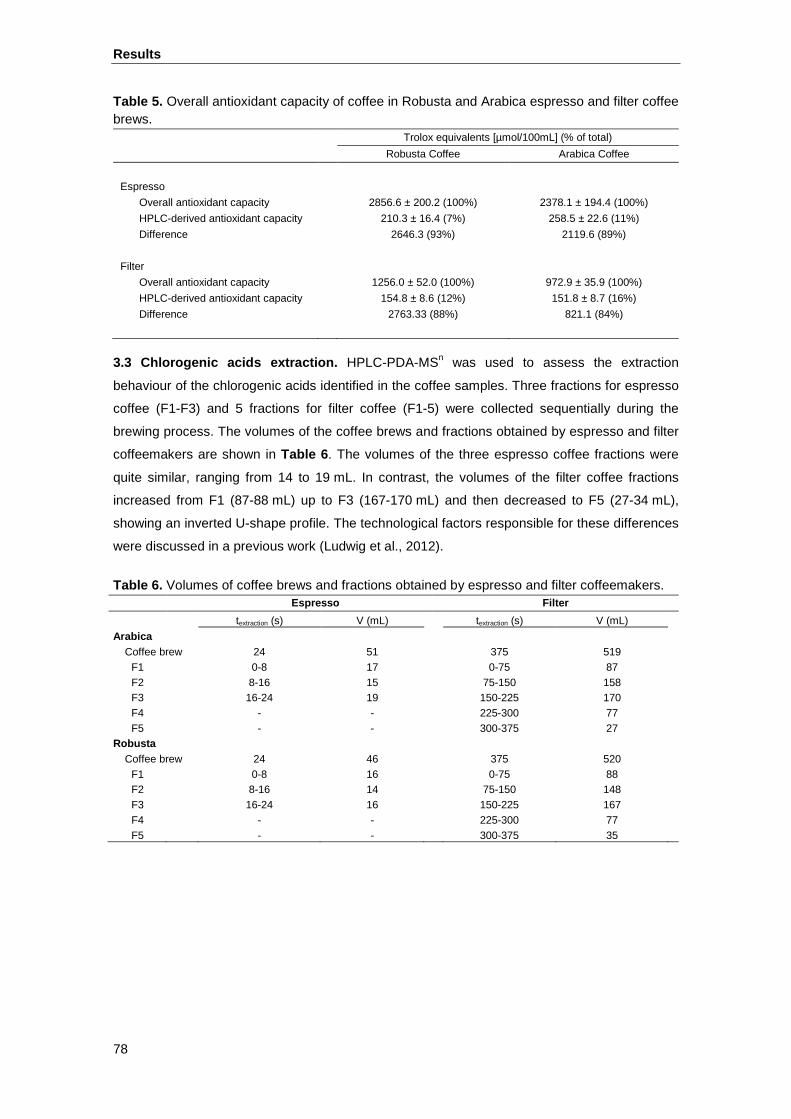
Results
78
Table 5. Overall antioxidant capacity of coffee in Robusta and Arabica espresso and filter coffee brews.
Trolox equivalents [µmol/100mL] (% of total)
Robusta Coffee Arabica Coffee
Espresso
Overall antioxidant capacity 2856.6 ± 200.2 (100%) 2378.1 ± 194.4 (100%)
HPLC-derived antioxidant capacity 210.3 ± 16.4 (7%) 258.5 ± 22.6 (11%)
Difference 2646.3 (93%) 2119.6 (89%)
Filter
Overall antioxidant capacity 1256.0 ± 52.0 (100%) 972.9 ± 35.9 (100%)
HPLC-derived antioxidant capacity 154.8 ± 8.6 (12%) 151.8 ± 8.7 (16%)
Difference 2763.33 (88%) 821.1 (84%)
3.3 Chlorogenic acids extraction. HPLC-PDA-MSn was used to assess the extraction
behaviour of the chlorogenic acids identified in the coffee samples. Three fractions for espresso
coffee (F1-F3) and 5 fractions for filter coffee (F1-5) were collected sequentially during the
brewing process. The volumes of the coffee brews and fractions obtained by espresso and filter
coffeemakers are shown in Table 6 . The volumes of the three espresso coffee fractions were
quite similar, ranging from 14 to 19 mL. In contrast, the volumes of the filter coffee fractions
increased from F1 (87-88 mL) up to F3 (167-170 mL) and then decreased to F5 (27-34 mL),
showing an inverted U-shape profile. The technological factors responsible for these differences
were discussed in a previous work (Ludwig et al., 2012).
Table 6. Volumes of coffee brews and fractions obtained by espresso and filter coffeemakers. Espresso Filter
textraction (s) V (mL) textraction (s) V (mL) Arabica
Coffee brew 24 51 375 519 F1 0-8 17 0-75 87 F2 8-16 15 75-150 158 F3 16-24 19 150-225 170 F4 - - 225-300 77 F5 - - 300-375 27
Robusta Coffee brew 24 46 375 520
F1 0-8 16 0-75 88 F2 8-16 14 75-150 148 F3 16-24 16 150-225 167 F4 - - 225-300 77 F5 - - 300-375 35
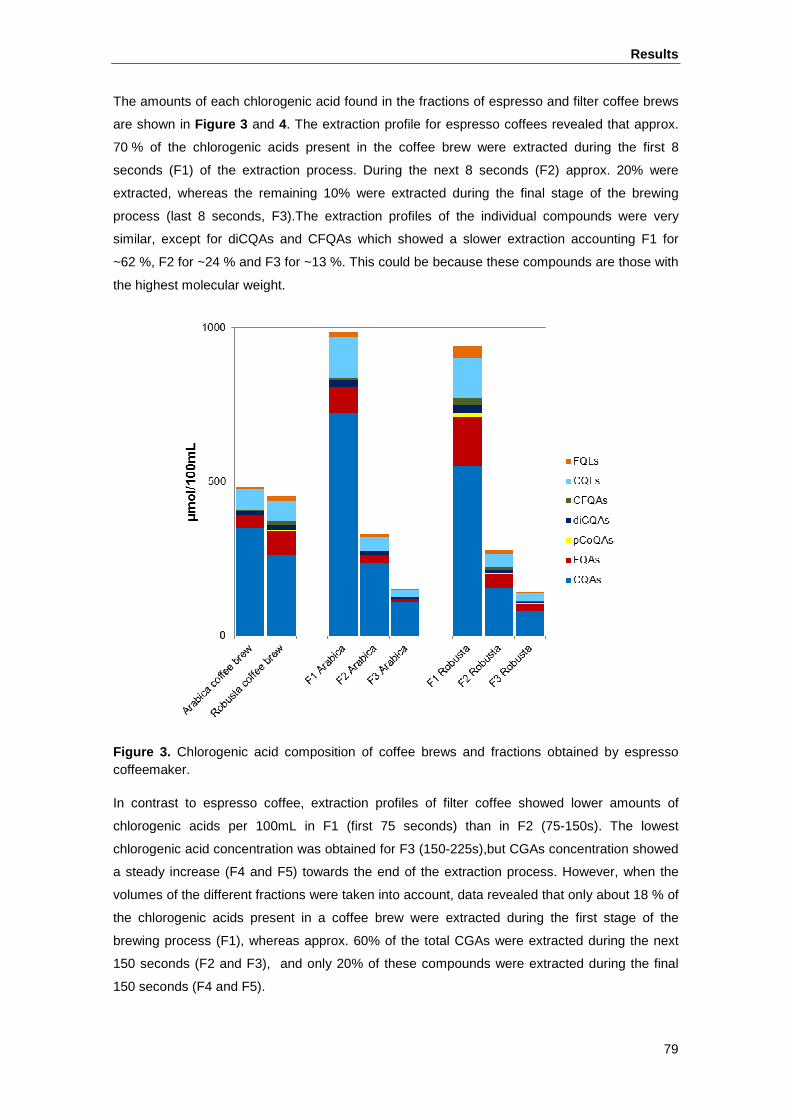
Results
79
The amounts of each chlorogenic acid found in the fractions of espresso and filter coffee brews
are shown in Figure 3 and 4. The extraction profile for espresso coffees revealed that approx.
70 % of the chlorogenic acids present in the coffee brew were extracted during the first 8
seconds (F1) of the extraction process. During the next 8 seconds (F2) approx. 20% were
extracted, whereas the remaining 10% were extracted during the final stage of the brewing
process (last 8 seconds, F3).The extraction profiles of the individual compounds were very
similar, except for diCQAs and CFQAs which showed a slower extraction accounting F1 for
~62 %, F2 for ~24 % and F3 for ~13 %. This could be because these compounds are those with
the highest molecular weight.
Figure 3. Chlorogenic acid composition of coffee brews and fractions obtained by espresso coffeemaker.
In contrast to espresso coffee, extraction profiles of filter coffee showed lower amounts of
chlorogenic acids per 100mL in F1 (first 75 seconds) than in F2 (75-150s). The lowest
chlorogenic acid concentration was obtained for F3 (150-225s),but CGAs concentration showed
a steady increase (F4 and F5) towards the end of the extraction process. However, when the
volumes of the different fractions were taken into account, data revealed that only about 18 % of
the chlorogenic acids present in a coffee brew were extracted during the first stage of the
brewing process (F1), whereas approx. 60% of the total CGAs were extracted during the next
150 seconds (F2 and F3), and only 20% of these compounds were extracted during the final
150 seconds (F4 and F5).
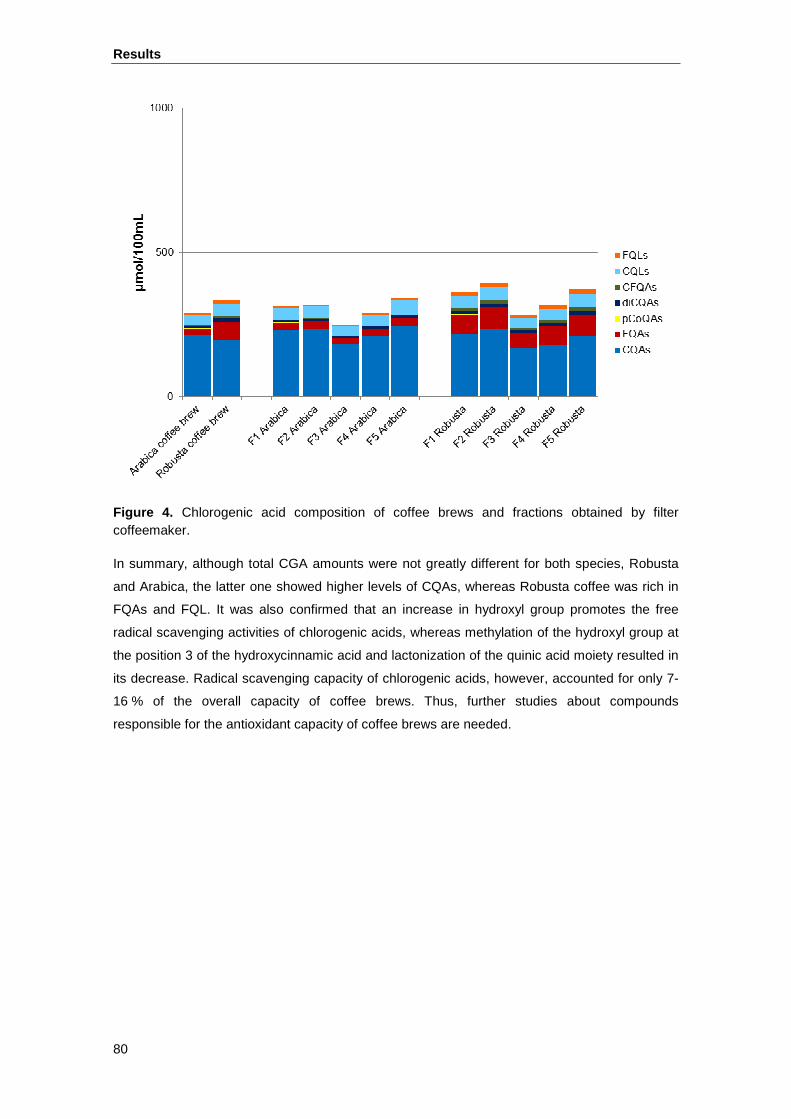
Results
80
Figure 4. Chlorogenic acid composition of coffee brews and fractions obtained by filter coffeemaker.
In summary, although total CGA amounts were not greatly different for both species, Robusta
and Arabica, the latter one showed higher levels of CQAs, whereas Robusta coffee was rich in
FQAs and FQL. It was also confirmed that an increase in hydroxyl group promotes the free
radical scavenging activities of chlorogenic acids, whereas methylation of the hydroxyl group at
the position 3 of the hydroxycinnamic acid and lactonization of the quinic acid moiety resulted in
its decrease. Radical scavenging capacity of chlorogenic acids, however, accounted for only 7-
16 % of the overall capacity of coffee brews. Thus, further studies about compounds
responsible for the antioxidant capacity of coffee brews are needed.
Results
81
5 REFERENCES
Arab, L. (2010). Epidemiologic evidence on coffee and cancer. Nutrition and Cancer, 62(3), 271-283.
Bonita, J. S., Mandarano, M., Shuta, D., & Vinson, J. (2007). Coffee and cardiovascular disease: In vitro, cellular, animal, and human studies. Pharmacological Research, 55(3), 187-198.
Clifford, M. N. (2000). Chlorogenic acids and other cinnamates - nature, occurrence, dietary burden, absorption and metabolism. Journal of the Science of Food and Agriculture, 80(7), 1033-1043.
Clifford, M. N. (1997). The nature of chlorogenic acids: Are they advantageous compounds in coffee? Proceedings of the 17th ASIC Colloquium, Nairobi, Kenia, pp. 97-106., 79-91.
Clifford, M. N., Johnston, K. L., Knight, S., & Kuhnert, N. (2003). Hierarchical scheme for LC-MSn identification of chlorogenic acids. Journal of Agricultural and Food Chemistry, 51(10), 2900-2911.
Clifford, M. N., Knight, S., & Kuhnert, N. (2005). Discriminating between the six isomers of dicaffeoylquinic acid by LC-MSn. Journal of Agricultural and Food Chemistry, 53(10), 3821-3832.
Farah, A., De Paulis, T., Trugo, L. C., & Martin, P. R. (2005). Effect of roasting on the formation of chlorogenic acid lactones in coffee. Journal of Agricultural and Food Chemistry, 53(5), 1505-1513.
Galeone, C., Turati, F., La Vecchia, C., & Tavani, A. (2010). Coffee consumption and risk of colourectal cancer: a meta-analysis of case-control studies. Cancer Causes & Control, 21(11), 1949-1959.
Ludwig, I. A., Sanchez, L., Caemmerer, B., Kroh, L. W., De Peña, M. P., & Cid, C. (2012). Extraction of coffee antioxidants: Impact of brewing time and method. Food Research International, 48(1), 57-64.
Nardini, M., D'Aquino, M., Tomassi, G., Gentili, V., Di Felice, M., & Scaccini, C. (1995). Inhibition of human low-density lipoprotein oxidation by caffeic acid and other hydroxycinnamic acid derivatives. Free Radical Biology and Medicine, 19(5), 541-552.
Pulido, R., Hernandez-Garcia, M., & Saura-Calixto, F. (2003). Contribution of beverages to the intake of lipophilic and hydrophilic antioxidants in the Spanish diet. European Journal of Clinical Nutrition, 57(10), 1275-1282.
Rice-Evans, C. A., Miller, N. J., & Paganga, G. (1996). Structure-antioxidant activity relationships of flavonoids and phenolic acids. Free Radical Biology and Medicine, 20(7), 933-956.
Rice-Evans, C., Miller, N., & Paganga, G. (1997). Antioxidant properties of phenolic compounds. Trends in Plant Science, 2(4), 152-159.
Smrke, S., Opitz, S. E. W., Vovk, I., & Yeretzian, C. (2013). How does roasting affect the antioxidants of a coffee brew? Exploring the antioxidant capacity of coffee via on-line antioxidant assays coupled with size exclusion chromatography. Food & Function, in press, DOI: 10.1039/C3FO30377B.
Stalmach, A., Mullen, W., Nagai, C., & Crozier, A. (2006). On-line HPLC analysis of the antioxidant activity of phenolic compounds in brewed, paper-filtered coffee. Brazilian Journal of Plant Physiology, 18(1), 253-262.
Results
82
Svilaas, A., Sakhi, A., Andersen, L., Svilaas, T., Strom, E., & Jacobs, D. (2004). Intakes of antioxidants in coffee, wine, and vegetables are correlated with plasma carotenoids in humans. The Journal of Nutrition, 134(3), 562-567.
Trugo, L. C., & Macrae, R. (1984). A study of the effect of roasting on the chlorogenic acid composition of coffee using HPLC. Food Chemistry, 15(3), 219-227.
Van Dam, R., & Hu, F. (2005). Coffee consumption and risk of type 2 diabetes: a systematic review. JAMA: the Journal of the American Medical Association, 294(1), 97-104.
Vignoli, J. A., Bassoli, D. G., & Benassi, M. T. (2011). Antioxidant activity, polyphenols, caffeine and melanoidins in soluble coffee: The influence of processing conditions and raw material. Food Chemistry, 124(3), 863-868.
Results
83
Objective 5
Study of the fate of coffee phenolics at colon leve l as influenced by the metabolism of
colonic microbiota.
Estudio de la influencia del metabolismo de la micr oflora intestinal humana sobre los
compuestos fenólicos a nivel del colon.
Paper 3:
Catabolism of coffee chlorogenic acids by human colonic microbiota
Iziar A. Ludwig , Maria Paz de Peña, Concepción Cid, Alan Crozier
BioFactors (accepted May 2013)
Impact factor (JCR, 2011): 4.933
Journal Rank in categories:
• Biochemistry and Molecular Biology: 58/290 (Q1)
• Endocrinology and Metabolism: 21/122 (Q1)

Results
85
TITLE: Catabolism of coffee chlorogenic acids by hu man colonic microbiota
AUTHORS: Iziar A. Ludwig a, M. Paz de Peña a, Concepción Cid a, Alan Crozier b
aDepartment of Nutrition, Food Science and Physiology, School of Pharmacy, University of
Navarra, E-31080-Pamplona, Spain
bSchool of Medicine, College of Medical, Veterinary and Life Sciences, University of Glasgow,
Glasgow G12 8QQ, United Kingdom
*Address for correspondence:
Professor Alan Crozier
North Laboratory, Joseph Black Building
School of Medicine, College of Medical, Veterinary and Life Sciences
University of Glasgow
Glasgow G12 8QQ, United Kingdom.
Telephone; +44 141 330 4613.
E-mail: [email protected]

Results
87
ABSTRACT
Several studies have indicated potential health benefits associated with coffee consumption.
These benefits might be ascribed in part to the chlorogenic acids (CGAs), the main
(poly)phenols in coffee. The impact of these dietary (poly)phenols on health depend on their
bioavailability. As they pass along the gastrointestinal tract CGAs are metabolised extensively
and it is their metabolites rather than the parent compounds which predominate in the
circulatory system. This paper reports on a study in which after incubation of espresso coffee
with human faecal samples, HPLC-MS and GC-MS were used to monitor CGA breakdown and
identify and quantify the catabolites produced by the colonic microflora. The CGAs were rapidly
degraded by the colonic microflora and over the 6 h incubation period, 11 catabolites were
identified and quantified. The appearance of the initial degradation products, caffeic and ferulic
acid, was transient, with maximum quantities at 1 h. Dihydrocaffeic acid, dihydroferulic acid, and
3-(3′-hydroxyphenyl)propionic acid were the major end products, comprising 75-83 % of the
total catabolites, whereas the remaining 17-25% consisted of six minor catabolites. The rate and
extent of the degradation showed a clear influence of the composition of the gut microbiota of
individual volunteers. Pathways involved in colonic catabolism of CGAs are proposed and
comparison with studies on the bioavailability of coffee CGAs ingested by humans helped
distinguish between colonic catabolites and phase II metabolites of CGAs.
1 INTRODUCTION
Dietary (poly)phenolic compounds are receiving much attention because of the health benefits
ascribed to their antioxidant, anti-inflammatory, cardioprotective, anticancer, chemopreventive,
and neuroprotective properties (Del Rio et al., 2013). Among dietary components with a high
(poly)phenol content, coffee, one of the most consumed beverages, is an extremely rich source
of chlorogenic acids (CGAs) (Clifford, 2000; Clifford et al., 2005; Crozier et al., 2012). CGAs are
a family of non-flavonoid compounds, comprising quinate esters of hydroxycinnamic acids such
as caffeic, ferulic, and p-coumaric acids. The main classes of CGAs in coffee are caffeoylquinic
acids (CQAs), feruloylquinic acids (FQAs), p-coumaroylquinic acids (pCoQAs), dicaffeoylquinic
acids (diCQAs), and caffeoylferuloylquinic acids (CFQAs). In addition, caffeoylquinic acid
lactones (CQLs) and feruloylquinic acid lactones (FQLs), products of roasting, can also occur in
coffee in significant amounts. Depending on the position of the hydroxycinnamic acid on the
quinic acid moiety, a wide range of different isomers occur in coffee, with the predominant
compounds being 3-, 4- and 5-CQAs (Clifford, 2000; Clifford et al., 2005; Crozier et al., 2012;
Farah et al., 2005).
Several studies have indicated potential health benefits associated with coffee consumption
(Bøhn et al., 2012; Higdon & Frei, 2006; Nkondjock, 2009; Williamson & Stalmach, 2012). For
example, epidemiological evidence has shown significant association between habitual coffee
consumption and a lower risk of type-2 diabetes (Van Dam & Hu, 2005), a preventive effect in
hepatocellular and endometrial cancer (Arab, 2010), and a reduced risk of colourectal cancer
(Galeone et al., 2010). These benefits might be ascribed in part to the CQAs which possess
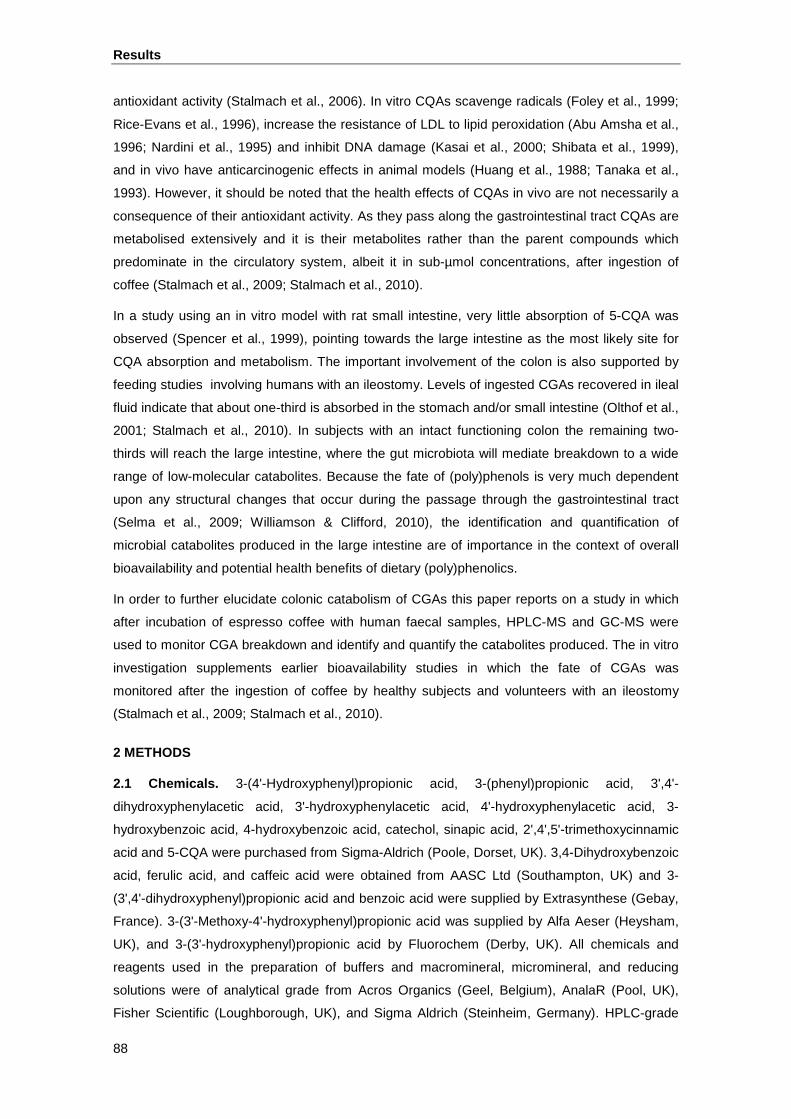
Results
88
antioxidant activity (Stalmach et al., 2006). In vitro CQAs scavenge radicals (Foley et al., 1999;
Rice-Evans et al., 1996), increase the resistance of LDL to lipid peroxidation (Abu Amsha et al.,
1996; Nardini et al., 1995) and inhibit DNA damage (Kasai et al., 2000; Shibata et al., 1999),
and in vivo have anticarcinogenic effects in animal models (Huang et al., 1988; Tanaka et al.,
1993). However, it should be noted that the health effects of CQAs in vivo are not necessarily a
consequence of their antioxidant activity. As they pass along the gastrointestinal tract CQAs are
metabolised extensively and it is their metabolites rather than the parent compounds which
predominate in the circulatory system, albeit it in sub-µmol concentrations, after ingestion of
coffee (Stalmach et al., 2009; Stalmach et al., 2010).
In a study using an in vitro model with rat small intestine, very little absorption of 5-CQA was
observed (Spencer et al., 1999), pointing towards the large intestine as the most likely site for
CQA absorption and metabolism. The important involvement of the colon is also supported by
feeding studies involving humans with an ileostomy. Levels of ingested CGAs recovered in ileal
fluid indicate that about one-third is absorbed in the stomach and/or small intestine (Olthof et al.,
2001; Stalmach et al., 2010). In subjects with an intact functioning colon the remaining two-
thirds will reach the large intestine, where the gut microbiota will mediate breakdown to a wide
range of low-molecular catabolites. Because the fate of (poly)phenols is very much dependent
upon any structural changes that occur during the passage through the gastrointestinal tract
(Selma et al., 2009; Williamson & Clifford, 2010), the identification and quantification of
microbial catabolites produced in the large intestine are of importance in the context of overall
bioavailability and potential health benefits of dietary (poly)phenolics.
In order to further elucidate colonic catabolism of CGAs this paper reports on a study in which
after incubation of espresso coffee with human faecal samples, HPLC-MS and GC-MS were
used to monitor CGA breakdown and identify and quantify the catabolites produced. The in vitro
investigation supplements earlier bioavailability studies in which the fate of CGAs was
monitored after the ingestion of coffee by healthy subjects and volunteers with an ileostomy
(Stalmach et al., 2009; Stalmach et al., 2010).
2 METHODS
2.1 Chemicals. 3-(4'-Hydroxyphenyl)propionic acid, 3-(phenyl)propionic acid, 3',4'-
dihydroxyphenylacetic acid, 3'-hydroxyphenylacetic acid, 4'-hydroxyphenylacetic acid, 3-
hydroxybenzoic acid, 4-hydroxybenzoic acid, catechol, sinapic acid, 2',4',5'-trimethoxycinnamic
acid and 5-CQA were purchased from Sigma-Aldrich (Poole, Dorset, UK). 3,4-Dihydroxybenzoic
acid, ferulic acid, and caffeic acid were obtained from AASC Ltd (Southampton, UK) and 3-
(3',4'-dihydroxyphenyl)propionic acid and benzoic acid were supplied by Extrasynthese (Gebay,
France). 3-(3'-Methoxy-4'-hydroxyphenyl)propionic acid was supplied by Alfa Aeser (Heysham,
UK), and 3-(3'-hydroxyphenyl)propionic acid by Fluorochem (Derby, UK). All chemicals and
reagents used in the preparation of buffers and macromineral, micromineral, and reducing
solutions were of analytical grade from Acros Organics (Geel, Belgium), AnalaR (Pool, UK),
Fisher Scientific (Loughborough, UK), and Sigma Aldrich (Steinheim, Germany). HPLC-grade
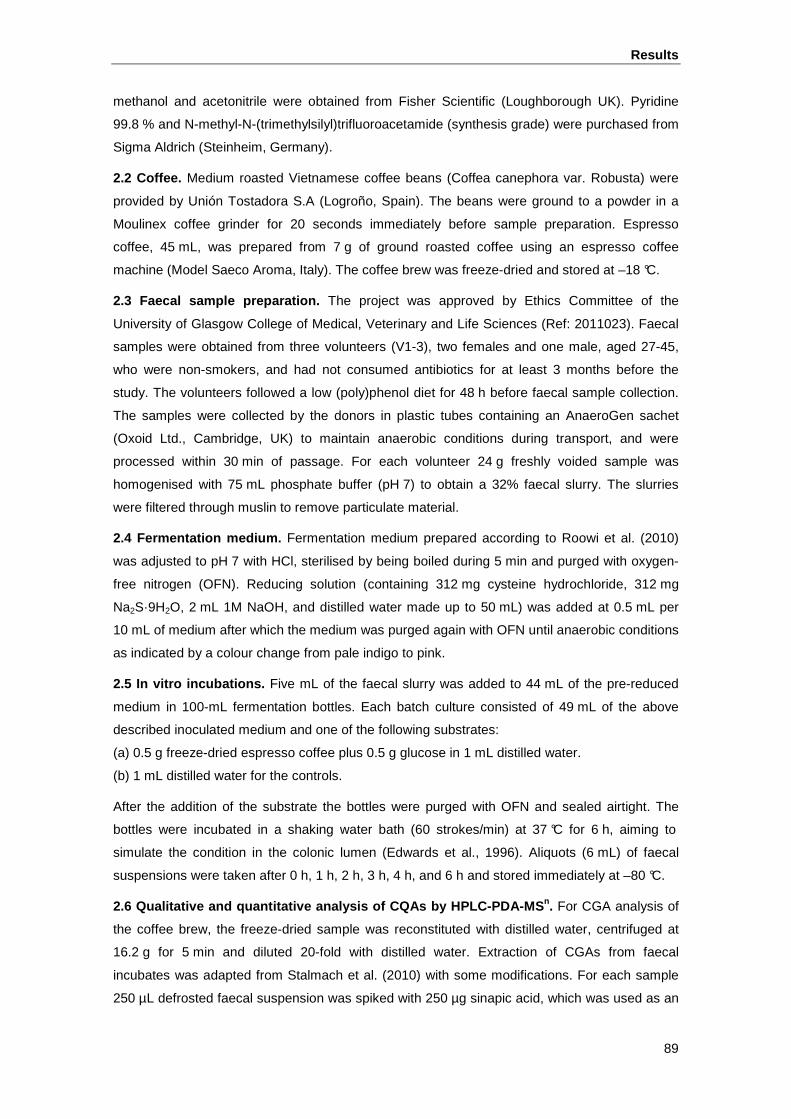
Results
89
methanol and acetonitrile were obtained from Fisher Scientific (Loughborough UK). Pyridine
99.8 % and N-methyl-N-(trimethylsilyl)trifluoroacetamide (synthesis grade) were purchased from
Sigma Aldrich (Steinheim, Germany).
2.2 Coffee. Medium roasted Vietnamese coffee beans (Coffea canephora var. Robusta) were
provided by Unión Tostadora S.A (Logroño, Spain). The beans were ground to a powder in a
Moulinex coffee grinder for 20 seconds immediately before sample preparation. Espresso
coffee, 45 mL, was prepared from 7 g of ground roasted coffee using an espresso coffee
machine (Model Saeco Aroma, Italy). The coffee brew was freeze-dried and stored at –18 °C.
2.3 Faecal sample preparation. The project was approved by Ethics Committee of the
University of Glasgow College of Medical, Veterinary and Life Sciences (Ref: 2011023). Faecal
samples were obtained from three volunteers (V1-3), two females and one male, aged 27-45,
who were non-smokers, and had not consumed antibiotics for at least 3 months before the
study. The volunteers followed a low (poly)phenol diet for 48 h before faecal sample collection.
The samples were collected by the donors in plastic tubes containing an AnaeroGen sachet
(Oxoid Ltd., Cambridge, UK) to maintain anaerobic conditions during transport, and were
processed within 30 min of passage. For each volunteer 24 g freshly voided sample was
homogenised with 75 mL phosphate buffer (pH 7) to obtain a 32% faecal slurry. The slurries
were filtered through muslin to remove particulate material.
2.4 Fermentation medium. Fermentation medium prepared according to Roowi et al. (2010)
was adjusted to pH 7 with HCl, sterilised by being boiled during 5 min and purged with oxygen-
free nitrogen (OFN). Reducing solution (containing 312 mg cysteine hydrochloride, 312 mg
Na2S·9H2O, 2 mL 1M NaOH, and distilled water made up to 50 mL) was added at 0.5 mL per
10 mL of medium after which the medium was purged again with OFN until anaerobic conditions
as indicated by a colour change from pale indigo to pink.
2.5 In vitro incubations. Five mL of the faecal slurry was added to 44 mL of the pre-reduced
medium in 100-mL fermentation bottles. Each batch culture consisted of 49 mL of the above
described inoculated medium and one of the following substrates:
(a) 0.5 g freeze-dried espresso coffee plus 0.5 g glucose in 1 mL distilled water.
(b) 1 mL distilled water for the controls.
After the addition of the substrate the bottles were purged with OFN and sealed airtight. The
bottles were incubated in a shaking water bath (60 strokes/min) at 37 °C for 6 h, aiming to
simulate the condition in the colonic lumen (Edwards et al., 1996). Aliquots (6 mL) of faecal
suspensions were taken after 0 h, 1 h, 2 h, 3 h, 4 h, and 6 h and stored immediately at –80 °C.
2.6 Qualitative and quantitative analysis of CQAs b y HPLC-PDA-MS n. For CGA analysis of
the coffee brew, the freeze-dried sample was reconstituted with distilled water, centrifuged at
16.2 g for 5 min and diluted 20-fold with distilled water. Extraction of CGAs from faecal
incubates was adapted from Stalmach et al. (2010) with some modifications. For each sample
250 µL defrosted faecal suspension was spiked with 250 µg sinapic acid, which was used as an
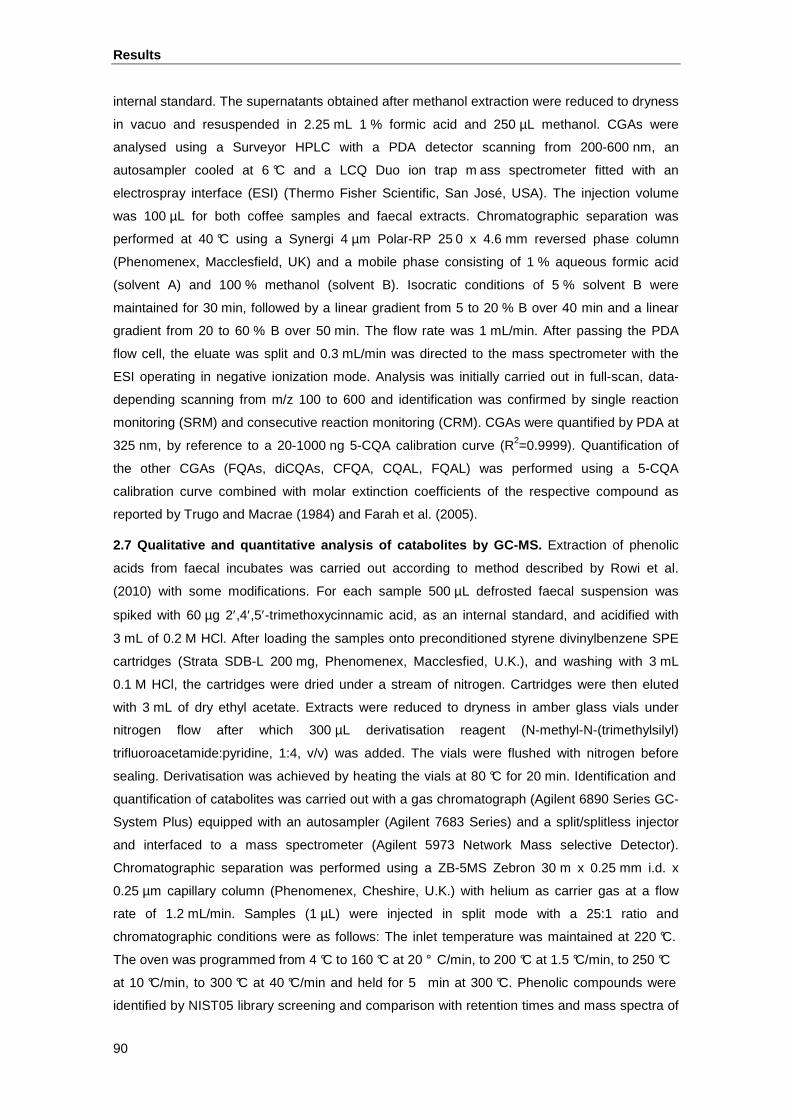
Results
90
internal standard. The supernatants obtained after methanol extraction were reduced to dryness
in vacuo and resuspended in 2.25 mL 1 % formic acid and 250 µL methanol. CGAs were
analysed using a Surveyor HPLC with a PDA detector scanning from 200-600 nm, an
autosampler cooled at 6 °C and a LCQ Duo ion trap m ass spectrometer fitted with an
electrospray interface (ESI) (Thermo Fisher Scientific, San José, USA). The injection volume
was 100 µL for both coffee samples and faecal extracts. Chromatographic separation was
performed at 40 °C using a Synergi 4 µm Polar-RP 25 0 x 4.6 mm reversed phase column
(Phenomenex, Macclesfield, UK) and a mobile phase consisting of 1 % aqueous formic acid
(solvent A) and 100 % methanol (solvent B). Isocratic conditions of 5 % solvent B were
maintained for 30 min, followed by a linear gradient from 5 to 20 % B over 40 min and a linear
gradient from 20 to 60 % B over 50 min. The flow rate was 1 mL/min. After passing the PDA
flow cell, the eluate was split and 0.3 mL/min was directed to the mass spectrometer with the
ESI operating in negative ionization mode. Analysis was initially carried out in full-scan, data-
depending scanning from m/z 100 to 600 and identification was confirmed by single reaction
monitoring (SRM) and consecutive reaction monitoring (CRM). CGAs were quantified by PDA at
325 nm, by reference to a 20-1000 ng 5-CQA calibration curve (R2=0.9999). Quantification of
the other CGAs (FQAs, diCQAs, CFQA, CQAL, FQAL) was performed using a 5-CQA
calibration curve combined with molar extinction coefficients of the respective compound as
reported by Trugo and Macrae (1984) and Farah et al. (2005).
2.7 Qualitative and quantitative analysis of catabo lites by GC-MS. Extraction of phenolic
acids from faecal incubates was carried out according to method described by Rowi et al.
(2010) with some modifications. For each sample 500 µL defrosted faecal suspension was
spiked with 60 µg 2′,4′,5′-trimethoxycinnamic acid, as an internal standard, and acidified with
3 mL of 0.2 M HCl. After loading the samples onto preconditioned styrene divinylbenzene SPE
cartridges (Strata SDB-L 200 mg, Phenomenex, Macclesfied, U.K.), and washing with 3 mL
0.1 M HCl, the cartridges were dried under a stream of nitrogen. Cartridges were then eluted
with 3 mL of dry ethyl acetate. Extracts were reduced to dryness in amber glass vials under
nitrogen flow after which 300 µL derivatisation reagent (N-methyl-N-(trimethylsilyl)
trifluoroacetamide:pyridine, 1:4, v/v) was added. The vials were flushed with nitrogen before
sealing. Derivatisation was achieved by heating the vials at 80 °C for 20 min. Identification and
quantification of catabolites was carried out with a gas chromatograph (Agilent 6890 Series GC-
System Plus) equipped with an autosampler (Agilent 7683 Series) and a split/splitless injector
and interfaced to a mass spectrometer (Agilent 5973 Network Mass selective Detector).
Chromatographic separation was performed using a ZB-5MS Zebron 30 m x 0.25 mm i.d. x
0.25 µm capillary column (Phenomenex, Cheshire, U.K.) with helium as carrier gas at a flow
rate of 1.2 mL/min. Samples (1 µL) were injected in split mode with a 25:1 ratio and
chromatographic conditions were as follows: The inlet temperature was maintained at 220 °C.
The oven was programmed from 4 °C to 160 °C at 20 ° C/min, to 200 °C at 1.5 °C/min, to 250 °C
at 10 °C/min, to 300 °C at 40 °C/min and held for 5 min at 300 °C. Phenolic compounds were
identified by NIST05 library screening and comparison with retention times and mass spectra of
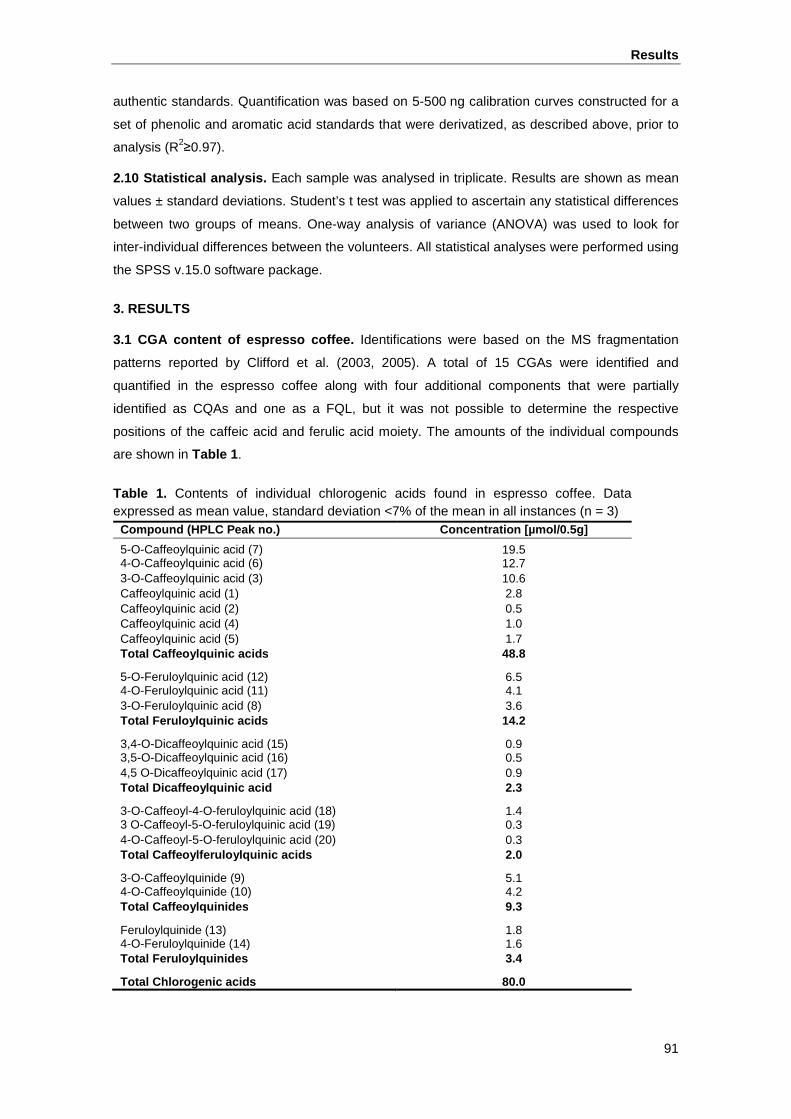
Results
91
authentic standards. Quantification was based on 5-500 ng calibration curves constructed for a
set of phenolic and aromatic acid standards that were derivatized, as described above, prior to
analysis (R2≥0.97).
2.10 Statistical analysis. Each sample was analysed in triplicate. Results are shown as mean
values ± standard deviations. Student’s t test was applied to ascertain any statistical differences
between two groups of means. One-way analysis of variance (ANOVA) was used to look for
inter-individual differences between the volunteers. All statistical analyses were performed using
the SPSS v.15.0 software package.
3. RESULTS
3.1 CGA content of espresso coffee. Identifications were based on the MS fragmentation
patterns reported by Clifford et al. (2003, 2005). A total of 15 CGAs were identified and
quantified in the espresso coffee along with four additional components that were partially
identified as CQAs and one as a FQL, but it was not possible to determine the respective
positions of the caffeic acid and ferulic acid moiety. The amounts of the individual compounds
are shown in Table 1 .
Table 1. Contents of individual chlorogenic acids found in espresso coffee. Data expressed as mean value, standard deviation <7% of the mean in all instances (n = 3)
Compound (HPLC Peak no.) Concentration [µmol/0.5g]
5-O-Caffeoylquinic acid (7) 19.5 4-O-Caffeoylquinic acid (6) 12.7 3-O-Caffeoylquinic acid (3) 10.6 Caffeoylquinic acid (1) 2.8 Caffeoylquinic acid (2) 0.5 Caffeoylquinic acid (4) 1.0 Caffeoylquinic acid (5) 1.7 Total Caffeoylquinic acids 48.8
5-O-Feruloylquinic acid (12) 6.5 4-O-Feruloylquinic acid (11) 4.1 3-O-Feruloylquinic acid (8) 3.6 Total Feruloylquinic acids 14.2
3,4-O-Dicaffeoylquinic acid (15) 0.9 3,5-O-Dicaffeoylquinic acid (16) 0.5 4,5 O-Dicaffeoylquinic acid (17) 0.9 Total Dicaffeoylquinic acid 2.3
3-O-Caffeoyl-4-O-feruloylquinic acid (18) 1.4 3 O-Caffeoyl-5-O-feruloylquinic acid (19) 0.3 4-O-Caffeoyl-5-O-feruloylquinic acid (20) 0.3 Total Caffeoylferuloylquinic acids 2.0
3-O-Caffeoylquinide (9) 5.1 4-O-Caffeoylquinide (10) 4.2 Total Caffeoylquinides 9.3
Feruloylquinide (13) 1.8 4-O-Feruloylquinide (14) 1.6 Total Feruloylquinides 3.4
Total Chlorogenic acids 80.0
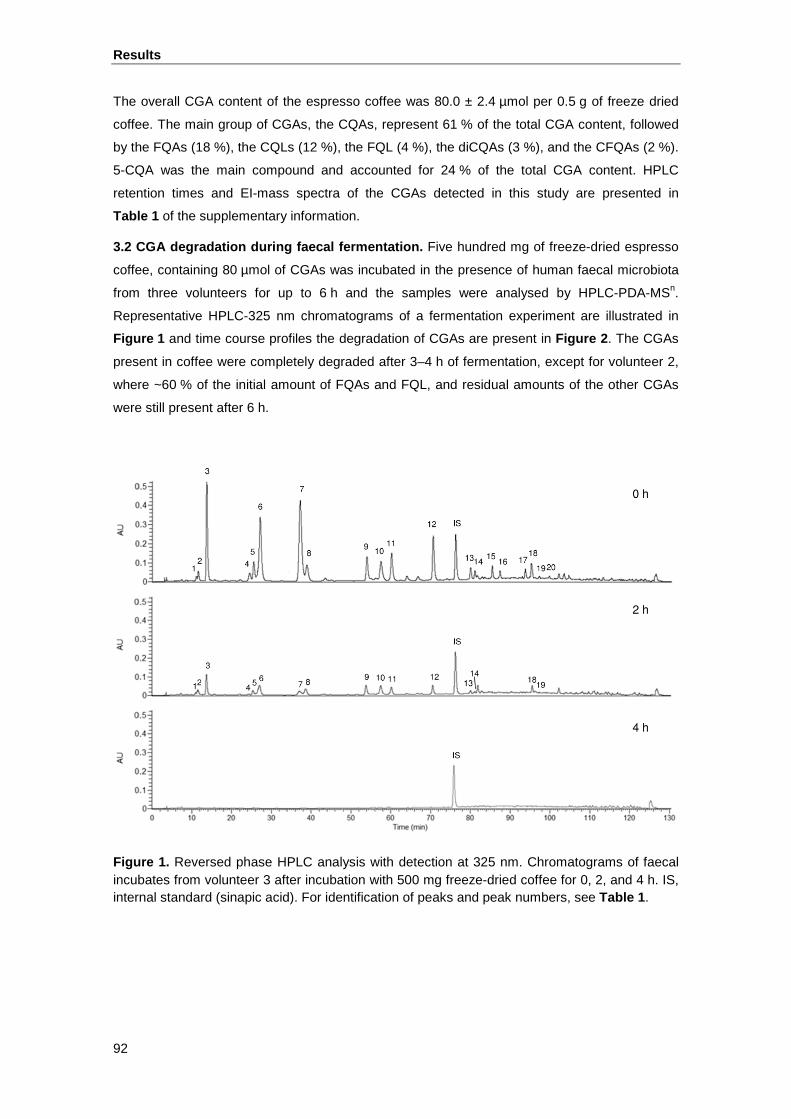
Results
92
The overall CGA content of the espresso coffee was 80.0 ± 2.4 µmol per 0.5 g of freeze dried
coffee. The main group of CGAs, the CQAs, represent 61 % of the total CGA content, followed
by the FQAs (18 %), the CQLs (12 %), the FQL (4 %), the diCQAs (3 %), and the CFQAs (2 %).
5-CQA was the main compound and accounted for 24 % of the total CGA content. HPLC
retention times and EI-mass spectra of the CGAs detected in this study are presented in
Table 1 of the supplementary information.
3.2 CGA degradation during faecal fermentation. Five hundred mg of freeze-dried espresso
coffee, containing 80 µmol of CGAs was incubated in the presence of human faecal microbiota
from three volunteers for up to 6 h and the samples were analysed by HPLC-PDA-MSn.
Representative HPLC-325 nm chromatograms of a fermentation experiment are illustrated in
Figure 1 and time course profiles the degradation of CGAs are present in Figure 2 . The CGAs
present in coffee were completely degraded after 3–4 h of fermentation, except for volunteer 2,
where ~60 % of the initial amount of FQAs and FQL, and residual amounts of the other CGAs
were still present after 6 h.
Figure 1. Reversed phase HPLC analysis with detection at 325 nm. Chromatograms of faecal incubates from volunteer 3 after incubation with 500 mg freeze-dried coffee for 0, 2, and 4 h. IS, internal standard (sinapic acid). For identification of peaks and peak numbers, see Table 1 .
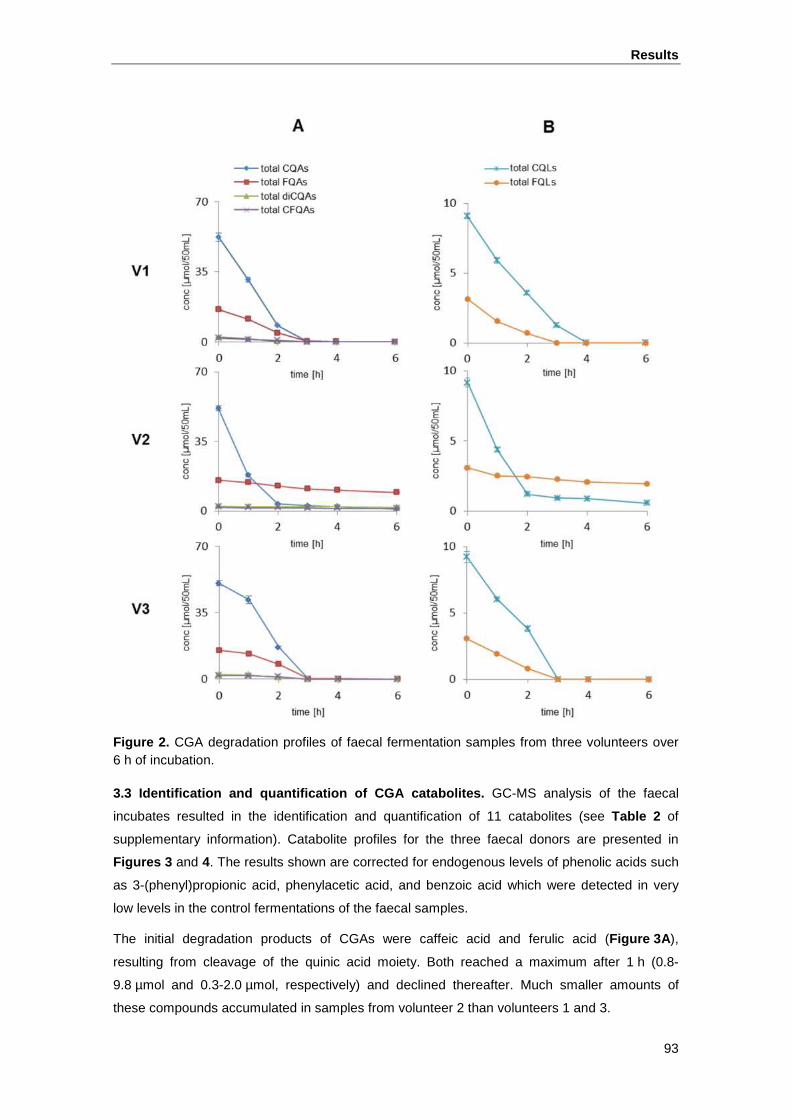
Results
93
Figure 2. CGA degradation profiles of faecal fermentation samples from three volunteers over 6 h of incubation.
3.3 Identification and quantification of CGA catabo lites. GC-MS analysis of the faecal
incubates resulted in the identification and quantification of 11 catabolites (see Table 2 of
supplementary information). Catabolite profiles for the three faecal donors are presented in
Figures 3 and 4. The results shown are corrected for endogenous levels of phenolic acids such
as 3-(phenyl)propionic acid, phenylacetic acid, and benzoic acid which were detected in very
low levels in the control fermentations of the faecal samples.
The initial degradation products of CGAs were caffeic acid and ferulic acid (Figure 3A ),
resulting from cleavage of the quinic acid moiety. Both reached a maximum after 1 h (0.8-
9.8 µmol and 0.3-2.0 µmol, respectively) and declined thereafter. Much smaller amounts of
these compounds accumulated in samples from volunteer 2 than volunteers 1 and 3.
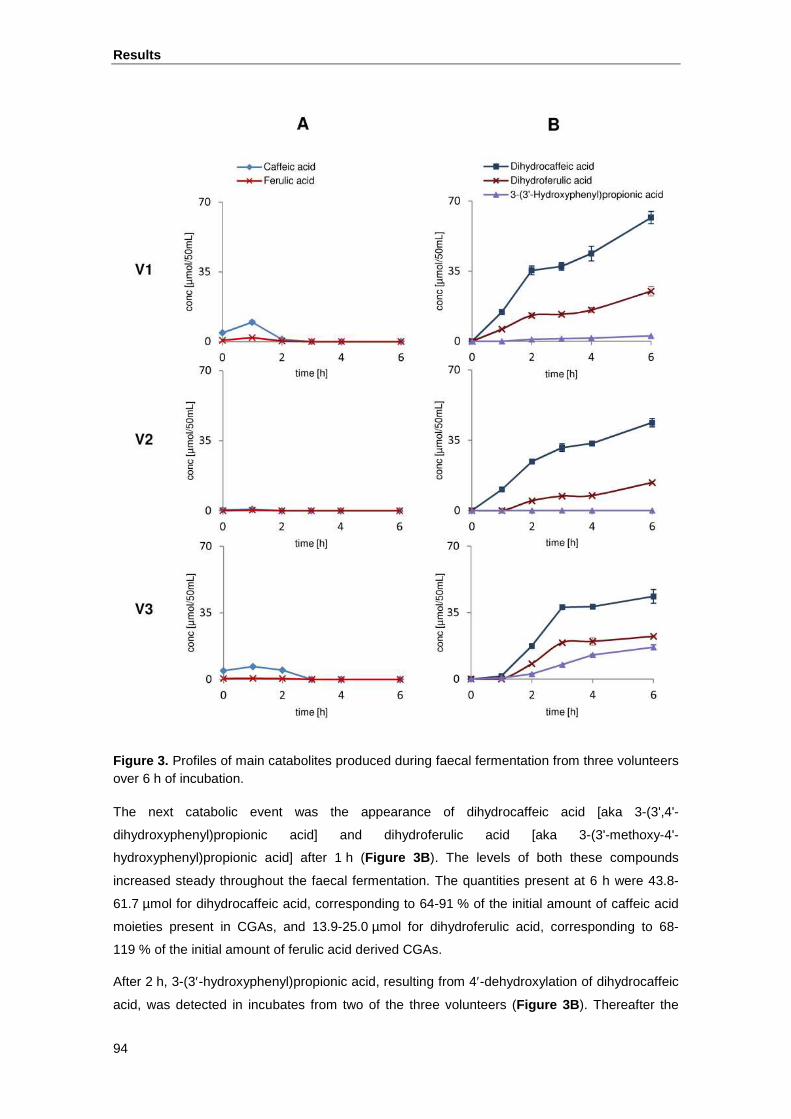
Results
94
Figure 3. Profiles of main catabolites produced during faecal fermentation from three volunteers over 6 h of incubation.
The next catabolic event was the appearance of dihydrocaffeic acid [aka 3-(3',4'-
dihydroxyphenyl)propionic acid] and dihydroferulic acid [aka 3-(3'-methoxy-4'-
hydroxyphenyl)propionic acid] after 1 h (Figure 3B ). The levels of both these compounds
increased steady throughout the faecal fermentation. The quantities present at 6 h were 43.8-
61.7 µmol for dihydrocaffeic acid, corresponding to 64-91 % of the initial amount of caffeic acid
moieties present in CGAs, and 13.9-25.0 µmol for dihydroferulic acid, corresponding to 68-
119 % of the initial amount of ferulic acid derived CGAs.
After 2 h, 3-(3′-hydroxyphenyl)propionic acid, resulting from 4′-dehydroxylation of dihydrocaffeic
acid, was detected in incubates from two of the three volunteers (Figure 3B ). Thereafter the
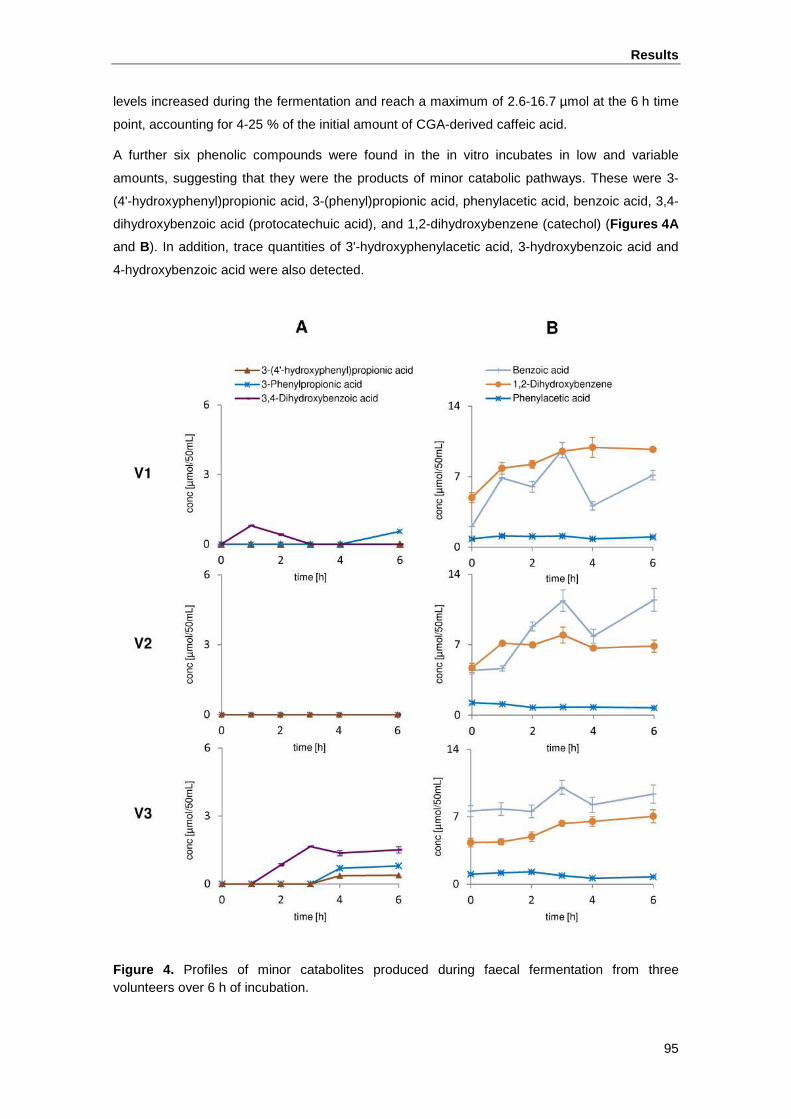
Results
95
levels increased during the fermentation and reach a maximum of 2.6-16.7 µmol at the 6 h time
point, accounting for 4-25 % of the initial amount of CGA-derived caffeic acid.
A further six phenolic compounds were found in the in vitro incubates in low and variable
amounts, suggesting that they were the products of minor catabolic pathways. These were 3-
(4'-hydroxyphenyl)propionic acid, 3-(phenyl)propionic acid, phenylacetic acid, benzoic acid, 3,4-
dihydroxybenzoic acid (protocatechuic acid), and 1,2-dihydroxybenzene (catechol) (Figures 4A
and B). In addition, trace quantities of 3'-hydroxyphenylacetic acid, 3-hydroxybenzoic acid and
4-hydroxybenzoic acid were also detected.
Figure 4. Profiles of minor catabolites produced during faecal fermentation from three volunteers over 6 h of incubation.
Results
96
The overall quantities of catabolites present at the end of the 6 h fermentation were 107.8 ±
6.3 µmol, 76.7 ± 4.8 µmol, and 102.3 ± 6.8 µmol for volunteers 1-3, respectively. Dihydrocaffeic
acid, dihydroferulic acid, and 3-(3′-hydroxyphenyl)propionic acid, the major end products,
comprising 75-83 % of the total catabolites, whereas the remaining 17-25% correspond to the
six minor catabolites described above.
4. DISCUSSION
For the in vitro fermentation, 500 mg freeze-dried espresso coffee was incubated 0 h, 1 h, 2 h,
3 h, 4 h, and 6 h, under anaerobic conditions, with fresh faecal samples from three healthy
donors in the presence of glucose. Analysis of aliquots of incubates by HPLC-PDA-MSn and
GC-MS revealed that that CGAs are a good substrate for the enzymes of the human gut
microbiota as they were almost completely degraded after 3-4 h of faecal fermentation
(Figure 2 ).
Potential catabolic steps occurring in the faecal incubates are illustrated in Figure 5 . The
breakdown of the principal CGAs in the coffee, CQAs and FQAs is probably the result of the
action of bacterial esterases, in as much as the first catabolic event was the appearance of
caffeic acid and ferulic acid resulting from cleavage of quinic acid from the hydroxycinnamate
moiety. Several colonic bacteria, including Escherichia coli, Bifidobacterium lactis, and
Lactobacillus gasseri, express cinnamoyl esterase (Couteau et al., 2001), which would catalyse
such a cleavage. The appearance of low amounts of caffeic acid and ferulic acid was transient,
with maximum quantities occurring at 1 h (Figure 2 ). This would appear to be a consequence of
their further metabolism, via reduction of the side chain double bond by reductase activity, which
led to the appearance of dihydrocaffeic acid and dihydroferulic acid. The two dihydro derivatives
were the major end products of the faecal fermentation of the coffee CGAs.
As well as dihydrocaffeic acid and dihydroferulic acid, 3-(3'-hydroxyphenyl)propionic acid was
detected after 1-2 h of fermentation. Formation of the phenylpropionic acid was concomitant
with reduced concentrations of dihydrocaffeic acid, as a result of 4'-dehydroxylation. 3-(3'-
Hydroxyphenyl)propionic acid was previously reported to be the main catabolite found after
incubation of 1 µmol 5-CQA with human faecal microbiota (Gonthier et al., 2006). In the present
study with a more substantial amount of CGA substrate much higher variable amounts of 3-(3'-
hydroxyphenyl)propionic acid were found depending on the donor as illustrated in Figure 3B .
Further degradation of 5-CQA to form 3-(phenyl)propionic acid, phenylacetic acid, benzoic acid
and their respective hydroxy derivatives, has been reported previously (Selma et al., 2009).
However this study, and that of Gonthier et al. (2006), focused on the colonic catabolism of pure
reference compounds and did not take into account possible matrix effects occurring in
incubations with the complex mixture of dietary CGAs present in coffee that are likely to reach
the colon in vivo (Stalmach et al., 2010). In the current investigation six catabolites, resulting
from demethoxylation, dehydroxylation and decarboxylation were found in low and variable
amounts (Figure 3 ). Removal of the 3′-methoxy group of dihydroferulic acid would lead to the
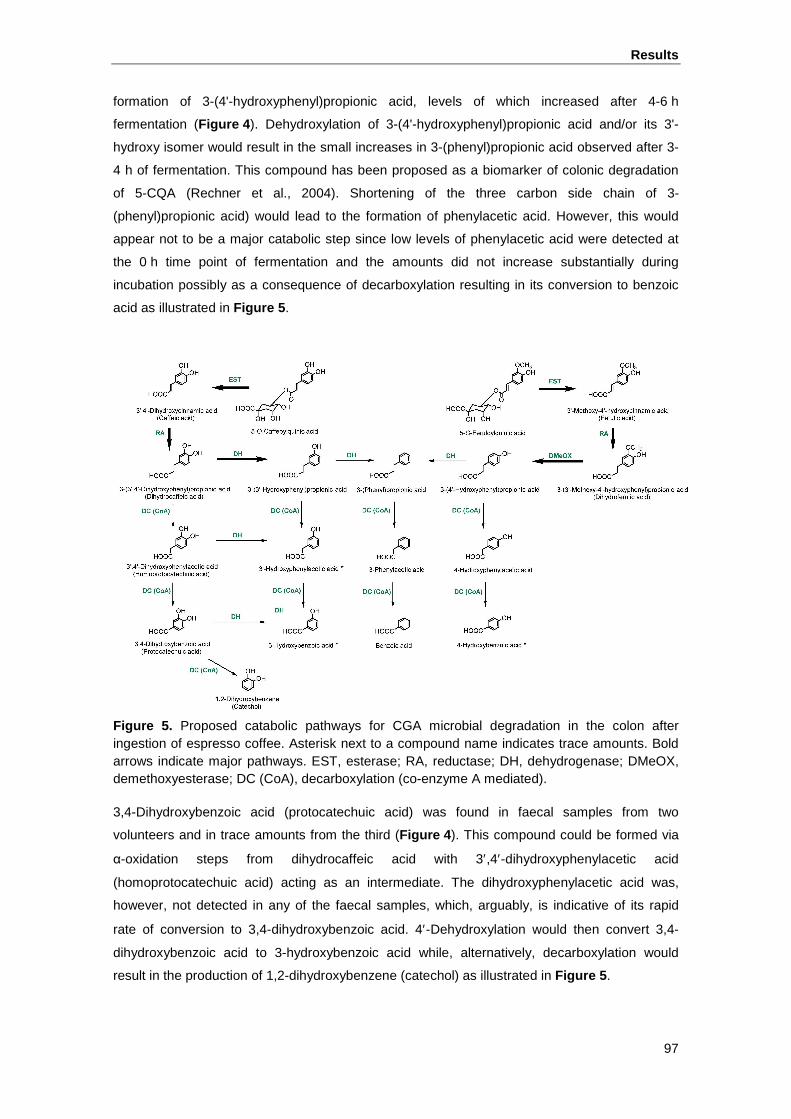
Results
97
formation of 3-(4'-hydroxyphenyl)propionic acid, levels of which increased after 4-6 h
fermentation (Figure 4 ). Dehydroxylation of 3-(4'-hydroxyphenyl)propionic acid and/or its 3'-
hydroxy isomer would result in the small increases in 3-(phenyl)propionic acid observed after 3-
4 h of fermentation. This compound has been proposed as a biomarker of colonic degradation
of 5-CQA (Rechner et al., 2004). Shortening of the three carbon side chain of 3-
(phenyl)propionic acid) would lead to the formation of phenylacetic acid. However, this would
appear not to be a major catabolic step since low levels of phenylacetic acid were detected at
the 0 h time point of fermentation and the amounts did not increase substantially during
incubation possibly as a consequence of decarboxylation resulting in its conversion to benzoic
acid as illustrated in Figure 5 .
Figure 5. Proposed catabolic pathways for CGA microbial degradation in the colon after ingestion of espresso coffee. Asterisk next to a compound name indicates trace amounts. Bold arrows indicate major pathways. EST, esterase; RA, reductase; DH, dehydrogenase; DMeOX, demethoxyesterase; DC (CoA), decarboxylation (co-enzyme A mediated).
3,4-Dihydroxybenzoic acid (protocatechuic acid) was found in faecal samples from two
volunteers and in trace amounts from the third (Figure 4 ). This compound could be formed via
α-oxidation steps from dihydrocaffeic acid with 3′,4′-dihydroxyphenylacetic acid
(homoprotocatechuic acid) acting as an intermediate. The dihydroxyphenylacetic acid was,
however, not detected in any of the faecal samples, which, arguably, is indicative of its rapid
rate of conversion to 3,4-dihydroxybenzoic acid. 4′-Dehydroxylation would then convert 3,4-
dihydroxybenzoic acid to 3-hydroxybenzoic acid while, alternatively, decarboxylation would
result in the production of 1,2-dihydroxybenzene (catechol) as illustrated in Figure 5 .
Results
98
Benzoic acid and 1,2-dihydroxybenzene occur in coffee as a result of the roasting process
(Nunes & Coimbra, 2010; Rahn & König, 1978) which would explain why they were already
present in the samples taken at 0 h. Nevertheless the levels of both compounds varied over the
6 h faecal fermentation period indicating that their presence might at least in part be the result of
bacterial catabolism of CGAs. Benzoic acid, however, can also have been formed from quinic
acid by the gut microbiota (Williamson & Clifford, 2010). Three further phenolic acids were
detected in the faecal incubates in trace amounts, namely 3′-hydroxyphenylacetic acid, 3-
hydroxybenzoic acid and 4-hydroxybenzoic acid that might result from 3-(3'-
hydroxyphenyl)propionic acid and 3-(4'-hydroxyphenyl)propionic acid being subject to α-
oxidation. None of these phenolic acids were present in the control or in the coffee samples
indicating they are CGA degradation products.
The data obtained with the faecal fermentations suggest that bacteria present in the human gut
are capable of further demethoxylation, dehydroxylation and decarboxylation of dihydrocaffeic
acid, dihydroferulic acid and 3-(3'-hydroxyphenyl)propionic acid. However, the corresponding
catabolic routes can be considered as minor pathways of coffee CGA degradation, since the
amounts found for the resulting compounds were very low. From the catabolites detected during
the faecal fermentation we propose pathways with major and minor routes of colonic CGA
degradation after coffee ingestion (Figure 5 ).
Total amounts of catabolites found in V1 and V3 after 6 h of incubation, 107.8 ± 6.3 µmol and
102.3 ± 6.8 µmol, respectively, were significantly higher (p<0.05) than 80.0 ± 2.4 µmol CGA
content of the coffee used for the faecal fermentation. Several studies have confirmed the
incorporation of CGAs and other phenolic compounds into coffee melanoidins, the high
molecular brown end products of the Maillard reaction formed during coffee roasting (Bekedam
et al., 2008; Nunes & Coimbra, 2010). A partial release of these compounds during the faecal
fermentation could have increased the amounts of phenolic acids and might explain the
differences found between amounts of CGAs incubated and the amounts of catabolites found at
the end of the fermentation.
Inter-individual differences in the catabolism of phenolic compounds by gut microbiota have
been extensively reported (González-Barrio et al., 2011; Gross et al., 2010; Jaganath et al.,
2009; Selma et al., 2009) and were also found in the present study. The observed differences
can be attributed to the well-known different bacterial populations present in the individual faecal
microbial communities, harbouring specific enzymatic capacities (Zoetendal et al., 2008). The
rate and extent of the degradation of the coffee CGAs showed a clear and statistically significant
(p<0.05) influence of the composition of the gut microbiota. The inter-individual differences were
particularly noticeable for volunteer 2 (Figure 2 ). While degradation profiles obtained for V1 and
V3 differed only in the breakdown rate, V2 showed an incomplete degradation of FQAs and
FQL, with recovery rates up to 60 % after 6 h of faecal fermentation. Other minor CGAs, such
as diCQAs, CFQAs, were also degraded to a lesser extent in samples from V2. Breakdown
rates for CQAs and CQLs, however, were similar for all volunteers, and as these
Results
99
representatives made up 72 % of the total CGAs, CGA degradation by gut microbiota was 80-
100 % for all volunteers. Differences between the donors were also observed in the catabolite
profiles (Figures 3 and 4). Samples from volunteer 2 showed significantly lower levels of caffeic
acid and ferulic acid. Nevertheless dihydrocaffeic acid and dihydroferulic acids were the main
end catabolites of faecal fermentation for volunteer 2. In contrast to volunteers 1 and 3, 3-(3′-
hydroxyphenyl)propionic acid and its 4′-hydroxy isomer were not found in fermentations with
faecal material from volunteer 2. The inter-individual differences indicate that the composition of
the gut microflora and thus the presence of certain bacterial species might have an influence on
the formation of catabolites, especially those produced by minor pathways.
The results obtained in this in vitro study are in accordance with those on the bioavailability of
CGAs in humans in which the main colon-derived metabolites in plasma and/or urine after
ingestion of coffee were dihydrocaffeic acid, dihydroferulic acid and their sulfated and
glucuronide metabolites (Stalmach et al., 2009). There was an absence of glucuronide and
sulfate conjugates in faecal fermentations demonstrating that they are not of bacterial origin but
instead are probably phase II hepatic products and/or are formed in epithelial cells during
passage through the colon en route to the circulatory system. The same probably also applies i)
to co-enzyme A-mediated metabolism of ferulic acid to feruloylglycine and ii) to the catechol-O-
methyltransferase catalysed reactions that in vivo result in metabolism of caffeic acid to
isoferulic acid (Stalmach et al., 2009; Stalmach et al., 2010), conversions that did not occur in
the faecal incubations.
In conclusion, all coffee CGAs were rapidly degraded by the colonic microflora. A total of 11
catabolites were identified during the 0–6 h of faecal fermentation showing that the CGAs were
extensively catabolized by the microorganisms present in the human faecal samples. The rate
and extent of the degradation showed a clear influence of the composition of the gut microbiota
of individual volunteers. However, the amounts found indicate major degradation pathways
leading to the accumulation of dihydrocaffeic acid and dihydroferulic acid. It is known that these
catabolites are better absorbed that their CQAs and FQAs, and in vivo studies have confirmed
free and sulfated dihydrocaffeic and dihydroferulic acids as main metabolites in plasma and
urine after ingestion of coffee. Thus, bioavailability of CGAs depends largely on microbial
conversions in the colon. Nevertheless, dihydrocaffeic, dihydroferulic acids, other minor
catabolites and their parent CGAs that are present in upper regions of the large intestine, where
they might act as antioxidants and prebiotics explaining at least partly some of the health
benefits at colon level ascribed to coffee consumption. It is important that investigations of the
potential protective colonic effects of coffee consumption (Galeone et al., 2010) with ex vivo cell
systems should make use of this mixture of ingested CGAs and their colonic catabolites at
doses that prevail in the proximal gastrointestinal tract.
Results
100
ACKNOWLEDGEMENTS
We thank all the volunteers for participating in this study, professor Christine A. Edwards and
Maizatul H. Omar for their assistance with the study. This research was funded by the Spanish
Ministry of Economy and Competitiveness (AGL2009-12052). We also thank the Government of
Navarre for the grant given to I.A.L., and Unión Tostadora S.A. for providing the coffee.
Results
101
5 REFERENCES
Abu Amsha, R., Croft, K. D., Puddey, I. B., Proudfoot, J. M., & Beilin, L. J. (1996). Phenolic content of various beverages determines the extent of inhibition of human serum and low-density lipoprotein oxidation in vitro: Identification and mechanism of action of some cinnamic acid derivatives from red wine. Clinical Science, 91(4), 449-458.
Arab, L. (2010). Epidemiologic evidence on coffee and cancer. Nutrition and Cancer, 62(3), 271-283.
Bekedam, E. K., Schols, H. A., Van Boekel, M. A. J. S., & Smit, G. (2008). Incorporation of chlorogenic acids in coffee brew melanoidins. Journal of Agricultural and Food Chemistry, 56(6), 2055-2063.
Bøhn, S. K., Ward, N. C., Hodgson, J. M., & Croft, K. D. (2012). Effects of tea and coffee on cardiovascular disease risk. Food & Function, 3(6), 575-591.
Clifford, M. N. (2000). Chlorogenic acids and other cinnamates - nature, occurrence, dietary burden, absorption and metabolism. Journal of the Science of Food and Agriculture, 80(7), 1033-1043.
Clifford, M. N., Johnston, K. L., Knight, S., & Kuhnert, N. (2003). Hierarchical scheme for LC-MSn identification of chlorogenic acids. Journal of Agricultural and Food Chemistry, 51(10), 2900-2911.
Clifford, M. N., Knight, S., & Kuhnert, N. (2005). Discriminating between the six isomers of dicaffeoylquinic acid by LC-MSn. Journal of Agricultural and Food Chemistry, 53(10), 3821-3832.
Couteau, D., McCartney, A. L., Gibson, G. R., Williamson, G., & Faulds, C. B. (2001). Isolation and characterization of human colonic bacteria able to hydrolyse chlorogenic acid. Journal of Applied Microbiology, 90(6), 873-881.
Crozier, T. W. M., Stalmach, A., & Crozier, A. (2012). Espresso coffees, caffeine and chlorogenic acid intake: Potential health implications. Food & Function, 3(1), 30-33.
Del Rio, D., Rodriguez-Mateos, A., Spencer, J. P. E., Tognolini, M., Borges, G., & Crozier, A. (2013). Dietary (poly)phenols in human health: Structures, bioavailability, and evidence of protective effects against chronic diseases. Antioxidants and Redox Signaling, 18(14), 1818-1892.
Edwards, C. A., Gibson, G., Champ, M., Jensen, B., Mathers, J. C., Nagengast, F., Rumney, C., & Quehl, A. (1996). In vitro method for quantification of the fermentation of starch by human faecal bacteria. Journal of the Science of Food and Agriculture, 71(2), 209-217.
Farah, A., De Paulis, T., Trugo, L. C., & Martin, P. R. (2005). Effect of roasting on the formation of chlorogenic acid lactones in coffee. Journal of Agricultural and Food Chemistry, 53(5), 1505-1513.
Foley, S., Navaratnam, S., McGarvey, D. J., Land, E. J., Truscott, T. G., & Rice-Evans, C. A. (1999). Singlet oxygen quenching and the redox properties of hydroxycinnamic acids. Free Radical Biology and Medicine, 26(9–10), 1202-1208.
Galeone, C., Turati, F., La Vecchia, C., & Tavani, A. (2010). Coffee consumption and risk of colourectal cancer: A meta-analysis of case-control studies. Cancer Causes & Control, 21(11), 1949-1959.
Gonthier, M. P., Remesy, C., Scalbert, A., Cheynier, V., Souquet, J. M., Poutanen, K., & Aura, A. M. (2006). Microbial metabolism of caffeic acid and its esters chlorogenic and caftaric acids by human faecal microbiota in vitro. Biomedicine & Pharmacotherapy, 60(9), 536-540.
Results
102
González-Barrio, R., Edwards, C. A., & Crozier, A. (2011). Colonic catabolism of ellagitannins, ellagic acid, and raspberry anthocyanins: In vivo and in vitro studies. Drug Metabolism and Disposition, 39(9), 1680-1688.
Gross, G., Jacobs, D. M., Peters, S., Possemiers, S., Van Duyhoven, J., Vaughan, E. E., & Van de Wiele, T. (2010). In vitro bioconversion of polyphenols from black tea and red wine/grape juice by human intestinal microbiota displays strong interindividual variability. Journal of Agricultural and Food Chemistry, 58(18), 10236-10246.
Higdon, J., & Frei, B. (2006). Coffee and health: A review of recent human research. Critical Reviews in Food Science and Nutrition, 46(2), 101-123.
Huang, M., Smart, R. C., Wong, C., & Conney, A. H. (1988). Inhibitory effect of curcumin, chlorogenic acid, caffeic acid, and ferulic acid on tumor promotion in mouse skin by 12-O-tetradecanoylphorbol-13-acetate. Cancer Research, 48(21), 5941-5946.
Jaganath, I. B., Mullen, W., Lean, M. E. J., Edwards, C. A., & Crozier, A. (2009). In vitro catabolism of rutin by human faecal bacteria and the antioxidant capacity of its catabolites. Free Radical Biology and Medicine, 47(8), 1180-1189.
Kasai, H., Fukada, S., Yamaizumi, Z., Sugie, S., & Mori, H. (2000). Action of chlorogenic acid in vegetables and fruits as an inhibitor of 8-hydroxydeoxyguanosine formation in vitro and in a rat carcinogenesis model. Food and Chemical Toxicology, 38(5), 467-471.
Nardini, M., D'Aquino, M., Tomassi, G., Gentili, V., Di Felice, M., & Scaccini, C. (1995). Inhibition of human low-density lipoprotein oxidation by caffeic acid and other hydroxycinnamic acid derivatives. Free Radical Biology and Medicine, 19(5), 541-552.
Nkondjock, A. (2009). Coffee consumption and the risk of cancer: An overview. Cancer Letters, 277(2), 121-125.
Nunes, F. M., & Coimbra, M. A. (2010). Role of hydroxycinnamates in coffee melanoidin formation. Phytochemistry Reviews, 9(1), 171-185.
Olthof, M. R., Hollman, P. C. H., & Katan, M. B. (2001). Chlorogenic acid and caffeic acid are absorbed in humans. The Journal of Nutrition, 131(1), 66-71.
Rahn, W., & König, W. A. (1978). GC/MS investigations of the constituents in a diethyl ether extract of an acidified roast coffee infusion. Journal of High Resolution Chromatography, 1(1), 69-71.
Rechner, A. R., Smith, M. A., Kuhnle, G., Gibson, G. R., Debnam, E. S., Srai, S. K. S., Moore, K. P., & Rice-Evans, C. A. (2004). Colonic metabolism of dietary polyphenols: Influence of structure on microbial fermentation products. Free Radical Biology and Medicine, 36(2), 212-225.
Rice-Evans, C. A., Miller, N. J., & Paganga, G. (1996). Structure-antioxidant activity relationships of flavonoids and phenolic acids. Free Radical Biology and Medicine, 20(7), 933-956.
Roowi, S., Stalmach, A., Mullen, W., Lean, M. E. J., Edwards, C. A., & Crozier, A. (2010). Green tea flavan-3-ols: Colonic degradation and urinary excretion of catabolites by humans. Journal of Agricultural and Food Chemistry, 58(2), 1296-1304.
Selma, M. V., Espin, J. C., & Tomas-Barberan, F. A. (2009). Interaction between phenolics and gut microbiota: Role in human health. Journal of Agricultural and Food Chemistry, 57(15), 6485-6501.
Shibata, H., Sakamoto, Y., Oka, M., & Kono, Y. (1999). Natural antioxidant, chlorogenic acid, protects against DNA breakage caused by monochloramine. Bioscience, Biotechnology, and Biochemistry, 63(7), 1295-1297.
Results
103
Spencer, J. P. E., Chowrimootoo, G., Choudhury, R., Debnam, E. S., Srai, S. K., & Rice-Evans, C. (1999). The small intestine can both absorb and glucuronidate luminal flavonoids. FEBS letters, 458(2), 224-230.
Stalmach, A., Mullen, W., Nagai, C., & Crozier, A. (2006). On-line HPLC analysis of the antioxidant activity of phenolic compounds in brewed, paper-filtered coffee. Brazilian Journal of Plant Physiology, 18(1), 253-262.
Stalmach, A., Mullen, W., Barron, D., Uchida, K., Yokota, T., Cavin, C., Steiling, H., Williamson, G., & Crozier, A. (2009). Metabolite profiling of hydroxycinnamate derivatives in plasma and urine after the ingestion of coffee by humans: Identification of biomarkers of coffee consumption. Drug Metabolism and Disposition, 37(8), 1749-1758.
Stalmach, A., Steiling, H., Williamson, G., & Crozier, A. (2010). Bioavailability of chlorogenic acids following acute ingestion of coffee by humans with an ileostomy. Archives of Biochemistry and Biophysics, 501(1), 98-105.
Tanaka, T., Kojima, T., Kawamori, T., Wang, A., Suzui, M., Okamoto, K., & Mori, H. (1993). Inhibition of 4-nitroquinoline-1-oxide-induced rat tongue carcinogenesis by the naturally occurring plant phenolics caffeic, ellagic, chlorogenic and ferulic acids. Carcinogenesis, 14(7), 1321-1325.
Trugo, L. C., & Macrae, R. (1984). A study of the effect of roasting on the chlorogenic acid composition of coffee using HPLC. Food Chemistry, 15(3), 219-227.
Van Dam, R., & Hu, F. (2005). Coffee consumption and risk of type 2 diabetes: A systematic review. JAMA: the Journal of the American Medical Association, 294(1), 97-104.
Williamson, G., & Clifford, M. N. (2010). Colonic metabolites of berry polyphenols: The missing link to biological activity? British Journal of Nutrition, 104(S3), S48-S66.
Williamson, G., & Stalmach, A. (2012). Absorption and Metabolism of Dietary Chlorogenic Acids and Procyanidins. In V. Cheynier, P. Sarni-Manchado, & S. Quideau, Recent Advances in Polyphenol Research (pp. 209-222). Oxford, UK.: Wiley-Blackwell.
Zoetendal, E. G., Rajilić-Stojanović, M., & de Vos, W. M. (2008). High-throughput diversity and functionality analysis of the gastrointestinal tract microbiota. Gut, 57(11), 1605-1615.
Results
104
SUPPLEMENTARY INFORMATION
Catabolism of coffee chlorogenic acids by human col onic
microbiota
Iziar A. Ludwig a, Maria Paz de Peña a, Concepción Cid a, Alan Crozier b
aDepartment of Nutrition, Food Science and Physiology, School of Pharmacy, University of
Navarra, E-31080-Pamplona, Spain
bSchool of Medicine, College of Medical, Veterinary and Life Sciences, University of Glasgow,
Glasgow G12 8QQ, United Kingdom
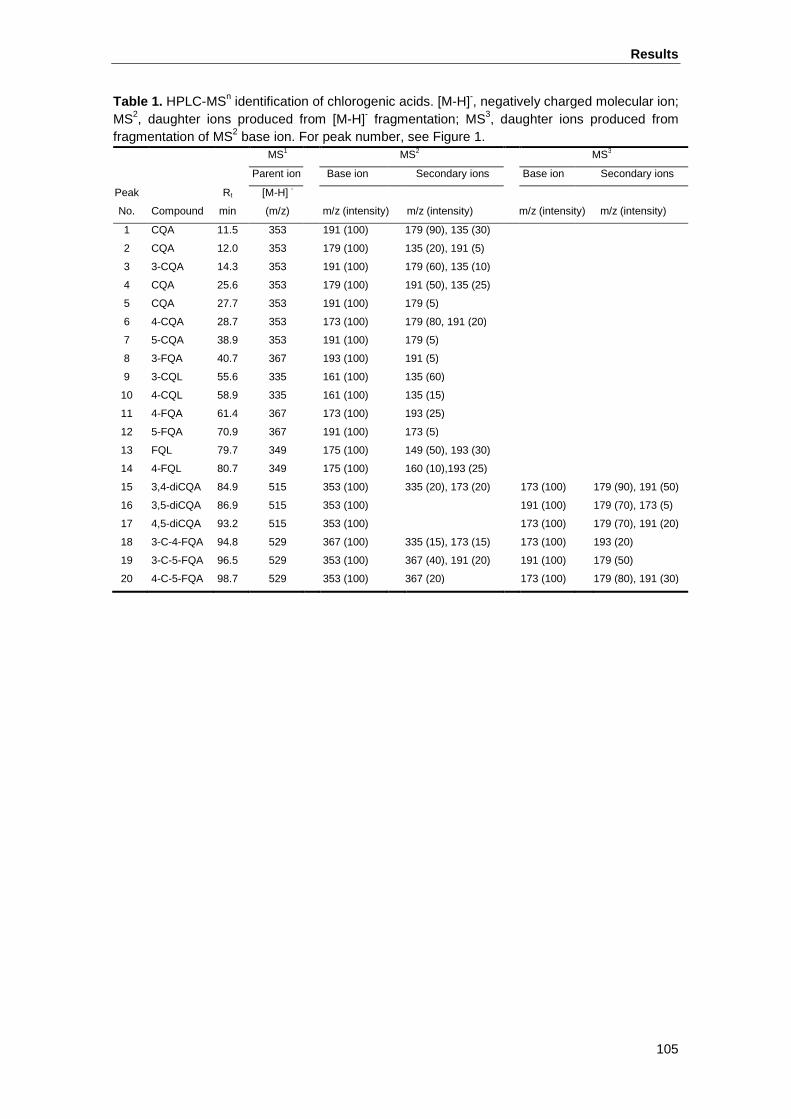
Results
105
Table 1. HPLC-MSn identification of chlorogenic acids. [M-H]-, negatively charged molecular ion; MS2, daughter ions produced from [M-H]- fragmentation; MS3, daughter ions produced from fragmentation of MS2 base ion. For peak number, see Figure 1.
MS1 MS2 MS3
Parent ion Base ion Secondary ions Base ion Secondary ions
Peak
No. Compound
Rt
min
[M-H] -
(m/z)
m/z (intensity) m/z (intensity)
m/z (intensity) m/z (intensity)
1 CQA 11.5 353 191 (100) 179 (90), 135 (30)
2 CQA 12.0 353 179 (100) 135 (20), 191 (5)
3 3-CQA 14.3 353 191 (100) 179 (60), 135 (10)
4 CQA 25.6 353 179 (100) 191 (50), 135 (25)
5 CQA 27.7 353 191 (100) 179 (5)
6 4-CQA 28.7 353 173 (100) 179 (80, 191 (20)
7 5-CQA 38.9 353 191 (100) 179 (5)
8 3-FQA 40.7 367 193 (100) 191 (5)
9 3-CQL 55.6 335 161 (100) 135 (60)
10 4-CQL 58.9 335 161 (100) 135 (15)
11 4-FQA 61.4 367 173 (100) 193 (25)
12 5-FQA 70.9 367 191 (100) 173 (5)
13 FQL 79.7 349 175 (100) 149 (50), 193 (30)
14 4-FQL 80.7 349 175 (100) 160 (10),193 (25)
15 3,4-diCQA 84.9 515 353 (100) 335 (20), 173 (20) 173 (100) 179 (90), 191 (50)
16 3,5-diCQA 86.9 515 353 (100) 191 (100) 179 (70), 173 (5)
17 4,5-diCQA 93.2 515 353 (100) 173 (100) 179 (70), 191 (20)
18 3-C-4-FQA 94.8 529 367 (100) 335 (15), 173 (15) 173 (100) 193 (20)
19 3-C-5-FQA 96.5 529 353 (100) 367 (40), 191 (20) 191 (100) 179 (50)
20 4-C-5-FQA 98.7 529 353 (100) 367 (20) 173 (100) 179 (80), 191 (30)
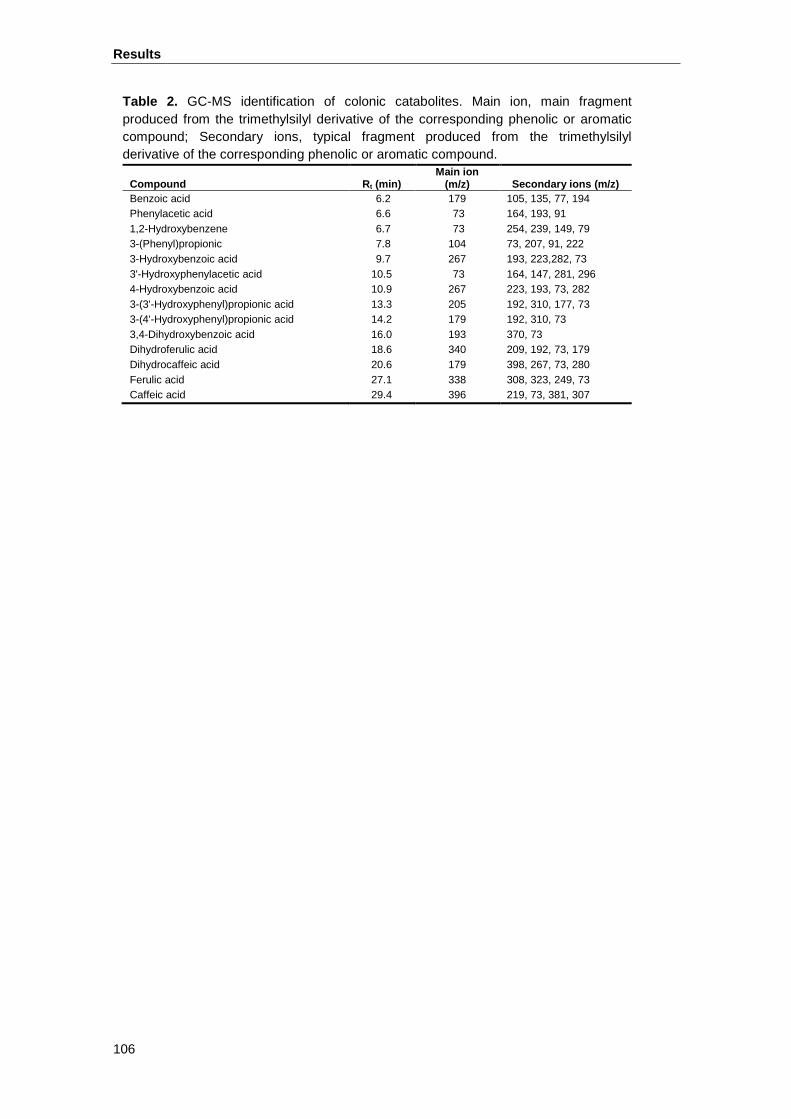
Results
106
Table 2. GC-MS identification of colonic catabolites. Main ion, main fragment produced from the trimethylsilyl derivative of the corresponding phenolic or aromatic compound; Secondary ions, typical fragment produced from the trimethylsilyl derivative of the corresponding phenolic or aromatic compound.
Compound R t (min) Main ion
(m/z) Secondary ions (m/z) Benzoic acid 6.2 179 105, 135, 77, 194 Phenylacetic acid 6.6 73 164, 193, 91 1,2-Hydroxybenzene 6.7 73 254, 239, 149, 79 3-(Phenyl)propionic 7.8 104 73, 207, 91, 222 3-Hydroxybenzoic acid 9.7 267 193, 223,282, 73 3'-Hydroxyphenylacetic acid 10.5 73 164, 147, 281, 296 4-Hydroxybenzoic acid 10.9 267 223, 193, 73, 282 3-(3'-Hydroxyphenyl)propionic acid 13.3 205 192, 310, 177, 73 3-(4'-Hydroxyphenyl)propionic acid 14.2 179 192, 310, 73 3,4-Dihydroxybenzoic acid 16.0 193 370, 73 Dihydroferulic acid 18.6 340 209, 192, 73, 179 Dihydrocaffeic acid 20.6 179 398, 267, 73, 280 Ferulic acid 27.1 338 308, 323, 249, 73 Caffeic acid 29.4 396 219, 73, 381, 307

GENERAL DISCUSSION

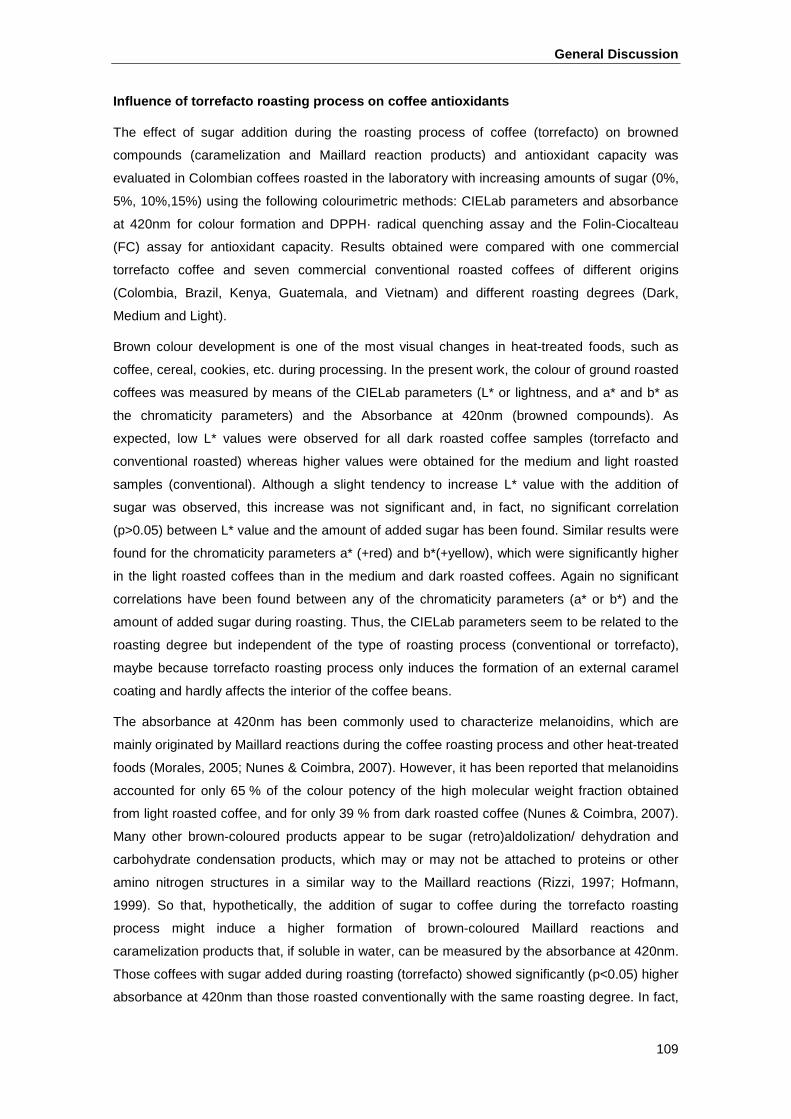
General Discussion
109
Influence of torrefacto roasting process on coffee antioxidants
The effect of sugar addition during the roasting process of coffee (torrefacto) on browned
compounds (caramelization and Maillard reaction products) and antioxidant capacity was
evaluated in Colombian coffees roasted in the laboratory with increasing amounts of sugar (0%,
5%, 10%,15%) using the following colourimetric methods: CIELab parameters and absorbance
at 420nm for colour formation and DPPH· radical quenching assay and the Folin-Ciocalteau
(FC) assay for antioxidant capacity. Results obtained were compared with one commercial
torrefacto coffee and seven commercial conventional roasted coffees of different origins
(Colombia, Brazil, Kenya, Guatemala, and Vietnam) and different roasting degrees (Dark,
Medium and Light).
Brown colour development is one of the most visual changes in heat-treated foods, such as
coffee, cereal, cookies, etc. during processing. In the present work, the colour of ground roasted
coffees was measured by means of the CIELab parameters (L* or lightness, and a* and b* as
the chromaticity parameters) and the Absorbance at 420nm (browned compounds). As
expected, low L* values were observed for all dark roasted coffee samples (torrefacto and
conventional roasted) whereas higher values were obtained for the medium and light roasted
samples (conventional). Although a slight tendency to increase L* value with the addition of
sugar was observed, this increase was not significant and, in fact, no significant correlation
(p>0.05) between L* value and the amount of added sugar has been found. Similar results were
found for the chromaticity parameters a* (+red) and b*(+yellow), which were significantly higher
in the light roasted coffees than in the medium and dark roasted coffees. Again no significant
correlations have been found between any of the chromaticity parameters (a* or b*) and the
amount of added sugar during roasting. Thus, the CIELab parameters seem to be related to the
roasting degree but independent of the type of roasting process (conventional or torrefacto),
maybe because torrefacto roasting process only induces the formation of an external caramel
coating and hardly affects the interior of the coffee beans.
The absorbance at 420nm has been commonly used to characterize melanoidins, which are
mainly originated by Maillard reactions during the coffee roasting process and other heat-treated
foods (Morales, 2005; Nunes & Coimbra, 2007). However, it has been reported that melanoidins
accounted for only 65 % of the colour potency of the high molecular weight fraction obtained
from light roasted coffee, and for only 39 % from dark roasted coffee (Nunes & Coimbra, 2007).
Many other brown-coloured products appear to be sugar (retro)aldolization/ dehydration and
carbohydrate condensation products, which may or may not be attached to proteins or other
amino nitrogen structures in a similar way to the Maillard reactions (Rizzi, 1997; Hofmann,
1999). So that, hypothetically, the addition of sugar to coffee during the torrefacto roasting
process might induce a higher formation of brown-coloured Maillard reactions and
caramelization products that, if soluble in water, can be measured by the absorbance at 420nm.
Those coffees with sugar added during roasting (torrefacto) showed significantly (p<0.05) higher
absorbance at 420nm than those roasted conventionally with the same roasting degree. In fact,
General Discussion
110
highly significant (p<0.001) and excellent correlation (0.876) between the absorbance at 420nm
and the amount of sugar added during the roasting process has been found showing that this
parameter might be proposed as a marker for the torrefacto roasting process. The highest
absorbances at 420nm in torrefacto coffees also explain that caramelization products in
torrefacto roasted coffee are mainly water soluble.
The antioxidant capacity of the torrefacto roasted coffees in comparison with conventional
roasted coffees was evaluated by two colourimetric assays, the DPPH· radical quenching assay
and the Folin-Ciocalteau (FC) assay. Focusing on the influence of sugar addition during the
roasting process, correlation results show a clear and significant (0.701, p<0.001) tendency to
increase the DPPH antioxidant capacity with the amount of sugar added during roasting
process. In fact, significant correlation between DPPH and absorbance at 420nm, proposed as
a good marker for the torrefacto roasting process, was found (0.721, p<0.001). These findings
are in agreement with those obtained in commercial torrefacto roasted coffee blends (López-
Galilea et al., 2006b; López-Galilea et al., 2007). Thus, the higher DPPH quenching activity
found in torrefacto coffees can be attributed mainly to the formation of Maillard reactions and
caramelization antioxidant products (Manzocco et al., 2000). Commercial conventional roasted
coffees showed lower DPPH antioxidant capacity results than lab-roasted torrefacto roasted
coffees. This might be explained by a longer storage (from roasting to purchase) under less
controlled conditions (room temperature) in commercial samples, because during storage the
antioxidant capacity decreases due to the presence of residual oxygen, and other radicals or
pro-oxidant compounds formed during the roasting process (Manzocco et al., 2002). Moreover,
roasting degree seems to influence conventional roasted coffees in different ways, depending
on the origin or variety because DPPH increased with a higher roasting degree (Dark vs
Medium) for Colombia coffee (Arabica), but decreased for Vietnam one (Robusta) (Medium vs
Light). This could be due to the fact that although Robusta coffee has higher amounts of
phenolic compounds than Arabica ones, roasting induces a higher loss of these antioxidant
compounds in Robusta coffees (Clifford, 1997; Perrone et al., 2010). In fact, only moderate
correlation between DPPH and L* values (-0.483, p<0.001) has been found. In regard to the
provenance of coffee, conventional roasted coffees of different origins and the same roasting
degree (Medium) can be ranked according to the DPPH quenching activity in increasing order
as follows: Brazil < Vietnam < Colombia < Guatemala < Kenya.
The Folin Ciocalteau method is traditionally used to measure phenolic compounds, but several
authors have reported that this method also evaluates other reducing nonphenolic compounds,
such as melanoidins, proteins and thiols, and thus should be seen as a measure of total
antioxidant capacity rather than phenolic content (Caemmerer & Kroh, 2006; Everette et al.,
2010; Perez-Martinez et al., 2010). A decrease in the antioxidant capacity measured by the
Folin-Ciocalteau technique in conjunction with the increase of roasting degree can be observed.
A highly significant (p<0.001) and good correlation (0.785) with L* values has been found.
Similar patterns were reported by other authors (Bekedam et al., 2008a; Sacchetti et al., 2009)
in conventional roasted coffees, mainly due to a higher degradation of chlorogenic acids. Loss
General Discussion
111
of phenolic compounds during roasting is very well known and losses of 8-10% for every 1%
loss of dry matter (Clifford, 1997; Clifford, 1999; Clifford, 2000) up to 95% of the chlorogenic
acid content in green coffee with drastic roasting conditions were reported (Trugo & Macrae,
1984). Higher FC reducing capacities were found in those coffees roasted with sugar
(torrefacto) in comparison with their respective conventional roasted ones (same origin, same
roasting degree). For that reason, the influence of torrefacto roasting on phenolic compounds
was studied more deeply in those coffees roasted with increasing amounts of sugar addition. 5-
caffeoilquinic, caffeic and ferulic acids, and 4-vinylguaiacol were quantified in these latter
samples by HPLC analyses and results were similar to those reported for commercial
Colombian coffees by Lopez Galilea et al. (2008b). Little differences among coffees samples in
the four phenolic compounds (3.48-6.34 mg 5-CQA, 4.03-5.16 µg caffeic acid, 37.22-49.15µg
ferulic acid, and 6.60-7.87 µg 4-vinylguaiacol per g of coffee) were observed. These differences,
most of them statistically non-significant (p<0.05), seem to be due to normal variations during
the roasting process, but not to the addition of sugar during the torrefacto roasting process. The
addition of sugar during the torrefacto roasting process did not reduce the degradation of the
main phenolic compounds caused by heat treatment as was suggested by the Folin-Ciocalteau
technique if it is used as a measurement of the total phenolic compounds. This discrepancy in
the results might be explained by the presence of other reducing nonphenolic compounds
formed during the torrefacto roasting process that react with the Folin Ciocalteau reagent, but
not by a protective effect of torrefacto roasting against the degradation of phenolic compounds.
This agrees with the results of Lopez Galilea et al. (2008b) who do not find any correlations
between phenolic compounds and torrefacto roast in commercial coffee blends. Thus, it could
be said that torrefacto roasting process hardly affects the final content of phenolic compounds
that seems to be more influenced by other factors such as roasting degree, the variety of coffee,
etc. (Farah et al., 2006).
To evaluate at a glance the influence of the roasting type (conventional or torrefacto) and the
roasting degree (Dark, Medium and Light) on the antioxidant activity and colour of coffee
samples, Principal Component Analysis (PCA) has been applied to the results obtained from the
present study. Figure 1 shows a bidimensional representation of all the variables and coffee
samples according to the two selected Principal Components (PC). PC1 (65.2% of the total
variance) was mainly characterized by the CIELab colour parameters (L*, a* and b*) and the
Folin-Ciocalteau reducing capacity. It could be observed that PC1 distributed all the coffee
samples according to the roasting degree, the dark samples being on the left half of the graphic,
but independently of the origin, variety and type of roasting process (conventional or torrefacto).
PC2 (19.2% of the total variance) was mainly and positively characterized by the absorbance at
420nm. Moreover, DPPH quenching activity contributed partially to the PC2. Thus, those
coffees roasted with sugar addition (torrefacto) were mapped in the top half-part of the graphic.
Roasting degree also exerts influence on brown compounds formation because dark roasted
coffees showed significantly (p<0.05) higher absorbances at 420nm than conventional medium
and light roasted coffees. However, this influence was much lower than that induced by
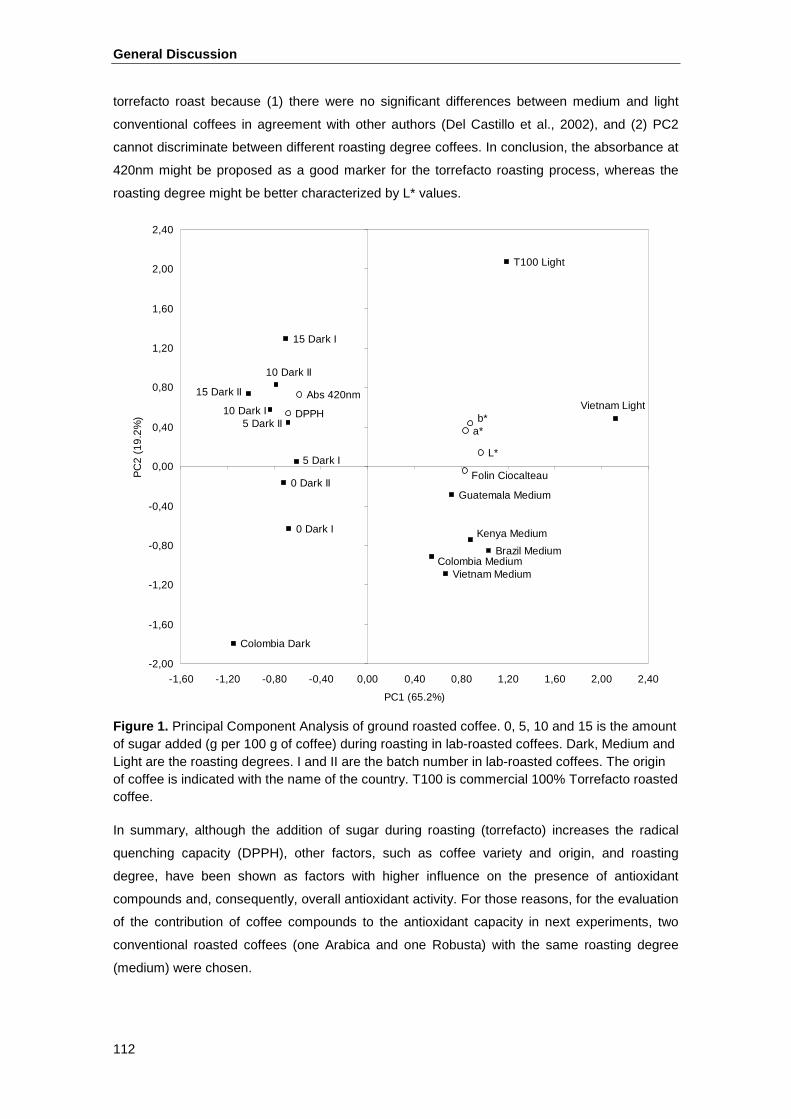
General Discussion
112
torrefacto roast because (1) there were no significant differences between medium and light
conventional coffees in agreement with other authors (Del Castillo et al., 2002), and (2) PC2
cannot discriminate between different roasting degree coffees. In conclusion, the absorbance at
420nm might be proposed as a good marker for the torrefacto roasting process, whereas the
roasting degree might be better characterized by L* values.
0 Dark I
5 Dark I
10 Dark I
15 Dark I
Colombia Dark
T100 Light
Vietnam Medium
Brazil Medium
Kenya Medium
Guatemala Medium
Colombia Medium
Vietnam Light
L*
b*a*
Folin Ciocalteau
DPPH
Abs 420nm
0 Dark II
5 Dark II
10 Dark II
15 Dark II
-2,00
-1,60
-1,20
-0,80
-0,40
0,00
0,40
0,80
1,20
1,60
2,00
2,40
-1,60 -1,20 -0,80 -0,40 0,00 0,40 0,80 1,20 1,60 2,00 2,40
PC1 (65.2%)
PC
2 (1
9.2%
)
Figure 1. Principal Component Analysis of ground roasted coffee. 0, 5, 10 and 15 is the amount of sugar added (g per 100 g of coffee) during roasting in lab-roasted coffees. Dark, Medium and Light are the roasting degrees. I and II are the batch number in lab-roasted coffees. The origin of coffee is indicated with the name of the country. T100 is commercial 100% Torrefacto roasted coffee.
In summary, although the addition of sugar during roasting (torrefacto) increases the radical
quenching capacity (DPPH), other factors, such as coffee variety and origin, and roasting
degree, have been shown as factors with higher influence on the presence of antioxidant
compounds and, consequently, overall antioxidant activity. For those reasons, for the evaluation
of the contribution of coffee compounds to the antioxidant capacity in next experiments, two
conventional roasted coffees (one Arabica and one Robusta) with the same roasting degree
(medium) were chosen.
General Discussion
113
Extractability of coffee antioxidants
Brewing process is essential for the antioxidant composition and health properties of a coffee
brew, because the contact of water with roasted coffee grounds is the crucial step for extraction
of coffee compounds. Previous works showed that some chemical species identified in roasted
coffee, including antioxidants, exhibit different extraction rates that may also be influenced by
the choice of brewing technique (Petracco, 2001, 2005; Lopez-Galilea et al., 2007) and
technological conditions (water pressure and temperature, and coffee/water ratio) (Andueza et
al., 2002, 2003, 2007). However, in these studies, among coffee phenolics, only 5-caffeoylquinic
acid has been quantified. Although this is the most abundant phenolic in coffee, many other
chlorogenic acids may contribute to the antioxidant capacity. The knowledge of extraction
behaviour of the main coffee antioxidants during brewing time might lead to identify the
technological factors with major impact on antioxidant extraction. Thus, it could be possible to
obtain not only coffee brews with higher antioxidant capacity, but also coffee extracts with health
properties that can be used as ingredients in functional foods. For these reasons, before to
evaluate the contribution of Maillard reaction products and phenolic compounds to the
antioxidant capacity of coffee brews, it is of a great interest to study the extraction behaviour of
the main coffee antioxidants and the antioxidant capacity, during brewing time in the most
widely consumed coffee brew procedures (espresso and filter coffeemakers).
One Arabica coffee (origin Guatemala that was one of the coffees with the highest antioxidant
capacity, Ludwig et al., 2013) and one Robusta coffee (origin Vietnam) with the same roasting
degree (medium) were selected for the preparation of filter and espresso coffee brews. To study
the extractability of coffee antioxidants, three fractions for espresso coffee (F1-F3) and 5
fractions for filter coffee (F1-F5) were collected sequentially every 8 s and every 75 s,
respectively, during the brewing process.
The volumes of the three espresso coffee fractions were quite similar, ranging from 14 to 17 mL
because espresso coffeemaker applies constant pressure that forces water through the coffee
grounds with a constant flow. In contrast, the volumes of the filter coffee fractions increased
from F1 (76-80 mL) up to F3 (160-186 mL) and then decreased to F5 (26-54 mL), showing an
inverted U-shape profile. In filter coffee no mechanical forces are applied, and the brew volume
dripping out from the extraction chamber depends on the water amount, and consequently on
the water pressure in the extraction chamber of the coffeemaker according to Darcy’s law
(Petracco, 2005). This fact explains the low volume obtained for F1 (0-75 s). With time, water
fills the extraction chamber increasing the pressure and favouring that water passes through the
coffee bed, which leads to higher volumes in the middle fractions. At the end of the brewing
procedure, pressure decreases when the water reservoir depletes, giving the lowest volume in
the last fraction (F5).
The antioxidant capacity of the coffee brews and fractions obtained by espresso and filter
coffeemakers was measured by means of three colourimetric assays (Folin-Ciocalteau, ABTS
General Discussion
114
and DPPH) and two electron spin resonance (ESR) spectroscopy techniques (Fremy´s salt and
TEMPO).
The Folin-Ciocalteau assay, based on an electron-transfer reaction, is the most popular method
to evaluate the total phenolic compounds. However, the Folin-Ciocalteau reagent can be
reduced by many electron-donors, not only phenolic compounds (Huang et al., 2005). ABTS·+
and DPPH· were chosen to assess the radical scavenging activity in coffee fractions. These
radicals react energetically with hydrogen-donors, such as phenolic compounds, being DPPH·
likely more selective in the reaction with H-donors than ABTS·+ (Huang et al., 2005). In these
three colourimetric assays, Robusta coffee brews showed significantly (p<0.01) higher
antioxidant capacity than Arabica ones. The results were similar to those reported by other
authors in espresso and filter coffee brews (Sanchez-Gonzalez et al., 2005; Perez-Martinez et
al., 2010).
Espresso coffee fractions from both coffee varieties showed a remarkable decrease in
antioxidant capacity with brewing time in all three colourimetric assays. More than 70% of the
overall antioxidant capacity of an espresso coffee brew was found in F1 (0-8 s), whereas F3
accounted for less than 12 %. These results demonstrate that the compounds responsible for
the antioxidant activity of an espresso coffee brew are mainly extracted at the beginning of the
brewing process and, afterwards, are diluted. Similar results were found by Alves et al. (2010)
for DPPH antioxidant activity in espresso coffees with different brew lengths (“short” to “long”).
To go deeper into the influence of brewing time on antioxidant capacity due to phenolics or
Maillard reaction products (MRP), Electron spin resonance (ESR) spectroscopy was applied
using Fremy’s salt and TEMPO radicals. Mainly phenolic compounds can be detected when
Fremy’s salt is used as the stabilized radical, whereas TEMPO is mainly scavenged by Maillard
reaction products (MRP), such as melanoidins (Caemmerer & Kroh, 2006). The results obtained
with ESR spectroscopy showed that Fremy´s salt scavenging capacity was almost four times
higher than TEMPO. Similar results were reported by other authors who proposed that the
phenolic antioxidants evaluated by Fremy´s salt dominate the overall antioxidant capacity of
coffee brews, whereas the contribution of roasting-induced antioxidants is rather limited
(Bekedam et al., 2008b; Perez-Martinez et al., 2010).
The ESR antioxidant capacity of espresso coffee fractions showed that F1 (0-8 s) accounted for
75-81 % and for 86-89 % of the Fremy´s salt and TEMPO scavenging capacity of an espresso
coffee brew, respectively. Whereas antioxidant capacity due to phenolics and measured by
Fremy’s salt assay showed a similar profile to the results obtained with the colourimetric assays,
the high percentages observed for TEMPO scavenging capacity in F1 indicate that MRP
antioxidants were extracted mainly during the first 8 seconds and more quickly than phenolics.
In fact the last fraction (16-24 s) only accounted for 1-2 % of the TEMPO scavenging capacity.
Filter coffee fractions showed different antioxidant capacity extraction behaviours in comparison
to espresso coffee, being also different in the two coffee samples, Arabica and Robusta. In
Arabica filter coffee, all antioxidant capacity assays showed a U-shape profile with the highest
General Discussion
115
concentration in F1 (0-75 s) and F5 (300-375 s) and the lowest in F3 (150-225 s). However, in
Robusta coffee the U-shape antioxidant capacity extraction started after 75 s, showing F1 the
lowest values. This could be due to a higher water absorption in Robusta coffee at the
beginning of the brewing process that leads to a longer wetting stage. The wettability depends
on the particle shape and size that may be different depending on factors like grinding that is
also influenced by coffee origin or variety and roasting degree (Lingle, 1996). In this work, taking
into account that roasting degree and grinding conditions were maintained the same, different
wettability may be due to different brittleness of Arabica and Robusta coffee beans. The
increase of antioxidant capacity in the last fractions (F4 and F5) of filter coffee brews could be
due to the water pressure decrease that induces a lower flow and a longer contact time between
water and ground coffee. Nevertheless, it should be stressed that the last fraction (F5) had the
lowest volume (26 mL and 54 mL for Arabica and Robusta coffees, respectively) and thus, its
contribution to the antioxidant capacity of the overall coffee brew was rather limited (~9 % and
~14 %, respectively). The results of the antioxidant capacity due to phenolics and MRP,
measured by ESR spectroscopy in filter coffee fractions using Fremy’s salt and TEMPO, also
corroborate that the antioxidants extraction seems to be delayed in Vietnam filter coffee. This
was more pronounced in TEMPO antioxidant capacity that mainly evaluates the scavenging
activity of melanoidins which are polymeric compounds with more difficult to be released without
water pressure.
The antioxidant capacity of coffee brew is attributed to both, natural antioxidants, like phenolic
compounds, and roasting-induced antioxidants, like melanoidins and other MRPs. To know the
influence of brewing time on the main antioxidant compounds, browned compounds (Abs
420 nm), caffeine and caffeoylquinic acids were quantified in the coffee samples. Extraction
behaviour of browned compounds was in all samples similar to TEMPO scavenging capacity
measured by ESR spectroscopy. In fact, high correlation (r=0.969, p<0.001) between
absorbance at 420 nm and TEMPO antioxidant capacity was found. These results support the
findings described above about extraction behaviour of MRP.
Among coffee components, caffeine has been proposed as an antioxidant compound against
lipid peroxidation induced by reactive oxygen species (Lee, 2000). Caffeine was found in
significantly higher concentration in Robusta espresso and filter coffee brews and fractions. It is
very well known that Robusta coffees are richer in caffeine than Arabica ones (Belitz et al.,
2009). Thus, caffeine might partially explain the higher antioxidant capacity of Robusta coffee
brews that could not be attributed to the caffeoylquinic acids that were found in lower amounts
in these coffee brews, as will be discussed later. In fact, high correlations have been found
between antioxidant capacity assays and caffeine (r values ranging from 0.906 for Fremy’s salt
assay to 0.968 for DPPH). Other authors also reported similar findings, suggesting that caffeine
might be a good contributor to the antioxidant capacity or reducing power of coffee brews
(López-Galilea et al., 2007; Vignoli et al., 2011). Nevertheless a more in-depth analysis of the
compositional differences between Arabica and Robusta coffees is necessary to confirm these
results.
General Discussion
116
Caffeoylquinic acids (CQAs) are the most abundant chlorogenic acid class accounting for 76-
84% of the total CGA in green coffee (Perrone et al., 2008). Although during roasting CGAs are
lost up to 95%, CQA still are the predominant CGA in roasted coffee (Trugo & Macrae, 1984).
Monocaffeoylquinic acids (3-CQA, 4-CQA, 5-CQA) and dicaffeoylquinic acids (3,4-diCQA, 3,5-
diCQA, 4,5-diCQA) were identified and quantified by HPLC-PDA in each fraction and coffee
brew. 5-CQA was the major compound among CQAs in all samples, followed by 4-CQA and 3-
CQA. The diCQAs were present in much lower concentration than CQAs. These results are in
agreement with those reported by other authors in roasted coffee (Perrone et al., 2008) and in
coffee brew (Alves et al., 2010). Higher amounts of chlorogenic acids in Robusta coffees than in
Arabica ones have been extensively reported (Farah et al., 2005). However, in this study lower
amounts of CQA were found in Robusta coffee than in Arabica ones. Also Vignoli et al. (2011)
observed higher amount of 5-CQA in Arabica soluble coffee. This could be due to several
factors, such as the origin of coffee and the higher loss of chlorogenic acids in Robusta coffee
during roasting process (Clifford, 1997; Perrone et al., 2010).
Fractions obtained from espresso coffeemaker showed in both coffee varieties a steep
decrease with extraction time in all three monocaffeoylquini acid isomers (3-, 4-, and 5-CQA).
F1 (0-8s) accounted for about 70 %, F2 (8-16 s) for 17 % and F3 (16-24 s) for less than 14 % of
the total CQA amounts found in an espresso coffee brew. The CQA extraction behaviour was
similar to that of the antioxidant capacity measured by colourimetric assays and Fremy´s salt,
showing high correlations (r values ranging from 0.727 to 0.903, p<0.001), most likely because
monocaffeoylquinic acids are the most abundant phenolic compounds in coffee. In contrast,
diCQAs were extracted more slowly, accounting F1 for ~50 %, F2 for ~30 % and F3 still for
~20 %, showing correlations coefficients lower than 0.700 The esterification of an additional
caffeic acid moiety in diCQA increases the number of hydroxyl groups and might favor the
retention of these compounds by interaction with melanoidins or other polymeric compounds
(Kroll et al., 2003; Bekedam et al., 2008c), reducing the release of diCQA. In fact, the hydrogen
bonding between hydroxyl groups of the phenolic compounds and the amide carbonyls of the
peptide bond was found to be a common non-covalent link between phenolics and melanoidins
(Nunes & Coimbra, 2010). Also the weaker polarity of the diCQA compared to the CQA might
explain the slower release of these compounds during extraction with water (Kroll et al., 2003).
Blumberg et al. (2010) studied the influence of hot water percolation on the concentration of
monocaffeoylquinic acids and chlorogenic acid lactones and reported that dicaffeoylquinic
lactones were extracted rather slowly in comparison to monocaffeoylquinic ones.
Caffeoylquinic acids extraction behaviour was different in filter coffee. Different extraction
profiles were also found for the two coffee samples. In Arabica filter coffee, CQAs and diCQAs
extraction showed a U-shape profile with the highest concentration in F1 (0-75 s) and F5 (300-
375 s) and the lowest in F3 (150-225 s), similar to that observed for antioxidant capacity
according to the correlations showed before. However, in Robusta filter coffee the U-shape
extraction of caffeoylquinic acids started after 75 s, and F1 exhibited the significantly lowest
caffeoylquinic acids concentration. The delay in caffeoylquinic acids extraction might be
General Discussion
117
attributed to the longer wetting stage observed in Robusta coffee, as described above. On the
other hand, the increased extraction of caffeoylquinic acids in the last stage of the brewing
process, could be due to the water pressure decrease that induces a lower flow and a longer
contact time between water and ground coffee. This might facilitate the hydrolysis of
caffeoylquinic acids bound to melanoidins increasing their release during advanced stages of
filter coffee brewing (Lingle, 1996). However, when the low volumes of these fractions are taken
into account, it could be observed that caffeoylquinic acids from F5 only accounted for ~8 % and
~11 % of the total contents in Arabica and Robusta filter coffee brews, respectively.
Unlike in espresso coffee, similar extraction percentages among CQAs and diCQAs in each
coffee fraction along the filter brewing process were observed. Moreover, when the
concentration of antioxidants is calculated per gram of coffee taking into account the different
fraction volumes, higher extraction of these phenolic compounds per gram of coffee was
obtained in filter coffee brews than in espresso ones, in agreement with Pérez-Martinez et al.
(2010). This may be due to the technological differences between espresso and filter
coffeemaker. Although the high water pressure applied in espresso coffeemaker favors the
extraction process, the short contact time between water and coffee grounds, the high
coffee/water ratio and the limited space in the coffee cake does not allow equilibrium to be
reached (Petracco, 2005). In contrast, longer contact time and turbulences in the extraction
chamber of the filter coffeemaker allow the water in immediate contact with the coffee to extract
additional compounds when it has not become so saturated with dissolved material. Thus, both
technological factors might favor the extraction of CQAs and diCQAs, free and bound with
melanoidins. In fact, turbulences are considered, after time and temperature, the third most
important factor in filter coffee brewing (Lingle, 1996).
In summary, brewing time plays a key role in antioxidants extraction of coffee. To optimize their
extraction in order to obtain antioxidants that can be used as ingredients for functional foods,
several technological factors should be taken into account. Thus, higher water pressure
increases antioxidants extraction speed as observed in espresso coffee. Nevertheless,
parameters like turbulence and longer contact time, typically of a filter coffeemaker, should be
considered in order to increase extraction efficiency, mainly of less polar antioxidant compounds
as diCQA. Further research in the influence of technological parameters on chemical
composition of coffee brew fractions, as well as their sensory properties, should be needed
before industrial development.
Contribution of volatile Maillard reaction products to the antioxidant capacity of coffee
Roasting process induces the formation of a great variety of volatile compounds, most of them
Maillard reaction products, which contribute to aroma that is one of the most valuable properties
of roasted coffee. In addition, some studies have proposed several heterocyclic compounds
formed during heat treatment as being potentially antioxidant (Fuster et al., 2000; Yanagimoto
et al., 2002). For this work, one Arabica coffee (origin Colombia that is one of the most aromatic
coffee) and one Robusta coffee (origin Vietnam) with the same roasting degree (medium) were
General Discussion
118
selected to study the profile of their volatile compounds and later to quantify those who are
proposed as potent antioxidants and to evaluate their contribution to the overall antioxidant
capacity of coffee.
A total of sixty-two and sixty-four volatile compounds were identified and quantified for Arabica
and Robusta coffee, respectively. They comprised 4 sulfur compounds, 8 aldehydes, 6 esters,
15 furans, 8 ketones, 5 alcohols, 2 thiophenes, 6 pyrroles, 2 pyridines, 4 pyrazines, 2 thiazoles,
1 lactone, 2 phenolic compounds, 1 alkene, and 1 ether.
Arabica coffee showed a significantly higher total area of volatiles than Robusta (2.1x10⁶ vs
0.7x10⁶), mainly because the most abundant volatile chemical classes (aldehydes, furans,
ketones and esters) were significantly higher in Arabica samples. Aldehydes and esters are
responsible for fruity and malty coffee flavour notes, whereas diketones contribute to the buttery
aroma, and furans are considered to be responsible for the typical roasted coffee aroma
(Semmelroch & Grosch, 1995; Maeztu et al., 2001; Flament, 2001). Similar results were
reported by other authors (Sanz et al., 2002; Lopez Galilea et al., 2008a) when they compared
the volatile compounds of Arabica coffee with those found in Arabica-Robusta coffee blends
roasted by conventional or torrefacto techniques. In contrast, chromatographic areas of
pyrazines and pyridines, and in less proportion thiazoles, were higher in Robusta coffee.
Pyrazines are responsible for roasty, earthy, musty and woody flavour notes characteristic of
Robusta coffee (Blank et al., 1991; Semmelroch & Grosch, 1995; Lopez Galilea et al., 2006a)
and pyridines contribute to smoky aroma (Flament, 2001). Also, low molecular weight phenolic
compounds, and mainly 2-methoxyphenol (guaiacol) that is a key odorant (Semmelroch &
Grosch, 1995; Sanz et al., 2002) responsible for phenolic and burnt aroma (Lopez Galilea et al.,
2006a), were only detected in Robusta coffee samples at low levels but not in Arabica. Similar
results were found by other authors in conventional roasted Arabica and Robusta coffee
(Semmelroch & Grosch, 1995; Maeztu et al., 2001; Lopez Galilea et al., 2008b) and coffee
brews (Maeztu et al., 2001).
Several studies suggest that some heterocyclic compounds developed during coffee roasting
such as furans, pyrroles and thiophenes, exhibit antioxidant properties (Fuster et al., 2000;
Yanagimoto et al., 2002; Yanagimoto et al., 2004). However, Lopez Galilea et al. (2008b) found
significant negative correlations of these compounds with antioxidant capacity suggesting a
prooxidant capacity. Despite the different approach in these studies, the results might not be
considered as contradictory if it is taken into account that some antioxidant compounds may act
as prooxidant at different doses. Most of the work which study the antioxidant capacity of
volatiles have been carried out using standard compounds at higher concentration than those
present in coffee. Thus, these results cannot be directly transferred to the knowledge of the
antioxidant capacity of coffee. For those reasons, the concentration of heterocyclic volatile
compounds in coffee was firstly measured to further assess their actual contribution to the total
antioxidant capacity of coffee at the concentration usually found in coffee.
General Discussion
119
Seven furans (furan, 2-methylfuran, 2,5-dimethylfuran, 2-methyl-tetrahydrofuran-3-one, furfural,
5-methylfurfural and 2-furfurylacetate), three pyrrols (1-methylpyrrole, pyrrole, and 2-formyl-1-
methyl-pyrrole), and two thiophenes (thiophene and 2-methylthiophene) were initially chosen
because they were previously proposed by other authors as potential antioxidants, but also
because their chromatographic areas were the highest in analyzed coffee samples in most
cases. The concentration of these volatile compounds, were quantified in both Arabica and
Robusta coffees based on the calibration curves of the corresponding standard. Except in
thiophenes with the same concentrations, Arabica coffee exhibited higher concentration in all
analyzed compounds, showing considerably higher amounts of 2-methyl-tetrahydrofuran-3one
(more than 5-fold) and 5-methylfurfural (almost 3-fold) than in Robusta coffee. The volatiles with
the highest chromatographic areas, 2-methylfuran and 1-methylpyrrole, were not the most
abundant in coffee because the relationship between the chromatographic area and the
concentration is not the same for every volatile compounds. For that reason, the ranking order
among volatiles in each chemical family group was also different.
Model systems with the selected furans (Fu), pyrroles (Py), thiophenes (Th), and one with all of
them (Fu-Py-Th) were prepared based on the mean concentrations of each compound found in
Arabica and Robusta coffee. The antioxidant capacity of each model system was assessed
using the ABTS+ radical quenching assay. For each model system, three different concentration
levels including that found in coffee (coffee, 10-fold, 100-fold) were analyzed to evaluate the
dose dependent antioxidant activity.
Furans are cyclic ethers present in heated and roasted foods. A great variety of furans are
originated during roasting process in coffee as Maillard-reaction products, but they are also the
result of thermal oxidation of lipids and thermal degradation of thiamine, nucleotides, and
terpenes (Flament, 2001). In furan model system (Fu), any appreciable antioxidant activity at
coffee furan concentration was observed. However, for the 10-fold and 100-fold concentrated
furan model systems, ABTS+ quenching activities equivalent to 0.08 and 0.85 mmol Trolox per
liter were found, showing a linear dose dependent increase in antioxidant capacity. To ascertain
the contribution of each single furan to the overall Fu-model system antioxidant activity, volatile
compounds were tested individually. Because the furan model system showed no antioxidant
activity at concentration levels actually present in coffee, 10-fold concentrated solutions of each
furan were used to measure the ABTS+ antioxidant activity. From the 7 analyzed furans, only 2-
methyl-tetrahydrofuran-3-one exhibits antioxidant activity. This was no significant different to
that of the Fu-model system at the same concentration level (10-fold), showing that the
antioxidant activity of the main coffee furans might be mainly attributed to this volatile
compound, maybe because 2-methyl-tetrahydrofuran-3-one was by far the most abundant furan
in coffee. Although five of the furans analyzed (namely furan, 2-methylfuran, furfural, 5-
methylfurfural and 2-furfurylacetate) have been reported as potent antioxidants (Fuster et al.,
2000; Yanagimoto et al., 2002; Yanagimoto et al., 2004), results obtained in this study show
that even at concentrations 10-fold higher than actually present in coffee, only 2-methyl-
tetrahydrofuran-3-one exhibited a very limited radical scavenging activity.
General Discussion
120
Pyrroles are also formed during roasting process. Pyrrole and 1-methyl-pyrrole are formed in
the pyrolysis of proline and threonine alone or combined with glucose or sucrose, and in the
pyrolysis of trigonelline (Flament, 2001). 2-formyl-1-methylpyrrole is formed from 1-
methylpyrrole and also when D-xylose reacted thermally with various amines or amino acids
(glycine, alanine, beta-alanine, leucine). In Pyrrole model system (Py), no appreciable
antioxidant activity at concentration levels equivalent to coffee was found. The 10-fold and 100-
fold concentrated pyrrole systems exhibited antioxidant activity equal to 0.32 and 0.81 mmol
Trolox per liter, respectively, showing a non-linear dose dependent antioxidant activity increase.
In comparison with furans, pyrroles showed a 4 times higher radical quenching activity at 10-fold
concentrations, but similar antioxidant activity at 100-fold concentrations. These results suggest
a higher effectiveness of pyrroles at lower concentrations, as proposed by other authors (Fuster
et al., 2000) but still undetectable at coffee concentration. To assess the contribution of each
pyrrole, the three compounds were analyzed separately at 10-fold concentration by the ABTS
assay. Results reveal that the antioxidant activity measured for the Py model system might be
totally attributed to pyrrole, whereas 1-methylpyrrole and 2-formyl-1-methylpyrrol seem to be
ineffective in quenching ABTS+ radicals at the tested concentrations. Also, Yanagimoto et al.
(2002) observed that pyrrole inhibited hexanal oxidation higher than 1-methylpyrrole, but the
inhibition were quite low for both volatile compounds (<10% at 10 µg/mL for pyrrole and <3% at
5-20 µg/mL for 1-methylpyrrole). However, 2-formyl-1-methylpyrrole seems to be more effective
as a lipophilic antioxidant inhibiting hexanal oxidation in dichloromethane solutions (Yanagimoto
et al., 2002) than as a hydrophilic antioxidant quenching ABTS+ radicals in aqueous solutions
similar to coffee brews.
Thiophenes present in roasted coffee can be formed by pyrolysis of sulfur amino acids as
methionine or cysteine and cystine alone, or by browning reactions in the presence of sugars
(Flament, 2001). Although some authors (Fuster et al., 2000; Yanagimoto et al., 2002) reported
that both thiophenes found in coffee (thiophene and 2-methylthiophene) exhibit antioxidant
activity, the results obtained in this study did not show radical quenching activity at any analyzed
concentration level (coffee, 10-fold and 100-fold). This could probably be due to the very low
amounts of thiophenes used in this study to evaluate the ABTS+ antioxidant activity even at the
highest concentration (100-fold, with 10 µg/mL for tiophene and 2 µg/mL for 1-methylthiophene).
Actually, these compounds are present in coffee in very low amounts and therefore, although
their antioxidant capacity was demonstrated at high concentrations (more than 50 µg/mL),
tiophenes barely contribute to the antioxidant capacity of coffee.
When the antioxidant activity of a model system containing all the 12 selected heterocyclic
compounds (furans, pyrroles and thiophenes) was analyzed, no radical quenching activity was
detected at concentration levels similar to coffee brew, whereas ABTS+ quenching activity equal
to 0.35 and 0.90 mmol Trolox per liter were observed for 10-fold and 100-fold concentrated
samples, respectively. Thus, the radical quenching activity of the Fu-Py-Th model system was
slightly higher than the maximum value showed for each concentration (pyrroles at 10-fold and
furans at 10-fold), but not the sum of the model systems of furans and pyrroles. These results
General Discussion
121
suggest antagonistic effects among furans, pyrroles and thiophenes. Moreover, when the
ABTS+ quenching activity of model systems was compared to the overall antioxidant activity of a
filter coffee brew, the results clearly showed the almost insignificant contribution of these
heterocyclic volatile compounds to the antioxidant activity of coffee, even at the 100-fold
concentrated Fu-Py-Th model system, which exhibited the highest ABTS+ quenching activity,
accounting only for 3.3% of the overall activity of a filter coffee brew.
The most abundant volatile compounds in coffee are aldehydes and ketones and some of them
are also Maillard reaction products. For those reasons, we decided to test the antioxidant
activity of two new model systems, one with aldehydes (Ald) and another with ketones (Ke). In
terms of chromatographic areas, 2-methylpropanal, 2-methylbutanal and 3-methylbutanal
(Strecker degradation products of valine, isoleucine, and leucine), were the most abundant
aldehydes followed by acetaldehyde and propanal that are formed by pyrolysis of alanine and
serine, and/or sugar. However, acetaldehyde and propanal were in significantly higher
concentrations than Strecker aldehydes in both coffees. Also, two diones (2,3-butanedione and
2,3-pentanedione) were selected for quantification and further evaluation of their antioxidant
activity in a model system. All aldehydes and ketones were in significantly higher amounts in
Arabica coffee than in Robusta one, in agreement with other studies (Grosch, 1996). As in the
previous model systems, mean concentrations of the selected aldehydes and ketones found in
Arabica and Robusta coffee were used to prepare the aldehydes and the ketones model
systems The antioxidant capacity of each model system at three different concentration levels
(coffee, 10-fold and 100-fold) was assessed using the ABTS+ radical quenching assay. The
results shown that even at the highest concentration, the antioxidant capacity of the aldehydes
and ketones were negligible in comparison to that of the coffee brew and also to those of the
heterocyclic volatiles model systems.
In summary, volatile compounds present in coffee contribute very little to the antioxidant
capacity of coffee in comparison to other coffee chemical compounds, such as phenolics and
melanoidins. The results of the present study also indicate that, although some volatile
compounds may act as antioxidant in high doses, it is necessary to evaluate their capacity at
the actual concentrations in food samples. For these reasons, next experiments were mainly
focused on non-volatile compounds (phenolics and non-phenolics) present at the most common
coffee brews (espresso and filter) prepared with Arabica and Robusta roasted coffee.
Contribution of phenolic and non-phenolic compounds to the antioxidant capacity of
coffee
Despite the fact that technological factors influence the extractability of the main antioxidant
compounds in coffee, it should be taken into account that, similar to the volatiles, each
antioxidant present in coffee may contribute in different percentage to the overall antioxidant
capacity of coffee brews. In addition, as it was suggested before, it is necessary to evaluate
their antioxidant capacity at the actual concentrations in food samples. Thus, on-line ABTS
chromatographic analysis was used to evaluate the contribution of non-volatile compounds to
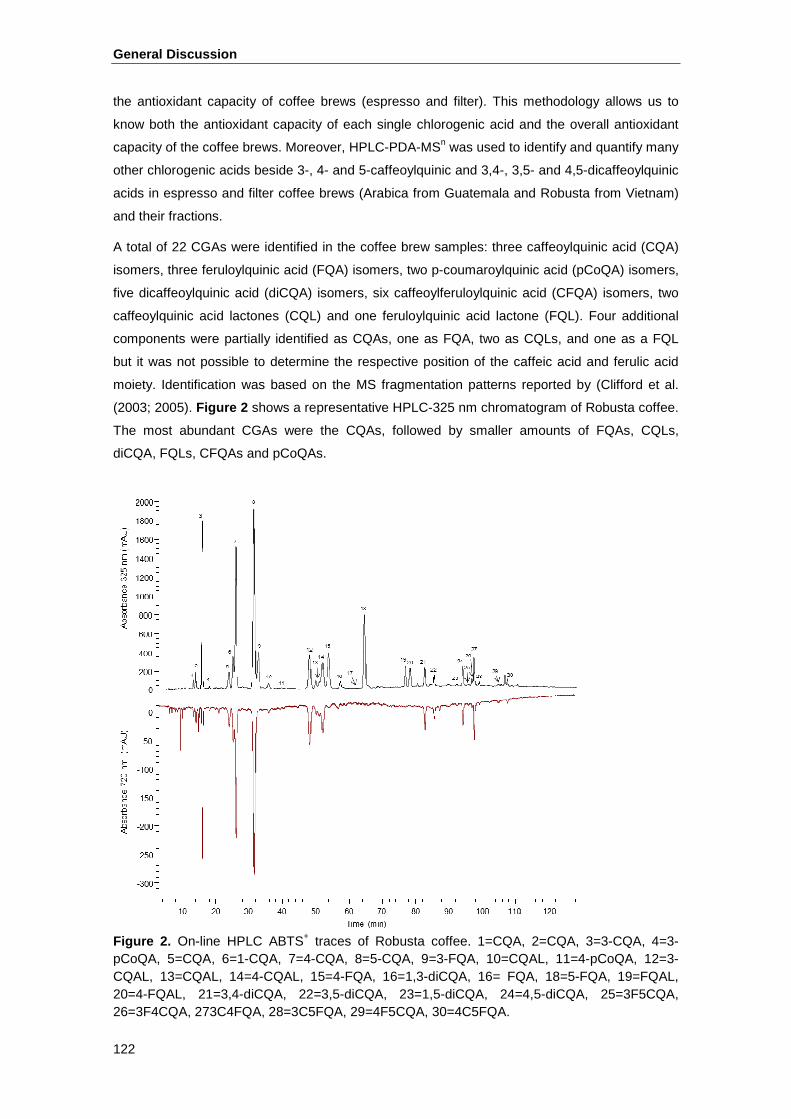
General Discussion
122
the antioxidant capacity of coffee brews (espresso and filter). This methodology allows us to
know both the antioxidant capacity of each single chlorogenic acid and the overall antioxidant
capacity of the coffee brews. Moreover, HPLC-PDA-MSn was used to identify and quantify many
other chlorogenic acids beside 3-, 4- and 5-caffeoylquinic and 3,4-, 3,5- and 4,5-dicaffeoylquinic
acids in espresso and filter coffee brews (Arabica from Guatemala and Robusta from Vietnam)
and their fractions.
A total of 22 CGAs were identified in the coffee brew samples: three caffeoylquinic acid (CQA)
isomers, three feruloylquinic acid (FQA) isomers, two p-coumaroylquinic acid (pCoQA) isomers,
five dicaffeoylquinic acid (diCQA) isomers, six caffeoylferuloylquinic acid (CFQA) isomers, two
caffeoylquinic acid lactones (CQL) and one feruloylquinic acid lactone (FQL). Four additional
components were partially identified as CQAs, one as FQA, two as CQLs, and one as a FQL
but it was not possible to determine the respective position of the caffeic acid and ferulic acid
moiety. Identification was based on the MS fragmentation patterns reported by (Clifford et al.
(2003; 2005). Figure 2 shows a representative HPLC-325 nm chromatogram of Robusta coffee.
The most abundant CGAs were the CQAs, followed by smaller amounts of FQAs, CQLs,
diCQA, FQLs, CFQAs and pCoQAs.
Figure 2. On-line HPLC ABTS+ traces of Robusta coffee. 1=CQA, 2=CQA, 3=3-CQA, 4=3-pCoQA, 5=CQA, 6=1-CQA, 7=4-CQA, 8=5-CQA, 9=3-FQA, 10=CQAL, 11=4-pCoQA, 12=3-CQAL, 13=CQAL, 14=4-CQAL, 15=4-FQA, 16=1,3-diCQA, 16= FQA, 18=5-FQA, 19=FQAL, 20=4-FQAL, 21=3,4-diCQA, 22=3,5-diCQA, 23=1,5-diCQA, 24=4,5-diCQA, 25=3F5CQA, 26=3F4CQA, 273C4FQA, 28=3C5FQA, 29=4F5CQA, 30=4C5FQA.
General Discussion
123
Although the overall contents of CGAs were not greatly different for both species, the CGAs
composition differed considerably. Arabica coffee had approx. 30 % higher amounts 3-, 4-, and
5-caffeoylquinic acids, whereas Robusta coffee showed 2-fold higher levels of FQAs and FQLs
and almost 5-fold higher amounts of CFQAs. These findings are in accordance with other
studies on coffee chlorogenic acids that report higher amounts of CGAs with a ferulic acid
moiety in Robusta coffee varieties (Clifford, 1997; Clifford, 2000). As regards the coffee making
procedure, filter and espresso, higher amounts of CGAs were found in espresso coffee, most
likely due to the higher coffee to water ratio and the pressure applied during extraction that
leads to a more concentrated coffee brew.
On-line ABTS chromatographic analysis was used to assess the antioxidant capacity of each
single CGA present in the coffee samples. After separation of coffee chlorogenic acids on the
HPLC column, the eluate was mixed with stabilized ABTS+ radical solution, which has a deep
blue colour. Any quenching of the radical resulted in a loss of colour, which was detected by
monitoring the absorbance at 720 nm giving a negative peak on the HPLC traces as illustrated.
The antioxidant capacities of individual compounds were added together to give the total HPLC-
derived antioxidant capacity, that was used to determine the contribution of each single
compound to the total antioxidant capacity of CGAs. Caffeoylquinic acids showed the highest
contribution to the total antioxidant capacity (75-84 %), followed by CGLs (11-14%), diCQAs (4-
8 %), CFQAs (0-5 %), and pCoQAs (0-1 %). None of the FQAs and FQLs exhibited ABTS+
scavenging capacity. Similar findings were reported by Rice-Evans et al. (1997) and Stalmach
et al. (2006) indicating that methylation at the 3’-hydroxyl group has an adverse effect on
antioxidant activity.
To further investigate the influence of chemical structure on antioxidant capacity, Trolox
equivalent antioxidant capacity (TEAC) values were calculated for the different chlorogenic acid
subgroups. The antioxidant capacity exhibited by the different chlorogenic acid subgroups
depends on the number of hydroxyl groups in the molecule (Nardini et al., 1995; Rice-Evans et
al., 1997). This was also observed in the current study. Dicaffeoylquinic acids exhibited the
highest antioxidant capacity because of the presence of two caffeic acid moieties, each one with
two hydroxyl groups. CQAs, with only one caffeic acid group exhibited half the antioxidant
capacity of diCQAs. The same values were observed for CFQAs with one caffeic and one ferulic
acid moiety, most likely due to the absence of antioxidant capacity of ferulic acid groups as
discussed above. CQLs, typical products of coffee roasting (Farah et al., 2005) showed slightly
lower TEAC values than their precursors, the CQAs. This indicates that the lactonization seems
to have a reducing effect on the ABTS+ scavenging capacity of the compound. Chlorogenic
acids with p-coumaroylquinic acid moieties exhibited the lowest TEAC values. The presence of
only one hydroxyl group in the hydroxycinnamic acid moiety of these chlorogenic acids resulted
in a reduction of the antioxidant capacity by 50% compared to CQAs. These results corroborate
that the antioxidant capacity of chlorogenic acids depends primarily on the number of hydroxyl
groups but is also influenced by other structural changes like methylation or lactonization.
General Discussion
124
Regarding to the total antioxidant capacities of CGAs of the two coffee varieties analysed in this
study, the higher values obtained for Arabica coffee could be explained by differences in the
chlorogenic acid composition. As described above, Arabica coffee showed higher levels of
CQAs which possess high TEAC values, whereas Robusta coffee was rich in FQAs and FQLs,
which do not exhibit any ABTS+ scavenging activity at all.
To assess the contribution of the CGAs to the overall antioxidant capacity of coffee, samples
were analysed using the on-line ABTS method described above but after removing the column
from the HPLC system. Data obtained allowed to determine the antioxidant capacity of all coffee
components including those that did not elute from the chromatographic column, such as high
molecular weight Maillard reaction products. The comparison of the overall antioxidant capacity
with the HPLC-derived antioxidant capacity revealed that only 7-16 % of the antioxidant capacity
of coffee brews corresponds to the chlorogenic acids. These values were lower for espresso
coffee brews (7-11 %) than those for filter coffee brews (12-16 %). Moreover, Robusta coffee
exhibited lower values than Arabica coffee when the same extraction procedure (espresso or
filter coffeemaker) was used. The results obtained in the current study indicate that the
remaining 84-93% of the overall antioxidant capacity must be ascribed to other compounds
different to chlorogenic acids that did not elute from the HPLC column. These compounds were
extracted in higher amounts by the espresso coffeemaker and were present in higher amounts
in Robusta coffee. As mentioned previously, those compounds that did not elute from the HPLC
column might correspond to the high molecular weight Maillard reaction products (MRPs)
resulting from the coffee roasting process. Other authors suggested that MRPs may contribute
to higher degree to the overall antioxidant capacity of coffee than chlorogenic acids in dark
roasted coffee (Smrke et al., 2013). These findings seem to contradict the previously discussed
ESR spectroscopy results which showed that phenolic antioxidant capacity evaluated by
Fremy´s salt was almost four times higher than roasting-induced antioxidant capacity measured
with TEMPO. The apparent inconsistency might be explained by the fact that the on-line ABTS
assay measures the antioxidant capacity of the free CGAs present in the coffee samples but
does not take into account CGAs and other coffee phenolics bound to melanoidins, whereas
Fremy´s salt assay evaluates the antioxidant capacity of free and bound coffee phenolics
(Bekedam et al., 2008b). In addition, synergistic effects between CGAs and other coffee
antioxidants might increase the antioxidant capacity exhibited by individual CGAs as measured
by the on-line ABTS technique.
To go deeper into the knowledge of the extractability of the phenolics in the coffee brews,
HPLC-PDA-MSn was used to identify and quantify all the chlorogenic acids found in coffee
brews in the three fractions for espresso coffee (F1-F3) and 5 fractions for filter coffee (F1-5)
collected sequentially during the brewing process.
Extraction profile for espresso coffees revealed that approx. 70 % of the chlorogenic acids
present in the coffee brew were extracted during the first 8 seconds (F1) of the extraction
process. During the next 8 seconds (F2) approx. 20% were extracted, whereas the remaining
General Discussion
125
10% were extracted during the final stage of the brewing process (last 8 seconds, F3). The
extraction profiles of the individual compounds were very similar, except for diCQAs and CFQAs
which showed a slower extraction accounting F1 for ~62 %, F2 for ~24 % and F3 for ~13 %,
This could be because these compounds are those with the highest molecular weight.
In contrast to espresso coffee, extraction profiles of filter coffee showed lower amounts of
chlorogenic acids per 100mL in F1 (first 75 seconds) than in F2 (75-150s). The lowest
chlorogenic acid concentration was obtained for F3 (150-225s), but CGAs concentration
showed a steady increase (F4 and F5) towards the end of the extraction process. However,
when the volumes of the different fractions were taken into account, data revealed that only
about 18 % of the chlorogenic acids present in a coffee brew were extracted during the first
stage of the brewing process (F1), whereas approx. 60% of the total CGAs were extracted
during the next 150 seconds (F2 and F3), and only 20% of these compounds were extracted
during the final 150 seconds (F4 and F5). The different extraction profiles found in espresso and
filter coffee brews are consistent with the reults previously described on CQAs extractabilty. The
technological factors responsible for these differences were already discussed.
In summary, although total CGA amounts were not greatly different for both species, Robusta
and Arabica, the latter one showed higher levels of CQAs, whereas Robusta coffee was rich in
FQAs and FQLs. It was also confirmed that an increase in hydroxyl group promotes free radical
scavenging activities of chlorogenic acids, whereas methylation of the hydroxyl group at the
position 3 of the hydroxycinnamic acid and lactonization of the quinic acid moiety resulted in its
decrease. Radical scavenging capacity of chlorogenic acids, however, accounted for only 7-
16 % of the overall capacity of coffee brews suggesting that high molecular weight Maillard
reaction products might highly contribute to the antioxidant capacity of coffee brews. Thus,
further studies about responsible compounds on antioxidant capacity of coffee brews are
needed.
Catabolism of coffee phenolics by human colonic mic robiota
The health benefits ascribed to the chlorogenic acids (CGAs), the main (poly)phenols in coffee
depend on their bioavailability. Because the fate of (poly)phenols is very much dependent upon
any structural changes that occur during the passage through the gastrointestinal tract (Selma
et al., 2009; Williamson & Clifford, 2010), the identification and quantification of microbial
catabolites produced in the large intestine are of importance in the context of overall
bioavailability and potential health benefits of dietary (poly)phenolics. Thus, espresso coffee
was incubated with human faecal samples, and HPLC-MS and GC-MS were used to monitor
CGA breakdown and identify and quantify the catabolites produced by the colonic microflora.
A total of 15 CGAs were identified and quantified in the espresso coffee along with four
additional components that were partially identified as CQAs and one as a FQL but it was not
possible to determine the respective position of the caffeic acid and ferulic acid moiety. The
overall CGA content of the espresso coffee was 80.0 ± 2.4 µmol per 0.5 g of freeze dried coffee.
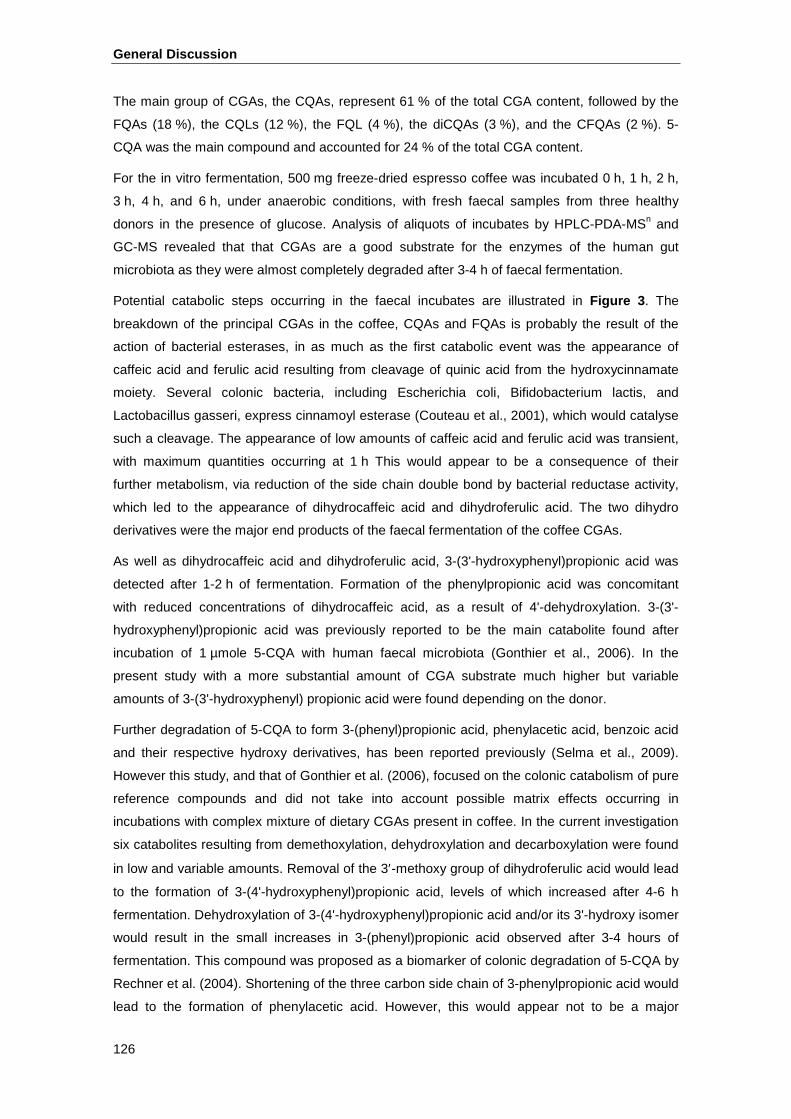
General Discussion
126
The main group of CGAs, the CQAs, represent 61 % of the total CGA content, followed by the
FQAs (18 %), the CQLs (12 %), the FQL (4 %), the diCQAs (3 %), and the CFQAs (2 %). 5-
CQA was the main compound and accounted for 24 % of the total CGA content.
For the in vitro fermentation, 500 mg freeze-dried espresso coffee was incubated 0 h, 1 h, 2 h,
3 h, 4 h, and 6 h, under anaerobic conditions, with fresh faecal samples from three healthy
donors in the presence of glucose. Analysis of aliquots of incubates by HPLC-PDA-MSn and
GC-MS revealed that that CGAs are a good substrate for the enzymes of the human gut
microbiota as they were almost completely degraded after 3-4 h of faecal fermentation.
Potential catabolic steps occurring in the faecal incubates are illustrated in Figure 3 . The
breakdown of the principal CGAs in the coffee, CQAs and FQAs is probably the result of the
action of bacterial esterases, in as much as the first catabolic event was the appearance of
caffeic acid and ferulic acid resulting from cleavage of quinic acid from the hydroxycinnamate
moiety. Several colonic bacteria, including Escherichia coli, Bifidobacterium lactis, and
Lactobacillus gasseri, express cinnamoyl esterase (Couteau et al., 2001), which would catalyse
such a cleavage. The appearance of low amounts of caffeic acid and ferulic acid was transient,
with maximum quantities occurring at 1 h This would appear to be a consequence of their
further metabolism, via reduction of the side chain double bond by bacterial reductase activity,
which led to the appearance of dihydrocaffeic acid and dihydroferulic acid. The two dihydro
derivatives were the major end products of the faecal fermentation of the coffee CGAs.
As well as dihydrocaffeic acid and dihydroferulic acid, 3-(3'-hydroxyphenyl)propionic acid was
detected after 1-2 h of fermentation. Formation of the phenylpropionic acid was concomitant
with reduced concentrations of dihydrocaffeic acid, as a result of 4'-dehydroxylation. 3-(3'-
hydroxyphenyl)propionic acid was previously reported to be the main catabolite found after
incubation of 1 µmole 5-CQA with human faecal microbiota (Gonthier et al., 2006). In the
present study with a more substantial amount of CGA substrate much higher but variable
amounts of 3-(3'-hydroxyphenyl) propionic acid were found depending on the donor.
Further degradation of 5-CQA to form 3-(phenyl)propionic acid, phenylacetic acid, benzoic acid
and their respective hydroxy derivatives, has been reported previously (Selma et al., 2009).
However this study, and that of Gonthier et al. (2006), focused on the colonic catabolism of pure
reference compounds and did not take into account possible matrix effects occurring in
incubations with complex mixture of dietary CGAs present in coffee. In the current investigation
six catabolites resulting from demethoxylation, dehydroxylation and decarboxylation were found
in low and variable amounts. Removal of the 3′-methoxy group of dihydroferulic acid would lead
to the formation of 3-(4'-hydroxyphenyl)propionic acid, levels of which increased after 4-6 h
fermentation. Dehydroxylation of 3-(4'-hydroxyphenyl)propionic acid and/or its 3'-hydroxy isomer
would result in the small increases in 3-(phenyl)propionic acid observed after 3-4 hours of
fermentation. This compound was proposed as a biomarker of colonic degradation of 5-CQA by
Rechner et al. (2004). Shortening of the three carbon side chain of 3-phenylpropionic acid would
lead to the formation of phenylacetic acid. However, this would appear not to be a major
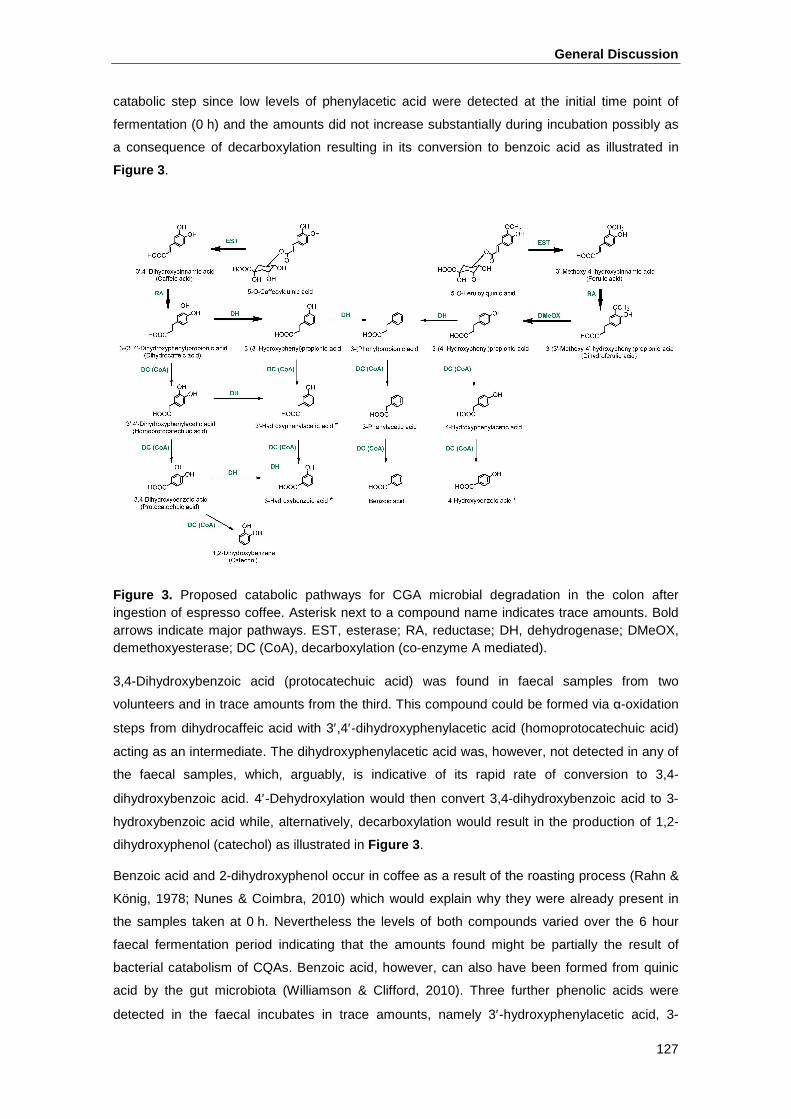
General Discussion
127
catabolic step since low levels of phenylacetic acid were detected at the initial time point of
fermentation (0 h) and the amounts did not increase substantially during incubation possibly as
a consequence of decarboxylation resulting in its conversion to benzoic acid as illustrated in
Figure 3 .
Figure 3. Proposed catabolic pathways for CGA microbial degradation in the colon after ingestion of espresso coffee. Asterisk next to a compound name indicates trace amounts. Bold arrows indicate major pathways. EST, esterase; RA, reductase; DH, dehydrogenase; DMeOX, demethoxyesterase; DC (CoA), decarboxylation (co-enzyme A mediated).
3,4-Dihydroxybenzoic acid (protocatechuic acid) was found in faecal samples from two
volunteers and in trace amounts from the third. This compound could be formed via α-oxidation
steps from dihydrocaffeic acid with 3′,4′-dihydroxyphenylacetic acid (homoprotocatechuic acid)
acting as an intermediate. The dihydroxyphenylacetic acid was, however, not detected in any of
the faecal samples, which, arguably, is indicative of its rapid rate of conversion to 3,4-
dihydroxybenzoic acid. 4′-Dehydroxylation would then convert 3,4-dihydroxybenzoic acid to 3-
hydroxybenzoic acid while, alternatively, decarboxylation would result in the production of 1,2-
dihydroxyphenol (catechol) as illustrated in Figure 3 .
Benzoic acid and 2-dihydroxyphenol occur in coffee as a result of the roasting process (Rahn &
König, 1978; Nunes & Coimbra, 2010) which would explain why they were already present in
the samples taken at 0 h. Nevertheless the levels of both compounds varied over the 6 hour
faecal fermentation period indicating that the amounts found might be partially the result of
bacterial catabolism of CQAs. Benzoic acid, however, can also have been formed from quinic
acid by the gut microbiota (Williamson & Clifford, 2010). Three further phenolic acids were
detected in the faecal incubates in trace amounts, namely 3′-hydroxyphenylacetic acid, 3-
General Discussion
128
hydroxybenzoic acid and 4-hydroxybenzoic acid that might result from 3-(3'-
hydroxyphenyl)propionic acid and 3-(4'-hydroxyphenyl)propionic acid being subject to α-
oxidation. None of these phenolic acids were present in the control or in the coffee samples
indicating they are CGA degradation products.
The data obtained with the faecal fermentations suggest that bacteria present in the human gut
are capable of further demethyoxylation, dehydroxylation and decarboxylation of dihydrocaffeic
acid, dihydroferulic acid and 3-(3'-hydroxyphenyl)propionic acid. However, the corresponding
catabolic routes can be considered as minor pathways of coffee CGA degradation, since the
amounts found for the resulting compounds were very low. From the catabolites detected during
the faecal fermentation and the amounts found we propose a pathway with major and minor
routes of colonic CGA degradation after coffee ingestion (Figure 3 ).
Total amounts of catabolites found in V1 and V3 after 6 h of incubation were significantly higher
(p<0.05) than the CGA content of the coffee used for the faecal fermentation. Several studies
have confirmed the incorporation of chlorogenic acids and other phenolic compounds into coffee
melanoidins, the high molecular brown end products of the Maillard reaction formed during
coffee roasting (Bekedam et al., 2008c; Nunes & Coimbra, 2010). A partial release of these
compounds during the faecal fermentation could have increased the amounts of phenolic acids
and might explain the differences found between amounts of CGAs incubated and the amounts
of catabolites found at the end of the fermentation.
Interindividual differences in the catabolism of phenolic compounds by gut microbiota have been
extensively reported (Selma et al., 2009; Jaganath et al., 2009; Gross et al., 2010; González-
Barrio et al., 2011) and were also found in the present study. The observed differences can be
attributed to the well-known different bacterial populations present in the individual faecal
microbial communities, harbouring specific enzymatic capacities (Zoetendal et al., 2008). The
rate and extend of the degradation of the coffee CGAs showed a clear and statistically
significant (p<0.05) influence of the composition of the gut microbiota. The inter-individual
differences were particularly noticeable for volunteer 2. While degradation profiles obtained for
V1 and V3 differed only in the breakdown rate, V2 showed an incomplete degradation of FQAs
and FQL, with recovery rates up to 60 % after 6 h of faecal fermentation. Other minor CGAs,
such as diCQAs, CFQAs, were also degraded to a lesser extent in samples from V2.
Breakdown rates for CQAs and CQLs, however, were similar for all volunteers, and as these
representatives made up 72 % of the total chlorogenic acid amount, CGA degradation by gut
microbiota was for all volunteers between 80-100 %. Differences between the donors were also
observed in the catabolite profiles. Samples from volunteer 2 showed significantly lower levels
of caffeic acid and ferulic acid. Nevertheless dihydrocaffeic acid and dihydroferulic acids were
the main end catabolites of faecal fermentation also for volunteer 2. Contrary to volunteers 1
and 3, 3-(3′-hydroxyphenyl)propionic acid and its 4′-hydroxy isomer were not found in
fermentations with faecal material from volunteer 2. The inter-individual differences indicate that
the composition of the gut microflora and thus the presence of certain bacterial species might
General Discussion
129
have a great influence on the formation of catabolites, especially those resulting from minor
pathways.
The results obtained in this in vitro study are in accordance with those on the bioavailability of
CGAs in humans in which the main colon-derived metabolites in plasma and/or urine after
ingestion of coffee were dihydrocaffeic acid, dihydroferulic acid and their sulfated and
glucuronide metabolites (Stalmach et al., 2009). There was an absence of glucuronide and
sulfate conjugates in faecal fermentations demonstrating that they are not of bacterial origin but
instead are probably phase II hepatic products and/or are formed in epithelial cells during
passage through the colon en route to the circulatory system. The same probably also applies i)
to co-enzyme A mediated metabolism of ferulic acid to feruloylglycine and ii) to the catechol-O-
methyltransferase catalysed reactions that in vivo result in the metabolism of caffeic acid to
isoferulic acid (Stalmach et al. 2009, 2010), conversions that did not occur in the faecal
incubations.
In conclusion, all coffee CGAs were rapidly degraded by the colonic microflora. A total of 11
catabolites were identified during the 0–6 h of faecal fermentation showing that the CGAs were
extensively catabolized by the microorganisms present in the human faecal samples. The rate
and extent of the degradation showed a clear influence of the composition of the gut microbiota
of individual volunteers. However, the amounts found indicate major degradation pathways
leading to the accumulation of dihydrocaffeic acid and dihydroferulic acid. It is known that these
catabolites are better absorbed that their CQAs and FQAs and in vivo studies have confirmed
free and sulfated dihydrocaffeic and dihydroferulic acids as main metabolites in plasma and
urine after ingestion of coffee. Thus, bioavailability of CGAs depends highly on microbial
conversions in the colon. Nevertheless, dihydrocaffeic, dihydroferulic acids, other minor
catabolites and their parent CGAs that are present in upper regions of the large intestine where
they might act as antioxidants and prebiotics explaining at least partly some of the health
benefits at colon level ascribed to coffee consumption. It is important that investigations of the
potential protective colonic effects of coffee consumption with ex vivo cell systems should make
use of this mixture of ingested CGAs and their colonic catabolites at doses that prevail in the
proximal gastrointestinal tract.
General Discussion
130
REFERENCES
Alves, R. C., Costa, A. S. G., Jerez, M., Casal, S., Sineiro, J., Nunez, M. J., & Oliveira, B. (2010). Antiradical activity, phenolics profile, and hydroxymethylfurfural in espresso Coffee: Influence of technological factors. Journal of Agricultural and Food Chemistry, 58(23), 12221-12229.
Andueza, S., Maeztu, L., Dean, B., De Peña, M., Bello, J., & Cid, C. (2002). Influence of water pressure on the final quality of arabica espresso coffee. Application of multivariate analysis. Journal of Agricultural and Food Chemistry, 50(25), 7426-7431.
Andueza, S., De Pena, M. P., Vila, M., & Cid, C. (2007). Influence of coffee/water ratio on the final quality of espresso coffee. Journal of the science of food and agriculture, 87(4), 586-592.
Andueza, S., Maeztu, L., Pascual, L., Ibañez, C., De Peña, M. P., & Cid, C. (2003). Influence of extraction temperature on the final quality of espresso coffee. Journal of the Science of Food and Agriculture, 83(3), 240-248.
Bekedam, E. K., Loots, M., Schols, H., Van Boekel,Martinus A J S., & Smit, G. (2008a). Roasting effects on formation mechanisms of coffee brew melanoidins. Journal of Agricultural and Food Chemistry, 56(16), 7138-45.
Bekedam, E. K., Schols, H. A., Cämmerer, B., Kroh, L. W., in both coffees an Boekel, M. A. J. S., & Smit, G. (2008b). Electron Spin Resonance (ESR) Studies on the formation of roasting-induced antioxidative structures in coffee brews at different degrees of roast. Journal of Agricultural and Food Chemistry, 56(12), 4597-4604.
Bekedam, E. K., Schols, H. A., Van Boekel, M. A. J. S., & Smit, G. (2008c). Incorporation of chlorogenic acids in coffee brew melanoidins. Journal of Agricultural and Food Chemistry, 56(6), 2055-2063.
Belitz, H., Grosch, W., & Schieberle, P. (2009). Coffee, Tea, Cocoa. In Food Chemistry, (4 th ed.) Berlin: Springer-Verlag.
Blank, I., Sen, A., & Grosch, W. (1991). Aroma impact compounds of Arabica and Robusta coffee - Qualitative and quantitative investigation. In: Proceedings 17th International Scientific Colloquium on Coffee (pp. 117-129). San Francisco, US.
Blumberg, S., Frank, O., & Hofmann, T. (2010). Quantitative studies on the influence of the bean roasting parameters and hot water percolation on the concentrations of bitter compounds in coffee brew. Journal of Agricultural and Food Chemistry, 58(6), 3720-3728.
Caemmerer, B., & Kroh, L. W. (2006). Antioxidant activity of coffee brews. European Food Research and Technology, 223(4), 469-474.
Clifford, M. N. (2000). Chlorogenic acids and other cinnamates - nature, occurrence, dietary burden, absorption and metabolism. Journal of the Science of Food and Agriculture, 80(7), 1033-1043.
Clifford, M. N. (1999). Chlorogenic acids and other cinnamates - nature, occurrence and dietary burden. Journal of the Science of Food and Agriculture, 79(3), 362-372.
Clifford, M. N. (1997). The nature of chlorogenic acids: Are they advantageous compounds in coffee? Proceedings of the 17th ASIC Colloquium, Nairobi, Kenia, pp. 97-106., 79-91.
Couteau, D., McCartney, A. L., Gibson, G. R., Williamson, G., & Faulds, C. B. (2001). Isolation and characterization of human colonic bacteria able to hydrolyse chlorogenic acid. Journal of Applied Microbiology, 90(6), 873-881.
Del Castillo, M. D., Ames, J. M., & Gordon, M. H. (2002). Effect of Roasting on the Antioxidant Activity of Coffee Brews. Journal of Agricultural and Food Chemistry, 50(13), 3698-3703.
General Discussion
131
Everette, J., Bryant, Q., Green, A., Abbey, Y., Wangila, G., & Walker, R. (2010). Thorough study of reactivity of various compound classes toward the Folin-Ciocalteu reagent. Journal of Agricultural and Food Chemistry, 58(14), 8139-8144.
Farah, A., De Paulis, T., Trugo, L. C., & Martin, P. R. (2005). Effect of roasting on the formation of chlorogenic acid lactones in coffee. Journal of Agricultural and Food Chemistry, 53(5), 1505-1513.
Farah, A., Monteiro, M. C., Calado, V., Franca, A. S., & Trugo, L. C. (2006). Correlation between cup quality and chemical attributes of Brazilian coffee. Food Chemistry, 98(2), 373-380.
Flament, I. (2001). Coffee flavor chemistry. Chichester, UK: John Wiley & Sons Ltd.
Fuster, M. D., Mitchell, A. E., Ochi, H., & Shibamoto, T. (2000). Antioxidative activities of heterocyclic compounds formed in brewed coffee. Journal of Agricultural and Food Chemistry, 48(11), 5600-5603.
Gonthier, M. P., Remesy, C., Scalbert, A., Cheynier, V., Souquet, J. M., Poutanen, K., & Aura, A. M. (2006). Microbial metabolism of caffeic acid and its esters chlorogenic and caftaric acids by human faecal microbiota in vitro. Biomedicine & Pharmacotherapy, 60(9), 536-540.
González-Barrio, R., Edwards, C. A., & Crozier, A. (2011). Colonic catabolism of ellagitannins, ellagic acid, and raspberry anthocyanins: In vivo and in vitro studies. Drug Metabolism and Disposition, 39(9), 1680-1688.
Grosch, W. (1996). Why does coffee smell so good. Chemie in unserer Zeit, 30(3), 126-133.
Gross, G., Jacobs, D. M., Peters, S., Possemiers, S., Van Duyhoven, J., Vaughan, E. E., & Van de Wiele, T. (2010). In vitro bioconversion of polyphenols from black tea and red wine/grape juice by human intestinal microbiota displays strong interindividual variability. Journal of Agricultural and Food Chemistry, 58(18), 10236-10246.
Hofmann, T. (1999). Quantitative studies on the role of browning precursors in the Maillard reaction of pentoses and hexoses with L-alanine. European Food Research and Technology, 209(2), 113-121.
Huang, D. J., Ou, B. X., & Prior, R. L. (2005). The chemistry behind antioxidant capacity assays. Journal of Agricultural and Food Chemistry, 53(6), 1841-1856.
Jaganath, I. B., Mullen, W., Lean, M. E. J., Edwards, C. A., & Crozier, A. (2009). In vitro catabolism of rutin by human faecal bacteria and the antioxidant capacity of its catabolites. Free Radical Biology and Medicine, 47(8), 1180-1189.
Kroll, N., Rawel, H., & Rohn, S. (2003). Reactions of plant phenolics with food proteins and enzymes under special consideration of covalent bonds. Food Science and Technology Research, 9(3), 205-218.
Lee, C. (2000). Antioxidant ability of caffeine and its metabolites based on the study of oxygen radical absorbing capacity and inhibition of LDL peroxidation. Clinica Chimica Acta, 295(1-2), 141-154.
Lingle, T. R. (1996). The Coffee Brewing Handbook. Long Beach, California: Spelcialty Coffee Association.
Lopez Galilea, I., Andriot, I., De Peña, M. P., Cid, C., & Guichard, E. (2008a). How does roasting process influence the retention of coffee aroma compounds by lyophilized coffee extract? Journal of Food Science, 73(3), S165-S171.
Lopez Galilea, I., De Peña, M. P., & Cid, C. (2008b). Application of multivariate analysis to investigate potential antioxidants in conventional and torrefacto roasted coffee. European Food Research and Technology, 227(1), 141-149.
General Discussion
132
Lopez Galilea, I., Fournier, N., Cid, C., & Guichard, E. (2006a). Changes in headspace volatile concentrations of coffee brews caused by the roasting process and the brewing procedure. Journal of Agricultural and Food Chemistry, 54(22), 8560-8566.
López-Galilea, I., Andueza, S., Leonardo, I. d., De Peña, M. P., & Cid, C. (2006b). Influence of torrefacto roast on antioxidant and pro-oxidant activity of coffee. Food Chemistry, 94(1), 75-80.
López-Galilea, I., De Peña, M. P., & Cid, C. (2007). Correlation of selected constituents with the total antioxidant capacity of coffee beverages: Influence of the brewing procedure. Journal of Agricultural and Food Chemistry, 55(15), 6110-6117.
Ludwig, I. A., Bravo, J., De Peña, M. P., & Cid, C. (2013). Effect of sugar addition (torrefacto) during roasting process on antioxidant capacity and phenolics of coffee. LWT-Food Science and Technology, 51, 553-559.
Maeztu, L., Sanz, C., Andueza, S., De Peña, M. P., Bello, J., & Cid, C. (2001). Characterization of espresso coffee aroma by static headspace GC-MS and sensory flavor profile. Journal of Agricultural and Food Chemistry, 49(11), 5437-5444.
Manzocco, L., Calligaris, S., Mastrocola, D., Nicoli, M. C., & Lerici, C. R. (2000). Review of non-enzymatic browning and antioxidant capacity in processed foods. Trends in Food Science & Technology, 11(9–10), 340-346.
Manzocco, L., Calligaris, S., & Nicoli, M. (2002). Assessment of pro-oxidant activity of foods by kinetic analysis of crocin bleaching. Journal of Agricultural and Food Chemistry, 50(10), 2767-2771.
Morales, F. J. (2005). Assessing the non-specific hydroxyl radical scavenging properties of melanoidins in a Fenton-type reaction system. Analytica Chimica Acta, 534(1), 171-176.
Nardini, M., D'Aquino, M., Tomassi, G., Gentili, V., Di Felice, M., & Scaccini, C. (1995). Inhibition of human low-density lipoprotein oxidation by caffeic acid and other hydroxycinnamic acid derivatives. Free Radical Biology and Medicine, 19(5), 541-552.
Nunes, F. M., & Coimbra, M. A. (2010). Role of hydroxycinnamates in coffee melanoidin formation. Phytochemistry Reviews, 9(1), 171-185.
Nunes, F., & Coimbra, M. (2007). Melanoidins from coffee infusions. Fractionation, chemical characterization, and effect of the degree of roast. Journal of Agricultural and Food Chemistry, 55(10), 3967-3977.
Perez-Martinez, M., Caemmerer, B., De Peña, M. P., Cid, C., & Kroh, L. W. (2010). Influence of brewing method and acidity regulators on the antioxidant capacity of coffee brews. Journal of Agricultural and Food Chemistry, 58(5), 2958-2965.
Perrone, D., Donangelo, R., Donangelo, C., & Farah, A. (2010). Modeling weight loss and chlorogenic acids content in coffee during roasting. Journal of Agricultural and Food Chemistry, 58(23), 12238-12243.
Perrone, D., Farah, A., Donangelo, C. M., de Paulis, T., & Martin, P. R. (2008). Comprehensive analysis of major and minor chlorogenic acids and lactones in economically relevant Brazilian coffee cultivars. Food Chemistry, 106(2), 859-867.
Petracco, M. (2005). Percolation. In A. Illy & R. Viani, Espresso Coffee: The Chemistry of Quality (pp. 259-289), (2 nd ed.) London: Elsevier Academic Press.
Petracco, M. (2001). Technology IV: Beverage Preparation: Brewing Trends for the New Millenium. In R. J. Clark & O. G. Vitzthum, Coffee: Recent Developments. Oxford, UK: Blackwell Science.
General Discussion
133
Rahn, W., & König, W. A. (1978). GC/MS investigations of the constituents in a diethyl ether extract of an acidified roast coffee infusion. Journal of High Resolution Chromatography, 1(1), 69-71.
Rechner, A. R., Smith, M. A., Kuhnle, G., Gibson, G. R., Debnam, E. S., Srai, S. K. S., Moore, K. P., & Rice-Evans, C. A. (2004). Colonic metabolism of dietary polyphenols: Influence of structure on microbial fermentation products. Free Radical Biology and Medicine, 36(2), 212-225.
Rice-Evans, C., Miller, N., & Paganga, G. (1997). Antioxidant properties of phenolic compounds. Trends in Plant Science, 2(4), 152-159.
Rizzi, G. (1997). Chemical structure of coloured Maillard reaction products. Food Reviews International, 13(1), 1-28.
Sacchetti, G., Di Mattia, C., Pittia, P., & Mastrocola, D. (2009). Effect of roasting degree, equivalent thermal effect and coffee type on the radical scavenging activity of coffee brews and their phenolic fraction. Journal of Food Engineering, 90(1), 74-80.
Sanchez-Gonzalez, I., Jimenez-Escrig, A., & Saura-Calixto, F. (2005). In vitro antioxidant activity of coffees brewed using different procedures (Italian, espresso and filter). Food Chemistry, 90(1-2), 133-139.
Sanz, C., Maeztu, L., Zapelena, M. J., Bello, J., & Cid, C. (2002). Profiles of volatile compounds and sensory analysis of three blends of coffee: Influence of different proportions of Arabica and Robusta and influence of roasting coffee with sugar. Journal of the Science of Food and Agriculture, 82(8), 840-847.
Selma, M. V., Espin, J. C., & Tomas-Barberan, F. A. (2009). Interaction between phenolics and gut microbiota: Role in human health. Journal of Agricultural and Food Chemistry, 57(15), 6485-6501.
Semmelroch, P., & Grosch, W. (1995). Analysis of roasted coffee powders and brews by gas chromatography-olfactometry of headspace samples. LWT - Food Science and Technology, 28(3), 310-313.
Smrke, S., Opitz, S. E. W., Vovk, I., & Yeretzian, C. (2013). How does roasting affect the antioxidants of a coffee brew? Exploring the antioxidant capacity of coffee via on-line antioxidant assays coupled with size exclusion chromatography. Food Function, in press, DOI: 10.1039/C3FO30377B.
Stalmach, A., Mullen, W., Nagai, C., & Crozier, A. (2006). On-line HPLC analysis of the antioxidant activity of phenolic compounds in brewed, paper-filtered coffee. Brazilian Journal of Plant Physiology, 18(1), 253-262.
Stalmach, A., Mullen, W., Barron, D., Uchida, K., Yokota, T., Cavin, C., Steiling, H., Williamson, G., & Crozier, A. (2009). Metabolite profiling of hydroxycinnamate derivatives in plasma and urine after the ingestion of coffee by humans: Identification of biomarkers of coffee consumption. Drug Metabolism and Disposition, 37(8), 1749-1758.
Stalmach, A., Steiling, H., Williamson, G., & Crozier, A. (2010). Bioavailability of chlorogenic acids following acute ingestion of coffee by humans with an ileostomy. Archives of Biochemistry and Biophysics, 501(1), 98-105.
Trugo, L. C., & Macrae, R. (1984). A study of the effect of roasting on the chlorogenic acid composition of coffee using HPLC. Food Chemistry, 15(3), 219-227.
Vignoli, J. A., Bassoli, D. G., & Benassi, M. T. (2011). Antioxidant activity, polyphenols, caffeine and melanoidins in soluble coffee: The influence of processing conditions and raw material. Food Chemistry, 124(3), 863-868.
General Discussion
134
Williamson, G., & Clifford, M. N. (2010). Colonic metabolites of berry polyphenols: The missing link to biological activity? British Journal of Nutrition, 104(S3), S48-S66.
Yanagimoto, K., Lee, K., Ochi, H., & Shibamoto, T. (2002). Antioxidative activity of heterocyclic compounds found in coffee volatiles produced by Maillard reaction. Journal of Agricultural and Food Chemistry, 50(19), 5480-5484.
Yanagimoto, K., Ochi, H., Lee, K., & Shibamoto, T. (2004). Antioxidative activities of fractions obtained from brewed coffee. Journal of Agricultural and Food Chemistry, 52(3), 592-596.
Zoetendal, E. G., Rajilić-Stojanović, M., & de Vos, W. M. (2008). High-throughput diversity and functionality analysis of the gastrointestinal tract microbiota. Gut, 57(11), 1605-1615.
CONCLUSIONS

Conclusions
137
Objective 1
1. The addition of sugar during roasting (torrefacto) is a technological process with a lower
influence on the presence of antioxidant compounds and, consequently, overall
antioxidant capacity than roasting degree, coffee variety (Arabica and Robusta) and
origin. In fact, although torrefacto increases the radical quenching capacity (DPPH) in
coffee, it hardly affects the final content of antioxidant compounds like phenolics.
2. The absorbance at 420 nm is a good marker for the torrefacto roasting process,
whereas the roasting degree might be better characterized by L* values.
Objective 2
3. Brewing time plays a key role in antioxidants extractability of coffee. Moreover, higher
water pressure increases phenolic and non-phenolic antioxidants extraction speed like
in espresso coffee, but parameters like turbulence and longer contact time, typically of a
filter coffeemaker, should be considered in order to increase extraction efficiency,
mainly in less polar antioxidant compounds like dicaffeoylquinic acids.
Objective 3
4. Volatile Maillard reaction products present in coffee contribute very little (<3.3 %) to the
antioxidant capacity in comparison to other coffee antioxidants, such as phenolics and
melanoidins, even at 100-fold coffee concentration.
5. Although some coffee volatile compounds like heterocyclic ones (furans, pyrroles and
thiophenes) may act as antioxidants in high doses, it is necessary to evaluate their
antioxidant capacity at the actual concentrations in foods.
Objective 4
6. The identification and quantification of 22 chlorogenic acids by HPLC-PDA-MSn shows
that the total chlorogenic acids content in coffee brews is not greatly different for both
species, but Arabica coffee shows higher levels of caffeoylquinic acids, whereas
Robusta coffee is rich in feruloylquinic acids and their lactones.
7. The antioxidant capacity of coffee chlorogenic acids can be mainly attributed to
caffeoylquinic acids (75-84 %), followed by their lactones (11-14%), dicaffeoylquinic
acids (4-8 %), caffeoyl-feruloyl-quinic acids (0-5 %), and p-coumaroylquinic acids (0-
1 %). Moreover, none of the feruloylquinic acids and their lactones exhibit ABTS+
scavenging capacity. The TEAC values for the chlorogenic acids subgroups confirm
that an increase in hydroxyl groups promotes free radical scavenging activities of
chlorogenic acids, whereas methylation of the hydroxyl group at the position 3 of the
hydroxycinnamic acid and lactonization of the quinic acid moiety results in its decrease.
8. The ABTS+ scavenging capacity of chlorogenic acids accounts for only 7-16 % of the
overall capacity of coffee brews suggesting that high molecular weight Maillard reaction
products, as well as phenolics bound to melanoidins might contribute to a higher degree
to the antioxidant capacity of coffee brews.
Conclusions
138
Objective 5
9. Faecal fermentation results show that all coffee clorogenic acids are rapidly and
extensively catabolized by the colonic microflora, leading to the formation of up to 11
catabolites.
10. An incomplete degradation of feruloylquinic acids and their lactones (40 % after 6 h)
and significantly lower levels of caffeic and ferulic acids in faecal fermentation samples
for volunteer 2 indicate that the inter-individual differences in composition of the gut
microflora might have an influence on the rate and extent of the chlorogenic acids
degradation.
11. The amounts of the different colonic catabolites found indicate major degradation
pathways leading to the accumulation of dihydrocaffeic acid and dihydroferulic acid that
are better absorbed than their parent compounds. Thus, bioavailability of chlorogenic
acids depends greatly on microbial conversions in the colon.
12. Dihydrocaffeic, dihydroferulic acids, other minor catabolites and their parent chlorogenic
acids that are present in the large intestine where they might act as antioxidants and
prebiotics explaining at least partly some of the health benefits at colon level ascribed to
coffee consumption.
Conclusions
139
Objetivo 1
1. El tueste torrefacto influye en menor proporción que el grado de tueste, y la variedad y
origen del café en el contenido de compuestos antioxodantes y, por consiguiente, en la
capacidad antioxidante del café. De hecho, aunque el tueste torrefacto aumenta la
capacidad de captación de radicales libres (DPPH), apenas afecta al contenido de
compuestos antioxidantes como los fenólicos.
2. La absorbancia a 420 nm es un buen marcador del tueste torrefacto, sin embargo el
grado de tueste se caracteriza mejor por el valor L*.
Objetivo 2
3. El tiempo de elución en la preparación de una bebida de café tiene un papel clave en la
extracción de antioxidantes. Además, una mayor presión del agua, propia de la
cafetera expreso, aumenta la velocidad de extracción de compuestos fenólicos y no
fenólicos. En cambio, otros factores tecnológicos como las turbulencias y un mayor
tiempo de contacto entre el agua y el café, típicos de una cafetera filtro, favorecen la
eficacia de la extracción de los compuestos antioxidantes, principalmente los de menor
polaridad, como los diCQA.
Objetivo 3
4. Los compuestos volátiles resultantes de la reacción de Maillard presentes en el café
contribuyen mínimamente (<3,3 %) a la capacidad antioxidante global del café en
comparación con otros compuestos antioxidantes, como los fenólicos y las
melanoidinas, incluso a concentraciones 100 veces superiores a las encontradas en el
café.
5. Aunque algunos compuestos volátiles heterocíclicos (furanos, pirroles y tiofenos)
pueden actuar como antioxidantes a altas concentraciones, es necesario evaluar su
capacidad antioxidante a las concentraciones realmente presentes en los alimentos.
Objetivo 4
6. La identificación y cuantificación de 22 ácidos clorogénicos por HPLC-PDA-MSn lleva a
concluir que el contenido total de ácidos clorogénicos no es muy diferente entre las dos
especies de café, aunque el café Arábica presenta mayores niveles de ácidos
cafeoilquínicos, mientras que la variedad Robusta es más rica en ácidos
feruloilquínicos y sus correspondientes lactonas.
7. La capacidad antioxidante de los ácidos clorogénicos presentes en el café se debe
mayoritariamente a los ácidos cafeoilquínicos (75-84%), seguidos por sus
correspondientes lactonas (11-14%), los ácidos dicafeoilquínicos (4-8%), los
cafeoilferuloilquínicos (0-5%), y los p-cumaroilquínicos (0-1%). Además, ninguno de los
ácidos feruloilquínicos y sus correspondientes lactonas presentan capacidad reductora
del radical ABTS+. Los valores de la capacidad antioxidante equivalente al Trolox
(TEAC) de los diferentes subgrupos de ácidos clorogénicos confirman que un
Conclusions
140
incremento en el número de grupos hidroxilo en la estructura de los ácidos
clorogénicos aumenta su capacidad reductora del radical ABTS+, mientras que la
metilación del grupo hidroxilo en la posición 3 del ácido hidroxicinámico y la
lactonización del ácido quínico disminuyen dicha capacidad.
8. La capacidad reductora del radical ABTS+ de los ácidos clorogénicos supone solo un 7-
16 % de la capacidad antioxidante de las bebidas de café, lo cual sugiere que los
compuestos de alto peso molecular resultantes de la reacción de Maillard así como
compuestos fenólicos unidos a melanoidinas podrían contribuir en una alta proporción
a la capacidad antioxidante de las bebidas de café.
Objetivo 5
9. Los resultados obtenidos durante la fermentación fecal del café muestran que la
microflora del colon metaboliza rápida y ampliamente los ácidos clorogénicos presentes
en el café dando lugar a la formación de 11 catabolitos.
10. La degradación incompleta de los ácidos feruloilquínicos y sus lactonas (40% después
de 6 h) y los niveles significativamente más bajos de los ácidos cafeico y ferúlico en las
muestras procedentes de uno de los voluntarios indican que las diferencias inter-
individuales en la composición de la microflora intestinal puede tener influencia en la
velocidad y extensión de la degradación de los ácidos clorogénicos.
11. Las principales rutas de degradación de los ácidos clorogénicos muestran una
acumulación de los ácidos dihidrocafeico y dihidroferúlico que se absorben mejor que
los ácidos clorogénicos originales. Por lo tanto la biodisponibilidad de los ácidos
clorogénicos depende en gran medida del metabolismo de la microbiota del colon.
12. Los ácidos dihidrocafeico y dihidroferúlico, otros catabolitos minoritarios y los ácidos
clorogénicos no catabolizados que están presentes en el intestino grueso podrían
actuar como antioxidantes y prebióticos explicando, al menos en parte, algunos de los
efectos beneficios para la salud a nivel del colon atribuidos al consumo de café.

DISSEMINATION OF RESULTS

Dissemination of Results
143
Publications
Iziar A. Ludwig, Jimena Bravo, M. Paz De Peña, Concepción Cid. (2013). Effect of sugar
addition (torrefacto) during roasting process on antioxidant capacity and phenolics of coffee.
LWT – Food Science and Technology, 51, 553-559.
Iziar A. Ludwig , Lidia Sanchez, Bettina Caemmerer, Lothar W. Kroh, M. Paz De Peña,
Concepción Cid. (2012). Extraction of coffee antioxidants: impact of brewing time and method.
Food Research International, 48, 57-64
Iziar A. Ludwig , Maria Paz De Peña, Concepción Cid, Alan Crozier. (2013). In vitro catabolism
of coffee polyphenols by human colonic microbiota. BioFactors (accepted May 2013).
Iziar A. Ludwig , Lidia Sánchez, M. Paz De Peña, Concepción Cid. Modelling the contribution of
volatile compounds to the antioxidant capacity of coffee. Journal of Agricultural and Food
Chemistry (submitted).
Iziar A. Ludwig , , M. Paz De Peña, Concepción Cid, Alan Crozier. Assesing the contribution of
phenolic and non-phenolic compounds to the antioxidant capacity of coffee brews (in
preparation).
Conference communications
Iziar A. Ludwig , Ana I. Mudarra, Concepción Cid, and M. Paz De Peña. (2007). Oral
communication: “Increasing antioxidant capacity of coffee by addition of sugar during roasting
process”. In Thermally Processed Foods: Possible Health Implications (COST-927), Ebersberg,
Germany. Book of Abstracts; page 9. (see annex).
Jimena Bravo, Iziar A. Ludwig , Isabel Juániz, M. Paz De Peña y Concepción Cid. (2010).
Poster: “Influencia del origen en la capacidad antioxidante del café”. In II Congreso de la
Federación Española de Sociedades de Nutrición, Alimentación y Dietética (FESNAD),
Barcelona, Spain. Nutrición Hospitalaria 2010; Supl. 1, Vol. 25, pag. 100. ISSN: 0212-1611.
(see annex)
Lidia Sánchez Ayaso, Iziar A. Ludwig , M. Paz De Peña, and Concepción Cid. (2011). Poster:
“Influence of temperature and equilibration time on the quantification of aroma impact
compounds in coffee brews”. In Euro Food Chem XVI, Gdansk, Poland. Polish Journal of Food
and Nutrition Sciences 2011; Suppl. 1, Vol. 61, pag. 125. ISSN: 1230-0322. (see annex)
Iziar Ludwig , Lidia Sánchez Ayaso, Bettina Cämmerer, Lothar W. Kroh, M. Paz De Peña, and
Concepción Cid. (2011). Poster: “Influence of the extraction time on the antioxidant activity of
coffee brews”. In First International Congress on CoCoTea, Novara, Italy. Book of Abstracts and
CD-Proceedings; pages 94 and 201-2013. ISBN: 978-88-903360-0-3. (see annex)
Dissemination of Results
144
Iziar Ludwig , M. Paz De Peña, and Concepción Cid. (2011). Oral communication: “Unravelling
the contribution of volatile compounds to the antioxidant capacity of coffee- A study on model
systems”. In First International Congress on CoCoTea, Novara, Italy. Book of Abstracts and CD-
Proceedings; pages 24 and 31. ISBN: 978-88-903360-0-3. (see annex)
Iziar Ludwig , Lidia Sánchez Ayaso, M. Paz De Peña, and Concepción Cid. (2011). Poster:
“Unravelling the influence of brewing time on coffee chlorogenic acids extraction”. In 5th
International Conference on Polyphenols and Health, Sitges, Spain. Libro de Abstracts; page
176. (see annex)
Iziar Ludwig , Maizatul H. Omar, M. Paz De Peña, and Concepción Cid, Alan Crozier. (2012).
Oral comunication: “Coffee phenolics degradation and formation of bioactive metabolites by
human colonic microflora”. Chemical Reactions in Foods VII, Prague, Czech Republic. Book of
Abstracts; page 59. ISBN: 978-80-7080-836-8. (see annex)

Annex

COST-927
Thermally processed foods:
possible health implications
September 5th
- 6th
, 2007
Ebersberg – Germany
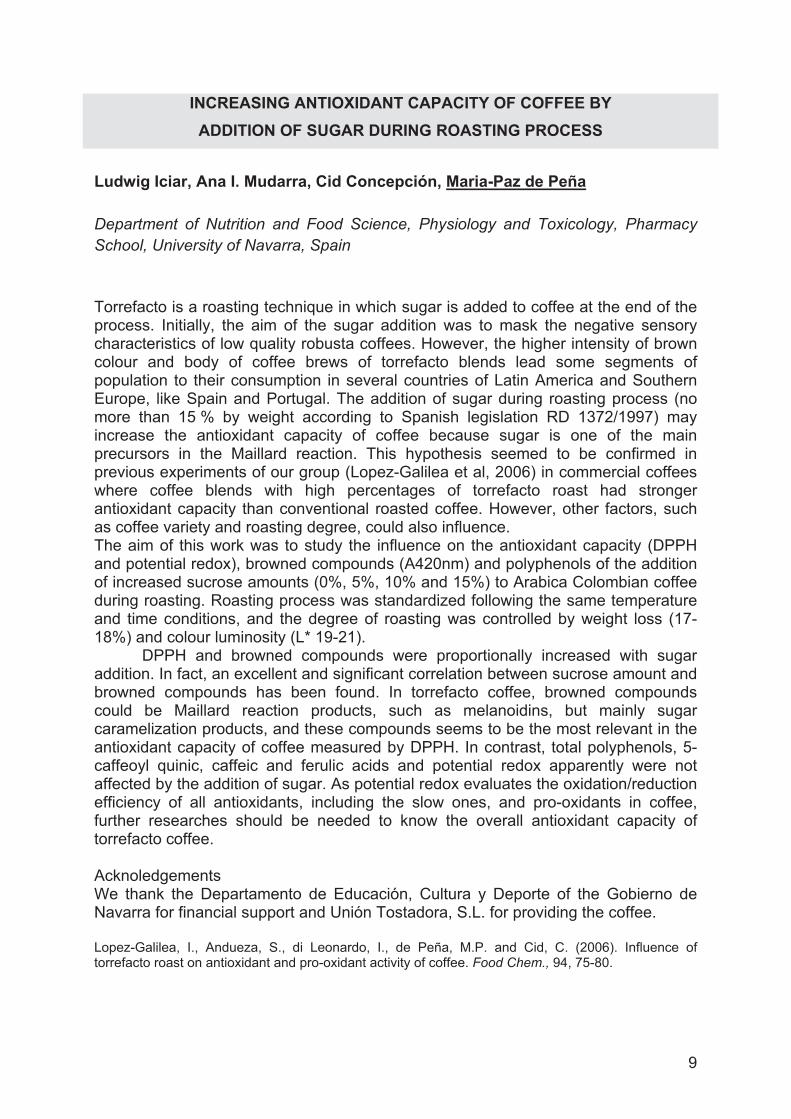
INCREASING ANTIOXIDANT CAPACITY OF COFFEE BY
ADDITION OF SUGAR DURING ROASTING PROCESS
Ludwig Iciar, Ana I. Mudarra, Cid Concepción, Maria-Paz de Peña
Department of Nutrition and Food Science, Physiology and Toxicology, Pharmacy
School, University of Navarra, Spain
Torrefacto is a roasting technique in which sugar is added to coffee at the end of the process. Initially, the aim of the sugar addition was to mask the negative sensory characteristics of low quality robusta coffees. However, the higher intensity of brown colour and body of coffee brews of torrefacto blends lead some segments of population to their consumption in several countries of Latin America and Southern Europe, like Spain and Portugal. The addition of sugar during roasting process (no more than 15 % by weight according to Spanish legislation RD 1372/1997) may increase the antioxidant capacity of coffee because sugar is one of the main precursors in the Maillard reaction. This hypothesis seemed to be confirmed in previous experiments of our group (Lopez-Galilea et al, 2006) in commercial coffees where coffee blends with high percentages of torrefacto roast had stronger antioxidant capacity than conventional roasted coffee. However, other factors, such as coffee variety and roasting degree, could also influence. The aim of this work was to study the influence on the antioxidant capacity (DPPH and potential redox), browned compounds (A420nm) and polyphenols of the addition of increased sucrose amounts (0%, 5%, 10% and 15%) to Arabica Colombian coffee during roasting. Roasting process was standardized following the same temperature and time conditions, and the degree of roasting was controlled by weight loss (17-18%) and colour luminosity (L* 19-21).
DPPH and browned compounds were proportionally increased with sugar addition. In fact, an excellent and significant correlation between sucrose amount and browned compounds has been found. In torrefacto coffee, browned compounds could be Maillard reaction products, such as melanoidins, but mainly sugar caramelization products, and these compounds seems to be the most relevant in the antioxidant capacity of coffee measured by DPPH. In contrast, total polyphenols, 5-caffeoyl quinic, caffeic and ferulic acids and potential redox apparently were not affected by the addition of sugar. As potential redox evaluates the oxidation/reduction efficiency of all antioxidants, including the slow ones, and pro-oxidants in coffee, further researches should be needed to know the overall antioxidant capacity of torrefacto coffee. Acknoledgements We thank the Departamento de Educación, Cultura y Deporte of the Gobierno de Navarra for financial support and Unión Tostadora, S.L. for providing the coffee. Lopez-Galilea, I., Andueza, S., di Leonardo, I., de Peña, M.P. and Cid, C. (2006). Influence of torrefacto roast on antioxidant and pro-oxidant activity of coffee. Food Chem., 94, 75-80.
9

Nutrición hospitalaria. Vol 25, Supl. 1, marzo 2010
II Congreso Fesnad, Barcelona 2010, “Hacia una alimentación
responsable” 3 a 5 de marzo de 2010
http://www.fesnad.org/congresos/II_congreso_Fesnad/congreso.asp
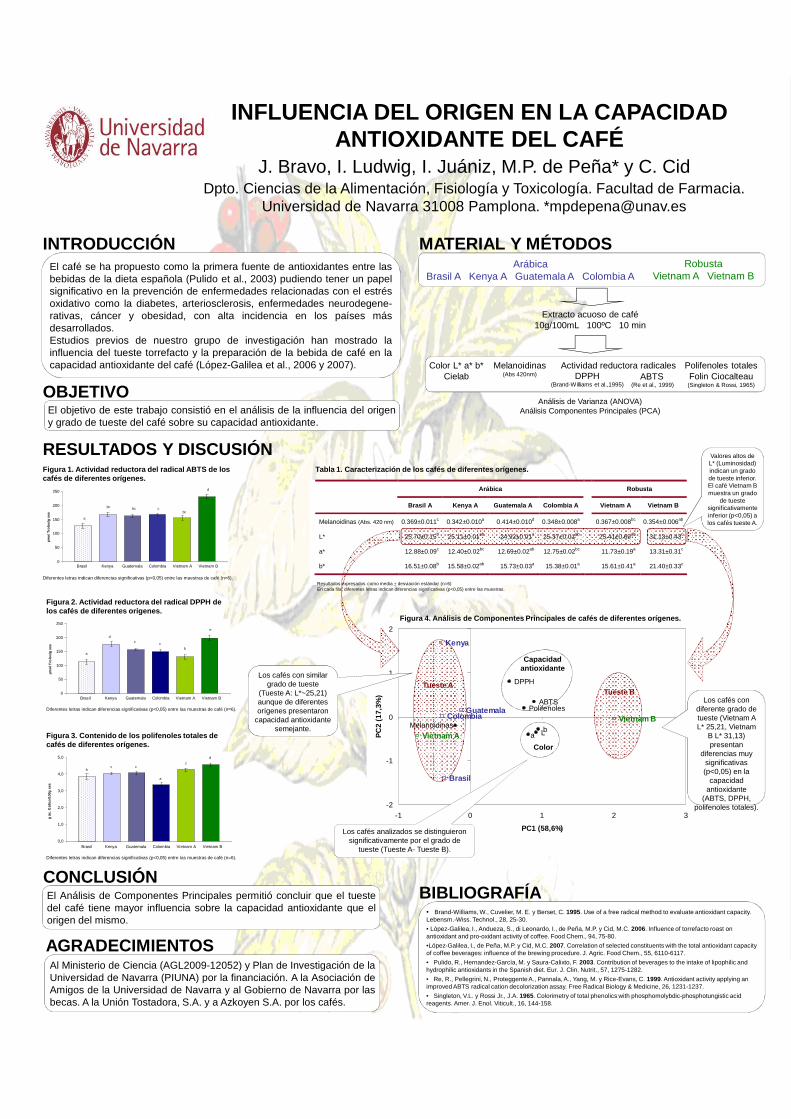
INFLUENCIA DEL ORIGEN EN LA CAPACIDAD ANTIOXIDANTE DEL CAFÉ
J. Bravo, I. Ludwig, I. Juániz, M.P. de Peña* y C. CidDpto. Ciencias de la Alimentación, Fisiología y Toxicología. Facultad de Farmacia.
Universidad de Navarra 31008 Pamplona. *[email protected]
INTRODUCCIÓNEl café se ha propuesto como la primera fuente de antioxidantes entre lasbebidas de la dieta española (Pulido et al., 2003) pudiendo tener un papelsignificativo en la prevención de enfermedades relacionadas con el estrésoxidativo como la diabetes, arteriosclerosis, enfermedades neurodegene-rativas, cáncer y obesidad, con alta incidencia en los países másdesarrollados.Estudios previos de nuestro grupo de investigación han mostrado lainfluencia del tueste torrefacto y la preparación de la bebida de café en lacapacidad antioxidante del café (López-Galilea et al., 2006 y 2007).
OBJETIVOEl objetivo de este trabajo consistió en el análisis de la influencia del origeny grado de tueste del café sobre su capacidad antioxidante.
CONCLUSIÓNEl Análisis de Componentes Principales permitió concluir que el tuestedel café tiene mayor influencia sobre la capacidad antioxidante que elorigen del mismo.
AGRADECIMIENTOSAl Ministerio de Ciencia (AGL2009-12052) y Plan de Investigación de laUniversidad de Navarra (PIUNA) por la financiación. A la Asociación deAmigos de la Universidad de Navarra y al Gobierno de Navarra por lasbecas. A la Unión Tostadora, S.A. y a Azkoyen S.A. por los cafés.
BIBLIOGRAFÍA• Brand-Williams, W., Cuvelier, M. E. y Berset, C. 1995. Use of a free radical method to evaluate antioxidant capacity. Lebensm.-Wiss. Technol., 28, 25-30.
• López-Galilea, I., Andueza, S., di Leonardo, I., de Peña, M.P. y Cid, M.C. 2006. Influence of torrefacto roast on antioxidant and pro-oxidant activity of coffee. Food Chem., 94, 75-80.
•López-Galilea, I., de Peña, M.P. y Cid, M.C. 2007. Correlation of selected constituents with the total antioxidant capacity of coffee beverages: influence of the brewing procedure. J. Agric. Food Chem., 55, 6110-6117.
• Pulido, R., Hernandez-García, M. y Saura-Calixto, F. 2003. Contribution of beverages to the intake of lipophilic and hydrophilic antioxidants in the Spanish diet. Eur. J. Clin. Nutrit., 57, 1275-1282.
• Re, R., Pellegrini, N., Proteggente A., Pannala, A., Yang, M. y Rice-Evans, C. 1999. Antioxidant activity applying an improved ABTS radical cation decolorization assay. Free Radical Biology & Medicine, 26, 1231-1237.
• Singleton, V.L. y Rossi Jr., J.A. 1965. Colorimetry of total phenolics with phosphomolybdic-phosphotungistic acid reagents. Amer. J. Enol. Viticult., 16, 144-158.
MATERIAL Y MÉTODOS
Extracto acuoso de café10g/100mL 100ºC 10 min
Análisis de Varianza (ANOVA)Análisis Componentes Principales (PCA)
RobustaVietnam A Vietnam B
ArábicaBrasil A Kenya A Guatemala A Colombia A
Polifenoles totalesFolin Ciocalteau (Singleton & Rossi, 1965)
Color L* a* b* Cielab
Melanoidinas(Abs 420nm)
Actividad reductora radicalesDPPH ABTS
(Re et al., 1999)(Brand-Williams et al.,1995)
RESULTADOS Y DISCUSIÓNFigura 1. Actividad reductora del radical ABTS de l os cafés de diferentes orígenes.
Diferentes letras indican diferencias significativas (p<0,05) entre las muestras de café (n=6).
0
50
100
150
200
250
µmol
Tro
lox/
g ss
s
bc
a
bcbc
c
d
Brasil Kenya Guatemala Colombia Vietnam A Vietnam B
Figura 2. Actividad reductora del radical DPPH de los cafés de diferentes orígenes.
0
50
100
150
200
250
µmol
Tro
lox/
g ss
s b
a
d
c c
e
Brasil Kenya Guatemala Colombia Vietnam A Vietnam B
Diferentes letras indican diferencias significativas (p<0,05) entre las muestras de café (n=6).
Figura 3. Contenido de los polifenoles totales de cafés de diferentes orígenes.
0,0
1,0
2,0
3,0
4,0
5,0
g ác
. Gál
ico/
100g
sss
c
b c c
a
d
Brasil Kenya Guatemala Colombia Vietnam A Vietnam B
Diferentes letras indican diferencias significativas (p<0,05) entre las muestras de café (n=6).
bL
ABTSPolifenoles
DPPH
aMelanoidinas
Vietnam A
Brasil
Kenya
GuatemalaColombia Vietnam B
-2
-1
0
1
2
-1 0 1 2 3
PC1 (58,6%)
PC
2 (1
7,3%
)
Figura 4. Análisis de Componentes Principales de ca fés de diferentes orígenes.
Tueste ATueste B
Color
Los cafés con similar grado de tueste
(Tueste A: L*~25,21) aunque de diferentes orígenes presentaron
capacidad antioxidante semejante.
Los cafés con diferente grado de tueste (Vietnam A L* 25,21, Vietnam
B L* 31,13) presentan
diferencias muy significativas (p<0,05) en la
capacidad antioxidante
(ABTS, DPPH, polifenoles totales).
Los cafés analizados se distinguieron significativamente por el grado de
tueste (Tueste A- Tueste B).
Capacidad antioxidante
Tabla 1. Caracterización de los cafés de diferentes orígenes.
Arábica Robusta
Brasil A Kenya A Guatemala A Colombia A Vietnam A Vietnam B
Melanoidinas (Abs. 420 nm) 0.369±0.011c 0.342±0.010a 0.414±0.010d 0.348±0.008a 0.367±0.008bc 0.354±0.006ab
L* 25.70±0.15b 25.11±0.01ab 24.92±0.01a 25.37±0.01ab 25.41±0.69ab 31.13±0.43c
a* 12.88±0.09c 12.40±0.02bc 12.69±0.02ab 12.75±0.02bc 11.73±0.19a 13.31±0.31c
b* 16.51±0.08b 15.58±0.02ab 15.73±0.03a 15.38±0.01a 15.61±0.41a 21.40±0.33c
Valores altos de L* (Luminosidad) indican un grado de tueste inferior.El café Vietnam B muestra un grado
de tueste significativamente inferior (p<0,05) a los cafés tueste A.
Resultados expresados como media ± desviación estándar (n=6)En cada fila, diferentes letras indican diferencias significativas (p<0,05) entre las muestras.

ISSN (1230-0322)
2 0 1 1 , Vol. 61, Suppl. 1
Publishedby the Division of Food
Sciences, Institute of Animal
Reproduction and Food
Research of Polish Academy
of Sciences, Olsztyn
EuroFoodChem XVITranslating food chemistry
into health bene! ts
Conference Proceedings
Gdansk 6th-8th July, 2011
125PJFNS, 2011, Vol. 61 EuroFoodChem XVI
mulated with F-100% flour, respectively. Similarly, total EAA
content was found 9% and 6% higher in rye bread and ginger
cake formulated with F-100% flour, respectively. In addition,
rye bread formulated with whole rye flour exhibited larger
content of total EAA (16%) than WB. Regarding protein
quality indexes, F100% rye bread showed greater CS values
compared to either F92% rye bread and WB, however, PER
values were similar among wheat and rye breads. In the case
of ginger cakes, CS and PER values were found slightly lower
compared to WB. Hence, whole rye flour (100% extraction
rate) could be use as an approach to improve the nutritional
quality of traditional rye-based products.
[1] Frias J., Gulewicz P., Martinez-Villaluenga C., Pilarski R., Blázquez E., Jiménez B., Gulewicz K., Vidal-Valverde C., J. Agric. Food Chem., 2009, 57, 1319–1325.[2] FAO. 2007. Protein and amino acid requirements in human nutrition. Report of joint WHO/FAO/UNU. Expert consultation. WHO Technical Report series 935.[3] Alsmeyer B.J., Cummingham A.E., Happich M.L., Food Technol., 1974, 28, 34–40.
Correspondence to: [email protected]
P199
Effects of Microwave and Hot-Air Popper Methods on Some Characteristics of Popcorn
smail Sait Do!an1, Önder Yõldõz2, Issa Javidipour1
1University of Yüzüncü Yõl, Turkey2I!dõr University, Turkey
Key words: popcorn, microwave, hot-air popper, hexanal, textural proper-ties
Popcorn is one of the most popular snack foods in the world.
In this study three types of commercial popcorns seed packag-
es including light butter flavour (14% fat), butter flavour (32%
fat) and great buttery taste (44% fat) popped with two differ-
ent methods; microwave oven and hot-air popper. The effects
of popping methods and the types of popcorn seed products
on popping volume (cm3/g), popped kernel size (kernel num-
ber/10 g), moisture content, color values (L, a and b), hexanal
content as indicator of oil oxidation and some textural char-
acteristics (crispness and firmness) have been determined.
Popcorn seed samples popped with hot-air popper showed
higher popping volume and popped kernel size. Higher oil
level increased the popped kernel size, but decreased the pop-
ping volume (p<0.001). The moisture contents of the sam-
ples in both methods varied between 0.89 and 3.03%. Samples
popped with hot-air popper had higher moisture contents
and higher L and a values (p<0.05). In both methods, oil lev-
els did not significantly alter the moisture content and color
values (p>0.05). Higher oil contents leaded to higher hexanal
concentrations. Popcorn samples popped with microwave
method had lower hexanal level (p<0.001) than their counter-
parts produced with hot-air popper. The oil level and popping
method significantly (p<0.05) affected the textural proper-
ties of popcorn. Increasing the oil level and microwave ap-
plication also increased the crispness and the firmness values.
Overall quality of popcorns popped with hot-air method look
preferable, but lower hexanal content of popcorns prepared
with microwave method should be considered.
Correspondence to: [email protected]; o.yildiz.36@hot-
mail.com
P200
Influence of Temperature and Equilibration Time on the Quantification of Aroma Impact Compounds in Coffee Brews
Lidia Sánchez-Ayaso, Iziar A."Ludwig, M."Paz De Peña, Concepción Cid
Department of Nutrition, Food Science, Physiology,
and Toxicology, School of Pharmacy, University of Navarra,
E-31080-Pamplona, Spain
Key words: coffee, aroma, static headspace, coffee brews, aroma impact compounds
One of the most contributory factors for the high accept-
ability of coffee is its aroma, which involves more than
800 volatile compounds. The aim of this study was to opti-
mize the methodology of the main aroma impact compounds
extraction in coffee brews with the highest efficiency at lowest
time using static headspace-gas chromatography-mass spec-
trometry (HS-GC-MS). Equilibration time and temperature
were the factors studied to choose the optimal conditions for
analyzing aroma compounds in coffee brews by a static head-
space sampling extraction method.
Five temperatures of equilibration (50, 55, 60, 65
and 70ºC) were studied. Seventy one volatile compounds
were identified in Arabica filter coffee brews and the main
aroma impact compounds in coffee brews (methanethiol,
acetaldehyde, propanal, 2-methylpropanal, 2-methylbu-
tanal, 3-methylbutanal, 2,3-butanedione, 2,3-pentanedione,
3,5-dimethyl-3-ethylpyrazine and guaiacol) were quantified.
Increased amounts of aroma impact compounds with tem-
perature increase were found, except in methanethiol, 3,5-di-
methyl-3-ethylpyrazine and guaiacol that decreased at 70ºC
due to thermal degradation. Consequently, 65ºC was selected
as extraction temperature. Then, the extraction of the aroma
impact compounds was studied at five different equilibra-
tion times: 15, 25, 35, 45 and 55 min at 65ºC. The maximum
concentration in the majority of the quantified aroma impact
compounds was obtained at an equilibration time of 25 min.
In conclusion, the optimal conditions in static headspace for
quantification of aroma impact compounds in coffee brews
were 25 min at 65ºC.
Acknowledgements: This research was funded by the Span-
ish Ministry of Science and Innovation (AGL2009–12052). We
thank the Government of Navarra (Dpt. Industry and Dpt. Edu-

126 EuroFoodChem XVI PJFNS, 2011, Vol. 61
cation) for the grants given to L.S.A. and I.A.L, and the Unión
Tostadora for providing the coffee samples.
Correspondence to: [email protected]
P201
How Does Affect Thermal Processing to Functional Properties of Bean Flours?
Yolanda Aguilera, Rosa M Esteban, Vanesa Benítez, Thaise Sarmento, Esperanza Mollá, Francisco J."López-
-Andréu, María A."Martín-Cabrejas
Instituto de Ciencias de la Alimentación (CIAL). Dpto. Química
Agrícola, Facultad de Ciencias, C/ Nicolás Cabrera 9, Campus
Universidad Autónoma de Madrid, 28049 Madrid, Spain
Key words: dehydration, bean flours, functional properties
Research has emphasized the utilization of beans in the form
of meal and flour for using as functional ingredients in food
products. Dehydration is a technology classified as a high
temperature process to produce a variety of foods and ingre-
dients and offers numerous advantages including prolonged
preservation time, high productivity and quality of resulting
products. The objective of this study was to determine chang-
es in functional properties of bean flours as affected by soak-
ing, cooking and dehydration, with a view to providing useful
information towards effective utilization of these legumes
in various food applications. The raw legume flours exhibited
low oil holding capacities, 1.10 mL/g and did not show any
change by thermal processing, instead water holding capaci-
ties reached 3.45 mL/ g sample after dehydration. Emulsifying
activity and foam capacity were higher in raw legumes than
thermal processed samples. Nevertheless, swelling capac-
ity showed great increases in legume flours after dehydration
process. Thus, the study of the effect of dehydration on func-
tional properties provides useful information for bean flours.
These legume flours could be used as functional ingredients
in food systems and incorporated into products such as bakery
products, seasonings, and sausages among other but sensory
and texture analyses of the products would be necessary.
Correspondence to: [email protected]
P202
Effect of Frying Process on Antioxidant Capacity of Vegetable Oils, Meat and Potatoes
Aleksandra Szyd#owska-Czerniak, Agnieszka Kilanowska, Edward Sz#yk
Faculty of Chemistry, Nicolaus Copernicus University,
Toru", Poland
Key words: antioxidant capacity, food, total phenolic content, frying
Vegetable oils, meats and French fries hold an important
place in human diet. Vegetable oils are consumed as salad
oils, cooking oils, and frying oils. Fried foods are very popu-
lar worldwide due to their delicious sensory characteristics.
Despite common opinion, the frying process have almost
the same or even lower effect on nutrient losses compared
to other cooking methods [1,2]. In the frying process, veg-
etables, meat, potatoes or seafood, are brought in direct con-
tact with hot oil. The food surface becomes golden yellow to
dark brown and develops a pleasant fried food ßavor. Frying
temperature and frying time varies depends on products fried.
The antioxidant activity of studied food products and oils
before and after the frying process was determined by a fer-
ric reducing antioxidant power (FRAP) method. Moreover,
the total content of phenolic compounds by the Folin-Ciocal-
teau method was analyzed. Meat products (poultry and pork)
and French fries were fried in rapeseed oil, palm oil and olive
oil with garlic. The antioxidant activity of meat and French
fries before frying ranged between 9.0–15.3 µmol TE (Tro-
lox)/100 g and 273.8– 276.7 µmol TE/100 g, whereas after fry-
ing values increased for meet samples from 31.1 µmol TE/100
g to 69.7 µmol TE/100 g, and decreased for French fries 75.4
µmol TE/100 g – 121.1 µmol TE/100 g. However, the anti-
oxidant activity of oils varied from 113.3 µmol TE/100 g to
231.0 µmol TE/100g. The total phenolic compounds in all
oils decreased in the range 3.3– 80.2% after frying. Principal
component analysis (PCA) was applied for analysis of frying
process impact on the antioxidant capacity and TPC of stud-
ied food samples.
[1] Chiou A., Salta F.N., Kalogeropoulos N., Mylona A., Ntalla I., An-drikopoulos N.K., J. Food Sci., 2007.[2] Gupta M.K., Bailey’s Industrial Oil and Fat Products, 2005.
Correspondence to: [email protected]
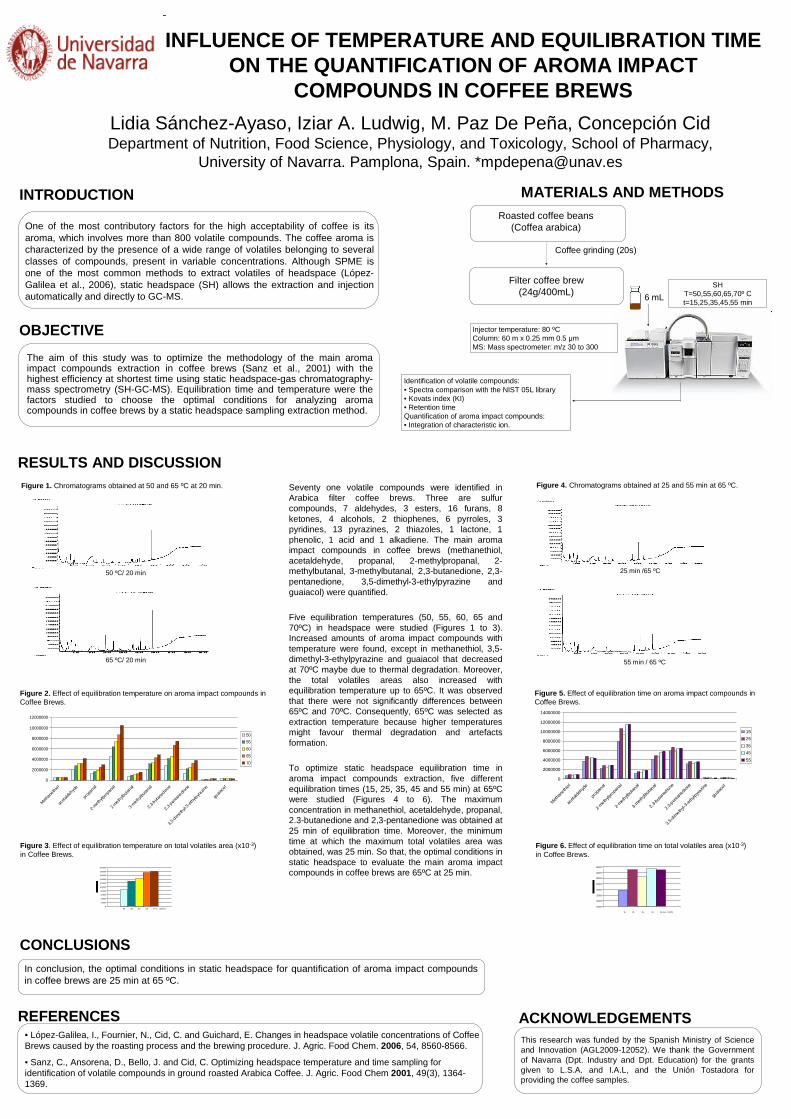
0
2000000
4000000
6000000
8000000
10000000
12000000
14000000
Met
hane
thiol
acet
aldeh
yde
prop
anal
2-met
hylpr
opan
al
2-met
hylbut
anal
3-met
hylbut
anal
2,3-
buta
nedion
e
2,3-pen
tane
dion
e
3,5-
dimet
hyl-3
-eth
ylpyra
zine
guaia
col
15
25
35
45
55
The aim of this study was to optimize the methodology of the main aroma impact compounds extraction in coffee brews (Sanz et al., 2001) with the highest efficiency at shortest time using static headspace-gas chromatography-mass spectrometry (SH-GC-MS). Equilibration time and temperature were the factors studied to choose the optimal conditions for analyzing aroma compounds in coffee brews by a static headspace sampling extraction method.
RESULTS AND DISCUSSION
MATERIALS AND METHODS
Lidia Sánchez-Ayaso, Iziar A. Ludwig, M. Paz De Peña, Concepción Cid Department of Nutrition, Food Science, Physiology, and Toxicology, School of Pharmacy,
University of Navarra. Pamplona, Spain. *[email protected]
CONCLUSIONS
INFLUENCE OF TEMPERATURE AND EQUILIBRATION TIME ON THE QUANTIFICATION OF AROMA IMPACT
COMPOUNDS IN COFFEE BREWS
INTRODUCTION
One of the most contributory factors for the high acceptability of coffee is its aroma, which involves more than 800 volatile compounds. The coffee aroma ischaracterized by the presence of a wide range of volatiles belonging to severalclasses of compounds, present in variable concentrations. Although SPME isone of the most common methods to extract volatiles of headspace (López-Galilea et al., 2006), static headspace (SH) allows the extraction and injectionautomatically and directly to GC-MS.
Figure 1. Chromatograms obtained at 50 and 65 ºC at 20 min.
OBJECTIVE
ACKNOWLEDGEMENTSThis research was funded by the Spanish Ministry of Science and Innovation (AGL2009-12052). We thank the Government of Navarra (Dpt. Industry and Dpt. Education) for the grants given to L.S.A. and I.A.L, and the Unión Tostadora for providing the coffee samples.
REFERENCES
Seventy one volatile compounds were identified in Arabica filter coffee brews. Three are sulfurcompounds, 7 aldehydes, 3 esters, 16 furans, 8 ketones, 4 alcohols, 2 thiophenes, 6 pyrroles, 3 pyridines, 13 pyrazines, 2 thiazoles, 1 lactone, 1 phenolic, 1 acid and 1 alkadiene. The main aroma impact compounds in coffee brews (methanethiol, acetaldehyde, propanal, 2-methylpropanal, 2-methylbutanal, 3-methylbutanal, 2,3-butanedione, 2,3-pentanedione, 3,5-dimethyl-3-ethylpyrazine and guaiacol) were quantified.
Five equilibration temperatures (50, 55, 60, 65 and 70ºC) in headspace were studied (Figures 1 to 3). Increased amounts of aroma impact compounds with temperature were found, except in methanethiol, 3,5-dimethyl-3-ethylpyrazine and guaiacol that decreased at 70ºC maybe due to thermal degradation. Moreover, the total volatiles areas also increased with equilibration temperature up to 65ºC. It was observed that there were not significantly differences between 65ºC and 70ºC. Consequently, 65ºC was selected as extraction temperature because higher temperatures might favour thermal degradation and artefacts formation.
To optimize static headspace equilibration time in aroma impact compounds extraction, five different equilibration times (15, 25, 35, 45 and 55 min) at 65ºC were studied (Figures 4 to 6). The maximum concentration in methanethiol, acetaldehyde, propanal, 2.3-butanedione and 2,3-pentanedione was obtained at 25 min of equilibration time. Moreover, the minimum time at which the maximum total volatiles area was obtained, was 25 min. So that, the optimal conditions in static headspace to evaluate the main aroma impact compounds in coffee brews are 65ºC at 25 min.
In conclusion, the optimal conditions in static headspace for quantification of aroma impact compounds in coffee brews are 25 min at 65 ºC.
Roasted coffee beans(Coffea arabica)
Coffee grinding (20s)
Filter coffee brew(24g/400mL)
6 mL
SHT=50,55,60,65,70º Ct=15,25,35,45,55 min
Identification of volatile compounds:• Spectra comparison with the NIST 05L library• Kovats index (KI)• Retention timeQuantification of aroma impact compounds:• Integration of characteristic ion.
50 ºC/ 20 min
65 ºC/ 20 min
Figure 2. Effect of equilibration temperature on aroma impact compounds in Coffee Brews.
25 min /65 ºC
Figure 4. Chromatograms obtained at 25 and 55 min at 65 ºC.
55 min / 65 ºC
Figure 5. Effect of equilibration time on aroma impact compounds in Coffee Brews.
Injector temperature: 80 ºCColumn: 60 m x 0.25 mm 0.5 µm MS: Mass spectrometer: m/z 30 to 300
Figure 3. Effect of equilibration temperature on total volatiles area (x10-3) in Coffee Brews.
Figure 6. Effect of equilibration time on total volatiles area (x10-3) in Coffee Brews.
125000
130000
135000
140000
145000
150000
155000
160000
15 15 25 35 45 55 min (65ºC)
0
20000
40000
60000
80000
100000
120000
140000
160000
180000
200000
50 55 60 65 70 ºC (20min)
0
2000000
4000000
6000000
8000000
10000000
12000000
Met
hane
thiol
acet
aldeh
yde
prop
anal
2-meth
ylpro
pana
l
2-meth
ylbut
anal
3-met
hylbut
anal
2,3-
butan
edione
2,3-
penta
nedio
ne
3,5-
dimeth
yl-3-
ethy
lpyra
zine
guaia
col
50
55
60
65
70
• López-Galilea, I., Fournier, N., Cid, C. and Guichard, E. Changes in headspace volatile concentrations of CoffeeBrews caused by the roasting process and the brewing procedure. J. Agric. Food Chem. 2006, 54, 8560-8566.
• Sanz, C., Ansorena, D., Bello, J. and Cid, C. Optimizing headspace temperature and time sampling foridentification of volatile compounds in ground roasted Arabica Coffee. J. Agric. Food Chem 2001, 49(3), 1364-1369.
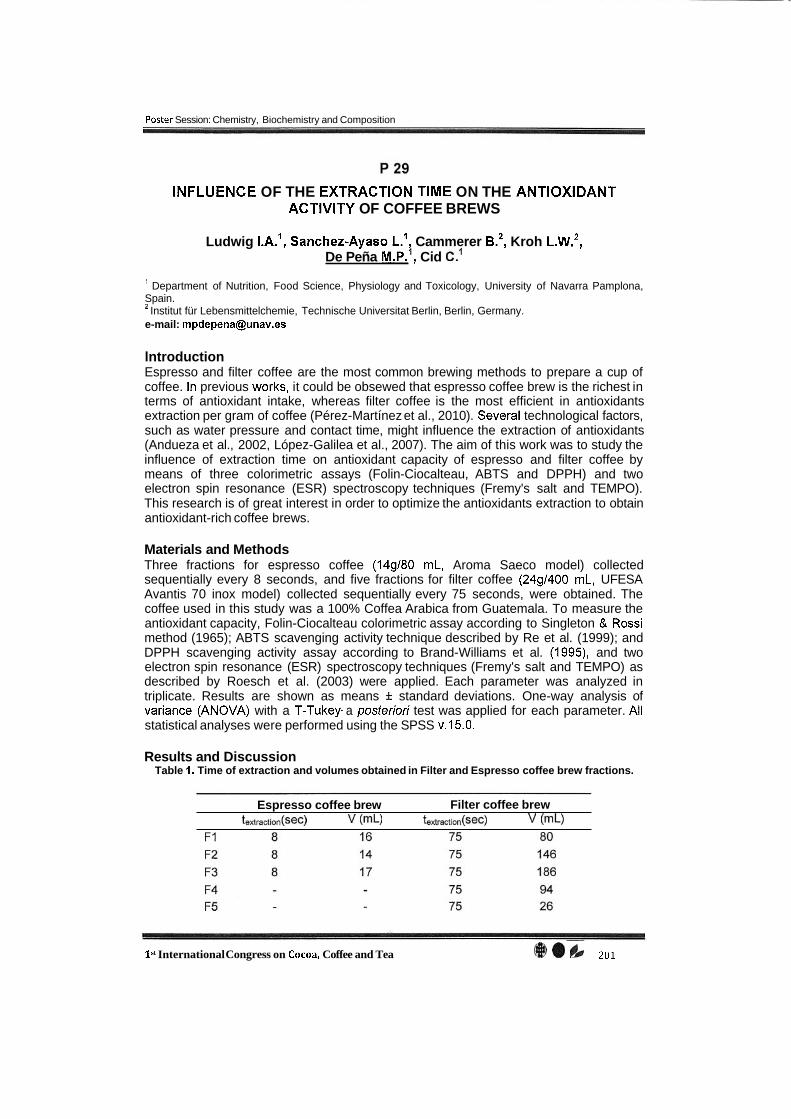
Poster Session: Chemistry, Biochemistry and Composition
INFLUENCE OF THE EXTRACTION TIME ON THE ANTlOXlDANT ACTlVlTY OF COFFEE BREWS
Ludwig I.A.', Sanchez-Ayaso L.' Cammerer B.*, Kroh L.w.~, De Peña M.P.', Cid c.I
Department of Nutrition, Food Science, Physiology and Toxicology, University of Navarra Pamplona, Spain. Institut für Lebensmittelchemie, Technische Universitat Berlin, Berlin, Germany.
e-mail: [email protected]
lntroduction Espresso and filter coffee are the most common brewing methods to prepare a cup of coffee. In previous works, it could be obsewed that espresso coffee brew is the richest in terms of antioxidant intake, whereas filter coffee is the most efficient in antioxidants extraction per gram of coffee (Pérez-Martínez et al., 201 0). Several technological factors, such as water pressure and contact time, might influence the extraction of antioxidants (Andueza et al., 2002, López-Galilea et al., 2007). The aim of this work was to study the influence of extraction time on antioxidant capacity of espresso and filter coffee by means of three colorimetric assays (Folin-Ciocalteau, ABTS and DPPH) and two electron spin resonance (ESR) spectroscopy techniques (Fremy's salt and TEMPO). This research is of great interest in order to optimize the antioxidants extraction to obtain antioxidant-rich coffee brews.
Materials and Methods Three fractions for espresso coffee (14gl80 mL, Aroma Saeco model) collected sequentially every 8 seconds, and five fractions for filter coffee (24gl400 mL, UFESA Avantis 70 inox model) collected sequentially every 75 seconds, were obtained. The coffee used in this study was a 100% Coffea Arabica from Guatemala. To measure the antioxidant capacity, Folin-Ciocalteau colorimetric assay according to Singleton & Rossi method (1 965); ABTS scavenging activity technique described by Re et al. (1 999); and DPPH scavenging activity assay according to Brand-Williams et al. (1995), and two electron spin resonance (ESR) spectroscopy techniques (Fremy's salt and TEMPO) as described by Roesch et al. (2003) were applied. Each parameter was analyzed in triplicate. Results are shown as means I standard deviations. One-way analysis of variance (ANOVA) with a T-Tukey. a posterior¡ test was applied for each parameter. All statistical analyses were performed using the SPSS v.15.0.
Results and Discussion Table 1. Time of extraction and volumes obtained in Filter and Espresso coffee brew fractions.
Espresso coffee brew Filter coffee brew fextraction(sec) v (mL) fex t rac t ion (~e~) v (mL)
lSt International Congress on Cocoa, Coffee and Tea @ e b z a l
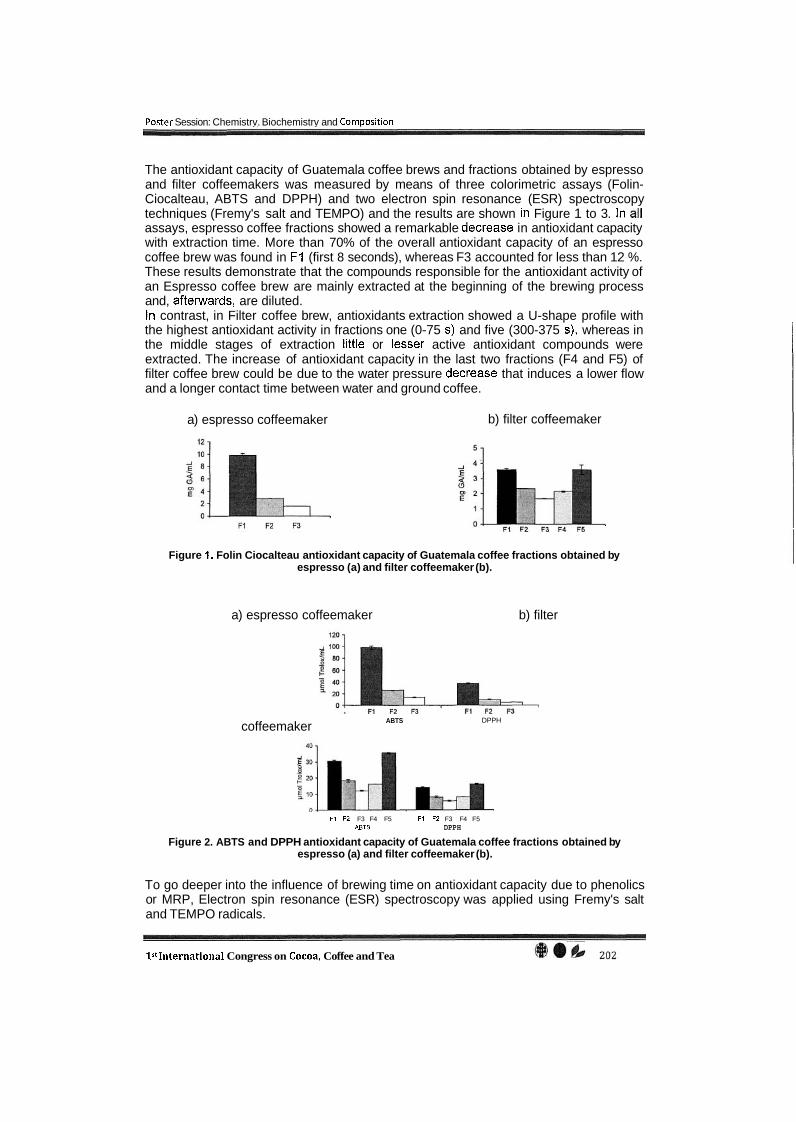
Poster Session: Chemistrv. Biochemistrv and Com~osition
The antioxidant capacity of Guatemala coffee brews and fractions obtained by espresso and filter coffeemakers was measured by means of three colorimetric assays (Folin- Ciocalteau, ABTS and DPPH) and two electron spin resonance (ESR) spectroscopy techniques (Fremy's salt and TEMPO) and the results are shown in Figure 1 to 3. In al1 assays, espresso coffee fractions showed a remarkable decrease in antioxidant capacity with extraction time. More than 70% of the overall antioxidant capacity of an espresso coffee brew was found in F1 (first 8 seconds), whereas F3 accounted for less than 12 %. These results demonstrate that the compounds responsible for the antioxidant activity of an Espresso coffee brew are mainly extracted at the beginning of the brewing process and, afterwards, are diluted. In contrast, in Filter coffee brew, antioxidants extraction showed a U-shape profile with the highest antioxidant activity in fractions one (0-75 S) and five (300-375 S), whereas in the middle stages of extraction little or lesser active antioxidant compounds were extracted. The increase of antioxidant capacity in the last two fractions (F4 and F5) of filter coffee brew could be due to the water pressure decrease that induces a lower flow and a longer contact time between water and ground coffee.
a) espresso coffeemaker b) filter coffeemaker
Figure l. Folin Ciocalteau antioxidant capacity of Guatemala coffee fractions obtained by espresso (a) and filter coffeemaker (b).
a) espresso coffeemaker b) filter
coffeemaker ABTS DPPH
F1 F2 F3 F4 F5 F1 F2 F3 F4 F5 ABTS DPPH
Figure 2. ABTS and DPPH antioxidant capacity of Guatemala coffee fractions obtained by espresso (a) and filter coffeemaker (b).
To go deeper into the influence of brewing time on antioxidant capacity due to phenolics or MRP, Electron spin resonance (ESR) spectroscopy was applied using Fremy's salt and TEMPO radicals.
lstInternational Congress on Cocoa, Coffee and Tea
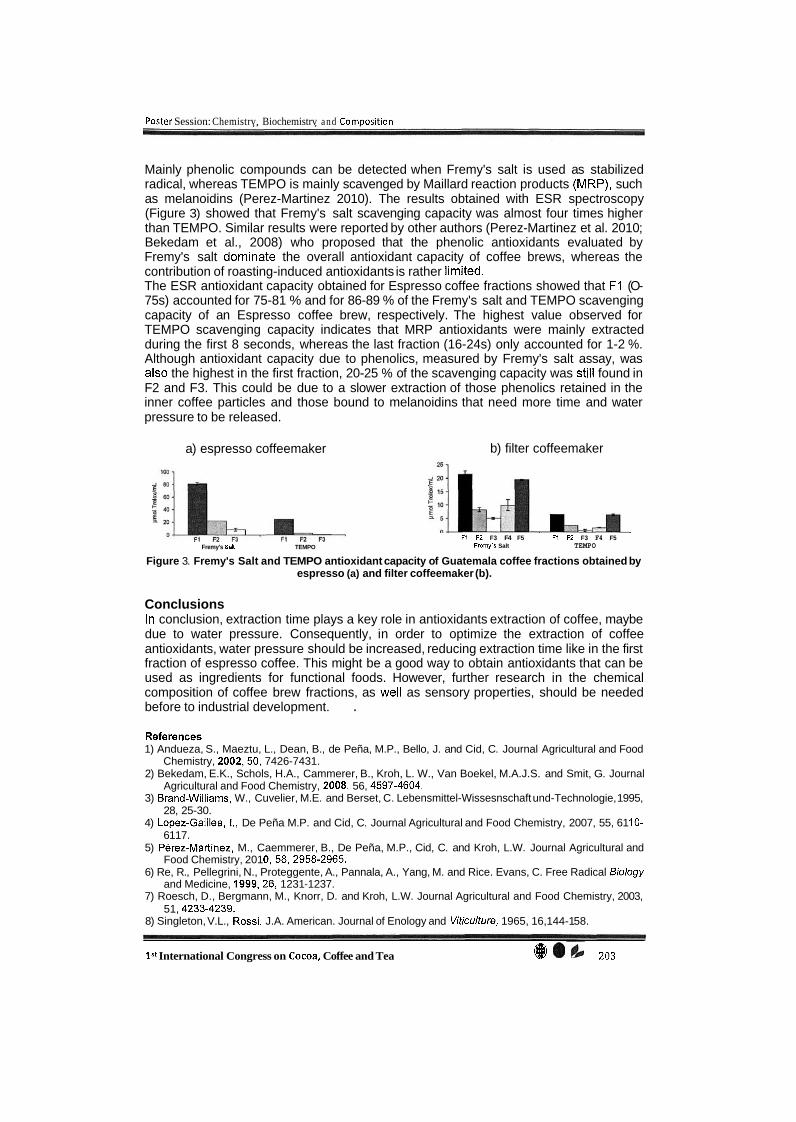
Poster Session: Chemistrv. Biochemistrv and Com~osition
Mainly phenolic compounds can be detected when Fremy's salt is used as stabilized radical, whereas TEMPO is mainly scavenged by Maillard reaction products (MRP), such as melanoidins (Perez-Martinez 2010). The results obtained with ESR spectroscopy (Figure 3) showed that Fremy's salt scavenging capacity was almost four times higher than TEMPO. Similar results were reported by other authors (Perez-Martinez et al. 201 0; Bekedam et al., 2008) who proposed that the phenolic antioxidants evaluated by Fremy's salt dominate the overall antioxidant capacity of coffee brews, whereas the contribution of roasting-induced antioxidants is rather limited. The ESR antioxidant capacity obtained for Espresso coffee fractions showed that F1 (O- 75s) accounted for 75-81 % and for 86-89 % of the Fremy's salt and TEMPO scavenging capacity of an Espresso coffee brew, respectively. The highest value observed for TEMPO scavenging capacity indicates that MRP antioxidants were mainly extracted during the first 8 seconds, whereas the last fraction (16-24s) only accounted for 1-2 %. Although antioxidant capacity due to phenolics, measured by Fremy's salt assay, was also the highest in the first fraction, 20-25 % of the scavenging capacity was still found in F2 and F3. This could be due to a slower extraction of those phenolics retained in the inner coffee particles and those bound to melanoidins that need more time and water pressure to be released.
a) espresso coffeemaker b) filter coffeemaker
Fremy's Salt TEMPO F1 F2 F3 F4 F5 F1 F2 F3 F4 F5
Fremy's Salt TEMPO
Figure 3. Fremy's Salt and TEMPO antioxidant capacity of Guatemala coffee fractions obtained by espresso (a) and filter coffeemaker (b).
Conclusions In conclusion, extraction time plays a key role in antioxidants extraction of coffee, maybe due to water pressure. Consequently, in order to optimize the extraction of coffee antioxidants, water pressure should be increased, reducing extraction time like in the first fraction of espresso coffee. This might be a good way to obtain antioxidants that can be used as ingredients for functional foods. However, further research in the chemical composition of coffee brew fractions, as well as sensory properties, should be needed before to industrial development. .
References 1) Andueza, S., Maeztu, L., Dean, B., de Peña, M.P., Bello, J. and Cid, C. Journal Agricultural and Food
Chemistry, 2002,50, 7426-7431. 2) Bekedam, E.K., Schols, H.A., Cammerer, B., Kroh, L. W., Van Boekel, M.A.J.S. and Smit, G. Journal
Agricultural and Food Chemistry, 2008, 56, 4597-4604. 3) Brand-Williams, W., Cuvelier, M.E. and Berset, C. Lebensmittel-Wissesnschaft und-Technologie, 1995,
28, 25-30. 4) Lopez-Galilea, l., De Peña M.P. and Cid, C. Journal Agricultural and Food Chemistry, 2007, 55, 61 10-
61 17. 5) Pérez-Martinez, M., Caemmerer, B., De Peña, M.P., Cid, C. and Kroh, L.W. Journal Agricultural and
Food Chemistry, 201 0,58,2958-2965. 6) Re, R., Pellegrini, N., Proteggente, A., Pannala, A., Yang, M. and Rice. Evans, C. Free Radical Biology
and Medicine, 1999,26, 1231 -1 237. 7) Roesch, D., Bergmann, M., Knorr, D. and Kroh, L.W. Journal Agricultural and Food Chemistry, 2003,
51, 4233-4239. 8) Singleton, V.L., Rossi, J.A. American. Journal of Enology and Viticulture, 1965, 16,144-1 58.
l s t International Congress on Cocoa, Coffee and Tea @ 203
Session 1: Com~osition, aualitv and functional ingredients
UNRAVELLING THE CONTRIBUTION OF VOLATILE COMPOUNDS TO THE ANTlOXlDANT CAPACITY
OF COFFEE: A STUDY ON MODEL SYSTEMS
Ludwig I.A., De Pena M.P., Cid C.
Department of Nutrition, Food Science, Physiology and Toxicology, University of Navarra Pamplona, Spain. e-mail: [email protected]
Abstract
Several authors have proposed some volatile compounds present in coffee as potent antioxidants (Fuster et al., 2000, Yanagimoto et al., 2002). However, the contribution of the volatile compounds to the antioxidant capacity of coffee is still unclear and controversial mainly because of their low concentrations in coffee brews (Lopez-Galilea et al., 2007). The aim of this study was to evaluate the antioxidant capacity of those volatile compounds reported as antioxidants and present in coffee brews. Seven furans, 3 pyrroles, and 2 thiophenes identified in filter coffee brews (by HS-GC-MS) were selected to prepare model systems at different concentrations including those found in coffee. All model systems were analysed using ABTS as free stable radical to assess the antioxidant capacity. Results were compared with the antioxidant capacity of a filter coffee sample. The model system containing al1 the three chemical groups (pyrroles, furans and thiophenes) was the most active in scavenging ABTS, followed by pyrroles and furans. Thiophenes were ineffective as radical scavengers at al1 concentrations including 100-fold. However, in comparison with the antioxidant capacity exhibited by the filter coffee sample, the contribution of the volatile compounds assayed was insignificant (0.1 3%). In addition, results showed that the heterocyclic compounds analysed exhibited non-linear concentration-dependent antioxidant capacity. In conclusion, volatile compounds contribute very little to the antioxidant capacity of coffee in comparison to other coffee antioxidants such as caffeoylquinic acids and melanoidins.
References
Fuster, M.D. et al. Antioxidative activities of heterocyclic compounds formed in brewed coffee. J. Agric. Food Chem. 2000, 48 (1 l ) , 5600-5603 Lopez-Galilea, l. et al. Correlation of Selected Constituents with the Total Antioxidant Capacity of Coffee Beverages: lnfluence of the Brewing Procedure. J. Agric. Food Chem. 2007, 55, 61 10-61 17 Yanagimoto, K. et al. Antioxidative activity of heterocyclic compounds found in coffee volatiles produced by Maillard reaction. J. Agric. Food Chem. 2002, 50, 5480-5484
This research was funded by the Ministry of Science and lnnovation of the Spanish Government (AGL2009-12052). We thank the Department of Education of the Government of Navarra for the grant given to I.A.L., and the Unión Tostadora for providing the coffee samples.
1StInternational Congress on Cocoa, Coffee and Tea

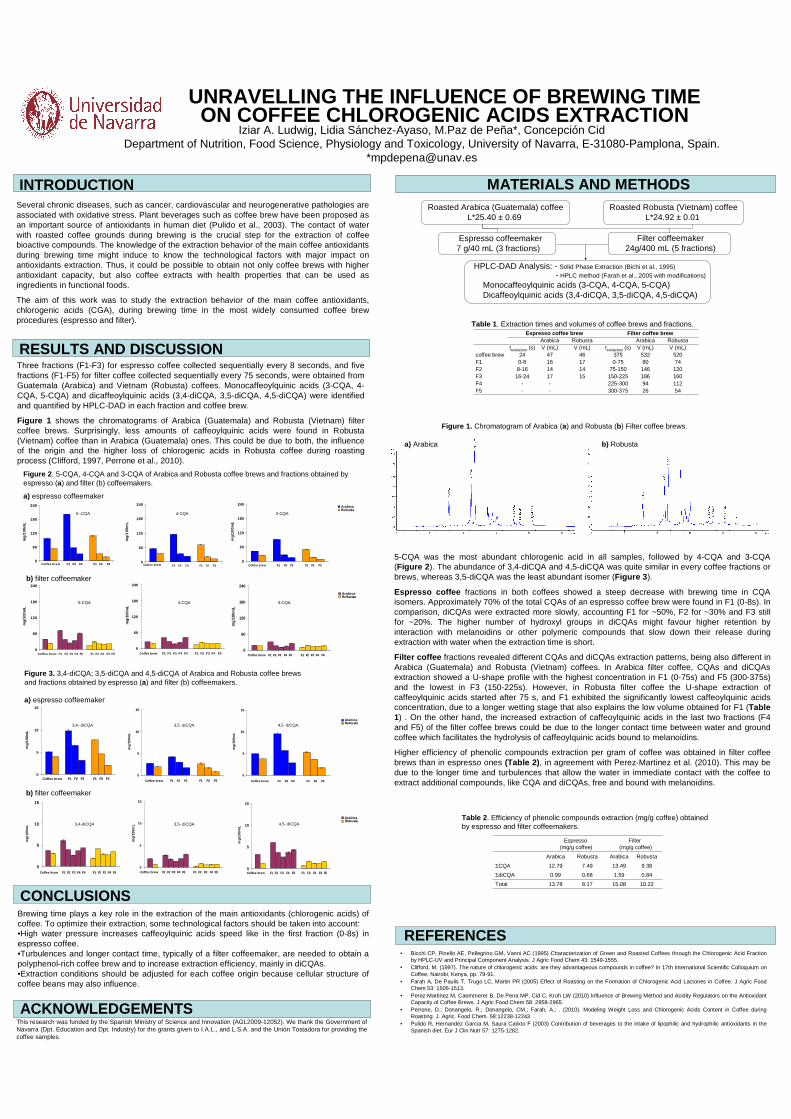
0
5
10
15
mg
/100
mL
Coffee brew F1 F2 F3 F1 F2 F3 0
5
10
15
mg
/100
mL
Coffee brew F1 F2 F3 F1 F2 F3
0
5
10
15
mg
/100
mL
Arabica Robusta
Coffee brew F1 F2 F3 F1 F2 F3
0
60
120
180
240
mg
/100
mL
Coffee brew F1 F2 F3 F1 F2 F3 0
60
120
180
240
mg
/100
mL
F1 F2 F3 F1 F2 F3 Coffee brew 0
60
120
180
240
mg
/100
mL
Arabica Robusta
Coffee brew F1 F2 F3 F1 F2 F3
• Bicchi CP, Pinello AE, Pellegrino GM, Vanni AC (1995) Characterization of Green and Roasted Coffees through the Chlorogenic Acid Fraction by HPLC-UV and Principal Component Analysis. J Agric Food Chem 43: 1549-1555.
• Clifford, M. (1997). The nature of chlorogenic acids: are they advantageous compounds in coffee? In 17th International Scientific Colloquium on Coffee, Nairobi, Kenya, pp. 79-91.
• Farah A, De Paulis T, Trugo LC, Martin PR (2005) Effect of Roasting on the Formation of Chlorogenic Acid Lactones in Coffee. J Agric Food Chem 53: 1505-1513.
• Perez-Martinez M, Caemmerer B, De Pena MP, Cid C, Kroh LW (2010) Influence of Brewing Method and Acidity Regulators on the Antioxidant Capacity of Coffee Brews. J Agric Food Chem 58: 2958-2965.
• Perrone, D.; Donangelo, R.; Donangelo, CM.; Farah, A.; . (2010). Modeling Weight Loss and Chlorogenic Acids Content in Coffee during Roasting. J. Agric. Food Chem. 58:12238-12243.
• Pulido R, Hernandez Garcia M, Saura Calixto F (2003) Contribution of beverages to the intake of lipophilic and hydrophilic antioxidants in the Spanish diet. Eur J Clin Nutr 57: 1275-1282.
MATERIALS AND METHODS
Iziar A. Ludwig, Lidia Sánchez-Ayaso, M.Paz de Peña*, Concepción CidDepartment of Nutrition, Food Science, Physiology and Toxicology, University of Navarra, E-31080-Pamplona, Spain.
UNRAVELLING THE INFLUENCE OF BREWING TIME ON COFFEE CHLOROGENIC ACIDS EXTRACTION
INTRODUCTIONSeveral chronic diseases, such as cancer, cardiovascular and neurogenerative pathologies are associated with oxidative stress. Plant beverages such as coffee brew have been proposed as an important source of antioxidants in human diet (Pulido et al., 2003). The contact of water with roasted coffee grounds during brewing is the crucial step for the extraction of coffee bioactive compounds. The knowledge of the extraction behavior of the main coffee antioxidants during brewing time might induce to know the technological factors with major impact on antioxidants extraction. Thus, it could be possible to obtain not only coffee brews with higher antioxidant capacity, but also coffee extracts with health properties that can be used as ingredients in functional foods.
The aim of this work was to study the extraction behavior of the main coffee antioxidants, chlorogenic acids (CGA), during brewing time in the most widely consumed coffee brew procedures (espresso and filter).
Figure 2. 5-CQA, 4-CQA and 3-CQA of Arabica and Robusta coffee brews and fractions obtained by espresso (a) and filter (b) coffeemakers.
a) espresso coffeemaker
ACKNOWLEDGEMENTSThis research was funded by the Spanish Ministry of Science and Innovation (AGL2009-12052). We thank the Government of Navarra (Dpt. Education and Dpt. Industry) for the grants given to I.A.L., and L.S.A. and the Unión Tostadora for providing the coffee samples.
REFERENCES
5-CQA was the most abundant chlorogenic acid in all samples, followed by 4-CQA and 3-CQA (Figure 2). The abundance of 3,4-diCQA and 4,5-diCQA was quite similar in every coffee fractions or brews, whereas 3,5-diCQA was the least abundant isomer (Figure 3).
Espresso coffee fractions in both coffees showed a steep decrease with brewing time in CQA isomers. Approximately 70% of the total CQAs of an espresso coffee brew were found in F1 (0-8s). In comparison, diCQAs were extracted more slowly, accounting F1 for ~50%, F2 for ~30% and F3 still for ~20%. The higher number of hydroxyl groups in diCQAs might favour higher retention by interaction with melanoidins or other polymeric compounds that slow down their release during extraction with water when the extraction time is short.
Filter coffee fractions revealed different CQAs and diCQAs extraction patterns, being also different in Arabica (Guatemala) and Robusta (Vietnam) coffees. In Arabica filter coffee, CQAs and diCQAsextraction showed a U-shape profile with the highest concentration in F1 (0-75s) and F5 (300-375s) and the lowest in F3 (150-225s). However, in Robusta filter coffee the U-shape extraction of caffeoylquinic acids started after 75 s, and F1 exhibited the significantly lowest caffeoylquinic acids concentration, due to a longer wetting stage that also explains the low volume obtained for F1 (Table 1) . On the other hand, the increased extraction of caffeoylquinic acids in the last two fractions (F4 and F5) of the filter coffee brews could be due to the longer contact time between water and ground coffee which facilitates the hydrolysis of caffeoylquinic acids bound to melanoidins.
Higher efficiency of phenolic compounds extraction per gram of coffee was obtained in filter coffee brews than in espresso ones (Table 2), in agreement with Perez-Martinez et al. (2010). This may be due to the longer time and turbulences that allow the water in immediate contact with the coffee to extract additional compounds, like CQA and diCQAs, free and bound with melanoidins.
CONCLUSIONSBrewing time plays a key role in the extraction of the main antioxidants (chlorogenic acids) of coffee. To optimize their extraction, some technological factors should be taken into account:•High water pressure increases caffeoylquinic acids speed like in the first fraction (0-8s) in espresso coffee. •Turbulences and longer contact time, typically of a filter coffeemaker, are needed to obtain a polyphenol-rich coffee brew and to increase extraction efficiency, mainly in diCQAs. •Extraction conditions should be adjusted for each coffee origin because cellular structure of coffee beans may also influence.
RESULTS AND DISCUSSIONThree fractions (F1-F3) for espresso coffee collected sequentially every 8 seconds, and five fractions (F1-F5) for filter coffee collected sequentially every 75 seconds, were obtained from Guatemala (Arabica) and Vietnam (Robusta) coffees. Monocaffeoylquinic acids (3-CQA, 4-CQA, 5-CQA) and dicaffeoylquinic acids (3,4-diCQA, 3,5-diCQA, 4,5-diCQA) were identified and quantified by HPLC-DAD in each fraction and coffee brew.
Figure 1 shows the chromatograms of Arabica (Guatemala) and Robusta (Vietnam) filter coffee brews. Surprisingly, less amounts of caffeoylquinic acids were found in Robusta (Vietnam) coffee than in Arabica (Guatemala) ones. This could be due to both, the influence of the origin and the higher loss of chlorogenic acids in Robusta coffee during roasting process (Clifford, 1997, Perrone et al., 2010).
b) filter coffeemaker
Figure 3. 3,4-diCQA; 3,5-diCQA and 4,5-diCQA of Arabica and Robusta coffee brews and fractions obtained by espresso (a) and filter (b) coffeemakers.
a) espresso coffeemaker
Figure 1. Chromatogram of Arabica (a) and Robusta (b) Filter coffee brews.
a) Arabica b) Robusta
3,4--diCQA 3,5- diCQA 4,5- diCQA
3,4-diCQA 3,5- diCQA 4,5- diCQA
5426300-375--F511294225-300--F4160186150-225151716-24F312014675-15014148-16F274800-7517160-8F1
520532375464724coffee brewV (mL)V (mL)textraction (s)V (mL)V (mL)textraction (s)
RobustaArabicaRobustaArabicaFilter coffee brewEspresso coffee brew
Roasted Arabica (Guatemala) coffeeL*25.40 ± 0.69
Espresso coffeemaker7 g/40 mL (3 fractions)
HPLC-DAD Analysis: - Solid Phase Extraction (Bichi et al., 1995)- HPLC method (Farah et al., 2005 with modifications)
Monocaffeoylquinic acids (3-CQA, 4-CQA, 5-CQA)Dicaffeoylquinic acids (3,4-diCQA, 3,5-diCQA, 4,5-diCQA)
Roasted Robusta (Vietnam) coffeeL*24.92 ± 0.01
Table 1. Extraction times and volumes of coffee brews and fractions.
5--CQA 4-CQA 3-CQA
b) filter coffeemaker
5-CQA 4-CQA 3-CQA
Filter coffeemaker24g/400 mL (5 fractions)
10.2215.088.1713.78Total
0.841.590.680.99ΣdiCQA
9.3813.497.4912.79ΣCQA
RobustaArabicaRobustaArabica
Filter (mg/g coffee)
Espresso(mg/g coffee)
Table 2. Efficiency of phenolic compounds extraction (mg/g coffee) obtainedby espresso and filter coffeemakers.
0
60
120
180
240
mg
/100
mL
Arabica Robusta
Coffee brew F1 F2 F3 F4 F5 F1 F2 F3 F4 F5
0
60
120
180
240
mg
/100
mL
Coffee brew F1 F2 F3 F4 F5 F1 F2 F3 F4 F50
60
120
180
240
mg
/100
mL
Coffee brew F1 F2 F3 F4 F5 F1 F2 F3 F4 F5
0
5
10
15
mg
/100
mL
Coffee brew F1 F2 F3 F4 F5 F1 F2 F3 F4 F50
5
10
15
mg/
100m
L
Arabica Robusta
Coffee brew F1 F2 F3 F4 F5 F1 F2 F3 F4 F5
0
5
10
15
mg/
100m
L
Coffee brew F1 F2 F3 F4 F5 F1 F2 F3 F4 F5

BOOK OF ABSTRACTS
November 14-16,2012
INSTiTüTE OF CHEMICAL TECHNOLOQY PRAGUE
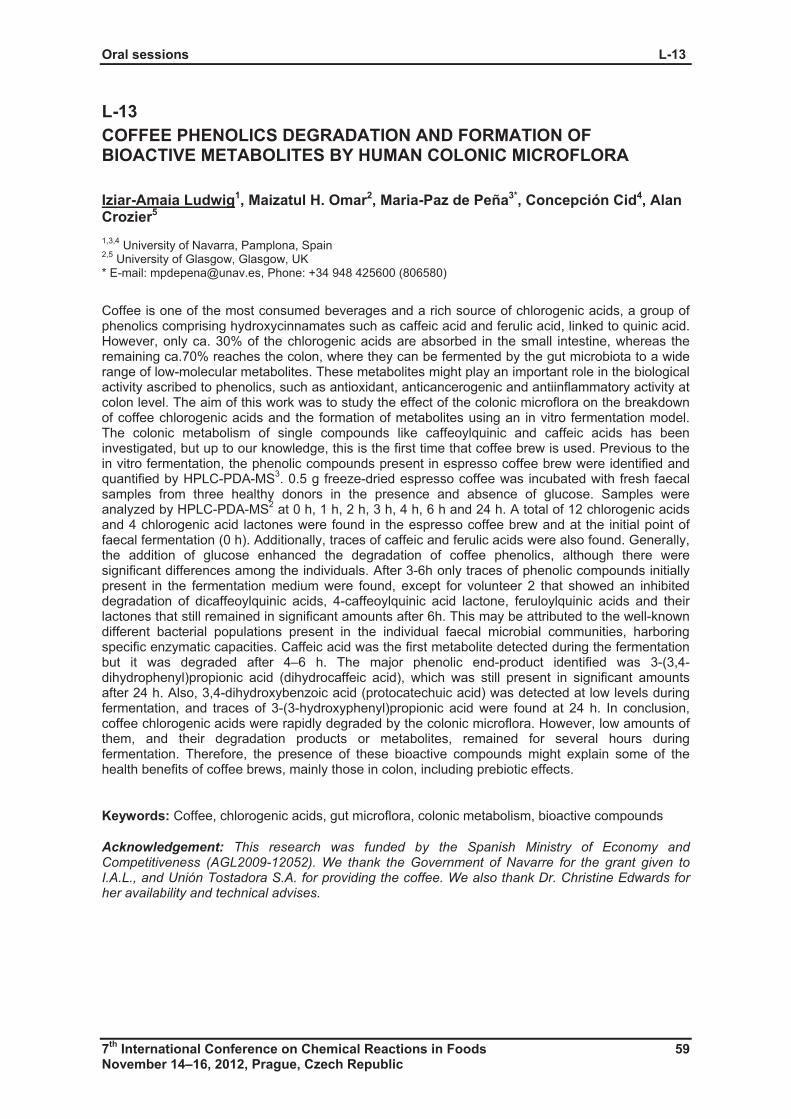
Oral sessions L-13
7th
International Conference on Chemical Reactions in Foods 59 November 14–16, 2012, Prague, Czech Republic
L-13
COFFEE PHENOLICS DEGRADATION AND FORMATION OF BIOACTIVE METABOLITES BY HUMAN COLONIC MICROFLORA
Iziar-Amaia Ludwig1, Maizatul H. Omar2, Maria-Paz de Peña3*, Concepción Cid4, Alan Crozier5
1,3,4 University of Navarra, Pamplona, Spain
2,5 University of Glasgow, Glasgow, UK
* E-mail: [email protected], Phone: +34 948 425600 (806580)
Coffee is one of the most consumed beverages and a rich source of chlorogenic acids, a group of phenolics comprising hydroxycinnamates such as caffeic acid and ferulic acid, linked to quinic acid. However, only ca. 30% of the chlorogenic acids are absorbed in the small intestine, whereas the remaining ca.70% reaches the colon, where they can be fermented by the gut microbiota to a wide range of low-molecular metabolites. These metabolites might play an important role in the biological activity ascribed to phenolics, such as antioxidant, anticancerogenic and antiinflammatory activity at colon level. The aim of this work was to study the effect of the colonic microflora on the breakdown of coffee chlorogenic acids and the formation of metabolites using an in vitro fermentation model. The colonic metabolism of single compounds like caffeoylquinic and caffeic acids has been investigated, but up to our knowledge, this is the first time that coffee brew is used. Previous to the in vitro fermentation, the phenolic compounds present in espresso coffee brew were identified and quantified by HPLC-PDA-MS
3. 0.5 g freeze-dried espresso coffee was incubated with fresh faecal
samples from three healthy donors in the presence and absence of glucose. Samples were analyzed by HPLC-PDA-MS
2 at 0 h, 1 h, 2 h, 3 h, 4 h, 6 h and 24 h. A total of 12 chlorogenic acids
and 4 chlorogenic acid lactones were found in the espresso coffee brew and at the initial point of faecal fermentation (0 h). Additionally, traces of caffeic and ferulic acids were also found. Generally, the addition of glucose enhanced the degradation of coffee phenolics, although there were significant differences among the individuals. After 3-6h only traces of phenolic compounds initially present in the fermentation medium were found, except for volunteer 2 that showed an inhibited degradation of dicaffeoylquinic acids, 4-caffeoylquinic acid lactone, feruloylquinic acids and their lactones that still remained in significant amounts after 6h. This may be attributed to the well-known different bacterial populations present in the individual faecal microbial communities, harboring specific enzymatic capacities. Caffeic acid was the first metabolite detected during the fermentation but it was degraded after 4–6 h. The major phenolic end-product identified was 3-(3,4-dihydrophenyl)propionic acid (dihydrocaffeic acid), which was still present in significant amounts after 24 h. Also, 3,4-dihydroxybenzoic acid (protocatechuic acid) was detected at low levels during fermentation, and traces of 3-(3-hydroxyphenyl)propionic acid were found at 24 h. In conclusion, coffee chlorogenic acids were rapidly degraded by the colonic microflora. However, low amounts of them, and their degradation products or metabolites, remained for several hours during fermentation. Therefore, the presence of these bioactive compounds might explain some of the health benefits of coffee brews, mainly those in colon, including prebiotic effects.
Keywords: Coffee, chlorogenic acids, gut microflora, colonic metabolism, bioactive compounds
Acknowledgement: This research was funded by the Spanish Ministry of Economy and Competitiveness (AGL2009-12052). We thank the Government of Navarre for the grant given to I.A.L., and Unión Tostadora S.A. for providing the coffee. We also thank Dr. Christine Edwards for her availability and technical advises.