Embed Size (px)
Citation preview
Favipiravir and severe acute respiratory syndrome coronavirus 2 in hamster 1
model 2
Jean-Sélim Driouich1#, Maxime Cochin1#, Guillaume Lingas2, Grégory Moureau1, Franck Touret1, Paul 3
Rémi Petit1, Géraldine Piorkowski1, Karine Barthélémy1, Bruno Coutard1, Jérémie Guedj2, Xavier de 4
Lamballerie1, Caroline Solas1,3, Antoine Nougairède1* 5
1: Unité des Virus Émergents, UVE: Aix Marseille Univ, IRD 190, INSERM 1207, Marseille, France. 6
2: Université de Paris, IAME, INSERM, F-75018 Paris, France 7
3: Laboratoire de Pharmacocinétique et Toxicologie, Hôpital La Timone, APHM, Marseille, France 8
#Contributed equally 9
*Corresponding author: [email protected] 10
Summary 11
There is a need for safe and effective antiviral molecules with which to combat COVID-19 pandemics. 12
Recently, in vitro inhibitory activity of favipiravir against SARS-CoV-2 was reported. Here, we used a 13
Syrian hamster model to explore the pharmacokinetics of this molecule and its in vivo efficacy against 14
SARS-CoV-2. Results revealed that high doses (700-1400mg/kg/day) significantly reduced virus 15
replication in the lungs accompanied by clinical alleviation of the disease. However, these high doses 16
were associated with significant toxicity in hamsters. Favipiravir pharmacokinetics displayed non-linear 17
increase in plasma exposure between the doses and good lung penetration. Analysis of viral genomes 18
in vivo showed that favipiravir induced a mutagenic effect. Whilst the plasma trough concentrations 19
observed in this study were comparable with those previously found during human clinical trials, this 20
potential toxicity requires further investigation to assess whether a tolerable dosing regimen can be 21
found in humans that effectively reduces virus replication. 22
Keywords 23
COVID-19, SARS-CoV-2, antiviral therapy, favipiravir, animal model, preclinical research 24
Introduction 25
In March 2020, the World Health Organization declared coronavirus disease 2019 (COVID-19) a 26
pandemic (WHO, 2020). The COVID-19 outbreak was originally identified in Wuhan, China, in 27
December 2019 and spread rapidly around the world within a few months. The severe acute 28
respiratory syndrome coronavirus 2 (SARS-CoV-2), the causative agent of COVID-19, belongs to the 29
Coronaviridae family and is closely related to the SARS-CoV which emerged in China in 2002 (Zhu et 30
al., 2020). After an incubation period of about 5 days, disease onset usually begins with an influenza-31
like syndrome associated with high virus replication in respiratory tracts (Huang et al., 2020, He et al., 32
2020). In some patients, a late acute respiratory distress syndrome, associated with high levels of 33
inflammatory proteins, occurs within one to two weeks (Huang et al., 2020). As of 7 July 2020, more 34
than 11.6 million cases of COVID-19 have resulted in more than 538,000 deaths (Dong et al., 2020). In 35
the face of this ongoing pandemic and its unprecedented repercussions, not only on human health but 36
also on society, ecology and economy, there is an urgent need for effective infection prevention and 37
control measures. 38
Whilst host-directed and immune-based therapies could prove useful for the clinical management of 39
critically ill patients, the availability of safe and effective antiviral molecules would represent an 40
important step towards fighting the current pandemic. As conventional drug development is a slow 41
process, repurposing of drugs already approved for any indication was extensively explored and led to 42
the implementation of many clinical trials for the treatment of COVID-19 (Mercorelli et al., 2018). 43
However, the development of effective antiviral drugs for the treatment of COVID-19, should, as much 44
as possible, rely on robust pre-clinical in vivo data, not only on efficacy generated in vitro. Accordingly, 45
rapid implementation of rodent and non-human primate animal models should help to assess more 46
finely the potential safety and efficacy of drug candidates and to determine appropriated dose 47
regimens in humans (Chan et al., 2020, Rockx et al., 2020). 48
Favipiravir (6-fluoro-3-hydroxypyrazine-2-carboxamine) is an anti‐influenza drug approved in Japan 49
that has shown broad-spectrum antiviral activity against a variety of other RNA viruses (Guedj et al., 50
2018, Yamada et al., 2019, Segura Guerrero et al., 2018, Tani et al., 2018, Jochmans et al., 2016, 51
Takahashi et al., 2003, Rosenke et al., 2018). Favipiravir is a prodrug that is metabolized intracellularly 52
into its active ribonucleoside 5'-triphosphate form that acts as a nucleotide analogue to selectively 53
inhibit RNA-dependent RNA polymerase and induce lethal mutagenesis (Baranovich et al., 2013, 54
Sangawa et al., 2013). Recently, several studies reported in vitro inhibitory activity of favipiravir against 55
SARS-CoV-2 with 50% effective concentrations (EC50) ranging from 62 to >500µM (10 to >78µg/mL) 56
(Wang et al., 2020, Jeon et al., 2020, Shannon et al., 2020). Based on these results, more than 20 clinical 57
trials on the management of COVID-19 by favipiravir are in progress (https://clinicaltrials.gov/). In the 58
present study, a Syrian hamster model (Mesocricetus auratus) was implemented to explore the in vivo 59
safety and efficacy and the pharmacokinetics (PK) of several dosing regimens of favipiravir. 60
Results 61
In vitro efficacy of favipiravir 62
Using VeroE6 cells and an antiviral assay based on reduction of cytopathic effect (CPE), we recorded 63
EC50 and EC90 of 32 and 52.5 µg/mL using a multiplicity of infection (MOI) of 0.001, 70.0 and >78.5µg/mL 64
with an MOI of 0.01 (Figure S1) in accordance with previous studies (Wang et al., 2020, Jeon et al., 65
2020, Shannon et al., 2020). Infectious titer reductions (fold change in comparison with untreated cells) 66
were ≥2 with 19.6µg/mL of favipiravir and ranged between 11 and 342 with 78.5µg/mL. Using CaCo2 67
cells, which do not exhibit CPE with SARS-CoV-2 BavPat1 strain, infectious titer reductions were around 68
5 with 19.6µg/mL of favipiravir and ranged between 144 and 7721 with 78.5µg/mL of the drug. 50% 69
cytotoxic concentrations (CC50) in VeroE6 and CaCo2 cells were >78.5µg/mL. 70
Infection of Syrian hamsters with SARS-CoV-2 71
Following Chan et al., we implemented a hamster model to study the efficacy of antiviral compounds 72
(Chan et al., 2020). Firstly, we intranasally infected four-week-old female Syrian hamsters with 106 73
TCID50 of virus. Groups of two animals were sacrificed 2, 3, 4 and 7 days post-infection (dpi). Viral 74
replication was quantified in sacrificed animals by RT-qPCR in organs (lungs, brain, liver, small/large 75
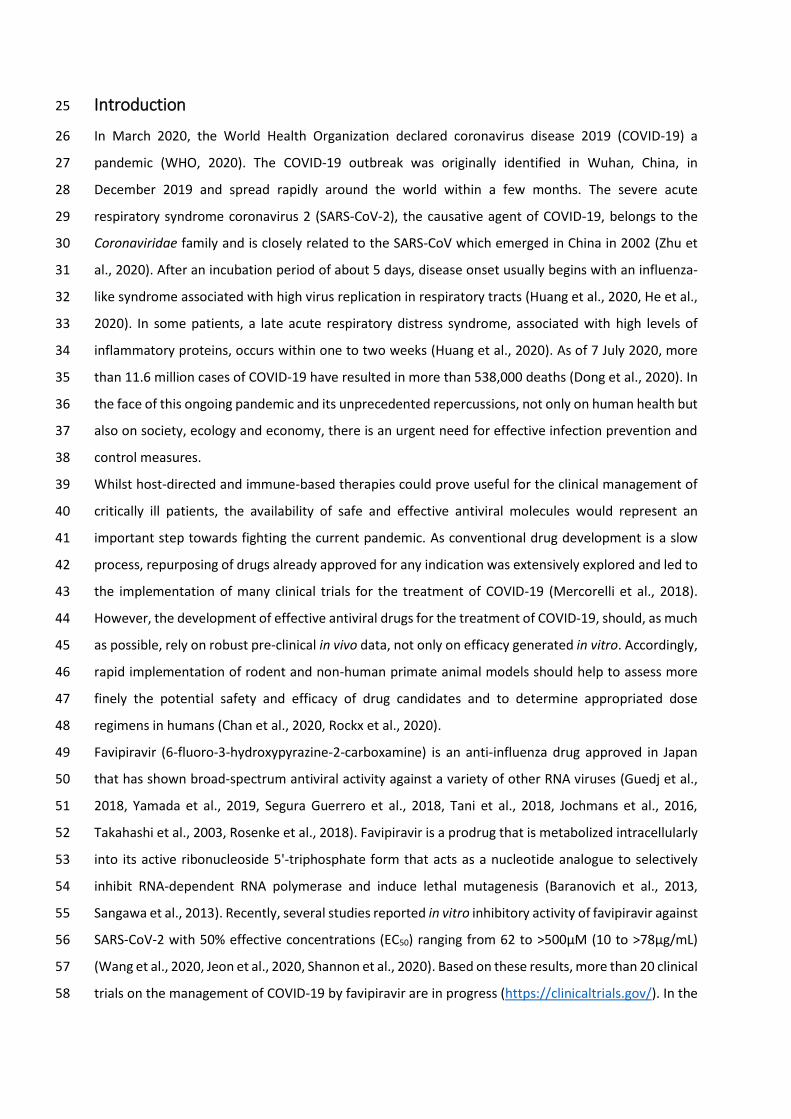
bowel, kidney, spleen and heart) and plasma. Viral loads in lungs peaked at 2 dpi, remained elevated 76
until 4 dpi and dramatically decreased at 7 dpi (Figure 1a). Viral loads in plasma peaked at 3 dpi and 77
viral replication was detected in the large bowel at 2 dpi (Figure 1b and Table S1). No viral RNA was 78
detected in almost all the other samples tested (Table S1). Subsequently, we infected animals with two 79
lower doses of virus (105 and 104 TCID50). Viral RNA was quantified in lungs, large bowel and plasma 80
from sacrificed animals 2, 3, 4 and 7 dpi (Figure 1a and 1b). Viral loads in lungs peaked at 2 and 3 dpi 81
with doses of 105 and 104 TCID50 respectively. Maximum viral loads in lungs of animals infected with 82
each dose of virus were comparable. Viral RNA yields in plasma and large bowel followed a similar 83
trend but with more variability, with this two lower doses. In addition, clinical monitoring of animals 84
showed no marked symptoms of infection but significant weight losses from 3 dpi when compared to 85
animals intranasally inoculated with sodium chloride 0.9% (Figure 1c). 86
87
Figure 1: Implementation of hamster model 88
Hamsters were intranasally infected with 106, 105 or 104 TCID50 of virus. Viral replication was quantified using 89
an RT-qPCR assay. a Lung viral RNA yields. b Plasmatic viral loads. c Clinical course of the disease. Normalized 90
weight at day n was calculated as follows: (% of initial weight of the animal at day n)/(mean % of initial weight 91
for mock-infected animals at day n). Data represent mean ±SD (details in Table S1). 92
In vivo efficacy of favipiravir 93
To assess the efficacy of favipiravir, hamsters received the drug, intraperitoneally, three times a day 94
(TID). We used three doses of favipiravir: 18.75, 37.5 and 75mg/day (corresponding to 340±36, 670±42 95
and 1390±126 mg/kg/day respectively). 96
In a first set of experiments, treatment was initiated at day of infection (preemptive antiviral therapy) 97
and ended at 2 dpi. We infected groups of 6 animals intranasally with three doses of virus (106, 105 and 98
104 TCID50) and viral replication was measured in lungs and plasma at 3 dpi (Figure 2a). When analysis 99
of virus replication in clarified lung homogenates was based on infectious titers (as measured using 100
TCID50 assay), an inverse relationship was observed between infectious titers and the dose of 101
favipiravir (Figure 2b). This trend was even more important when low doses of virus were used to infect 102
animals. At each dose of virus, mean infectious titers for groups of animals treated with 75mg/day TID 103
were significantly lower than those observed with untreated groups (p≤0.0001): reduction of infectious 104
titers ranged between 1.9 and 3.7 log10. For animals infected with 105 or 104 TCID50, significant 105
infectious titer reductions of around 0.8 log10 were also observed with the dose of 37,5mg/day TID 106
(p≤0.038). Drug 90% and 99% effective doses (ED90 and ED99) were estimated based on these results 107
and ranged between 31-42mg/day and 53-70mg/day respectively (Table 2). When analysis of virus 108
replication in clarified lung homogenates were assessed on viral RNA yields (as measured using 109
quantitative real time RT-PCR assay), significant differences with groups of untreated animals, ranging 110
between 0.7 and 2.5 log10, were observed only with the higher dose of favipiravir (p≤0.012). Once 111
again, this difference was more noticeable with lower doses of virus (Figure 2b). Since we found higher 112
reductions of infectious titers than those observed with viral RNA yields, we estimated the relative 113
infectivity of viral particle (i.e. the ratio of the number of infectious particles over the number of viral 114
RNA molecules). Decreased infectivity was observed in all treated groups of animals. These differences 115
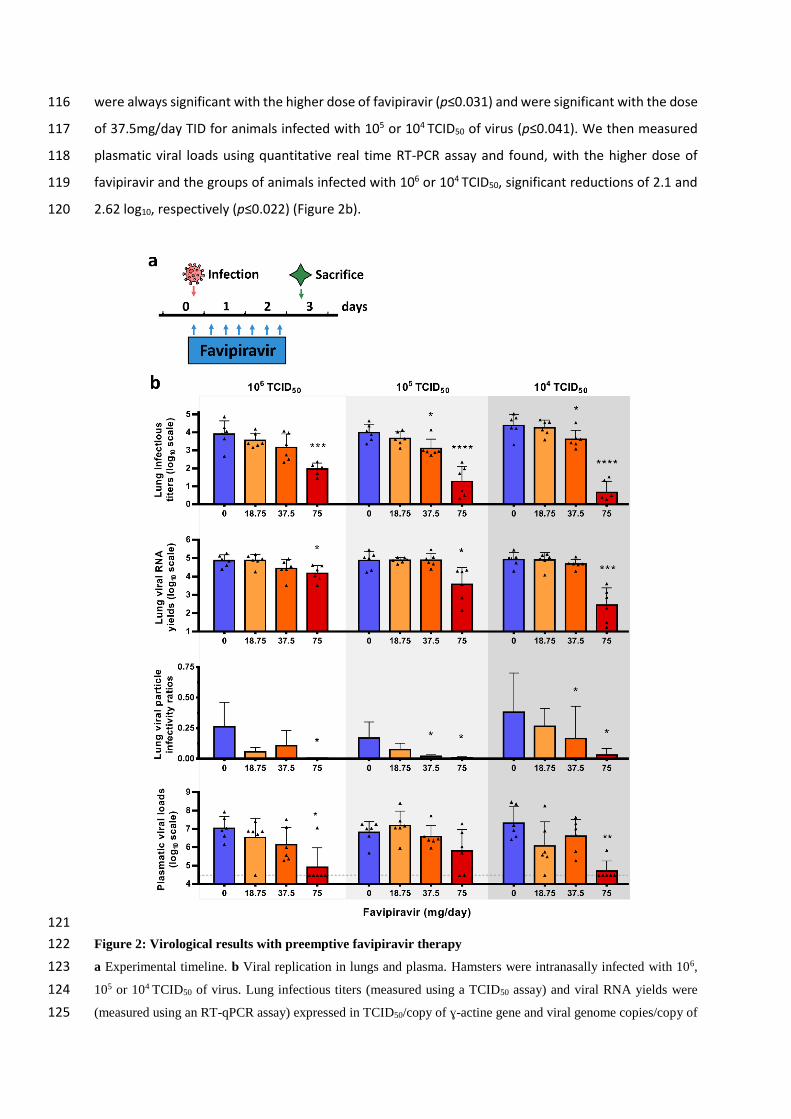
were always significant with the higher dose of favipiravir (p≤0.031) and were significant with the dose 116
of 37.5mg/day TID for animals infected with 105 or 104 TCID50 of virus (p≤0.041). We then measured 117
plasmatic viral loads using quantitative real time RT-PCR assay and found, with the higher dose of 118
favipiravir and the groups of animals infected with 106 or 104 TCID50, significant reductions of 2.1 and 119
2.62 log10, respectively (p≤0.022) (Figure 2b). 120
121
Figure 2: Virological results with preemptive favipiravir therapy 122
a Experimental timeline. b Viral replication in lungs and plasma. Hamsters were intranasally infected with 106, 123
105 or 104 TCID50 of virus. Lung infectious titers (measured using a TCID50 assay) and viral RNA yields were 124
(measured using an RT-qPCR assay) expressed in TCID50/copy of ɣ-actine gene and viral genome copies/copy of 125
ɣ-actine gene respectively. Relative lung viral particle infectivities were calculated as follows: ratio of lung 126
infectious titer over viral RNA yields. Plasmatic viral loads (measured using an RT-qPCR assay) are expressed in 127
viral genome copies/mL of plasma (the dotted line indicates the detection threshold of the assay). Data represent 128
mean ±SD. ****, ***, ** and * symbols indicate that the average value for the group is significantly lower than 129
that of the untreated group with a p-value <0.0001, ranging between 0.0001-0.001, 0.001-0.01 and 0.01-0.05 130
respectively (details in Table S2 and S3). 131
Table 2: 50%, 90% and 99% drug effective doses 132
ED50
mg/day (95%CI1)
ED90
mg/day (95%CI1)
ED99
mg/day (95%CI1)
Preemptive therapy
104 TCID50 34 (30-37) 42 (38-46) 53 (48-58)
105 TCID50 26 (21-30) 37 (31-44) 56 (46-65)
106 TCID50 15 (10-20) 31 (21-41) 70 (48-93)
Preventive therapy
104 TCID50 27 (25-29) 35 (32-38) 47 (44-51)
1: 95% confidence interval
Dose-response curves are presented in Figure S2.
In a second set of experiments, we assessed, over a period of 7 days, the impact of treatment on the 133
clinical course of the disease using weight loss as the primary criterion (Figure 3a). Beforehand, we 134
evaluated the toxicity of the three doses of favipiravir with groups of four non-infected animals treated 135
from day 0 to day 3 (Figure 3b). High toxicity was observed with the dose of 75mg/day TID with 136
significant weight loss noticed from the first day of treatment (Table S4). We also found a constant, 137
but moderate, toxicity with the dose of 37.5mg/day TID that was significant at day 4 and 5 only. No 138
toxicity was detected with the lower dose of favipiravir. To assess if the toxicity observed with the 139
highest dose of favipiravir was exacerbated by the infection, we compared weight losses of infected 140
and non-infected animals treated with the dose of 75mg/day TID. Regardless of the dose of virus, no 141
significant difference was observed at 1, 2 and 3 dpi (Figure S3). After this evaluation of favipiravir 142
toxicity, we intranasally infected groups of 10 animals with two doses of virus (105 or 104 TCID50). 143
Treatment with a dose of 37.5mg/day TID was initiated on the day of infection (preemptive antiviral 144
therapy) and ended at 3 dpi (Figure 3a). With both doses of virus, treatment was associated with 145
clinical alleviation of the disease (Figure 3c-d). With the dose of 105 TCID50, mean weights of treated 146
animals were significantly higher than those of untreated animals at 5 and 6 dpi (p≤0.031). Similar 147
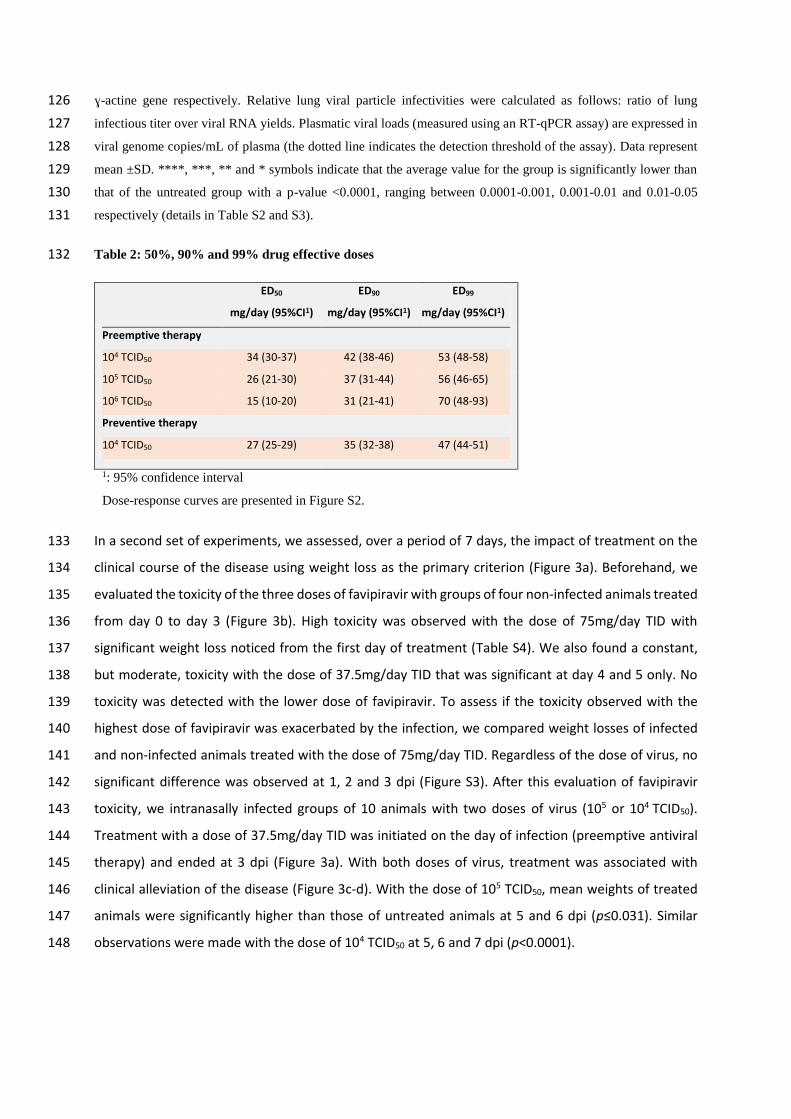
observations were made with the dose of 104 TCID50 at 5, 6 and 7 dpi (p<0.0001). 148
149
Figure 3: Clinical follow-up with preemptive favipiravir therapy 150
a Experimental timeline. b Evaluation of the toxicity of the three doses of favipiravir (mg/day TID) with uninfected 151
animals following an identical experimental timeline without infection. c-d Clinical follow-up with animals 152
infected respectively with 105 and 104 TCID50 of virus and treated with a dose of favipiravir of 37.5mg/day TID. 153
Normalized weight at day n was calculated as follows: (% of initial weight of the animal at day n)/(mean % of 154
initial weight for mock-infected animals at day n). Data represent mean ±SD. **** and * symbols indicate a 155
significant difference between treated and untreated animals with a p-value <0.0001 and ranging between 0.01-156
0.05 respectively (details in Table S2 and S4). 157
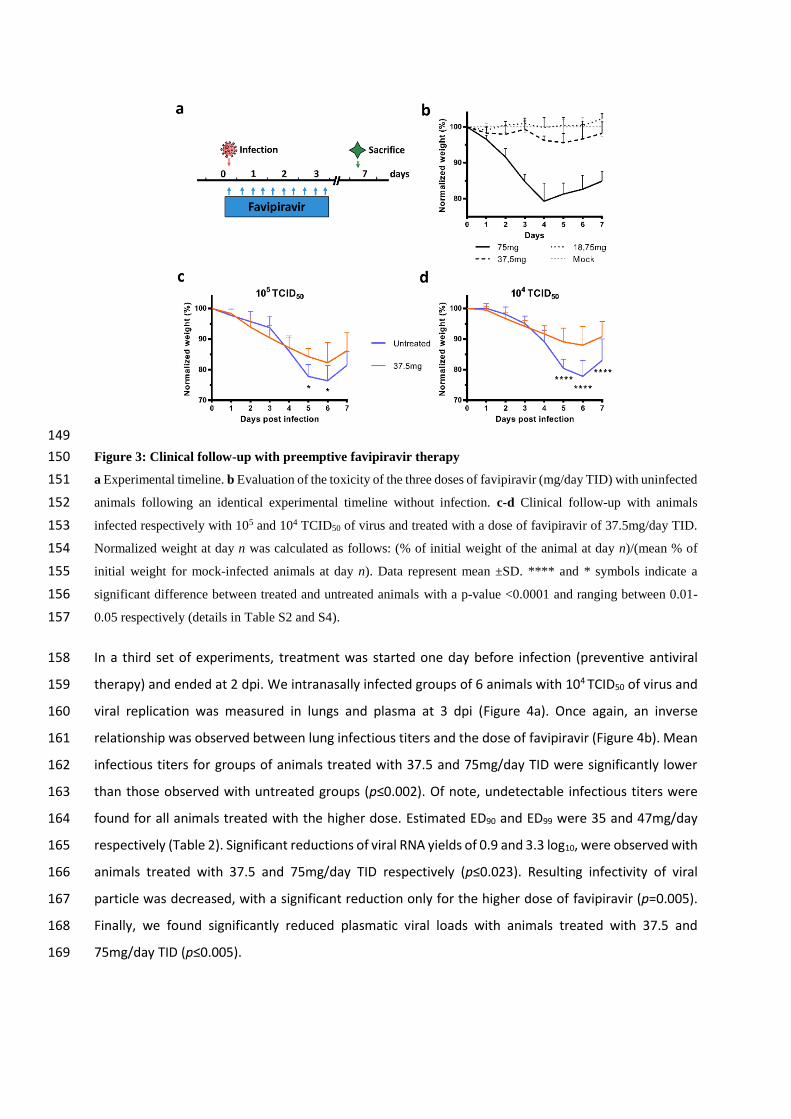
In a third set of experiments, treatment was started one day before infection (preventive antiviral 158
therapy) and ended at 2 dpi. We intranasally infected groups of 6 animals with 104 TCID50 of virus and 159
viral replication was measured in lungs and plasma at 3 dpi (Figure 4a). Once again, an inverse 160
relationship was observed between lung infectious titers and the dose of favipiravir (Figure 4b). Mean 161
infectious titers for groups of animals treated with 37.5 and 75mg/day TID were significantly lower 162
than those observed with untreated groups (p≤0.002). Of note, undetectable infectious titers were 163
found for all animals treated with the higher dose. Estimated ED90 and ED99 were 35 and 47mg/day 164
respectively (Table 2). Significant reductions of viral RNA yields of 0.9 and 3.3 log10, were observed with 165
animals treated with 37.5 and 75mg/day TID respectively (p≤0.023). Resulting infectivity of viral 166
particle was decreased, with a significant reduction only for the higher dose of favipiravir (p=0.005). 167
Finally, we found significantly reduced plasmatic viral loads with animals treated with 37.5 and 168
75mg/day TID (p≤0.005). 169
170
Figure 4: Virological results with preventive favipiravir therapy 171
a Experimental timeline. b Viral replication in lungs and plasma. Hamsters were intranasally infected with 104 172
TCID50 of virus. Lung infectious titers (measured using a TCID50 assay) and viral RNA yields awee (measured 173
using an RT-qPCR assay). They are expressed in TCID50/copy of ɣ-actine gene and viral genome copies/copy of 174
ɣ-actine gene respectively. Relative lung virus infectivities were calculated as follows: ratio of lung infectious titer 175
over viral RNA yields. Plasmatic viral loads (measured using an RT-qPCR assay) are expressed in viral genome 176
copies/mL of plasma (the dotted line indicates the detection threshold of the assay). Data represent mean ±SD. 177
****, ** and * symbols indicate that the average value for the group is significantly different from that of the 178
untreated group with a p-value <0.0001, ranging between 0.001-0.01 and 0.01-0.05 respectively (details in Table 179
S2 and S3). 180
Favipiravir pharmacokinetics (PK) in a hamster model 181
We first assessed the PK and lung distribution of favipiravir in a subgroup of uninfected animals. Groups 182
of animals were treated respectively with a single dose of favipiravir administrated intraperitoneally: 183
6.25mg, 12.5 mg and 25 mg. In each dose group, we sacrificed 3 animals at specific time points post-184
treatment (0.5, 1, 5 or 8 hours) for determination of favipiravir in plasma. Drug concentration in lung 185
tissue was determined at 0.5 and 5 hours post-treatment. Subsequently, we assessed the favipiravir 186
concentration after multiple dose in animals intranasally infected with 105 TCID50 of virus. Groups of 9 187
animals received the three doses evaluated for 3 days (Figure 2a): 18.75mg/day, 37.5mg/day and 188
75mg/day TID and were sacrificed at 12-hours after the last treatment dose. Favipiravir was quantified 189
in plasma (n=9) and lung tissue (n=3). 190
Results are presented in Table 3 and Figure S4. The single dose PK analysis showed that the maximum 191
concentration of favipiravir was observed at 0.5 hour at all doses, then plasma drug concentrations 192
decreased exponentially to reach concentrations below 10 µg/ml at 12 hours. Favipiravir PK exhibited 193
a non-linear increase in concentration between the doses. After multiple doses, trough concentrations 194
(12 hours) of favipiravir also exhibited a non-linear increase between doses. The extrapolated 12 hours 195
post-treatment concentrations after a single dose were calculated in order to determine the 196
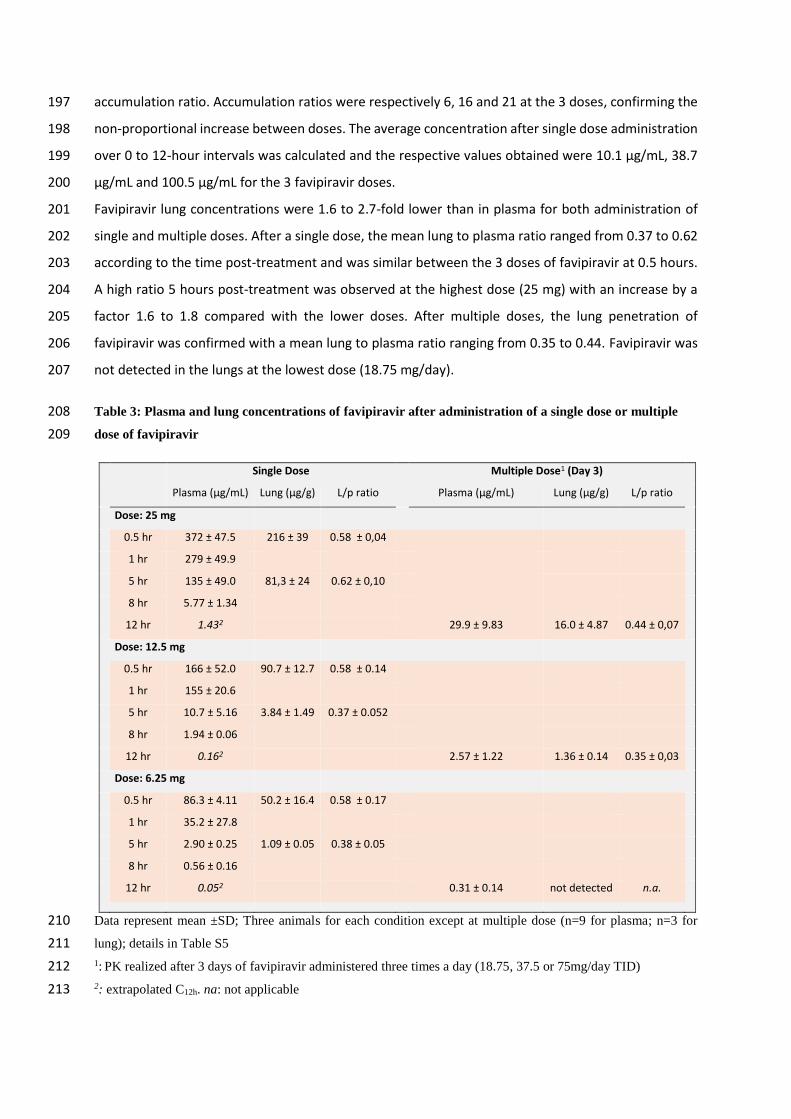
accumulation ratio. Accumulation ratios were respectively 6, 16 and 21 at the 3 doses, confirming the 197
non-proportional increase between doses. The average concentration after single dose administration 198
over 0 to 12-hour intervals was calculated and the respective values obtained were 10.1 µg/mL, 38.7 199
µg/mL and 100.5 µg/mL for the 3 favipiravir doses. 200
Favipiravir lung concentrations were 1.6 to 2.7-fold lower than in plasma for both administration of 201
single and multiple doses. After a single dose, the mean lung to plasma ratio ranged from 0.37 to 0.62 202
according to the time post-treatment and was similar between the 3 doses of favipiravir at 0.5 hours. 203
A high ratio 5 hours post-treatment was observed at the highest dose (25 mg) with an increase by a 204
factor 1.6 to 1.8 compared with the lower doses. After multiple doses, the lung penetration of 205
favipiravir was confirmed with a mean lung to plasma ratio ranging from 0.35 to 0.44. Favipiravir was 206
not detected in the lungs at the lowest dose (18.75 mg/day). 207
Table 3: Plasma and lung concentrations of favipiravir after administration of a single dose or multiple 208
dose of favipiravir 209
Single Dose Multiple Dose1 (Day 3)
Plasma (µg/mL) Lung (µg/g) L/p ratio Plasma (µg/mL) Lung (µg/g) L/p ratio
Dose: 25 mg
0.5 hr 372 ± 47.5 216 ± 39 0.58 ± 0,04
1 hr 279 ± 49.9
5 hr 135 ± 49.0 81,3 ± 24 0.62 ± 0,10
8 hr 5.77 ± 1.34
12 hr 1.432 29.9 ± 9.83 16.0 ± 4.87 0.44 ± 0,07
Dose: 12.5 mg
0.5 hr 166 ± 52.0 90.7 ± 12.7 0.58 ± 0.14
1 hr 155 ± 20.6
5 hr 10.7 ± 5.16 3.84 ± 1.49 0.37 ± 0.052
8 hr 1.94 ± 0.06
12 hr 0.162 2.57 ± 1.22 1.36 ± 0.14 0.35 ± 0,03
Dose: 6.25 mg
0.5 hr 86.3 ± 4.11 50.2 ± 16.4 0.58 ± 0.17
1 hr 35.2 ± 27.8
5 hr 2.90 ± 0.25 1.09 ± 0.05 0.38 ± 0.05
8 hr 0.56 ± 0.16
12 hr 0.052 0.31 ± 0.14 not detected n.a.
Data represent mean ±SD; Three animals for each condition except at multiple dose (n=9 for plasma; n=3 for 210
lung); details in Table S5 211 1: PK realized after 3 days of favipiravir administered three times a day (18.75, 37.5 or 75mg/day TID) 212 2: extrapolated C12h. na: not applicable 213
Mutagenic effect of favipiravir 214
To understand which genomic modifications accompanied favipiravir treatment, direct complete 215
genome sequencing of clarified lung homogenates from animals intranasally infected with 106 TCID50 216
of virus and treated with the two highest doses of drug (preemptive antiviral therapy; Figure 2) was 217
performed. Data were generated by next generation sequencing from lung samples of four animals 218
per group (untreated, 37.5mg/day TID and 75mg/day TID). The mean sequencing coverage for each 219
sample ranged from 10,991 to 37,991 reads per genomic position and we subjected substitutions with 220
a frequency ≥1% to further analysis. The genetic variability in virus stock was also analyzed: 14 221
nucleotide polymorphisms were detected of which 5 recorded a mutation frequency higher than 10% 222
(Table S6). 223
In order to study the mutagenic effect of favipiravir, we used the consensus sequence from virus stock 224
as reference and all the mutations simultaneously detected in a lung sample and in virus stock were 225
not considered in the further analysis (1 to 4 mutations per sample, see Table S6). Overall, no majority 226
mutations were detected (mutation frequency >50%), mutations were distributed throughout the 227
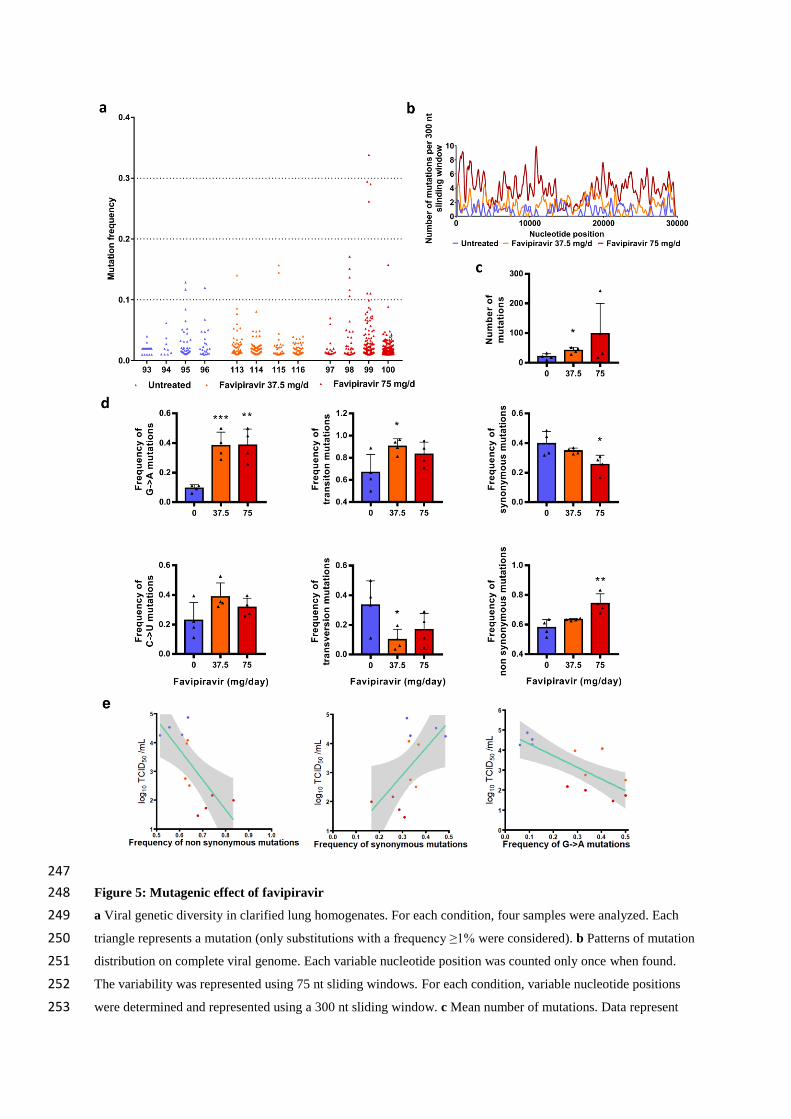
whole genome and almost all of them exhibited a frequency lower than 10% (Figure 5a and 5b). 228
Results revealed a relationship between the number of mutations detected per sample and the dose 229
of favipiravir (Figure 5c): the mean number of mutations increased by a factor 2 and 4.8 with groups 230
of animals treated with 37.5 and 75mg/day TID, respectively. The difference is significant only with a 231
dose of 37.5mg/day TID (p=0.029). This increase of the number of mutations is mainly the consequence 232
of the occurrence of a large number of G→A substitutions and, to a lesser extent, C→U substitutions. 233
Consequently, regardless of the dose of favipiravir, mean frequency of G→A substitutions was 234
significantly increased by a factor of 4.2 (p≤0.009). This rise of these transition mutations led to 235
increased frequency of all transition mutations (significant only at dose of 37.5mg/day TID; p=0.037) 236
and increased frequency of non-synonymous mutations (significant only at dose of 75mg/day TID; 237
p=0.009) (Figure 5d). We investigated whether or not effectiveness in treated animals was linked with 238
the characteristics of the mutations detected on viral populations and found that frequency of non-239
synonymous, synonymous and G→A mutations were associated with infectious titers in lungs (p<0.03; 240
Figure 5e). Finally, our experiments revealed some parallel evolution events; 32 substitutions in viral 241
sub-populations were detected in two independent animals. Notably, 18 of these shared mutations 242
were detected only with treated animals, 14 of them being non-synonymous (Table S8). These 243
mutations are located in nsp2, 3, 4, 5, 6, 14, N protein, Matrix, ORF 3a and 8. At this stage, one cannot 244
conclude if these substitutions reflect the adaptation to the hamster model or are the result of the 245
antiviral selection. 246
247
Figure 5: Mutagenic effect of favipiravir 248
a Viral genetic diversity in clarified lung homogenates. For each condition, four samples were analyzed. Each 249
triangle represents a mutation (only substitutions with a frequency ≥1% were considered). b Patterns of mutation 250
distribution on complete viral genome. Each variable nucleotide position was counted only once when found. 251
The variability was represented using 75 nt sliding windows. For each condition, variable nucleotide positions 252
were determined and represented using a 300 nt sliding window. c Mean number of mutations. Data represent 253
mean ±SD. d Mutation characteristics. For each sample, the frequency of a given mutation was calculated as 254
follows: number of this kind of mutation detected in the sample divided by the total number of mutations 255
detected in this sample. Data represent mean ±SD. ** and * symbols indicate that the average value for the group 256
is significantly different from that of the untreated group with a p-value ranging between 0.001-0.01 and 0.01-257
0.05 respectively (details in details in Table S6 and S7). e Association between lung infectious titers (measured 258
using a TCID50 assay) and frequency of non synonymous, synonymous and G→A mutations. Each dot represent 259
data from a given animal. 260
Discussion 261
In the current study, we used a hamster model to assess efficacy of the favipiravir against SARS-CoV-262
2. Following infection, viral RNA was mainly detected in lungs, blood, and, to a lesser extent, in the 263
large bowel. Peak of viral replication was observed at 2-3 dpi followed by observation of significant 264
weight losses, in line with recently reported investigations that involved 6-10 weeks old hamsters 265
(Kaptein et al., 2020, Chan et al., 2020). Clinically, the main symptom was weight loss, observed from 266
the first day of infection and followed by recovery at 6dpi. This confirmed that the in vivo model, with 267
younger animals (4 weeks-old), is suitable for preclinical evaluation of antiviral compounds against 268
SARS-CoV-2. 269
Using a preemptive strategy, we demonstrated that doses of favipiravir of around 700-1400mg/kg/day 270
TID reduced viral replication in lungs of infected animals and allowed clinical alleviation of the disease. 271
Reduction of viral replication was greater when estimated on the basis of infectious titers than on total 272
viral RNA as previously observed in non-human primates treated with Remdesivir (Williamson et al., 273
2020). However, the effective doses of favipiravir were higher than those usually used in rodent models 274
(≈100-400mg/kg/day) (Sidwell et al., 2007, Smither et al., 2014, Julander et al., 2009, Tani et al., 2018, 275
Oestereich et al., 2016, Yamada et al., 2019). This can be correlated with the high favipiravir EC50 found 276
in vitro for SARS-CoV-2. Moreover, effective doses were associated with significant toxicity in our 277
hamster model. This observed toxicity reflected only the adverse effects of favipiravir and was not 278
exacerbated during SARS-CoV-2 infection. Indeed, similar weight losses were measured among 279
infected and non-infected animals treated with the highest dose of favipiravir at 1, 2 and 3dpi. 280
In the present study, reduction of viral replication was correlated with the dose of favipiravir 281
administrated and inversely correlated with the dose of virus inoculated. In a recent study, favipiravir 282
administrated per os twice daily (loading dose of 600mg/kg/day followed by 300mg/kg/day) revealed 283
a mild reduction of lung viral RNA yields using a similar hamster model with high doses of virus (2x10⁶ 284
TCID50) (Kaptein et al., 2020). These results are in accordance with ours at the lower dose of favipiravir 285
(around 340mg/kg/day TID). 286
By characterizing the dose response curve, we estimated that the dose required to reduce by 90% 287
(ED90) the level of infectious titers in lungs is in the range of 570-780mg/kg/day. In the most favourable 288
situation, where high doses were used as a preemptive therapy, favipiravir led to undetectable viral 289
replication in lung and plasma. These results showed that the use of high doses of favipiravir could 290
expand its in vivo spectrum against RNA viruses. 291
With influenza viruses, favipiravir acts as a nucleotide analogue. It is metabolized intracellularly to its 292
active form and incorporated into nascent viral RNA strands. This inhibits RNA strand extension and 293
induces abnormal levels of mutation accumulation into the viral genome (Baranovich et al., 2013, 294
Sangawa et al., 2013). Recently, it was shown in vitro that favipiravir has a similar mechanism of action 295
with SARS-CoV-2 through a combination of chain termination, reduced RNA synthesis and lethal 296
mutagenesis (Shannon et al., 2020). Our genomic analysis confirmed the mutagenic effect of favipiravir 297
in vivo. Indeed, we found that favipiravir treatment induced appearance of a large number of G→A 298
and C→U mutations into viral genomes. This was associated to a decrease of viral infectivity probably 299
because alteration of the genomic RNA disturb the replication capacity. Similar findings were described 300
in vitro and in vivo with other RNA viruses (Baranovich et al., 2013, Guedj et al., 2018, Escribano-301
Romero et al., 2017, Arias et al., 2014). Of note, we also observed a strong inverse association between 302
infectious titers in lungs and the proportion of non-synonymous mutations detected in viral 303
populations. Because random non-synonymous mutations are more deleterious than synonymous 304
mutations (Cuevas et al., 2012), this suggests that they were randomly distributed over the three 305
positions of the codons and that no compensatory mechanism was triggered by the virus to eliminate 306
them (i.e. negative selection). Finally, the inverse correlation between lung infections titers and the 307
frequency of G→A substitutions showed that an increased proportion of these mutations beyond an 308
error threshold might be expected to cause lethal mutagenesis. 309
Genomic analyses revealed that 18 mutations detected in viral sub-populations were shared only with 310
treated animals. Two of them were located in the nsp14 coding region involved in the proof-reading 311
activity of the viral RNA polymerisation (Eckerle et al., 2007, Ferron et al., 2018). However, they were 312
located in the N7 MTase domain involved in viral RNA capping (Chen et al., 2013, Ma et al., 2015). By 313
comparison, resistance mutations selected against Remdesivir in β-coronavirus murine hepatitis virus 314
model were obtained in the RdRP (nsp12) coding sequence (Agostini et al., 2018). Further 315
investigations are needed to assess the impact of these mutations on the antiviral effect of favipiravir. 316
Favipiravir PK in our hamster model displayed a non-linear increase in plasma exposure between the 317
doses as already reported in nonhuman primates (Madelain et al., 2017). The observed favipiravir 318
concentration versus time profiles were in agreement with previous results of a PK study performed 319
in 7-8 week-old hamsters orally treated with a single dose of 100mg/kg of favipiravir (Gowen et al., 320
2015). The maximum plasma drug concentration occurred at 0.5 h after oral administration, earlier 321
than in humans, and then decreased rapidly in agreement with its short half-life (Madelain et al., 2016). 322
After repeated doses, plasma exposure confirmed non-linear PK over the entire range of doses, further 323
emphasized by accumulation ratios. The important accumulation observed at the highest dose could 324
explain in part the toxicity observed in hamsters at this dose. Favipiravir undergoes an important 325
hepatic metabolism mainly by aldehyde oxidase producing an inactive M1 metabolite and inhibits 326
aldehyde oxidase activity in a concentration- and time-dependent manner. These properties explain 327
the self-inhibition of its own metabolism as observed in our study in which the highest dose of 328
favipiravir led to a greater increase in favipiravir concentrations (Madelain et al., 2020). 329
A good penetration of favipiravir in lungs was observed with lung/plasma ratios ranging from 35 to 330
44% after repeated doses, consistent with its physicochemical properties. Lung exposure was also in 331
accordance with previous studies (Gowen et al., 2015). 332
How clinically realistic are these results? To address this question we compared the drug 333
concentrations obtained in the hamster model with those obtained in patients. In 2016, a clinical trial 334
evaluated the use of favipiravir in Ebola infected patients (Sissoko et al., 2016). The dose used in Ebola 335
infected patients was 6000mg on day 0 followed by 1200mg BID for 9 days. The median trough 336
concentrations of favipiravir at Day 2 and Day 4 were 46.1 and 25.9µg/mL, respectively. This is within 337
the range observed here in hamsters treated with the highest dose (around 1400mg/kg/day), with a 338
mean trough concentration of 29.9µg/mL. However, additional investigations are required to 339
determine whether or not similar favipiravir plasma exposure in SARS-COV-2 infected patients are 340
associated with antiviral activity. The major differences in PK between hamster and humans, and the 341
toxicity observed at the highest doses in our animal model limits the extrapolation of our results. 342
Therefore, whether safe dosing regimens in humans may achieve similar plasma exposure and 343
recapitulate the profound effect on viral replication is unknown. Further, the intracellular 344
concentration of the active metabolite was not determined and which parameter of the drug 345
pharmacokinetics best drives the antiviral effect remains to be established. 346
In summary, this study establishes that high doses of favipiravir are associated with antiviral activity 347
against SARS-CoV-2 infection in a hamster model. The better antiviral efficacy was observed using a 348
preventive strategy, suggesting that favipiravir could be more appropriate for a prophylactic use. Our 349
results should be interpreted with caution because high doses of favipiravir were associated with signs 350
of toxicity in our model. It is required to determine if a tolerable dosing regimen could generate similar 351
exposure in non-human primates, associated with significant antiviral activity, before testing a high 352
dose regimen in COVID-19 patients. Furthermore, subsequent studies should determine if an increased 353
antiviral efficacy can be reached using favipiravir in association with other effective antiviral drugs, 354
since this strategy may enable to reduce the dosing regimen of favipiravir. Finally, this work reinforces 355
the need for rapid development of animal models to confirm in vivo efficacy of antiviral compounds 356
and accordingly, to determine appropriate dose regimens in humans before starting clinical trials. 357
Acknowledgments 358
We thank Laurence Thirion (UVE; Marseille) for providing RT-qPCR systems . We thank Camille Placidi 359
(UVE; Marseille) for her technical contribution. We also thank Pr. Ernest A. Gould (UVE; Marseille) for 360
his careful reading of the manuscript and English language editing. We thank Pr Drosten and Pr Drexler 361
for providing the SARS-CoV-2 strain through the European Research infrastructure EVA GLOBAL. This 362
work was supported by the Fondation de France “call FLASH COVID-19”, project TAMAC, by “Institut 363
national de la santé et de la recherche médicale” through the REACTing (REsearch and ACTion targeting 364
emerging infectious diseases) initiative (“Preuve de concept pour la production rapide de virus 365
recombinant SARS-CoV-2”), and by European Virus Archive Global (EVA 213 GLOBAL) funded by the 366
European Union’s Horizon 2020 research and innovation program under grant agreement No. 871029. 367
A part of the work was done on the Aix Marseille University antivirals platform “AD2P”. 368
Author Contributions 369
Conceptualization, J.S.D., M.C., G.M. and A.N. ; Methodology, J.S.D., M.C., G.L., G.M. and A.N. ; Formal 370
Analysis, J.S.D., M.C. and G.L. ; Investigation, J.S.D., M.C., G.M., F.T., P.R.P., G.P., K.B. and A.N. ; 371
Resources, F.T., B.C., J.G., X.d.L., C.S. and A.N. ; Writing – Original Draft, J.S.D., M.C., J.G., C.S. and A.N. 372
; Writing – Review & Editing, J.G., X.d.L., C.S. and A.N. ; Visualization, J.S.D., M.C., G.L., F.T., P.R.P. and 373
A.N. ; Supervision, A.N. ; Funding Acquisition, F.T., B.C., X.d.L. and A.N. 374
Declaration of Interests 375
J.G has consulted for F. Hoffman-La Roche. C.S has consulted for ViiV Healthcare, MSD and Gilead. 376
The remaining authors declare no competing interests. 377
Methods 378
Cells 379
VeroE6 cells (ATCC CRL-1586) and Caco-2 cells (ATCC HTB-37) were grown at 37°C with 5% CO2 in 380
minimal essential medium (MEM) supplemented with 7.5% heat-inactivated fetal bovine serum (FBS), 381
1% Penicillin/Streptomycin and 1% non-essential amino acids (all from ThermoFisher Scientific). 382
Virus 383
All experiments with infectious virus were conducted in biosafety level (BSL) 3 laboratory. SARS-CoV-2 384
strain BavPat1, supplied through European Virus Archive GLOBAL (https://www.european-virus-385
archive.com/), was provided by Christian Drosten (Berlin, Germany). Virus stocks were prepared by 386
inoculating at MOI of 0.001 a 25cm2 culture flask of confluent VeroE6 cells with MEM medium 387
supplemented with 2.5% FBS. The cell supernatant medium was replaced each 24h hours and 388
harvested at the peak of infection, supplemented with 25mM HEPES (Sigma), aliquoted and stored at 389
-80°C. 390
In vitro determination of EC50, EC90, CC50 and infectious titer reductions 391
One day prior to infection, 5×10⁴ VeroE6 cells were seeded in 96-well culture plates (5×10⁴ cells/well 392
in 100µL of 2.5% FBS medium (assay medium). The next day, seven 2-fold serial dilutions of favipiravir 393
(Courtesy of Toyama-Chemical; 0.61µg/mL to 78.5µg/mL, in triplicate) were added (25µL/well, in assay 394
medium). Eight virus control wells were supplemented with 25µL of assay medium and eight cell 395
controls were supplemented with 50µL of assay medium. After 15 min, 25µL of virus suspension, 396
diluted in assay medium, was added to the wells at an MOI of 0.01 or 0.001 (except for cell controls). 397
Three days after infection, cell supernatant media were collected to perform TCID50 assay (at 398
concentration of 78.5, 39.3, 19.6µg/mL), as described below, in order to calculate infectious titer 399
reductions and cell viability was assessed using CellTiter-Blue reagent (Promega) following 400
manufacturer’s intructions. Fluorescence (560/590nm) was recorded with a Tecan Infinite 200Pro 401
machine (Tecan). The 50% and 90% effective concentrations (EC50, EC90) were determined using 402
logarithmic interpolation (% of inhibition were calculated as follows: (ODsample-ODvirus control)/(ODcell control-403
ODvirus control)). For the evaluation of CC50 (the concentration that induced 50% cytoxicity), the same 404
culture conditions were set as for the determination of the EC50, without addition of the virus, then 405
cell viability was measured using CellTiter Blue (Promega). CC50 was determined using logarithmic 406
interpolation. 407
In vivo experiments 408
Approval and authorization 409
In vivo experiments were approved by the local ethical committee (C2EA—14) and the French 410
‘Ministère de l’Enseignement Supérieur, de la Recherche et de l’Innovation’ (APAFIS#23975) and 411
performed in accordance with the French national guidelines and the European legislation covering 412
the use of animals for scientific purposes. All experiments were conducted in BSL 3 laboratory. 413
Animal handling 414
Three-week-old female Syrian hamsters were provided by Janvier Labs. Animals were maintained in 415
ISOcage P - Bioexclusion System (Techniplast) with unlimited access to water/food and 14h/10h 416
light/dark cycle. Animals were weighed and monitored daily for the duration of the study to detect the 417
appearance of any clinical signs of illness/suffering. Virus inoculation was performed under general 418
anesthesia (isoflurane). Organs and blood were collected after euthanasia (cervical dislocation) which 419
was also realized under general anesthesia (isofluorane). 420
Hamster Infection 421
Anesthetized animals (four-week-old) were intranasally infected with 50µL containing 106, 105 or 422
104 TCID50 of virus in 0.9% sodium chloride solution). The mock group was intranasally inoculated with 423
50µL of 0.9% sodium chloride solution. 424
Favipiravir administration 425
Hamster were intra-peritoneally inoculated with different doses of favipiravir. Control group were 426
intra-peritoneally inoculated with a 0.9% sodium chloride solution. 427
Organ collection 428
Organs were first washed in 10mL of 0.9% sodium chloride solution and then transferred to a 2mL or 429
50mL tube containing respectively 1mL (small/large bowel pieces, kidney, spleen and heart) or 10mL 430
(lungs, brain and liver) of 0.9% sodium chloride solution and 3mm glass beads. They were crushed 431
using a the Tissue Lyser machine (Retsch MM400) for 5min at 30 cycles/s and then centrifuged 5min à 432
1200g. Supernatant media were transferred to a 2mL tube, centrifuged 10 min at 16,200g and stored 433
at -80°C. One milliliter of blood was harvested in a 2mL tube containing 100µL of 0.5M EDTA 434
(ThermoFischer Scientific). Blood was centrifuged for 10 min at 16,200g and stored at -80°C. 435
Quantitative real-time RT-PCR (RT-qPCR) assays 436
To avoid contamination, all experiments were conducted in a molecular biology laboratory that is 437
specifically designed for clinical diagnosis using molecular techniques, and which includes separate 438
laboratories dedicated to perform each step of the procedure. Prior to PCR amplification, RNA 439
extraction was performed using the QIAamp 96 DNA kit and the Qiacube HT kit and the Qiacube HT 440
(both from Qiagen) following the manufacturer’s instructions. Shortly, 100 µl of organ clarified 441
homogenates, spiked with 10µL of internal control (bacteriophage MS2) (Ninove et al., 2011), were 442
transferred into an S-block containing the recommended volumes of VXL, proteinase K and RNA carrier. 443
RT-qPCR (SARS-CoV-2 and MS2 viral genome detection) were performed with the Express one step RT-444
qPCR Universal kit (ThermoFisher Scientific) using 3.5µL of RNA and 6.5µL of RT-qPCR mix that contains 445
250nmol of each primer and 75nmol of probe. Amplification was performed with the QuantStudio 12K 446
Flex Real-Time PCR System (ThermoFisher Scientific) using the following conditions: 50°C for 10min, 447
95°C for 20s, followed by 40 cycles of 95°C for 3s, 60°C for 30s. qPCR (ɣ-actine gene detection) was 448
perfomed under the same condition as RT-qPCR with the following modifications: we used the Express 449
one step qPCR Universal kit (ThermoFisher Scientific) and the 50°C step of the amplification cycle was 450
removed. Primers and probes sequences used to detect SARS-CoV-2, MS2 and ɣ-actine are described 451
in Table S9. 452
Tissue-culture infectious dose 50 (TCID50) assay 453
To determine infectious titers, 96-well culture plates containing confluent VeroE6 cells were 454
inoculated with 150μL per well of serial dilutions of each sample (four-fold or ten-fold dilutions when 455
analyzing lung clarified homogenates or cell supernatant media respectively). Each dilution was 456
performed in sextuplicate. Plates were incubated for 4 days and then read for the absence or presence 457
of cytopathic effect in each well. Infectious titers were estimated using the method described by Reed 458
& Muench (REED and MUENCH, 1938). 459
Favipiravir pharmacokinetics 460
Animal handling, hamster infections and favipiravir administrations were performed as described 461
above. A piece of left lung was first washed in 10mL of sodium chloride 0.9% solution, blotted with 462
filter paper, weighed and then transferred to a 2mL tube containing 1mL of 0.9% sodium chloride 463
solution and 3mm glass beads. It was crushed using the Tissue Lyser machine (Retsch MM400) during 464
10min at 30 cycles/s and then centrifuged 5min à 1200g. Supernatant media were transferred to 2mL 465
tubes, centrifuged 10 min at 16,200g and stored at -80°C. One milliliter of blood was harvested in a 466
2mL tube containing 100µL of 0.5M EDTA (ThermoFischer Scientific). Blood was centrifuged for 10 min 467
at 16,200g and stored at -80°C. 468
Quantification of favipiravir in plasma and lung tissues was performed by a validated sensitive and 469
selective validated high-performance liquid chromatography coupled with tandem mass spectrometry 470
method (UPLC-TQD, Waters, USA) with a lower limit of quantification of 0.1 µg/mL. Precision and 471
accuracy of the 3 quality control samples (QCs) were within 15% over the calibration range (0.5 µg/mL 472
to 100 µg/mL) (Bekegnran et al., submitted). Favipiravir was extracted by a simple protein precipitation 473
method, using acetonitrile for plasma and ice-cold acetonitrile for clarified lung homogenates. Briefly, 474
50 µL of samples matrix was added to 500µL of acetonitrile solution containing the internal standard 475
(favipiravir-13C,15N, Alsachim), then vortexed for 2min followed by centrifugation for 10min at 4°C. 476
The supernatant medium was evaporated and the dry residues were then transferred to 96-well plates 477
and 50 µL was injected. To assess the selectivity and specificity of the method and matrix effect, blank 478
plasma and tissues homogenates from 2 control animals (uninfected and untreated) were processed 479
at each run. Moreover, the same control samples spiked with favipiravir concentration equivalent to 480
the QCs (0.75, 50 and 80 µg/mL) were also processed and compared to the QCs samples. 481
Noncompartemental analysis conducted using software Pkanalix2019R2 (www.lixoft.com). Areas 482
under the plasma concentration time curve were computed using medians of favipiravir 483
concentrations at 0.5, 1, 5 and 8 hours, and extrapolated until T=12h. Ctrough were extrapolated at 484
T=12h using lambda-z loglinear regression on the decreasing slope of concentrations. 485
Sequence analysis of the full-length genome 486
200µL of lung clarified homogenate or infectious cell supernatant (virus stock) was inactivated with an 487
equal volume of VXL lysis buffer (Qiagen) and viral RNA was extracted using an EZ1 Advanced XL robot 488
with the EZ1 mini virus 2.0 kit (both from Qiagen) and linear acrylamide (ThermoFisher Scientific) in 489
place of carrier RNA. cDNA was generated in a final volume of 40µL using 14µL of nucleic acid extract, 490
random hexamer and the Protoscript II First Strand cDNA Synthesis Kit (New England Biolabs). A 491
specific set of primers (Table S10) was used to generate thirteen amplicons covering the entire genome 492
with the Q5 High-Fidelity DNA polymerase (New England Biolabs). PCR mixes (final volume 25µL) 493
contained 2.5µL of cDNA, 2µL of each primer (10µM) and 12.5 µL of Q5 High-Fidelity 2X Master Mix. 494
Amplification was performed with the following conditions: 30 sec at 98°C, then 45 cycles of 15 sec at 495
98°C and 5 min à 65°C. Size of PCR products was verified by gel electrophoresis. For each sample, an 496
equimolar pool of all amplicons was prepared and purified using Monarch PCR & DNA Cleanup Kit (New 497
England Biolabs). After DNA quantification using Qubit dsDNA HS Assay Kit and Qubit 2.0 fluorometer 498
(ThermoFisher Scientific), amplicons were fragmented by sonication into fragments of around 200bp 499
long. Libraries were built by adding barcodes, for sample identification, and primers using AB Library 500
Builder System (ThermoFisher Scientific). To pool equimolarly the barcoded samples a quantification 501
step by real time PCR using Ion Library TaqMan Quantitation Kit (ThermoFisher Scientific) was 502
performed. Then, emulsion PCR from pools and loading on 530 chip was performed using the 503
automated Ion Chef instrument (ThermoFisher Scientific). Sequencing was performed using the S5 Ion 504
torrent technology v5.12 (ThermoFisher Scientific) following manufacturer’s instructions. Consensus 505
sequence was obtained after trimming of reads (reads with quality score <0.99, and length <100pb 506
were removed and the 30 first and 30 last nucleotides were removed from the reads). Mapping of the 507
reads on a reference (determine following blast of De Novo contigs) was done using CLC genomics 508
workbench software v.20 (Qiagen). A de novo contig was also produced to ensure that the consensus 509
sequence was not affected by the reference sequence. Mutation frequency for each position was 510
calculated as the number of reads with a mutation compared to the reference divided by the total 511
number of reads at that site. Only substitutions with a frequency of at least 1% were taken into account 512
for the analysis (Table S6). 513
ED50, ED90 and ED99 determination 514
We conducted a nonlinear regression of infectious viral load against dose, using an Emax model, giving 515
𝑉𝐿 = 𝑉𝐿0 × (1 − (𝐷𝛾
𝐷𝛾+𝐷50𝛾 )) with 𝑉𝐿0 being infectious viral load of untreated animals. We estimated 516
𝐷50 the dose required to decrease viral load by 50%, using a coefficient 𝛾 to account for the high 517
sigmoidicity of the relation between dose and titers. 𝛾 coefficient was chosen as the one maximizing 518
likelihood of the model. We extrapolated the 𝐷90 and 𝐷99 using 𝐷90 = √9 × 𝐷50𝛾𝛾
and 𝐷99 =519
√99 × 𝐷50𝛾𝛾
, as well as their 95% confidence interval using the delta method. 520
Statistical analysis 521
Graphical representations and statistical analyses were performed with Graphpad Prism 7 (Graphpad 522
software) except linear/nonlinear regressions and their corresponding graphical representations that 523
were performed using R statistical software (http://www.R-project.org). Statistical details for each 524
experiments are described in the figure legends and in corresponding supplemental tables. P-values 525
lower than 0.05 were considered statistically significant. 526
Supplemental Data 527
Supplemental figure 1: In vitro efficacy of favipiravir 528
Supplemental figure 2: Dose-response curves 529
Supplemental figure 3: Evaluation of the toxicity for animals infected and treated with high doses of 530
favipiravir 531
Supplemental figure 4: Plasma concentrations of favipiravir after administration of a single dose of 532
favipiravir 533
Supplemental table 1: Implementation of hamster model 534
Supplemental table 2: Individual data from in vivo experiments 535
Supplemental table 3: Statistical analysis of in vivo experiments 536
Supplemental table 4: Statistical analysis of clinical monitoring 537
Supplemental table 5: Individual data of favipiravir pharmacokinetics 538
Supplemental table 6: Individual data for analysis of mutagenic effect of favipiravir 539
Supplemental table 7: Statistical analysis of mutagenic effect of favipiravir 540
Supplemental table 8: Shared mutations detected in lung clarified homogenates 541
Supplemental table 9: (RT)-qPCR systems 542
Supplemental table 10: Primer sequences used to produce overlapping amplicons for next generation 543
sequencing 544
References 545
AGOSTINI, M. L., ANDRES, E. L., SIMS, A. C., GRAHAM, R. L., SHEAHAN, T. P., LU, X., SMITH, E. C., CASE, 546
J. B., FENG, J. Y., JORDAN, R., RAY, A. S., CIHLAR, T., SIEGEL, D., MACKMAN, R. L., CLARKE, M. 547
O., BARIC, R. S. & DENISON, M. R. 2018. Coronavirus Susceptibility to the Antiviral Remdesivir 548
(GS-5734) Is Mediated by the Viral Polymerase and the Proofreading Exoribonuclease. mBio, 549
9. 550
ARIAS, A., THORNE, L. & GOODFELLOW, I. 2014. Favipiravir elicits antiviral mutagenesis during virus 551
replication in vivo. Elife, 3, e03679. 552
BARANOVICH, T., WONG, S. S., ARMSTRONG, J., MARJUKI, H., WEBBY, R. J., WEBSTER, R. G. & 553
GOVORKOVA, E. A. 2013. T-705 (favipiravir) induces lethal mutagenesis in influenza A H1N1 554
viruses in vitro. J Virol, 87, 3741-51. 555
CHAN, J. F., ZHANG, A. J., YUAN, S., POON, V. K., CHAN, C. C., LEE, A. C., CHAN, W. M., FAN, Z., TSOI, H. 556
W., WEN, L., LIANG, R., CAO, J., CHEN, Y., TANG, K., LUO, C., CAI, J. P., KOK, K. H., CHU, H., 557
CHAN, K. H., SRIDHAR, S., CHEN, Z., CHEN, H., TO, K. K. & YUEN, K. Y. 2020. Simulation of the 558
clinical and pathological manifestations of Coronavirus Disease 2019 (COVID-19) in golden 559
Syrian hamster model: implications for disease pathogenesis and transmissibility. Clin Infect 560
Dis. 561
CHEN, Y., TAO, J., SUN, Y., WU, A., SU, C., GAO, G., CAI, H., QIU, S., WU, Y., AHOLA, T. & GUO, D. 2013. 562
Structure-function analysis of severe acute respiratory syndrome coronavirus RNA cap 563
guanine-N7-methyltransferase. J Virol, 87, 6296-305. 564
CUEVAS, J. M., DOMINGO-CALAP, P. & SANJUAN, R. 2012. The fitness effects of synonymous mutations 565
in DNA and RNA viruses. Mol Biol Evol, 29, 17-20. 566
DONG, E., DU, H. & GARDNER, L. 2020. An interactive web-based dashboard to track COVID-19 in real 567
time. Lancet Infect Dis, 20, 533-534. 568
ECKERLE, L. D., LU, X., SPERRY, S. M., CHOI, L. & DENISON, M. R. 2007. High fidelity of murine hepatitis 569
virus replication is decreased in nsp14 exoribonuclease mutants. J Virol, 81, 12135-44. 570
ESCRIBANO-ROMERO, E., JIMENEZ DE OYA, N., DOMINGO, E. & SAIZ, J. C. 2017. Extinction of West Nile 571
Virus by Favipiravir through Lethal Mutagenesis. Antimicrob Agents Chemother, 61. 572
FERRON, F., SUBISSI, L., SILVEIRA DE MORAIS, A. T., LE, N. T. T., SEVAJOL, M., GLUAIS, L., DECROLY, E., 573
VONRHEIN, C., BRICOGNE, G., CANARD, B. & IMBERT, I. 2018. Structural and molecular basis 574
of mismatch correction and ribavirin excision from coronavirus RNA. Proc Natl Acad Sci U S A, 575
115, E162-E171. 576
GOWEN, B. B., SEFING, E. J., WESTOVER, J. B., SMEE, D. F., HAGLOCH, J., FURUTA, Y. & HALL, J. O. 2015. 577
Alterations in favipiravir (T-705) pharmacokinetics and biodistribution in a hamster model of 578
viral hemorrhagic fever. Antiviral Res, 121, 132-7. 579
GUEDJ, J., PIORKOWSKI, G., JACQUOT, F., MADELAIN, V., NGUYEN, T. H. T., RODALLEC, A., GUNTHER, 580
S., CARBONNELLE, C., MENTRE, F., RAOUL, H. & DE LAMBALLERIE, X. 2018. Antiviral efficacy of 581
favipiravir against Ebola virus: A translational study in cynomolgus macaques. PLoS Med, 15, 582
e1002535. 583
HE, X., LAU, E. H. Y., WU, P., DENG, X., WANG, J., HAO, X., LAU, Y. C., WONG, J. Y., GUAN, Y., TAN, X., 584
MO, X., CHEN, Y., LIAO, B., CHEN, W., HU, F., ZHANG, Q., ZHONG, M., WU, Y., ZHAO, L., ZHANG, 585
F., COWLING, B. J., LI, F. & LEUNG, G. M. 2020. Temporal dynamics in viral shedding and 586
transmissibility of COVID-19. Nat Med, 26, 672-675. 587
HUANG, C., WANG, Y., LI, X., REN, L., ZHAO, J., HU, Y., ZHANG, L., FAN, G., XU, J., GU, X., CHENG, Z., YU, 588
T., XIA, J., WEI, Y., WU, W., XIE, X., YIN, W., LI, H., LIU, M., XIAO, Y., GAO, H., GUO, L., XIE, J., 589
WANG, G., JIANG, R., GAO, Z., JIN, Q., WANG, J. & CAO, B. 2020. Clinical features of patients 590
infected with 2019 novel coronavirus in Wuhan, China. Lancet, 395, 497-506. 591
JEON, S., KO, M., LEE, J., CHOI, I., BYUN, S. Y., PARK, S., SHUM, D. & KIM, S. 2020. Identification of 592
antiviral drug candidates against SARS-CoV-2 from FDA-approved drugs. Antimicrob Agents 593
Chemother. 594
JOCHMANS, D., VAN NIEUWKOOP, S., SMITS, S. L., NEYTS, J., FOUCHIER, R. A. & VAN DEN HOOGEN, B. 595
G. 2016. Antiviral Activity of Favipiravir (T-705) against a Broad Range of Paramyxoviruses In 596
Vitro and against Human Metapneumovirus in Hamsters. Antimicrob Agents Chemother, 60, 597
4620-9. 598
JULANDER, J. G., SHAFER, K., SMEE, D. F., MORREY, J. D. & FURUTA, Y. 2009. Activity of T-705 in a 599
hamster model of yellow fever virus infection in comparison with that of a chemically related 600
compound, T-1106. Antimicrob Agents Chemother, 53, 202-9. 601
KAPTEIN, S. J., JACOBS, S., LANGENDRIES, L., SELDESLACHTS, L., TER HORST, S., LIESENBORGHS, L., 602
HENS, B., VERGOTE, V., HEYLEN, E., MAAS, E., DE KEYZER, C., BERVOETS, L., RYMENANTS, J., 603
VAN BUYTEN, T., THIBAUT, H. J., DALLMEIER, K., BOUDEWIJNS, R., WOUTERS, J., AUGUSTIJNS, 604
P., VEROUGSTRAETE, N., CAWTHORNE, C., WEYNAND, B., ANNAERT, P., SPRIET, I., VELDE, G. 605
V., NEYTS, J., ROCHA-PEREIRA, J. & DELANG, L. 2020. Antiviral treatment of SARS-CoV-2-606
infected hamsters reveals a weak effect of favipiravir and a complete lack of effect for 607
hydroxychloroquine. bioRxiv, 2020.06.19.159053. 608
MA, Y., WU, L., SHAW, N., GAO, Y., WANG, J., SUN, Y., LOU, Z., YAN, L., ZHANG, R. & RAO, Z. 2015. 609
Structural basis and functional analysis of the SARS coronavirus nsp14-nsp10 complex. Proc 610
Natl Acad Sci U S A, 112, 9436-41. 611
MADELAIN, V., GUEDJ, J., MENTRE, F., NGUYEN, T. H., JACQUOT, F., OESTEREICH, L., KADOTA, T., 612
YAMADA, K., TABURET, A. M., DE LAMBALLERIE, X. & RAOUL, H. 2017. Favipiravir 613
Pharmacokinetics in Nonhuman Primates and Insights for Future Efficacy Studies of 614
Hemorrhagic Fever Viruses. Antimicrob Agents Chemother, 61. 615
MADELAIN, V., MENTRE, F., BAIZE, S., ANGLARET, X., LAOUENAN, C., OESTEREICH, L., NGUYEN, T. H. T., 616
MALVY, D., PIORKOWSKI, G., GRAW, F., GUNTHER, S., RAOUL, H., DE LAMBALLERIE, X. & 617
GUEDJ, J. 2020. Modeling Favipiravir Antiviral Efficacy Against Emerging Viruses: From Animal 618
Studies to Clinical Trials. CPT Pharmacometrics Syst Pharmacol, 9, 258-271. 619
MADELAIN, V., NGUYEN, T. H., OLIVO, A., DE LAMBALLERIE, X., GUEDJ, J., TABURET, A. M. & MENTRE, 620
F. 2016. Ebola Virus Infection: Review of the Pharmacokinetic and Pharmacodynamic 621
Properties of Drugs Considered for Testing in Human Efficacy Trials. Clin Pharmacokinet, 55, 622
907-23. 623
MERCORELLI, B., PALU, G. & LOREGIAN, A. 2018. Drug Repurposing for Viral Infectious Diseases: How 624
Far Are We? Trends Microbiol, 26, 865-876. 625
NINOVE, L., NOUGAIREDE, A., GAZIN, C., THIRION, L., DELOGU, I., ZANDOTTI, C., CHARREL, R. N. & DE 626
LAMBALLERIE, X. 2011. RNA and DNA bacteriophages as molecular diagnosis controls in clinical 627
virology: a comprehensive study of more than 45,000 routine PCR tests. PLoS One, 6, e16142. 628
OESTEREICH, L., RIEGER, T., LUDTKE, A., RUIBAL, P., WURR, S., PALLASCH, E., BOCKHOLT, S., 629
KRASEMANN, S., MUNOZ-FONTELA, C. & GUNTHER, S. 2016. Efficacy of Favipiravir Alone and 630
in Combination With Ribavirin in a Lethal, Immunocompetent Mouse Model of Lassa Fever. J 631
Infect Dis, 213, 934-8. 632
REED, L. J. & MUENCH, H. 1938. A SIMPLE METHOD OF ESTIMATING FIFTY PER CENT ENDPOINTS. 633
American Journal of Epidemiology, 27, 493-497. 634
ROCKX, B., KUIKEN, T., HERFST, S., BESTEBROER, T., LAMERS, M. M., OUDE MUNNINK, B. B., DE 635
MEULDER, D., VAN AMERONGEN, G., VAN DEN BRAND, J., OKBA, N. M. A., SCHIPPER, D., VAN 636
RUN, P., LEIJTEN, L., SIKKEMA, R., VERSCHOOR, E., VERSTREPEN, B., BOGERS, W., 637
LANGERMANS, J., DROSTEN, C., FENTENER VAN VLISSINGEN, M., FOUCHIER, R., DE SWART, R., 638
KOOPMANS, M. & HAAGMANS, B. L. 2020. Comparative pathogenesis of COVID-19, MERS, and 639
SARS in a nonhuman primate model. Science, 368, 1012-1015. 640
ROSENKE, K., FELDMANN, H., WESTOVER, J. B., HANLEY, P. W., MARTELLARO, C., FELDMANN, F., 641
SATURDAY, G., LOVAGLIO, J., SCOTT, D. P., FURUTA, Y., KOMENO, T., GOWEN, B. B. & 642
SAFRONETZ, D. 2018. Use of Favipiravir to Treat Lassa Virus Infection in Macaques. Emerg 643
Infect Dis, 24, 1696-1699. 644
SANGAWA, H., KOMENO, T., NISHIKAWA, H., YOSHIDA, A., TAKAHASHI, K., NOMURA, N. & FURUTA, Y. 645
2013. Mechanism of action of T-705 ribosyl triphosphate against influenza virus RNA 646
polymerase. Antimicrob Agents Chemother, 57, 5202-8. 647
SEGURA GUERRERO, N. A., SHARMA, S., NEYTS, J. & KAPTEIN, S. J. F. 2018. Favipiravir inhibits in vitro 648
Usutu virus replication and delays disease progression in an infection model in mice. Antiviral 649
Res, 160, 137-142. 650
SHANNON, A., SELISKO, B., LE, N., HUCHTING, J., TOURET, F., PIORKOWSKI, G., FATTORINI, V., FERRON, 651
F., DECROLY, E., MEIER, C., COUTARD, B., PEERSEN, O. & CANARD, B. 2020. Favipiravir strikes 652
the SARS-CoV-2 at its Achilles heel, the RNA polymerase. bioRxiv, 2020.05.15.098731. 653
SIDWELL, R. W., BARNARD, D. L., DAY, C. W., SMEE, D. F., BAILEY, K. W., WONG, M. H., MORREY, J. D. 654
& FURUTA, Y. 2007. Efficacy of orally administered T-705 on lethal avian influenza A (H5N1) 655
virus infections in mice. Antimicrob Agents Chemother, 51, 845-51. 656
SISSOKO, D., LAOUENAN, C., FOLKESSON, E., M'LEBING, A. B., BEAVOGUI, A. H., BAIZE, S., CAMARA, A. 657
M., MAES, P., SHEPHERD, S., DANEL, C., CARAZO, S., CONDE, M. N., GALA, J. L., COLIN, G., 658
SAVINI, H., BORE, J. A., LE MARCIS, F., KOUNDOUNO, F. R., PETITJEAN, F., LAMAH, M. C., 659
DIEDERICH, S., TOUNKARA, A., POELART, G., BERBAIN, E., DINDART, J. M., DURAFFOUR, S., 660
LEFEVRE, A., LENO, T., PEYROUSET, O., IRENGE, L., BANGOURA, N., PALICH, R., HINZMANN, J., 661
KRAUS, A., BARRY, T. S., BERETTE, S., BONGONO, A., CAMARA, M. S., MUNOZ, V. C., 662
DOUMBOUYA, L., HAROUNA, S., KIGHOMA, P. M., KOUNDOUNO, F. R., LOLAMOU, R., LOUA, 663
C. M., MASSALA, V., MOUMOUNI, K., PROVOST, C., SAMAKE, N., SEKOU, C., SOUMAH, A., 664
ARNOULD, I., KOMANO, M. S., GUSTIN, L., BERUTTO, C., CAMARA, D., CAMARA, F. S., 665
COLPAERT, J., DELAMOU, L., JANSSON, L., KOUROUMA, E., LOUA, M., MALME, K., MANFRIN, 666
E., MAOMOU, A., MILINOUNO, A., OMBELET, S., SIDIBOUN, A. Y., VERRECKT, I., YOMBOUNO, 667
P., BOCQUIN, A., CARBONNELLE, C., CARMOI, T., FRANGE, P., MELY, S., NGUYEN, V. K., 668
PANNETIER, D., TABURET, A. M., TRELUYER, J. M., KOLIE, J., MOH, R., GONZALEZ, M. C., 669
KUISMA, E., LIEDIGK, B., NGABO, D., RUDOLF, M., THOM, R., KERBER, R., GABRIEL, M., WLFEL, 670
R., WOLFEL, R., BADIR, J., BENTAHIR, M., DECCACHE, Y., DUMONT, C., DURANT, J. F., EL 671
BAKKOURI, K., UWAMAHORO, M. G., SMITS, B., TOUFIK, N., et al. 2016. Experimental 672
Treatment with Favipiravir for Ebola Virus Disease (the JIKI Trial): A Historically Controlled, 673
Single-Arm Proof-of-Concept Trial in Guinea. Plos Medicine, 13. 674
SMITHER, S. J., EASTAUGH, L. S., STEWARD, J. A., NELSON, M., LENK, R. P. & LEVER, M. S. 2014. Post-675
exposure efficacy of oral T-705 (Favipiravir) against inhalational Ebola virus infection in a 676
mouse model. Antiviral Res, 104, 153-5. 677
TAKAHASHI, K., FURUTA, Y., FUKUDA, Y., KUNO, M., KAMIYAMA, T., KOZAKI, K., NOMURA, N., EGAWA, 678
H., MINAMI, S. & SHIRAKI, K. 2003. In vitro and in vivo activities of T-705 and oseltamivir against 679
influenza virus. Antivir Chem Chemother, 14, 235-41. 680
TANI, H., KOMENO, T., FUKUMA, A., FUKUSHI, S., TANIGUCHI, S., SHIMOJIMA, M., UDA, A., MORIKAWA, 681
S., NAKAJIMA, N., FURUTA, Y. & SAIJO, M. 2018. Therapeutic effects of favipiravir against 682
severe fever with thrombocytopenia syndrome virus infection in a lethal mouse model: Dose-683
efficacy studies upon oral administration. PLoS One, 13, e0206416. 684
WANG, M., CAO, R., ZHANG, L., YANG, X., LIU, J., XU, M., SHI, Z., HU, Z., ZHONG, W. & XIAO, G. 2020. 685
Remdesivir and chloroquine effectively inhibit the recently emerged novel coronavirus (2019-686
nCoV) in vitro. Cell Res, 30, 269-271. 687
WHO 2020. World Health Organization. WHO Director-General's opening remarks at the media 688
briefing on COVID-19 - 11 March 2020 (https://www.who.int). 689
WILLIAMSON, B. N., FELDMANN, F., SCHWARZ, B., MEADE-WHITE, K., PORTER, D. P., SCHULZ, J., VAN 690
DOREMALEN, N., LEIGHTON, I., YINDA, C. K., PEREZ-PEREZ, L., OKUMURA, A., LOVAGLIO, J., 691
HANLEY, P. W., SATURDAY, G., BOSIO, C. M., ANZICK, S., BARBIAN, K., CIHLAR, T., MARTENS, 692
C., SCOTT, D. P., MUNSTER, V. J. & DE WIT, E. 2020. Clinical benefit of remdesivir in rhesus 693
macaques infected with SARS-CoV-2. Nature. 694
YAMADA, K., NOGUCHI, K., KIMITSUKI, K., KAIMORI, R., SAITO, N., KOMENO, T., NAKAJIMA, N., 695
FURUTA, Y. & NISHIZONO, A. 2019. Reevaluation of the efficacy of favipiravir against rabies 696
virus using in vivo imaging analysis. Antiviral Res, 172, 104641. 697
ZHU, N., ZHANG, D., WANG, W., LI, X., YANG, B., SONG, J., ZHAO, X., HUANG, B., SHI, W., LU, R., NIU, 698
P., ZHAN, F., MA, X., WANG, D., XU, W., WU, G., GAO, G. F., TAN, W., CHINA NOVEL 699
CORONAVIRUS, I. & RESEARCH, T. 2020. A Novel Coronavirus from Patients with Pneumonia in 700
China, 2019. N Engl J Med, 382, 727-733. 701
702


![Design, synthesis and application of carbazole macrocycles ...€¦ · Anion receptors containing carbazole and amide functionalities were investigated in numerous works [6-9]. In](https://img.pdfslide.fr/doc/110x75/605e9713d39a752cd71609f2/design-synthesis-and-application-of-carbazole-macrocycles-anion-receptors-containing.jpg)
![7 Biologie Moléculaire 9 Séparation 10 Biochips ... 2010_11/F/kapitel_6_F.pdf · Référence Description Volume [µl] Couleur Graduation Stérilité Qté par sachet ou rack/carton](https://img.pdfslide.fr/doc/110x75/5e0bdd211d1d056340063d6c/7-biologie-molculaire-9-sparation-10-biochips-201011fkapitel6fpdf.jpg)