Embed Size (px)
Citation preview
A Comprehensive Analysis of Groundwater Quality in The BarnettShale RegionZacariah L. Hildenbrand,*,†,‡ Doug D. Carlton, Jr.,‡,§ Brian E. Fontenot,‡,◆ Jesse M. Meik,‡,∥
Jayme L. Walton,‡ Josh T. Taylor,† Jonathan B. Thacker,§ Stephanie Korlie,§ C. Phillip Shelor,§
Drew Henderson,§ Akinde F. Kadjo,§ Corey E. Roelke,‡,# Paul F. Hudak,∇ Taylour Burton,¶
Hanadi S. Rifai,¶ and Kevin A. Schug*,‡,§
†Inform Environmental, LLC, Dallas Texas 75206, United States‡Affiliate of the Collaborative Laboratories for Environmental Analysis and Remediation, The University of Texas at Arlington,Arlington Texas 76019, United States§Department of Chemistry and Biochemistry, The University of Texas at Arlington, Arlington Texas 76019, United States∥Department of Biological Sciences, Tarleton State University, Stephenville Texas 76401, United States#Department of Biology, The University of Texas at Arlington, Arlington Texas 76019, United States∇Department of Geography, University of North Texas, Denton, Texas 76203, United States¶Department of Civil and Environmental Engineering, University of Houston, Houston, Texas 77204, United States
*S Supporting Information
ABSTRACT: The exploration of unconventional shale energy reserves and theextensive use of hydraulic fracturing during well stimulation have raised concerns aboutthe potential effects of unconventional oil and gas extraction (UOG) on theenvironment. Most accounts of groundwater contamination have focused primarily onthe compositional analysis of dissolved gases to address whether UOG activities havehad deleterious effects on overlying aquifers. Here, we present an analysis of 550groundwater samples collected from private and public supply water wells drawingfrom aquifers overlying the Barnett shale formation of Texas. We detected multiplevolatile organic carbon compounds throughout the region, including various alcohols,the BTEX family of compounds, and several chlorinated compounds. These data donot necessarily identify UOG activities as the source of contamination; however, theydo provide a strong impetus for further monitoring and analysis of groundwater qualityin this region as many of the compounds we detected are known to be associated withUOG techniques.
1. INTRODUCTION
The potential effects of unconventional oil and gas (UOG)drilling activities on groundwater quality have led to muchconcern despite a relative lack of scientific data. Recently,investigations in the Marcellus and Barnett shale formations inPennsylvania and Texas found elevated levels of dissolvedmethane1,2 and heavy metals3 in private water wells locatednear unconventional drilling sites. A number of extractionprocesses are utilized during unconventional shale explorationincluding directional drilling, shale acidization, and hydraulicfracturing, in which large quantities of water, proppants, andchemical additives are used to extract sequestered hydro-carbons. Additives used during hydraulic fracturing includeviscosifiers, descaling agents, anticorrosive compounds, lubri-cants, pH stabilizers, and other solvents that could be harmful ifintroduced into the environment.4 Instances of chemicalcontamination can result from casing failures, which happenin approximately 3% of new gas well operations,4 althoughrecent findings indicate failure rates closer to 12% within the
first year of operation.5 Recent research has shown thathydraulic fracturing could potentially alter contaminant path-ways to aquifers via increased advective transport and/or flowthrough existing fractures widened by UOG activities.6,7
Additionally, surface sources such as mishandled waste fluidand produced waters or spills of UOG fluids during stimulationor completion of wells may contaminate groundwater, andshallow water wells may be vulnerable to such contamination.8
One of the more active regions for UOG drilling is in north-central Texas where the Barnett shale formation supportsapproximately 20 000 UOG wells. This region includes aportion of the Dallas-Fort Worth metropolitan area andoutlying areas, and groundwater is potentially vulnerable tocontamination from various urban and rural sources. The
Received: March 25, 2015Revised: June 13, 2015Accepted: June 16, 2015Published: June 16, 2015
Article
pubs.acs.org/est
© 2015 American Chemical Society 8254 DOI: 10.1021/acs.est.5b01526Environ. Sci. Technol. 2015, 49, 8254−8262
Dow
nloa
ded
by U
NIV
OF
TE
XA
S A
T A
RL
ING
TO
N o
n Se
ptem
ber
14, 2
015
| http
://pu
bs.a
cs.o
rg
Pub
licat
ion
Dat
e (W
eb):
Jun
e 26
, 201
5 | d
oi: 1
0.10
21/a
cs.e
st.5
b015
26
Trinity and Woodbine aquifers overlying the Barnett shaleformation have historically been described as good quality withlow levels of heavy metals such as arsenic, selenium, strontium,and barium and naturally elevated levels of total dissolved solids(TDS).9 However, recent research on groundwater quality nearBarnett shale UOG activities identified higher concentrations ofheavy metals compared to historical data for this region.3 Formore detailed information regarding historical water quality inaquifers overlying the Barnett shale formation, we refer thereader to Fontenot et al.3 Here, we present an updated analysisof groundwater quality in aquifers overlying the Barnett shaleand adjacent areas of north-central Texas. The objectives of thisstudy are to assess whether or not UOG activity may have hadan impact on groundwater quality by screening for the presenceof elevated natural constituents and contaminants potentiallyrelated to UOG activity, examining correlations amonggroundwater constituents, and to identify changes in ground-water quality since the previous study of Fontenot et al.3 A totalof 550 groundwater samples were screened for the presence ofchemical compounds used in hydraulic fracturing, as well as forvarious metals and other dissolved ions. We detected elevatedlevels of 10 different metals and the presence of 19 differentchemical compounds, including benzene, toluene, ethyl-benzene, and xylene (BTEX). These results constitute thelargest analysis of groundwater quality in aquifers overlying ashale formation associated with UOG activities.
2. MATERIALS AND METHODS
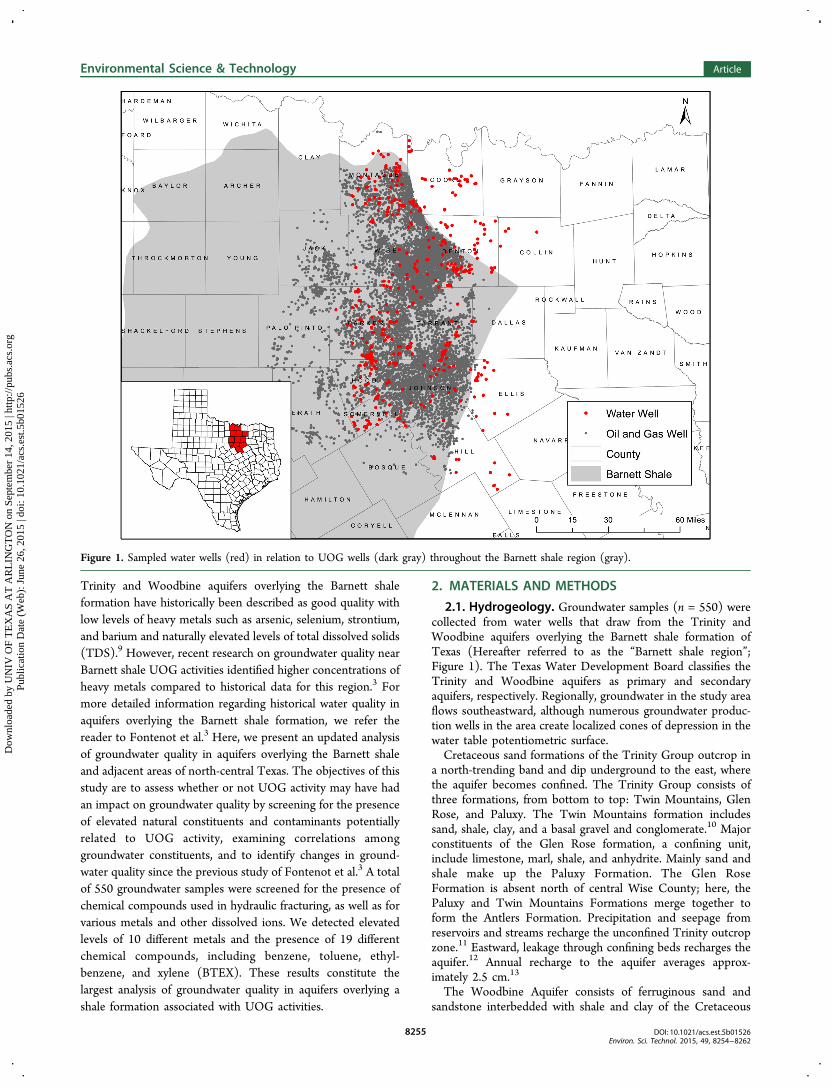
2.1. Hydrogeology. Groundwater samples (n = 550) werecollected from water wells that draw from the Trinity andWoodbine aquifers overlying the Barnett shale formation ofTexas (Hereafter referred to as the “Barnett shale region”;Figure 1). The Texas Water Development Board classifies theTrinity and Woodbine aquifers as primary and secondaryaquifers, respectively. Regionally, groundwater in the study areaflows southeastward, although numerous groundwater produc-tion wells in the area create localized cones of depression in thewater table potentiometric surface.Cretaceous sand formations of the Trinity Group outcrop in
a north-trending band and dip underground to the east, wherethe aquifer becomes confined. The Trinity Group consists ofthree formations, from bottom to top: Twin Mountains, GlenRose, and Paluxy. The Twin Mountains formation includessand, shale, clay, and a basal gravel and conglomerate.10 Majorconstituents of the Glen Rose formation, a confining unit,include limestone, marl, shale, and anhydrite. Mainly sand andshale make up the Paluxy Formation. The Glen RoseFormation is absent north of central Wise County; here, thePaluxy and Twin Mountains Formations merge together toform the Antlers Formation. Precipitation and seepage fromreservoirs and streams recharge the unconfined Trinity outcropzone.11 Eastward, leakage through confining beds recharges theaquifer.12 Annual recharge to the aquifer averages approx-imately 2.5 cm.13
The Woodbine Aquifer consists of ferruginous sand andsandstone interbedded with shale and clay of the Cretaceous
Figure 1. Sampled water wells (red) in relation to UOG wells (dark gray) throughout the Barnett shale region (gray).
Environmental Science & Technology Article
DOI: 10.1021/acs.est.5b01526Environ. Sci. Technol. 2015, 49, 8254−8262
8255
Dow
nloa
ded
by U
NIV
OF
TE
XA
S A
T A
RL
ING
TO
N o
n Se
ptem
ber
14, 2
015
| http
://pu
bs.a
cs.o
rg
Pub
licat
ion
Dat
e (W
eb):
Jun
e 26
, 201
5 | d
oi: 1
0.10
21/a
cs.e
st.5
b015
26
Woodbine Formation. Discontinuous seams of lignite, gypsum,and volcanic ash are also present in the Woodbine Formation.10
Overlying the Trinity Group and intervening strata, theWoodbine Formation also outcrops in the study area anddips eastward. Unconfined conditions occur in the outcropzone, and artesian conditions prevail downdip.11 Precipitationon the outcrop zone and seepage from lakes and streamsrecharge the aquifer. Average annual recharge to the aquifer isapproximately 2 cm.13
2.2. Sample Collection. Private water well samples (n =550) were collected from wells tapping the Trinity andWoodbine aquifers. Of the 550 samples, 350 came from privatewells serving residential purposes, while 59 samples came fromagricultural water wells, and 141 samples came from municipalor public water supply wells servicing communities throughoutthe Dallas-Fort Worth Metroplex. Approximately 83% of thesamples were collected from wells tapping aquifers locatedabove the Barnett shale formation, a feature populated by morethan 20 000 UOG wells since the early 2000s. Samples werecollected without prior knowledge of the UOG activity in thearea and all geospatial analyses were performed ex post facto.Samples were collected throughout Montague, Wise, Parker,Hood, Tarrant, Somervell, Johnson, Hill, Ellis, Dallas, Denton,Collin and Cooke counties (Figure 1). Water well depthsranged from 10 to 1200 m according to wellowners, and welldepth tended to increase eastward in both aquifers, followingthe slope of the principal water-bearing formations into thesubsurface. Sites were selected on the basis of well ownerparticipation and our ability to collect unfiltered/untreatedwater that would be representative of the underlying aquifers, asdescribed previously.3 Measurements for basic water qualityparameters such as temperature, dissolved oxygen (DO),conductivity, total dissolved solids (TDS), salinity, pH, andoxidation−reduction potential (ORP) were performed with aYSI Professional Plus multiparametric probe, and each waterwell was purged until measurements for these parameters hadstabilized, indicating that samples were representative of freshgroundwater from the underlying aquifer. Two duplicatesamples from each private water well were collected inphotoresistant HDPE bottles with no headspace. Samples formetals analysis were filtered and preserved with nitric acid to apH less than 2 and stored at 4 °C until laboratory procedurescould be performed. Samples for anion analysis were preservedwith chloroform and frozen to reduce microbial degradation.All laboratory measurements were made within 14 days, exceptfor the metal analysis, which was measured within 6 months of
collection, per suggested holding times from the EnvironmentalProtection Agency (EPA).14 Method blanks and randomanalytical replicates were performed for each set of samplescollected across multiple trips from December 2013 to August2014 (See Supporting Information for exact sampling dates).
2.3. Analysis. Chemical analyses included gas chromatog-raphy−mass spectrometry (GC−MS), headspace−gas chroma-tography (HS−GC), inductively coupled plasma−mass spec-trometry and −optical emission spectroscopy (ICP−MS andICP−OES), and ion chromatography (IC). Specific organicswere selected from a 2011 Congressional Report on hydraulicfracturing fluid ingredients15 as well as frequently listedcomponents of UOG fluids in the national hydraulic fracturingchemical registry (www.fracfocus.org).16 These include metalions, alcohols, aromatic compounds, aldehydes, amines, andothers (See Supporting Information for a full list of screenedspecies). Whenever possible, we evaluated constituents in thecontext of their respective primary or secondary maximumcontaminant limits (MCL), health advisory levels, or othersuggested levels as provided in the United States Environ-mental Protection Agency’s (EPA) Drinking Water Stand-ards.17
Information about UOG drilling activity in the region wasobtained from www.fracfocus.org16 and the Texas RailroadCommission,18 the governing body for oil and gas drilling inthe state of Texas. Geospatial analyses were conducted usingArcGIS 10.1.19 Because we obtained measurements of waterquality variables for nearly all sample wells, we evaluated therelationship between measures of water quality and bothdistance to nearest UOG well and depth of sample well usingmultiple regression and model selection based on adjusted R2
values. We noted spurious positive relationships betweendistance to nearest UOG well and some water quality variables,and thus we elected to not use this predictor variable further(Table 1; see Results and Discussion below). We evaluatedbivariate relationships for particular variables for which we hada priori reason to assume they may be related, and derived acomposite variable for chloride, bromide, and nitrate using aprincipal components analysis (PCA) of these three variablesbased on the correlation matrix. Before all analyses, we log-transformed both distance measures and log10-transformedremaining variables to normalize distributions. To evaluategeographic patterns at a coarse scale, we used Pearson’s chi-squared tests of independence for frequency of water wellsamples with either detection or EPA’s drinking watermaximum contaminant limit (MCL) exceedances of selected
Table 1. Measures of General Water Quality Variables As a Function of Distance from Nearest Gas Well (Log Meter) AndDepth of Sample Well (Log Meter), Using Multiple Regression and Model Selection (See Text for Details)a
variable best model slope P-value R2adj
log10-temperature dist + depth + dist*depth +0.04* (interaction) <0.0001 0.463log10-DO depth −0.13* <0.0001 0.220log10-conductivity dist + depth dist = +0.03* <0.0001 0.125
depth = +0.05*log10-TDS dist + depth dist = +0.05* <0.0001 0.127
depth = +0.03*log10-salinity dist + depth dist = +0.02* dist =0.001 0.096
depth = +0.05* depth = <0.0001log10-pH
b depth +0.03* <0.0001 0.307ORP depth +20.07* <0.0001 0.024
aAsterisks indicate that the 95% confidence interval for the slope parameter does not include zero. bRelationship is nonlinear; low pH at shallowdepths, high pH at intermediate depths, and slight trend toward neutral pH at deepest depths (R2adj is based on linear approximation).
Environmental Science & Technology Article
DOI: 10.1021/acs.est.5b01526Environ. Sci. Technol. 2015, 49, 8254−8262
8256
Dow
nloa
ded
by U
NIV
OF
TE
XA
S A
T A
RL
ING
TO
N o
n Se
ptem
ber
14, 2
015
| http
://pu
bs.a
cs.o
rg
Pub
licat
ion
Dat
e (W
eb):
Jun
e 26
, 201
5 | d
oi: 1
0.10
21/a
cs.e
st.5
b015
26
compounds for each county with ≥40 total samples. Thisanalysis allowed us to evaluate whether particular counties innorth-central Texas exhibited higher or lower than expectedfrequencies of samples with particular compounds. Allregression, correlation, and principal component analyseswere performed in Systat 12.0220 and chi-squared tests wereperformed in the software program R.21
3. RESULTS AND DISCUSSIONA total of 550 groundwater samples were collected from privateand public water supply wells throughout the Barnett shaleregion. Sampled water wells ranged from 90 m away from thenearest UOG well in areas of active UOG extraction to 47 220m away from the nearest UOG well in areas outside of theBarnett shale, with a median and mean distance of 807 and2315 m, respectively. The large difference between median andmean values reflects the influence of extreme outliers at thehigher end of this range. Of the 550 samples, 339 (61.6%) werecollected from water wells within 1 km of the nearest UOGwell, which likely reflects the increased willingness of wellowners to participate in this research in more heavily drilledareas. Unfortunately, this opportunistic and necessarily biasedsampling hindered our ability to make meaningful inferencesregarding levels of contamination as a function of distance fromnearest UOG well for several reasons: (1) the expectation of nodetection of a given contaminant for a given sample wellassumes uniform and substantial sampling across a gradient ofdistances from UOG wells, but the distribution of well samplesas a function of distance from UOG well was strongly right-skewed; (2) the radius of 1 km for the majority of ourgroundwater samples is not an adequate distance to detectmeaningful statistical patterns of contaminant diffusion fromthe site of UOG wells; and (3) distance to nearest UOG well ispositively correlated with depth of groundwater well (r = 0.36,p < 0.0001) (Supporting Information Figure 1), a potentialconfounding variable (see Water Quality results below). Waterwells in the eastern part of the study area tend to be bothfarther away from UOG wells (because the Barnett shaleformation is westward) and deeper (because the aquifersdeepen eastward); thus, explaining observation (3) above. Weobserved some weak, positive correlations between UOG wellsand some analytes, but interpret these results as spurious forthe reasons mentioned above in conjunction with the followingadditional considerations: (1) positive relationships betweenanalyte concentrations and distance from UOG well have noreasonable causal basis, but are readily explained by thecorrelation with depth of sample well, (2) explanatory power ofthe correlations using distance from UOG well was consistentlylower than for correlations with depth of well, suggesting thatbetween these collinear factors, it is more parsimonious toassume that relationships with distance from UOG well areconfounded.3.1. Water Quality. Multiple regression analyses of basic
water quality parameters as a function of distance from nearestUOG well (distance) and depth of groundwater well sample(depth) revealed that depth is a substantially better predictor ofoverall water quality than is distance, albeit most relationshipswere weak (Table 1). In general, TDS concentrations tend toincrease eastward in the study area, as groundwater movesalong the principal water-bearing formations of the Trinity andWoodbine aquifers. With travel, increased residence (contact)time facilitates more dissolution of aquifer constituents. Forexample, sodium, chloride, sulfate, and various other con-
stituents tend to increase eastward, as does water well depth.All variables showed a positive relationship with depth exceptfor dissolved oxygen, which showed a negative relationship withdepth. Dissolved oxygen levels tend to be higher in shallower,unconfined areas of the aquifer where groundwater mixes withgases in the vadose zone. Values for pH exhibited a nonlinearrelationship with depth, with low values in shallow wells, highvalues at intermediate depths, and a slight trend toward neutralpH for the deepest wells. Values for pH also tend to be lower inthe unconfined outcrop zones, where slightly acidic rainwaterrecharges the aquifers. Model selection indicated that for manyvariables, an additive or interaction model best explained thetotal variance in the data set; however, the low R2adj values formodels including only UOG distance for each of these responsevariables, and the collinearity between depth and UOGdistance, suggest that the inclusion of distance in these modelsis spurious. Basic water quality analyses revealed the consistentoccurrence of elevated TDS throughout the 13 countiessampled. Of the 550 samples, 344 exceeded the secondaryMCL of 500 mg/L suggested by the EPA. TDS values rangedfrom 68.5 to 3328 mg/L with an average slightly above theMCL (630.3 mg/L). Measurements also showed pH valuesranging from 5.3 to 9.4 with a mean value of 8.1. Collectively,254 samples were outside of the range of 6.5−8.5 suggested bythe EPA MCL, with 15 samples having pH measurementsbelow 6.5 and 239 samples having pH measurements above 8.5.Elevated TDS and pH measurements are not unusual for theTrinity and Woodbine aquifers, as similar results have beenreported previously.3,22
3.2. Anions in Groundwater. Subsequent analyses usingion chromatography (IC) were performed to assess theprevalence of selected water quality anions in the Trinity andWoodbine aquifers. Nitrate and fluoride were measured tocharacterize the relative effect of agricultural surface activitieson the underlying groundwater. Nitrate was detected in 223 ofthe 550 samples, and 2 samples were found to be elevatedabove the 44.3 mg/L MCL, with a maximum value of 55.7 mg/L. As a whole, nitrate values were higher (median = 0.95 mg/L)than those previously reported in the Trinity and Woodbineaquifers, each with median values of 0.4 mg/L.22 High levels ofnitrate in shallow groundwater often stem from agriculturalprocesses, such as the use of fertilizer and organic manures, aswell as septic systems and decaying vegetation. Nitrate valuestend to be higher in the outcrop zones of the aquifers, wherethey are more vulnerable to contaminants originating from theland surface. Generally, the outcrop zone of the Trinity aquiferis more rural than that of the Woodbine aquifer, andagricultural activity in the Trinity outcrop zone may accountfor higher median nitrate values observed in that aquifer.Fluoride was found to be elevated above its 4 mg/L MCL in 2wells with a median value of 0.3 mg/L, less than previousmeasurements collected in the 2000s (0.7 and 1.3 mg/L for theTrinity and the Woodbine aquifers, respectively).22 Elevatedfluoride levels may originate from phosphate fertilizers andmineral constituents in the aquifers, especially in the Woodbineaquifer.23,24 For example, fluoride is known to occur atrelatively high levels in parts of the Woodbine aquifer,24 aplausible source being volcanic ash deposits.An overall prevalence of nitrate and the lack of covariation
between nitrate and fluoride (r = −0.05) suggest that they maybe coming from different sources, such as agricultural sourcesfor nitrate and natural sources for fluoride. Sulfate levels(median value of 52.8 mg/L) were below those discovered in
Environmental Science & Technology Article
DOI: 10.1021/acs.est.5b01526Environ. Sci. Technol. 2015, 49, 8254−8262
8257
Dow
nloa
ded
by U
NIV
OF
TE
XA
S A
T A
RL
ING
TO
N o
n Se
ptem
ber
14, 2
015
| http
://pu
bs.a
cs.o
rg
Pub
licat
ion
Dat
e (W
eb):
Jun
e 26
, 201
5 | d
oi: 1
0.10
21/a
cs.e
st.5
b015
26
previous measurements; 79 and 114 mg/L for the Trinity andWoodbine aquifers in samples collected in the 2000s.22
Chloride levels were also found to be consistent with historicalmeasurements with a median value of 25.4 mg/L compared to35 and 36.3 mg/L discovered in samples previously collectedfrom the Trinity and Woodbine aquifers, respectively.22
However, chloride was found to be elevated above the 250mg/L MCL threshold in 21 wells with a maximum value of3373.8 mg/L, a value over 3 times greater than previouslyobserved.22
Formation water in general contains elevated concentrationsof chloride, bromide, sodium, and sulfate.25 Of these ions,bromide has recently been used when attempting to identifyformation water intrusion with the aquifer because of itsnaturally low abundance and conservative behavior in ground-water. High levels of chloride and bromide can be an indicationof anthropogenic contamination, one possibility being UOGactivity,26 a result of groundwater mixing with produced waterfrom the shale formation.25 Bromide was detected in 170 waterwells ranging from 0.03 to 6.4 mg/L (Supporting InformationDescriptive Statistics Table). Previous groundwater monitoringefforts within a few of the counties sampled in this studyshowed bromide concentrations up to approximately 3.5 mg/L,with an outlier of 8.4 mg/L; however, bromide was notdetected in the majority of samples.26,27
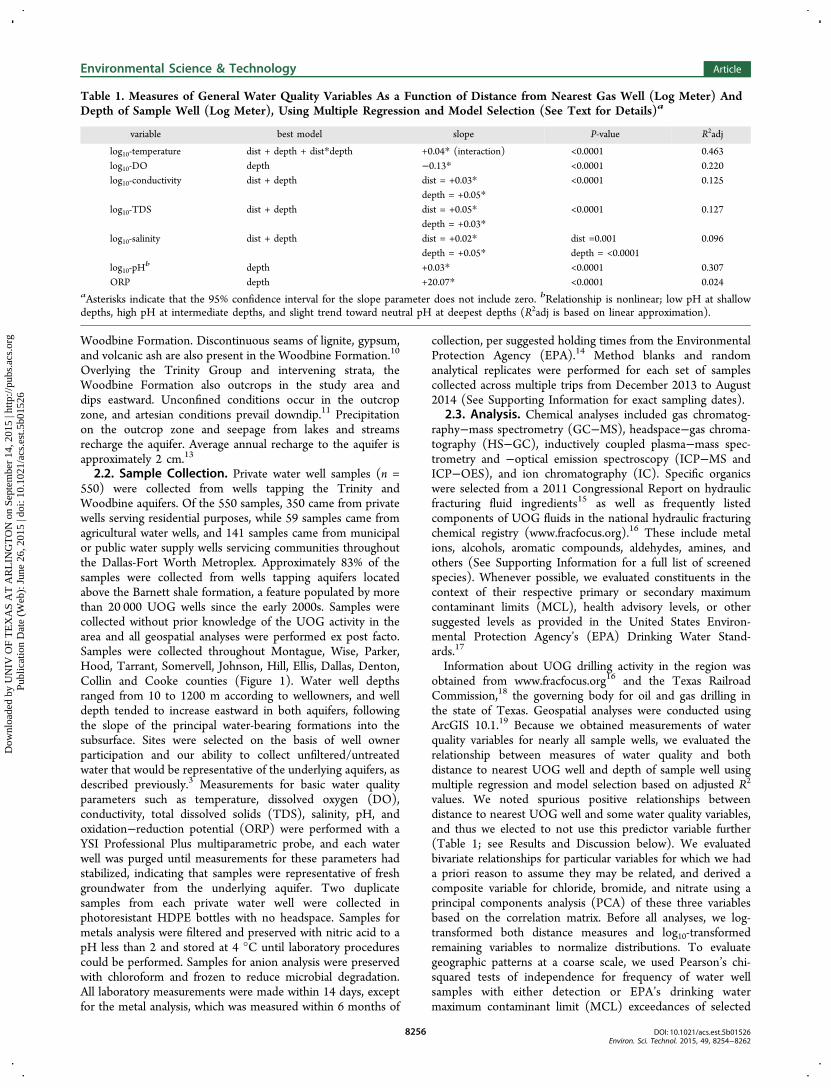
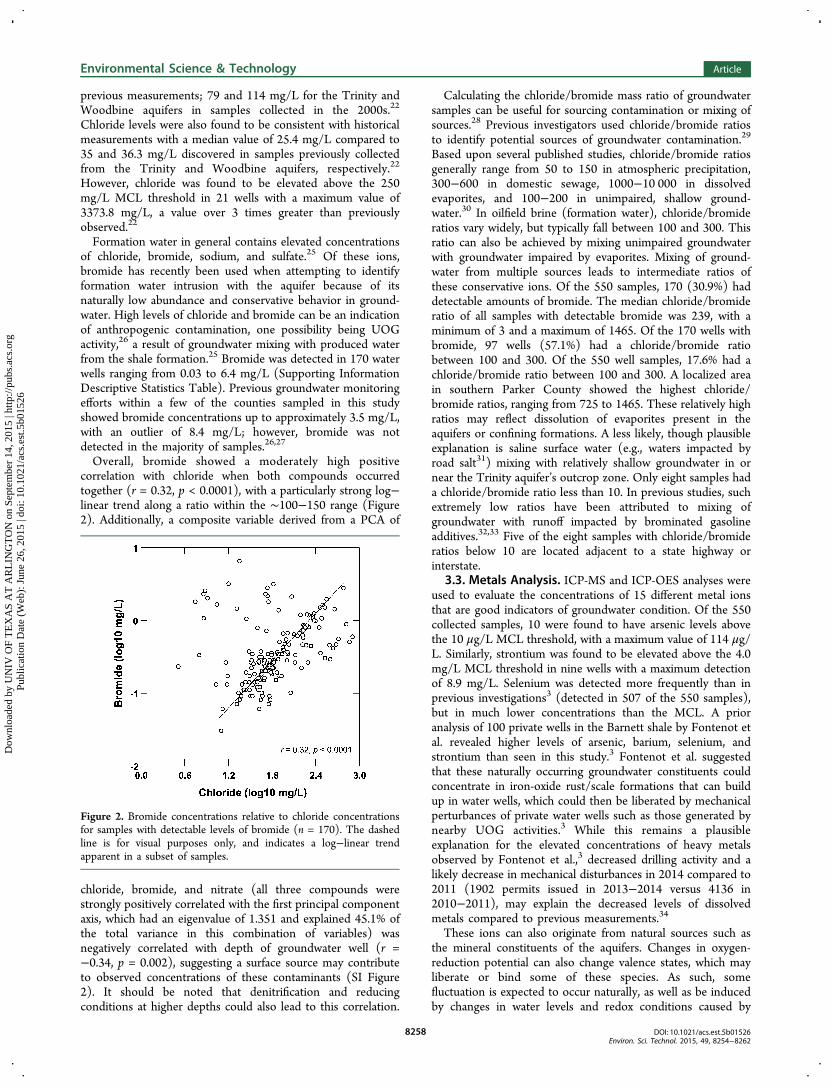
Overall, bromide showed a moderately high positivecorrelation with chloride when both compounds occurredtogether (r = 0.32, p < 0.0001), with a particularly strong log−linear trend along a ratio within the ∼100−150 range (Figure2). Additionally, a composite variable derived from a PCA of
chloride, bromide, and nitrate (all three compounds werestrongly positively correlated with the first principal componentaxis, which had an eigenvalue of 1.351 and explained 45.1% ofthe total variance in this combination of variables) wasnegatively correlated with depth of groundwater well (r =−0.34, p = 0.002), suggesting a surface source may contributeto observed concentrations of these contaminants (SI Figure2). It should be noted that denitrification and reducingconditions at higher depths could also lead to this correlation.
Calculating the chloride/bromide mass ratio of groundwatersamples can be useful for sourcing contamination or mixing ofsources.28 Previous investigators used chloride/bromide ratiosto identify potential sources of groundwater contamination.29
Based upon several published studies, chloride/bromide ratiosgenerally range from 50 to 150 in atmospheric precipitation,300−600 in domestic sewage, 1000−10 000 in dissolvedevaporites, and 100−200 in unimpaired, shallow ground-water.30 In oilfield brine (formation water), chloride/bromideratios vary widely, but typically fall between 100 and 300. Thisratio can also be achieved by mixing unimpaired groundwaterwith groundwater impaired by evaporites. Mixing of ground-water from multiple sources leads to intermediate ratios ofthese conservative ions. Of the 550 samples, 170 (30.9%) haddetectable amounts of bromide. The median chloride/bromideratio of all samples with detectable bromide was 239, with aminimum of 3 and a maximum of 1465. Of the 170 wells withbromide, 97 wells (57.1%) had a chloride/bromide ratiobetween 100 and 300. Of the 550 well samples, 17.6% had achloride/bromide ratio between 100 and 300. A localized areain southern Parker County showed the highest chloride/bromide ratios, ranging from 725 to 1465. These relatively highratios may reflect dissolution of evaporites present in theaquifers or confining formations. A less likely, though plausibleexplanation is saline surface water (e.g., waters impacted byroad salt31) mixing with relatively shallow groundwater in ornear the Trinity aquifer’s outcrop zone. Only eight samples hada chloride/bromide ratio less than 10. In previous studies, suchextremely low ratios have been attributed to mixing ofgroundwater with runoff impacted by brominated gasolineadditives.32,33 Five of the eight samples with chloride/bromideratios below 10 are located adjacent to a state highway orinterstate.
3.3. Metals Analysis. ICP-MS and ICP-OES analyses wereused to evaluate the concentrations of 15 different metal ionsthat are good indicators of groundwater condition. Of the 550collected samples, 10 were found to have arsenic levels abovethe 10 μg/L MCL threshold, with a maximum value of 114 μg/L. Similarly, strontium was found to be elevated above the 4.0mg/L MCL threshold in nine wells with a maximum detectionof 8.9 mg/L. Selenium was detected more frequently than inprevious investigations3 (detected in 507 of the 550 samples),but in much lower concentrations than the MCL. A prioranalysis of 100 private wells in the Barnett shale by Fontenot etal. revealed higher levels of arsenic, barium, selenium, andstrontium than seen in this study.3 Fontenot et al. suggestedthat these naturally occurring groundwater constituents couldconcentrate in iron-oxide rust/scale formations that can buildup in water wells, which could then be liberated by mechanicalperturbances of private water wells such as those generated bynearby UOG activities.3 While this remains a plausibleexplanation for the elevated concentrations of heavy metalsobserved by Fontenot et al.,3 decreased drilling activity and alikely decrease in mechanical disturbances in 2014 compared to2011 (1902 permits issued in 2013−2014 versus 4136 in2010−2011), may explain the decreased levels of dissolvedmetals compared to previous measurements.34
These ions can also originate from natural sources such asthe mineral constituents of the aquifers. Changes in oxygen-reduction potential can also change valence states, which mayliberate or bind some of these species. As such, somefluctuation is expected to occur naturally, as well as be inducedby changes in water levels and redox conditions caused by
Figure 2. Bromide concentrations relative to chloride concentrationsfor samples with detectable levels of bromide (n = 170). The dashedline is for visual purposes only, and indicates a log−linear trendapparent in a subset of samples.
Environmental Science & Technology Article
DOI: 10.1021/acs.est.5b01526Environ. Sci. Technol. 2015, 49, 8254−8262
8258
Dow
nloa
ded
by U
NIV
OF
TE
XA
S A
T A
RL
ING
TO
N o
n Se
ptem
ber
14, 2
015
| http
://pu
bs.a
cs.o
rg
Pub
licat
ion
Dat
e (W
eb):
Jun
e 26
, 201
5 | d
oi: 1
0.10
21/a
cs.e
st.5
b015
26
pumping. Compared to the previous measurements collectedby Fontenot et al.,3 ORP values suggested a more oxidativeenvironment with a median value of 80.7 mV compared to aprevious median value of 28.6. Coupled with an increase in pHfrom 7.69 to 8.30, the current conditions are less favorable fordissolved metals compared to the conditions observed in 2011.Additionally, the samples in Fontenot et al.3 were not acidifiedand filtered as they were sampling for total metals, notdissolved metals as in the current study. However, it should benoted that this difference in sampling protocol likely cannotaccount for the large variations in metals concentrationsbetween the two studies as total metals analysis usually leads toa more conservative concentration estimate than dissolvedmetals analysis.Beryllium, iron, and molybdenum were also elevated in 75,
87, and 187 of the groundwater samples, respectively, with ahigher than expected frequency of MCL exceedances inMontague County based on chi-squared tests (Table 2).Beryllium exceedances (0.004 mg/L MCL) were also detectedat a higher than expected frequency in Parker and Tarrantcounties; whereas iron exceedances (0.3 mg/L MCL) were alsohigher than expected in Cooke and Johnson counties, andmolybdenum exceedances (0.04 mg/L MCL) were morefrequent in Parker and Wise counties (Table 2). Thesignificance of these three ions remains to be determined, asthere is no historical precedent for reference. Other metal ionsfound in excess of their respective MCL values include barium(1 sample), chromium (1 sample), copper (1 sample), nickel(16 samples), and zinc (1 sample).3.4. Gas Chromatography Analyses. GC−MS and HS−
GC analyses revealed the most striking results of this study. Ofthe 39 volatile and semivolatile compounds that were screened,13 compounds were detected at least once. In particular,methanol and/or ethanol were detected in 35 and 240 wellsrespectively with average concentrations of 0.5 and 3.2 mg/Land maximum concentrations of 44.6 and 394.2 mg/L,respectively. Methanol and ethanol both are used extensivelyin unconventional drilling as anticorrosive agents and gellingagents (www.fracfocus.org);16 however, these two alcohols canalso be produced in situ. Methanol can be produced throughthe digestion of methane by methanotrophic bacteria,35
whereas ethanol can be produced organically by thermophilicbacteria,36 albeit typically in much smaller concentrations than
was observed here. Both methanol and ethanol were found in19 wells from Denton, Parker, and Montague counties, inlocalized areas similar to the areas exhibiting high bromide.These two alcohols have been detected previously in thisregion, but at that time, no conclusions could be made abouttheir origin.3 Propargyl alcohol and isopropyl alcohol were alsodetected in 155 and 8 water wells, respectively, with maximumconcentrations of 26.4 and 9.4 mg/L, respectively. Moreover,when present together, ethanol levels were correlated withpropargyl alcohol levels (r = 0.53, p < 0.0001), but not withmethanol levels (r = −0.13, p = 0.517). The source of thesealcohols remains to be determined; however, methanol,ethanol, and propargyl alcohol were all detected at a greaterpercentage within the Barnett shale (89, 92, and 90%,respectively) than the percentage of total samples collectedwithin the producing region (83.1%). In particular, ethanol wasdetected at a higher frequency than expected in Montague,Parker, Tarrant, and Wise counties based on chi-squaredanalysis; whereas propargyl alcohol was found at a higherincidence in samples from Johnson, Parker, Tarrant and Wisecounties (Table 2). These counties comprise the mostproductive subregion of the Barnett shale; 18 559 UOG wellstimulation events were recorded here since the year 2000, andcollectively, these species constitute a specific subset ofcompounds commonly used in unconventional well stimulationper the 2011 Congressional Report on hydraulic fracturing.15
Of the four alcohol species that were detected throughout thestudy, only methanol showed a negative correlation with welldepth (r = −0.39, p = 0.034), suggesting the source of themethanol originated from the surface, as could result from themishandling of waste solutions and/or fluid spills. Thecorrelations between well depth and ethanol and propargylalcohol were not significant (p > 0.05), and there wereinsufficient detections of isopropyl alcohol to perform acorrelative analysis with well depth.Dichloromethane (DCM) was detected in 122 samples, with
121 of these detections exceeding the suggested MCL of 0.005mg/L, and 93% of the detections coming from samplescollected within the Barnett shale region. DCM had a meanconcentration of 0.08 mg/L across the data set, with amaximum concentration of 2.9 mg/L. The source of thisindustrial solvent remains to be determined; however, DCMhas been detected in a previous study of groundwater quality in
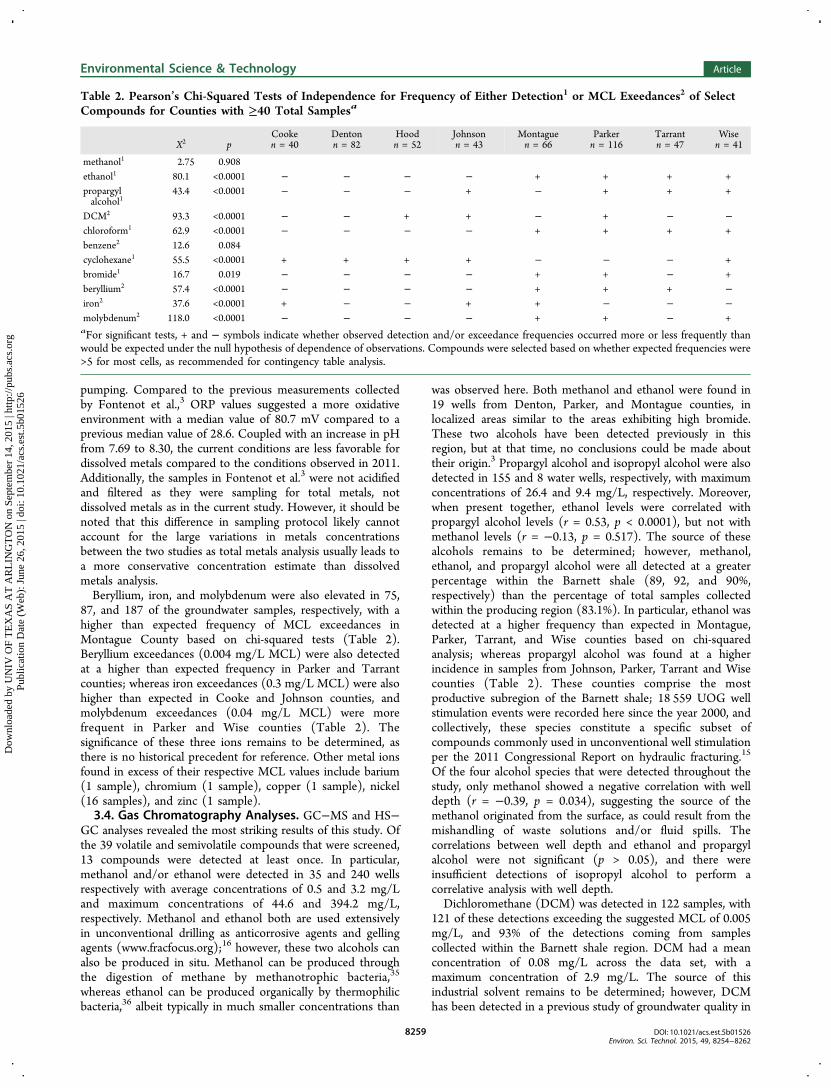
Table 2. Pearson’s Chi-Squared Tests of Independence for Frequency of Either Detection1 or MCL Exeedances2 of SelectCompounds for Counties with ≥40 Total Samplesa
X2 pCooken = 40
Dentonn = 82
Hoodn = 52
Johnsonn = 43
Montaguen = 66
Parkern = 116
Tarrantn = 47
Wisen = 41
methanol1 2.75 0.908ethanol1 80.1 <0.0001 − − − − + + + +propargylalcohol1
43.4 <0.0001 − − − + − + + +
DCM2 93.3 <0.0001 − − + + − + − −chloroform1 62.9 <0.0001 − − − − + + + +benzene2 12.6 0.084cyclohexane1 55.5 <0.0001 + + + + − − − +bromide1 16.7 0.019 − − − − + + − +beryllium2 57.4 <0.0001 − − − − + + + −iron2 37.6 <0.0001 + − − + + − − −molybdenum2 118.0 <0.0001 − − − − + + − +aFor significant tests, + and − symbols indicate whether observed detection and/or exceedance frequencies occurred more or less frequently thanwould be expected under the null hypothesis of dependence of observations. Compounds were selected based on whether expected frequencies were>5 for most cells, as recommended for contingency table analysis.
Environmental Science & Technology Article
DOI: 10.1021/acs.est.5b01526Environ. Sci. Technol. 2015, 49, 8254−8262
8259
Dow
nloa
ded
by U
NIV
OF
TE
XA
S A
T A
RL
ING
TO
N o
n Se
ptem
ber
14, 2
015
| http
://pu
bs.a
cs.o
rg
Pub
licat
ion
Dat
e (W
eb):
Jun
e 26
, 201
5 | d
oi: 1
0.10
21/a
cs.e
st.5
b015
26
the Permian Basin, a region in western Texas that has recentlyseen increased UOG activity (Hildenbrand et al., in review).DCM has also been implicated in air quality contaminationevents associated with unconventional drilling in Colorado37
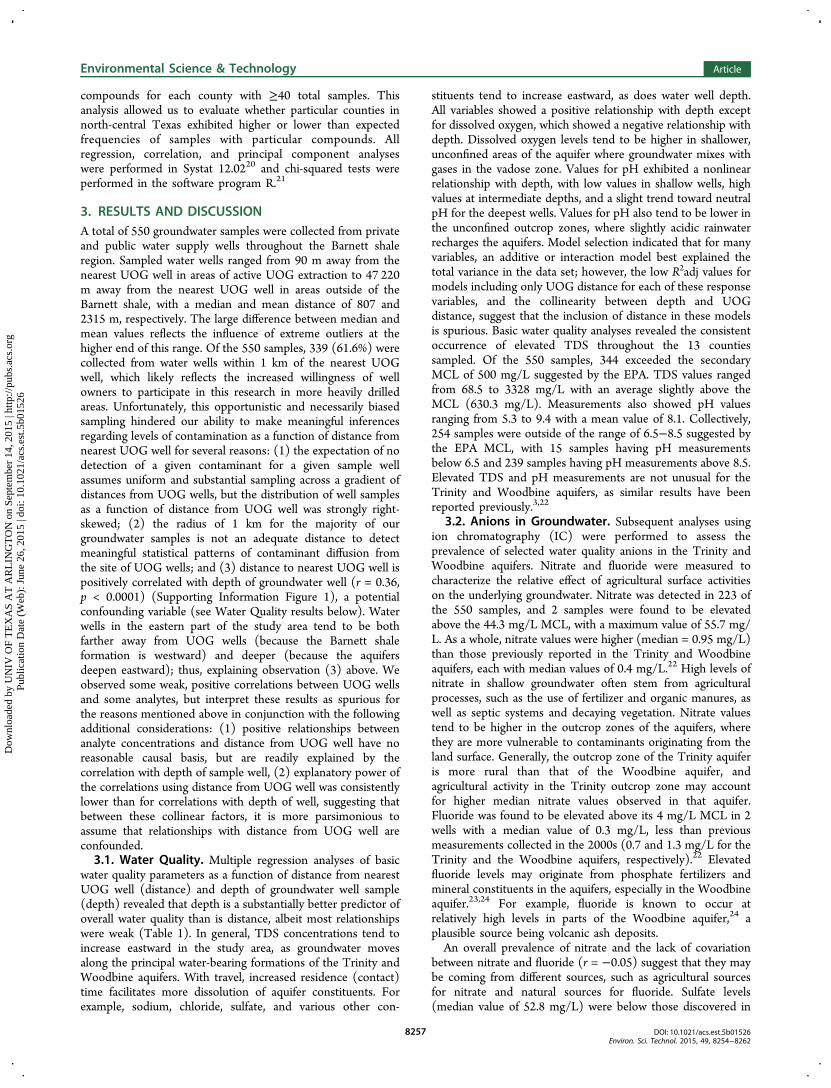
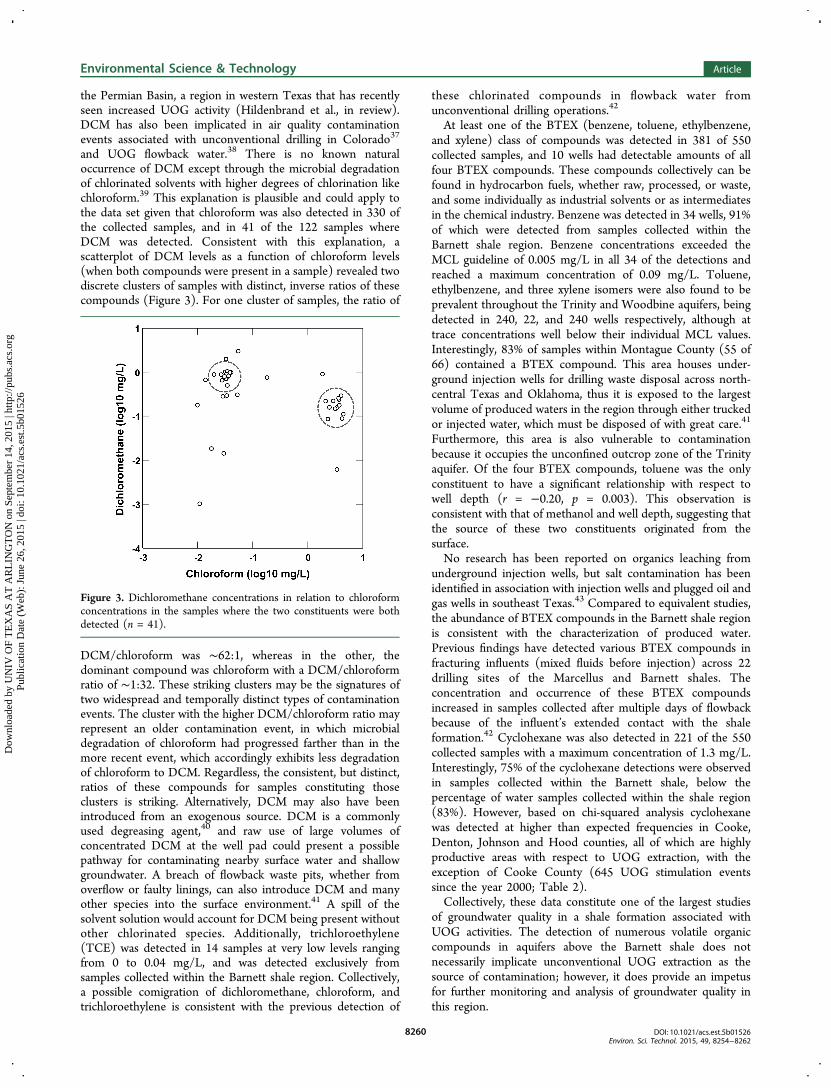
and UOG flowback water.38 There is no known naturaloccurrence of DCM except through the microbial degradationof chlorinated solvents with higher degrees of chlorination likechloroform.39 This explanation is plausible and could apply tothe data set given that chloroform was also detected in 330 ofthe collected samples, and in 41 of the 122 samples whereDCM was detected. Consistent with this explanation, ascatterplot of DCM levels as a function of chloroform levels(when both compounds were present in a sample) revealed twodiscrete clusters of samples with distinct, inverse ratios of thesecompounds (Figure 3). For one cluster of samples, the ratio of
DCM/chloroform was ∼62:1, whereas in the other, thedominant compound was chloroform with a DCM/chloroformratio of ∼1:32. These striking clusters may be the signatures oftwo widespread and temporally distinct types of contaminationevents. The cluster with the higher DCM/chloroform ratio mayrepresent an older contamination event, in which microbialdegradation of chloroform had progressed farther than in themore recent event, which accordingly exhibits less degradationof chloroform to DCM. Regardless, the consistent, but distinct,ratios of these compounds for samples constituting thoseclusters is striking. Alternatively, DCM may also have beenintroduced from an exogenous source. DCM is a commonlyused degreasing agent,40 and raw use of large volumes ofconcentrated DCM at the well pad could present a possiblepathway for contaminating nearby surface water and shallowgroundwater. A breach of flowback waste pits, whether fromoverflow or faulty linings, can also introduce DCM and manyother species into the surface environment.41 A spill of thesolvent solution would account for DCM being present withoutother chlorinated species. Additionally, trichloroethylene(TCE) was detected in 14 samples at very low levels rangingfrom 0 to 0.04 mg/L, and was detected exclusively fromsamples collected within the Barnett shale region. Collectively,a possible comigration of dichloromethane, chloroform, andtrichloroethylene is consistent with the previous detection of
these chlorinated compounds in flowback water fromunconventional drilling operations.42
At least one of the BTEX (benzene, toluene, ethylbenzene,and xylene) class of compounds was detected in 381 of 550collected samples, and 10 wells had detectable amounts of allfour BTEX compounds. These compounds collectively can befound in hydrocarbon fuels, whether raw, processed, or waste,and some individually as industrial solvents or as intermediatesin the chemical industry. Benzene was detected in 34 wells, 91%of which were detected from samples collected within theBarnett shale region. Benzene concentrations exceeded theMCL guideline of 0.005 mg/L in all 34 of the detections andreached a maximum concentration of 0.09 mg/L. Toluene,ethylbenzene, and three xylene isomers were also found to beprevalent throughout the Trinity and Woodbine aquifers, beingdetected in 240, 22, and 240 wells respectively, although attrace concentrations well below their individual MCL values.Interestingly, 83% of samples within Montague County (55 of66) contained a BTEX compound. This area houses under-ground injection wells for drilling waste disposal across north-central Texas and Oklahoma, thus it is exposed to the largestvolume of produced waters in the region through either truckedor injected water, which must be disposed of with great care.41
Furthermore, this area is also vulnerable to contaminationbecause it occupies the unconfined outcrop zone of the Trinityaquifer. Of the four BTEX compounds, toluene was the onlyconstituent to have a significant relationship with respect towell depth (r = −0.20, p = 0.003). This observation isconsistent with that of methanol and well depth, suggesting thatthe source of these two constituents originated from thesurface.No research has been reported on organics leaching from
underground injection wells, but salt contamination has beenidentified in association with injection wells and plugged oil andgas wells in southeast Texas.43 Compared to equivalent studies,the abundance of BTEX compounds in the Barnett shale regionis consistent with the characterization of produced water.Previous findings have detected various BTEX compounds infracturing influents (mixed fluids before injection) across 22drilling sites of the Marcellus and Barnett shales. Theconcentration and occurrence of these BTEX compoundsincreased in samples collected after multiple days of flowbackbecause of the influent’s extended contact with the shaleformation.42 Cyclohexane was also detected in 221 of the 550collected samples with a maximum concentration of 1.3 mg/L.Interestingly, 75% of the cyclohexane detections were observedin samples collected within the Barnett shale, below thepercentage of water samples collected within the shale region(83%). However, based on chi-squared analysis cyclohexanewas detected at higher than expected frequencies in Cooke,Denton, Johnson and Hood counties, all of which are highlyproductive areas with respect to UOG extraction, with theexception of Cooke County (645 UOG stimulation eventssince the year 2000; Table 2).Collectively, these data constitute one of the largest studies
of groundwater quality in a shale formation associated withUOG activities. The detection of numerous volatile organiccompounds in aquifers above the Barnett shale does notnecessarily implicate unconventional UOG extraction as thesource of contamination; however, it does provide an impetusfor further monitoring and analysis of groundwater quality inthis region.
Figure 3. Dichloromethane concentrations in relation to chloroformconcentrations in the samples where the two constituents were bothdetected (n = 41).
Environmental Science & Technology Article
DOI: 10.1021/acs.est.5b01526Environ. Sci. Technol. 2015, 49, 8254−8262
8260
Dow
nloa
ded
by U
NIV
OF
TE
XA
S A
T A
RL
ING
TO
N o
n Se
ptem
ber
14, 2
015
| http
://pu
bs.a
cs.o
rg
Pub
licat
ion
Dat
e (W
eb):
Jun
e 26
, 201
5 | d
oi: 1
0.10
21/a
cs.e
st.5
b015
26
■ ASSOCIATED CONTENT*S Supporting InformationAdditional materials and methods, figures, tables, and thecomplete water quality data set referenced in the text. TheSupporting Information is available free of charge on the ACSPublications website at DOI: 10.1021/acs.est.5b01526.
■ AUTHOR INFORMATIONCorresponding Authors*(Z.L.H.) Phone: 915-694-7132; e-mail: [email protected].*(K.A.S.) Phone: 817-272-3541; e-mail: [email protected] Address◆(B.E.F.) Water Quality Protection Division, United StatesEnvironmental Protection Agency, Dallas, Texas 75202, UnitedStatesAuthor ContributionsZ.L.H., D.D.C., B.E.F., and J.M.M. contributed equally to thiswork. Z.L.H., D.D.C., B.E.F., J.M.M., C.P.S., and K.A.S.designed research; Z.L.H., D.D.C., J.T.T., and C.E.R. recruitedvolunteer study participants and collected samples; S.K., C.P.S.,D.J.H., A.F.K., C.E.R., J.B.T., B.E.F., J.M.M., P.H., and J.L.W.conducted analytical chemistry analyses, hydrogeology descrip-tions, geospatial analyses, statistical analyses, and performedquality checks and verification of all data collected; B.E.F.,J.M.M., Z.L.H., D.D.C., and J.L.W. analyzed data and providedconclusions for statistical analyses and geospatial relationships;T.B. and H.R. analyzed UOG drilling localities and commonindustrial practices; A.F.K., C.P.S., P.H., T.B., H.R., C.E.R., andJ.L.W. provided comments, conclusions, and corrections onearlier versions of the manuscript; Z.L.H., B.E.F., D.D.C.,J.M.M., P.H., and K.A.S wrote the paper.NotesThis work is not a product of the United States Government orthe United States Environmental Protection Agency, and theauthors did not do this work in any governmental capacity. Theviews expressed are those of the authors only and do notnecessarily represent those of the United States or the UnitedStates Environmental Protection Agency.The authors declare no competing financial interest.
■ ACKNOWLEDGMENTSWe thank the Shimadzu Institute for Research Technologies atThe University of Texas at Arlington for research funds andinstrumentation used in this study. We thank GeotechEnvironmental Equipment of Carrolton, Texas, for their helpfulguidance with basic water quality measurements. We also thankall of the participating well owners for their contribution to thisresearch, and to Drs. J.P. Nicot and Purnendu Dasgupta for allof their support and comments on earlier versions of thismanuscript.
■ REFERENCES(1) Jackson, R. B.; Vengosh, A.; Darrah, T. H.; Warner, N. R.; Down,A.; Poreda, R. J.; Osborn, S. G.; Zhao, K.; Karr, J. D. Increased straygas abundance in a subset of drinking water wells near Marcellus shalegas extraction. Proc. Natl. Acad. Sci. U.S.A. 2013, 110 (28), 11250−5.(2) Osborn, S. G.; Vengosh, A.; Warner, N. R.; Jackson, R. B.Methane contamination of drinking water accompanying gas-welldrilling and hydraulic fracturing. Proc. Natl. Acad. Sci. U.S.A. 2011, 108(20), 8172−6.(3) Fontenot, B. E.; Hunt, L. R.; Hildenbrand, Z. L.; Carlton, D. D.,Jr.; Oka, H.; Walton, J. L.; Hopkins, D.; Osorio, A.; Bjorndal, B.; Hu,Q. H.; Schug, K. A. An evaluation of water quality in private drinking
water wells near natural gas extraction sites in the barnett shaleformation. Environ. Sci. Technol. 2013, 47 (17), 10032−40.(4) Vidic, R. D.; Brantley, S. L.; Vandenbossche, J. M.; Yoxtheimer,D.; Abad, J. D. Impact of shale gas development on regional waterquality. Science 2013, 340 (6134), 1235009.(5) Ingraffea, A. R.; Wells, M. T.; Santoro, R. L.; Shonkoff, S. B.Assessment and risk analysis of casing and cement impairment in oiland gas wells in Pennsylvania, 2000−2012. Proc. Natl. Acad. Sci. U.S.A.2014, 111 (30), 10955−60.(6) Saiers, J. E.; Barth, E. Potential contaminant pathways fromhydraulically fractured shale aquifers. Groundwater 2012, 50 (6), 826−8 discussion 828−30..(7) Darrah, T. H.; Vengosh, A.; Jackson, R. B.; Warner, N. R.;Poreda, R. J. Noble gases identify the mechanisms of fugitive gascontamination in drinking-water wells overlying the Marcellus andBarnett Shales. Proc. Natl. Acad. Sci. U.S.A. 2014, 111 (39), 14076−81.(8) Assessment of the Potential Impacts of Hydraulic Fracturing for Oiland Gas on Drinking Water Resources; Environmental ProtectionAgency: Washington, DC, May 2015.(9) Reedy, R. C.; Scanlon, B. R.; Walden, S.; Strassberg. G. NaturallyOccurring Groundwater Contamination in Texas; Texas Water Develop-ment Board, 2011.(10) Peckman, R. C.; Sounders, V. I.; Dillard, J. W.; Baker, B.Reconnaissance Investigation of the Ground-Water Resources of the TrinityRiver Basin, Texas; Texas Water Commission: Austin, TX, 1963.(11) Ground-Water Quality of Texas: An Overview of Natural andMan-Affected Conditions; Texas Water Commission, 1989.(12) Rapp, K. B. Groundwater recharge in the Trinity aquifer,Central Texas. Baylor Geol. Stud., Bull. 1988, 46, 1−34.(13) Baker, B.; Duffin, G.; Flores, R.; Lynch, T. Evaluation of WaterResources in Part of Central Texas; Texas Water Development Board:Austin, TX, 1990.(14) Sampling Guidance for Unknown Contaminants in DrinkingWater; Environmental Protection Agency: Washington, DC, 2008.(15) Chemicals Used in Hydraulic Fracturing; United States House ofRepresentative Committee on Energy and Commerce: Washington,DC, 2011.(16) FracFocus. Chemical Disclosure Registry. http://fracfocus.org(accessed July 9, 2014).(17) 2012 ed. of the Drinking Water Standards and Health Advisories;Environmental Protection Agency: Washington, DC, 2012.(18) Railroad Commission of Texas. http://www.rrc.state.tx.us(accessed April 12, 2014).(19) ArcGIS Desktop 10.1, Environmental Systems Research Institute:Redlands, CA.(20) Systat, Version 12.02, Cranes Software International: San Jose,CA.(21) Team, R. C. R: A Language and Environment for StatisticalComputing; R Foundation for Statistical Computing, 2014.(22) Chaudhuri, S.; Ale, S. Characterization of groundwater resourcesin the Trinity and Woodbine aquifers in Texas. Sci. Tot. Environ. 2013,452−453, 333−48.(23) Brindha, K.; Rajesh, R.; Murugan, R.; Elango, L. Fluoridecontamination in groundwater in parts of Nalgonda District, AndhraPradesh, India. Enviro. Monit. Assess. 2011, 172 (1−4), 481−92.(24) Nolan, B. T.; Hitt, K. J.; Ruddy, B. C. Probability of nitratecontamination of recently recharged groundwaters in the contermi-nous United States. Environ. Sci. Technol. 2002, 36 (10), 2138−45.(25) Warner, N. R.; Christie, C. A.; Jackson, R. B.; Vengosh, A.Impacts of shale gas wastewater disposal on water quality in westernPennsylvania. Environ. Sci. Technol. 2013, 47 (20), 11849−11857/.(26) Hudak, P. F. Solutes and Potential Sources in a Portion of theTrinity aquifer, Texas, USA. Carbonates Evaporites 2010, 25 (1), 15−20.(27) Hudak, P. F. Lane use and groundwater quality in the TrinityGroup outcrop of North-Central Texas, USA. Environ. Int. 1997, 23(4), 507−517.(28) Katz, B. G.; Eberts, S. M.; Kauffman, L. J. Using Cl/Br ratios andother indicators to assess potential impacts on graoundwater quality
Environmental Science & Technology Article
DOI: 10.1021/acs.est.5b01526Environ. Sci. Technol. 2015, 49, 8254−8262
8261
Dow
nloa
ded
by U
NIV
OF
TE
XA
S A
T A
RL
ING
TO
N o
n Se
ptem
ber
14, 2
015
| http
://pu
bs.a
cs.o
rg
Pub
licat
ion
Dat
e (W
eb):
Jun
e 26
, 201
5 | d
oi: 1
0.10
21/a
cs.e
st.5
b015
26
from septics systems: A review and examples from principal aquifers inthe United States. J. Hydrol. 2011, 397 (3), 151−166.(29) Whittemore, D. O. Geochemical differentiation of oil and gasbrine from other saltwater sources contamination water resources:Case studies in Kansas and Oklahoma. Environ. Geosci. 1995, 2 (1),15−31.(30) Davis, S. N.; Whittemore, D. O.; Fabryka-Martin, J. Uses ofchloride/bromide ratios in studies of potable water. Groundwater1998, 36 (2), 338−350.(31) Richter, B. C.; Kreitler, C. W. Geochemical Techniques forIdentifying Sources of Ground-Water Salinization, 1st ed.; CRC Press,1993.(32) Flury, M.; Papritz, A. Bromide in the natural environment:Occurrence and toxicity. J. Environ. Qual. 1993, 22 (4), 747−758.(33) Vengosh, A.; Pankratov, I. Chloride/bromide and chloride/fluoride rations of domestic sewage effluents and associatedcontaminated ground water. Groundwater 1998, 36 (5), 815−824.(34) Railroad Commssion of Texas. Barnett Shale drilling permitsi s s u e d . h t t p : / / www . r r c . s t a t e . t x . u s /m e d i a / 1 4 4 8 2 /barnettshaledrillingpermitsissued.pdf (accessed March 12, 2014),.(35) Corder, R. E.; Johnson, E. R.; Vega, J. L.; Clausen, E. C.; Gaddy,J. L. Biological Production of Methanol from Methane. 1986. https://web.anl.gov/PCS/acsfuel/preprint%20archive/Files/33_3_LOS%20ANGELES_09-88_0469.pdf.(36) Taylor, M. P.; Eley, K. L.; Martin, S.; Tuffin, M. I.; Burton, S. G.;Cowan, D. A. Thermophilic ethanologenesis: Future prospects forsecond-generation bioethanol production. Trends Biotechnol. 2009, 27(7), 398−405.(37) Colborn, T.; S, K.; Herrick, L.; Kwiatkowski. An exploratorystudy of air quality near natural gas operations. Hum. Ecol. Risk Assess.2014, 20 (1), 86−105.(38) Maguire-Boyle, S. J.; Barron, A. R. Organic compounds inproduced waters from shale gas wells. Environ. Sci.: Processes Impacts2014, 16 (10), 2237−48.(39) Cappelletti, M.; Frascari, D.; Zannoni, D.; Fedi, S. Microbialdegradation of chloroform. Appl. Microbiol. Biotechnol. 2012, 96 (6),1395−409.(40) Dichloromethane in drinking-water. In Guidelines for Drinking-Water Quality, 2nd ed.; World Health Organization: Geneva, 1996;Vol. 2.(41) Vengosh, A.; Jackson, R. B.; Warner, N.; Darrah, T. H.;Kondash, A. A critical review of the risks to water resources fromunconventional shale gas development and hydraulic fracturing in theUnited States. Environ. Sci. Technol. 2014, 48 (15), 8334−48.(42) Hayes, T. D.; Severin, B. F. Characterization of Flowback Watersfrom the Marcellus and Barnett; Gas Technology Institute: Des Plaines,IL, 2012.(43) Hudak, P. F.; Wachal, D. J. Effects of brine injection wells, dryholes, and plugged oil/gas wells on chloride, bromide, and bariumconcentrations in the Gulf Coast Aquifer, southeast Texas, USA.Environ. Int. 2001, 26 (7−8), 497−503.
Environmental Science & Technology Article
DOI: 10.1021/acs.est.5b01526Environ. Sci. Technol. 2015, 49, 8254−8262
8262
Dow
nloa
ded
by U
NIV
OF
TE
XA
S A
T A
RL
ING
TO
N o
n Se
ptem
ber
14, 2
015
| http
://pu
bs.a
cs.o
rg
Pub
licat
ion
Dat
e (W
eb):
Jun
e 26
, 201
5 | d
oi: 1
0.10
21/a
cs.e
st.5
b015
26


![[E d i t o r i al]](https://img.pdfslide.fr/doc/110x75/62b138711de08d53e751fe79/e-d-i-t-o-r-i-al.jpg)