Embed Size (px)
Citation preview
© 2018 The Author | IJEFBM 2018 © 2018 FLE Learning
CONTENTS
4 FOREIGN AID VOLATILITY AND ECONOMIC GROWTH: A CASE STUDY OF PAKISTAN
Sadia Mansoor, Mirza Aqeel Baig and Muhammad Javid
14 CURATING THE CROWD – TOWARDS A TYPOLOGY OF VALUE-CREATING ONLINE COMMUNITY
INTERACTIONS.
Michael Rowe, John Douglas Thomson and Marta Poblet
25 SME MARKETING MIX STANDARDISATION IN THE B2B MARKET
Juergen Wieland
36 DO ORGANIZATIONAL CULTURE AND STRUCTURE ENHANCE INTERNAL CONTROL
EFFECTIVENESS? EVIDENCE FROM MALAYSIAN SOCIAL COOPERATIVES
Nur Aima Shafie, Marlia Othman, Abd Halim Mohd Noor, Zuraidah Mohd Sanusi and Razana Juhaida
Johari
48 THE JOINT INFLUENCE OF RELATIONSHIP MARKETING, SOCIAL PERFORMANCE MANAGEMENT
AND FIRM CHARACTERISTICS ON CUSTOMER RETENTION BY MICRO-FINANCE INSTITUTIONS
IN KENYA
Stella Nyongesa, Prof Francis Kibera and Prof Ruth Kiraka
59 THE DETERMINANTS OF EMERGING AND DEVELOPED MARKET MNE OUTWARD FDI: A
COMPARATIVE ANALYSIS OF MALAYSIAN AND SINGAPOREAN MNES
Norlia Mohd Zain
71 ROLE OF GOVERNANCE, RISK AND COMPLIANCE ON SUCCESSFUL PORTFOLIO PROJECT
MANAGEMENT
Saif Saeed Alqubaisi
APRIL 2018
International Journal of Economics,
Finance and Business Management Studies VOLUME 4 ISSUE 1 ISBN: 978-1-911185-80-2 (Online) ISSN: 2397-6926 (Online)
FLE
FLE
Learning
Learning
International Journal of Economics, Finance and Business Management Studies | 2
VOLUME 4 ISSUE 1 ISBN: 978-1-911185-80-2 (Online) ISSN: 2397-6926 (Online) www.flepublications.com
CONTENTS
4 FOREIGN AID VOLATILITY AND ECONOMIC GROWTH: A CASE STUDY OF
PAKISTAN
Sadia Mansoor, Mirza Aqeel Baig and Muhammad Javid
14 CURATING THE CROWD – TOWARDS A TYPOLOGY OF VALUE-CREATING
ONLINE COMMUNITY INTERACTIONS.
Michael Rowe, John Douglas Thomson and Marta Poblet
25 SME MARKETING MIX STANDARDISATION IN THE B2B MARKET
Juergen Wieland
36 DO ORGANIZATIONAL CULTURE AND STRUCTURE ENHANCE INTERNAL
CONTROL EFFECTIVENESS? EVIDENCE FROM MALAYSIAN SOCIAL
COOPERATIVES
Nur Aima Shafie, Marlia Othman, Abd Halim Mohd Noor, Zuraidah Mohd
Sanusi and Razana Juhaida Johari
48 THE JOINT INFLUENCE OF RELATIONSHIP MARKETING, SOCIAL
PERFORMANCE MANAGEMENT AND FIRM CHARACTERISTICS ON
CUSTOMER RETENTION BY MICRO-FINANCE INSTITUTIONS IN KENYA
Stella Nyongesa, Prof Francis Kibera and Prof Ruth Kiraka
59 THE DETERMINANTS OF EMERGING AND DEVELOPED MARKET MNE
OUTWARD FDI: A COMPARATIVE ANALYSIS OF MALAYSIAN AND
SINGAPOREAN MNES
Norlia Mohd Zain
71 ROLE OF GOVERNANCE, RISK AND COMPLIANCE ON SUCCESSFUL
PORTFOLIO PROJECT MANAGEMENT
Saif Saeed Alqubaisi
APRIL 2018
International Journal of Economics,
Finance and Business Management Studies
VOLUME 4 ISSUE 1 ISSN: 2397-6926 (Online)
International Journal of Economics, Finance and Business Management Studies| 3
© 2018 The Author | IJEFBM 2018 © 2018 FLE Learning
General Editor
Dr. Ramandeep Kaur Chhina
Associate Editor(s):
Prof. Dr. Abdul Ghafur Hamid
Dr Avnita Lakhani
Dr Monika WIECZOREK-KOSMALA
Dr. Bashar Malkawi
Dr. Indianna Minto-Coy
Dr. Jamil Ammar
Dr. Nitin Upadhyay
Dr. Poomintr Sooksripaisarnkit
Dr. Rajesh Sharma
Dr. Zhixiong Liao
Dr. Zinatul Zainol
Ms. Florence Simbiri-Jaoko
Ms. Mercy Khaute
Prof. Tshepo Herbert Mongalo
Dr. Joanna Błach
Miss. Kate Masih
Format for citing papers
This journal may be cited as (2018) 4(1) IJEFBM
000
Author surname, initial(s), Title of paper (2018)
International Journal of Economics, Finance and
Business Management Studies pp.
Disclaimer
Whilst every effort has been made to ensure that
the information contained in this publication is
correct, neither the editors and contributors nor
FLE Learning accept any responsibility for any
errors or omissions, quality, accuracy and currency
of the information, nor any consequences that may
result. FLE Learning takes no responsibility for the
accuracy of URLs of external websites given in this
publication nor for the accuracy or relevance of
their content. The opinions, advices and
information contained in this publication do not
necessarily reflect the views or policies of the FLE
Learning.
Copyright © 2018 FLE Learning Ltd
All rights reserved. No part of this publication may
be reproduced or transmitted in any form, or by any
means, or stored in any retrieval system of any
nature without the prior permission of the
publishers.
Permited fair dealing under the Copyright, Designs
and Patents Act 1988, or in accordance with the
terms of a licence issued by the Copyright
Licensing Agency in respect of photocopying
and/or reprographic reproduction is excepted.
Any application for permission for other use of
copyright material including permission to
reproduce extracts in other published works must
be made to the publishers and in the event of such
permission being granted full acknowledgement of
author, publisher and source must be given.
IJEFBM © 2018 FLE Learning Ltd
ISSN: 2397-6926 (Online)
ISBN: 978-1-911185-80-2 (Online)
This E-journal is published by FLE Learning Ltd
(trading as FLE Learning) in Livingston, United
Kingdom.
Annual Subscription £150.00
E-copies of articles from International Journal of
Economics, Finance and Business Management
Studies can be obtained from FLE Learning.
Current Rates are : £50.00 per article
Subscription and all editorial correspondance
FLE Learning Ltd
T: 0044 131 463 7007
F: 0044 131 608 0239
W: www.flelearning.co.uk
APRIL 2018
International Journal of Economics,
Finance and Business Management Studies
VOLUME 4 ISSUE 1 ISSN: 2397-6926 (Online)
International Journal of Economics, Finance and Business Management Studies | SADIA MANSOOR | 4
VOLUME 4 ISSUE 1 ISBN: 978-1-911185-80-2 (Online) ISSN: 2397-6926 (Online) www.flepublications.com
1.03-AQ27-4923
FOREIGN AID VOLATILITY AND ECONOMIC GROWTH: A CASE
STUDY OF PAKISTAN
SADIA MANSOOR1, MIRZA AQEEL BAIG2 AND MUHAMMAD JAVID3
ABSTRACT
While the debate on the effectiveness of foreign aid remains inconclusive, recent literature
has focused on exploring the possible causes that render such an ineffective. Among others,
the volatility in aid inflows is cited as one of the reasons for aid ineffectiveness. Historically,
Pakistan has been one of the major aid recipient countries, but it still lags behind in terms of
economic development. By analysing the period 1972-2015, we explored the role of aid
volatility in explaining economic growth in the case of Pakistan. By developing an index for
macroeconomic policy environment, we also investigate the role of prevailing
macroeconomic conditions in aid effectiveness. We employed the Generalised Method of
Moments (GMM) for estimation because of its advantage in handling the endogeneity of
foreign aid. After controlling for traditional determinants of economic growth, our results
show that both foreign aid and its volatility are negatively related to economic growth in case
of Pakistan. However, we have found that a favourable policy environment results in an
increase in foreign aid effectiveness.
Key Words: Foreign Aid, Volatility, Macroeconomic Policy Index, Economic Growth,
Generalised Method of Moments, Endogeneity.
INTRODUCTION
The early post-Keynesian model of Harrod and Domar (1954) explains economic growth
through developing its relationship with capital stock and the rate of savings. A major
corollary of the Harrod–Domar model was that increase in domestic capital stock helps boost
economic performance. This capital accumulation in turns depends on the stock of national
savings available for investment.
Cheneray and Strout (1966) extend the work of Harrod and Domar through developing
an internal-external gaps model, which is often cited as the theoretical foundation of foreign
aid. The internal gap refers to disequilibrium between saving and investment, while the
external gap refers to trade deficit. The model highlights the importance of low domestic
savings or loanable funds. In case of low investments, the economy will also be short of
exportable surplus of goods. The economy, as a result, gets stuck is a vicious circle and can
only be brought out of it through the help of foreign aid.
Like other developing countries, Pakistan is no exception to a low saving rate. The
saving–investment gap has remained largely negative in the case of Pakistan. On average,
this gap has represented 2.4% of GDP from 1980 to 2015. According to the World Bank
database, the average gross national savings (as a percentage of GDP) is 31.4% for
developing countries and 14.5% in the case of Pakistan. As a result, Pakistan’s economy has
been heavily relying on foreign assistance to increase capital stock. For instance, the official
development assistance (ODA)4 was 41.5% of gross capital formation 1972-2015 for
Pakistan, compared with 32% in developing countries.
1 Sadia Mansoor , also known as Sadia Anwar, Senior Lecturer, Institute of Business Management, Karachi, Pakistan. E-
mail:- [email protected]. 2 Assistant Professor, Department of Economics. Institute of Business Management, Karachi, Pakistan.
E-mail:- [email protected]. 3 Research Analyst, Pakistan institute of Development Economics, Islamabad., Pakistan. E-mail:- [email protected]. 4According to the World Bank, “Net official development assistance (ODA), consists of disbursements of loans made on
concessional terms (net of repayments of principal) and grants by official agencies of the members of the Development
International Journal of Economics, Finance and Business Management Studies| 5
© 2018 The Author | IJEFBM 2018 © 2018 FLE Learning
THE DYNAMICS OF FOREIGN AID INFLOWS IN PAKISTAN
Pakistan has received different types of ODA. Between 1972 and 2009, Pakistan received
US $61.8 billion, out of which US $38.7 billion (53%) was project support aid. In times of
natural disasters (i.e. floods, earthquakes and drought), Pakistan received US $6.5 billion
(10%) and US $11.5 billion for balance of payment adjustments.
Foreign aid inflows have been quite volatile in case of Pakistan. Unlike other aid-
dependent countries, Pakistan’s aid inflows are dependent on geopolitical factors and military
considerations. Most of the aid Pakistan received was from a bilateral source, mainly from
the US.5The US bilateral aid to Pakistan started in 1951 and aid inflows have been volatile
and independent of economic needs of Pakistan. For instance, in the early 1960s, Pakistan
received almost US $400 million per year, but the first hiccup occurred after the India–
Pakistan war (a geopolitical factor) in 1965, when the US suspended aid to Pakistan. Aid
inflows during the 1960s and 1970s were a result of Pakistan’s mutual defence assistance
agreement with the US in the pre-Cold War era. Similarly, aid inflows during the 1980s can
be contextualised by the outlook of the Afghanistan war.
The US imposed “democracy sanctions” and cut foreign aid transfers to Pakistan as a
result of nuclear test confirmation in 1998 and military takeover in 1999. However, after
9/11, Pakistan joined a war coalition against terrorism and received the highest average
annual aid of approximately US $3 billion during 2010-2014. The majority of the funds were
under the heading of reimbursement of the cost of military coalition support in the war
against terror. During the war on terror (2010-14), the US promised US $7.5 billion in aid to
Pakistan, but only half of this was actually disbursed (EADP, 2015).6 These stylised facts
show that aid inflows have been volatile in Pakistan due to geographical issues and coalition
involvement.
The objective of this study is to empirically investigate the impact of foreign aid and its
volatility on economic growth of Pakistan. We have also explored the role of sound
macroeconomic policies in explaining aid effectiveness. For this purpose, we have
constructed macroeconomic policy index by following Burnside and Dollar (2000). The
organisation of this paper is as follows. Section 2 provides a literature review on the aid–
growth nexus, as well as on the impacts of volatile aid inflows on economic growth. In
Section 3, we discuss the construction of the macroeconomic policy index and the
econometric model. This is followed by the last section, which presents our results and
discussion along with policy recommendations.
LITERATURE REVIEW
An ample literature is available on foreign aid and growth relationship. This section provides
a brief review of available literature on foreign aid, volatility of foreign aid, and their
relationship with economic growth.
LITERATURE ON THE AID–GROWTH NEXUS
The literature on foreign aid can broadly be divided into three stands. The first strand
maintains that foreign aid has significantly positive impact on economic growth and
development. According to Rosenstein-Rodan (1961), foreign aid contributes towards
increases investment. Chenerey and Strout (1966) also support positive contribution of aid to
GDP growth and present theoretical framework in their “two gap” model. Papanek (1973)
Assistance Committee (DAC), by multilateral institutions, and by non-DAC countries to promote economic development
and welfare in countries and territories in the DAC list of ODA recipients.” 5 Anwar and Michaelowa (2004) calculated that more than 72 percent ODA to Pakistan comes from bilateral sources, and
out of that nearly half the aid was provided by a single donor (i.e., the US). 6 Source: Economic Affair Division Pakistan: Annual Status Report 2015.
International Journal of Economics, Finance and Business Management Studies | SADIA MANSOOR | 6
VOLUME 4 ISSUE 1 ISBN: 978-1-911185-80-2 (Online) ISSN: 2397-6926 (Online) www.flepublications.com
also finds positive impact of aid inflows on economic performance in 23 developing
countries. Levy (1988) states that foreign aid inflows accelerated investments in African
countries. In the case of Pakistan, Chishti and Hasan (1992) find a positive impact of foreign
grants on economic performance. Similar conclusions have been drawn by Irving and Abbas
(2005), Shabbir et al. (1992) and Khan et al. (1992).
In contrast, some studies deviate from the positive effects of foreign aid and affirm a
negative impact of aid inflows on economic growth and development. This strand was
initiated by Friedman (1958), who argued that dependency on foreign aid decreases the
potential of governments to achieve self-sustainability. Griffen and Enos (1970) empirically
establish the negative impact of aid on 27 aid-dependent economies. According to Baure
(1979), “Aid is a phenomenon whereby poor people in rich countries are taxed to support the
lifestyles of rich people in poor countries.” Likewise, Mosley (1980) confirms the negative
aid–growth relationship and states that corruption and misallocation of foreign aid inflows
hurt economic growth. Similarly, Hadijmichael et al. (1995), Boone (1996) and Alesina and
Weder (2002) affirm that aid inflow does not reduce poverty or increase economic growth,
but increases dependency and corruption. Rajan and Subramanian (2005) argues that aid
inflows are unfavourable for private sector investment. Sabra and Eltalla (2016) conclude that
higher aid inflows accelerate imports and do not foster investment to attain economic growth
in Arab countries. Recently, Sabra and Sartawi (2015) attribute aid as hindering factor to
economic growth in Palestine by crowding out savings.
In the case of Pakistan, Naqvi (1971) concludes that aid inflows erode domestic
savings. Aslam (1987) and Kemal (1992) also share this viewpoint. Iqbal (1997) suggests that
aid inflows increase public consumption and do not foster economic growth. Khan and
Ahmad (1997, 2007) maintain aid is a curse for Pakistan’s economy and show that aid
inflows boost non-developmental expenditures rather than promoting economic growth.
The third strand of literature highlights the role of the macroeconomic policy
environment of the aid recipient country in the analysis of the aid effectiveness framework.
Burnside and Dollar (1997, 2000) construct a macroeconomic policy index and state that aid
can be effective in the presence of a sound macroeconomic policy environment. The main
argument of this strand is that aid effectiveness is conditional on the policy environment.
Collier and Dollar (2001, 2002) add that, along with good policies, the geographical location
and allocation of aid to specific sectors are favourable factors for attaining positive outcomes
of foreign aid.
Javid and Qayyum (2011) follow Burnside and Dollar (1997) in constructing a
macroeconomic policy index for Pakistan, concluding that aid fosters economic growth in the
presence of a low budget deficit, positive trade balance and low inflation. Although it appears
convincing that aid will be more effective in the presence of favourable policies, Durbarry et
al. (1998) empirically find aid to be effective irrespective of the policy environment.
Similarly, Hansen and Trap (1999) analyse 131 countries and conclude that aid is effective
even in countries with a bad policy environment.
EMPIRICAL LITERATURE ON FOREIGN AID VOLATILITY AND ECONOMIC
GROWTH
There are several reasons why volatility in aid inflows negatively affects economic growth.
First, volatile inflows can result in delay or even suspension in the execution of planned
developmental projects. Second, if aid has a humanitarian objective, then volatile aid can
force the recipient government to utilise its own resources that had been planned for other
purposes. At the same time, it reduces the confidence of the recipient government and the
private sector on the donor agency’s future commitment. Volatility in aid inflows can also
induce leakages in already received aid flows.
International Journal of Economics, Finance and Business Management Studies| 7
© 2018 The Author | IJEFBM 2018 © 2018 FLE Learning
Lensink and Morrissey (2000) attribute volatility in aid inflows as a root cause for
ineffectiveness in economic growth. Bulir and Hamann (2003) point out that volatility causes
project suspension. Similarly, Hudson and Mosely (2008) state that volatility in aid inflows
increases uncertainty and prolong ongoing aid-dependent projects. Neanidis and Varvarigos
(2009) and Markandya et al. (2010) support unfavourable outcomes of volatile aid inflows.
The volatility in aid inflows not just hampers the economic growth of the recipient country,
but also has implications for other sectors of the economy. By studying 73 aid-dependent
countries, Arellano et al. (2009) find that volatility of aid cause disruptions in exports-related
manufacturing products. They conclude that an abrupt increase in aid inflows results in
increasing public expenditures, while their sharp fall force recipient governments to cut their
developmental spending.
MODEL, METHODOLOGY AND DATA
This chapter presents model specifications and econometric methodology. The foundation of
aid-growth model is based on the landmark study of Chenery and Strout (1966), who present
a two-gap model. In the case of low domestic savings, we have incorporated foreign aid as an
external financial resource to fill the savings–investment gap in Pakistan. Our model is based
on the production function, where the real GDP (Y) is dependent on inputs and other
explanatory variables:
𝑌 = 𝑓 (𝐿, 𝐾, 𝑇𝑂, 𝑂𝐷𝐴, 𝐹𝐷𝐼, 𝑃𝑜𝑙, ∈) ------- Eq (3.1)
where GDP is dependent on the labour force (L), gross fixed capital formation (K) and trade
openness (TO). Moreover, foreign inflows are split into two sets to fill the savings–
investment gap, foreign aid (ODA) and foreign direct investment (FDI). Economic policies
(Pol) play pivotal role is economic growth so we have added macroeconomic policies in our
model. Lastly, the ∈ is a normally distributed random error term.
CONSTRUCTION OF THE INDEX
The theoretical foundation for the formulation of the policy index is based on Fischer (1993),
and the methodological structure is based on work by Burnside and Dollar (2000). The
objective of the index is to explore the impact of the existing policy environment on aid’s
contribution to economic growth. We have extended the macroeconomic policy index for
Pakistan, previously constructed by Javid and Qayyum (2011). Like Burnside and Dollar
(2000), Javid and Qayyum (2011) constructed the index by using three variables: inflation
rate, budget balance and trade openness. We have extended this index by adding money
supply to the GDP ratio to represent financial development.
The relationship between macroeconomic policies and economic growth is well
established in the literature. A generous literature is available on the well-framed theoretical
relationship of inflation, twin deficit and money supply with economic growth (see, Fisher,
1993; Parkin, 1986; Dollar, 1992). As an extension to Burnside and Dollar’s (2000)
macroeconomic policy index, we have added money supply to the GDP ratio as an indicator
for financial development. We have employed the principal component method to construct
the index. The first component of the principal component method explains the maximum
variations of the data, while the second and third components explain the remaining
variations. We derive the weights of included variables through the first principal component,
as it represents the highest correlation. Finally, we get the weights through normalising the
values of vector 1. The policy index used in our analysis is based on the following equation:
𝑃𝑜𝑙𝑖𝑐𝑦𝐼𝑛𝑑𝑒𝑥 = −1 (𝐼𝑛𝑓𝑙𝑎𝑡𝑖𝑜𝑛) + 2 (𝑏𝑢𝑑𝑔𝑒𝑡𝑏𝑎𝑙𝑎𝑛𝑐𝑒
𝐺𝐷𝑃) + 3 (𝑇𝑟𝑎𝑑𝑒𝑂𝑝𝑒𝑛𝑛𝑒𝑠𝑠)
+ 4 (𝑚𝑜𝑛𝑒𝑦𝑠𝑢𝑝𝑝𝑙𝑦
𝐺𝐷𝑃)
International Journal of Economics, Finance and Business Management Studies | SADIA MANSOOR | 8
VOLUME 4 ISSUE 1 ISBN: 978-1-911185-80-2 (Online) ISSN: 2397-6926 (Online) www.flepublications.com
where 1,2 ,3 𝑎𝑛𝑑 4are the weights of first component and the estimated weights are
1.097, 0.726, 1.066 and 0.437 respectively.
We have followed Bulir and Hamann (2003) and Hudson and Mosley (2008) for
estimation of foreign aid volatility, and used a Hodrick–Prescott (HP) filter.
ECONOMETRIC METHODOLOGY
Hansen (1982) developed the Generalised Method of Moments (GMM) model, which is
actually a generalised approach to the method of moments presented by Karl Pearson (1894).
Due to its several advantages, GMM has been widely used for estimations in economics and
finance. The major advantage of GMM is that it does not require complete knowledge of the
underlying data generating process. In contrast to Maximum Likelihood Estimation (MLE),
GMM estimation requires specified moments derived from an underlying model.
GMM is particularly useful in estimating the impact of growth volatility in economic
growth because of the potential endogeneity of aid. There are various sources of endogeneity
in the relationship between aid and economic growth. It is argued that foreign aid is
endogenous to growth since donors allocate aid purposively and are likely to react to
recipient countries’ growth performance. The methodology of GMM comes in handy in this
case because it addresses the concerns of the endogeneity problem (Hansen and Tarp, 2000).
To address this concern of aid endogeneity, most studies aimed at the aid–growth relationship
have used GMM estimation methodology.7
GMM offers an estimation approach when the numbers of restricted moments in the
data generating process are higher than the number of parameters required to be estimated. In
contrast to the approach of satisfying one moment condition and violating the other, GMM
strategy chooses an estimator that balances each population moment condition against the
others, seeking residuals that trade-off violations of one moment restriction against violations
of the other moment restrictions.
VARIABLES AND EQUATIONS
To conduct a time series analysis, we have employed data from 1972 to 2015. Mainly we
have taken data from World Bank’s World Development Indicators, but we have also used
economic survey of Pakistan for data of fiscal sector variables.
We have estimated four equations. Equation (1) tests the impact of foreign aid inflows
on economic growth of Pakistan. Equation (2) checks the impact of foreign aid inflows on
growth in presence of existing policy environment. We have used foreign aid and policy
index interactive terms in equation (3); this equation represents the combined effect of
existing macroeconomic policies and aid inflows. Here, we are basically mimicking the work
of Burnside and Dollar (1997), as they used this aid-policy interactive term in their analysis. log (GDP) = a0 + 𝑎1𝑙𝑜𝑔(Aid) + 𝑎2 log(LF) + 𝑎3log(GFCF) + 𝑎4 log(TO) + 𝑎5 (FDI) + 𝜇 --Eq(3.2)
log (GDP) = a0 + a1log(Aid) + 𝑎2 log(LF) + 𝑎3log(GFCF) + 𝑎4 log(TO) + α5(FDI) + α6 log(Pol) + µ--Eq(3.3)
log (GDP) = a0 + 𝑎1log(Aid) + 𝑎2 log(LF) + 𝑎3log(GFCF) + 𝑎4 log(TO) + 𝑎5 (FDI) + α6(AID ∗ POL) + µ -Eq(3.4)
Here, GDP represents gross domestic product per capita, and Aid denotes official
developmental assistance as a percentage of GDP. LF symbolises labour force, gross fixed
capital formation is GFCF, foreign direct investment is FDI and TO represents trade
openness.8
7For example Dalgaard et al (2004) , Rajan and Subramanian (2005) and Reddy (2009) used GMM methodology to tackle
endogeneity issue in aid-growth nexus. This problem was also identified by Clemens et al (2004), Easterly (2003), Easterly
et al(2004), Hansen and Tarp (2002), and Tavares (2003). 8 Data on all variables has been taken on constant prices.
International Journal of Economics, Finance and Business Management Studies| 9
© 2018 The Author | IJEFBM 2018 © 2018 FLE Learning
Another important objective of this study is to explore the impact of volatility in
foreign aid inflows on economic growth of Pakistan. To capture the impact, we have
constructed equation 3.4 based on equation 3.2 (in which we have replaced foreign aid with
its volatility (AidV) as an explanatory variable): log (GDP) = a0 + a1(AidV) + a2 log(LF) + a3log(GFCF) + a4 log(TO) + a5 (FDI) + µ--Eq (4)
All the variables are taken in natural log form, except FDI and foreign aid volatility.
EMPIRICAL RESULTS AND DISCUSSION
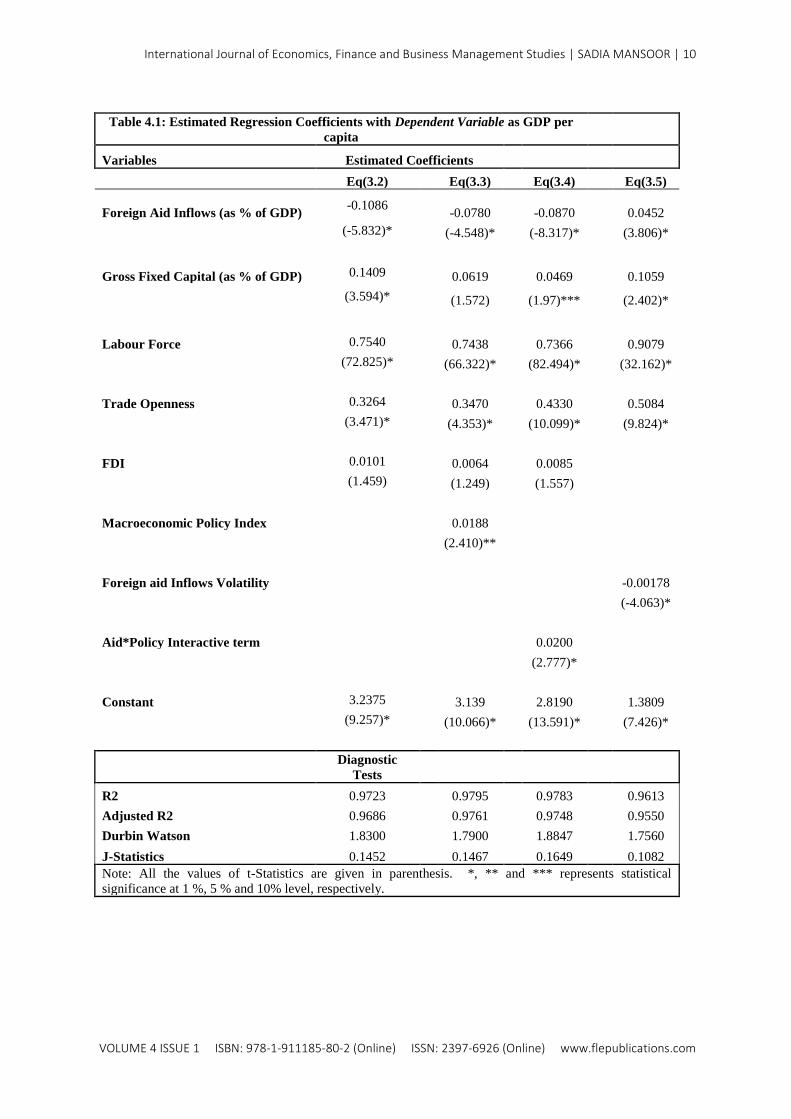
Our results show that foreign aid inflows negatively impact economic growth in Pakistan.
The estimation results, as presented in Table 4.1 (Eq3.2), show that a 1% increase in aid to
GDP ratio leads to a 0.10% decline in GDP per capita. This result is in line with the majority
of existing studies in the case of Pakistan (see, Chisti and Hasan, 1992; Iqbal, 1997; Khan
and Ahmad, 2007). As cited in the literature, most of the aid inflows in Pakistan come from a
bilateral source (i.e., the US) based on the strategic needs of the donor country rather than
depending on the economic needs of Pakistan.
The results of equation 3.2 also present the impact of other control variables on
economic growth. Gross fixed capital formation and labour force have a significantly positive
impact on GDP per capita. However, FDI has a positive but insignificant impact on economic
growth in Pakistan. There are several studies that also questioned role of FDI in developing
countries (see, Adewumi, 2006).
Empirical results of equation 1 show that a 1% increase in trade openness boosts GDP
per capita by 0.32 percent. Our results are in line with Iqbal and Zahid (1998) and Shirazi et
al. (2004); they all find trade liberalisation fosters economic growth of Pakistan. The results
of Eq3.3 show that a sound policy environment has a significantly positive impact on
economic growth. The coefficient of the policy–growth relationship shows that a 1% increase
in policy index leads to a 0.01% increase in economic growth. In equation (3.4), we have
investigated whether aid is conditional to the macroeconomic policy environment. We have
thus used the macroeconomic policy index and foreign aid interactive term. Aid*policy
interactive term has a strong intuitive aspect that outcomes from foreign aid utilisation
become positive when a country has a sound macroeconomic policy environment. Our results
are in agreement with the findings of Burnside and Dollar (1997, 2000) and Javid and
Qayyum (2011). We find that aid is effective, conditional on sound macroeconomic policies
in Pakistan. Lastly, we have estimated equation (3.5); this equation has captured the impact
of volatile aid inflows on Pakistan’s economy.
The findings of this study suggest some policy implication. First, large fluctuations in
aid are not desirable, as volatility is found to negatively relate with GDP growth in the case of
Pakistan. Second, considering Pakistan receives a major part of the aid inflows from a single
country, there is a need to diversify its donor base. There is also a need to insulate aid inflows
due to the strategic and political consideration of donor countries. In this regard, a long-term
commitment should be obtained and ensured before the start of any aid programme. Lastly, as
shown by our results, aid effectiveness can be enhanced through improvements in the
macroeconomic policy environment.
International Journal of Economics, Finance and Business Management Studies | SADIA MANSOOR | 10
VOLUME 4 ISSUE 1 ISBN: 978-1-911185-80-2 (Online) ISSN: 2397-6926 (Online) www.flepublications.com
Table 4.1: Estimated Regression Coefficients with Dependent Variable as GDP per
capita
Variables Estimated Coefficients
Eq(3.2)
Eq(3.3)
Eq(3.4)
Eq(3.5)
Foreign Aid Inflows (as % of GDP) -0.1086
-0.0780
-0.0870
0.0452
(-5.832)*
(-4.548)*
(-8.317)*
(3.806)*
Gross Fixed Capital (as % of GDP) 0.1409
0.0619
0.0469
0.1059
(3.594)*
(1.572)
(1.97)***
(2.402)*
Labour Force 0.7540
0.7438
0.7366
0.9079
(72.825)*
(66.322)*
(82.494)*
(32.162)*
Trade Openness 0.3264
0.3470
0.4330
0.5084
(3.471)*
(4.353)*
(10.099)*
(9.824)*
FDI 0.0101
0.0064
0.0085
(1.459)
(1.249)
(1.557)
Macroeconomic Policy Index
0.0188
(2.410)**
Foreign aid Inflows Volatility
-0.00178
(-4.063)*
Aid*Policy Interactive term
0.0200
(2.777)*
Constant 3.2375
3.139
2.8190
1.3809
(9.257)*
(10.066)*
(13.591)*
(7.426)*
Diagnostic
Tests
R2 0.9723
0.9795
0.9783
0.9613
Adjusted R2 0.9686
0.9761
0.9748
0.9550
Durbin Watson 1.8300
1.7900
1.8847
1.7560
J-Statistics 0.1452
0.1467
0.1649
0.1082
Note: All the values of t-Statistics are given in parenthesis. *, ** and *** represents statistical
significance at 1 %, 5 % and 10% level, respectively.
International Journal of Economics, Finance and Business Management Studies| 11
© 2018 The Author | IJEFBM 2018 © 2018 FLE Learning
REFERENCES
Alesina, A. and Weder, B. (2002) Do corrupt governments receive less foreign aid? American
Economic Review, 92(4), 1126-1137.
Anwar, M. and Michaelowa, K. (2006) The political economy of US aid to Pakistan. Review
of Development Economics, 10(2), 195-209.
Arellano, C., et al. (2009) The dynamic implications of foreign aid and its variability. Journal
of Development Economics, 88(1), 87-102.
Aslam, N. (1987) The impact of foreign capital inflow on savings and investment: The case
of Pakistan. The Pakistan Development Review, 26(4), 787-789.
Balassa, B. (1986) Comparative advantage in manufactured goods: a reappraisal. The Review
of Economics and Statistics, 68(2), 315-319.
Bauer, P.T. (1979) Foreign Aid Viewed Differently. Aussenwirtschaft, 34, 225-239.
Boone, P. (1996) Politics and the effectiveness of foreign aid. European Economic
Review, 40(2), 289-329.
Bulíř, A. and Hamann, A.J. (2003) Aid volatility: an empirical assessment. IMF Staff
Papers, 50(1), 64-89.
Burnside, C. and Dollar, D. (1997) Aid, policies, and growth. World Bank Policy Research
Working Paper No. 569252. [Online]. Available from:
http://documents.worldbank.org/curated/en/698901468739531893/pdf/multi-page.pdf
[Accessed 01 February 2018].
Burnside, C. and Dollar, D. (1998) Aid, the incentive regime, and poverty reduction. World
Bank Policy Research Paper 1937. [Online]. Available
from: http://documents.worldbank.org/curated/en/143851468764416188/pdf/multi0pag
e.pdf [Accessed 01 February 2018].
Butt, R. and Javid, A.Y. (2013) Foreign Aid and the Fiscal Behaviour of Government of
Pakistan. PIDE Working Paper 96. Pakistan Institute of Development Economics.
Chenery, H.B. and Strout, A.M. (1966) Foreign assistance and economic development. The
American Economic Review, 56, 679-733.
Chishti, S., Hasan, M.A. and Khan, A.H. (1992) Foreign Aid, Defence Expenditure and
Public Investment in Pakistan [with Comments]. The Pakistan Development
Review, 31(4), 895-908.
Collier, P. and Dollar, D. (2001) Can the world cut poverty in half? How policy reform and
effective aid can meet international development goals. World development, 29(11),
1787-1802.
Dollar, D. (1992) Outward-oriented developing economies really do grow more rapidly:
evidence from 95 LDCs, 1976-1985. Economic development and cultural
change, 40(3), 523-544.
Durbarry, R., Gemmell, N. and Greenaway, D. (1998) New evidence on the impact of foreign
aid on economic growth. CREDIT Research Paper 98r8. University of Nottingham,
Nottingham.
Fischer, A.M. (1993) Inflation targeting: The New Zealand and Canadian cases. Cato
Journal, 13(1), 1-27.
Friedman, M. and Meiselman, D. (1958) The relative stability of monetary velocity and the
investment multiplier in the United States, 1897-1958. USA: Department of Economics,
University of Chicago.
International Journal of Economics, Finance and Business Management Studies | SADIA MANSOOR | 12
VOLUME 4 ISSUE 1 ISBN: 978-1-911185-80-2 (Online) ISSN: 2397-6926 (Online) www.flepublications.com
Griffin, K.B. and Enos, J.L. (1970) Foreign assistance: objectives and
consequences. Economic development and cultural change, 18(3), 313-327.
Hadjimichael, M.T., et al. (1995) Sub-Saharan Africa: growth, savings, and investment,
1986-93. Occasional Paper No. 118, International Monetary Fund.
Hansen, H. and Tarp, F. (1999) The effectiveness of foreign aid. Copenhagen: Development
Economics Research Group, Institute of Economics, University of Copenhagen.
Hudson, J. and Mosley, P. (2008) Aid volatility, policy and development. World
Development, 36(10), 2082-2102.
Iqbal, Z. (1997) Foreign aid and the public sector: a model of fiscal behaviour in
Pakistan. The Pakistan Development Review, 115-129.
Iqbal, Z., Siddiqui, R. and Zaidi, A. (1998) The Impact of Structural Adjustment on Income
Distribution in Pakistan A SAM-based Analysis [with Comments]. The Pakistan
Development Review, 34(4), 377-397.
Irving, B. and Abbas, S.A. (2005) Foreign Aid and Industrial Development in Pakistan. UK:
Cambridge University Press.
Kavoussi, R.M. (1984) Export expansion and economic growth: Further empirical
evidence. Journal of Development Economics, 14(1), 241-250.
Kemal, A.R. (1992) Self-reliance and the implications for growth and resource
mobilisation. The Pakistan Development Review, 31(4), 1101-1110.
Khan, M.A. and Ahmed, A. (2007) Foreign Aid-Blessing or Curse: Evidence from
Pakistan. The Pakistan Development Review, 46(3), 215-240.
Khan, S.R. and Ahmad, E. (1997) Has Aid Helped in Pakistan? [with Comments]. The
Pakistan Development Review, 36(4), 947-957.
Lensink, R. and Morrissey, O. (2000) Aid instability as a measure of uncertainty and the
positive impact of aid on growth. The Journal of Development Studies, 36(3), 31-49.
Levy, V. (1988) Aid and growth in Sub-Saharan Africa: The recent experience. European
Economic Review, 32(9), 1777-1795.
Markandya, A. and Yi, S. (2010) What are the links between aid volatility and growth?
Policy Research Working Paper 5201. Washington: The World Bank.
McKinnon, R.I. (1973) The order of economic liberalization: Financial control in the
transition to a market economy. USA: Johns Hopkins University Press.
Mosley, P. (1980) Aid, savings and growth revisited. Oxford Bulletin of Economics and
Statistics, 42(2), 79-95.
Muhammad, J. and Qayyum, A. (2011) Foreign aid-growth nexus in Pakistan: role of
macroeconomic policies. [Online] Available at: https://mpra.ub.uni-
muenchen.de/29498/1/MPRA_paper_29498.pdf [Accessed 1 August 2017].
Naqvi, S.N. (1971) The incubus of foreign aid. Pakistan: Pakistan Institute of Development
Economics. Karachi: Pakistan Institute of Development Economics.
Neanidis, K.C. and Varvarigos, D. (2009) The allocation of volatile aid and economic
growth: Theory and evidence. European Journal of Political Economy, 25(4), 447-462.
Papanek, G.F. (1973) Aid, foreign private investment, savings, and growth in less developed
countries. Journal of political Economy, 81(1), 120-130.
Parkin, M. (1986) The output-inflation trade-off when prices are costly to change. Journal of
Political Economy, 94(1), 200-224.
Phelps, E.S. and Taylor, J.B. (1977) Stabilizing powers of monetary policy under rational
expectations. Journal of political Economy, 85(1), 163-190.
Rajan, R.G. and Subramanian, A. (2005) What undermines aid's impact on growth? NBER
Working Paper No. 11657. Massachusets, US: National Bureau of Economic Research.
[Online]. Available from: http://www.nber.org/papers/w11657.pdf [Accessed 01
February 2018].
International Journal of Economics, Finance and Business Management Studies| 13
© 2018 The Author | IJEFBM 2018 © 2018 FLE Learning
Rosenstein-Rodan, P.N. (1961) International aid for underdeveloped countries. The Review of
Economics and Statistics, 43(2), 107-138.
Sabra, M.M. and Eltalla, A. (2016) Foreign Aid, Domestic Savings and Economic Growth in
Selected MENA Countries. Business and Economic Research, 6(1), 352-362.
Sabra, M.M. and Sartawi, S. (2015) Development Impacts of Foreign Aid on Economic
Growth, Domestic Savings and Dutch Disease Presence in Palestine. International
Journal of Economics and Empirical Research, 3(11), 532-542.
Sato, R. (1964) The Harrod–Domar model vs the Neo-Classical growth model. The Economic
Journal, 74(294), 380-387.
Shabbir, T., Mahmood, A. and Niazi, S.A. (1992) The Effects of Foreign Private Investment
on Economic Growth in Pakistan [with Comments]. The Pakistan Development Review,
31(4), 831-841.
Shaw, E.S. (1973) Financial deepening in economic development. Oxford: Oxford University
Press.
Shirazi, N.S., Manap, T.A. and Din, M.U. (2004) Exports and economic growth nexus: The
case of Pakistan [with comments]. The Pakistan Development Review, 43(4), 563-581.
International Journal of Economics, Finance and Business Management Studies | MICHAEL ROWE| 14
VOLUME 4 ISSUE 1 ISBN: 978-1-911185-80-2 (Online) ISSN: 2397-6926 (Online) www.flepublications.com
2.05-AX26-5526
CURATING THE CROWD – TOWARDS A TYPOLOGY OF VALUE-
CREATING ONLINE COMMUNITY INTERACTIONS
MICHAEL ROWE1, JOHN DOUGLAS THOMSON2 AND MARTA POBLET3
ABSTRACT
This paper proposes a conceptual model of online community management and development
in the context of organisational value creation. It investigates the drivers and limiting factors
that contribute to the development of online communities and the appropriation of value from
them. A multiple-methods approach to the study of online communities has been used.
Qualitative data from semi-structured interviews with subjects actively participating in
crowdsourcing activities was obtained over a two-year period. Quantitative methodology
included a review of online communities associated with the 2015 Fortune 500 companies,
and an additional 167 measurements of eight online communities provided cross-sectional
and time-series data. This paper contributes an empirical model that considers two categories
of factors: organisational factors – which are controllable by decision-makers within the
organisation; and community factors – which shape and limit the nature of the resultant
community, and reflect variables relating to the nature of participation.
Key words: Online community, crowdsourcing, community participation, crowd, value
creation
INTRODUCTION
Social media has created a new paradigm where thoughts, attitudes and beliefs can be
instantly captured and shared across networks of other participants around the world
(Kietzmann, Hermkens, McCarthy and Silvestre, 2011). While the movement of content in
the social media universe may be perceived simply as a form of diversion or entertainment,
the underlying technology provides users with the opportunity of forming cohesive online
communities (OCs), a fact increasingly being taken into account by business and government
(Turban, Strauss and Lai, 2016). OCs have been defined as “social networks in which people
with common interests, goals, or practices interact to share information and knowledge, and
engage in social interactions” (Chiu, Hsu and Wang, 2006). The potential associated with the
leverage of OCs can be seen not simply as a by-product of an organisation’s social
interactions, but potentially a characteristic central to its use as a creator of value (Sridhar
Balasubramanian, 2001).
Understanding the factors that drive formation and development of OCs and which
mediate the participation of their membership is an important precondition of recognising
how these communities may create value. Specific questions addressed by this research are:
what are the drivers and limiting factors that contribute to the development of OCs and the
appropriation of value from them, and how might the variables associated with OCs and the
interactions between them be modelled?
LITERATURE REVIEW
While the study of community dates back to Aristotle, contemporary studies find that the
range of characteristics that need to be satisfied for community membership to occur include
1 PhD candidate. RMIT University Graduate School of Business and Law. 405 Russell St, Melbourne, VIC, Australia 3000.
E-mail: - [email protected] 2 Senior Lecturer, RMIT University Graduate School of Business and Law. 405 Russell St, Melbourne, VIC, Australia 3000.
E-mail: - [email protected] 3 Assoc Professor Marta Poblet, RMIT University Graduate School of Business and Law. 405 Russell St, Melbourne, VIC,
Australia 3000. E-mail: - [email protected]
International Journal of Economics, Finance and Business Management Studies| 15
© 2018 The Author | IJEFBM 2018 © 2018 FLE Learning
a sense of belonging, emotional safety and the integration of needs fulfilment for participants
(McMillan and Chavis, 1986). Community is seen as a resource utilised by people “for
meeting key physiological and psychological needs such as the need for affiliation, power
and affection” (Nowell and Boyd, 2010).
Translated into an online context, any definition of community must transcend physical
place and instead describe a set of social relationships (Andrews, Preece and Turoff, 2001).
Many properties of OCs are consistent with those of their more traditional counterparts
(Silva, Mousavidin and Goel, 2006). The interest of each individual within a community is
generally better served by individuals acting in concert rather than by each acting in isolation.
In translating the exchanges of such a community from a sociological to an organisational
context, the best interests of an enterprise may be served through the appropriate harnessing
of the interactions of whatever community the organisation may be able to harness. From
these roots, the notion of community in relation to organisational performance arises.
Forms of community
If the ultimate objective of enterprise is to satisfy the needs of customers more effectively
than alternatives (Webster, 2017), then competitive advantage is the reward that comes with
the achievement of that aim (Treacy and Wiersema, 1993). But online customer communities
are rarely completely homogenous, and each individual customer is likely to have
perspectives and preferences that differ from others in his or her cohort. This has implications
for organisations and the approach they take to customer communities – how well a company
understands its prime stakeholders (customers among them), and how capable it is in not just
addressing the variation in needs, but also in operationally integrating the views of its
customers into the attributes of the goods and services it produces (Treacy and Wiersema,
1993).
Within this context, the role of the brand community can be considered. In his paper
introducing the concept, Muniz defined brand community as “a specialised, non-
geographically bound community based on a structured set of social relationships among
admirers of a brand” (Muniz, Jr. and O’Guinn, 2001). He noted that brands with a strong
sense of community are of more value to a marketer than brands with a lesser focus or
understanding of their community.
An additional category of OC might be called “communities of interest” (Armstrong
and Hagel, 2009). Internet technologies enable the members of a community of shared
interests to associate with relative ease. Geographic, language, cultural and status barriers are
significantly reduced in an online context, and this enables the formation of communities that
are potentially both demographically truly diverse, and also quite narrow in their focus.
Nexus with crowdsourcing
Crowdsourcing is defined as a “type of participative online activity in which an individual, an
institution, a non-profit organization … proposes to a group of individuals … via a flexible
open call, the voluntary undertaking of a task” (Estelles-Arolas and Gonzalez-Ladron-de-
Guevara, 2012). For value to be created through crowdsourcing, three criteria must be met.
First, the subject of the task being crowdsourced must be modular in nature, i.e. elements of
the subject must be able to be changed without compromising the integrity of the whole.
Second, there must be structural capability within the organisation to be able to both engage
the crowd and utilise the output from the crowd in a manner that creates value. Finally, an
authentic community must be engaged (Rowe, Poblet and Thomson, 2015). The manner in
which these communities may be engaged, and the variables associated with mediating that
involvement, are critical determinants of successful leverage of OCs by organisations.
International Journal of Economics, Finance and Business Management Studies | MICHAEL ROWE| 16
VOLUME 4 ISSUE 1 ISBN: 978-1-911185-80-2 (Online) ISSN: 2397-6926 (Online) www.flepublications.com
The study of crowdsourcing must therefore take into account the dynamics of the
crowd. Here arises a definitional constraint, as many of the crowds engaged in crowdsourcing
do not satisfy the accepted preconditions of community. In other words, while all
communities are comprised of crowds, not all crowds are communities. Participation in
crowdsourcing may be by individuals unmotivated by commonality of interest with like-
minded others. Consider the individual that voluntarily submits information about the
location of potholes to their local council using an app similar to “Street Bump”. This
individual is enabling the local government to crowdsource data in relation to the condition of
roads in surrounding neighbourhoods, but the individual is not by any practical means a
member of a community for the purposes of this activity.
This paper therefore does not use “community” and “crowd” interchangeably. Rather, it
assumes that the characteristics of the OC drive value creation, not the mere access to a
crowd.
METHODOLOGY
This research applies a multiple-method approach to the study of OCs. Qualitative data was
obtained through semi-structured interviews over a two-year period with subjects actively
participating in crowdsourcing activities. In addition, a “digital ethnographic” investigation
(including naturalistic involvement in, and observations of, functioning OCs and associated
artefacts) was undertaken. Digital Ethnography is a qualitative research methodology which
adapts ethnographic research techniques to the study of OCs (Underberg and Zorn, 2013).
Quantitative methodology included a review of OCs associated with the 2015 Fortune 500
companies, and an additional 167 measurements of a convenience sample of eight OCs
providing cross-sectional and time-series data encompassing 1.1 billion individual posts and
contributions.
Many OC forums have been captured in Internet archives, along with metrics that
enable the development of these communities over time to be mapped. As an investigation
into the nature of the communities these forums attract formed a significant part of this
research, taking data from these archives provided a rich source of quantitative data. A
selection of candidate sites was obtained, and these were then entered into the Internet
Archive site (www.archive.org) to establish the quality of historical data available. Quality of
data in this sense refers to the start date of entries into the archive, and the frequency and
distribution of updates. Figure 1 shows an example of the reporting available on the site and
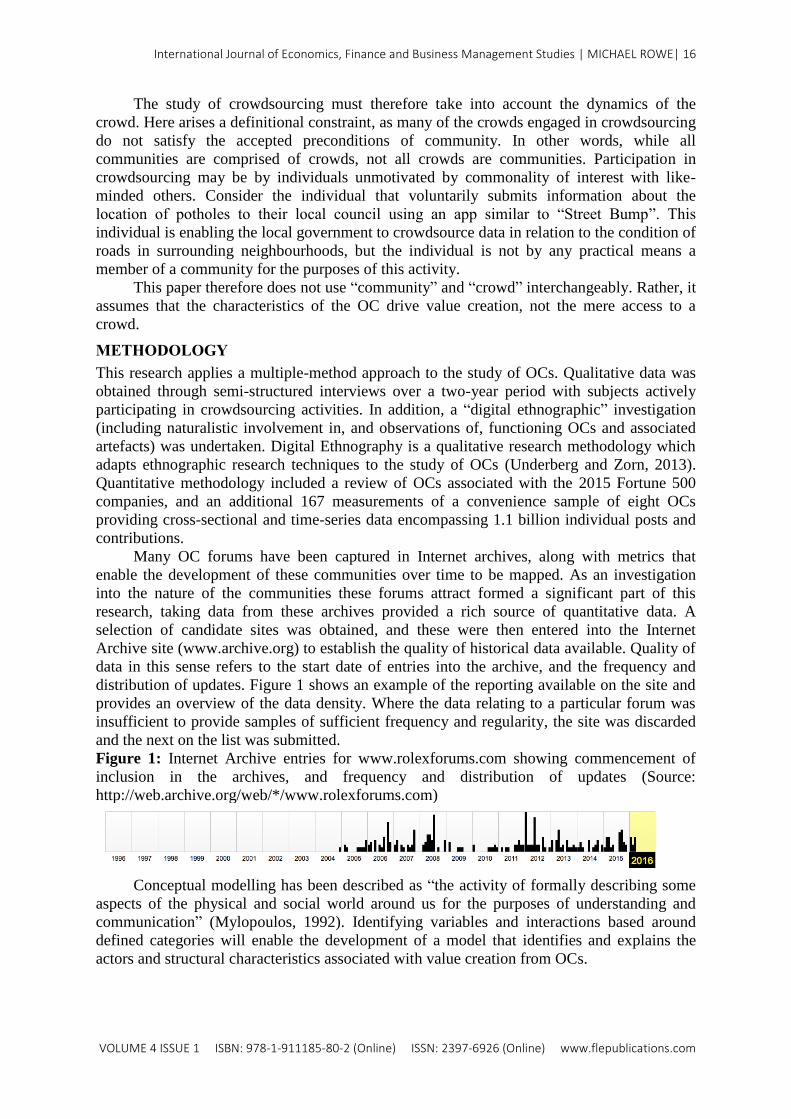
provides an overview of the data density. Where the data relating to a particular forum was
insufficient to provide samples of sufficient frequency and regularity, the site was discarded
and the next on the list was submitted.
Figure 1: Internet Archive entries for www.rolexforums.com showing commencement of
inclusion in the archives, and frequency and distribution of updates (Source:
http://web.archive.org/web/*/www.rolexforums.com)
Conceptual modelling has been described as “the activity of formally describing some
aspects of the physical and social world around us for the purposes of understanding and
communication” (Mylopoulos, 1992). Identifying variables and interactions based around
defined categories will enable the development of a model that identifies and explains the
actors and structural characteristics associated with value creation from OCs.
International Journal of Economics, Finance and Business Management Studies| 17
© 2018 The Author | IJEFBM 2018 © 2018 FLE Learning
TOWARDS A COMPREHENSIVE MODEL
OCs may exist in many forms. They may be directly associated with an organisation, or they
may be entirely independent of the organisation and exist only as a result of the individual
members’ shared approach to a contingency.
The proposed empirical model considers two dimensions:
1. Organisational dimensions – which are controllable by decision-makers within the
organisation; and
2. Community dimensions – which shape and limit the nature of the resultant
community, and reflect variables relating to the nature of participation.
Taken together, the proposed model provides both an explanation for observed
community interactions, and a diagnostic tool showing alternative configurations that may
potentially drive better value creation from an existing community engagement approach.
Organisational dimensions
Organisational dimensions are those that are specifically related to, and under the control of,
the seeker organisation. They are distinct from of any particular crowdsourcing process and
can be considered independent variables.
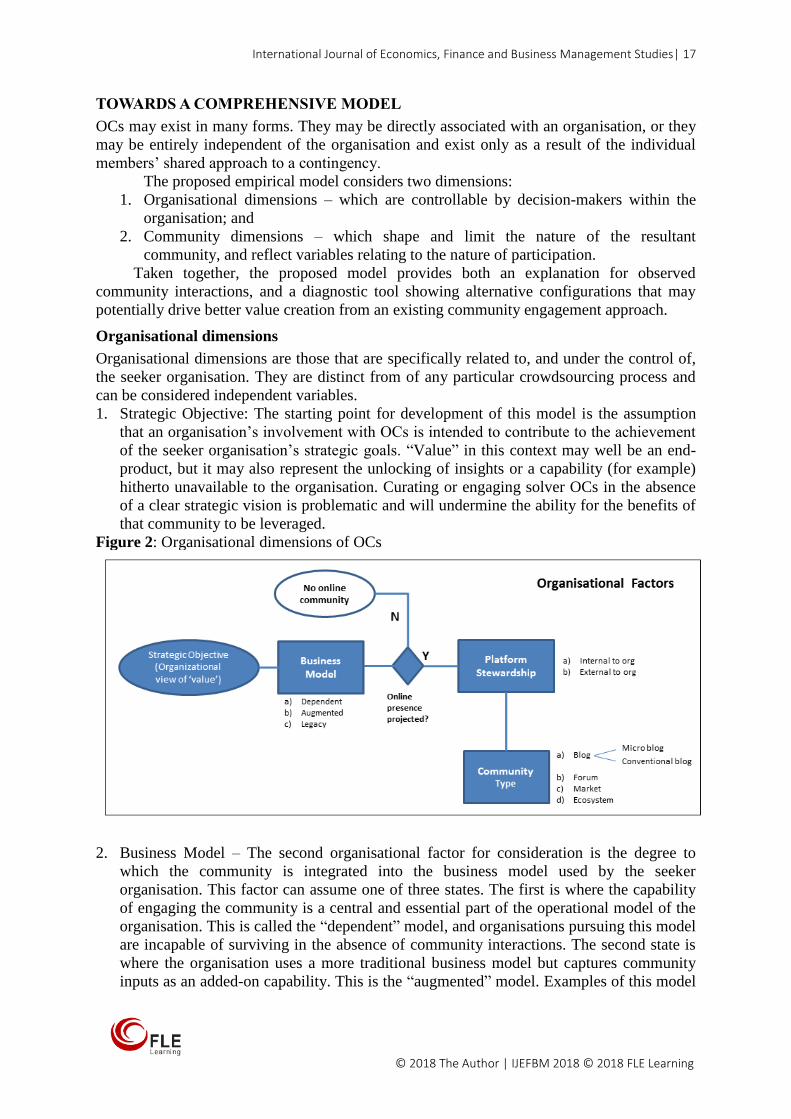
1. Strategic Objective: The starting point for development of this model is the assumption
that an organisation’s involvement with OCs is intended to contribute to the achievement
of the seeker organisation’s strategic goals. “Value” in this context may well be an end-
product, but it may also represent the unlocking of insights or a capability (for example)
hitherto unavailable to the organisation. Curating or engaging solver OCs in the absence
of a clear strategic vision is problematic and will undermine the ability for the benefits of
that community to be leveraged.
Figure 2: Organisational dimensions of OCs
2. Business Model – The second organisational factor for consideration is the degree to
which the community is integrated into the business model used by the seeker
organisation. This factor can assume one of three states. The first is where the capability
of engaging the community is a central and essential part of the operational model of the
organisation. This is called the “dependent” model, and organisations pursuing this model
are incapable of surviving in the absence of community interactions. The second state is
where the organisation uses a more traditional business model but captures community
inputs as an added-on capability. This is the “augmented” model. Examples of this model
International Journal of Economics, Finance and Business Management Studies | MICHAEL ROWE| 18
VOLUME 4 ISSUE 1 ISBN: 978-1-911185-80-2 (Online) ISSN: 2397-6926 (Online) www.flepublications.com
are governments that use crowd-based techniques to assist in policy formation and
problem solving. The third state is where the organisation disregards, either through
design or neglect, the presence of whatever OC of interest exists around it. This can occur
for a number of reasons and is relatively prevalent at the time of writing. This is referred
to as the “legacy” model.
Organisations that are “dependent” (such as Amazon, Facebook and eBay) maintain
customer communities that are the value creation engine and effectively inseparable from
the organisation itself. Other companies (such as AT&T, Hewlett Packard and Nike)
maintain active communities that have been developed alongside their primary
operations, enabling input to be obtained while the organisation remains operationally
independent from its associated communities. Many more organisations – usually ones of
significant scale – are too bound by fixed organisational structures, industry regulatory
pressures or stock market expectations to engage OCs in any meaningful way. Banks and
mining companies are typical examples. As the impact of social media and OCs becomes
more apparent, some business-to-consumer enterprises appear to be decreasing their
reliance on legacy systems and are starting to provide opportunities within their operating
or business models for more significant stakeholder interactions.
3. Online Presence Projected – at this point the model seeks to establish whether the
organisation projects an online presence beyond a simple website. The null case here is
the organisation whose presence provides no way for interested parties to respond. In
these cases, the organisation eschews even the most basic social media presence.
American Tower (http://www.americantower.com) is a large transnational enterprise
based in the United States. Its website is purely descriptive with no social media presence
or any other way for interested parties to interact with the firm beyond a “contact us”
page.
Social media is simple and inexpensive to access, and many organisations use social
media platforms such as Twitter, Facebook, Pinterest and Instagram as an extension of
their website. This may satisfy a technical definition of creating and engaging with an
OC, but in reality simply posting content to Twitter and Instagram does not mean an
impact is being felt either in respect of forming or contributing to a community
discussion. It should be recognised that almost all organisations of scale now project
some form of online presence through social media channels. This is a necessary but not
sufficient precondition to the formation of a community. The test of whether a community
has been formed relates to the extent of response that results from this activity. This kind
of irregular and ad hoc activity is a separate category of interaction that (while capable of
influencing decision-making within organisations) does not represent a coherent response
to community building and is, one might surmise, often unwelcome in relation to the
pressure it puts on management. It is, however, an important community interaction, and
one with the potential to create value for the organisation.
4. Platform Stewardship – This factor reflects the relationship between the organisation and
its community. This is an important decision for an organisation – it can foster the
creation of its own OC (management of the community is a function internal to the
organisation), or it can monitor but otherwise have a hands-off relationship with a
community that has been created outside the auspices of the organisation (management is
external to the organisation). Some organisations may be unaware of both the existence of
an associated community, or of the potential to leverage this community for advantage
(not considered by the organisation).
Web 2.0 technologies that enable interaction are ubiquitous and accessible to all.
The degree of perceived authenticity of these interactions is likely to have the effect of
mediating the quality of the contribution by the stakeholder. For example, independently
International Journal of Economics, Finance and Business Management Studies| 19
© 2018 The Author | IJEFBM 2018 © 2018 FLE Learning
moderated, spontaneously evolving communities are likely to elicit a more open, honest
and unfiltered set of responses than those from sites established, curated and overseen by
the organisation being commented upon. In this case the obvious presence of the observer
is likely to influence the contribution of the community (Vaezi, Torkzadeh and Chang,
2011).
This review of companies comprising the 2015 Fortune 500 list in the United States
found that, of those that could be considered B2C (i.e., operating in consumer markets)
(n=226), only 44 or 19.5% hosted their own easily accessible OC. Of those with a
primarily B2B focus (n=274), 31 or 11.3% maintained online stakeholder communities.
In contrast, every one of the Fortune 500 companies was the subject of discussion and
comment among online forums external to the company. Many of these interactions
centred on the investment potential of the companies under discussion. Others consisted
of contributors seeking information about employment opportunities and experiences
from other community members who had had dealings with the company. Independent
and spontaneous communities discussing products, strategies and topical concerns related
to the companies were also prevalent.
5. Community Type: Categorisation of type of community utilises two dimensions: the
scope of interests covered in the interactions of community members, and the extent of
diversity of interaction enabled by the platform.
Some communities form around very specific topics – they are single-interest
driven and often quite specialist in nature. A community dedicated to the restoration of a
particular model of automobile is unlikely to sustain discussions about politics. Other
communities arise in response to a broader range of interests. These might be aligned to a
particular brand or cause, or be more general in nature. Members of these communities,
such as Quora and Straight Dope Message Board, typically start and propagate
discussions and encourage the contribution of different perspectives and viewpoints from
their community across a range of topics.
“Diversity of interaction” in this model reflects the degrees of freedom of
participation afforded to the community. Interactions can range from one-sided to many-
sided. A one-sided community will have a flow of information that moves from a source
to an audience. In a typical one-sided system, the audience is either unable to contribute
back to the source, or can do so only in a piecemeal fashion without the formation of
conversational threads and free-ranging interactions with other audience members being
feasible. Some organisations may seek to limit the diversity of interaction to minimise the
potential risks associated with open and unconstrained communication. Moving beyond
this token activity can be challenging for the organisation. It requires it to develop
capabilities of managing a more plentiful and diverse range of interactions. However,
there are numerous examples where organisations have benefitted from a broad and
diverse range of interaction. This can be achieved by allowing stakeholders to
independently and autonomously create new topics and opportunities for interaction
between each other and the organisation itself.
Four community types arise from the scope/diversity interaction. Where the scope
of interest is low and the diversity of interaction is also low, the community form is a blog
(originally called a “weblog”). The blog’s author (blogger) is typically an individual or
representative with some professed interest or expertise in a particular area,
communicating to a community that shares that interest. The number and extent of
responses is insignificant compared to the number of viewers of the content. Contrast this
to a situation with low diversity of interaction but high scope of interest. This form may
be found in online markets such as eBay, or Alibaba where the range of topics (i.e.,
International Journal of Economics, Finance and Business Management Studies | MICHAEL ROWE| 20
VOLUME 4 ISSUE 1 ISBN: 978-1-911185-80-2 (Online) ISSN: 2397-6926 (Online) www.flepublications.com
categories of items for sale) is potentially unlimited, but participants generally relate only
within the context of the individual vendors in the market.
The third form is found where the scope of interest tends to be focused while the
diversity of interaction is much greater. Online forums – sites enabling users to participate
in topic-driven discussions – are perhaps the most visible and therefore accessible
example of this and lie at the basis of the formation and development of many OCs. The
final categorisation occurs when the scope of interest is large and the diversity of
interaction is similarly large. Under these circumstances, a number of separate
communities (based on a common theme) form an ecosystem around a particular
organisation or cause. The subsequent interaction is complex. An example of an
ecosystem topology is Lego, which engages with a diverse range of communities around
the world.
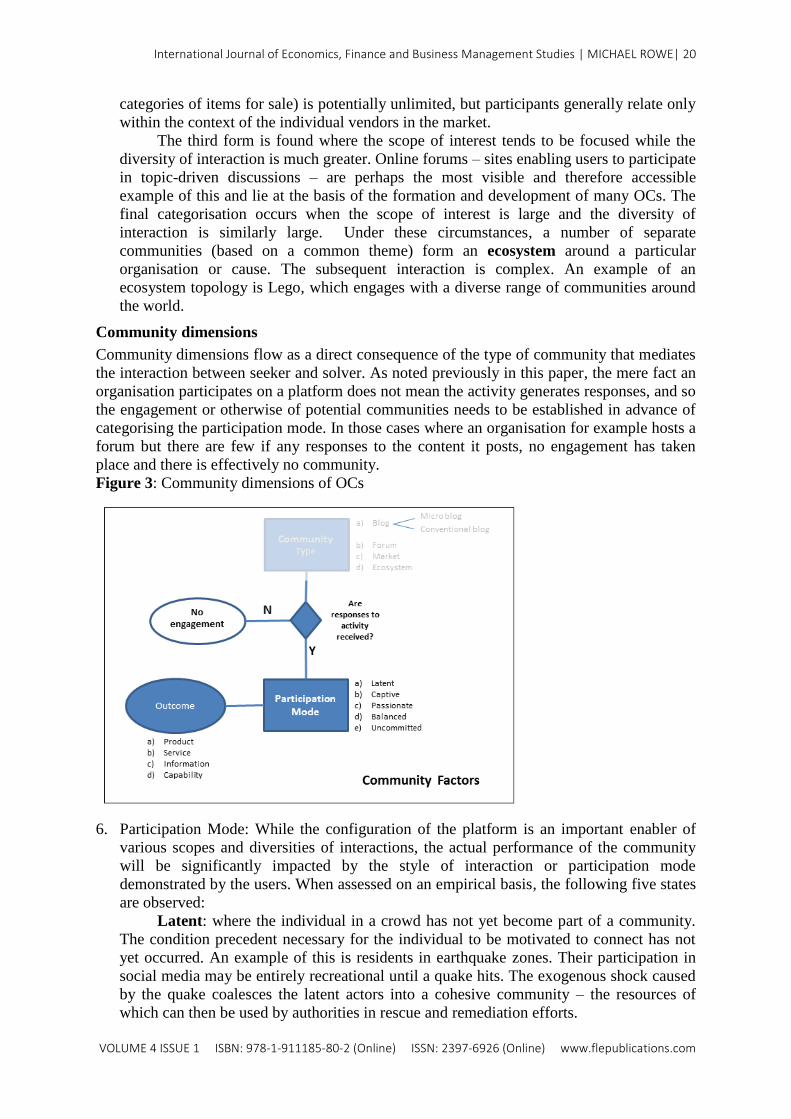
Community dimensions
Community dimensions flow as a direct consequence of the type of community that mediates
the interaction between seeker and solver. As noted previously in this paper, the mere fact an
organisation participates on a platform does not mean the activity generates responses, and so
the engagement or otherwise of potential communities needs to be established in advance of
categorising the participation mode. In those cases where an organisation for example hosts a
forum but there are few if any responses to the content it posts, no engagement has taken
place and there is effectively no community.
Figure 3: Community dimensions of OCs
6. Participation Mode: While the configuration of the platform is an important enabler of
various scopes and diversities of interactions, the actual performance of the community
will be significantly impacted by the style of interaction or participation mode
demonstrated by the users. When assessed on an empirical basis, the following five states
are observed:
Latent: where the individual in a crowd has not yet become part of a community.
The condition precedent necessary for the individual to be motivated to connect has not
yet occurred. An example of this is residents in earthquake zones. Their participation in
social media may be entirely recreational until a quake hits. The exogenous shock caused
by the quake coalesces the latent actors into a cohesive community – the resources of
which can then be used by authorities in rescue and remediation efforts.
International Journal of Economics, Finance and Business Management Studies| 21
© 2018 The Author | IJEFBM 2018 © 2018 FLE Learning
Captive: where interactions between platform and community are a result of there
being no practical option. Participation is not through choice but through necessity (for
example, Telstra, Commonwealth Bank of Australia);
Passionate: where participation is the result of a free choice to engage on behalf of
the members of the community, and contributions come from the participants’ desire to
be heard and to make a positive contribution to the community (Straight Dope Message
Boards, Rolex Forums);
Balanced: where participation becomes a way of life, not driven by compelling
external stimuli but by the incorporation of the platform into the participant’s daily
routine. Need to participate is often justified as functional rather than driven from a
particular need to address issues. An example of this is recreational participation on
platforms such as Facebook and Twitter; and
Uncommitted: where the bond between platform and community member is weak
and irregular – if it exists at all. The platform owner is offering access to the platform
through a sense of obligation or to be seen to be contemporary. The potential user may
perceive the pages to be a contrivance with little substance and limited ability to actually
provide influence (for example The Clorox Company, and their “Heritage Community”).
The style of interaction is an important consideration because it contributes to the
degree of authenticity and engagement present in the interaction. The standard of
contribution arising from authentic and engaged participants is more useful than that of
individuals participating on a platform through obligation or lack of choice. An
organisation seeking to leverage the insights of its community may be disappointed by
responses when that community is delivered to the organisation through overly moderated
or controlled platforms.
7. Anticipated Outcome – A final element of the comprehensive model relates to the nature
of outcome sought. The classical dichotomy of goods and service (tangible/intangible)
can be extended here to include two additional classifications of outcome; information
and capability. Turning to a community for information is self-explanatory – the
information may relate to guidance on potential new products and services, to better
understanding the priorities of consumers, or to establishing a clearer picture of the
organisation’s reputation and brand in the eyes of the market. When an organisation turns
to a community to either get it to perform tasks on its behalf or to solve problems, the
community is effectively providing that firm with a capability it did not have previously.
Community-based capability building extends the resource-based view of the firm
(Barney, 1991) to include the valuable, rare and imperfectly imitable contributions of a
community of individuals, each with a perspective and some degree of willingness to
contribute.
International Journal of Economics, Finance and Business Management Studies | MICHAEL ROWE| 22
VOLUME 4 ISSUE 1 ISBN: 978-1-911185-80-2 (Online) ISSN: 2397-6926 (Online) www.flepublications.com
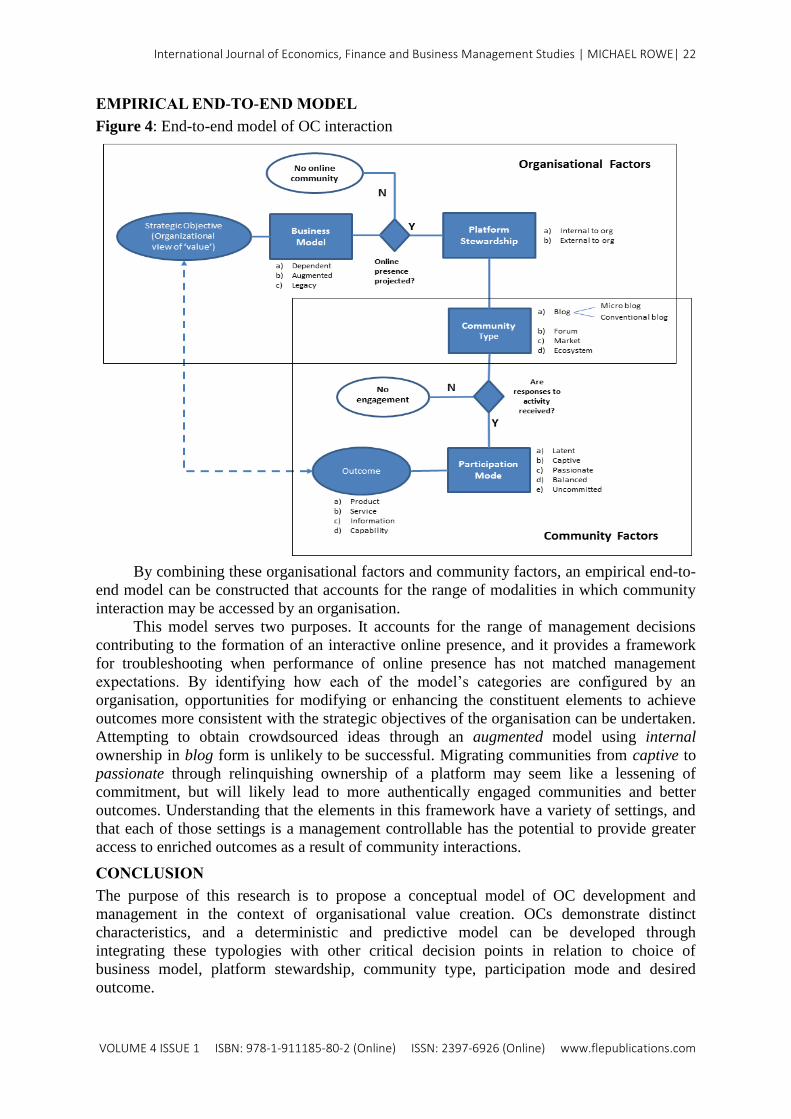
EMPIRICAL END-TO-END MODEL
Figure 4: End-to-end model of OC interaction
By combining these organisational factors and community factors, an empirical end-to-
end model can be constructed that accounts for the range of modalities in which community
interaction may be accessed by an organisation.
This model serves two purposes. It accounts for the range of management decisions
contributing to the formation of an interactive online presence, and it provides a framework
for troubleshooting when performance of online presence has not matched management
expectations. By identifying how each of the model’s categories are configured by an
organisation, opportunities for modifying or enhancing the constituent elements to achieve
outcomes more consistent with the strategic objectives of the organisation can be undertaken.
Attempting to obtain crowdsourced ideas through an augmented model using internal
ownership in blog form is unlikely to be successful. Migrating communities from captive to
passionate through relinquishing ownership of a platform may seem like a lessening of
commitment, but will likely lead to more authentically engaged communities and better
outcomes. Understanding that the elements in this framework have a variety of settings, and
that each of those settings is a management controllable has the potential to provide greater
access to enriched outcomes as a result of community interactions.
CONCLUSION
The purpose of this research is to propose a conceptual model of OC development and
management in the context of organisational value creation. OCs demonstrate distinct
characteristics, and a deterministic and predictive model can be developed through
integrating these typologies with other critical decision points in relation to choice of
business model, platform stewardship, community type, participation mode and desired
outcome.
International Journal of Economics, Finance and Business Management Studies| 23
© 2018 The Author | IJEFBM 2018 © 2018 FLE Learning
FUTURE RESEARCH
The model developed by this research is conceptual in nature. Future research directions may
include a more formal investigation of the nature and characteristics of the linkages between
agents, and their impact on performance of the organisation seeking to utilise communities in
value creation. There is now an abundance of data accessible with relative ease through new
data mining techniques. Artificial Intelligence (AI) algorithms are already enabling meaning
to be extracted from large and diverse datasets with relative ease (Kozinets, 2010). As new
forms of community evolve, investigations may reveal a metacategorisation of sociological
importance across a range of disciplines.
At the heart of these investigations lies the basic human drive for connectedness.
Perhaps the most important dimension of this is the authenticity with which relationships
form and are carried forward. Just as the notion of community is losing its geographic
dependence and becoming more abstracted over time, so the challenge of keeping the trust
and the humanity in the relationships becomes a more important factor. Future research
directions accounting for aspects of authenticity in distributed relationships may provide a
stepping off point for a means of further leveraging the potential that exists wherever
communities operate.
REFERENCES
Andrews, D., Preece, J. and Turoff, M. (2001) A conceptual framework for demographic
groups resistant to online community interaction. Proceedings of the 34th Annual
Hawaii International Conference on System Sciences, 6(3), 9–24.
Armstrong, A. and Hagel, J. (2009) The Real Value of Online Communities. Knowledge and
Communities, 2009(3), 85–98.
Barney, J. (1991) Firm resources and sustained competitive advantage. Journal of
Management, 17(1), 99–120.
Chiu, C., Hsu, M. and Wang, E. T. G. (2006) Understanding knowledge sharing in virtual
communities : An integration of social capital and social cognitive theories. Decision
Support System, 42(3), 1872–1888.
Estelles-Arolas, E. and Gonzalez-Ladron-de-Guevara, F. (2012) Towards an integrated
crowdsourcing definition. Journal of Information Science, 38(2), 189–200.
Kietzmann, J. H. et al. (2011) Social media? Get serious! Understanding the functional
building blocks of social media. Business Horizons, 54(3), 241–251.
Kozinets, R. V. (2010) Netnography. Doing ethnographic research online. US: Sage
Publications.
McMillan, D. W. and Chavis, D. M. (1986) Sense of community: A definition and theory.
Journal of Community Psychology, 14(1), 6–23.
Muniz, Jr., A. M. and O’Guinn, T. C. (2001) Brand Community. Journal of Consumer
Research, 27(4), 412–432.
Mylopoulos, J. (1992) Conceptual modelling and Telos. [Online] Conceptual Modeling,
Databases, and Case An Integrated View of Information Systems Development, 49–68.
Available from: http://www.cs.toronto.edu/~jm/2507S/Readings/CM+Telos.pdf
[Accessed 26 October 2017].
Nowell, B. and Boyd, N. (2010) Viewing community as responsibility as well as resource:
Deconstructing the theoretical roots of psychological sense of community. Journal of
Community Psychology, 38(7), 828–841.
Rowe, M., Poblet, M. and Thomson, J. D. (2015) Creating value through crowdsourcing: The
antecedent conditions. In: Lecture Notes in Business Information Processing, 218,
345–355).
International Journal of Economics, Finance and Business Management Studies | MICHAEL ROWE| 24
VOLUME 4 ISSUE 1 ISBN: 978-1-911185-80-2 (Online) ISSN: 2397-6926 (Online) www.flepublications.com
Silva, L., Mousavidin, E. and Goel, L. (2006) Weblogging: In plementing communities of
practice. In: IFIP, E. et al (eds.). Social Inclusion: Society and Organizational
Implications for Information Systems, 208, 295–316.
Sridhar Balasubramanian, V. M. (2001) The Economic Leverage of the Virtual Community.
International Journal of Electronic Commerce, 5(3), 103–138.
Treacy, M. and Wiersema, F. (1993) Customer Intimacy and Other Value Disciplines
Customer Intimacy and Other Value Disciplines. Harvard Business Review, 71(9301),
84–93.
Turban, E., Strauss, J. and Lai, L. (2016) Innovative Social Commerce Applications: From
Social Government to Entertainment and Gaming. In: Turban, E., Strauss, J. and Lai,
L.(eds.) Social Commerce: Marketing, Technology and Management. Cham: Springer
International Publishing.
Underberg, N. M. and Zorn, E. (2013) Digital ethnography: Anthropoly, narrative, and new
media. Texas: University of Texas Press.
Vaezi, R., Torkzadeh, G. and Chang, J. C.-J. (2011) Understanding the influence of blog on
the development of social capital. ACM SIGMIS Database, 42(3), 34.
Webster, F. E. J. (2017) The Changing Role of Marketing in the Corporation. Journal of
Marketing, 56(4), 1–17.
International Journal of Economics, Finance and Business Management Studies| 25
© 2018 The Author | IJEFBM 2018 © 2018 FLE Learning
3.06-AT06-5103
SME MARKETING MIX STANDARDISATION IN THE B2B MARKET
JUERGEN WIELAND1
ABSTRACT
The purpose of this paper is to examine price and product policy interdependencies in relation
to a standardised use of a marketing management approach in SMEs. The methodology is
based on four site cases with consulting companies and internal marketing departments of
German SMEs, realised through 14 semi-structured in-depth interviews and correlated
documents. The findings of the research reveal that no model for the management of price
and product policy interdependencies was available. In particular, the organisation,
implementation and management of interdependencies for successfully implementing policies
within the marketing mix was lacking. This study shows that a coherent, structured marketing
mix is the basis for marketing-mix-management success. Marketers have to be aware that
management’s culture or orientation may reflect the stakeholders’ perception of their firm.
Features linked to companies’ capabilities, such as international business experience, modes
of market entry and dynamic organisational characteristics, make their marketing-mix-
management more successful. This study suggests how to identify mix policies and their
interdependencies and how to manage a structured marketing mix successfully, illustrating
these topics using a subcontracting sub-activity model, whereas earlier studies have focused
on a step-by-step plan.
Keywords – Marketing mix, marketing strategies, B2B, SME
INTRODUCTION
The emergence of marketing-mix-management, where methods and procedures are developed
for executing the marketing mix, has been a topic for researchers and practitioners for many
decades (Grönroos, 1994). The aims of marketing-mix-management are to plan, organise, and
control the marketing mix, to meet stakeholders’ requirements, to increase revenue
generation, and to improve resource allocation. The lack of an in-depth account of the manner
in which a marketing mix is realised, however, has a complicated effect on the
implementation of this style of management. German small and medium-sized enterprises
(SMEs) in the business-to-business (B2B) industry have received little attention from
researchers in this context (Kleinaltenkamp and Saab, 2009; O'Dwyer et al., 2009),
notwithstanding the fact that 89.6% of German industry consists of SMEs (IFM, 2013).
Although the literature on these firms’ marketing practices is well-developed (Spence and
Essoussi, 2010), only a few specific studies relating to marketing-mix-management have yet
been published (Spence and Essoussi, 2010; Mitchell and Hutchinson, 2012). On the other
hand, a considerable amount of research has been done on marketing mix management
models in the context of the coordination and arrangement of international policies (Richter,
2012).
The potential for the arrangement of an integrated marketing mix that includes firms’
interdependencies is enormous and associated with high stakeholder satisfaction, making it a
crucial aspect of success in the German market (Kleinaltenkamp and Saab, 2009). The
behaviour of small companies follows patterns that differ from those of larger companies
with regard to a structured marketing-mix-management approach (Gabrielli and Balboni,
2010). Thus, because SMEs in the German B2B industry are subjected to increased
1 University of Gloucestershire, School of business and management, Park Campus, The Park, Cheltenham GL50 2RH
United Kingdom. E-mail: [email protected]
International Journal of Economics, Finance and Business Management Studies | JUERGEN WIELAND| 26
VOLUME 4 ISSUE 1 ISBN: 978-1-911185-80-2 (Online) ISSN: 2397-6926 (Online) www.flepublications.com
competition in the so-called D-A-CH region (which includes Germany, Austria, and
Switzerland), these companies are compelled to seek opportunities that cater increasingly to
stakeholders’ needs to bolster stakeholder loyalty and to improve their service (O'Dwyer et
al., 2009). An integrated marketing-mix with clearly-defined interdependencies represents the
ultimate response in the effort to manage these various aspects of marketing management
(Kleinaltenkamp and Saab, 2009).
German B2B enterprises are challenged by rising competition in the globalised and
fast-changing market, by increasing price competition, quality standards, and customer
expectations, as well as by changing market demands. Only those organisations can survive
that are able to establish an acceptable price while maintaining high standards of quality and
increasing their customer orientation, which is made possible through a structured marketing-
mix-management approach (Vignali et al., 2012). Small and medium-sized B2B enterprises
represent Germany’s ‘industrial elite’, employing 46,000 specialists and ranking first among
high-technology machinery producers worldwide (CAEF, 2013). To conduct a
comprehensive and applicable marketing-mix is a mandatory component of the overall
marketing strategy for German B2B enterprises (Bruhn, 2003). According to the scarce
literature on SMEs’ marketing-mix-management and the inherent need for an all-embracing
marketing mix, the following research gap is formulated:
RG: To explore the extent to which limited resources and high competition in the
German B2B industry of SMEs impact the adoption of a structured marketing-mix-
management approach with integrated interdependency management.
For the analysis of this research gap, a comparative overview of the main concepts of
marketing-mix-management and an analysis of market behaviour of perceived high
competition are presented. Afterwards, the methodology is explained and the interviews are
analysed. Finally, the implications of the study findings for marketing managers and
researchers are discussed.
LITERATURE REVIEW
The benefit of a valuable marketing mix
The benefit of a valuable marketing-mix-management lies in the fact that it helps meet the
requirements of different types of stakeholders, boosts sales and generates higher profits
(Pepels, 2013). A highly structured marketing mix refers to a mix with a high impact on
stakeholder loyalty (Brooks and Simkin, 2012), particularly when marketing activities are
clearly communicated to the stakeholders. A well-suited marketing-mix-management
programme is quickly accepted and permits stakeholders to personally identify with the
marketing-mix programme. This leads to stakeholder loyalty and satisfaction and sometimes
to their active engagement (Vrontis et al., 2009). The basis for this relationship is the
thorough analysis of the sub-instruments the stakeholder needs, building interdependency
relationships between those sub-instruments and arranging them within the mix (Pepels,
2013). This basis allows marketers to gain synergies from a standardised product portfolio
and to convey this marketing concept to stakeholders who are open to its significance and
attitudes (Kimery and Rinehart, 1998). Interferences within the marketing-mix possibly lead
stakeholders to respond negatively to marketing activity (Green, 2008). Consequently, a re-
conceptualised marketing-mix-management concept involves the identification of sub-
instruments, effective management of interdependencies and the development of a valuable
marketing-mix-management model.
Marketing-mix-management
Recent studies on marketing-mix-management focus on relevant processes and factors in
SMEs’ and LOs’ management of marketing-mix and interdependencies. Depending on the
industry and the target of the marketing plan, marketers will take approaches to each of the 4
International Journal of Economics, Finance and Business Management Studies| 27
© 2018 The Author | IJEFBM 2018 © 2018 FLE Learning
Ps in terms of planning, organising and controlling them (AMA, 2014). Recent studies on
marketing-mix-management add that the marketing mix is a set of various tools that can be
controlled in combination with interdependency management (Chenhall, 2007; Desmond,
2004; Skitmore, 2009). Given these facts, these processes are analysed and compared.
Marketing mix planning
Marketing managers need to account for interdependencies among the 4 Ps and marketing
mix planning, particularly when determining the appropriate level of budget and its allocation
to marketing strategies and the practical implementation of marketing-mix targets (Naik et
al., 2005). Marketing mix planning is, in particular, the synchronisation of all operational
sub-instruments to achieve a perfect combination to meet corporate and marketing objectives
(Brooks and Simkin, 2012).
Within SMEs, the marketing mix managers are the functional persons who plan the
marketing-mix and allocate resources and products on the market (Cespedes, 2012). Banterle
et al. (2013) further note that the marketing-mix plan has to be aligned according to the
overall business strategy. Within the marketing mix, only objectives which can be
definitively realised and objectively measured should be planned (Banterle et al., 2013).
Marketing mix organisation
Marketing mix organisation can be linked back to marketing mix planning, as it focuses not
only on target derivation, strategy definition and practical implementation of derived targets,
but is also based on the practical implementation of marketing mix targets (Robins, 1991).
Robins (1991) Robins (1991) stresses that the marketing team should give individual and
detailed attention to each element of the marketing mix, the evaluation has to be continuous
and the marketing mix organisation should be more rigorous. The crucial step in deriving
targets is to plan alternative actions that are achieved through a thorough marketing mix plan
(Helbig, 2009). Gatignon and Hanssens (1987) note that LOs tend to measure the
effectiveness of mix variables with time series or cross-sectional data. In the case of SMEs,
marketing mix effectiveness is measured by focusing only on a small subset of marketing mix
variables and not on the entire mix (Herche, 1994). Furthermore, in SMEs, the organisation
of the entire marketing mix is handled in a less formalised manner than in LOs (Dickinson
and Ramaseshan, 2004). Wilthorn et al. (2013, p. 4) state that in practice there exist
differences in large organisations compared to smaller ones with regard to the organisation of
the marketing mix, “where it is argued that small-sized enterprises typically are family owned
or entrepreneurial organisations with a more collegial and less formalised internal system”.
Gatignon and Hanssens (1987) add that, in SMEs, the key elements regarding the
organisation of the marketing mix widely differ from those used in large operations.
Marketing mix control
The marketing mix which SMEs and LOs introduce must be subject to control. Clearly
quantifiable and measurable objectives are the main factor for marketing managers to focus
on when controlling the marketing mix. This requires control over budget expenditure,
performance of each mix variable and the monitoring of interdependencies (Lidstone, 1987).
LOs of the German B2B industry develop internal fluid sets of guidelines for action that
require constant innovation in the light of changing circumstances (Holloway, 2004). To
maximise the effort of marketing mix control, different control systems are used by large
enterprises: they use performance control, create strategic control, carry out financial control
or develop quality control mechanisms (Holloway, 2004). In practice, it is often difficult to
discern how control of the marketing mix is achieved, as there also exist differences between
sales-driven and relationship-driven marketers (Merrilees et al., 2011). Comparing LOs and
SMEs of the German B2B industry, the former tend to be relationship-driven and listen more
to the needs of stakeholders, and may adapt the marketing mix accordingly (Merrilees et al.,
International Journal of Economics, Finance and Business Management Studies | JUERGEN WIELAND| 28
VOLUME 4 ISSUE 1 ISBN: 978-1-911185-80-2 (Online) ISSN: 2397-6926 (Online) www.flepublications.com
2011). The latter are much more sales-driven and make adjustments to marketing reasons to
boost sales and increase profit margins (Swoboda and Olejnik, 2013). Needless to say, a
sales-driven SME of the German B2B industry is able to use their niche market power to set
differential price margins across different markets. Merrilees et al. (2011) find that
relationship-driven firms may not necessarily make greater adaptations to their marketing
mix to meet stakeholders’ requirements, but will exercise more control over it.
Interdependency management
It is suggested that interdependency management can be viewed as a strategic process for
preparing, implementing and optimising mix-variables and their interdependencies and
embedding this within a marketing-mix-management approach within the overall
organisational structure (Patanakul and Milosevic, 2008). According to Naik et al. (2005),
marketing-mix-management can only be successful if interdependencies between mix
variables are used in a synergic manner. A few papers study interdependency management in
SMEs, and their results show that it is an integrative part of marketing-mix-management
(Codita, 2010). Jagpal et al. (1982, p. 401) state that identifying and defining marketing-mix
interdependencies “allows more effective control of marketing instruments”. This explicitly
enhances productiveness “of a given marketing instrument to depend on the time path of the
entire marketing mix”. Looking forward and reasoning backward increases an SME’s own
optimal decisions in response to the best decisions made by all other competitors (Naik et al.,
2005). In conclusion, SMEs do not seem to have been attracted by the advantages of
interdependency management in the past, but have changed their opinion due to increased
competition and fast-changing stakeholder requirements. A summary of this discussion can
be found in Table 1. The literature review and the contradictions found there lead to the
following research questions:
How is marketing-mix-management standardisation realised by SMEs in the German
B2B industry?
What are the key drivers in the interdependency management of SMEs in the German
B2B industry?
What processes do SMEs follow in interdependency management, and how are these
processes different from those of LOs?
Table 1: Comparison of marketing-mix-management in SMEs and LOs
SMEs LOs
Marketing mix planning Limited and reductive concept with
functional purpose.
Fully integrated concept within the
marketing-mix-management
approach. This concept is aligned
with the overall business strategy.
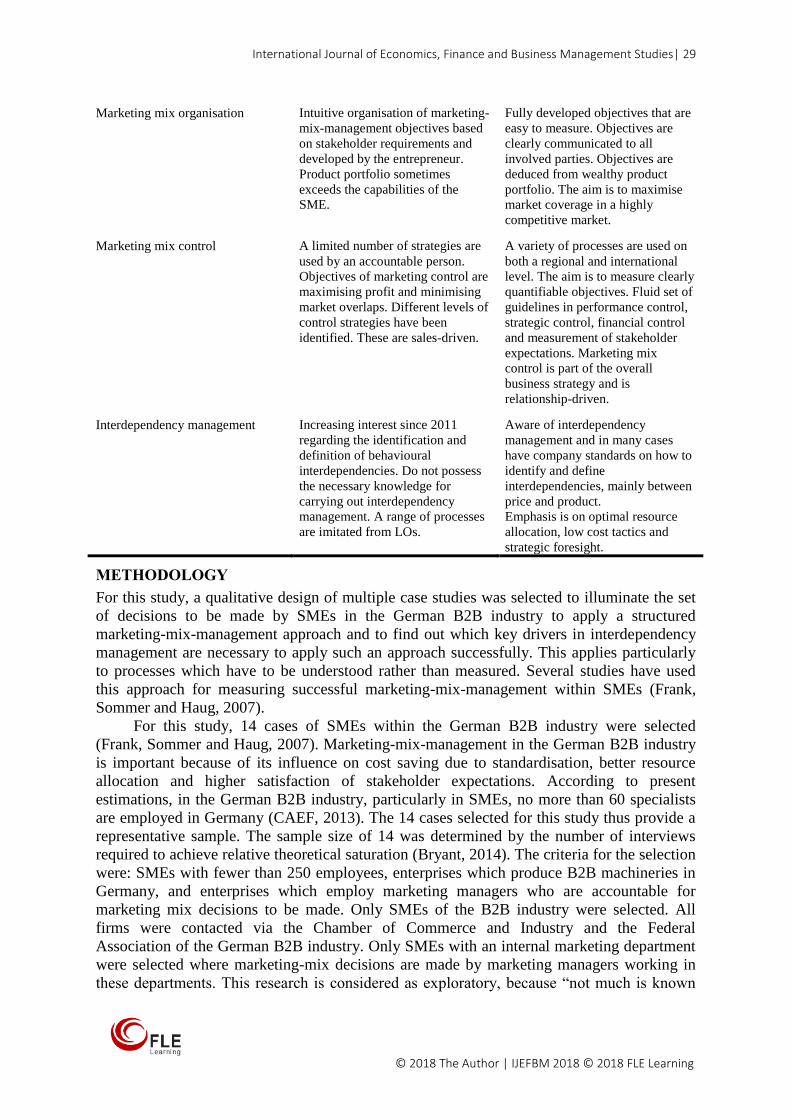
International Journal of Economics, Finance and Business Management Studies| 29
© 2018 The Author | IJEFBM 2018 © 2018 FLE Learning
Marketing mix organisation Intuitive organisation of marketing-
mix-management objectives based
on stakeholder requirements and
developed by the entrepreneur.
Product portfolio sometimes
exceeds the capabilities of the
SME.
Fully developed objectives that are
easy to measure. Objectives are
clearly communicated to all
involved parties. Objectives are
deduced from wealthy product
portfolio. The aim is to maximise
market coverage in a highly
competitive market.
Marketing mix control A limited number of strategies are
used by an accountable person.
Objectives of marketing control are
maximising profit and minimising
market overlaps. Different levels of
control strategies have been
identified. These are sales-driven.
A variety of processes are used on
both a regional and international
level. The aim is to measure clearly
quantifiable objectives. Fluid set of
guidelines in performance control,
strategic control, financial control
and measurement of stakeholder
expectations. Marketing mix
control is part of the overall
business strategy and is
relationship-driven.
Interdependency management Increasing interest since 2011
regarding the identification and
definition of behavioural
interdependencies. Do not possess
the necessary knowledge for
carrying out interdependency
management. A range of processes
are imitated from LOs.
Aware of interdependency
management and in many cases
have company standards on how to
identify and define
interdependencies, mainly between
price and product.
Emphasis is on optimal resource
allocation, low cost tactics and
strategic foresight.
METHODOLOGY
For this study, a qualitative design of multiple case studies was selected to illuminate the set
of decisions to be made by SMEs in the German B2B industry to apply a structured
marketing-mix-management approach and to find out which key drivers in interdependency
management are necessary to apply such an approach successfully. This applies particularly
to processes which have to be understood rather than measured. Several studies have used
this approach for measuring successful marketing-mix-management within SMEs (Frank,
Sommer and Haug, 2007).
For this study, 14 cases of SMEs within the German B2B industry were selected
(Frank, Sommer and Haug, 2007). Marketing-mix-management in the German B2B industry
is important because of its influence on cost saving due to standardisation, better resource
allocation and higher satisfaction of stakeholder expectations. According to present
estimations, in the German B2B industry, particularly in SMEs, no more than 60 specialists
are employed in Germany (CAEF, 2013). The 14 cases selected for this study thus provide a
representative sample. The sample size of 14 was determined by the number of interviews
required to achieve relative theoretical saturation (Bryant, 2014). The criteria for the selection
were: SMEs with fewer than 250 employees, enterprises which produce B2B machineries in
Germany, and enterprises which employ marketing managers who are accountable for
marketing mix decisions to be made. Only SMEs of the B2B industry were selected. All
firms were contacted via the Chamber of Commerce and Industry and the Federal
Association of the German B2B industry. Only SMEs with an internal marketing department
were selected where marketing-mix decisions are made by marketing managers working in
these departments. This research is considered as exploratory, because “not much is known
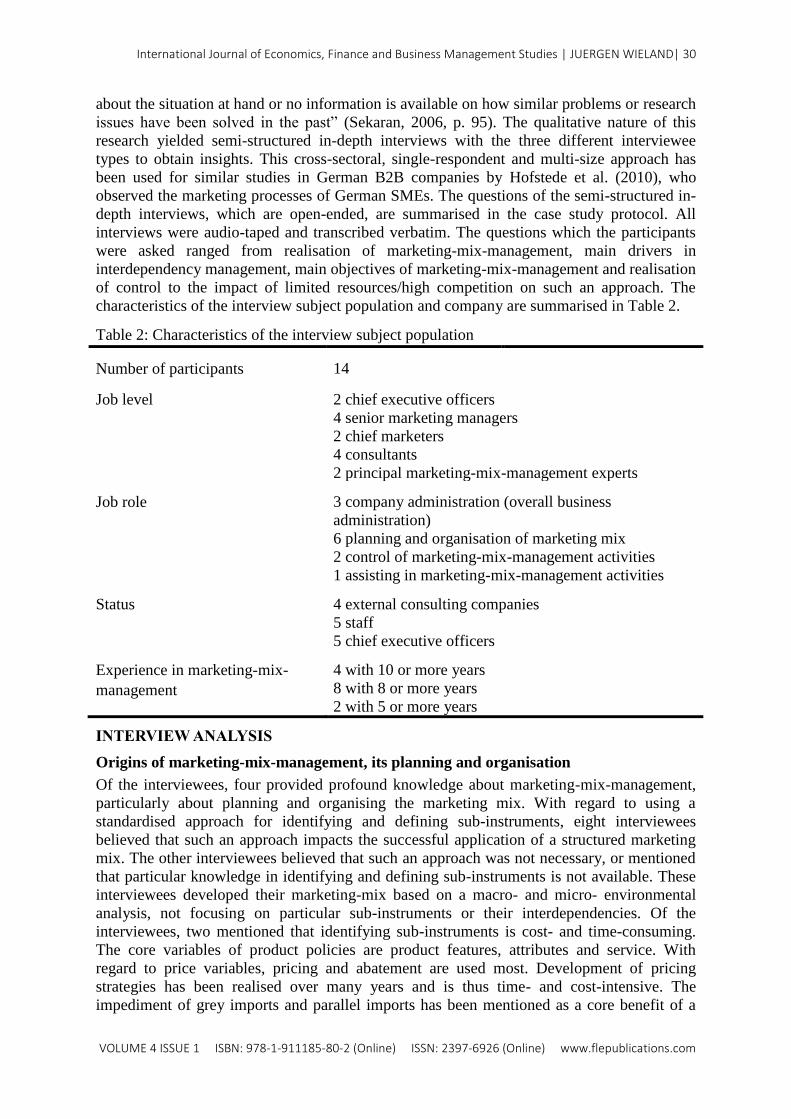
International Journal of Economics, Finance and Business Management Studies | JUERGEN WIELAND| 30
VOLUME 4 ISSUE 1 ISBN: 978-1-911185-80-2 (Online) ISSN: 2397-6926 (Online) www.flepublications.com
about the situation at hand or no information is available on how similar problems or research
issues have been solved in the past” (Sekaran, 2006, p. 95). The qualitative nature of this
research yielded semi-structured in-depth interviews with the three different interviewee
types to obtain insights. This cross-sectoral, single-respondent and multi-size approach has
been used for similar studies in German B2B companies by Hofstede et al. (2010), who
observed the marketing processes of German SMEs. The questions of the semi-structured in-
depth interviews, which are open-ended, are summarised in the case study protocol. All
interviews were audio-taped and transcribed verbatim. The questions which the participants
were asked ranged from realisation of marketing-mix-management, main drivers in
interdependency management, main objectives of marketing-mix-management and realisation
of control to the impact of limited resources/high competition on such an approach. The
characteristics of the interview subject population and company are summarised in Table 2.
Table 2: Characteristics of the interview subject population
Number of participants 14
Job level 2 chief executive officers
4 senior marketing managers
2 chief marketers
4 consultants
2 principal marketing-mix-management experts
Job role 3 company administration (overall business
administration)
6 planning and organisation of marketing mix
2 control of marketing-mix-management activities
1 assisting in marketing-mix-management activities
Status 4 external consulting companies
5 staff
5 chief executive officers
Experience in marketing-mix-
management
4 with 10 or more years
8 with 8 or more years
2 with 5 or more years
INTERVIEW ANALYSIS
Origins of marketing-mix-management, its planning and organisation
Of the interviewees, four provided profound knowledge about marketing-mix-management,
particularly about planning and organising the marketing mix. With regard to using a
standardised approach for identifying and defining sub-instruments, eight interviewees
believed that such an approach impacts the successful application of a structured marketing
mix. The other interviewees believed that such an approach was not necessary, or mentioned
that particular knowledge in identifying and defining sub-instruments is not available. These
interviewees developed their marketing-mix based on a macro- and micro- environmental
analysis, not focusing on particular sub-instruments or their interdependencies. Of the
interviewees, two mentioned that identifying sub-instruments is cost- and time-consuming.
The core variables of product policies are product features, attributes and service. With
regard to price variables, pricing and abatement are used most. Development of pricing
strategies has been realised over many years and is thus time- and cost-intensive. The
impediment of grey imports and parallel imports has been mentioned as a core benefit of a
International Journal of Economics, Finance and Business Management Studies| 31
© 2018 The Author | IJEFBM 2018 © 2018 FLE Learning
standardised pricing strategy. Of the interviewees, two mentioned that in standardising the
price mix internal issues such as goals and objectives of the company, research and
production have to be taken into account. In planning a structured marketing mix, the
activities have been focused on analysing, particularly competition-, macro-, micro-, and
organisational factors. All interviewees used common analysis tools for examining the
current situation. SWOT analysis, BCG-analysis, PLC, Porter’s five forces were mentioned
most often. Few interviewees used marketing-mix-management approaches, particularly
brand aid-models, mix-mapping methods and stratics models to plan and organise mix
variables. Interestingly, four interviewees mentioned that they plan to use a structured
marketing-mix-management approach in the future.
Marketing mix control
SMEs in the German B2B industry have developed several strategies to undertake marketing
mix control to measure the performance outcome of mix variables, budget expenditure and
stakeholder satisfaction. The interviewees mentioned that clearly quantifiable and measurable
marketing mix objectives are the main factor in successfully controlling a marketing mix.
This proposition is clearly underlined by the current literature, which states that mix variables
have to be quantified to be successfully measured (Lidstone, 1987). In practice, SMEs use a
wide range of decisions outlining the marketing mix strategies to be adopted and the tactics to
be employed to achieve the plan’s objectives. Of the interviewees, seven mentioned that they
used marketing cost analysis and management by objectives as marketing control tools. All
respondents further noted that competitor analysis and stakeholder analysis are requirements
for controlling marketing-mix targets. SMEs in the German B2B industry base their
marketing mix control on long-term figures of market share, revenue, profit and return on
investment. The issue on controlling is communicated via a clear and rigorously defined
process to all involved parties. Of the interviewees, four emphasised marketing mix mapping
and market segmentation approaches as valuable long-term control tools. Relationship-driven
companies control their activities more successfully, as they have greater access to
information about stakeholders’ wants, marketplaces and competitors. These findings are
confirmed by Merrilees et al. (2011), who state that relationship-driven firms exercise their
marketing mix control to meet stakeholder needs and have more control over this process
than sales-driven companies. The interviewees further noted that long-term control is the
basis for exceeding stakeholder expectations. It seems that relationship-driven companies
possess much larger information bases for carrying out control issues than sales-driven
companies. The interviews show not only that clear controlling guidelines and the
commitment of all involved parties are essential, but also that it is necessary to integrate the
controlling task within the marketing-mix-management process and overall business strategy.
By doing so, a structured marketing-mix-management process is ensured.
Interdependency management
The interviewees suggested that a relational model is used to support the strategic process for
preparing, implementing and optimising mix variables, and for embedding this process within
a structured marketing-mix-management approach. The participants mentioned that such a
relational model is a radical innovation and enables the marketer to add value to the
marketing mix and to increase the chance of successful application. Of the interviewees,
seven mentioned that such a framework leads to repeat purchase and enhances stakeholder
satisfaction. This argument is supported by the fact that identification of interdependencies
helps the marketer to optimise mix variables. This in turn enables the definition of such
variables according to stakeholder requirements. The interviewees stated that such a
framework is dictated by German B2B trends, because these SMEs launch up to two new
International Journal of Economics, Finance and Business Management Studies | JUERGEN WIELAND| 32
VOLUME 4 ISSUE 1 ISBN: 978-1-911185-80-2 (Online) ISSN: 2397-6926 (Online) www.flepublications.com
product lines a year. They also mentioned that the companies have to offer training to enable
such innovations. For the successful application of a marketing-mix-management framework,
mix variables have to be used in a synergic manner, as this allows for the effective
application of marketing instruments, reduces time and saves money. German SMEs
standardise their products to a high degree, which also ensures production efficiency. By
managing interdependencies in a synergic way, productiveness is increased and unnecessary
waste of resources is reduced. Of the interviewees, six stated that they know many marketers
do not possess the necessary knowledge for managing interdependencies; two said they know
marketers who have never heard of this issue.
DISCUSSION
In comparison to Los, where marketing-mix-management is created via measurable
objectives by the controlling department to answer the needs of stakeholders, increase
business performance and enhance resource allocation, marketing-mix-management in
German B2B SMEs is based on the overall business strategy of the general management. The
marketing mix creation should concentrate on much more focused contexts such as product
launch, attributes and features, as realised by German B2B SMEs. Consistent with the
literature on marketing-mix-management in LOs, the general management of SMEs has to
concentrate on a manageable product portfolio with no more than four product lines (Kauf
and Kniess, 2014). Over the years, marketers in SMEs have gained knowledge about how to
measure the effectiveness of mix variables (Hofstede et al., 2010). Research shows that
German B2B SMEs use less formalised internal systems than LOs to plan, organise, and
control a structured marketing mix and to identify price and product policy
interdependencies. This leads to the first proposition:
P1 In German B2B SMEs, less formalised marketing-mix-management
approaches are used because of missing knowledge.
This study confirms the findings by Coviello et al. (2002) that firms plan their
marketing mix based only on a small subset of marketing mix variables, not on the entire
mix. Studies show that handling the whole marketing mix in a formalised manner leads to
higher stakeholder satisfaction (Dickinson and Ramaseshan, 2004). LOs make full use of
primary macro- and micro-economic data. This enhances the integration of price and product
policy interdependencies into the marketing mix and the exploitation of synergic effects. The
contribution of this article, therefore, is that marketing mix variables have to be developed in
a synergic and formalised manner. The measurement of the effectiveness of price and product
variables serves as a basis to enhance marketing-mix-management in SMEs. Since these
firms have limited resources for marketing mix creation and interdependency management,
measurable marketing mix objectives increase German B2B SMEs’ chance of applying the
marketing-mix successfully, hence the following research proposition regarding marketing
mix control in German B2B SMEs:
P2a In German B2B SMEs, clearly quantifiable marketing mix objectives are a
relevant factor of success to be used for marketing mix control.
P2b For German B2B SMEs, clearly quantifiable marketing mix objectives provide
a low cost enhancement of marketing-mix-management.
It was also found that functional and systematically outlined marketing mix objectives
were used in the development of a strong marketing mix to achieve planned objectives,
thereby supporting a number of studies (Lidstone, 1987). Clearly outlined responsibilities,
direct communication and staff responsible for taking corrective actions and management by
objectives seem to prevail, enabling higher profits and providing a solid long-term basis for
enhancing marketing-mix-management success. This leads to the third set of propositions:
International Journal of Economics, Finance and Business Management Studies| 33
© 2018 The Author | IJEFBM 2018 © 2018 FLE Learning
P3a In German B2B SMEs, functional and systematically outlined marketing mix
objectives contribute to the development of a strong marketing mix.
P3b In German B2B SMEs, functional and systematically outlined marketing mix
objectives provide a basis for long-term success.
As suggested by Gatignon and Hanssens (1987), a functional interdependency
framework helps provide optimal resource allocation and increased efficiency in pricing
strategies. In sum, functionally outlined marketing mix objectives provide segment
standardisation statements. The functional interdependency framework is an integral part of
the marketing-mix-management approach. To support the integration of the interdependency
framework, as well as the integration of price and product policy standardisation, the
introduction of prioritisation, classification, mapping and controlling of interdependencies as
separate steps enhances marketing mix success and helps lower cost while raising efficiency.
On this basis, two propositions are made:
P4a In German B2B SMEs, interdependency management increases marketing mix
success, particularly regarding higher efficiency and lower costs.
P4b In German B2B SMEs, an integrated interdependency framework and
standardised identification strategy of policies are essential in supporting marketing-
mix-management.
Managerial implications
This study demonstrates that the use of a structured marketing-mix-management approach in
German B2B SMEs provides positive results. Marketing mix managers have to be aware that
the way they identify and define price and product policies and their interdependencies
strongly impacts both stakeholder satisfaction and resource allocation. Defined mix variables
therefore have to be synergic in their behaviour. Among standardised product features,
attributes and pricing strategies which have to be standardised before structuring the
marketing mix enhance marketing-mix-management at low costs. Aligning marketing-mix-
management strategies with overall business strategies reduces risk while creating new
product lines and penetrating new markets. A clear procedure of managing price and product
policy interdependencies both enhances marketing-mix success and serves as a knowledge
tool for marketers. Finally, a strict focus has to be kept on a manageable product portfolio,
which should include no more than four machineries. Clear communication between all
involved parties might be ensured with a standardised request for information.
Limits and future research
This study was limited to 14 marketers specialising in the B2B industry and can, therefore,
only be generalised with caution. Only one key marketer from each organisation was
interviewed, which is justified by the fact that SMEs generally employ no more than one
marketing mix manager.
Nevertheless, future research may improve the generalisability of the exploratory
findings presented in this research within the application of a structured marketing-mix-
management approach and across other markets. The findings of this study provide further
topics to be investigated in the field of marketing-mix-management. By answering the
following questions, further insights could be provided:
To what extent is the use of price and product policies standardised by German B2B
SMEs?
Under what conditions are price and product policies identified and defined?
International Journal of Economics, Finance and Business Management Studies | JUERGEN WIELAND| 34
VOLUME 4 ISSUE 1 ISBN: 978-1-911185-80-2 (Online) ISSN: 2397-6926 (Online) www.flepublications.com
Which change management strategies are efficient for marketing-mix-management in
German B2B SMEs?
REFERENCE
Banterle, A. et al. (2013) Food SMEs Face Increasing Competition in the EU Market:
Marketing Management Capability Is a Tool for Becoming a Price Maker.
Agribusiness, 30(2), 113-131.
Brooks, N. and Simkin, L. (2012) Judging marketing mix effectiveness. Marketing
Intelligence & Planning, 30(5), 494-514.
Bruhn, M. (2003) Relationship marketing: Management of customer relationships. London:
Pearson Education Limited.
Cespedes, F. (2012) Coordinating marketing and sales in B2B organizations. In: Lilien, G.L.
and Grewal, R. (eds.) Handbook of Business to Business Marketing. London: Edward
Elgar Publishing.
Codita, R. (2010) Contingency factors of marketing-mix Standardization. Berlin: Springer-
Verlag.
Coviello, N. E. et al. (2002) How firms relate to their markets: an empirical examination of
contemporary marketing practices. Journal of marketing, 66(3), 33-46.
Dickinson, S. and Ramaseshan, B. (2004) An investigation of the antecedents to cooperative
marketing strategy implementation. Journal of Strategic Marketing, 12(2), 71-95.
Frank, K., Sommer, L. and Haug, M. (2007) Medium-sized automotive supplier and the
marketing mix: a missed opportunity? [Mittelständische Automobil-Zulieferer und
Marketing-Mix- eine verpasste Chance?] University of Albstadt Sigmaringen.
Gabrielli, V. and Balboni, B. (2010) SME practice towards integrated marketing
communications. Marketing Intelligence & Planning, 28(3), 275-290.
Gatignon, H. and Hanssens, D. M. (1987) Modeling Marketing Interactions with Application
to Salesforce Effectiveness. Journal of Marketing Research, 24(3), 247-257.
Green, A. (2008) Planning for effective evaluation: Are marketers really doing it? Journal of
Sponsorship, 1(4),357-363.
Helbig, T. M. A. (2009) Innovationsmanagement im technischen Vertrieb. Lohmar. Köln:
Eul.
Herche, J. (1994) Ethnocentric tendencies, marketing strategy and import purchase
behaviour. International Marketing Review, 11(3), 4-16.
Hofstede, G. J. et al. (2010) Towards a cross-cultural typology of trust in B2B food trade.
British Food Journal, 112(7), 671-687.
Holloway, J. C. (2004) Marketing for tourism. New York: Financial Times/Prentice Hall.
IFM (2013) Development of SMEs in Germany: 2013. Bonn: Federal Office of Statistics.
Jagpal, H. S., Sudit, E. F. and Vinod, H. D. (1982) Measuring dynamic marketing mix
interactions using translog functions. Journal of Business, 55(3),401-415.
Kauf, F. and Kniess, J. (2014) Managing Innovation During Economic Changes and
Crisis:“How Small and Mid-Sized Enterprises React”'. In: Rüdiger, K., Peris-Ortiz, M.,
Blanco-González, A. (eds.) Entrepreneurship, Innovation and Economic Crisis. Berlin:
Springer International Publishing, 85-95.
Kimery, K. M. and Rinehart, S. M. (1998) Markets and constituencies: an alternative view of
the marketing concept. Journal of Business Research, 43(3), 117-124.
Kleinaltenkamp, M. and Saab, S. (2009) [Technical sales: A practical introduction into
business-to-business marketing] Technischer Vertrieb: Eine praxisorientierte
Einführung in das Business-to-Business-Marketing. Berlin: Springer International
Publishing,
International Journal of Economics, Finance and Business Management Studies| 35
© 2018 The Author | IJEFBM 2018 © 2018 FLE Learning
Lidstone, J. (1987) How Will We Know When We've Arrived? Implementing and controlling
the marketing plan. Journal of Marketing Management, 3(1), 61-71.
Merrilees, B., Rundle-Thiele, S. and Lye, A. (2011) Marketing capabilities: Antecedents and
implications for B2B SME performance. Industrial Marketing Management, 40(3),
368-375.
Naik, P. A., Raman, K. and Winer, R. S. (2005) Planning marketing-mix strategies in the
presence of interaction effects. Marketing Science, 24(1), 25-34.
O'Dwyer, M., Gilmore, A. and Carson, D. (2009) Innovative marketing in SMEs. European
Journal of Marketing, 43(1/2), 46-61.
Patanakul, P. and Milosevic, D. (2008) A competency model for effectiveness in managing
multiple projects. The Journal of High Technology Management Research, 18(2), 118-
131.
Pepels, W. (2013) Productmanagement: Product Innovation -Branding - Programme
Planning - Process Organisaiton [Produktmanagement: Produktinnovation-
Markenpolitik-Programmplanung-Prozessorganisation]. Oldenbourg
Wissenschaftsverlag.
Richter, T. (2012) International marketing mix management: Theoretical framework,
contingency factors and empirical findings from world-markets. Berlin: Logos Verlag.
Robins, F. (1991) Marketing planning in the larger family business. Journal of Marketing
Management, 7(4), 325-341.
Sekaran, U. (2006) Research methods for business: A skill building approach. US: John
Wiley & Sons.
Spence, M. and Essoussi, L. H. (2010) SME brand building and management: an exploratory
study. European Journal of Marketing, 44(7/8), 1037-1054.
Swoboda, B. and Olejnik, E. (2013) A taxonomy of small-and medium-sized international
family firms. Journal of International Entrepreneurship, 11(2), 130-157.
Vignali, C., Vignali, G. and Ryding, D. V. (2012) Discount retailing, a European test case for
perceived value as a basis for shaping the firm's offer. International Journal of Business
and Globalisation, 8(2), 239-255.
Vrontis, D., Thrassou, A. and Lamprianou, I. (2009) International marketing adaptation
versus standardisation of multinational companies. International Marketing Review,
26(4/5), 477-500.
Wilthorn, C., Larsson, M. and Henriksson, H. (2013) Supplier-Buyer Relationships within the
Small-Sized Fashion Retail Industry: A qualitative study of relationship marketing
within small-sized fashion retailers in Sweden. Ph.D thesis, Linnaeus University,
School of Business and Economics
International Journal of Economics, Finance and Business Management Studies | NUR AIMA SHAFIE | 36
VOLUME 4 ISSUE 1 ISBN: 978-1-911185-80-2 (Online) ISSN: 2397-6926 (Online) www.flepublications.com
4.07-AU19-5281
DO ORGANISATIONAL CULTURE AND STRUCTURE ENHANCE
INTERNAL CONTROL EFFECTIVENESS? EVIDENCE FROM
MALAYSIAN SOCIAL COOPERATIVES
NUR AIMA SHAFIE1,2, MARLIA OTHMAN, ABD HALIM MOHD NOOR, ZURAIDAH
MOHD SANUSI AND RAZANA JUHAIDA JOHARI
ABSTRACT
Similar to the private and public sector, internal control in social cooperative plays an
important role on the success of the organisation and is a mirror to effective governance.
Nonetheless, little is known about the effectiveness of internal control of cooperative in
Malaysia, as current practice does not require the organisation to follow any prescribed
standard of internal control or to report it in their annual report. Hence, this study will shed
some light on the factors that influence the effectiveness of internal control in cooperative.
This study examines the impact of the cooperatives’ organisational culture, organisational
structure and the age of the cooperative on internal control effectiveness. Data was collected
using questionnaires, which were distributed to ‘Top 100 Cooperatives’ for the year 2014.
Based on the analysis of the 56 responses received, regression analysis revealed that only
organisational culture and cooperative age shows a significant relationship with internal
control effectiveness in Malaysian cooperatives.
Key words: Internal control effectiveness, cooperative, social enterprises, contingency
characteristic
INTRODUCTION
The establishment and movement of cooperatives globally have been driven by ideas of
democracy founded on a socioeconomic philosophy that suggests an expansion of decision-
making power from small minority shareholders to a large majority of public shareholders.
The formation of a cooperative fulfils the need and demand of economically deprived
community by pursuing social and economic goals, involving the provision of services and
the community’s economic revitalisation (Leviten-Reid and Fairbairn, 2011). The
International Cooperative Alliance (ICA) defines the term cooperative as “an autonomous
association of person united voluntarily to meet their common economic, social and cultural
needs and aspirations through a jointly owned and democratically controlled enterprise.”
Cooperative principles are based on the strong orientation towards the general interest of
public, in contrast with most traditional private companies. Cooperatives, which pool together
their collective resources, assist less fortunate people in reducing the risk of vulnerability and
in rising out of poverty. These social problems can be alleviated through a collective
approach towards social protection as a practice by cooperative (UN, 2003; Hagen, 2004).
The cooperative is different from traditional private firms and traditional non-profit
organisations. They not only combine the social goals of the traditional non-profit
organisation with the commercial characteristics of a corporation, but also have a unique
ownership and membership structure. The cooperative members have full control over the
firm, but not over its profit; cooperatives are allowed to distribute part of the profit, but their
assets are normally locked (Hansman, 1996). The cooperative has a multiple stakeholder
membership, including its governance, and different actors participate in the production
process, including workers, volunteers and customers (Thomas, 2004). Based on its
1 Faculty of Accountancy, Universiti Teknologi MARA, Malaysia 2 Accounting Research Institute (ARI), Universiti Teknologi MARA, Malaysia
International Journal of Economics, Finance and Business Management Studies| 37
© 2018 The Author | IJEFBM 2018 © 2018 FLE Learning
principles and structure, a cooperative can be seen as a type of social enterprise, and it
represents one of the most developed and successful models of such an enterprise (Borzaga et
al., 2014).
Cooperatives have similar requirements to other business organisations in achieving
business goals and performance, although they are different in organisational characteristics,
thus outlining the need and importance of internal control effectiveness in cooperative
organisations. O’Connor (2003) stated several reasons why corporate governance is difficult
in cooperatives compared to other organisations. One of the problems is the absence of
effective oversight (control) by the owners (directors) of cooperatives. Additionally,
compared to directors of public companies, cooperative directors typically have less expertise
and thus less incentive in providing effective corporate governance. Understanding that
effective internal control is a function of corporate governance, problems within the corporate
governance also indicate problems in its internal control. Cooperative without effective
internal control can lead to financial misappropriation by the person in charge within the
management.
Although the professional literature on internal control has made progress in discussing
internal control and its effectiveness, the amount of research within this area is scarce
(Jokipii, 2009), particularly on Malaysian cooperatives. There are several studies on internal
control in the private sector (e.g. public listed companies and small-medium enterprises), the
public sector and non-profit organisations in Malaysia (Fadzil, Haron and Jantan, 2006;
Haron, Rahman and Hanid; Ghazali, 2010; Mohamad-Nor, Shafie and Wan-Hussin, 2010;
Mohd-Sanusi, Mohd- Omar and Mohd-Nassir, 2015), but studies on internal control and
internal control effectiveness within Malaysian cooperative organisations context are very
limited. Very little literature focuses on the relationship between organisational culture,
organisational structure and the effectiveness of internal control. Hence, this study will
examine the influence of cooperative characteristics (organisation culture, organisation
structure, environmental factors and organisational age) on the effectiveness of internal
control.
THE DEVELOPMENT OF COOPERATIVES IN MALAYSIA
In Malaysia, the cooperative movement started in the early 20th century (SKM, 2014). The
idea of cooperatives was introduced to solve problems faced by rural farmers, who were
oppressed by middle-men or business mediators under the “padi kunca” system, and also to
solve problems of indebtedness by low-wage workers and civil servants in the city. In 1922,
“Sharikat Bersama-sama Kerja Bantu Membantu” was established in Taiping, Perak; at the
same time, the Cooperative Societies Enactment 1922 was enacted to supervise the “sharikat
kerjasama”, now known as “koperasi” (cooperatives). In the first year of the movement, six
rural credit cooperatives, three civil servants’ cooperatives and two cooperative stores were
established (SKM, 2014).
The Malaysian Cooperative Societies Act 1993 (Act 502) defined a cooperative as an
organisation built for the purpose of improving its members’ participation in economic and
social activities. Owned by a group of individuals, a cooperative is formed based on the
cooperative principles: open and voluntary membership, democratic management, limited
return based on members’ contributions, a fair distribution of profits, promotion of education
on cooperatives and active cooperation among registered cooperatives (SKM, 2014). Today,
under the administration of the Ministry of Domestic Trade, Cooperatives and Consumerism
(MDTCC) and under the regulation of the Malaysia Cooperative Societies Commission
(MCSC), Malaysian cooperatives are regulated by the Cooperative Societies Act 1993 (Akta
Koperasi 1993) (ACT 502) and the Malaysia Cooperative Societies Commission Act 2007
(Akta Suruhanjaya Koperasi Malaysia 2007) (SKM, 2014).
International Journal of Economics, Finance and Business Management Studies | NUR AIMA SHAFIE | 38
VOLUME 4 ISSUE 1 ISBN: 978-1-911185-80-2 (Online) ISSN: 2397-6926 (Online) www.flepublications.com
The National Cooperative Policy (NCP) was launched in 2002 with the aim of re-
developing cooperatives. It was introduced to outline several strategies to be implemented to
enable cooperatives to play an active role in business development, along with the public and
private sectors. The authority structure of cooperatives was also improved through the NCP
between 2002 and 2010 by having cooperatives monitored under the MDTCC and placed
under the sole authority of Malaysian Cooperative Societies Commission (MCSC).
The Malaysian government regards cooperatives as a platform for economic
development (Othman, Mohamad and Abdullah, 2013). It is taken as a tool in helping to
eliminate rural poverty and unequal income distribution, and in enhancing development in
both rural and urban areas. As a result of the local government transformation plan,
cooperatives have emerged into efficient businesses from being only small and rural, and
providing only basic services to their members (Mohamad, Othaman and Mohamad, 2013).
The role of cooperatives in uplifting the economic development of rural and urban areas has
been described under the New Economic Model (NEM): although on an individual basis
cooperatives may seem small, when combined and pooled together, the collective power of
cooperatives is very impressive.
ISSUES OF MALAYSIAN COOPERATIVES
Despite the growth in the terms of numbers of cooperative as recorded by MCSC and
Malaysia’s long history of cooperatives over the past 92 years (Raja-Yusof, Devi, Din, Nordi
and Saari, 2002), issues such as the absence of good governance and the weak structure in
some cooperatives have typically characterised Malaysia’s cooperative movement. These
problems have resulted in poor financial performance, poor cash flow and mismanagement
and noncompliance with the Cooperative Societies Act 1993 and its related legislation in this
sector (Bidin, 2007). These kinds of problems have hindered the movement and the
development of cooperatives as inspired by the government.
Issues such as absence of good corporate governance and lack of capital, along with a
weak structure, have resulted in poor cash flow and financial performance, mismanagement
and financial misappropriation in cooperatives (Bidin, 2007). In Malaysia, an example of an
infamous financial scandal involving cooperatives was the Deposit Taking Cooperative,
ANGKASA, MOCCIS, Bank Rakyat and the Cooperative Central Bank. The scandal
involved a large amount and the loss incurred was reported at more than RM 2 billion. In a
statement to the press, Royal Professor Ungku Aziz stressed his disappointment over the
scandal and the time it took to settle the investigation.
The scandal was a result of ineffective internal control in the organisation, and created
an urgency for regulators to implement better internal control in the organisation.
Nonetheless, up to date, it is still not mandatory for cooperatives to implement or to report on
their internal control in their annual report.
INTERNAL CONTROL EFFECTIVENESS IN COOPERATIVES
Generally defined, internal controls are process employed by the board and management to
prevent and mitigate fraud, to warrant reliable financial reporting and to stay compliant with
rules, law and regulations. From the board to the lower-level employees, all are responsible
for the internal controls impacting their jurisdiction. Sponsoring Organisations of the
Treadway Commission (COSO, 1992, p. 1) defined internal control as “a process, effected by
an entity’s Board of Directors, management and other personnel, designed to provide
reasonable assurance regarding the achievement of objectives in the following categories;
effectiveness and efficiency of operations, reliability of financial reporting, and compliance
with applicable laws and regulations.” As a process, internal control is dynamic in nature,
with constant changes in the organisation’s environment (internal and external), resulting in a
cycle where, as past threats are mitigated, new risks will arise.
International Journal of Economics, Finance and Business Management Studies| 39
© 2018 The Author | IJEFBM 2018 © 2018 FLE Learning
Internally, internal control helps organisations ensure the reliability of reports, such as
financial reports; helps compliance with laws and regulations; encourages and promotes
operational efficiency and effectiveness; and most importantly helps in reducing risks
(COSO, 1992). Internal control also helps management deal with external opportunities and
threats such as the competitive environments, economic volatility and shifting demands and
supplies (COSO, 1992). The purpose of internal control is to reduce risk and error and to
enhance accountability, as it provides a system of checks and balances, with the potential for
reducing theft and fraud. It can also help identify potential areas of errors. In evaluating the
effectiveness of internal control, although it depends on subjective judgment, COSO (1992)
outlined that effectiveness is determined by meeting three categories of objectives of internal
control: effective and efficient organisational operations, reliable reports and compliance with
laws and regulations.
Generally, if the organisation’s internal control is free from material control
weaknesses and reasonable assurance regarding the achievement of its objectives is provided,
internal control is deemed effective (Pfister, 2009). Effective internal control exists when
board and management obtain reasonable assurance that achievement on efficiency and
effectiveness of operation is gained, and it is crucial for the management to be aware of the
level at which these achievements are earned (Pfister, 2009). In addition, board and the
management are reasonably assured that internal financial reports and statements are reliably
produced. All information in the financial reports needs to be carefully constructed and free
from material errors for it to be reliable. Finally, the management and board must have
reasonable assurance that the organisation as a whole has complied with the laws and
regulations pertaining to the organisations’ operations.
CONTINGENCY THEORY
The theoretical foundation of this study is premised on contingency theory. Donaldson (2001)
defined contingency as “any variable that moderates the effect of organizational
characteristics on organizational performance.” Klaas (2001) outlined that organisational
viability depends on different contingencies such as organisational structure, organisational
climate, technology and culture. Thus, it explains how the contingency theory enables a
researcher to originate systematically factors in predicting or explaining expected situations
(Badara, 2013; Umanath, 2003). The main context of contingency theory is that the success
of any management control initiative (e.g., internal control and internal control effectiveness)
depends on the contingencies of the company.
Additionally, Hui and Fatt (2007) state that two theories (industrial organisation and
resource based theory) discussed in the research argue that a good fit between a firm’s
internal characteristics and external forces is crucial to the effectiveness of a strategy. A good
fit means tailoring controls to organisations’ characteristics to make them unique, as this will
result in better effectiveness in control (Fisher, 1998; Jokipii, 2009, Ninlaphay
Ussahawanitchakit and Boonlua, 2012). Ninlaphay et al. (2012) argue that organisational
ability to adapt to internal control system in times of facing external or internal changes is
crucial in determining whether the system fits the organisation, and is thus capable of
promoting its effectiveness.
A specific proposition of contingency theory is that the dependent variable and two or
more independent variables’ relationships are hypothesised and empirically tested (Drazin
and Van de Ven, 1985; Badara, 2013). Organisational ability in adapting to internal control
systems may be analysed by empirically testing the relationship of organisational
contingencies (contingency characteristics and organisational culture) and the effectiveness
of the system. In this study, components of contingency theory such as organisational
structure, environmental factors and organisational culture will be utilised in explaining
International Journal of Economics, Finance and Business Management Studies | NUR AIMA SHAFIE | 40
VOLUME 4 ISSUE 1 ISBN: 978-1-911185-80-2 (Online) ISSN: 2397-6926 (Online) www.flepublications.com
organisational contingencies that could influence the effectiveness of internal control in
cooperative organisations.
RESEARCH HYPOTHESES
Organisational Structure
Organisational structure fairly affects elements in internal control, which directly affects
effectiveness of internal control and provides a base for the overall internal control system
(Standards for Internal Control, New York State Government, 2007). Some of the line-up of
organisational structure characteristics in an overview by Vroom (2002) are standardisation,
differentiation and coordination, formalisation, centralisation, and configuration.
Otley (1980) states that a mechanistic structure (more centralised, vertically
differentiated and formalised) will increase predictability of work behaviour by reducing
variability, and thus may facilitate organisations’ internal control. It was later found in the
results that organisational structure has a statistically significant positive effect on internal
control effectiveness. Erserim (2012) on the other hand finds no significant relationship
between centralisation and managerial accounting practices, but finds formalisation to have
positive relationship with managerial accounting practices. Additionally, Jokipii (2009) finds
no significant results for organisational structure towards internal control and its perceived
effectiveness. Thus the following hypotheses are built:
H1a: There is a positive relationship between cooperative’s organisational structure
(centralisation) and the effectiveness of internal control.
H1b: There is a positive relationship between cooperative’s organisational structure
(formalisation) and the effectiveness of internal control.
Environmental Factors
Environment factors include forces outside organisation that could potentially affect
performance (Robbins, 1998). As all environmental elements (i.e., government regulations
and competitors) combine and conspire, an unpredictable environment will be produced to a
lesser or greater extent (Lashley and Lee-Ross, 2003). Lashley and Lee-Ross (2003) also list
some popular techniques in analysing environmental factors, such as SWOT analysis
(strengths, weaknesses, opportunities and threats), PEST analysis (political,
economic/environmental, social and technological factors) and mnemonics (all appropriate
variables are considered).
Chenhall (2003) emphasises the external environment as a powerful contextual
variable. Specific external risks may arise towards the industry within which the organisation
operates (AICPA, 2006); for example, using technology to ensure efficient organisational
operation, or political factors that may impact the organisation (Gupta, 2013; Mahara, 2013),
having an impact on the effectiveness of internal control.
H2: There is a positive relationship between environmental factors and the effectiveness of
internal control.
Organisational Culture
Organisational culture is a shared values, assumptions and beliefs that exist in the
environment of an organisation, which produces a behavioural norm in solving problems
(Schein, 1990; Owens, 1987) and guides behaviours within the organisation (Heris, 2014;
Ahmad, 2012). Organisational culture influences behaviour and attitudes within an
organisation, as it acts as a system of social control, and the values and beliefs that construct
culture portray the organisational internal environment (Aycan, Kanugo and Sinha, 1999;
MacIntosh and Doherty, 2010), making organisational culture an organisational contingency.
Previous research findings found a significant positive relationship between internal
control, internal control effectiveness and organisational performance, and organisational
International Journal of Economics, Finance and Business Management Studies| 41
© 2018 The Author | IJEFBM 2018 © 2018 FLE Learning
culture (Aydin and Ceylan 2009; Pfister, 2009). Aydin and Ceylan (2009) state that
organisational commitment and employee satisfaction will aid in organisational effectiveness;
for example, employee satisfaction will increase involvement in the organisation and thus
facilitate organisational effectiveness.
Although reports on direct positive relationships between organisational culture and
internal control effectiveness are fairly limited, large significant findings on organisational
culture positive relationships with internal control and organisational performance have made
the researcher’s point in discovering a relationship between organisational culture and
internal control effectiveness relevant. Thus, the following hypothesis is constructed:
H3: There is a positive relationship between organisational culture and the effectiveness of
internal control.
RESEARCH METHOD
Design and Research Instrument
This paper employs quantitative methods by using a questionnaire adopted from prior
literature on internal control effectiveness by Jokipii (2009). Questions were also adopted
from prior literature on organisational culture by Aftab, Rana and Sarwar (2012). The
questionnaires were prepared in booklets and were bilingual (in English and Bahasa
Malaysia), and were distributed in both languages separately. The questionnaire was
designed in four (4) sections. Section A covered demographic information of respondents: the
gender, age and position in the cooperative organisation of each respondent. Section B
required respondents to answer questions on the characteristics of cooperatives, namely the
cooperatives’ years of operation, their organisational structure in terms of both centralisation
and formalisation, and environmental factors.
Section C focused on the organisational culture of the organisation. The section
consisted of 31 statements which explained four dimensions of organisational culture. As
previously mentioned, these dimensions from Denison’s Framework of Organisational
Culture comprise of four traits: involvement, consistency, adaptability and mission. Lastly,
Section D consisted of statements that represent the effectiveness of internal control in the
organisation. It was elaborated under three elements: operational efficiency and effectiveness,
reliability of information and compliance with laws and regulations.
The questions of every section, except the demographic section, operational years and
centralisation (organisational structure) section, were built on a four-point Likert Scale. The
respondents needed to select their most appropriate responses to each statement: whether they
strongly agreed (SA), agreed (A), disagreed (D) or strongly disagreed (SD). The
questionnaire is included in the Appendix section.
Participants and Procedures
The targeted respondents for the study were the management of cooperatives, comprising of
the cooperatives’ Board Members (Ahli Lembaga Koperasi), executives and non-executives,
as the responsibility for internal control lies in each individual in the organisation (Pfister,
2009). Questionnaires were distributed by mail to the selected samples – the cooperatives
listed in the Top 100 Cooperatives for the year 2014. Mail was addressed to respected
cooperatives as this was the most effective way to reach the respondents and in an attempt to
receive more valid responses to the questions. Out of 100 distributed questionnaires, 56 were
returned by the respondent. The response rate was equal to 56%.
RESULT OF THE ANALYSIS
Respondent Demographic
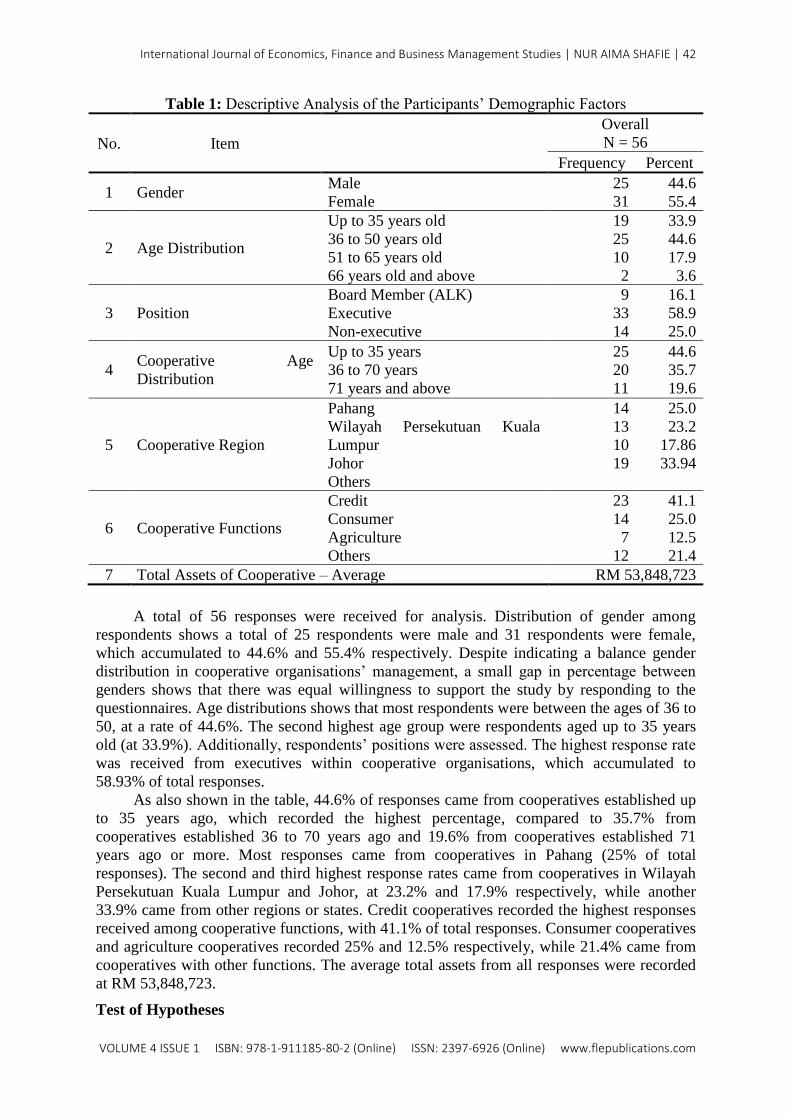
International Journal of Economics, Finance and Business Management Studies | NUR AIMA SHAFIE | 42
VOLUME 4 ISSUE 1 ISBN: 978-1-911185-80-2 (Online) ISSN: 2397-6926 (Online) www.flepublications.com
Table 1: Descriptive Analysis of the Participants’ Demographic Factors
No. Item
Overall
N = 56
Frequency Percent
1 Gender Male
Female
25
31
44.6
55.4
2 Age Distribution
Up to 35 years old
36 to 50 years old
51 to 65 years old
66 years old and above
19
25
10
2
33.9
44.6
17.9
3.6
3 Position
Board Member (ALK)
Executive
Non-executive
9
33
14
16.1
58.9
25.0
4 Cooperative Age
Distribution
Up to 35 years
36 to 70 years
71 years and above
25
20
11
44.6
35.7
19.6
5 Cooperative Region
Pahang
Wilayah Persekutuan Kuala
Lumpur
Johor
Others
14
13
10
19
25.0
23.2
17.86
33.94
6 Cooperative Functions
Credit
Consumer
Agriculture
Others
23
14
7
12
41.1
25.0
12.5
21.4
7 Total Assets of Cooperative – Average RM 53,848,723
A total of 56 responses were received for analysis. Distribution of gender among
respondents shows a total of 25 respondents were male and 31 respondents were female,
which accumulated to 44.6% and 55.4% respectively. Despite indicating a balance gender
distribution in cooperative organisations’ management, a small gap in percentage between
genders shows that there was equal willingness to support the study by responding to the
questionnaires. Age distributions shows that most respondents were between the ages of 36 to
50, at a rate of 44.6%. The second highest age group were respondents aged up to 35 years
old (at 33.9%). Additionally, respondents’ positions were assessed. The highest response rate
was received from executives within cooperative organisations, which accumulated to
58.93% of total responses.
As also shown in the table, 44.6% of responses came from cooperatives established up
to 35 years ago, which recorded the highest percentage, compared to 35.7% from
cooperatives established 36 to 70 years ago and 19.6% from cooperatives established 71
years ago or more. Most responses came from cooperatives in Pahang (25% of total
responses). The second and third highest response rates came from cooperatives in Wilayah
Persekutuan Kuala Lumpur and Johor, at 23.2% and 17.9% respectively, while another
33.9% came from other regions or states. Credit cooperatives recorded the highest responses
received among cooperative functions, with 41.1% of total responses. Consumer cooperatives
and agriculture cooperatives recorded 25% and 12.5% respectively, while 21.4% came from
cooperatives with other functions. The average total assets from all responses were recorded
at RM 53,848,723.
Test of Hypotheses
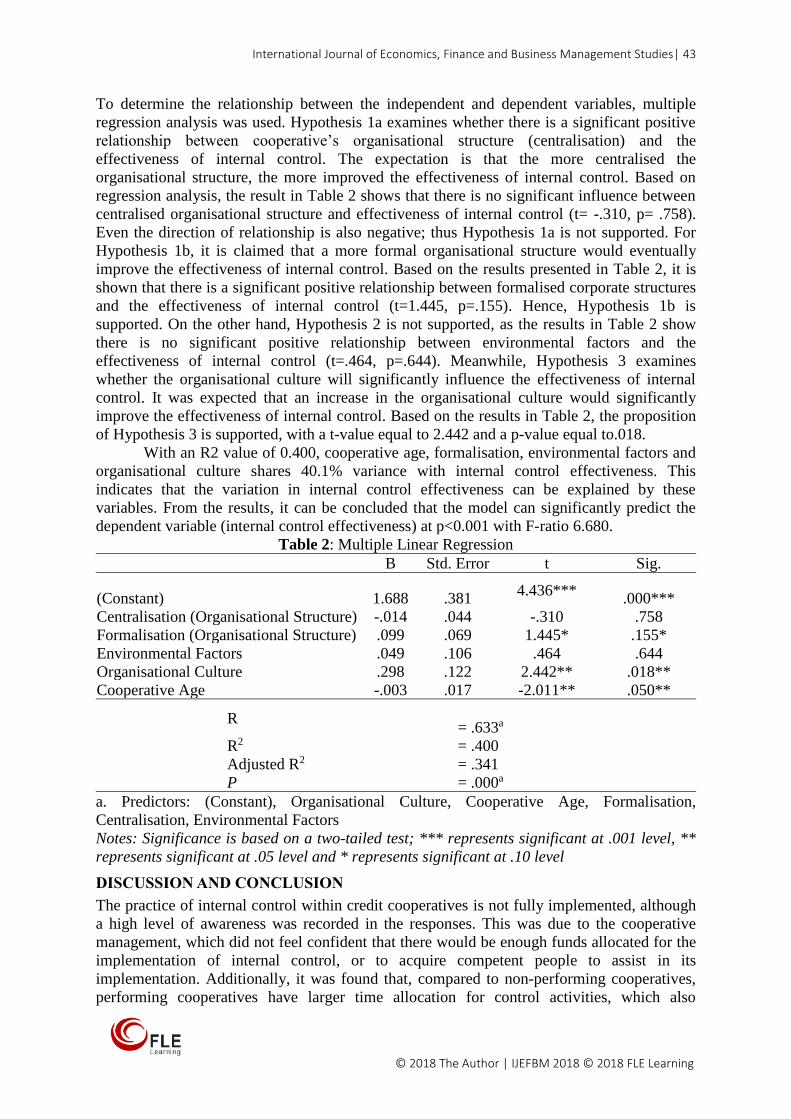
International Journal of Economics, Finance and Business Management Studies| 43
© 2018 The Author | IJEFBM 2018 © 2018 FLE Learning
To determine the relationship between the independent and dependent variables, multiple
regression analysis was used. Hypothesis 1a examines whether there is a significant positive
relationship between cooperative’s organisational structure (centralisation) and the
effectiveness of internal control. The expectation is that the more centralised the
organisational structure, the more improved the effectiveness of internal control. Based on
regression analysis, the result in Table 2 shows that there is no significant influence between
centralised organisational structure and effectiveness of internal control (t= -.310, p= .758).
Even the direction of relationship is also negative; thus Hypothesis 1a is not supported. For
Hypothesis 1b, it is claimed that a more formal organisational structure would eventually
improve the effectiveness of internal control. Based on the results presented in Table 2, it is
shown that there is a significant positive relationship between formalised corporate structures
and the effectiveness of internal control (t=1.445, p=.155). Hence, Hypothesis 1b is
supported. On the other hand, Hypothesis 2 is not supported, as the results in Table 2 show
there is no significant positive relationship between environmental factors and the
effectiveness of internal control (t=.464, p=.644). Meanwhile, Hypothesis 3 examines
whether the organisational culture will significantly influence the effectiveness of internal
control. It was expected that an increase in the organisational culture would significantly
improve the effectiveness of internal control. Based on the results in Table 2, the proposition
of Hypothesis 3 is supported, with a t-value equal to 2.442 and a p-value equal to.018.
With an R2 value of 0.400, cooperative age, formalisation, environmental factors and
organisational culture shares 40.1% variance with internal control effectiveness. This
indicates that the variation in internal control effectiveness can be explained by these
variables. From the results, it can be concluded that the model can significantly predict the
dependent variable (internal control effectiveness) at p<0.001 with F-ratio 6.680.
Table 2: Multiple Linear Regression
B Std. Error t Sig.
(Constant) 1.688 .381 4.436***
.000***
Centralisation (Organisational Structure) -.014 .044 -.310 .758
Formalisation (Organisational Structure) .099 .069 1.445* .155*
Environmental Factors .049 .106 .464 .644
Organisational Culture .298 .122 2.442** .018**
Cooperative Age -.003 .017 -2.011** .050**
R
= .633a
R2 = .400
Adjusted R2 = .341
P = .000a
a. Predictors: (Constant), Organisational Culture, Cooperative Age, Formalisation,
Centralisation, Environmental Factors
Notes: Significance is based on a two-tailed test; *** represents significant at .001 level, **
represents significant at .05 level and * represents significant at .10 level
DISCUSSION AND CONCLUSION
The practice of internal control within credit cooperatives is not fully implemented, although
a high level of awareness was recorded in the responses. This was due to the cooperative
management, which did not feel confident that there would be enough funds allocated for the
implementation of internal control, or to acquire competent people to assist in its
implementation. Additionally, it was found that, compared to non-performing cooperatives,
performing cooperatives have larger time allocation for control activities, which also
International Journal of Economics, Finance and Business Management Studies | NUR AIMA SHAFIE | 44
VOLUME 4 ISSUE 1 ISBN: 978-1-911185-80-2 (Online) ISSN: 2397-6926 (Online) www.flepublications.com
indicates the importance of internal control effectiveness for cooperatives’ performance. All
of this has raised questions on the cooperatives’ ability to implement effective internal
control.
To determine whether the internal control system fits the organisation to promote
effectiveness, organisations need to be able to adapt. The need for effective internal control
may vary depending on each organisational context (Jokipii, 2009). Standardised internal
control, such as COSO, also suggest that internal control effectiveness depends on
organisational characteristics. The effectiveness of internal control is tested to be influenced
by organisational characteristics (organisational structure, organisational culture) and also
environmental factors. This could indicate that effectiveness of internal control relies heavily
on these characteristics. Both organisation structures in terms of formalisation and
organisational culture influence the effectiveness of internal control. This indicates that a
more formal organisational structure, such as having formal written policies and procedures,
will improve the effectiveness of internal control.
Formal organisational structure will work, perhaps by directing and informing the
lower-level employees formally on the do’s and dont’s that would direct the organisation
towards more effective internal control. Over time, these formal organisational structures,
which inform the tone from the top, would provide unique capabilities for cooperative to
remain competitive in the market. On the other hand, the results also indicate that all four
dimensions of organisational culture impact on cooperatives’ internal control effectiveness.
For example, if cooperatives provide a culture of involvement, which makes the employees
feel they are a part of the team and can see the importance of their work in achieving
organisational goals, cooperatives could also improve their internal control effectiveness.
Involvement serves as an important dimension in explaining commitment and capability
development by employees (Ahmad, 2012). Similarly, a highly consistent culture will lead
organisations to be effective (Davenport, 1993). Adaptability, culture and mission are also
important within cooperatives to improve internal control effectiveness.
A major limitation to this study was the low response rate from the questionnaire
survey via mail. Future studies may consider conducting interviews, as they may provide a
better understanding of current views and practices of internal control and internal control
effectiveness within cooperative organisations. Interviews may also provide deeper
perceptions of cooperative organisations’ contingency characteristics, organisational culture
and internal control effectiveness. Although previous studies of the relationship between
these variables have been carried out primarily on profit organisations, when tested in the
context of the cooperative, the results from this study could provide an avenue for more
exploration in future on the factors that can influence the effectiveness of internal control.
Additionally, the usage of the four-point Likert scale in this study might cause normality
problems; it is recommended for future studies to expand the scale. Due to data limitations,
exploration on types of cooperative that place great concern on internal control effectiveness
cannot be done; future studies may therefore expand the research sample and obtain more
information, so that comparisons between each cooperative function might be made. Despite
the limitations, it is hoped this study will enhance the understanding of internal control and
internal control effectiveness literatures, particularly for cooperatives in Malaysia.
ACKNOWLEDGEMENTS
The authors would like to convey their appreciation to the Ministry of Higher Education of
Malaysia for providing the fundamental research grant to undertake this project. Appreciation
also goes to the Faculty of Accountancy, the Accounting Research Institute (ARI) and the
Institute of Research Management and Innovation (IRMI), Universiti Teknologi MARA,
Malaysia for support in this study.
International Journal of Economics, Finance and Business Management Studies| 45
© 2018 The Author | IJEFBM 2018 © 2018 FLE Learning
REFERENCES
Aftab, H., Rana, T. and Sarwar, A. (2012) An investigation of the relationship between
organizational culture and the employee’s role based performance: Evidence from the
banking sector. International Journal of Business and Commerce, 2(4), 01-13.
Ahmad, M. S. (2012) Impact of organizational culture on performance management practices
in Pakistan. Business Intelligence Journal, 5(1), 50-55.
Aycan, Z., Kanungo, R.N. and Sinha, J.B.P. (1999) Organizational culture and human
resource management practices: the model of culture fit. Journal of Cross-Cultural
Psychology, 30(4), 501-526.
Aydin, B. and Ceylan, A. (2008) The employee satisfaction in metalworking manufacturing:
How do organizational culture and organizational learning capacity jointly affect
it? Journal of Industrial Engineering and Management, 1(2), 143-168.
Badara, M. S. (2013) Impact of the effective internal control system on the internal audit
effectiveness at local government level. Journal of Social and Development Sciences,
4(10), 16-23.
Bidin, Y. H. (2007) Positioning knowledge management as key success factor in the growth
of cooperatives in Malaysia. Asian Academy of Management Journal, 12(1), 69-82.
Borzaga C. et al. (2014) Europe in Transition: The Role of Social Cooperatives and Social
Enterprises. [Online] Euricse Working Papers, 69|14. Available from:
http://www.euricse.eu/wp-content/uploads/2015/03/1405514708_n2553.pdf [Accessed
12 October 2017].
Chenhall, R. (2003) Management control systems design with in its organizational context:
Findings from contingency-based research and directions for the future. Accounting,
Organizations and Society, 28(2–3), 127–168.
Committee of Sponsoring Organizations of the Treadway Commission (COSO) (1992)
[Online] Available from: https://www.coso.org/Pages/default.aspx [Accessed 12
October 2017].
Davenport, T. (1993) Process innovation: Reengineering work through information
technology. Boston, MA: Harvard Business School Press.
Donaldson, L. (2001) The contingency theory of organizations. US: Sage Publications.
Drazin, R. and Van de Ven, A. H. (1985) Alternative forms of fit in contingency Theory.
Administrative Science Quarterly, 30(4), 514-539.
Fadzil, F., Haron, H. and Jantan, M. (2006) Internal auditing practices and internal control
system. Managerial Auditing Journal, 20(8), 844–866.
Fisher, J. (1998) Contingency theory, management control systems and firm outcomes: Past
results and future directions. Behavioral Research in Accounting, 10, 47–64.
Gupta, A. (2013) Environment and PEST analysis: An approach to external business
environment. International Journal of Modern Social Science,s 2(1), 34-43.
Hagen, H. (2004) ILO Recommendation 193 in practice – Co-operative values and principles
in national legislation. Paper for ILO/ICA conference April 2004. Geneva: ILO.
Hansmann, H. (1996) The Ownership of Enterprise. Cambridge, MA: Harvard University
Press
Heris, M. S. (2014) Preventing Effects of organizational culture on organizational
effectiveness in Islamic Azad universities of Northwest of Iran. Indian Journal of
Fundamental and Applied Life Sciences, 4(S3), 250-256.
Hui, L.T. and Fatt, Q.K. (2007) Strategic organizational conditions for risks reduction and
earnings management: A combined strategy and auditing paradigm. Accounting Forum,
31(2), 179–201.
International Journal of Economics, Finance and Business Management Studies | NUR AIMA SHAFIE | 46
VOLUME 4 ISSUE 1 ISBN: 978-1-911185-80-2 (Online) ISSN: 2397-6926 (Online) www.flepublications.com
Internal Control Integrated Framework; COSO (1994) Committee of Sponsoring
Organization of Treadway Commission. Internal control integrated framework. New
York: AICPA.
Jokipii, A. (2009) Determinants and consequences of internal control in firms: A contingency
theory based analysis. Journal of Management and Governance, 14(2), 115-144.
Klaas, P. (2001) Towards a concept of dynamics fit in contingency theory. Non published
working paper. Odense, Denmark: University of Southern Denmark.
Lashley, C. and Lee-Ross, D. (2003) Organization behaviour for leisure services. Boston,
MA: Butterworth-Heinemann.
Leviten-Reid, C. and Fairbairn, B. (2011) Multi-stakeholder Governance in Cooperative
Organizations: Toward a New Framework for Research? Canadian Journal of
Nonprofit and Social Economy Research, 2(2), 25-36.
MacIntosh, E.W. and Doherty, A. (2010) The influence of organizational culture on job
satisfaction and intention to leave. Sport Management Review, 13(2) 106-117.
Mahara, T. (2013) PEST-Benefit/Threat Analysis for selection of ERP in Cloud for
SMEs. Asian Journal of Management Research, 3(2), 365-373.
Mohamad, M., Othman, I. W. and Mohamed, A. (2013) Accountability issues and challenges:
the scenario of Malaysian Cooperative Movement. International Scholarly and
Scientific Research and Innovation, 7(6), 665-670.
Mohamad-Nor, M. N., Shafie, R. and Wan-Hussin, W. N. (2010) Corporate governance and
audit report lag in Malaysia. Asian Academy of Management Journal of Accounting and
Finance, 6(2), 57-84.
Mohd-Sanusi, Z. et al. (2015) Effects of internal controls, fraud motives and experience in
assessing likelihood of fraud risk. Journal of Economics, Business and Management,
3(2), 194-200.
New York (State) Office of the State Comptroller, and DiNapoli, T. P. (2007) Standards for
Internal Control in New York State Government. New York: State Comptroller.
Ninlaphay, S., Ussahawanitchakit, P. and Boonlua, S. (2012) Internal control system
effectiveness and ongoing firm sustainability: Evidence from financial businesses in
Thailand. Journal of International Finance and Economics, 12(4), 61-84.
Othman, I. W., Mohamad, M. and Abdullah, A. (2013) Cooperative movements in Malaysia:
The issue of governance. [Online]. World Academy of Science, Engineering and
Technology, 7(6). Available from: https://waset.org/publications/8324/cooperative-
movements-in-malaysia-the-issue-of-governance [Accessed 13 September 2017].
Otley, D. T. (1980) The contingency theory of management accounting: Achievement and
prognosis. Accounting, Organization and Society, 3(4), 413-428.
Owens, R. (1987) Organizational Behavior in Education. Englewood Cliffs, NJ: Prentice-
Hall.
Pfister, J. A. (2009) Managing Organizational Culture for Effective Internal Control. Berlin
Heidelberg: Springer-Verlaf.
Raja-Yusof, R. M. et al. (2002) Ciri-ciri keusahawanan dan amalan pengurusan di kalangan
pengurus-pengurus koperasi di Malaysia. Monograf Penyelidikan, Maktab Kerjasama
Malaysia.
Robbins, S. P. (1998) Organizational behaviour (8th ed.) US: McGraw-Hill Education.
Schein, E. (1990) Organizational Culture and Leadership. San Francisco, CA: Jossey-Bass.
Suruhanjaya Koperasi Malaysia - Dasar Koperasi Negara [2011-2020] (SKM) (n.d.) Portal
Rasmi Suruhanjaya Koperasi Malaysia - Dasar Koperasi Negara [2011-2020]. [Online]
http://www.skm.gov.my/Gerakan-Koperasi/Dasar-Koperasi-Negara-2011-2020.aspx
[Accessed 15 March 2018].

International Journal of Economics, Finance and Business Management Studies| 47
© 2018 The Author | IJEFBM 2018 © 2018 FLE Learning
Suruhanjaya Koperasi Malaysia - Pengenalan. (n.d.) (SKM). Available from
http://www.skm.gov.my/Gerakan-Koperasi/Pengenalan.aspx [Accessed 13 September
2017].
Thomas, A. (2004) The Rise of Social Cooperatives in Italy. Voluntas: International Journal
of Voluntary and Non-Profit Organisations, 15(3), 243-263.
Umanath, N. S. (2003) The concept of contingency beyond It depends illustrations from IS
research stream. Information and Management 40, 551–562.
UN (2003) Co-operatives in social development. Report of the Secretary General A/58/159
United Nations General Assembly.
Vroom, G. (2006) Organizational Design and the Intensity of Rivalry. Management Science,
52(11), 1689-1702.
International Journal of Economics, Finance and Business Management Studies | STELLA NYONGESA| 48
VOLUME 4 ISSUE 1 ISBN: 978-1-911185-80-2 (Online) ISSN: 2397-6926 (Online) www.flepublications.com
5.17-AT14-5249
THE JOINT INFLUENCE OF RELATIONSHIP MARKETING, SOCIAL
PERFORMANCE MANAGEMENT AND FIRM CHARACTERISTICS
ON CUSTOMER RETENTION BY MICRO-FINANCE INSTITUTIONS
IN KENYA
STELLA NYONGESA1, PROF FRANCIS KIBERA2 AND PROF RUTH KIRAKA3
ABSTRACT
Relationship marketing is a widely recognised strategy used to influence a firm’s ability to
retain customers for long-term business survival. However, customer retention continues to
be the greatest challenge facing many businesses, implying there could be other factors
affecting the outcome of relationship building efforts. In particular, a firm’s social
performance is increasingly cited as key in influencing business survival, while firm
characteristics are assumed to affect outcomes of relationship management. Empirical
evidence explaining the nature of combined influence of these variables, however, is scanty.
This research tests the hypothesis that the joint effect of relationship marketing, firm
characteristics and social performance management on customer retention is statistically
significant. Evidence from 55 microfinance institutions in Kenya support this hypothesis,
although firm characteristics on their own were found to have minimal influence on customer
retention. Social performance management is therefore a desirable practice for customer
retention.
Key words: Relationship Marketing, Social performance management, Firm Characteristics,
Customer retention
INTRODUCTION
The link between relationship marketing and customer retention is a well-studied topic in the
field of marketing (Morgan and Hunt, 1994; Oly Ndubisi, 2007). The issue facing marketing
scholars, therefore, is not whether relationship marketing leads to customer retention, but
rather to understand and uncover other conditions under which the association between
relationship marketing and customer retention may be affected (Ranaweera and Prabhu,
2003). One such condition is the role of social performance management in influencing
business performance parameters. There is a developing body of literature on the importance
of businesses embracing socially responsible practices (Husted, 2000; Dahlsrud, 2008,
Waddock and Graves, 1997). According to Husted (2000), a firm’s social environment
increasingly plays a critical role in business survival, while Waddock and Graves (1997) find
a positive association between corporate social responsibility and corporate financial
performance. The modern debate on the need for firms to be socially responsible was sparked
off by Bowen (1953) when he argued that businesses have an obligation to design policies,
make decisions and engage in actions which are desirable to stakeholders and wider society.
Most businesses engage in corporate social responsibility programmes to show stakeholders
their interests are taken care of, but it is equally important for monitoring how well a firm is
fairing in this sphere. Corporate social performance management practices are thus the
business’s framework comprising principles of social responsibility, processes, policies and
programmes guiding its social responsiveness, and the observable outcomes of these actions
1Assistant Lecturer and PhD Student, School of Management and Commerce, Strathmore University, Kenya. Email:
[email protected]. 2 Professor in Marketing, School of Business, University of Nairobi, Kenya. Email: [email protected]. 3 Professor in International Development and Strategic Management and Dean, School of Graduate Studies, Strathmore
University, Kenya. Email: [email protected].
International Journal of Economics, Finance and Business Management Studies| 49
© 2018 The Author | IJEFBM 2018 © 2018 FLE Learning
(Wood, 1991). Within the microfinance sector, this practice is known by the term Social
Performance Management (SPM). The aim of SPM is to aid microfinance institutions (MFIs)
in monitoring their social performance because apart from pursuing financial goals, MFIs are
expected to pursue social goals too and be efficient at both (Gutiérrez-Nieto, Serrano-Cinca
and Mar Molinero, 2009).
Besides the increasing calls for firms to be socially reasonable, there is an emerging
notion that firm characteristics (age, size, ownership structure, technology adoption) can
promote a business’s efforts to build loyal customers because customers care about how well
a company offers its products and services. According to Hoang, Igel, and Laosirihongthong
(2010), the use of supporting activities like technology systems, experience in offering the
product or service, employing a reasonable number of educated and skilled staff and
extensive distribution coverage of business operations are vital to meeting customers’ needs
and consequently to customer retention. For their part, Ryals and Payne (2001) posit that
information technology is an important element in customer data management. They argue
that a company’s ability to understand and respond to customers’ needs will depend on the
type and amount of information held about customers. Appropriate relationship marketing
strategies should thus include technology adoption tactics, because information technology
enables a firm to determine the economics of customer acquisition, customer retention and
lifetime value (Ryals and Payne, 2001).
Literature on relationship marketing and customer retention suggests that when a firm
builds relationships characterised by trust, commitment, communication, strong bonds and
keeping promises, the likelihood of customer defection is much lower (Morgan and Hunt,
1994; Ryals and Payne, 2001; Oly Ndubisi, 2007). Recently, however, this outcome seems to
be less apparent. Despite the deployment of relationship marketing programmes, customer
retention continues to be the greatest challenge facing marketers (Alrubaiee and Al-Nazer,
2010), suggesting there could other factors affecting the outcome of relationship building
efforts.
This paper reports results from a study conducted to establish empirical linkages
between relationship marketing, SPM practices, firm characteristics and customer retention.
LITERATURE REVIEW
The organisational function of marketing has undergone progressive changes from the
traditional orientation of the production philosophy predominant in the 1920s, to the selling
orientation (1930s), to the marketing orientation (1960s), and finally to the relationship
marketing (RM) orientation that emerged in the 1980s (Grönroos, 1989; Gruen, 1997). The
shift in marketing attitude and practice from transactional marketing (TM) to relationship
marketing (RM) arose due to increased competition, more informed customers, technological
advancements and the saturation and maturing of markets (Alrubaiee and Al-Nazer, 2010;
Varki and Wong, 2003).
RM
Numerous definitions of RM exist, signifying the variety of opinions on what constitutes this
concept (Harker, 1999). Although this term was first mentioned in a conference paper on
service marketing by Berry (1983), it has since gone through a variety of conceptualisations
by different authors, demonstrating the high level of scholarly interest in this practice
(Harker, 1999). Berry (1995) defines RM as the process of attracting, maintaining and
growing customer relations. Grönroos (2004) suggests it is “to identify and establish,
maintain and enhance and when necessary also terminate relationships with customers and
other stakeholders, at a profit, so that the objectives of all parties are met, and that this is done
by a mutual exchange and fulfilment of promises.” On their part, Jagdish and Parvatiyar
International Journal of Economics, Finance and Business Management Studies | STELLA NYONGESA| 50
VOLUME 4 ISSUE 1 ISBN: 978-1-911185-80-2 (Online) ISSN: 2397-6926 (Online) www.flepublications.com
(1995) describe RM as a long-term interactive relationship between the provider and the
customer with the aim of long-term profitability. Harker (1999) undertook to analyse these
diverse definitions in an attempt to construct a general definition of RM. This resulted in
seven “conceptual categories” the term seemed to espouse – birth; development;
maintenance; temporal nature; interaction; outputs; and emotional content. The author
concluded that Grönroos’ (1994) definition was the best because all seven conceptual
categories were captured. It is a general consensus, however, that relationships between
businesses and their customers evolve through a series of stages.
Firm Characteristics
Existing literature on organisational characteristics (such as age, size and structure) and their
influence on performance seems to suggest that these factors have a role they play (Cadogan
and Diamantopoulos 1995; Majumdar, 1997). Cadogan and Diamantopoulos (1995) suggest
that, as firms grow larger in size and become older and more experienced, the tendency to
become bureaucratic and inflexible increases. Majumdar (1997) on the other hand sought to
investigate whether larger firms are superior in performance to smaller firms (or vice versa),
and whether older firms are superior in performance to younger firms (or vice versa). The
author found that older firms are more productive but less profitable, while larger firms are
more profitable but less productive. Zahra, Ireland and Hitt (2000) find that the age of a firm
(number of years in operation) influences a firm’s profitability, while Hendricks and Singhal
(2001) find that firm size is an important predictor for financial performance. However, other
scholars have found that firm characteristics such as age and size do not influence firm
performance. For instance, Thuo (2010) establishes that the age and size of a firm neither
directly influences firm competitiveness, nor even moderates the relationship between
customer relationship management and marketing productivity; while Njeru (2013) finds that
the age and size of the firm are statistically insignificant. Such contradictory findings suggest
that the role of firm characteristics in determining firm performance, especially with respect
to customer retention, is not yet conclusive. Ryals and Payne (2001) posit that the success of
RM depends on deployment of appropriate organisational infrastructure. The authors argue
that the use of information technology enables a firm determine economics of customer
acquisition, customer retention and lifetime value. On their part, Pearce (1997, cited in Ryals
and Payne, 2001) reasons that customer retention strategies cannot be effective without the
support of a suitable data infrastructure. Further, Grönroos (2004) explains that a shift
towards the adoption of a RM approach tends to demand a number of changes to be effected
by organisations, especially in transforming from old structures to modern structures, from
manual operating systems to technology driven system, and from employees’ transactional
attitudes to relationship-driven attitudes. A firm’s characteristics, therefore, seem important
in influencing the ability of a firm to realise its relationship building objectives; but empirical
evidence on their role in influencing the RM-customer retention association is sparse.
SPM
The stakeholder approach to managing business operations suggests that organisations have a
variety of stakeholders whose interests must be met (Donaldson and Preston, 1995; Freeman
and McVea, 1984). This explains why some organisations engage in social responsibility
practices and strive to measure their social performance. Scholars of stakeholder management
argue that managers must understand the concerns of shareholders, employees, customers,
suppliers, lenders and society to develop objectives and strategies supported by their
stakeholders (Donaldson and Preston, 1995a). This kind of management philosophy translates
into the need for social performance management practices. According to Sinha (2006), SPM
is a set of management practices consisting of processes, structures and strategies that get an
to act in a socially responsible manner for improvement in clients’ welfare. For his part,
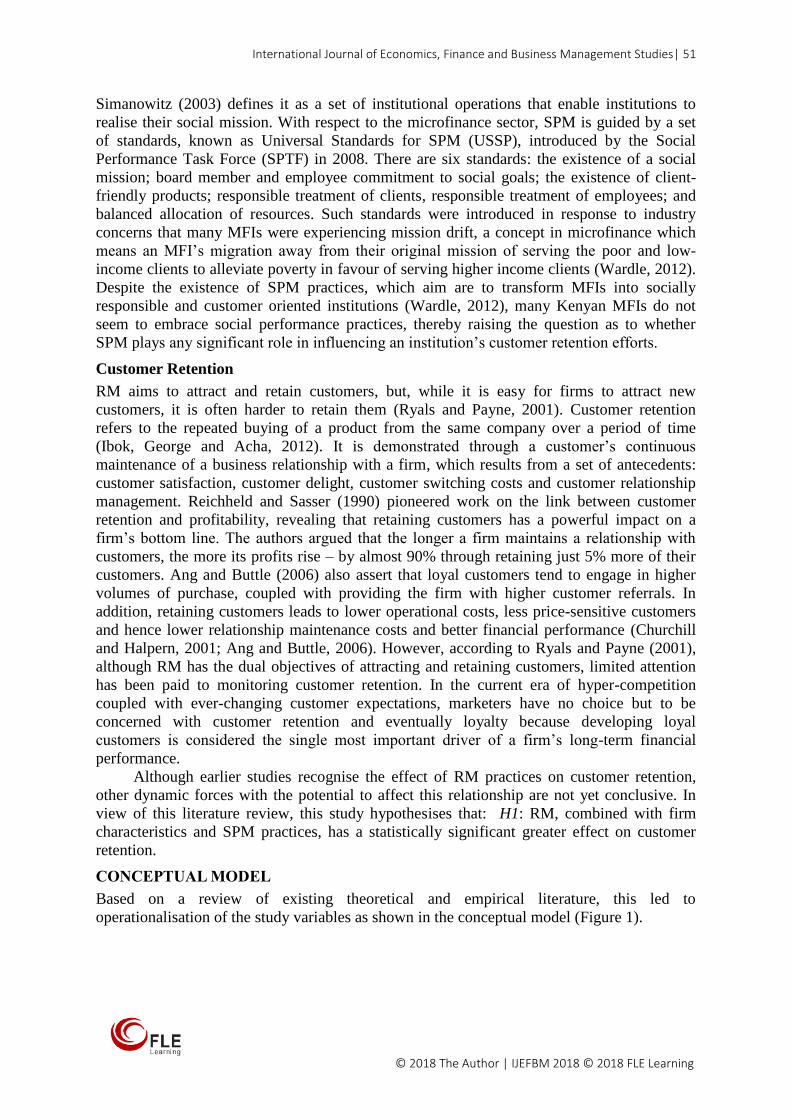
International Journal of Economics, Finance and Business Management Studies| 51
© 2018 The Author | IJEFBM 2018 © 2018 FLE Learning
Simanowitz (2003) defines it as a set of institutional operations that enable institutions to
realise their social mission. With respect to the microfinance sector, SPM is guided by a set
of standards, known as Universal Standards for SPM (USSP), introduced by the Social
Performance Task Force (SPTF) in 2008. There are six standards: the existence of a social
mission; board member and employee commitment to social goals; the existence of client-
friendly products; responsible treatment of clients, responsible treatment of employees; and
balanced allocation of resources. Such standards were introduced in response to industry
concerns that many MFIs were experiencing mission drift, a concept in microfinance which
means an MFI’s migration away from their original mission of serving the poor and low-
income clients to alleviate poverty in favour of serving higher income clients (Wardle, 2012).
Despite the existence of SPM practices, which aim are to transform MFIs into socially
responsible and customer oriented institutions (Wardle, 2012), many Kenyan MFIs do not
seem to embrace social performance practices, thereby raising the question as to whether
SPM plays any significant role in influencing an institution’s customer retention efforts.
Customer Retention
RM aims to attract and retain customers, but, while it is easy for firms to attract new
customers, it is often harder to retain them (Ryals and Payne, 2001). Customer retention
refers to the repeated buying of a product from the same company over a period of time
(Ibok, George and Acha, 2012). It is demonstrated through a customer’s continuous
maintenance of a business relationship with a firm, which results from a set of antecedents:
customer satisfaction, customer delight, customer switching costs and customer relationship
management. Reichheld and Sasser (1990) pioneered work on the link between customer
retention and profitability, revealing that retaining customers has a powerful impact on a
firm’s bottom line. The authors argued that the longer a firm maintains a relationship with
customers, the more its profits rise – by almost 90% through retaining just 5% more of their
customers. Ang and Buttle (2006) also assert that loyal customers tend to engage in higher
volumes of purchase, coupled with providing the firm with higher customer referrals. In
addition, retaining customers leads to lower operational costs, less price-sensitive customers
and hence lower relationship maintenance costs and better financial performance (Churchill
and Halpern, 2001; Ang and Buttle, 2006). However, according to Ryals and Payne (2001),
although RM has the dual objectives of attracting and retaining customers, limited attention
has been paid to monitoring customer retention. In the current era of hyper-competition
coupled with ever-changing customer expectations, marketers have no choice but to be
concerned with customer retention and eventually loyalty because developing loyal
customers is considered the single most important driver of a firm’s long-term financial
performance.
Although earlier studies recognise the effect of RM practices on customer retention,
other dynamic forces with the potential to affect this relationship are not yet conclusive. In
view of this literature review, this study hypothesises that: H1: RM, combined with firm
characteristics and SPM practices, has a statistically significant greater effect on customer
retention.
CONCEPTUAL MODEL
Based on a review of existing theoretical and empirical literature, this led to
operationalisation of the study variables as shown in the conceptual model (Figure 1).
International Journal of Economics, Finance and Business Management Studies | STELLA NYONGESA| 52
VOLUME 4 ISSUE 1 ISBN: 978-1-911185-80-2 (Online) ISSN: 2397-6926 (Online) www.flepublications.com
RESEARCH METHOD
This section presents the research design adopted for this study, the population and sampling
methods used, the validity and reliability tests and the data analysis techniques employed.
Research Design
This study adopted the positivism research paradigm because it sought to objectively
establish facts by empirically establishing the nature of relationships between the study
variables. Using descriptive cross-sectional survey design, the target population was 55 MFIs
in Kenya. The microfinance sector was deliberately chosen because it comprises institutions
with varying characteristics; in addition, the nature of competition in the industry compels
firms to adopt RM to survive. The study targeted employees and customers selected using
non-probability sampling, specifically purposive sampling for the employees and
convenience sampling for the customers. Total sample size of for employees was 55 while
554 customers were targeted. Primary data was collected using two structured questionnaires
(employees and customers). Questionnaire items were developed based on existing literature
(Morgan and Hunt, 1994; Wetzels et al., 1998; Oly Ndubisi, 2007; Sin et al., 2002; and
Leverin and Lijander, 2006). Prior to data collection, respondents were assured of
confidentiality and anonymity.
Validity and Reliability
The internal consistency Cronbach’s Alpha (α), which ranges from 0 to 1, is a coefficient that
reflects how well the measurement items correlate to one another. Different authors
recommend different cut-off points for reliability (Gliem and Gliem, 2003; Cooper and
Schindler, 2006; Asikhia, 2009). This study thus adopted a cut-off Cronbach value of 0.7.
Using SPSS version 17, validity and reliability tests were performed and alpha coefficients
for all the variables were above the 0.7 threshold. Face-to-face and content validity were
tested for to determine the extent to which the instruments were accurate and meaningful.
Figure 5: The Conceptual Model
Source: Researcher
International Journal of Economics, Finance and Business Management Studies| 53
© 2018 The Author | IJEFBM 2018 © 2018 FLE Learning
RESULTS
Responses were received from 48 managers and 492 customers, representing a response rate
of 87.3 % and 88.8 % respectively. Of the questionnaires, 22 were discarded for lack of
consistency and completeness. Descriptive statistics were obtained from the data collected
and a summary of the variables according the two groups of respondents’ perception are
presented in this section. The questions were framed on a five-point Likert scale type, ranging
from not at all (1) to a very large extent (5); or strongly disagree (1) to strongly agree (5).
Table 1 presents a summary of descriptive statistics of RM, firm characteristics, social
performance and customer retention.
Table 1: Descriptive Summary of Study Variables RM
(employees)
N Mean Std. Deviation CV (%)
Trust 47 4.062 0.744 19
Commitment 48 4.356 0.697 16
Communication 48 4.532 0.584 13
Keeping promises 48 4.22 2.545 24
Relationship bonds 48 4.122 0.792 19
Shared values 48 4.446 0.834 19
MEAN SCORE 47 4.289 1.033 18
RM (customers) Trust 492 3.965 1.086 27
Commitment 492 3.359 1.390 42
Communication 492 3.421 1.013 31
Keeping promises 492 3.802 1.223 32
Relationship bonds
492 3.373 1.278 38
Shared values 492 3.567 1.348 37
MEAN SCORE 492 3.581 1.223 34
FC (employees) IT platforms 48 3.262 1.180 38
CRM actions 48 4.036 1.169 27
MEAN SCORE 48 3.649 1.175 33
SPM
(employees)
Social mission statement 48 4.655 0.506 11
Board members commitment 48 3.965 0.714 18
Client-friendly
products/services
48 4.533 1.617 15
Responsibility to clients 48 4.338 0.746 17
Responsibility to employees 48 3.942 0.787 20
Balanced resource allocation 48 3.828 0.869 23
MEAN SCORE 48 4.210 0.873 17
SPM
(customers)
Client friendly products/services 490 3.606 1.412 40
Responsible treatment of clients 488 3.829 1.266 33
MEAN SCORE 489 3.718 1.339 37
CR attributes CR according to employees 48 3.888 0.7889 21
CR according to customers 488 3.243 1.1834 37
MEAN SCORE 268 3.566 0.986 29
Likelihood of
customers to
terminate
relationship
with the firm
Termination (according to
employees)
48 2.438 0.749 31
Termination (according to
customers)
488 2.147 1.367 64
MEAN SCORE 268 2.293 1.058 48
Source: Primary Data, 2017
Overall mean score for RM according to employees was 4.289, SD=1.033 and
CV=18%, whereas that score according to customers was mean=3.581, SD=1.223 and
CV=34%. Findings suggest that, although employees profess strong relationships with their
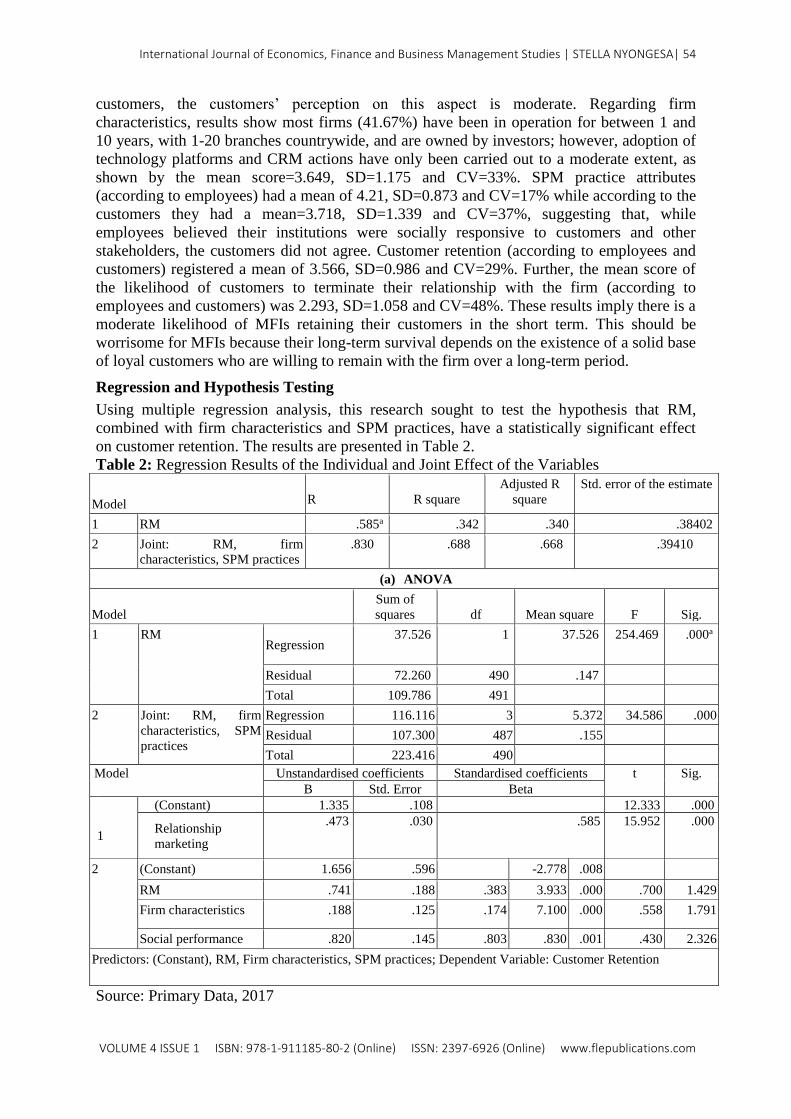
International Journal of Economics, Finance and Business Management Studies | STELLA NYONGESA| 54
VOLUME 4 ISSUE 1 ISBN: 978-1-911185-80-2 (Online) ISSN: 2397-6926 (Online) www.flepublications.com
customers, the customers’ perception on this aspect is moderate. Regarding firm
characteristics, results show most firms (41.67%) have been in operation for between 1 and
10 years, with 1-20 branches countrywide, and are owned by investors; however, adoption of
technology platforms and CRM actions have only been carried out to a moderate extent, as
shown by the mean score=3.649, SD=1.175 and CV=33%. SPM practice attributes
(according to employees) had a mean of 4.21, SD=0.873 and CV=17% while according to the
customers they had a mean=3.718, SD=1.339 and CV=37%, suggesting that, while
employees believed their institutions were socially responsive to customers and other
stakeholders, the customers did not agree. Customer retention (according to employees and
customers) registered a mean of 3.566, SD=0.986 and CV=29%. Further, the mean score of
the likelihood of customers to terminate their relationship with the firm (according to
employees and customers) was 2.293, SD=1.058 and CV=48%. These results imply there is a
moderate likelihood of MFIs retaining their customers in the short term. This should be
worrisome for MFIs because their long-term survival depends on the existence of a solid base
of loyal customers who are willing to remain with the firm over a long-term period.
Regression and Hypothesis Testing
Using multiple regression analysis, this research sought to test the hypothesis that RM,
combined with firm characteristics and SPM practices, have a statistically significant effect
on customer retention. The results are presented in Table 2.
Table 2: Regression Results of the Individual and Joint Effect of the Variables
Model
R
R square
Adjusted R
square
Std. error of the estimate
1 RM .585a .342 .340 .38402
2 Joint: RM, firm
characteristics, SPM practices
.830 .688 .668 .39410
(a) ANOVA
Model
Sum of
squares df Mean square F Sig.
1 RM Regression
37.526 1 37.526 254.469 .000a
Residual 72.260 490 .147
Total 109.786 491
2 Joint: RM, firm
characteristics, SPM
practices
Regression 116.116 3 5.372 34.586 .000
Residual 107.300 487 .155
Total 223.416 490
Model Unstandardised coefficients Standardised coefficients t Sig.
B Std. Error Beta
(
(Constant)
1
(Constant) 1.335 .108 12.333 .000
Relationship
marketing
.473 .030 .585 15.952 .000
2 (Constant) 1.656 .596 -2.778 .008
RM .741 .188 .383 3.933 .000 .700 1.429
Firm characteristics .188 .125 .174 7.100 .000 .558 1.791
Social performance .820 .145 .803 .830 .001 .430 2.326
Predictors: (Constant), RM, Firm characteristics, SPM practices; Dependent Variable: Customer Retention
Source: Primary Data, 2017
International Journal of Economics, Finance and Business Management Studies| 55
© 2018 The Author | IJEFBM 2018 © 2018 FLE Learning
The simple regression results show that, individually, the influence of RM on customer
retention is significant (R2=0.342, F=254.46, P<0.05), implying that RM explains 34.2% of
variation in customer retention (P < 0.05, F=254.46). The coefficient β is also significant (β =
0.473, t=15.952, P < 0.05), suggesting that when RM changes by 1%, it leads to a 47.3%
change in customer retention. However, to test for the joint effects, multiple regression
analysis was employed to establish the combined influence of RM, firm characteristics and
SPM on customer retention. Results show that the joint influence of these three variables on
customer retention is significant and greater (R2=0.688, F=34.586, P<0.05) than the
individual effects of RM on customer retention (R2=0.342, F=254.46, P<0.05). This implies
that (jointly) RM, firm characteristics and SPM explain 68.8% of variation in customer
retention, while the remaining 31.2% is explained by other factors not considered in the
study. The F ratio shows that the regression of RM, firm characteristics and SPM on
customer retention is statistically significant at P < 0.05. Therefore, RM, SPM practices and
firm characteristics have a significant joint influence on customer retention and hence can
jointly be used to predict customer retention. Based on the results, the hypothesis that RM
(combined with firm characteristics and SPM practices) has a statistically significant effect
on customer retention is accepted, and the regression model for the hypothesis was fitted as
follows: the original model: Y0= β0+β1 RM +β2 FC+ β3 SPM +ε; the new model: Y=
1.656+0.741RM +0.188FC +0.820SPM
Where: Y= Customer retention ; RM= RM ; FC= Firm characteristics; SPM=
SPM practices; Ԑ = error term
DISCUSSION
Several existing studies show that RM and customer retention are associated (Morgan and
Hunt, 1994; Bowen and Chen, 2001, Ang and Buttle, 2006; Henning-Thurau et al., 2002,
Wetzels et al., 1998). However, an interesting angle this study sought to take was to
determine the joint effect of a set of variables (RM, firm characteristics and SPM) on
customer retention. Oly Ndubisi (2007) and Sin et al. (2002) recommended research into such
factors, which the authors opined may either strengthen or weaken the association between
RM and customer retention. This study sought to address this gap by establishing the nature
of joint effect between all four variables. The results show that the joint effect of RM, firm
characteristics and SPM on customer retention is superior. SPM had the largest contribution
to customer retention (β=0.820, t=8.30, P<0.05), followed by RM (β=0.741, t=3.933,
P<0.05), while firm characteristics had the lowest contribution to customer retention
(β=0.188, t=7.100, P<0.05). Such results indicate that SPM and RM are both strong
predictors of customer retention, implying that, as firms embrace RM activities, they need to
combine these with social performance practices to retain customers better.
CONCLUSION
The study investigated the joint effect of RM, firm characteristics and SPM on the customer
retention and found this effect strong, positive and statistically significant. This suggests that
if MFIs embrace all three initiatives, their influence on customer retention will be stronger
than the individual effect of each. Consequently, RM and SPM are vital strategies for
customer retention, whereas firm characteristics (information technology and customer
relationship management actions) need to be combined with other initiatives to boost
customer retention. Therefore, the success of MFIs in an increasingly competitive financial
services sector requires a combination of strategies that focus not only on relationship
management, but also on social responsibility and innovative technological platforms to
improve customer retention levels for long-term sustainability.
REFERENCES
International Journal of Economics, Finance and Business Management Studies | STELLA NYONGESA| 56
VOLUME 4 ISSUE 1 ISBN: 978-1-911185-80-2 (Online) ISSN: 2397-6926 (Online) www.flepublications.com
Alrubaiee, L. and Al-Nazer, N. (2010) Investigate the impact of relationship marketing
orientation on customer loyalty: The customer’s perspective. International Journal of
Marketing Studies, 2(1), 155.
Ang, L. and Buttle, F. (2006) Customer retention management processes: A quantitative
study. European Journal of Marketing, 40(1/2), 83-99.
Asikhia, O. U. (2009) The Moderating Role of E-Marketing on the Consequences of Market
Orientation in Nigerian Firms. International Journal of Business and Information, 4(2),
243-270.
Berry, L. L. (1995) Relationship Marketing of Services – Growing Interest, Emerging
Perspectives. Journal of the Academy of Marketing Science, 23(4), 236-245.
Bowen, H. (1953) Social Responsibilities of the Businessman. The American Catholic
Sociological Review, 15(1), 42.
Bowen, J. T. and Chen, S. (2001) The relationship between customer loyalty and customer
satisfaction. International Journal of Contemporary Hospitality Management, 13(5),
213-217.
Churchill, C. F. and Halpern, S. S. (2001) Building Customer Loyalty. Washington DC: The
Microfinance Network Series.
Cooper, R.D. and Schindler, S.P. (2006) Business Research Methods. 9th ed., US: McGraw
Hill.
Dahlsrud, A. (2008) How corporate social responsibility is defined: an analysis of 37
definitions. Corporate Social Responsibility and Environmental Management, 15(1), 1-
13.
Donaldson, T. and Preston, L. E. (1995a) The stakeholder theory of the corporation:
concepts, evidence and implication. Academy of Management Review, 20(1), 65–91.
Freeman, E. R. and McVea, J. (1984) A Stakeholder Approach to Strategic Management.
[Online]. Working Paper, The Darden Graduate School of Business Administration,
University of Virginia. Available from:
https://poseidon01.ssrn.com/delivery.php?ID=730022068104120007114066126118114
0940930050350670640431050831070040670981190590480120551110340661050991
1800402005904403201005209308802710511500009500901709507208900407009408
8013118102090115077117075021103109093081093098125120005108120086006103
andEXT=pdf [Accessed 16 September 2017].
Gliem, J. A. and Gliem, R. R. (2003) Calculating, Interpreting and Reporting Cronbabac's
Alpha Reliability Coefficient for Likert-Type Scales. [Online] Paper presented at the
Midwest Research-to-Practice Conference in Adult, Continuing and Community
Education, The Ohio State University, Columbus, OH. Available from:
http://s3.spanglefish.com/s/8287/documents/psychological%20measurement/cronbach
%20alpha.pdf [Accessed 16 September 2017].
Grönroos, C. (1989) Defining marketing: a market oriented approach. European Journal of
Marketing, 23(1), 52-60.
Grönroos, C. (2004) The relationship marketing process: communication, interaction,
dialogue, value. Journal of Business and Industrial Marketing, 19(2), 99-113.
Gruen, T. W. (1997) Relationship marketing: the route to marketing efficiency and
effectiveness. Business Horizons, 40(6), 32-38.
Gutiérrez-Nieto, B., Serrano-Cinca, C. and Mar Molinero, C. (2009) Social efficiency in
microfinance institutions. Journal of the Operational Research Society, 60(1), 104-119.
Hair, J. et al. (2006) Multivariate data analysis. 6th ed., Uppersaddle River, NJ: Pearson
Prentice Hall.
Harker, M. J. (1999) Relationship marketing defined? An examination of current relationship
marketing definitions. Marketing Intelligence and Planning, 17(1), 13-20.
International Journal of Economics, Finance and Business Management Studies| 57
© 2018 The Author | IJEFBM 2018 © 2018 FLE Learning
Hendricks and Singhal (2001) Firm characteristics, Total quality management, and Financial
Performance. Journal of Operations Management, 19(3), 269-285.
Henning-Thurau, T., Gwinner, K. P. and Gremler, D. D. (2002) Understanding Relationship
Marketing Outcomes: An Integration of Relational Benefits and Relationship Quality.
Journal of Service Research, 4(3), 230-247.
Hoang, D. T., Igel, B. and Laosirihongthong, T. (2010) Total quality management (TQM)
strategy and organisational characteristics: Evidence from a recent WTO member.
Total Quality Management and Business Excellence, 21(9), 931-951.
Husted, B. W. (2000) A contingency theory of corporate social performance. Business and
Society, 39(1), 24-48.
Ibok, N. I., George, E. and Acha, I. (2012) Customer Retention Practices of Microfinance
banks. European Journal of Business and Management, 4(14), 146-152.
Ibok, N. I. and Udofot, P. O. (2012) Customers’ Retention in Micro Finance Banks: An
Analysis of Drivers and Inhibitors. International Journal of Marketing Studies, 4(5),
74-80.
Jagdish, S. and Parvatiyar, A. (1995) The Evolution of Relationship Marketing. International
Business Review, 4(4), 397-418.
Lambe, C. J., Wittmann, C. M. and Spekman, R. E. (2001) Social Exchange Theory and
Research on Business-to-Business Relational Exchange. Journal of Business-to-
Business Marketing, 8(3), 1-36.
Majumdar, S. K. (1997) The Impact of Size and Age on Firm-Level Performance: Some
Evidence From India. Review of Industrial Organization, 2(2), 231-241
Morgan, R. M. and Hunt, S. D. (1994) The Commitment-Trust Theory of Relationship
Marketing. Journal of Marketing, 58(3), 20.
Oly Ndubisi, N. (2007) Relationship marketing and customer loyalty. Marketing Intelligence
and Planning, 25(1), 98-106.
Parvatiyar, A. and Sheth, J. N. (2001) Customer relationship management: Emerging
practice, process, and discipline. Journal of Economic and Social Research, 3(2), 1-34.
Ranaweera, C. and Prabhu, J. (2003) The influence of satisfaction, trust and switching
barriers on customer retention in a continuous purchasing setting. International Journal
of Service Industry Management, 14(4), 374-395
Reichheld, F. and Sasser, E. W. J. (1990) Zero Defections - Quality comes to Services.
Harvard Business Review, 68(5), 105-111.
Ryals, L. and Payne, A. (2001) Customer relationship management in financial services:
towards information-enabled relationship marketing. Journal of Strategic Marketing,
9(1), 3-27.
Simanowitz, A. (2003) Microfinance, poverty and social performance: Overview. IDS
Bulletin, 34(4) 1-9.
Sin, L. Y. M. et al. (2002) The effect of relationship marketing orientation on business
performance in a service‐oriented economy. Journal of Services Marketing, 16(7), 656-
676.
Sinha, F. (2006) Social Rating and Social Performance Reporting in Microfinance. Towards a
Common Framework. [Online]. The SEEP Network for the Argidius Foundation.
Available from:
https://www.shareweb.ch/site/EI/Documents/FSD/Topics/Social%20Performance%20
Mainstreaming/Social%20Rating%20and%20Social%20Performance%20Reporting%2
0in%20Microfinance%20-%20Towards%20a%20Common%20Framework%20-
%202006(en).pdf [Accessed 16 September 2017].
International Journal of Economics, Finance and Business Management Studies | STELLA NYONGESA| 58
VOLUME 4 ISSUE 1 ISBN: 978-1-911185-80-2 (Online) ISSN: 2397-6926 (Online) www.flepublications.com
Thuo, J. K. (2011) The influence of customer relationship management practices on the
performance of commercial banks in Kenya. Unpublished PhD Thesis, University of
Nairobi, Kenya.
van den Bosch, A. L. M., Elving, W. J. L. and de Jong, M. D. T. (2006) The impact of
organisational characteristics on corporate visual identity. European Journal of
Marketing, 40(7/8), 870-885.
Varki, S. and Wong, S. (2003) Consumer Involvement in Relationship Marketing of Services.
Journal of Service Research, 6(1), 83-91.
Wardle, L. (2012) The Universal Standards for Social Performance Management
Implementation Guide. [Online]. Social Performance Task Force. Available from:
https://sptf.info/images/universal%20standards%20for%20spm%20implementation%20
guide.pdf [Accessed 16 September 2017].
Waddock, S. and Graves, S. (1997) The Corporate Social Performance-Financial
performance Link. Strategic Management Journal, 18, 303-319.
Wetzels, M., de Ruyter, K. and van Birgelen, M. (1998) Marketing service relationships: the
role of commitment. Journal of Business and Industrial Marketing, 13(4/5), 406-423.
Wood, D. J. (1991) Corporate Social Performance Revisited. The Academy of Management
Review, 16(4), 691.
Wood, D. J. and Jones, R. E. (1995) Stakeholder Mismatching: A Theoretical Problem in
Empirical Research on Corporate Social Performance. The International Journal of
Organisational Analysis, 3(3), 229-267.
Zahra, S. A., Ireland R. D. and Hitt, M. A. (2000) International Expansion by New Venture
Firms: International Diversity, Mode of Market Entry, Technological Learning, and
Performance. The Academy of Management Journal, 43 (5), 925-950.
International Journal of Economics, Finance and Business Management Studies| 59
© 2018 The Author | IJEFBM 2018 © 2018 FLE Learning
6.25-AT02-5083
THE DETERMINANTS OF EMERGING AND DEVELOPED MARKET
MNE OUTWARD FDI: A COMPARATIVE ANALYSIS OF MALAYSIAN
AND SINGAPOREAN MNES
NORLIA MOHD ZAIN1
ABSTRACT
Since early 1960s, the basic long-term pattern of FDI from industrialised multinational
enterprises (MNEs) has become a foundation for traditional theories of FDI and MNEs.
However, the rise of outward FDI from emerging economies’ (E)MNEs, particularly from
East Asia, such as China and India, has raised many interesting questions, such as how do
Asian MNEs differ from developed economies’ (D)MNEs in their internationalisation,
decisions and behaviour? Given that comparative studies on EMNEs, particularly from
different South-East Asian countries, is limited, it is the central objective of this paper to
examine and analyse the differences and similarities in the geographical patterns of outward
FDI from Malaysia (EMNEs) and Singapore (DMNEs). This study measures the direction
and impact of institutional effects, economic development factors and MNEs’ special
ownership advantages on the location choice and underlying motivations of their outward
FDI at two digits industry classification of NACE code.
Keywords: Multinational enterprise (MNEs), Outward FDI (OFDI), industry-level analysis.
INTRODUCTION
Since the early 1980s, substantial progress toward the removal of cross-border restrictions on
international capital flows and the trend towards an integrated world economy have increased
the growth of foreign direct investment (FDI) activity (Doukas and Lang, 2003).
Globalisation has been widely recognised for the past several decade as being driven by the
multinational enterprises (MNEs) of developed nations ((Buckley et al., 2014). In the
voluminous literature on FDI and MNEs from developed countries, a strand of the literature
focuses on the phenomenon of increasing outward FDI (OFDI) from emerging market MNEs
(EMMNEs), and this has become one of the “big questions” of the 21st century International
Business research agenda (Mathews, 2006). Bhaumik and Driffield (2011) highlight that total
OFDI stock by EMMNEs recorded a 107% increase within a decade, from $72 billion in
1980 to $149 billion in 1990, then to over $1 trillion by the end of 2005. As illustrated in
Figure 1, in 2013, the outward stock from developing countries was $5 trillion, or 19% of the
worldwide flow of FDI (United Nations Conference on Trade and Development (UNCTAD).
1 PhD Student (Full-time), Department of Economics, Durham University Business School, Durham University, Mill Hill
Lane, DH1 3LB, United Kingdom. E-mail:- [email protected]
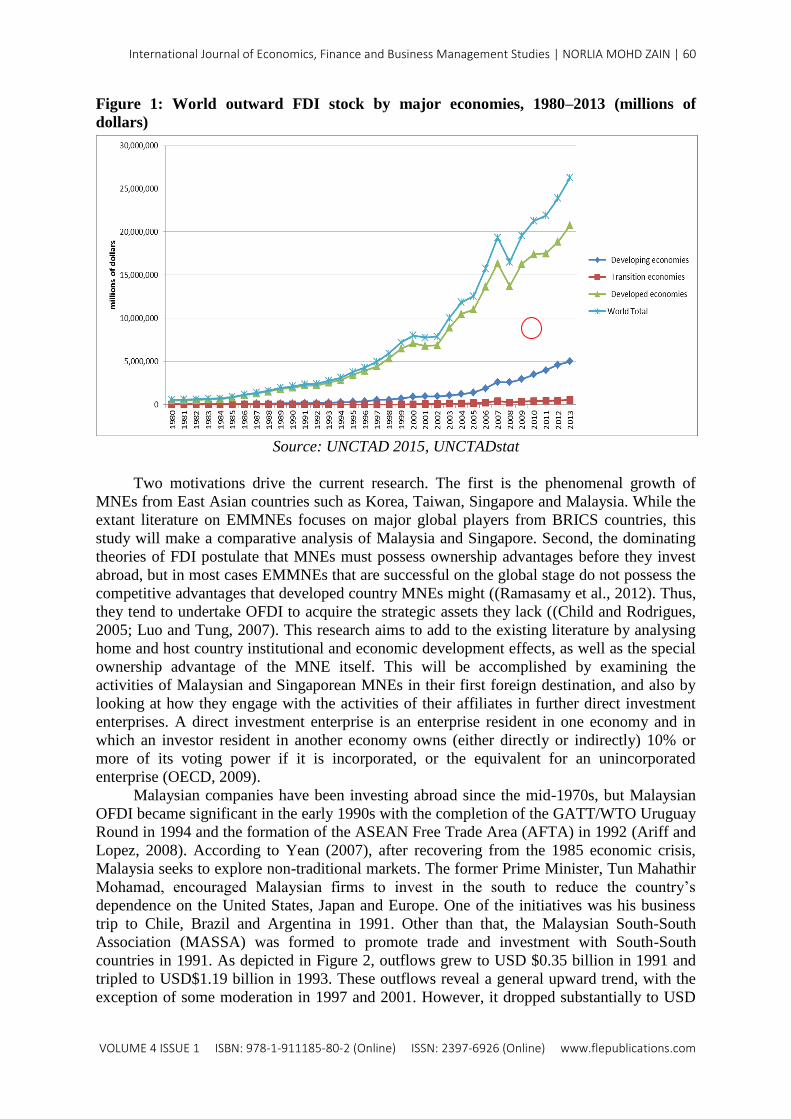
International Journal of Economics, Finance and Business Management Studies | NORLIA MOHD ZAIN | 60
VOLUME 4 ISSUE 1 ISBN: 978-1-911185-80-2 (Online) ISSN: 2397-6926 (Online) www.flepublications.com
Figure 1: World outward FDI stock by major economies, 1980–2013 (millions of
dollars)
Source: UNCTAD 2015, UNCTADstat
Two motivations drive the current research. The first is the phenomenal growth of
MNEs from East Asian countries such as Korea, Taiwan, Singapore and Malaysia. While the
extant literature on EMMNEs focuses on major global players from BRICS countries, this
study will make a comparative analysis of Malaysia and Singapore. Second, the dominating
theories of FDI postulate that MNEs must possess ownership advantages before they invest
abroad, but in most cases EMMNEs that are successful on the global stage do not possess the
competitive advantages that developed country MNEs might ((Ramasamy et al., 2012). Thus,
they tend to undertake OFDI to acquire the strategic assets they lack ((Child and Rodrigues,
2005; Luo and Tung, 2007). This research aims to add to the existing literature by analysing
home and host country institutional and economic development effects, as well as the special
ownership advantage of the MNE itself. This will be accomplished by examining the
activities of Malaysian and Singaporean MNEs in their first foreign destination, and also by
looking at how they engage with the activities of their affiliates in further direct investment
enterprises. A direct investment enterprise is an enterprise resident in one economy and in
which an investor resident in another economy owns (either directly or indirectly) 10% or
more of its voting power if it is incorporated, or the equivalent for an unincorporated
enterprise (OECD, 2009).
Malaysian companies have been investing abroad since the mid-1970s, but Malaysian
OFDI became significant in the early 1990s with the completion of the GATT/WTO Uruguay
Round in 1994 and the formation of the ASEAN Free Trade Area (AFTA) in 1992 (Ariff and
Lopez, 2008). According to Yean (2007), after recovering from the 1985 economic crisis,
Malaysia seeks to explore non-traditional markets. The former Prime Minister, Tun Mahathir
Mohamad, encouraged Malaysian firms to invest in the south to reduce the country’s
dependence on the United States, Japan and Europe. One of the initiatives was his business
trip to Chile, Brazil and Argentina in 1991. Other than that, the Malaysian South-South
Association (MASSA) was formed to promote trade and investment with South-South
countries in 1991. As depicted in Figure 2, outflows grew to USD $0.35 billion in 1991 and
tripled to USD$1.19 billion in 1993. These outflows reveal a general upward trend, with the
exception of some moderation in 1997 and 2001. However, it dropped substantially to USD
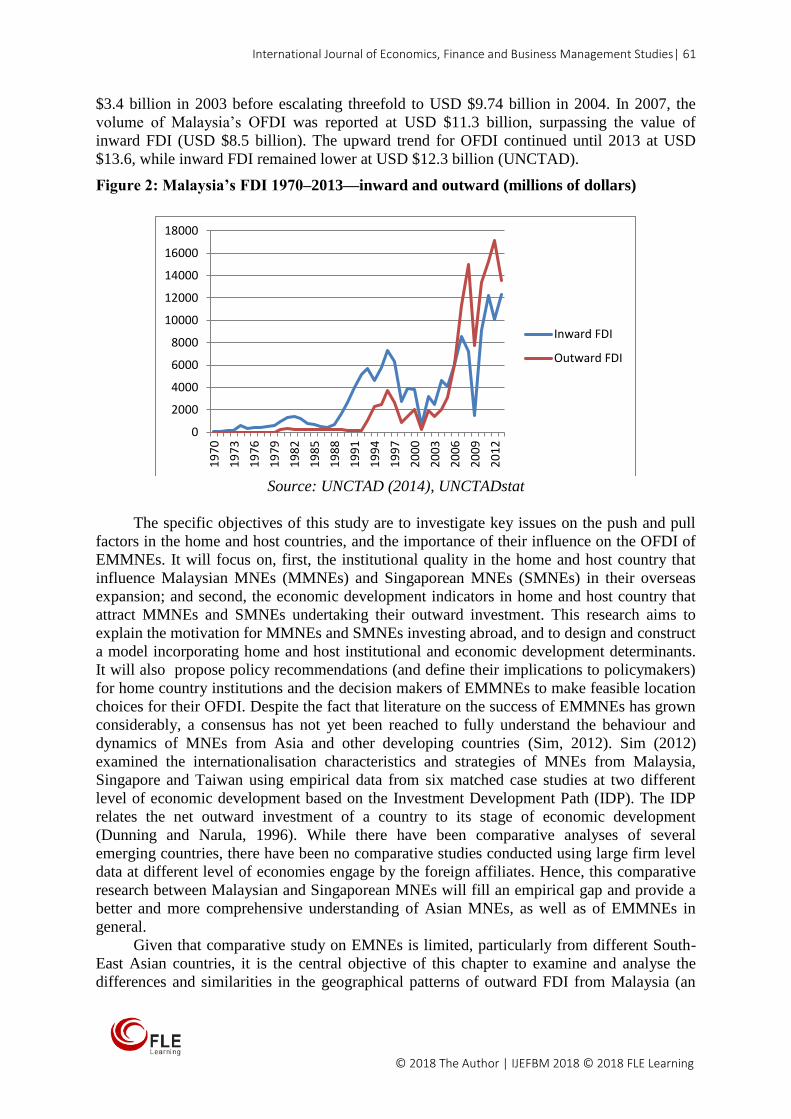
International Journal of Economics, Finance and Business Management Studies| 61
© 2018 The Author | IJEFBM 2018 © 2018 FLE Learning
$3.4 billion in 2003 before escalating threefold to USD $9.74 billion in 2004. In 2007, the
volume of Malaysia’s OFDI was reported at USD $11.3 billion, surpassing the value of
inward FDI (USD $8.5 billion). The upward trend for OFDI continued until 2013 at USD
$13.6, while inward FDI remained lower at USD $12.3 billion (UNCTAD).
Figure 2: Malaysia’s FDI 1970–2013—inward and outward (millions of dollars)
Source: UNCTAD (2014), UNCTADstat
The specific objectives of this study are to investigate key issues on the push and pull
factors in the home and host countries, and the importance of their influence on the OFDI of
EMMNEs. It will focus on, first, the institutional quality in the home and host country that
influence Malaysian MNEs (MMNEs) and Singaporean MNEs (SMNEs) in their overseas
expansion; and second, the economic development indicators in home and host country that
attract MMNEs and SMNEs undertaking their outward investment. This research aims to
explain the motivation for MMNEs and SMNEs investing abroad, and to design and construct
a model incorporating home and host institutional and economic development determinants.
It will also propose policy recommendations (and define their implications to policymakers)
for home country institutions and the decision makers of EMMNEs to make feasible location
choices for their OFDI. Despite the fact that literature on the success of EMMNEs has grown
considerably, a consensus has not yet been reached to fully understand the behaviour and
dynamics of MNEs from Asia and other developing countries (Sim, 2012). Sim (2012)
examined the internationalisation characteristics and strategies of MNEs from Malaysia,
Singapore and Taiwan using empirical data from six matched case studies at two different
level of economic development based on the Investment Development Path (IDP). The IDP
relates the net outward investment of a country to its stage of economic development
(Dunning and Narula, 1996). While there have been comparative analyses of several
emerging countries, there have been no comparative studies conducted using large firm level
data at different level of economies engage by the foreign affiliates. Hence, this comparative
research between Malaysian and Singaporean MNEs will fill an empirical gap and provide a
better and more comprehensive understanding of Asian MNEs, as well as of EMMNEs in
general.
Given that comparative study on EMNEs is limited, particularly from different South-
East Asian countries, it is the central objective of this chapter to examine and analyse the
differences and similarities in the geographical patterns of outward FDI from Malaysia (an
0
2000
4000
6000
8000
10000
12000
14000
16000
18000
19
70
19
73
19
76
19
79
19
82
19
85
19
88
19
91
19
94
19
97
20
00
20
03
20
06
20
09
20
12
Inward FDI
Outward FDI
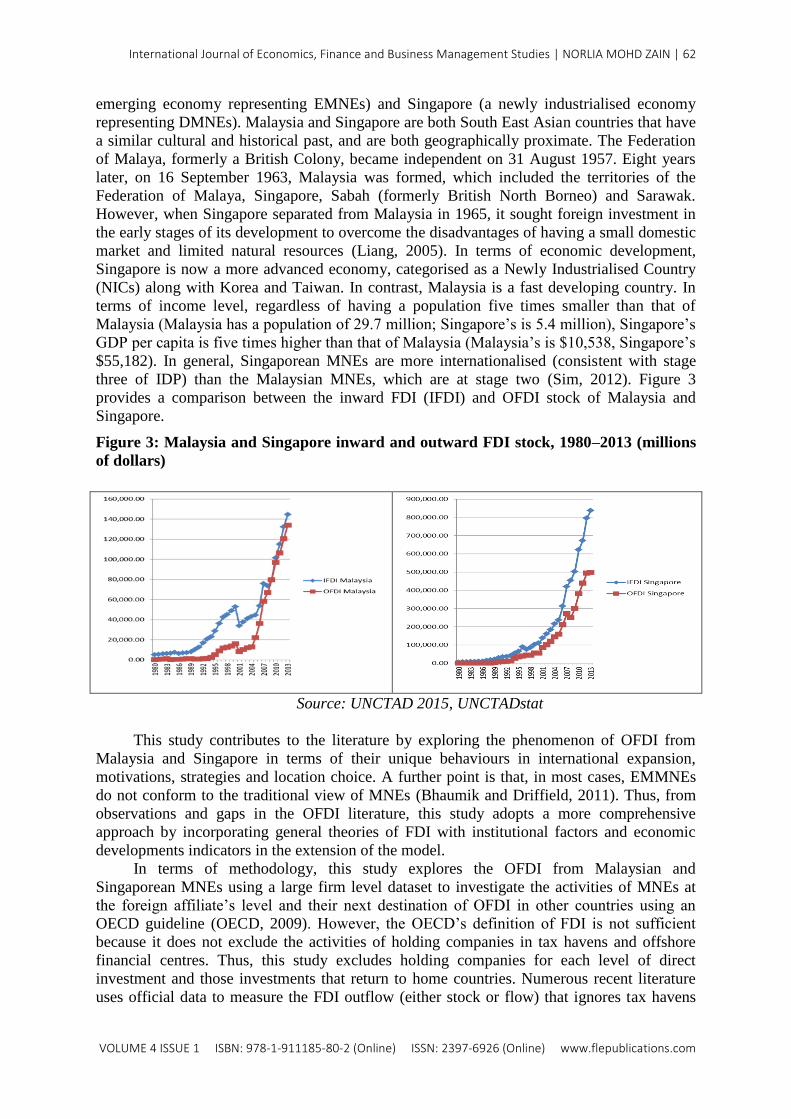
International Journal of Economics, Finance and Business Management Studies | NORLIA MOHD ZAIN | 62
VOLUME 4 ISSUE 1 ISBN: 978-1-911185-80-2 (Online) ISSN: 2397-6926 (Online) www.flepublications.com
emerging economy representing EMNEs) and Singapore (a newly industrialised economy
representing DMNEs). Malaysia and Singapore are both South East Asian countries that have
a similar cultural and historical past, and are both geographically proximate. The Federation
of Malaya, formerly a British Colony, became independent on 31 August 1957. Eight years
later, on 16 September 1963, Malaysia was formed, which included the territories of the
Federation of Malaya, Singapore, Sabah (formerly British North Borneo) and Sarawak.
However, when Singapore separated from Malaysia in 1965, it sought foreign investment in
the early stages of its development to overcome the disadvantages of having a small domestic
market and limited natural resources (Liang, 2005). In terms of economic development,
Singapore is now a more advanced economy, categorised as a Newly Industrialised Country
(NICs) along with Korea and Taiwan. In contrast, Malaysia is a fast developing country. In
terms of income level, regardless of having a population five times smaller than that of
Malaysia (Malaysia has a population of 29.7 million; Singapore’s is 5.4 million), Singapore’s
GDP per capita is five times higher than that of Malaysia (Malaysia’s is $10,538, Singapore’s
$55,182). In general, Singaporean MNEs are more internationalised (consistent with stage
three of IDP) than the Malaysian MNEs, which are at stage two (Sim, 2012). Figure 3
provides a comparison between the inward FDI (IFDI) and OFDI stock of Malaysia and
Singapore.
Figure 3: Malaysia and Singapore inward and outward FDI stock, 1980–2013 (millions
of dollars)
Source: UNCTAD 2015, UNCTADstat
This study contributes to the literature by exploring the phenomenon of OFDI from
Malaysia and Singapore in terms of their unique behaviours in international expansion,
motivations, strategies and location choice. A further point is that, in most cases, EMMNEs
do not conform to the traditional view of MNEs (Bhaumik and Driffield, 2011). Thus, from
observations and gaps in the OFDI literature, this study adopts a more comprehensive
approach by incorporating general theories of FDI with institutional factors and economic
developments indicators in the extension of the model.
In terms of methodology, this study explores the OFDI from Malaysian and
Singaporean MNEs using a large firm level dataset to investigate the activities of MNEs at
the foreign affiliate’s level and their next destination of OFDI in other countries using an
OECD guideline (OECD, 2009). However, the OECD’s definition of FDI is not sufficient
because it does not exclude the activities of holding companies in tax havens and offshore
financial centres. Thus, this study excludes holding companies for each level of direct
investment and those investments that return to home countries. Numerous recent literature
uses official data to measure the FDI outflow (either stock or flow) that ignores tax havens
International Journal of Economics, Finance and Business Management Studies| 63
© 2018 The Author | IJEFBM 2018 © 2018 FLE Learning
issues and activities of holding companies in tax heavens destination such as Hong Kong, the
Cayman Islands, the British Virgin Islands and other places such as Luxembourg and the
Netherlands. This official data suffers from the “round-tripping” FDI problem that involves
investment holding companies undertaking investment abroad, which did not represent real
economic activity (Buckley et al., 2013; Sutherland and Ning, 2011; Ning and Sutherland,
2012; Yao and Sutherland, 2009). The dataset is obtained from a novel firm-level database,
the Bureau van Dijk’s (BvD) Orbis, to obtain a viable population of investing companies. The
Bureau v. Dijk database (Amadeus for Europe and Orbis for the World) is a useful source of
secondary data, as this data has the appeal that comparisons of Malaysian OFDI vis-a-vis
other countries can be undertaken, as comparative analysis strengthens this type of work.
Simultaneously, the research provides recommendations to policy makers and MNEs to
identify new outward FDI opportunities in other feasible destinations and sectors.
The findings of this paper suggest that there is a need to extend the extant theories of
FDI, particularly when the OFDI of firms from developing countries like Malaysia and
Singapore are brought into the equation. The findings of this paper are that Malaysian and
Singaporean OFDI behaviour can be explained by three major attributes: institutional factors,
economic development indicators and the special ownership advantages of the firms. More
specifically, the results indicate that Malaysian MNEs are most likely to establish their
operation in neighbouring countries if the quality of government system and administrative
procedure is void at home, rather than choosing OECD and Rest of the World region far from
home with a dissimilar culture and complex administrative rules and regulations. This finding
supports the Stages Model that that MNEs are more likely to invest in those countries with
similar cultures and psychic distance (Johanson and Vahlne, 1977; Johanson and Vahlne,
2009). In contrast, separately from the independent variables, Singaporean MNEs are more
likely to invest in the OECD region compared to Malaysian MNEs.
THE GENERAL THEORY OF FDI
Several dominant theories exist on the development and motivation of FDI that are relevant
in explaining OFDI activities, but most are related to firms from advanced countries. Buckley
and Casson (1976) were the first to formalise various streams of thought into a coherent
theory of MNEs. This theory postulates that firms will invest abroad if the benefits of
exploiting firm competitive advantages outweigh the relative costs of the operations. Dunning
(1979) brings together internalisation theory and traditional trade economics to create the
eclectic paradigm of FDI. In the MNE theory, FDI was explained by identifying three types
of special advantages MNEs have: the ownership, location and internalisation (OLI)
advantages. Firms will internationalise when they have ownership advantages (patents,
technical knowledge, management skills and reputation) to be exploited abroad in a location
that offers lower transaction cost (I advantage). According to Buckley et al. (2007), the OLI
paradigm also suggests a location choice aspect, in that MNEs undertake OFDI based on
three main motivations: market-seeking, efficiency-seeking for cost reduction, and resource
seeking (including strategic-asset-seeking FDI).
Rugman (1981) developed the matrix of firm specific advantages–country specific
advantages (FSA–CSA) at the MNE level, which underlines the company’s motivations for
investing abroad first to exploit its FSA, such as a company’s property, technologies,
knowledge, and managerial or marketing abilities; and, further, to benefit from host country
advantages such as natural resources, labour force, cultural factors, tariff and non-tariff
barriers and public policies. Another general theory of FDI is the Stages model, which
identifies geographic distance for firm internationalisation. Johanson and Vahlne (1977)
postulate that firms start to internationalise in markets close to the home market in psychic
distance terms, gradually entering markets further away and choosing low risk entry modes,
International Journal of Economics, Finance and Business Management Studies | NORLIA MOHD ZAIN | 64
VOLUME 4 ISSUE 1 ISBN: 978-1-911185-80-2 (Online) ISSN: 2397-6926 (Online) www.flepublications.com
later increasing their commitment to better exploit the market potential. This process involves
a concept of liability of foreignness (LOF) that explains why foreign firm need to possess
FSA to offset the liability.
As the general theory of FDI has been built largely on the experience of industrialised
country investors, there are inevitably questions over whether these theories can be readily
applied to emerging market investors ((Buckley et al., 2007). According to Hennart (2012),
the argument surrounding the theory that can explain EMMNEs are divided into three camps.
The first IB scholars invoked the OLI model, believing that EMMNEs will not be successful
in investment abroad owing to the absence of a strong FSA; their current foreign investment
are ill advised and will not survive for long term. A second group of researchers agree that
EMMNEs invest abroad regardless of whether or not they possess FSAs, which indicates that
the OLI model is unable to explain EMMNEs and should be replaced by a specific theory
applicable to EMMNEs (Mathews, 2006). Another group argues that the OLI model must be
extended because EMMNEs possess unconventional types of FSAs that are not included in
the model (Cuervo-Cazurra, 2012; Ramamurti, 2009; Ramamurti, 2012).
WHY ARE EMMNES DIFFERENT?
An emerging market is often characterised by poorly developed institutions in terms of social,
political, geographic, economic factors, as well as regulation, which have been termed
institutional voids (Khanna and Palepu, 1997). However, this disadvantage has become an
advantage to the EMMNEs, as it gives them initial FSAs to operate in difficult environment
in local, which they reinforce later in foreign investment (Ramamurti, 2009; Ramamurti,
2012). EMMNEs are often capable of turning these disadvantages into advantages when they
embark on foreign investment (Cuervo-Cazurra and Genc, 2008). Moreover, Madhok and
Keyhani (2012) argue that EMMNEs need theoretical advancement, contrary to the extant IB
literature, to answer the question of how to make the most of what they have to create
advantage. In their study, they introduce the concept of Liability of Emergingness (LOE),
which is incurred due to national environments that suffers from underdeveloped markets,
unsophisticated customers, weak suppliers, infrastructure bottlenecks and many other
institutional voids. To overcome the LOE, EMMNEs undertake outward internationalisation
through acquisition in advanced economies. Acquisition of firms from advanced countries
makes it possible for EMMNEs to acquire the brand or world class image in one quick step,
thus overcoming the “less than world class” image that comes from LOE.
Child and Rodrigues (2005) argue that the internationalisation of Chinese firms is
significantly impacted by institutional factors because they receive large amount of support
from the government. Many developing countries are characterised by a heavy institutional
and political involvement in their business system. Thus, Child and Rodrigues (2005) have
suggested that international business theory needs to take the role of government into account
in developing and transitional countries. A few studies discuss government involvement in
emerging market OFDI. For instance, Luo and Tung (2007) mention home government
encouragement for “springboard”, particularly via state-owned enterprises (SOEs), while
these MNEs are still being subject to home government influence due to fact that their
governments are usually the largest shareholders. Hennart (2012) also discusses
complementary local resources (CLRs) such as land and natural resources, which are
monopolised by the government and only available to local firms.
Buckley et al. (2007) utilise the general theory of FDI in their study of Chinese OFDI,
incorporating three special explanations of capital market imperfections, special ownership
advantages and institutional factors. One of the common institutional voids related to
emerging market is an underdeveloped capital market. However, Buckley et al. (2007) find
International Journal of Economics, Finance and Business Management Studies| 65
© 2018 The Author | IJEFBM 2018 © 2018 FLE Learning
that the Chinese MNEs have transformed the disadvantage of operating in market
imperfections into ownership advantages, whereby the state-owned firms provide capital at
below market rates to the Chinese MNEs, soft loans granted to potential outward investors
due to inefficient banking systems, role of business group to raise capital for their foreign
affiliates due to inefficient internal capital market and cheap capital from family members. In
their study, Buckley et al. (2007) also recognise that the dark side of government involvement
includes high levels of bureaucratic engagement and burdensome administrative FDI
approval procedures, because the government will often control the amount, direction and
scope of outward capital flows. Similarly, Luo and Tung (2007) mention that SOEs receiving
greater institutional support and government underwriting also face higher bureaucratic and
political intervention.
Building on extant theories and previous research, six hypotheses are proposed:
H1: Government effectiveness of the home and host country is associated positively with
the location choice of Malaysian and Singaporean MNEs in undertaking OFDI.
H2: Economic development of the home and host country is associated positively with the
location choice of Malaysian and Singaporean MNEs in undertaking OFDI.
H3: The size of the firm is associated positively with the location choice of Malaysian and
Singaporean MNEs in undertaking OFDI.
H4: The age (experience) of the firm is associated positively with the location choice of
Malaysian and Singaporean MNEs in undertaking OFDI.
H5: The type of ownership (stated-owned or private firm) is associated positively with the
location choice of Malaysian and Singaporean MNEs in undertaking OFDI.
H6: The type of industry determines the motivation of Malaysian and Singaporean MNEs
in undertaking OFDI.
METHODOLOGY
The base model estimates the probability of the firm i investing in different regions according
to determinant variables using multinomial logistic regression. The location of OFDI is
classified into four main regions in this analysis based on political regions, namely ASEAN
countries, other Asian countries, OECD countries and the rest of the world. The explanatory
variables are classified into three groups as summarised in Table 1.
Table 1: Explanatory Variables
Firm level data Governance index Economic development
Age of the company Voice and accountability GDP growth
Size Political stability GDP per capita
Industry Government effectiveness Population
State ownership Regulatory quality Host patent
Rule of law Skilled labour
Control of corruption Natural resources
Source: Bureau Van Dijk Orbis, The Worldwide Governance Indicators (WDI) and World
Development Indicator (WDI) database.
International Journal of Economics, Finance and Business Management Studies | NORLIA MOHD ZAIN | 66
VOLUME 4 ISSUE 1 ISBN: 978-1-911185-80-2 (Online) ISSN: 2397-6926 (Online) www.flepublications.com
The four destination groups where chosen after considering different regions according
to distance, political relations and the results from estimations. All the independent variables
were also considered, but for governance stability and economic indicators the best approach
was to estimate factor analysis to identify relationships between the variables. The reason for
this was to measure the institutional and economic indicators, which proxied by governance
and technology and to avoid the problem of multicollinearity. Based on factor analysis
regression, two factors where developed: a governance factor and a technology factor. A
multinomial regression was estimated using the selected-developed independent variables,
identifying differences between Malaysia and Singapore through composite dummies for
Singapore.
RESULTS AND DISCUSSION
To check the level of influence of each determinant, this study calculates the marginal effect
associated with the multinomial logistic regressions as illustrated in Table 2. Overall, the
marginal effect results indicate that large Malaysian and Singaporean MNEs are both more
likely to invest in ASEAN countries than small or medium-sized firms. There are significant
and strong results by industry. Each of the industries deserves a particular analysis. A
substitution effect appears to exist between other Asian and OECD countries. Government
stability appears to favour the investments in OECD countries and to avoid investments in
other Asian countries. It is interesting to note that the technology-seeking motivation is more
attractive in other Asian countries and diminishes the probability of investing in OECD.
Apart from the Information and Communication industry, Malaysian and Singaporean MNEs
seem to be indifferent about investments in the rest of the world. In contrast, Singaporean
MNEs show strong significant regional differences in the probabilities of investing abroad
compared to Malaysia. Singaporean MNEs seem to be less affected by the size of the
company than Malaysian MNEs. In contrast to Malaysian MNEs, Singaporean firms are less
sensitive to investments in the Information and Communication industry. Overall results
prove that state-owned Singaporean MNEs tend to favour investments in OECD countries.
Separately from the independent variables, Singaporean MNEs are more alike to invest in the
OECD than Malaysian MNEs. Parsimony of the model is tested using joint test regression for
the Singaporean firm composite dummy for all the explanatory variables, as shown in Table
3.
Table 2: Marginal effects per variable
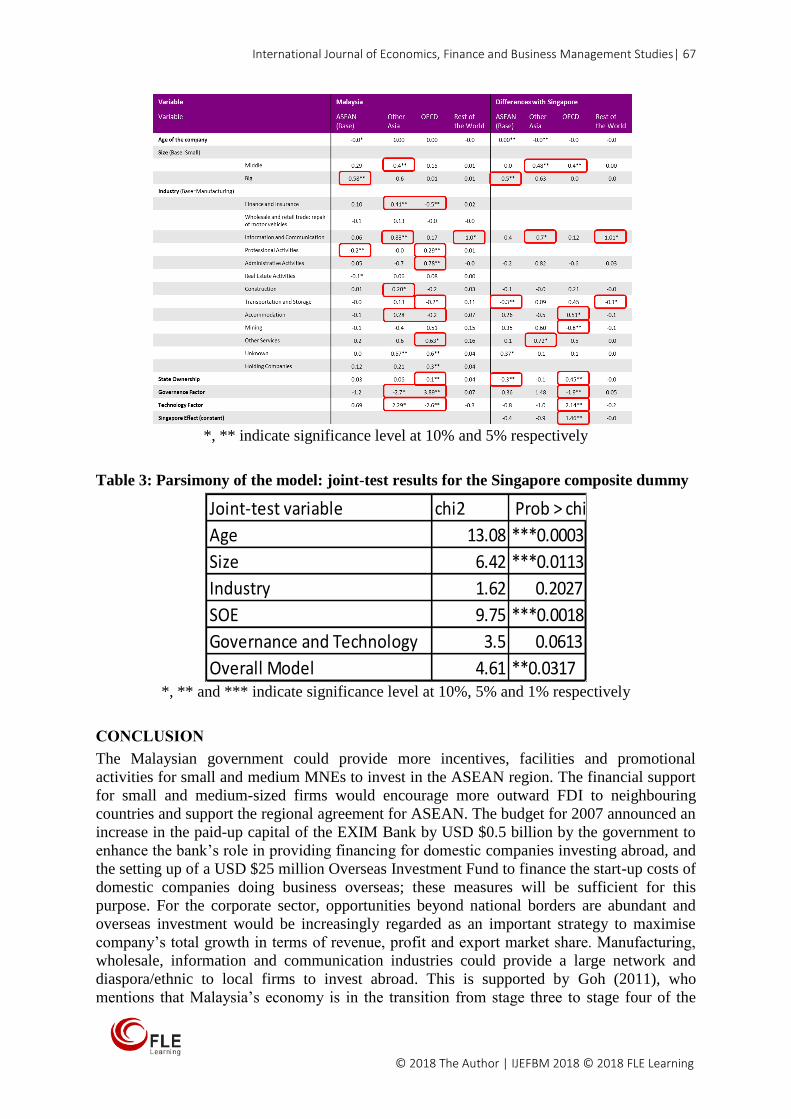
International Journal of Economics, Finance and Business Management Studies| 67
© 2018 The Author | IJEFBM 2018 © 2018 FLE Learning
*, ** indicate significance level at 10% and 5% respectively
Table 3: Parsimony of the model: joint-test results for the Singapore composite dummy
*, ** and *** indicate significance level at 10%, 5% and 1% respectively
CONCLUSION
The Malaysian government could provide more incentives, facilities and promotional
activities for small and medium MNEs to invest in the ASEAN region. The financial support
for small and medium-sized firms would encourage more outward FDI to neighbouring
countries and support the regional agreement for ASEAN. The budget for 2007 announced an
increase in the paid-up capital of the EXIM Bank by USD $0.5 billion by the government to
enhance the bank’s role in providing financing for domestic companies investing abroad, and
the setting up of a USD $25 million Overseas Investment Fund to finance the start-up costs of
domestic companies doing business overseas; these measures will be sufficient for this
purpose. For the corporate sector, opportunities beyond national borders are abundant and
overseas investment would be increasingly regarded as an important strategy to maximise
company’s total growth in terms of revenue, profit and export market share. Manufacturing,
wholesale, information and communication industries could provide a large network and
diaspora/ethnic to local firms to invest abroad. This is supported by Goh (2011), who
mentions that Malaysia’s economy is in the transition from stage three to stage four of the
Joint-test variable chi2 Prob > chi2
Age 13.08 ***0.0003
Size 6.42 ***0.0113
Industry 1.62 0.2027
SOE 9.75 ***0.0018
Governance and Technology 3.5 0.0613
Overall Model 4.61 **0.0317
International Journal of Economics, Finance and Business Management Studies | NORLIA MOHD ZAIN | 68
VOLUME 4 ISSUE 1 ISBN: 978-1-911185-80-2 (Online) ISSN: 2397-6926 (Online) www.flepublications.com
investment development path (IDP) as the nation has embarked on a higher level of economic
development, with domestic firms building up ownership advantages and expanding their
operations abroad. With competitive pressure from globalisation and increasing trade
openness within the country, Malaysian firms have to respond to these challenges, either by
relocating their production activities in the host countries to gain competitive/cost advantage
and to expand markets, or by moving upstream to achieve higher value added and total factor
productivity in the home country. Furthermore, Kueh et al. (2008) mention that the time
frame for achieving the next stage can be shorter if Malaysia particularly (and ASEAN
members generally) make the transition from a paternalistic top-down governance structure
to a pluralistic market economy structure. Malaysia should also grab the opportunity from the
emergence of fast-growing economies like India and China in the world market. For example,
by locating production in China’s low labour costs, Malaysia can gain a competitive
advantage in terms of price and therefore be able to compete and survive in the challenging
market.
BRIEF BIOGRAPHY
Norlia Mohd Zain is a PhD candidate in Economics at Durham University Business School
(UK). A piece of her work was presented at the 42nd Academy of International Business,
United Kingdom and Ireland Conference 2015, the largest chapter of the worldwide AIB
hosted by Manchester University. Another chapter of her work was presented at the 2016
International Academic Conferences on Business and Economics, at Harvard Faculty Club,
Harvard University, Boston, USA. Her research has looked at, among other things, how the
institutions and technology of home and host countries could influence the location choice
and motivation of MNEs towards FDI activities.
REFERENCES
Ariff, M. and Lopez, G. P. (2008) Outward FDI from Southeast Asia: the Malaysian
experience. New Dimensions of Economic Globalization: Surge of Outward Foreign
Direct Investment from Asia. Singapore: World Scientific.
Bhaumik, S. K. and Driffield, N. (2011) Direction of outward FDI of EMNEs: Evidence from
the Indian pharmaceutical sector. Thunderbird International Business Review, 53(5),
615-628.
Buckley, P. J. and Casson, M. (1976) The future of the multinational enterprise, vol. 1.
London: Macmillan.
Buckley, P. J. et al. (2007) The determinants of Chinese outward foreign direct investment.
Journal of International Business Studies, 38(4), 499-518.
Buckley, P. J., Elia, S. and Kafouros, M. (2014) Acquisitions by emerging market
multinationals: Implications for firm performance. Journal of World Business, 49(4),
611-632.
Buckley, P. J. et al. (2013) The economic geography of offshore incorporation in tax havens
and offshore financial centres: the case of Chinese MNEs. Journal of Economic
Geography, 15(1), 103-128.
Child, J. and Rodrigues, S. B. (2005) The internationalization of Chinese firms: A case for
theoretical extension?[1]. Management and Organization Review, 1(3), 381-410.
Cuervo-Cazurra, A. (2012) Extending theory by analyzing developing country multinational
companies: Solving the Goldilocks debate. Global Strategy Journal, 2(3), 153-167.
Cuervo-Cazurra, A. and Genc, M. (2008) Transforming disadvantages into advantages:
developing-country MNEs in the least developed countries. Journal of International
Business Studies, 39(6), 957-979.
Doukas, J. A. and Lang, L. H. P. (2003) Foreign Direct Investment, Diversification and Firm
Performance. Journal of International Business Studies, 34(2), 153-172.
International Journal of Economics, Finance and Business Management Studies| 69
© 2018 The Author | IJEFBM 2018 © 2018 FLE Learning
Dunning, J. H. (1979) Explaining changing patterns of international production: in defence of
the eclectic theory. Oxford Bulletin of Economics and Statistics, 41(4), 269-295.
Dunning, J. H. and Narula, R. (1996) The investment development path revisited. In J.H.
Dunning and R. Narula, Foreign direct investment and governments: Catalysts for
economic restructuring. London, New York: Routledge, 1-41.
Goh, S. K. (2011) Malaysia's outward FDI: The effects of market size and government
policy. Journal of Policy Modeling, 33(3), 497-510.
Hennart, J.-F. (2012) Emerging market multinationals and the theory of the multinational
enterprise. Global Strategy Journal, 2(3), 168-187.
Johanson, J. and Vahlne, J.-E. (1977) The internationalization process of the firm-a model of
knowledge development and increasing foreign market commitments. Journal of
International Business Studies, 8(1), 23-32.
Johanson, J. and Vahlne, J.-E. (2009) The Uppsala internationalization process model
revisited: From liability of foreignness to liability of outsidership. Journal of
International Business Studies, 40(9), 1411-1431.
Khanna, T. and Palepu, K. (1997) Why focused strategies may be wrong for emerging
markets. Harvard Business Review, 75, 41-54.
Kueh, S., Puah, C.-H. and Apoi, A. (2008) Outward FDI of Malaysia: An empirical
examination from macroeconomic perspective. Economic Bulletin, 6(28), 1-11.
Liang, M. (2005) Singapore's Trade Policies: Priorities and Options. ASEAN Economic
Bulletin, 22(1), 49-59.
Luo, Y. and Tung, R. L. (2007) International expansion of emerging market enterprises: A
springboard perspective. Journal of International Business Studies, 38(4), 481-498.
Madhok, A. and Keyhani, M. (2012) Acquisitions as entrepreneurship: asymmetries,
opportunities, and the internationalization of multinationals from emerging economies.
Global Strategy Journal, 2(1), 26-40.
Mathews, J. A. (2006) Dragon multinationals: New players in 21st century globalization.
Asia Pacific Journal of Management, 23(1), 5-27.
Ning, L. and Sutherland, D. (2012) Internationalization of China's Private Sector MNEs: An
Analysis of the Motivations for Foreign Affiliate Formation. Thunderbird International
Business Review, 54(2), 169-182.
OECD (2009) OECD Benchmark Definition of Foreign Direct Investment 2008. Paris: OECD
Publishing.
Ramamurti, R. (2009) What have we learned about emerging—market MNEs? In
Ramamurti, R. and Singh, J. (eds.) Emerging multinationals in emerging markets. UK:
Cambridge University Press.
Ramamurti, R. (2012) What is really different about emerging market multinationals? Global
Strategy Journal, 2(1), 41-47.
Ramasamy, B., Yeung, M. and Laforet, S. (2012) China's outward foreign direct investment:
Location choice and firm ownership. Journal of World Business, 47(1), 17-25.
Rugman, A. M. (1981) Inside the multinationals: The economics of internal markets. New
York, NY: Columbia University Press.
Sim, A. B. (2012) A comparative case study of the internationalization strategies of
Malaysian, Singaporean and Taiwanese firms. Journal of Asian Business, 24(3), 85-
108.
Sutherland, D. and Ning, L. (2011) Exploring ‘onward-journey’ODI strategies in China's
private sector businesses. Journal of Chinese Economic and Business Studies, 9(1), 43-
65.

International Journal of Economics, Finance and Business Management Studies | NORLIA MOHD ZAIN | 70
VOLUME 4 ISSUE 1 ISBN: 978-1-911185-80-2 (Online) ISSN: 2397-6926 (Online) www.flepublications.com
UNCTAD (2015). [Online]. Available from: http://unctadstat.unctad.org/ [Accessed 12
November 2018].
Yao, S. and Sutherland, D. (2009) Chinalco and Rio Tinto: A Long March for China's
National Champions. The China Quarterly, 199, 829.
Yean, T. S. (2007) Outward foreign direct investment from Malaysia: an exploratory study.
Journal of Current Southeast Asian Affairs, 26(5), 44-72.
International Journal of Economics, Finance and Business Management Studies| 71
© 2018 The Author | IJEFBM 2018 © 2018 FLE Learning
7.G.AY20-5680
THE ROLE OF GOVERNANCE, RISK AND COMPLIANCE IN
SUCCESSFUL PORTFOLIO PROJECT MANAGEMENT
SAIF SAEED ALQUBAISI1
ABSTRACT
Governance, Risk and Compliance (GRC) are methodologies that are used for the betterment
of corporate decisions, both tactical and strategical. They will also directly affect the
corporate capacity to acquire an exhaustive comprehension of their risk. Without a genuine
comprehension of the considerable number of risks it confronts, the corporation cannot settle
on solid vital and strategic choices that push supportable cost efficiencies, quicken execution
and drive gainful development. Overseeing risks in a project is achieved through the portfolio
methodology, which encourages conformity and the reallocation of assets among tasks and
takes into account extra portfolio risks and interdependencies between risks. In the field of
business today, the success of the project depends on early and aggressive risk identification
activities. It primarily depends on collaboration and coordination of the related stakeholders.
An integrated approach is used to effectively mitigate and anticipate the risk, which can have
a critical impact on the project.
Governance is another element that has become popular in recent years, especially after
the fall of big business giants globally. Efficient governance allows the timely identification
of possible risks and the related remedies. Corporate governance focuses on developing and
establishing a decision-making architecture from the upper level to the front line that aims to
strengthen the business model and maximise the performance, eliminate risk and contribute
to project value. The ultimate goal is to ensure accountability, timely disclosure of the
information and authority. Research shows that corporate governance is equally important for
the internal and external stakeholders. Achieving a certain level of sustainable compliance is
considered a primary goal of the business, and leaders are required to unveil new and
unprecedented methods for reducing costs, improving business performance, and
strengthening the decision making process. In short, in a competitive and fast-paced business,
success depends on attaining the balance between risk and opportunities, and this is becoming
more complex with time with the number, budget and scope of programmes, and projects.
The concept and application of portfolio management has gained attention in this
regard. It is a process of holistically looking across different process, analysing the strategic
alignment and return on investment of portfolios. It is a systematic process of opting for the
right programmes and projects for the corporate strategy. It translates and applies the strategic
vision to the individual projects, leading to a greatest potential efficiency. GRC integrates
isolated projects and programmes in an efficient and effective business-wide way with a
control structure to ensure that strategic initiatives align with the risk management process.
Therefore, it is a branch of management targeted to attain a balance between the competing
demands of stakeholders, regulators, market forces and customers. Portfolio GRC enjoys a
fundamental importance in the world of business and its success for government. This
research aims to develop a relationship between GRC and portfolio management, which will
facilitate the entity in strategically aligning the resources and processes in the government
sector.
Keywords: Governance, Risk and Compliance, Portfolio GRC, Portfolio Management
1 PHD Student in Engineering System, School of Engineering and Applied Science, Aston University, United Kingdom.
International Journal of Economics, Finance and Business Management Studies | SAIF SAEED ALQUBAISI | 72
VOLUME 4 ISSUE 1 ISBN: 978-1-911185-80-2 (Online) ISSN: 2397-6926 (Online) www.flepublications.com
INTRODUCTION
Over the years, the adoption of portfolio project management (PPM) has experienced
significant growth in a variety of disciplines with the aim of ensuring that tasks are aligned to
diverse sectors and departments (Kaiser, 2015). Notably, the continuously elevating
economic requirements to reduce time to market indicates that projects such as these are not
conducted individually and are always meant to satisfy a larger scope of priorities. Given that
interrelationships in various business environments have led to a rise in the number of
projects undertaken together within government, there has been an increase in the need for
GRC on the running portfolio, programme and projects. The combination of these aspects has
led to model results from projects conducted by various organisation and government
departments across the globe (Patanakul, 2012; Badewi, 2016). Irrespective of the increased
adoption of suitable PPM and GRC in the management of various projects, the value arising
from such projects is subject to scrutiny through case studies, which have concluded that
most projects are not conducted to end within the specified time frame and budget, leading to
the delivery of incomplete reports (Teller and Kock, 2013). As a consequence, there are
disconnects between existing projects that are misaligned or managed as a single project. As
a result of this, government and enterprise project governance and compliance officers have
endeavoured to develop structured ways to manage multiple projects in a manner that
maximises value addition in the project activities. Further on, the integration of GRC, in
accompaniment with PPM, in the management of various projects has enhanced the
alignment of enterprise and government projects with the critical strategies that form part of
the approval and initiating processes.
Recently, the awareness of the need for GRC as part of the portfolio has increased in
specifically governmental entities due to the strategic importance of the programmes and the
requirement to align the projects with government aims and strategic objectives, as well as in
corporate GRC. Government representatives and senior management have to ensure that they
are able to capture the risks facing them and their project, and government should have the
resources to handle any obstacles facing them and convert the obstacles to corporate value.
However, project governance and risk can always be indicated on the project level, but still
cannot be indicated at the programme level and portfolio (Neckowicz et al., 2015). For
effective corporate operations, corporate strategy, portfolio, programme and project strategy
need interaction (Mayer et al., 2015). Activities of business alignment along the integrations
of project governance and the associations among process and structure are the main
requirements of having portfolio GRC.
Many of the objectives under strategic planning are not achieved due to the differences
between the implemented strategic planning in reality and the corporate objectives (Killen et
al., 2015). To transform the planning into real action, corporations have to be more effective
in their ability (El Kharbili, 2012). Batenburg et al. (2014) similarly found that articulating
strategies by corporations is easier than executing strategy in practice. Hence, the defined
strategic objectives and plans have to be transformed into action plans as well as into
completed projects. Corporations on specific governmental entities are not capable to have
visibility on their programmes and projects within their portfolio, which leads to lack of
proper selection and prioritisation of projects. Nor are they able to execute the projects in a
cohesive and consistent way to reach planed corporate objectives, which set obstacles in the
way of executive management and stakeholders.
In this paper, the gap in the literature concerning project governance, risk and
compliance is examined, as the alignment of Project GRC (PGRC) with corporate GRC is
significant for success. The initial literature review conducted in the area of PGRC reveals
the lack of significant literature in this area and the absence of clarity on the measurements
and markers with a specific end goal and which are used to assess the quality, risk,
International Journal of Economics, Finance and Business Management Studies| 73
© 2018 The Author | IJEFBM 2018 © 2018 FLE Learning
governance and compliance. This paper presents a detailed review of GRC and PPM and the
impact creation through their combination as PGRC. PPM rotates around the current practice
of management of projects, giving rise to guidelines for monitoring projects being carried out
across the country to bring about effective management of the government risk exposure,
which is critical to financial sustainability as well as forming an integral part of governance
risk compliance.
PPM
The concept of project management and its development can be traced back to a report
published by the UK institution of Civil Engineers. It discussed post-World War II national
development and drew attention to the need for a systematic approach, with a planned
breakdown of activities to achieve fixed objectives. In the literature, a project is described in
many ways; for example, it can be described as “a temporary endeavour to create a unique
product, service or result” (PMI, 2013). Before the emergence of portfolios, there existed
programmes. The term “programme management” has been defined in the literature in
various ways; however, most definitions refer to the coordinated management of a collection
of interrelated projects (Sarbazhosseini et al., 2014). The importance of programme
management in organising both potential and approved projects and activities and presenting
an integrated approach to project management has often been discussed in the academic
literature (Jonas et al., 2013). This approach analyses the needs of working with high-priority
objectives to support the implementation of the corporate strategy, at the same time
increasing the visibility of the important projects at higher management levels and prioritising
those with the highest potential for stakeholder value maximisation.
In PPM, a distinction between three elements – collaboration, foresight and risk
management - is observed, as per the project management theory (PMI, 2013). While they are
noted as to be closely linked, they are nevertheless distinct. PPM is noted as a broad concept
with a series of processes that lead to selection, prioritisation and allocation of resources for
multiple projects (at independent level) and programmes (PMI, 2013; Voss and Kock, 2013).
In PPM, there are few main components that define its importance and hence, the framework
of operation (Kaiser et al., 2015; Yang et al., 2014). These components include strategy,
governance, processes and methods. Strategic alignment is crucial for the successful
management of a project portfolio. They emerge from the mission, vision and objectives of
the organisation. Governance in PPM is targeted to distribute responsibility among various
members (i.e. internal and external) that are involved in decision-making (Alneyadi and Ali,
2014).
Key factors affecting the success of PPM
PPM as a process is executed many times in a year by matching it to business type,
organisational size and the culture followed by the management (Heagney, 2016). The aim is
to translate strategy into initiative, to identify programmes and projects, to optimise the
portfolio followed by its approval and to identify risks and suggest remedial strategies for
them (Kerzner, 2013).
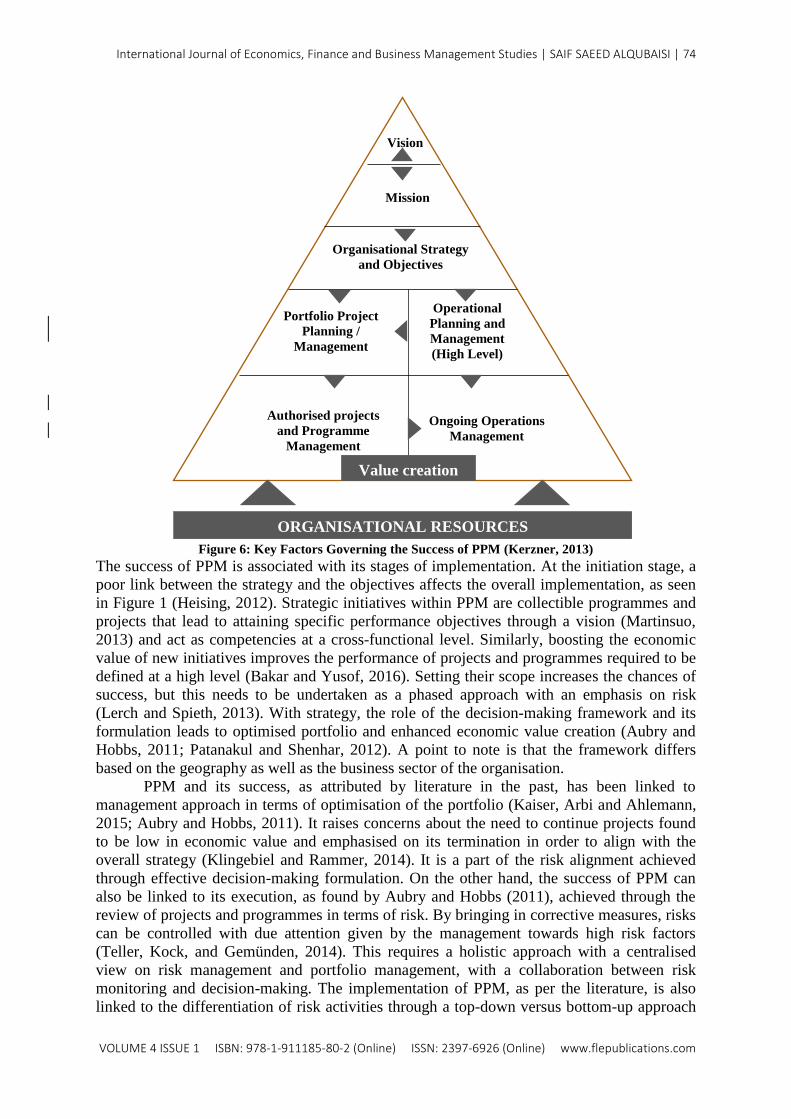
International Journal of Economics, Finance and Business Management Studies | SAIF SAEED ALQUBAISI | 74
VOLUME 4 ISSUE 1 ISBN: 978-1-911185-80-2 (Online) ISSN: 2397-6926 (Online) www.flepublications.com
Figure 6: Key Factors Governing the Success of PPM (Kerzner, 2013)
The success of PPM is associated with its stages of implementation. At the initiation stage, a
poor link between the strategy and the objectives affects the overall implementation, as seen
in Figure 1 (Heising, 2012). Strategic initiatives within PPM are collectible programmes and
projects that lead to attaining specific performance objectives through a vision (Martinsuo,
2013) and act as competencies at a cross-functional level. Similarly, boosting the economic
value of new initiatives improves the performance of projects and programmes required to be
defined at a high level (Bakar and Yusof, 2016). Setting their scope increases the chances of
success, but this needs to be undertaken as a phased approach with an emphasis on risk
(Lerch and Spieth, 2013). With strategy, the role of the decision-making framework and its
formulation leads to optimised portfolio and enhanced economic value creation (Aubry and
Hobbs, 2011; Patanakul and Shenhar, 2012). A point to note is that the framework differs
based on the geography as well as the business sector of the organisation.
PPM and its success, as attributed by literature in the past, has been linked to
management approach in terms of optimisation of the portfolio (Kaiser, Arbi and Ahlemann,
2015; Aubry and Hobbs, 2011). It raises concerns about the need to continue projects found
to be low in economic value and emphasised on its termination in order to align with the
overall strategy (Klingebiel and Rammer, 2014). It is a part of the risk alignment achieved
through effective decision-making formulation. On the other hand, the success of PPM can
also be linked to its execution, as found by Aubry and Hobbs (2011), achieved through the
review of projects and programmes in terms of risk. By bringing in corrective measures, risks
can be controlled with due attention given by the management towards high risk factors
(Teller, Kock, and Gemünden, 2014). This requires a holistic approach with a centralised
view on risk management and portfolio management, with a collaboration between risk
monitoring and decision-making. The implementation of PPM, as per the literature, is also
linked to the differentiation of risk activities through a top-down versus bottom-up approach
Vision
Mission
Organisational Strategy
and Objectives
Portfolio Project
Planning /
Management
Operational
Planning and
Management
(High Level)
Authorised projects
and Programme
Management
Ongoing Operations
Management
ORGANISATIONAL RESOURCES
Value creation
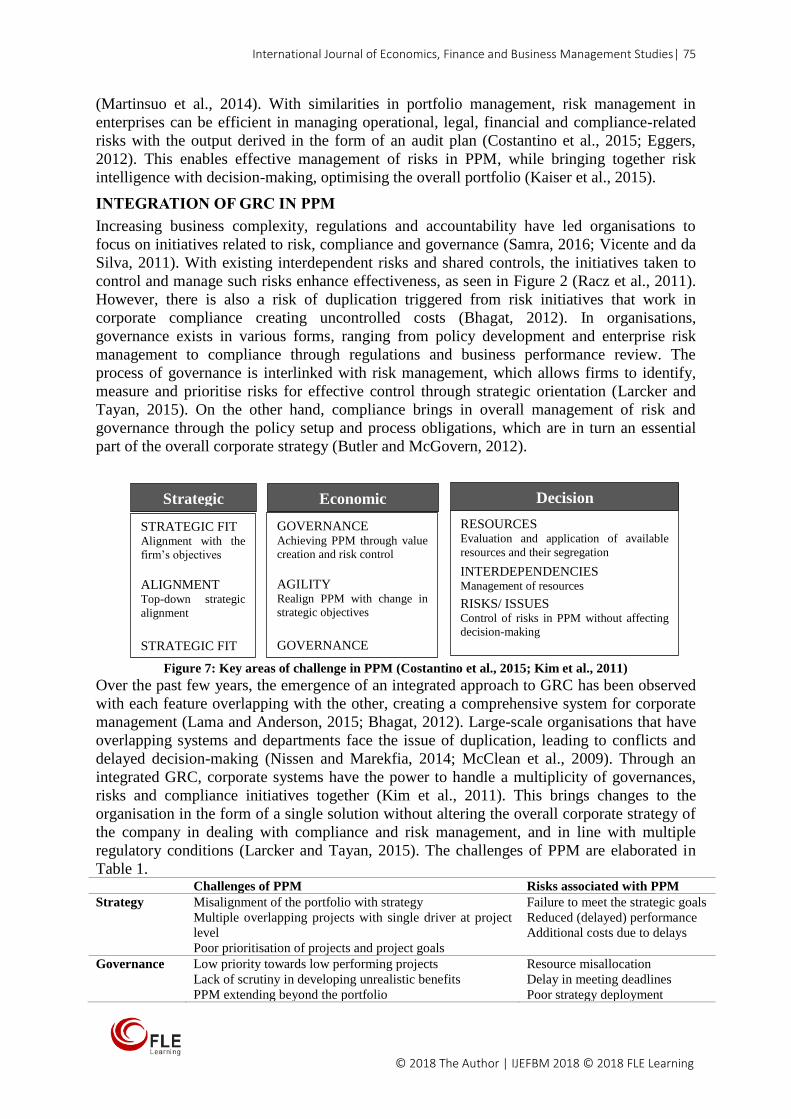
International Journal of Economics, Finance and Business Management Studies| 75
© 2018 The Author | IJEFBM 2018 © 2018 FLE Learning
(Martinsuo et al., 2014). With similarities in portfolio management, risk management in
enterprises can be efficient in managing operational, legal, financial and compliance-related
risks with the output derived in the form of an audit plan (Costantino et al., 2015; Eggers,
2012). This enables effective management of risks in PPM, while bringing together risk
intelligence with decision-making, optimising the overall portfolio (Kaiser et al., 2015).
INTEGRATION OF GRC IN PPM
Increasing business complexity, regulations and accountability have led organisations to
focus on initiatives related to risk, compliance and governance (Samra, 2016; Vicente and da
Silva, 2011). With existing interdependent risks and shared controls, the initiatives taken to
control and manage such risks enhance effectiveness, as seen in Figure 2 (Racz et al., 2011).
However, there is also a risk of duplication triggered from risk initiatives that work in
corporate compliance creating uncontrolled costs (Bhagat, 2012). In organisations,
governance exists in various forms, ranging from policy development and enterprise risk
management to compliance through regulations and business performance review. The
process of governance is interlinked with risk management, which allows firms to identify,
measure and prioritise risks for effective control through strategic orientation (Larcker and
Tayan, 2015). On the other hand, compliance brings in overall management of risk and
governance through the policy setup and process obligations, which are in turn an essential
part of the overall corporate strategy (Butler and McGovern, 2012).
Figure 7: Key areas of challenge in PPM (Costantino et al., 2015; Kim et al., 2011)
Over the past few years, the emergence of an integrated approach to GRC has been observed
with each feature overlapping with the other, creating a comprehensive system for corporate
management (Lama and Anderson, 2015; Bhagat, 2012). Large-scale organisations that have
overlapping systems and departments face the issue of duplication, leading to conflicts and
delayed decision-making (Nissen and Marekfia, 2014; McClean et al., 2009). Through an
integrated GRC, corporate systems have the power to handle a multiplicity of governances,
risks and compliance initiatives together (Kim et al., 2011). This brings changes to the
organisation in the form of a single solution without altering the overall corporate strategy of
the company in dealing with compliance and risk management, and in line with multiple
regulatory conditions (Larcker and Tayan, 2015). The challenges of PPM are elaborated in
Table 1. Challenges of PPM Risks associated with PPM
Strategy Misalignment of the portfolio with strategy
Multiple overlapping projects with single driver at project
level
Poor prioritisation of projects and project goals
Failure to meet the strategic goals
Reduced (delayed) performance
Additional costs due to delays
Governance Low priority towards low performing projects
Lack of scrutiny in developing unrealistic benefits
PPM extending beyond the portfolio
Resource misallocation
Delay in meeting deadlines
Poor strategy deployment
Strategic
Economic
Decision
STRATEGIC FIT Alignment with the
firm’s objectives
ALIGNMENT Top-down strategic
alignment
STRATEGIC FIT Alignment with the
GOVERNANCE Achieving PPM through value
creation and risk control
AGILITY Realign PPM with change in
strategic objectives
GOVERNANCE Achieving PPM through value
RESOURCES Evaluation and application of available
resources and their segregation
INTERDEPENDENCIES Management of resources
RISKS/ ISSUES Control of risks in PPM without affecting
decision-making
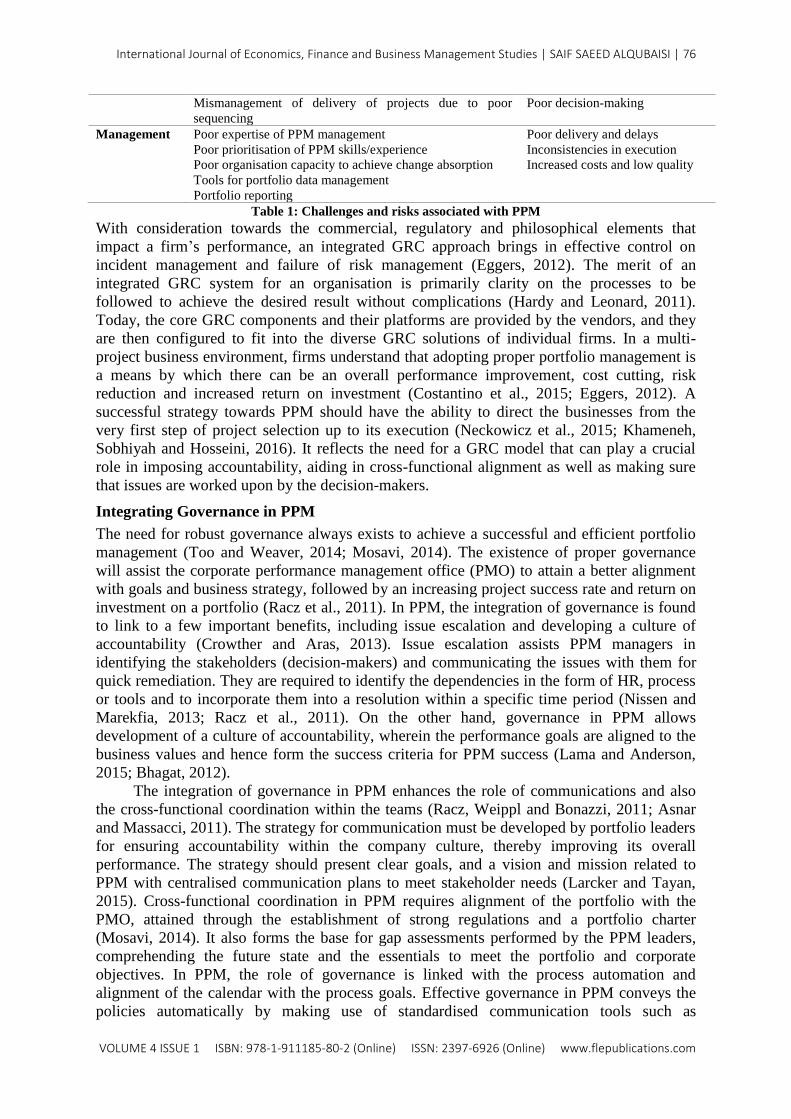
International Journal of Economics, Finance and Business Management Studies | SAIF SAEED ALQUBAISI | 76
VOLUME 4 ISSUE 1 ISBN: 978-1-911185-80-2 (Online) ISSN: 2397-6926 (Online) www.flepublications.com
Mismanagement of delivery of projects due to poor
sequencing
Poor decision-making
Management Poor expertise of PPM management
Poor prioritisation of PPM skills/experience
Poor organisation capacity to achieve change absorption
Tools for portfolio data management
Portfolio reporting
Poor delivery and delays
Inconsistencies in execution
Increased costs and low quality
Table 1: Challenges and risks associated with PPM
With consideration towards the commercial, regulatory and philosophical elements that
impact a firm’s performance, an integrated GRC approach brings in effective control on
incident management and failure of risk management (Eggers, 2012). The merit of an
integrated GRC system for an organisation is primarily clarity on the processes to be
followed to achieve the desired result without complications (Hardy and Leonard, 2011).
Today, the core GRC components and their platforms are provided by the vendors, and they
are then configured to fit into the diverse GRC solutions of individual firms. In a multi-
project business environment, firms understand that adopting proper portfolio management is
a means by which there can be an overall performance improvement, cost cutting, risk
reduction and increased return on investment (Costantino et al., 2015; Eggers, 2012). A
successful strategy towards PPM should have the ability to direct the businesses from the
very first step of project selection up to its execution (Neckowicz et al., 2015; Khameneh,
Sobhiyah and Hosseini, 2016). It reflects the need for a GRC model that can play a crucial
role in imposing accountability, aiding in cross-functional alignment as well as making sure
that issues are worked upon by the decision-makers.
Integrating Governance in PPM
The need for robust governance always exists to achieve a successful and efficient portfolio
management (Too and Weaver, 2014; Mosavi, 2014). The existence of proper governance
will assist the corporate performance management office (PMO) to attain a better alignment
with goals and business strategy, followed by an increasing project success rate and return on
investment on a portfolio (Racz et al., 2011). In PPM, the integration of governance is found
to link to a few important benefits, including issue escalation and developing a culture of
accountability (Crowther and Aras, 2013). Issue escalation assists PPM managers in
identifying the stakeholders (decision-makers) and communicating the issues with them for
quick remediation. They are required to identify the dependencies in the form of HR, process
or tools and to incorporate them into a resolution within a specific time period (Nissen and
Marekfia, 2013; Racz et al., 2011). On the other hand, governance in PPM allows
development of a culture of accountability, wherein the performance goals are aligned to the
business values and hence form the success criteria for PPM success (Lama and Anderson,
2015; Bhagat, 2012).
The integration of governance in PPM enhances the role of communications and also
the cross-functional coordination within the teams (Racz, Weippl and Bonazzi, 2011; Asnar
and Massacci, 2011). The strategy for communication must be developed by portfolio leaders
for ensuring accountability within the company culture, thereby improving its overall
performance. The strategy should present clear goals, and a vision and mission related to
PPM with centralised communication plans to meet stakeholder needs (Larcker and Tayan,
2015). Cross-functional coordination in PPM requires alignment of the portfolio with the
PMO, attained through the establishment of strong regulations and a portfolio charter
(Mosavi, 2014). It also forms the base for gap assessments performed by the PPM leaders,
comprehending the future state and the essentials to meet the portfolio and corporate
objectives. In PPM, the role of governance is linked with the process automation and
alignment of the calendar with the process goals. Effective governance in PPM conveys the
policies automatically by making use of standardised communication tools such as
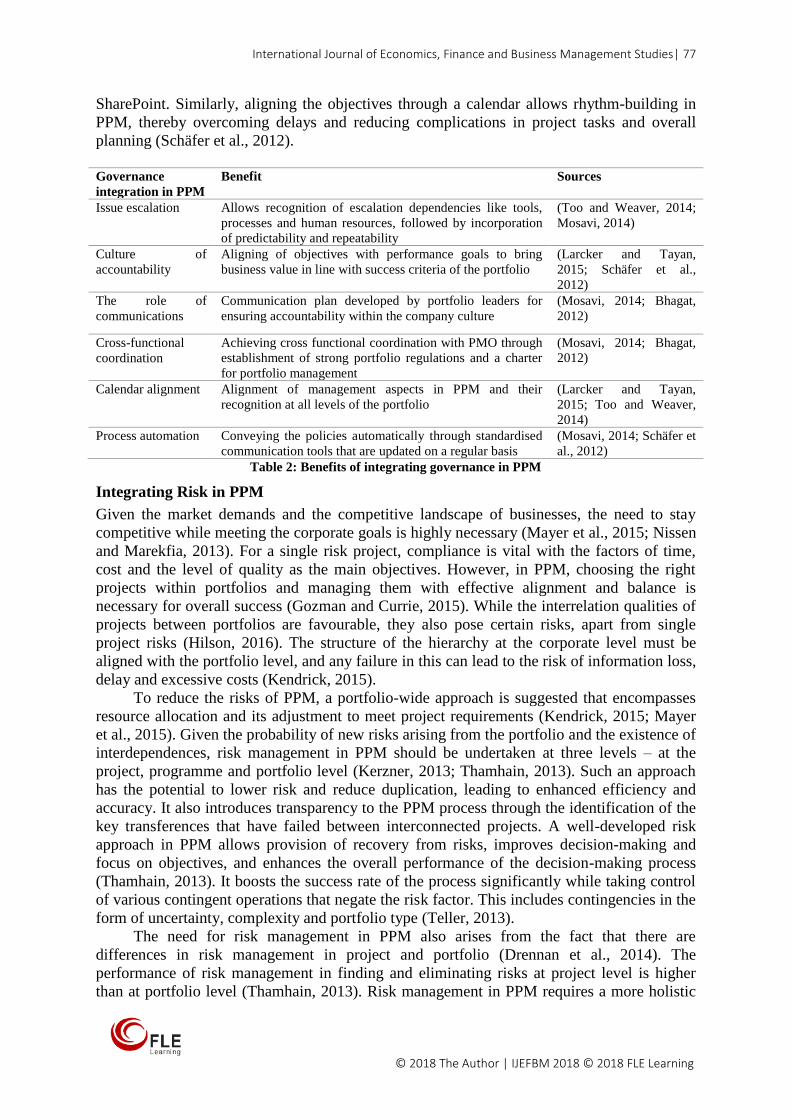
International Journal of Economics, Finance and Business Management Studies| 77
© 2018 The Author | IJEFBM 2018 © 2018 FLE Learning
SharePoint. Similarly, aligning the objectives through a calendar allows rhythm-building in
PPM, thereby overcoming delays and reducing complications in project tasks and overall
planning (Schäfer et al., 2012).
Governance
integration in PPM
Benefit Sources
Issue escalation Allows recognition of escalation dependencies like tools,
processes and human resources, followed by incorporation
of predictability and repeatability
(Too and Weaver, 2014;
Mosavi, 2014)
Culture of
accountability
Aligning of objectives with performance goals to bring
business value in line with success criteria of the portfolio
(Larcker and Tayan,
2015; Schäfer et al.,
2012)
The role of
communications
Communication plan developed by portfolio leaders for
ensuring accountability within the company culture
(Mosavi, 2014; Bhagat,
2012)
Cross-functional
coordination
Achieving cross functional coordination with PMO through
establishment of strong portfolio regulations and a charter
for portfolio management
(Mosavi, 2014; Bhagat,
2012)
Calendar alignment Alignment of management aspects in PPM and their
recognition at all levels of the portfolio
(Larcker and Tayan,
2015; Too and Weaver,
2014)
Process automation Conveying the policies automatically through standardised
communication tools that are updated on a regular basis
(Mosavi, 2014; Schäfer et
al., 2012)
Table 2: Benefits of integrating governance in PPM
Integrating Risk in PPM
Given the market demands and the competitive landscape of businesses, the need to stay
competitive while meeting the corporate goals is highly necessary (Mayer et al., 2015; Nissen
and Marekfia, 2013). For a single risk project, compliance is vital with the factors of time,
cost and the level of quality as the main objectives. However, in PPM, choosing the right
projects within portfolios and managing them with effective alignment and balance is
necessary for overall success (Gozman and Currie, 2015). While the interrelation qualities of
projects between portfolios are favourable, they also pose certain risks, apart from single
project risks (Hilson, 2016). The structure of the hierarchy at the corporate level must be
aligned with the portfolio level, and any failure in this can lead to the risk of information loss,
delay and excessive costs (Kendrick, 2015).
To reduce the risks of PPM, a portfolio-wide approach is suggested that encompasses
resource allocation and its adjustment to meet project requirements (Kendrick, 2015; Mayer
et al., 2015). Given the probability of new risks arising from the portfolio and the existence of
interdependences, risk management in PPM should be undertaken at three levels – at the
project, programme and portfolio level (Kerzner, 2013; Thamhain, 2013). Such an approach
has the potential to lower risk and reduce duplication, leading to enhanced efficiency and
accuracy. It also introduces transparency to the PPM process through the identification of the
key transferences that have failed between interconnected projects. A well-developed risk
approach in PPM allows provision of recovery from risks, improves decision-making and
focus on objectives, and enhances the overall performance of the decision-making process
(Thamhain, 2013). It boosts the success rate of the process significantly while taking control
of various contingent operations that negate the risk factor. This includes contingencies in the
form of uncertainty, complexity and portfolio type (Teller, 2013).
The need for risk management in PPM also arises from the fact that there are
differences in risk management in project and portfolio (Drennan et al., 2014). The
performance of risk management in finding and eliminating risks at project level is higher
than at portfolio level (Thamhain, 2013). Risk management in PPM requires a more holistic
International Journal of Economics, Finance and Business Management Studies | SAIF SAEED ALQUBAISI | 78
VOLUME 4 ISSUE 1 ISBN: 978-1-911185-80-2 (Online) ISSN: 2397-6926 (Online) www.flepublications.com
view, given the low availability of research on the application of risk management to
portfolios and the complexities that exist in identifying risks (Kim et al., 2011). Another point
to note is the lack of literature on the integration of risk management process within PPM
(Drennan et al., 2014; Vicente and da Silva, 2011). While the importance of risk management
in portfolios is widely understood by organisations, there are complications in linking it with
strategic objectives and its influence on the risk management cycle of individual projects and
programmes (Nissen and Marekfia, 2013). Hence, there is a need for an effective risk
management process for PPM that transcends project-level risk management, eliminating
interdependencies in projects and thereby portfolios. Such a process will allow knowledge
exchange across the portfolio and increase the chance of success (Sanchez et al., 2008).
Integrating Compliance in PPM
In PPM, managing compliance is a challenging task, given the need to comply with multiple
laws (locally and internationally), the diverse lines of business and the existence of multi-
national business operations (El Kharbili, 2012). It is highly essential that businesses
undertaking PPM understand the intensity of “what aspects the business needs to comply
with.” More importantly, it is about “how to make people take accountability” (Mitchel and
Switzer, 2009; Bhagat, 2012). The process of PPM compliance encompasses a four-step
approach that initiates the identification of the legal, statutory, contractual and regulatory
obligations faced by the business (Abdullah et al., 2016). This includes requirement analysis
and deviation analysis, leading to deficiency management and reporting cum documentation
(Tricker and Tricker, 2015). This four-step approach to compliance management is a standard
framework that allows firms to build a control system internally (Parker and Nielson, 2011;
Mayer et al., 2015). Compliance in PPM is undertaken through audit, security checks and
self-assessments, with the examination frequency varying from one channel to the other.
(Mayer et al., 2015; Racz et al., 2010).
In PPM, assurance of achieving the set of objectives on reporting and compliance
reliability is achieved through an effective integrated GRC model (Ele and Ola, 2016;
Gozman and Currie, 2015). Compliance is hence considered a vital aspect of the GRC model
in PPM, which allows compliance with laws and regulations externally and integrates various
categories of the system for compliance and reporting review (Abdullah et al., 2016;
Batenburg et al., 2014). A weak point in a standard compliance management framework is its
poor integration with risk management, as there are no risks identified for non-compliance
(Nissen and Marekfia, 2013). An integrated GRC in PPM should consider the alignment of
compliance with risk management to enable a compliance approach based on the risk of non-
compliance (Parker and Nielson, 2011; El Kharbili, 2012).
To achieve a successful compliance model while in integration with the other elements
of GRC, companies are required to focus on delineating policies and framework for
compliance and to checking compliance health (Ramezani et al., 2011). Along with the
above, companies should also focus on preparing checklists, enabling automatic tools and
ensuring provision of regular updates on the compliance process (Bhagat, 2012; Ettredge et
al., 2011). Enabling compliance processes in companies with elements of governance and
risk is a complex process. As identified by Lama and Anderson (2015), there are two main
procedures to adhere to. The first procedure is setting up the conditions for the procedures,
work and infrastructure, along with the statutory records (Schäfer et al., 2012), later classified
into policies and process (Asnar and Massacci, 2011). The second procedure covers
licensing, returns, payments and registration, among other aspects (Vicente and da Silva,
2011b). Companies also need to focus on enforcing compliance at the employee level, with a
team delegated to monitor, review and manage compliance status and reports (Racz et al.,
2010; Vicente and da Silva, 2011a).
International Journal of Economics, Finance and Business Management Studies| 79
© 2018 The Author | IJEFBM 2018 © 2018 FLE Learning
CONCLUSION
The PPM concept and the integration of governance, risk and compliance is both
challenging and intriguing. While there is extensive literature on PPM and GRC, there is not
much literature in the field of PGRC, reflecting a need for further probing into this unique
concept and its application in the government and private sectors. Notwithstanding the effect
of GRC on the concept of PPM, it can be said that each concept has the potential to offer
unique benefits to the other, while achieving effective management of risks across various
levels. Most importantly, PGRC has the potential to bring PPM into alignment with the
strategic vision and objectives, thereby enhanced decision-making, effective control on
redundancies and improving the overall performance.
REFERENCES
Abdullah, N.S., Indulska, M. and Sadiq, S. (2016) Compliance management ontology–a
shared conceptualization for research and practice in compliance
management. Information Systems Frontiers 18(5), 995-1020.
Alneyadi, A.S. and Ali, A.B. (2014) Artificial Intelligence Approach for Project Portfolio
Management. Artificial Intelligence, 3(3), 458-469.
Asnar, Y. and Massacci, F. (2011) A method for security governance, risk, and compliance
(GRC): a goal-process approach. In: Aldini, A. and Gorrieri, R. (eds.) Foundations of
security analysis and design VI. Berlin: Springer Berlin Heidelberg.
Aubry, M. and Hobbs, B. (2011) A fresh look at the contribution of project management to
organizational performance. Project Management Journal, 42(1), 3-16.
Badewi, A. (2016) The impact of project management (PM) and benefits management (BM)
practices on project success: Towards developing a project benefits governance
framework. International Journal of Project Management, 34(4), 761-778.
Bakar, A.H.A. and Yusof, M.N. (2016) Project Portfolio Management and Portfolio
Performance In Construction Industry: A Conceptual Framework. Research Journal
of Fisheries and Hydrobiology, 11(3), 131-136.
Batenburg, R., Neppelenbroek, M. and Shahim, A. (2014) A maturity model for governance,
risk management and compliance in hospitals. Journal of Hospital Administration,
3(4), 43.
Bhagat, B.C (2012) Cloud Computing Governance, Cyber Security, Risk, and Compliance
Business Rules System and Method. US Patent Application 13/016,999. [Online].
Available from: https://patents.google.com/patent/US20120011077A1/en [Accessed
11 November 2018].
Butler, T. and McGovern, D. (2012) A conceptual model and IS framework for the design
and adoption of environmental compliance management systems. Information
Systems Frontiers, 14(2), 221-235.
Costantino, F., Di Gravio, G. and Nonino, F. (2015) Project selection in project portfolio
management: An artificial neural network model based on critical success
factors. International Journal of Project Management, 33(8), 1744-1754.
Crowther, D. and Aras, G. (2013) Introduction. In: Crowther, D. and Aras, G. (eds.) The
Governance of Risk (Developments in Corporate Governance and Responsibility, Vol.
5. London: Emerald Group Publishing Limited.
Drennan, L.T., McConnell, A. and Stark, A. (2014) Risk and crisis management in the public
sector. London: Routledge.
Eggers, J.P. (2012) All experience is not created equal: learning, adapting, and focusing in
product portfolio management. Strategic Management Journal, 33(3), 315-335.
International Journal of Economics, Finance and Business Management Studies | SAIF SAEED ALQUBAISI | 80
VOLUME 4 ISSUE 1 ISBN: 978-1-911185-80-2 (Online) ISSN: 2397-6926 (Online) www.flepublications.com
El Kharbili, M. (2012) Business process regulatory compliance management solution
frameworks: A comparative evaluation. In Proceedings of the Eighth Asia-Pacific
Conference on Conceptual Modelling. Australian Computer Society, Inc., 130, 23-32.
Ele, S.I. And Oko, J.O. (2016) Governance, Risk and Compliance (GRC). A. Journal of
Integrative Humanism, 6(1), 161.
Ettredge, M. et al. (2011) The effects of firm size, corporate governance quality, and bad
news on disclosure compliance. Review of Accounting Studies, 16(4), 866-889.
Gozman, D. and Currie, W. (2015) Managing governance, risk, and compliance for post-
crisis regulatory change: A model of IS capabilities for financial organizations. In The
2015 48th Hawaii International Conference on System Sciences (HICSS) (4661-
4670). IEEE.
Hardy, C. and Leonard, J. (2011) Governance Risk and Compliance (GRC): Conceptual
Muddle and Technological Tangle. ACIS 2011 Proceedings, 42. [Online]. Available
from: https://aisel.aisnet.org/cgi/viewcontent.cgi?article=1041&context=acis2011
[Accessed 17 November 2017].
Heagney, J. (2016) Fundamentals of project management. 5th ed., US: American
Management Association.
Heising, W. (2012) The integration of ideation and project portfolio management – A key
factor for sustainable success. International Journal of Project Management, 30(5),
582-595.
Hilson, D. (2016) The Risk Management Handbook: A Practical Guide to Managing the
Multiple Dimensions of Risk. London: Kogan Page.
Jonas, D., Kock, A. and Gemünden, H.G. (2013) Predicting project portfolio success by
measuring management quality – a longitudinal study. IEEE Transactions on
Engineering Management, 60(2), 215-226.
Kaiser, M.G., El Arbi, F. and Ahlemann, F. (2015) Successful project portfolio management
beyond project selection techniques: Understanding the role of structural
alignment. International Journal of Project Management, 33(1), 126-139.
Kendrick, T. (2015) Identifying and managing project risk: essential tools for failure-
proofing your project. 3rd ed., US: AMACOM.
Kerzner, H. (2013) Project management: a systems approach to planning, scheduling, and
controlling. 11th ed., US: John Wiley & Sons.
Khameneh, A., Sobhiyah, M.H. and Hosseini, H.K. (2016) Developing project portfolio
management model for innovation projects using grounded theory: a case of Iran's
power industry. [Online]. Available from:
https://pdfs.semanticscholar.org/6986/e8925193be36e8dc380d0afd8d8d83f49414.pdf
[Accessed 11 November 2017].
Killen, C.P., Clegg, S., Biesenthal, C. and Sankaran, S. (2015) Time to make space for
practice-based research in project portfolio management. [Online]. Asia Pacific
Researchers in Organisational Studies (APROS)/European Group for Organization
Studies (EGOS). Available from:
https://opus.lib.uts.edu.au/bitstream/10453/42021/1/APROS%20EGOS%202015%20
Killen%20Clegg%20Biesenthal%20Sankaran.pdf [Accessed 11 November 2017].
Klingebiel, R. and Rammer, C. (2014) Resource allocation strategy for innovation portfolio
management. Strategic Management Journal 35(2), 246-268.
Lama, T., and Anderson, W. W (2015) Company characteristics and compliance with ASX
corporate governance principles. Pacific Accounting Review, 27(3), 373-392.
Larcker, D. and Tayan, B. (2015) Corporate governance matters: A closer look at
organizational choices and their consequences. London: Pearson Education.
International Journal of Economics, Finance and Business Management Studies| 81
© 2018 The Author | IJEFBM 2018 © 2018 FLE Learning
Lerch, M. and Spieth, P. (2013) Innovation project portfolio management: A qualitative
analysis. IEEE Transactions on Engineering Management, 60(1), 18-29.
Martinsuo, M. and Killen, C.P. (2014) Value management in project portfolios: Identifying
and assessing strategic value. Project Management Journal, 45(5), 56-70.
Martinsuo, M. (2013) Project portfolio management in practice and in context. International
Journal of Project Management, 31(6), 794-803.
Mayer, N., Barafort, B., Picard, M. and Cortina, S. (2015) An ISO Compliant and Integrated
Model for IT GRC: Governance, Risk Management and Compliance. Berlin: Springer
International Publishing.
McClean, C., McNabb, K. and Dill, A. (2009) The GRC Technology Puzzle: Getting all the
Pieces to Fit. [Online]. Technical report, Forrester Research, Inc. Available from:
http://www-935.ibm.com/services/in/en/it-services/security-governance-
services/grc_technology.pdf [Accessed 11 November 2017].
Mosavi, A. (2014) Exploring the roles of portfolio steering committees in project portfolio
governance. International Journal of Project Management 32(3), 388-399.
Neckowicz, K.T. et al. (2015) Project Portfolio Management System Creating Virtual
Relationships. [Online]. U.S. Patent Application 14/725,763. Available from:
https://patents.google.com/patent/US20160350698A1/en [Accessed 11 November
2017].
Nissen, V. and Marekfia, W. (July 2013) Towards a research agenda for strategic governance,
risk and compliance (GRC) management. In: 2013 IEEE 15th Conference on Business
Informatics (CBI). Vienna, Austria, July 15-18 2013, 1-6.
Nissen, V. and Marekfia, W. (2014) The development of a data-centred conceptual reference
model for strategic GRC management. Journal of Service Science and
Management, 7(2), 63-76.
Parker, C. and Nielsen, V.L. eds. (2011) Explaining compliance: Business responses to
regulation. London: Edward Elgar.
Patanakul, P. and Shenhar, A.J. (2012) What project strategy really is: the fundamental
building block in strategic project management. Project Management Journal,
43(1),4-20.
Project Management Institute (2013) PMBOK. 5th ed., Newton Square, PA: Project
Management Institute.
Racz, N. et al. (2010) Governance, risk and compliance (GRC) status quo and software use:
results from a survey among large enterprises. [Online]. ACIS 2010 Proceedings,
Paper, 21. Available from:
https://pdfs.semanticscholar.org/9904/b013c688e9ca79f8d352a94c639b58049c43.pdf
[Accessed 11 November 2017].
Racz, N., Weippl, E. and Bonazzi, R. (2011) IT governance, risk and compliance (GRC)
status quo and integration: an explorative industry case study. 2011 IEEE World
Congress on Services. Washington, USA, July 4-9 2011, 429-436.
Ramezani, E., Fahland, D., van der Werf, J.M. and Mattheis, P. (August 2011) Separating
compliance management and business process management. In: International
Conference on Business Process Management (459-464). Berlin Heidelberg:
Springer.
Samra, E. (2016) Corporate governance in Islamic financial institutions. [Online]. Law
School International Immersion Program Papers, No. 22. Available from:
https://chicagounbound.uchicago.edu/cgi/viewcontent.cgi?referer=https://www.googl
e.com/&httpsredir=1&article=1019&context=international_immersion_program_pape
rs [Accessed 11 November 2017].
International Journal of Economics, Finance and Business Management Studies | SAIF SAEED ALQUBAISI | 82
VOLUME 4 ISSUE 1 ISBN: 978-1-911185-80-2 (Online) ISSN: 2397-6926 (Online) www.flepublications.com
Sarbazhosseini, H., McDonald, C. and Saifullah, D. (2014) An evaluation of organisational
state-transition approach in project portfolio management: results from five
government cases. In: AIPM National Conference Proceedings (24-34). [Online].
Available from: https://docplayer.net/64970851-An-evaluation-of-organisational-
state-transition-approach-in-project-portfolio-management-results-from-five-
government-cases.html [Accessed 11 November 2017].
Schäfer, T., Fettke, P. and Loos, P. (2012) Towards an Integration of GRC and BPM–
requirements changes for compliance management caused by externally induced
complexity drivers. In: Daniel, F., Barkaoui, K. and Dustdar, S. (eds.) Business
Process Management Workshops. Berlin Heidelberg: Springer, 344-355.
Teller, J. (2013) Portfolio risk management and its contribution to project portfolio success:
An investigation of organization, process, and culture. Project Management Journal,
44(2), 36-51.
Teller, J. and Kock, A. (2013) An empirical investigation on how portfolio risk management
influences project portfolio success. International Journal of Project Management,
31(6), 817-829.
Thamhain, H. (2013) Managing risks in complex projects. Project Management
Journal, 44(2), 20-35.
Too, E.G. and Weaver, P. (2014) The management of project management: A conceptual
framework for project governance. International Journal of Project
Management, 32(8), 1382-1394.
Tricker, R.B. and Tricker, R.I. (2015) Corporate governance: Principles, policies, and
practices. USA: Oxford University Press.
Vicente, P. and da Silva, M.M. (2011a) A conceptual model for integrated governance, risk
and compliance. In International Conference on Advanced Information Systems
Engineering. London, UK, June 20-24, 2011. Berlin Heidelberg: Springer, 199-213.
Vicente, P. and da Silva, M.M. (2011b), July. A business viewpoint for integrated IT
governance, risk and compliance. In: 2011 IEEE World Congress on Services.
Washington, USA, July 4-9 2011, 422-428.
Voss, M. and Kock, A. (2013) Impact of relationship value on project portfolio success—
Investigating the moderating effects of portfolio characteristics and external
turbulence. International Journal of Project Management, 31(6), 847-861.
Yang, Y., Narayanan, V.K. and De Carolis, D.M. (2014) The relationship between portfolio
diversification and firm value: The evidence from corporate venture capital
activity. Strategic Management Journal, 35(13), 1993-2011.

International Journal of Economics, Finance and Business Management Studies| 83
© 2018 The Author | IJEFBM 2018 © 2018 FLE Learning

International Journal of Economics, Finance and Business Management Studies | SAIF SAEED ALQUBAISI | 84
VOLUME 4 ISSUE 1 ISBN: 978-1-911185-80-2 (Online) ISSN: 2397-6926 (Online) www.flepublications.com
FLE Learning T: 0044 131 463 7007 F: 0044 131 608 0239
E: [email protected] W: www.flelearning.co.uk
APRIL 2018
International Journal of Economics, Finance
and Business Management Studies
VOLUME 4 ISSUE 1 ISSN: 2397-6926 (Online)