Embed Size (px)
Citation preview
Key wor ld energy stat ist icsAlso avai lab le on smartphones and tab lets
2017
KEY WORLDENERGY
STATISTICS
KEyWorld2017.indb 1 30/08/2017 14:33:54
IEA member countries: Australia
Austria Belgium
CanadaCzech RepublicDenmarkEstoniaFinlandFrance
GermanyGreece
HungaryIreland
ItalyJapan
KoreaLuxembourg
NetherlandsNew Zealand
NorwayPoland
PortugalSlovak RepublicSpain SwedenSwitzerlandTurkeyUnited Kingdom
United States
The European Commissionalso participates in
the work of the IEA.
Inte
rnat
ional E
nergy AgencySecure Sustainable
Tog
eth
er
KEyWorld2017.indb 2 30/08/2017 14:33:56
The International Energy Agency (IEA) was established in 1974 to promote energy security and provide authoritative analysis on energy for its member countries and beyond. Energy statistics have always been and remain at the heart of the work of the IEA. They provide a comprehensive view on energy production, transformation and fi nal use, the factors that infl uence energy choices such as prices and RD&D and the wider impact of energy use on CO2 emissions. Over the years with input from energy statisticians all around the world, the IEA has gained recognition as the world’s most authoritative source for energy statistics.
Energy statistics are produced to be used: to monitor changes in energy production and use; inform debate; and provide a wider understanding of energy. In Key World Energy Statistics (KWES), we look to highlight some of the key facts and trends from across the vast number of datasets the IEA produces to enable everyone to know more about energy. As part of the IEA modernisation programme, this year’s edition of KWES has been updated. It contains more information on energy effi ciency and renewables, more geographic data – including on the “IEA Family”, created through our “Open Doors” policy – and also more of the fundamental data required to fully understand energy security – the heart of our work.
Because energy plays such a vital role in our lives today, I hope that these statistics will not only inform but also help policy makers and others to make wise decisions so that energy is produced and consumed in a secure, affordable, effi cient and sustainable manner.
As I like to say, in the world of energy, data always wins. I would therefore like to thank Duncan Millard, the IEA Chief Statistician, and his excellent team for their work in ensuring we all have the data needed to gain a comprehensive understanding of energy.
Dr. Fatih BirolExecutive Director, International Energy Agency
KWES is a summary of the comprehensive data made available by the IEA via its website: http://www.iea.org/statistics/. It is also available in app form for all major mobile devices.
Foreword
KEyWorld2017.indb 3 30/08/2017 14:33:56

TABLE
OF
CONTENTS
KEyWorld2017.indb 4 30/08/2017 14:33:56
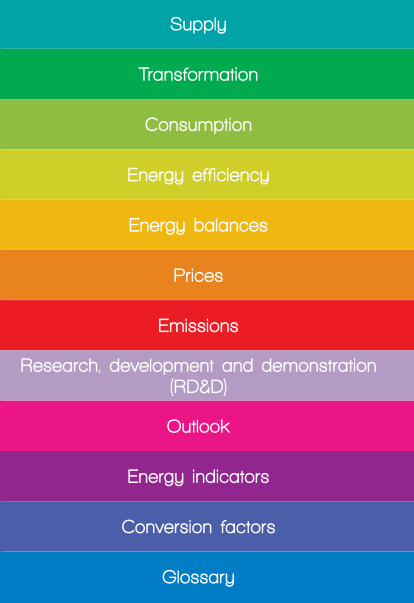
Supply
Transformation
Consumption
Energy balances
Energy eff iciency
Prices
Emissions
Research, development and demonstration (RD&D)
Outlook
Energy indicators
Conversion factors
Glossary
KEyWorld2017.indb 5 30/08/2017 14:33:56
6
Supply
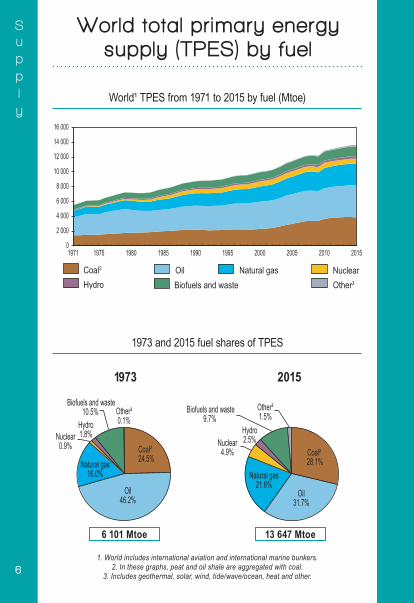
World total pr imary energy supply (TPES) by fuel
Other3
Natural gasOilBiofuels and waste
Coal2 NuclearHydro
0
2 000
4 000
6 000
8 000
10 000
12 000
14 000
16 000
1971 1975 1980 1985 1990 1995 2000 2005 2010 2015
World¹ TPES from 1971 to 2015 by fuel (Mtoe)
1973 and 2015 fuel s hares of TPES
1. World includes international aviation and international marine bunkers.2. In these graphs, peat and oil shale are aggregated with coal.
3. Includes geothermal, solar, wind, tide/wave/ocean, heat and other.
6 101 Mtoe 13 647 Mtoe
Coal² 28.1%
Oil31.7%
Natural gas21.6%
Nuclear4.9%
Hydro2.5%
Biofuels and waste9.7%
Other³1.5%
Coal²24.5%
Oil46.2%
Natural gas16.0%
Nuclear0.9%
Hydro1.8%
Biofuels and waste10.5% Other³
0.1%
1973 2015
KEyWorld2017.indb 6 30/08/2017 14:33:56
7
Supply
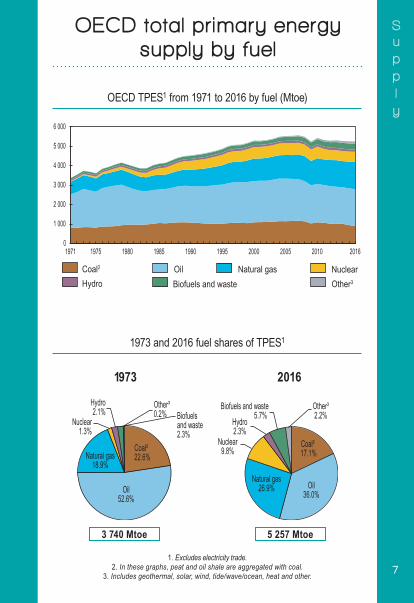
OECD total pr imary energy supply by fuel
Other3
Natural gasOilBiofuels and waste
Coal2 NuclearHydro
0
1 000
2 000
3 000
4 000
5 000
6 000
1971 1975 1980 1985 1990 1995 2000 2005 2010 2016
OECD TPES1 from 1971 to 2016 by fuel (Mtoe)
1973 and 2016 fuel shares of TPES1
1. Excludes electricity trade.2. In these graphs, peat and oil shale are aggregated with coal.
3. Includes geothermal, solar, wind, tide/wave/ocean, heat and other.
Coal² 17.1%
Oil36.0%
Natural gas26.9%
Nuclear9.8%
Hydro2.3%
Biofuels and waste5.7%
Other³2.2%
Coal²22.6%
Oil52.6%
Natural gas18.9%
Nuclear1.3%
Hydro2.1% Biofuels
and waste2.3%
Other³0.2%
3 740 Mtoe 5 257 Mtoe
1973 2016
KEyWorld2017.indb 7 30/08/2017 14:33:57
8
Supply
Non-OECD Europe and EurasiaNon-OECD AmericasNon-OECD Asia1
Middle East ChinaOECDBunkers2Africa
0
2 000
4 000
6 000
8 000
10 000
12 000
14 000
16 000
1971 1975 1980 1985 1990 1995 2000 2005 2010 2015
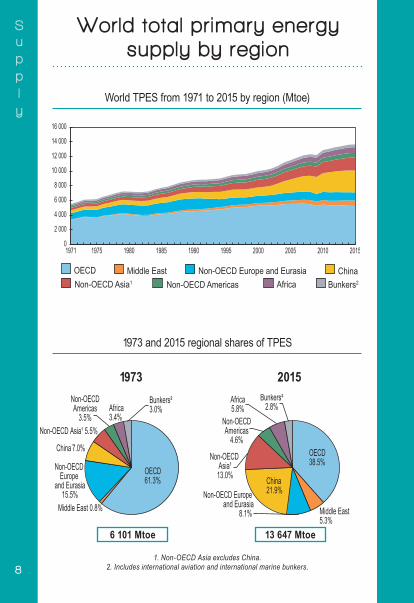
World TPES from 1971 to 2015 by region (Mtoe)
1973 and 2015 regional shares of TPES
6 101 Mtoe 13 647 Mtoe
1. Non-OECD Asia excludes China.2. Includes international aviation and international marine bunkers.
OECD61.3%
Middle East 0.8%
Non-OECD Europe
and Eurasia15.5%
China 7.0%
Non-OECD Asia¹ 5.5%
Non-OECDAmericas
3.5% Non-OECDAmericas
4.6%
Africa3.4%
OECD38.5%
Middle East5.3%
Non-OECD Europe and Eurasia
8.1%
Non-OECD Asia¹13.0%
Africa5.8%
Bunkers²2.8%
China21.9%
Bunkers²3.0%
1973 2015
World total pr imary energy supply by region
KEyWorld2017.indb 8 30/08/2017 14:33:57
9
Supply
0
2 000
4 000
6 000
8 000
10 000
12 000
14 000
16 000
1971 1975 1980 1985 1990 1995 2000 2005 2010 2015
Other countries1
IEA Accession countries1IEA Association countries1
Bunkers2
IEA1
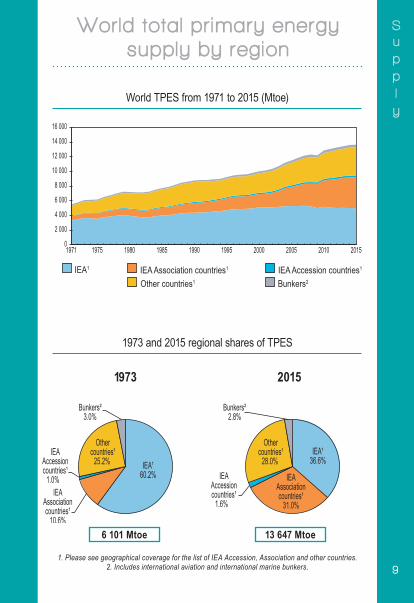
1973 and 2015 regional shares of TPES
6 101 Mtoe 13 647 Mtoe
1. Please see geographical coverage for the list of IEA Accession, Association and other countries.2. Includes international aviation and international marine bunkers.
1973 2015
IEA¹60.2%
IEA¹36.6%
IEAAssociationcountries¹
10.6%
IEAAssociationcountries¹
31.0%
IEAAccessioncountries¹
1.0% IEAAccessioncountries¹
1.6%
Othercountries¹
25.2%
Othercountries¹
28.0%
Bunkers²3.0%
Bunkers²2.8%
World TPES from 1971 to 2015 (Mtoe)
World total pr imary energy supply by region
KEyWorld2017.indb 9 30/08/2017 14:33:58
10
Supply
0
2 000
4 000
6 000
8 000
10 000
12 000
14 000
16 000
1990 1995 2000 2005 2010 2015
OceaniaAfrica Bunkers1AfricaAsiaEuropeAmericas
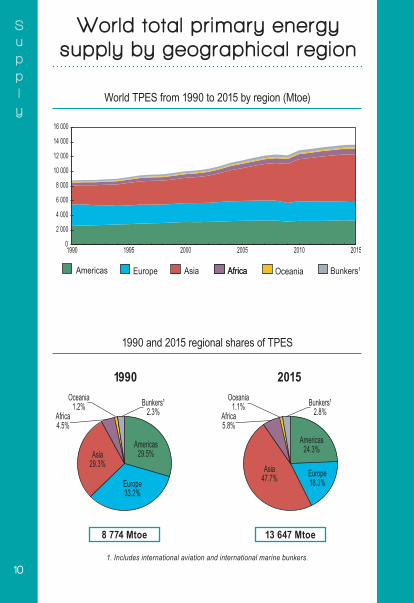
World TPES from 1990 to 2015 by region (Mtoe)
1990 and 2015 regional shares of TPES
8 774 Mtoe 13 647 Mtoe
1. Includes international aviation and international marine bunkers.
Americas29.5%
Europe33.2%
Asia29.3%
Africa4.5%
Oceania1.2% Bunkers¹
2.3%
Americas24.3%
Europe18.3%
Asia47.7%
Africa5.8%
Oceania1.1% Bunkers¹
2.8%
1990 2015
World total pr imary energy supply by geographical region
KEyWorld2017.indb 10 30/08/2017 14:33:58
11
Supply
OECD Europe OECD Asia and OceaniaOECD Americas
0
1 000
2 000
3 000
4 000
5 000
6 000
1971 1975 1980 1985 1990 1995 2000 2005 2010 2016
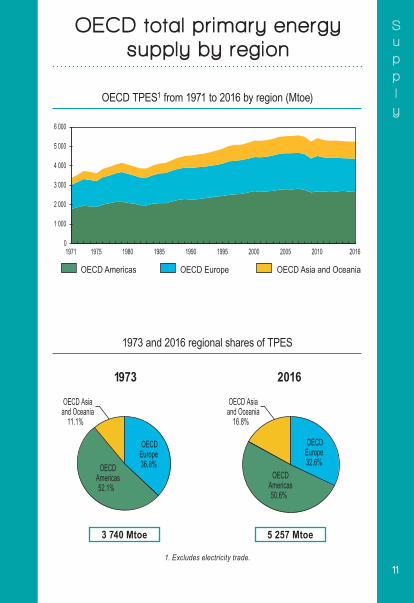
1973 and 2016 regional shares of TPES
3 740 Mtoe 5 257 Mtoe
1. Excludes electricity trade.
1973 2016
OECDAmericas52.1%
OECD Asiaand Oceania
11.1%
OECDEurope 36.8%
OECDAmericas50.6%
OECD Asiaand Oceania
16.8%
OECDEurope 32.6%
OECD TPES1 from 1971 to 2016 by region (Mtoe)
OECD total pr imary energy supply by region
KEyWorld2017.indb 11 30/08/2017 14:33:59
12
Supply
Non-OECD Europe and EurasiaChina
Middle EastNon-OECD Americas AfricaNon-OECD Asia2
OECD
0 500
1 0001 5002 0002 5003 0003 5004 0004 5005 000
1971 1975 1980 1985 1990 1995 2000 2005 2010 2016
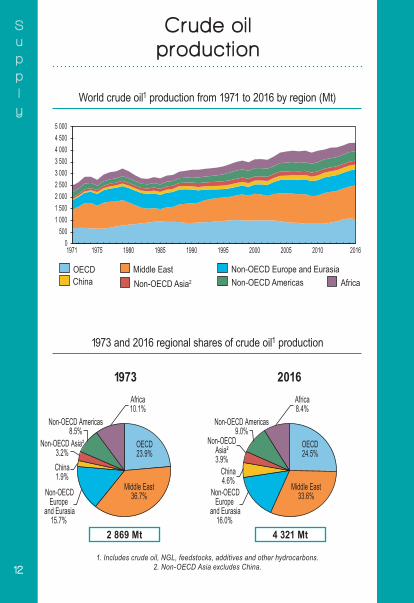
OECD23.9%
OECD24.5%
Middle East36.7%Non-OECD
Europe and Eurasia
15.7%
Non-OECD Asia²3.2%
Non-OECD Americas8.5%
Non-OECD Americas9.0%
Africa10.1%
Middle East33.6%
China1.9%
Non-OECDEurope
and Eurasia16.0%
Non-OECDAsia²3.9%
Africa8.4%
China4.6%
World crude oil1 production from 1971 to 2016 by region (Mt)
1973 and 2016 regional shares of crude oil1 production
2 869 Mt 4 321 Mt
1. Includes crude oil, NGL, feedstocks, additives and other hydrocarbons.2. Non-OECD Asia excludes China.
1973 2016
Crude oi l product ion
006-025_Supply.indd 12 30/08/2017 14:39:28
13
Supply
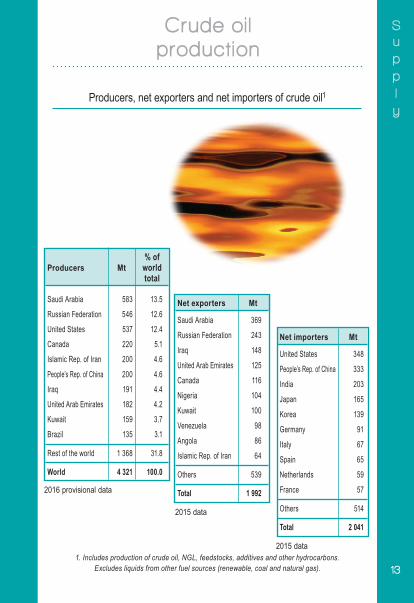
Net importers Mt
United States 348
People’s Rep. of China 333
India 203
Japan 165
Korea 139
Germany 91
Italy 67
Spain 65
Netherlands 59
France 57
Others 514
Total 2 041
Net exporters Mt
Saudi Arabia 369
Russian Federation 243
Iraq 148
United Arab Emirates 125
Canada 116
Nigeria 104
Kuwait 100
Venezuela 98
Angola 86
Islamic Rep. of Iran 64
Others 539
Total 1 9922016 provisional data
2015 data
2015 data1. Includes production of crude oil, NGL, feedstocks, additives and other hydrocarbons.
Excludes liquids from other fuel sources (renewable, coal and natural gas).
% ofProducers Mt world total
Saudi Arabia 583 13.5Russian Federation 546 12.6United States 537 12.4Canada 220 5.1Islamic Rep. of Iran 200 4.6
People’s Rep. of China 200 4.6Iraq 191 4.4United Arab Emirates 182 4.2Kuwait 159 3.7Brazil 135 3.1
Rest of the world 1 368 31.8
World 4 321 100.0
Crude oi l product ion
Producers, net exporters and net importers of crude oil1
KEyWorld2017.indb 13 30/08/2017 14:34:00
14
Supply
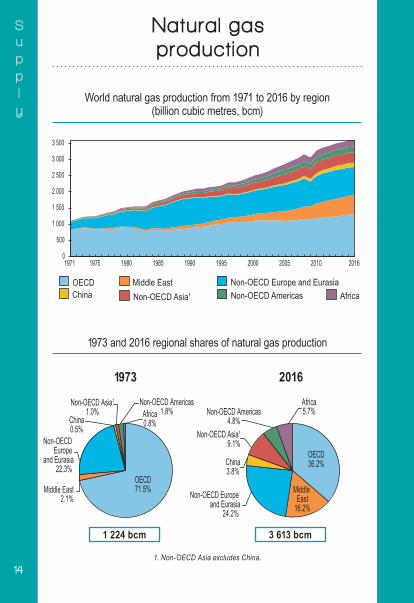
OECD71.5%
OECD36.2%
Middle East2.1%
Non-OECD Europe
and Eurasia22.3%
Non-OECD Asia1
1.0%Non-OECD Americas
1.8% Non-OECD Americas4.8%
Africa0.8%
Middle East
16.2%
China0.5%
Non-OECD Europe and Eurasia
24.2%
Non-OECD Asia1
9.1%
Africa5.7%
China3.8%
0
500
1 000
1 500
2 000
2 500
3 000
3 500
1971 1975 1980 1985 1990 1995 2000 2005 2010 2016
Non-OECD Europe and EurasiaChina
Middle EastNon-OECD Americas AfricaNon-OECD Asia1
OECD
World natural gas production from 1971 to 2016 by region (billion cubic metres, bcm)
1973 and 2016 regional shares of natural gas production
1 224 bcm 3 613 bcm
1. Non-OECD Asia excludes China.
1973 2016
Natural gas product ion
KEyWorld2017.indb 14 30/08/2017 14:34:00
15
Supply
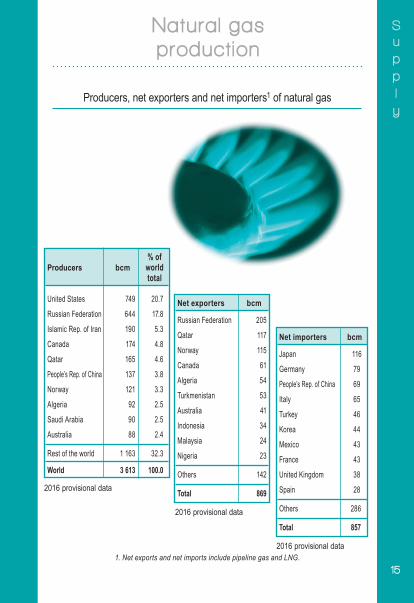
Producers, net exporters and net importers1 of natural gas
Net importers bcm
Japan 116
Germany 79
People’s Rep. of China 69
Italy 65
Turkey 46
Korea 44
Mexico 43
France 43
United Kingdom 38
Spain 28
Others 286
Total 857
Net exporters bcm
Russian Federation 205
Qatar 117
Norway 115
Canada 61
Algeria 54
Turkmenistan 53
Australia 41
Indonesia 34
Malaysia 24
Nigeria 23
Others 142
Total 8692016 provisional data
2016 provisional data
2016 provisional data1. Net exports and net imports include pipeline gas and LNG.
% ofProducers bcm world
total
United States 749 20.7
Russian Federation 644 17.8
Islamic Rep. of Iran 190 5.3
Canada 174 4.8
Qatar 165 4.6
People’s Rep. of China 137 3.8
Norway 121 3.3
Algeria 92 2.5
Saudi Arabia 90 2.5
Australia 88 2.4
Rest of the world 1 163 32.3
World 3 613 100.0
Natural gas product ion
KEyWorld2017.indb 15 30/08/2017 14:34:00
16
Supply
Non-OECD Europe and EurasiaChina
Middle EastNon-OECD Americas AfricaNon-OECD Asia2
OECD
01 0002 0003 0004 0005 0006 0007 0008 0009 000
1971 1975 1980 1985 1990 1995 2000 2005 2010 2016
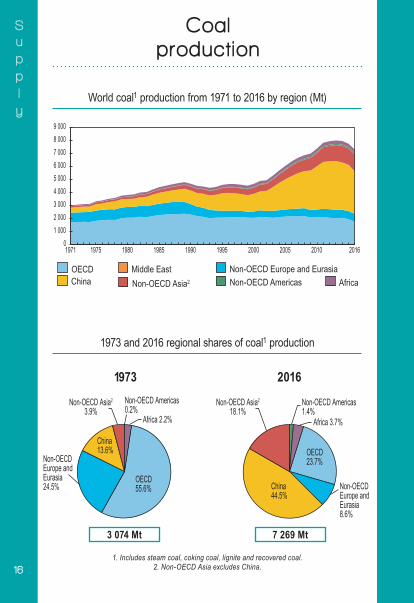
World coal1 production from 1971 to 2016 by region (Mt)
1973 and 2016 regional shares of coal1 production
1. Includes steam coal, coking coal, lignite and recovered coal.2. Non-OECD Asia excludes China.
1973 2016
OECD55.6%
Non-OECDEurope andEurasia24.5% Non-OECD
Europe andEurasia8.6%
China13.6%
Non-OECD Asia2
3.9%Non-OECD Asia2
18.1%Non-OECD Americas0.2%
Non-OECD Americas1.4%
Africa 2.2% Africa 3.7%
OECD23.7%
China44.5%
Coal product ion
3 074 Mt 7 269 Mt
KEyWorld2017.indb 16 30/08/2017 14:34:01
17
Supply
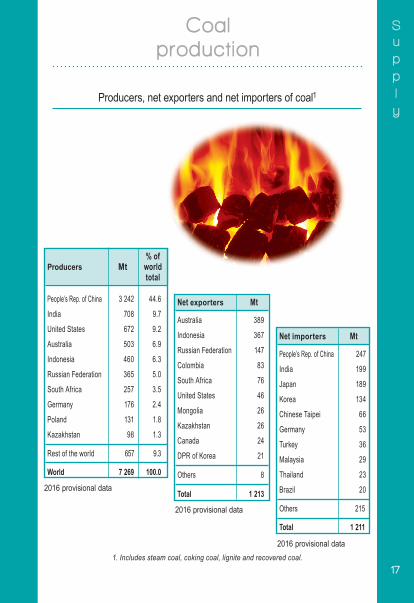
Producers, net exporters and net importers of coal1
Net importers Mt
People’s Rep. of China 247
India 199
Japan 189
Korea 134
Chinese Taipei 66
Germany 53
Turkey 36
Malaysia 29
Thailand 23
Brazil 20
Others 215
Total 1 211
Net exporters Mt
Australia 389
Indonesia 367
Russian Federation 147
Colombia 83
South Africa 76
United States 46
Mongolia 26
Kazakhstan 26
Canada 24
DPR of Korea 21
Others 8
Total 1 2132016 provisional data
2016 provisional data
2016 provisional data1. Includes steam coal, coking coal, lignite and recovered coal.
% ofProducers Mt world total
People’s Rep. of China 3 242 44.6
India 708 9.7
United States 672 9.2
Australia 503 6.9
Indonesia 460 6.3
Russian Federation 365 5.0
South Africa 257 3.5
Germany 176 2.4
Poland 131 1.8
Kazakhstan 98 1.3
Rest of the world 657 9.3
World 7 269 100.0
Coal product ion
KEyWorld2017.indb 17 30/08/2017 14:34:01
18
Supply
Non-OECD Europe and Eurasia
Other2ChinaNon-OECDAsia1
OECD
0
500
1 000
1 500
2 000
2 500
3 000
1971 1975 1980 1985 1990 1995 2000 2005 2010 2015
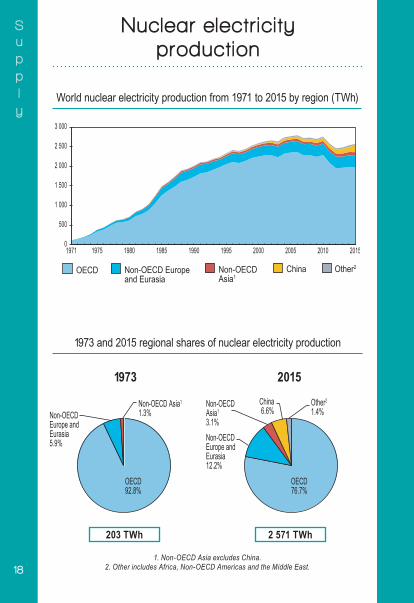
World nuclear electricity production from 1971 to 2015 by region (TWh)
1973 and 2015 regional shares of nuclear electricity production
203 TWh 2 571 TWh
1. Non-OECD Asia excludes China.2. Other includes Africa, Non-OECD Americas and the Middle East.
1973 2015
OECD92.8%
OECD76.7%
Non-OECDEurope andEurasia5.9% Non-OECD
Europe andEurasia12.2%
Non-OECD Asia1
1.3%Non-OECDAsia1
3.1%
China 6.6%
Other2
1.4%
Nuclear electr ic i ty product ion
KEyWorld2017.indb 18 30/08/2017 14:34:02
19
Supply
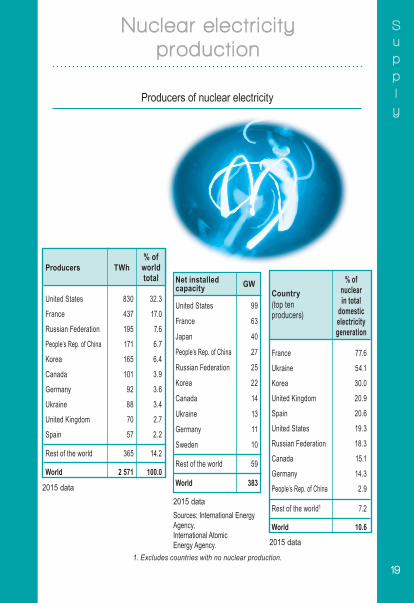
Producers of nuclear electricity
Net installed capacity GW
United States 99
France 63
Japan 40
People’s Rep. of China 27
Russian Federation 25
Korea 22
Canada 14
Ukraine 13
Germany 11
Sweden 10
Rest of the world 59
World 3832015 data2015 dataSources: International Energy Agency, International Atomic Energy Agency.
1. Excludes countries with no nuclear production.
% ofProducers TWh world
total
United States 830 32.3
France 437 17.0
Russian Federation 195 7.6
People’s Rep. of China 171 6.7
Korea 165 6.4
Canada 101 3.9
Germany 92 3.6
Ukraine 88 3.4
United Kingdom 70 2.7
Spain 57 2.2
Rest of the world 365 14.2
World 2 571 100.0
% ofCountry nuclear(top ten in totalproducers) domestic electricity
generation
France 77.6
Ukraine 54.1
Korea 30.0
United Kingdom 20.9
Spain 20.6
United States 19.3
Russian Federation 18.3
Canada 15.1
Germany 14.3
People’s Rep. of China 2.9
Rest of the world1 7.2
World 10.62015 data
Nuclear electr ic i ty product ion
KEyWorld2017.indb 19 30/08/2017 14:34:02
20
Supply
Non-OECD Europe and EurasiaChina
Middle EastNon-OECD Americas AfricaNon-OECD Asia2
OECD
0 500
1 0001 5002 0002 5003 0003 5004 0004 500
1971 1975 1980 1985 1990 1995 2000 2005 2010 2015
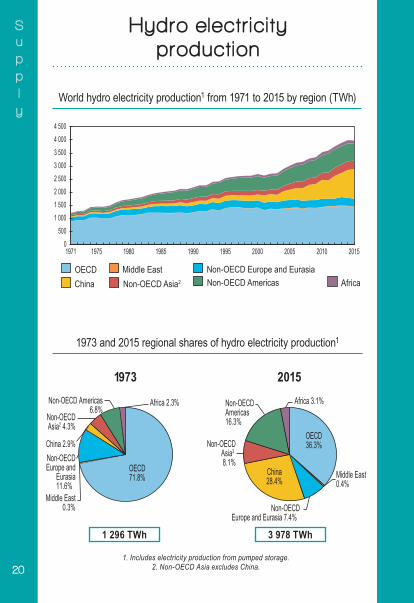
World hydro electricity production1 from 1971 to 2015 by region (TWh)
1973 and 2015 regional shares of hydro electricity production1
1 296 TWh 3 978 TWh
1. Includes electricity production from pumped storage.2. Non-OECD Asia excludes China.
1973 2015
OECD71.8%
Middle East0.3%
Non-OECDEurope and
Eurasia11.6%
China 2.9%
Non-OECDAsia2 4.3%
Non-OECDAsia2 8.1%
Non-OECD Americas6.8%
Africa 2.3%
Middle East0.4%
Africa 3.1%
OECD36.3%
Non-OECDEurope and Eurasia 7.4%
China28.4%
Non-OECDAmericas16.3%
Hydro electr ic i ty product ion
KEyWorld2017.indb 20 30/08/2017 14:34:03
21
Supply
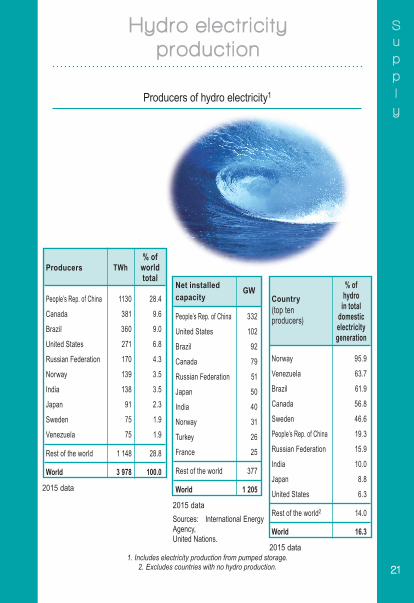
Producers of hydro electricity1
1. Includes electricity production from pumped storage.2. Excludes countries with no hydro production.
% ofProducers TWh world
total
People’s Rep. of China 1130 28.4
Canada 381 9.6
Brazil 360 9.0
United States 271 6.8
Russian Federation 170 4.3
Norway 139 3.5
India 138 3.5
Japan 91 2.3
Sweden 75 1.9
Venezuela 75 1.9
Rest of the world 1 148 28.8
World 3 978 100.0
2015 data
% ofCountry hydro(top ten in totalproducers) domestic electricity
generation
Norway 95.9
Venezuela 63.7
Brazil 61.9
Canada 56.8
Sweden 46.6
People’s Rep. of China 19.3
Russian Federation 15.9
India 10.0
Japan 8.8
United States 6.3
Rest of the world2 14.0
World 16.3
Net installed GWcapacity
People’s Rep. of China 332
United States 102
Brazil 92
Canada 79
Russian Federation 51
Japan 50
India 40
Norway 31
Turkey 26
France 25
Rest of the world 377
World 1 205
2015 dataSources: International Energy Agency, United Nations.
2015 data
Hydro electr ic i ty product ion
KEyWorld2017.indb 21 30/08/2017 14:34:03
22
Supply
0 100 200 300 400 500 600 700 800 900
2005 2006 2007 2008 2009 2010 2011 2012 2013 2014 2015
Non-OECD Europe and EurasiaChina
Middle EastNon-OECD Americas AfricaNon-OECD Asia1
OECD
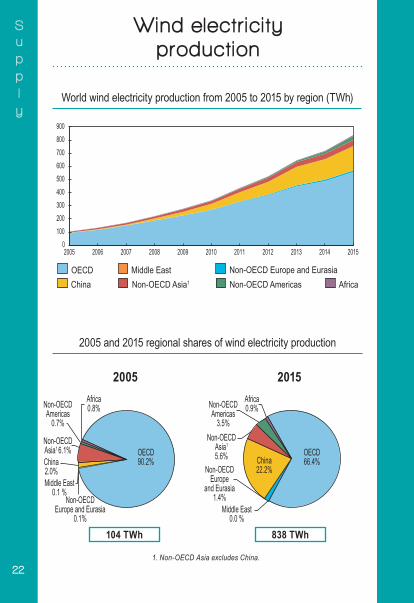
World wind electricity production from 2005 to 2015 by region (TWh)
2005 and 2015 regional shares of wind electricity production
104 TWh 838 TWh
1. Non-OECD Asia excludes China.
2005 2015
OECD90.2%
Middle East0.1 %
Non-OECDEurope and Eurasia
0.1%
China2.0%
Non-OECDAsia1 6.1%
Non-OECDAmericas
0.7%
Africa0.8%
OECD66.4%
Middle East0.0 %
Non-OECDEurope
and Eurasia1.4%
China22.2%
Non-OECDAsia1
5.6%
Non-OECDAmericas
3.5%
Africa0.9%
Wind electr ic i ty product ion
KEyWorld2017.indb 22 30/08/2017 14:34:03
23
Supply
Wind electr ic i ty product ion
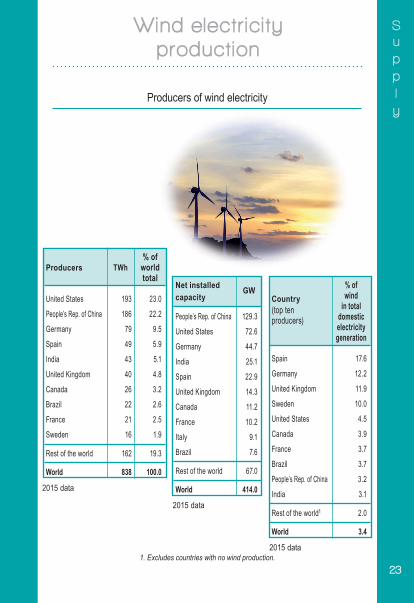
Producers of wind electricity
1. Excludes countries with no wind production.
% ofProducers TWh world total
United States 193 23.0
People’s Rep. of China 186 22.2
Germany 79 9.5
Spain 49 5.9
India 43 5.1
United Kingdom 40 4.8
Canada 26 3.2
Brazil 22 2.6
France 21 2.5
Sweden 16 1.9
Rest of the world 162 19.3
World 838 100.0
2015 data
% ofCountry wind(top ten in totalproducers) domestic electricity generation
Spain 17.6
Germany 12.2
United Kingdom 11.9
Sweden 10.0
United States 4.5
Canada 3.9
France 3.7
Brazil 3.7
People’s Rep. of China 3.2
India 3.1
Rest of the world1 2.0
World 3.4
Net installed GWcapacity
People’s Rep. of China 129.3
United States 72.6
Germany 44.7
India 25.1
Spain 22.9
United Kingdom 14.3
Canada 11.2
France 10.2
Italy 9.1
Brazil 7.6
Rest of the world 67.0
World 414.0
2015 data
2015 data
KEyWorld2017.indb 23 30/08/2017 14:34:04
24
Supply
Non-OECD Europe and EurasiaChina
Middle EastNon-OECD Americas AfricaNon-OECD Asia1
OECD
0
50
100
150
200
250
300
2005 2006 2007 2008 2009 2010 2011 2012 2013 2014 2015
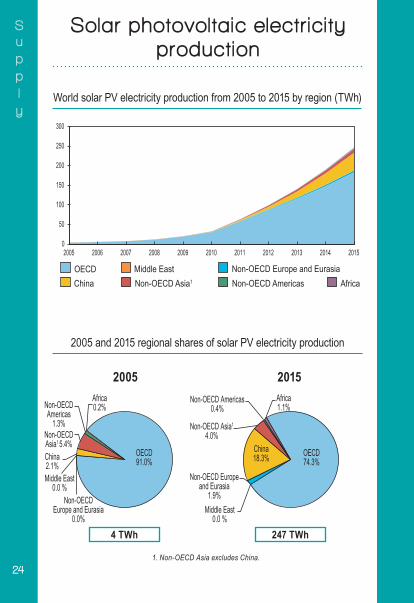
World solar PV electricity production from 2005 to 2015 by region (TWh)
2005 and 2015 regional shares of solar PV electricity production
4 TWh 247 TWh
1. Non-OECD Asia excludes China.
2005 2015
Middle East0.0 %
Non-OECD Europeand Eurasia
1.9%
Non-OECD Asia1
4.0%
Non-OECD Americas0.4%
Africa1.1%
Middle East0.0 %
Non-OECDEurope and Eurasia
0.0%
China2.1%
Non-OECDAsia1 5.4%
Non-OECDAmericas
1.3%
Africa0.2%
OECD91.0%
OECD74.3%
China18.3%
Solar photovoltaic electr ic i ty product ion
KEyWorld2017.indb 24 30/08/2017 14:34:04
25
Supply
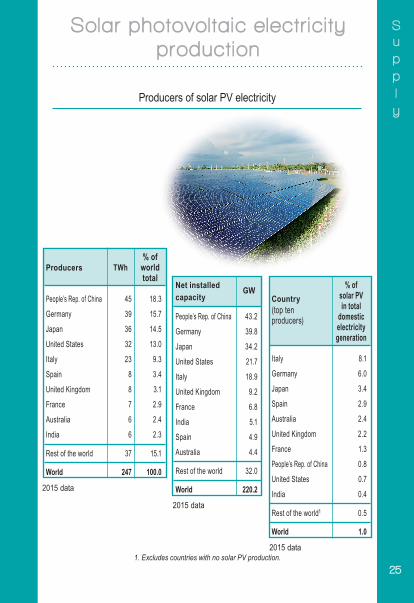
Solar photovoltaic electr ic i ty product ion
Producers of solar PV electricity
1. Excludes countries with no solar PV production.
% ofProducers TWh world
total
People’s Rep. of China 45 18.3
Germany 39 15.7
Japan 36 14.5
United States 32 13.0
Italy 23 9.3
Spain 8 3.4
United Kingdom 8 3.1
France 7 2.9
Australia 6 2.4
India 6 2.3
Rest of the world 37 15.1
World 247 100.0
2015 data
% ofCountry solar PV(top ten in totalproducers) domestic electricity
generation
Italy 8.1
Germany 6.0
Japan 3.4
Spain 2.9
Australia 2.4
United Kingdom 2.2
France 1.3
People’s Rep. of China 0.8
United States 0.7
India 0.4
Rest of the world1 0.5
World 1.0
Net installed GWcapacity
People’s Rep. of China 43.2
Germany 39.8
Japan 34.2
United States 21.7
Italy 18.9
United Kingdom 9.2
France 6.8
India 5.1
Spain 4.9
Australia 4.4
Rest of the world 32.0
World 220.2
2015 data
2015 data
KEyWorld2017.indb 25 30/08/2017 14:34:05

26
Transf o r m a t i o n
Other productsAviation fuels
Fuel oilMotor gasoline
Middle distillatesLPG/ethane/naphtha
0 500
1 0001 5002 0002 5003 0003 5004 0004 500
1971 1975 1980 1985 1990 1995 2000 2005 2010 2015
World refinery output from 1971 to 2015 by product (Mt)
1973 and 2015 shares of refinery output by product
2 719 Mt
1973 2015LPG/ethane/naphtha5.8%
Motorgasoline21.0%
Aviation fuels 4.2%
Middledistillates26.0%
Fuel oil33.8%
Other products9.2%
Aviation fuels 7.2%
Other products13.2%
Fuel oil11.2%
LPG/ethane/naphtha9.2%
Motorgasoline24.2%
Middledistillates35.0%
Refining by product
4 033 Mt
KEyWorld2017.indb 26 30/08/2017 14:34:05
27
Transf o r m a t i o n
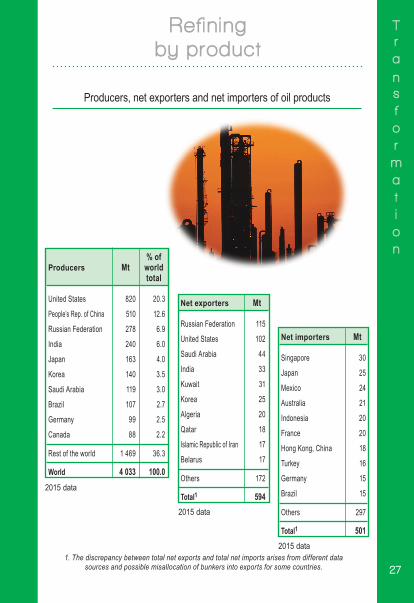
Producers, net exporters and net importers of oil products
Net importers Mt
Singapore 30
Japan 25
Mexico 24
Australia 21
Indonesia 20
France 20
Hong Kong, China 18
Turkey 16
Germany 15
Brazil 15
Others 297
Total1 501
Net exporters Mt
Russian Federation 115
United States 102
Saudi Arabia 44
India 33
Kuwait 31
Korea 25
Algeria 20
Qatar 18
Islamic Republic of Iran 17
Belarus 17
Others 172
Total1 5942015 data
2015 data
2015 data
% ofProducers Mt world total
United States 820 20.3
People’s Rep. of China 510 12.6
Russian Federation 278 6.9
India 240 6.0
Japan 163 4.0
Korea 140 3.5
Saudi Arabia 119 3.0
Brazil 107 2.7
Germany 99 2.5
Canada 88 2.2
Rest of the world 1 469 36.3
World 4 033 100.0
1. The discrepancy between total net exports and total net imports arises from different data sources and possible misallocation of bunkers into exports for some countries.
Refining by product
KEyWorld2017.indb 27 30/08/2017 14:34:06
28
Transf o r m a t i o n
Non-OECD Europe and EurasiaChina
Middle EastNon-OECD Americas AfricaNon-OECD Asia2
OECD
0
1 000
2 000
3 000
4 000
5 000
1971 1975 1980 1985 1990 1995 2000 2005 2010 2015
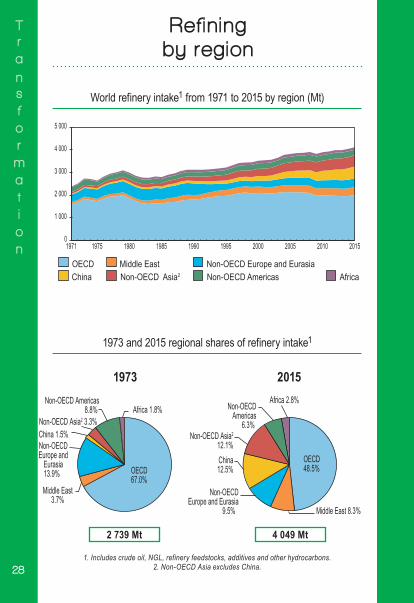
World refinery intake1 from 1971 to 2015 by region (Mt)
1973 and 2015 regional shares of refinery intake1
2 739 Mt 4 049 Mt
1. Includes crude oil, NGL, refinery feedstocks, additives and other hydrocarbons.2. Non-OECD Asia excludes China.
1973 2015
OECD48.5%OECD
67.0%Middle East
3.7%
Non-OECDEurope and
Eurasia13.9%
China 1.5%
China12.5%
Non-OECD Asia2 3.3%Non-OECD Asia2
12.1%
Non-OECD Americas8.8% Africa 1.8% Non-OECD
Americas6.3%
Africa 2.8%
Non-OECDEurope and Eurasia
9.5% Middle East 8.3%
Refining by region
KEyWorld2017.indb 28 30/08/2017 14:34:06
29
Transf o r m a t i o n
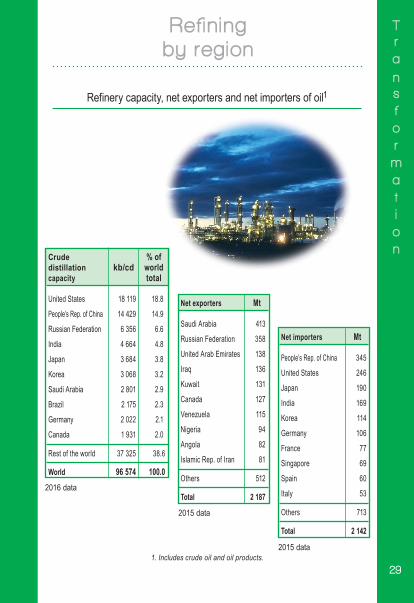
Refinery capacity, net exporters and net importers of oil1
Net importers Mt
People’s Rep. of China 345
United States 246
Japan 190
India 169
Korea 114
Germany 106
France 77
Singapore 69
Spain 60
Italy 53
Others 713
Total 2 142
Net exporters Mt
Saudi Arabia 413
Russian Federation 358
United Arab Emirates 138
Iraq 136
Kuwait 131
Canada 127
Venezuela 115
Nigeria 94
Angola 82
Islamic Rep. of Iran 81
Others 512
Total 2 1872016 data
2015 data
2015 data1. Includes crude oil and oil products.
Crude % ofdistillation kb/cd worldcapacity total
United States 18 119 18.8
People’s Rep. of China 14 429 14.9
Russian Federation 6 356 6.6
India 4 664 4.8
Japan 3 684 3.8
Korea 3 068 3.2
Saudi Arabia 2 801 2.9
Brazil 2 175 2.3
Germany 2 022 2.1
Canada 1 931 2.0
Rest of the world 37 325 38.6
World 96 574 100.0
Refining by region
KEyWorld2017.indb 29 30/08/2017 14:34:06
30
Transf o r m a t i o n
Hydro Non-hydro renewables and waste2NuclearFossil thermal
0
4 000
8 000
12 000
16 000
20 000
24 000
28 000
1971 1975 1980 1985 1990 1995 2000 2005 2010 2015
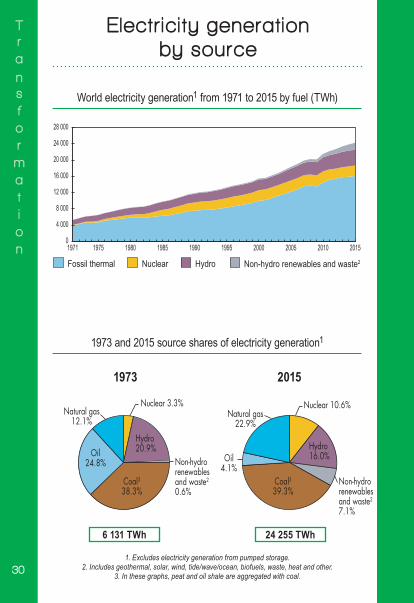
World electricity generation1 from 1971 to 2015 by fuel (TWh)
1973 and 2015 source shares of electricity generation1
6 131 TWh 24 255 TWh
1. Excludes electricity generation from pumped storage.2. Includes geothermal, solar, wind, tide/wave/ocean, biofuels, waste, heat and other.
3. In these graphs, peat and oil shale are aggregated with coal.
Nuclear 3.3%
Non-hydrorenewablesand waste2
0.6%
Oil24.8%
Natural gas12.1%
Coal338.3%
Natural gas22.9%
Oil4.1%
Coal339.3%
Non-hydrorenewablesand waste2
7.1%
Hydro16.0%
Hydro20.9%
Nuclear 10.6%
1973 2015
Electr ic i ty generat ion by source
KEyWorld2017.indb 30 30/08/2017 14:34:07
31
Transf o r m a t i o n
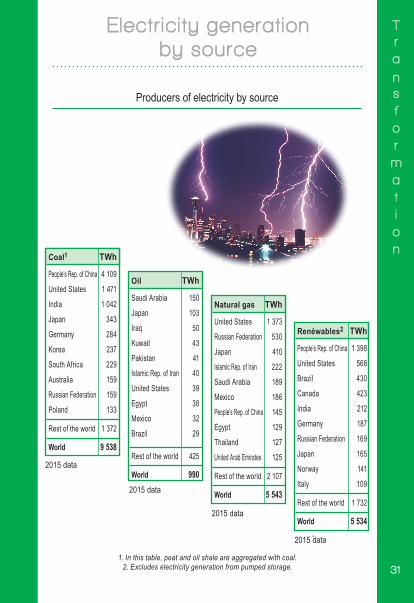
Producers of electricity by source
Natural gas TWh
United States 1 373
Russian Federation 530
Japan 410
Islamic Rep. of Iran 222
Saudi Arabia 189
Mexico 186
People’s Rep. of China 145
Egypt 129
Thailand 127
United Arab Emirates 125
Rest of the world 2 107
World 5 543
Renewables2 TWh
People’s Rep. of China 1 398
United States 568
Brazil 430
Canada 423
India 212
Germany 187
Russian Federation 169
Japan 165
Norway 141
Italy 109
Rest of the world 1 732
World 5 534
Oil TWh
Saudi Arabia 150
Japan 103
Iraq 50
Kuwait 43
Pakistan 41
Islamic Rep. of Iran 40
United States 39
Egypt 38
Mexico 32
Brazil 29
Rest of the world 425
World 9902015 data
2015 data
2015 data
2015 data
Coal1 TWh
People’s Rep. of China 4 109
United States 1 471
India 1 042
Japan 343
Germany 284
Korea 237
South Africa 229
Australia 159
Russian Federation 159
Poland 133
Rest of the world 1 372
World 9 538
1. In this table, peat and oil shale are aggregated with coal.2. Excludes electricity generation from pumped storage.
Electr ic i ty generat ion by source
KEyWorld2017.indb 31 30/08/2017 14:34:07
32
Transf o r m a t i o n
Non-OECD Europe and EurasiaChina
Middle EastNon-OECD Americas AfricaNon-OECD Asia2
OECD
0
4 000
8 000
12 000
16 000
20 000
24 000
28 000
1971 1975 1980 1985 1990 1995 2000 2005 2010 2015
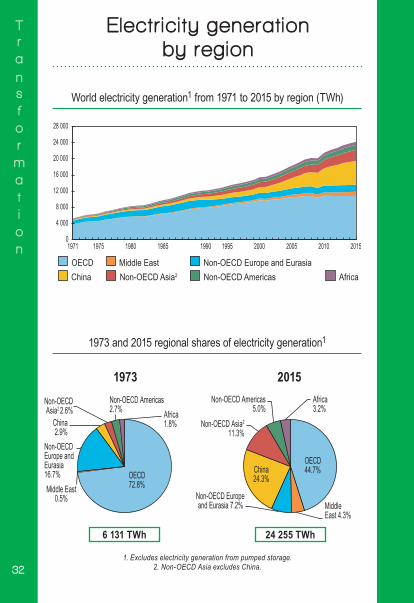
World electricity generation1 from 1971 to 2015 by region (TWh)
1973 and 2015 regional shares of electricity generation1
6 131 TWh 24 255 TWh
1. Excludes electricity generation from pumped storage.2. Non-OECD Asia excludes China.
OECD72.8% Middle East
0.5%
Non-OECDEurope andEurasia16.7%
China2.9%
Non-OECDAsia2 2.6%
Non-OECD Americas2.7% Africa
1.8% Non-OECD Asia2
11.3%
Non-OECD Americas5.0%
Non-OECD Europeand Eurasia 7.2%
China24.3%
OECD44.7%
MiddleEast 4.3%
Africa3.2%
1973 2015
Electr ic i ty generat ion by region
KEyWorld2017.indb 32 30/08/2017 14:34:07
33
Transf o r m a t i o n
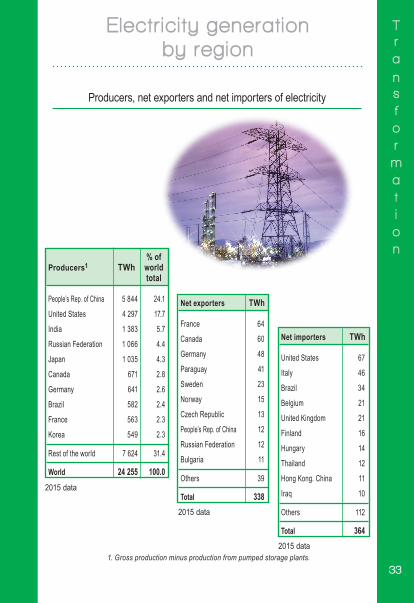
Producers, net exporters and net importers of electricity
Net importers TWh
United States 67
Italy 46
Brazil 34
Belgium 21
United Kingdom 21
Finland 16
Hungary 14
Thailand 12
Hong Kong. China 11
Iraq 10
Others 112
Total 364
Net exporters TWh
France 64
Canada 60
Germany 48
Paraguay 41
Sweden 23
Norway 15
Czech Republic 13
People’s Rep. of China 12
Russian Federation 12
Bulgaria 11
Others 39
Total 3382015 data
2015 data
2015 data*1. Gross production minus production from pumped storage plants.
% ofProducers1 TWh world total
People’s Rep. of China 5 844 24.1
United States 4 297 17.7
India 1 383 5.7
Russian Federation 1 066 4.4
Japan 1 035 4.3
Canada 671 2.8
Germany 641 2.6
Brazil 582 2.4
France 563 2.3
Korea 549 2.3
Rest of the world 7 624 31.4
World 24 255 100.0
Electr ic i ty generat ion by region
KEyWorld2017.indb 33 30/08/2017 14:34:08
34
Consum p t i o n
Other4
Natural gasBiofuels and waste3Coal2
ElectricityOil
0
2 000
4 000
6 000
8 000
10 000
1971 1975 1980 1985 1990 1995 2000 2005 2010 2015
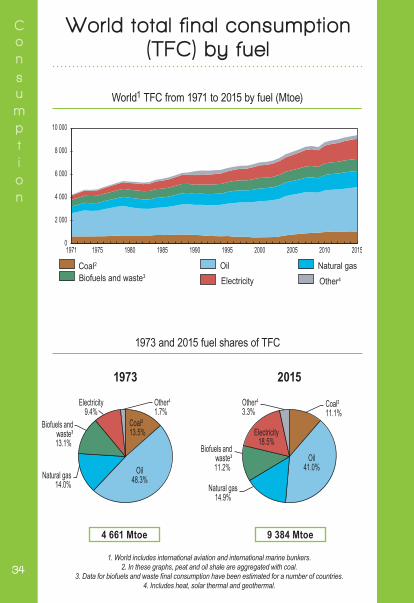
1973 and 2015 fuel shares of TFC
1. World includes international aviation and international marine bunkers.2. In these graphs, peat and oil shale are aggregated with coal.
3. Data for biofuels and waste final consumption have been estimated for a number of countries.4. Includes heat, solar thermal and geothermal.
1973 2015
Coal²13.5%
Oil48.3%Natural gas
14.0%
Biofuels andwaste³13.1%
Electricity9.4%
Other4
1.7%
Biofuels andwaste³11.2%
Electricity18.5%
Other4
3.3%Coal²11.1%
Oil41.0%
Natural gas14.9%
4 661 Mtoe 9 384 Mtoe
World1 TFC from 1971 to 2015 by fuel (Mtoe)
World total f inal consumption (TFC) by fuel
KEyWorld2017.indb 34 30/08/2017 14:34:08
35
Consum p t i o n
Other2
Natural gasBiofuels and wasteCoal1
ElectricityOil
0
500
1 000
1 500
2 000
2 500
3 000
3 500
4 000
1971 1975 1980 1985 1990 1995 2000 2005 2010 2015
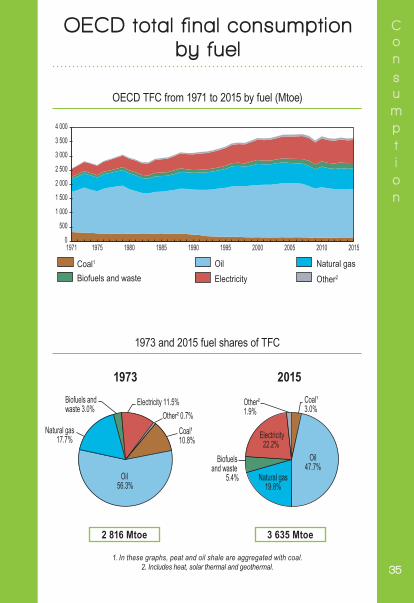
OECD TFC from 1971 to 2015 by fuel (Mtoe)
1973 and 2015 fuel shares of TFC
1. In these graphs, peat and oil shale are aggregated with coal.2. Includes heat, solar thermal and geothermal.
1973 2015
Coal¹10.8%
Oil 56.3%
Natural gas17.7%
Biofuels andwaste 3.0%
Electricity 11.5%
Electricity22.2%
Other² 0.7%
Oil47.7%
Biofuels and waste
5.4% Natural gas19.8%
Other²1.9%
Coal¹3.0%
2 816 Mtoe 3 635 Mtoe
OECD total f inal consumption by fuel
KEyWorld2017.indb 35 30/08/2017 14:34:09
36
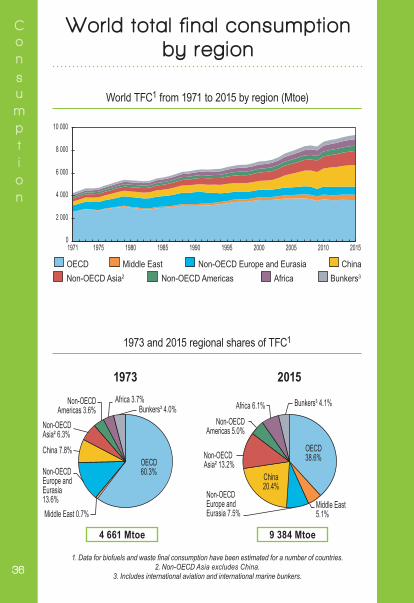
Consum p t i o n
OECD60.3%
Middle East 0.7%
Non-OECD Europe and Eurasia13.6%
China 7.8%
Non-OECDAsia² 6.3%
Non-OECDAmericas 3.6%
Africa 3.7% Bunkers³ 4.0% Bunkers³ 4.1% Africa 6.1%
Non-OECDAmericas 5.0%
Non-OECD Europe and Eurasia 7.5%
Non-OECDAsia² 13.2%
Middle East5.1%
OECD38.6%
China20.4%
4 661 Mtoe 9 384 Mtoe
1. Data for biofuels and waste final consumption have been estimated for a number of countries. 2. Non-OECD Asia excludes China.
3. Includes international aviation and international marine bunkers.
1973 2015
ChinaNon-OECD Europe and EurasiaNon-OECD Asia2
Middle EastOECDBunkers3AfricaNon-OECD Americas
0
2 000
4 000
6 000
8 000
10 000
1971 1975 1980 1985 1990 1995 2000 2005 2010 2015
1973 and 2015 regional shares of TFC1
World TFC1 from 1971 to 2015 by region (Mtoe)
World total f inal consumption by region
KEyWorld2017.indb 36 30/08/2017 14:34:09
37
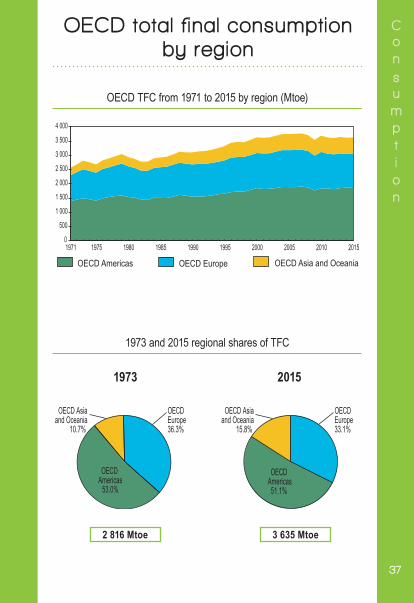
Consum p t i o n
1973 and 2015 regional shares of TFC
2 816 Mtoe 3 635 Mtoe
1973 2015
OECD TFC from 1971 to 2015 by region (Mtoe)
OECD Europe OECD Asia and OceaniaOECD Americas
0
500
1 000
1 500
2 000
2 500
3 000
3 500
4 000
1971 1975 1980 1985 1990 1995 2000 2005 2010 2015
OECDEurope36.3%
OECD Asiaand Oceania
10.7%
OECD Asiaand Oceania
15.8%
OECDEurope33.1%
OECD Americas
53.0%
OECD Americas51.1%
OECD total f inal consumption by region
KEyWorld2017.indb 37 30/08/2017 14:34:09
38
Consum p t i o n
Iron and steel Chemical and petrochemical Non-metallic mineralsOther industryCommercial, agriculture and fishing
ResidentialTransportNon-specified² Non-energy use
0
200
400
600
800
1 000
1 200
1971 1975 1980 1985 1990 1995 2000 2005 2010 2015
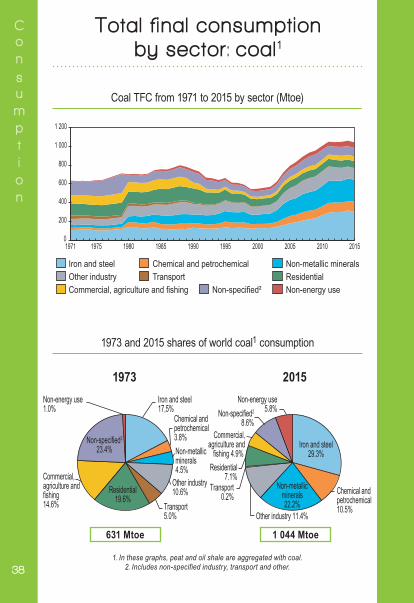
Coal TFC from 1971 to 2015 by sector (Mtoe)
1973 and 2015 shares of world coal1 consumption
631 Mtoe 1 044 Mtoe
Iron and steel17,5%
Chemical andpetrochemical3.8%
Chemical andpetrochemical10.5%
Non-metallicminerals4.5%
Other industry10.6%
Other industry 11.4% Transport5.0%
Transport0.2%
Residential19.6%
Residential7.1%Commercial,
agriculture andfishing14.6%
Commercial,agriculture and
fishing 4.9%
Non-specified2
8.6%
Non-specified2
23.4%
Non-energy use1.0%
Non-energy use5.8%
Non-metallicminerals22.2%
Iron and steel29.3%
1. In these graphs, peat and oil shale are aggregated with coal.2. Includes non-specified industry, transport and other.
1973 2015
Total f inal consumption by sector : coal 1
KEyWorld2017.indb 38 30/08/2017 14:34:10
39
Consum p t i o n
0 500
1 0001 5002 0002 5003 0003 5004 0004 500
1971 1975 1980 1985 1990 1995 2000 2005 2010 2015
Industry Aviation Road RailNavigation Residential Other¹ Non-energy use
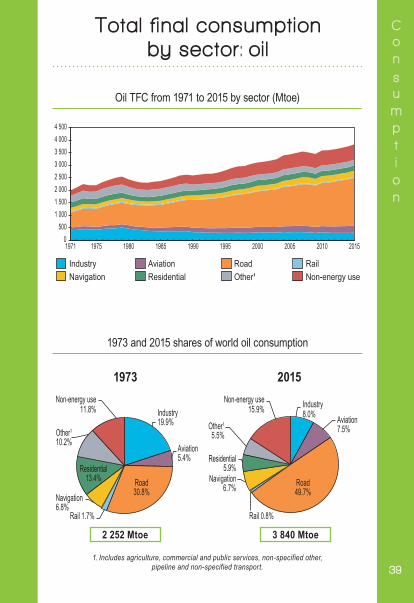
Oil TFC from 1971 to 2015 by sector (Mtoe)
1973 and 2015 shares of world oil consumption
2 252 Mtoe 3 840 Mtoe
1. Includes agriculture, commercial and public services, non-specified other,pipeline and non-specified transport.
1973 2015
Transport45.4%
Non-energy use11.8%
Non-energy use15.9% Industry
8.0%
Transport64.5%
Industry19.9%
Aviation5.4%
Aviation7.5%
Road30.8%
Rail 1.7% Rail 0.8%
Navigation6.8%
Navigation6.7%
Other1
10.2%Other1
5.5%
Road49.7%
Residential13.4%
Residential5.9%
Total f inal consumption by sector : oi l
KEyWorld2017.indb 39 30/08/2017 14:34:10
40
Consum p t i o n
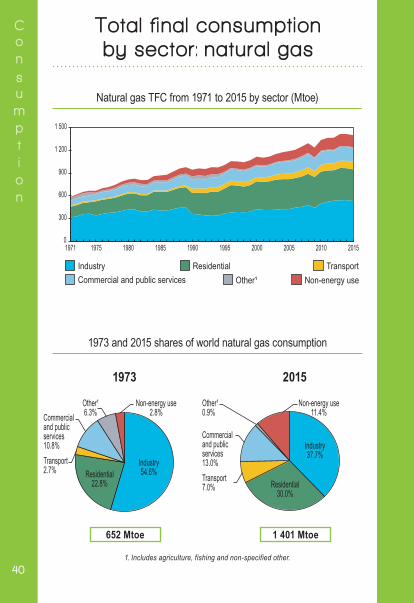
Total f inal consumption by sector : natural gas
IndustryCommercial and public services
TransportResidentialOther¹ Non-energy use
0
300
600
900
1 200
1 500
1971 1975 1980 1985 1990 1995 2000 2005 2010 2015
Natural gas TFC from 1971 to 2015 by sector (Mtoe)
1973 and 2015 shares of world natural gas consumption
652 Mtoe 1 401 Mtoe
Residential22.8%
Industry37.7%
Industry54.6%
Residential30.0%
Commercialand publicservices10.8%Transport2.7%
Other¹6.3%
Non-energy use2.8%
Commercialand publicservices13.0%Transport7.0%
Other¹0.9%
Non-energy use11.4%
1. Includes agriculture, fishing and non-specified other.
1973 2015
KEyWorld2017.indb 40 30/08/2017 14:34:11
41
Consum p t i o n
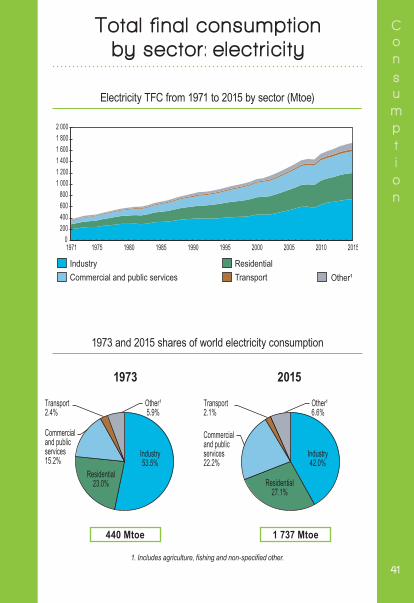
Total f inal consumption by sector : electr ic i ty
0 200 400 600 800
1 0001 2001 4001 6001 8002 000
1971 1975 1980 1985 1990 1995 2000 2005 2010 2015
IndustryCommercial and public services Transport
ResidentialOther¹
Electricity TFC from 1971 to 2015 by sector (Mtoe)
1973 and 2015 shares of world electricity consumption
440 Mtoe 1 737 Mtoe
1. Includes agriculture, fishing and non-specified other.
1973 2015
Residential23.0%
Industry42.0%
Industry53.5%
Residential27.1%
Commercialand publicservices15.2%
Transport2.4%
Other¹5.9%
Commercialand publicservices22.2%
Transport2.1%
Other¹6.6%
KEyWorld2017.indb 41 30/08/2017 14:34:11
42
Consum p t i o n
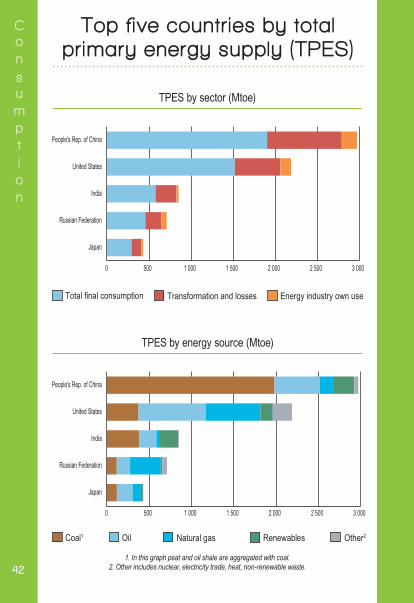
Top f ive countr ies by total pr imary energy supply (TPES)
Total final consumption Energy industry own useTransformation and losses
0 500 1 000 1 500 2 000 2 500 3 000
Japan
Russian Federation
India
United States
People's Rep. of China
Coal1 RenewablesNatural gasOil Other2
0 500 1 000 1 500 2 000 2 500 3 000
Japan
Russian Federation
India
United States
People's Rep. of China
TPES by sector (Mtoe)
TPES by energy source (Mtoe)
1. In this graph peat and oil shale are aggregated with coal.2. Other includes nuclear, electricity trade, heat, non-renewable waste.
KEyWorld2017.indb 42 30/08/2017 14:34:11
43
Consum p t i o n
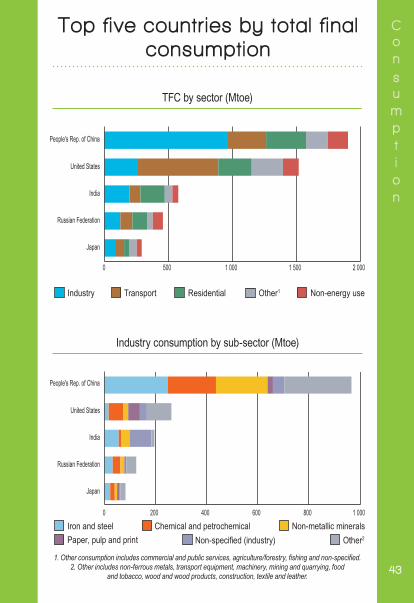
Top f ive countr ies by total f inal consumption
Industry Other1ResidentialTransport Non-energy use
0 500 1 000 1 500 2 000
Japan
Russian Federation
India
United States
People's Rep. of China
Iron and steelPaper, pulp and print
Non-metallic mineralsChemical and petrochemicalNon-specified (industry) Other2
Japan
Russian Federation
India
United States
People's Rep. of China
0 200 400 600 800 1 000
TFC by sector (Mtoe)
Industry consumption by sub-sector (Mtoe)
1. Other consumption includes commercial and public services, agriculture/forestry, fishing and non-specified.2. Other includes non-ferrous metals, transport equipment, machinery, mining and quarrying, food
and tobacco, wood and wood products, construction, textile and leather.
KEyWorld2017.indb 43 30/08/2017 14:34:12
44
Energy
efficiency
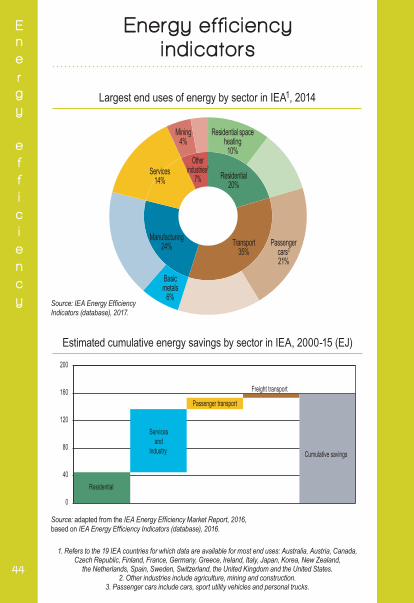
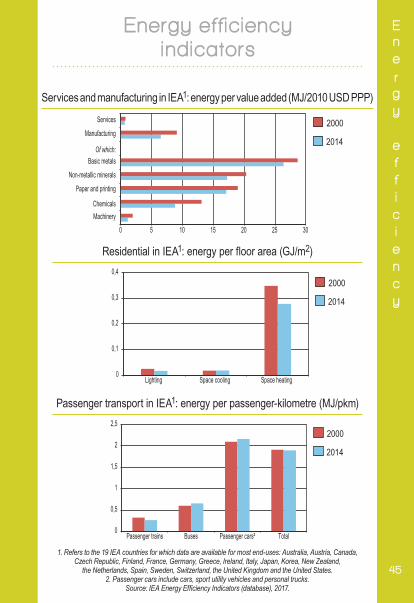
Energy eff ic iency indicators
Residential spaceheating
10%
Residential20%
Mining4%
Otherindustries2
7%Services
14%
Manufacturing24%
Basicmetals
6%
Transport35%
Passengercars3
21%
Residential
Servicesand
Industry
Passenger transport
Freight transport
Cumulative savings
0
40
80
120
160
200
Largest end uses of energy by sector in IEA1, 2014
Estimated cumulative energy savings by sector in IEA, 2000-15 (EJ)
1. Refers to the 19 IEA countries for which data are available for most end uses: Australia, Austria, Canada,Czech Republic, Finland, France, Germany, Greece, Ireland, Italy, Japan, Korea, New Zealand,
the Netherlands, Spain, Sweden, Switzerland, the United Kingdom and the United States.2. Other industries include agriculture, mining and construction.
3. Passenger cars include cars, sport utility vehicles and personal trucks.
Source: IEA Energy Efficiency Indicators (database), 2017.
Source: adapted from the IEA Energy Efficiency Market Report, 2016, based on IEA Energy Efficiency Indicators (database), 2016.
KEyWorld2017.indb 44 30/08/2017 14:34:12
45
Energy
efficiency
Energy eff ic iency indicators
0 5 10 15 20 25 30MachineryChemicals
Paper and printingNon-metallic minerals
Basic metals
Manufacturing
Of which:
Services 2000
2014
0
0,1
0,2
0,3
0,4
Lighting Space cooling Space heating
2000
2014
2000
2014
0
0,5
1
1,5
2
2,5
Passenger trains Buses Passenger cars² Total
Services and manufacturing in IEA1: energy per value added (MJ/2010 USD PPP)
Residential in IEA1: energy per floor area (GJ/m2)
Passenger transport in IEA1: energy per passenger-kilometre (MJ/pkm)
1. Refers to the 19 IEA countries for which data are available for most end-uses: Australia, Austria, Canada,Czech Republic, Finland, France, Germany, Greece, Ireland, Italy, Japan, Korea, New Zealand,
the Netherlands, Spain, Sweden, Switzerland, the United Kingdom and the United States.2. Passenger cars include cars, sport utility vehicles and personal trucks.
Source: IEA Energy Efficiency Indicators (database), 2017.
KEyWorld2017.indb 45 30/08/2017 14:34:13
46
Energy
b a l a n c e s
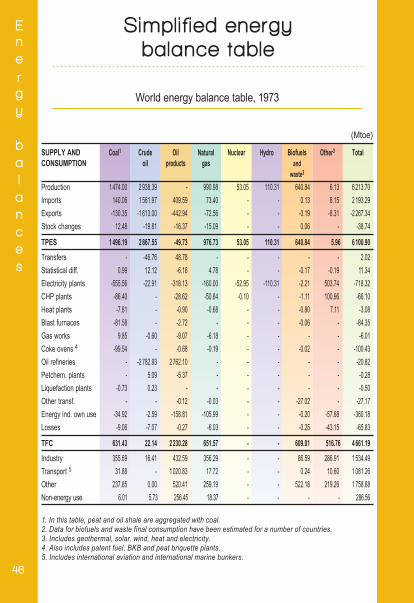
SUPPLY AND Coal1 Crude Oil Natural Nuclear Hydro Biofuels Other3 Total CONSUMPTION oil products gas and
waste2
Production 1 474.00 2 938.39 - 990.98 53.05 110.31 640.84 6.13 6 213.70Imports 140.06 1 561.97 409.59 73.40 - - 0.13 8.15 2 193.29Exports -130.35 -1 613.00 -442.94 -72.56 - - -0.19 -8.31 -2 267.34Stock changes 12.48 -19.81 -16.37 -15.09 - - 0.06 - -38.74
TPES 1 496.19 2 867.55 -49.73 976.73 53.05 110.31 640.84 5.96 6 100.90Transfers - -46.76 48.78 - - - - - 2.02Statistical diff. 0.99 12.12 -6.18 4.78 - - -0.17 -0.19 11.34Electricity plants -555.56 -22.91 -318.13 -160.00 -52.95 -110.31 -2.21 503.74 -718.32CHP plants -86.40 - -28.62 -50.84 -0.10 - -1.11 100.96 -66.10Heat plants -7.81 - -0.90 -0.68 - - -0.80 7.11 -3.08Blast furnaces -81.58 - -2.72 - - - -0.06 - -84.35Gas works 9.85 -0.60 -9.07 -6.18 - - - - -6.01Coke ovens 4 -99.54 - -0.68 -0.19 - - -0.02 - -100.43Oil refineries - -2 782.93 2 762.10 - - - - - -20.82Petchem. plants - 5.09 -5.37 - - - - - -0.28Liquefaction plants -0.73 0.23 - - - - - - -0.50Other transf. - - -0.12 -0.03 - - -27.02 - -27.17Energy ind. own use -34.92 -2.59 -158.81 -105.99 - - -0.20 -57.68 -360.18Losses -9.06 -7.07 -0.27 -6.03 - - -0.25 -43.15 -65.83
TFC 631.43 22.14 2 230.28 651.57 - - 609.01 516.76 4 661.19Industry 355.69 16.41 432.59 356.29 - - 86.59 286.91 1 534.49Transport 5 31.88 - 1 020.83 17.72 - - 0.24 10.60 1 081.26Other 237.85 0.00 520.41 259.19 - - 522.18 219.26 1 758.88Non-energy use 6.01 5.73 256.45 18.37 - - - - 286.56
1. In this table, peat and oil shale are aggregated with coal.2. Data for biofuels and waste final consumption have been estimated for a number of countries.3. Includes geothermal, solar, wind, heat and electricity.4. Also includes patent fuel, BKB and peat briquette plants.5. Includes international aviation and international marine bunkers.
(Mtoe)
Simpl i f ied energy balance table
World energy balance table, 1973
KEyWorld2017.indb 46 30/08/2017 14:34:13
47
Energy
b a l a n c e s
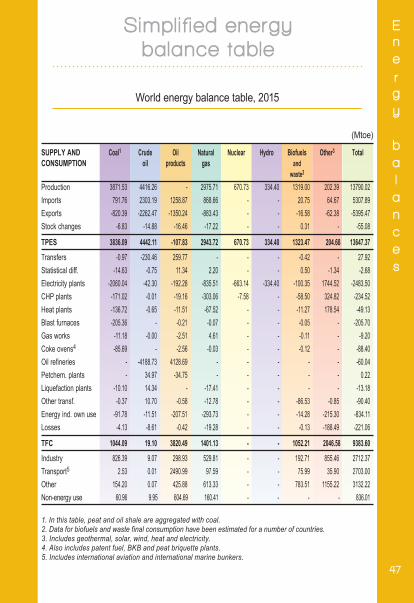
1. In this table, peat and oil shale are aggregated with coal.2. Data for biofuels and waste final consumption have been estimated for a number of countries.3. Includes geothermal, solar, wind, heat and electricity.4. Also includes patent fuel, BKB and peat briquette plants.5. Includes international aviation and international marine bunkers.
(Mtoe)
SUPPLY AND Coal1 Crude Oil Natural Nuclear Hydro Biofuels Other3 Total CONSUMPTION oil products gas and waste2 Production 3871.53 4416.26 - 2975.71 670.73 334.40 1319.00 202.39 13790.02Imports 791.76 2303.19 1258.87 868.66 - - 20.75 64.67 5307.89Exports -820.39 -2262.47 -1350.24 -883.43 - - -16.58 -62.38 -5395.47Stock changes -6.83 -14.88 -16.46 -17.22 - - 0.31 - -55.08
TPES 3836.09 4442.11 -107.83 2943.72 670.73 334.40 1323.47 204.68 13647.37Transfers -0.97 -230.46 259.77 - - - -0.42 - 27.92Statistical diff. -14.63 -0.75 11.34 2.20 - - 0.50 -1.34 -2.68Electricity plants -2060.04 -42.30 -192.28 -835.51 -663.14 -334.40 -100.35 1744.52 -2483.50CHP plants -171.02 -0.01 -19.16 -303.06 -7.58 - -58.50 324.82 -234.52Heat plants -136.72 -0.65 -11.51 -67.52 - - -11.27 178.54 -49.13Blast furnaces -205.36 - -0.21 -0.07 - - -0.05 - -205.70Gas works -11.18 -0.00 -2.51 4.61 - - -0.11 - -9.20Coke ovens4 -85.69 - -2.56 -0.03 - - -0.12 - -88.40Oil refineries - -4188.73 4128.69 - - - - - -60.04Petchem. plants - 34.97 -34.75 - - - - - 0.22Liquefaction plants -10.10 14.34 - -17.41 - - - - -13.18Other transf. -0.37 10.70 -0.58 -12.78 - - -86.53 -0.85 -90.40Energy ind. own use -91.78 -11.51 -207.51 -293.73 - - -14.28 -215.30 -834.11Losses -4.13 -8.61 -0.42 -19.28 - - -0.13 -188.49 -221.06
TFC 1044.09 19.10 3820.49 1401.13 - - 1052.21 2046.58 9383.60Industry 826.39 9.07 298.93 529.81 - - 192.71 855.46 2712.37Transport5 2.53 0.01 2490.99 97.59 - - 75.99 35.90 2703.00Other 154.20 0.07 425.88 613.33 - - 783.51 1155.22 3132.22Non-energy use 60.96 9.95 604.69 160.41 - - - - 836.01
Simpl i f ied energy balance table
World energy balance table, 2015
KEyWorld2017.indb 47 30/08/2017 14:34:13
48
Energy
b a l a n c e s
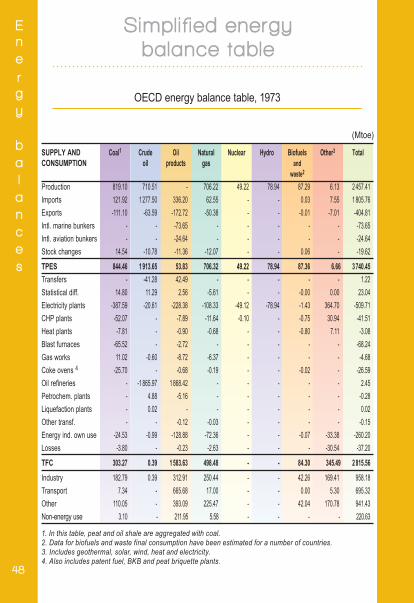
SUPPLY AND Coal1 Crude Oil Natural Nuclear Hydro Biofuels Other3 Total CONSUMPTION oil products gas and
waste2
Production 819.10 710.51 - 706.22 49.22 78.94 87.29 6.13 2 457.41Imports 121.92 1 277.50 336.20 62.55 - - 0.03 7.55 1 805.76Exports -111.10 -63.59 -172.72 -50.38 - - -0.01 -7.01 -404.81Intl. marine bunkers - - -73.65 - - - - - -73.65Intl. aviation bunkers - - -24.64 - - - - - -24.64Stock changes 14.54 -10.78 -11.36 -12.07 - - 0.06 - -19.62TPES 844.46 1 913.65 53.83 706.32 49.22 78.94 87.36 6.66 3 740.45Transfers - -41.28 42.49 - - - - - 1.22Statistical diff. 14.80 11.29 2.56 -5.61 - - -0.00 0.00 23.04Electricity plants -387.59 -20.61 -228.38 -108.33 -49.12 -78.94 -1.43 364.70 -509.71CHP plants -52.07 - -7.89 -11.64 -0.10 - -0.75 30.94 -41.51Heat plants -7.81 - -0.90 -0.68 - - -0.80 7.11 -3.08Blast furnaces -65.52 - -2.72 - - - - - -68.24Gas works 11.02 -0.60 -8.72 -6.37 - - - - -4.68Coke ovens 4 -25.70 - -0.68 -0.19 - - -0.02 - -26.59Oil refineries - -1 865.97 1 868.42 - - - - - 2.45Petrochem. plants - 4.88 -5.16 - - - - - -0.28Liquefaction plants - 0.02 - - - - - - 0.02Other transf. - - -0.12 -0.03 - - - - -0.15Energy ind. own use -24.53 -0.99 -128.88 -72.36 - - -0.07 -33.38 -260.20Losses -3.80 - -0.23 -2.63 - - - -30.54 -37.20TFC 303.27 0.39 1 583.63 498.48 - - 84.30 345.49 2 815.56Industry 182.79 0.39 312.91 250.44 - - 42.26 169.41 958.18Transport 7.34 - 665.68 17.00 - - 0.00 5.30 695.32Other 110.05 - 393.09 225.47 - - 42.04 170.78 941.43Non-energy use 3.10 - 211.95 5.58 - - - - 220.63
1. In this table, peat and oil shale are aggregated with coal.2. Data for biofuels and waste final consumption have been estimated for a number of countries.3. Includes geothermal, solar, wind, heat and electricity.4. Also includes patent fuel, BKB and peat briquette plants.
(Mtoe)
Simpl i f ied energy balance table
OECD energy balance table, 1973
KEyWorld2017.indb 48 30/08/2017 14:34:13
49
Energy
b a l a n c e s
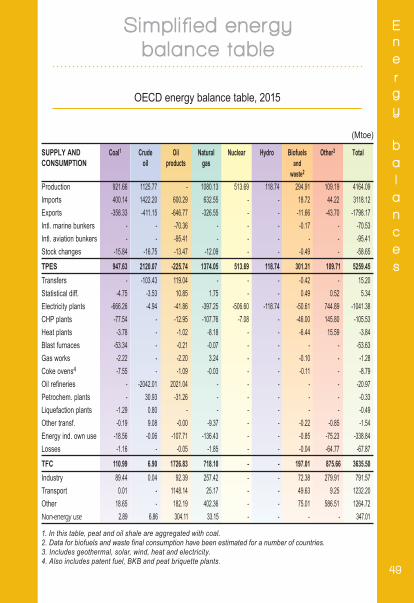
SUPPLY AND Coal1 Crude Oil Natural Nuclear Hydro Biofuels Other3 Total CONSUMPTION oil products gas and
waste2
Production 921.66 1125.77 - 1080.13 513.69 118.74 294.91 109.19 4164.09Imports 400.14 1422.20 600.29 632.55 - - 18.72 44.22 3118.12Exports -358.33 -411.15 -646.77 -326.55 - - -11.66 -43.70 -1798.17Intl. marine bunkers - - -70.36 - - - -0.17 - -70.53Intl. aviation bunkers - - -95.41 - - - - - -95.41Stock changes -15.84 -16.75 -13.47 -12.09 - - -0.49 - -58.65TPES 947.63 2120.07 -225.74 1374.05 513.69 118.74 301.31 109.71 5259.45Transfers - -103.43 119.04 - - - -0.42 - 15.20Statistical diff. -4.75 -3.53 10.85 1.75 - - 0.49 0.52 5.34Electricity plants -666.26 -4.94 -41.86 -397.25 -506.60 -118.74 -50.61 744.89 -1041.38CHP plants -77.54 - -12.95 -107.76 -7.08 - -46.00 145.80 -105.53Heat plants -3.78 - -1.02 -8.18 - - -6.44 15.59 -3.84Blast furnaces -53.34 - -0.21 -0.07 - - - - -53.63Gas works -2.22 - -2.20 3.24 - - -0.10 - -1.28Coke ovens4 -7.55 - -1.09 -0.03 - - -0.11 - -8.79Oil refineries - -2042.01 2021.04 - - - - - -20.97Petrochem. plants - 30.93 -31.26 - - - - - -0.33Liquefaction plants -1.29 0.80 - - - - - - -0.49Other transf. -0.19 9.08 -0.00 -9.37 - - -0.22 -0.85 -1.54Energy ind. own use -18.56 -0.06 -107.71 -136.43 - - -0.85 -75.23 -338.84Losses -1.16 - -0.05 -1.85 - - -0.04 -64.77 -67.87TFC 110.99 6.90 1726.83 718.10 - - 197.01 875.66 3635.50Industry 89.44 0.04 92.39 257.42 - - 72.38 279.91 791.57Transport 0.01 - 1148.14 25.17 - - 49.63 9.25 1232.20Other 18.65 - 182.19 402.36 - - 75.01 586.51 1264.72Non-energy use 2.89 6.86 304.11 33.15 - - - - 347.01
1. In this table, peat and oil shale are aggregated with coal.2. Data for biofuels and waste final consumption have been estimated for a number of countries.3. Includes geothermal, solar, wind, heat and electricity.4. Also includes patent fuel, BKB and peat briquette plants.
(Mtoe)
Simpl i f ied energy balance table
OECD energy balance table, 2015
KEyWorld2017.indb 49 30/08/2017 14:34:13
50
Prices
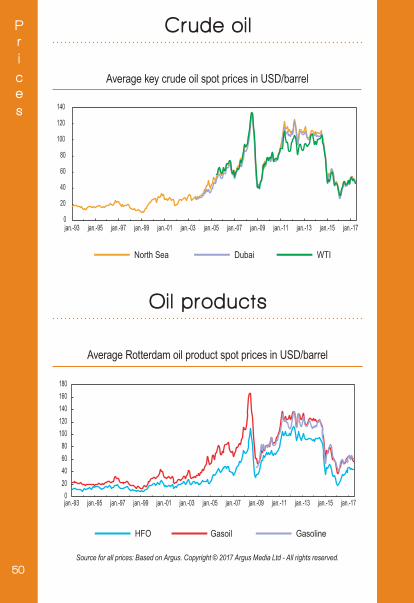
WTIDubaiNorth Sea
0
20
40
60
80
100
120
140
jan.-93 jan.-95 jan.-97 jan.-99 jan.-01 jan.-03 jan.-05 jan.-07 jan.-09 jan.-11 jan.-13 jan.-15 jan.-17
HFO Gasoil Gasoline
020406080
100120140160180
jan.-93 jan.-95 jan.-97 jan.-99 jan.-01 jan.-03 jan.-05 jan.-07 jan.-09 jan.-11 jan.-13 jan.-15 jan.-17
Average Rotterdam oil product spot prices in USD/barrel
Crude oi l
Oi l products
Average key crude oil spot prices in USD/barrel
Source for all prices: Based on Argus. Copyright © 2017 Argus Media Ltd - All rights reserved.
KEyWorld2017.indb 50 30/08/2017 14:34:14
51
Prices
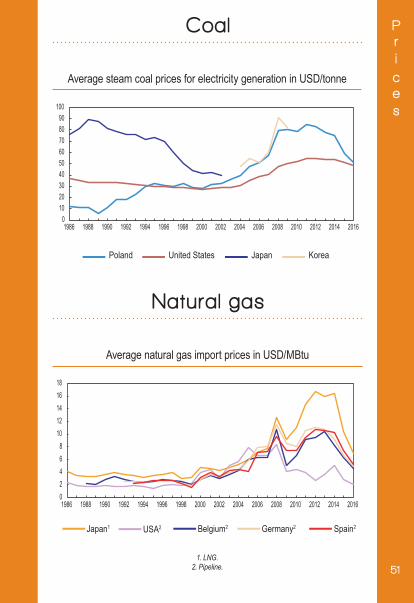
Poland United States Japan Korea
0102030405060708090
100
1986 1988 1990 1992 1994 1996 1998 2000 2002 2004 2006 2008 2010 2012 2014 2016
Belgium2 Spain2Japan1 USA2 Germany2
02468
1012141618
1986 1988 1990 1992 1994 1996 1998 2000 2002 2004 2006 2008 2010 2012 2014 2016
Average natural gas import prices in USD/MBtu
Natural gas
Coal
Average steam coal prices for electricity generation in USD/tonne
1. LNG.2. Pipeline.
KEyWorld2017.indb 51 30/08/2017 14:34:14
52
Prices
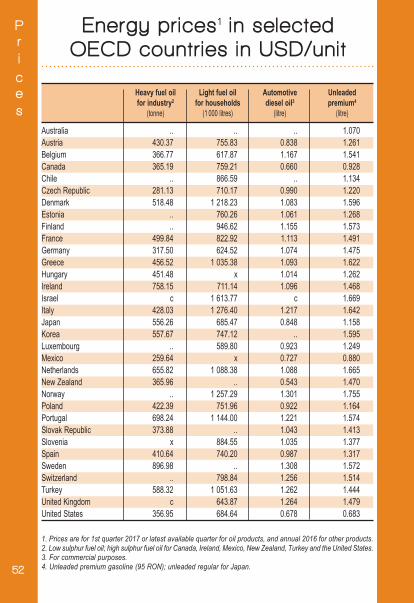
1. Prices are for 1st quarter 2017 or latest available quarter for oil products, and annual 2016 for other products.2. Low sulphur fuel oil; high sulphur fuel oil for Canada, Ireland, Mexico, New Zealand, Turkey and the United States.3. For commercial purposes.4. Unleaded premium gasoline (95 RON); unleaded regular for Japan.
Heavy fuel oil Light fuel oil Automotive Unleaded for industry2 for households diesel oil3 premium4
(tonne) (1 000 litres) (litre) (litre)
Australia .. .. .. 1.070Austria 430.37 755.83 0.838 1.261Belgium 366.77 617.87 1.167 1.541Canada 365.19 759.21 0.660 0.928Chile .. 866.59 .. 1.134Czech Republic 281.13 710.17 0.990 1.220Denmark 518.48 1 218.23 1.083 1.596Estonia .. 760.26 1.061 1.268Finland .. 946.62 1.155 1.573France 499.84 822.92 1.113 1.491Germany 317.50 624.52 1.074 1.475Greece 456.52 1 035.38 1.093 1.622Hungary 451.48 x 1.014 1.262Ireland 758.15 711.14 1.096 1.468Israel c 1 613.77 c 1.669Italy 428.03 1 276.40 1.217 1.642Japan 556.26 685.47 0.848 1.158Korea 557.67 747.12 .. 1.595Luxembourg .. 589.80 0.923 1.249Mexico 259.64 x 0.727 0.880Netherlands 655.82 1 088.38 1.088 1.665New Zealand 365.96 .. 0.543 1.470Norway .. 1 257.29 1.301 1.755Poland 422.39 751.96 0.922 1.164Portugal 698.24 1 144.00 1.221 1.574Slovak Republic 373.88 .. 1.043 1.413Slovenia x 884.55 1.035 1.377Spain 410.64 740.20 0.987 1.317Sweden 896.98 .. 1.308 1.572Switzerland .. 798.84 1.256 1.514Turkey 588.32 1 051.63 1.262 1.444United Kingdom c 643.87 1.264 1.479United States 356.95 684.64 0.678 0.683
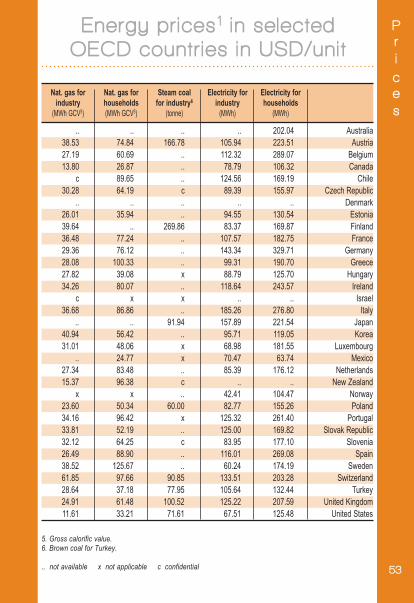
Energy prices1 in selected OECD countr ies in USD/unit
KEyWorld2017.indb 52 30/08/2017 14:34:14
53
Prices
5. Gross calorific value.6. Brown coal for Turkey.
.. not available x not applicable c confidential
Nat. gas for Nat. gas for Steam coal Electricity for Electricity for industry households for industry6 industry households
(MWh GCV5) (MWh GCV5) (tonne) (MWh) (MWh)
.. .. .. .. 202.04 Australia 38.53 74.84 166.78 105.94 223.51 Austria 27.19 60.69 .. 112.32 289.07 Belgium 13.80 26.87 .. 78.79 106.32 Canada
c 89.65 .. 124.56 169.19 Chile 30.28 64.19 c 89.39 155.97 Czech Republic
.. .. .. .. .. Denmark 26.01 35.94 .. 94.55 130.54 Estonia39.64 .. 269.86 83.37 169.87 Finland
36.48 77.24 .. 107.57 182.75 France 29.36 76.12 .. 143.34 329.71 Germany 28.08 100.33 .. 99.31 190.70 Greece 27.82 39.08 x 88.79 125.70 Hungary 34.26 80.07 .. 118.64 243.57 Ireland
c x x .. .. Israel 36.68 86.86 .. 185.26 276.80 Italy
.. .. 91.94 157.89 221.54 Japan 40.94 56.42 .. 95.71 119.05 Korea 31.01 48.06 x 68.98 181.55 Luxembourg
.. 24.77 x 70.47 63.74 Mexico 27.34 83.48 .. 85.39 176.12 Netherlands 15.37 96.38 c .. .. New Zealand
x x .. 42.41 104.47 Norway 23.60 50.34 60.00 82.77 155.26 Poland 34.16 96.42 x 125.32 261.40 Portugal 33.81 52.19 .. 125.00 169.82 Slovak Republic 32.12 64.25 c 83.95 177.10 Slovenia 26.49 88.90 .. 116.01 269.08 Spain 38.52 125.67 .. 60.24 174.19 Sweden 61.85 97.66 90.85 133.51 203.28 Switzerland 28.64 37.18 77.95 105.64 132.44 Turkey 24.91 61.48 100.52 125.22 207.59 United Kingdom 11.61 33.21 71.61 67.51 125.48 United States
Energy prices1 in selected OECD countr ies in USD/unit
KEyWorld2017.indb 53 30/08/2017 14:34:14
54
Emissi o n s
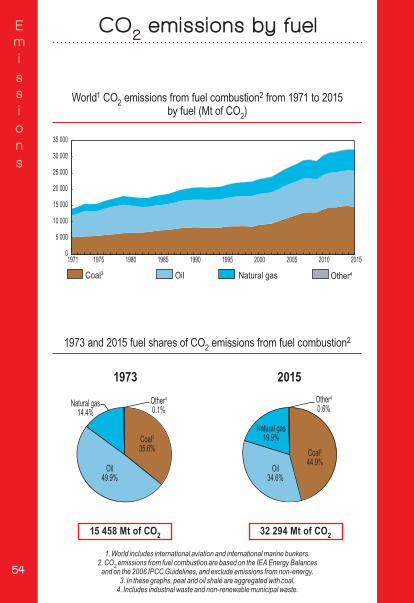
15 458 Mt of CO2 32 294 Mt of CO2
1. World includes international aviation and international marine bunkers. 2. CO2 emissions from fuel combustion are based on the IEA Energy Balances
and on the 2006 IPCC Guidelines, and exclude emissions from non-energy. 3. In these graphs, peat and oil shale are aggregated with coal.
4. Includes industrial waste and non-renewable municipal waste.
Natural gasOilCoal3 Other4
0
5 000
10 000
15 000
20 000
25 000
30 000
35 000
1971 1975 1980 1985 1990 1995 2000 2005 2010 2015
Natural gas19.9%
Oil34.6%
Coal344.9%
Natural gas14.4%
Oil49.9%
Coal335.6%
Other4
0.6%Other4
0.1%
World1 CO2 emissions from fuel combustion2 from 1971 to 2015 by fuel (Mt of CO2)
1973 and 2015 fuel shares of CO2 emissions from fuel combustion2
1973 2015
CO2 emissions by fuel
KEyWorld2017.indb 54 30/08/2017 14:34:14
55
Emissi o n s
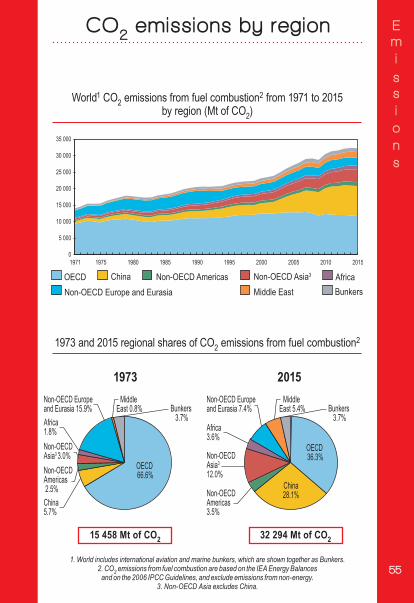
15 458 Mt of CO2 32 294 Mt of CO2
1. World includes international aviation and marine bunkers, which are shown together as Bunkers.2. CO2 emissions from fuel combustion are based on the IEA Energy Balances
and on the 2006 IPCC Guidelines, and exclude emissions from non-energy.3. Non-OECD Asia excludes China.
Non-OECDAmericas 2.5% Non-OECD
Americas3.5%
Non-OECDAsia3 3.0% Non-OECD
Asia3
12.0%
Non-OECD Europeand Eurasia 15.9%
Non-OECD Europeand Eurasia 7.4%
Middle East 0.8%
Middle East 5.4%
OECD 66.6%
OECD 36.3%
China5.7%
China28.1%
Africa1.8% Africa
3.6%
Bunkers 3.7%
Bunkers 3.7%
Non-OECD Europe and EurasiaNon-OECD Americas Non-OECD Asia3
Middle EastAfricaOECDBunkers
China
0
5 000
10 000
15 000
20 000
25 000
30 000
35 000
1971 1975 1980 1985 1990 1995 2000 2005 2010 2015
World1 CO2 emissions from fuel combustion2 from 1971 to 2015 by region (Mt of CO2)
1973 and 2015 regional shares of CO2 emissions from fuel combustion2
1973 2015
CO2 emissions by region
KEyWorld2017.indb 55 30/08/2017 14:34:15
56
RD&D
Research, development and demonstrat ion (RD&D)
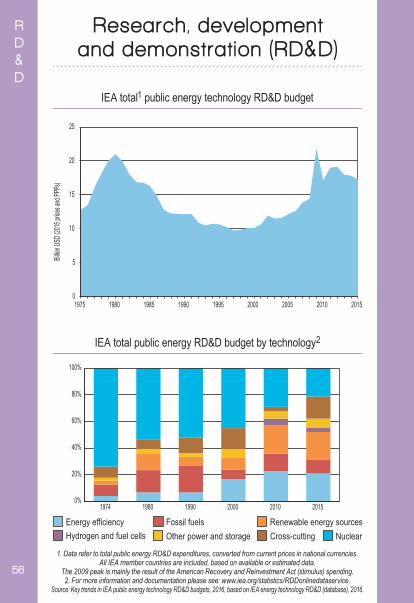
IEA total1 public energy technology RD&D budget
IEA total public energy RD&D budget by technology2
1. Data refer to total public energy RD&D expenditures, converted from current prices in national currencies.All IEA member countries are included, based on available or estimated data.
The 2009 peak is mainly the result of the American Recovery and Reinvestment Act (stimulus) spending.2. For more information and documentation please see: www.iea.org/statistics/RDDonlinedataservice.
Source: Key trends in IEA public energy technology RD&D budgets, 2016, based on IEA energy technology RD&D (database), 2016.
0
5
10
15
20
25
1975 1980 1985 1990 1995 2000 2005 2010 2015
Billion
USD (
2015 p
rices a
nd PP
Ps)
Energy efficiencyHydrogen and fuel cells
Renewable energy sourcesFossil fuelsNuclearOther power and storage Cross-cutting
0%
20%
40%
60%
80%
100%
1974 1980 1990 2000 2010 2015
KEyWorld2017.indb 56 30/08/2017 14:34:15
57
RD&D
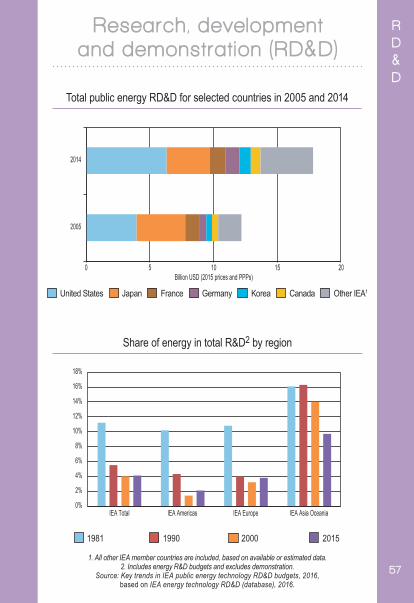
Research, development and demonstrat ion (RD&D)
Total public energy RD&D for selected countries in 2005 and 2014
Share of energy in total R&D2 by region
1. All other IEA member countries are included, based on available or estimated data.2. Includes energy R&D budgets and excludes demonstration.
Source: Key trends in IEA public energy technology RD&D budgets, 2016, based on IEA energy technology RD&D (database), 2016.
United States GermanyFranceJapan Korea Canada Other IEA1
0 5 10 15 20
2005
2014
Billion USD (2015 prices and PPPs)
200019901981 2015
0%
2%
4%
6%
8%
10%
12%
14%
16%
18%
IEA Total IEA Americas IEA Europe IEA Asia Oceania
KEyWorld2017.indb 57 30/08/2017 14:34:16
58
Outloo k
Other3 Natural gas2
HydroOil2
NuclearCoal1
02 0004 0006 0008 000
10 00012 00014 00016 00018 00020 000
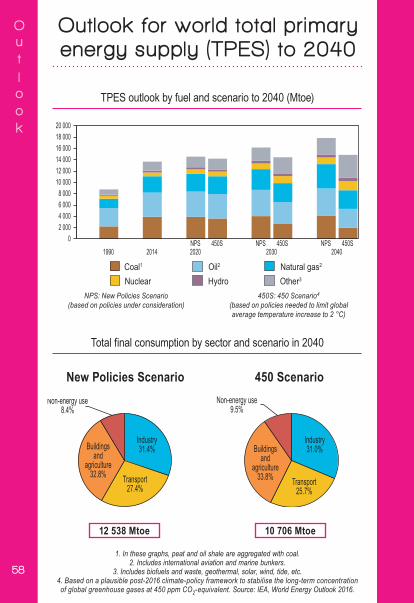
NPS 450S NPS 450S NPS 450S1990 2014 2020 2030 2040
12 538 Mtoe 10 706 Mtoe
1. In these graphs, peat and oil shale are aggregated with coal.2. Includes international aviation and marine bunkers.
3. Includes biofuels and waste, geothermal, solar, wind, tide, etc.4. Based on a plausible post-2016 climate-policy framework to stabilise the long-term concentration of global greenhouse gases at 450 ppm CO2-equivalent. Source: IEA, World Energy Outlook 2016.
NPS: New Policies Scenario (based on policies under consideration)
450S: 450 Scenario4
(based on policies needed to limit globalaverage temperature increase to 2 °C)
New Policies Scenario 450 Scenario
Industry31.4%
Non-energy use8.4%
Buildingsand
agriculture32.8% Transport
27.4%
Industry31.0%
Non-energy use9.5%
Buildingsand
agriculture33.8% Transport
25.7%
Outlook for world total pr imary energy supply (TPES) to 2040
TPES outlook by fuel and scenario to 2040 (Mtoe)
Total final consumption by sector and scenario in 2040
KEyWorld2017.indb 58 30/08/2017 14:34:16
59
Outloo k
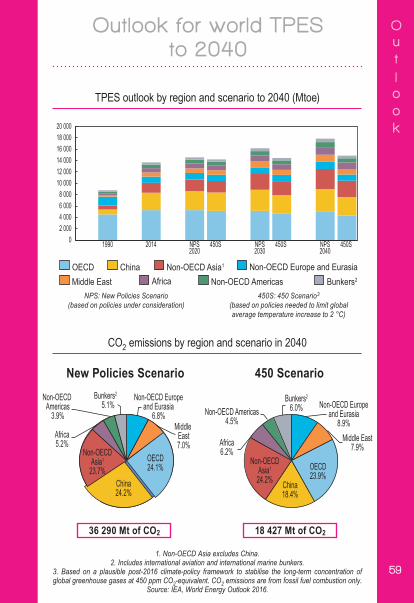
NPS: New Policies Scenario (based on policies under consideration)
450S: 450 Scenario3
(based on policies needed to limit global average temperature increase to 2 °C)
OECD China Non-OECD Asia1 Non-OECD Europe and EurasiaMiddle East Africa Non-OECD Americas Bunkers2
02 0004 0006 0008 000
10 00012 00014 00016 00018 00020 000
1990 2014 NPS2020
450S NPS2030
450S NPS2040
450S
36 290 Mt of CO2 18 427 Mt of CO2
1. Non-OECD Asia excludes China.2. Includes international aviation and international marine bunkers.
3. Based on a plausible post-2016 climate-policy framework to stabilise the long-term concentration ofglobal greenhouse gases at 450 ppm CO2-equivalent. CO2 emissions are from fossil fuel combustion only.
Source: IEA, World Energy Outlook 2016.
New Policies Scenario 450 Scenario
OECD24.1%
China24.2%
Non-OECDAsia1
23.7%
Non-OECD Europeand Eurasia
6.8%Middle
East7.0%
Africa5.2%
Non-OECD Americas
3.9%
Bunkers2
5.1%
OECD23.9%
China18.4%
Non-OECDAsia1
24.2%
Non-OECD Europeand Eurasia
8.9%Middle East
7.9%Africa6.2%
Non-OECD Americas4.5%
Bunkers2
6.0%
Outlook for world TPES to 2040
TPES outlook by region and scenario to 2040 (Mtoe)
CO2 emissions by region and scenario in 2040
058-059_Outlook.indd 59 30/08/2017 14:35:40
60
Energy
i n d i c a t o r s
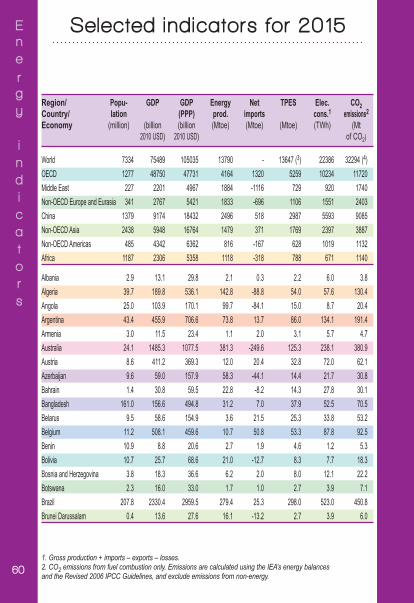
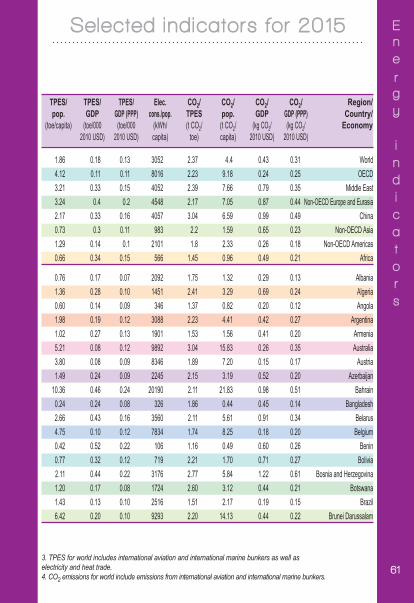
Region/ Popu- GDP GDP Energy Net TPES Elec. CO2 Country/ lation (PPP) prod. imports cons.1 emissions2
Economy (million) (billion (billion (Mtoe) (Mtoe) (Mtoe) (TWh) (Mt 2010 USD) 2010 USD) of CO2)
1. Gross production + imports – exports – losses.2. CO2 emissions from fuel combustion only. Emissions are calculated using the IEA’s energy balancesand the Revised 2006 IPCC Guidelines, and exclude emissions from non-energy.
World 7334 75489 105035 13790 - 13647 (3) 22386 32294 (4)OECD 1277 48750 47731 4164 1320 5259 10234 11720 Middle East 227 2201 4967 1884 -1116 729 920 1740 Non-OECD Europe and Eurasia 341 2767 5421 1833 -696 1106 1551 2403 China 1379 9174 18432 2496 518 2987 5593 9085 Non-OECD Asia 2438 5948 16764 1479 371 1769 2397 3887 Non-OECD Americas 485 4342 6362 816 -167 628 1019 1132 Africa 1187 2306 5358 1118 -318 788 671 1140
Albania 2.9 13.1 29.8 2.1 0.3 2.2 6.0 3.8 Algeria 39.7 189.8 536.1 142.8 -88.8 54.0 57.6 130.4 Angola 25.0 103.9 170.1 99.7 -84.1 15.0 8.7 20.4 Argentina 43.4 455.9 706.6 73.8 13.7 86.0 134.1 191.4 Armenia 3.0 11.5 23.4 1.1 2.0 3.1 5.7 4.7 Australia 24.1 1485.3 1077.5 381.3 -249.6 125.3 238.1 380.9 Austria 8.6 411.2 369.3 12.0 20.4 32.8 72.0 62.1 Azerbaijan 9.6 59.0 157.9 58.3 -44.1 14.4 21.7 30.8 Bahrain 1.4 30.8 59.5 22.8 -8.2 14.3 27.8 30.1 Bangladesh 161.0 156.6 494.8 31.2 7.0 37.9 52.5 70.5 Belarus 9.5 58.6 154.9 3.6 21.5 25.3 33.8 53.2 Belgium 11.2 508.1 459.6 10.7 50.8 53.3 87.8 92.5 Benin 10.9 8.8 20.6 2.7 1.9 4.6 1.2 5.3 Bolivia 10.7 25.7 68.6 21.0 -12.7 8.3 7.7 18.3 Bosnia and Herzegovina 3.8 18.3 36.6 6.2 2.0 8.0 12.1 22.2 Botswana 2.3 16.0 33.0 1.7 1.0 2.7 3.9 7.1 Brazil 207.8 2330.4 2959.5 279.4 25.3 298.0 523.0 450.8 Brunei Darussalam 0.4 13.6 27.6 16.1 -13.2 2.7 3.9 6.0
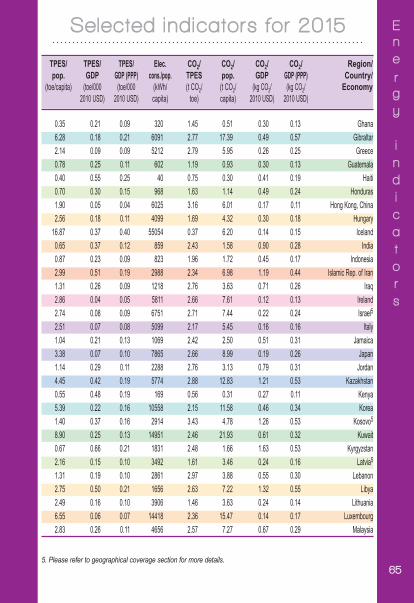
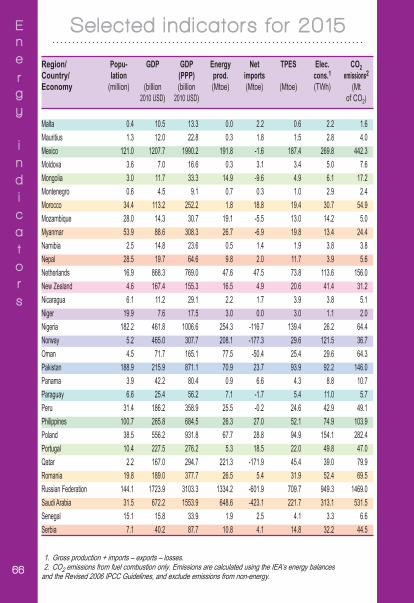
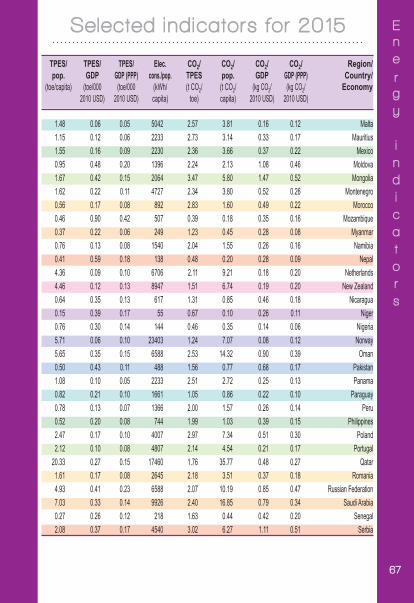
Selected indicators for 2015
KEyWorld2017.indb 60 30/08/2017 14:34:16
61
Energy i n d i c a t o r s
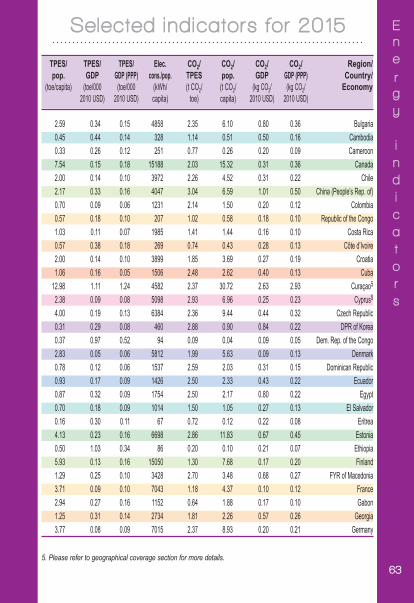
TPES/ TPES/ TPES/ Elec. CO2/ CO2/ CO2/ CO2/ Region/ pop. GDP GDP (PPP) cons./pop. TPES pop. GDP GDP (PPP) Country/ (toe/capita) (toe/000 (toe/000 (kWh/ (t CO2/ (t CO2/ (kg CO2/ (kg CO2/ Economy 2010 USD) 2010 USD) capita) toe) capita) 2010 USD) 2010 USD)
3. TPES for world includes international aviation and international marine bunkers as well as electricity and heat trade.4. CO2 emissions for world include emissions from international aviation and international marine bunkers.
1.86 0.18 0.13 3052 2.37 4.4 0.43 0.31 World 4.12 0.11 0.11 8016 2.23 9.18 0.24 0.25 OECD 3.21 0.33 0.15 4052 2.39 7.66 0.79 0.35 Middle East 3.24 0.4 0.2 4548 2.17 7.05 0.87 0.44 Non-OECD Europe and Eurasia2.17 0.33 0.16 4057 3.04 6.59 0.99 0.49 China 0.73 0.3 0.11 983 2.2 1.59 0.65 0.23 Non-OECD Asia 1.29 0.14 0.1 2101 1.8 2.33 0.26 0.18 Non-OECD Americas 0.66 0.34 0.15 566 1.45 0.96 0.49 0.21 Africa
0.76 0.17 0.07 2092 1.75 1.32 0.29 0.13 Albania 1.36 0.28 0.10 1451 2.41 3.29 0.69 0.24 Algeria 0.60 0.14 0.09 346 1.37 0.82 0.20 0.12 Angola 1.98 0.19 0.12 3088 2.23 4.41 0.42 0.27 Argentina 1.02 0.27 0.13 1901 1.53 1.56 0.41 0.20 Armenia 5.21 0.08 0.12 9892 3.04 15.83 0.26 0.35 Australia 3.80 0.08 0.09 8346 1.89 7.20 0.15 0.17 Austria 1.49 0.24 0.09 2245 2.15 3.19 0.52 0.20 Azerbaijan
10.36 0.46 0.24 20190 2.11 21.83 0.98 0.51 Bahrain 0.24 0.24 0.08 326 1.86 0.44 0.45 0.14 Bangladesh 2.66 0.43 0.16 3560 2.11 5.61 0.91 0.34 Belarus 4.75 0.10 0.12 7834 1.74 8.25 0.18 0.20 Belgium 0.42 0.52 0.22 106 1.16 0.49 0.60 0.26 Benin 0.77 0.32 0.12 719 2.21 1.70 0.71 0.27 Bolivia 2.11 0.44 0.22 3176 2.77 5.84 1.22 0.61 Bosnia and Herzegovina 1.20 0.17 0.08 1724 2.60 3.12 0.44 0.21 Botswana 1.43 0.13 0.10 2516 1.51 2.17 0.19 0.15 Brazil 6.42 0.20 0.10 9293 2.20 14.13 0.44 0.22 Brunei Darussalam
Selected indicators for 2015
KEyWorld2017.indb 61 30/08/2017 14:34:16
62
Energy
i n d i c a t o r s
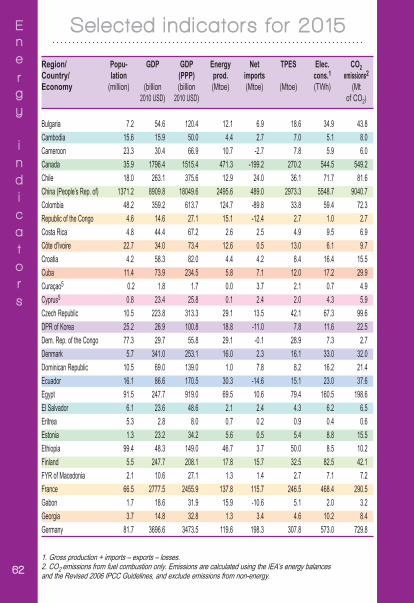
1. Gross production + imports – exports – losses.2. CO2 emissions from fuel combustion only. Emissions are calculated using the IEA’s energy balances and the Revised 2006 IPCC Guidelines, and exclude emissions from non-energy.
Region/ Popu- GDP GDP Energy Net TPES Elec. CO2 Country/ lation (PPP) prod. imports cons.1 emissions2
Economy (million) (billion (billion (Mtoe) (Mtoe) (Mtoe) (TWh) (Mt 2010 USD) 2010 USD) of CO2)
Bulgaria 7.2 54.6 120.4 12.1 6.9 18.6 34.9 43.8 Cambodia 15.6 15.9 50.0 4.4 2.7 7.0 5.1 8.0 Cameroon 23.3 30.4 66.9 10.7 -2.7 7.8 5.9 6.0 Canada 35.9 1796.4 1515.4 471.3 -199.2 270.2 544.5 549.2 Chile 18.0 263.1 375.6 12.9 24.0 36.1 71.7 81.6 China (People’s Rep. of) 1371.2 8909.8 18049.6 2495.6 489.0 2973.3 5548.7 9040.7 Colombia 48.2 359.2 613.7 124.7 -89.8 33.8 59.4 72.3 Republic of the Congo 4.6 14.6 27.1 15.1 -12.4 2.7 1.0 2.7 Costa Rica 4.8 44.4 67.2 2.6 2.5 4.9 9.5 6.9 Côte d’Ivoire 22.7 34.0 73.4 12.6 0.5 13.0 6.1 9.7 Croatia 4.2 58.3 82.0 4.4 4.2 8.4 16.4 15.5 Cuba 11.4 73.9 234.5 5.8 7.1 12.0 17.2 29.9 Curaçao5 0.2 1.8 1.7 0.0 3.7 2.1 0.7 4.9 Cyprus5 0.8 23.4 25.8 0.1 2.4 2.0 4.3 5.9 Czech Republic 10.5 223.8 313.3 29.1 13.5 42.1 67.3 99.6 DPR of Korea 25.2 26.9 100.8 18.8 -11.0 7.8 11.6 22.5 Dem. Rep. of the Congo 77.3 29.7 55.8 29.1 -0.1 28.9 7.3 2.7 Denmark 5.7 341.0 253.1 16.0 2.3 16.1 33.0 32.0 Dominican Republic 10.5 69.0 139.0 1.0 7.8 8.2 16.2 21.4 Ecuador 16.1 86.6 170.5 30.3 -14.6 15.1 23.0 37.6 Egypt 91.5 247.7 919.0 69.5 10.6 79.4 160.5 198.6 El Salvador 6.1 23.6 48.6 2.1 2.4 4.3 6.2 6.5 Eritrea 5.3 2.8 8.0 0.7 0.2 0.9 0.4 0.6 Estonia 1.3 23.2 34.2 5.6 0.5 5.4 8.8 15.5 Ethiopia 99.4 48.3 149.0 46.7 3.7 50.0 8.5 10.2 Finland 5.5 247.7 208.1 17.8 15.7 32.5 82.5 42.1 FYR of Macedonia 2.1 10.6 27.1 1.3 1.4 2.7 7.1 7.2 France 66.5 2777.5 2455.9 137.8 115.7 246.5 468.4 290.5 Gabon 1.7 18.6 31.9 15.9 -10.6 5.1 2.0 3.2 Georgia 3.7 14.8 32.8 1.3 3.4 4.6 10.2 8.4 Germany 81.7 3696.6 3473.5 119.6 198.3 307.8 573.0 729.8
Selected indicators for 2015
KEyWorld2017.indb 62 30/08/2017 14:34:16
63
Energy i n d i c a t o r s
TPES/ TPES/ TPES/ Elec. CO2/ CO2/ CO2/ CO2/ Region/ pop. GDP GDP (PPP) cons./pop. TPES pop. GDP GDP (PPP) Country/ (toe/capita) (toe/000 (toe/000 (kWh/ (t CO2/ (t CO2/ (kg CO2/ (kg CO2/ Economy 2010 USD) 2010 USD) capita) toe) capita) 2010 USD) 2010 USD)
5. Please refer to geographical coverage section for more details.
2.59 0.34 0.15 4858 2.35 6.10 0.80 0.36 Bulgaria 0.45 0.44 0.14 328 1.14 0.51 0.50 0.16 Cambodia 0.33 0.26 0.12 251 0.77 0.26 0.20 0.09 Cameroon 7.54 0.15 0.18 15188 2.03 15.32 0.31 0.36 Canada 2.00 0.14 0.10 3972 2.26 4.52 0.31 0.22 Chile 2.17 0.33 0.16 4047 3.04 6.59 1.01 0.50 China (People’s Rep. of)0.70 0.09 0.06 1231 2.14 1.50 0.20 0.12 Colombia 0.57 0.18 0.10 207 1.02 0.58 0.18 0.10 Republic of the Congo 1.03 0.11 0.07 1985 1.41 1.44 0.16 0.10 Costa Rica 0.57 0.38 0.18 269 0.74 0.43 0.28 0.13 Côte d’Ivoire 2.00 0.14 0.10 3899 1.85 3.69 0.27 0.19 Croatia 1.06 0.16 0.05 1506 2.48 2.62 0.40 0.13 Cuba
12.98 1.11 1.24 4582 2.37 30.72 2.63 2.93 Curaçao5
2.38 0.09 0.08 5098 2.93 6.96 0.25 0.23 Cyprus5
4.00 0.19 0.13 6384 2.36 9.44 0.44 0.32 Czech Republic 0.31 0.29 0.08 460 2.88 0.90 0.84 0.22 DPR of Korea0.37 0.97 0.52 94 0.09 0.04 0.09 0.05 Dem. Rep. of the Congo 2.83 0.05 0.06 5812 1.99 5.63 0.09 0.13 Denmark 0.78 0.12 0.06 1537 2.59 2.03 0.31 0.15 Dominican Republic 0.93 0.17 0.09 1426 2.50 2.33 0.43 0.22 Ecuador 0.87 0.32 0.09 1754 2.50 2.17 0.80 0.22 Egypt 0.70 0.18 0.09 1014 1.50 1.05 0.27 0.13 El Salvador 0.16 0.30 0.11 67 0.72 0.12 0.22 0.08 Eritrea 4.13 0.23 0.16 6698 2.86 11.83 0.67 0.45 Estonia 0.50 1.03 0.34 86 0.20 0.10 0.21 0.07 Ethiopia 5.93 0.13 0.16 15050 1.30 7.68 0.17 0.20 Finland 1.29 0.25 0.10 3428 2.70 3.48 0.68 0.27 FYR of Macedonia 3.71 0.09 0.10 7043 1.18 4.37 0.10 0.12 France 2.94 0.27 0.16 1152 0.64 1.88 0.17 0.10 Gabon 1.25 0.31 0.14 2734 1.81 2.26 0.57 0.26 Georgia 3.77 0.08 0.09 7015 2.37 8.93 0.20 0.21 Germany
Selected indicators for 2015
KEyWorld2017.indb 63 30/08/2017 14:34:16
64
Energy
i n d i c a t o r s
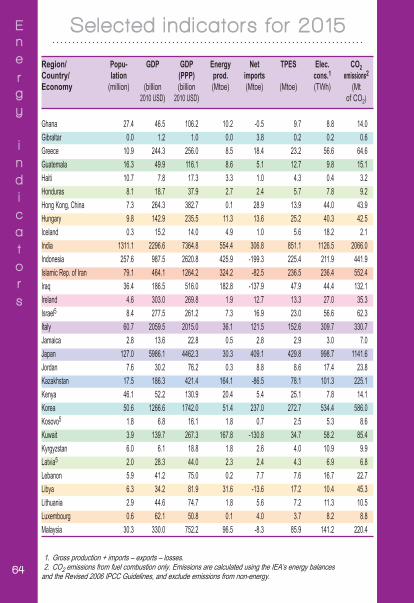
1. Gross production + imports – exports – losses.2. CO2 emissions from fuel combustion only. Emissions are calculated using the IEA’s energy balances
and the Revised 2006 IPCC Guidelines, and exclude emissions from non-energy.
Region/ Popu- GDP GDP Energy Net TPES Elec. CO2 Country/ lation (PPP) prod. imports cons.1 emissions2
Economy (million) (billion (billion (Mtoe) (Mtoe) (Mtoe) (TWh) (Mt 2010 USD) 2010 USD) of CO2)
Ghana 27.4 46.5 106.2 10.2 -0.5 9.7 8.8 14.0 Gibraltar 0.0 1.2 1.0 0.0 3.8 0.2 0.2 0.6 Greece 10.9 244.3 256.0 8.5 18.4 23.2 56.6 64.6 Guatemala 16.3 49.9 116.1 8.6 5.1 12.7 9.8 15.1 Haiti 10.7 7.8 17.3 3.3 1.0 4.3 0.4 3.2 Honduras 8.1 18.7 37.9 2.7 2.4 5.7 7.8 9.2 Hong Kong, China 7.3 264.3 382.7 0.1 28.9 13.9 44.0 43.9 Hungary 9.8 142.9 235.5 11.3 13.6 25.2 40.3 42.5 Iceland 0.3 15.2 14.0 4.9 1.0 5.6 18.2 2.1 India 1311.1 2296.6 7364.8 554.4 306.8 851.1 1126.5 2066.0 Indonesia 257.6 987.5 2620.8 425.9 -199.3 225.4 211.9 441.9 Islamic Rep. of Iran 79.1 464.1 1264.2 324.2 -82.5 236.5 236.4 552.4 Iraq 36.4 186.5 516.0 182.8 -137.9 47.9 44.4 132.1 Ireland 4.6 303.0 269.8 1.9 12.7 13.3 27.0 35.3 Israel5 8.4 277.5 261.2 7.3 16.9 23.0 56.6 62.3 Italy 60.7 2059.5 2015.0 36.1 121.5 152.6 309.7 330.7 Jamaica 2.8 13.6 22.8 0.5 2.8 2.9 3.0 7.0 Japan 127.0 5986.1 4462.3 30.3 409.1 429.8 998.7 1141.6 Jordan 7.6 30.2 76.2 0.3 8.8 8.6 17.4 23.8 Kazakhstan 17.5 186.3 421.4 164.1 -86.5 78.1 101.3 225.1 Kenya 46.1 52.2 130.9 20.4 5.4 25.1 7.8 14.1 Korea 50.6 1266.6 1742.0 51.4 237.0 272.7 534.4 586.0 Kosovo5 1.8 6.8 16.1 1.8 0.7 2.5 5.3 8.6 Kuwait 3.9 139.7 267.3 167.8 -130.8 34.7 58.2 85.4 Kyrgyzstan 6.0 6.1 18.8 1.8 2.6 4.0 10.9 9.9 Latvia5 2.0 28.3 44.0 2.3 2.4 4.3 6.9 6.8 Lebanon 5.9 41.2 75.0 0.2 7.7 7.6 16.7 22.7 Libya 6.3 34.2 81.9 31.6 -13.6 17.2 10.4 45.3 Lithuania 2.9 44.6 74.7 1.8 5.6 7.2 11.3 10.5 Luxembourg 0.6 62.1 50.8 0.1 4.0 3.7 8.2 8.8 Malaysia 30.3 330.0 752.2 96.5 -8.3 85.9 141.2 220.4
Selected indicators for 2015
KEyWorld2017.indb 64 30/08/2017 14:34:17
65
Energy i n d i c a t o r s
TPES/ TPES/ TPES/ Elec. CO2/ CO2/ CO2/ CO2/ Region/ pop. GDP GDP (PPP) cons./pop. TPES pop. GDP GDP (PPP) Country/ (toe/capita) (toe/000 (toe/000 (kWh/ (t CO2/ (t CO2/ (kg CO2/ (kg CO2/ Economy 2010 USD) 2010 USD) capita) toe) capita) 2010 USD) 2010 USD)
0.35 0.21 0.09 320 1.45 0.51 0.30 0.13 Ghana 6.28 0.18 0.21 6091 2.77 17.39 0.49 0.57 Gibraltar 2.14 0.09 0.09 5212 2.79 5.95 0.26 0.25 Greece 0.78 0.25 0.11 602 1.19 0.93 0.30 0.13 Guatemala 0.40 0.55 0.25 40 0.75 0.30 0.41 0.19 Haiti 0.70 0.30 0.15 968 1.63 1.14 0.49 0.24 Honduras 1.90 0.05 0.04 6025 3.16 6.01 0.17 0.11 Hong Kong, China 2.56 0.18 0.11 4099 1.69 4.32 0.30 0.18 Hungary
16.87 0.37 0.40 55054 0.37 6.20 0.14 0.15 Iceland 0.65 0.37 0.12 859 2.43 1.58 0.90 0.28 India 0.87 0.23 0.09 823 1.96 1.72 0.45 0.17 Indonesia 2.99 0.51 0.19 2988 2.34 6.98 1.19 0.44 Islamic Rep. of Iran 1.31 0.26 0.09 1218 2.76 3.63 0.71 0.26 Iraq 2.86 0.04 0.05 5811 2.66 7.61 0.12 0.13 Ireland 2.74 0.08 0.09 6751 2.71 7.44 0.22 0.24 Israel5
2.51 0.07 0.08 5099 2.17 5.45 0.16 0.16 Italy 1.04 0.21 0.13 1069 2.42 2.50 0.51 0.31 Jamaica 3.38 0.07 0.10 7865 2.66 8.99 0.19 0.26 Japan 1.14 0.29 0.11 2288 2.76 3.13 0.79 0.31 Jordan 4.45 0.42 0.19 5774 2.88 12.83 1.21 0.53 Kazakhstan 0.55 0.48 0.19 169 0.56 0.31 0.27 0.11 Kenya 5.39 0.22 0.16 10558 2.15 11.58 0.46 0.34 Korea 1.40 0.37 0.16 2914 3.43 4.78 1.26 0.53 Kosovo5
8.90 0.25 0.13 14951 2.46 21.93 0.61 0.32 Kuwait 0.67 0.66 0.21 1831 2.48 1.66 1.63 0.53 Kyrgyzstan 2.16 0.15 0.10 3492 1.61 3.46 0.24 0.16 Latvia5
1.31 0.19 0.10 2861 2.97 3.88 0.55 0.30 Lebanon 2.75 0.50 0.21 1656 2.63 7.22 1.32 0.55 Libya 2.49 0.16 0.10 3906 1.46 3.63 0.24 0.14 Lithuania 6.55 0.06 0.07 14418 2.36 15.47 0.14 0.17 Luxembourg 2.83 0.26 0.11 4656 2.57 7.27 0.67 0.29 Malaysia
5. Please refer to geographical coverage section for more details.
Selected indicators for 2015
KEyWorld2017.indb 65 30/08/2017 14:34:17
66
Energy
i n d i c a t o r s
1. Gross production + imports – exports – losses.2. CO2 emissions from fuel combustion only. Emissions are calculated using the IEA’s energy balances
and the Revised 2006 IPCC Guidelines, and exclude emissions from non-energy.
Region/ Popu- GDP GDP Energy Net TPES Elec. CO2 Country/ lation (PPP) prod. imports cons.1 emissions2
Economy (million) (billion (billion (Mtoe) (Mtoe) (Mtoe) (TWh) (Mt 2010 USD) 2010 USD) of CO2)
Malta 0.4 10.5 13.3 0.0 2.2 0.6 2.2 1.6 Mauritius 1.3 12.0 22.8 0.3 1.8 1.5 2.8 4.0 Mexico 121.0 1207.7 1990.2 191.8 -1.6 187.4 269.8 442.3 Moldova 3.6 7.0 16.6 0.3 3.1 3.4 5.0 7.6 Mongolia 3.0 11.7 33.3 14.9 -9.6 4.9 6.1 17.2 Montenegro 0.6 4.5 9.1 0.7 0.3 1.0 2.9 2.4 Morocco 34.4 113.2 252.2 1.8 18.8 19.4 30.7 54.9 Mozambique 28.0 14.3 30.7 19.1 -5.5 13.0 14.2 5.0 Myanmar 53.9 88.6 308.3 26.7 -6.9 19.8 13.4 24.4 Namibia 2.5 14.8 23.6 0.5 1.4 1.9 3.8 3.8 Nepal 28.5 19.7 64.6 9.8 2.0 11.7 3.9 5.6 Netherlands 16.9 868.3 769.0 47.6 47.5 73.8 113.6 156.0 New Zealand 4.6 167.4 155.3 16.5 4.9 20.6 41.4 31.2 Nicaragua 6.1 11.2 29.1 2.2 1.7 3.9 3.8 5.1 Niger 19.9 7.6 17.5 3.0 0.0 3.0 1.1 2.0 Nigeria 182.2 461.8 1006.6 254.3 -116.7 139.4 26.2 64.4 Norway 5.2 465.0 307.7 208.1 -177.3 29.6 121.5 36.7 Oman 4.5 71.7 165.1 77.5 -50.4 25.4 29.6 64.3 Pakistan 188.9 215.9 871.1 70.9 23.7 93.9 92.2 146.0 Panama 3.9 42.2 80.4 0.9 6.6 4.3 8.8 10.7 Paraguay 6.6 25.4 56.2 7.1 -1.7 5.4 11.0 5.7 Peru 31.4 186.2 358.9 25.5 -0.2 24.6 42.9 49.1 Philippines 100.7 265.8 684.5 26.3 27.0 52.1 74.9 103.9 Poland 38.5 556.2 931.8 67.7 28.8 94.9 154.1 282.4 Portugal 10.4 227.5 276.2 5.3 18.5 22.0 49.8 47.0 Qatar 2.2 167.0 294.7 221.3 -171.9 45.4 39.0 79.9 Romania 19.8 189.0 377.7 26.5 5.4 31.9 52.4 69.5 Russian Federation 144.1 1723.9 3103.3 1334.2 -601.9 709.7 949.3 1469.0 Saudi Arabia 31.5 672.2 1553.9 648.6 -423.1 221.7 313.1 531.5 Senegal 15.1 15.8 33.9 1.9 2.5 4.1 3.3 6.6 Serbia 7.1 40.2 87.7 10.8 4.1 14.8 32.2 44.5
Selected indicators for 2015
KEyWorld2017.indb 66 30/08/2017 14:34:17
67
Energy i n d i c a t o r s
TPES/ TPES/ TPES/ Elec. CO2/ CO2/ CO2/ CO2/ Region/ pop. GDP GDP (PPP) cons./pop. TPES pop. GDP GDP (PPP) Country/ (toe/capita) (toe/000 (toe/000 (kWh/ (t CO2/ (t CO2/ (kg CO2/ (kg CO2/ Economy 2010 USD) 2010 USD) capita) toe) capita) 2010 USD) 2010 USD)
1.48 0.06 0.05 5042 2.57 3.81 0.16 0.12 Malta 1.15 0.12 0.06 2233 2.73 3.14 0.33 0.17 Mauritius 1.55 0.16 0.09 2230 2.36 3.66 0.37 0.22 Mexico 0.95 0.48 0.20 1396 2.24 2.13 1.08 0.46 Moldova 1.67 0.42 0.15 2064 3.47 5.80 1.47 0.52 Mongolia 1.62 0.22 0.11 4727 2.34 3.80 0.52 0.26 Montenegro 0.56 0.17 0.08 892 2.83 1.60 0.49 0.22 Morocco 0.46 0.90 0.42 507 0.39 0.18 0.35 0.16 Mozambique 0.37 0.22 0.06 249 1.23 0.45 0.28 0.08 Myanmar 0.76 0.13 0.08 1540 2.04 1.55 0.26 0.16 Namibia 0.41 0.59 0.18 138 0.48 0.20 0.28 0.09 Nepal 4.36 0.09 0.10 6706 2.11 9.21 0.18 0.20 Netherlands 4.46 0.12 0.13 8947 1.51 6.74 0.19 0.20 New Zealand 0.64 0.35 0.13 617 1.31 0.85 0.46 0.18 Nicaragua 0.15 0.39 0.17 55 0.67 0.10 0.26 0.11 Niger 0.76 0.30 0.14 144 0.46 0.35 0.14 0.06 Nigeria 5.71 0.06 0.10 23403 1.24 7.07 0.08 0.12 Norway 5.65 0.35 0.15 6588 2.53 14.32 0.90 0.39 Oman 0.50 0.43 0.11 488 1.56 0.77 0.68 0.17 Pakistan 1.08 0.10 0.05 2233 2.51 2.72 0.25 0.13 Panama 0.82 0.21 0.10 1661 1.05 0.86 0.22 0.10 Paraguay 0.78 0.13 0.07 1366 2.00 1.57 0.26 0.14 Peru 0.52 0.20 0.08 744 1.99 1.03 0.39 0.15 Philippines 2.47 0.17 0.10 4007 2.97 7.34 0.51 0.30 Poland 2.12 0.10 0.08 4807 2.14 4.54 0.21 0.17 Portugal
20.33 0.27 0.15 17460 1.76 35.77 0.48 0.27 Qatar 1.61 0.17 0.08 2645 2.18 3.51 0.37 0.18 Romania 4.93 0.41 0.23 6588 2.07 10.19 0.85 0.47 Russian Federation 7.03 0.33 0.14 9926 2.40 16.85 0.79 0.34 Saudi Arabia 0.27 0.26 0.12 218 1.63 0.44 0.42 0.20 Senegal 2.08 0.37 0.17 4540 3.02 6.27 1.11 0.51 Serbia
Selected indicators for 2015
KEyWorld2017.indb 67 30/08/2017 14:34:17
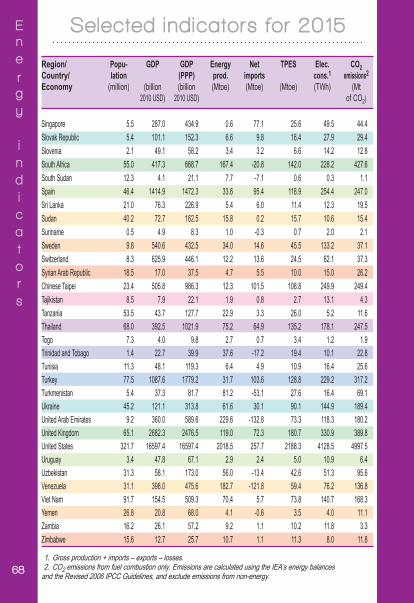
68
Energy
i n d i c a t o r s
1. Gross production + imports – exports – losses.2. CO2 emissions from fuel combustion only. Emissions are calculated using the IEA’s energy balances
and the Revised 2006 IPCC Guidelines, and exclude emissions from non-energy.
Region/ Popu- GDP GDP Energy Net TPES Elec. CO2 Country/ lation (PPP) prod. imports cons.1 emissions2
Economy (million) (billion (billion (Mtoe) (Mtoe) (Mtoe) (TWh) (Mt 2010 USD) 2010 USD) of CO2)
Singapore 5.5 287.0 434.9 0.6 77.1 25.6 49.5 44.4 Slovak Republic 5.4 101.1 152.3 6.6 9.8 16.4 27.9 29.4 Slovenia 2.1 49.1 58.2 3.4 3.2 6.6 14.2 12.8 South Africa 55.0 417.3 668.7 167.4 -20.8 142.0 228.2 427.6 South Sudan 12.3 4.1 21.1 7.7 -7.1 0.6 0.3 1.1 Spain 46.4 1414.9 1472.3 33.6 95.4 118.9 254.4 247.0 Sri Lanka 21.0 76.3 226.9 5.4 6.0 11.4 12.3 19.5 Sudan 40.2 72.7 162.5 15.8 0.2 15.7 10.6 15.4 Suriname 0.5 4.9 8.3 1.0 -0.3 0.7 2.0 2.1 Sweden 9.8 540.6 432.5 34.0 14.6 45.5 133.2 37.1 Switzerland 8.3 625.9 446.1 12.2 13.6 24.5 62.1 37.3 Syrian Arab Republic 18.5 17.0 37.5 4.7 5.5 10.0 15.0 26.2 Chinese Taipei 23.4 505.8 986.3 12.3 101.5 108.8 249.9 249.4 Tajikistan 8.5 7.9 22.1 1.9 0.8 2.7 13.1 4.3 Tanzania 53.5 43.7 127.7 22.9 3.3 26.0 5.2 11.6 Thailand 68.0 392.5 1021.9 75.2 64.9 135.2 178.1 247.5 Togo 7.3 4.0 9.8 2.7 0.7 3.4 1.2 1.9 Trinidad and Tobago 1.4 22.7 39.9 37.6 -17.2 19.4 10.1 22.8 Tunisia 11.3 48.1 119.3 6.4 4.9 10.9 16.4 25.6 Turkey 77.5 1087.6 1779.2 31.7 103.6 128.8 229.2 317.2 Turkmenistan 5.4 37.3 81.7 81.2 -53.1 27.6 16.4 69.1 Ukraine 45.2 121.1 313.8 61.6 30.1 90.1 144.9 189.4 United Arab Emirates 9.2 360.0 589.6 229.6 -132.8 73.3 118.3 180.2 United Kingdom 65.1 2682.3 2476.5 119.0 72.3 180.7 330.9 389.8 United States 321.7 16597.4 16597.4 2018.5 257.7 2188.3 4128.5 4997.5 Uruguay 3.4 47.8 67.1 2.9 2.4 5.0 10.9 6.4 Uzbekistan 31.3 58.1 173.0 56.0 -13.4 42.6 51.3 95.6 Venezuela 31.1 398.0 475.6 182.7 -121.8 59.4 76.2 136.8 Viet Nam 91.7 154.5 509.3 70.4 5.7 73.8 140.7 168.3 Yemen 26.8 20.8 68.0 4.1 -0.6 3.5 4.0 11.1 Zambia 16.2 26.1 57.2 9.2 1.1 10.2 11.8 3.3 Zimbabwe 15.6 12.7 25.7 10.7 1.1 11.3 8.0 11.8
Selected indicators for 2015
KEyWorld2017.indb 68 30/08/2017 14:34:17
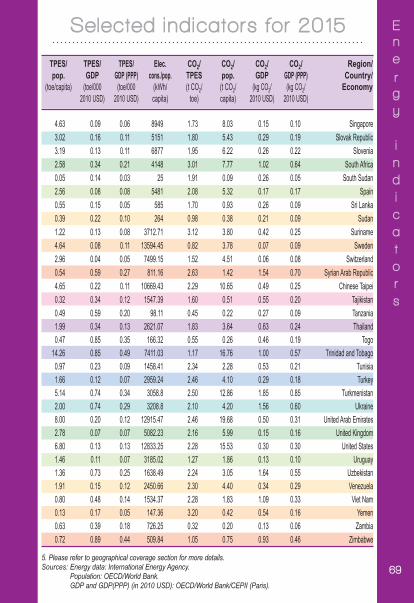
69
Energy i n d i c a t o r s
5. Please refer to geographical coverage section for more details.Sources: Energy data: International Energy Agency.
Population: OECD/World Bank. GDP and GDP(PPP) (in 2010 USD): OECD/World Bank/CEPII (Paris).
TPES/ TPES/ TPES/ Elec. CO2/ CO2/ CO2/ CO2/ Region/ pop. GDP GDP (PPP) cons./pop. TPES pop. GDP GDP (PPP) Country/ (toe/capita) (toe/000 (toe/000 (kWh/ (t CO2/ (t CO2/ (kg CO2/ (kg CO2/ Economy 2010 USD) 2010 USD) capita) toe) capita) 2010 USD) 2010 USD)
4.63 0.09 0.06 8949 1.73 8.03 0.15 0.10 Singapore 3.02 0.16 0.11 5151 1.80 5.43 0.29 0.19 Slovak Republic 3.19 0.13 0.11 6877 1.95 6.22 0.26 0.22 Slovenia 2.58 0.34 0.21 4148 3.01 7.77 1.02 0.64 South Africa 0.05 0.14 0.03 25 1.91 0.09 0.26 0.05 South Sudan 2.56 0.08 0.08 5481 2.08 5.32 0.17 0.17 Spain 0.55 0.15 0.05 585 1.70 0.93 0.26 0.09 Sri Lanka 0.39 0.22 0.10 264 0.98 0.38 0.21 0.09 Sudan 1.22 0.13 0.08 3712.71 3.12 3.80 0.42 0.25 Suriname4.64 0.08 0.11 13594.45 0.82 3.78 0.07 0.09 Sweden 2.96 0.04 0.05 7499.15 1.52 4.51 0.06 0.08 Switzerland 0.54 0.59 0.27 811.16 2.63 1.42 1.54 0.70 Syrian Arab Republic 4.65 0.22 0.11 10669.43 2.29 10.65 0.49 0.25 Chinese Taipei 0.32 0.34 0.12 1547.39 1.60 0.51 0.55 0.20 Tajikistan 0.49 0.59 0.20 98.11 0.45 0.22 0.27 0.09 Tanzania 1.99 0.34 0.13 2621.07 1.83 3.64 0.63 0.24 Thailand 0.47 0.85 0.35 166.32 0.55 0.26 0.46 0.19 Togo
14.26 0.85 0.49 7411.03 1.17 16.76 1.00 0.57 Trinidad and Tobago 0.97 0.23 0.09 1458.41 2.34 2.28 0.53 0.21 Tunisia 1.66 0.12 0.07 2959.24 2.46 4.10 0.29 0.18 Turkey 5.14 0.74 0.34 3058.8 2.50 12.86 1.85 0.85 Turkmenistan 2.00 0.74 0.29 3208.8 2.10 4.20 1.56 0.60 Ukraine 8.00 0.20 0.12 12915.47 2.46 19.68 0.50 0.31 United Arab Emirates 2.78 0.07 0.07 5082.23 2.16 5.99 0.15 0.16 United Kingdom 6.80 0.13 0.13 12833.25 2.28 15.53 0.30 0.30 United States 1.46 0.11 0.07 3185.02 1.27 1.86 0.13 0.10 Uruguay 1.36 0.73 0.25 1638.49 2.24 3.05 1.64 0.55 Uzbekistan 1.91 0.15 0.12 2450.66 2.30 4.40 0.34 0.29 Venezuela 0.80 0.48 0.14 1534.37 2.28 1.83 1.09 0.33 Viet Nam 0.13 0.17 0.05 147.36 3.20 0.42 0.54 0.16 Yemen 0.63 0.39 0.18 726.25 0.32 0.20 0.13 0.06 Zambia 0.72 0.89 0.44 509.84 1.05 0.75 0.93 0.46 Zimbabwe
Selected indicators for 2015
KEyWorld2017.indb 69 30/08/2017 14:34:17
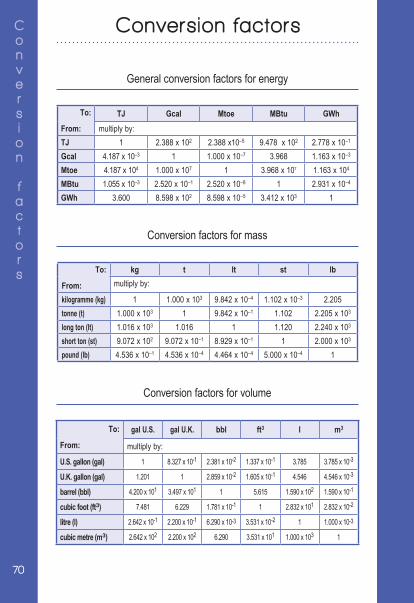
70
Conversion
factors
General conversion factors for energy
Conversion factors for mass
Conversion factors for volume
To:
From:
gal U.S. gal U.K. bbl ft3 l m3
multiply by:
U.S. gallon (gal) 1 8.327 x 10⁻¹ 2.381 x 10⁻² 1.337 x 10⁻¹ 3.785 3.785 x 10⁻³
U.K. gallon (gal) 1.201 1 2.859 x 10⁻² 1.605 x 10⁻¹ 4.546 4.546 x 10⁻³
barrel (bbl) 4.200 x 101 3.497 x 101 1 5.615 1.590 x 10² 1.590 x 10⁻¹
cubic foot (ft3) 7.481 6.229 1.781 x 10⁻¹ 1 2.832 x 101 2.832 x 10⁻²
litre (l) 2.642 x 10⁻¹ 2.200 x 10⁻¹ 6.290 x 10⁻³ 3.531 x 10⁻² 1 1.000 x 10⁻³
cubic metre (m3) 2.642 x 10² 2.200 x 10² 6.290 3.531 x 101 1.000 x 10³ 1
To:
From:
kg t lt st lbmultiply by:
kilogramme (kg) 1 1.000 x 10³ 9.842 x 10⁻⁴ 1.102 x 10⁻³ 2.205tonne (t) 1.000 x 10³ 1 9.842 x 10⁻¹ 1.102 2.205 x 10³
long ton (lt) 1.016 x 10³ 1.016 1 1.120 2.240 x 10³
short ton (st) 9.072 x 10² 9.072 x 10⁻¹ 8.929 x 10⁻¹ 1 2.000 x 10³
pound (lb) 4.536 x 10⁻¹ 4.536 x 10⁻⁴ 4.464 x 10⁻⁴ 5.000 x 10⁻⁴ 1
To:
From:TJ Gcal Mtoe MBtu GWh
multiply by:TJ 1 2.388 x 10² 2.388 x10⁻⁵ 9.478 x 10² 2.778 x 10⁻¹
Gcal 4.187 x 10⁻³ 1 1.000 x 10⁻⁷ 3.968 1.163 x 10⁻³
Mtoe 4.187 x 10⁴ 1.000 x 10⁷ 1 3.968 x 10⁷ 1.163 x 10⁴
MBtu 1.055 x 10⁻³ 2.520 x 10⁻¹ 2.520 x 10⁻⁸ 1 2.931 x 10⁻⁴
GWh 3.600 8.598 x 10² 8.598 x 10⁻⁵ 3.412 x 10³ 1
Conversion factors
KEyWorld2017.indb 70 30/08/2017 14:34:17
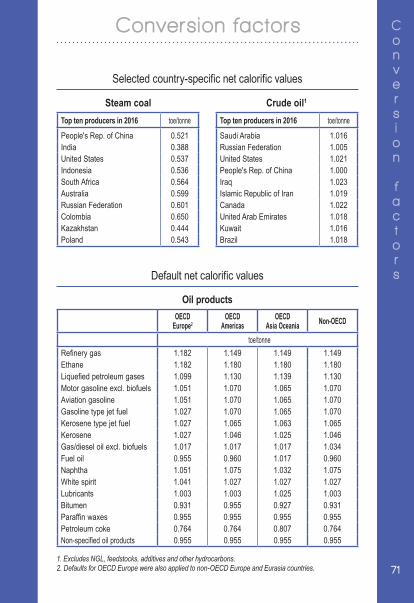
71
Conversion
factors
Selected country-specific net calorific values
1. Excludes NGL, feedstocks, additives and other hydrocarbons.2. Defaults for OECD Europe were also applied to non-OECD Europe and Eurasia countries.
Oil products
Default net calorific values
Steam coalTop ten producers in 2016 toe/tonne
People's Rep. of China 0.521India 0.388United States 0.537Indonesia 0.536South Africa 0.564Australia 0.599Russian Federation 0.601Colombia 0.650Kazakhstan 0.444Poland 0.543
Crude oil1
Top ten producers in 2016 toe/tonne
Saudi Arabia 1.016Russian Federation 1.005United States 1.021People's Rep. of China 1.000Iraq 1.023Islamic Republic of Iran 1.019Canada 1.022United Arab Emirates 1.018Kuwait 1.016Brazil 1.018
OECD Europe2
OECD Americas
OECD Asia Oceania Non-OECD
toe/tonneRefinery gas 1.182 1.149 1.149 1.149Ethane 1.182 1.180 1.180 1.180Liquefied petroleum gases 1.099 1.130 1.139 1.130Motor gasoline excl. biofuels 1.051 1.070 1.065 1.070Aviation gasoline 1.051 1.070 1.065 1.070Gasoline type jet fuel 1.027 1.070 1.065 1.070Kerosene type jet fuel 1.027 1.065 1.063 1.065Kerosene 1.027 1.046 1.025 1.046Gas/diesel oil excl. biofuels 1.017 1.017 1.017 1.034Fuel oil 0.955 0.960 1.017 0.960Naphtha 1.051 1.075 1.032 1.075White spirit 1.041 1.027 1.027 1.027Lubricants 1.003 1.003 1.025 1.003Bitumen 0.931 0.955 0.927 0.931Paraffin waxes 0.955 0.955 0.955 0.955Petroleum coke 0.764 0.764 0.807 0.764Non-specified oil products 0.955 0.955 0.955 0.955
Conversion factors
KEyWorld2017.indb 71 30/08/2017 14:34:17
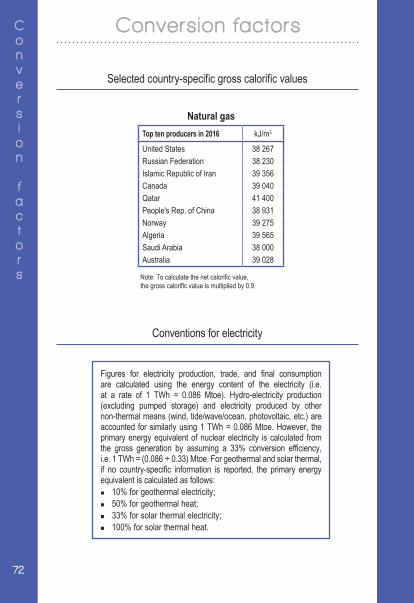
72
Conversion
factors
Conventions for electricity
Selected country-specific gross calorific values
Natural gasTop ten producers in 2016 kJ/m3
United States 38 267 Russian Federation 38 230 Islamic Republic of Iran 39 356 Canada 39 040 Qatar 41 400People's Rep. of China 38 931 Norway 39 275 Algeria 39 565 Saudi Arabia 38 000Australia 39 028
Note: To calculate the net calorific value, the gross calorific value is multiplied by 0.9.
Figures for electricity production, trade, and final consumption are calculated using the energy content of the electricity (i.e. at a rate of 1 TWh = 0.086 Mtoe). Hydro-electricity production (excluding pumped storage) and electricity produced by other non-thermal means (wind, tide/wave/ocean, photovoltaic, etc.) are accounted for similarly using 1 TWh = 0.086 Mtoe. However, the primary energy equivalent of nuclear electricity is calculated from the gross generation by assuming a 33% conversion efficiency, i.e. 1 TWh = (0.086 ÷ 0.33) Mtoe. For geothermal and solar thermal,if no country-specific information is reported, the primary energyequivalent is calculated as follows: 10% for geothermal electricity; 50% for geothermal heat; 33% for solar thermal electricity; 100% for solar thermal heat.
Conversion factors
KEyWorld2017.indb 72 30/08/2017 14:34:17
73
Glossary
Coal Coal includes all coal, both primary (including coking coal, steam coal and lignite) and derived fuels (including patent fuel, coke oven coke, gas coke, BKB, gas works gas, coke oven gas, blast furnace gas and other recovered gases). For presentational purposes, peat (including peat products) and oil shale are also included in this category where applicable.
Steam coal Steam coal comprises anthracite, other bituminous coal and sub-bituminous coal.Crude oil Crude oil comprises crude oil, natural gas liquids, refinery feedstocks and
additives as well as other hydrocarbons.Oil products Oil products comprises refinery gas, ethane, LPG, aviation gasoline, motor
gasoline, jet fuels, kerosene, gas/diesel oil, fuel oil, naphtha, white spirit, lubricants, bitumen, paraffin waxes, petroleum coke and other oil products.
Natural gas Natural gas includes both “associated” and “non-associated” gas.Renewables Renewables includes hydro, geothermal, solar PV, solar thermal, tide/wave/
ocean, wind, municipal waste (renewable), primary solid biofuels, biogases, biogasoline, biodiesel, other liquid biofuels, non-specified primary biofuels and waste and charcoal.
Nuclear Nuclear shows the primary heat equivalent of the electricity produced by a nuclear power plant with an average thermal efficiency of 33%.
Hydro Hydro shows the energy content of the electricity produced in hydro power plants. Hydro output excludes output from pumped storage plants.
Solar photo-voltaic (PV)
Solar PV electricity refers to electricity produced from solar photovoltaics, i.e. by the direct conversion of solar radiation through photovoltaic processes in semiconductor devices (solar cells), including concentrating photovoltaic systems.
Wind Wind electricity refers to electricity produced from devices driven by wind.Biofuels and waste
Biofuels and waste comprises solid biofuels, liquid biofuels, biogases, industrial waste and municipal waste. Biofuels are defined as any plant matter used directly as fuel or converted into fuels (e.g. charcoal) or electricity and/or heat. Included here are wood, vegetal waste (including wood waste and crops used for energy production), ethanol, animal materials/wastes and sulphite lyes. Municipal waste comprises wastes produced by residential, commercial and public services, that are collected by local authorities for disposal in a central location for the production of heat and/or power.
Other Other includes geothermal, solar, wind, tide/wave/ocean energy, electricity and heat. Unless the actual efficiency of geothermal and solar thermal is known, the quantity of geothermal and solar energy entering electricity generation is inferred from the electricity/heat production at geothermal and solar plants assuming an average thermal efficiency of:■ 10% for geothermal electricity;■ 50% for geothermal heat;■ 33% for solar thermal electricity;■ 100% for solar thermal heat.
Defini t ions
KEyWorld2017.indb 73 30/08/2017 14:34:17
74
Glossary
Other (ctd.) For solar PV, wind and tide/wave/ocean energy, the quantities entering electricity generation are equal to the electrical energy generated. Direct use of geothermal and solar heat is also included here. Electricity is accounted for at the same heat value as electricity in final consumption (i.e. 1 GWh = 0.000086 Mtoe). Heat includes heat that is produced for sale and is accounted for in the transformation sector.
Production Production is the production of primary energy, i.e. coking coal, steam coal, lignite, peat, oil shale, crude oil, NGLs, natural gas, biofuels and waste, nuclear, hydro, geothermal, solar and the heat from heat pumps that is extracted from the ambient environment. Production is calculated after removal of impurities (e.g. sulphur from natural gas).
Imports and exports
Imports and exports comprise amounts having crossed the national territorial boundaries of the country, whether or not customs clearance has taken place.
a) Oil and natural gas Quantities of crude oil and oil products imported or exported under processing agreements (i.e. refining on account) are included. Quantities of oil in transit are excluded. Crude oil, NGL and natural gas are reported as coming from the country of origin; refinery feedstocks and oil products are reported as coming from the country of last consignment. Re-exports of oil imported for processing within bonded areas are shown as exports of product from the processing country to the final destination.
b) CoalImports and exports comprise the amount of fuels obtained from or supplied to other countries, whether or not there is an economic or customs union between the relevant countries. Coal in transit is not included.
c) ElectricityAmounts are considered as imported or exported when they have crossed the national territorial boundaries of the country.
International marine bunkers
International marine bunkers covers those quantities delivered to ships of all flags that are engaged in international navigation. The international navigation may take place at sea, on inland lakes and waterways, and in coastal waters. Consumption by ships engaged in domestic navigation is excluded. The domestic/international split is determined on the basis of port of departure and port of arrival, and not by the flag or nationality of the ship. Consumption by fishing vessels and by military forces is also excluded.
International aviation bunkers
International aviation bunkers covers deliveries of aviation fuels to aircraft for international aviation. Fuels used by airlines for their road vehicles are excluded. The domestic/international split should be determined on the basis of departure and landing locations and not by the nationality of the airline. For many countries this incorrectly excludes fuel used by domestically owned carriers for their international departures.
Defini t ions
KEyWorld2017.indb 74 30/08/2017 14:34:17
75
Glossary
Stock changes
Stock changes reflects the difference between opening stock levels on the first day of the year and closing levels on the last day of the year of stocks on national territory held by producers, importers, energy transformation industries and large consumers. A stock build is shown as a negative number, and a stock draw as a positive number.
Total primary energy supply (TPES)
Total primary energy supply (TPES) is made up of production + imports – exports – international marine bunkers – international aviation bunkers ± stock changes. For the world total, international marine bunkers and international aviation bunkers are not subtracted from TPES.
Transfers Transfers includes both interproduct transfers, products transferred and recycled products.
Statistical differences
Statistical differences includes the sum of the unexplained statistical differences for individual fuels, as they appear in the basic energy statistics. It also includes the statistical differences that arise because of the variety of conversion factors in the coal and oil columns.
Electricity plants
Electricity plants refers to plants which are designed to produce electricity only. If one or more units of the plant is a CHP unit (and the inputs and outputs can not be distinguished on a unit basis) then the whole plant is designated as a CHP plant. Both main activity producers and autoproducer plants are included here.
Oil refineries Oil refineries shows the use of primary energy for the manufacture of finished oil products and the corresponding output. Thus, the total reflects transformation losses. In certain cases the data in the total column are positive numbers. This can be due to either problems in the primary refinery balance or to the fact that the IEA uses regional net calorific values for oil products.
Other transformation
Other transformation covers non-specified transformation not shown elsewhere, such as the transformation of primary solid biofuels into charcoal.
Energy industry own use
Energy industry own use contains the primary and secondary energy consumed by transformation industries for heating, pumping, traction and lighting purposes [ISIC 05, 06, 19 and 35, Group 091 and Classes 0892 and 0721].
Losses Losses includes losses in energy distribution, transmission and transport.
Total final consumption (TFC)
Total final consumption (TFC) is the sum of consumption by the different end-use sectors and also includes non-energy use. Backflows from the petrochemical industry are not included in final consumption.
Industry Industry consumption is specified by sub-sector as listed below. Energy used for transport by industry is not included here but is reported under transport. Non-energy use in industry is excluded from industry and reported separately:■ Iron and steel industry [ISIC Group 241 and Class 2431]; ■ Chemical and petrochemical industry [ISIC Divisions 20 and 21] excluding
petrochemical feedstocks;
Defini t ions
KEyWorld2017.indb 75 30/08/2017 14:34:17
76
Glossary
Industry (ctd.) ■ Non-ferrou s metals basic industries [ISIC Group 242 and Class 2432]; ■ Non-metallic minerals such as glass, ceramic, cement, etc.
[ISIC Division 23];■ Transport equipment [ISIC Divisions 29 and 30];■ Machinery comprises fabricated metal products, machinery and equipment
other than transport equipment [ISIC Divisions 25 to 28];■ Mining (excluding fuels) and quarrying [ISIC Divisions 07 and 08 and Group
099]; ■ Food and tobacco [ISIC Divisions 10 to 12];■ Paper, pulp and printing [ISIC Divisions 17 and 18];■ Wood and wood products (other than pulp and paper) [ISIC Division 16];■ Construction [ISIC Divisions 41 to 43];■ Textile and leather [ISIC Divisions 13 to 15];■ Non-specified (any manufacturing industry not included above) [ISIC
Divisions 22, 31 and 32].
Transport Transport includes all fuels used for transport [ISIC Divisions 49 to 51]. It includes transport in industry and covers domestic aviation, road, rail, pipeline transport, domestic navigation and non-specified transport. Fuel used for ocean, coastal and inland fishing (included under fishing) and military consumption (included in other non-specified) are excluded from transport. Please note that international marine and international aviation bunkers are also included here for world total. Non-energy use in transport is excluded from transport and reported separately.
Other Other covers residential, commercial and public services [ISIC Divisions 33, 36-39, 45-47, 52, 53, 55, 56, 58-66, 68-75, 77-82, 84 (excluding Class 8422),85-88, 90-99], agriculture/forestry [ISIC Divisions 01 and 02], fishing [ISICDivision 03] and non-specified consumption.
Non-energy use Non-energy use covers those fuels that are used as raw materials in the different sectors and are not consumed as a fuel or transformed into another fuel. Non-energy use also includes petrochemical feedstocks. Non-energy use is shown separately in final consumption under the heading non-energy use.
Defini t ions
KEyWorld2017.indb 76 30/08/2017 14:34:17
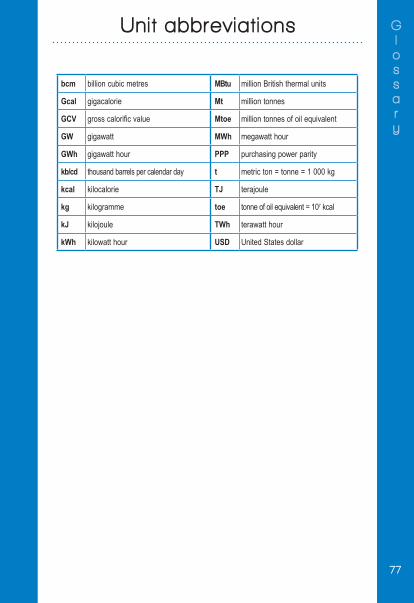
77
Glossary
bcm billion cubic metres MBtu million British thermal units
Gcal gigacalorie Mt million tonnes
GCV gross calorific value Mtoe million tonnes of oil equivalent
GW gigawatt MWh megawatt hour
GWh gigawatt hour PPP purchasing power parity
kb/cd thousand barrels per calendar day t metric ton = tonne = 1 000 kg
kcal kilocalorie TJ terajoule
kg kilogramme toe tonne of oil equivalent = 107 kcal
kJ kilojoule TWh terawatt hour
kWh kilowatt hour USD United States dollar
Unit abbreviat ions
KEyWorld2017.indb 77 30/08/2017 14:34:17
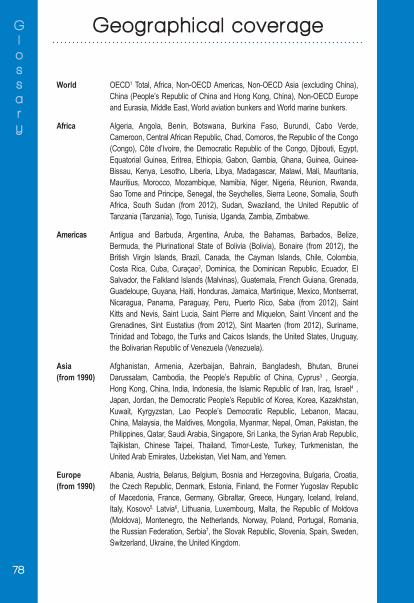
78
Glossary
World OECD1 Total, Africa, Non-OECD Americas, Non-OECD Asia (excluding China), China (People’s Republic of China and Hong Kong, China), Non-OECD Europe and Eurasia, Middle East, World aviation bunkers and World marine bunkers.
Africa Algeria, Angola, Benin, Botswana, Burkina Faso, Burundi, Cabo Verde, Cameroon, Central African Republic, Chad, Comoros, the Republic of the Congo (Congo), Côte d’Ivoire, the Democratic Republic of the Congo, Djibouti, Egypt, Equatorial Guinea, Eritrea, Ethiopia, Gabon, Gambia, Ghana, Guinea, Guinea-Bissau, Kenya, Lesotho, Liberia, Libya, Madagascar, Malawi, Mali, Mauritania, Mauritius, Morocco, Mozambique, Namibia, Niger, Nigeria, Réunion, Rwanda, Sao Tome and Principe, Senegal, the Seychelles, Sierra Leone, Somalia, South Africa, South Sudan (from 2012), Sudan, Swaziland, the United Republic of Tanzania (Tanzania), Togo, Tunisia, Uganda, Zambia, Zimbabwe.
Americas Antigua and Barbuda, Argentina, Aruba, the Bahamas, Barbados, Belize, Bermuda, the Plurinational State of Bolivia (Bolivia), Bonaire (from 2012), the British Virgin Islands, Brazil, Canada, the Cayman Islands, Chile, Colombia, Costa Rica, Cuba, Curaçao2, Dominica, the Dominican Republic, Ecuador, El Salvador, the Falkland Islands (Malvinas), Guatemala, French Guiana, Grenada, Guadeloupe, Guyana, Haiti, Honduras, Jamaica, Martinique, Mexico, Montserrat, Nicaragua, Panama, Paraguay, Peru, Puerto Rico, Saba (from 2012), Saint Kitts and Nevis, Saint Lucia, Saint Pierre and Miquelon, Saint Vincent and the Grenadines, Sint Eustatius (from 2012), Sint Maarten (from 2012), Suriname, Trinidad and Tobago, the Turks and Caicos Islands, the United States, Uruguay, the Bolivarian Republic of Venezuela (Venezuela).
Asia (from 1990)
Afghanistan, Armenia, Azerbaijan, Bahrain, Bangladesh, Bhutan, Brunei Darussalam, Cambodia, the People’s Republic of China, Cyprus3 , Georgia, Hong Kong, China, India, Indonesia, the Islamic Republic of Iran, Iraq, Israel4 , Japan, Jordan, the Democratic People’s Republic of Korea, Korea, Kazakhstan, Kuwait, Kyrgyzstan, Lao People’s Democratic Republic, Lebanon, Macau, China, Malaysia, the Maldives, Mongolia, Myanmar, Nepal, Oman, Pakistan, the Philippines, Qatar, Saudi Arabia, Singapore, Sri Lanka, the Syrian Arab Republic, Tajikistan, Chinese Taipei, Thailand, Timor-Leste, Turkey, Turkmenistan, the United Arab Emirates, Uzbekistan, Viet Nam, and Yemen.
Europe (from 1990)
Albania, Austria, Belarus, Belgium, Bosnia and Herzegovina, Bulgaria, Croatia, the Czech Republic, Denmark, Estonia, Finland, the Former Yugoslav Republic of Macedonia, France, Germany, Gibraltar, Greece, Hungary, Iceland, Ireland, Italy, Kosovo5, Latvia6, Lithuania, Luxembourg, Malta, the Republic of Moldova (Moldova), Montenegro, the Netherlands, Norway, Poland, Portugal, Romania, the Russian Federation, Serbia7, the Slovak Republic, Slovenia, Spain, Sweden, Switzerland, Ukraine, the United Kingdom.
Geographical coverage
KEyWorld2017.indb 78 30/08/2017 14:34:17
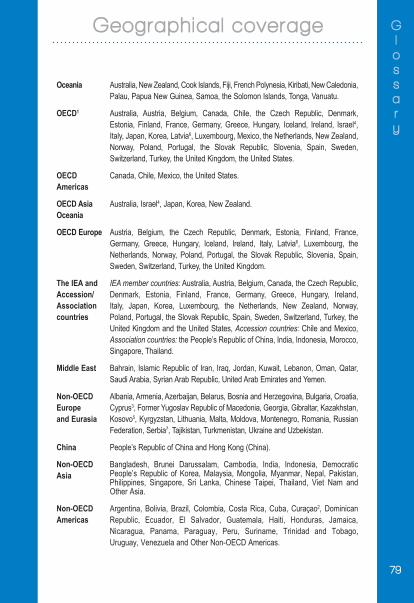
79
Glossary
Geographical coverage
Oceania Australia, New Zealand, Cook Islands, Fiji, French Polynesia, Kiribati, New Caledonia, Palau, Papua New Guinea, Samoa, the Solomon Islands, Tonga, Vanuatu.
OECD1 Australia, Austria, Belgium, Canada, Chile, the Czech Republic, Denmark, Estonia, Finland, France, Germany, Greece, Hungary, Iceland, Ireland, Israel4, Italy, Japan, Korea, Latvia6, Luxembourg, Mexico, the Netherlands, New Zealand, Norway, Poland, Portugal, the Slovak Republic, Slovenia, Spain, Sweden, Switzerland, Turkey, the United Kingdom, the United States.
OECD Americas
Canada, Chile, Mexico, the United States.
OECD Asia Oceania
Australia, Israel4, Japan, Korea, New Zealand.
OECD Europe Austria, Belgium, the Czech Republic, Denmark, Estonia, Finland, France, Germany, Greece, Hungary, Iceland, Ireland, Italy, Latvia6, Luxembourg, the Netherlands, Norway, Poland, Portugal, the Slovak Republic, Slovenia, Spain, Sweden, Switzerland, Turkey, the United Kingdom.
The IEA and Accession/ Association countries
IEA member countries: Australia, Austria, Belgium, Canada, the Czech Republic, Denmark, Estonia, Finland, France, Germany, Greece, Hungary, Ireland, Italy, Japan, Korea, Luxembourg, the Netherlands, New Zealand, Norway, Poland, Portugal, the Slovak Republic, Spain, Sweden, Switzerland, Turkey, the United Kingdom and the United States, Accession countries: Chile and Mexico, Association countries: the People’s Republic of China, India, Indonesia, Morocco, Singapore, Thailand.
Middle East Bahrain, Islamic Republic of Iran, Iraq, Jordan, Kuwait, Lebanon, Oman, Qatar, Saudi Arabia, Syrian Arab Republic, United Arab Emirates and Yemen.
Non-OECD Europe and Eurasia
Albania, Armenia, Azerbaijan, Belarus, Bosnia and Herzegovina, Bulgaria, Croatia, Cyprus3, Former Yugoslav Republic of Macedonia, Georgia, Gibraltar, Kazakhstan, Kosovo5, Kyrgyzstan, Lithuania, Malta, Moldova, Montenegro, Romania, Russian Federation, Serbia7, Tajikistan, Turkmenistan, Ukraine and Uzbekistan.
China People’s Republic of China and Hong Kong (China).
Non-OECD Asia
Bangladesh, Brunei Darussalam, Cambodia, India, Indonesia, Democratic People’s Republic of Korea, Malaysia, Mongolia, Myanmar, Nepal, Pakistan, Philippines, Singapore, Sri Lanka, Chinese Taipei, Thailand, Viet Nam and Other Asia.
Non-OECD Americas
Argentina, Bolivia, Brazil, Colombia, Costa Rica, Cuba, Curaçao2, Dominican Republic, Ecuador, El Salvador, Guatemala, Haiti, Honduras, Jamaica, Nicaragua, Panama, Paraguay, Peru, Suriname, Trinidad and Tobago, Uruguay, Venezuela and Other Non-OECD Americas.
KEyWorld2017.indb 79 30/08/2017 14:34:17
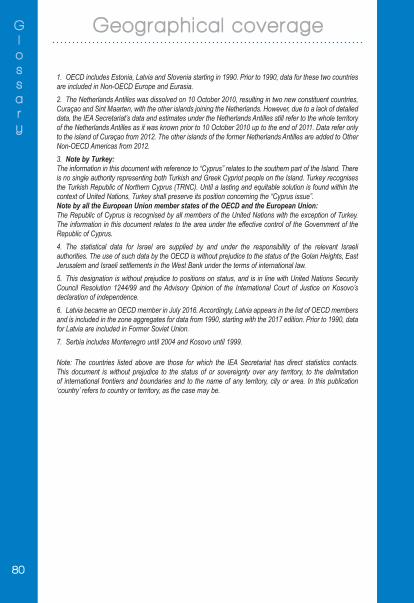
80
Glossary
1. OECD includes Estonia, Latvia and Slovenia starting in 1990. Prior to 1990, data for these two countriesare included in Non-OECD Europe and Eurasia.2. The Netherlands Antilles was dissolved on 10 October 2010, resulting in two new constituent countries,Curaçao and Sint Maarten, with the other islands joining the Netherlands. However, due to a lack of detailed data, the IEA Secretariat’s data and estimates under the Netherlands Antilles still refer to the whole territory of the Netherlands Antilles as it was known prior to 10 October 2010 up to the end of 2011. Data refer only to the island of Curaçao from 2012. The other islands of the former Netherlands Antilles are added to Other Non-OECD Americas from 2012.3. Note by Turkey:The information in this document with reference to “Cyprus” relates to the southern part of the Island. There is no single authority representing both Turkish and Greek Cypriot people on the Island. Turkey recognises the Turkish Republic of Northern Cyprus (TRNC). Until a lasting and equitable solution is found within the context of United Nations, Turkey shall preserve its position concerning the “Cyprus issue”. Note by all the European Union member states of the OECD and the European Union:The Republic of Cyprus is recognised by all members of the United Nations with the exception of Turkey. The information in this document relates to the area under the effective control of the Government of the Republic of Cyprus.4. The statistical data for Israel are supplied by and under the responsibility of the relevant Israeliauthorities. The use of such data by the OECD is without prejudice to the status of the Golan Heights, East Jerusalem and Israeli settlements in the West Bank under the terms of international law.5. This designation is without prejudice to positions on status, and is in line with United Nations Security Council Resolution 1244/99 and the Advisory Opinion of the International Court of Justice on Kosovo’sdeclaration of independence.6. Latvia became an OECD member in July 2016. Accordingly, Latvia appears in the list of OECD members and is included in the zone aggregates for data from 1990, starting with the 2017 edition. Prior to 1990, datafor Latvia are included in Former Soviet Union.7. Serbia includes Montenegro until 2004 and Kosovo until 1999.
Note: The countries listed above are those for which the IEA Secretariat has direct statistics contacts. This document is without prejudice to the status of or sovereignty over any territory, to the delimitation of international frontiers and boundaries and to the name of any territory, city or area. In this publication ‘country’ refers to country or territory, as the case may be.
Geographical coverage
KEyWorld2017.indb 80 30/08/2017 14:34:17
81
Nine annual publications
World Energy Statistics 2017
World Energy Statistics presents comprehensive world energy statistics on all energy sources – coal, gas, oil, electricity, renewables and waste. It covers energy supply and consumption for 150 countries and regions, including all OECD countries, over 100 other key energy producing and consuming countries, as well as world totals. The book includes detailed tables by country in original units for the year 2015, and summary time series on production, trade, and final consumption by sector. It also presents provisional 2016 supply data for OECD countries, and initial 2016 estimates for non-OECD countries’ production and trade of natural gas, primary coal and oil.
Published August 2017 – Price: Print €120; PDF €96
World Energy Balances 2017
World Energy Balances presents comprehensive energy balances for all the world’s largest energy producing and consuming countries. It contains detailed data on the supply and consumption of energy for 150 countries and regions, including all OECD countries, over 100 other key energy producing and consuming countries, as well as world totals. The book includes graphs and detailed data by country for all energy sources – coal, gas, oil, electricity, renewables and waste - expressed in balance format, for the year 2015. Alongside this, there are summary time series on production, trade, final consumption by sector, as well as key energy and economic indicators. The volume also presents provisional 2016 supply data for OECD countries, and initial 2016 estimates for non-OECD countries’ production and trade of natural gas, primary coal and oil.
Published August 2017 - Price: Print €120; PDF €96
Stat ist ics publ icat ions
KEyWorld2017.indb 81 30/08/2017 14:34:17
82
Electricity Information 2017
Electricity Information provides a comprehensive review of historical and current market trends in the OECD electricity sector, including 2016 provisional data. It provides an overview of the world electricity developments in 2015 covering world electricity and heat production, input fuel mix, supply and consumption, and electricity imports and exports. More detail is provided for the 35 OECD countries with information covering production, installed capacity, input energy mix to electricity and heat production, consumption, electricity trades, input fuel prices and end-user electricity prices. It provides comprehensive statistical details on overall energy consumption, economic indicators, electricity and heat production by energy form and plant type, electricity imports and exports, sectoral energy and electricity consumption, as well as prices for electricity and electricity input fuels for each country and regional aggregate.
Published August 2017 - Price: Print €150; PDF €120
Coal Information 2017
Coal Information provides a comprehensive review of historical and current market trends in the world coal sector, including 2016 provisional data. It provides a review of the world coal market in 2015, alongside a statistical overview of developments, which covers world coal production and coal reserves, coal demand by type, coal trade and coal prices. A detailed and comprehensive statistical picture of historical and current coal developments in the 35 OECD member countries, by region and individually is presented in tables and charts. Complete coal balances and coal trade data for selected years are presented on 22 major non-OECD coal-producing and -consuming countries, with summary statistics on coal supply and end-use statistics for about 40 countries and regions worldwide.
Published August 2017 – Price: Print €165; PDF €132
Stat ist ics publ icat ions
KEyWorld2017.indb 82 30/08/2017 14:34:17
83
Natural Gas Information 2017
Natural Gas Information is a detailed reference work on gas supply and demand covering not only the OECD countries but also the rest of the world, this publication contains essential information on LNG and pipeline trade, gas reserves, storage capacity and prices. The main part of the book concentrates on OECD countries, showing a detailed supply and demand balance for each country and for the three OECD regions: Americas, Asia-Oceania and Europe, as well as a breakdown of gas consumption by end user. Import and export data are reported by source and destination.
Published August 2017 – Price: Print €165; PDF €132
Oil Information 2017
Oil Information is a comprehensive reference book on current developments in oil supply and demand. This publication contains key data on world production, trade, prices and consumption of major oil product groups, with time series back to the early 1970s. Its core consists of a detailed and comprehensive picture of oil supply, demand, trade, production and consumption by end-user for each OECD country individually and for the OECD regions. Trade data are reported extensively by origin and destination.
Published August 2017 – Price: Print €165; PDF €132
Renewables Information 2017
Renewables Information provides a comprehensive review of historical and current market trends in OECD countries, including 2015 provisional data. It provides an overview of the development of renewables and waste in the world over the 1990 to 2015 period. A greater focus is given to the OECD countries with a review of electricity generation and capacity from renewable and waste energy sources, including detailed tables. However, an overview of developments in the world and OECD renewable and waste market is also presented. The publication encompasses energy indicators, generating capacity, electricity and heat production from renewable and waste sources, as well as production and consumption of renewables and waste.
Published August 2017 – Price: Print €110; PDF €88
Stat ist ics publ icat ions
KEyWorld2017.indb 83 30/08/2017 14:34:17
84
CO2 Emissions from Fuel Combustion, 2017
In recognition of the fundamental importance of understanding energy related environmental issues, the IEA’s CO
2 Emissions from Fuel Combustion provides
a full analysis of emissions stemming from energy use. This annual publication has become an essential tool for analysts and policy makers in many international fora such as the Conference of the Parties, which will be meeting in Bonn, Germany, from 7 to 16 November 2017. The data in this book are designed to assist in understanding the evolution of the emissions of CO2 from 1971 to 2015 for 150 countries and regions by sector and by fuel. Emissions were calculated using IEA energy databases and the default methods and emission factors from the 2006 IPCC Guidelines for National Greenhouse Gas Inventories.
Published November 2017 – Price: Print €165; PDF €132
Energy Efficiency Indicators Highlights 2017
Energy Efficiency Indicators Highlights is designed to help understand what drives final energy use in IEA member countries in order to improve and track national energy efficiency policies.It provides the first comprehensive selection of data that the IEA has been collecting each year after its member states recognized in 2009 the need to better monitor energy efficiency policies.The report includes country-specific analysis of end uses across the largest sectors – residential, services, industry and transport. It answers questions such as:
• What are the largest drivers for energy use trends in each country?• Was energy saved because of efficiency progress over time?• How much energy is used for space heating, appliances or cooking?• What are the most energy-intensive industries?
Improving energy efficiency is a critical step for governments to take to move towards a sustainable energy system. This report highlights the key role of end-use energy data and indicators in monitoring progress in energy efficiency around the world.
Published December 2017 - Free pdf
Stat ist ics publ icat ions
KEyWorld2017.indb 84 30/08/2017 14:34:17
85
Two quarterlies
Oil, Gas, Coal and Electricity
Oil, Gas, Coal and Electricity provides detailed and up-to-date quarterly statistics on oil, natural gas, coal and electricity for the OECD countries. Oil statistics cover production, trade, refinery intake and output, stock changes and consumption for crude oil, NGL and nine selected product groups. Statistics for electricity, natural gas and coal show supply and trade. Oil and coal import and export data are reported by origin and destination. Gas imports and exports data are reported by entries and exits of physical flows. Moreover, oil and coal production are reported on a worldwide basis.
Published Quarterly – Price: single edition Print €120, annual subscription Print €380
single edition PDF €96 annual subscription PDF €304
Energy Prices and Taxes
Energy Prices and Taxes responds to the needs of the energy industry and OECD governments for up-to-date information on prices and taxes in national and international energy markets. It contains crude oil import prices by crude stream, industry prices and consumer prices. The end-user prices for OECD member countries cover main oil products, gas, coal and electricity. Every issue includes full notes on sources and methods and a description of price components in each country. Time series availability varies with each data series.
Published Quarterly – Price: single edition Print €120, annual subscription Print €380
single edition PDF €96 annual subscription PDF €304
Stat ist ics publ icat ions
KEyWorld2017.indb 85 30/08/2017 14:34:17
86
Electronic editionsCD-ROMs and Online Data Services
To complement its publications, the Energy Data Centre produces CDROMs containing the complete databases which are used for preparing the statistics publications. Built-in software allows you to access and manipulate all these data in a very user-friendly manner and includes graphic facilities. These databases are also available on the internet from our online data service.
■ Annual CD-ROMS / Online Databases• World Energy Statistics 2017 Price: €800• World Energy Balances 2017 Price: €800• World Energy Statistics and Balances 2017 Price: €1 400 (Combined subscription of the above two series) • Electricity Information 2017 Price: €550• Coal Information 2017 Price: €550• Natural Gas Information 2017 Price: €550• Oil Information 2017 Price: €550• Renewables Information 2017 Price: €400• CO2 Emissions from Fuel Combustion 2017 Price: €550
■ Quarterly CD-ROMs / Online Databases• Energy Prices and Taxes Price: (four quarters) €900
A description of these services is available on our website: http://data.iea.org
All the annual and quarterly online databases are also accessible over the internet on a pay-per-view basis. The databases can be accessed either for a single data point or for time series.
Note: The prices quoted above are for single-user licences. Please consult our website for information on multi-user licence prices.
Stat ist ics publ icat ions
KEyWorld2017.indb 86 30/08/2017 14:34:17
87
Other online servicesThe Monthly Oil Data Service
This service provides the detailed databases of historical and projected information which is used in preparing the IEA monthly Oil Market Report (OMR). The IEA Monthly Oil Data Service comprises three packages available separately or combined as a subscriber service on the internet. The data are available at the same time as the official release of the Oil Market Report.The packages include:
• Supply, Demand, Balances and Stocks Price: €6 150• Trade Price: €2 050• Field-by-Field Supply Price: €3 080• Complete Service Price: €9 200
A description of this service is available on our website: www.iea.org/statistics/mods
The Monthly Gas Data Service
This service provides monthly natural gas data for OECD countries:• Supply balances in terajoules and cubic metres;• Production, trade, stock changes and levels where available, gross
inland deliveries, own use and losses;• Highly detailed trade data with about 50 import origins and export
destinations;• LNG trade detail available from January 2002;• From 2011 onwards, transit volumes are included and trade data
corresponds to entries/exits.The databases cover the time period January 1984 to current month with a time lag of two months for the most recent data.
• Monthly Gas Data Service:Historical plus 12 monthly updates Price: €800
A description of this service is available on our website: www.iea.org/statistics/mgds
Note: The prices quoted above are for single-user licences. Please consult our website for information on multi-user licence prices.
Stat ist ics publ icat ions
KEyWorld2017.indb 87 30/08/2017 14:34:17
Together
SecureSustainable
STATIST ICS
Key information
Energy balance f lows
Energy atlas
www iea org/statistics/
25 years of free statistics and historic data on oil, natural gas, coal, electricity, renewables, energy-related CO
2 emissions and more – for over 150 countries and
regions.
Interactive maps and customisable charts that offer panoramas on every aspect of energy for 150 countries and regions.
Interactive features to explore the shifts in a country’s energy balance – from production through to transformation – over
up to 40 years, showing important changes in supply mix or share of consumption.
iea onl ine
More information: [email protected]
Online_Stat_Ad_11x16_Q.indd 1 31-08-2017 11:02:18

A wealth ofENERGY
STATSat your
f ingertips
www.iea.org
IEA ENERGY STATS: download it for
free on your
iPhone, iPad,
Android device or
Windows Phone
2017
Key wor ld energy stat ist ics
of
KEyWorld2017.indb 89 30/08/2017 14:34:19
90
Oil Market Report
Each month, the primary source of data on supply, demand, stocks, prices and refining
Since its appearance in 1983, the International Energy Agency’s Oil Market Report (OMR) has become the definitive source of information on world oil market fundamentals, covering supply, demand, OECD stocks, prices and refining as well as OECD and selected non-OECD trade.The OMR provides the most extensive, up-to-date statistical data available on current world oil market trends. It is the first and exclusive source to present official government statistics from all OECD countries, as well as selected data from non-OECD countries.The main market movements of the month are highlighted in a convenient summary, while detailed analysis explains recent market developments and provides an insight into the months ahead. It is the only regular short-term analysis of the oil industry available based on information obtained from the extensive IEA network of contacts with government and industry.The OMR provides both historical data and supply/demand forecasts for the year ahead. Featuring tables, graphs and statistics, it provides all the data and analysis necessary to track the oil market and to identify trends in production, consumption, refining, inventories in OECD countries and prices for both crude and products.Additionally, subscribers to the OMR receive a copy of the annual Medium-Term Oil Market Report (MTOMR) which examines key industry themes. These include the impact of the global economic slowdown on oil demand, upstream and downstream investment levels, the likely pace of development of biofuels and non-conventional oil supplies, likely oil products availability and oil price formation. The MTOMR provides detailed supply and demand forecasts for crude oil and oil products looking five years forward, and since its inception in 2006 the report has become a standard industry reference.
To subscribe electronically, please see our website at www.oilmarketreport.org
Annual subscription rate for single electronic copy: €2 200
KEyWorld2017.indb 90 30/08/2017 14:34:19
91
World Energy Outlook 2017
The global energy scene is in a state of flux, thrown off balance by falling costs for a range of technologies, led by wind and solar, and shale oil and gas. Understanding the dynamic interplay of energy markets, technologies and policies has never been more critical. The World Energy Outlook (WEO), widely regarded as the gold standard of energy analysis, provides strategic insight on what today’s policy and investment decisions mean for long-term trends. The 2017 edition of the WEO will contain a full update of energy demand and supply projections through 2040 under different scenarios, and their consequences for energy security, economic prosperity, efficiency, investment, air quality and climate change. A vital aid to decision-makers, this year’s WEO will also include in-depth analysis of:
China’s energy outlook: China’s influence has long been felt in coal, oil and gas, as well as in nuclear power, but the country is also now firmly established as a global leader in renewable energy, efficiency and innovation. In cooperation with the newly established IEA-China Liaison Office in Beijing, the WEO will examine China’s economic and energy transitions in detail, and consider how the country’s policy choices can shape not just national prospects, but also global outcomes.
Natural gas: The outlook for gas markets is evolving rapidly under pressure from two revolutions: the shale revolution, led by the United States, and the LNG revolution that is testing traditional gas business and pricing models. It will also investigate the wider opportunities and uncertainties for gas in the transition to a cleaner energy system, including its role in tackling local pollution as well as the risk of methane emissions.
In addition, the WEO-2017 series will feature two special reports: The close links between energy and development, assessing today’s global picture for access to modern energy, the strategies and technologies that can enable countries to achieve energy for all by 2030, and the ways in which reliable energy can move communities to meet Sustainable Development Goals.
Prospects for energy in Southeast Asia, where infrastructure and investment will have to keep up with rapid, sustained growth in energy demand if the region is to build on its position as one of growth engines in Asia. The report will include coverage of the particular challenge of providing secure, clean and affordable energy to small island systems and remote settlements.
For more information please visit our website: www.worldenergyoutlook.orgOrder now at www.iea.org/books
or by emailing [email protected] Price: €150
KEyWorld2017.indb 91 30/08/2017 14:34:19

92
Notes
KEyWorld2017.indb 92 30/08/2017 14:34:19

Notes
Beyond IEA Countries
Bookshop_2017_16x23.indd 1
KEyWorld2017.indb 94 30/08/2017 14:34:20
93
95
Onl
in
e bookshopPDF versions at 20%
discountw
ww
.iea
.org/books
Inte
rnat
iona
l Energy Agency
Secure Sustain
able T
oget
her
World Energy Outlook series
World Energy
Investment series
Energy Statistics series
Energy Policiesof IEA
Countriesseries
Energy Technology
Perspectives series
E-mail: books@
iea.org
Market ReportSeries
Oil
Coal
RenewableEnergy Energy
Efficiency
Gas
Global Gas Security series
EnergyPolicies
Beyond IEA Countries
series
Bookshop_2017_16x23.indd 1 11-05-2017 17:09:11
KEyWorld2017.indb 95 30/08/2017 14:34:20
9
Please note that this publication is subject to specific restrictions that limit its use and distribution.
The terms and conditions are available online atwww.iea.org/t&c
Printed in France by Chirat, September 2017Cover design: IEA, Photo credits: © Image 100
Inside photos: Pages 13,15, 19, 27 and 31 - © PhotodiscPages 17 and 33 - © Brand X
Pages 21 and 29 - © Digital Stock
IEA/OECD possible corrigenda on: www.oecd.org/about/publishing/corrigenda.htm
This publication reflects the views of the International Energy Agency (IEA) Secretariat but does not necessarily reflect those of individual IEA member countries. The IEA makes no representation or warranty, express or implied, in respect to the publication's contents (including its completeness or
accuracy) and shall not be responsible for any use of, or reliance on, the publication.
This document and any map included herein are without prejudice to the status of or sovereignty over any territory, to the delimitation of international frontiers
and boundaries and to the name of any territory, city or area.
The paper used for this document has received certification from the Programme for the Endorsement of Forest Certification (PEFC) for being produced respecting PEFC’s ecological, social and ethical standards. PEFC is an international non-profit, non-governmental organization dedicated
to promoting Sustainable Forest Management (SFM) through independent third-party certification.
IEA Publications,International Energy Agency
Website: www.iea.org Contact information: www.iea.org/about/contact/
KEyWorld2017.indb 96 30/08/2017 14:34:20
5

31-35, rue de la Fédération
75739 Paris Cedex 15
www.iea.org