Embed Size (px)
Citation preview
Série ScientifiqueScientific Series
MontréalAvril 1997
97s-15
Liberalization, Political Riskand Stock Market Returns
in Emerging Markets
Jean-Marc Suret, Jean-François L’Her
Ce document est publié dans l’intention de rendre accessibles les résultats préliminaires de larecherche effectuée au CIRANO, afin de susciter des échanges et des suggestions. Les idées et lesopinions émises sont sous l’unique responsabilité des auteurs, et ne représentent pas nécessairementles positions du CIRANO ou de ses partenaires.This paper presents preliminary research carried out at CIRANO and aims to encouragediscussion and comment. The observations and viewpoints expressed are the sole responsibilityof the authors. They do not necessarily represent positions of CIRANO or its partners.
CIRANO
Le CIRANO est une corporation privée à but non lucratif constituée en vertu de la Loi descompagnies du Québec. Le financement de son infrastructure et de ses activités de rechercheprovient des cotisations de ses organisations-membres, d’une subvention d’infrastructure duministère de l’Industrie, du Commerce, de la Science et de la Technologie, de même que dessubventions et mandats obtenus par ses équipes de recherche. La Série Scientifique est laréalisation d’une des missions que s’est données le CIRANO, soit de développer l’analysescientifique des organisations et des comportements stratégiques.
CIRANO is a private non-profit organization incorporated under the Québec Companies Act.Its infrastructure and research activities are funded through fees paid by memberorganizations, an infrastructure grant from the Ministère de l’Industrie, du Commerce, de laScience et de la Technologie, and grants and research mandates obtained by its researchteams. The Scientific Series fulfils one of the missions of CIRANO: to develop the scientificanalysis of organizations and strategic behaviour.
Les organisations-partenaires / The Partner Organizations
•École des Hautes Études Commerciales•École Polytechnique•McGill University•Université de Montréal•Université du Québec à Montréal•Université Laval•MEQ•MICST•Avenor•Banque Nationale du Canada•Bell Québec•Caisse de dépôt et de placement du Québec•Fédération des caisses populaires Desjardins de Montréal et de l’Ouest-du-Québec•Hydro-Québec•Raymond, Chabot, Martin, Paré•Société d’électrolyse et de chimie Alcan Ltée•Téléglobe Canada•Ville de Montréal
ISSN 1198-8177
Correspondence Address: Jean-Marc Suret, CIRANO, 2020 University Street, 25th floor, Montréal,*
Qc, Canada H3A 2A5 Tel: (514) 985-4030 Fax: (514) 985-4039 e-mail: [email protected] authors gratefully acknowledge financial support from the Social Sciences and HumanitiesResearch Council of Canada and from PARADI. They thank Vicky Girard, who collected the data andconducted preliminary tests, Isabelle Côté and Stephan Smith for helpful assistance and finally KlausFischer and Cam Morrill for helpful comments on previous versions of this paper. The usual disclaimerregarding any remaining errors applies.
Université Laval, CREFA and CIRANO†
École des Hautes Études Commerciales and CIRANO‡
Liberalization, Political Risk and StockMarket Returns in Emerging Markets*
Jean-Marc Suret , Jean-François L’Her† ‡
Résumé / Abstract
Cet article propose une analyse des périodes d’hyper-rendement desmarchés boursiers émergents, de 1976 à 1994 et porte sur 20 pays. Une année dited’hyper-rendement survient lorsque, au cours de cette année, il est possibled’observer une période durant laquelle le rendement cumulé de l’indice boursierdépasse 70 %. 23 % des 279 années/pays étudiés correspondent à cette définition.Un modèle logistique incorpore des indicateurs macroéconomiques contemporains,des indicateurs du processus de libéralisation des marchés boursiers et les variationsdu niveau de risque politique. Les périodes d’hyper-rendement sont associées defaçon significative aux variations de risque politique et aux épisodes delibéralisation, mais les relations avec les changements de conditions économiquessont faibles. Un modèle prédictif est également testé, qui incorpore des mesuresagrégées des ratios cours/bénéfice et valeur comptable/valeur marchande en plus desvariations futures des conditions économiques. Dans ce cas également, lesvariations contemporaines de risque politique et les épisodes de libéralisation jouentun rôle prédominant.
In this paper, we analyze hyper-return periods from 1976 to 1994 for20 emerging stock markets. We define a hyper-return period as a calendar yearduring which a cumulative geometric return in excess of 70% is observed.According to this definition, the hyper-return periods represent 23% of the 279country-year observations examined. First, a logistic model incorporatingcontemporary macroeconomic variables, market liberalization steps andpolitical risk changes is used to explain hyper-return periods. Hyper-returnperiods are shown to be associated with political risk changes and withliberalization steps, whereas their relationship with changes in macroeconomicconditions is shown to be weak. Second, when a predictive model whereaggregate price-to-earnings and book-to-market ratios and macroeconomicvariables are used in addition to changes in political risk and liberalizationsteps, the latter variables play a predominant role.

Mots Clés : Marchés émergents, marchés boursiers, risque politique,libéralisation
Keywords : Emerging Markets, Stock Markets, Political Risk, Liberalization
JEL : G1
The Emerging Markets Data Base is provided by the International Finance Corporation,1
from the World Bank Group. See The Emerging Stock Markets Fact Book for a description of the indexcomposition and computation. The section entitled Currency Consideration of this publication providesinformation relative to the conversion of local currency to the U.S. dollar.
1
IntroductionIn the last few years emerging markets have attracted many investors. The reasonis that their stock markets generate considerable returns that have low correlationswith those of industrialized countries’ stock markets. This increases the benefits ofinternational diversification (Harvey, 1993). However, these markets are also veryvolatile (Divecha, Drach and Sefek,1992; Harvey, 1993) and a large part of theirperformance seems to be driven by a few periods with excessively high returns. Forinstance (Table 1), annual geometric returns reached 602% in Venezuela (1990),502% in Turkey (1989), 459% in Argentina (1976) and 383% in the Philippines(1986). The downside is that these high returns are often followed by large losses:-75% in Mexico (1982), -66% in Brazil (1990), -63% in Zimbabwe (1981) and-61% in Argentina (1989). These return outliers challenge both academics andpractitioners. Can these hyper-returns be predicted by time-series models thataccount for conditional volatility or for unexpected changes in economic andstructural factors? Are these returns induced by irrational factors? For practitioners,the analysis of these periods is also important because the return on an emergingmarket portfolio largely depends on the manager's ability to anticipate them. Thispaper analyzes hyper-return periods observed in a sample of emerging markets from1976 to 1994. It also provides an empirical validation of the Kim and Singal(1993) and Hartmann and Khambata (1993) hypothesis, that links high stockmarket returns to the liberalization and gradual opening of the market.
The paper is organized as follows. In the first section we describe the data andhypotheses. We devote the second part of the paper to explaining hyper-returnperiods, using a model that incorporates both liberalization and political riskvariables and macroeconomic determinants of stock market returns. In the thirdpart of the paper, we investigate whether it is possible to predict hyper-returnperiods, using aggregate stock market anomalies, naive macroeconomic forecastsand liberalization variables. The last section offers concluding comments.
1. Data and hypotheses
1.1 Return distribution analysis
We obtain monthly stock market returns, expressed in U.S. dollars, from theEmerging Market Database (EMDB) . Table 1 reports, for each of the 201
2
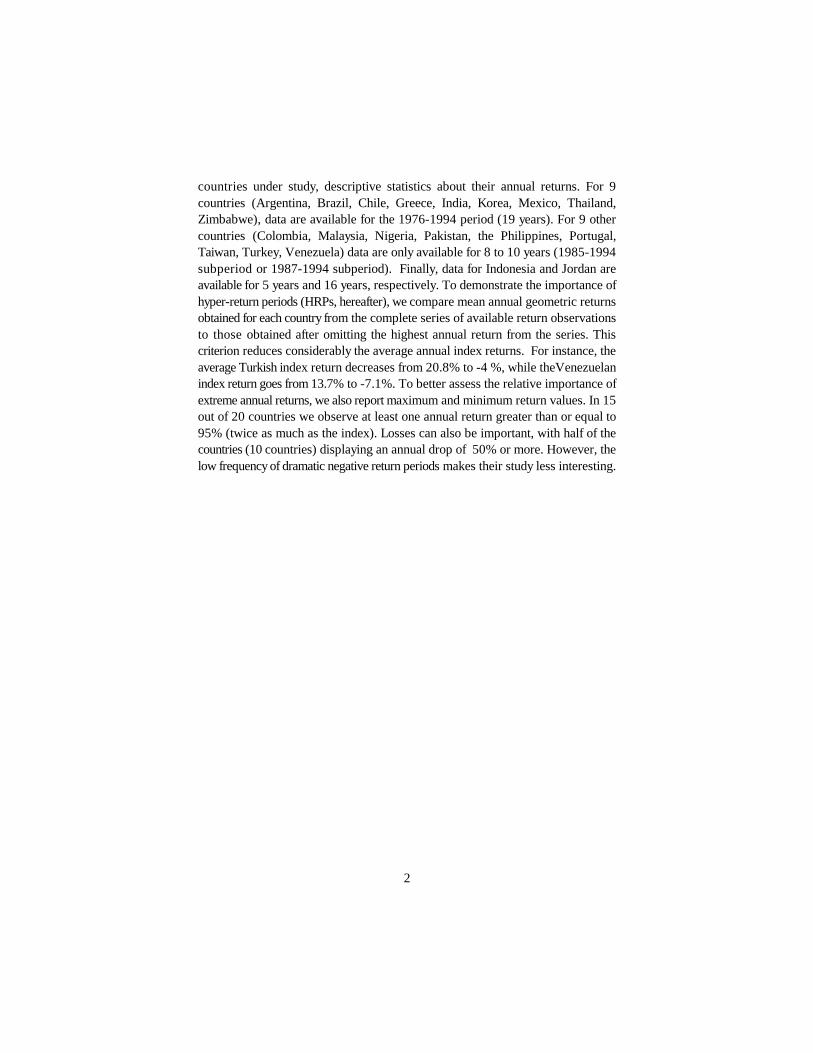
countries under study, descriptive statistics about their annual returns. For 9countries (Argentina, Brazil, Chile, Greece, India, Korea, Mexico, Thailand,Zimbabwe), data are available for the 1976-1994 period (19 years). For 9 othercountries (Colombia, Malaysia, Nigeria, Pakistan, the Philippines, Portugal,Taiwan, Turkey, Venezuela) data are only available for 8 to 10 years (1985-1994subperiod or 1987-1994 subperiod). Finally, data for Indonesia and Jordan areavailable for 5 years and 16 years, respectively. To demonstrate the importance ofhyper-return periods (HRPs, hereafter), we compare mean annual geometric returnsobtained for each country from the complete series of available return observationsto those obtained after omitting the highest annual return from the series. Thiscriterion reduces considerably the average annual index returns. For instance, theaverage Turkish index return decreases from 20.8% to -4 %, while theVenezuelanindex return goes from 13.7% to -7.1%. To better assess the relative importance ofextreme annual returns, we also report maximum and minimum return values. In 15out of 20 countries we observe at least one annual return greater than or equal to95% (twice as much as the index). Losses can also be important, with half of thecountries (10 countries) displaying an annual drop of 50% or more. However, thelow frequency of dramatic negative return periods makes their study less interesting.
Table 1Main characteristics of the distribution of annual returns of emerging stock markets, 1976-1994.
Years Average Average annual geometric Maximum First Median Third Minimumannual return quartile quartile
arithmeticreturns
Beg. Nb. Global The highest % Year % Yearannual return
is omittedArgentina 76 19 731 261 161 4586 76 1682 98 -265 -611 89Brazil 76 19 269 110 56 1704 91 698 3 -183 -657 90Chile 76 19 479 343 296 1548 86 981 450 162 -546 82Colombia 85 10 549 438 329 1913 91 786 361 122 -123 88Greece 76 19 109 10 -40 1522 87 355 -2 -272 -534 83India 76 19 197 174 139 1051 85 303 184 15 -156 87Indonesia 90 5 108 3 -169 1134 93 29 -6 -193 -423 91Jordan 79 16 109 91 67 522 81 245 16 -58 -122 84Korea 76 19 241 180 142 1128 88 392 205 -44 -380 80Malaysia 85 10 181 137 66 1029 93 279 120 -112 -215 94Mexico 76 19 331 180 143 1083 88 972 254 -48 -750 82Nigeria 85 10 186 52 -61 1909 94 378 60 -132 -567 86Pakistan 85 10 278 206 102 1721 91 207 124 64 -184 92Philippines 85 10 737 473 291 3826 86 595 494 183 -539 90Portugal 87 8 308 152 -6 2241 87 391 109 -239 -298 90Taiwan 85 10 407 278 203 1208 87 933 359 -6 -509 90Thailand 76 19 292 221 177 1382 77 407 217 -68 -322 79Turkey 87 8 1000 208 -40 5024 89 2482 -215 -473 -611 88Venezuela 85 10 597 137 -71 6016 90 526 -155 -266 -423 92Zimbabwe 76 19 262 81 31 1538 85 947 184 -195 -630 81
This admittedly arbitrary definition has been used by Frankel and Rose (1996) in their2
study of currency crashes in emerging markets. As these limits are imposed arbitrarily, a sensitivityanalysis is conducted to test the robustness of results to this definition of HRPs.
4
1.2 Defining and detecting hyper-return periods
We define HRPs as periods with returns of 70% or more. The HRPs could havebeen detected by looking at the geometric annual returns in a year. However, theplanning horizon of portfolio managers do not necessarily correspond with acalendar year or any particular 12-month period. Therefore, a two-step procedurewas used whereby HRPs were first identified and then assigned to calendar yearsas follows.
First, geometric returns were computed over a 6-month moving window over theentire sample and period available. Windows with geometric returns greater thanor equal to 70% were identified. If such returns occur once or more during acalendar year, the given year is said to be a hyper-return period. If such returnsoccur during the first three months of a calendar year, the HRP is assigned to theprevious calendar year. Using this method, 24% of the 279 country-year2
observations in the sample were identified as HRPs. Table 2 reports these HRPsby country and by year. Relatively few of these HRPs occur in the 1976-1984subperiod (except for Argentina and Chile), most appearing in the 1985-1994subperiod. The year with the most HRPs (8) is 1987 and the country with thegreatest number of HRPs (8) is Argentina.
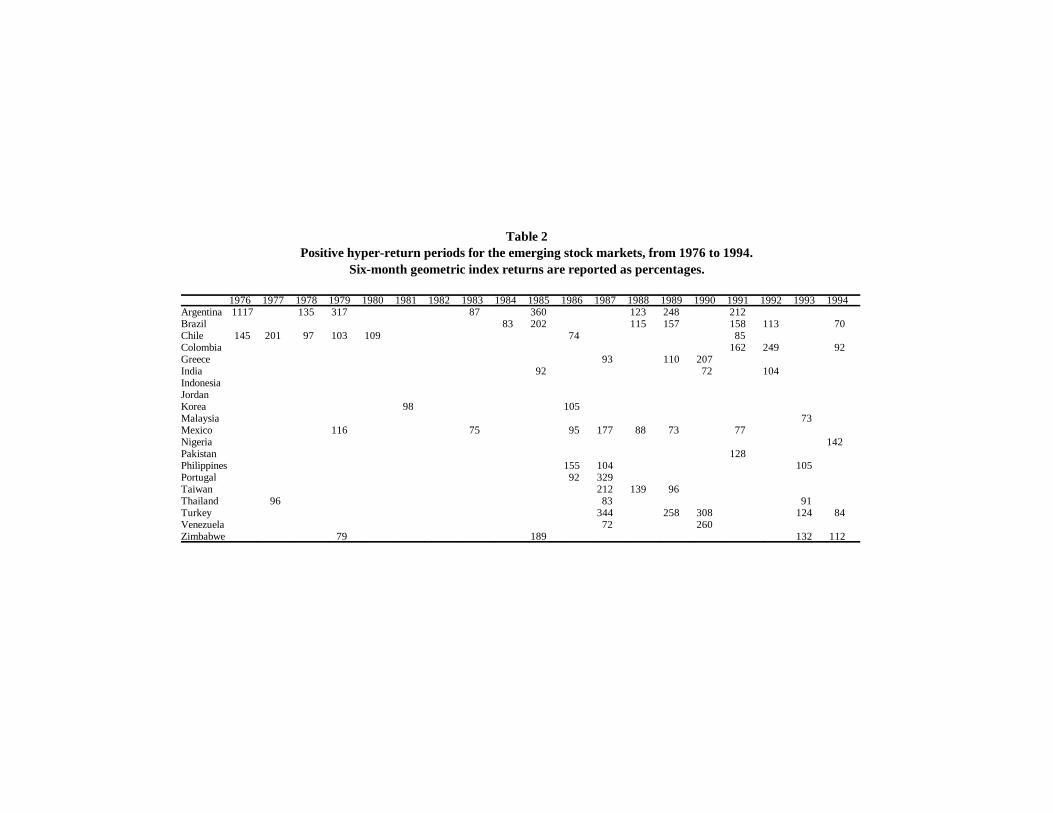
Table 2Positive hyper-return periods for the emerging stock markets, from 1976 to 1994.
Six-month geometric index returns are reported as percentages.
1976 1977 1978 1979 1980 1981 1982 1983 1984 1985 1986 1987 1988 1989 1990 1991 1992 1993 1994Argentina 1117 135 317 87 360 123 248 212 Brazil 83 202 115 157 158 113 70Chile 145 201 97 103 109 74 85 Colombia 162 249 92Greece 93 110 207 India 92 72 104IndonesiaJordanKorea 98 105Malaysia 73 Mexico 116 75 95 177 88 73 77Nigeria 142Pakistan 128Philippines 155 104 105Portugal 92 329Taiwan 212 139 96Thailand 96 83 91 Turkey 344 258 308 124 84Venezuela 72 260Zimbabwe 79 189 132 112
See Cosset and Suret (1995) for a review of previous studies on political risk.3
6
1.3 Hypotheses
A survey of the financial literature revealed relatively few studies that dealspecifically with HRPs. However, it is generally accepted that liberalization periodsare associated with high returns on market indices. Gooptu (1993) notes that“recent regulatory changes in the developing countries are creating an appropriateenvironment for attracting foreign portfolio investment flows” (p. 60). As indicatedby Hartmann and Khambata (1993, p. 92), such capital flows can lead to anincrease in stock prices. Demingûç-Kunt and Huizinga (1994) note thatrestrictions to foreign investment represent effective barriers to portfolio flows andsignificantly increase pretax equity returns. Hartmann and Khambata (1993) as wellas Kim and Singal (1993) estimate that liberalization steps increase the demand foremerging market equities from foreign investors, thus pushing up market returns.However, legal and fiscal restrictions are but two of a variety of barriers to foreigninvestment. Political risk is also an important factor in international portfoliodecisions . Political risk is a multidimensional concept which includes some3
aspects similar to those previously evoked concerning liberalization. For example,Solnik (1991) states that political transfer risk can take the form of a prohibition onrepatriation of profits and/or capital investment from a foreign country. However,Robock (1971) suggests a broader definition of political risk, including unexpecteddiscontinuities in the business environment resulting from political changes.Errunza (1983) and French and Poterba (1991), among others, acknowledge thatpolitical risk influences the international portfolio investment decision. Thus areduction in political risk might also be associated with a rapid increase in stockprices. On the basis of these studies, the central null hypothesis of this paper canbe stated as follows: There is no relationship between HRPs and either decreasesin political risk or the liberalization process.
To specify the model correctly, it is necessary to take into account other variableslikely to influence market index returns. Previous studies (Chen, Roll and Ross,1986; Bodurtha, Cho and Senbet, 1989; Ferson and Harvey, 1993) have identifiedthree main (macroeconomic) factors that can be linked to stock prices: economicactivity, unexpected inflation and interest rates. Given the difficulty of obtainingreliable and consistent data on interest rates in emerging markets, we take only thefirst two variables into account. In addition, recent studies (Easton, Harris andOhlson, 1992) have brought to light a close relationship between firms’ market andaccounting returns. In consequence, among the control variables, we include thevariation of the accounting rate of return on equity for all stocks included in the IFCindex (also provided by the EMDB). Thus, the explicative model includes
PRS, formerly Frost & Sullivan and developed by Michel O'Leary and William Coplin,4
is one of the world's leading agencies providing assessments of political risk. PRS's monthly newsletter,Political Risk Letter, publishes monthly forecasts of political risk in 85 countries. These forecasts relyon independent judgments from over 250 country experts in the United States and overseas. See Cossetand Suret (1995) for a more complete description of the data. For the two first years covered by thestudy, no political risk ratings were available. The first available ratings (1978) are thus considered toapply to previous years, i.e. we assume no variation in political risk grades for the years 1976 and 1977.
7
macroeconomic indicators, the accounting rate of return and the political risk andliberalization variables discussed above.
Our model to predict HRPs is based on previous empirical studies that associatesecurity returns to market anomalies (Fama and French, 1992). These studies weregenerally conducted at the security level. The three generally accepted marketanomalies are size, price-to-earnings ratio (PE) and price-to-book ratio (PB). Thefirst anomaly is not relevant when using aggregated data (emerging stock marketindices), but we retain the aggregate PE and PB ratios. Consequently, three groupsof variables were used to determine to what extent it is possible to anticipate HRPs.The first set of variables are the variations in political risk and liberalization stepsduring the contemporary period. Implicitly we are assuming that these variationscan be partially anticipated. The second group of variables is made up of threeindicators (variation of inflation, of Gross Domestic Product and of return on equity)during the preceding year. Finally, assuming that an analogy between marketanomalies at the stock level and market anomalies at the market level is possible,the third group of variables includes aggregate price-to-earnings (PE) and price-to-book (PB) ratios.
1.4 Measurement problems
Political risk: Monthly political risk indices relative to direct investment, asprovided by Political Risk Services (PRS), are used as measures of perceivedpolitical risk . A grade "A" for a country means low political risk exposure.4
According to Cosset and Suret (1995), international portfolio investors' politicalrisk is associated with the uncertainty of future capital controls and therefore withPRS' risk category that applies to financial transfers. Specifically, this categoryrefers to risk of financial transfers, local currency non-convertibility, and transferof foreign currency out of the country (the transfer could be for payment of exports,repatriation of profits or capital, or for any other business purpose). Political riskindices are first transformed to numerical values (see appendix 1). The relativeannual variation of the political risk level observed from December to Decemberis then calculated as )PR = ((PR - PR ) / PR ).t t t-1 t-1
8
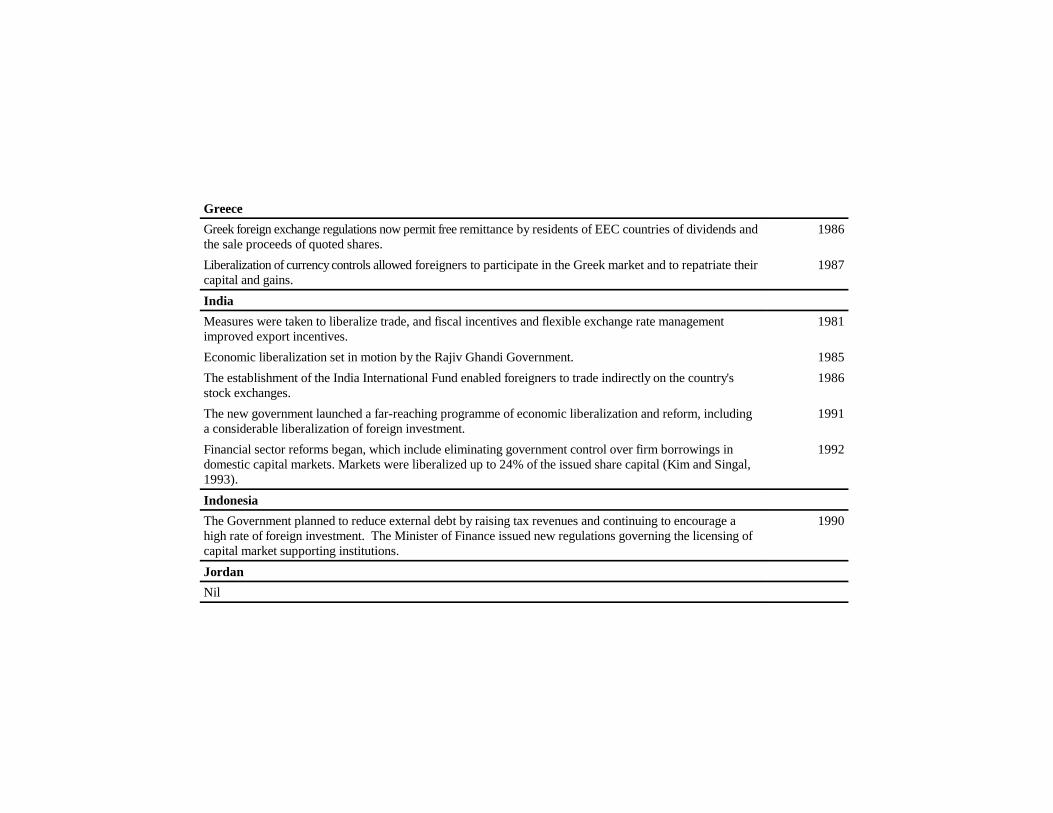
Liberalization: Taking into account steps leading to market liberalization is difficultsince there is no systematic account of these events and liberalization is often agradual process which can not easily be attributed to a specific date (Kim andSingal, 1993). A systematic survey of events linked to the liberalization ofemerging markets was thus carried out. This account is similar to that of Kim andSingal, but spans a broader group of announcements. Indeed, included in this listare all events of an economic nature likely to affect markets in a positive way:liberalization measures, debt refinancing agreements, massive privatizationinitiatives, measures to ease and stimulate investments by foreigners, etc. A binaryvariable (LIB) takes the value 1 for a given country-year when a liberalization stepis deemed to have taken place in that country during that year. When the announcedmeasures bear on many consecutive years, each of these years is attributed the value1. A list of liberalization steps and periods over which these events are expectedto have an influence is presented in appendix 2.
Control variables were obtained as follows. The Gross Domestic Product (GDP),in US $, was extracted from the Emerging Stock Markets Fact Book (variousyears, published by the International Finance Corporation, IFC), for the years 1980-1994. For 1976 to 1979 inclusively, data were taken from the United NationsStatistical Yearbook. Since data for corresponding years in both sources was notexactly identical, the data taken from the United Nations source were adjusted usingthe ratio of the 1980 GDP values taken from both sources. )GDP , the annualt
variation of the GDP, is given by ((GDP - GDP ) / GDP ). The rate of inflation,t t-1 t-1
INFL , was also taken from the Emerging Stock Markets Fact Book for the years t
1981-1994. From 1976 to 1980 inclusively, it was taken from the InternationalFinancial Statistics of the International Monetary Fund. The annual change in theinflation rate, )INFL, is given by ((INFL - INFL ) / INFL ).t t-1 t-1
The price-to-earnings (PE ) and the price-to-book value (PB ) ratios are extractedt t
from the Emerging Stock Markets Fact book. The earnings-to-book value ratiois given by (PB / PE )=EB . The annual variation of the earnings-to-book valuet t t
ratio, )EB , is calculated as follows: (EB - EB ) / EB .t t t-1 t-1
2. Methodology and results
2.1 Models
Logistic models are used to estimate the coefficients associated with a set ofindependent variables likely to explain or predict the HRP dummy variable. Thegeneral logistic model can be stated as follows:
Li ' lnPi
(1&Pi)' $1%$2Xi ,2%...%$kXi ,k
LnPi
(1&Pi ,t)' $1%$2)INFLi ,t%$3)GDPi ,t%$4)ROEi ,t%$5)PRi ,t%$6
Li ,t ' $1%$2)INFLi ,t%$3)GDPi ,t%$4)ROEi ,t%$5)PRi ,t%$6LIBi ,t
%$7)INFLi ,t%1%$8)GDPi ,t%1%$9)ROEi ,t%1
Li ' $1%$2)INFLi ,t&1%$3)GDPi ,t&1%$4)ROEi ,t&1%$5PEi ,t&1%$6PBi ,t&1
9
(1)
(2)
(3)
(4)
where P is the probability of observing a HRP during the year t for a specifici
country and X to X are the independent variables. Four models are estimated.2 k
Models 1 and 2 are descriptive, testing the relationship between HRPs andconcurrent variables, whereas Models 3 and 4 use previous years' data to predictfuture HRPs.
The following is the default model (Model 1):
where )INFL, )GDP and )ROE stand for the annual relative change in theinflation rate, in the Gross Domestic Product and in the rate of return on equity oflisted companies, respectively. )PR is the annual change in political risk and LIBis a dummy variable taking the value 1 when a liberalization step occurs and 0otherwise.
Model 2 allows for a possible expectation effect. It is possible that investorsforecast the evolution, over the following year, of indicators associated with marketreturns. Thus, variations in inflation, GDP and ROE for the year following the yearof analysis are added to model 1 and used as control variables. Model 2 can bestated as follows:
Model 3 is a simple predictive model which can be used by a portfolio managerinvesting in emerging markets:
However, this predictive model does not factor in changes in political risk and theongoing liberalization process. Model 4 takes these variables into account:
Li ' $1%$2)INFLi ,t&1%$3)GDPi ,t&1%$4)ROEi ,t&1
%$5)PRi ,t%$6LIBi ,t%$7PEi ,t&1%$8PBi ,t&1
A pair of input observations with different responses (L , L ) is said to be concordant5i j
(discordant) if the larger response has a lower (higher) predicted event probability (e /1-e ) than thex x
smaller response. If the pair is neither concordant nor discordant, it is a tie.
10
(5)
In this model, the variations in inflation, GDP and ROE are calculated for thepreceding year while the average PE and PB ratios are estimated at the end of theyear preceding the HRP. Variations in political risk are considered to be predictableand they are measured simultaneously with the HRP.
2.2 Results
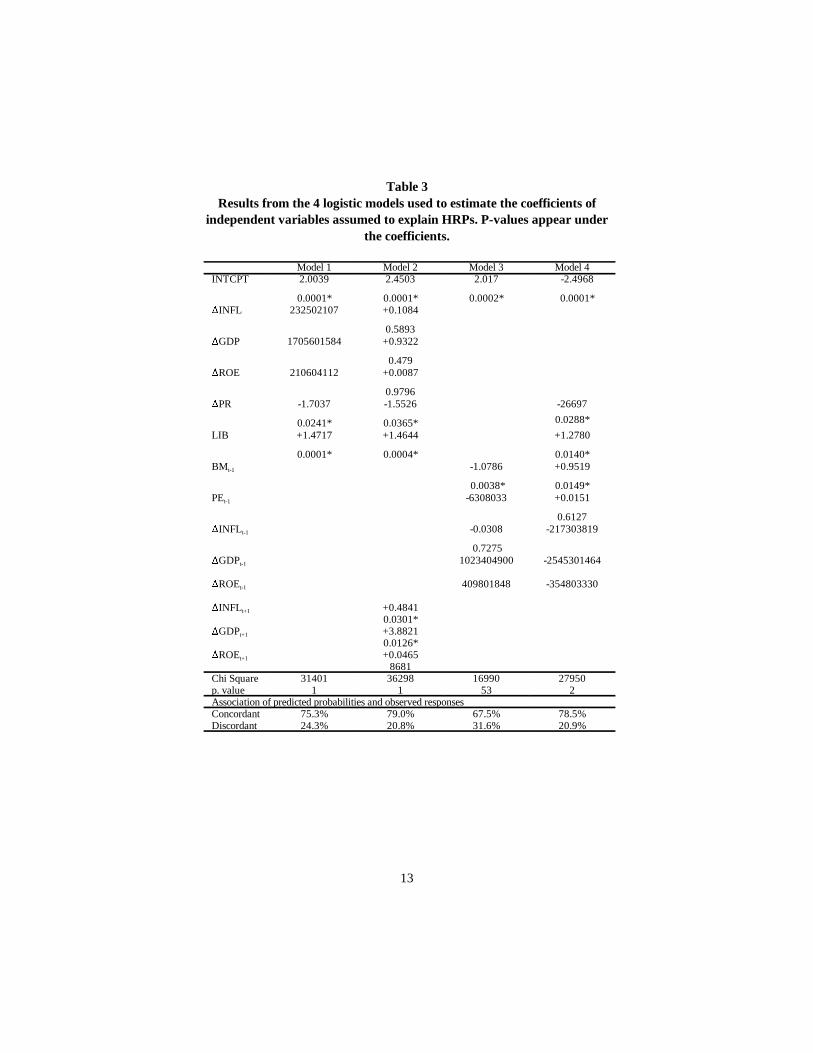
Results of the various models are reported in Table 3, where HRPs are definedaccording to the 70% limit.
Explanatory models
Models 1 and 2 show that variations in political risk as well as liberalization stepsare highly significant. In Model 1, as expected, variations in political risk arenegatively linked to the probability of observing a HRP (p-value of 0.0241), sincea decrease (increase) in this risk is considered as positive (negative) for investors.On the other hand, liberalization steps are positively associated with HRPs (p-valueof 0.0001) for they favour the inflow of foreign capital. The values of thecoefficients associated with both variables, as well as their significance levels, varyslightly when changes in control variables are introduced in the model (Model 2).
The explanatory power of variations in inflation, GDP and firms’ rates of return isweak. Indeed, none of the coefficients corresponding to these variables issignificant at the 5% level. HRPs are thus linked more to variations in regulatory orpolitical conditions than to contemporary variations in the economy (Model 1).However, the introduction of variations in inflation and GDP during the followingperiod improves the model (Model 2). Both coefficients are significant at the 5%level. Thus, HPRs seem to occur not only during periods of liberalization ordecrease in political risk, but also when agents expect an improvement in thecountry's economic performance. To test the ability of the models to correctlyclassify HRPs and non-HRPs, the percentage of concordant/discordant pairs hasbeen computed . Models 1 and 2 discriminate HRPs and non-HRPs at 75% and5
79% levels, respectively.
Predictive models
Models 3 and 4 attempt to predict HRPs. In Model 3, all variables are measured
11
before the HRP. Only the BM variable (book-to-market ratio) plays a significantrole and predicts, to a certain extent, HRPs. It is negatively related to HRPs and hasa p-value of 0.0038. This result is identical to that observed by Fama and French(1992) at the security level. In Model 4, the inclusion of variables linked toliberalization steps and to variations in political risk contemporary to HRPsappreciably improves the model, whose chi-square increases from 16.6% to27.95%. Their inclusion, however, changes the sign of the BM coefficient. Theability of both models to correctly classify HRPs and non-HRPs is reducedcompared to Models 1 and 2. However, the percentages of concordant/discordantpairs are still 67.5 % (Model 3) and 78,7% (Model 4).
Sensitivity analysis
In order to test the robustness of the previous results, the four models were re-estimated redefining HRPs as periods with 50% and 90% six-month geometricreturns. When the definition is relaxed (50% level), the only notable difference isthe fact that political risk variation no longer plays a significant role in theexplanatory models (Models 1 and 2). Liberalization steps still play an importantrole. The relaxed definition of HRPs also weakens the performance of predictivemodels. On the other hand, when the definition of HRPs is made more restrictive(geometric returns of 90%), the validity of the models is reinforced, both overall andin terms of the variables’ significance levels. With that exception, results areidentical to those reported in Table 3.
3. Concluding remarks
Extreme returns obtained on emerging stock markets and their low correlation withdeveloped markets’ returns have attracted many investors. However, their volatilityhas also discouraged many of them. We examined whether hyper-return periodsobserved in emerging stock markets are associated with three different sets offundamental variables: 1) the liberalization process and changes in political risk; 2)macroeconomic indicators (variations in inflation, in Gross Domestic Product andin aggregate returns on equity); and 3) market anomalies transposed to the marketlevel (price-to-earnings ratio and price-to-book ratio).
We find evidence that financial liberalization and changes in political risk are thevariables that have the strongest impact on stock market returns and the existenceof hyper-return periods. The positive effect of liberalization on emerging stockmarkets is consistent with an increase in foreign investment. This result is ofparticular interest because the implementation of liberalization processes in
12
emerging markets could alternatively have induced capital outflows (Kim andSingal, 1993) or complicated macroeconomic adjustment policies to capital flows(Corbo and Hernandez, 1993).
Macroeconomic indicators play a role in explaining hyper-return periods only ifinvestors are able to correctly predict the future inflation rates or Gross DomesticProducts. However, return on equity does not help to identify hyper-return periods.Finally, aggregate market anomalies are not good predictors of hyper-return periods.While the price-to-book ratio is significant and of the expected sign when usedalone, it provides no incremental explanatory power when the political risk andliberalization variables are included in the model.
Thus, liberalization and political risk dominate other variables in identifying hyper-return periods in 20 emerging stock markets over the 1976-1994 period. However,macroeconomic variables as well as return on equity, price-to-earnings and price-to-book ratios are not free from measurement problems. The three latter variablesare computed from detailed data about individual stocks from emerging stockmarkets. The reliability of these data is sometimes questionable. In addition,emerging stock market returns are driven by very few firms and the huge returnsobserved on emerging markets may be due to the strategic and comparativeadvantages of these firms on the international markets. The success factors of thesefirms are not considered in the paper. Finally, the paper focuses upon fundamentalfactors likely to explain hyper-return periods in emerging stock markets. However,these returns can be greatly affected by the considerable capital flows which aregoverned more by speculative and short-term interests than by investment decisionsbased on fundamentals.
13
Table 3Results from the 4 logistic models used to estimate the coefficients of
independent variables assumed to explain HRPs. P-values appear underthe coefficients.
Model 1 Model 2 Model 3 Model 4INTCPT 2.0039 2.4503 2.017 -2.4968
0.0001* 0.0001* 0.0002* 0.0001*)INFL 232502107 +0.1084
0.5893)GDP 1705601584 +0.9322
0.479)ROE 210604112 +0.0087
0.9796)PR -1.7037 -1.5526 -26697
0.0241* 0.0365* 0.0288*
LIB +1.4717 +1.4644 +1.2780
0.0001* 0.0004* 0.0140*BM -1.0786 +0.9519t-1
0.0038* 0.0149*PE -6308033 +0.0151t-1
0.6127)INFL -0.0308 -217303819t-1
0.7275)GDP 1023404900 -2545301464t-1
)ROE 409801848 -354803330t-1
)INFL +0.4841t+1
0.0301*)GDP +3.8821t+1
0.0126*)ROE +0.0465t+1
8681Chi Square 31401 36298 16990 27950p. value 1 1 53 2Association of predicted probabilities and observed responsesConcordant 75.3% 79.0% 67.5% 78.5%Discordant 24.3% 20.8% 31.6% 20.9%
14
ReferencesBodurtha, J.N., D.C. Cho and L.W. Senbet (1989), "Economic Forces and the StockMarket: An International Perspective", The Global Finance Journal 1: 21-46.
Chen, N., R. Roll and S.A. Ross (1986), "Economic Forces and the Stock Market",Journal of Business 59: 383-403.
Corbo, V. and L. Hernandez (1993), "Macroeconomic Adjustments to CapitalInflows: Rationale and Some Recent Experiences ", in S. Claessens and S. Gooptu,eds. Portfolio Investment in Developing Countries, Discussion Paper n 228, Theo
World Bank,Washington, D.C.: 353-381.
Cosset, J.C. and J.M. Suret (1995), "Political Risk and the Benefits of InternationalDiversification", Journal of International Business Study, second quarter: 301-318.
Demingûç-Kunt, A. and H. Huizinga, Portfolio Investments in Emerging StockMarkets: Direct and Indirect Barriers, in S. Claessens and S. Gooptu, eds.Portfolio Investment in Developing Countries, Discussion Paper n 228, The Worldo
Bank, Washington, D.C.: 308-312.
Divecha, A.B., J. Drach and D. Sefek (1992), "Emerging Markets: A QuantitativePerspective", The Journal of Portfolio Management, Fall: 41-51.
Easton, P.D., T.S. Harris and J.A. Ohlson (1992), "Aggregate Accounting EarningsCan Explain Most of Security Returns", Journal of Accounting and Economics 15:119-142.
Errunza, V.R. (1983), "Emerging Markets: A New Opportunity for ImprovingGlobal Portfolio Performance", Financial Analyst Journal, September-October:51-58.
Fama, E.F. and K.R. French (1992), "The Cross-Section of Expected StockReturns", Journal of Finance 47, June: 427-465.
Ferson, W.E and C.R. Harvey (1993), The Risk and Predictability of InternationalEquity Returns, Working paper, Washington University, May.
Frankel, E.A. and A. Rose (1996), Currency Crashes in Emerging Markets: AnEmpirical Treatment, International Finance Discussion Papers 534, Washington:Board of Governors of the Federal Reserve System, January.
French, K.R. and J.M. Poterba (1991), "Investor Diversification and InternationalEquity Markets", American Economic Review, May: 222-226.
Gooptu, S. (1993), "Portfolio Investment Flows to Emerging Markets" in S.Claessens and S. Gooptu, eds. Portfolio Investment in Developing Countries,Discussion Paper n 228, The World Bank, Washington, D.C.: 45-77.o
Harvey, C.R. (1993), Predictable Risk and Returns in Emerging Markets, Workingpaper, Duke University, September.
Hartmann, M.A. and D. Khambata (1993), "Emerging Stock Markets: InvestmentStrategies of the Future", The Columbia Journal of Word Business, Summer: 104.
International Finance Corporation, Emerging Stock Markets Factbook,Washington, D.C., various years.
15
International Monetary Fund, International Financial Statistics, various years.
Kim E.H. and V. Singal (1993), "Opening Up of Stock Markets by EmergingMarkets: Effects of Portfolio Flows and Volatility of Stock Prices", in S. Claessensand S. Gooptu, eds. Portfolio Investment in Developing Countries, DiscussionPaper n 228, The World Bank, Washington, D.C.: 383-425.o
Robock, S.H. (1971), "Political Risk: Identification and Assessment", ColumbiaJournal of World Business", July-August: 6-20.
Solnik, B. (1991), International Investment (2 edition), Addison-Wesley.nd
United Nations, United Nations Statistical Yearbook, New York, various years.
16
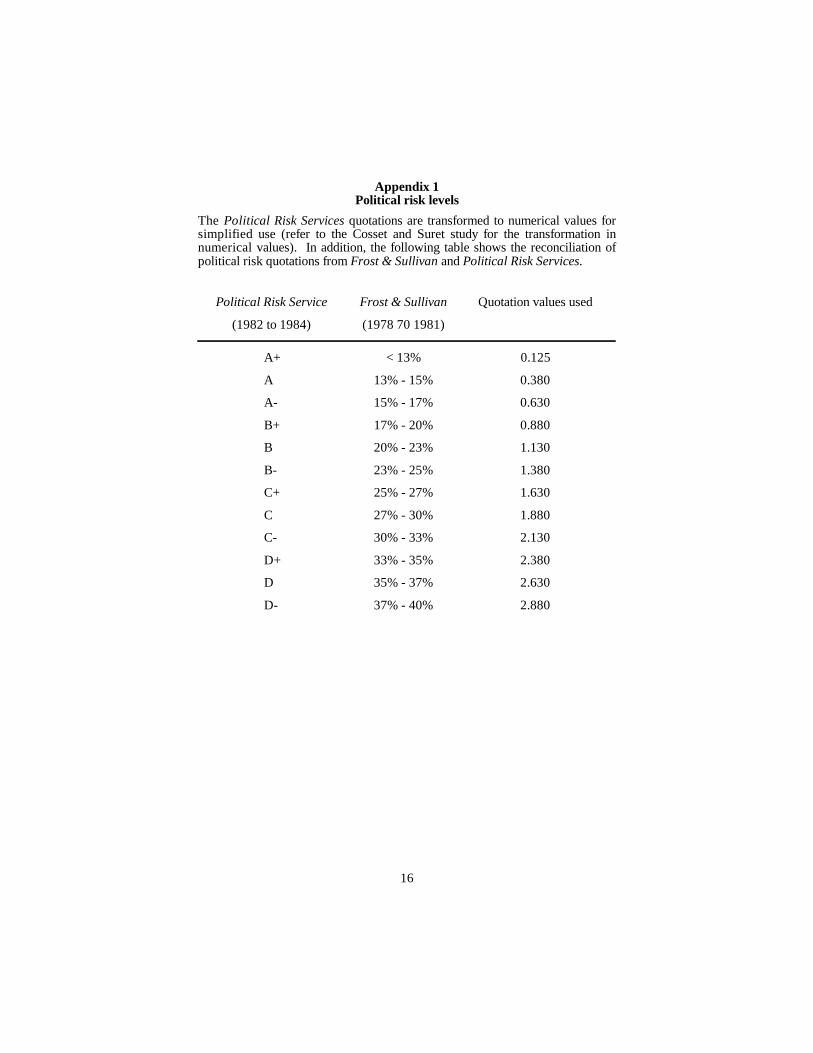
Appendix 1Political risk levels
The Political Risk Services quotations are transformed to numerical values forsimplified use (refer to the Cosset and Suret study for the transformation innumerical values). In addition, the following table shows the reconciliation ofpolitical risk quotations from Frost & Sullivan and Political Risk Services.
Political Risk Service Frost & Sullivan Quotation values used
(1982 to 1984) (1978 70 1981)
A+ < 13% 0.125
A 13% - 15% 0.380
A- 15% - 17% 0.630
B+ 17% - 20% 0.880
B 20% - 23% 1.130
B- 23% - 25% 1.380
C+ 25% - 27% 1.630
C 27% - 30% 1.880
C- 30% - 33% 2.130
D+ 33% - 35% 2.380
D 35% - 37% 2.630
D- 37% - 40% 2.880
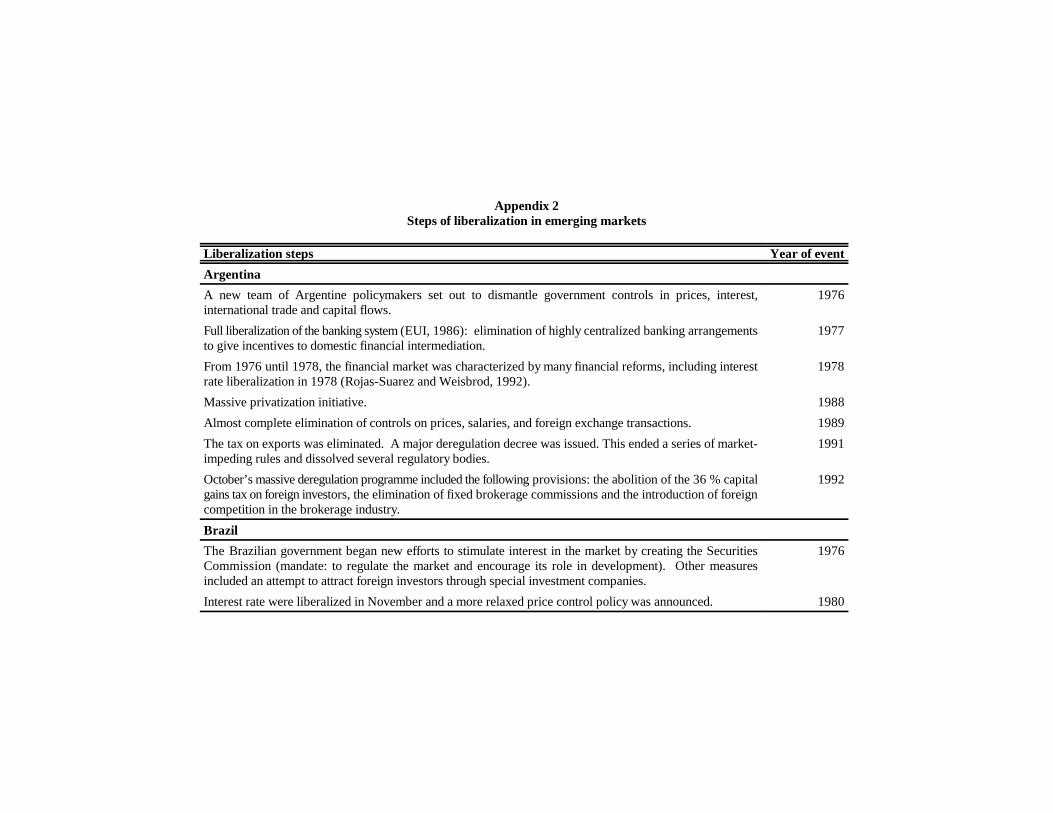
Appendix 2Steps of liberalization in emerging markets
Liberalization steps Year of event
Argentina
A new team of Argentine policymakers set out to dismantle government controls in prices, interest, 1976international trade and capital flows.
Full liberalization of the banking system (EUI, 1986): elimination of highly centralized banking arrangements 1977to give incentives to domestic financial intermediation.
From 1976 until 1978, the financial market was characterized by many financial reforms, including interest 1978rate liberalization in 1978 (Rojas-Suarez and Weisbrod, 1992).
Massive privatization initiative. 1988
Almost complete elimination of controls on prices, salaries, and foreign exchange transactions. 1989
The tax on exports was eliminated. A major deregulation decree was issued. This ended a series of market- 1991impeding rules and dissolved several regulatory bodies.
October’s massive deregulation programme included the following provisions: the abolition of the 36 % capital 1992gains tax on foreign investors, the elimination of fixed brokerage commissions and the introduction of foreigncompetition in the brokerage industry.
Brazil
The Brazilian government began new efforts to stimulate interest in the market by creating the Securities 1976Commission (mandate: to regulate the market and encourage its role in development). Other measuresincluded an attempt to attract foreign investors through special investment companies.
Interest rate were liberalized in November and a more relaxed price control policy was announced. 1980
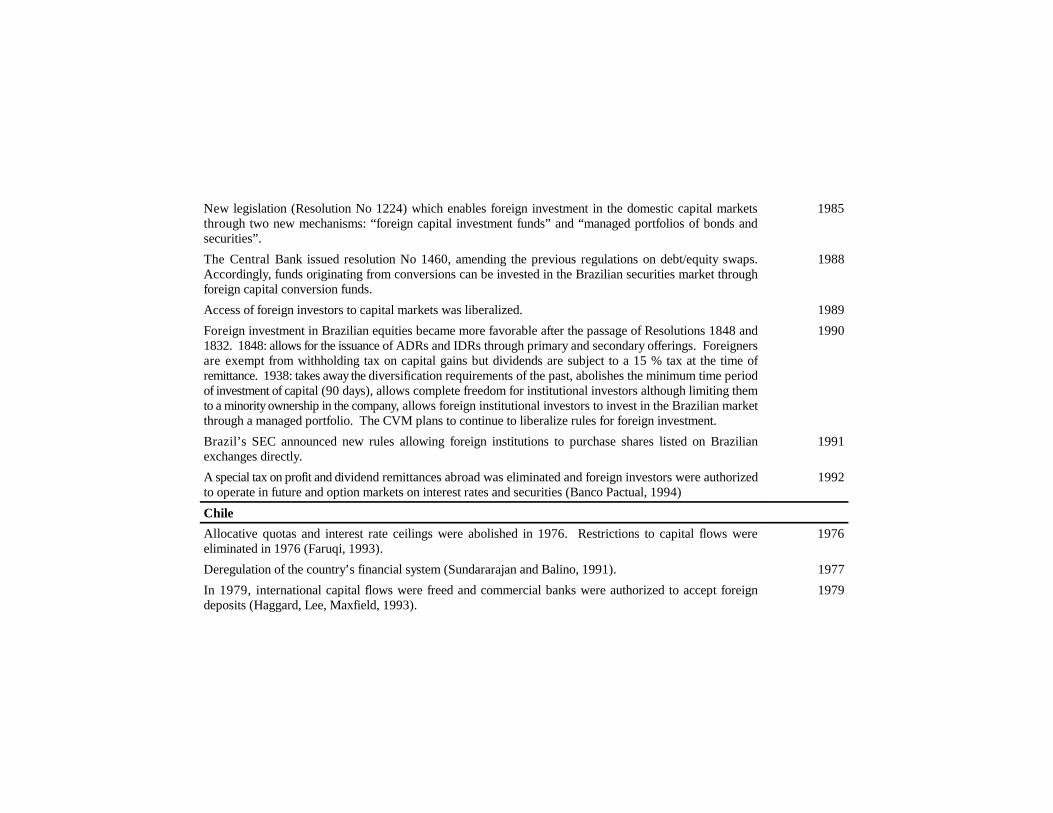
New legislation (Resolution No 1224) which enables foreign investment in the domestic capital markets 1985through two new mechanisms: “foreign capital investment funds” and “managed portfolios of bonds andsecurities”.
The Central Bank issued resolution No 1460, amending the previous regulations on debt/equity swaps. 1988Accordingly, funds originating from conversions can be invested in the Brazilian securities market throughforeign capital conversion funds.
Access of foreign investors to capital markets was liberalized. 1989
Foreign investment in Brazilian equities became more favorable after the passage of Resolutions 1848 and 19901832. 1848: allows for the issuance of ADRs and IDRs through primary and secondary offerings. Foreignersare exempt from withholding tax on capital gains but dividends are subject to a 15 % tax at the time ofremittance. 1938: takes away the diversification requirements of the past, abolishes the minimum time periodof investment of capital (90 days), allows complete freedom for institutional investors although limiting themto a minority ownership in the company, allows foreign institutional investors to invest in the Brazilian marketthrough a managed portfolio. The CVM plans to continue to liberalize rules for foreign investment.
Brazil’s SEC announced new rules allowing foreign institutions to purchase shares listed on Brazilian 1991exchanges directly.
A special tax on profit and dividend remittances abroad was eliminated and foreign investors were authorized 1992to operate in future and option markets on interest rates and securities (Banco Pactual, 1994)
Chile
Allocative quotas and interest rate ceilings were abolished in 1976. Restrictions to capital flows were 1976eliminated in 1976 (Faruqi, 1993).
Deregulation of the country’s financial system (Sundararajan and Balino, 1991). 1977
In 1979, international capital flows were freed and commercial banks were authorized to accept foreign 1979deposits (Haggard, Lee, Maxfield, 1993).
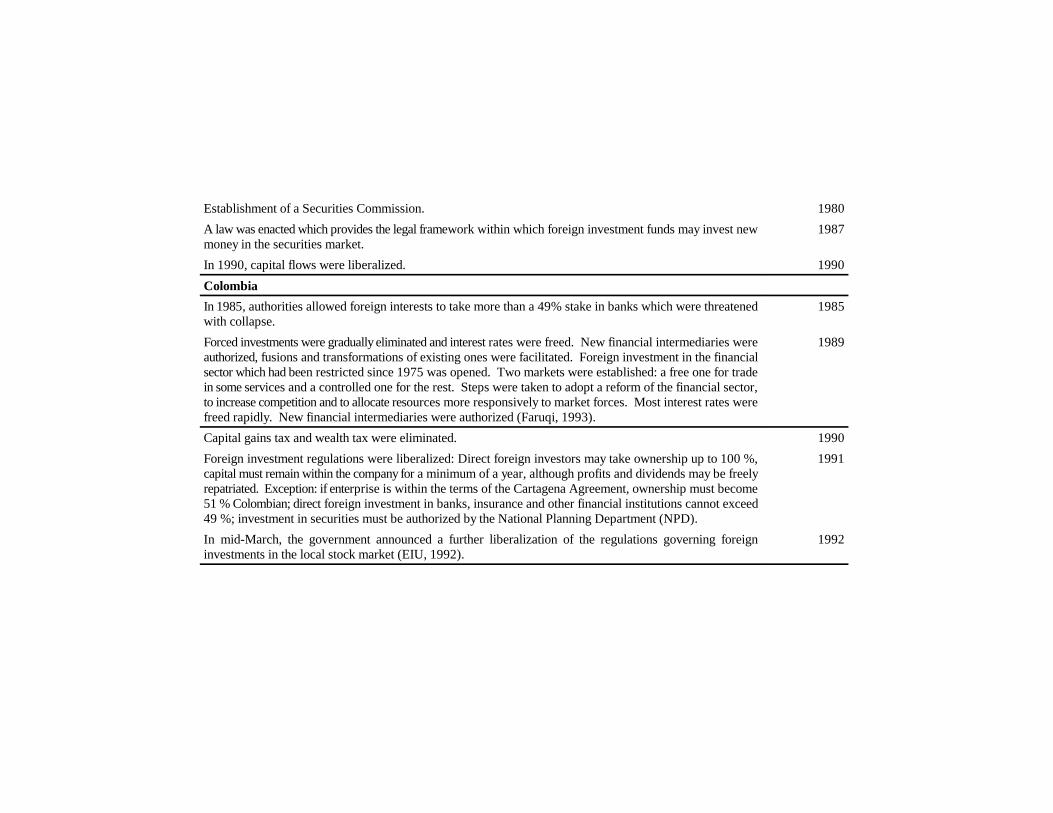
Establishment of a Securities Commission. 1980
A law was enacted which provides the legal framework within which foreign investment funds may invest new 1987money in the securities market.
In 1990, capital flows were liberalized. 1990
Colombia
In 1985, authorities allowed foreign interests to take more than a 49% stake in banks which were threatened1985with collapse.
Forced investments were gradually eliminated and interest rates were freed. New financial intermediaries were 1989authorized, fusions and transformations of existing ones were facilitated. Foreign investment in the financialsector which had been restricted since 1975 was opened. Two markets were established: a free one for tradein some services and a controlled one for the rest. Steps were taken to adopt a reform of the financial sector,to increase competition and to allocate resources more responsively to market forces. Most interest rates werefreed rapidly. New financial intermediaries were authorized (Faruqi, 1993).
Capital gains tax and wealth tax were eliminated. 1990
Foreign investment regulations were liberalized: Direct foreign investors may take ownership up to 100 %, 1991capital must remain within the company for a minimum of a year, although profits and dividends may be freelyrepatriated. Exception: if enterprise is within the terms of the Cartagena Agreement, ownership must become51 % Colombian; direct foreign investment in banks, insurance and other financial institutions cannot exceed49 %; investment in securities must be authorized by the National Planning Department (NPD).
In mid-March, the government announced a further liberalization of the regulations governing foreign 1992investments in the local stock market (EIU, 1992).
Greece
Greek foreign exchange regulations now permit free remittance by residents of EEC countries of dividends and1986the sale proceeds of quoted shares.
Liberalization of currency controls allowed foreigners to participate in the Greek market and to repatriate their 1987capital and gains.
India
Measures were taken to liberalize trade, and fiscal incentives and flexible exchange rate management 1981improved export incentives.
Economic liberalization set in motion by the Rajiv Ghandi Government. 1985
The establishment of the India International Fund enabled foreigners to trade indirectly on the country's 1986stock exchanges.
The new government launched a far-reaching programme of economic liberalization and reform, including 1991a considerable liberalization of foreign investment.
Financial sector reforms began, which include eliminating government control over firm borrowings in 1992domestic capital markets. Markets were liberalized up to 24% of the issued share capital (Kim and Singal,1993).
Indonesia
The Government planned to reduce external debt by raising tax revenues and continuing to encourage a 1990high rate of foreign investment. The Minister of Finance issued new regulations governing the licensing ofcapital market supporting institutions.
Jordan
Nil
Korea
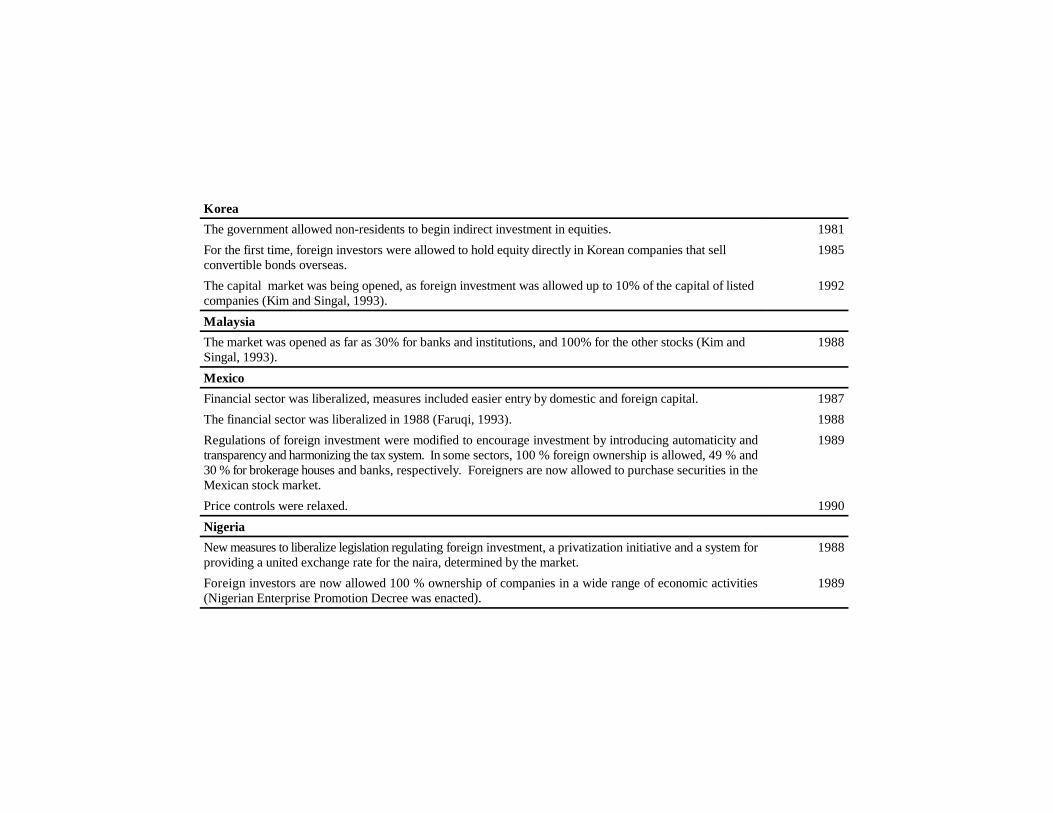
The government allowed non-residents to begin indirect investment in equities. 1981
For the first time, foreign investors were allowed to hold equity directly in Korean companies that sell 1985convertible bonds overseas.
The capital market was being opened, as foreign investment was allowed up to 10% of the capital of listed 1992companies (Kim and Singal, 1993).
Malaysia
The market was opened as far as 30% for banks and institutions, and 100% for the other stocks (Kim and 1988Singal, 1993).
Mexico
Financial sector was liberalized, measures included easier entry by domestic and foreign capital. 1987
The financial sector was liberalized in 1988 (Faruqi, 1993). 1988
Regulations of foreign investment were modified to encourage investment by introducing automaticity and 1989transparency and harmonizing the tax system. In some sectors, 100 % foreign ownership is allowed, 49 % and30 % for brokerage houses and banks, respectively. Foreigners are now allowed to purchase securities in theMexican stock market.
Price controls were relaxed. 1990
Nigeria
New measures to liberalize legislation regulating foreign investment, a privatization initiative and a system for 1988providing a united exchange rate for the naira, determined by the market.
Foreign investors are now allowed 100 % ownership of companies in a wide range of economic activities 1989(Nigerian Enterprise Promotion Decree was enacted).
Pakistan
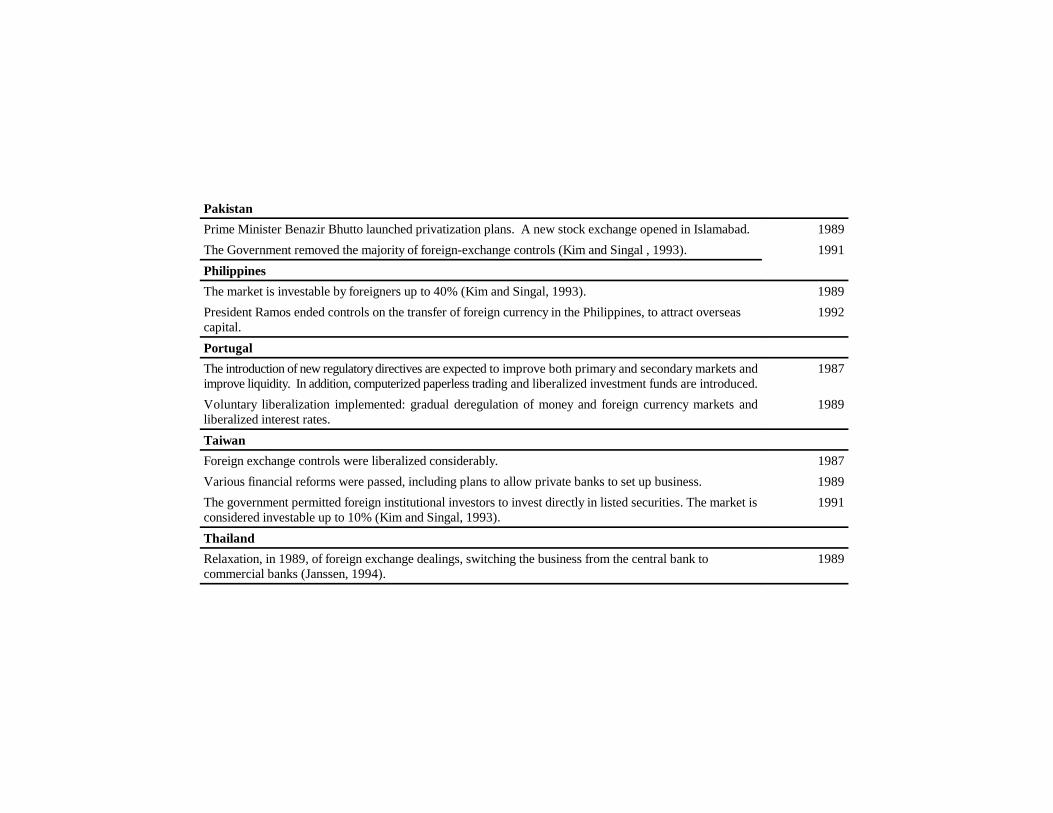
Prime Minister Benazir Bhutto launched privatization plans. A new stock exchange opened in Islamabad. 1989
The Government removed the majority of foreign-exchange controls (Kim and Singal , 1993). 1991
Philippines
The market is investable by foreigners up to 40% (Kim and Singal, 1993). 1989
President Ramos ended controls on the transfer of foreign currency in the Philippines, to attract overseas 1992capital.
Portugal
The introduction of new regulatory directives are expected to improve both primary and secondary markets and 1987improve liquidity. In addition, computerized paperless trading and liberalized investment funds are introduced.
Voluntary liberalization implemented: gradual deregulation of money and foreign currency markets and 1989liberalized interest rates.
Taiwan
Foreign exchange controls were liberalized considerably. 1987
Various financial reforms were passed, including plans to allow private banks to set up business. 1989
The government permitted foreign institutional investors to invest directly in listed securities. The market is 1991considered investable up to 10% (Kim and Singal, 1993).
Thailand
Relaxation, in 1989, of foreign exchange dealings, switching the business from the central bank to 1989commercial banks (Janssen, 1994).
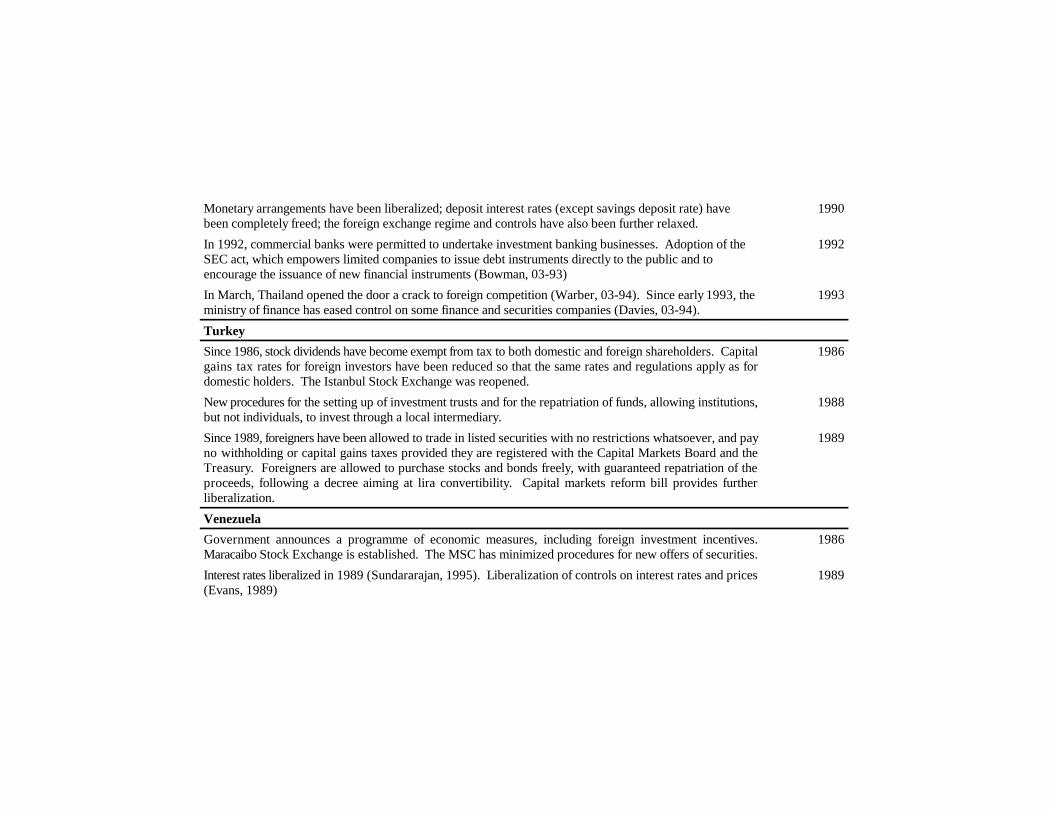
Monetary arrangements have been liberalized; deposit interest rates (except savings deposit rate) have 1990been completely freed; the foreign exchange regime and controls have also been further relaxed.
In 1992, commercial banks were permitted to undertake investment banking businesses. Adoption of the 1992SEC act, which empowers limited companies to issue debt instruments directly to the public and toencourage the issuance of new financial instruments (Bowman, 03-93)
In March, Thailand opened the door a crack to foreign competition (Warber, 03-94). Since early 1993, the 1993ministry of finance has eased control on some finance and securities companies (Davies, 03-94).
Turkey
Since 1986, stock dividends have become exempt from tax to both domestic and foreign shareholders. Capital1986gains tax rates for foreign investors have been reduced so that the same rates and regulations apply as fordomestic holders. The Istanbul Stock Exchange was reopened.
New procedures for the setting up of investment trusts and for the repatriation of funds, allowing institutions, 1988but not individuals, to invest through a local intermediary.
Since 1989, foreigners have been allowed to trade in listed securities with no restrictions whatsoever, and pay1989no withholding or capital gains taxes provided they are registered with the Capital Markets Board and theTreasury. Foreigners are allowed to purchase stocks and bonds freely, with guaranteed repatriation of theproceeds, following a decree aiming at lira convertibility. Capital markets reform bill provides furtherliberalization.
Venezuela
Government announces a programme of economic measures, including foreign investment incentives. 1986Maracaibo Stock Exchange is established. The MSC has minimized procedures for new offers of securities.
Interest rates liberalized in 1989 (Sundararajan, 1995). Liberalization of controls on interest rates and prices 1989(Evans, 1989)
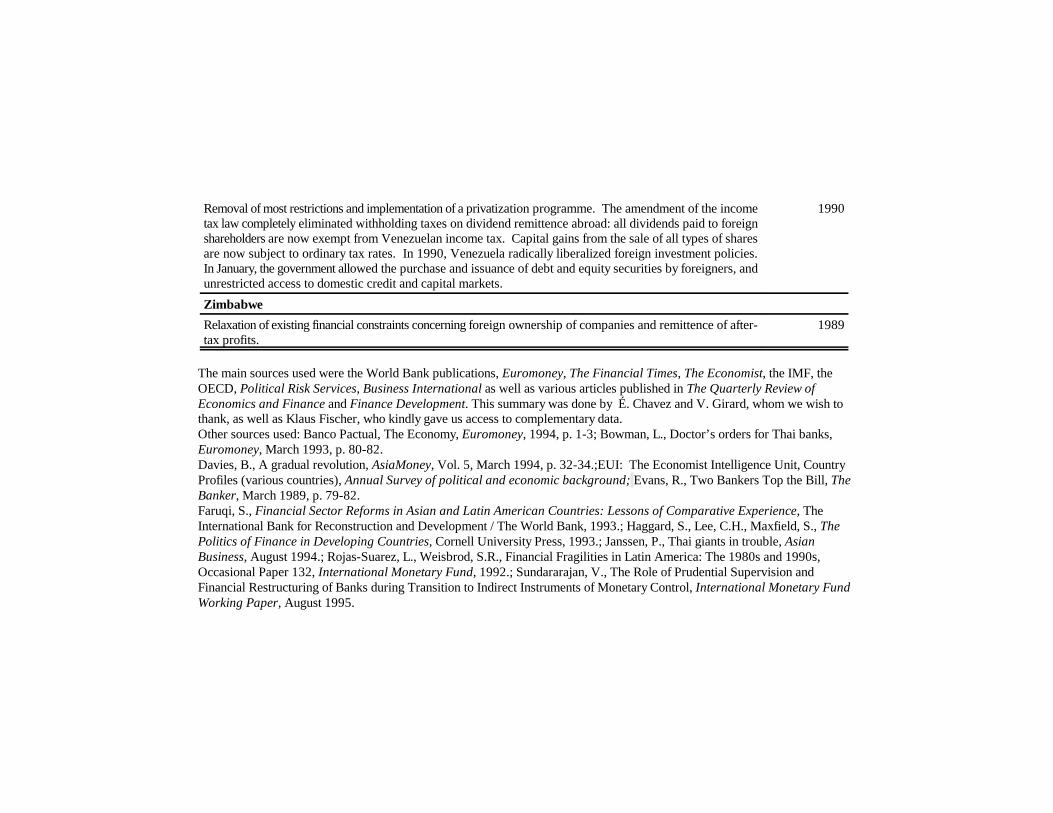
Removal of most restrictions and implementation of a privatization programme. The amendment of the income 1990tax law completely eliminated withholding taxes on dividend remittence abroad: all dividends paid to foreignshareholders are now exempt from Venezuelan income tax. Capital gains from the sale of all types of sharesare now subject to ordinary tax rates. In 1990, Venezuela radically liberalized foreign investment policies.In January, the government allowed the purchase and issuance of debt and equity securities by foreigners, andunrestricted access to domestic credit and capital markets.
Zimbabwe
Relaxation of existing financial constraints concerning foreign ownership of companies and remittence of after- 1989tax profits.
The main sources used were the World Bank publications, Euromoney, The Financial Times, The Economist, the IMF, theOECD, Political Risk Services, Business International as well as various articles published in The Quarterly Review ofEconomics and Finance and Finance Development. This summary was done by É. Chavez and V. Girard, whom we wish tothank, as well as Klaus Fischer, who kindly gave us access to complementary data.Other sources used: Banco Pactual, The Economy, Euromoney, 1994, p. 1-3; Bowman, L., Doctor’s orders for Thai banks,Euromoney, March 1993, p. 80-82.Davies, B., A gradual revolution, AsiaMoney, Vol. 5, March 1994, p. 32-34.;EUI: The Economist Intelligence Unit, CountryProfiles (various countries), Annual Survey of political and economic background; Evans, R., Two Bankers Top the Bill, TheBanker, March 1989, p. 79-82.Faruqi, S., Financial Sector Reforms in Asian and Latin American Countries: Lessons of Comparative Experience, TheInternational Bank for Reconstruction and Development / The World Bank, 1993.; Haggard, S., Lee, C.H., Maxfield, S., ThePolitics of Finance in Developing Countries, Cornell University Press, 1993.; Janssen, P., Thai giants in trouble, AsianBusiness, August 1994.; Rojas-Suarez, L., Weisbrod, S.R., Financial Fragilities in Latin America: The 1980s and 1990s,Occasional Paper 132, International Monetary Fund, 1992.; Sundararajan, V., The Role of Prudential Supervision andFinancial Restructuring of Banks during Transition to Indirect Instruments of Monetary Control, International Monetary FundWorking Paper, August 1995.
Sundararajan, V., Balino, T. J.T., Banking Crises: Cases and Issues, International Monetary Fund, 1991.;Warner, A., Toughtimes for the Thai, The Banker, Vol. 144, March 1994, p. 64-67.
Vous pouvez consulter la liste complète des publications du CIRANO et les publications elles-mêmes%
sur notre site World Wide Web à l'adresse suivante :http://www.cirano.umontreal.ca/publication/page1.html
Liste des publications au CIRANO %%
Cahiers CIRANO / CIRANO Papers (ISSN 1198-8169)
96c-1 Peut-on créer des emplois en réglementant le temps de travail ? / par Robert Lacroix
95c-2 Anomalies de marché et sélection des titres au Canada / par Richard Guay, Jean-François L'Her et Jean-Marc Suret
95c-1 La réglementation incitative / par Marcel Boyer
94c-3 L'importance relative des gouvernements : causes, conséquences et organisationsalternative / par Claude Montmarquette
94c-2 Commercial Bankruptcy and Financial Reorganization in Canada / par Jocelyn Martel
94c-1 Faire ou faire faire : La perspective de l'économie des organisations / par Michel Patry
Série Scientifique / Scientific Series (ISSN 1198-8177)
97s-15 Liberalization, Political Risk and Stock Market Returns in Emerging Markets /Jean-Marc Suret, Jean-François L’Her
97s-14 Methods of Pay and Earnings: A Longitudinal Analysis / Daniel Parent
97s-13 A Note on Hedging in ARCH and Stochastic Volatility Option Pricing Models / RenéGarcia et Éric Renault
97s-12 Equilibrium Asset Prices and No-Arbitrage with Portfolio Constraints / Jérôme B.Detemple et Shashidhar Murthy
97s-11 Aggregation, Efficiency and Mutual Fund Separation in Incomplete Markets / JérômeB. Detemple et Piero Gottardi
97s-10 Global Strategic Benchmarking, Critical Capabilities and Performance of AerospaceSubcontractors / Élisabeth Lefebvre, Louis A. Lefebvre
97s-09 Reported Job Satisfaction: What Does It Mean? / Louis Lévy-Garboua, ClaudeMontmarquette
97s-08 Living on a Noisy and Dusty Street: Implications for Environmental Evaluation /Tagreed Boules, Robert Gagné et Paul Lanoie
97s-07 The Location of Comparative Advantages on the Basis of Fundamentals Only / Thijsten Raa et Pierre Mohnen
97s-06 GARCH for Irregularly Spaced Financial Data: The ACD-GARCH Model / EricGhysels, Joanna Jasiak
97s-05 Can Capital Markets Create Incentives for Pollution Control? / Paul Lanoie, BenoîtLaplante et Maité Roy
97s-04 La régie des services informatiques : Le rôle de la mesure et des compétences dans lesdécisions d’impartition / Benoit A. Aubert, Suzanne Rivard et Michel Patry
97s-03 Competition and Access in Telecoms: ECPR, Global Price Caps, and Auctions / MarcelBoyer


![SYNOPSIS OF 2011 - IN.govSECTION 86, IC 6-3-4-1.5 [EFFECTIVE JULY 1, 2011] – requires a professional preparer who files more than 50 returns in 2012 and more than 10 returns in 2013](https://img.pdfslide.fr/doc/110x75/5ed30a75aaf3a803270b5e38/synopsis-of-2011-ingov-section-86-ic-6-3-4-15-effective-july-1-2011-a.jpg)