Embed Size (px)
Citation preview
1.
3.
THEECONOMIC
IMPACTOF
MALARIAIN PERU
This work was carried out with the participation of:
Design and SupervisionDr. César Bueno-Cuadra (MOH)
Dr. César Cabezas-Sanchez (MOH)Dr. Jaime Chang-Neyra (USAID)
Dr. Walter Mendoza-De Souza (MOH)Dr. Salomón Durand-Velasco (MOH)
Dr. Luis Seminario-Carrasco (USAID)Dr. Víctor Zamora-Mesía (MOH)
The reference terms for the study were made by:María Antonia Remenyi-Díaz (Economist)
Translation:Roxana Lescano
Translation reviewer: Dr. Fernando Llanos-Zavalaga
Research Team:APOYO Institute:
Lorena Alcázar-Valdivia, Ph.D. in Economy(Project Director)
Rosa Ana Balcázar-Suárez (economist)(Project Director)
Pedro Francke-Ballve (economist)(Technical specialist in charge)
Dr. Manuel Quimper-Herrera (epidemiologist)Augusto Portocarrero-Grados (economist)
Javier Paulini-Sanchez (economist)Claudia Barrios-Paucar (sociologist)
© Ministry of Health, 2000Av. Salaverry cuadra 8 s/n, Jesus María, Lima, Peru
Correspondence:Proyecto Vigia (MINSA-USAID)
Camilo Carrillo 402, Jesus María, LimaTelephones: 51 (1) 332-3482, 51 (1) 332-3458
http: //www.minsa.gob.pe/[email protected]
This document can be freely used and reproduced,as a whole or in part, as long as its procedence ismentioned and there is no commercial use.
ISBN: 9972-820-15-7Depósito Legal N° 1501012000-4490
This publication was made with financial support fromthe Vigia Project “Addressing the Threats of Emergingand Re-Emerging Diseases ” (Cooperative Agreementbetween the Ministry of Health of Peru and the U.S.Agency for International Development (USAID).
Original Title:El impacto económico de lamalaria en el Perú.© MINSA-Perú, 1999.
To the families in rural areas of the northern coast and jungleof our country who suffer the effects of malaria and
fight collectively against the disease.
To the health workers.
DEDICATION

THE ECONOMIC IMPACTOF MALARIAIN PERU
MINISTRY OF HEALTH
Dr. Alejandro Aguinaga-RecuencoMinister of Health
Dr. Víctor Zamora-MesíaNational Director of the Vigia Project

ACKNOWLEDGEMENTS
To the families of those sick with malaria who opened their doors to usfor the survey.
To the Ministry of Health workers who work in health facilities and in theRegional Health Offices of Loreto, Piura and Tumbes for their valuableand speedy collaboration in the collection and correction of regionaldata.
To the Director’s Offices from the ESSALUD Hospitals of Piura andIquitos.
To the organizations that provided information: Proyecto Vichayal III,Bosque del Norte, ADEC, Villa Nazaret, Ideas, CIPCA, Médicos delMundo and the Red Cross Loreto.
To the Transitory Council Boards of Regional Administration in Piura,Tumbes and Loreto.
To the Provincial Municipalities of Piura, Tumbes and Maynas
To the Basic Health and Nutrition Project, coordination headworkers ofPiura.
To Dr. Marie-Andree Diouf-Romisch, representative of the PanAmerican Health Organization Mission in Peru

INDEX
INDEX p. 11
PROLOGUE p. 13
EXECUTIVE SUMMARY p. 15
INTRODUCTION p. 17
1. Malaria in Peru and in the world p. 21
1.1. General aspects p. 21
1.2 Malaria in the world p. 21
1.3 Malaria in Peru p. 22
1.3.1 Historical evolution p. 23
1.3.2 Current status p. 25
1.3.3 Characteristics of the main malaria transmission
areas in Peru p. 28
1.4 Prevention and control strategies p. 29
2. Cost estimation in the health reform framework p. 33
2.1 A global view of the health sector in the reform process p. 33
2.2 The economic theory, costs and health economics p. 34
2.3 The study of the economic costs of malaria and its implications
in the health reform p. 35
3. Aspects considered in cost estimation p. 39
3.1 Economic costs and effects of the health status p. 39
3.2 Concepts of the economic costs p. 40
3.2.1 Direct costs p. 40
3.2.2 Indirect costs p. 41
3.2.3 Other indirect costs produced by the effects on the behavior
of economic agents p. 42
4. Methodology used in the economic costs estimation of malaria p. 43
4.1 Methodological techniques and tools considered p. 43
4.1.1 Calculation of the MOH direct institutional costs p. 44
4.1.2 Costs of other institutions: ESSALUD, NGOs, and others p. 47
12.
Th
e e
con
om
ic im
pa
ct o
f ma
laria
in P
eru
4.1.3 Direct and indirect costs borne by patients
and their families p. 47
a) Contents of the house survey p. 48
b) Sampling for the house survey p. 49
c) Application of the survey p. 52
d) Value of time p. 53
e) Value of life p. 55
f) Value of suffering p. 55
4.1.4 Calculation of the costs by loss of tourism p. 56
4.2 Possible bias and deficiencies of the methodology used p. 56
5. The economic cost of malaria in Peru p. 59
5.1 The cost of malaria in Peru in 1998 p. 59
5.1.1 The total cost of malaria in Peru p. 59
5.1.2 The Ministry of Health costs p. 60
5.1.3 Costs of other institutions p. 68
5.1.4 Total costs for families in prevention p. 69
5.1.5 Total cost for families for treatment p. 70
5.1.6 Mortality costs p. 73
5.1.7 Costs for loss of tourism p. 73
5.1.8 The fiscal costs of malaria p. 74
5.1.9 Malaria costs in regard to the GDP and by economic
activity. p. 75
5.2 The cost of malaria for families p. 77
6. Final comments p. 83
BIBLIOGRAPHY P. 87
ANNEX 1
Socio-economic Profile of the areas in the study p. 93
ANNEX 2
Profile of for health services user p. 117
INDEX OF ANNEXES NOT INCLUDED p. 127
13.
PROLOGUE
Malaria has re-emerged alarmingly in the epidemiological maps of the world and has
turned into a serious threat, not only for individual and collective health but for the
sustainable economic development of the societies struck by it.
Social, economic, biological and environmental phenomena explain its re-emergence.
The dramatic change suffered by the environment –which determines earth warming
and thus, the modification of climatic patterns–; the expansion of agricultural borders;
overpopulation and uninterrupted migration; constant changes in the biology and
behavior of the vector and parasite involved in the transmission of the disease; increased
resistance to medications and insecticides used to fight it; as well as the limited interest
in developing new technologies and procedures for its control (since it is a disease
centered around countries of limited economic development, therefore, not very attractive
for the commercialization of new drugs and vaccines) are the underlying factors of this
threat, which pose an enormous challenge for the health systems.
The threat this problem poses to the whole world, as well as its extreme complexity, has
lead the World Health Organization to develop a special program to fight it. This is the
“Roll Back Malaria Initiative” whose main development scene is the African continent
where this disease has reached unusual levels of morbidity and mortality. The last World
Assembly of the World Health Organization, after extensive discussion on the magnitude
and implications of malaria, was able to persuade the main international cooperation
agencies of the need to carry out an additional effort to fight it, assigning special funds for
malaria research, prevention and control.
In our country, upon the boundless advance of malaria, the Ministry of Health has made
huge efforts to try to control the phenomenon. However, the multiple factors conditioning
the disease and the complexity of the control measures that overflow the health borders,
have stopped the malaria prevention and control results from being optimum.
The study entitled “Economic Impact of Malaria in Peru” is a Ministry of Health initiative,
its purpose is to contribute to improve the knowledge of some elements that make up the
complex malaria problem and its repercussions in the health and economy of the Peru-
vian population. This effort has been accompanied and financed by the U.S. Agency for
International Development (USAID) through the Vigia Project.
14.
Th
e e
con
om
ic im
pa
ct o
f ma
laria
in P
eru
The results obtained in this study evidence the loss the country has and continues to have
due to the persistent factors conditioning the magnitude of the disease, as well as the
need for a multisectorial approach that guarantees the necessary resources to control a
problem that seriously threatens the sustainable development and national security.
We hope this study becomes a powerful management and awareness tool that commits
institutions and society as a whole in the prevention and control of malaria in Peru.
Dr. Alejandro Aguinaga-Recuenco
Minister of Health
15.
EXECUTIVE SUMMARY
The Ministry of Health and USAID, through the Vigia Project, contracted for the
performance of this study. The objective was to estimate the cost of malaria, not only for
the government, but also for the familes affected by the disease, and to find out about the
other effects the disease has on the economic activity in an indirect manner. The study is
framed within the sector reform context because the control of malaria implies prioritizing
collective health and reducing the inequities in health.
The study has considered the estimation of direct costs which are the economic re-
sources directly spent because of the disease; and the indirect costs that do not imply
a cash disbursement of money but represent a loss of opportunities to produce or to
work.
The methodology used involved: a survey of 364 houses of the areas affected by malaria
(Loreto, Piura, Tumbes) to determine the time lost and other costs faced by families
affected by the disease; a survey of health services to identify the total costs of the health
centers, including personnel costs and general services; and the data collection from the
Ministry of Health units and others that assign resources to the fight against malaria.
The main results and conclusions of the study are the following:
1. Malaria represents a high cost to the Peruvian economy. The estimated total cost is
37,9 million of US dollars. This figure represents 3% of the animal rearing industry
GDP for the departments of Loreto, Piura and Tumbes, where its incidence concen-
trates. Also, in regard to the total expenditure in health, the total cost of malaria repre-
sents 1,5% .
2. The cost for the Government (originated by the efforts carried out for its control) is 9,3
million US dollars, part of which comes from the resources allocated to it by the
National program and other health units oriented to this goal. The amount includes
time dedicated by professionals and health workers and the cost of the infrastructure
involved. The government spending oriented to malaria is only 1% of the public
expenditure in health.
3. Malaria represents an important cost for the families who live in endemic areas
because it is as high as 26,6 million US dollars. For these families, mostly poor, the
average cost by the disease is 475 US dollars. Although one malaria case costs yearly
an average of 95 dollars to the families, the families experience an average of five
Executive summary
16.
Th
e e
con
om
ic im
pa
ct o
f ma
laria
in P
eru
cases. For the rural families in the jungle, 70% of them are poor, this cost can equal
to one third of their yearly earnings.
4. Mortality caused by malaria, in spite of its being low –43 deaths in 1998 in 77,000
cases of falciparum malaria, that is 0,5 per one thousand– represents an important
economic cost. As for this measure, however, the limitations of appraising human
lives must be highlighted.
5. Economic effects are generated in an indirect manner through the decreased
tourism. This could explain the significant loss of between 700,000 and 3,5 million
US dollars. In an extreme case, the cost would be meaningful in regard to the other
costs identified.
6. The main malaria costs are those generated on the families or more indirectly on the
economic activity and these are not adequately perceived by society. This adds to
undervaluing the importance of the disease. That is, releasing the real cost to society
may turn into a strategy that promotes more active participation of the civil society in
the fight against malaria.
7. In the field work, a strategy was found to modify the watering system for rice crops in
Piura that could be promising in the reduction of the presence of mosquitoes carrying
the Plasmodium without generating a negative effect on the agricultural production.
This system consists of alternating six days of watering with nine dry days. In the
experimental testing, it reduces the presence of larvae in the fields without reducing
their productivity. This system could presumably be generalized to other areas, after
its replicability is tested through trials in the field.
17.
INTRODUCTION
Malaria is a re-emerging infectious disease in Peru and in the world, with a significant
increase on incidence in the last 20 years after great progress in its control achieved
in the 1960s. Currently, if diseases were ordered on the health loss they cause, malaria
would be the eleventh in the world and the seventh in the developing world.
In Peru, malaria has re-emerged as an important infectious disease due to its increased
incidence and geographic distribution. In 1998, more than 200,000 malaria cases
were reported, centered around the jungle and northern coastal area of the country.
The Ministry of Health (MOH), as part of its mission, has been performing malaria
prevention and control measures, including the development of research that allows
for better knowledge of the disease and the most efficacious control methods.
The MOH within this context, through the Vigia Project carried out within a cooperative
agreement with the U.S. Agency for International Development (USAID) decided to
carry out a study on the economic impact of malaria in Peru. The objective was to
estimate the cost of malaria, not only for the government but also for the families
affected and to find out about the other effects generated by the disease on the
economic activity in an indirect manner. Additionally, it was considered that the field
work required to carry out this study provided an opportunity to analyze two additional
aspects: the use of health services by the population and the socio-economic profile
of the population affected.
It must be noted that many of the economic costs that malaria involves go unnoticed
because they befall on a rural, poor and disperse population whose work days and
resources are not usually accounted for. Identifying them allows us to highlight the real
importance of malaria and improve the level of public opinion information about it,
which is essential to the development of active strategies to fight it, not only on behalf
of the government but on behalf of the population affected. On the other hand learning
about the economic costs is an essential requirement for the application of economic
tools such as the cost-benefit analysis or cost-effectiveness, used in health to guide
the policy toward more efficient methods.
Once the reference terms for the study were established –made by María Antonia Remenyi,
an economist, in collaboration with Dr. Jaime Chang and Dr. Víctor Zamora–, a public bid
was called and the Apoyo Institute was awarded the contract.
Introduction
18.
Th
e e
con
om
ic im
pa
ct o
f ma
laria
in P
eru
The central team in charge of the project’s execution is made by Lorena Alcazar, Ph.D.
in Economy and Rosa Ana Balcazar, economist, both responsible for the management
of the project; by Pedro Francke, economist and principal investigator; Dr. Manuel
Quimper, specialist in Epidemiology and Augusto Portocarrrero, economist. The team
was completed by Claudia Barrios, sociologist and Javier Paulini, economist. The
study was carried out in the course of three months and a half.
The methodology included a survey of 364 homes in the departments of Loreto, Piura
and Tumbes, areas with the highest malaria prevalence (70 percent of the cases in
the national territory). It also involved collection of data by means of forms, pre-
established in coordination with the various central level organisms of the Ministry of
Health, as well as with other national and international organizations that finance
malaria control.
In order to complete the demographic and health information, we also visited the
Regional Health Offices (Direcciones Regionales de Salud, DISAs), regional institutions
and health facilities of the areas selected.
Coordination with the Vigia Project and collaboration with officials from various units
within the Ministry of Health and Regional Health Offices have facilitated the access
to information about the sector. Collaboration of officials from public and private
entities, which allowed us to gather most of the information requested, has also been
essential to the successful ending of this task.
This publication is the product of processing the information obtained on the eco-
nomic cost of malaria. It starts with a chapter of general interest that places the malaria
problem in context, in Peru and worldwide, and a concise description of the particular
characteristics of this disease.
The second chapter is also an introductory section that informs on the objectives of
the reform of the health sector; a brief presentation of the concepts linking the health
field and economic theory is provided; and a description of the tight relationship
existing between malaria control activities on behalf of the government and the ongo-
ing reform process. The following two chapters include the theoretical framework ad
the methodology used as the basis for this study of the impact.
19.
The results from the calculation and analysis of the economic costs of malaria are
presented in detail in the fifth chapter. It includes a description of the direct and indirect
costs malaria generates not only for the government but for various public and private
institutions involved in its control as well as for the families affected by the disease.
The sixth and last chapter presents some final comments related to the field work
carried and the results obtained in the study.
The publication also includes other sections of interest, such as an executive sum-
mary (in the first pages) and two annexes: the socio-economic profile of the population
affected by malaria and a study on the use of health services by individuals sick with
malaria and on the interaction between the population and the institutions to apply
control strategies.

20.
Th
e e
con
om
ic imp
act o
f ma
laria
in P
eru
21.
1.1 General aspects
Malaria belongs to the group of re-emerging infectious diseases because though it isan old disease, with a downward period at around the middle of this century and thathas acquired great magnitude throughout the globe in the last few years.
Malaria is caused by a unicellular parasite of the genus Plasmodium. Four are thespecies affecting man: Plasmodium vivax, falciparum, malariae and ovale. The firstone is identified with benign forms of the disease whereas the second one causessevere disease, occassionally leading to death and that is why it is also called“malignant malaria”. The third one is somewhat rare in our country; and the last formis not present here.
Transmission of the disease from one sick person to a healthy person takes place bya mosquito bite. This mosquito vector belongs to the genus Anopheles and there areover 40 species of this genus identified in Peru. The main ones are A.pseudopunctipennis, A. albimanus, A. benarrochi and A. darlingi (Calderón, 1995).
The mosquitoes that transmit malaria reproduce by laying their eggs in different bodiesof water containing organic substrates. These rearing sites can be natural, such aspuddles, swamps, aguaje farms, etc., or they can also be artificial, such as overfloodedrice crops, fish farms, swimming pools, dams, canals, etc. The biological birth processof the larvae (infantile forms of the vector) from eggs, through growth and mature stagetoward the adult forms requires special temperature and humidity conditions that arefound in tropical climates, either valleys or jungle, and in swamp temperate areas.Thus, countries with an ecosystem such as that described above are generally malariaendemic.
1.2 Malaria in the world
This disease that had been eliminated or suppressed effectively in many parts of theworld is now experiencing such a resurgence that today, it is a public health problemin more than 90 countries inhabited by 2,400 million people, that is 40% of the worldpopulation.
It is estimated to cause 500 million clinical cases and over one million deaths a year,half of them in children under 15 years old. Every 30 seconds, a child victim of malariadies somewhere (Malaria Foundation International, 1998).
Malaria in Peru and in the world 1.
Malaria in Peru and in the world
22.
Th
e e
con
om
ic im
pa
ct o
f ma
laria
in P
eru
Malaria is considered a disease of poverty because its impact is much greater amongpoor people. The morbidity burden caused by this disease in the world is calculatedat 39 million DALY1 (WHO,1999a).
Although Africa is the most severely punished region, South America and the Carib-bean have seen considerable increase in Malaria cases since 1980, adding up to900,000 cases in 1997. Around 4,000 individuals out of these cases died. In 1997,Brazil presented with more than twice the number of cases than in 1980 and, in thissame period of time, the number of cases have had a five fold increase for the Andeanarea. The areas affected are mainly the Amazon Basin and the Pacific coastal areanear the Equatorial line (PAHO, 1998).
A particularly alarming aspect is the re-introduction of malignant malaria (caused byPlasmodium falciparum) in areas that were free of this severe form of the disease untilshort time ago.
This reality has led the new director of the World Health Organization (WHO) to launcha new control initiative called “Roll Back Malaria – A Global Partnership” shortly aftertaking over her position as the WHO Director in 1998. This initiative aims at associ-ating the poorest countries and those endemically struck by malaria, with internationalorganisms of the United Nations, such as UNICEF, UNDP, the World Bank and theWHO, cooperation and bilateral development agencies, NGOs, the private sector, etc.,in each country (WHO,1999b).
1.3 Malaria in Peru
In the public health scope of Peru, malaria holds a position of high importance dueto its increased incidence and geographic coverage. In the last few years, the in-creased number of cases has turned Peru into the country with the second highestincidence in South America.
In 1998, 212,590 malaria cases occurred in Peru. Fortunately, although there were 43fatal cases, in general, the mortality rate reported in our territory is way under thatobserved in other American countries and quite far from the rates reported in Africa(MOH-General Office of Epidemiology [OGE] 1999).
1 The calculation of DALY (disability adjusted life years) is used to measure the burden of morbidity.
23.
1.3.1 Historical evolution
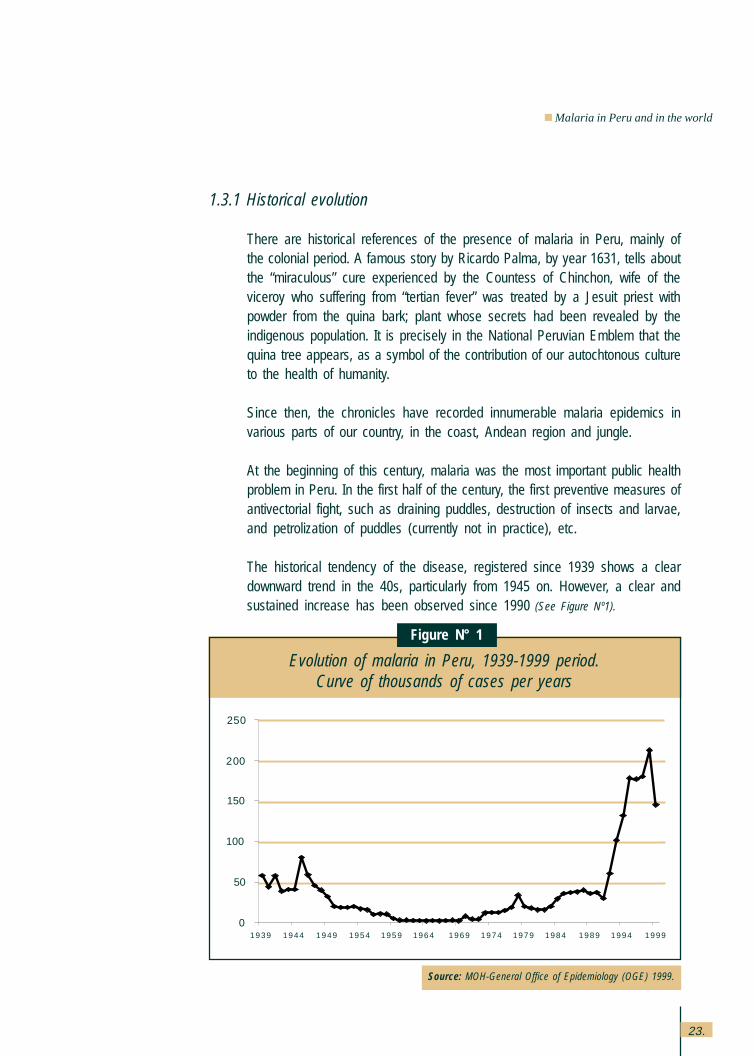
There are historical references of the presence of malaria in Peru, mainly ofthe colonial period. A famous story by Ricardo Palma, by year 1631, tells aboutthe “miraculous” cure experienced by the Countess of Chinchon, wife of theviceroy who suffering from “tertian fever” was treated by a Jesuit priest withpowder from the quina bark; plant whose secrets had been revealed by theindigenous population. It is precisely in the National Peruvian Emblem that thequina tree appears, as a symbol of the contribution of our autochtonous cultureto the health of humanity.
Since then, the chronicles have recorded innumerable malaria epidemics invarious parts of our country, in the coast, Andean region and jungle.
At the beginning of this century, malaria was the most important public healthproblem in Peru. In the first half of the century, the first preventive measures ofantivectorial fight, such as draining puddles, destruction of insects and larvae,and petrolization of puddles (currently not in practice), etc.
The historical tendency of the disease, registered since 1939 shows a cleardownward trend in the 40s, particularly from 1945 on. However, a clear andsustained increase has been observed since 1990 (See Figure Nº1).
Malaria in Peru and in the world
0
5 0
1 0 0
1 5 0
2 0 0
2 5 0
Evolution of malaria in Peru, 1939-1999 period.Curve of thousands of cases per years
Figure N° 1
Source: MOH-General Office of Epidemiology (OGE) 1999.
1939 1944 1949 1954 1959 1964 1969 1974 1979 1984 1989 1994 1999
250
200
150
100
50
0
24.
Th
e e
con
om
ic im
pa
ct o
f ma
laria
in P
eru
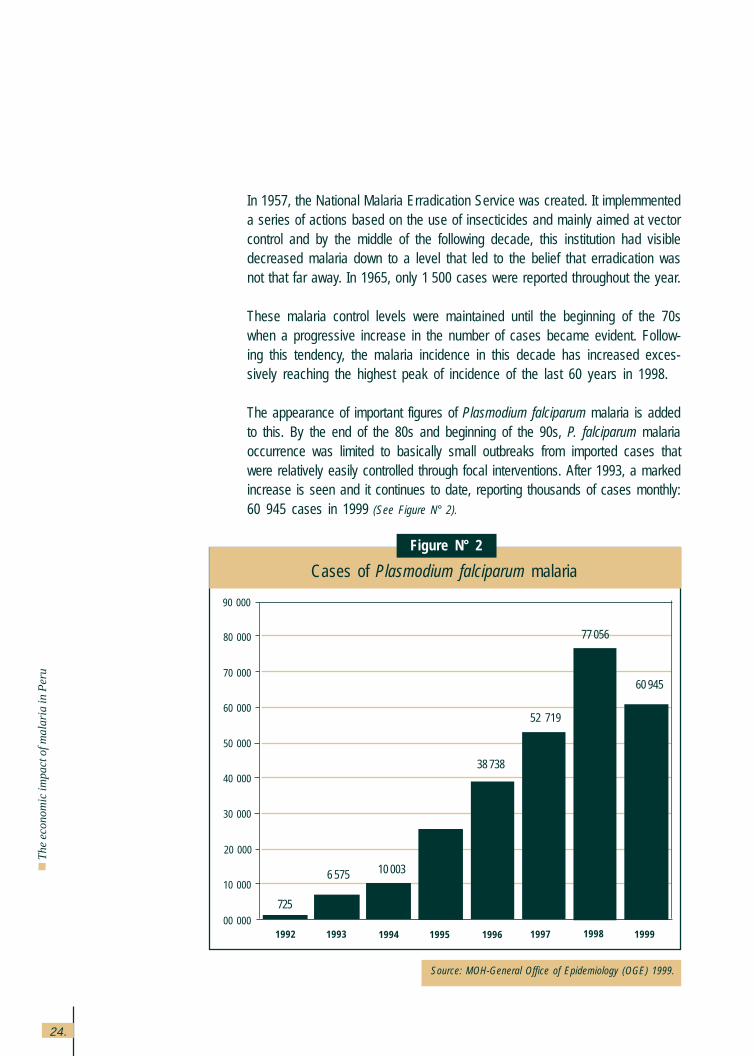
In 1957, the National Malaria Erradication Service was created. It implemmenteda series of actions based on the use of insecticides and mainly aimed at vectorcontrol and by the middle of the following decade, this institution had visibledecreased malaria down to a level that led to the belief that erradication wasnot that far away. In 1965, only 1,500 cases were reported throughout the year.
These malaria control levels were maintained until the beginning of the 70swhen a progressive increase in the number of cases became evident. Follow-ing this tendency, the malaria incidence in this decade has increased exces-sively reaching the highest peak of incidence of the last 60 years in 1998.
The appearance of important figures of Plasmodium falciparum malaria is addedto this. By the end of the 80s and beginning of the 90s, P. falciparum malariaoccurrence was limited to basically small outbreaks from imported cases thatwere relatively easily controlled through focal interventions. After 1993, a markedincrease is seen and it continues to date, reporting thousands of cases monthly:60 945 cases in 1999 (See Figure N° 2).
Cases of Plasmodium falciparum malaria
Figure N° 2
Source: MOH-General Office of Epidemiology (OGE) 1999.
19991992 1993 1994 1995 1996 1997 199800 000
10 000
20 000
90 000
80 000
70 000
60 000
50 000
40 000
30 000
725
6 575 10 003
38 738
52 719
77 056
60 945
25.
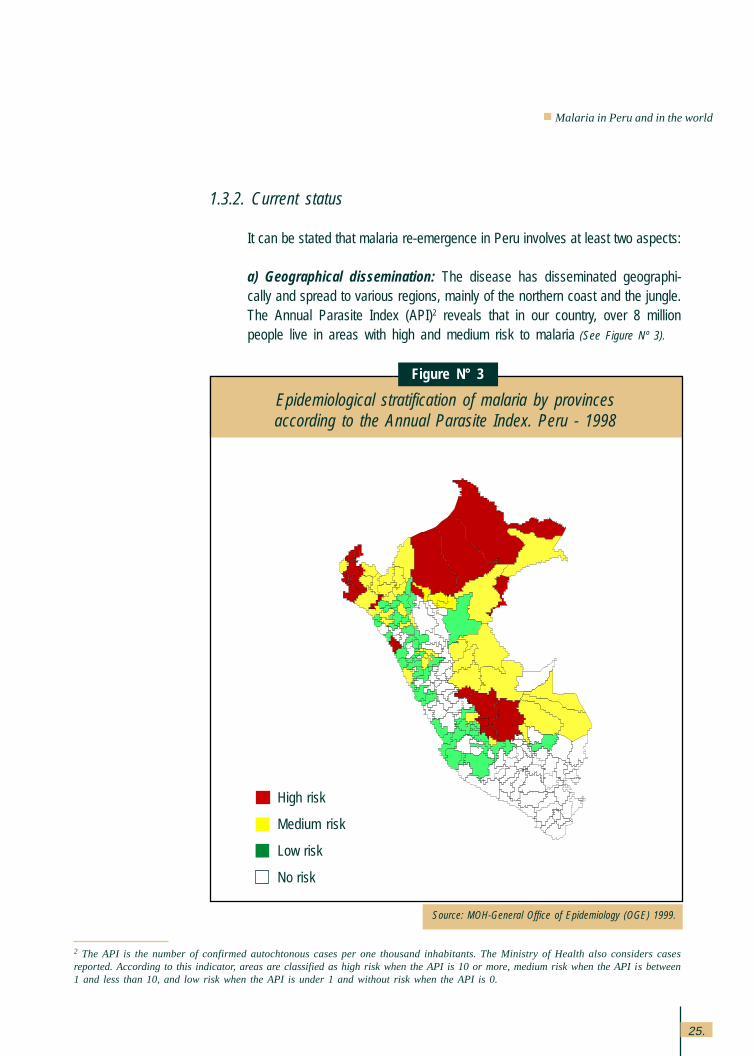
1.3.2. Current status
It can be stated that malaria re-emergence in Peru involves at least two aspects:
a) Geographical dissemination: The disease has disseminated geographi-cally and spread to various regions, mainly of the northern coast and the jungle.The Annual Parasite Index (API)2 reveals that in our country, over 8 millionpeople live in areas with high and medium risk to malaria (See Figure Nº 3).
Epidemiological stratification of malaria by provincesaccording to the Annual Parasite Index. Peru - 1998
Figure N° 3
Source: MOH-General Office of Epidemiology (OGE) 1999.
2 The API is the number of confirmed autochtonous cases per one thousand inhabitants. The Ministry of Health also considers casesreported. According to this indicator, areas are classified as high risk when the API is 10 or more, medium risk when the API is between1 and less than 10, and low risk when the API is under 1 and without risk when the API is 0.
High risk
Medium risk
Low risk
No risk
Malaria in Peru and in the world
26.
Th
e e
con
om
ic im
pa
ct o
f ma
laria
in P
eru
0 5 000 10 000 15 000 20 000 25 000 30 000
CAJAMARCA
BAGUA
UCAYALI
JAEN
SAN MARTIN
PIURA
LORETO
L. CASTILLA
TUMBES
LAMBAYEQUE
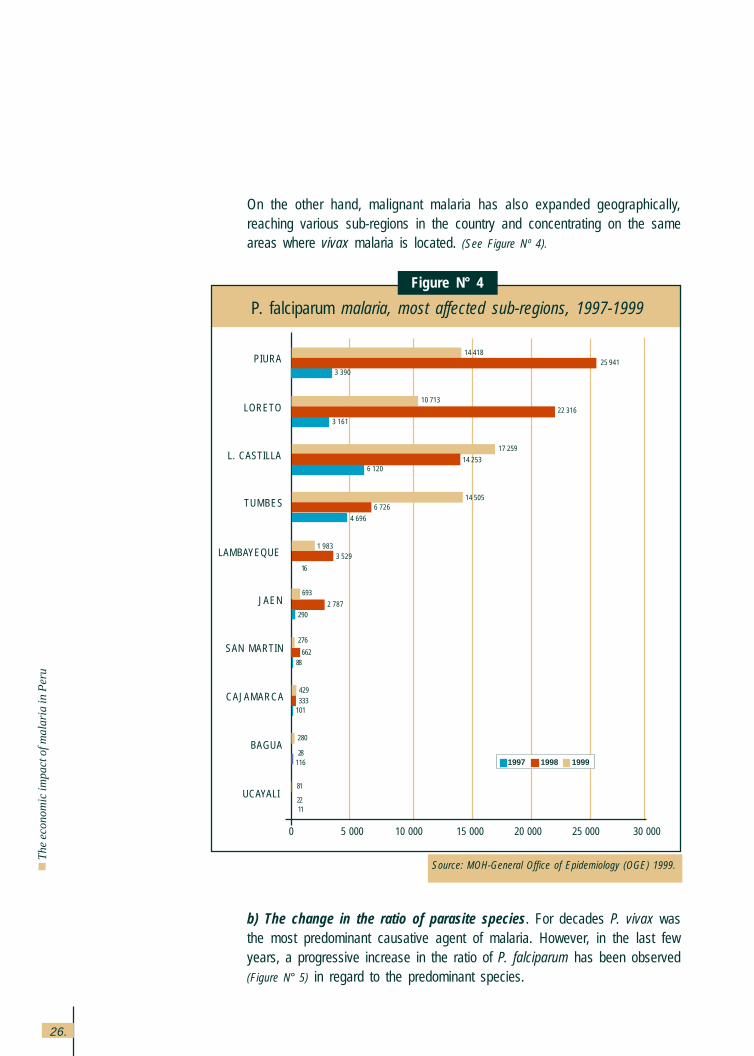
On the other hand, malignant malaria has also expanded geographically,reaching various sub-regions in the country and concentrating on the sameareas where vivax malaria is located. (See Figure Nº 4).
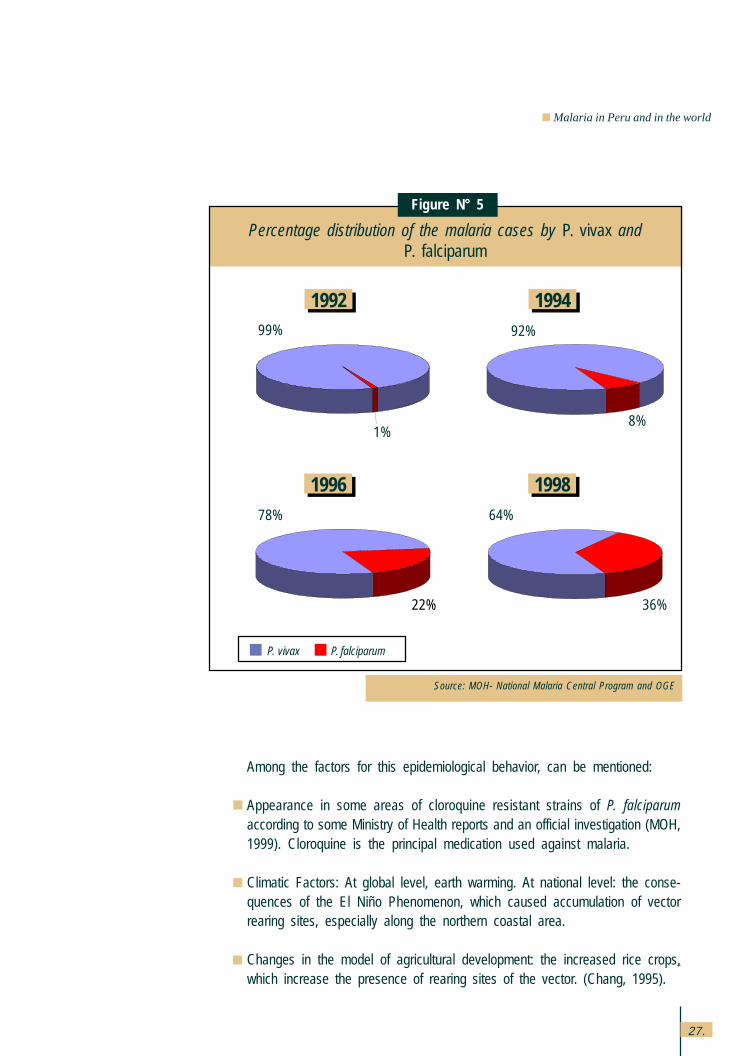
b) The change in the ratio of parasite species. For decades P. vivax wasthe most predominant causative agent of malaria. However, in the last fewyears, a progressive increase in the ratio of P. falciparum has been observed(Figure N° 5) in regard to the predominant species.
Source: MOH-General Office of Epidemiology (OGE) 1999.
P. falciparum malaria, most affected sub-regions, 1997-1999
Figure N° 4
14 418
10 713
3 39025 941
22 316
17 259
3 161
14 2536 120
14 5056 726
4 696
1 9833 529
16
693
2 787290
1997 1998 1999
1122
81
276
66288
429333
101
280
28116
27.
Malaria in Peru and in the world
Among the factors for this epidemiological behavior, can be mentioned:
Appearance in some areas of cloroquine resistant strains of P. falciparumaccording to some Ministry of Health reports and an official investigation (MOH,1999). Cloroquine is the principal medication used against malaria.
Climatic Factors: At global level, earth warming. At national level: the conse-quences of the El Niño Phenomenon, which caused accumulation of vectorrearing sites, especially along the northern coastal area.
Changes in the model of agricultural development: the increased rice crops,which increase the presence of rearing sites of the vector. (Chang, 1995).
Percentage distribution of the malaria cases by P. vivax andP. falciparum
Figure N° 5
Source: MOH- National Malaria Central Program and OGE
1992 1994
1996 199878%
22%
64%
36%
99%
1%
92%
8%
P. vivax P. falciparum
1
99
28.
Th
e e
con
om
ic im
pa
ct o
f ma
laria
in P
eru
The introduction of a highly efficient vector in malaria transmission into Loretoas is Anopheles darlingi (Aramburú, 1999); and the progressive advance of A.albimanus in the northern coast.
Appearance of vector resistance to insecticides.
Increased mobility of individuals and vehicles due to commercial exchangealong the borders, not only in Tumbes but also in Loreto and migration whichfavors the inadvertent transportation of the vector or that allows for the individu-als carrying the parasite to arrive at an area where the vector is present andthus, facilitate the spread of the disease.
1.3.3 Characteristics of the main malaria transmission areas of Peru
It has been quite evident in the last few years that the principal malaria trans-mission areas present with characteristics that are so different from each otherthat it is possible to distinguish two malaria epidemic patterns in Peru: the“Northern Coast” epidemic pattern and the “Jungle” epidemic pattern. Thefactors conditioning and determining the presence of the disease in eachepidemic pattern are clearly different and thus need to be addressed in adifferent manner for their adequate control (Químper, 1998).
The “Northern Coast” epidemic pattern established in the poorest provinces ofthe Piura department (where one of the three residual malaria foci of Peruexisted by 1970) is characterized by the existence of areas receptive to thevector in the coastal valleys and the migration of people from a residual andnever extinguished focus in the Alto Piura area, attracted by handlabor-intenseagricultural activities developed in the medium and lower Piura river. The statusof neighboring Ecuador and the fact that they share the same vector (Anophelesalbimanus), that is capable and competent to transmit Plasmodium falciparum,have also favored the appearance of malignant malaria cases where there wasonly P. vivax, though in a lesser proportion than in the jungle.
The most affected population in the northern coastal area resides in precarioushousing of the outskirts and is dedicated to agricultural tasks in the rice crops.This situation reveals that the rice producing activities prepare and maintain theplace where the mosquito vector lives and reproduces.
In the “Jungle” epidemic pattern, it is the jungle itself that provides the mosquitowith the ideal environmental conditions for its reproduction instead of the modi-fication of man’s activities (with the exception of the recently introduced fish
29.
Malaria in Peru and in the world
farms that represent an additional rearing site when they are not managedadequately). Because of this, malaria is endemic in the jungle, especiallyamong native groups and it is unlikely to be erradicated. The countries sharingthe Amazon Basin with Peru have malignant malaria by P. falciparum as oneof their most serious health problems.
For reasons still unclear, the most important malaria transmissor in the jungle,Anopheles darlingi (which has great affinity with Plasmodium falciparum,causative agent of malignant malaria) had not been identified in our territoryfor a long period of time and this kept us free from the malignant form ofmalaria, thus being the exception among the Amazon peoples. However, afew years ago, this vector was found in the outskirts of Iquitos and in somelocalities throughout the provinces of Loreto, near the corridors leading to thedifferent border areas.
Fortunately, knowledge of the elements that make the epidemiological chain ofmalaria (vector, parasite, host) allows us to confront the disease with bettercontrol possibilities than in other endemic diseases. Thus, we have learned thatmalaria vectors differ in their feeding times and in their preference of varioustypes of Plasmodium related to benign or malignant forms of malaria, whichallows for the design of various strategies of the fight against the vector in itslarvae or adult stage, according to the peculiar biology of the vector and thepredominant parasite, with different success perspectives.
1.4 Prevention and control strategies
The malaria problem represents a most singular challenge because as a disease thatspreads through mosquito vectors, it requires a varied set of measures to attain itsadequate control. These measures refer not only to care for people and their individualand collective behavior, including life styles, occupational risks, migratory movements,etc.; but also attention to the environment involving climatic variations, effects ofproductive activities on the environment and characteristics of housing and basicservices.
The Ministry of Health has considered malaria to be one of its priority health problems(MOH, 1995). In this regard, the execution of prevention and control measures for thedisease is deserving of the utmost attention. The National Malaria Control Programof the Ministry of Health increased its health service coverage guaranteeing diagnosisand treatment completely free of charge to patients. Investment in infrastructure and
30.
Th
e e
con
om
ic im
pa
ct o
f ma
laria
in P
eru
equipment of the services as the product of the government’s stronger effort withinternational cooperation has contributed to improve the national capabilities for thedeployment of actions against the disease. Also, malaria control requires detailedknowledge on the biology of the vector and on the different parasites that cause thedisease.
Following is the set of measures are being conducted for malaria control:
1) Epidemiological Surveillance, that is notification and systematic investigationof cases and data analysis, directed by General Office of Epidemiology (OGE).
2) Entomological Surveillance, that is the study of the vector habits by geo-graphic areas based on its transmission and insecticide resistance capabili-ties. This has led to the demonstration of the recent introduction of Anophelesdarlingi, a much more efficient vector in its capabilities to attack human beings(Calderón, 1995).
3) Medical care for people, it involves reinforcement of individual and collectivehealth services alike, taking into consideration the diagnosis, early detectionand case treatment. The parasitological diagnosis has allowed us to verify there-introduction of P. falciparum in various places of our territory. It also involvessanitary education, aspects on life styles and occupational risks, emphasizingpersonal protection measures (use of repellents and mosquito nets). Amongthese measures of preventive education, it has been detected that, for ex-ample, mosquitoes bite late at night, thus, it is possible to place mesh ormosquito nets as protection and control elements. The protective effect ofthese mosquito nets can be improved if they are impregnated or sprayed withinsecticides (Aramburú et al, 1999).
4) Environmental Control, which involves fighting the vector through the follow-ing means:
a) Physical control, such as drainage of rearing sites, weeding borders andothers.
b) Chemical control, not only of the vector larvae through larvicides, but of theadult forms as well, through home spraying with long-term action insecti-cides and spatial fumigation during epidemics. In Loreto, some measureshave been tested to fight the larvae stage of the vector, taking advantage ofthe prolonged jungle summer caused by El Niño to get to the places wheretransmission foci had been identified before. (DISA Loreto, 1998).
31.
Malaria in Peru and in the world
c) Biological control in some pilot areas. From 1990 to date, biological controlhas been tested in the northern region by means of a bacteria that attacksthe larvae stage (Bacillus thuringiensis var. israelii), whose management inthe hands of the community has been particularly well accepted (Ventosilla,1993 a, b)
Maintaining strict surveillance is extremely important because the moving of peopleover uncontrolled routes may re-introduce the vector or its larvae into peri-urban areasof high populational density with the consequent risk of epidemics.
Community participation is particularly relevant in malaria control activities. Thishappens through individual activities carried out by health promoters who, in remoteareas, take samples for diagnosis and treatment administration. This is also reflectedin the work carried out by the community to eliminate rearing sites.
The development of better agricultural techniques and house building would allow forthe achievement of adequate disease control as the population, now a malaria victim,adds the new techniques, as inferred by some community experiences developed inthe northern region.
We can conclude that the fight against malaria requires coordinated participation fromvarious governmental entities, local and regional authorities from the various depart-ments in the coastal and jungle area and of the population –particularly from the nativecommunities– and, even from the border countries because vectors do not recognizeborders.

32.
Th
e e
con
om
ic imp
act o
f ma
laria
in P
eru
33.
Cost estimation in the health reform framework 2.
2.1 A global view of the health sector in the reform process
The reform of the health sector is a process for its transformation that has been takingplace for some years worldwide and aims at generating ostensible changes in thefunctions and relations among the various institutions and agents operating in thesector in order to decrease the inequality of the health of the population health,increase the efficiency and efficacy of the systems and health services and satisfy theneeds of the majorities through the provision of quality health services.
With that intent in mind, the following concrete objectives have been set forth for thehealth reform in Peru:
In the institutional aspect: Establish a clear separation of the three basic functions,as follows:
The Government function: Exercised by the Ministry of Health in thefulfillment of its role as regulator, assignor of public financing and warrantorof the supply of services. These functions include strategic planning based onthe analysis and projections of the health status, control and fiscalization toensure the fulfillment of sanitary regulations, regulating the provision of servicesby public and private providers, following-up and supervision of the contributingsystem of the social security in health and modulation in the field of preparationand licensing health professionals and technicians.
The function of Administrating the public resources destined to financ-ing health services for the target population of the government (poor, ex-treme poor and population at risk), based on the logics of the purchase ofservices from public or private providers according to price, opportunity andquality.
The Service Production function exercised by the Ministry of Health andPeruvian social security-ESSALUD facilities, as well as the main institutionsin the sector, not only from the private sector but also from the public sectoras well. The latter is organized in service networks for basic health care andin national and regional hospitals, as well as specialized institutes to tend tomore complex interventions. For more flexibility in the use of resources, it isproposed that the networks of institutions and the hospitals and specializedinstitutes under the Government jurisdiction will be subject to an autonomousregime regulated through management agreements and monitoring andcontrol of results.
Cost estimation in the health
reform
34.
Th
e e
con
om
ic im
pa
ct o
f ma
laria
in P
eru
For these functions to be adequately fulfilled and thus, achieve the developmentproposed in the institutional field, we need to establish the organization of the servicesand generate the following capabilities:
In the Financial aspect.- The aim is to apply new forms of assigning and deliveringpublic resources to health providers in order to promote equity and efficiency. Todo this, we propose to rechannel the public health funds toward collective andindividual health of a high social value toward more cost-effective interventions, toadequately regulate fee charges and promote new insurance schemes andestablish payment mechanisms that promote the efficient production of priorityservices.
In the Service Providing aspect.- We propose to develop new models for health carethat integrate basic health services and bring them closer to the users, adapting themto cultural and social realities of each region and establish a culture of quality andwarmth in the service. Also, for the adequate organization of the services, it is requiredto put the offer in order, to establish adequate reference and counter-reference systemsamong the basic and more complex health services, as well as to professionalize themanagement of networks and hospitals by providing them with modern managementtools.
These efforts were first exposed to public opinion at the end of 1995 with thepresentation of the document entitled “Hacia un sector salud con equidad, eficienciay calidad. Lineamientos de política de salud 1995-2000” (Towards a health sectorwith equity, efficiency and quality. Health Policy Guidelines 1995-2000) (MOH, 1995).The main guidelines for the Health Sector Reform were set forth in it, as well asa proposed general model for the reform that aims at being comprehensive andwhole.
2.2 The economic theory, costs and health economics
Health economics is the logic framework to improve decision making in the sector,mainly those decisions that refer to the use of resources, including such topics asfinancing health systems, balancing supply and demand, health appraisal, therelationship between health and the socio-economic environment and micro-economicevaluation of interventions.
35.
The economic theory awards great importance to the issue of costs. It considers thatmaximizing benefits and minimizing costs allows for the optimal use of resourcesunder determined hypotheses (perfect competition and prices that reflect all therelevant social effects). (Mc Guire et al., 1994)
However, the theory has various problems on its application in health, particularlybecause prices do not collect all the relevant social effects when there are problemsin the configuration of the demand or in the external issues of the consumption. Inthe first case, health demand occurs within a context of incomplete informationbecause the user does not know what services he/she requires or their quality. As forthe externalities, they refer to the services that, in addition to providing a benefit tothe individual, generate benefits for third parties, as well. A typical case of this is thetransmissible diseases, in which curing an ill person tends to reduce the spread ofthe disease to others.
According to Abel Smith (1989), health economists have offered more than is pos-sible because there are difficulties with the cost data and the epidemiological data.Measuring the benefits is also problematic. Reaffirming his statement, Abel-Smithcites Mills (1985), who states that “there are still few studies of economic evaluationthat are capable of offering practical advise to governments.”
Hammer (1993) indicates that there is a large difference between the theory thatproposes election among alternatives based on complete information and reality. Intheory, what must be done is to compare the marginal costs of the various interven-tions with its benefits or marginal effects and choosing the optimal combination toachieve the most benefits at the lowest cost. This, however, does not happen inpractice. To demonstrate this, the author presents several highly illustrative examplesabout the mistakes made when priority is assigned to other factors such as theimportance of the disease or when the analysis is restricted only to the average costof the treatment.
2.3 The study of the economic cost of malaria and its implicationsin the health reform
There are many aspects linking the study of the economic cost of malaria with theactual reform process of the health sector.
The first aspect refers to the need, outlined by the reform, to give priority to theintervention on collective health (MOH, 1995). Economic theory teaches that the
Cost estimation in the health reform framework
36.
Th
e e
con
om
ic im
pa
ct o
f ma
laria
in P
eru
benefits provided by the public goods, like the various malaria prevention activitieson vector control are distributed throughout the society as a whole and thus, they donot justify the cost incurred privately. At the same time, due to their trait of non-excludable and non-rivalry goods, it is not possible to establish mechanisms to chargefor the access to benefits of public goods. Another factor to be considered is thepositive externalities derived from curing a person ill with malaria; that is, the benefitsfor third parties that are indirectly embedded in treating one individual. These benefitsresult from the fact that transmission levels are lower when there are less individualsinfected with the Plasmodium parasite.
A second aspect that coincides with the interventions in collective health proposedby the health reform is the need for them to have an integral and inter-sectorialnature. In the case of malaria, the need is evident given the fact that the vectordevelopment is closely associated to environmental conditions, which could befavorably or unfavorably impacted by actions carried out for economic development,such as road building or rice crops. This study of the economic impact of malariahighlights the importance of the disease for other sectors (Ministry of Economy andFinances, Ministry of Agriculture, Ministry of Industries), although the tendency inthese sectors has been not to pay much attention to it.
A third aspect relates to health equity. This is one of the great principles of the healthreform and is of particular importance in Peru where there is a large degree ofinequality and even different epidemiological patterns among different strata of thesociety. Although in our country, no detailed studies have been performed in thisregard, international studies show that in a large majority of the cases, transmissiblediseases affect the poor in a much larger rate (given their living conditions) and that,because of this, the fight against these diseases is also justified from an equity pointof view. The socioeconomic profile of those affected by the disease included in thisstudy also provides information in the same direction.
A last aspect that relates the health sector reform with the present study is theoptimization of the use of available financial resources. The aim is to achieve agreater impact in the health of the population for every dollar invested through moreefficiency and efficacy. This greater rationality of the expenses is usually consideredin health by means of cost-effectiveness and cost-benefit indicators. The first indicatorsrefer to the impact achieved in the health status whereas the second ones establisha link between the economic cost and the economic profit obtained from improvinghealth.
37.
Cost estimation in the health reform framework
This study represents a contribution in both directions. On one hand, it allows for thecalculation of the total direct cost to fight malaria, which is a requirement to performestimations of cost-effectiveness3. On the other hand, it provides the possibility ofmaking estimates of how larger costs funded directly by the State may reduce thecosts borne by those affected families, thus leading to a net benefit for society.
3 Strictly speaking, a estimation of cost-effectiveness should deal with marginal costs and impact and not on average costs, but that isusually hard to estimate, and presumably requires from the knowledge of the average costs.

38.
Th
e e
con
om
ic imp
act o
f ma
laria
in P
eru
39.
Aspects considered in cost estimation 3
3.1 Economic costs and effects on the health status
Can be said that in the case of diseases, the main cost is almost always not theeconomic cost, measured through income lost, but it is the cost in terms of healthstatus which takes into consideration the suffering of the individuals and the life yearslost. In the field of social politics, one usually looses sight of the fact that the incomeis only one means for people to achieve a higher level of well-being, and there areother means and ways to achieve the same objective. Thus, aspects such as thehealth status and life expectancy are some of the final objectives in this search for well-being.
From this perspective and also considering the difficulty on ethical and technicalterms, of measuring the value of a human life, many assessments of efficacyand impact in health are performed not in function of the economic cost butin function of the final goal of improving the health status. To achieve this, thefollowing indicators are commonly used: years of potential life lost (YPLL),disability adjusted life years (DALY), and also healthy life years (HLY), all theseindicators allow us to compare the different health strategies or interventions.Thus, the estimations of YPLL and DALYs upon measuring premature death ordiscapacity produced by non fatal morbidity may lead to the knowledge of thecost-effectiveness levels of the various interventions, which would help anefficient resource allocation.
However, the analysis of economic costs is also relevant. From the estimation of di-rect and indirect costs, we can obtain indicators such as the cost-benefit ones thatestablish how profitable an expense in health is from the point of view of its ownmonetary recovery. Notwithstanding, it must be noted that this type of cost-benefitanalysis has problems such as measuring the value of the added life years or dayswithout disease achieved in terms of the enrollment of individuals, thus establishingdifferences in the value of health for different people. These limitations are betterappreciated when extreme cases are observed since, theoretically, diseases thatdecrease life of the old people (who, generally do not have paid jobs) would not causeindirect costs. Better said, if nothing were spent curing the elderly, there would be nocosts.
Based on the study performed, the theoretical development set forth in this reportfocuses on the economic cost of malaria, including an appraisal of the effects overhealth.
Aspects considered in cost estimation
40.
Th
e e
con
om
ic im
pa
ct o
f ma
laria
in P
eru
3.2 Concepts of the economic costs
According to MOH-UNICEF-PAHO/WHO (1996), the economic costs are the “oppor-tunity cost of all the resources used”; that is, what is not bought or done when usingthe resources. The Centers for Disease Control and Prevention (CDC, 1995) pro-poses that costs should at least consider the resources spent on the health interven-tion and the costs saved by the treatment, though they add that it should also includethe effects on the productivity and those called “intangible” effects, that is the costscaused by suffering. However, the Basicc method used by CDC does not take theminto account.
Drummond et al (1987) classify costs into three types: the health system or direct costs;the costs borne by patients or families that involve payments made, loss in productivityand psychological or cost of suffering; as well as the external costs.
CDC (1995) and Drummond consider that the benefits generated must be discountedfrom the costs. For Mills (1989), on the other hand, discounting the benefits is optional.
3.2.1 Direct Costs
Direct costs are, on one hand, the costs of surveillance, prevention, diagnosisand cure, including those incurred by the Ministry of Health and ESSALUD; andon the other hand, those incurred by the patient.
MOH and ESSALUD costs (and those of other government buildings), munici-palities, non-government organizations (NGOs) and various institutions thatsubsidize the fight against malaria, all the costs, that is: supplies, personnel whointervene directly, administrative costs and the costs generated by infrastructure(depreciation and financial costs) as well as general services (cleanliness,electricity, etc.)
In regard to the surveillance costs, it must be noted that due to the system’scharacteristics, it is not possible to distinguish between the costs for malariasurveillance and the costs for the surveillance of other diseases, or to tell apartthose elements that correspond to surveillance from those of diagnosis. However,it is possible to recognize costs associated to disease prevalence because ifthis did not exist, personnel time and equipment of the surveillance systemcould be less.
Also considered are the costs of prevention (spraying with insecticides, impreg-nated mosquito nets, etc.), costs of diagnosis (diagnostic consultation, labora-
41.
tory tests, etc.), costs of cure (consultation, medications, hospitalization, etc.)and costs of recovery.
An element not considered in the cost estimation due to difficulties estimatingmedium and long term consequences of malaria on the health status, such asmore predisposition to other diseases and discapacity.
As for the direct costs corresponding to patients, these involve medications,consultations, tests, as well as the cost of traveling (tickets and food, not onlyfor the patient but also for an accompanying family member if required). As forthe medications, consultations and tests, we evaluated the possibility of doubleaccounting of costs since they could be considered as patient costs and alsoas MOH costs. However, this possibility has been discarded since the Ministryof Health gives the required malaria medications free of charge. In theseconditions, the expense on medications incurred by families seen by the theMOH would be for analgesics and other medications not specifically requiredon malaria treatment.
3.2.2 Indirect costs
Indirect costs refer, in general to the opportunity costs, that is, the costs that,even though they do not imply a disbursement of cash, represent a loss ofopportunities for production or work, and even the idle time measured in termsof the opportunity cost had they used that time in productive work. In the specificcase of malaria, this varies according to the time of the year because theeconomic effect is higher if the disease affects the working capability in criticaltimes like harvest season.
Indirect costs can be classified according to the reasons why families losechances of income due to the disease. The first loss of income opportunitiesis the time ill individuals dedicate to obtain cure. This can be analyzed in termsof duration of the trip to the health center, time spent waiting for consultation,time dedicated by the accompanying person, etc. The family costs for theirparticipation in preventive activities carried out by the community can also beincluded.
A second loss of income is the days and hours during which the ill individualcannot work or works with less productivity. These days include not only theperiod of disease but the convalescence because the malaria infected indi-vidual recovers gradually. Also considered is the income lost due to death ofthe individual.
Aspects considered in cost estimation
42.
Th
e e
con
om
ic im
pa
ct o
f ma
laria
in P
eru
3.2.3 Other indirect costs produced by the effects on the behavior of economicagents
Finally, there are costs caused by the effect produced on other economicagents and that have a repercussion on the economy as a whole. One evidentcost, though hard to measure, is the one on tourism because as potentialtourists perceive the area as a risk area, the demand for tourist services willdecrease. However, some of these people may also change their tourist des-tination to another area of Peru, in which case, the economic cost would befor the region but none for the country as a whole.
Another cost identified relates to the dynamics of the economic activity. Any timethe disease risk is internalized by the economic agents and there is mobility offactors, they will tend to demand higher salaries to make up for the cost thedisease has on them. Such behavior applies not only to the hand labor (in thisregard, testimonies from the beginning of the century shows that the malariapresence in the coastal ranches generated resistance to work there on behalfof Andean workers (Cueto, 1997), like investments, that due to a higher pricefor hand labor, confront lower rentability margins.
43.
Methodology used in the economic costsestimation of malaria 4.
Made by: APOYO Institute.
Supplies
Personnel at the pri-mary health care level
General services atthe primary healthcare level.
Hospitalization
Direct collection ofinformation
Survey at health fa-cilities
Survey of the healthfacilities and data fromthe Costs andIncome System atMorropon
Direct interview andfees ESSALUD
Central organisms
Selected healthfacilities
Selected healthfacilities
Piura and LoretoHospitals
Directly obtained
Unit cost by numberof cases
Unit cost by numberof cases.
Number of cases inthe regions by unitcost
None
Higher cost in lowprevalence areas
Higher cost in lowprevalence areas
Unregistered casesin other regions
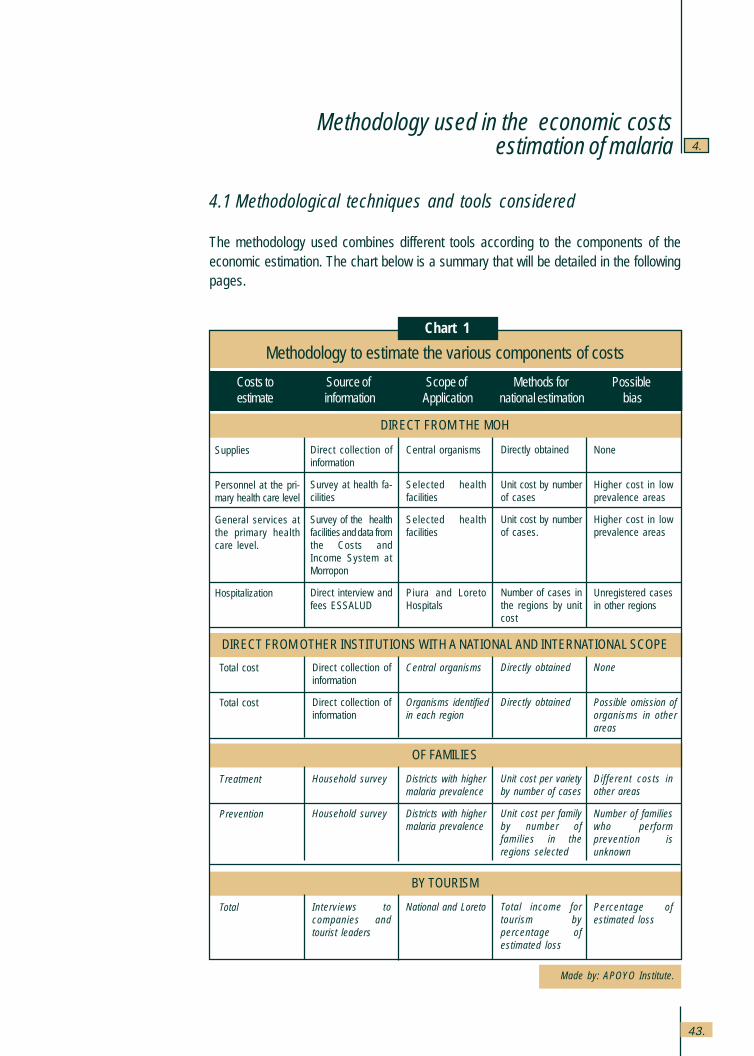
4.1 Methodological techniques and tools considered
The methodology used combines different tools according to the components of theeconomic estimation. The chart below is a summary that will be detailed in the followingpages.
Methodology to estimate the various components of costs
Costs to Source of Scope of Methods for Possibleestimate information Application national estimation bias
DIRECT FROM THE MOH
DIRECT FROM OTHER INSTITUTIONS WITH A NATIONAL AND INTERNATIONAL SCOPE
Total cost
Total cost
Direct collection ofinformation
Direct collection ofinformation
Central organisms
Organisms identifiedin each region
Directly obtained
Directly obtained
None
Possible omission oforganisms in otherareas
OF FAMILIES
Treatment
Prevention
Household survey
Household survey
Districts with highermalaria prevalence
Districts with highermalaria prevalence
Unit cost per varietyby number of cases
Unit cost per familyby number offamilies in theregions selected
Different costs inother areas
Number of familieswho performprevention isunknown
BY TOURISM
Total Interviews tocompanies andtourist leaders
National and Loreto Total income fortourism bypercentage ofestimated loss
Percentage ofestimated loss
Chart 1
Methodology used in the economic costsestimation
44.
Th
e e
con
om
ic im
pa
ct o
f ma
laria
in P
eru
4.1.1 Estimation of the MOH direct institutional costs
The estimation of the direct health service costs provided by the State presentsvarious problems. For Prescott and Warford (1993), these are due to the factthat in the health field, subsidies many times distort or cloud the recognition ofthe service prices. On the contrary, Drummond et al., (1987) puts the stress onother known problems for cost estimation, such as the need to prorate theshared costs among various services because they think that there are no clearresponses, for example, for prorating costs such as general and administrativeservices.
According to Drummond et al., (1987), there are three methods for theappraisal of health services; identify each supply and factor utilized in eachprocedure, which becomes highly costly; observe the total costs and dividethem between the total number of cases or the procedures; or combine bothmethods, considering the supplies specifically used and prorating the othercosts. The capital costs involve the financial costs or the opportunity to usethe money and the depreciation of equipment or infrastructure.
Cohn (1973) adds that supplies must be appraised according to the shadowexchange rate without tariffs and the work must be appraised according tomarginal productivity, which would be its shadow price and not according tosalaries. In economy, shadow price means the price that would prevail if therewere no distortions in the functioning of the free market and would reflect,according to the well-being theory, the social cost for the economy. However,it must be noted that the utilization of shadow prices for the exchange rateor salaries, although theoretically correct from the point of view of the project’ssocial efficiency, has presented with serious methodological difficulties.
In his study of cost-effectiveness of malaria control programs in the BrazilianAmazon region, Ahkavan (1997) only considers the direct costs, appraising thepersonnel costs according to their salaries, treatment and hospitalization ac-cording to fee for service, in a sensitivity analysis two fees were considered: thefee set forth by the government and the fee established by the physician orga-nization.
This study has distinguished the Ministry of Health costs into supplies, person-nel and other general and intermediate services.
45.
4 Surveillance of cases and treatment resistance would be collected by laboratory test as part of diagnostic testing.
Methodology used in the economic costs estimation of malaria
As for the cost of supplies directly used in malaria surveillance, prevention,diagnosis and treatment, we compiled data on the expenses of the BasicHealth for All Program (PSBT) –that funds the National Malaria Control Pro-gram–, the Basic Health and Nutrition Project (PSNB), the General Office ofEpidemiology (OGE), the General Office for Environmental Health, the NationalDefense Office of the Ministry of Health and the National Institute of Health(INS), who directly buy and send these supplies to the regions where thisdisease prevails. This information was obtained from central organisms and forthe national level.
As for the costs confronted by the primary health facilities with other resources(basically personnel costs, costs for general and intermediate services andinfrastructure), the following method was used for the estimation: through fieldwork, we estimated the average time used by physicians and health personnel,as well as the basic services used. The time was broken down according to:
Surveillance: entomological surveillance, surveillance of contacts, record-ing and transmission of information4 among the various institutions perform-ing the surveillance;
Prevention: talks and Information, Education and Communication in gen-eral, provision of mosquito nets, setting biological controllers (Bacillusthuringiensis reared in coconut water, larvivores fish), search for patients,spraying with insecticides, drying out reservoirs;
Diagnosis and treatment: consultations, house visits, laboratory tests.
Field work was based on in-depth interviews with the heads of the health facilities,physicians and health personnel, carried out directly by the members of thework team in meetings organized by the regional director’s offices between theMay 14th and 17th in Piura and Tumbes, and May 20th and 22nd in Loreto. Inthese meetings, they also gathered information on other organizations, likemunicipalities and NGOs that may have expenses in malaria or in looking foralternative control methods based on changes of the environment managementto obtain qualitative information on the patterns of service use.
46.
Th
e e
con
om
ic im
pa
ct o
f ma
laria
in P
eru
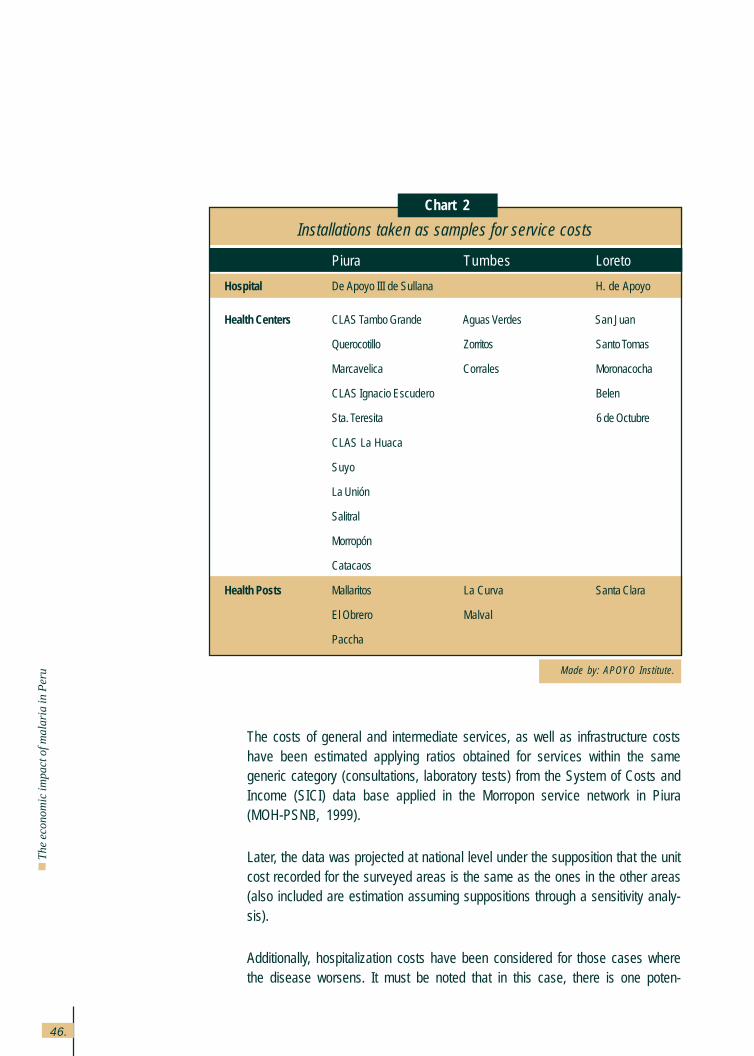
The costs of general and intermediate services, as well as infrastructure costshave been estimated applying ratios obtained for services within the samegeneric category (consultations, laboratory tests) from the System of Costs andIncome (SICI) data base applied in the Morropon service network in Piura(MOH-PSNB, 1999).
Later, the data was projected at national level under the supposition that the unitcost recorded for the surveyed areas is the same as the ones in the other areas(also included are estimation assuming suppositions through a sensitivity analy-sis).
Additionally, hospitalization costs have been considered for those cases wherethe disease worsens. It must be noted that in this case, there is one poten-
Made by: APOYO Institute.
Installations taken as samples for service costs
Piura Tumbes Loreto
Hospital De Apoyo III de Sullana H. de Apoyo
Health Centers CLAS Tambo Grande Aguas Verdes San Juan
Querocotillo Zorritos Santo Tomas
Marcavelica Corrales Moronacocha
CLAS Ignacio Escudero Belen
Sta. Teresita 6 de Octubre
CLAS La Huaca
Suyo
La Unión
Salitral
Morropón
Catacaos
Health Posts Mallaritos La Curva Santa Clara
El Obrero Malval
Paccha
Chart 2
47.
Methodology used in the economic costs estimation of malaria
tially higher cost since currently, treatment for these cases is rather limitedgiven the little funding available for hospitals and given the conditions of thepatients, most patients are poor and have no medical insurance. For theestimation, we opted to multiply the number of hospitalized patients times theaverage number of days in which the malaria patients are hospitalized in award and in the Intensive Care Unit (ICU) and times the value of theseservices. The number of patients was directly obtained from the Piura andLoreto hospitals, as well as the estimate of the average number of days thepatients remain in the ward and in the ICU. In order to appraise theseservices, ESSALUD fees have been used since its installations are in thesame level of complexity and they come closest to the unit cost of thisservice.
4.1.2 Costs of other institutions: ESSALUD, NGOs and others
There are other institutions that carry out efforts for the control of malaria.Information was also collected from WHO/PAHO and ESSALUD. As for WHO/PAHO, these are expenses used for this disease. As for ESSALUD, their feesystem was used. It establishes budget amounts for the department manage-ment offices and hospitals according to the number of cases treated and areference fee based on cost studies.
In regard to other institutions of local scope, we opted for identifying them inthe regional visits. In the northern coastal area, information was gatheredabout the following NGOs and projects: Vichayal III, Bosque del Norte,Asociación de Desarrollo Comunal (ADEC), Villa Nazaret, IDEAS, CIPCA andPRISMA, as well as about the Provincial municipality of Piura and CTARsPiura and Tumbes. In Loreto, information was gathered about Medicos delMundo and the Red Cross, as well as about INADE – National Institute forDevelopment. Other institutions like the Provincial municipality of Maynas wereinvestigated without any findings of significant expenses made in relation tomalaria.
4.1.3 Direct and indirect costs borne by patients and their families
In order to estimate the costs borne by malaria patients, directly and indirectly,data provided by the affected families was gathered by means of a survey.
48.
Th
e e
con
om
ic im
pa
ct o
f ma
laria
in P
eru
a) Contents of the house survey
The main information compiled at this level for the economic costs estimationwere:
Variety of malaria, number of episodes.
Number of consultations, including up to two alternative sites for consulta-tion.
Length of time for the trip and cost of transportation fare to these twoalternative sites of consultation.
If the consultation was made when the ill person was disabled or repre-sented additional time lost.
Persons accompanying the patient to the consultation.
Total time spent in the health facility, including waiting time, consultation,payments, sample taking and collecting medications.
Expenses incurred for the consultations, laboratory tests, and medications.
Days during which the patient was totally and partially disabled.
If during the days of disability, the patient lost a special opportunity to carryout a business and obtain income.
Days and hours dedicated to caring for the patient by the caregiver whocared for him, and if this stopped that person from performing other activi-ties.
Other expenses and time dedicated to prevent the disease, not only incommunity but in family activities as well, such as mosquito nets, screens,insecticides and biological controllers, among others.
Additionally, information was gathered to determine the socio-economic profileof the families and patients in the areas selected, in order to break down thecosts according to various categories, such as:
49.
Methodology used in the economic costs estimation of malaria
Age.
Sex.
Education level.
Mother tongue.
Main occupation of the members.
Housing conditions (water, sewage, electricity, telephone, floors, roofs, walls,number of rooms).
b) Sampling for the house survey
According to the background of malaria in Peru, the provinces included in thisstudy have different behaviors in regard to the seasons, high risk places for thetransmission of this disease, age distribution and type of Plasmodium in thecases reported. These differences occur, essentially, at regional level, that isbetween the northern coastal area and the jungle. Since, we originally expectedto find similar behaviors between Piura and Tumbes, we opted to consider twostrata of research: “Northern Coastal Area” made by Piura and Tumbes and“Jungle” represented by Loreto.
Given the nature of the research, a probabilistic sampling system was used,divided into two stages: 1) selection by cluster criterion (Foci); (2) search forhomes with at least one member who had malaria in the last 12 months.
There is some argument in the specialized literature as to whether the useof a house survey is methodologically adequate or not, given the possibilitythat the disease may not have been identified in the houses. However, Vosti(1990) believes that in spite of the fact that part of the population is migrantand may have less knowledge of the disease, malaria is well identified. Forthe survey, most of those who suffered from the disease were detected withthe aid of the health center or port and the records they keep. The pilot testand the definitive survey found that the homes and the sick individuals dorecognize the disease adequately, although under different names; only asmall number of individuals was not able to identify the variety of disease theyhad.
50.
Th
e e
con
om
ic im
pa
ct o
f ma
laria
in P
eru
Choosing the sample for the application of the house survey was performed incoordination with the VIGIA Project and with the individuals in charge of theMalaria Control Program at departmental level. The departments of Loreto,Piura and Tumbes were designated for the study. The following criteria wasused for the selection of the provinces to be evaluated:
Level of Annual Parasite Index (API), defined according to the Ministry of Healthas the number of cases reported among the total population.
Evolution of the disease in regard to the year before. Priority was given to theplaces that showed a higher incidence during the first trimester of 1999.
Socio-economic characteristics of the areas, in order to obtain a sample fromplaces according to the various economic activities, ethnic group (native com-munities) and access to basic services.
Accessibility to the area.
Inside each district, the selection of localities was carried out in coordination withthe health center to identify the most affected areas.
The universe of the study was made up by the houses where at least one of themembers had contracted malaria in the last 12 months, period considered asacceptable given the severity of the disease. The key informer was the mother orindividual most directly involved in the care of the patient.
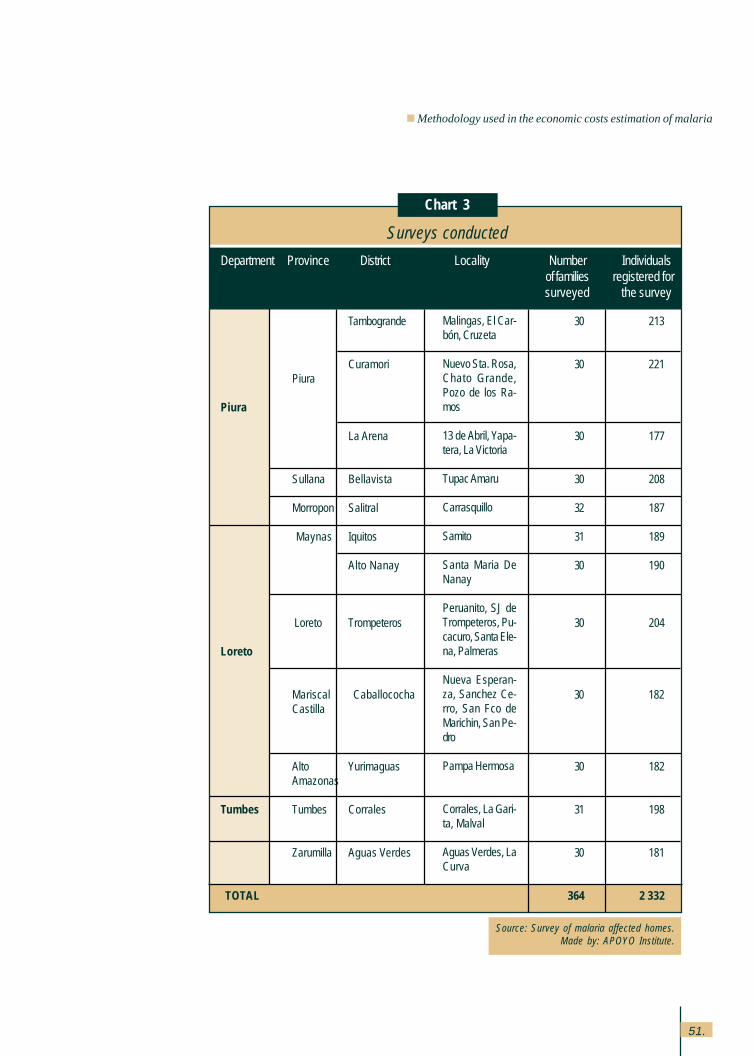
Work was carried out in 12 districts that belonged to 9 provinces, performingapproximately 30 interviews per locality, with a total of 360 surveys.
51.
Methodology used in the economic costs estimation of malaria
Source: Survey of malaria affected homes.Made by: APOYO Institute.
Surveys conducted
Department Province District Locality Number Individualsof families registered forsurveyed the survey
Tambogrande 30 213
Curamori 30 221Piura
Piura
La Arena 30 177
Sullana Bellavista 30 208
Morropon Salitral 32 187
Maynas Iquitos 31 189
Alto Nanay 30 190
Loreto Trompeteros 30 204
Loreto
Mariscal Caballococha 30 182Castilla
Alto Yurimaguas 30 182Amazonas
Tumbes Tumbes Corrales 31 198
Zarumilla Aguas Verdes 30 181
TOTAL 364 2 332
Malingas, El Car-bón, Cruzeta
Nuevo Sta. Rosa,Chato Grande,Pozo de los Ra-mos
13 de Abril, Yapa-tera, La Victoria
Tupac Amaru
Carrasquillo
Samito
Santa Maria DeNanay
Peruanito, SJ deTrompeteros, Pu-cacuro, Santa Ele-na, Palmeras
Nueva Esperan-za, Sanchez Ce-rro, San Fco deMarichin, San Pe-dro
Pampa Hermosa
Corrales, La Gari-ta, Malval
Aguas Verdes, LaCurva
Chart 3
52.
Th
e e
con
om
ic im
pa
ct o
f ma
laria
in P
eru
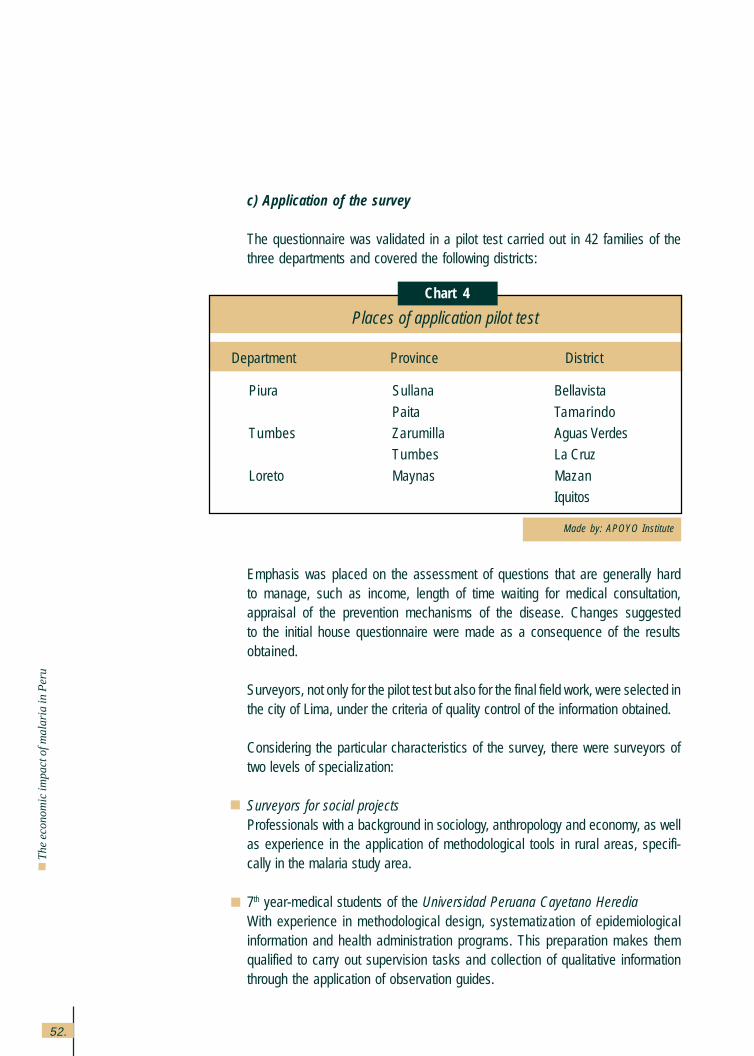
c) Application of the survey
The questionnaire was validated in a pilot test carried out in 42 families of thethree departments and covered the following districts:
Emphasis was placed on the assessment of questions that are generally hardto manage, such as income, length of time waiting for medical consultation,appraisal of the prevention mechanisms of the disease. Changes suggestedto the initial house questionnaire were made as a consequence of the resultsobtained.
Surveyors, not only for the pilot test but also for the final field work, were selected inthe city of Lima, under the criteria of quality control of the information obtained.
Considering the particular characteristics of the survey, there were surveyors oftwo levels of specialization:
Surveyors for social projectsProfessionals with a background in sociology, anthropology and economy, as wellas experience in the application of methodological tools in rural areas, specifi-cally in the malaria study area.
7th year-medical students of the Universidad Peruana Cayetano HerediaWith experience in methodological design, systematization of epidemiologicalinformation and health administration programs. This preparation makes themqualified to carry out supervision tasks and collection of qualitative informationthrough the application of observation guides.
Made by: APOYO Institute
Places of application pilot test
Department Province District
Piura Sullana Bellavista
Paita Tamarindo
Tumbes Zarumilla Aguas Verdes
Tumbes La Cruz
Loreto Maynas Mazan
Iquitos
Chart 4
53.
Methodology used in the economic costs estimation of malaria
In regard to the application of the survey, the following activities were also per-formed:
Systematization of the qualitative information gathered through observation guidesin meetings with all the evaluation team to compare results by areas and preparepreliminary conclusions.
Quality control of the information collected. Considering the type of informationgathered by the survey, once the field work was finished, they proceeded to cleanout and review the surveys. This process was performed with the physical pres-ence of the surveyors.
In order to guarantee the quality of the information, work was carried out incoordination with field supervisors, which allowed for a strict quality control ofthe data collected. Additionally, an exhaustive desk was performed and it helpedto overcome some minor problems in the coding of options on behalf of theevaluators.
Also, an analysis of the data collected by the survey was performed by meansof a program especially designed that allowed crossings and pertinent corre-lations.
d) Value of time
The methods found by Mills (1989) to appraise the lost days are varied: salaries,average agricultural productivity, elasticity of the product to the work offer, marginalproductivity calculated from a Cobb-Douglas production function, income percapita, income per capita adjusted by differences in sex and age, salariesdifferenced by sex, salaries for employees, 50% of the salaries for those under-employed and zero for unemployed individuals.
This study, due to the rural condition of most of the families affected and thedifficulty in collecting information, estimated the cost of lost man-hours utiliz-ing information from Living Standards Measurement Survey (LSMS) (CuantoS.A., 1997) for similar areas (rural jungle and rural coast) and, according tothe age and gender profile. To do this, a estimation of the personal incomewas performed processing the LSMS database, considering not only the ba-sic income but the complementary income as well and the principal andsecondary jobs.
54.
Th
e e
con
om
ic im
pa
ct o
f ma
laria
in P
eru
Consideration of work and time that are not negotiated in the market, likedomestic work and leisure time, is common in specialized literature. McGuireet al, indicate that most of the cost-benefit studies consider the female timeaccording to the extra product the woman would obtain if she worked, valuedat market prices and considering it as the opportunity costs. Drummond et al.(1987) propose that leisure time can be valued at price zero, at the price of asimilar salary in the market or at the price of the salary for overtime, but thatthe most common way starts out at zero and performs a sensitivity analysis.This involves carrying out additional estimations, changing the criticalparameters within a reasonable margin in which they can change. Bonilla etal., (1991) value all the time, even the time spent at home and on leisure,according to the average productivity of individuals of similar characteristics(income by worker).
The study used the cost by person-hour, even for children, women and otherindividuals who do not work since this time has a value, estimated accordingto that cost as a shadow price. An alternative estimation was performed for asensitivity analysis in which only half of the market salary was considered forthis market.
On the other hand is the problem of replacing the sick person’s work by a familymember. Najera et al. (1991) indicate that the redistribution of time within thehome can be considered in two ways: as an effect that reduces the costs ofthe disease or simply as a redistribution of the costs. In the study, this aspecthas been considered as part of the second case, that is, as a redistributioninside home that does not reduce the costs for it.
Finally, there is the problem of how to add cost variations to the possibleestimations of the disease. This occurs when the demand for hand labor andthe salaries or shadow prices of the hand labor are higher or lower due toseasonal reasons, such as harvest, planting or others. Konradsen et al., (1997)in a study for Sri Lanka, considered the salary with the higher values in peri-ods of high work demand; the loss of work days is higher during importantagricultural seasons and the total annual cost is between 6% and 18% oftheir annual income.
In the study, we opted to consider these effects according to the answers ofthe patients themselves about whether they had lost an economic opportunityor if they had to face special costs due to these reasons. These losses werevalued with a co-efficient of 10%, located within the class found by Konradesenet al., for Sri Lanka.
55.
Methodology used in the economic costs estimation of malaria
e) Value of life
As for the costs caused by mortality, we calculated the years of useful productivelife lost by mortality on the basis of a maximum productive age of 65 years oldand they were valued according to the profile of income by ages obtainedfrom the LSMS. The possible loss due to mortality by other causes wasdiscounted, utilizing the mortality rates for ages in effect from the CELADE-INEI study for 1995-2000. Given the low mortality rate associated to this disease,the surveys do not have enough representativity to show reliable results, optingfor the use of the surveillance system records that presumably carry a registryof the deaths by this disease.
The costs of mortality must be temporarily discounted although there is adebate in regard to which rate is applicable for the discount. CDC (1995)uses a 3% discount rate, making sensitivity analysis changing it between 0and 8%. In a sensitivity analysis, Cohn (1973) uses a discount rate between 6and 18%, suggesting that the most relevant range is between 10 and 15%.Akhavan (1997) also uses a discount rate of 3% annually. Following interna-tional sources in this regard, the future income was discounted according todifferent rates that range from 1% to 10%, using a rate of 3% as the basisbecause it is the most widely accepted one.
f) Value of suffering
It is proposed that the most adequate appraisal of the cost of disease for thefamilies should be the willingness-to-pay, which is the price the individual orthe family would be willing to pay to get rid of the disease (Hammer 1993,McGuire et al 1994 and Prescott and Warford 1993). This data seems moreexact than that of the effective cost for families as it involves other diseasecosts, such as the cost of suffering for the families and it also adds thosecases where the families do not spend because they prefer to have the diseaseinstead of spending money. From that point of view, the cost effectively incurredby the families would be a minimum value of the total real cost. A similarestimate that could be the upper limit is the willingness-to-accept (Hammer1993), also called compensatory variation (McGuire et al), which would bethe price a person would charge to agree to having the disease, if he/shecould so choose.
In the pilot survey, a question was introduced aimed at capturing this willingnessto pay. However, it was found that individuals did not have an adequate re-sponse, due to the habit of having free treatment and the difficulty of understand-
56.
Th
e e
con
om
ic im
pa
ct o
f ma
laria
in P
eru
ing and responding to a hypothetical situation as “if there were an immediatecure…”. Because of this, this type of appraisal had to be left aside.
4.1.4 Estimation of the costs by loss of tourism
In regards to the effects of malaria on other economic activities, Mills (1989)stated that they are left aside by most of the research studies because they areconsidered untreatable. Mills (1989) only found two studies that explore thistopic: one of them uses a macro-economic model through which the diseaseaffects the demographic behavior and this affects the income per capita; andthe other study investigates the use of the land, but in his opinion, has little solidevidence.
The study looked for information related to tourism. Interviews with seven touristcompanies in Lima and Iquitos were carried out, giving more privilege to theleading companies and to those that sell tourist packages abroad to come tothe jungle area. Also, interviews with leaders of the various fields of the sectorwere performed.
Additionally, official information was obtained on the number of tourists thatvisited the study sites, as well as on the average amount spent by each touristin Peru. This last piece of information was obtained from a survey annuallyperformed by the Banco Central de Reserva (BCR) to estimate the income bytourism and that is used as the bases for estimates in this item in the Balanceof Payments.
Starting out from this information, we estimated the loss for tourism multiplyingthe percentage of tourists lost due to this disease times the total number oftourists visiting the site times the average amount spent per tourist, figure thatwas estimated by the Ministry of Industry and Tourism (MITINCI) and/ or theBCR. Since the first parameter was hard to identify, the results must be inter-preted as proxies, that is simple magnitude orders of what this cost could beachieving.
4.2 Possible bias and deficiencies in the methodology used
It is necessary to point out that the methodology inevitably has weaknesses andimperfections that need to be evaluated to find out the possible bias the informationmay have.
57.
Methodology used in the economic costs estimation of malaria
The main bias and deficiencies may be associated to the following considerations:
The estimated cost is an approximation to the cost the country actually had in1998 and does not take into account approximations of the counter-factualtype, that is, of how much the cost would be if no malaria control actions hadbeen performed.
Stated above, the survey of houses and search for information in other publicand private institutions was performed in the areas with the highest malariaincidence and with this baseline, we estimated the total economic costs inthese areas and also an average unit cost per case. With these data, weextrapolated the cost of malaria at national level over the basis of the totalnumber of existing cases. However, it is possible that elements such as theseverity of the disease and use of services may not be similar in the areaswith the highest incidence and those with less number of cases. Presumably,in areas with extensive malaria presence, the population has higher levels ofimmunization and deeper knowledge of the disease, which probably reducesits costs.
Unit costs for personnel and health care services were estimated based onthe health facilities in those regions most severely affected by malaria. Otherregions are likely to have higher costs due to the lower prevalence anddisplacement of the population. It must be highlighted that this bias is oppositeto the one before, which may decrease the total bias.
It was not possible to quantify other possible economic effects of the diseaseover productive activities due to the difficulty in the estimation. We measuredthe direct effects of malaria on the group of productive activities due to man-hours lost. However, issues such as the possible reduction of investment oreffects on transportation and commerce caused by changes on the behaviorof the economic agents (investors decide not to go ahead with their investmentbecause of malaria or commerce does not happen and thus, affects otheractivities) require too much information that is hard to correct and quantify,thus not making a reliable estimation.
It is possible for a malaria consequence to increase the probability of havingother diseases in later years, even when the patient has been cured of malaria.This would, in turn, have direct and indirect costs not taken into considerationby the study.
One must take into consideration that we made a estimation of the cost thedisease actually has, but it is possible for there to be an important degree of
58.
Th
e e
con
om
ic im
pa
ct o
f ma
laria
in P
eru
uncovered needs due to the deficiency of the supply side, particularly in re-gard to complex care. This is a “hidden” cost of the disease that must appearas the perception of the need by the ill people increase and as the availabilityof the offer increases in regard to these health problems.
The possible effects of the confluence of the disease seasonality and the season-ality of the requirements for hand labor for agricultural production and other activi-ties are approximate figures supposing coefficients of higher loss given the diffi-culty to estimate different shadow salaries in different periods of the agriculturalproductive process.
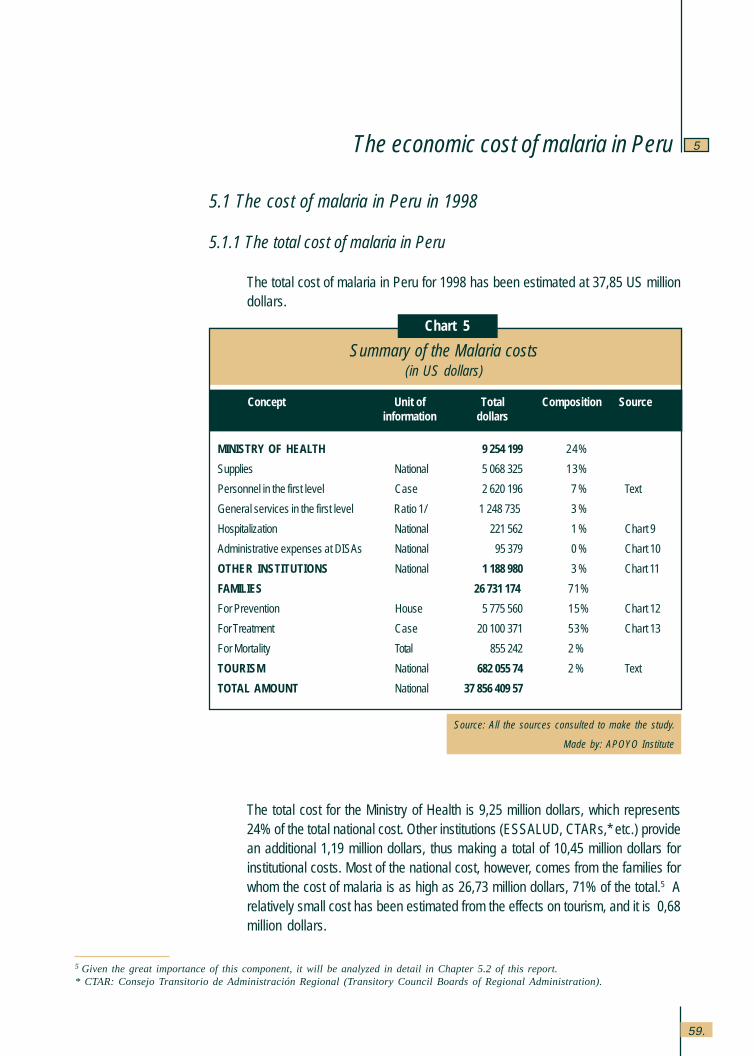
59.
The economic cost of malaria in Peru 5
Source: All the sources consulted to make the study.
Made by: APOYO Institute
Chart 5
Summary of the Malaria costs(in US dollars)
Concept Unit of Total Composition Sourceinformation dollars
MINISTRY OF HEALTH 9,254,199 24%
Supplies National 5,068,325 13%
Personnel in the first level Case 2,620,196 7 % Text
General services in the first level Ratio 1/ 1,248,735, 3 %
Hospitalization National 221,562 1 % Chart 9
Administrative expenses at DISAs National 95,379 0 % Chart 10
OTHER INSTITUTIONS National 1,188,980 3 % Chart 11
FAMILIES 26,731,174, 71%
For Prevention House 5,775,560 15% Chart 12
For Treatment Case 20,100,371 53% Chart 13
For Mortality Total 855,242 2 %
TOURISM National 682,055,74 2 % Text
TOTAL AMOUNT National 37,856,409,57
5.1 The cost of malaria in Peru in 1998
5.1.1 The total cost of malaria in Peru
The total cost of malaria in Peru for 1998 has been estimated at 37,85 US milliondollars.
The total cost for the Ministry of Health is 9,25 million dollars, which represents24% of the total national cost. Other institutions (ESSALUD, CTARs,* etc.) providean additional 1,19 million dollars, thus making a total of 10,45 million dollars forinstitutional costs. Most of the national cost, however, comes from the families forwhom the cost of malaria is as high as 26,73 million dollars, 71% of the total.5 Arelatively small cost has been estimated from the effects on tourism, and it is 0,68million dollars.
5 Given the great importance of this component, it will be analyzed in detail in Chapter 5.2 of this report.* CTAR: Consejo Transitorio de Administración Regional (Transitory Council Boards of Regional Administration).
The economic cost of malaria in Peru
60.
Th
e e
con
om
ic im
pa
ct o
f ma
laria
in P
eru
As observed, the relationship between the institutional spending and the expensefor society is quite uneven. The State and in lesser degree, some other organiza-tions of the civil society, spend close to one third of what malaria costs the rest ofthe society, the individuals and families and the economic activity. Unable to es-tablish a concluding causality in this regard, this would suggest a weakness onbehalf of these organizations in adequately perceiving the interests of society. Thisis a problem of the public good identified in the economic theory; if there is nomarket mechanism to channel the demand, this must be expressed through col-lective forms that have a cost of organization. There is also the problem of the freerider, there are no incentives to the individual participation because this has costswhereas the benefits are public, that is not excluding. In the case of malaria, theseproblems, probably worsen due to the isolation and dispersion of the principalindividuals affected, as well as to their lack of knowledge of the existing possibili-ties to reinforce the struggle to control the disease.
5.1.2 The Ministry of Health Costs
The study has established differences in the Ministry of Health costs betweensupplies (goods and services) and transferences sent from the central level spe-cifically for malaria, personnel expenses and other expenses for general andintermediate services, as well as administration.
As for the resources specifically sent for malaria control from the central level,information was gathered about expenses made by the various programs andprojects, which added to 5,07 million dollars for 1998. (See Chart 6).
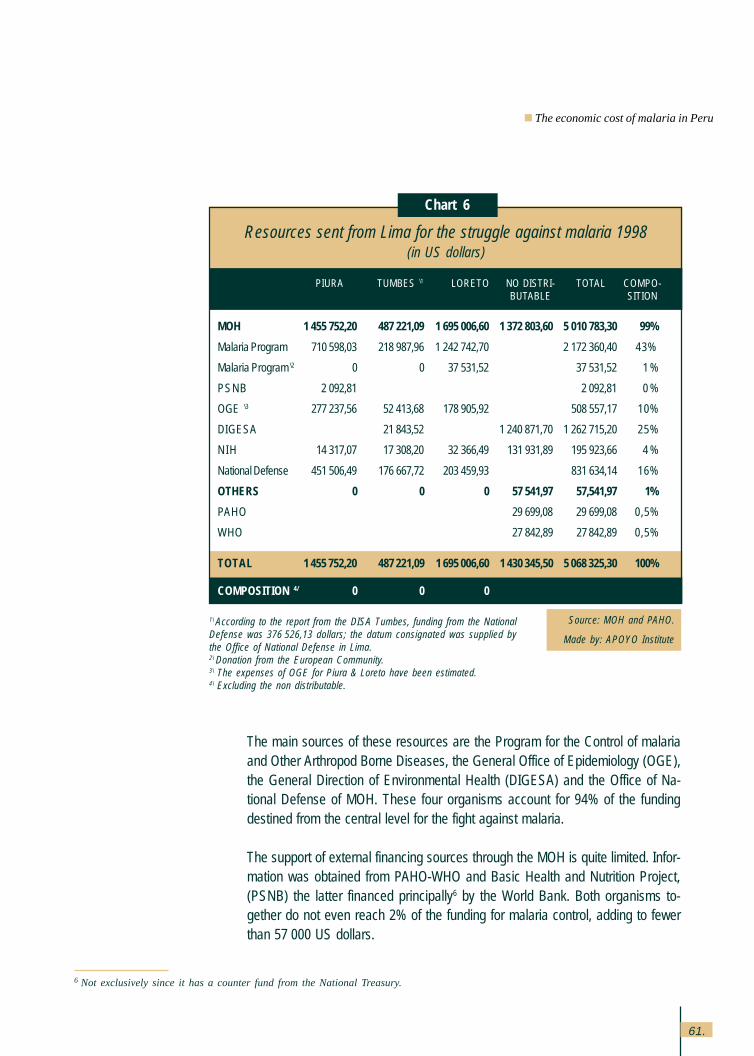
61.
The main sources of these resources are the Program for the Control of malariaand Other Arthropod Borne Diseases, the General Office of Epidemiology (OGE),the General Direction of Environmental Health (DIGESA) and the Office of Na-tional Defense of MOH. These four organisms account for 94% of the fundingdestined from the central level for the fight against malaria.
The support of external financing sources through the MOH is quite limited. Infor-mation was obtained from PAHO-WHO and Basic Health and Nutrition Project,(PSNB) the latter financed principally6 by the World Bank. Both organisms to-gether do not even reach 2% of the funding for malaria control, adding to fewerthan 57,000 US dollars.
Source: MOH and PAHO.
Made by: APOYO Institute
Chart 6
Resources sent from Lima for the struggle against malaria 1998(in US dollars)
PIURA TUMBES \1 LORETO NO DISTRI- TOTAL COMPO-BUTABLE SITION
MOH 1,455,752,20 487,221,09 1,695,006,60 1,372,803,60 5,010,783,30 99%
Malaria Program 710,598,03 218,987,96 1,242,742,70 2,172,360,40 43%
Malaria Program \2 0 0 37,531,52 37,531,52 1 %
PSNB 2,092,81 2,092,81 0 %
OGE \3 277,237,56 52,413,68 178,905,92 508,557,17 10%
DIGESA 21,843,52 1,240,871,70 1,262,715,20 25%
NIH 14,317,07 17,308,20 32,366,49 131,931,89 195,923,66 4 %
National Defense 451,506,49 176,667,72 203,459,93 831,634,14 16%
OTHERS 0 0 0 57,541,97 57,541,97 1%
PAHO 29,699,08 29,699,08 0,5%
WHO 27,842,89 27 842,89 0,5%
TOTAL 1 455 752,20 487 221,09 1 695 006,60 1 430 345,50 5 068 325,30 100%
COMPOSITION 4/ 0 0 0
1\ According to the report from the DISA Tumbes, funding from the NationalDefense was 376,526,13 dollars; the datum consignated was supplied bythe Office of National Defense in Lima.2\ Donation from the European Community.3\ The expenses of OGE for Piura & Loreto have been estimated.4\ Excluding the non distributable.
6 Not exclusively since it has a counter fund from the National Treasury.
The economic cost of malaria in Peru
62.
Th
e e
con
om
ic im
pa
ct o
f ma
laria
in P
eru
According to the information obtained, these resources were practically in-tended for Loreto and the northern coast (Piura y Tumbes) in equal amounts,although during 1998, there was a higher incidence of malaria in the northerncoastal area (93,000 cases versus 54,000 in Loreto), particularly of the malig-nant variety or falciparum of severe consequences to the health (47,000 versus22,000 cases in Loreto). Since the evolution of the malaria epidemic in 1998in these areas depends as much on natural environmental conditions (espe-cially the El Niño phenomenon) as on the control actions carried out, it is notpossible to conclude that there is an incorrect or unequal distribution of re-sources as it is possible that the lesser incidence of malaria in Loreto is dueto the transference of funding.
On the other hand, the difference in the resources sent to Piura and Tumbesmay be revealing the greater importance awarded by the authorities to themalignant variety of malaria. In fact, almost four times the amount of fundingsent to Tumbes was sent to Piura, in spite of the total number of malaria caseswhich is only 58% higher. However, the concentration of cases of malignantmalaria is indeed much higher in Piura than in Tumbes (almost six times morecases).
The various activities where malaria control funding can be assigned havebeen identified for two thirds of this funding (See Chart 7). Of this, a little less than20% is dedicated to surveillance and almost one third to prevention. The rest(49%) is oriented at detection and treatment of cases. Surveillance and preven-tion are assigned relatively more funding in the northern coastal area than inLoreto.
On the other hand is the cost faced by primary health facilities for personneland services funded with other resources, mainly the regional budgets and theBasic Health for All Program (PSBT). In this regard, the costs for personnel andgeneral and intermediate services have been estimated without taken intoconsideration the costs of capital (infrastructure and equipment) given thedifficulties met in their estimation.
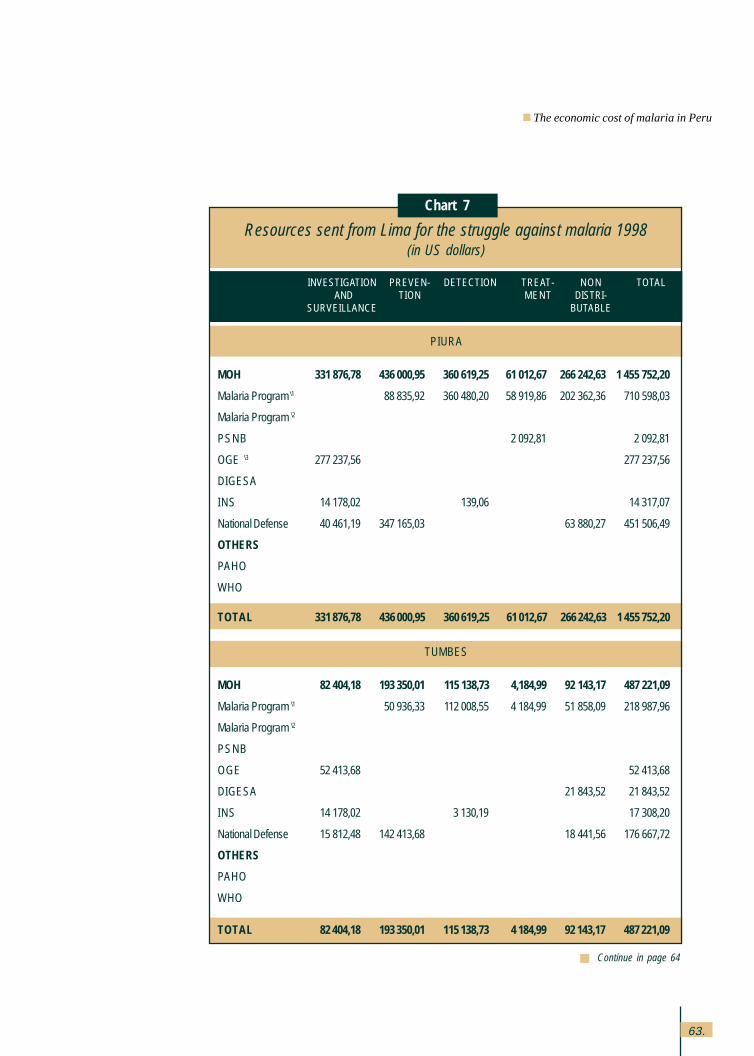
63.
Resources sent from Lima for the struggle against malaria 1998(in US dollars)
INVESTIGATION PREVEN- DETECTION TREAT- NON TOTAL AND TION MENT DISTRI-
SURVEILLANCE BUTABLE
PIURA
MOH 331,876,78 436,000,95 360,619,25 61,012,67 266,242,63 1,455,752,20
Malaria Program \1 88,835,92 360,480,20 58,919,86 202,362,36 710,598,03
Malaria Program \2
PSNB 2,092,81 2,092,81
OGE \3 277,237,56 277,237,56
DIGESA
INS 14,178,02 139,06 14,317,07
National Defense 40,461,19 347,165,03 63,880,27 451,506,49
OTHERS
PAHO
WHO
TOTAL 331 876,78 436 000,95 360 619,25 61 012,67 266 242,63 1 455 752,20
TUMBES
MOH 82,404,18 193,350,01 115,138,73 4,184,99 92,143,17 487,221,09
Malaria Program \1 50,936,33 112,008,55 4,184,99 51,858,09 218,987,96
Malaria Program \2
PSNB
OGE 52,413,68 52,413,68
DIGESA 21,843,52 21,843,52
INS 14.178,02 3,130,19 17,308,20
National Defense 15,812,48 142,413,68 18,441,56 176,667,72
OTHERS
PAHO
WHO
TOTAL 82 404,18 193 350,01 115 138,73 4 184,99 92 143,17 487 221,09
Continue in page 64
Chart 7
The economic cost of malaria in Peru
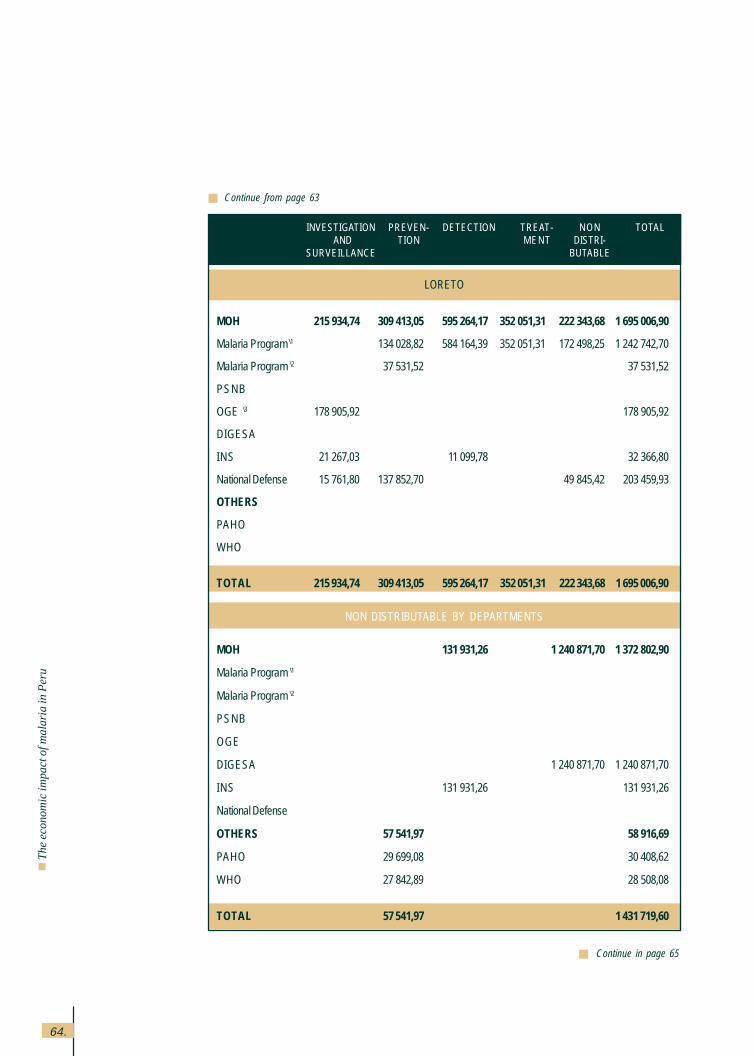
64.
Th
e e
con
om
ic im
pa
ct o
f ma
laria
in P
eru
INVESTIGATION PREVEN- DETECTION TREAT- NON TOTAL AND TION MENT DISTRI-
SURVEILLANCE BUTABLE
Continue in page 65
Continue from page 63
LORETO
MOH 215,934,74 309,413,05 595,264,17 352,051,31 222,343,68 1,695,006,90
Malaria Program \1 134,028,82 584,164,39 352,051,31 172,498,25 1,242,742,70
Malaria Program \2 37,531,52 37,531,52
PSNB
OGE \3 178,905,92 178,905,92
DIGESA
INS 21,267,03 11,099,78 32,366,80
National Defense 15,761,80 137,852,70 49,845,42 203,459,93
OTHERS
PAHO
WHO
TOTAL 215 934,74 309 413,05 595 264,17 352 051,31 222 343,68 1 695 006,90
NON DISTRIBUTABLE BY DEPARTMENTS
MOH 131,931,26 1,240,871,70 1,372,802,90
Malaria Program \1
Malaria Program \2
PSNB
OGE
DIGESA 1,240,871,70 1,240,871,70
INS 131,931,26 131,931,26
National Defense
OTHERS 57,541,97 58,916,69
PAHO 29,699,08 30,408,62
WHO 27,842,89 28,508,08
TOTAL 57 541,97 1 431 719,60
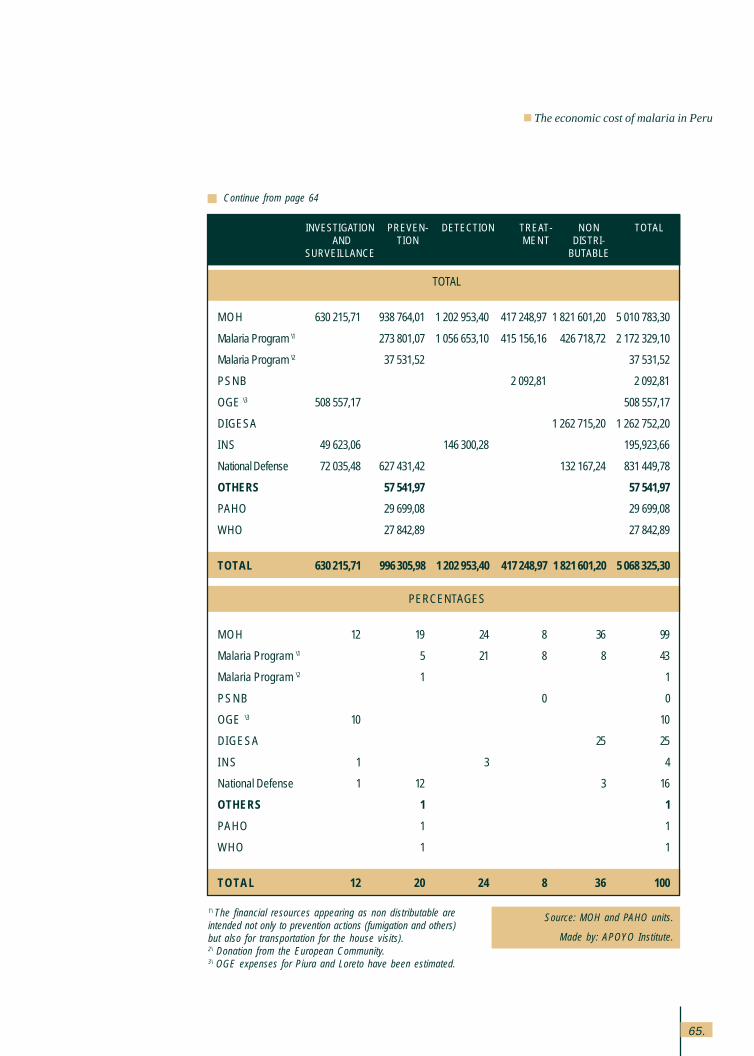
65.
INVESTIGATION PREVEN- DETECTION TREAT- NON TOTAL AND TION MENT DISTRI-
SURVEILLANCE BUTABLE
Continue from page 64
Source: MOH and PAHO units.
Made by: APOYO Institute.
1\ The financial resources appearing as non distributable areintended not only to prevention actions (fumigation and others)but also for transportation for the house visits).2\ Donation from the European Community.3\ OGE expenses for Piura and Loreto have been estimated.
TOTAL
MOH 630,215,71 938,764,01 1,202,953,40 417,248,97 1,821,601,20 5,010,783,30
Malaria Program \1 273,801,07 1,056,653,10 415,156,16 426,718,72 2,172,329,10
Malaria Program \2 37,531,52 37,531,52
PSNB 2,092,81 2,092,81
OGE \3 508,557,17 508,557,17
DIGESA 1,262,715,20 1,262.752,20
INS 49,623,06 146,300,28 195,923,66
National Defense 72,035,48 627,431,42 132,167,24 831,449,78
OTHERS 57,541,97 57,541,97
PAHO 29,699,08 29,699,08
WHO 27,842,89 27,842,89
TOTAL 630 215,71 996 305,98 1 202 953,40 417 248,97 1 821 601,20 5 068 325,30
PERCENTAGES
MOH 12 19 24 8 36 99
Malaria Program \1 5 21 8 8 43
Malaria Program \2 1 1
PSNB 0 0
OGE \3 10 10
DIGESA 25 25
INS 1 3 4
National Defense 1 12 3 16
OTHERS 1 1
PAHO 1 1
WHO 1 1
TOTAL 12 20 24 8 36 100
The economic cost of malaria in Peru
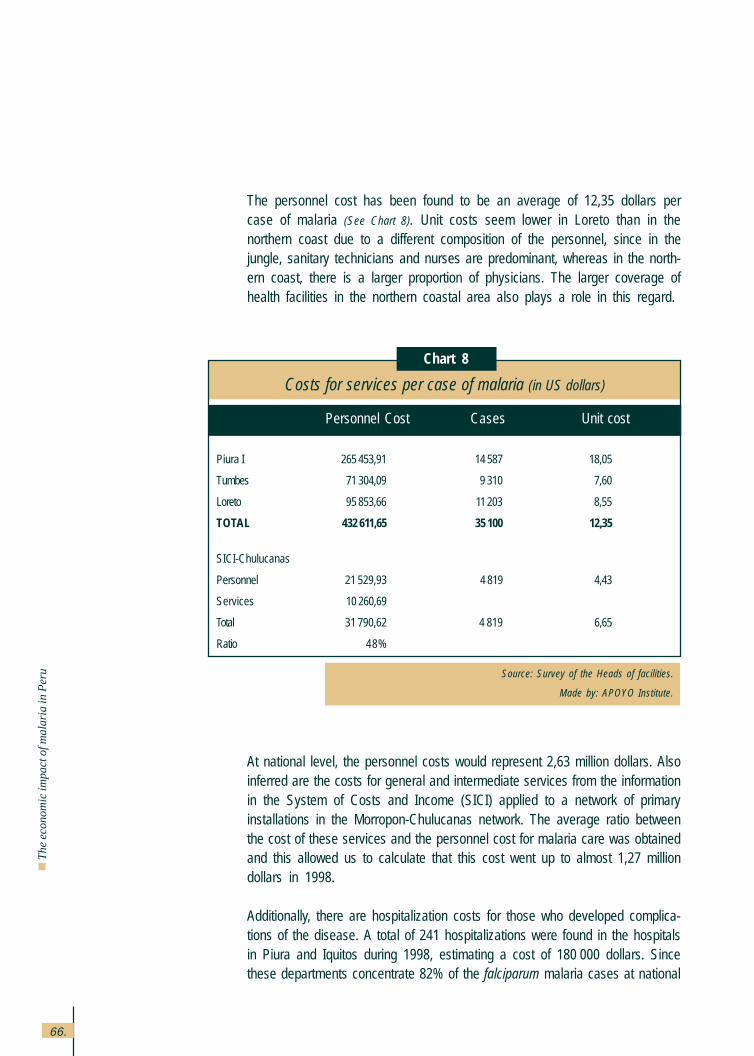
66.
Th
e e
con
om
ic im
pa
ct o
f ma
laria
in P
eru
The personnel cost has been found to be an average of 12,35 dollars percase of malaria (See Chart 8). Unit costs seem lower in Loreto than in thenorthern coast due to a different composition of the personnel, since in thejungle, sanitary technicians and nurses are predominant, whereas in the north-ern coast, there is a larger proportion of physicians. The larger coverage ofhealth facilities in the northern coastal area also plays a role in this regard.
At national level, the personnel costs would represent 2,63 million dollars. Alsoinferred are the costs for general and intermediate services from the informationin the System of Costs and Income (SICI) applied to a network of primaryinstallations in the Morropon-Chulucanas network. The average ratio betweenthe cost of these services and the personnel cost for malaria care was obtainedand this allowed us to calculate that this cost went up to almost 1,27 milliondollars in 1998.
Additionally, there are hospitalization costs for those who developed complica-tions of the disease. A total of 241 hospitalizations were found in the hospitalsin Piura and Iquitos during 1998, estimating a cost of 180,000 dollars. Sincethese departments concentrate 82% of the falciparum malaria cases at national
Source: Survey of the Heads of facilities.
Made by: APOYO Institute.
Chart 8
Costs for services per case of malaria (in US dollars)
Personnel Cost Cases Unit cost
Piura I 265 453,91 14 587 18,05
Tumbes 71 304,09 9 310 7,60
Loreto 95 853,66 11 203 8,55
TOTAL 432 611,65 35 100 12,35
SICI-Chulucanas
Personnel 21 529,93 4 819 4,43
Services 10 260,69
Total 31 790,62 4 819 6,65
Ratio 48%
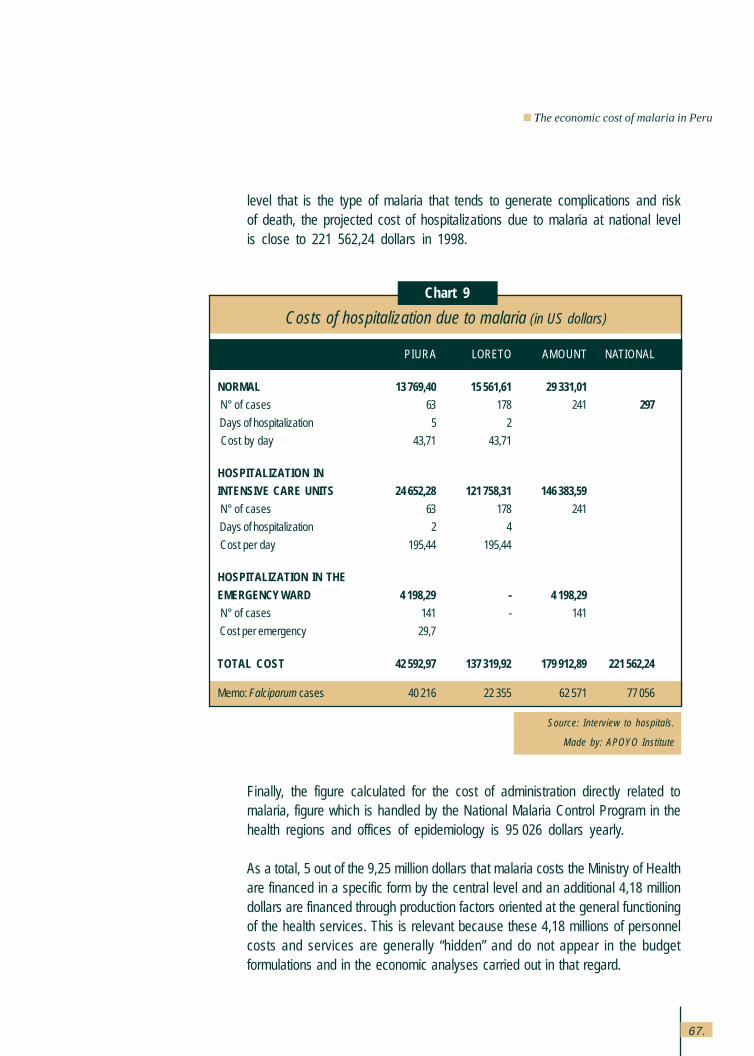
67.
Finally, the figure calculated for the cost of administration directly related tomalaria, figure which is handled by the National Malaria Control Program in thehealth regions and offices of epidemiology is 95,026 dollars yearly.
As a total, 5 out of the 9,25 million dollars that malaria costs the Ministry of Healthare financed in a specific form by the central level and an additional 4,18 milliondollars are financed through production factors oriented at the general functioningof the health services. This is relevant because these 4,18 millions of personnelcosts and services are generally “hidden” and do not appear in the budgetformulations and in the economic analyses carried out in that regard.
Source: Interview to hospitals.
Made by: APOYO Institute
Chart 9
Costs of hospitalization due to malaria (in US dollars)
PIURA LORETO AMOUNT NATIONAL
NORMAL 13 769,40 15 561,61 29 331,01
N° of cases 63 178 241 297
Days of hospitalization 5 2
Cost by day 43,71 43,71
HOSPITALIZATION IN
INTENSIVE CARE UNITS 24 652,28 121 758,31 146 383,59
N° of cases 63 178 241
Days of hospitalization 2 4
Cost per day 195,44 195,44
HOSPITALIZATION IN THE
EMERGENCY WARD 4 198,29 - 4 198,29
N° of cases 141 - 141
Cost per emergency 29,7
TOTAL COST 42 592,97 137 319,92 179 912,89 221 562,24
Memo: Falciparum cases 40 216 22 355 62 571 77 056
level that is the type of malaria that tends to generate complications and riskof death, the projected cost of hospitalizations due to malaria at national levelis close to 221 562,24 dollars in 1998.
The economic cost of malaria in Peru
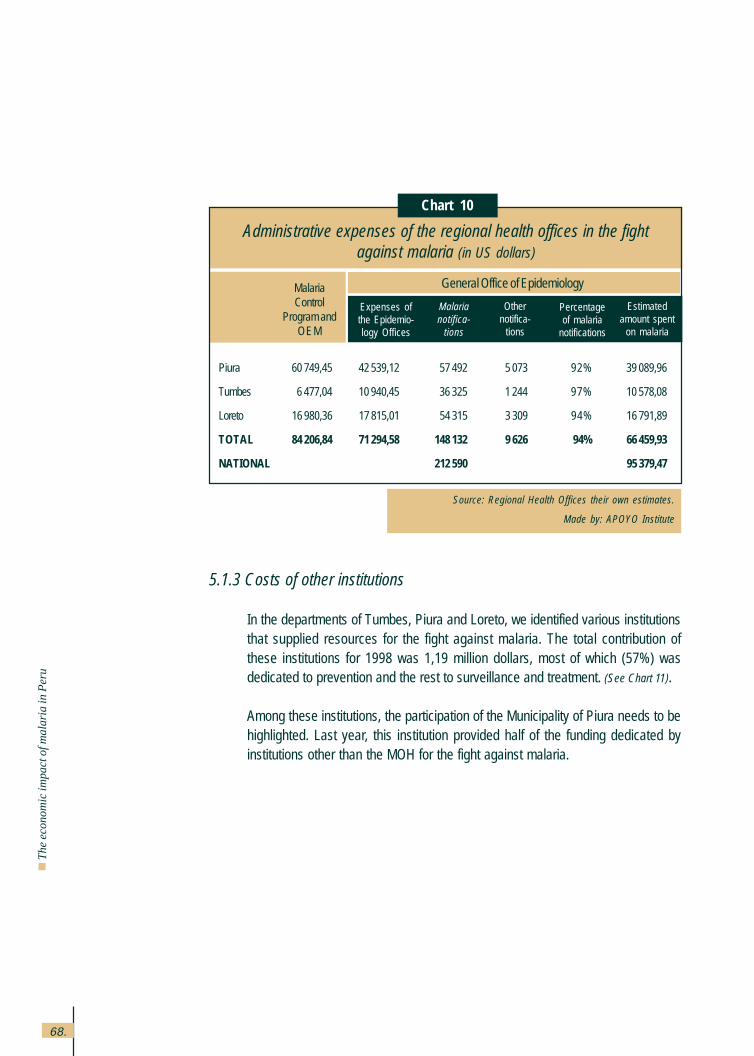
68.
Th
e e
con
om
ic im
pa
ct o
f ma
laria
in P
eru
5.1.3 Costs of other institutions
In the departments of Tumbes, Piura and Loreto, we identified various institutionsthat supplied resources for the fight against malaria. The total contribution ofthese institutions for 1998 was 1,19 million dollars, most of which (57%) wasdedicated to prevention and the rest to surveillance and treatment. (See Chart 11).
Among these institutions, the participation of the Municipality of Piura needs to behighlighted. Last year, this institution provided half of the funding dedicated byinstitutions other than the MOH for the fight against malaria.
Source: Regional Health Offices their own estimates.
Made by: APOYO Institute
Chart 10
Administrative expenses of the regional health offices in the fightagainst malaria (in US dollars)
MalariaControl
Program andOEM
Expenses ofthe Epidemio-logy Offices
Malarianotifica-
tions
Othernotifica-
tions
Percentageof malaria
notifications
Estimatedamount spent
on malaria
General Office of Epidemiology
Piura 60 749,45 42 539,12 57 492 5 073 92% 39 089,96
Tumbes 6 477,04 10 940,45 36 325 1 244 97% 10 578,08
Loreto 16 980,36 17 815,01 54 315 3 309 94% 16 791,89
TOTAL 84 206,84 71 294,58 148 132 9 626 94% 66 459,93
NATIONAL 212 590 95 379,47
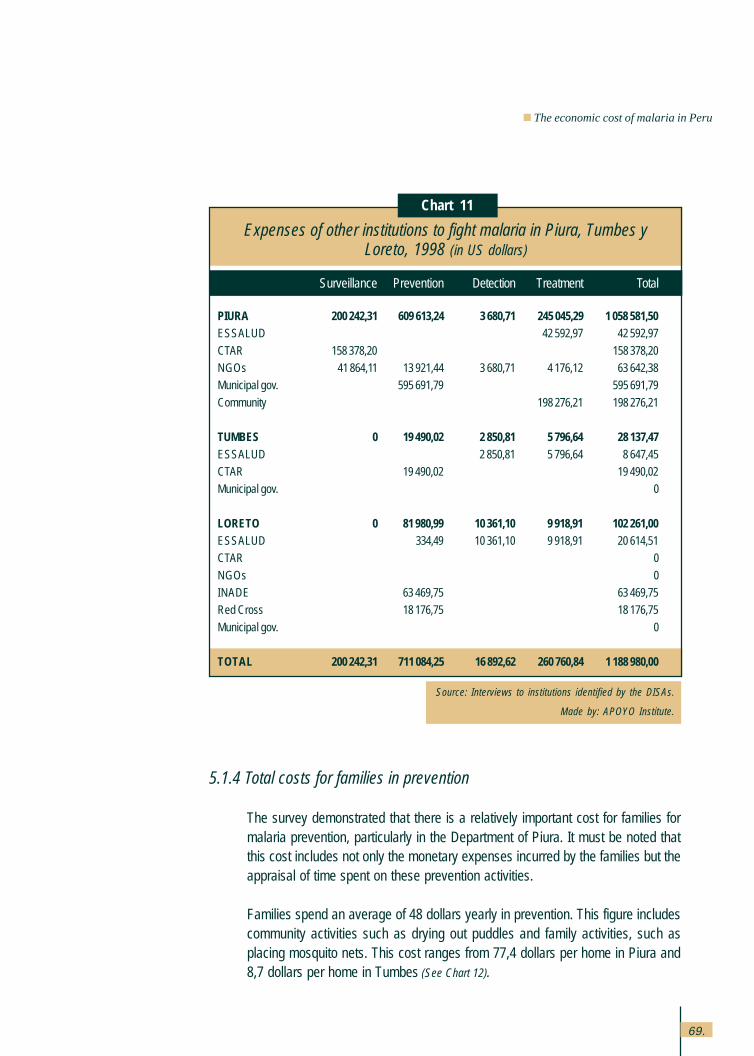
69.
5.1.4 Total costs for families in prevention
The survey demonstrated that there is a relatively important cost for families formalaria prevention, particularly in the Department of Piura. It must be noted thatthis cost includes not only the monetary expenses incurred by the families but theappraisal of time spent on these prevention activities.
Families spend an average of 48 dollars yearly in prevention. This figure includescommunity activities such as drying out puddles and family activities, such asplacing mosquito nets. This cost ranges from 77,4 dollars per home in Piura and8,7 dollars per home in Tumbes (See Chart 12).
Source: Interviews to institutions identified by the DISAs.
Made by: APOYO Institute.
Expenses of other institutions to fight malaria in Piura, Tumbes yLoreto, 1998 (in US dollars)
Surveillance Prevention Detection Treatment Total
PIURA 200 242,31 609 613,24 3 680,71 245 045,29 1 058 581,50ESSALUD 42 592,97 42 592,97
CTAR 158 378,20 158 378,20NGOs 41 864,11 13 921,44 3 680,71 4 176,12 63 642,38Municipal gov. 595 691,79 595 691,79
Community 198 276,21 198 276,21
TUMBES 0 19 490,02 2 850,81 5 796,64 28 137,47ESSALUD 2 850,81 5 796,64 8 647,45CTAR 19 490,02 19 490,02Municipal gov. 0
LORETO 0 81 980,99 10 361,10 9 918,91 102 261,00ESSALUD 334,49 10 361,10 9 918,91 20 614,51CTAR 0
NGOs 0INADE 63 469,75 63 469,75Red Cross 18 176,75 18 176,75
Municipal gov. 0
TOTAL 200 242,31 711 084,25 16 892,62 260 760,84 1 188 980,00
Chart 11
The economic cost of malaria in Peru
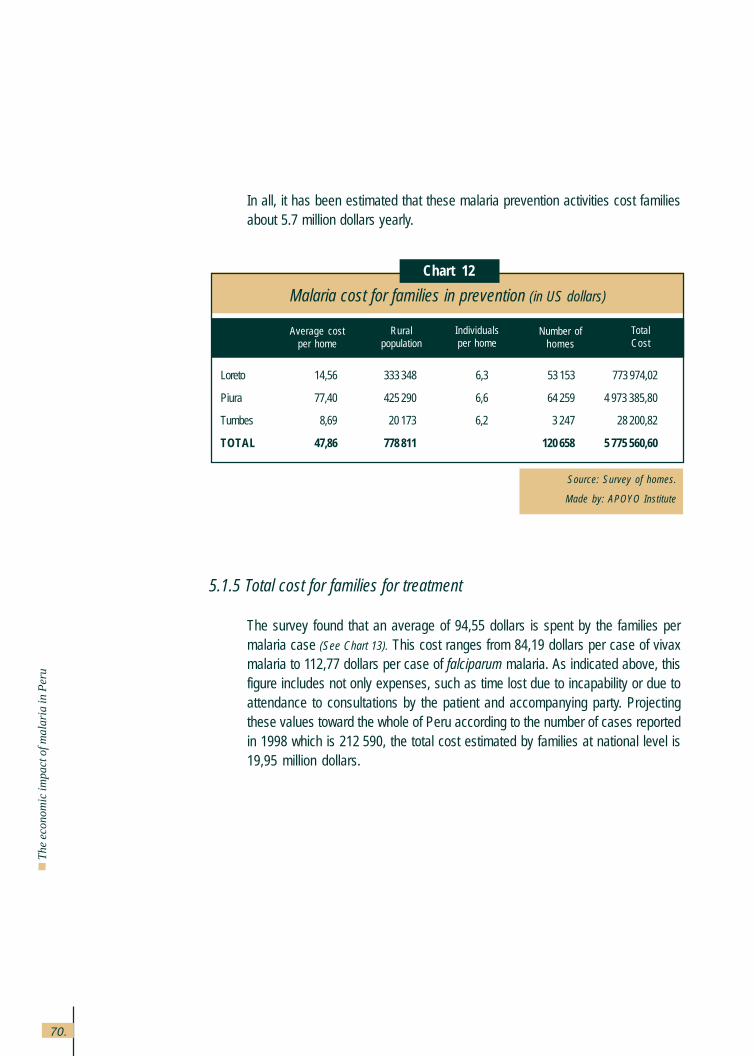
70.
Th
e e
con
om
ic im
pa
ct o
f ma
laria
in P
eru
In all, it has been estimated that these malaria prevention activities cost familiesabout 5.7 million dollars yearly.
5.1.5 Total cost for families for treatment
The survey found that an average of 94,55 dollars is spent by the families permalaria case (See Chart 13). This cost ranges from 84,19 dollars per case of vivaxmalaria to 112,77 dollars per case of falciparum malaria. As indicated above, thisfigure includes not only expenses, such as time lost due to incapability or due toattendance to consultations by the patient and accompanying party. Projectingthese values toward the whole of Peru according to the number of cases reportedin 1998 which is 212,590, the total cost estimated by families at national level is19,95 million dollars.
Source: Survey of homes.
Made by: APOYO Institute
Chart 12
Malaria cost for families in prevention (in US dollars)
Loreto 14,56 333 348 6,3 53 153 773 974,02
Piura 77,40 425 290 6,6 64 259 4 973 385,80
Tumbes 8,69 20 173 6,2 3 247 28 200,82
TOTAL 47,86 778 811 120 658 5 775 560,60
Average costper home
Ruralpopulation
Individualsper home
Number ofhomes
TotalCost
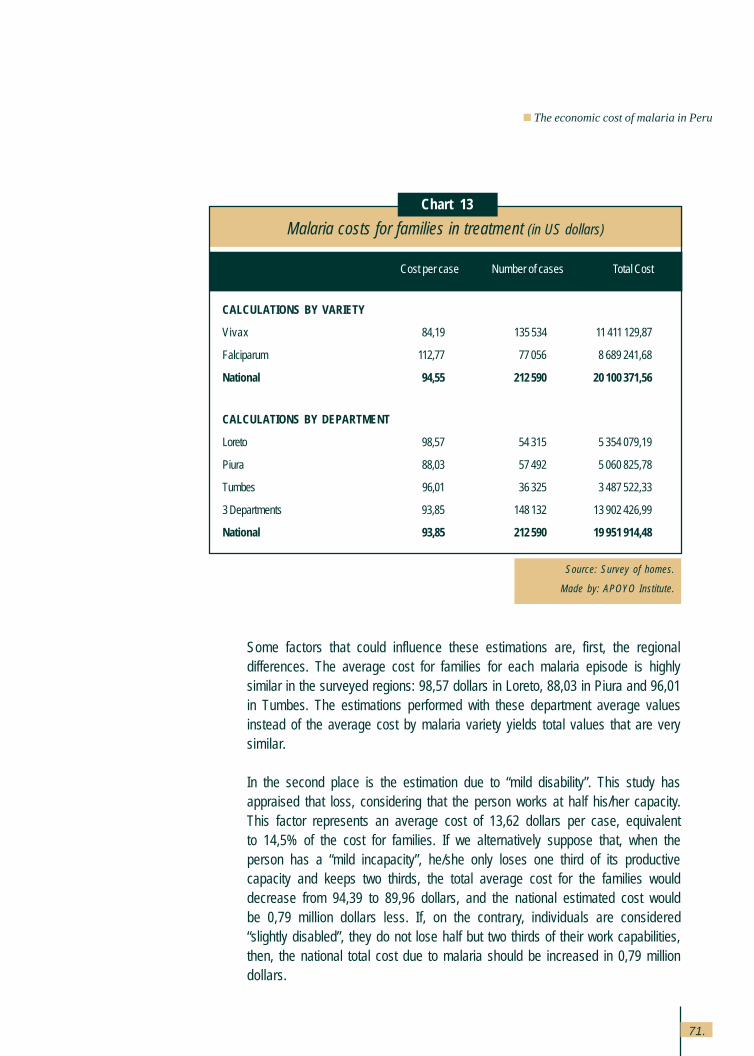
71.
Some factors that could influence these estimations are, first, the regionaldifferences. The average cost for families for each malaria episode is highlysimilar in the surveyed regions: 98,57 dollars in Loreto, 88,03 in Piura and 96,01in Tumbes. The estimations performed with these department average valuesinstead of the average cost by malaria variety yields total values that are verysimilar.
In the second place is the estimation due to “mild disability”. This study hasappraised that loss, considering that the person works at half his/her capacity.This factor represents an average cost of 13,62 dollars per case, equivalentto 14,5% of the cost for families. If we alternatively suppose that, when theperson has a “mild incapacity”, he/she only loses one third of its productivecapacity and keeps two thirds, the total average cost for the families woulddecrease from 94,39 to 89,96 dollars, and the national estimated cost wouldbe 0,79 million dollars less. If, on the contrary, individuals are considered“slightly disabled”, they do not lose half but two thirds of their work capabilities,then, the national total cost due to malaria should be increased in 0,79 milliondollars.
Source: Survey of homes.
Made by: APOYO Institute.
Chart 13
Malaria costs for families in treatment (in US dollars)
Cost per case Number of cases Total Cost
CALCULATIONS BY VARIETY
Vivax 84,19 135 534 11 411 129,87
Falciparum 112,77 77 056 8 689 241,68
National 94,55 212 590 20 100 371,56
CALCULATIONS BY DEPARTMENT
Loreto 98,57 54 315 5 354 079,19
Piura 88,03 57 492 5 060 825,78
Tumbes 96,01 36 325 3 487 522,33
3 Departments 93,85 148 132 13 902 426,99
National 93,85 212 590 19 951 914,48
The economic cost of malaria in Peru
72.
Th
e e
con
om
ic im
pa
ct o
f ma
laria
in P
eru
In regards to the appraisal of time of those who do not participate in the workmarket or in productive activities, the total cost for time lost is only 12,7% forchildren from 6 to 15 and individuals over 65 years old. The appraisal of timeat half the market salary would reduce the cost in 6,3%, that is, in 1,27 milliondollars.
For those who declared occupations that are not valued in the market, thestudy established a value for their time that was equivalent to the salary theywould get in the market. Under this estimation, housewives contributed with36% of the time lost, students contributed with 11% of this cost and the unem-ployed with 0,2%. An appraisal at half the market salary for these occupationswould reduce the estimation of the malaria cost in 4,75 million dollars. How-ever, various studies have established that in the rural areas, even womenwho state they are housewives participate in productive tasks because thereis no clear difference between production tasks and consumption tasks. Thus,the woman participates in animal care, in agricultural activity when morehand labor is required (times of planting and harvesting), in artisan craft activi-ties and activities of transformation, among others. Supposing that those whodeclare to be housewives have a shadow hand labor cost of 75% of themarket salary and the students and the unemployed only have half of thesalary as the shadow price for their time, the cost of malaria would be lessthan the cost of 2,95 million dollars.
Finally, the estimation also includes an additional cost of 10% over the timelost for those individuals who indicated that the disease had represented theloss of a special opportunity to obtain income, for example, during harvest orplanting times. However, that loss only represents 1,4% of the value of timelost for the families because of malaria (See Chart 17), in view of the fact thatonly 10% of the ill patients indicated that they had registered that type ofproblem. Given the scarce magnitude of this phenomenon, even if it were notincluded in the estimations or if it was assumed that the loss was a higherproportion than the lost salaries, results would not be substantially modified.
73.
5.1.6 Mortality costs
As indicated, the mortality cost was valued through the estimated future flow ofincome that these individuals would have, discounting the present value. In-come was calculated by the LSMS (Living Standards Measurement Survey) byregion and age range, with a limit of productive age at 65 years old. It is notredundant to restate the limitations of this method to value life, according towhich, life of the elderly and poor has a lower value. This is really a methodthat only considers the value of individuals as a production factor, and not likea value in itself, and conceives the production of goods as the final goal.However, other methods to appraise human life are quite complex and equallyarguable and there are no estimates for Peru.
The possible deaths due to other causes have been discounted. In 1998, 43deaths due to malaria were recorded and these deaths, by a rate of 3% ofannual discount, yield a total value of 0,85 million dollars. That is, an averageof 19,640 dollars per person. However, there are 8 deaths recorded in individu-als older than 65 years of age, whose value has been set at zero. Not includingthis last group, the estimated unit value for life lost is 24,390 dollars. About twothirds (65%) of this value lost to mortality occurs in the jungle, where a highermortality toll is recorded (34 out of the 43 general cases and 27 out of 35 whowere not elderly individuals).
If a discount rate of 12% is used, the value of lives lost to malaria would be 0,38millions; and if the discount rate used is 6%, the value would be 0,57 milliondollars.
5.1.7 Costs for loss of tourism
The number of tourists arriving in Loreto, Piura and Tumbes was registeredas 46,903; 5,712; and 4,126, respectively. The Central Reserve Bank calculatesthat foreign tourists spend an average of 1,400 dollars during their stay inPeru, figure that has been considered for the estimation of tourism in thestudy sites since there are no other estimates that are more accurate. Fromthe above data, the total income by foreign tourism in the departmentsmentioned above is around 79 million dollars. It must be highlighted that, ingeneral, the tour operators consider that the effect of malaria on internationaltourism is none.
The economic cost of malaria in Peru
74.
Th
e e
con
om
ic im
pa
ct o
f ma
laria
in P
eru
In-depth interviews were carried out with various tour operators and represen-tatives of the various companies in that field and we identified that the firsttourist destination where malaria is, (the jungle) is part of adventure tourism ordone by individuals willing to take risks, independently of the disease. Also, wefound out that the serious touristic agents are prepared with chemoprophy-laxis and mosquito repellents in general. However, we were not able to findout about the number of tourists who fail to come because of the diseasesince there is a potential, unregistered demand for tourism through variousmechanisms of information (internet, direct versions, tour companies abroad,etc.) –through which these individuals find out about the disease and decideagainst coming to Peru– decisions that are not recorded.
However, supposing that the rate of tourists who decide against coming to Perudue to malaria is 1% of those who arrive in Loreto and 0,5% of the ones arrivingat the northern coast, the resulting cost of malaria is 725,000 dollars for 1998.If the effect were five times higher, that is 5% in Loreto and 2,5% in the northerncoast, the total cost would be 3,6 million dollars.
5.1.8 The fiscal costs of malaria
An approximation of the total fiscal cost of malaria was also performed. In thiscase, not only the requirements on the public budget for malaria control, butalso the lower income received by the government due to the decreasedeconomic activity, as a consequence of the disease.
In order to calculate the loss of tax income, we have considered that thefamilies decrease their consumption due to the malaria cost and this affectsthe income through the Value Added Tax (VAT) in the proportion of goods andservices subject to this rate. Also, for the case of tourism, a global rate of 10%over the net income has been considered and this includes not only VAT butincome tax and other taxes.
Chart 14 presents the total estimated fiscal costs and these are 11,15 milliondollars. Most of it (85%) is observed to be due to budget funding allocated tothe disease and the cost of loss of tax collection is relatively low. This is dueto the fact that the families where malaria prevails are rural and poor, whosehighest consumption item is food and who do not pay taxes.
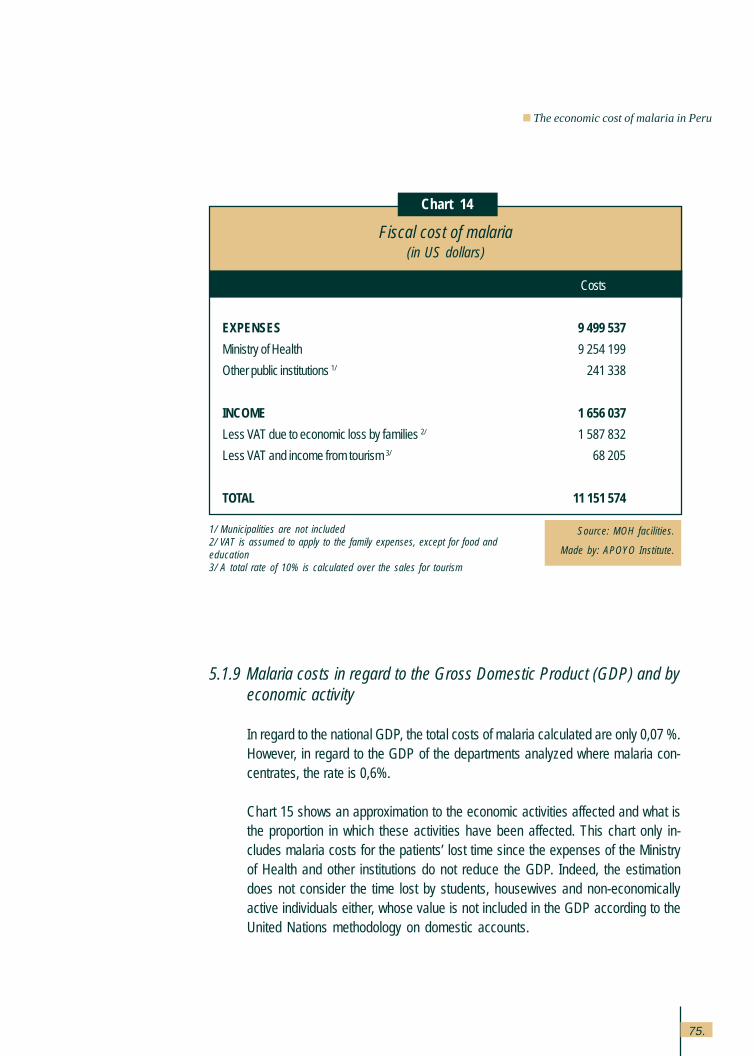
75.
5.1.9 Malaria costs in regard to the Gross Domestic Product (GDP) and byeconomic activity
In regard to the national GDP, the total costs of malaria calculated are only 0,07 %.However, in regard to the GDP of the departments analyzed where malaria con-centrates, the rate is 0,6%.
Chart 15 shows an approximation to the economic activities affected and what isthe proportion in which these activities have been affected. This chart only in-cludes malaria costs for the patients’ lost time since the expenses of the Ministryof Health and other institutions do not reduce the GDP. Indeed, the estimationdoes not consider the time lost by students, housewives and non-economicallyactive individuals either, whose value is not included in the GDP according to theUnited Nations methodology on domestic accounts.
Source: MOH facilities.
Made by: APOYO Institute.
Chart 14
1/ Municipalities are not included2/ VAT is assumed to apply to the family expenses, except for food andeducation3/ A total rate of 10% is calculated over the sales for tourism
Fiscal cost of malaria(in US dollars)
Costs
EXPENSES 9 499 537
Ministry of Health 9 254 199
Other public institutions 1/ 241 338
INCOME 1 656 037
Less VAT due to economic loss by families 2/ 1 587 832
Less VAT and income from tourism 3/ 68 205
TOTAL 11 151 574
The economic cost of malaria in Peru
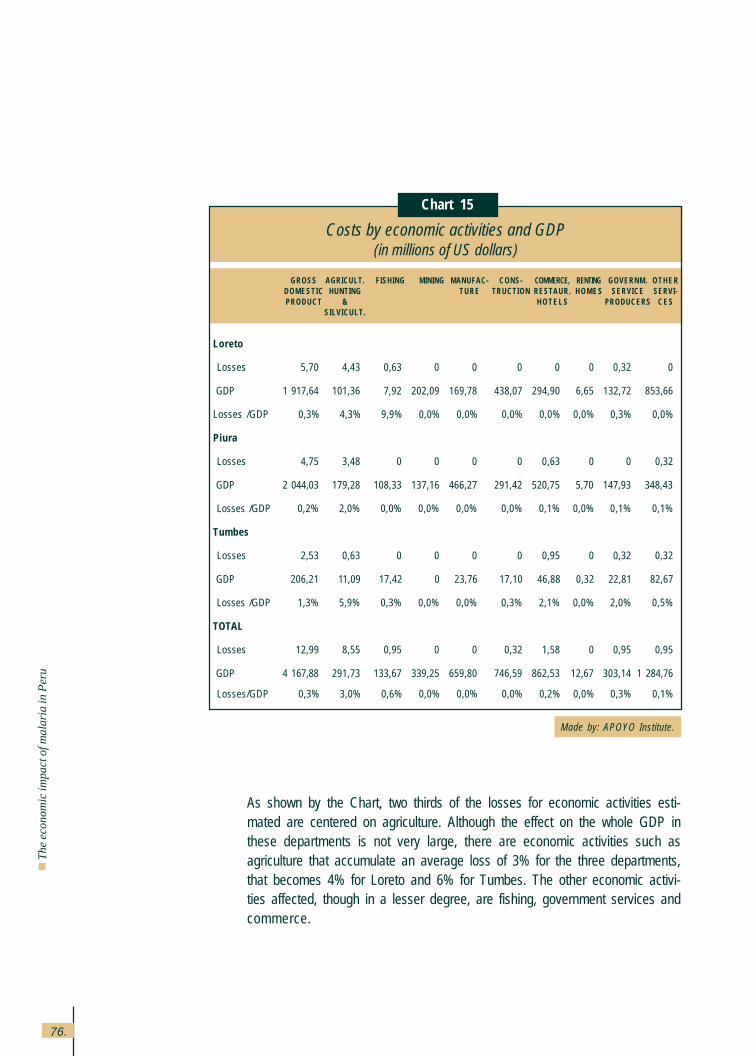
76.
Th
e e
con
om
ic im
pa
ct o
f ma
laria
in P
eru
As shown by the Chart, two thirds of the losses for economic activities esti-mated are centered on agriculture. Although the effect on the whole GDP inthese departments is not very large, there are economic activities such asagriculture that accumulate an average loss of 3% for the three departments,that becomes 4% for Loreto and 6% for Tumbes. The other economic activi-ties affected, though in a lesser degree, are fishing, government services andcommerce.
Made by: APOYO Institute.
Chart 15
Costs by economic activities and GDP(in millions of US dollars)
GROSS AGRICULT. FISHING MINING MANUFAC- CONS- COMMERCE, RENTING GOVERNM. OTHERDOMESTIC HUNTING TURE TRUCTION RESTAUR. H O M E S SERVICE SERVI-PRODUCT & H O T E L S PRODUCERS C E S
SILVICULT.
Loreto
Losses 5,70 4,43 0,63 0 0 0 0 0 0,32 0
GDP 1 917,64 101,36 7,92 202,09 169,78 438,07 294,90 6,65 132,72 853,66
Losses /GDP 0,3% 4,3% 9,9% 0,0% 0,0% 0,0% 0,0% 0,0% 0,3% 0,0%
Piura
Losses 4,75 3,48 0 0 0 0 0,63 0 0 0,32
GDP 2 044,03 179,28 108,33 137,16 466,27 291,42 520,75 5,70 147,93 348,43
Losses /GDP 0,2% 2,0% 0,0% 0,0% 0,0% 0,0% 0,1% 0,0% 0,1% 0,1%
Tumbes
Losses 2,53 0,63 0 0 0 0 0,95 0 0,32 0,32
GDP 206,21 11,09 17,42 0 23,76 17,10 46,88 0,32 22,81 82,67
Losses /GDP 1,3% 5,9% 0,3% 0,0% 0,0% 0,3% 2,1% 0,0% 2,0% 0,5%
TOTAL
Losses 12,99 8,55 0,95 0 0 0,32 1,58 0 0,95 0,95
GDP 4 167,88 291,73 133,67 339,25 659,80 746,59 862,53 12,67 303,14 1 284,76
Losses/GDP 0,3% 3,0% 0,6% 0,0% 0,0% 0,0% 0,2% 0,0% 0,3% 0,1%
77.
5.2 The cost of malaria for families
The economic cost of malaria has been analyzed from a macro-economic pointof view, observing its effects on the internal revenue and on the economic activi-ties. The effects on families are shown below.
In this regard, it is important to indicate that many families register more than onecase. This happens because many people get sick or because those who gotsick had several episodes. In the areas surveyed, the average was 2,6 sickindividuals per house and the average number of episodes per sick individual was1,9. These data reveal that the home confronts an average of almost five episodesof malaria a year, which increases to over 7 in Loreto. There are no major differencesin the number of episodes who had vivax and those who had falciparum, thoughthere were differences among the regions.
Chart 16 shows the information on the malaria cost for families. As observed, theannual average cost is 495,41 dollars per family, which in Loreto is as high as742,79 dollars whereas in the North coast, it is approximately 316,76 dollars.These regional differences are mainly explained by the larger number of casesper family in the jungle, since as seen in the preceding pages, the costs per eachepisode are very similar in both areas.
The economic cost of malaria in Peru
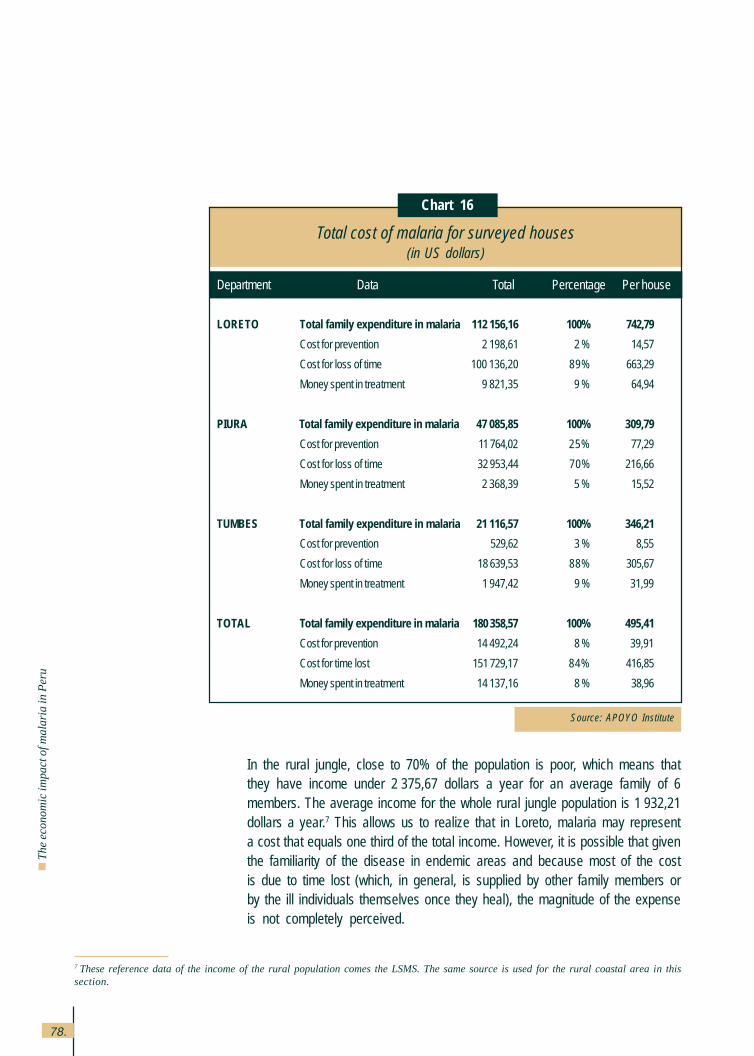
78.
Th
e e
con
om
ic im
pa
ct o
f ma
laria
in P
eru
In the rural jungle, close to 70% of the population is poor, which means thatthey have income under 2,375,67 dollars a year for an average family of 6members. The average income for the whole rural jungle population is 1,932,21dollars a year.7 This allows us to realize that in Loreto, malaria may representa cost that equals one third of the total income. However, it is possible that giventhe familiarity of the disease in endemic areas and because most of the costis due to time lost (which, in general, is supplied by other family members orby the ill individuals themselves once they heal), the magnitude of the expenseis not completely perceived.
Source: APOYO Institute
Chart 16
Total cost of malaria for surveyed houses(in US dollars)
Department Data Total Percentage Per house
LORETO Total family expenditure in malaria 112 156,16 100% 742,79
Cost for prevention 2 198,61 2 % 14,57
Cost for loss of time 100 136,20 89% 663,29
Money spent in treatment 9 821,35 9 % 64,94
PIURA Total family expenditure in malaria 47 085,85 100% 309,79
Cost for prevention 11 764,02 25% 77,29
Cost for loss of time 32 953,44 70% 216,66
Money spent in treatment 2 368,39 5 % 15,52
TUMBES Total family expenditure in malaria 21 116,57 100% 346,21
Cost for prevention 529,62 3 % 8,55
Cost for loss of time 18 639,53 88% 305,67
Money spent in treatment 1 947,42 9 % 31,99
TOTAL Total family expenditure in malaria 180 358,57 100% 495,41
Cost for prevention 14 492,24 8 % 39,91
Cost for time lost 151 729,17 84% 416,85
Money spent in treatment 14 137,16 8 % 38,96
7 These reference data of the income of the rural population comes the LSMS. The same source is used for the rural coastal area in thissection.
79.
In the rural coast, the average income is slightly higher, around 2,597,40 dollarsannually; thus, the effects of malaria represent 12% of the average income.
Eighty-four percent of the costs for families are due to time lost, 8% to paymentsmade in regard to the malaria episode and another 8% for prevention. Differencesare found in this regard, among the regions: in Piura, prevention activities madeby the families and communities are more important for the cost, 25%, whereasthe costs for loss of time are lower.
Within the cost for time lost, most of it is due to the cost due to incapacitation(52%) and care for the ill (42%), and the time spent in going to the healthinstallation and being treated there only an average of 5% (See Chart 17).
As for the cost of incapacitation, 93% of the ill individuals stated having beencompletely incapacitated for some days; the average number was 7,2 days.However, it is interesting to highlight that 45% of the cases were completelyincapacitated for 4 days or less, but an important 14% were incapacitated over14 days in total. Those individuals of productive age, indicated that they wereincapacitated for longer periods than the children or elderly. Additionally, 85%of the ill individuals indicated that they were slightly incapacitated for an averageof 6,8 days, though this was also higher between 26 and 65 years of age. Lessthan 20% of those incapacitated and who had an economically productiveactivity was replaced by a family member. This replacement is more frequentin the jungle.
The economic cost of malaria in Peru
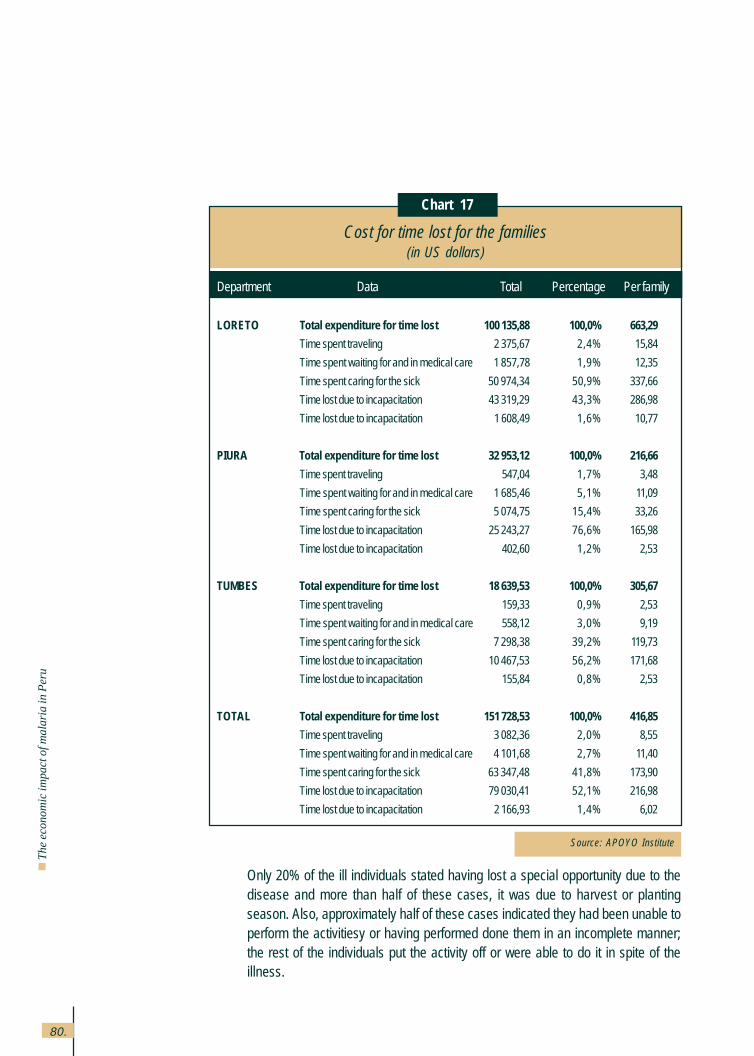
80.
Th
e e
con
om
ic im
pa
ct o
f ma
laria
in P
eru
Source: APOYO Institute
Chart 17
Cost for time lost for the families(in US dollars)
Department Data Total Percentage Per family
LORETO Total expenditure for time lost 100 135,88 100,0% 663,29
Time spent traveling 2 375,67 2,4% 15,84
Time spent waiting for and in medical care 1 857,78 1,9% 12,35
Time spent caring for the sick 50 974,34 50,9% 337,66
Time lost due to incapacitation 43 319,29 43,3% 286,98
Time lost due to incapacitation 1 608,49 1,6% 10,77
PIURA Total expenditure for time lost 32 953,12 100,0% 216,66
Time spent traveling 547,04 1,7% 3,48
Time spent waiting for and in medical care 1 685,46 5,1% 11,09
Time spent caring for the sick 5 074,75 15,4% 33,26
Time lost due to incapacitation 25 243,27 76,6% 165,98
Time lost due to incapacitation 402,60 1,2% 2,53
TUMBES Total expenditure for time lost 18 639,53 100,0% 305,67
Time spent traveling 159,33 0,9% 2,53
Time spent waiting for and in medical care 558,12 3,0% 9,19
Time spent caring for the sick 7 298,38 39,2% 119,73
Time lost due to incapacitation 10 467,53 56,2% 171,68
Time lost due to incapacitation 155,84 0,8% 2,53
TOTAL Total expenditure for time lost 151 728,53 100,0% 416,85
Time spent traveling 3 082,36 2,0% 8,55
Time spent waiting for and in medical care 4 101,68 2,7% 11,40
Time spent caring for the sick 63 347,48 41,8% 173,90
Time lost due to incapacitation 79 030,41 52,1% 216,98
Time lost due to incapacitation 2 166,93 1,4% 6,02
Only 20% of the ill individuals stated having lost a special opportunity due to thedisease and more than half of these cases, it was due to harvest or plantingseason. Also, approximately half of these cases indicated they had been unable toperform the activitiesy or having performed done them in an incomplete manner;the rest of the individuals put the activity off or were able to do it in spite of theillness.
81.
As for the care of the sick, only 322 were reportedly caring for 956 ill individuals in364 homes. This seems to indicate that home care is exclusively in the hands ofone person who assumes this task in a specialized manner. Although, this func-tion is predominantly performed by women, especially in the jungle, over one thirdof those cared for are men, mostly adults. There are more caregivers in the north-ern coast (208 caregivers for 213 homes) than in the jungle (114 for 151 homes).These caregivers dedicate an average of 13 days, with over 8 hours each, to carefor the sick; although in the jungle, the time spent providing care is longer (18 daysof an average of 13 hours each).
It must be noted that if the ill patient is incapacitated at the moment of going to thehealth installation, that time included in the time lost due to incapacity and notduring the consultation time, this accounts for 28% of the cases. On the otherhand, the time spent by the accompanying person, some 60% of the cases, al-though this person is not present in all the consultations (an average of three timesin contrast to 4,5 consultations, as an average).
The average length of the trip is 15 minutes and the average bus fare is 13 cents.On the other hand, the time spent waiting for and receiving medical care is anaverage of one hour; although it is somewhat longer in the northern coast (onehour and 12 minutes).
The time lost due to disability is more important in the northern coast, as well asthe waiting time, whereas the time spent caring for the ill and traveling is longer inthe jungle. In the jungle, traveling time is longer (an average of 20 minutes incontrast to 12 minutes in the northern coast), as well as bus fare (16 cents incontrast to 10 cents).
It must be highlighted that 90% of the ill patients are aged between 6 and 65 yearsold, although an important 31% is between 6 and 15 when the economic effectsare not so severe. In this sense, the northern coast tends to be more economicallyaffected by the disease, whereas a higher percentage of ill patients is between 16and 45, the age of the highest productive potential (5% in the northern coast incontrast to 37 % in Loreto).
Also, it is important to stress that some consultation costs are registered (14%average of the component of direct payments and 1% of the total cost per family).These are more important in the northern coast, and a very limited amount due tolaboratory tests, mainly in Tumbes. However, these expenses are generally limited,in spite of the fact that the average number of consultations is 4,4 per malariaepisode (about one million consultations if projected at national level), given the
The economic cost of malaria in Peru
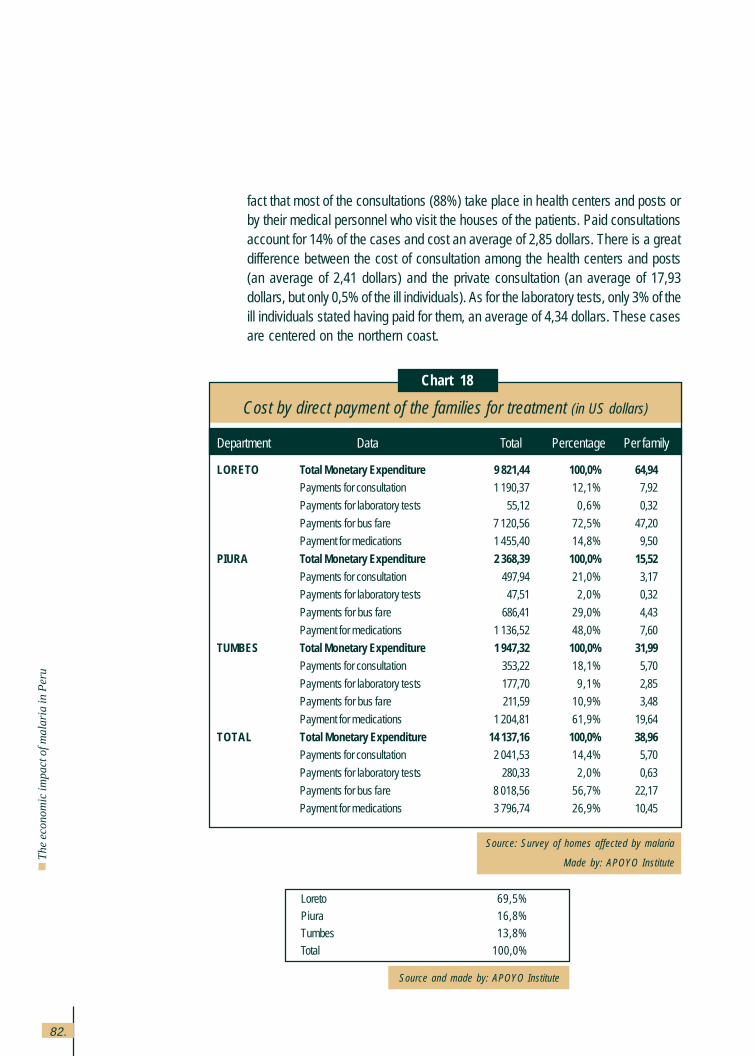
82.
Th
e e
con
om
ic im
pa
ct o
f ma
laria
in P
eru
Source: Survey of homes affected by malaria
Made by: APOYO Institute
Chart 18
Cost by direct payment of the families for treatment (in US dollars)
Department Data Total Percentage Per family
LORETO Total Monetary Expenditure 9 821,44 100,0% 64,94Payments for consultation 1 190,37 12,1% 7,92
Payments for laboratory tests 55,12 0,6% 0,32
Payments for bus fare 7 120,56 72,5% 47,20
Payment for medications 1 455,40 14,8% 9,50
PIURA Total Monetary Expenditure 2 368,39 100,0% 15,52
Payments for consultation 497,94 21,0% 3,17
Payments for laboratory tests 47,51 2,0% 0,32
Payments for bus fare 686,41 29,0% 4,43
Payment for medications 1 136,52 48,0% 7,60
TUMBES Total Monetary Expenditure 1 947,32 100,0% 31,99
Payments for consultation 353,22 18,1% 5,70
Payments for laboratory tests 177,70 9,1% 2,85
Payments for bus fare 211,59 10,9% 3,48
Payment for medications 1 204,81 61,9% 19,64
TOTAL Total Monetary Expenditure 14 137,16 100,0% 38,96Payments for consultation 2 041,53 14,4% 5,70
Payments for laboratory tests 280,33 2,0% 0,63
Payments for bus fare 8 018,56 56,7% 22,17
Payment for medications 3 796,74 26,9% 10,45
Loreto 69,5%Piura 16,8%Tumbes 13,8%
Total 100,0%
Source and made by: APOYO Institute
fact that most of the consultations (88%) take place in health centers and posts orby their medical personnel who visit the houses of the patients. Paid consultationsaccount for 14% of the cases and cost an average of 2,85 dollars. There is a greatdifference between the cost of consultation among the health centers and posts(an average of 2,41 dollars) and the private consultation (an average of 17,93dollars, but only 0,5% of the ill individuals). As for the laboratory tests, only 3% of theill individuals stated having paid for them, an average of 4,34 dollars. These casesare centered on the northern coast.
83.
Final comments 6.
1. Malaria represents a high cost to the Peruvian economy. The estimated totalcost is 37,85 millions of US dollars for 1998. Although this only represents 0,07%of the national GDP, it accounts for 3% of the cattle raising GDP for the depart-ments of Loreto, Piura and Tumbes, where their incidence is centered. Also, inregard to the total expenditure in health, the total cost for malaria represents1,5%.
2. One of the main costs originated by malaria is due to the efforts the governmenthas undertaken for its control. This total cost adds up to 9,25 million dollars, apart of which comes from the resources assigned by the national program andother health entities oriented toward this goal. An important portion of the cost isoriginated in the time dedicated by the professionals and workers of the sectorand by the cost of the infrastructure involved. The government expense in ma-laria is only 1% of the total public expenditures in health.
3. Malaria represents a significant cost for the families, most of them poor, thatadds to 26,7 million dollars. For the families in endemic areas, the average costper disease is 475 dollars. This is due to the fact that even one case of malariacosts an average of 95 dollars to the families; houses have an average of fivecases per year. For the rural families in the jungle, 70% of which are consideredpoor, this cost could equal to one third of their yearly income. The effect of thesevere malaria cases on families in extreme poverty conditions, or the effects ofthe concentration of non severe cases per family can undoubtedly be cata-strophic from the economic point of view. Thus, the importance of the studybecause malaria control would fit within the search for social equity and thefight against poverty.
4. This calculation of the economic cost has valued the time lost to the disease,but not the suffering caused by it. An attempt to come close to this measurethrough questions oriented toward determining the willingness-to-paydemonstrated its non-viability in the pilot survey.
5. Mortality caused by malaria, in spite of its being relatively low –43 deaths in1998 in contrast to 77,000 falciparum malaria cases, that is 0,5 per one thou-sand– represents an important economic cost. Again, we must highlight thehuge limitations of an appraisal of human lives based on the earnings theycould acquire in their useful life.
Final comments
84.
Th
e e
con
om
ic im
pa
ct o
f ma
laria
in P
eru
6. The study could not quantify with reasonable certainty the economic effectsindirectly generated by malaria through the decrease in tourism. However, themost probable magnitude order seems to be within 700,000 and 3,5 milliondollars. Only in the very extreme case, this would be meaningful in regard to theother costs identified by malaria in Peru.
7. The main malaria costs are those generated by the families or in an indirectmanner on the economic activity. Given the fact that the families tend to recoverthese costs through a harder family effort and that effects such as those ontourism are not easily identifiable, these costs are not adequately perceived bysociety. These characteristics, in spite of the public good or with high externalitiesthat the malaria control strategies have, favor the underestimation of theimportance of the disease and the undersupplying of public resources for itscontrol. This is why, the release of the real malaria costs for society may beefficacious within a strategy oriented toward the improvement of the relationshipbetween the civil society and the government and bring it closer to the problemsand demands of the population.
8. The study did not intend to perform cost-effectiveness or cost-benefit analyses inrelation to the various malaria control activities. In that regard, studies of this typeconducted in the Brazilian Amazon region (Musgrove et al 1999) indicate a costbetween 64 y 69 dollars per DALY. However, this calculation is critically sup-ported by the supposition that falciparum cases would have achieved a lethalityof 10% had they not been treated, in contrast to 0,15% in this country in 1996.This lower lethality rate responds for over 90% of DALY appropriated to theintervention conducted.
In Peru, there is a very low malaria lethality rate and there are no estimates onits lethality rate without treatment. In spite of that, the cost caused by malariamortality is significant. This indicates that a strategy such as the one used inBrazil based on concentrating vector control programs in areas with high con-centration of falciparum malaria deserves some attention.
85.
9. In the field work, a strategy to change the watering system for rice crops in Piurahas been found to be promising in the decrease of the presence of mosquitoescarrying Plasmodium without generating negative effects on the agricultural pro-duction (Programa de Salud de la Comunidad de San Juan de Catacaos, 1994-1997). The system consists on alternating six watering days with nine dry days.In the experimental test, it brought down to zero the presence of larvaes in therice crops without reducing productivity, although it required a slightly higheradditional cost for hand labor in order to weed the fields. Presumably, this sys-tem could be generalized to Piura and Tumbes, as well as to the departmentsof San Martín and upper jungle. Field tests are obviously required to evaluateand ensure its replicability. Tumbes confronts the additional problem of mosqui-toes rearing in shrimp farms. In Loreto and in the lower jungle, this system ofrice crops cannot be applied.
Final comments

86.
Th
e e
con
om
ic imp
act o
f ma
laria
in P
eru
87.
BIBLIOGRAPHY
Abel-Smith, Brian (1989)
“Health economics in developing countries”, Journal of Tropical Medicine and Hygiene, 92: 229-241.
Akhavan, D (1997)
“Cost-effectiveness analysis of malaria control and treatment in the Brazilian amazon: lessons in
strategy”, mimeo, World Bank Operations Department, Washington DC.
Aramburú, J; Ramal, C y Witzig, R (1999)
“Malaria reemergence in the peruvian amazon region”, Emerging infectious diseases, 5, 2: 209-215,
Mar-Apr.
Bendahmane, D. (s/f)
“Indicators for programs to prevent diarrheal disease, malaria and acute respiratory infections”,
Activity Report 46, Environmental Health Project EHP Technical Advisory Group, mimeo
Bonilla, E, Stella, L, Rodríguez, P y A. Rodríguez (1991)
Salud y desarrollo. Aspectos socioeconómicos de la malaria en Colombia, Plaza y Janés.
Brinkmann, U y Brinkmann, A (1995)
“Economic aspects of the use of impregnated mosquito nets for malaria control”, Bulletin of the World
Health Organization, 73, 5.
Calderón G., Fernández R. y Valle J. (1995)
“Especies de la fauna anofelina, su distribución y algunas consideraciones sobre su abundancia e
infectividad en el Perú”, Revista Peruana de Epidemiología, 8, 1, June.
Centers for Diseases Control and Prevention(1995)
“Assessing the effectiveness of disease and injury prevention programs: costs and consequences”,
Mortality and Morbidity Weekly Report, 44, august 18.
Chang, J. (1995)
“Relación entre magnitud de áreas bajo cultivo de arroz e incidencia de malaria en la Región Grau”,
non published article.
Cohn, E (1973)
“Assessing the costs and beneficts of anti-malaria programs: the indian experience”, American
Journal of Public Health, 63, 12, december.
Cortez, Rafael (1998)
“The effects of household and public investment in health on productivity. The case of Peru”,
mimeo, Red de Centros del BID.
Bibliography
88.
Th
e e
con
om
ic im
pa
ct o
f ma
laria
in P
eru
Cuanto S. A. (1997)
Perú en números 1997. Anuario Estadístico. Lima, October.
Cueto, M (1997)
“Identidad regional y malaria en el Perú”. In: El regreso de las epidemias. Lima, Instituto de Estudios
Peruanos. Chapter 4: 127-171.
Cuzquén, L (1982)
“Epidemiología de la malaria en el Perú”, Revista Diagnóstico, 90, 4, Lima.
Dirección de Salud de Loreto, DISA Loreto (1997)
Informe operacional programa malaria al III trimestre
Dirección de Salud de Loreto, DISA Loreto (1998)
Boletín de Malaria 1997
Drummond, M.F.(1980)
Principles of economic appraisal in health care, Oxford University Press.
Drummond, Michael; Stoddart, Greg y George Torrance (1987)
Methods for the economic evaluation of health care programmes, Oxford University Press.
Ellwein,L.B; Thulasiraj, R.D., Boulter, A.R., Dhittal, S.P.(1998)
“Estimating costs of programme services and products using information provided in standard
financial statements”, Bulletin of the World Health Organization, 75, 5.
Ettling, M; Mc Farland, DA; Schultz, L.J; Chitsulo, L (1994)
“Economic impact of malaria in malawian households”, Trop Med Parasitol, 45, 1, March.
Frenk, J. (1991)
“La transición epidemiológica en América Latina”, Boletín de la Oficina Sanitaria Panamericana, 111, 6:
485-496.
Guiguedme, T.R; Coulibaly, N; Coulibaly, S.O; Ouedraogo, J.B; Gbary, A.R. (1997)
“Esquisse d’une mehode d’estimation du cout economique chiffre des acces palustres: application
a une zone rurale au Burkina Faso”, Trop Med Int Health, 2, 7.
Hammer, J (1993)
“The economics of malaria control”, World Bank Research Observer, 8, 1, January.
89.
Healthig.com (1999)
“¿La humanidad está perdiendo la lucha contra la malaria?”,
http:// www. healthig. com / malaria / malaria1.html
Henderson, Tom (1998)
“An introduction to health economics”,
www.pitt.edu /^super>l /lecture /lec0092 /001.html.
Instituto Nacional de Estadística e Informática, INEI (1994).
Censo Nacional de Población y Vivienda 1993.
Instituto Nacional de Estadística e Informática, INEI (1996).
Compendio de estadísticas sociales 1995 – 1996. Lima, octubre..
Instituto Nacional de Estadística e Informática, INEI (1997).
Población, Mujer y salud. Resultados de la Encuesta Demográfica y de Salud Familiar 1996.
Departamentos de Tumbes, Piura y Loreto. Lima, agosto.
Instituto Nacional de Estadística e Informática, INEI (1998).
Compendio de Estadísticas Departamentales 1997 – 1998. Lima, octubre.
Kere, N.K; Keni,J; Bobogare,A; Webber, R.H; Southgate, B.A. (1993)
“The economic impact of Plasmodium falciparum malaria on education investment: a Pacific
Island study”, Southeast Asian Journal of Tropical Medicine and Public Health, 24, 4, december.
Konradsen, F; van der Hoek, W; Amerasonghe, P.H; Amerasinghe, F.P. (1997)
“Measuring the economic cost of malaria to households in Sri Lanka”, American Journal of Tropical
Medicine and Hygiene, 56, 6.
Malaria Foundation International (1999)
http://www.malaria.org
McGuire, Alistair; Henderson, John y Gavin Money (1994)
The economics of health care, Routledge, Londres.
Mills, Anne (1989)
“Health economics in developing countries”, American Journal of Tropical Medicine and
Hygiene, 92: 229-241.
Ministry of Health - General Office of Epidemiology (OGE) (1992-1999)
Boletines semanales epidemiológicos.
90.
Th
e e
con
om
ic im
pa
ct o
f ma
laria
in P
eru
Ministry of Health - Pan American Health Organization (1993)
Textos básicos para proyectos de desarrollo en salud. Lima.
Ministry of Health - UNICEF - WHO/PAHO (1996)
Para gerenciar en salud. Guía para la estimación de costos de los servicios en establecimientos de
primer nivel. Lima.
Ministry of Health, MOH (1995)
Hacia un sector salud con equidad, eficiencia y calidad. Lineamientos de política de salud 1995 -
2000. Lima.
Ministry of Health, MOH (1997)
Análisis de costos de los servicios de salud. 2000 Project, Lima.
Ministry of Health, MOH (1997)
Análisis del gasto público en salud. 2000 Project, Lima.
Ministry of Health, MOH (1998b)
Desarrollo e implementación del SICI en el Hospital Víctor Ramos Guardia de Huaraz: análisis de
resultados. 2000 Project, Lima.
Ministry of Health, MOH (1999)
Resistencia del Plasmodium falciparum a medicamentos antimaláricos en el Perú. Lima.
Ministry of Health - Basic Health and Nutrition Project (PSNB) (1999)
Plan de desarrollo e implementación del Sistema de Costos e Ingresos (SICI), Documento 5 A, Análisis
de la producción, costos e ingresos de establecimientos seleccionados en la red de servicios de salud Morropón
– Chulucanas (Piura).
Murray, Christopher (1993)
“Quantifying the burden of disease: the technical basis for disability adjusted life years”, Bull World
Health Organ 1994, 72: 419-445.
Najera, J, Liese, B y J. Hammer (1995)
“Malaria”. In: Disease control priorities in developing countries, D. Jamison y W. Mosley eds, Oxford
University Press for the World Bank.
PAHO, Pan American Health Organization (1996)
Status of malaria programs in the Americas: XLIV Report, documento N° CD39/INF/2, Sep, Washing-
ton, USA.
91.
PAHO, Pan American Health Organization (1998)
“Salud en las Américas 1998”, Boletín Epidemiológico, 19, 3: 1-10, September.
Parodi, Carlos (1997)
Economía de las Políticas Sociales, CIUP, Lima
Pesse, K y Castro, C (1994)
“Para que no pique la turula”. In: Control de la malaria en la comunidad campesina de Catacaos,
Comunidad Campesina de San Juan de Catacaos, Piura
Ruz, W y K. Pesse (s/f)
El impacto socioeconómico de la malaria.
Prescott, Nicholas (s/f)
The economics of malaria, filariasis and human trypanosomiasis, documento TDR / SER (SC-1) /
80.4, World Health Organization, Ginebra.
Prescott, Nicholas y Jeremy Warford (1993)
Evaluación económica del sector salud. MOH-PAHO (1993)
Programa de Salud de la Comunidad campesina San Juan de Catacaos (1994-1997)
Riego intermitente de los cultivos de arroz y su efecto sobre la reproducción del mosquito vector
de malaria. Piura.
Químper, M. (1998)
Malaria en la Región Loreto, Study for Integrated Project of Malaria in Region of Loreto, CARE-Peru, july.
Romero, J. (1968)
“Estimación del costo de un programa de erradicación del paludismo”, Bulletin of PAHO, february.
Ruebush, T, Porter, C y J. Stein (1997)
Short-term consultation to the malaria control program, Loreto region, Peru, CDC, USA.
Smith, P.G. (1987)
Evaluating interventions against tropical diseases, International Journal of Epidemiology 16, 2.
The Scientist (1997)
“Malaria: a statistical index”
http://www.the-scientist.library.upenn.Edu /yr1997/may/mack_p6a_970512.html
92.
Th
e e
con
om
ic im
pa
ct o
f ma
laria
in P
eru
Ventosilla, P. (1993a)
Control Vectorial de la Malaria mediante Bacillus thuringiensis var. Israeli (Bti) cultivado en agua de
coco, en Piura, Peru, Instituto de Medicina Tropical “Alexander von Humboldt”, Universidad Peruana Cayetano
Heredia, Lima.
Ventosilla, P. (1993b)
Participación de la comunidad y los escolares en control biológico de la Malaria con Bti en Piura, Peru.
Instituto de Medicina Tropical “Alexander von Humboldt”, Universidad Peruana Cayetano Heredia, Lima.
Vosti, S (1990)
“Malaria among gold miners in southern Pará, Brazil: estimates of determinants and individual costs”,
Soc. Sci. Med, 30, 10.
WHO, World Health Organization (1999a)
The World Health Report 1999, World Health Organization.
WHO, World Health Organization (1999b)
“Roll Back Malaria”,
http://www.who.int/rbm/about.html
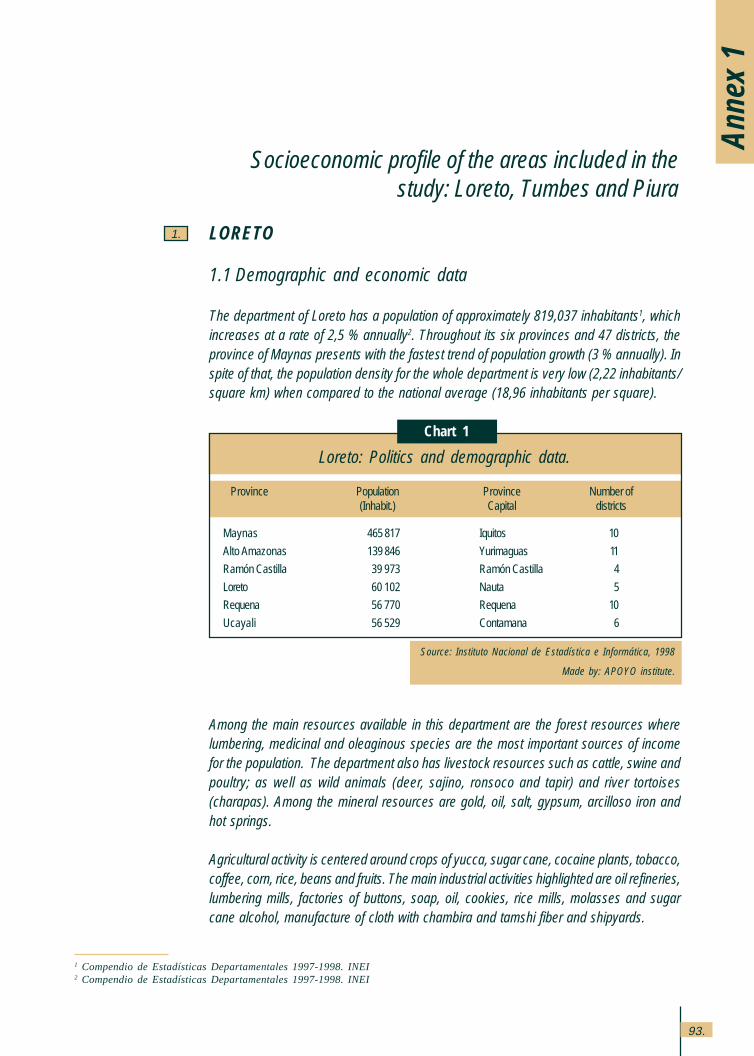
93.
Anne
x 1
1 Compendio de Estadísticas Departamentales 1997-1998. INEI2 Compendio de Estadísticas Departamentales 1997-1998. INEI
Socioeconomic profile of the areas included in thestudy: Loreto, Tumbes and Piura
1.
Loreto: Politics and demographic data.
Chart 1
Source: Instituto Nacional de Estadística e Informática, 1998
Made by: APOYO institute.
Province Population Province Number of(Inhabit.) Capital districts
Maynas 465 817 Iquitos 10
Alto Amazonas 139 846 Yurimaguas 11
Ramón Castilla 39 973 Ramón Castilla 4
Loreto 60 102 Nauta 5
Requena 56 770 Requena 10
Ucayali 56 529 Contamana 6
LORETO
1.1 Demographic and economic data
The department of Loreto has a population of approximately 819,037 inhabitants1, whichincreases at a rate of 2,5 % annually2. Throughout its six provinces and 47 districts, theprovince of Maynas presents with the fastest trend of population growth (3 % annually). Inspite of that, the population density for the whole department is very low (2,22 inhabitants/square km) when compared to the national average (18,96 inhabitants per square).
Among the main resources available in this department are the forest resources wherelumbering, medicinal and oleaginous species are the most important sources of incomefor the population. The department also has livestock resources such as cattle, swine andpoultry; as well as wild animals (deer, sajino, ronsoco and tapir) and river tortoises(charapas). Among the mineral resources are gold, oil, salt, gypsum, arcilloso iron andhot springs.
Agricultural activity is centered around crops of yucca, sugar cane, cocaine plants, tobacco,coffee, corn, rice, beans and fruits. The main industrial activities highlighted are oil refineries,lumbering mills, factories of buttons, soap, oil, cookies, rice mills, molasses and sugarcane alcohol, manufacture of cloth with chambira and tamshi fiber and shipyards.
Annex 1: Socioeconomic profile
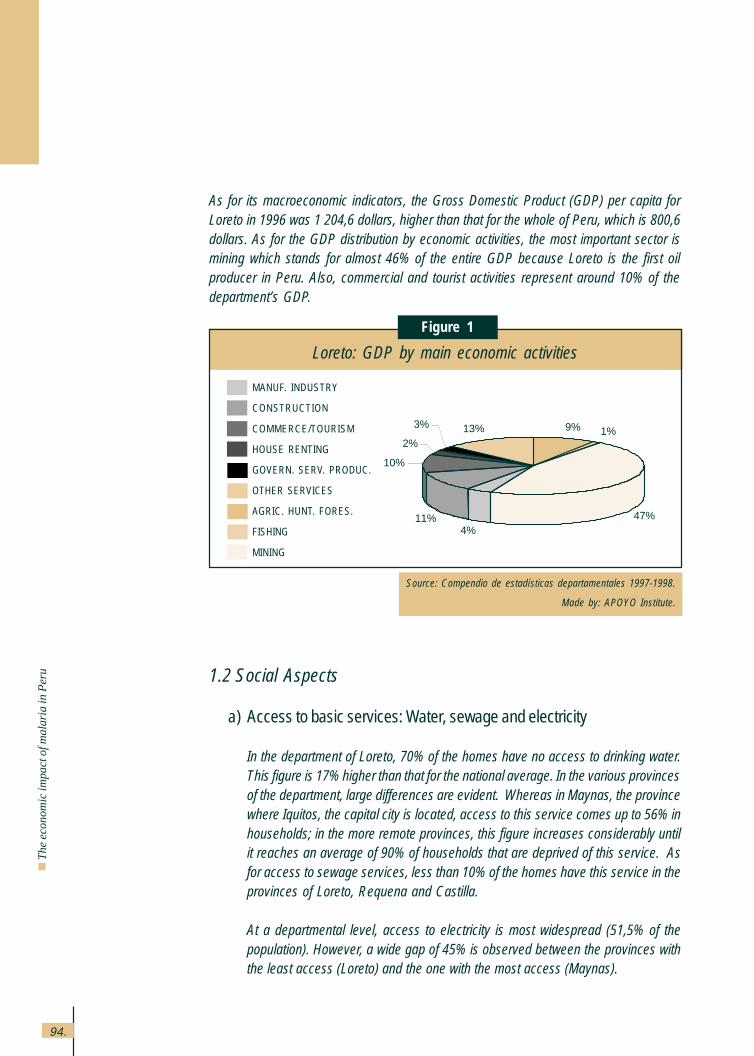
94.
Th
e e
con
om
ic im
pa
ct o
f ma
laria
in P
eru
As for its macroeconomic indicators, the Gross Domestic Product (GDP) per capita forLoreto in 1996 was 1,204,6 dollars, higher than that for the whole of Peru, which is 800,6dollars. As for the GDP distribution by economic activities, the most important sector ismining which stands for almost 46% of the entire GDP because Loreto is the first oilproducer in Peru. Also, commercial and tourist activities represent around 10% of thedepartment’s GDP.
1.2 Social Aspects
a) Access to basic services: Water, sewage and electricity
In the department of Loreto, 70% of the homes have no access to drinking water.This figure is 17% higher than that for the national average. In the various provincesof the department, large differences are evident. Whereas in Maynas, the provincewhere Iquitos, the capital city is located, access to this service comes up to 56% inhouseholds; in the more remote provinces, this figure increases considerably untilit reaches an average of 90% of households that are deprived of this service. Asfor access to sewage services, less than 10% of the homes have this service in theprovinces of Loreto, Requena and Castilla.
At a departmental level, access to electricity is most widespread (51,5% of thepopulation). However, a wide gap of 45% is observed between the provinces withthe least access (Loreto) and the one with the most access (Maynas).
Loreto: GDP by main economic activities
Figure 1
Source: Compendio de estadísticas departamentales 1997-1998.
Made by: APOYO Institute.
MANUF. INDUSTRY
CONSTRUCTION
COMMERCE/TOURISM
HOUSE RENTING
GOVERN. SERV. PRODUC.
OTHER SERVICES
AGRIC. HUNT. FORES.
FISHING
MINING
9% 1%
47%4%
11%
10%
2%
3% 13%
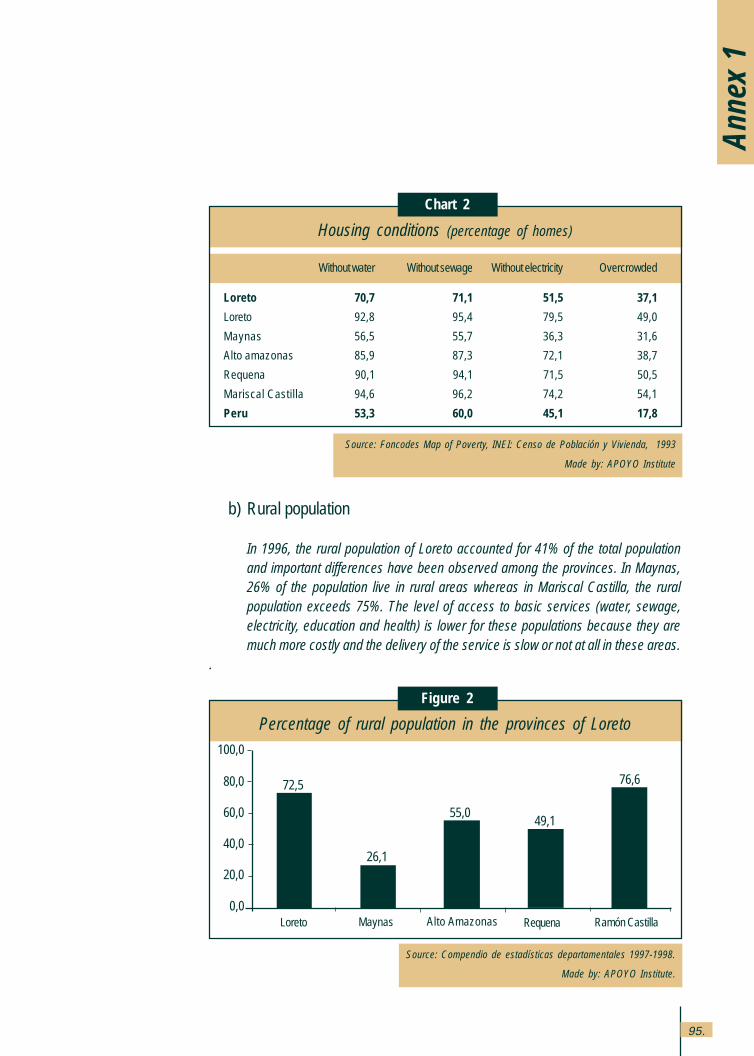
95.
b) Rural population
In 1996, the rural population of Loreto accounted for 41% of the total populationand important differences have been observed among the provinces. In Maynas,26% of the population live in rural areas whereas in Mariscal Castilla, the ruralpopulation exceeds 75%. The level of access to basic services (water, sewage,electricity, education and health) is lower for these populations because they aremuch more costly and the delivery of the service is slow or not at all in these areas.
.
Housing conditions (percentage of homes)
Chart 2
Source: Foncodes Map of Poverty, INEI: Censo de Población y Vivienda, 1993
Made by: APOYO Institute
Without water Without sewage Without electricity Overcrowded
Loreto 70,7 71,1 51,5 37,1
Loreto 92,8 95,4 79,5 49,0
Maynas 56,5 55,7 36,3 31,6
Alto amazonas 85,9 87,3 72,1 38,7
Requena 90,1 94,1 71,5 50,5
Mariscal Castilla 94,6 96,2 74,2 54,1
Peru 53,3 60,0 45,1 17,8
Anne
x 1
Percentage of rural population in the provinces of Loreto
Figure 2
Source: Compendio de estadísticas departamentales 1997-1998.
Made by: APOYO Institute.
100,0
80,0
60,0
40,0
20,0
0,0
72,5
26,1
55,049,1
76,6
Loreto Alto AmazonasMaynas Requena Ramón Castilla
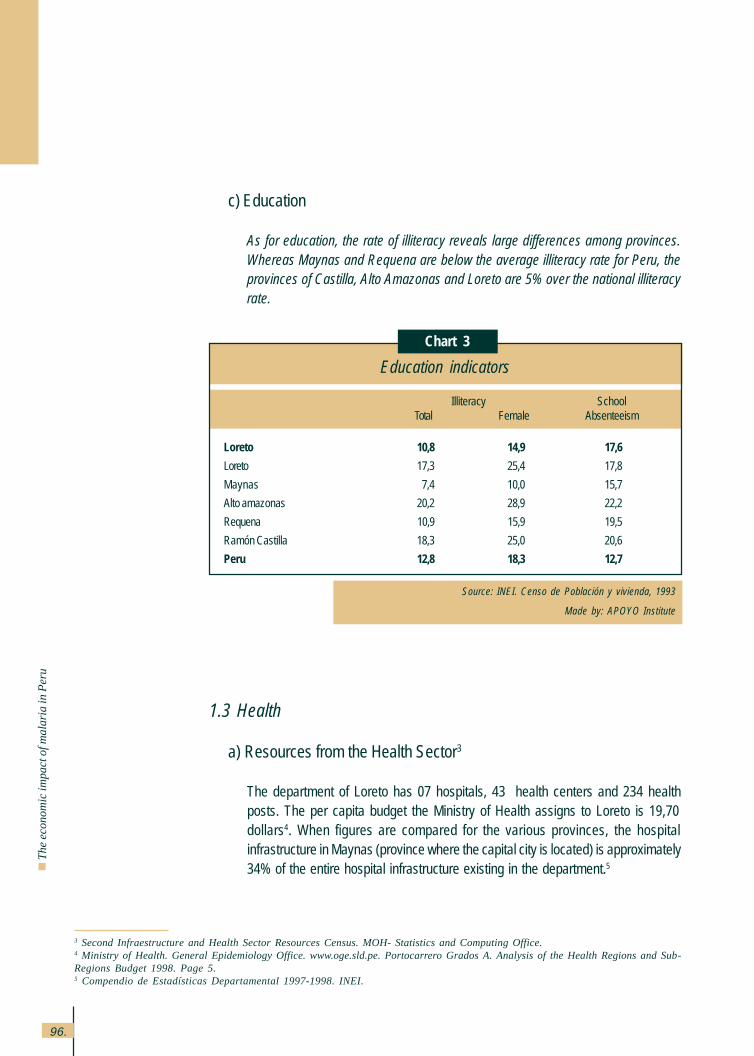
96.
Th
e e
con
om
ic im
pa
ct o
f ma
laria
in P
eru
c) Education
As for education, the rate of illiteracy reveals large differences among provinces.Whereas Maynas and Requena are below the average illiteracy rate for Peru, theprovinces of Castilla, Alto Amazonas and Loreto are 5% over the national illiteracyrate.
1.3 Health
a) Resources from the Health Sector3
The department of Loreto has 07 hospitals, 43 health centers and 234 healthposts. The per capita budget the Ministry of Health assigns to Loreto is 19,70dollars4. When figures are compared for the various provinces, the hospitalinfrastructure in Maynas (province where the capital city is located) is approximately34% of the entire hospital infrastructure existing in the department.5
Education indicators
Chart 3
Source: INEI. Censo de Población y vivienda, 1993
Made by: APOYO Institute
Illiteracy SchoolTotal Female Absenteeism
Loreto 10,8 14,9 17,6
Loreto 17,3 25,4 17,8
Maynas 7,4 10,0 15,7
Alto amazonas 20,2 28,9 22,2
Requena 10,9 15,9 19,5
Ramón Castilla 18,3 25,0 20,6
Peru 12,8 18,3 12,7
3 Second Infraestructure and Health Sector Resources Census. MOH- Statistics and Computing Office.4 Ministry of Health. General Epidemiology Office. www.oge.sld.pe. Portocarrero Grados A. Analysis of the Health Regions and Sub-Regions Budget 1998. Page 5.5 Compendio de Estadísticas Departamental 1997-1998. INEI.
97.
b) Morbidity, mortality and nutritional status
The morbidity rate among children under 5 years of age due to acute diarrhealdiseases (ADD)6 is 221,9 per every 100,000.7 This figure is higher than thenational average of 148,7 per 100,000.
Among the diseases affecting all age groups alike8 (contagious diseases suchas dengue, leishmaniasis, malaria, cholera, among others), Malaria is thedisease with the highest incidence in the department, followed by tuberculosiswith a morbidity rate of 133,9 per 100,000. This rate is higher than the nationalfigure of 111,9 per 100,000, but lower than Lima (180 per 100,000). Theincidence of cholera is 60.6 per 100,000, higher than the national average (18.8per 100,000). Finally, leishmaniasis with a morbidity rate of 53,6 per 100,000and the rate for classic dengue is 19,8 per 100,000. Both rates double thenational average rate.
Among the main mortality causes of children under 1 are Acute RespiratoryInfections (ARIs) in 22% of the cases and Acute Diarrheal Diseases in 9% ofthe cases, and the infantile9 mortality of 50 per 100,000 babies born alive.
On the other hand, the nutritional status10 of the children has a direct incidencein the levels of morbidity and mortality in the department. The index of chronicmalnutrition in Loreto indicates that 36% of the children under 5 suffer fromgrowth delay and 4% weigh less than the standard weight for their age (globalmalnutrition).
c) Malaria aspects in the area
Loreto is an endemic area for malaria and 25% of the cases reported in thenational territory are centered on it. Higher rates of the disease occur in ruralareas, especially in the farther away communities because their main economicactivities, fishing, hunting, agriculture, are high risk activities.
6 The Morbidity Rate per ADDS is the number of cases per illness (in children younger than 5 years old) per each 100 000 childrenyounger than 5 years that will be brief as cases per ten thousands.7 The Information for each of te departments regarding ADDS was obtained at: Ministry of Health - Epidemiology General Office.www.oge.sld.pe. Diarrhoea and Cholera Illness Control Program.8 The Information obtained for malaria, cholera, tuberculosis, uta and dengue comes from the Epidemiology General Office of theMinistry of Health. www.oge.sld.pe.9 Encuesta Demográfica y de Salud Familiar (ENDES) 1996 (INEI, 1997).10 Ibid.
Anne
x 1
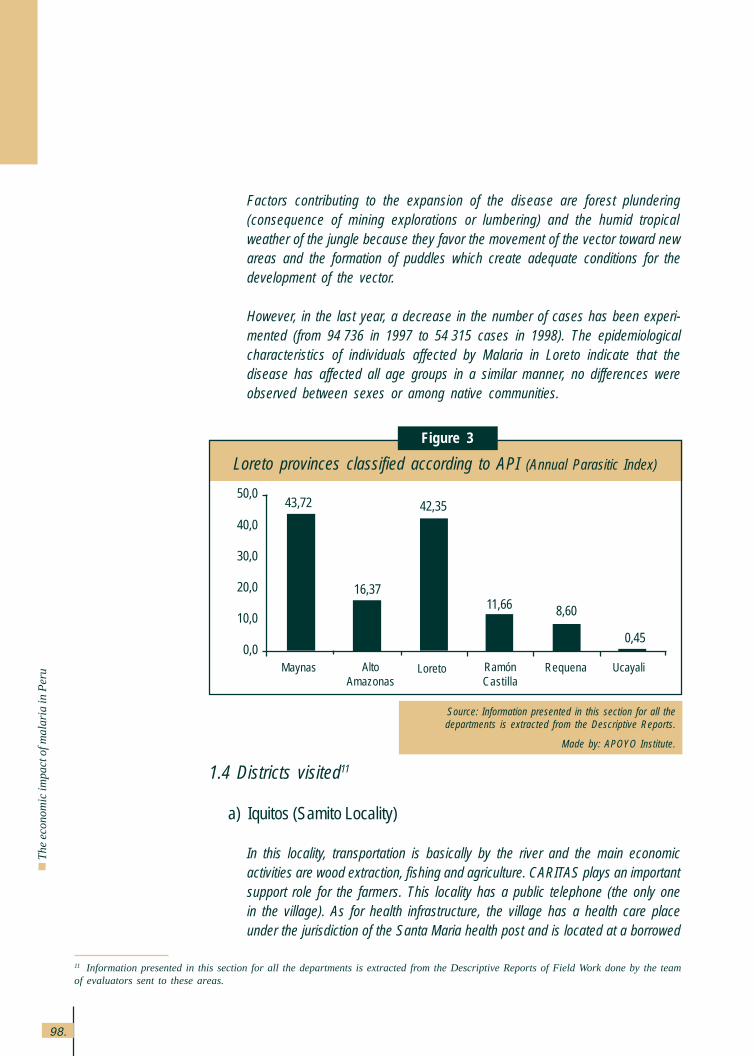
98.
Th
e e
con
om
ic im
pa
ct o
f ma
laria
in P
eru
Factors contributing to the expansion of the disease are forest plundering(consequence of mining explorations or lumbering) and the humid tropicalweather of the jungle because they favor the movement of the vector toward newareas and the formation of puddles which create adequate conditions for thedevelopment of the vector.
However, in the last year, a decrease in the number of cases has been experi-mented (from 94,736 in 1997 to 54,315 cases in 1998). The epidemiologicalcharacteristics of individuals affected by Malaria in Loreto indicate that thedisease has affected all age groups in a similar manner, no differences wereobserved between sexes or among native communities.
11 Information presented in this section for all the departments is extracted from the Descriptive Reports of Field Work done by the teamof evaluators sent to these areas.
1.4 Districts visited11
a) Iquitos (Samito Locality)
In this locality, transportation is basically by the river and the main economicactivities are wood extraction, fishing and agriculture. CARITAS plays an importantsupport role for the farmers. This locality has a public telephone (the only onein the village). As for health infrastructure, the village has a health care placeunder the jurisdiction of the Santa Maria health post and is located at a borrowed
Loreto provinces classified according to API (Annual Parasitic Index)
Figure 3
Source: Information presented in this section for all thedepartments is extracted from the Descriptive Reports.
Made by: APOYO Institute.
50,0
40,0
30,0
20,0
10,0
0,0
43,72
16,3711,66 8,60
0,45
42,35
Maynas AltoAmazonas
Loreto RamónCastilla
Requena Ucayali
99.
house. There is no medical or nursing personnel in charge of the center andthree health technicians are currently working there.
The health post carries out important prevention campaigns for Malaria andCholera. They promote prevention activities, such as the elimination of mosquitoreservoirs and have also given away mosquito nets to almost all the houses.They also promote drying out puddles, among other things. In addition to this,they develop various programs sponsored by the Ministry of Health (ARI, Diarrhealdiseases, health insurance for students, family planning, etc.).
There is no noteworthy participation of the community individuals as a unit, asample of this is that the population expects the Institutions to take the initiativeand this is difficult because the municipal government does not have its ownheadquarters and must follow guidelines set forth by Santa Maria.
b) Alto Nanay (Santa María de Nanay locality)
The main economic activities of this locality are agriculture, wood extraction,manufacture of hirapai leave roofs and fishing. CARITAS actions are also importantin this locality through their technical and economic support to the farmer, as wellas for the Winai program, which provides food assistance to undernourishedchildren.
Santa Maria has a health center where a physician, an obstetrician, a nurse andthree technicians work. They have a well-equipped pharmacy for the treatment ofmalaria. This health center is responsible for various health centers in the area,Samito among them, and they constantly visit these other health centers for thestudy and control of malaria and to monitor the PANFAR program.
The health center carries out important campaigns for the prevention of malariaand cholera by providing mosquito nets to the families in the last year and payingvisits for a house control. Other Ministry of Health sponsored programs (AcuteRespiratory Infections, Acute Diarrheal Diseases, health insurance for students,Family Planning, etc.) are administered by the health center. It is important tomention the joint participation of CARITAS and the health personnel, which allowsfor more support to the population, especially in the more distant areas.
c) Trompeteros
The main source of income for the families in this area is oil exploitation. Populationslocated near wells and camps have more services and better infrastructure, each
Anne
x 1
100.
Th
e e
con
om
ic im
pa
ct o
f ma
laria
in P
eru
locality has a radio frequency and their main means of transportation are boats,canoes and long boats used for public transportation.
FONCODES is one of the institutions in the area and it has financed the constructionof latrines and water wells. No work carried out by the municipality is identified andthere are no NGOs.
The Ministry of Health has health centers and posts but with rather meagerresources. There is a health center in Villa Trompeteros, 3 health posts located inProvidencia, Nueva Jerusalen and Pampa Hermosa, each one of them has healthtechnicians, one obstetrician and one nurse (in the Trompeteros health center).
All the populated areas have a Glass of Milk Comittee. Only Providencia, VillaTrompeteros and Pampa Hermosa have mothers’ association each. The leadersof these organizations rate the participation of the community as very low.
d) Caballococha
Most of the locality’s economy is centered on commerce, motivated by the merchandisetraffic along the border with Colombia. It must be noted that one of the most importantproblems affecting the population in general is the increase in gas prices, caused bythe regulation of its distribution determined by Iquitos authorities and due to Peruviangas smuggling in the border area. This led to the increase in transportation prices, aswell as the restriction in education and health services for the more remote locations.In the rural communities, the economic activity is agriculture and livestock raising,fishing and rearing of minor animals. The presence of the industry is centered on theCaballococha area and small brick factories as well as small private farms ofagricultural-industrial products such as olive oil can be found.
The monthly income level of the urban area is estimated at around 126,70 to221,73 dollars, contrasting sharply with the rural areas where the monthly incomeis set at approximately 31,68 dollars.
The locality is the center node of the Ramón Castilla health network, whichadministers and supervises the preventive actions in various border districts. Thehealth center has several health posts assigned to it: the Caballococha healthpost, Cuchillo Cocha, Chimbote, Isla del Tigre and San Antonio. However, at thetime of the study, a high concentration of medical personnel was observed inCaballococha, the only two doctors were there, as well as 20 out of the 24 healthtechnicians available in the area.
101.
Anne
x 1
Access to the Caballococha district is either by river through boats (7 hours) or byair (one-hour trip for 40 dollars). Access from the district toward the localities in theinterior is through small private boats. By land, one can only reach the nearbycommunities through an incomplete walk way, implemented by PRONAA.
The localities have baseline organizations (Popular Kitchens, Glass of MilkCommittees, and Mothers’ Associations) and there is active participation in thecommunity work (construction of walkways and cleanliness of wells) as well asfrequent local assemblies.
e) Yurimaguas
The most important productive activity in the area is agriculture, with rice, bananaand bean crops mainly. The annual agricultural cycle involves two stages: plantingin January and February, called “the large campaign” by the population andharvesting in June and July. The second planting or “small campaign” occurs inAugust with harvest time in December.
The main communication means in the area is the Yurimaguas-Tarapoto road, aside road of the marginal road but the localities communicate among each otherthrough dirt road shortcuts. The city has electricity (from 6:30 to 10:30 p.m.) and aradio central station, this is why they are implementing the fixed phone service.
In the health area, the jurisdiction of Pampa Hermosa has a health center cared bytwo physicians, three nurses, two nursing technicians and one administrative clerk.Communities that have their own health posts, have their own promoter. Thesecommunities are Grau, San Juan de Pamplona, Santo Tomás, Cotayacu, PuertoPerú, Nueva Alianza and San Francisco de Pampayacu.
TUMBES
2.1 Demographic and economic aspects
The department of Tumbes has a population of approximately 178,525 inhabitants12 andit grows at a rate of 2,8 per cent a year. The province of Zarumilla is the one with the highestpopulation increase (4,3 per cent annually). Politically, it is divided into 3 provinces and12 districts.
12 Compendio de Estadísticas Departamentales 1997-1998. INEI
2.
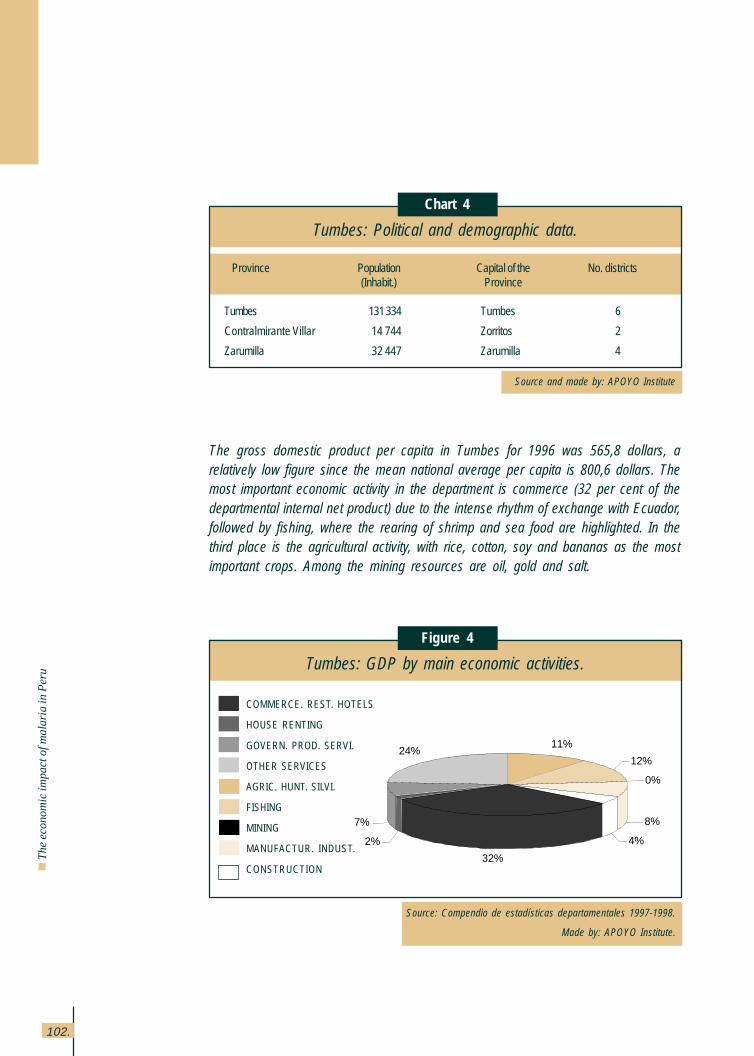
102.
Th
e e
con
om
ic im
pa
ct o
f ma
laria
in P
eru
The gross domestic product per capita in Tumbes for 1996 was 565,8 dollars, arelatively low figure since the mean national average per capita is 800,6 dollars. Themost important economic activity in the department is commerce (32 per cent of thedepartmental internal net product) due to the intense rhythm of exchange with Ecuador,followed by fishing, where the rearing of shrimp and sea food are highlighted. In thethird place is the agricultural activity, with rice, cotton, soy and bananas as the mostimportant crops. Among the mining resources are oil, gold and salt.
Tumbes: Political and demographic data.
Chart 4
Source and made by: APOYO Institute
Tumbes: GDP by main economic activities.
Figure 4
Source: Compendio de estadísticas departamentales 1997-1998.
Made by: APOYO Institute.
Province Population Capital of the No. districts(Inhabit.) Province
Tumbes 131 334 Tumbes 6
Contralmirante Villar 14 744 Zorritos 2
Zarumilla 32 447 Zarumilla 4
COMMERCE. REST. HOTELS
HOUSE RENTING
GOVERN. PROD. SERVI.
OTHER SERVICES
AGRIC. HUNT. SILVI.
FISHING
MINING
MANUFACTUR. INDUST.
CONSTRUCTION
11%
12%
0%
8%
4%
32%
2%
7%
24%
103.
Anne
x 1
2.2 Social Aspects
a) Access to basic services: water, sewage and electricity
In the Department of Tumbes, 58% of the homes have access to potable water. Thisis an important figure if one takes into consideration that in the national territory;the coverage of this service is 47%. In the provinces studied, no substantialdifferences are observed because Tumbes has only 3% less access to potablewater than Zarumilla.
As for access to sewage services, 60% of the households in this department donot have this service. This figure is similar to the national average but muchhigher than Lima, where only 32% of the homes do not have sewage. This goesto show that the coverage for this service in the department is still very poor. Nosignificant differences were observed among provinces.
As for electricity, large differences are found in the provinces. On one hand, theprovince of Tumbes has a high coverage since three fourths of the homes haveaccess to this service, figure close to the Lima figure but higher than the nationalaverage in about 18%. In the province of Zarumilla, coverage is lower, reachingonly 60% of the homes.
Access to basic housing services (percentage of homes)
Chart 5
Source: Foncodes Map of Poverty; INEI: Censo de Población y vivienda, 1993
Made by: APOYO Institute
Without Without Without Overcrowded water sewage electricity
Tumbes 42,4 59,9 30,4 14,7
Zarumilla 40,2 55,2 40,7 19,5
Tumbes 37,6 57,3 26,5 14,3
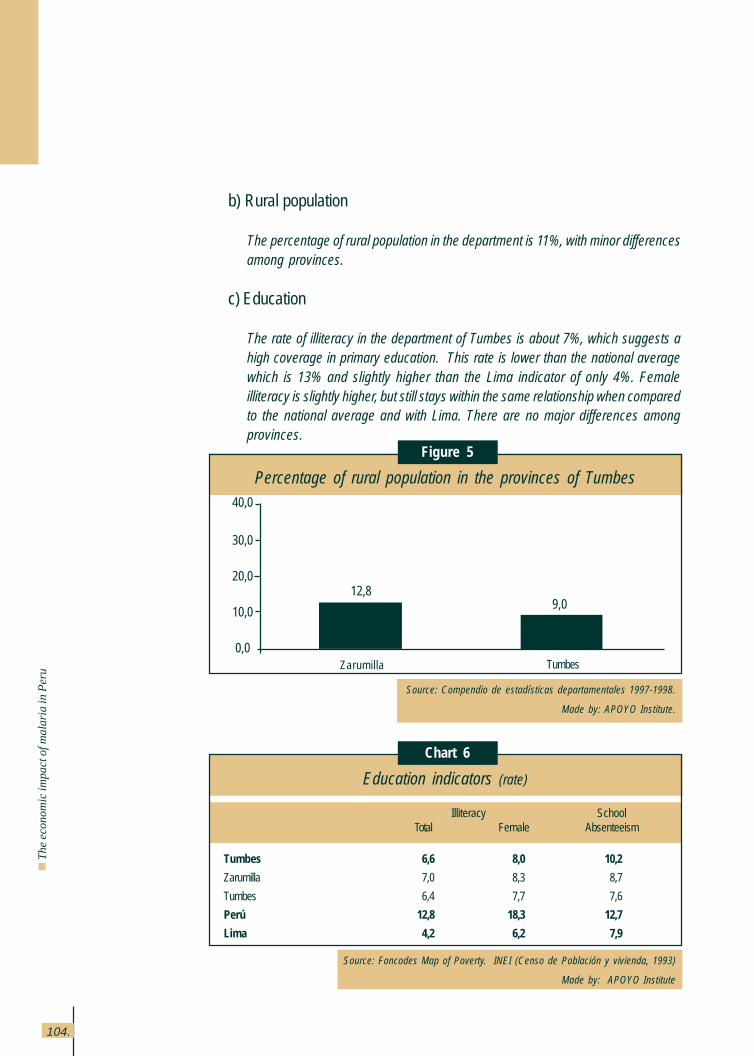
104.
Th
e e
con
om
ic im
pa
ct o
f ma
laria
in P
eru
b) Rural population
The percentage of rural population in the department is 11%, with minor differencesamong provinces.
c) Education
The rate of illiteracy in the department of Tumbes is about 7%, which suggests ahigh coverage in primary education. This rate is lower than the national averagewhich is 13% and slightly higher than the Lima indicator of only 4%. Femaleilliteracy is slightly higher, but still stays within the same relationship when comparedto the national average and with Lima. There are no major differences amongprovinces.
Chart 6
Source: Foncodes Map of Poverty. INEI (Censo de Población y vivienda, 1993)
Made by: APOYO Institute
Education indicators (rate)
Illiteracy SchoolTotal Female Absenteeism
Tumbes 6,6 8,0 10,2
Zarumilla 7,0 8,3 8,7
Tumbes 6,4 7,7 7,6
Perú 12,8 18,3 12,7
Lima 4,2 6,2 7,9
Percentage of rural population in the provinces of Tumbes
Figure 5
Source: Compendio de estadísticas departamentales 1997-1998.
Made by: APOYO Institute.
9,012,8
40,0
30,0
20,0
10,0
0,0Zarumilla Tumbes
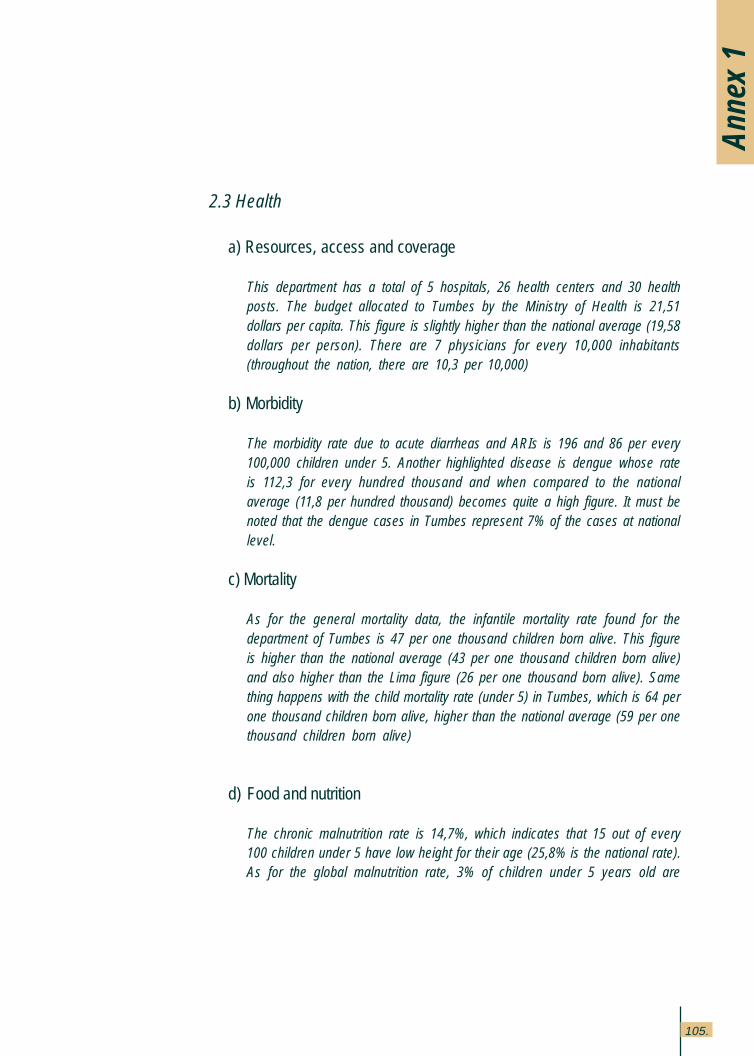
105.
2.3 Health
a) Resources, access and coverage
This department has a total of 5 hospitals, 26 health centers and 30 healthposts. The budget allocated to Tumbes by the Ministry of Health is 21,51dollars per capita. This figure is slightly higher than the national average (19,58dollars per person). There are 7 physicians for every 10,000 inhabitants(throughout the nation, there are 10,3 per 10,000)
b) Morbidity
The morbidity rate due to acute diarrheas and ARIs is 196 and 86 per every100,000 children under 5. Another highlighted disease is dengue whose rateis 112,3 for every hundred thousand and when compared to the nationalaverage (11,8 per hundred thousand) becomes quite a high figure. It must benoted that the dengue cases in Tumbes represent 7% of the cases at nationallevel.
c) Mortality
As for the general mortality data, the infantile mortality rate found for thedepartment of Tumbes is 47 per one thousand children born alive. This figureis higher than the national average (43 per one thousand children born alive)and also higher than the Lima figure (26 per one thousand born alive). Samething happens with the child mortality rate (under 5) in Tumbes, which is 64 perone thousand children born alive, higher than the national average (59 per onethousand children born alive)
d) Food and nutrition
The chronic malnutrition rate is 14,7%, which indicates that 15 out of every100 children under 5 have low height for their age (25,8% is the national rate).As for the global malnutrition rate, 3% of children under 5 years old are
Anne
x 1
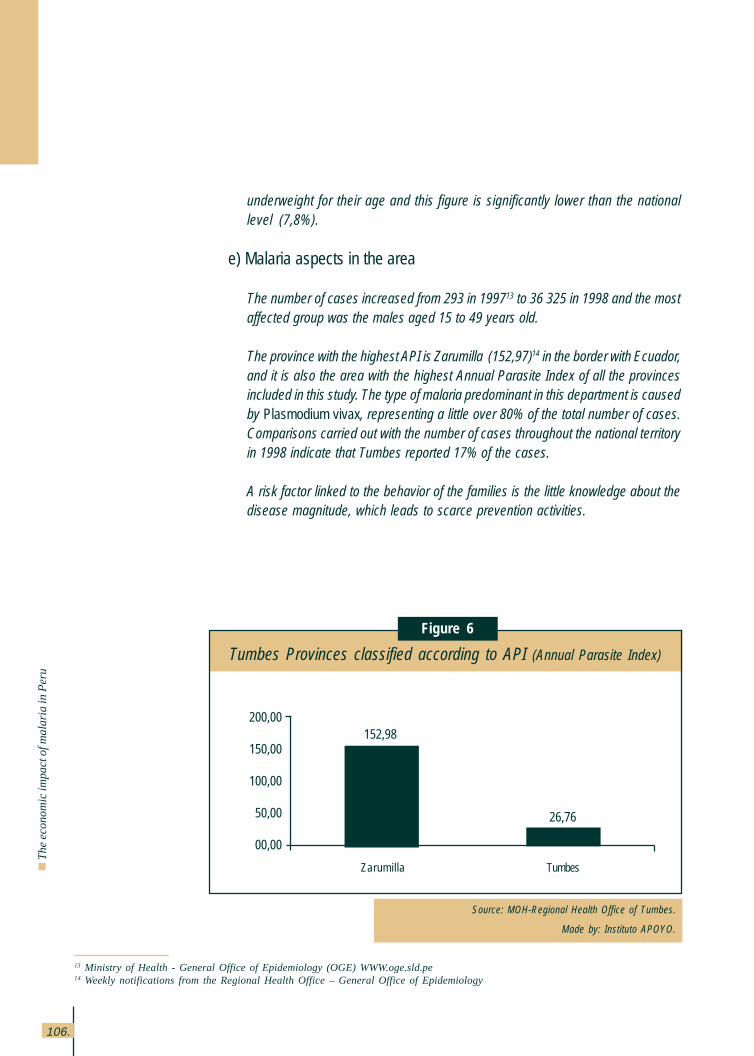
106.
Th
e e
con
om
ic im
pa
ct o
f ma
laria
in P
eru
underweight for their age and this figure is significantly lower than the nationallevel (7,8%).
e) Malaria aspects in the area
The number of cases increased from 293 in 199713 to 36,325 in 1998 and the mostaffected group was the males aged 15 to 49 years old.
The province with the highest API is Zarumilla (152,97)14 in the border with Ecuador,and it is also the area with the highest Annual Parasite Index of all the provincesincluded in this study. The type of malaria predominant in this department is causedby Plasmodium vivax, representing a little over 80% of the total number of cases.Comparisons carried out with the number of cases throughout the national territoryin 1998 indicate that Tumbes reported 17% of the cases.
A risk factor linked to the behavior of the families is the little knowledge about thedisease magnitude, which leads to scarce prevention activities.
13 Ministry of Health - General Office of Epidemiology (OGE) WWW.oge.sld.pe14 Weekly notifications from the Regional Health Office – General Office of Epidemiology
Tumbes Provinces classified according to API (Annual Parasite Index)
Figure 6
Source: MOH-Regional Health Office of Tumbes.
Made by: Instituto APOYO.
26,76
152,98200,00
150,00
100,00
50,00
00,00
Zarumilla Tumbes
107.
Anne
x 1
2.4 Districts visited
a) Corrales
The main economic activities in the area are agriculture (60%), commercialactivities (20%), temporary jobs in construction, transportation and handcrafts,etc. (20%).
The average monthly income per farmer is 158,38 dollars per hectare whereasan employee makes from 95,03 to 221,73 dollars and a business person makes158,38 dollars a month.
The district of Corrales has three health centers: Corrales (head of the network),La Cruz and San Jacinto, where there are five physicians, four of them work inCorrales and the other one rotates among the six additional health posts inVaquería, Oidor, Casa Blanqueada, Malval, San Isidro and Rica Playa. Housevisits and fumigation campaigns are carried out to discard malaria.
As for the community organizations operating in this locality, only the MothersAssociations remain active, operating a bakery industry downtown Corrales. TheChurch has a certain participation preparing groups of Catholic couples whoreceive informational talks about various topics, malaria prevention amongthem. However, the number of attending couples is small and those who doattend live in the center of the district.
b) Aguas Verdes
The main economic activities here are commerce and agriculture. This localityhas a health center in Aguas Verdes (staffed by three physicians in the district),and also a health post in La Curva and another one in Zarumilla. One of thepoints to bear in mind is the medical care received in the health centers andposts because the individuals surveyed have stated that they run into difficultiesat times due to the increased number of cases which makes the operationalcapability of the service hard.
As for the community organizations, the municipality works with NeighborCommittees, Glass of Milk Committees and Community Kitchens, known asPopular Kitchens.
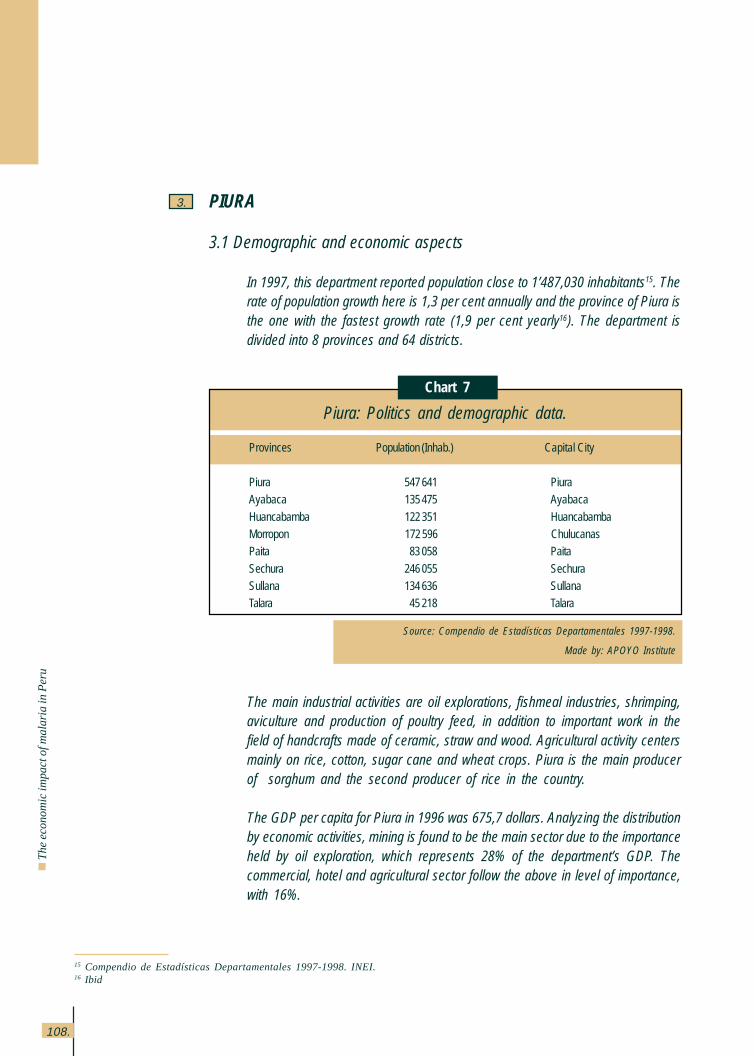
108.
Th
e e
con
om
ic im
pa
ct o
f ma
laria
in P
eru
PIURA
3.1 Demographic and economic aspects
In 1997, this department reported population close to 1’487,030 inhabitants15. Therate of population growth here is 1,3 per cent annually and the province of Piura isthe one with the fastest growth rate (1,9 per cent yearly16). The department isdivided into 8 provinces and 64 districts.
3.
The main industrial activities are oil explorations, fishmeal industries, shrimping,aviculture and production of poultry feed, in addition to important work in thefield of handcrafts made of ceramic, straw and wood. Agricultural activity centersmainly on rice, cotton, sugar cane and wheat crops. Piura is the main producerof sorghum and the second producer of rice in the country.
The GDP per capita for Piura in 1996 was 675,7 dollars. Analyzing the distributionby economic activities, mining is found to be the main sector due to the importanceheld by oil exploration, which represents 28% of the department’s GDP. Thecommercial, hotel and agricultural sector follow the above in level of importance,with 16%.
15 Compendio de Estadísticas Departamentales 1997-1998. INEI.16 Ibid
Piura: Politics and demographic data.
Chart 7
Source: Compendio de Estadísticas Departamentales 1997-1998.
Made by: APOYO Institute
Provinces Population (Inhab.) Capital City
Piura 547 641 PiuraAyabaca 135 475 Ayabaca
Huancabamba 122 351 HuancabambaMorropon 172 596 ChulucanasPaita 83 058 Paita
Sechura 246 055 SechuraSullana 134 636 SullanaTalara 45 218 Talara
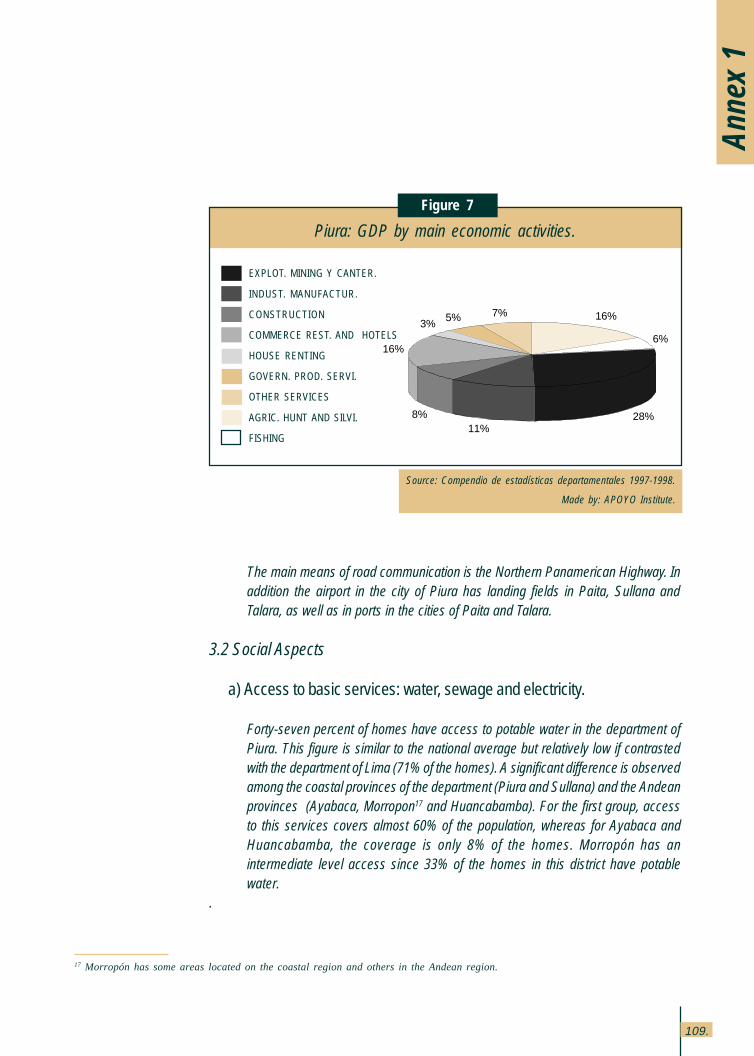
109.
The main means of road communication is the Northern Panamerican Highway. Inaddition the airport in the city of Piura has landing fields in Paita, Sullana andTalara, as well as in ports in the cities of Paita and Talara.
3.2 Social Aspects
a) Access to basic services: water, sewage and electricity.
Forty-seven percent of homes have access to potable water in the department ofPiura. This figure is similar to the national average but relatively low if contrastedwith the department of Lima (71% of the homes). A significant difference is observedamong the coastal provinces of the department (Piura and Sullana) and the Andeanprovinces (Ayabaca, Morropon17 and Huancabamba). For the first group, accessto this services covers almost 60% of the population, whereas for Ayabaca andHuancabamba, the coverage is only 8% of the homes. Morropón has anintermediate level access since 33% of the homes in this district have potablewater.
.
17 Morropón has some areas located on the coastal region and others in the Andean region.
Piura: GDP by main economic activities.
Figure 7
Source: Compendio de estadísticas departamentales 1997-1998.
Made by: APOYO Institute.
Anne
x 1
EXPLOT. MINING Y CANTER.
INDUST. MANUFACTUR.
CONSTRUCTION
COMMERCE REST. AND HOTELS
HOUSE RENTING
GOVERN. PROD. SERVI.
OTHER SERVICES
AGRIC. HUNT AND SILVI.
FISHING
16%
6%
28%11%
8%
16%
3%5% 7%
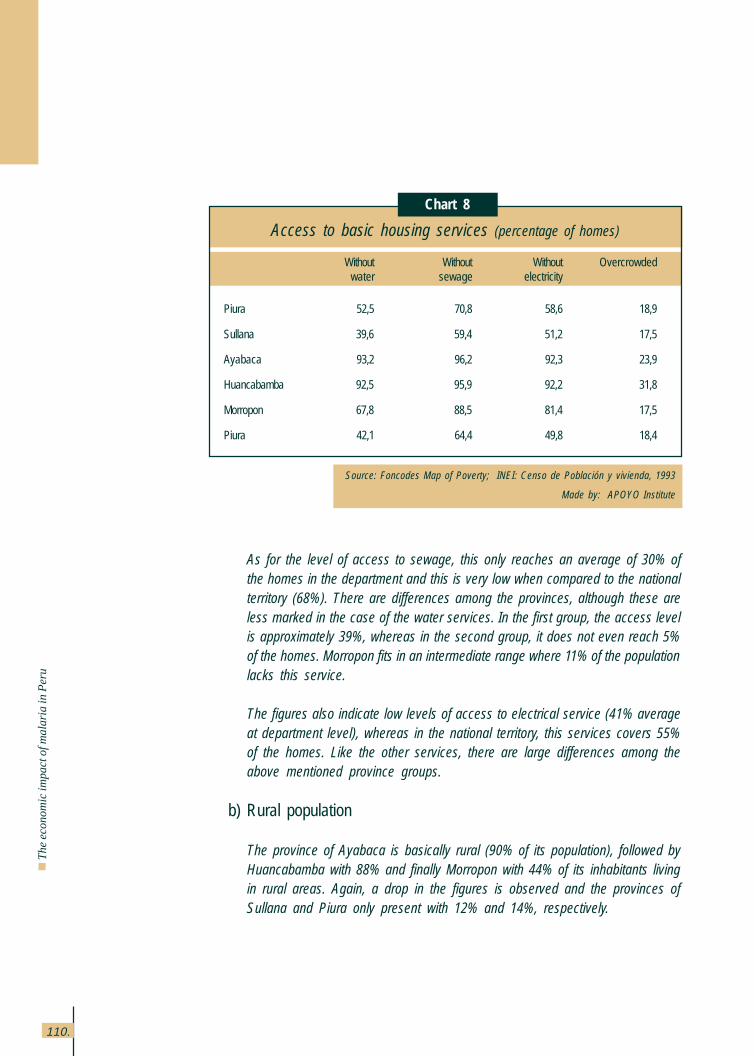
110.
Th
e e
con
om
ic im
pa
ct o
f ma
laria
in P
eru
As for the level of access to sewage, this only reaches an average of 30% ofthe homes in the department and this is very low when compared to the nationalterritory (68%). There are differences among the provinces, although these areless marked in the case of the water services. In the first group, the access levelis approximately 39%, whereas in the second group, it does not even reach 5%of the homes. Morropon fits in an intermediate range where 11% of the populationlacks this service.
The figures also indicate low levels of access to electrical service (41% averageat department level), whereas in the national territory, this services covers 55%of the homes. Like the other services, there are large differences among theabove mentioned province groups.
b) Rural population
The province of Ayabaca is basically rural (90% of its population), followed byHuancabamba with 88% and finally Morropon with 44% of its inhabitants livingin rural areas. Again, a drop in the figures is observed and the provinces ofSullana and Piura only present with 12% and 14%, respectively.
Access to basic housing services (percentage of homes)
Source: Foncodes Map of Poverty; INEI: Censo de Población y vivienda, 1993
Made by: APOYO Institute
Without Without Without Overcrowded water sewage electricity
Piura 52,5 70,8 58,6 18,9
Sullana 39,6 59,4 51,2 17,5
Ayabaca 93,2 96,2 92,3 23,9
Huancabamba 92,5 95,9 92,2 31,8
Morropon 67,8 88,5 81,4 17,5
Piura 42,1 64,4 49,8 18,4
Chart 8
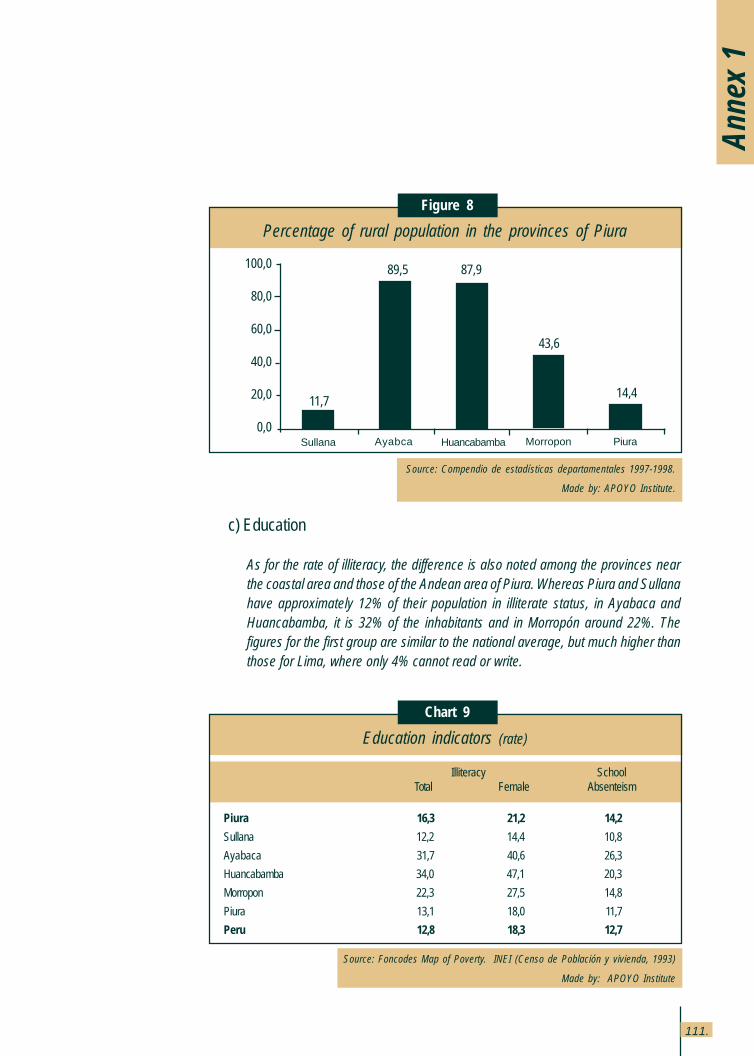
111.
c) Education
As for the rate of illiteracy, the difference is also noted among the provinces nearthe coastal area and those of the Andean area of Piura. Whereas Piura and Sullanahave approximately 12% of their population in illiterate status, in Ayabaca andHuancabamba, it is 32% of the inhabitants and in Morropón around 22%. Thefigures for the first group are similar to the national average, but much higher thanthose for Lima, where only 4% cannot read or write.
Anne
x 1
Chart 9
Source: Foncodes Map of Poverty. INEI (Censo de Población y vivienda, 1993)
Made by: APOYO Institute
Education indicators (rate)
Illiteracy SchoolTotal Female Absenteism
Piura 16,3 21,2 14,2
Sullana 12,2 14,4 10,8
Ayabaca 31,7 40,6 26,3
Huancabamba 34,0 47,1 20,3
Morropon 22,3 27,5 14,8
Piura 13,1 18,0 11,7
Peru 12,8 18,3 12,7
14,4
43,6
87,989,5
Percentage of rural population in the provinces of Piura
Figure 8
Source: Compendio de estadísticas departamentales 1997-1998.
Made by: APOYO Institute.
11,7
100,0
80,0
60,0
40,0
20,0
0,0PiuraMorroponHuancabambaAyabcaSullana
112.
Th
e e
con
om
ic im
pa
ct o
f ma
laria
in P
eru
3.3 Health
a) Resources, access and coverage
Piura has 6 hospitals, 66 Health Centers and 294 Health Posts and the budgetallocated by the Ministry of Health is 12,70 dollars per capita. The medicalpersonnel in the area is 6,4 physicians and 3,3 nurses per ten thousandinhabitants, both figures are considerably lower than those of Lima (18,9physicians per ten thousand and 9,1 per ten thousand, respectively).
b) Morbidity
As for diseases characteristically affecting children, acute diarrheas and ARIshave relatively low rates for the department (91,2 and 70,6 per each onehundred thousand children, respectively) when compared to the nationalaverage (148,7 and 74,8 per one hundred thousand, respectively). However, itis important to observe that the morbidity rate for Acute Respiratory Infections(ARIs), though lower than the national average is much higher than the ratefor Lima, set at 25,8 cases per ten thousand children.
c) Mortality
The infantile mortality rate is 56 per one thousand children born alive, higherfigure than the national average (43 per one thousand). The child mortalityrate (under 5) is 81 per one thousand children born alive, higher than 59 perone thousand which is the national figure. The percentage of children dying ofacute diarrheas (11%) is almost half the percentage of deaths due to ARIs(26%). The mortality rate due to infectious diseases (193 per one hundredthousand children) is high if compared to the national figures (170 per onehundred thousand) and it is almost 3 times the Lima figure.
d) Food and nutrition
The chronic malnutrition index shows that in Piura, 28 out of every 100 childrenunder 5 years old present a delay in the growth corresponding to their age.The indicator of acute malnutrition shows that 0,4% of the children areunderweight for their height and one out of every 10 children does not havethe adequate weight for their age.
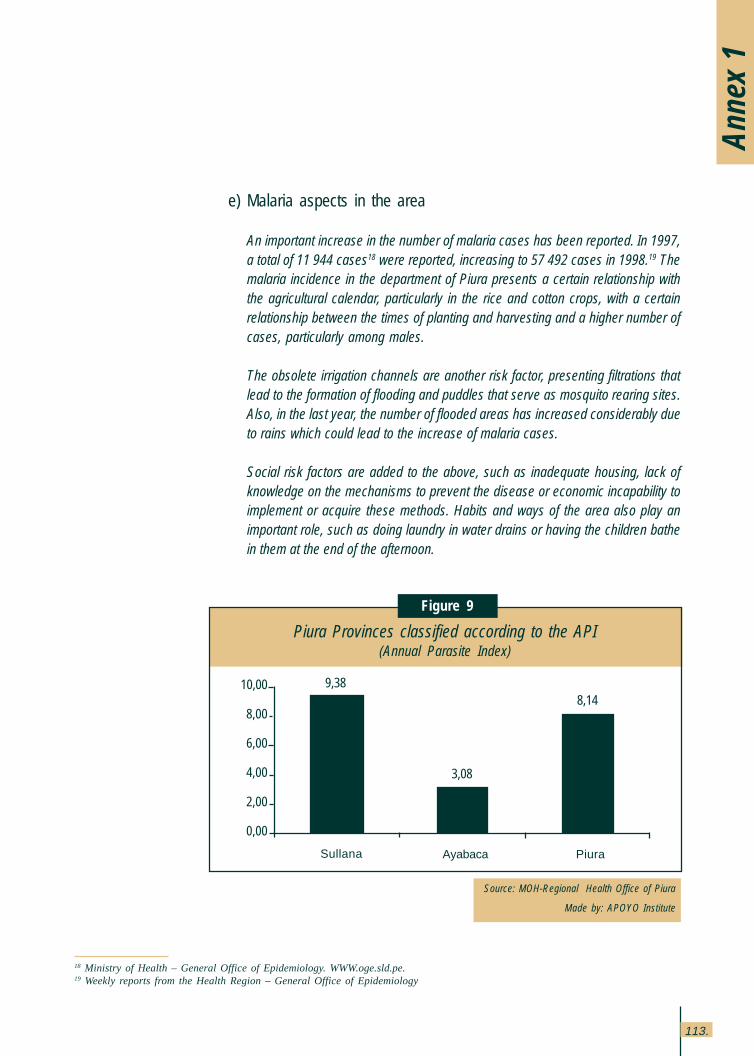
113.
Anne
x 1
e) Malaria aspects in the area
An important increase in the number of malaria cases has been reported. In 1997,a total of 11,944 cases18 were reported, increasing to 57,492 cases in 1998.19 Themalaria incidence in the department of Piura presents a certain relationship withthe agricultural calendar, particularly in the rice and cotton crops, with a certainrelationship between the times of planting and harvesting and a higher number ofcases, particularly among males.
The obsolete irrigation channels are another risk factor, presenting filtrations thatlead to the formation of flooding and puddles that serve as mosquito rearing sites.Also, in the last year, the number of flooded areas has increased considerably dueto rains which could lead to the increase of malaria cases.
Social risk factors are added to the above, such as inadequate housing, lack ofknowledge on the mechanisms to prevent the disease or economic incapability toimplement or acquire these methods. Habits and ways of the area also play animportant role, such as doing laundry in water drains or having the children bathein them at the end of the afternoon.
18 Ministry of Health – General Office of Epidemiology. WWW.oge.sld.pe.19 Weekly reports from the Health Region – General Office of Epidemiology
Source: MOH-Regional Health Office of Piura
Made by: APOYO Institute
Piura Provinces classified according to the API(Annual Parasite Index)
Figure 9
8,14
3,08
9,38
PiuraAyabacaSullana
10,00
8,00
6,00
4,00
2,00
0,00
114.
Th
e e
con
om
ic im
pa
ct o
f ma
laria
in P
eru
Up until 1997, the most important variety of malaria was vivax, but in 1998, thefalciparum cases increased in such a way that the ratio of falciparum malariacases over the total number of malaria cases became 68% for Piura I and 73% forPiura II19. This year, Piura represented 27% of all national cases, figure that iseven higher than the cases in Loreto.
3. 4 Districts visited 20
a) Tambo Grande (locality of Cruceta)
The main activity is agriculture, with rice and mango crops, destined to exports. Aworker’s daily income is 3,17 dollars.
In Cruceta, there is one health post, however, the population does not acknowledgethe existence of health promoters in the area nor do they mention the presence ofany NGO. Among the institutions active in the locality is FONCODES and it hasfinanced the building of latrines in one of the neighborhoods (AA.HH. SanchezCerro). No community organization is perceived and, on the contrary, a quite sociallydesintegrated population is observed.
b) Cura Mori
The main economic activity is rice and cotton crops. The farmers’ income dependson the sale price of mill rice.
Four sanitary areas have been formed (Chato Grande, Pozo de los Ramos, SantaRosa and Cucungará), each one with its corresponding health post. The Cucungaravillage is the one with a Health Center. This locality has a public telephone andradio and TV can be tuned to signals. However, the percentage of the populationwith access to this service is limited.
FONCODES has financed the building of latrines in certain sectors of the districtsnear Cura Mori. Also, a NGO Plan Internacional has carried out some activities inthis locality providing training to health promoters in the Oral Rehydration Units,carrying out house fumigation campaigns and delivery mosquito nets. AnotherNGO working in Cruceta is PRISMA. Through the Cusi Ayllu program, it providesfood assistance to the population of the poorest villages, in the way PRONAAdoes.
20 Statements and data presented in this section have been taken from the Evaluator Reports (Malaria survey).
115.
As for community organizations, there are Mothers’ Associations and a NeighborsBoard formed by the local political authority, the municipal agent, the ladypresident of the Popular Kitchen and the president of the Community DevelopmentCommittee.
c) La Arena
The inhabitants of this locality are dedicated to agriculture (rice, cotton, tomatoesand corn crops), cattle raising, and a group of them work as laborers for the localindustry. However, most are temporary workers (66% of the population) obtainingan average income of 4,75 dollars daily per shift.
As for the health sector, the district of Arenas has six health posts (Las Malvinas,Monte Grande, Chatito, Casa Grande, Loma Negra and Río Viejo). The LaArena Health Center also offers non traditional services through consultationwith healers, bone fixers, midwives and herb prescribers. The spatial locationof the health services is adequate, with a proportionate distribution accordingto the number of inhabitants per jurisdiction.
Reproductive health and family planning programs are conducted by PlanInternacional and CARE, which also collaborates in the vaccination campaignsand in the equipment of the various health services.
d) Bellavista
The most important economic activities in Bellavista are agriculture andcommerce. The most widespread crops are rice, lemons, corn and asparragusand the dwellers of the land are not the owners of it. An important group of thepopulation is employed as workers in the farms.
The health center provides care to six localities of this district, carrying outseasonal fumigation and spraying campaigns over potential mosquito rearingsites.
There is no active local organization and an example of this is that the presenceof health promoters is ther by initiative of the health post and not of thepopulation.
Anne
x 1
116.
Th
e e
con
om
ic im
pa
ct o
f ma
laria
in P
eru
e) Salitral
The main economic activity in this region is agriculture with rice, corn, beans andfruits as the most important crops.
The district of Salitral is within the micro health network of the same name. TheSalitral Health Center is located in this district, as well as the health posts of Hualcas,Serrán, Malacasi, La Alberca and Chignia Baja. The Salitral micro health networkbelongs to the Chulucanas – Morropon macro network and this one belongs to thePiura I Health Region. The Salitral health center has two physicians, one nurse, sixtechnicians and thirty-six health promoters. Malcasi has one physician, one nurse,two technicians and around twenty promoters. La Alberca does not have a doctorbut it has two technicians and twenty promotors. Finally, the Serran health post hasone physician, one nurse, four technicians and around forty promoters.
FONCODES and an NGO called IDEAS have an important presence in the area.The latter carries out work in support of agriculture through the introduction of newvarieties of fruits.
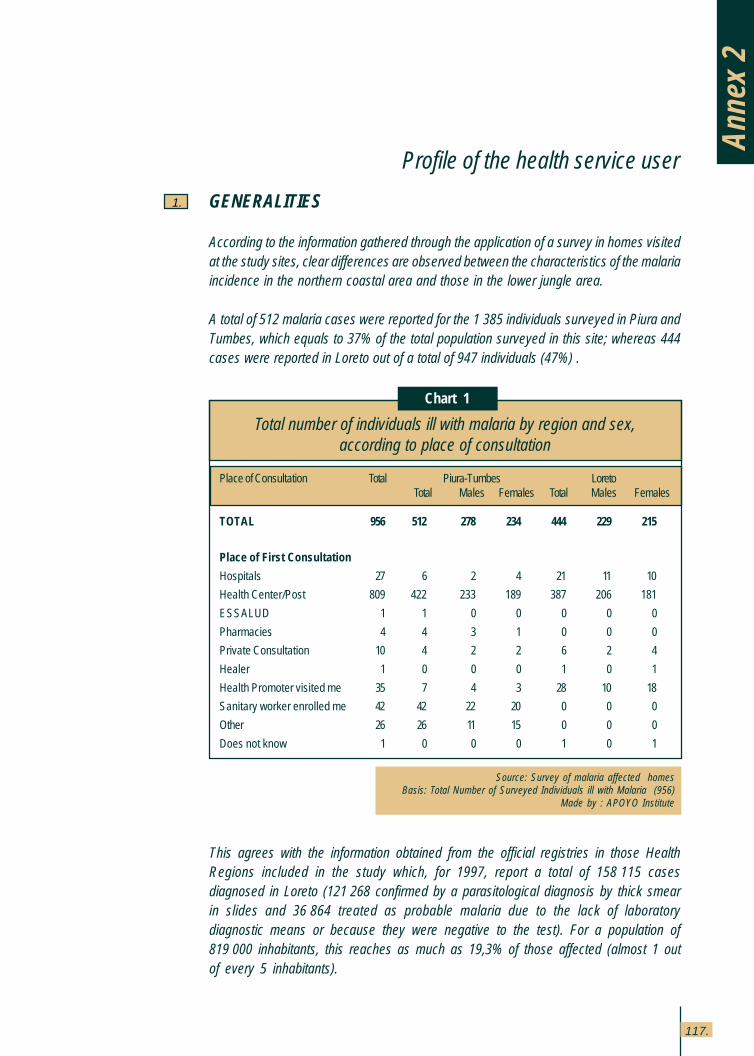
117.
Profile of the health service user
1.
Anne
x 2
Chart 1
Source: Survey of malaria affected homesBasis: Total Number of Surveyed Individuals ill with Malaria (956)
Made by : APOYO Institute
Total number of individuals ill with malaria by region and sex,according to place of consultation
Place of Consultation Total Piura-Tumbes LoretoTotal Males Females Total Males Females
TOTAL 956 512 278 234 444 229 215
Place of First Consultation
Hospitals 27 6 2 4 21 11 10
Health Center/Post 809 422 233 189 387 206 181
ESSALUD 1 1 0 0 0 0 0
Pharmacies 4 4 3 1 0 0 0
Private Consultation 10 4 2 2 6 2 4
Healer 1 0 0 0 1 0 1
Health Promoter visited me 35 7 4 3 28 10 18
Sanitary worker enrolled me 42 42 22 20 0 0 0
Other 26 26 11 15 0 0 0
Does not know 1 0 0 0 1 0 1
GENERALITIES
According to the information gathered through the application of a survey in homes visitedat the study sites, clear differences are observed between the characteristics of the malariaincidence in the northern coastal area and those in the lower jungle area.
A total of 512 malaria cases were reported for the 1,385 individuals surveyed in Piura andTumbes, which equals to 37% of the total population surveyed in this site; whereas 444cases were reported in Loreto out of a total of 947 individuals (47%) .
This agrees with the information obtained from the official registries in those HealthRegions included in the study which, for 1997, report a total of 158,115 casesdiagnosed in Loreto (121,268 confirmed by a parasitological diagnosis by thick smearin slides and 36,864 treated as probable malaria due to the lack of laboratorydiagnostic means or because they were negative to the test). For a population of819,000 inhabitants, this reaches as much as 19,3% of those affected (almost 1 outof every 5 inhabitants).
Annex 2: Profile of the health serviceuser
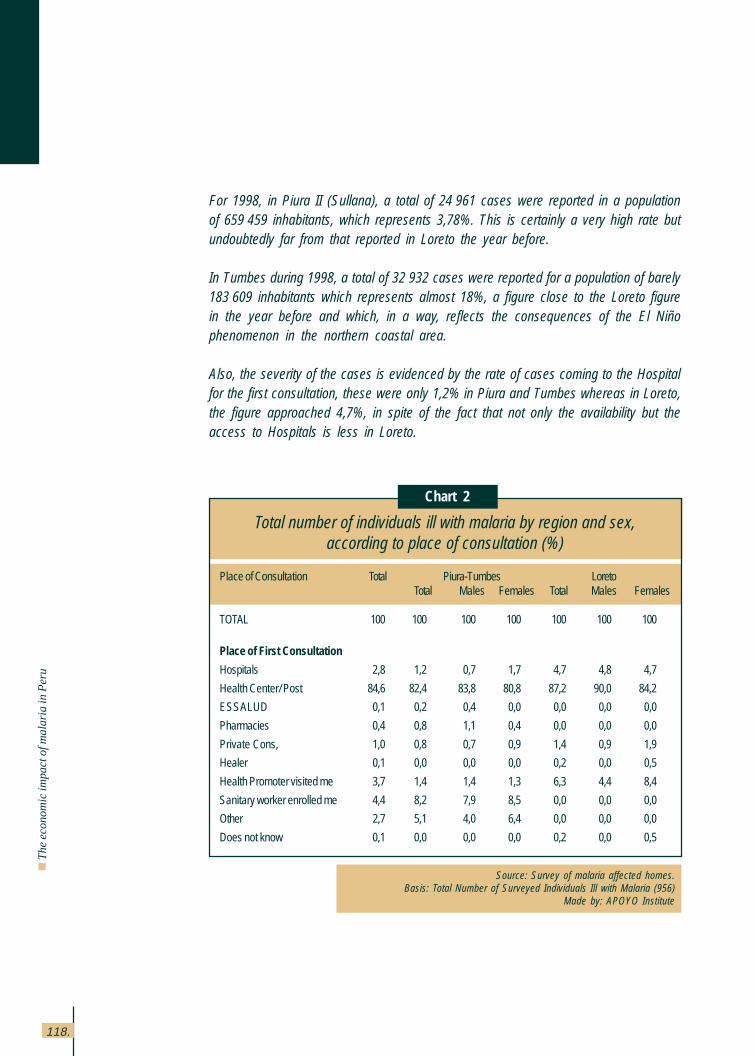
118.
Th
e e
con
om
ic im
pa
ct o
f ma
laria
in P
eru
For 1998, in Piura II (Sullana), a total of 24,961 cases were reported in a populationof 659,459 inhabitants, which represents 3,78%. This is certainly a very high rate butundoubtedly far from that reported in Loreto the year before.
In Tumbes during 1998, a total of 32,932 cases were reported for a population of barely183,609 inhabitants which represents almost 18%, a figure close to the Loreto figurein the year before and which, in a way, reflects the consequences of the El Niñophenomenon in the northern coastal area.
Also, the severity of the cases is evidenced by the rate of cases coming to the Hospitalfor the first consultation, these were only 1,2% in Piura and Tumbes whereas in Loreto,the figure approached 4,7%, in spite of the fact that not only the availability but theaccess to Hospitals is less in Loreto.
Chart 2
Source: Survey of malaria affected homes.Basis: Total Number of Surveyed Individuals Ill with Malaria (956)
Made by: APOYO Institute
Total number of individuals ill with malaria by region and sex,according to place of consultation (%)
Place of Consultation Total Piura-Tumbes LoretoTotal Males Females Total Males Females
TOTAL 100 100 100 100 100 100 100
Place of First Consultation
Hospitals 2,8 1,2 0,7 1,7 4,7 4,8 4,7
Health Center/ Post 84,6 82,4 83,8 80,8 87,2 90,0 84,2
ESSALUD 0,1 0,2 0,4 0,0 0,0 0,0 0,0
Pharmacies 0,4 0,8 1,1 0,4 0,0 0,0 0,0
Private Cons, 1,0 0,8 0,7 0,9 1,4 0,9 1,9
Healer 0,1 0,0 0,0 0,0 0,2 0,0 0,5
Health Promoter visited me 3,7 1,4 1,4 1,3 6,3 4,4 8,4
Sanitary worker enrolled me 4,4 8,2 7,9 8,5 0,0 0,0 0,0
Other 2,7 5,1 4,0 6,4 0,0 0,0 0,0
Does not know 0,1 0,0 0,0 0,0 0,2 0,0 0,5
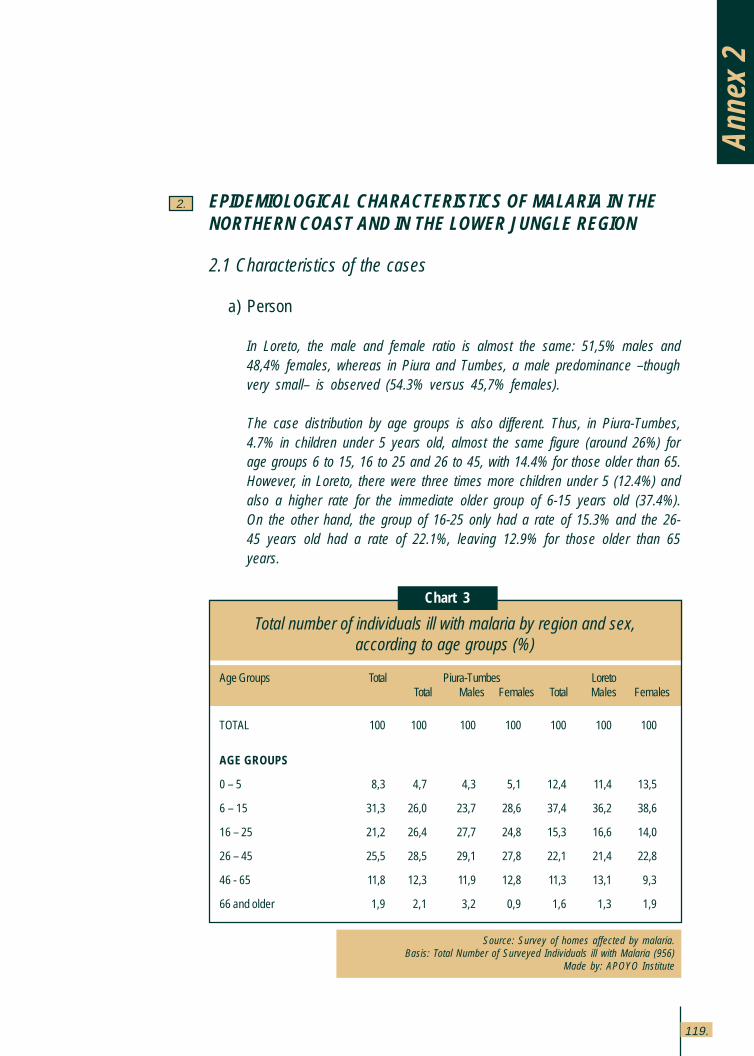
119.
Anne
x 2
EPIDEMIOLOGICAL CHARACTERISTICS OF MALARIA IN THENORTHERN COAST AND IN THE LOWER JUNGLE REGION
2.1 Characteristics of the cases
a) Person
In Loreto, the male and female ratio is almost the same: 51,5% males and48,4% females, whereas in Piura and Tumbes, a male predominance –thoughvery small– is observed (54.3% versus 45,7% females).
The case distribution by age groups is also different. Thus, in Piura-Tumbes,4.7% in children under 5 years old, almost the same figure (around 26%) forage groups 6 to 15, 16 to 25 and 26 to 45, with 14.4% for those older than 65.However, in Loreto, there were three times more children under 5 (12.4%) andalso a higher rate for the immediate older group of 6-15 years old (37.4%).On the other hand, the group of 16-25 only had a rate of 15.3% and the 26-45 years old had a rate of 22.1%, leaving 12.9% for those older than 65years.
Chart 3
Source: Survey of homes affected by malaria.Basis: Total Number of Surveyed Individuals ill with Malaria (956)
Made by: APOYO Institute
Total number of individuals ill with malaria by region and sex,according to age groups (%)
Age Groups Total Piura-Tumbes LoretoTotal Males Females Total Males Females
TOTAL 100 100 100 100 100 100 100
AGE GROUPS
0 – 5 8,3 4,7 4,3 5,1 12,4 11,4 13,5
6 – 15 31,3 26,0 23,7 28,6 37,4 36,2 38,6
16 – 25 21,2 26,4 27,7 24,8 15,3 16,6 14,0
26 – 45 25,5 28,5 29,1 27,8 22,1 21,4 22,8
46 - 65 11,8 12,3 11,9 12,8 11,3 13,1 9,3
66 and older 1,9 2,1 3,2 0,9 1,6 1,3 1,9
2.
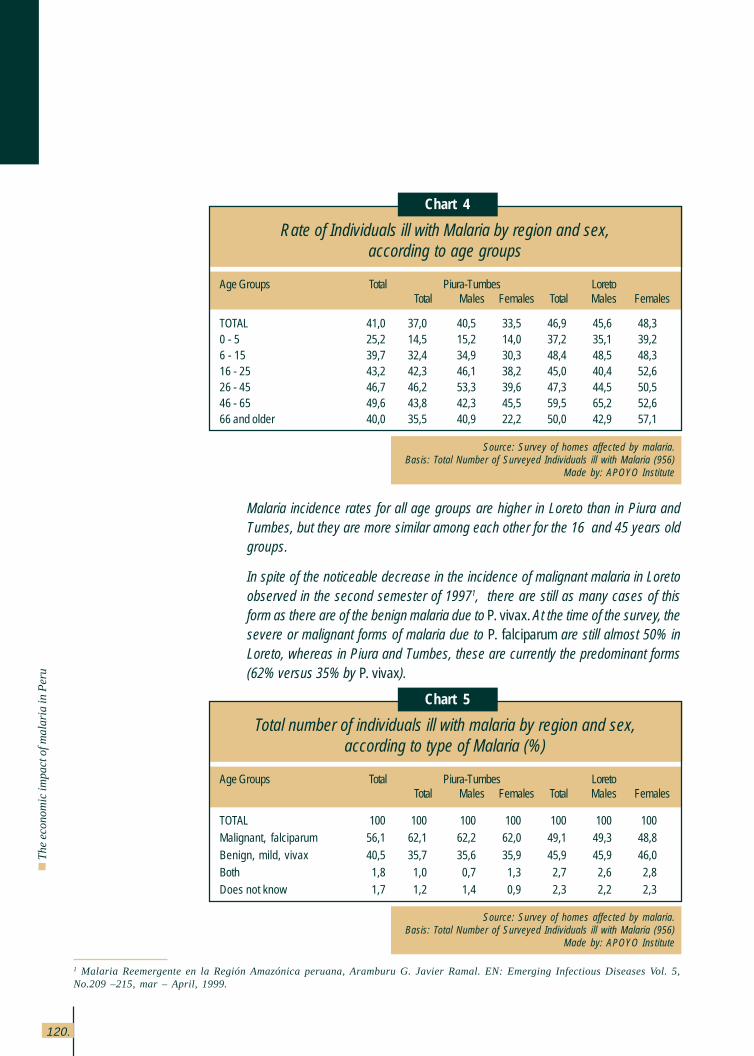
120.
Th
e e
con
om
ic im
pa
ct o
f ma
laria
in P
eru
Malaria incidence rates for all age groups are higher in Loreto than in Piura andTumbes, but they are more similar among each other for the 16 and 45 years oldgroups.
In spite of the noticeable decrease in the incidence of malignant malaria in Loretoobserved in the second semester of 19971, there are still as many cases of thisform as there are of the benign malaria due to P. vivax. At the time of the survey, thesevere or malignant forms of malaria due to P. falciparum are still almost 50% inLoreto, whereas in Piura and Tumbes, these are currently the predominant forms(62% versus 35% by P. vivax).
Chart 4
Source: Survey of homes affected by malaria.Basis: Total Number of Surveyed Individuals ill with Malaria (956)
Made by: APOYO Institute
Rate of Individuals ill with Malaria by region and sex,according to age groups
Age Groups Total Piura-Tumbes LoretoTotal Males Females Total Males Females
TOTAL 41,0 37,0 40,5 33,5 46,9 45,6 48,30 - 5 25,2 14,5 15,2 14,0 37,2 35,1 39,26 - 15 39,7 32,4 34,9 30,3 48,4 48,5 48,316 - 25 43,2 42,3 46,1 38,2 45,0 40,4 52,626 - 45 46,7 46,2 53,3 39,6 47,3 44,5 50,546 - 65 49,6 43,8 42,3 45,5 59,5 65,2 52,666 and older 40,0 35,5 40,9 22,2 50,0 42,9 57,1
Chart 5
Source: Survey of homes affected by malaria.Basis: Total Number of Surveyed Individuals ill with Malaria (956)
Made by: APOYO Institute
Total number of individuals ill with malaria by region and sex,according to type of Malaria (%)
Age Groups Total Piura-Tumbes LoretoTotal Males Females Total Males Females
TOTAL 100 100 100 100 100 100 100Malignant, falciparum 56,1 62,1 62,2 62,0 49,1 49,3 48,8
Benign, mild, vivax 40,5 35,7 35,6 35,9 45,9 45,9 46,0Both 1,8 1,0 0,7 1,3 2,7 2,6 2,8Does not know 1,7 1,2 1,4 0,9 2,3 2,2 2,3
1 Malaria Reemergente en la Región Amazónica peruana, Aramburu G. Javier Ramal. EN: Emerging Infectious Diseases Vol. 5,No.209 –215, mar – April, 1999.
121.
b) Transmission site
In Tumbes malaria affects not only those workers dedicated to shrimp larvaeextraction but also the farmers dedicated to rice crops.
In Piura I and Piura II (Sullana), the individuals affected are particularly farmersdedicated to rice crops and there is no evidence of other cases within the samefamilies which would allow for the suspicion that the infection is not happeningin the intra domiciliary, but in the work fields.
Something similar is currently being observed in Santa Maria de Nanay inLoreto where no cases are found (nor vectors) in the houses, in spite of thisbeing the area with the highest incidence. The infection seems to be takingplace in the forest, upon extraction of palm tree leaves, which is the maineconomic activity of the population.
This occupational exposure may be playing an important role in Tumbes andSullana, justifying the need to perform entomological studies, not only in thedwelling but also at the work place and during the hours workers are exposed.
The areas that are legally required to remain free from rice crops in the vicinityof the homes are not being respected; the vector control activities (larvae aswell as adults) are regarded with apprehension by the farmers, for fear ofhurting the shrimp extraction; and lastly, it is relevant to ask if malariatransmission occurs in the intra domiciliary or at the work place itself.
IPHN studies are carried out under traditional conditions but there is a concernto find out if mosquitoes also feed in the rice paddies or in the shrimp ponds.There is clearly an alteration of the environment caused by man’s economicactivities and closely linked to the development of the vectors and the spreadof disease.
c) Intensity of the attack and principal parasite species
The average number of episodes per person observed in Loreto was 2,5 where45% had only one episode, whereas 32,2% had more than three episodes(14,4% had five or more).
Anne
x 2
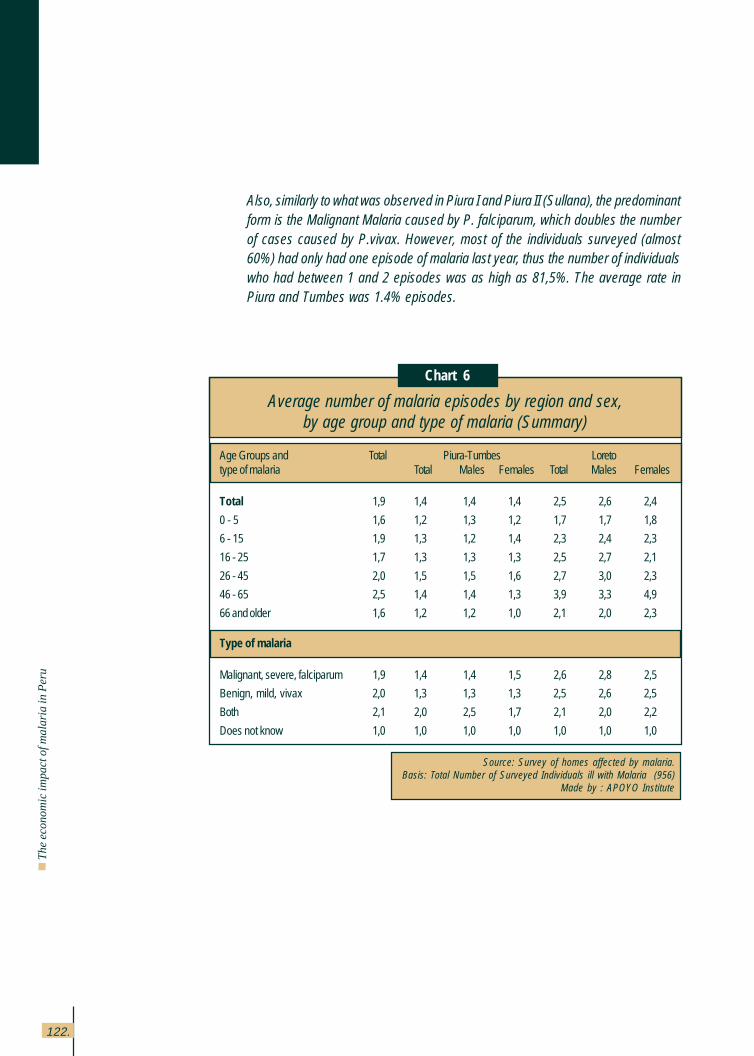
122.
Th
e e
con
om
ic im
pa
ct o
f ma
laria
in P
eru
Also, similarly to what was observed in Piura I and Piura II (Sullana), the predominantform is the Malignant Malaria caused by P. falciparum, which doubles the numberof cases caused by P.vivax. However, most of the individuals surveyed (almost60%) had only had one episode of malaria last year, thus the number of individualswho had between 1 and 2 episodes was as high as 81,5%. The average rate inPiura and Tumbes was 1.4% episodes.
Chart 6
Source: Survey of homes affected by malaria.Basis: Total Number of Surveyed Individuals ill with Malaria (956)
Made by : APOYO Institute
Average number of malaria episodes by region and sex,by age group and type of malaria (Summary)
Age Groups and Total Piura-Tumbes Loretotype of malaria Total Males Females Total Males Females
Total 1,9 1,4 1,4 1,4 2,5 2,6 2,4
0 - 5 1,6 1,2 1,3 1,2 1,7 1,7 1,8
6 - 15 1,9 1,3 1,2 1,4 2,3 2,4 2,3
16 - 25 1,7 1,3 1,3 1,3 2,5 2,7 2,1
26 - 45 2,0 1,5 1,5 1,6 2,7 3,0 2,3
46 - 65 2,5 1,4 1,4 1,3 3,9 3,3 4,9
66 and older 1,6 1,2 1,2 1,0 2,1 2,0 2,3
Type of malaria
Malignant, severe, falciparum 1,9 1,4 1,4 1,5 2,6 2,8 2,5
Benign, mild, vivax 2,0 1,3 1,3 1,3 2,5 2,6 2,5
Both 2,1 2,0 2,5 1,7 2,1 2,0 2,2
Does not know 1,0 1,0 1,0 1,0 1,0 1,0 1,0
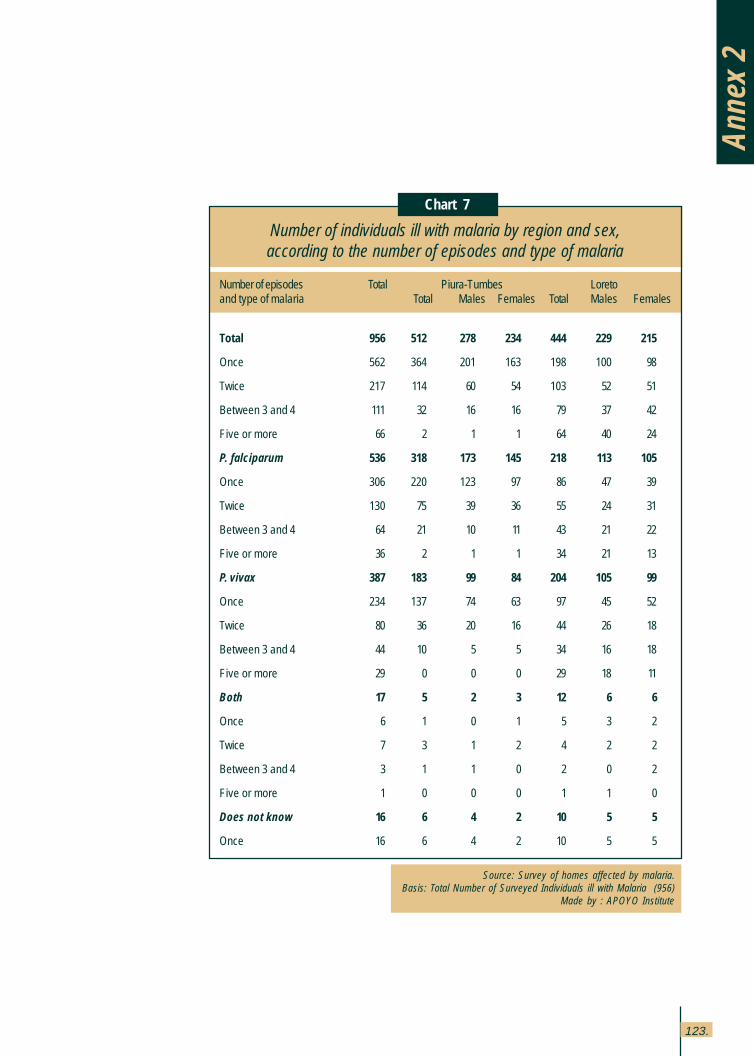
123.
Chart 7
Source: Survey of homes affected by malaria.Basis: Total Number of Surveyed Individuals ill with Malaria (956)
Made by : APOYO Institute
Number of individuals ill with malaria by region and sex,according to the number of episodes and type of malaria
Number of episodes Total Piura-Tumbes Loretoand type of malaria Total Males Females Total Males Females
Total 956 512 278 234 444 229 215
Once 562 364 201 163 198 100 98
Twice 217 114 60 54 103 52 51
Between 3 and 4 111 32 16 16 79 37 42
Five or more 66 2 1 1 64 40 24
P. falciparum 536 318 173 145 218 113 105
Once 306 220 123 97 86 47 39
Twice 130 75 39 36 55 24 31
Between 3 and 4 64 21 10 11 43 21 22
Five or more 36 2 1 1 34 21 13
P. vivax 387 183 99 84 204 105 99
Once 234 137 74 63 97 45 52
Twice 80 36 20 16 44 26 18
Between 3 and 4 44 10 5 5 34 16 18
Five or more 29 0 0 0 29 18 11
Both 17 5 2 3 12 6 6
Once 6 1 0 1 5 3 2
Twice 7 3 1 2 4 2 2
Between 3 and 4 3 1 1 0 2 0 2
Five or more 1 0 0 0 1 1 0
Does not know 16 6 4 2 10 5 5
Once 16 6 4 2 10 5 5
Anne
x 2
124.
Th
e e
con
om
ic im
pa
ct o
f ma
laria
in P
eru
USE OF SERVICES
The average expense incurred by patients for medications was twice as much in Piura -Tumbes than in Loreto, not only at Hospitals but at Health Centers and Posts, and even atPrivate Consultations. The average time spent waiting and under medical care is longerin Piura-Tumbes than in Loreto. The fee charged for medical care at the Health Centersand Posts is higher in Loreto.
3.1 Place of medical care
It is noticeable that the majority of patients (85%) were seen at Health Centers and Postsin Tumbes-Piura, as well as in Loreto. In Piura and Tumbes, 10% of those seen at HealthCenters and Posts were enrolled by the Sanitary technician and in Loreto, a similarpercentage was visited by the Health Promoter.
3.2 Accessibility
The time it took to access the first consultation site is about 10 minutes in Piura-Tumbesand almost 20 minutes in Loreto.
3.3 Concentration
The average number of consultations in both regions is similar for all health providers(approximately 4 consultations at Hospitals and Health Centers and half for PrivateConsultations and Healers), except for Piura-Tumbes where 10 visits were reported forEsSalud and 2,5 to the Pharmacy, which is unparalleled in Loreto. Also, the cost oftransportation is 5 times higher in Loreto than in Piura-Tumbes.
3.
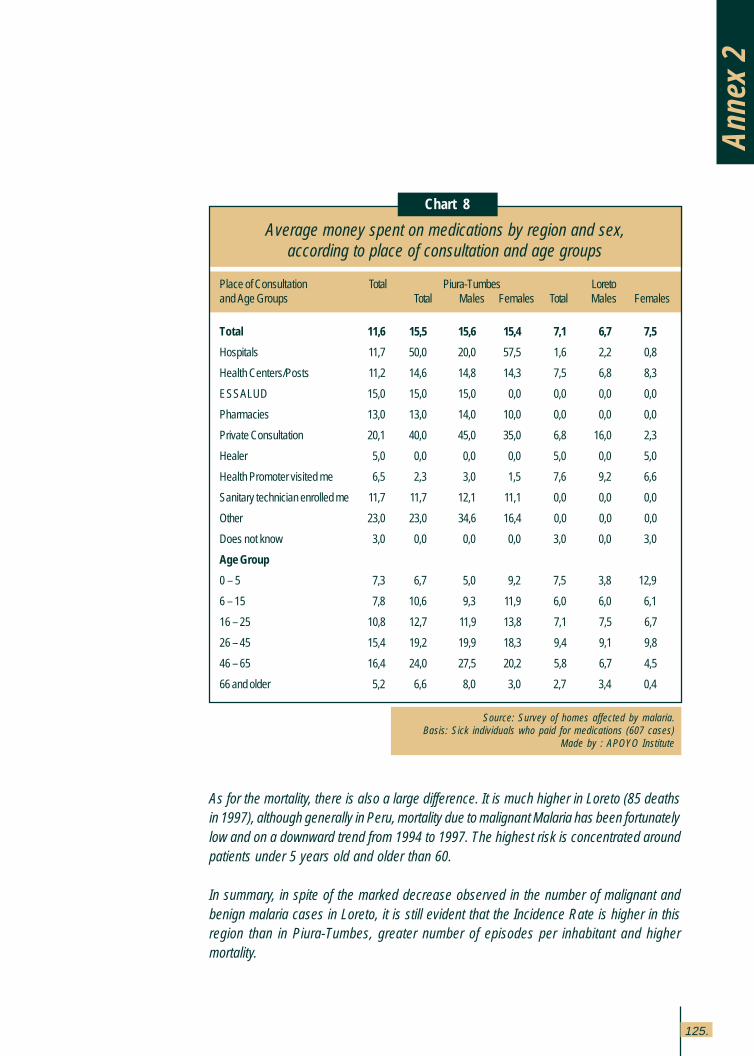
125.
As for the mortality, there is also a large difference. It is much higher in Loreto (85 deathsin 1997), although generally in Peru, mortality due to malignant Malaria has been fortunatelylow and on a downward trend from 1994 to 1997. The highest risk is concentrated aroundpatients under 5 years old and older than 60.
In summary, in spite of the marked decrease observed in the number of malignant andbenign malaria cases in Loreto, it is still evident that the Incidence Rate is higher in thisregion than in Piura-Tumbes, greater number of episodes per inhabitant and highermortality.
Chart 8
Source: Survey of homes affected by malaria.Basis: Sick individuals who paid for medications (607 cases)
Made by : APOYO Institute
Average money spent on medications by region and sex,according to place of consultation and age groups
Place of Consultation Total Piura-Tumbes Loretoand Age Groups Total Males Females Total Males Females
Total 11,6 15,5 15,6 15,4 7,1 6,7 7,5
Hospitals 11,7 50,0 20,0 57,5 1,6 2,2 0,8
Health Centers/Posts 11,2 14,6 14,8 14,3 7,5 6,8 8,3
ESSALUD 15,0 15,0 15,0 0,0 0,0 0,0 0,0
Pharmacies 13,0 13,0 14,0 10,0 0,0 0,0 0,0
Private Consultation 20,1 40,0 45,0 35,0 6,8 16,0 2,3
Healer 5,0 0,0 0,0 0,0 5,0 0,0 5,0
Health Promoter visited me 6,5 2,3 3,0 1,5 7,6 9,2 6,6
Sanitary technician enrolled me 11,7 11,7 12,1 11,1 0,0 0,0 0,0
Other 23,0 23,0 34,6 16,4 0,0 0,0 0,0
Does not know 3,0 0,0 0,0 0,0 3,0 0,0 3,0
Age Group
0 – 5 7,3 6,7 5,0 9,2 7,5 3,8 12,9
6 – 15 7,8 10,6 9,3 11,9 6,0 6,0 6,1
16 – 25 10,8 12,7 11,9 13,8 7,1 7,5 6,7
26 – 45 15,4 19,2 19,9 18,3 9,4 9,1 9,8
46 – 65 16,4 24,0 27,5 20,2 5,8 6,7 4,5
66 and older 5,2 6,6 8,0 3,0 2,7 3,4 0,4
Anne
x 2
VECTOR CONTROL ACTIVITIES
In Loreto, the main response from the population has been the increased use of mosquitonets (sprayed or impregnated with pytethoids), taking advantage of the appearance of avector with intra-domiciliary and night biting habits which include times when most peopleare asleep (Anopheles darlingi). The use of mosquito nets is part of an activity promotedand spread by the Regional Health Office, along with others destined to control newrearing sites, identified as the fish farm ponds and other ponds where Temephus-typelarvicides were used.
The assessment of these interventions, which were applied particularly during the extendedsummer window period derived from the El Niño phenomenon in the Amazon area, showsthat a dramatic decrease of the epidemic curve was attained. Although, some of theirconclusions have not been yet confirmed due to deficiencies in the methodology, thereare important indicators suggesting that intra domiciliary transmission was affected by thisintervention, particularly those studies carried out in riverside communities along theNapo River.
It is important to tell an interesting experience conducted in Piura-Tumbes by the individualsin charge of a Community Project developed in some sample parcels of the San Juan deCatacaos Community.
The experience involved modifying the habitual watering scheme of continuous floodingof the rice crops, comparing it with three intermittent watering models which subjected thecrops to 7 days of watering and 3, 6, or 9 dry days in each one of the three experimentalmodels to be tested.
Later, an assessment was conducted of the presence of various stages of anophelinelarvae in the puddles, as well as the presence of pupae stage and the output of the ricecrops. In the model of watering plus 9 dry days, a clear decrease in all larvae stages anda total absence of pupae were observed, keeping the rice crop production unaltered.
This was tested for two years and, at present, they are attempting a larger scale test, tryingto achieve a multiplying effect by imitation. An additional economic advantage (not quiteevident at present because farmers do not pay for the water they use in watering) is asavings of 40% water with the new scheme of 7 and 9 days of watering/dry.
4.
INDEX OF ANNEXES OF MALARIA STUDIES NOTINCLUDED IN THIS EDITION
Survey sheet of MOH and other Institutions.
Format to collect information about direct cost.
Questionnaire for MOH and other Institutions.
Interview form for tourist operators.
Questionnaire of malaria survey.
Surveyor’s manual.
Summary chart of the tourist operators interviews.
If you want asking for any annexes from this list,please apply for it to Proyecto Vigía,
located at Camilo Carrillo 402, Jesús María, Lima;or telephone 51 (1) 332-3482 51 (1) 332-3458;
fax 51 (1) 332-3458;or via e-mail: [email protected]

This book was was printed by Editorial Supergráfica E.I.R.L.
Jr. Ica 344-346, Lima 1Telephone: 51(1) 4266470


![5W`Za >SROZ BVSW` EOg b] O 0SbbS` :WTS[OYS c^ []ab ]T bVS Q]c\b`g O`S eWbV]cb `Sa]c`QSa bVOb bVS ESab bOYSa T]` U`O\bSR ;]ab ZOQY eObS` T]]R VSOZbVQO`S aQV]]Za O\R S\bS`^`WaS BVS 5O[PWO](https://img.pdfslide.fr/doc/110x75/5ecbc1dac75e8e26d02e900a/5wza-sroz-bvsw-eog-b-o-0sbbs-oys-c-ab-t-bvs-qcbg-os-ewbvcb-sacqsa.jpg)


![Présentation bvs maj mars 2016 [mode de compatibilité]](https://img.pdfslide.fr/doc/110x75/58ad4fd21a28ab0b0f8b4f0b/presentation-bvs-maj-mars-2016-mode-de-compatibilite.jpg)