Embed Size (px)
Citation preview
2
THESE
POUR L’OBTENTION DU GRADE DE DOCTEUR DE L’UNIVERSITE DE POITIERS
(Faculté des Sciences Fondamentales et Appliquées)
(Diplôme National - Arrêté du 7 août 2006)
Ecole Doctorale : Sciences pour l’Environnement Gay Lussac.
. Secteur de Recherche :
Biologie de l’environnement, des populations, écologie
Présentée par : Steve AUGIRON
Effectuée au Centre d’Études Biologiques de Chizé, Équipe AGRIPOP
************************
Evaluation des outils de conservation de la biodiversité en milieu
agricole : cas des Zones de Protections Spéciales et des Mesures
Agro-Environnementales - biodiversité
************************ Directeur de Thèse :
Vincent BRETAGNOLLE
************************ Soutenue le 19 mars 2012
devant la Commission d’Examen
JURY
Mme Tichit Muriel INRA - Paris Grignon Rapporteur Mr Julliard Romain MHN de Paris Rapporteur Mr Grandjean Frederic CNRS de Poitiers Examinateur Mr Lemaire Gilles INRA de Lusignan Examinateur Mr Boutin Jean-Marie ONCFS de Chizé Examinateur Mr Bretagnolle Vincent CNRS de Chizé Directeur de thèse
2
REMERCIEMENTS Les remerciements, c’est simple et compliqué, Donc veuillez m’excuser pour tout oubli ou même ordre car il n’y en a pas forcement, il est tard, il fait froid, je suis fatigué …. (il faut que je dorme… ZZzzz zzz) Bon alors je remercie sur 3 ans et 4 mois, le temps de la thèse ou sur un peu plus de 6 ans, le temps passé au labo de Chizé. (Bon c’est quand même un peu compliqué, ou on commence ou on finit). Je vais commencer…nous verrons où on s’arrête.
Je tiens à remercier Mr Boniface Koko, Directeur de l’Ecole Doctorale de Poitiers, qui a accepté de m’accueillir au sein de l’ED Sciences pour l’Environnement Gay Lussac, pendant ces trois années et 4 mois. Je tiens à remercier sincèrement Mme Sylvie Perez et Mme Sabrina Biais, pour leurs écoutes et leurs compréhensions, surtout en cette fin de thèse. C’est essentiel de trouver des personnes comme vous au sein de ces grandes universités, car en tant que doctorant vous êtes notre seul réel relais, et sachez que vous avez parfaitement répondu à l’ensemble de mes attentes et incertitudes, merci encore…
Je tiens à remercier le Directeur de l’unité de recherche UPR 1934, qui est aussi le directeur de l’équipe de recherche AGRIPOP, et qui est aussi mon directeur de thèse, Mr Bretagnolle Vincent. Je ne sais toujours pas si tu t’en rends compte mais nous sommes dans une conjoncture où le cumul de mandats n’est pas forcement bien vu (cf. gouvernement), à humour quand tu nous tiens ... C’est un peu long à expliquer, et oui quand même six ans avec le même directeur, c’est une certaine complicité et confiance qui se sont instaurées, et je lui dois beaucoup, tant dans l’approche et la rigueur de travail que dans le questionnement général qu’il tente de susciter dans notre recherche, mais aussi et encore une fois cette confiance qu’il m’a transmise aussi bien dans la gestion d’équipe, de logistique mais aussi de projet. Bon il faut qu’en même faire attention à tout ce que l’on dit car je ne suis pas sûr que ses chevilles tiennent le coup ! Et puis il y a aussi les mauvais cotés oui le côté obscur de la force… c’est aussi ça qui a fait de cette relation quelque chose de non platonique, parfois éruptive, mais au final constructive et surtout vraie, UN vrai et grand MERCI pour tout ce que tu m’a permis de faire ici, et je garderai en tête tout ces moments « off » pleins de déconnade et d’excès …
Je tiens à remercier l’ensemble de mon jury : Muriel Tichit, Romain Julliard, Frédéric Grandjean, Jean-Marie Boutin et Gilles Lemaire, il n’a pas été de tout repos de tous vous réunir, un réel grand merci d’avoir accepté, en un temps court ! En espérant que le travail de recherche établi dans le cadre de cette thèse puisse susciter l’envie d’aller plus loin dans la réflexion. Je ne doute pas que vous saurez contribuer, par vos commentaires et suggestions, à son amélioration… Un grand merci d’avance. Sylvie merci… !! Je peux m’arrêter là car cela fait une rime… ou pas ?? Merci d’être juste toi, tu es « toujours présente » pour filer un coup de main comme tu dis si bien, tu es dynamique, motivante, intéressée, pleine de questions mais ce qui est frappant c’est que tu fais partie des personnes vraies et c’est précisément cela qui fait du bien ici.
A l’équipe « AgriPoulpe » ou AgriPop, plus ou moins large selon les saisons et les années, merci à un ancien et unique (dans tous les sens du terme), Pablo, non pas Escobar mais Inschausti, je suis heureux d’avoir pu échanger avec toi à mon arrivée ici tu fais parti de ces personnes riches de connaissances que l’on aime écouter. Patrick D. un honneur d’avoir
3
pu faire partie de cette équipe lorsque tu étais Directeur de laboratoire. Tu représentes la réussite à la Francaise (private joke), un succès d’intégration, tu es un anglais parti vivre en Afrique et qui décide de venir travailler en France mais pourquoi ? Ton enthousiasme est débordant, tes conseils avisés et percutants, mais c’est surtout cette motivation que tu transmets aux gens lorsque tu félicites et encourages le travail accompli, c’est un petit rien qui fait une grosse différence.
Isabelle dite El Criquette, elle vit, dort et mange criquet, tu as raison il serait dommage qu’on loupe une trouvaille sur les criquets ! Merci pour tes discussions, conseils et ton investissement dans le management d’équipe, mais le padaouan te donne un conseil « it’s time to eat », en d’autres mots, prend le temps pour toi et valorise tes travaux. Je termine par une phrase de mon collègue Yoda : « Dure la route est, long le chemin est, criquet tu n’es pas née, mais ta vie tu y auras voué »
Une pensée, un peu triste pour moi, de cette équipe de rêve avec laquelle j’ai bravé vents et marées, mais aussi les soirées… Salomus, Alex (ou Mac Callagan), Victorinox, Léo El Pan (mon agri Bio), Benoit Gl.. (Bip !!), mais aussi Popchat (Guillaume), et attention le jeu de mots, « je ne boirai pas de ton eau Olivier » oui un peu long comme nom de famille et biensûr Mister JF del’blanco (notre cowboy en botte enfin ça c’est l’hiver non parce que sinon c’est pieds nus qu’il est) et Daminou (le travesti du GODS), merci à vous deux pour ces moments chaleureux dans ce magnifique bureau N°1 Agripop. Merci pour votre aide dans les moments de difficultés … Pour ce qui est du patrimoine foncier, JF je te laisse le pont, c’est déjà un super point d’Obs, et toi Dams si tu veux le péage … pour ton côté j’aime l’argent débordant. Vous tous qui au cours de ces années ont partagé bcp bcp bcp de choses bon je ne peux pas tout dire « hein té bien une vieille .. ! Merci Salom toujours dans la dentelle ». Merci à toi Thomas C, pour nos échanges, tes conseils avisés, ta collaboration, ta gentillesse mais aussi pour ta couleur de cheveux, je sais ça t’énerve mais nous on aime, je t’apprécie bcp.
Un TRES GRAND remerciement pour le terrain à l’ensemble de l’équipe Agripop (Contractuels, stagiaires, thésards) depuis 2008, la liste est bien trop longue, ainsi directement ou indirectement vous avez participé à la conception, à l’application, aux tris et déterminations, sans vous tout ceci serait impossible… Un très très grand merci à vous tous … car c’est précisément ce mutualisme qui nous permet d’aller encore plus loin. Et justement un des points forts de ce petit village et que nous trouvons encore de l’énergie et de l’envie, celui de prendre du temps pour aider l’autre, alors continuez, What else !
Merci et force et honneur à notre équipe (Bertrand G, Vincent L, Mathieu L, Adrien P, Boen, Kevin L, Thibault P, Helene D, Jerome Y, Paul M, Nicolas G, Stefanyia K, Marylin R, Fabrice R, Orianne R, et David P qui a une place un peu hybride car coincé entre plusieurs equipes), mais aussi aux plus anciens de l’équipe (Audrey S, Alban T, Nadine & Noel, Vincent R « le Braco marché », Mathieu Coincoin ..) tout n’est pas facile, les comportements, les caractères, les idées et les préjugés, dans ce microcosme nous reproduisons le Loft, en mieux, mais cela nous montre au combien il peut être difficile de vivre en groupe, mais je pense que l’on peut se féliciter de faire de cette station une véritable base expérimentale où l’on s’emploie à dépasser les problèmes de personnes, pour tendre vers une dynamique écologiquement et évolutivement « stable ». En tout les cas j’ai pu avoir la chance de connaître certains d’entre vous plus sincèrement dans une complicité de travail ou personnelle et c’est avec toute honnêteté que je vous dis merci.
4
Merci à mon Chrichri (Coiffet), pour sa gentillesse et son ouverture.. euhh ! Bon tu es vrai, pas de blabla et bon cuistot qui plus est. Et un grand merci pour les lunettes … passe pour le pot après la thèse tu auras tous les coups que tu veux.. et j’ai une bouteille au bureau !
Merci à l’administration plus précisément Evelyse, Delphine et Martine, j’ai toujours pu compter sur vous, bon et désolé de n’avoir pris le temps de vous réapprovisionner en chocolat … autant que vous le souhaitiez.
Merci aux laborantines de la microbio, qui ont toujours été là pour nous épauler et traiter nos échantillons en des temps record.
Bon pour le service informatique, c’est plus compliqué car ce n’est pas forcement de leurs fautes, et oui comme on dit « c’est le système ! ». Mais sachez que j’ai toujours pu compter sur vous, si si une grande partie du temps, vous avez tout au long de ces années été présents pour tenter de résoudre mes problèmes informatiques, le SAV n’est pas forcement au top (un effet Free.fr, trop de pub et l’on suit pu derrière..ahah c’est une blague). ET enfin je tiens à donner une étoile de louveteaux à André, un vrai scout, il est toujours présent pour aider contre vents et marées !!. Merci aux collaborateurs de papiers, Salom, Thomas, Luca, Seb et V… et bientôt Helmut et Isa cela ne tient qu’à vous d’avoir ce privilège… ihihih
Oui vraiment, vous aurez tous à votre manière investie beaucoup de temps en un minimum de temps (bon ok le terme « minimum » n’est pas approprié pour tous les articles !). merci pour les discussions, les stats, l’approche écrite en anglais .. enfin tout ce qu’il faut pr mener un manuscrit … many thank all
Je tiens à remercier aussi trois demoiselles (ou dames ? je ne sais pas trop car bon maintenant ça a bien évolué) avec qui j’ai partagé un grand nombre de moments lors de collocations, de soirées, de terrain, des moments tristes mais aussi des moments de rires, ouff vous avez cru que j’allais plomber la fin des remerciements, alors un grand merci à Jessica A, Camille F et Sophie L., ça a été un réel plaisir. Et comme le veux la tradition je vous dis « Force et honneur ».
Merci au collectif chizéen, aux petits (voire nains), aux grands, aux gros mais aussi aux maigres, aux gens biens mais d’ailleurs aussi à ceux qui le sont moins, aux personnes ouvertes ou personnes plutôt fermées, aux PostDoc, aux thésards, aux chercheurs, aux stagiaires, pour les rires, les pleurs aussi, les échanges, les bonjours ou les simples regards.
Remerciements aux anciens qui sont partis il y a quelques années et à ceux qui ont décidé de continuer encore un peu, et qui ont emporté avec eux cette folle dynamique et nous ont laissé qu’une simple petite musique nostalgique « On the road again »…
Je tiens à remercier ma famille, vous savez dans le cheminement d’une vie, nous pouvons être amenés à nous éloigner mais aussi à nous rapprocher, à se comprendre ou à se sentir complètement incompris, nous sommes très souvent physiquement loin des uns et des autres mais nous serons toujours proches, malgré tout, au fond de nous. Sachez que ce travail est l’accomplissement d’un long cheminement personnel, en tous les cas j’y ai mis toute ma volonté et ma force pour y arriver… plus que quelques pas, et si cela a été rendu possible c’est aussi grâce à vous, chacun à votre manière, avec vos mots ou vos gestes, avec nos moments de rires et de pleurs, nous nous enrichissons les uns des autres, pour cela nous nous devons de continuer à avancer conjointement.
5
A toi, ma jolie et toi, mon fils, merci d’être, oui d’être tout simplement dans ma vie, vous n’imaginez pas le bonheur et l’énergie que vous m’apportez, bon vous m’en prenez aussi..ihih. Comme tu sais, dans un tel exercice, on passe toujours par des phases « up » et « down », mais ce que je sais moi, c’est que j’ai toujours pu te trouver dans chacun de ces moments, avec ces lots de difficultés et de soutiens, merci du fond du cœur. Tu me demandes de quoi demain est fait, je n’en sais rien, mais ce que je peux dire c’est qu’il sera fait et construit autour de vous, vous êtes mon carburant cette force qui me pousse à aller de l’avant. Enfin un petit clin d’œil à l’Afrique, petit rayon de chaleur pendant les longues périodes d’hiver, pendant lesquelles j’ai pu y encadrer de folles explorations en compagnie d’un grand nombre afin de sillonner la brousse à la recherche de milliers d’Acridivores … KKrrunchh !!
"Si l'eau d'un bassin reste sans mouvement, elle devient stagnante et boueuse ; Mais si elle s'agite et coule, alors elle s'éclaircit : tel est l'homme qui voyage." Proverbe kurde - 1905.
6
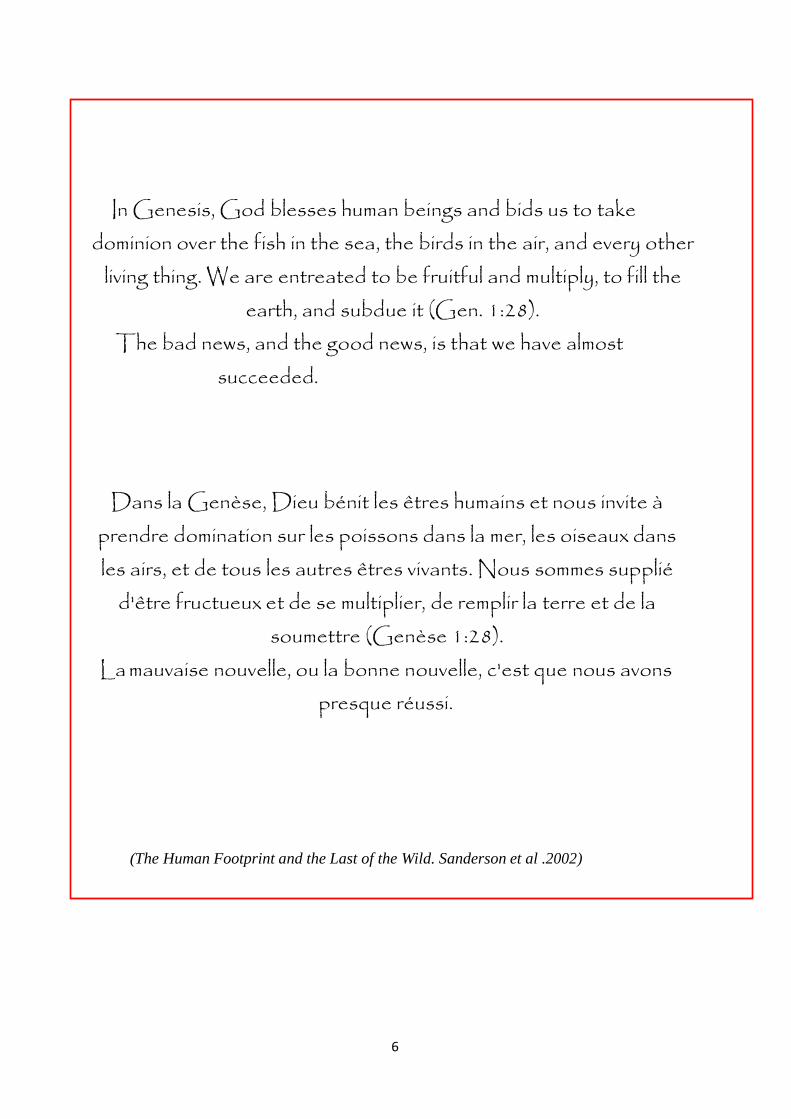
In Genesis, God blesses human beings and bids us to take dominion over the fish in the sea, the birds in the air, and every other
living thing. We are entreated to be fruitful and multiply, to fill the
earth, and subdue it (Gen. 1:28).
The bad news, and the good news, is that we have almost succeeded.
Dans la Genèse, Dieu bénit les êtres humains et nous invite à
prendre domination sur les poissons dans la mer, les oiseaux dans
les airs, et de tous les autres êtres vivants. Nous sommes supplié
d'être fructueux et de se multiplier, de remplir la terre et de la
soumettre (Genèse 1:28).
La mauvaise nouvelle, ou la bonne nouvelle, c'est que nous avons
presque réussi.
(The Human Footprint and the Last of the Wild. Sanderson et al .2002)
7
Table des MatièresTable des MatièresTable des MatièresTable des Matières
REMERCIEMENTS 2
CHAPITRE 1: Introduction & démarche de thèse 10 INTRODUCTION 10
1/ Des écosystèmes.. vers les anthroposystèmes 11 1.1/ Rôle de l’agriculture dans ces transformations 12
2/ L’agriculture au centre des enjeux du changement global 12
3/ La biodiversité dans les milieux agricoles 14
4/ Politique de conservation de la biodiversité à l ’échelle européenne 15 4.1/ Traités internationaux 15
4.2/ Evolution des politiques agricoles : vers une cohérence environnementale, économique et sociale 18
5/ Quelle efficacité pour les programmes agro-envir onnementaux : analyse bibliographique 21
5.1/ Mesures Agro-Environnementales et agriculture Biologique : Résultats des méta-analyses 21 DEMARCHE DE THESE 26 1/ Cadre général de la thèse 26 2/ Problématique 26 3/ Organisation du manuscrit 26 Références bibliographiques 28
CHAPITRE 2: 35
Local improvement of skylark Alauda arvensis and corn bunting Miliaria calandra trends in an intensive arable land: a case study of the co nservation tool Natura 2000 36 Abstract 37
Keywords 37
Introduction 38
Methods 40 Study area 40 Birds survey 40 Statistical analysis 41
Results 42 Smoothed trends in time series, accounting for confounding covariates 42 Spatial effect of the designation and spatial effect of delineation of the SPA 43 Are SPA effects a results of changes in landscape composition? 44 Comparison with trends at higher spatial scales 44
Discussion 45
8
Population trends 45 SPA and habitat improvement 46
Conclusion 47
Acknowledgements 48
References 49
Tables and figures 55
CHAPITRE 3: 68
A functional approach to quantify the spatio-tempor al and multi-scale effects of agri-environment schemes on individual species: a case s tudy with the corn bunting in central western France. 69
Abstract 70
Keywords 70
Introduction 71
Materials and Methods 72 Study area and Agri-Environment Schemes 72 Monitoring corn bunting abundance 74 GIS procedures 75 Statistical analyses 75
Results 77 Observer and sampling effects 77 Habitat relationships 78 Landscape context: Historical Stability Index and Natura 2000 Special Protection Area 78 Spatial and temporal AES effectivness 79
Discussion 80
Synthesis and Application 82
Acknowledgements 83
References 84
Tables and figures 88
CHAPITRE 4: 95
Relative effects of targeted versus non-targeted Ag ri-Environment Schemes on a farmland specialist bird, the Skylark Alauda arvens is, in French agro-ecosystems. 96
Abstract 97
Keywords 97
Introduction 98
Methods 99 Study area 99 Agri-Environment Schemes 99 GIS procedures 100 Skylark Monitoring 100 Statistical analyses 101
Results 102 Sampling effect and habitat relationships 102
9
AES effects 103
Discussion 103
Conclusion 106
Acknowledgements 107
References 108
Tables and figures 114
CHAPITRE 5: DISCUSSION, CONCLUSION ET PERSPECTIVES 121
1/ Bilan des résultats 122 2/ Quelle est l'efficacité des outils de conservati on en milieu intensif: les ZPS 123
Elements de méthodologie 124
Apport du monitoring à long terme 124 Le réseau de ZPS à une échelle nationale.. 125 Viabilité du réseau 126 Le réseau de ZPS en agro-système 126 Etude complémentaires pouvant être menées 126 3/ Quelle est l’efficacité des outils de conservati on en milieu intensif : les mesures agri-environnementales 127 Condensé des résultats 129
Sélection d’habitat et mesures agro-environnementale 129 En quoi le temps d’application d’une MAE peut affecter positivement la biodiversité ? 132 Effet de la surface en MAE sur la biodiversité : 133 MAE et éléments naturels et semis naturels, facteurs clefs pour la biodiversité 134 4/ Outils de conservation et perspectives 136 Mise en place d’une cohérence de conservation à l’échelle nationale 137
Références bibliographiques 139
Abstracts 144 Keywords 144
Résumé 145
Mots clefs 145

10
CHAPITRE I
INTRODUCTION
11
1 / Des écosystèmes… vers les anthroposystèmes
L’Homme a sans cesse modifié son environnement, d’abord de manière modeste, à
l’image des outils dont il disposait, puis de manière beaucoup plus conséquente. Bien
que la transformation directe des écosystèmes par l’homme fasse l’objet d’estimations
variées selon les études, elle n’en n’est pas moins consensuelle aujourd’hui. De fait, les
humains ont transformé les écosystèmes et les processus qui les sous-tendent dans la
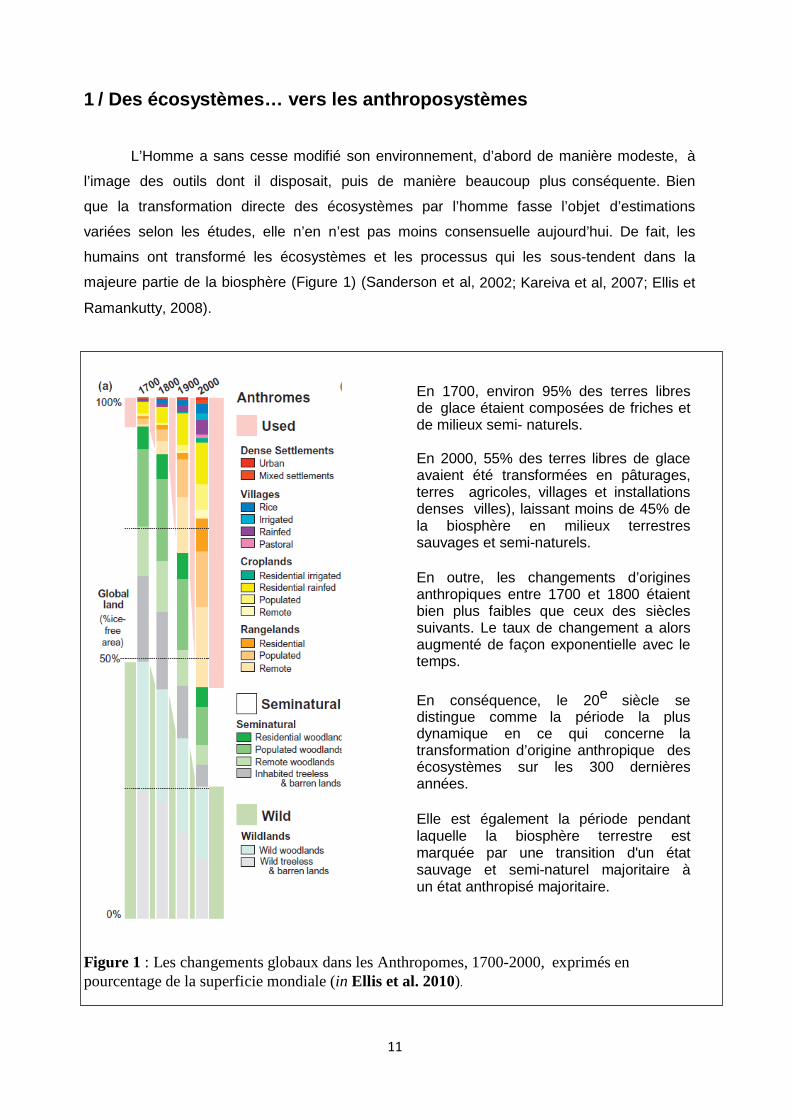
majeure partie de la biosphère (Figure 1) (Sanderson et al, 2002; Kareiva et al, 2007; Ellis et
Ramankutty, 2008).
Figure 1 : Les changements globaux dans les Anthropomes, 1700-2000, exprimés en pourcentage de la superficie mondiale (in Ellis et al. 2010).
En 1700, environ 95% des terres libres de glace étaient composées de friches et de milieux semi- naturels. En 2000, 55% des terres libres de glace avaient été transformées en pâturages, terres agricoles, villages et installations denses villes), laissant moins de 45% de la biosphère en milieux terrestres sauvages et semi-naturels. En outre, les changements d’origines anthropiques entre 1700 et 1800 étaient bien plus faibles que ceux des siècles suivants. Le taux de changement a alors augmenté de façon exponentielle avec le temps.
En conséquence, le 20e siècle se distingue comme la période la plus dynamique en ce qui concerne la transformation d’origine anthropique des écosystèmes sur les 300 dernières années. Elle est également la période pendant laquelle la biosphère terrestre est marquée par une transition d'un état sauvage et semi-naturel majoritaire à un état anthropisé majoritaire.
12
L’évolution démographique et géographique humaine est telle que son empreinte « écologique
» est maintenant probablement irréversible. Nous nous approprions plus de 40% de la
production primaire nette produite sur Terre chaque année (Vitousek et al. 1986, Rojstaczer et
al. 2001), consommons 35% de la productivité du plateau océanique (Pauly et Christensen,
1995) et utilisons 60% de l’eau douce de ruissellement (Postel et al. 1996).
Les activités humaines ont ainsi engendré de nombreuses extinctions, invasions, introductions
et domestications d’espèces ; elles ont également conduit à l’augmentation de l’érosion des
sols, altéré la fréquence des incendies et le fonctionnement des hydrosystèmes continentaux.
Au final, elles ont provoqué de profonds changements dans la productivité primaire et autres
processus clés, biogéochimiques et éco-systémiques (Vitousek et al, 1997; Defries et al, 2004;
Foley et al, 2005; Dearing et al, 2006; Hobbs et al, 2006; Ellis & Ramankutty, 2008; Hansen &
Galetti, 2009 in Ellis et al. 2010).
L’effet cumulatif de ces changements locaux se traduit par un phénomène mondial de
l’influence humaine sur la nature, une nouvelle époque géologique que certains appellent l’ère
«anthropocène» (Steffen et Tyson 2001, in Sanderson et al. 2002).
1.1 Rôle de l’agriculture dans ces transformations
L’agriculture occupe une très large part dans les changements d’utilisations des terres, et ce
plus fortement encore depuis les deux derniers siècles. Ce mode d’utilisation des terres trouve
ses origines environ 10000 ans plus tôt, lorsque l’homme entame une transition entre activité
de chasse et de cueillette vers un mode de production agricole, dans un premier temps
essentiellement centré sur l’autoconsommation et l’économie de subsistance. Cette évolution
est lente, via la sélection des graines poussant naturellement, jusqu’à la domestication et la
culture des plantes. Les habitats naturels ont alors été transformés en terres agricoles
extensives, diversifiant les paysages et permettant alors à de nombreuses espèces de
coloniser ces nouveaux habitats.
Depuis la révolution néolithique à aujourd’hui, l’homme est passé vers une utilisation (de plus
en plus permanente) croissante des terres pour l’agriculture et le développement, ayant la
capacité à remodeler les paysages et les processus éco- systémiques de façon directe ou
indirecte, volontaire ou non et ce dans toute la biosphère.
2 / L’agriculture au centre des enjeux du changemen t global
L’accélération des modes et des pratiques agricoles résulte de la pénurie alimentaire suite à la
Seconde Guerre mondiale. L’objectif est alors de reconstruire un secteur agricole
13
structurellement déficitaire via un développement rapide et une amélioration profonde de ses
techniques de production afin d’augmenter sa productivité et diminuer sa variabilité (Gardner,
1996). Ce qui sera mis en œuvre par la Politique Agricole Commune au sein de l’Union
Européenne en 1962. Cette politique signe une transition majeure et brutale entre une
agriculture extensive et locale vers une agriculture intensive et une production vouée à l’agro-
alimentaire et l’exportation. Les transformations sont majeures, l’intensification devient
mécanique et chimique. Cette politique donne une impulsion forte à la production de denrées
alimentaires mais aussi de désordre écologique (Robinson et Sutherland. 2002).
En pratique, l’évolution de l’agriculture est d’abord caractérisée par une forte augmentation de
la taille des parcelles, une diminution des éléments fixes du paysages (haies, bosquets, cours
d’eau et points d ‘eau etc..), une diminution des milieux pérennes (prairies, pâtures et cultures
pérennes). Puis une homogénéisation des cultures et une simplification des rotations sont
mises en place.
A titre d’exemple, en 1955, la France comptait 2,3 millions d’exploitations agricoles et près de
8 millions de personnes participant régulièrement au travail (Maurice Desriers, L’agriculture
française et l’Europe). En 2010, on ne comptabilise plus qu’environ 500000 exploitations
agricoles et 970 000 personnes participant régulièrement au travail (Agreste 2010), soit une
diminution de 78% des exploitations agricoles et 88% des personnes participants aux travaux.
Ce constat se poursuit à l’échelle européenne. Ainsi, au cours des dix dernières années
(2000-2010), le nombre d’exploitations a baissé de 24 % en Italie, 29 % aux Pays-Bas, 36 %
en Allemagne et 26 % en France (Agreste 2010).
Cette évolution a eu pour effet de limiter les petites exploitations à faible rendement, via un
remembrement massif et un regroupement continu des exploitations : ainsi en 1955, 80% des
exploitations agricoles comptaient moins de 20 hectares de SAU et 0,8% seulement
occupaient plus de 100 hectares. En 2010, par contraste, environ 50 % des exploitations
comptent moins de 20 ha de SAU et 19% des exploitations font plus de 100 ha
(agreste.agriculture.gouv.fr, 2010).
Parallèlement, cette évolution est aussi définie par une augmentation des apports en produits
phytosanitaires (insecticides, fongicides, herbicides…) et en fertilisants mais aussi par une
forte irrigation, modifiant ainsi directement ou indirectement les conditions physicochimiques
des sols des agro-écosystèmes (Vickery et al. 2001, Geiger et al. 2010). Ainsi Colombel
(2000) montre qu’entre 1959 et 1980, la quantité d’intrants utilisés dans l’agriculture a
augmenté de 250% avant de décroître. Toutefois, leur utilisation continue d’évoluer
qualitativement puisque les produits sont aujourd’hui plus concentrés et plus spécialisés.
14
Cette évolution globale a engendré une perte d’hétérogénéité spatiale des paysages agricoles
(Weibull et al. 2000, Benton et al. 2003), une plus grande instabilité temporelle (Vickery et al.
2001), ainsi qu’une réduction des milieux refuges et des corridors biologiques, éléments
déterminants de la non fragmentation des paysages (Fahrig et al. 2003). Les pratiques
agricoles intensives, sont fortement liées entre elles, aussi bien à l’échelle de la parcelle qu’à
celle du paysage (Benton et al.2003), ayant pour conséquence directe une perte de biodiversité
au niveau local etun risque accru d’extinction au niveau mondial (Aviron et al, 2005 ; Clough et
al, 2007 ; Norris et al. 2008).
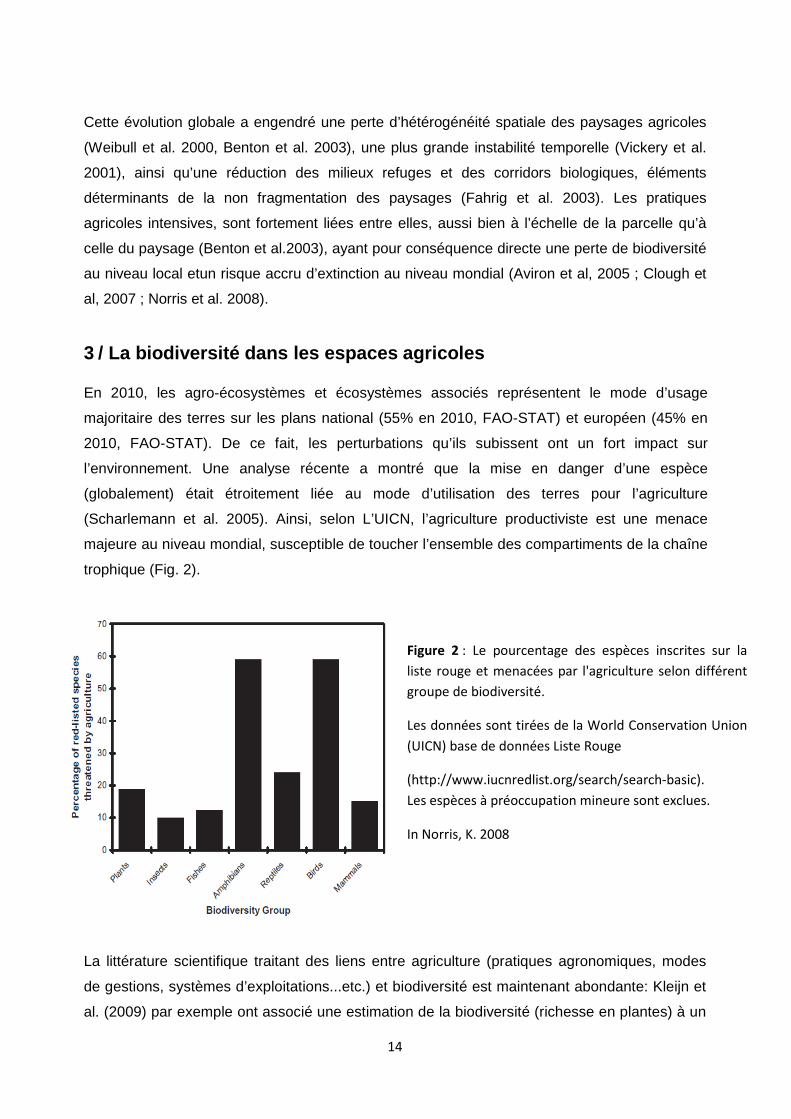
3 / La biodiversité dans les espaces agricoles En 2010, les agro-écosystèmes et écosystèmes associés représentent le mode d’usage
majoritaire des terres sur les plans national (55% en 2010, FAO-STAT) et européen (45% en
2010, FAO-STAT). De ce fait, les perturbations qu’ils subissent ont un fort impact sur
l’environnement. Une analyse récente a montré que la mise en danger d’une espèce
(globalement) était étroitement liée au mode d’utilisation des terres pour l’agriculture
(Scharlemann et al. 2005). Ainsi, selon L’UICN, l’agriculture productiviste est une menace
majeure au niveau mondial, susceptible de toucher l’ensemble des compartiments de la chaîne
trophique (Fig. 2).
La littérature scientifique traitant des liens entre agriculture (pratiques agronomiques, modes
de gestions, systèmes d’exploitations...etc.) et biodiversité est maintenant abondante: Kleijn et
al. (2009) par exemple ont associé une estimation de la biodiversité (richesse en plantes) à un
Figure 2 : Le pourcentage des espèces inscrites sur la
liste rouge et menacées par l'agriculture selon différent
groupe de biodiversité.
Les données sont tirées de la World Conservation Union
(UICN) base de données Liste Rouge
(http://www.iucnredlist.org/search/search-basic).
Les espèces à préoccupation mineure sont exclues.
In Norris, K. 2008
15
indicateur de gestion (taux d’intrants en Azote) sur un grand nombre de parcelles agricoles
(130 pérennes et 141 annuelles), dans 6 pays européens. Après avoir pris en compte les
différences environnementales, ils ont montré une diminution de la richesse spécifique avec
l’augmentation de l’intensité de l’utilisation des terres. Sur une même zone agricole au centre
de l’Allemagne, Baessler & Klotz (2006) ont montré, via une série temporelle de relevés
floristiques (120 parcelles échantillonnées en 1957, 115 parcelles en 1979 et 220 en 2000),
que le nombre et le taux de couverture des espèces de plantes ont diminués significativement
depuis les années 50. De la même manière, Fried et al. (2009) ont évalué le changement de
richesse spécifique, de la densité et de la fréquence d’occurrence des plantes adventices.
Leurs résultats indiquent que de nombreuses espèces ayant une valeur de conservation ont
disparu ou fortement diminué dans le centre des parcelles mais semblent toujours persister
dans les bordures des cultures.
A plus large échelle, Geiger et al (2010) ont montré dans une récente étude menée dans 9
pays européens que la diversité en plantes, en carabiques et en oiseaux était négativement
liée à des variables de l’agriculture intensive comme la fréquence et/ou la quantité
d’herbicides, insecticides et/ou fongicides. Enfin, les résultats du réseau de surveillance Pan-
européen des oiseaux communs (PECBMS), ont fourni des indices supplémentaires et
détaillés de la baisse globale des oiseaux inféodés aux milieux agricoles (Donald et al. 2006 ;
Vorisek et al. 2010).
Ainsi, après une probable augmentation de la biodiversité dans les milieux agricoles extensifs
de la période précédent le 20ieme siècle, aujourd’hui la tendance est inversée.
Si le problème général a été identifié, il s’agit désormais de trouver des solutions efficaces afin
de modifier les systèmes de productions et enrayer le déclin généralisé de la biodiversité.
Ainsi, Benton et al. (2003) soulignent l’importance de ne pas concentrer tous les efforts vers
des solutions ciblées mais plutôt globales en s’attachant par exemple à augmenter
l’hétérogénéité perdue, afin de restaurer et d’enrichir les différents compartiments du réseau
trophique.
4/ Politique de conservation de la biodiversité à l ’échelle
européenne
4.1/ Traités internationaux La politique européenne de l’environnement démarre véritablement en 1972, à la suite du
Sommet planétaire de Stockholm. Cette conférence des Nations unies a centré l’attention
internationale sur les questions d’environnement, en particulier sur celles liées à sa
dégradation et à la « pollution transfrontière ». Ce sommet pose pour la première fois des
16
questions d’ordre écologique, notamment la conservation de l’environnement, et amène
désormais à placer les écosystèmes terrestres et marins, la faune et la flore sauvages au rang
de préoccupations internationales.
La fin des années 70, marque un véritable tournant par l’intégration de conventions
internationales et de directives européennes. Ainsi la Directive « Oiseaux » de 1979 devient la
première proposition en matière de législation environnementale. Concernant la conservation
de toutes les espèces d’oiseaux vivant naturellement à l’état sauvage sur le territoire des Etats
membres, elle constitue dans un premier temps le cadre dans lequel s’appliquent les
dispositions de la Convention de « Berne » de 1979 et entre en vigueur en 1982. Cette
dernière Convention a pour objet d’assurer la conservation de la flore et de la faune sauvages
et de leurs habitats naturels, notamment lorsque cette conservation nécessite la coopération
de plusieurs Etats. La Directive « Oiseaux » incite à créer un réseau de sites afin de préserver
les habitats favorables aux espèces d’oiseaux sauvages migrateurs ou non. Une deuxième
directive est adoptée plus tard : en 1992 après 4 ans de discussion, la directive « Habitat »,
constitue avec la directive « Oiseaux » le cadre général l’application des dispositions de la
Convention de Berne.
Au début des années 80, la publication de la Stratégie Mondiale de la Conservation (SMC),
commandée dans le cadre du Programme des Nations Unies pour l’environnement (PNUE),
expose un cadre de travail pour l’établissement de stratégies multi-échelles visant à la
conservation des ressources vivantes dans le processus de l’évolution sociale et économique
actuelle. C’est la première fois que l’expression anglaise « sustainable development » est
traduite par « développement durable ». La conservation y est définie comme la meilleure
gestion permettant de tirer le maximum d’avantages des ressources vivantes et de pouvoir
poursuivre leur exploitation dans le futur. Trois principaux objectifs, unanimement admis,
forment le socle écologique des activités humaines dans la biosphère, i) le maintien des
processus écologiques essentiels et des systèmes vitaux; ii) l’utilisation durable des espèces
et des écosystèmes; iii) la préservation de la diversité biologique. Le discours paraît se
modeler afin de démontrer et de convaincre les décideurs que la conservation de la nature
répond à un intérêt commun.
C’est finalement en 1987 dans le rapport Brundtland intitulé « Notre avenir à tous » qu’est
extraite la définition du développement durable faisant aujourd’hui référence : « Un
développement qui répond aux besoins du présent sans compromettre la capacité des
générations futures de répondre aux leurs ». Tous les secteurs d’activités sont concernés par
le développement durable : l’agriculture, l’industrie, l’habitation etc...
17
Les recommandations figurants dans le rapport Brundtland ont conduit à la tenue de la
Conférence de Rio en 1992. Les nouvelles recommandations en faveur du développement
durable sont alors directement intégrées dans l’Agenda 21.
De ces processus découlent deux conventions que les Etats s’engagent à respecter : la
Convention sur le climat et la Convention sur la diversité biologique (CDB). Cette dernière
constitue le premier accord mondial sur la conservation, l’utilisation durable de la diversité
biologique et le partage juste et équitable des avantages qui découlent de l’utilisation des
ressources génétiques, à des fins commerciales et autres (selon la CDB). Le texte fixe les
orientations majeures de la politique internationale de lutte contre l’érosion de la diversité
biologique mais laisse en suspens les considérations plus pratiques de mise en œuvre, qui
sont abordées et précisées ultérieurement, lors des Conférences des parties (Kiss & Doumbe-
Bille, 1992).
Enfin au cours des années 2000, la prise de conscience mondiale de la perte de biodiversité
s’accélère, ce qui se traduit par des efforts de la communauté mondiale, politique, économique
et scientifique. L’Evaluation des Écosystèmes pour le Millénaire conduite entre 2001 et 2005,
permet d’identifier quatre grands types de services rendus par les écosystèmes:
d’approvisionnement (production de nourriture, de bois), de régulation (pollinisation,
séquestration de carbone), culturels (biodiversité patrimoniale, lieux de récréation) et de
soutien (cycles de l’azote, du carbone). Cette évaluation permet également de confirmer que
60 % environ des écosystèmes sont dégradés à très dégradés et souvent surexploités. En
2002, lors de la conférence des parties à la Convention sur la diversité biologique, les
gouvernements se sont engagés « à assurer, d’ici 2010, une forte réduction du rythme actuel
de perte de diversité biologique aux niveaux mondial, national et régional, à titre de
contribution à l’atténuation de la pauvreté et au profit de toutes les formes de vie sur la planète
». Cependant malgré le nombre croissant de réunions et conférences successives aux
différents échelons gouvernementaux, cette volonté commune s’est révélée impuissante à
stopper l’érosion de la biodiversité. « Aucun pays n’a réussi à atteindre cet objectif », a
constaté Ahmed Djoghlaf, secrétaire exécutif de la CDB.
Au cours de cette dernière décennie les institutions ont travaillé à synthétiser l’ensemble des
enjeux se rapportant à la biodiversité. Le but a été de définir les axes et objectifs d’une
politique s’inscrivant dans un cadre juridique nécessaire à l’instruction des questions de
conservation. Ces institutions insistent sur la nécessité de prendre en compte la biodiversité
dans les politiques sectorielles, notamment l’agriculture. Ainsi, le rapport international sur
l’agriculture a été lancé en 2002 par la banque mondiale et la FAO (Organisation des Nations
unies pour l’alimentation et l’agriculture) pour évaluer les sciences et technologies agricoles au
18
service du développement. Ce document indique que « le statu quo n’est plus une option », il
passe alors en revue les grands défis qui se posent aujourd’hui et souligne l’urgence de
changer les règles qui régissent l’agriculture moderne. Il précise clairement qu’à chaque
niveau, mondial, régional, national et local, les décideurs doivent être profondément conscients
qu’il y a des problèmes différents, de multiples cadres théoriques et modèles de
développement, et diverses options pour atteindre les objectifs de développement et de
durabilité (IAASTD, 2008). Au nombre des options possibles, on peut citer : une utilisation plus
rationnelle des nutriments, de l’énergie, de l’eau et des sols, une meilleure compréhension des
dynamiques sol-plantes-eau, une diversification accrue de l’agriculture, le renforcement des
systèmes agro-écologiques et la préservation de la biodiversité tant au niveau des
exploitations que des paysages (IAASTD, 2008).
Enfin lors de la dernière rencontre « des parties » à Nagoya en 2010, celle-ci a donné lieu à la
réalisation du plan stratégique 2011-2020 pour la diversité biologique. Cette rencontre définit le
besoin d’une vision à long terme « 2050 » et une mission opérationnelle pour 2020, avec en
trame de fond la reconduction de l’objectif d’enrayer la perte de biodiversité …
4.2/ Evolution des politiques agricoles : vers une cohérence
environnementale, économique et sociale
Face à l’évolution des exploitations agricoles et de leurs modes de fonctionnement, l’Union
Européenne a explicitement abordé l’impact de l’agriculture sur l’environnement dans un Livre
vert publié en 1985 (CEC 1985). La réforme de la politique agricole de l’UE (règlement CEE 797
/85) comprend un nouvel ensemble de mesures pour la protection de l’environnement. Ainsi,
l’article 19 autorise les états membres à verser des aides nationales dans des zones
écologiquement sensibles.
Cependant, le véritable tournant n’apparaît qu’en 1992, avec le règlement CEE 2078/92 qui
exige de tous les Etats membres de l’UE une application des mesures agro-environnementales.
Ainsi, L’UE semble vouloir rompre avec une agriculture exclusivement productiviste et décide
d’encourager une agriculture compatible avec les exigences de la protection de
l’environnement. Depuis, l’adhésion volontaire aux Mesures Agro-Environnentales (MAE) est
devenue l’instrument politique essentiel pour la conservation et l’amélioration de
l’environnement dans les milieux agricoles (Burton et al, 2008). Ces mesures ont pour but de
contrecarrer l’effet négatif de l’agriculture moderne sur l’environnement en offrant des incitations
financières aux agriculteurs afin qu’ils adoptent des pratiques agricoles plus respectueuses de
l’environnement (Kleijn & al, 2006). Elles sont le plus généralement appliquées à l’échelle de la
parcelle. Bien que l’essentiel des MAE ne soit pas destiné à la conservation de la biodiversité
19
(Kleijn & al, 2003), il ne s’agit en effet que de l’un de leurs multiples objectifs (gestion de l’eau,
des paysages, mise aux normes environnementales des exploitations…etc.).
L’année 1992 marque aussi l’engagement de l’Union européenne à enrayer la perte de la
biodiversité sur ses territoires en créant un réseau de sites écologiques nommé Natura 2000.
Avec près de 25 000 sites terrestres et marins, il s’agit aujourd’hui du plus vaste maillage de
sites protégés au monde. Ce réseau, mis en place en application de la Directive « Oiseaux » de
1979 et de la Directive « Habitats » de 1992, vise à assurer la survie à long terme des espèces
et des habitats à fort enjeu de conservation en Europe. Pour répondre à cet objectif, une liste
des sites abritant les habitats et espèces ciblés dans les annexes 1 et 2 des directives, est
demandée aux états membres selon un calendrier prévisionnel « théorique » en trois étapes
(liste nationale en 1995, liste communautaire en 1998, et intégration des sites retenus au
réseau Natura2000 en 2004) (OCDE, 2010). L’ensemble de ces sites est classé en deux
catégories : ZPS ou ZSC. La Zone de Protection spéciale (ZPS) vise la conservation des
espèces d’oiseaux sauvages figurant à l’annexe I de la Directive « Oiseaux ». La Zone Spéciale
de Conservation (ZSC) vise la conservation des habitats et des espèces animales et végétales
figurant aux annexes IV de la Directive « Habitats ».
En 2011, le réseau Natura2000 couvre respectivement 18% et 12.5% du territoire européen et
Français. Sur 1753 sites inscrits dans le réseau français, 384 le sont au titre de la Directive «
Oiseaux » et 1369 au titre de la Directive « Habitats, Faune, Flore » (developpement-
durable.gouv.fr).
La dynamique en faveur de l’environnement se concrétise à nouveau pour la période 2000-
2006 par une nouvelle orientation de la PAC qui approfondit et renforce les mécanismes mis en
place en 1992 (« mesures d’accompagnement » dans le cadre du second pilier) dès lors
devenu le Développement Rural. Il comprend principalement les aides agri-environnementales.
A l’inverse du premier pilier, ce second pilier est cofinancé à moitié par les Etats membres et à
moitié par l’UE. Les aides allouées dans le cadre des mesures agro-environnementales via le
Plan de Développement Rural National (PDRN) sont d’abord applicables à travers les Contrats
Territoriaux d’Exploitations (CTE) déclinés à l’échelle de l’exploitation pour une durée de 5 ans.
Souvent utilisés à des fins économiques (modernisation des exploitations) au détriment de leur
fonction écologique, leur évaluation s’avère toutefois rapidement négative. En 2003, ils sont
remplacés par les Contrats Agriculture Durable (CAD) bien plus axés sur des objectifs agro-
environnementaux. Ces contrats ont également pour objectif de simplifier les procédures
administratives et de limiter les excès budgétaires. De plus, tout exploitant situé dans un
périmètre Natura 2000 peut obtenir 20% de marge financière supplémentaire au titre de
soutient aux objectifs de la Directive «Habitat ». En 2007, les Mesures Agri- environnementales
20
Territorialisées (MAEt) sont créées dans le cadre du Plan de Développement Rural Hexagonal.
Ces mesures territorialisées sont déclinées en priorité dans les sites Natura 2000 et les bassins
versants prioritaires définis au titre de la Directive Cadre sur l’Eau (DCE).
L’ensemble des politiques et outils développé à l’issue de ces longs cheminements
internationaux, européens et nationaux en faveur de la biodiversité, a un coût qu’il convient
d’intégrer par rapport aux bénéfices réels apportés à la biodiversité.
Ainsi en 2002, près de 30,2 millions d’hectares ont été couverts par les MAE dans l’UE-15, ce
qui est équivalent à environ 24% du total de la superficie agricole utilisée (Burton 2008). En
France, les mesures orientées « biodiversité remarquable » ont été mises en place dans les
zones Natura2000 avec un taux moyen de contractualisation communale (Nb de bénéficiaires /
Nb total d’exploitations) de l’ordre de 40%, soit le double de la moyenne nationale (CNASEA,
2008). De plus, le taux de couverture de la SAU par des MAE est estimé à 47% en zone
Natura2000 contre 37% en moyenne au niveau national, dont 30% des surfaces concernent
des mesures à effets potentiels forts sur la biodiversité, contre 15% en moyenne au niveau
national (CNASEA, 2008). Dans le même temps, les dépenses communautaires sur les MAE
ont augmenté de façon spectaculaire passant d’un budget d’environ 50 millions d’euros en 1993
(AEE 2005, Burton et al. 2008), à 291 millions d’euros en 2000, pour atteindre 354.5 millions
d’euros en 2010 (Commission des Comptes de l’Agriculture, 2011). Cependant nous pouvons
noter que les mesures agro-environnementales n’ont que peu évolué en terme de proportion au
budget global européen alloué à l’agriculture, avec respectivement 2.13% et 2.16% du budget
global en 2000 et 2010 pour les MAE (Commission des Comptes de l’Agriculture, 2011).
Néanmoins il est important de noter que la partie spécifique octroyée au financement des
contrats Territoriaux d’Exploitations, Contrat d’Agriculture Durable, Mesures Argo-
Environnementales territorialisés ne représente qu’une infime partie du budget de la PAC, c’est
à dire environ 0.7%, soit 101.1 millions d’euros pour 2010 (Commission des Comptes de
l’Agriculture, 2011). L’outil Natura 2000 ne reste pas en marge, avec une estimation à dire
d’experts d’un budget annuel pour le dispositif Natura 2000 à 6,1 milliards d’euros pour les 25
Etats membres (Miller & Kettunen, 2005).
Les budgets ainsi alloués et cette disproportion budgétaire entre les deux piliers de la Politique
Agricole Commune nous amènent à nous poser la question de leur efficacité à maintenir voire
augmenter la biodiversité des espaces ruraux.
21
5/ Quelle efficacité pour les programmes agro- envi ronnementaux :
Analyse bibliographique La question qui nous intéresse ici est de savoir si l’efficacité des outils MAE et Natura est
éprouvée, ou à prouver, et dans quels contextes ou conditions ?
Nous évoquerons le cas de l’agriculture biologique, très fortement étudiée, ainsi que des
MAE de manière plus générale.
5.1/ Mesures Agro Environnementales et agriculture Biologique :
Résultats des méta-analyses
Une première méta-analyse est réalisée par Kleijn & Sutherland en 2003, dont les
principaux résultats peuvent être résumés ainsi:
1/ le design de recherche est insuffisant pour évaluer de façon fiable l’efficacité des mesures
et que 31% des études ne contiennent pas d’analyses statistiques.
2/ lorsqu’une approche expérimentale est utilisée, le design est généralement peu fiable voir
biaisé en vue de donner un résultat favorable.
3/ les études sont peu diversifiées entre les pays, ainsi, 62 études furent utilisées dont 76 %
provenaient des Pays-Bas et de l’Angleterre, et seulement 27% des études publiées étaient
dans des revues scientifiques internationales.
Ces auteurs concluent que le manque d’études robustes ne permet pas de statuer globalement
sur l’efficacité des programmes agro-environnementaux en Europe. Ils proposent alors qu’une
analyse écologique soit menée au préalable de toute implémentation de MAE, et préconisent
que les parcelles en contrats et témoins soient disposées aléatoirement, en s’assurant de
conditions initiales identiques, avec suffisamment de réplicas. Cependant, cette dernière
prescription correspond à une attente qu’il est parfois difficile d’obtenir ou de mettre en œuvre,
étant donné l’absence de contrôle sur les terres agricoles ou le bon vouloir des exploitants à
souscrire in natura lors du pilotage et de l’animation des campagnes de contractualisation.
Herzog (2005) note que quelque soit le mode d’agencement des parcelles dans le paysage à la
base, il constitue indirectement un cas d’étude semi- expérimental in natura, voir une réelle
opportunité scientifique car les AES modifient de façons importantes les modes de gestion de
l’agriculture et des paysages.
Un point important est mis en avant avec cette méta-analyse, les effets observés lors de
l’analyse des mesures semblent dépendant du contexte des pratiques agricoles dans lequel
22
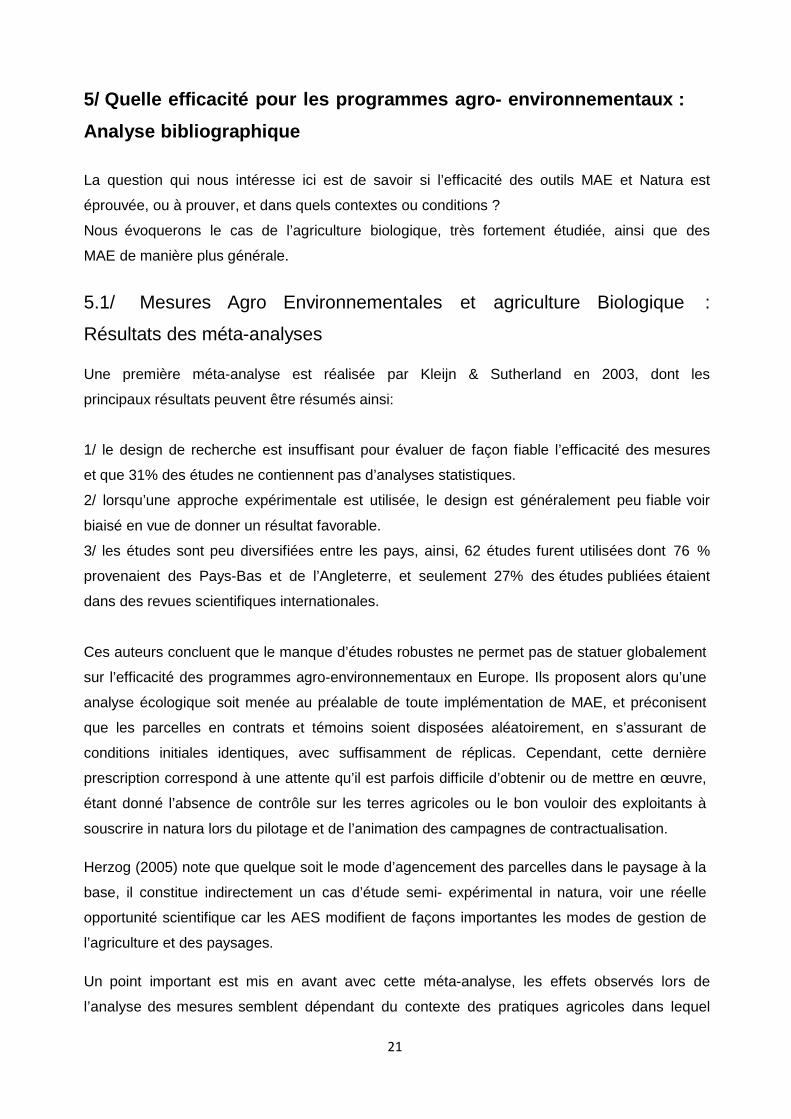
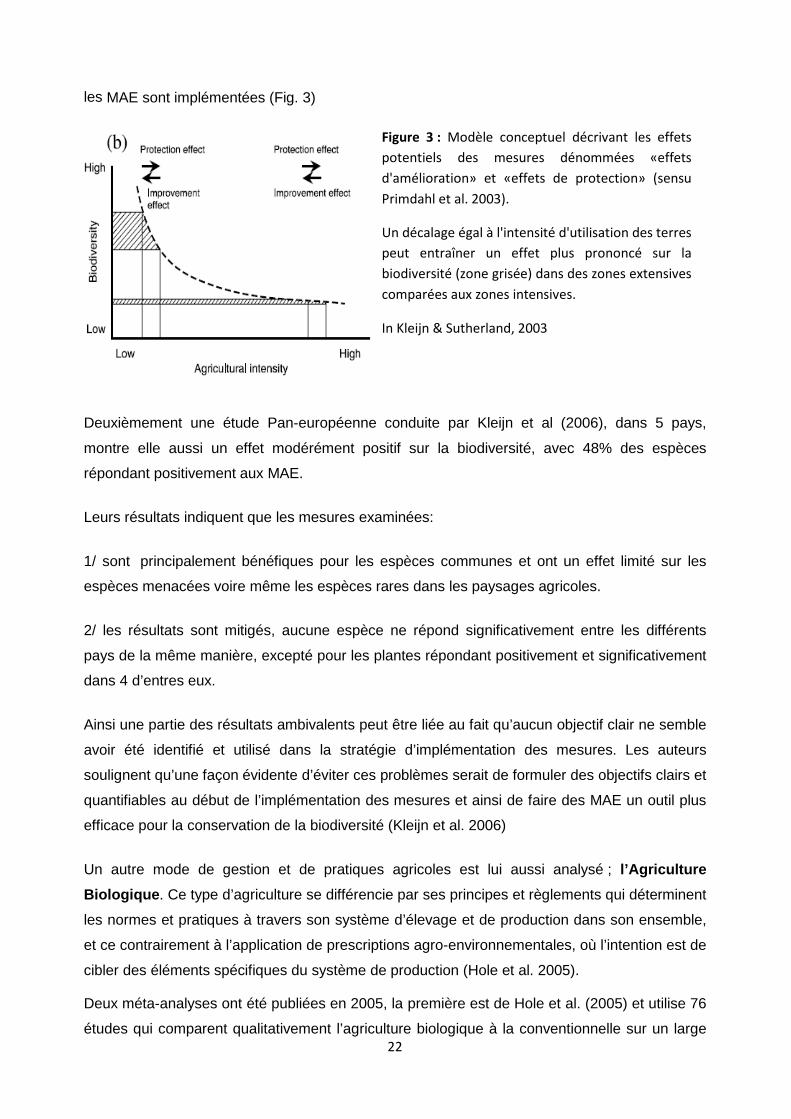
les MAE sont implémentées (Fig. 3)
Deuxièmement une étude Pan-européenne conduite par Kleijn et al (2006), dans 5 pays,
montre elle aussi un effet modérément positif sur la biodiversité, avec 48% des espèces
répondant positivement aux MAE.
Leurs résultats indiquent que les mesures examinées:
1/ sont principalement bénéfiques pour les espèces communes et ont un effet limité sur les
espèces menacées voire même les espèces rares dans les paysages agricoles.
2/ les résultats sont mitigés, aucune espèce ne répond significativement entre les différents
pays de la même manière, excepté pour les plantes répondant positivement et significativement
dans 4 d’entres eux.
Ainsi une partie des résultats ambivalents peut être liée au fait qu’aucun objectif clair ne semble
avoir été identifié et utilisé dans la stratégie d’implémentation des mesures. Les auteurs
soulignent qu’une façon évidente d’éviter ces problèmes serait de formuler des objectifs clairs et
quantifiables au début de l’implémentation des mesures et ainsi de faire des MAE un outil plus
efficace pour la conservation de la biodiversité (Kleijn et al. 2006)
Un autre mode de gestion et de pratiques agricoles est lui aussi analysé ; l’Agriculture
Biologique . Ce type d’agriculture se différencie par ses principes et règlements qui déterminent
les normes et pratiques à travers son système d’élevage et de production dans son ensemble,
et ce contrairement à l’application de prescriptions agro-environnementales, où l’intention est de
cibler des éléments spécifiques du système de production (Hole et al. 2005).
Deux méta-analyses ont été publiées en 2005, la première est de Hole et al. (2005) et utilise 76
études qui comparent qualitativement l’agriculture biologique à la conventionnelle sur un large
Figure 3 : Modèle conceptuel décrivant les effets
potentiels des mesures dénommées «effets
d'amélioration» et «effets de protection» (sensu
Primdahl et al. 2003).
Un décalage égal à l'intensité d'utilisation des terres
peut entraîner un effet plus prononcé sur la
biodiversité (zone grisée) dans des zones extensives
comparées aux zones intensives.
In Kleijn & Sutherland, 2003
23
panel de taxons, comme les oiseaux, les mammifères, les invertébrés et les plantes. Les
résultats sont :
1/ environ 66% ont un effet positif, 25% ont un effet mitigé ou sans effet observé, et 8 % ont un
effet négatif, ils démontrent ainsi que l’abondance des espèces et/ou la richesse, sont
globalement plus élevées dans les exploitations biologiques que conventionnelles.
2/ certaines différences constatées entre et au sein des études ne sont pas forcement
surprenantes étant donné la complexité des interactions entre un grand nombre de variables
environnementales et entre les groupes taxonomiques.
Toutefois, ces différences indiquent également que les avantages pour la biodiversité de
l’agriculture biologique peuvent varier selon des facteurs tels que la localisation, les conditions
climatiques, les types de cultures et d’espèces étudiés, et sont susceptibles d’être fortement
influencés par des pratiques de gestions spécifiques adoptées.
3/ Un constat identique aux MAE est fait, à savoir qu’un certain nombre de biais
méthodologiques et des préoccupations inhérentes au design de plusieurs de ces études, peut
avoir entraîné des biais involontaires, menant à des conclusions erronées (y compris une
tendance à sous-estimer les effets positifs de l’agriculture biologique sur la biodiversité).
Enfin les auteurs font remarquer qu’un grand nombre d’études est réalisé dans les systèmes
arables ou mixtes et déplorent ainsi un manque d’information concernant les impacts de
l’agriculture biologique dans les systèmes pastoraux, car le potentiel positif de l’agriculture
biologique pour la biodiversité dans ces systèmes est beaucoup moins clair (Hole et al. 2005).
Par ailleurs, Bengtsson et al. (2005) utilisent 63 études qui traitent de l’efficacité sur la richesse
et 117 études de l’efficacité sur l’abondance et ce sur différents groupes taxonomiques.
1/ Ainsi, 84% des études ont montré que la richesse des espèces est supérieure dans les
systèmes Biologiques et plus particulièrement pour les plantes, les oiseaux et insectes
prédateurs, et pour 82% de celles-ci portant sur l’abondance.
2/ Les systèmes Biologiques ont en moyenne 50% d’abondance en plus que dans le
conventionnel.
3/ Bien que le nombre d’études soit faible dans la plupart des groupes, les résultats suggèrent
que l’agriculture biologique peut augmenter la densité locale en insectes prédateurs et la faune
du sol, avec un bémol sur les densités de vers de terre.
Actuellement peu de preuves attestent que les autres insectes et les parasites sont plus
abondants en agriculture Biologique, ceci soutient la perception générale qui explicite que les
24
dégâts des insectes ravageurs sur les cultures sont généralement moins importants dans les
exploitations en agriculture Biologique.
4/ Les résultats sur la biodiversité peuvent aussi être modulés par les surfaces non cultivées,
telles que les bordures de champs, les îlots d’habitats, les haies, les pâtures naturelles, les
zones d’eaux, les fossés … etc., car ils constituent des refuges importants et des zones sources
pour un grand nombre d’organismes (Bengtsson et al. 2005).
5/ De plus, un grand nombre d’études ont un faible nombre de réplicas ou alors n’ont pas inclus
dans les variables explicatives d’autres effets que le système d’exploitation, comme la structure
du paysage, le type de sol ou encore l’historique des pratiques des exploitations.
Globalement les résultats montrent un effet échelle et paysage dépendant, avec par exemple
un effet moins clair dans les paysages hétérogènes sur la diversité en papillons, insectes
prédateurs et plantes. Cependant les effets positifs de l’agriculture biologique sur la richesse et
la diversité des espèces peuvent être attendus en paysage agricole intensive, mais pas
nécessairement à de faible échelle de mosaïque paysagère ayant une forte diversité de cultures
et d’habitats non cultivés.
Le paysage module ainsi l’efficacité des MAE, comme le montre Roschewitz et al. (2005) : la
diversité des adventices est plus élevée en agriculture biologique qu’en agriculture
conventionnelle, mais seulement dans des paysages simples car à l’inverse, c’est la complexité
des paysages qui améliore la diversité des espèces dans les parcelles conventionnelles à un
niveau de diversité similaire.
Cette brève analyse bibliographique indique clairement qu’une approche globale et systémique
est indispensable, couvrant plusieurs taxons si possible, incluant des échelles spatiales variées,
disposant de réplicas statistiques et d’un design spatial appropriés, et qui plus est ayant un suivi
temporel avant et après implémentation et s’appuyant sur des analyses statistiques adaptées.
Par ailleurs, l’intégration du paysage écologique est également indispensable. Enfin il convient
de différencier la biodiversité des espèces communes, qui peut être améliorée avec des
modifications relativement simples dans les pratiques agricoles, et la diversité où l’abondance
des espèces menacées nécessite une conservation plus élaborée via des mesures ciblées
(Kleijn et al. 2006).
Cependant pour évaluer l’efficacité des outils de conservation comme le réseau Natura 2000 ou
les mesures agro-environnementales, il est important de différencier les outils de type
génériques ou « horizontaux » , applicables sur de large surface et peu onéreux (réduction
d’intrant, non labours.. etc.), de ceux de type ciblés ou « verticaux », applicables localement et
25
plus couteux car plus contraignants, (retard de fauche sur culture pérenne ayant aucun apport
autorisé), et ceux enfin de type agriculture Biologique (applicable à l’échelle de l’exploitation
sans contrainte de surface). Kleijn et Sutherland (2003) ont prédit qu’une stratégie ciblée était
plus effective qu’une mesure à large spectre. La mesure ciblée « adaptative schemes » peut
être considérée comme un processus itératif de prise de décision qui vise à réduire l’incertitude
(et donc à maximiser le succès du système) via le suivi (Whittingham, 2011). Whittingham
(2010) montre que des données récentes suggèrent que la gestion ciblée peut faire une
différence positive pour la biodiversité à travers une large gamme d’études de cas à travers
l’Europe et les Etats-Unis. Ainsi bon nombre d’exemples corrobore cet effet positif, comme le
cas du bruant zizi Emberiza cirlus (Peach et al., 2001), de l’oedicnème criard Burhinus
oedicnemus (Aebischer et al. 2000b), du râle des genêts Crex crex (Aebischer et al.,2000a), du
tétras lyre Tetrao tetrix (Baines, Warren & Calladine 2002), du Chevalier gambette Tringa
totanus et du Vanneaux huppés Vanellus vanellus (Verhulst et al. 2007), de l’outarde
canepetière Tetrax tetrax (Bretagnolle et al. 2011) ou encore du bruant proyer Miliaria calendra
(Perkins et al. 2011). Cependant il semble qu’au vu du coût financier (primes à l’hectare), ces
mesures ciblées ne soient applicables qu’aux espèces menacées (Kleijn et al. 2006) et non
envisageables sur de larges échelles spatiales.
Ce travail de synthèse montre qu’aucune étude n’a traité spécifiquement des inter-relations
entre les MAE proposées ; or il est possible que certaines associations de mesures aient un
effet pouvant être additif, multiplicatif voire inverse. De même aucune étude à notre
connaissance n’a testé conjointement dans une même analyse des variables de structure et de
composition des paysages, associé à des métriques historiques, dans le but de tester l’efficacité
des MAE en fonction du nombre de contrats, leurs surfaces et leurs âges. De surcroît, les MAE
sont pour une large majorité appliquées au sein des sites Natura2000, eux mêmes disposés sur
des habitats à forte valeur patrimoniale, générant des biais possibles qui doivent être évalués
afin d’en tenir compte le moment venu, c’est-à-dire lors de l’évaluation de l’efficacité des
mesures agro-environnementales.
Il est cependant difficile d’obtenir des données de monitoring longitudinales et sur de larges
surfaces, qui plus est ayant mis en place un dispositif de conservation à large échelle, définit
selon des objectifs clairs. C’est l’objet de ce travail de thèse d’utiliser un tel jeu de données. En
effet, nous possédons des données sur le long terme (16 ans, 1996 - 2011 ) et à large échelle
(420 km 2) sur de nombreux taxons ; par ailleurs, les MAE mises en place sont variées, mêlent
des mesures centrées « espèce » et des mesures plus génériques, et enfin l’effort de
contractualisation a été très intense (près de 10 000 hectares ), échelonné sur 7 ans, entre
2005 et 2011.
26
Démarche de la thèse 1 / Cadre général de la thèse Cette thèse s’inscrit dans un projet de recherche qui vise à comprendre les conséquences des
changements d’organisation spatiale des systèmes de cultures au niveau parcellaire sur la
biodiversité, et des agroécosystèmes aux niveaux local et territorial. Il s’agit de valider, tester et
prévoir les conséquences des scénarii possibles d’évolution paysagère sur la dynamique et le
maintien de la biodiversité des agroécosystèmes.
2 / Problématique
L’objectif général de cette thèse vise donc à évaluer les outils de conservation mis à
disposition dans les agro écosystèmes, comme les zones de protection spéciale (ZPS) et les
mesures agro-environnementales (MAE), toutes deux destinées à maintenir et/ou améliorer la
qualité des habitats et ainsi la biodiversité.
Nous tenterons de répondre à deux questions centrales:
Les outils de conservation appliqués dans les agro écosystèmes céréaliers ont-ils un effet positif
sur la biodiversité ?, quels outils en particulier ?, et par quels processus écologiques ?
Ces effets dépendent-ils de l’échelle spatiale et/ou temporelle ?
3 / Organisation du manuscrit Les outils de conservation étudiés sont mis en place à deux échelles distinctes. Le premier à
large échelle, celle du « paysage » ; et le deuxième à plus fine échelle, celle des « parcelle et
assemblage de parcelles », avec respectivement le réseau Natura2000 et les Mesures Agro-
Environnementales. Cette thèse est essentiellement axée sur les oiseaux et ce pour deux
raisons, i) les oiseaux sont depuis longtemps utilisés comme des taxons indicateurs, dont la
persistance indiquerait la qualité des habitats, l’intégrité des communautés biologiques et le
fonctionnement durable des paysages auxquels ils appartiennent, ii) les habitats agricoles
accueillent en Europe 187 espèces d’oiseaux prioritaires (à enjeu de conservation) dont 88 en
France. Ainsi l’utilisation de ce groupe nous a paru la plus appropriée afin de comparer les
différents résultats dans le temps et l’espace et d’en tirer des méthodes transposables à
d’autres sites. Cependant, le panel de taxons aurait pu être plus important, ayant aussi (au
27
cours de ces trois années de travail de terrain et de recherche), élaboré des plans
d’échantillonnages sur les plantes, les insectes du sol et les criquets, qui feront l’objet
d’analyses ultérieures. Afin d’étayer la discussion générale, je tenterai de généraliser cependant
les résultats obtenus chez les oiseaux à ces autres taxons.
Cette thèse est organisée en trois étapes complémentaires.
Dans le chapitre 2 , nous avons évalué si la mise en place de l’outil de conservation
Natura2000 (via la délimitation d’une Zone de Protection Spéciale), basée sur la présence
d’espèces rares ou vulnérables listées dans l’annexe I de la Directive Oiseaux et opérant sur de
larges surfaces, pouvait affecter dans des agro-écosystèmes céréaliers intensifs positivement
les tendances de deux espèces de passereaux spécialistes et en déclin, l’alouette des champs
Alauda arvensis et le bruant proyer Miliaria calendra . Nous utilisons pour cela des données
longitudinales (basées sur 16 ans de suivi) issues d’Indice Ponctuel d’Abondance (IPA) répartit
au centre et sur la périphérie de la ZPS. Cette approche nous permet ainsi de répondre à la
question liée à la qualité intrinsèque de ces sites (Kleijn & Sutherland, 2003), et de déterminer si
un site ayant un statut de conservation peut induire un biais lors d’analyse comparative
ultérieure du à une qualité d’habitat initiale meilleure.
Puis nous avons cherché à évaluer l’efficacité des Mesures Agro-Environnementales, outils
opérants à plus fine échelle et définis selon des approches « horizontales » (i.e applicable sur
de large surface liée à un coût de mise en œuvre faible, environ < 350euros/ha) et « verticales »
(i.e applicable sur de plus faible surface, voire ciblée et agrégée, dont le coût de mise en œuvre
important, environ > 400euros/ha) sur la zone Atelier Plaine & Val de Sèvre. Pour cela nous
déterminons si, et dans quelle mesure les MAE ciblant dans une large partie une espèce
d'oiseau rare (l’Outarde canepetière Tetrax tetrax) est susceptible d’affecter l’abondance
d’espèces d’oiseaux spécialistes, le Bruant proyer dans le chapitre 3 et l’Alouette des champs
dans le chapitre 4 , deux espèces présentant des répartitions opposées, respectivement
agrégées et homogènes, et n’ayant pas les mêmes exigences en terme de composition et de
diversité d’habitat.
28
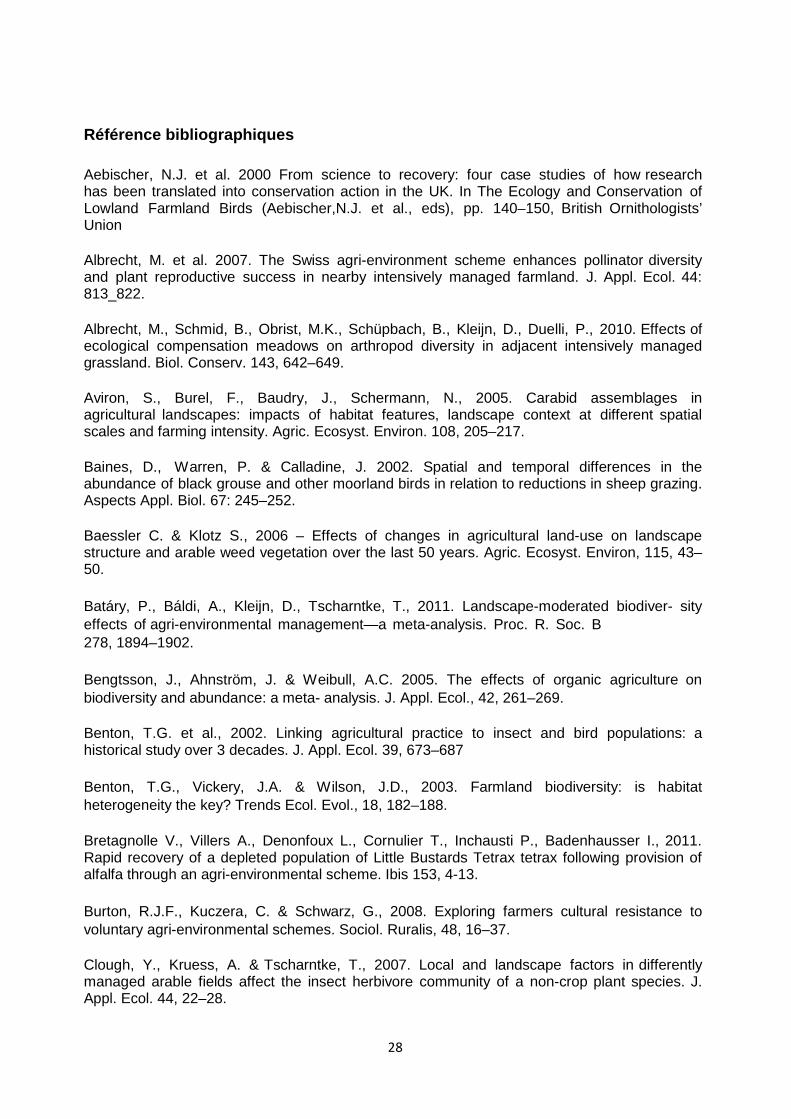
Référence bibliographiques
Aebischer, N.J. et al. 2000 From science to recovery: four case studies of how research has been translated into conservation action in the UK. In The Ecology and Conservation of Lowland Farmland Birds (Aebischer,N.J. et al., eds), pp. 140–150, British Ornithologists’ Union Albrecht, M. et al. 2007. The Swiss agri-environment scheme enhances pollinator diversity and plant reproductive success in nearby intensively managed farmland. J. Appl. Ecol. 44: 813_822. Albrecht, M., Schmid, B., Obrist, M.K., Schüpbach, B., Kleijn, D., Duelli, P., 2010. Effects of ecological compensation meadows on arthropod diversity in adjacent intensively managed grassland. Biol. Conserv. 143, 642–649. Aviron, S., Burel, F., Baudry, J., Schermann, N., 2005. Carabid assemblages in agricultural landscapes: impacts of habitat features, landscape context at different spatial scales and farming intensity. Agric. Ecosyst. Environ. 108, 205–217. Baines, D., Warren, P. & Calladine, J. 2002. Spatial and temporal differences in the abundance of black grouse and other moorland birds in relation to reductions in sheep grazing. Aspects Appl. Biol. 67: 245–252. Baessler C. & Klotz S., 2006 – Effects of changes in agricultural land-use on landscape structure and arable weed vegetation over the last 50 years. Agric. Ecosyst. Environ, 115, 43–50. Batáry, P., Báldi, A., Kleijn, D., Tscharntke, T., 2011. Landscape-moderated biodiver- sity effects of agri-environmental management—a meta-analysis. Proc. R. Soc. B 278, 1894–1902. Bengtsson, J., Ahnström, J. & Weibull, A.C. 2005. The effects of organic agriculture on biodiversity and abundance: a meta- analysis. J. Appl. Ecol., 42, 261–269. Benton, T.G. et al., 2002. Linking agricultural practice to insect and bird populations: a historical study over 3 decades. J. Appl. Ecol. 39, 673–687 Benton, T.G., Vickery, J.A. & Wilson, J.D., 2003. Farmland biodiversity: is habitat heterogeneity the key? Trends Ecol. Evol., 18, 182–188. Bretagnolle V., Villers A., Denonfoux L., Cornulier T., Inchausti P., Badenhausser I., 2011. Rapid recovery of a depleted population of Little Bustards Tetrax tetrax following provision of alfalfa through an agri-environmental scheme. Ibis 153, 4-13. Burton, R.J.F., Kuczera, C. & Schwarz, G., 2008. Exploring farmers cultural resistance to voluntary agri-environmental schemes. Sociol. Ruralis, 48, 16–37. Clough, Y., Kruess, A. & Tscharntke, T., 2007. Local and landscape factors in differently managed arable fields affect the insect herbivore community of a non-crop plant species. J. Appl. Ecol. 44, 22–28.
29
Concepcion, E.D., Diaz, M. & Baquero, R.A., 2008. Effects of landscape complexity on the ecological effectiveness of agrienvironment schemes. Landsc. Ecol., 23, 135–148. Colombel Y., 2000, L'agriculture française. Paris, Armand Colin, 96 p. Dallimer M., Acs S., Hanley N., Wilson P., Gaston K. J., Armsworth P. R.2009 What explains property-level variation in avian diversity? Taking an inter-disciplinary approach. J. Appl. Ecol. 46, 647–656. Dallimer, M., Gaston, K.J., Skinner, A.M.J., Hanley, N., Acs, S. & Armsworth, P.R. (2010) Field-level bird abundances are enhanced by landscape scale agri-environment scheme uptake. Biology Letters, 6, 643–646. Dearing, J., Battarbee, R.W., Dikau, R., Larocque, I. and Oldfield, F. 2006. Human environment interactions: towards synthesis and simulation. Reg. Environ. Change. 6, 115–123. DeFries RS, Foley JA, and Asner GP. 2004. Land-use choices: balancing human needs and ecosystem function. Front Ecol Environ. 2: 249–57. Desriers , M. 2007. L'agriculture française depuis cinquante ans : des petites exploitations familiales aux droits à paiement unique. Dans “L’agriculture, nouveaux defis” ed. 2007 Donald PF, Sanderson FJ, Burfield IJ, van Bommel FPJ, 2006. Further evidence of continent-wide impacts of agricultural intensification on European farmland birds, 1990–2000. Agric. Ecosyst. Environ, 116:189–196. Donald, P.F. & Evans, A.D., 2006. Habitat connectivity and matrix restoration: the wider implications of agri-environment schemes. J. Appl. Ecol, 43, 209–218. Duelli, P. & Obrist, M.K., 2003. Regional biodiversity in an agricultural landscape: the contribution of seminatural habitat islands. Basic and Applied Ecology, 4, 129–138. Ellis, E.C. & Ramankutty, N., 2008. Putting people in the map: anthropogenic biomes of the world. Front. Ecol. Evol., 6, 439–447. Ellis, E. C., 2011 Anthropogenic transformation of the terrestrial biosphere. Phil. Trans. R.Soc. A 369, 1010–1035. Fahrig L., 2002. Effect of habitat fragmentation on the extinction threshold: a synthesis. Ecol. Appl. 12:346–53 Fahrig, L., 2003. Effects of habitat fragmentation on biodiversity. Annu. Rev. Ecol. Syst., 34, 487–515.
Fahrig, L. et al. 2010. Functional landscape heterogeneity and animal biodiversity in agricultural landscapes. Ecol. Lett. 14: 101-112. Flieβbach A., Oberholzer H.R., Gunst L. & Mäder P., 2007. Soil organic matter and biological soil quality indicators after 21 years of organic and conventional farming. Agric. Ecosystems Environ., 118, 273-274.
30
Foley J.A, et al., 2005. Global consequences of land use. Science. 309:570–574.
Folke C, Holling CS, and Perrings C. 1996. Biological diversity, ecosystems and the human scale. Ecol Appl. 6: 1018–24. Fried, G., Petit, S., Dessaint, F., Reboud, X., 2009. Arable weed decline in Northern France: crop edges as refugia for weed conservation? Biol. Conserv. 142, 238–243. Fuentes-Montemayor, E., Goulson, D., Park, K.J., 2011. The effectiveness of agri- environment schemes for the conservation of farmland moths: assessing the importance of a landscape-scale management approach. J. Appl. Ecol. 48, 532–542. Gabriel, D., Sait, S.M., Hodgson, J.A., Schmutz, U., Kunin, W.E. & Benton, T.G., 2010. Scale matters: the impact of organic farming on biodiversity at different spatial scales. Ecol. Lett., 13, 858–869. Gardner, B., 1996. European Agriculture: Policies, Production and Trade, Routledge Gathmann, A. & Tscharntke, T. 2002. Foraging ranges of solitary bees. J. Anim. Ecol., 71, 757-764. Geiger, F., Bengtsson, J., Berendse, F., Weisser, W.W., Emmerson, M., Morales, M.B., Ceryngier, P., Liira, J., Tscharntke, T., Winqvist, C., Eggers, S., Bommarco, R., Pärt, T., Bretagnolle, V., Plantegenest, M., Clement, L.W., Dennis, C., Palmer, C., Oñate, J.J., Guerrero, I., Hawro, V., Aavik, T., Thies, C., Flohre, A., Hänke, S., Fischer, C., Goedhart, P.W., Inchausti, P., 2010. Persistent negative effects of pesticides on biodiversity and biological control potential on European farmland. Basic and Applied Ecology. 11, 97–105.
Hansen DM, & Galetti M., 2009. The forgotten megafauna. Science 324: 42–43.
Herzog, F. 2005. Agri-environment schemes as landscape experiments. Agric. Ecosystems Environ., 108, 175–177. Hobbs, R. J., S. Arico, J. Aronson, J. S. Baron, P. Bridgewater, V. A. Cramer, et al. 2006. Novel ecosystems: theoretical and management aspects of the new ecological world order. Global Ecology and Bio-geography. 15:1–7. Hole, D.G., Perkins, A.J., Wilson, J.D., Alexander, I.H., Grice, P.V. & Evans, A.D., 2005. Does organic farming benefit biodiversity? Biological Conservation, 122, 113–130. Jonason et al,. 2011. Assessing the effect of the time since transition to organic farming on plants and butterflies. J. Appl. Ecol. 48: 543–550. Kareiva P and Marvier M. 2007. Conservation for the people. Sci-Am 229977: 50–57. Kohler, F., Verhulst, J., van Klink, R. & Kleijn, D., 2008. At what spatial scale do high- quality habitats enhance the diversity of forbs and pollinators in intensively farmed landscapes? J. Appl. Ecol. 45, 753–762. Kiss, A-C, & Doumbe-Bille, S., (1992). Conférence des Nations Unies sur l'environnement et le développement (Rio de Janeiro-juin 1992). In: Annuaire français de droit international, volume 38. pp. 823-843.
31
Kiviniemi, K., 2008. Effects of fragment size and isolation on the occurrence of fourshort-lived plants in semi-natural grasslands. Acta Oecologica. 33, 56–65. Kleijn, D. & Sutherland, W.J., 2003. How effective are European agri-environment schemes in conserving and promoting bio-diversity? J. Appl. Ecol., 40, 947–969. Kleijn, D., Baquero, R.A., Clough, Y., Diaz, M., De Esteban,J., Fernandez, F., Gabriel, D., Herzog, F., Holzschuh, A.,Johl, R., Knop, E., Kruess, A., Marshall, E.J.P., Steffan-Dewenter, I., Tscharntke, T., Verhulst, J., West, T.M. & Yela, J.L., 2006. Mixed biodiversity benefits of agri-environment schemes in five European countries. Ecology Letters, 9, 243–254. Kleijn, D., Kohler, F., Baldi, A., Batary, P., Concepcio´n, E.D., Clough, Y., Dıaz, M., Gabriel, D., Holzschuh, A., Knop, E., Kova´cs, A., Marshall, E.J.P., Tscharntke, T., Verhulst, J., 2009. On the relationship between land-use intensity and farmland biodiversity in Europe. Proc. R. Soc. B. 276, 903–909. Kohler, F., Verhulst, J., van Klink, R. & Kleijn, D., 2008. At what spatial scale do high- quality habitats enhance the diversity of forbs and pollinators in intensively farmed landscapes? J. Appl. Ecol., 45, 753–762. Leng, X., Musters, C.J.M., de Snoo, G.R., 2009. Restoration of plant diversity on ditch banks: seed and site limitation in response to agri-environment schemes. Biological Conservation, 142, 1340–1349. Leng, X; Musters, CJM; de Snoo, GR., 2010. Synergy between nature reserves and agri-environmental schemes in enhancing ditch bank target species plant diversity. Biological Conservation, 143, 1470-1476. Millennium Ecosystem Assessment, 2005. Ecosystems and Human Well-being: Synthesis, Island Press, Washington, DC, USA, 155 p. Merckx, T., Feber, R.E., Dulieu, R.L., Townsend, M.C., Parsons, M.S., Bourn, N.A.D., Riordan, P., Macdonald, D.W., 2009. Effect of field margins on moths depends on species mobility: field-based evidence for landscape-scale conservation. Agric. Ecosyst. Environ. 129, 302–309 Miller, C., and M. Kettunen. 2005. Financing Natura 2000: guidance handbook. European Commission - General Directorate for the Environment, Bruxelles. Norris, K. 2008. Agriculture and biodiversity conservation: Opportunity knocks. Conserv. Lett. 1: 2–11. Pauly, D., and Christensen, V. 1995. Primary production required to sustain global fisheries. Nature, 374: 255–257. Peach, W.J., Lovett, L.J., Wotton, S.R., Jeffs, C., 2001. Countryside stewardship delivers cirl buntings (Emberiza cirlus) in Devon, UK. Biological Conservation. 101, 361–373. Perkins, A.J., Maggs, H.E., Watson, A. & Wilson, J.D., 2011. Adaptive management and targeting of agri-environment schemes does benefit biodiversity: a case study of the corn bunting Emberiza calandra. J. Appl. Ecol., 48, 514–522. Postel SL, Daily GC, Ehrlich PR., 1996. Human appropriation of renewable freshwater. Science 271: 785-788.
32
Primdahl, J., Peco, B., Schramek, J., Andersen, E. & Oñate, J.J., 2003. Environmental effects of agri-environmental schemes in Western Europe. Journal of Environmental Management, 67, 129–138. Robinson, R.A. & Sutherland, W.J., 2002. Changes in arable farming and biodiversity in Great Britain. J. Appl. Ecol., 39, 157–176. Rojstaczer, S., Sterling, S.M. and Moore. N.J ., 2001. Human appropriation of photosynthesis products, Science, 294, 2949– 2952. Roschewitz, I., Gabriel, D., Tscharntke, T., Thies, C., 2005. The effects of landscape complexity on arable weed species diversity in organic and conventional farming. J. Appl. Ecol. 42, 873–882. Roth, T., Amrhein, V., Peter, P., Weber, D., 2008. A Swiss agri-environment scheme effectively enhances species richness for some taxa over time. Agric. Ecosyst. Environ. 125, 167–172. Sanderson, E., Jaiteh, M., Levy, M., Redford, K., Wannebo, A.,Woolmer, G., 2002. The human footprint and the last of the wild. BioScience 52, 891–904. Scharlemann, J.P.W., Balmford, A., Green, R.E., 2005. The level of threat to restricted range bird species can be predicted from mapped data on land use and human population. Biological Conservation. 123, 317–326. Schmidt, M. H. and Tscharntke, T. 2005. Landscape context of sheetweb spider (Araneae: Linyphiidae) abundance in cereal fields. J. Biogeogr. 32: 46-473. Siriwardena, G. M. 2010. The importance of spatial and temporal scale for agri- environment scheme delivery. Ibis. 152: 515-529. Steffen W, & Tyson P, eds. 2001. Global Change and the Earth System: A Planet under Pressure. Stockholm: International Geosphere-Biosphere Program. Sutherland, W.J., Clout, M., Cote, I.M., Daszak, P., Depledge, M.H., Fellman, L., Fleishman, E., Garthwaite, R., Gibbons, D.W., De Lurio, J., Impey, A.J., Lickorish, F., Lindenmayer, D., Madgwick, J., Margerison, C., Maynard, T., Peck, L.S., Pretty, J., Prior, S., Redford, K.H., Scharlemann, J.P.W., Spalding, M., and Watkinson, A.R. (2010) A horizon scan of global conservation issues for 2010. Trends in Ecology and Evolution, 25, 1–7. Tscharntke, T., Rand, T. & Bianchi, F., 2005. The landscape context of trophic interactions: insect spillover across the crop–noncrop interface. Ann. Zool. Fenn. 42: 421_432. Tscharntke, T., Klein, A.M., Kruess, A., Steffan-Dewenter, I. & Thies, C., 2005. Landscape perspectives on agricultural intensificationand biodiversity — ecosystem service management. Ecology Letters, 8, 857–874. Verhulst J, Kleijn D, & Berendse F,. 2007. Direct and indirect effects of the most widely implemented Dutch agri-environment schemes on breeding waders. J. Appl. Ecol. 44, 70–80. Vickery, J.A. et al. (2001) The management of lowland neutral grasslands in Britain: effects of agricultural practices on birds and their food resources. J. Appl. Ecol. 38, 647–664
33
Vitousek PM & Sanford RL,. 1986. Nutrient cycling in moist tropical forest. Ann. Rev. Ecol. Syst. 17: 137-167 Vitousek PM, Aber JD, Howarth RW, Likens GE, Matson PA, Schindler DW, Schlesinger WH & Tilman DG,. 1997. Human alternation of the global nitrogen cycle: sources and consequences. Ecological Applications. 7, 737–750 Vorisek P, Jiguet F, van Strien A, S korpilova J, Klvanova A, Gregory RD,. 2010. Trends in abundance and biomass of widespread European farmlands birds: how much have we lost? In: BOU proceedings - Lowland Farmland Birds III. Weibull A.-C., Bengtsson J. and Nohlgren E,. 2000. Diversity of butterflies in the agricultural landscape: the role of farming system and landscape heterogeneity. Ecography. 23. 743–750. Walker, B., C. S. Holling, S. R. Carpenter, and A. Kinzig. 2004. Resilience, adaptability and transformability in social–ecological systems. Ecology and Society 9(2): 5. Westphal, C., Steffan-Dewenter, I. & Tscharntke, T. (2003) Mass flowering crops enhance pollinator densities at a landscape scale. Ecology Letters, 6, 961–965. Winqvist, C., Bengtsson, J., Aavik, T., Frank Berendse, Clement, L., W., Eggers, S., Fischer, C., Flohre, A., Geiger, F., Jaan Liira, Pärt, T., Thies, C., Tscharntke, T., Weisser, W. W., Bommarco, R. (2011).Mixed effects of organic farming and landscape complexity on farmland biodiversity and biological control potential across Europe. J. Appl. Ecol. 48 (3): 570–579. Whittingham, M.J. (2007) Will agri-environment schemes deliver substantial biodiversity gain, and if not why not? J. Appl. Ecol, 44, 1–5. Whittingham,M.J., 2011. The future of agri-environment schemes: biodiversity gains and ecosystem service delivery? J. Appl. Ecol, 48, 509-513. Site internet: World Conservation Union (UICN) base de données Liste Rouge http://www.iucnredlist.org/search/search-basic Agreste, 2010. Statistique agricole annuelle. Ministère de l’agriculture, de l’alimentation, de la pêche et des affaires rurales, Republique Francaise, http://www.agreste.agriculture.gouv.fr. CEC 1985 http://europa.eu.int/ CNASEA, 2008 http://agriculture.gouv.fr/IMG/pdf/3-Eval MAE_AND_Synthese.pdf (Commission des Comptes de l'Agriculture, 2011).
34
http://www.agreste.agriculture.gouv.fr/ (OCDE, 2010). www.ocde.org FAOSTAT, 2010 http://faostat.fao.org/ IAASTD, 2008 http://www.agassessment.org/
35
CHAPITRE II
Local improvement of skylark Alauda arvensis and corn bunting Miliaria calandra trends in an
intensive arable land: a case study of the conservation tool Natura 2000
Amélioration locale dans les tendances de l’Alouette des champs Alauda arvensis et du Bruant proyer Miliaria calandra au sein d’un paysage agricole intensif : étude de l’outil de
conservation Natura 2000
36
Title : Local improvement of skylark Alauda arvensis and corn bunting Miliaria calandra trends in an intensive arable land: a case study of the conservation tool Natura 2000
Running Head : Natura 2000 effect on farmland bird trends
Manuscript type: Article
Authors : Salomon Brodier1,2°, Steve Augiron2*, Thomas Cornulier2,3§, & Vincent Bretagnolle2‡
Affiliations : 1 Centre Ornithologique Lorrain, 5 rue de Nancy, 54690 Lay-Saint-Christophe, France 2 Centre d’Etudes Biologiques de Chize, CNRS, 79360 Beauvoir-sur-Niort, France 3 Institute for Biological and Environmental Sciences, University of Aberdeen, Zoology Building, Tillydrone Avenue, AB24 2TZ, Aberdeen, UK
e-mail addresses: °[email protected]; *[email protected]; §[email protected]; ‡[email protected],
Electronic appendices : Appendix1: Supplementary tables and figures
Corresponding author :
Vincent Bretagnolle
Centre d’Etudes Biologiques de Chize
CNRS
Villiers-en-bois
79360 Beauvoir-sur-Niort, France
Phone: + 33 549 097817
Fax: + 33 549 096526
E-mail: [email protected]
37
ABSTRACT
For the past 20 years, Agri-Environment Schemes (AES) and the Natura 2000 network have
been set up in Europe to halt the ongoing decline of farmland birds resulting from agricultural
intensification. Despite the wide implementation of these conservation tools bird trends are still
declining at national and European scale, thus questioning their effectiveness. We examined the
impact of the designation of a Special Protection Area (SPA) in 2004 on the trends of two
common but declining farmland birds, the Skylark and the Corn bunting, in an intensively
managed cereal agro-ecosystem of western France. From 1996 to 2011, trends in skylark
presence or abundance slightly decreased whereas trends in corn bunting abundance first
decreased and then showed a recovery. Our results indicate that the trends in skylark
abundance stabilized within the SPA, and in corn bunting, abundance significantly increased
following the implementation of AES in 2004 within the SPA. Bird trends outside the SPA were
broadly similar to those observed at the national and European scales. Our results suggest that
the implementation of a SPA in an arable landscape had a positive impact on farmland
passerines and their temporal trends, probably through the provision of suitable habitat following
the implementation of AES. Our results also suggest that the extensive implementation of SPAs
may have had a positive impact on bird population trends in farmlands at a regional level, where
c.200,000 ha (20% of arable land) have been designated since 2004. However, at a national
level, Natura 2000 currently covers a mere 3.7% of French arable land, and it is therefore no
surprise that these farmland specialists are still declining at this scale.
Keywords
Natura 2000, Special Protection Area, agricultural intensification, Agri-Environment Schemes,
farmland birds, Skylark, Corn bunting.
38
INTRODUCTION
In just four centuries, more than 80 % of grasslands, savannas and scrublands have
been converted and managed for human activities, while in the same time land used for
agriculture and urban settlements increased from 5% to 39% of total ice-free land area (Ellis et
al. 2010). Agricultural intensification within the last 50 years is now recognised as the general
driver of the on-going decline of about half of the farmland bird species across Europe (Krebs
et al. 1999, Donald et al. 2001a; Donald et al. 2006; Wilson et al. 2010). The exact causes of
this major decline are multiple and act both at field and landscape scales (see Newton 2004 for
a review). In particular, increased use of pesticides (Bright et al. 2008; Geiger et al. 2010a) and
loss of habitat heterogeneity (Benton et al. 2003) are thought to have reduced the availability of
both nesting and wintering habitats as well as food resources.
To counteract the negative effects of modern agriculture and more globally the loss of
biodiversity, two major conservation tools have been established in Europe over the last 20
years, including a range of more or less specific Agri-Environment Schemes (AES; Kleijn &
Sutherland 2003; Vickery et al. 2004) and the generic Natura 2000 ecological network
(Ostermann 1998). While AES directly encourages farmers to adopt environmentally friendly
practices through financial incentives, the Natura 2000 network consists in creating areas that
benefit from a set of tools (including AES) to enable local actors to preserve the sites. Natura
2000 sites now cover 80 million ha of terrestrial habitats (i.e. 19% of the EU territory: Boitier
2011), and became eventually the largest network of protected areas in the world (Sundseth
and Creed 2008). It notably aims at reversing bird population declines through the designation
of Special Protection Areas (SPAs) under the provisions of the Birds Directive (Council Directive
79/409/EEC; European Commission 1979). On their side, AES have in many cases proved to
be efficient at least locally (e.g. Kleijn et al. 2004, Perkins et al. 2011, Bretagnolle et al. 2011).
However, declines are still observed in farmland birds across Europe at the same rate (e.g.,
Voříšek et al. 2010, EBCC 2011) even in countries in which some of the most significant
conservation efforts were made over the last ten years (e.g., UK: Davey et al. 2010, DEFRA
2011). As a consequence, both the effects of AES or Natura 2000, and the understanding of the
causal links between agricultural changes and farmland bird declines have been recently
challenged (Klein & Sutherland 2003; Wretenberg et al. 2010; Kleijn et al. 2009; 2011). For
instance, Donald et al. (2001a) found that farmland birds declined more steadily in western than
eastern Europe, but there was no clear relationship between the slope of decline of farmland
birds and the level of state subsidies to agriculture (Donald et al. 2006). Similarly, Danish
populations of farmland birds remained fairly stable despite agricultural intensification during the
1980s (Fox 2004), while Swedish farmland birds decreased as much as in England despite a
39
lower degree of agricultural intensification (Wretenberg et al. 2006). These paradoxes may
however only be apparent; in the latter case for instance, northern breeding birds may share the
same intensified wintering areas. Unfortunately, most of the available studies on the subject
either consist in large-scale monitoring on the one hand, or in detailed mechanistic and
ecological studies at the level of small sites on the other hand. Long term studies at the
intermediate regional scales at which Natura 2000 is actually implemented are however still
lacking.
The skylark Alauda arvensis and the corn bunting Miliaria calandra are two common and
widespread farmland birds, typically associated with lowland arable agriculture, that declined
strongly in Europe over the last 30 years (46% for skylark and 78% for corn bunting: PECBMS,
2010), as well as in France (22% and 13% respectively between 1989 and 2009: CRBPO
2010). Several ecological studies, mostly conducted in the UK, support the evidence that recent
changes in farming practices led to populations decline in skylark (Wilson et al. 1997;
Chamberlain & Crick 1999; Chamberlain et al. 1999) and corn bunting (Donald 1997; Stoate et
al. 2000; Brickle et al. 2000; Wilson et al. 2007a) through a combination of factors affecting both
survival and productivity. In the case of skylarks, poor productivity results from the widespread
use of autumn-sown cereals, with their unsuitable dense vegetation structure and fast growing
limiting both the number of nesting attempts in a season (Chamberlain et al. 2000; Donald &
Vickery 2000; Donald et al. 2001b, 2002) and access to food (Morris et al. 2004). In addition,
decline in winter food availability is another important limiting factor (Donald et al. 2001c;
Gillings & Fuller 2001). Similarly for corn buntings, the decreasing availability of winter stubbles
(Donald & Forrest 1995; Mason & Macdonald 2000) and the change from seed bearing cereals
to silage in cattle-feeding stations (Wilson et al. 2007a) have lowered winter survival rates.
Moreover, the decrease of invertebrate prey abundance for nestlings (Brickle et al. 2000) and
changes in the timing of cereal harvesting cause both nest losses (Crick et al. 1994) and losses
of nesting habitat (Brickle & Harper 2002). AES were implemented for both species in the UK,
with demonstrated positive responses locally (Morris et al. 2004, Smith et al. 2009, Perkins et al.
2011), but the two species continue to decline at the UK level (Davey et al. 2010).
In this study, we seek to assess evidence for an effect of SPA designation on these two
species, monitored since 1996 on a 430 km² study site. Almost half of the site was designated
as a Natura 2000 site in 2004, providing a landscape-scale quasi-experiment with before-after in
addition to in-out contrasts (Kleijn & Sutherland 2003). Conservation management implemented
through AESs mostly consisted in the provision and extensive management of grassland (hay
meadows and alfalfa with fertilizer limitation and optional delayed mowing). These measures
contributed to the reversal of the decline of the little bustard Tetrax tetrax by increasing the
availability of rare, food-rich breeding habitats (Bretagnolle et al. 2011). Although not specifically
40
targeted, skylarks and corn buntings may also have benefited from SPA and AES through the
enhancement of habitat heterogeneity, increasing the availability of suitable nesting and
foraging resources throughout their life cycle (see Benton et al. 2003; Herzon & O’Hara 2007;
Geiger et al. 2010b). Despite their different ecological requirements we thus expect positive
effects of the SPA on the population trends of both passerine species after its designation in
2004. We also test if these trends could be explained by temporal or spatial changes in habitat
availability using agricultural land use covariates. Finally, we compare our local trends within or
outside the SPA to regional, national and European trends.
METHODS
Study area
The study was carried out in the Zone Atelier “Plaine & Val de Sèvres” (South of
Département des Deux-Sèvres, in the arable plain of Niort-Brioux (46°15’N, 0°30’W; see Fig. 1
for general location map)). The study area is mostly dedicated to intensive cereal crop
production, however characterised by relatively small fields (of about 4 ha on average), with
83% less than 5 ha, 13 % being 5-10 ha and 4% more than 10 ha. In 2010, cereals accounted
for 44 % of the land use, grassland (including hay meadows, alfalfa, pastures, set-asides and
fallows) c.15 %, and spring-sown crops c. 24%. Hedgerows and trees are scarce. The presence
of 17 Annex 1 species of the EU Bird Directive (notably the little bustard) has led to the
designation of half of the study area (207.6 km2) as a Special Protection Area in 2004 (ZPS
Niort Sud-Est, FR5412007; Fig. 1).
Bird surveys
Populations were surveyed during the breeding season since 1996 onwards, using a
network of 160 count points, a method particularly adapted to conspicuous species with a high
singing activity like the corn bunting and the skylark (Bibby et al. 2000). The sampling was
stratified into 8 sub-sectors in order to ensure regular coverage of the study area. Count points
were distributed along two crossing transects per sub-sector, each transect bearing 10 points
separated by about 500m (Fig. 1). All birds observed within a 200m radius from the observer
(allowing a reliable detection of the species), as well as their behaviour (singing or not, flying or
on the ground) were reported on a field map. However, analyses were restricted to singing
birds, i.e. territorial males. Rainfall, wind speed, and cloud cover were also recorded.
Counts lasted 10 min per sampling point from 1996 to 2000, a duration that was reduced
to 5 min from 2001 onwards with negligible loss of information on probability of presence (see
Bonthoux & Balent 2011). Because the change has not been calibrated for abundance data, we
41
conservatively included a “duration” factor (with two modalities: "until 2000" vs. "after"). In no
instance the addition of this factor affected our results (sign of slope, magnitude of estimates,
probability), therefore we only present the statistical results without the factor duration of count.
Counts were performed in the morning (from 7:00 to 11:00 am) and once in the breeding
season until 2005 (between the 20th April and 10th May). This period represents a good
compromise for both species as skylarks have already begun their first nesting while most of the
territories of male corn buntings are already established (Géroudet 1998). Since 2006, an
additional survey was carried out between 20th May to 10th June. In 1996 observers did not
systematically record if the birds observed were singing or not for Skylark. The number of
skylarks singing in 1996 was back-calculated using the relationship between the proportion of
skylarks singing and the total number of skylarks observed per count point using data from other
years. The relationship was estimated using a logistic GAM including the effect of wind, cloud
cover and an additive smooth effect of the total number of skylarks observed during the count
(Wood 2006), including only points where at least one skylark had been observed. The
explanatory variables accounted for 21.3% of the deviance in the proportion of singing birds (R²
= 0.73; see Appendix 1).
AES were implemented mostly in the core of the SPA (see Bretagnolle et al. 2011). In
our analysis we considered all the sampling points within 500m of the border of the SPA as
being "outside" the SPA. This allowed us to focus on the comparison of areas with high vs. low
or no AES coverage, while making sample size more balanced (84 count points inside vs. 76
outside, see Fig. 1).
Statistical analysis
We analysed presence-absence and abundance data for skylark and corn bunting using
Generalised Additive Mixed Models ('mgcv 1.7-5' package for R 2.13.0: Wood 2006). We used a
binomial error structure for the presence-absence model and Poisson errors for the abundance
model. Models were selected on the basis of their AIC weights (Burnham and Andersson 2002).
In addition, the lack of spatial autocorrelation in the residuals of the final models was checked
using a spline correlogram (‘Gstat 2.4.4’ package for R: Pebesma & Wesseling 1998).
A first set of models was run in order to investigate potentially confounding effects
affecting the proportion of birds present and singing such as meteorological covariates (wind
speed, cloud cover, rain, mean temperature at the day of count, and sum of rainfall over the 5
days before the count, assuming that singing activity increases after unfavourable weather),
julian date and time after sunrise. We included the rain covariate as a 2-level factor, julian date
and time after sunrise as non parametric splines and all other covariates as linear effects. A
model of confounding effects and including a random intercept per year, called “baseline model”
42
was selected using the difference in AIC values and AIC weights and served as a basis for
subsequent models. To correct for potential bias due to slight changes in the sampling
conditions over time (weather, time, date), we used the year-specific predictions of the baseline
model for standardised conditions (see Figure 2). In a second step we looked for temporal
trends in the time series by replacing the year random effect by a spline function of year in the
previous model, which we called “trends model”. The number of degrees of freedom for the
smoothing splines was selected automatically using the default generalised cross validation
procedure (Wood 2006) and was therefore only informed by the data. The spline analysis
provides a convenient and flexible way of visualising temporal trends in the presence or
abundance but does not provide a straightforward formal test for local changes associated with
SPA designation. In addition to the spline analysis of the trends, we therefore carried out a
complementary analysis building upon the baseline model with exclusion of spline year effect, to
test for an effect of the SPA by comparing points falling within or outside the SPA (two
modalities) and contrasting the years before or after the designation in 2004 (two modalities).
We thus tested four models with and without interaction between the two, and applied a
procedure of selection using AIC weights. In the final step of this analysis, we added two habitat
covariates to the “trend models” (percentage of cereals and of grasslands within a 200 m radius
around the sampling point) in order to assess whether trends remained after accounting for
broad land use changes (i.e. whether part of the trends could be attributed to changes in land
use). We selected a 200 m radius buffer because it was used for the species census and
because this distance covers most of the feeding trips in both corn buntings (Brickle et al. 2000)
and skylarks (Eraud 2002). For a better understanding, we first compared, the difference in crop
proportions between the inside and the outside of the SPA and before and after its designation
using Kruskal–Wallis test. Then we proceeded to a model selection with habitat covariates,
using AIC weights.
RESULTS
Smoothed trends in time series, accounting for conf ounding covariates
Both meteorological and timing covariates had significant effects on skylark and corn
bunting presences and abundances (Table 1 in Appendix, model selection procedure). Four
competing models for skylark abundance presented a ∆AIC value lower than 2. More
specifically, the time after sunrise was selected in all models with a positive effect, the date of
the count was selected in two models with a negative effect, and finally, a positive effect of the
amount of precipitations during the five days preceding the census was selected in the best
“baseline model” for skylark abundance (Table 1). Overall the time after sunrise and the Julian
43
date negatively affected respectively the presence and the abundance of both species (Table
1).
Accounting for these confounding variables in the model allowed us to correct the raw
data for differing sampling conditions over the season and between years, such as slight
variations in the time window of the census from one year to another (Fig. 2 a-d, compare
corrected and uncorrected data). Figure 2 shows temporal trends analysed using spline
functions after accounting for confounding variables in the model (see smoothed trends in Fig.
2). Corn bunting presence or abundance decreased between 1996 and 2004 before increasing
until 2009, and finally decreased again since then (Fig. 2a, c). Skylark presence remained
stable with small oscillations between 1996 and 2009 and tended to decrease slightly since
2009. Conversely, skylark abundance showed a strong decline from 1996 to 2011, dropping by
about 30% around the year 2000 (Fig. 2b, d).
Temporal effect of the designation and spatial effe ct of delineation of the SPA
The SPA was designated in 2004: we thus compared the mean of presence and
abundance for both species before versus after 2004, and within versus outside the SPA. We
also tested the trends between counting points within versus outside the SPA using spline
function with year (Fig. 3a and 3b, for abundance).
For both species and metrics, values were higher within the SPA than outside (i.e
abundance is higher in future SPA designation for skylark and corn bunting, respectively by 9.0
and 13.5 %). Skylark presence declined in both sides, especially after 2006, but with more and
larger fluctuations outside the SPA. Skylark abundance also declined in both sides with
oscillations but the decline was smaller within the SPA. However, it declined after 2008 and
2007 respectively within and outside (Fig. 3b). Corn bunting presence declined slightly between
1996 and 2004, and then remained stable or slightly decreasing outside the SPA. Corn bunting
abundance declined between 1996 and 2005 and then increased at a faster rate within the SPA
than outside (Fig 3a).
Four statistical models were evaluated for each variable response (Table 2). Overall, a
consistent effect was found for SPA and, to a lesser extent, for period, suggesting both a
significant difference between the areas throughout the study period and a change with time. In
both skylark and corn bunting, presence models integrating the interaction between SPA and
period were no better than those without interaction (skylarks) or even worse (buntings),
suggesting that there were no significant changes after 2004. In contrast, there was a strong
consistent effect for an interaction between SPA and period on skylark abundance, suggesting
that the decline was less pronounced within the SPA after 2004. For corn bunting abundance,
44
the model including the interaction between SPA and period performed slightly better than in the
model without interaction, providing weak evidence for a SPA effect after 2004. However, in
both cases, the abundance was doubled after the SPA designation, compared to the initial
abundance (26% and 18% higher in SPA than outside, respectively for skylark and bunting).
Are SPA effects a result of changes in landscape co mposition?
We tested whether the positive effect of SPA implementation on bird abundances may
simply result from land use changes (whether a result of AES implementation or not) by testing
if the SPA effects remained after including land use covariates into the trend modelling. Wheat
proportion increased significantly between the two periods (Kruskal–Wallis test: inside SPA: H =
6.2, P = 0.013; outside SPA: H = 14.2, P < 0.001), but did not statistically differ between outside
and inside the SPA (Appendix 2). Moreover the proportion of grassland increased significantly
inside the SPA after the designation (inside SPA: H = 30.8, P < 0.001) but not outside the SPA.
This strong increase inside the SPA led to a significant difference in proportion with outside the
SPA after 2004 (after 2004 inside SPA: H = 32.8, P < 0.001).
Including landscape covariates into the “SPA model” improved the ∆AIC value by more
than 2 for each response variable (Table 3, Fig 2 in Appendix). In particular, the interaction of
wheat and grassland improved the models of abundance in both species and the model of
presence in corn bunting. For both the presence and abundance of corn buntings, wheat had a
significant negative effect whereas the interactions of wheat and grassland had a significant
positive effect. For the abundance and presence of skylarks, both wheat and its interaction with
grassland had a significant positive effect whereas grassland had a negative one. In skylark
presence, two models were in competition, including grassland and wheat with and without
interaction. In both cases, the proportion of grassland had a negative effect and wheat a positive
effect. Although significant effects of wheat and grassland availability were found, their inclusion
in the models had only negligible effects on the observed trends (Figure 2 – Appendix).
Comparison with trends at higher spatial scales
The skylark and corn bunting have declined continuously at both European and national
levels (Fig. 3). In both species, national pattern are remarkably similar to European trends. For
both the skylark and corn bunting, the large scale patterns, especially the national trends are
very similar to those observed in our study site outside the SPA. Trends within the SPA are
comparatively more positive than national trends (Fig. 3), therefore suggesting a local effect
disconnected from larger spatial scale patterns. Interestingly, skylark abundance is found to be
stable or slightly increasing at a regional scale (Fig. 4d; data are not available at this scale for
the corn bunting), especially so since 2003-2004, i.e. after the designation of 8 SPA in the
45
Région Poitou-Charentes, covering about 200,000 ha (more than 20% of the arable land of the
Région).
DISCUSSION
Population trends
The comparison of local and large scale trends shows a good degree of similarity in the
dynamics of the two species between the parts of our study area outside the SPA and the
national and European trends. The contrasting trends we found in our study area between
within and outside the SPA and between periods form near-experimental evidence of the
positive local effects of the SPA implementation on these two farmland specialists. Although
skylarks and, to a lesser extent, corn buntings have declined globally over the last 16 years,
skylark decline has halted within the SPA and corn buntings have even started to increase
again since designation. Interestingly, variations in bird presence over time inside and outside
the SPA were relatively small, suggesting that the variations in abundance essentially reflected
variations in density rather than the colonisation/desertion of new/former areas. This is also
suggestive of a patchy distribution of habitat resources. However, slightly higher initial bird
abundances in the SPA (by c.10%) compared to outside suggest that the SPA was designated
in an area with higher densities of skylarks and corn buntings from the outset. Indeed, the limits
of the SPA were mainly drawn according to areas holding active or formerly active leks of the
little bustard as well as several threatened farmland species from the Annex 1 of the Birds
Directive, such as stone curlews Burhinus oedicnemus and Montagu’s harrier Circus pygargus.
This species community requires relatively preserved mixed farming systems with structurally
diverse crop mosaics including arable spring-sown crops, non-crop habitat and/or perennial
crops (Salamolard & Moreau 1999; Wolf et al. 2001; Koks et al. 2007; Green et al. 2000). We
could therefore expect that farmland specialist passerines that require several habitats for
breeding and foraging through the annual cycle, including skylarks (Wilson et al. 1997;
Chamberlain et al. 1999) and corn buntings (Gillings & Watts 1997) were also previously more
numerous within the designated area. Nevertheless, the recent increase of corn buntings in the
SPA as well as the attenuation of the decline of skylarks advocate for an additional habitat
improvement brought about by the SPA designation rather than just an a priori delineation bias
(i.e after designation abundance is about 20-25% higher in SPA than outside). The fact that our
study site yet held a high level of remarkable biodiversity may at least have been a determinant
factor in the positive effects of conservation measures following the designation (Kleijn et al.
2009; Whittingham 2011). These results are in line with previous findings on the effect of
protected areas (including National Parks, Nature Reserves and SPAs) on common birds at the
scale of France (Devictor et al. 2007). The latter showed that common species had significantly
46
higher densities and exhibited higher temporal stability in protected areas than elsewhere, in
particular in specialized species such as farmland birds.
However, the local decrease observed since 2009 remains surprising by its intensity
and because it affected presence and abundance of both species both within the SPA and
outside. A potential explanation is the severity of the 2009-2010 and 2010-2011 winters, with
long periods of temperature under 0°c or with snow cover. The latter may have resulted in a
high mortality of sedentary birds and decreased their abundance in the following breeding
seasons (see e.g. Cawthorne & Marchant, 1980). The weather hypothesis is locally supported
by a similar strong decline in the same years in other resident or short-distance migrant species
such as yellowhammers in contrast with long-distance migrant ones e.g., yellow wagtail and
warblers (unpublished data). Alternatively, or in conjunction, rotational CAP set asides were
highly selected by farmland birds and notably skylarks (see e.g. Gillings et al. 2010); their
abolition in 2008 at the national and European scales may also have had a negative impact on
birds.
The increase in skylark abundance found at the regional scale of Poitou-Charente is in
sharp contrast with declines found at other scales (national, European and outside SPA locally).
The Poitou-Charente region has seen a quantitatively high and unique implementation of SPA in
arable areas (nearly 200,000 ha - about half of the arable lowlands of the region are currently
designated under SPA) owing to the positive trends suggest that the extensive SPA designation
in the region has positively affected the regional population trend, as seems to be the case in
our study area. Further research would require information about local population growth rates
to confirm the hypothesis.
SPA and habitat improvement
The most likely candidate for explaining an improvement of habitat quality in the SPA is
the implementation of Agri-Environment Schemes aiming at improving breeding habitats for little
bustards (AESs, see Bretagnolle et al. 2011). AESs were largely adopted by farmers (only
580ha contracted in 2005, reaching 9374ha by 2011), notably leading to a significant increase
of the proportion of grassland in the SPA since 2004, after having decreased by a factor 10
since the 1950’s (unpublished data). Grasslands under AES hold a higher diversity of arable
weeds and invertebrate biomass compared with conventionally managed crops (Badenhausser
et al. 2008; Bretagnolle et al. 2011; Zahn et al. 2010) and may also favor access to food owing
to a more heterogeneous and scattered vegetation cover. Such an increase in the amount of
resource patches at the landscape level is expected to shorten the food provisioning trips to the
nestlings (see e.g. Poulsen et al. 1998 for skylarks and Brickle & Harper 1999 for corn buntings)
and ultimately allowing higher nesting densities. In the case of skylarks, our results suggest that
47
grassland habitats were avoided for nesting but the increase of their vegetation heterogeneity
consecutive to extensive management may also have directly favoured nesters (see e.g. Erdos
et al. 2009). Our analysis does not allows us to know if the population enhancement observed is
consecutive to higher habitat attractiveness, higher nesting success or both. Additionally, the
decline in the availability of habitats suitable for feeding in winter, such as winter stubbles and
set aside is considered to be an important cause of the decline of farmland birds in Europe
including corn buntings (Donald & Forrest 1995) and skylarks (Donald et al. 2001c; Gillings &
Fuller 2001). Reciprocally, the provision of these winter feeding habitats has been correlated
with positive breeding population trends (Gillings et al. 2005). Here, the more heterogeneous
structure and richer weed and seed composition of grass and alfalfa crops, at least those under
AES, may also increase their value as winter feeding habitats for skylarks (Perkins et al. 2000)
and corn buntings (Mason & MacDonald 2000; Fox & Heldbjerg 2008). Finally, the development
of non-inversion tillage (another locally implemented AES) may also have a further positive
impact on wintering granivorous passerines including skylarks (Cunningham et al. 2005; Field et
al. 2007).
Conclusion
Our results suggest that the designation of a SPA in arable lowlands had a local positive
impact on skylark and corn bunting trends, probably through the implementation of AESs
enhancing habitat heterogeneity (here defined by the amount of the rarer, grassland habitat)
and lowering land use intensity. Moreover, a dense network of SPAs dedicated to arable land
may also have had a positive impact on skylark trend at the Poitou-Charentes regional scale.
Our results also confirm that protected areas could constitute important spatial refuges for
declining common species (Devictor et al. 2007). Finally, our study suggests that the regional
scale may be relevant for conservation actions to yield beneficial results (Whittingham 2007)
and that the Natura 2000 network construction should be considered in regional conservation
objectives (Louette et al. 2011).
In contrast with the United Kingdom (Morris et al. 2004; Perkins et al. 2008, 2011),
skylarks and corn buntings are not specifically targeted by conservation measures in France
notably because these species are still common and widespread. Their populations are
however still declining, perhaps at a greater pace as a result of the abolition of the CAP set
asides in 2008 (Gillings et al. 2010). Extensive grassland provision above a critical threshold
may represent a generic option to stop the negative trends of these two species (Piha et al.
2007; Fox & Heldbjerg 2008; this study) and probably of many taxa in arable dominated
landscapes (see also Robinson et al. 2001; Atkinson et al. 2002).
48
At a national (as well as European) scale, economic incentives towards conservation
management options in arable areas may still be too limited because they are generally
geographically confined to priority sites (Natura 2000 and water protection zones). Moreover,
arable management options generally focus on field-margins and/or on chemical inputs rather
than on reversion from crops to grassland, at least for the reason that farmers favor the less
restrictive schemes that require the least modifications of their practices (Arnaud & Dupraz
2006). However, our study provides indication that where EU Bird Directive species like the little
bustard are present, they can represent an efficient “umbrella” species. Moreover, a regional
approach with a dense enough network of SPAs aimed at a rare species may stop or slow down
the decline of common species. While the range of such species may be geographically limited,
this strategy may be seen as a local complement to a more global strategy towards “ordinary”
nature including, e.g., organic farming.
Acknowledgements
This research was partly supported by DREAL Poitou-Charentes and several ANR projects
(ECOGER, PRAITERRE, BIODIVAGRIM). We wish to thank fieldworkers, too many to name
individually, for their dedicated work, but particularly Pierre Tabel for his pioneer work in 2002.
SA was supported by a PHD grant from Conseil Général des Deux Sèvres and Région Poitou-
Charentes. We are very grateful to Frédéric Jiguet, from the CRBPO-MNHN, who made
available national trends from the STOC program, as well as Cyril Eraud for making counts from
ONCFS and FNC available for the skylark for the Poitou-Charentes Region. We finally thank G.
Siriwardena for his helpful comments on the manuscript.
49
References
Arnaud, S. & Dupraz, P. (2006). Agroenvironnement : la position atypique de la France, Séminaire de politique agricole de la SFER, 13 octobre 2006, Société Française d’Economie Rurale, Paris.
Atkinson, P.W., Fuller, R.J., Vickery & J.A. (2002). Large-scale patterns of summer and winter bird distribution in relation to farmland type in England and Wales. Ecography 25, 466–480.
Badenhausser, I., Mediene, S., Paris Le Clerc, N. & Bretagnolle, V. (2008). Effects of agri-environnemental agreements on acridids and plant species richness in alfalfa crops. In Hopkins, A. et al. (eds) 22st International Symposium of the European Grassland Federation: 54–56. Uppsala, Sweden: Swedish University of Agricultural Sciences (SLU).
Benton, T.G., Vickery, J.A. & Wilson, J.D. (2003). Farmland biodiversity: is habitat heterogeneity the key?. Trends Ecol. Evol. 18, 182–188.
Bibby C, Burgess N, Hill D & Mustoe S (2000). Bird census techniques. Academic Press, London.
Boitier, B. (2011). Development of a land use module for the applied economic model NEMESIS: Application to European policies. Ph. D. Thesis. Economic Sciences. Ecole Centrale Paris – ERASME, 503 pp.
Bonthoux, S. & Balent, G. (2011). Point count duration: five minutes are usually sufficient to model the distribution of bird species and to study the structure of communities for a French landscape. J. Ornithol. in press.
Bretagnolle, V., Villers, A., Denonfoux, L., Cornulier, T., Inchausti, P. & Badenhausser, I. (2011). Rapid recovery of a depleted population of Little Bustards Tetrax tetrax following provision of alfalfa through an agri-environment scheme. Ibis 153, 4–13.
Brickle, N.W. & Harper, D.G.C. (1999). Diet of nestling corn buntings Miliaria calandra in southern England examined by compositional analysis of faeces. Bird Study 46, 319–329.
Brickle, N.W., Harper, D.G.C, Aebischer, N.J. & Cockayne, S.H. (2000). Effects of agricultural intensification on the breeding success of corn buntings Miliaria calandra. J. Appl. Ecol. 37, 742–755.
Brickle, N.W. & Harper, D.G.C. (2002). Agricultural intensification and the timing of breeding of corn buntings Miliaria calandra. Bird Study 49, 219-228.
Bright, J. A., Morris, A. J. & Winspear R. (2008). A review of Indirect Effects of Pesticides on Birds and mitigating land-management practices. RSPB Research Report No 28 J.A. (eds) Ecology and Conservation of Lowland Farmland Birds: 140–150. Tring: BOU.
Cawthorne, R.A. & Marchant, J.H. (1980). The effects of the 1978/79 winter on British bird populations. Bird Study 27, 163-172.
Chamberlain, D.E. & Crick, H.Q.P. (1999). Population declines and reproductive performance of skylarks Alauda arvensis in different regions and habitats of the United Kingdom. Ibis 141, 38–51.
50
Chamberlain, D.E., Vickery, J.A. & Gough, S. (2000). Spatial and temporal distribution of breeding Skylarks Alauda arvensis in relation to crop type in periods of population increase and decline. Ardea 88, 61–73.
Chamberlain, D.E., Wilson, A.M., Browne, S.J. & Vickery, J.A. (1999). Effects of habitat type and management on the abundance of skylarks in the breeding season. J. Appl. Ecol. 36, 856–870.
CRBPO, 2011. Vigie Nature. Downloaded from http://vigienature.mnhn.fr/page/oiseaux
Crick, H.Q.P., Dudley, C., Evans, A.D. & Smith, K.W. (1994). Causes of nest failure among buntings in the UK. Bird Study 41, 88–94.
Cunningham, H.M., Bradbury, R.B., Chaney, K. & Wilcox, A. (2005). Effect of non-inversion tillage on field usage by UK farmland birds in winter. Bird Study 52, 173–179.
Davey, C.M., Vickery, J.A., Boatman, N.D., Chamberlain, D.E., Parry, H.R. & Siriwardena, G.M. (2010). Assessing the impact of Entry Level Stewardship on lowland farmland birds in England. Ibis 152, 459–474.
Devictor V., Godet L., Julliard R., Couvet D. & Jiguet F. (2007). Can common species benefit from protected areas? Biol. Conserv. 139, 29–36.
Donald, P.F., Sanderson, F.J., Burfield, I.J. & van Bommel, F.P.J. (2006). Further evidence of continent-wide impacts of agricultural intensification on European farmland birds, 1990–2000. Agric. Ecosyst. Environ. 116, 189–196.
Donald, P.F. & Forrest, C. (1995). The effects of agricultural change on population size of Corn Buntings Miliaria calandra on individual farms. Bird Study 42: 205–215.
Donald, P.F. & Vickery, J.A. (2000). The importance of cereal fields for breeding and wintering Skylarks Alauda arvensis in the UK. Ecology and Conservation of Lowland Farmland Birds (eds N.J. Aebischer, A.D. Evans, P.V. Grice & J.A. Vickery), pp. 140–150. British Ornithologists’ Union, Tring, UK.
Donald, P.F. (1997). The Corn Bunting Miliaria calandra in Britain: a review of current status, patterns of decline and possible causes. In: Donald, P.F., Aebischer, N.J. (Eds.), The Ecology and Conservation of Corn Buntings Miliaria calandra: UK Nature Conservation No. 13. Joint Nature Conservation Committee, Peterborough, pp. 11–26.
Donald, P.F., Evans, A.D., Muirhead, L.B., Buckingham, D.L., Muirhead, L.B. & Wilson, J.D. (2001b). Factors affecting the territory distribution of Skylarks Alauda arvensis breeding on lowland farmland. Bird Study 48: 271–278.
Donald, P.F., Buckingham, D.L., Moorcroft, D., Muirhead, L.B., Evans, A.D. & Kirby, W.B. (2001c). Habitat use and diet of skylarks Alauda arvensis wintering on lowland farmland in southern Britain. J. Appl. Ecol. 38, 536–547.
Donald, P.F., Evans, A.D., Muirhead, L.B., Buckingham, D.L., Kirby, W.B. & Schmitt, S.I.A. (2002). Survival rates, causes of failure and productivity of Skylark Alauda arvensis nests on lowland farmland. Ibis 144, 652–664.
51
Donald, P.F., Green, R.E. & Heath, M.F. (2001a). Agricultural intensification and the collapse of Europe’s farmland bird populations. Proc. Roy. Soc. Lon. B-Biol. Sci. 268, 25-29.
Ellis, E. C., Klein Goldewijk, K., Siebert, S., Lightman, D. & Ramankutty, N. (2010). Anthropogenic transformation of the biomes, 1700 to 2000. Glob. Ecol. Biogeogr. 19, 589–606.
Eraud, C. (2002). Ecologie de l’Alouette des champs Alauda arvensis en milieux cultivés. EPHE Thesis. Office National de la Chasse et de la Faune Sauvage. 119 pp.
Eraud, C. & Boutin, J.M. (2002). Density and productivity of breeding skylarks Alauda arvensis in relation to crop type on agricultural lands in western France. Bird Study 49, 287–296.
Erdos, S., Báldi, A., Batáry, P. (2009). Nest site selection and breeding ecology of Sky Larks Alauda arvensis in Hungarian farmland. Bird Study 56, 259–263.Field, R.H., Benke, S., Bádonyi, K. & Bradbury, R.B. (2007). Influence of conservation tillage on winter bird use of arable fields in Hungary. Agric. Ecosyst. Environ. 120, 399-404.
Fox, A.D. (2004). Has Danish agriculture maintained farmland bird populations? J. Appl. Ecol. 41, 427–439.
Fox, T. A. D. & Heldbjerg, H. (2008). Which regional features of Danish agriculture favour the corn bunting in the contemporary farming landscape? Agric. Ecosyst. Environ. 126, 261–269.
Geiger, F., Bengtsson, J., Berendse, F., Weisser, W.W., Emmerson, M., Morales, M.B., Ceryngier, P., Liira, J., Tscharntke, T., Winqvist, C., Eggers, S., Bommarco, R., Pärt, T., Bretagnolle, V., Plantegenest, M., Clement, L.W., Dennis, C., Palmer, C., O˜nate, J.J., Guerrero, I., Hawro, V., Aavik, T., Thies, C., Flohre, A., Hänke, S., Fischer, C., Goedhart, P.W. & Inchausti, P. (2010a). Persistent negative effects of pesticides on biodiversity and biological control potential on European farmland. Basic Appl. Ecol. 11, 97–105.
Geiger, F., de Snoo, G.R., Berendse, F., Guerrero, I., Morales, M.B., Oñate, J.J., Eggers, S., Part, T., Bommarco, R., Bengtsson, J., Clement, L.W., Weisser, W.W., Olszewski, A., Ceryngier, P., Hawro, V., Inchausti, P., Fischer, C., Flohre, A., Thies, C. & Tscharntke, T. (2010b). Landscape composition influences farm management effects on farmland birds in winter: a pan-European approach. Agric. Ecosyst. Environ. 139, 571–577.
Géroudet, P. (1998). Les Passereaux d’Europe. Paris: Delachaux et Niestlé.
Gillings, S. & Watts, P.N. (1997). Habitat selection and breeding ecology of Corn Buntings Miliaria calandra in the Lincolnshire Fens. Pp. 139-150 in P.F. Donald & N.J. Aebischer (eds): The ecology and conservation of Corn Buntings Miliaria calandra. – UK Nature Conservation No. 13, Joint Nature Conservation Committee, Peterborough.
Gillings, S., Henderson, I.G., Morris, A.J. & Vickery, J.A. (2010). Assessing the implications of the loss of set-aside for farmland birds. Ibis 152, 713–723.
Gillings, S. & Fuller, R.J. (2001). Habitat selection by skylarks Alauda arvensis wintering in Britain in 1997/98. Bird Study, 48, 293–307.
Gillings, S., Newson, S.E., Noble, D.G. & Vickery, J.A. (2005). Winter availability of cereal stubbles attracts declining farmland birds and positively influences breeding population trends. Proc. Roy. Soc. Lon. B-Biol. Sci. 272, 733–739.
52
Green, R.E., Tyler, G.A. & Bowden, C.G.R. (2000). Habitat selection, ranging behaviour and diet of the stone curlew (Burhinus oedicnemus) in southern England. J. Zool. (Lond.) 250, 161–183.
Herzon, I. & O’Hara, R.B. (2007). Effects of landscape complexity on farmland birds in the Baltic States. Agric. Ecosyst. Environ. 118, 297–306.
Jiguet, F., Devictor, V., Julliard, R. & Couvet, D. (2011). French citizens monitoring ordinary birds provide tools for conservation and ecological science. Acta Oecol. in press.
Kleijn, D. & Sutherland, W.J. (2003). How effective are European agri-environment schemes in conserving and promoting biodiversity? J. Appl. Ecol. 40, 947–969.
Kleijn, D., Kohler, F., Baldi, F.A., Batary, P., Concepcion, E.D., Clough, Y., Dıaz, M., Gabriel, D., Holzschuh, A., Knop, E., Kovacs, A., Marshall, E.J.P., Tscharntke, T. & Verhulst, J. (2009). On the relationship between farmland biodiversity and land-use intensity in Europe. Proc. Roy. Soc. Lon. B-Biol. Sci. 276, 903–909.
Kleijn, D. & van Zuijlen, G.J.C. (2004). The conservation effects of meadow bird agreements on farmland in Zeeland, The Netherlands, in the period 1989–1995. Biol. Conserv. 117, 443-451.
Kleijn, D., Rundlof, M., Scheper, J., Smith, H.G. & Tscharntke, T. (2011). Does conservation on farmland contribute to halting the biodiversity decline? Trends Ecol. Evol. 26, 474-481.
Koks, B. J., Trierweiler, C., Visser E. G., Dijkstra, C. & Komdeur, J. (2007). Do voles make agricultural habitat attractive to Montagu’s Harrier Circus pygargus? Ibis, 149, 575-586.
Krebs, J.R., Wilson, J.D, Bradbury, R.D. & Siriwardena, G.M. (1999). The second silent spring? Nature 400, 611–612.
Louette, G., Adriaensa, D., Adriaensa P., Anselina A., Devosa K., Sannenb K., Van Landuyta W., Paelinckxa D. & Hoffmanna M. (2011). Bridging the gap between the Natura 2000 regional conservation status and local conservation objectives. J. Nat. Conserv. 19, 224-235.
Mason, C.F. & MacDonald, S.M. (2000). Corn bunting Miliaria calandra populations, landscape and land-use in an arable district of eastern England. Bird Conserv. Int. 10, 169–186.Morris, A.J., Holland, J.M., Smith, B. & Jones, N.E. (2004). Sustainable Arable Farming for an Improved Environment (SAFFIE): managing winter wheat sward structure for Skylarks Alauda arvensis. Ibis, 146, 155–162.
Newton, I. (2004). The recent declines of farmland bird populations in Britain: an appraisal of causal factors and conservation actions. Ibis, 146, 579–600.
Osterman, O.P. (1998). The need for management of nature conservation sites designated under Natura 2000. J. Appl. Ecol. 35, 968–973.
Pebesma, E.J. & Wesseling, C.G. (1998). Gstat: a program for geostatistical modelling, prediction and simulation. Comput. Geosci. 24, 17-31.
Perkins, A.J., Maggs, H.E., Watson, A., Wilson, J.D., 2011 Adaptive management and targeting of agrienvironment schemes does benefit biodiversity: a case study of the corn bunting Emberiza calandra. J. Appl. Ecol. 48, 514–522.
53
Perkins, A. J., Maggs, H. E., Wilson, J. D., Watson, A. & Smout, C. (2008). Targeted management intervention reduces rate of population decline of Corn Buntings Emberiza calandra in eastern Scotland. Bird Study 55: 52-58.
Perkins, A.J., Whittingham, M.J., Bradbury, R.B., Wilson, J.D., Morris, A.J. & Barnett, P.R. (2000). Habitat characteristics affecting use of lowland agricultural grassland by birds in winter. Biol. Conserv. 95, 279–294.
Poulsen, J.G., Sotherton, N.W. & Aebischer, N.J. (1998). Comparative nesting and feeding ecology of skylarks Alauda arvensis on arable farmland in southern England with special reference to set-aside. J. Appl. Ecol. 35, 131–147.
Robinson, R.A., Wilson, J.D. & Crick, H.Q.P. (2001). The importance of arable habitat for farmland birds in grassland landscapes. J. Appl. Ecol. 38, 1059–1069.
Salamolard, M. & Moreau, C. (1999). Habitat selection by Little Bustard Tetrax tetrax in a cultivated area of France. Bird Study, 46, 25-33.
Smith, B., Holland, J., Jones, N., Moreby, S., Morris, A.J. & Southway, S. (2009). Enhancing invertebrate food resources for Skylarks in cereal ecosystems: how useful are in-crop agri-environment scheme management options? J. Appl. Ecol. 46, 692–702.
Stoate, C., Borralho, R. & Arauja, M. (2000). Factors affecting corn bunting Miliaria calandra abundance in a Portuguese agricultural lanscape. Agric. Ecosyst. Environ. 77, 219–226.
Sundseth K, Creed P (2008) Natura 2000: Protecting Europe’s Biodiversity. Office for Official
Publications of the European Communities: 1–296.
Vickery, J.A., Bradbury, R.B., Henderson, I.G., Eaton, M.A. & Grice, P.V. (2004). The role of agri-environment schemes and farm management practices in reversing the decline of farmland birds in England. Biol. Conserv. 119, 19–39.
Villers, A., Millon, A., Jiguet, F., Lett, J.-M., Attie, C., Morales, M.B. & Bretagnolle, V. (2010). Migration of wild and captive-bred Little Bustards Tetrax tetrax: releasing birds from Spain threatens attempts to conserve declining French populations. Ibis 152, 254–261.
Voříšek, P., Jiguet, F., van Strien, A., Skorpilová, J., Klvanová, A. & Gregory, R.D. (2010). Trends in Abundance and Biomass of Widespread European Farmland Birds: How Much Have We Lost? BOU Proceedings e Lowland Farmland Birds III.
Whittingham, M. J. (2011). The future of agri-environment schemes: biodiversity gains and ecosystem service delivery? J. Appl. Ecol. 48, 509–513.
Whittingham, M.J. (2007). Will agri-environment schemes deliver substantial biodiversity gain, and if not why not? J. Appl. Ecol. 44, 1–5.
Wilson, J. D., Evans, A. D. & Grice, P. V. (2010). Bird conservation and agriculture: a pivotal moment ? Ibis 152, 176–179.
54
Wilson, J.D., Boyle, J., Jackson, D.B., Lowe, B. & Wilkinson, N.I. (2007a). Effect of cereal harvesting on a recent population decline of Corn Buntings Emberiza calandra on the Western Isles of Scotland. Bird Study 54, 362–370.
Wilson, J., Anderson, G., Perkins, A., Wilkinson, N. & Maggs, H. (2007b). Adapting agri-environment management to multiple drivers of decline of corn buntings Emberiza calandra across their UK range. Aspects Appl. Biol. 81,191–198.
Wilson, J.D., Evans, J., Browne, S.J. & King, J.R. (1997). Territory distribution and breeding success of skylarks Alauda arvensis on organic and intensive farmland in southern England. J. Appl. Ecol. 34, 1462–1478.
Wolf, A., Paul, J.P., Martin, J.L. & Bretagnolle, V. (2001). The benefits of extensive agriculture to birds: the case of the little bustard. J. Appl. Ecol. 38, 963-975.
Wood, S. N. (2006). Generalized additive models: an introduction with R. Boca Raton, Florida, USA, Chapman & Hall/CRC; R Development Core Team (2011). R: A Language and Environment for Statistical Computing. Vienna, Austria, R Foundation for Statistical Computing).
Wretenberg, J., Lindström, Å., Svensson, S., Tierfelder, T. & Pärt, T. (2006). Population trends of farmland birds in Sweden and England: similar trends but different patterns of agricultural intensification. J. Appl. Ecol. 43, 1110–1120.
Wretenberg, J., Pärt, T. & Berg, A. (2010). Changes in local species richness of farmland birds in relation to land-use changes and landscape structure. Biol. Conserv. 143, 375–381.
Zahn, A., Englmaier, I. & Drobny, M. (2010). Food availability for insectivores in grasslands – arthropod abundance in pastures, meadows and fallow land. Appl. Ecol. Environ. res. 8, 87-100.
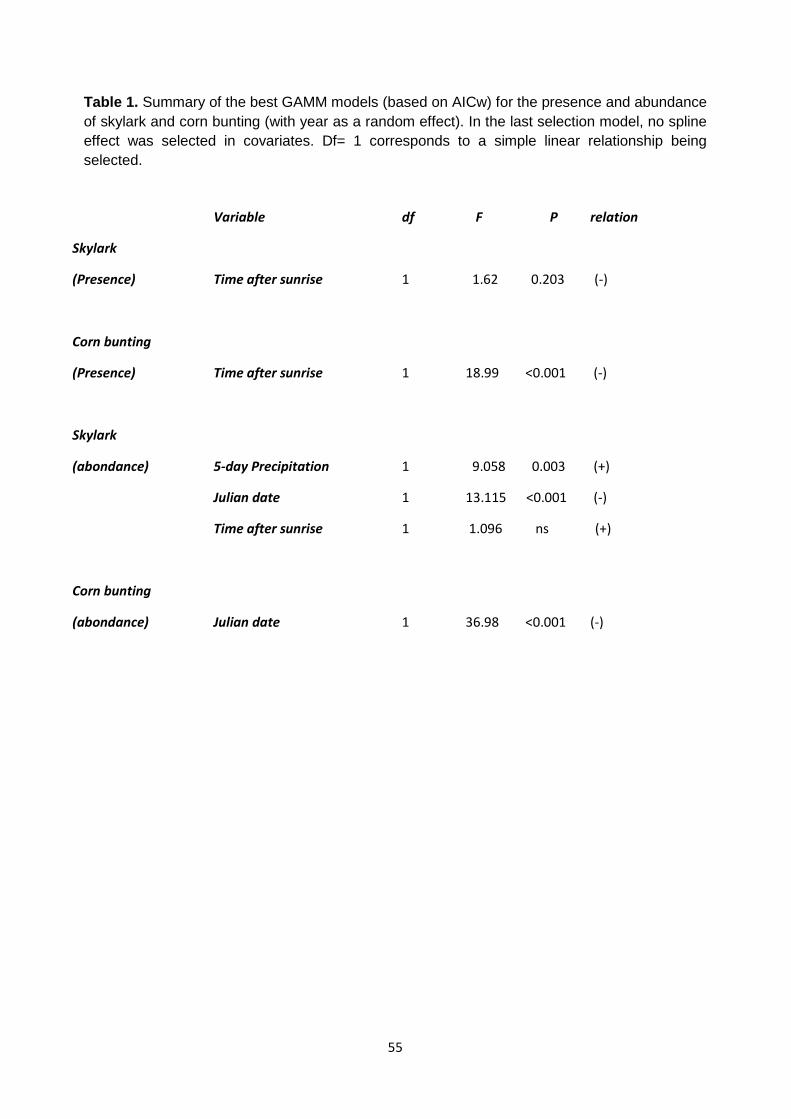
55
Table 1. Summary of the best GAMM models (based on AICw) for the presence and abundance of skylark and corn bunting (with year as a random effect). In the last selection model, no spline effect was selected in covariates. Df= 1 corresponds to a simple linear relationship being selected.
Variable df F P relation
Skylark
(Presence) Time after sunrise 1 1.62 0.203 (-)
Corn bunting
(Presence) Time after sunrise 1 18.99 <0.001 (-)
Skylark
(abondance) 5-day Precipitation 1 9.058 0.003 (+)
Julian date 1 13.115 <0.001 (-)
Time after sunrise 1 1.096 ns (+)
Corn bunting
(abondance) Julian date 1 36.98 <0.001 (-)
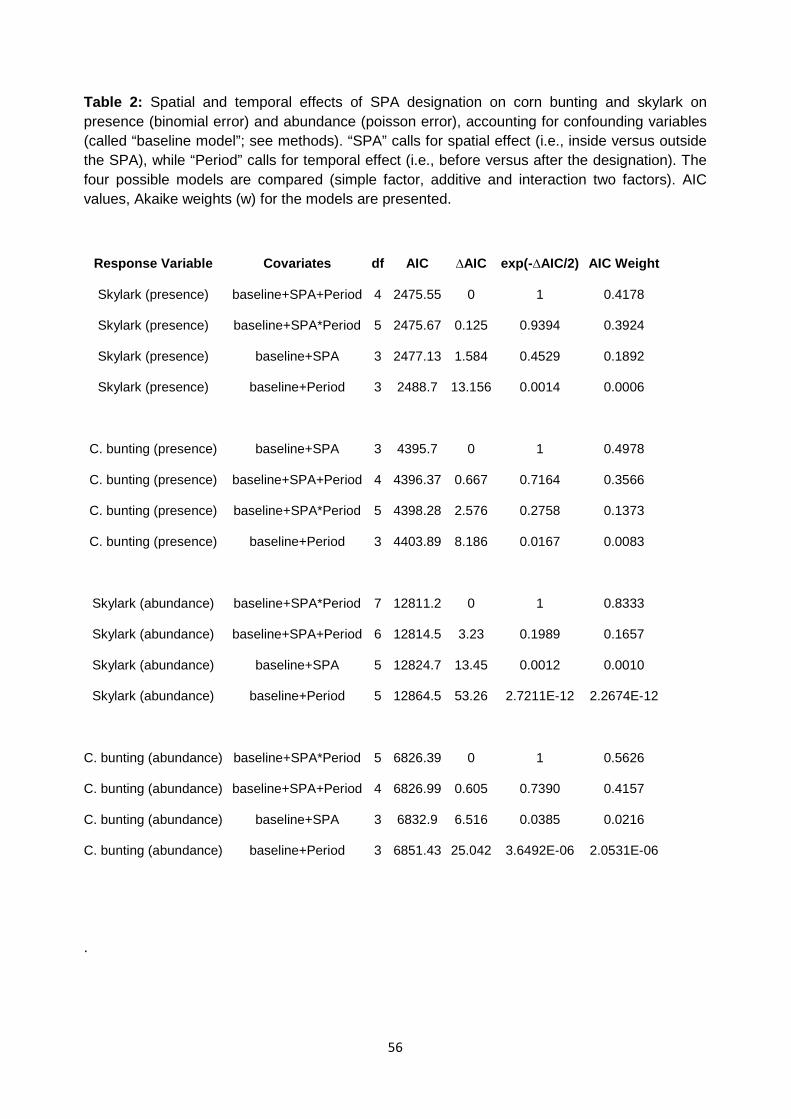
56
Table 2: Spatial and temporal effects of SPA designation on corn bunting and skylark on presence (binomial error) and abundance (poisson error), accounting for confounding variables (called “baseline model”; see methods). “SPA” calls for spatial effect (i.e., inside versus outside the SPA), while “Period” calls for temporal effect (i.e., before versus after the designation). The four possible models are compared (simple factor, additive and interaction two factors). AIC values, Akaike weights (w) for the models are presented.
Response Variable Covariates df AIC ∆AIC exp(-∆AIC/2) AIC Weight
Skylark (presence) baseline+SPA+Period 4 2475.55 0 1 0.4178
Skylark (presence) baseline+SPA*Period 5 2475.67 0.125 0.9394 0.3924
Skylark (presence) baseline+SPA 3 2477.13 1.584 0.4529 0.1892
Skylark (presence) baseline+Period 3 2488.7 13.156 0.0014 0.0006
C. bunting (presence) baseline+SPA 3 4395.7 0 1 0.4978
C. bunting (presence) baseline+SPA+Period 4 4396.37 0.667 0.7164 0.3566
C. bunting (presence) baseline+SPA*Period 5 4398.28 2.576 0.2758 0.1373
C. bunting (presence) baseline+Period 3 4403.89 8.186 0.0167 0.0083
Skylark (abundance) baseline+SPA*Period 7 12811.2 0 1 0.8333
Skylark (abundance) baseline+SPA+Period 6 12814.5 3.23 0.1989 0.1657
Skylark (abundance) baseline+SPA 5 12824.7 13.45 0.0012 0.0010
Skylark (abundance) baseline+Period 5 12864.5 53.26 2.7211E-12 2.2674E-12
C. bunting (abundance) baseline+SPA*Period 5 6826.39 0 1 0.5626
C. bunting (abundance) baseline+SPA+Period 4 6826.99 0.605 0.7390 0.4157
C. bunting (abundance) baseline+SPA 3 6832.9 6.516 0.0385 0.0216
C. bunting (abundance) baseline+Period 3 6851.43 25.042 3.6492E-06 2.0531E-06
.
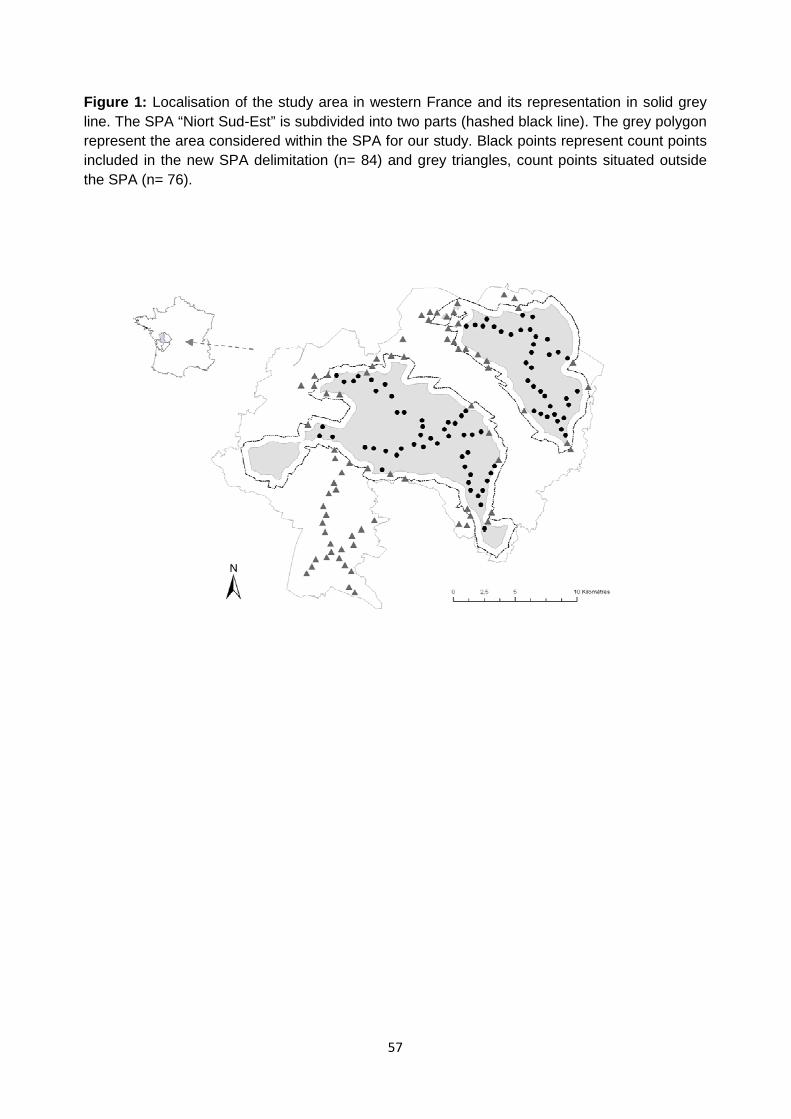
57
Figure 1: Localisation of the study area in western France and its representation in solid grey line. The SPA “Niort Sud-Est” is subdivided into two parts (hashed black line). The grey polygon represent the area considered within the SPA for our study. Black points represent count points included in the new SPA delimitation (n= 84) and grey triangles, count points situated outside the SPA (n= 76).
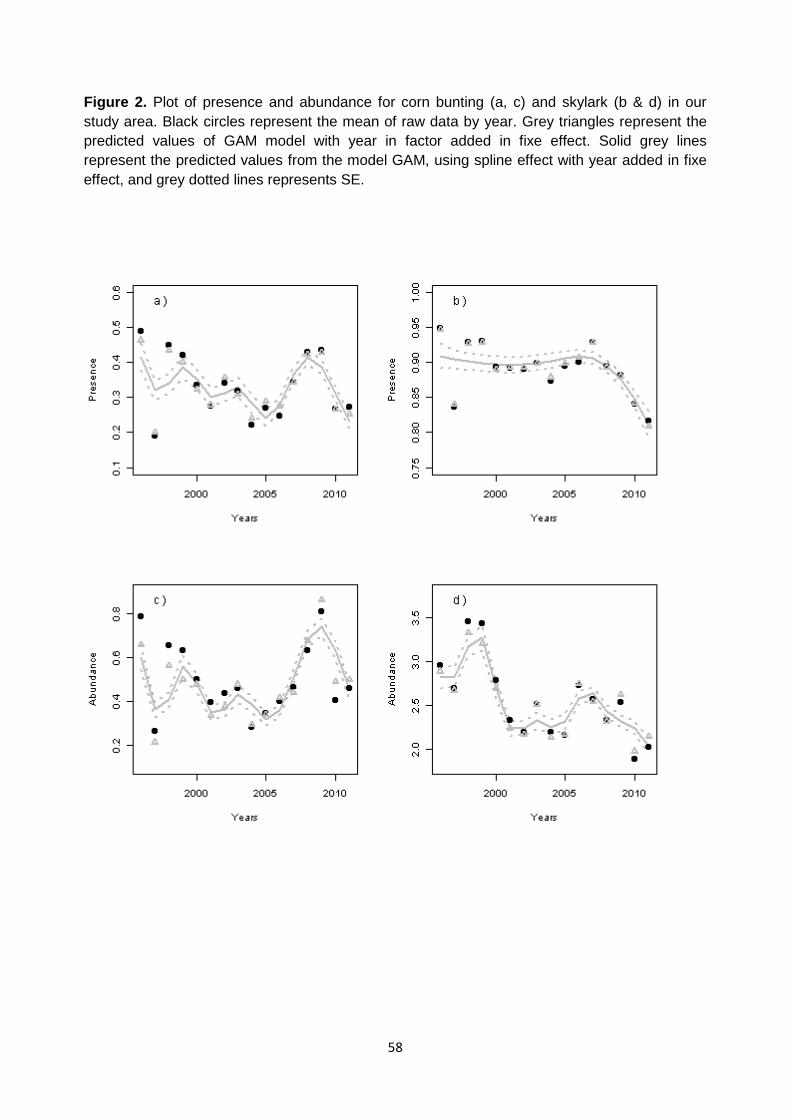
58
Figure 2. Plot of presence and abundance for corn bunting (a, c) and skylark (b & d) in our study area. Black circles represent the mean of raw data by year. Grey triangles represent the predicted values of GAM model with year in factor added in fixe effect. Solid grey lines represent the predicted values from the model GAM, using spline effect with year added in fixe effect, and grey dotted lines represents SE.
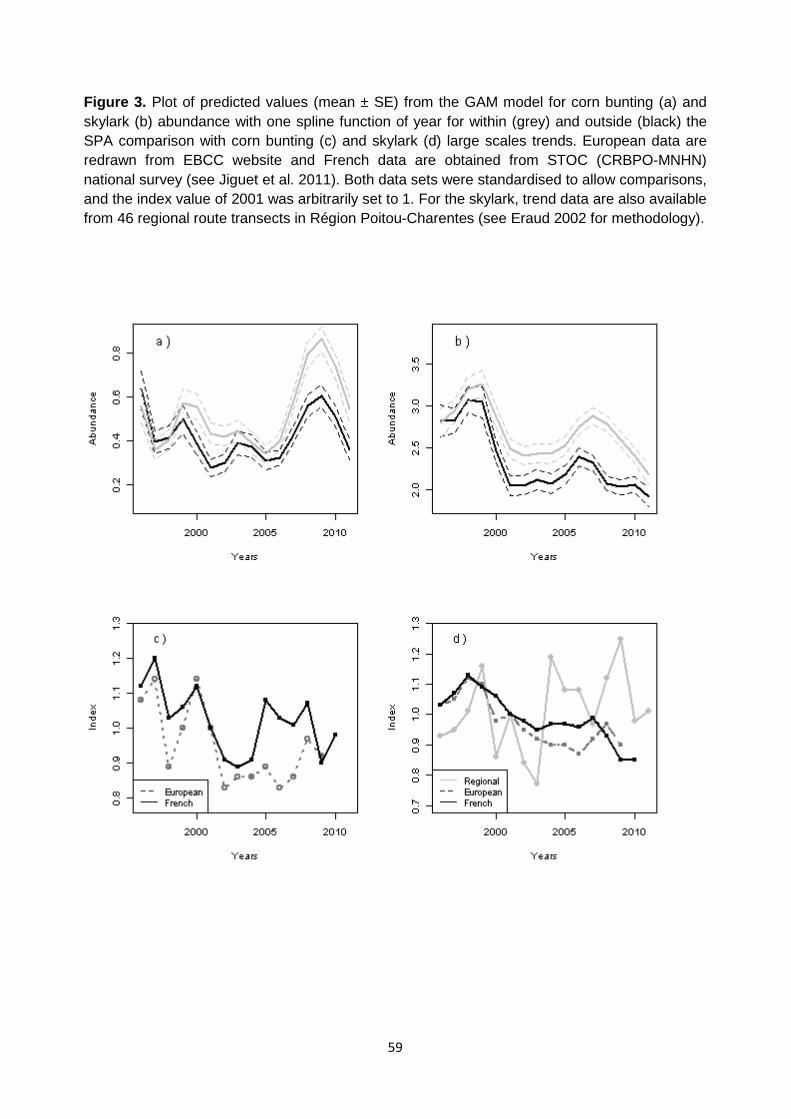
59
Figure 3. Plot of predicted values (mean ± SE) from the GAM model for corn bunting (a) and skylark (b) abundance with one spline function of year for within (grey) and outside (black) the SPA comparison with corn bunting (c) and skylark (d) large scales trends. European data are redrawn from EBCC website and French data are obtained from STOC (CRBPO-MNHN) national survey (see Jiguet et al. 2011). Both data sets were standardised to allow comparisons, and the index value of 2001 was arbitrarily set to 1. For the skylark, trend data are also available from 46 regional route transects in Région Poitou-Charentes (see Eraud 2002 for methodology).
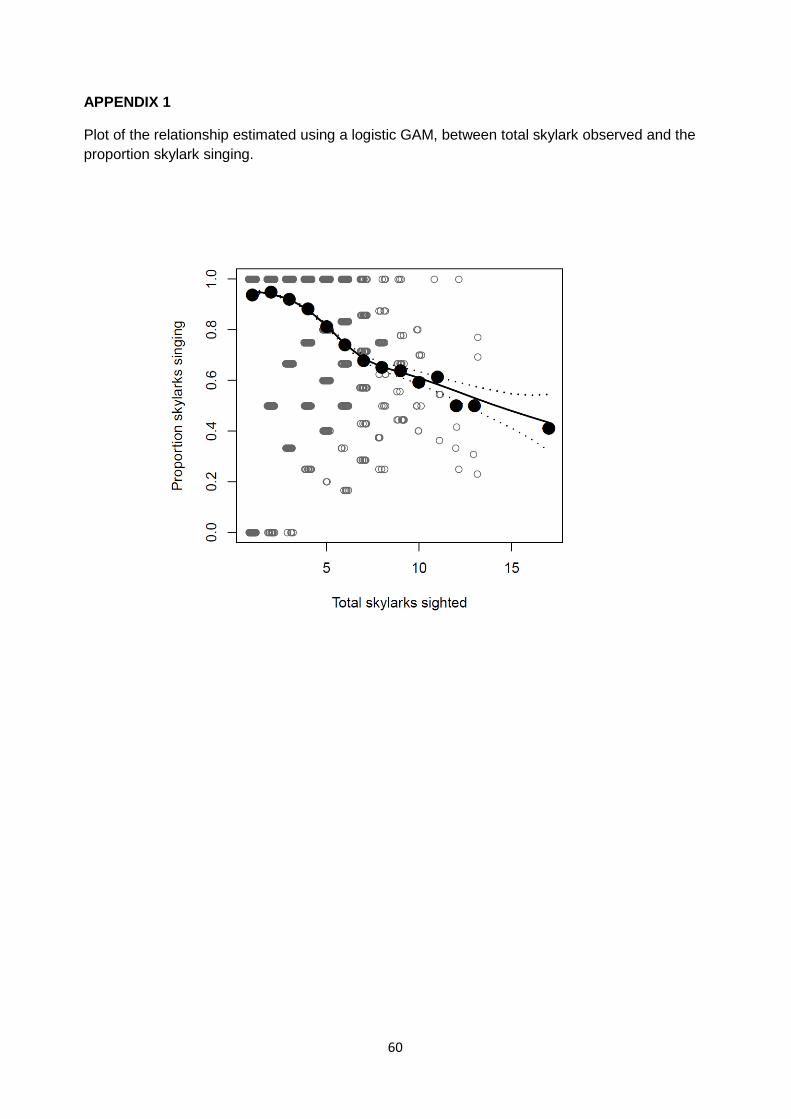
60
APPENDIX 1
Plot of the relationship estimated using a logistic GAM, between total skylark observed and the proportion skylark singing.
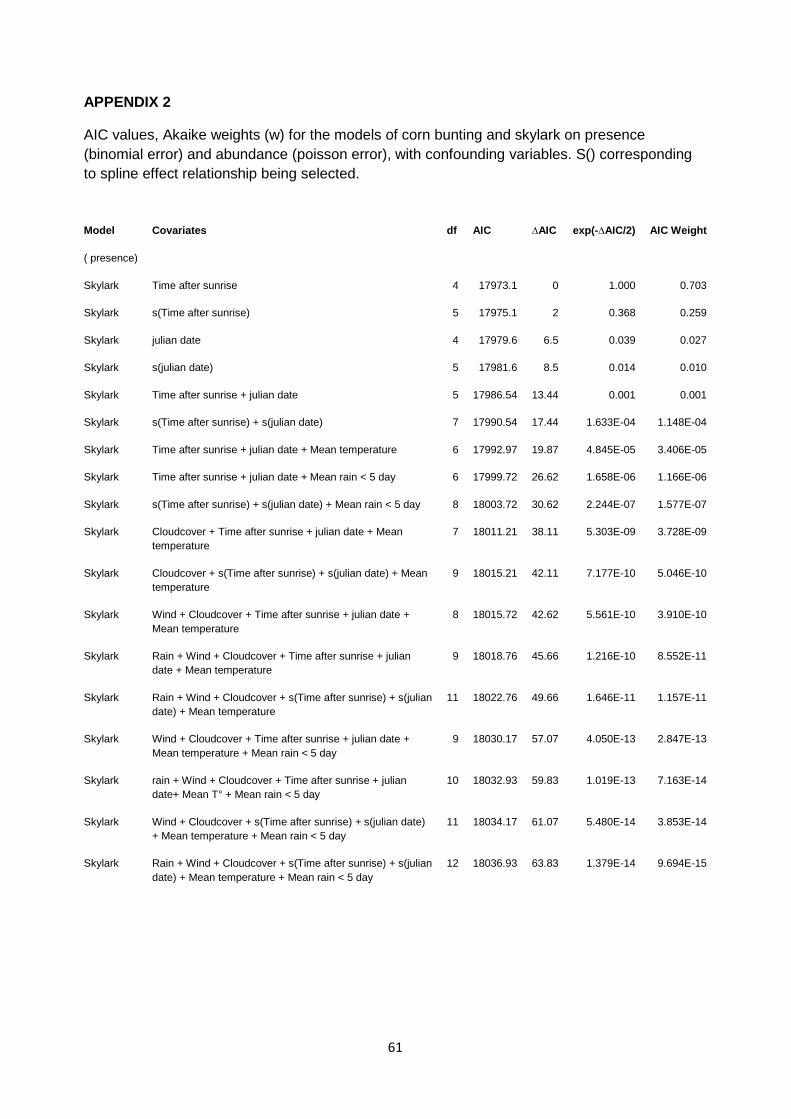
61
APPENDIX 2
AIC values, Akaike weights (w) for the models of corn bunting and skylark on presence (binomial error) and abundance (poisson error), with confounding variables. S() corresponding to spline effect relationship being selected.
Model
( presence)
Covariates df AIC ∆AIC exp(-∆AIC/2) AIC Weight
Skylark Time after sunrise 4 17973.1 0 1.000 0.703
Skylark s(Time after sunrise) 5 17975.1 2 0.368 0.259
Skylark julian date 4 17979.6 6.5 0.039 0.027
Skylark s(julian date) 5 17981.6 8.5 0.014 0.010
Skylark Time after sunrise + julian date 5 17986.54 13.44 0.001 0.001
Skylark s(Time after sunrise) + s(julian date) 7 17990.54 17.44 1.633E-04 1.148E-04
Skylark Time after sunrise + julian date + Mean temperature 6 17992.97 19.87 4.845E-05 3.406E-05
Skylark Time after sunrise + julian date + Mean rain < 5 day 6 17999.72 26.62 1.658E-06 1.166E-06
Skylark s(Time after sunrise) + s(julian date) + Mean rain < 5 day 8 18003.72 30.62 2.244E-07 1.577E-07
Skylark Cloudcover + Time after sunrise + julian date + Mean temperature
7 18011.21 38.11 5.303E-09 3.728E-09
Skylark Cloudcover + s(Time after sunrise) + s(julian date) + Mean temperature
9 18015.21 42.11 7.177E-10 5.046E-10
Skylark Wind + Cloudcover + Time after sunrise + julian date + Mean temperature
8 18015.72 42.62 5.561E-10 3.910E-10
Skylark Rain + Wind + Cloudcover + Time after sunrise + julian date + Mean temperature
9 18018.76 45.66 1.216E-10 8.552E-11
Skylark Rain + Wind + Cloudcover + s(Time after sunrise) + s(julian date) + Mean temperature
11 18022.76 49.66 1.646E-11 1.157E-11
Skylark Wind + Cloudcover + Time after sunrise + julian date + Mean temperature + Mean rain < 5 day
9 18030.17 57.07 4.050E-13 2.847E-13
Skylark rain + Wind + Cloudcover + Time after sunrise + julian date+ Mean T° + Mean rain < 5 day
10 18032.93 59.83 1.019E-13 7.163E-14
Skylark Wind + Cloudcover + s(Time after sunrise) + s(julian date) + Mean temperature + Mean rain < 5 day
11 18034.17 61.07 5.480E-14 3.853E-14
Skylark Rain + Wind + Cloudcover + s(Time after sunrise) + s(julian date) + Mean temperature + Mean rain < 5 day
12 18036.93 63.83 1.379E-14 9.694E-15
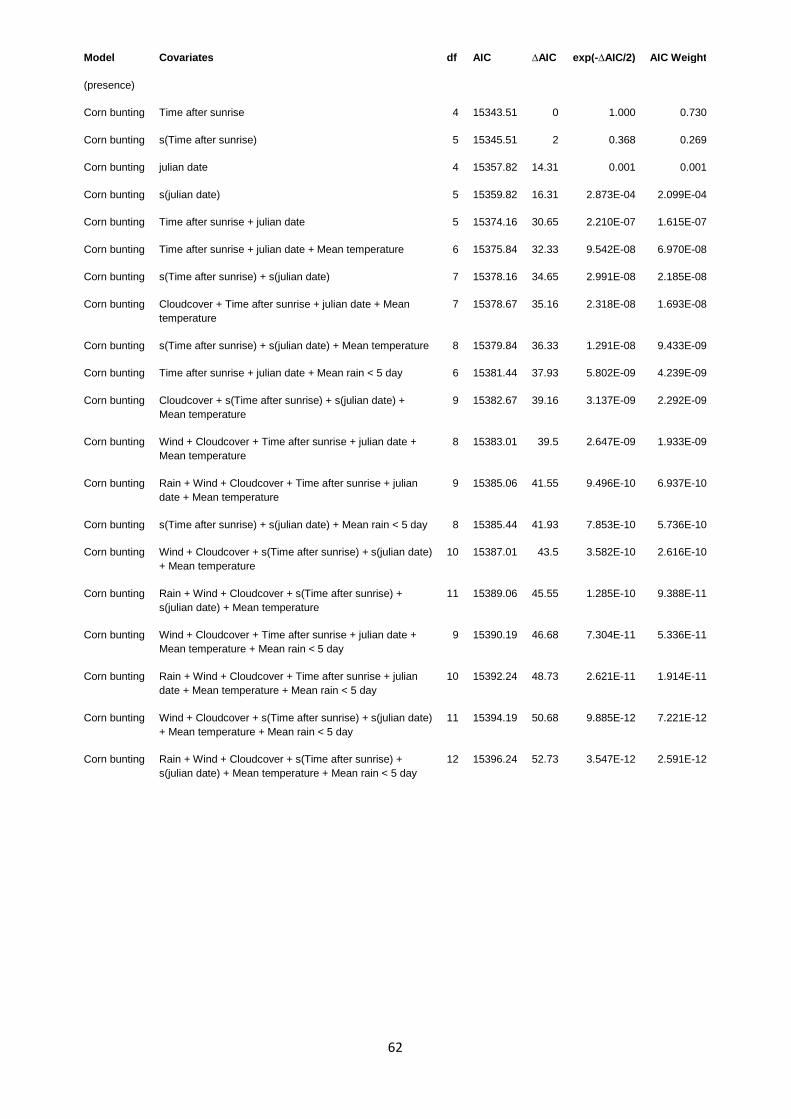
62
Model
(presence)
Covariates df AIC ∆AIC exp(-∆AIC/2) AIC Weight
Corn bunting Time after sunrise 4 15343.51 0 1.000 0.730
Corn bunting s(Time after sunrise) 5 15345.51 2 0.368 0.269
Corn bunting julian date 4 15357.82 14.31 0.001 0.001
Corn bunting s(julian date) 5 15359.82 16.31 2.873E-04 2.099E-04
Corn bunting Time after sunrise + julian date 5 15374.16 30.65 2.210E-07 1.615E-07
Corn bunting Time after sunrise + julian date + Mean temperature 6 15375.84 32.33 9.542E-08 6.970E-08
Corn bunting s(Time after sunrise) + s(julian date) 7 15378.16 34.65 2.991E-08 2.185E-08
Corn bunting Cloudcover + Time after sunrise + julian date + Mean temperature
7 15378.67 35.16 2.318E-08 1.693E-08
Corn bunting s(Time after sunrise) + s(julian date) + Mean temperature 8 15379.84 36.33 1.291E-08 9.433E-09
Corn bunting Time after sunrise + julian date + Mean rain < 5 day 6 15381.44 37.93 5.802E-09 4.239E-09
Corn bunting Cloudcover + s(Time after sunrise) + s(julian date) + Mean temperature
9 15382.67 39.16 3.137E-09 2.292E-09
Corn bunting Wind + Cloudcover + Time after sunrise + julian date + Mean temperature
8 15383.01 39.5 2.647E-09 1.933E-09
Corn bunting Rain + Wind + Cloudcover + Time after sunrise + julian date + Mean temperature
9 15385.06 41.55 9.496E-10 6.937E-10
Corn bunting s(Time after sunrise) + s(julian date) + Mean rain < 5 day 8 15385.44 41.93 7.853E-10 5.736E-10
Corn bunting Wind + Cloudcover + s(Time after sunrise) + s(julian date) + Mean temperature
10 15387.01 43.5 3.582E-10 2.616E-10
Corn bunting Rain + Wind + Cloudcover + s(Time after sunrise) + s(julian date) + Mean temperature
11 15389.06 45.55 1.285E-10 9.388E-11
Corn bunting Wind + Cloudcover + Time after sunrise + julian date + Mean temperature + Mean rain < 5 day
9 15390.19 46.68 7.304E-11 5.336E-11
Corn bunting Rain + Wind + Cloudcover + Time after sunrise + julian date + Mean temperature + Mean rain < 5 day
10 15392.24 48.73 2.621E-11 1.914E-11
Corn bunting Wind + Cloudcover + s(Time after sunrise) + s(julian date) + Mean temperature + Mean rain < 5 day
11 15394.19 50.68 9.885E-12 7.221E-12
Corn bunting Rain + Wind + Cloudcover + s(Time after sunrise) + s(julian date) + Mean temperature + Mean rain < 5 day
12 15396.24 52.73 3.547E-12 2.591E-12
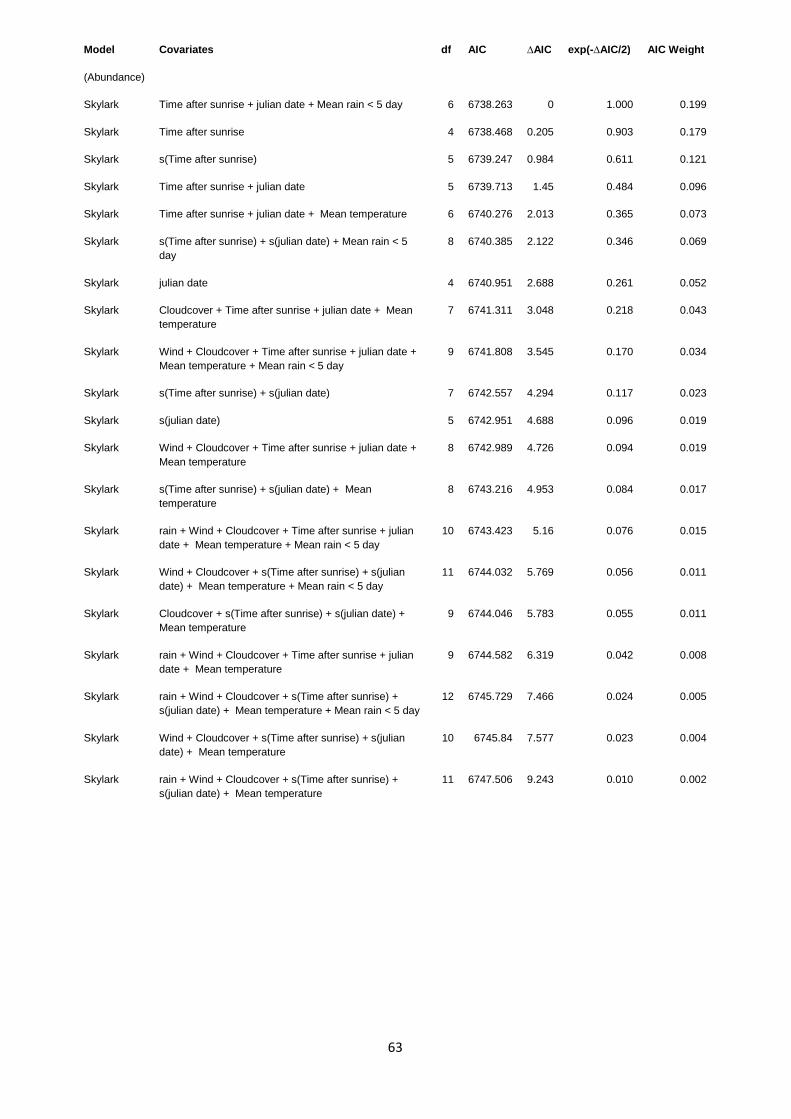
63
Model
(Abundance)
Covariates df AIC ∆AIC exp(-∆AIC/2) AIC Weight
Skylark Time after sunrise + julian date + Mean rain < 5 day 6 6738.263 0 1.000 0.199
Skylark Time after sunrise 4 6738.468 0.205 0.903 0.179
Skylark s(Time after sunrise) 5 6739.247 0.984 0.611 0.121
Skylark Time after sunrise + julian date 5 6739.713 1.45 0.484 0.096
Skylark Time after sunrise + julian date + Mean temperature 6 6740.276 2.013 0.365 0.073
Skylark s(Time after sunrise) + s(julian date) + Mean rain < 5 day
8 6740.385 2.122 0.346 0.069
Skylark julian date 4 6740.951 2.688 0.261 0.052
Skylark Cloudcover + Time after sunrise + julian date + Mean temperature
7 6741.311 3.048 0.218 0.043
Skylark Wind + Cloudcover + Time after sunrise + julian date + Mean temperature + Mean rain < 5 day
9 6741.808 3.545 0.170 0.034
Skylark s(Time after sunrise) + s(julian date) 7 6742.557 4.294 0.117 0.023
Skylark s(julian date) 5 6742.951 4.688 0.096 0.019
Skylark Wind + Cloudcover + Time after sunrise + julian date + Mean temperature
8 6742.989 4.726 0.094 0.019
Skylark s(Time after sunrise) + s(julian date) + Mean temperature
8 6743.216 4.953 0.084 0.017
Skylark rain + Wind + Cloudcover + Time after sunrise + julian date + Mean temperature + Mean rain < 5 day
10 6743.423 5.16 0.076 0.015
Skylark Wind + Cloudcover + s(Time after sunrise) + s(julian date) + Mean temperature + Mean rain < 5 day
11 6744.032 5.769 0.056 0.011
Skylark Cloudcover + s(Time after sunrise) + s(julian date) + Mean temperature
9 6744.046 5.783 0.055 0.011
Skylark rain + Wind + Cloudcover + Time after sunrise + julian date + Mean temperature
9 6744.582 6.319 0.042 0.008
Skylark rain + Wind + Cloudcover + s(Time after sunrise) + s(julian date) + Mean temperature + Mean rain < 5 day
12 6745.729 7.466 0.024 0.005
Skylark Wind + Cloudcover + s(Time after sunrise) + s(julian date) + Mean temperature
10 6745.84 7.577 0.023 0.004
Skylark rain + Wind + Cloudcover + s(Time after sunrise) + s(julian date) + Mean temperature
11 6747.506 9.243 0.010 0.002
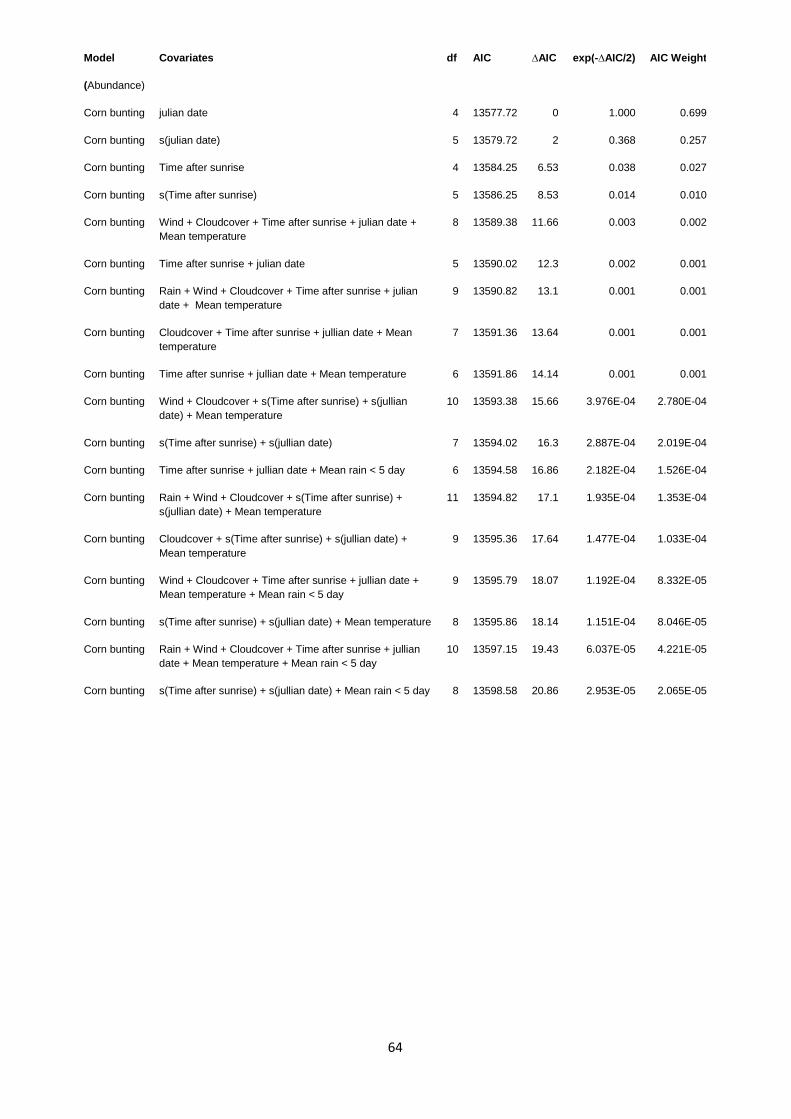
64
Model
(Abundance)
Covariates df AIC ∆AIC exp(-∆AIC/2) AIC Weight
Corn bunting julian date 4 13577.72 0 1.000 0.699
Corn bunting s(julian date) 5 13579.72 2 0.368 0.257
Corn bunting Time after sunrise 4 13584.25 6.53 0.038 0.027
Corn bunting s(Time after sunrise) 5 13586.25 8.53 0.014 0.010
Corn bunting Wind + Cloudcover + Time after sunrise + julian date + Mean temperature
8 13589.38 11.66 0.003 0.002
Corn bunting Time after sunrise + julian date 5 13590.02 12.3 0.002 0.001
Corn bunting Rain + Wind + Cloudcover + Time after sunrise + julian date + Mean temperature
9 13590.82 13.1 0.001 0.001
Corn bunting Cloudcover + Time after sunrise + jullian date + Mean temperature
7 13591.36 13.64 0.001 0.001
Corn bunting Time after sunrise + jullian date + Mean temperature 6 13591.86 14.14 0.001 0.001
Corn bunting Wind + Cloudcover + s(Time after sunrise) + s(jullian date) + Mean temperature
10 13593.38 15.66 3.976E-04 2.780E-04
Corn bunting s(Time after sunrise) + s(jullian date) 7 13594.02 16.3 2.887E-04 2.019E-04
Corn bunting Time after sunrise + jullian date + Mean rain < 5 day 6 13594.58 16.86 2.182E-04 1.526E-04
Corn bunting Rain + Wind + Cloudcover + s(Time after sunrise) + s(jullian date) + Mean temperature
11 13594.82 17.1 1.935E-04 1.353E-04
Corn bunting Cloudcover + s(Time after sunrise) + s(jullian date) + Mean temperature
9 13595.36 17.64 1.477E-04 1.033E-04
Corn bunting Wind + Cloudcover + Time after sunrise + jullian date + Mean temperature + Mean rain < 5 day
9 13595.79 18.07 1.192E-04 8.332E-05
Corn bunting s(Time after sunrise) + s(jullian date) + Mean temperature 8 13595.86 18.14 1.151E-04 8.046E-05
Corn bunting Rain + Wind + Cloudcover + Time after sunrise + jullian date + Mean temperature + Mean rain < 5 day
10 13597.15 19.43 6.037E-05 4.221E-05
Corn bunting s(Time after sunrise) + s(jullian date) + Mean rain < 5 day 8 13598.58 20.86 2.953E-05 2.065E-05
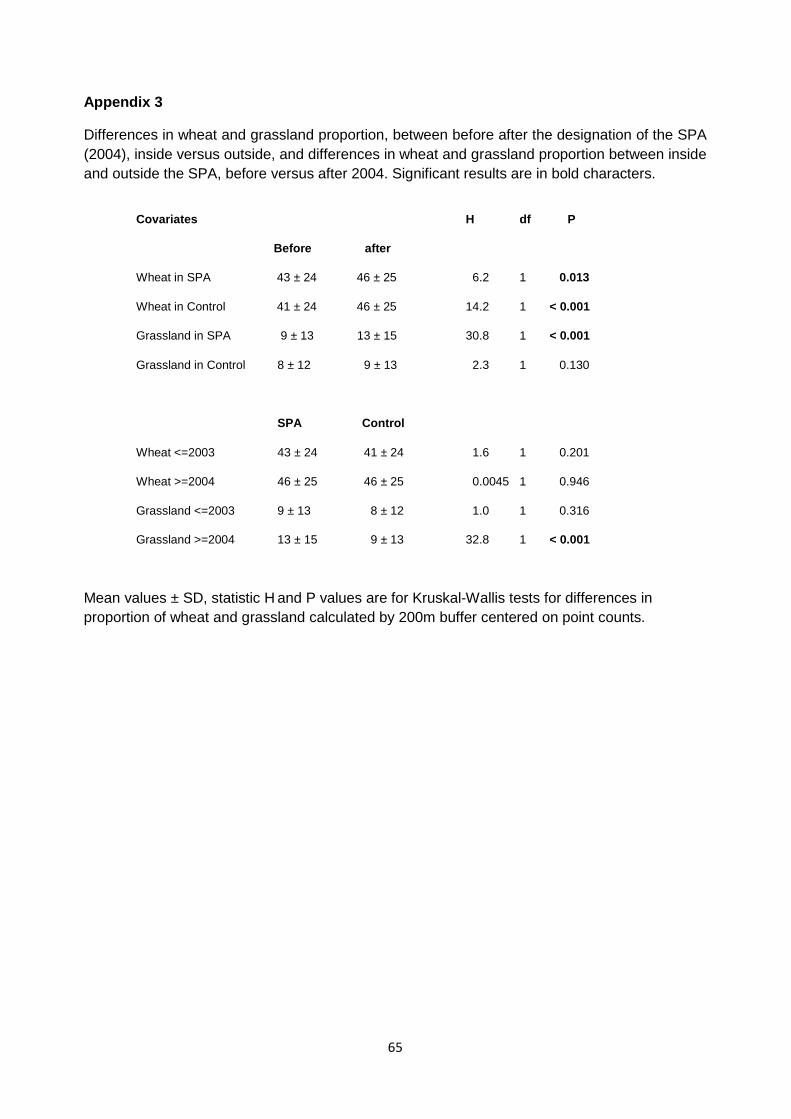
65
Appendix 3
Differences in wheat and grassland proportion, between before after the designation of the SPA (2004), inside versus outside, and differences in wheat and grassland proportion between inside and outside the SPA, before versus after 2004. Significant results are in bold characters.
Mean values ± SD, statistic H and P values are for Kruskal-Wallis tests for differences in proportion of wheat and grassland calculated by 200m buffer centered on point counts.
Covariates H df P
Before after
Wheat in SPA 43 ± 24 46 ± 25 6.2 1 0.013
Wheat in Control 41 ± 24 46 ± 25 14.2 1 < 0.001
Grassland in SPA 9 ± 13 13 ± 15 30.8 1 < 0.001
Grassland in Control 8 ± 12 9 ± 13 2.3 1 0.130
SPA Control
Wheat <=2003 43 ± 24 41 ± 24 1.6 1 0.201
Wheat >=2004 46 ± 25 46 ± 25 0.0045 1 0.946
Grassland <=2003 9 ± 13 8 ± 12 1.0 1 0.316
Grassland >=2004 13 ± 15 9 ± 13 32.8 1 < 0.001
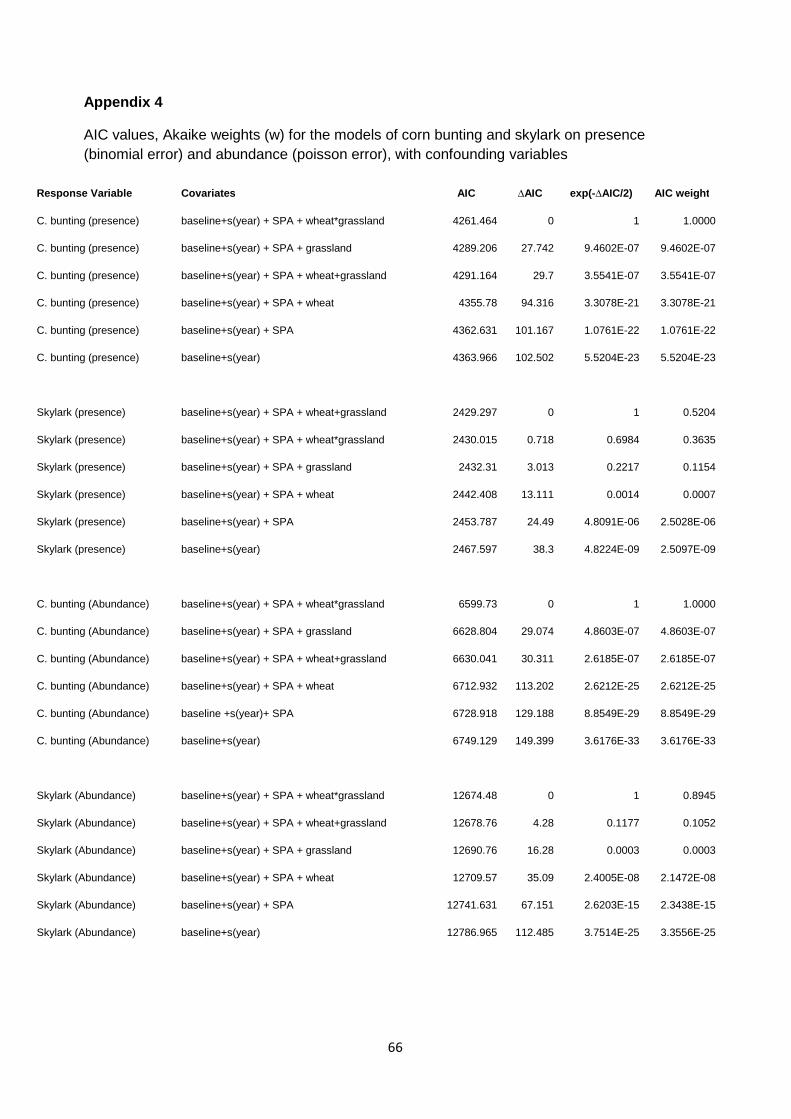
66
Appendix 4
AIC values, Akaike weights (w) for the models of corn bunting and skylark on presence (binomial error) and abundance (poisson error), with confounding variables
Response Variable Covariates AIC ∆AIC exp(-∆AIC/2) AIC weight
C. bunting (presence) baseline+s(year) + SPA + wheat*grassland 4261.464 0 1 1.0000
C. bunting (presence) baseline+s(year) + SPA + grassland 4289.206 27.742 9.4602E-07 9.4602E-07
C. bunting (presence) baseline+s(year) + SPA + wheat+grassland 4291.164 29.7 3.5541E-07 3.5541E-07
C. bunting (presence) baseline+s(year) + SPA + wheat 4355.78 94.316 3.3078E-21 3.3078E-21
C. bunting (presence) baseline+s(year) + SPA 4362.631 101.167 1.0761E-22 1.0761E-22
C. bunting (presence) baseline+s(year) 4363.966 102.502 5.5204E-23 5.5204E-23
Skylark (presence) baseline+s(year) + SPA + wheat+grassland 2429.297 0 1 0.5204
Skylark (presence) baseline+s(year) + SPA + wheat*grassland 2430.015 0.718 0.6984 0.3635
Skylark (presence) baseline+s(year) + SPA + grassland 2432.31 3.013 0.2217 0.1154
Skylark (presence) baseline+s(year) + SPA + wheat 2442.408 13.111 0.0014 0.0007
Skylark (presence) baseline+s(year) + SPA 2453.787 24.49 4.8091E-06 2.5028E-06
Skylark (presence) baseline+s(year) 2467.597 38.3 4.8224E-09 2.5097E-09
C. bunting (Abundance) baseline+s(year) + SPA + wheat*grassland 6599.73 0 1 1.0000
C. bunting (Abundance) baseline+s(year) + SPA + grassland 6628.804 29.074 4.8603E-07 4.8603E-07
C. bunting (Abundance) baseline+s(year) + SPA + wheat+grassland 6630.041 30.311 2.6185E-07 2.6185E-07
C. bunting (Abundance) baseline+s(year) + SPA + wheat 6712.932 113.202 2.6212E-25 2.6212E-25
C. bunting (Abundance) baseline +s(year)+ SPA 6728.918 129.188 8.8549E-29 8.8549E-29
C. bunting (Abundance) baseline+s(year) 6749.129 149.399 3.6176E-33 3.6176E-33
Skylark (Abundance) baseline+s(year) + SPA + wheat*grassland 12674.48 0 1 0.8945
Skylark (Abundance) baseline+s(year) + SPA + wheat+grassland 12678.76 4.28 0.1177 0.1052
Skylark (Abundance) baseline+s(year) + SPA + grassland 12690.76 16.28 0.0003 0.0003
Skylark (Abundance) baseline+s(year) + SPA + wheat 12709.57 35.09 2.4005E-08 2.1472E-08
Skylark (Abundance) baseline+s(year) + SPA 12741.631 67.151 2.6203E-15 2.3438E-15
Skylark (Abundance) baseline+s(year) 12786.965 112.485 3.7514E-25 3.3556E-25
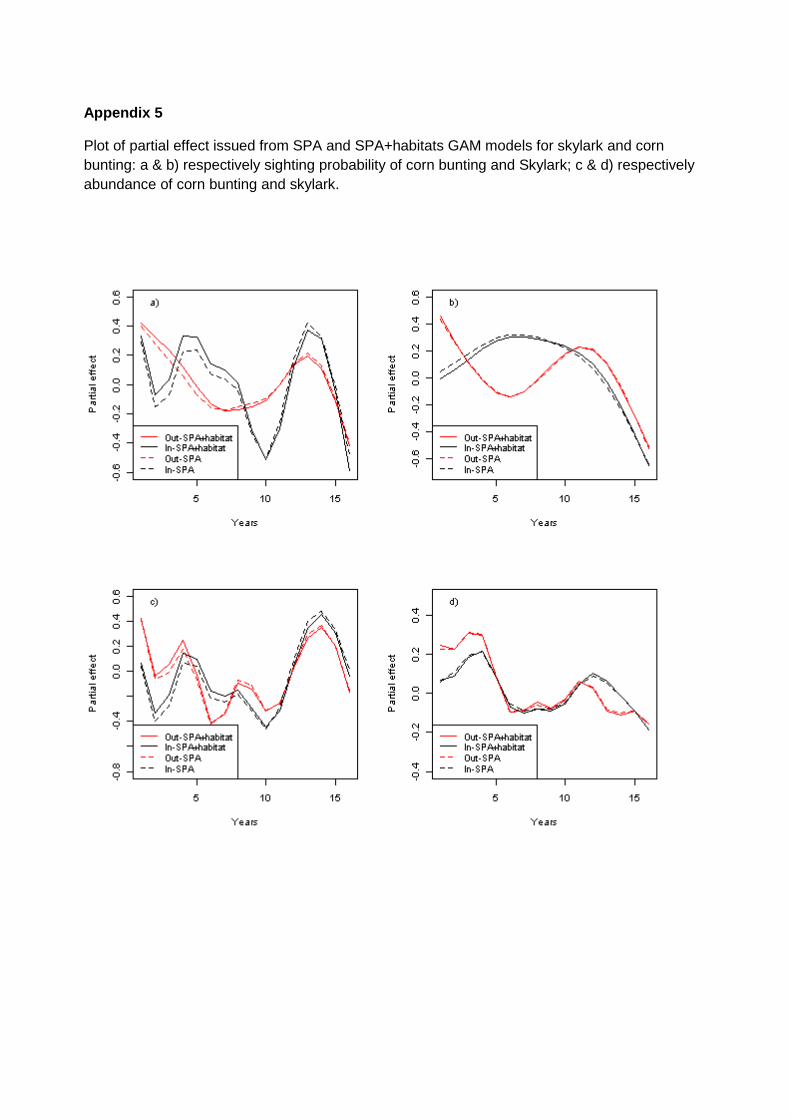
Appendix 5
Plot of partial effect issued from SPA and SPA+habitats GAM models for skylark and corn bunting: a & b) respectively sighting probability of corn bunting and Skylark; c & d) respectively abundance of corn bunting and skylark.
68
Chapitre III
A functional approach to quantify the spatio-
temporal and multi-scale effects of agri-
environment schemes on individual species: a case
study with the corn bunting in central western
France.
Utilisation d’une approche fonctionnelle afin de
quantifier les effets spatio-temporelles et multi-
échelles des Mesures Agro-Environnementale sur
une espèce : étude de cas avec le Bruant proyer
dans le centre Ouest de la France
Target journal: Journal of Applied Ecology Title : A functional approach to quantify the spatio-temporal and multi-scale effects of agri-environment schemes on individual species: a case study with the corn bunting in central western France. Running Head : AES effects on corn bunting Manuscript type: Article Authors : Steve Augiron1*, Luca Börger1, 2 §, Salomon Brodier1,3° & Vincent Bretagnolle1 ‡ Affiliations :
1 Centre d’Etudes Biologiques de Chize, CNRS, 79360 Beauvoir-sur-Niort, France
2 INRA (USC 1339), CEBC-CNRS, 79360 Beauvoir sur Niort, France
3 Centre Ornithologique Lorrain, 5 rue de Nancy, 54690 Lay-Saint-Christophe, France e-mail addresses: *[email protected]; §[email protected]; °[email protected]; ‡[email protected] Electronic appendices : Appendix1: Supplementary tables and figures Corresponding author : Steve Augiron Centre d’Etudes Biologiques de Chize CNRS Villiers-en-bois 79360 Beauvoir-sur-Niort, France Phone: + 33 549 093551 Fax: + 33 549 096526 E-mail: [email protected]
70
Abstract 1. Maximizing the effectiveness for biodiversity of agri-environment schemes (AES) is a key
policy challenge. Understanding the specific processes through which different schemes act,
also on non-target species, is essential to improve existing schemes and to transfer policies to
different areas.
2. We quantified fine scale spatial variation in breeding abundance of a severely declining
farmland bird, the corn bunting Miliaria calandra, over two years in response to AES
schemes targeted towards other taxa or ecosystem functions in an agricultural landscape in
France.
3. After controlling for the influence of habitat relationships, we assessed if intrinsic condition
of the site (Historical Stability of grassland and the presence of Special Protection Area) can
modulate the abundance. We highlight with the best model the importance of the Historical
Stability Index, with a strong effect of the land use regime in the five years previous to the
counts (higher abundances in areas dominated by perennial cultures). At both scale, Natura
2000, Special Protection Area was not selected.
4. Using a new functional approach to AES, and controlling for the influence of intrinsic
condition, we found a very strong support for an effect of AES actions on corn bunting
abundance. The results highlighted the presence of strong interactions between different
AES and also the scale and time dependency of the effects (years since implementation).
The AES-food resources and the AES-organic had an effect at both spatial scales of
analysis (200m & 400m buffers around point count locations), with the former strongly
modulating the effect of the latter, as well as the effects of the AES-habitat grassland.
Moreover we highlight positive interaction between large and old crop in alfalfa with AES–
safe nesting (i.e delaying mowing application).
6. Synthesis and applications. To increase the efficiency of AES, interactions between the effects of different AES co-
occurring in the same area need to be taken into account, considering also the complex effects
of time and spatial scale dependency as well as previous historical stability of grassland for
each targeted field. Using a functional approach to investigate AES effects on a specific
species, combined with fine-scale land use data, allows obtaining this knowledge.
Key-words : farmland bird, agriculture, AES, Historical Stability Index, SPA, temporal, spatial
71
INTRODUCTION Agricultural landscapes nowadays constitute a major part of terrestrial environments (Ellis et al.
2010; Sanderson et al. 2002; McNeill 2000). In the past decades these landscapes have been
profoundly modified by the intensification of agricultural practices, with strong negative
consequences for biodiversity (Norris 2008; Benton et al. 2003; Robinson & Sutherland, 2002;
Stoate et al. 2001; Donald, Green et Heath, 2001, Geiger et al. 2010). To mitigate the negative
impact of intensive agricultural production systems, agri-environment schemes (AES) were
introduced by European policy since the late 1980’s in order to encourage farmers to adopt
environmentally friendly practices, notably through the implementation and preservation of
natural and semi-natural grasslands and the extensification of production systems (Kleijn et
Sutherland 2003; Whittingham 2007), with similar policy measures implemented in the United
States under the Environmental Quality Incentives Program (Herzog 2005).
The efficacy of AES is, however, controversial, as the effects (when they exist) are often taxon
specific (Kleijn & Sutherland 2003, Bengtsson et al. 2005; Hole et al. 2005; Kleijn et al. 2006).
In addition, they may be modulated by the spatial context, such as landscape structure,
composition and scale (Tcharntke al. 2005, Concepcio’n et al. 2008, Batary et al. 2010,
Fuentes-Montemayor et al. 2011). For instance, organic farming is often promoted as an
efficient approach to enhance biodiversity (Hole et al.2005; Bengston et al. 2005; Gabriel &
Tscharntke 2007; Rundlöf et al. 2008; Gabriel et al. 2009, 2010; Jonason et al. 2011), but its
effectiveness may be strongly dependent on the landscape context (Winqvist et al. 2011). AES
efficiency may also vary over time, for example depending on the period of application of
schemes (Fliessbach et al. 2007; Siriwardena, 2010; Jonason et al. 2011) although in general
temporal aspects of AES efficiency have not been well investigated, especially with regard to
the dependence on the previous land use of a given field. Also, many schemes lack a robust
monitoring framework to assess their effectiveness (Kleijn & Sutherland 2003; Memmott et al.
2010). These limitations are particularly unfortunate, since they compromise a careful
evaluation, under a cost-benefit analysis framework, of the relative effects on biodiversity of
spatial versus temporal context dependence of AES. For example, should we add additional
areas with AES, or increase duration of existing measures, for an identical amount of money?
Similar questions have traditionally been studied regarding nature reserve selection but not yet
in a farmland context in which AES fields may be considered as temporary limited and spatially
confined reserves.
Thus, evaluating AES is methodologically difficult (Herzog 2005), but urgently needed to
increase their efficiency, to assess in second step the transferability to other areas
(Whittingham 2007). To do so it will be necessary to identify the most important fine-scale
mechanisms driving large-scale trends at the population level, but this is complicated by the
72
vast amount of different existing AES policy measures (Kleijn & Sutherland 2003, Herzog
2005), each one often addressing several objectives and applied together with multiple other
AES in the same landscape. Here, we propose a new simple approach to assess the efficacy of
AES and identify the likely underlying mechanisms for a given species, including both spatial
and temporal aspects. It is an implementation of the suggestion of Herzog (2005) that the
application of AES is best seen as landscape experiments, where the experimental treatments
consist in the introduction of new biotopes and the modification of energy flows and agricultural
inputs. The key to implement this idea and be able to assess the effects of different AES
schemes for a given species of interest is to use a functional approach, whereby different AES
management actions are functionally classified according to the biology and life-history of the
species. This allows to derive a suite of a priori models of the likely mechanisms of species
responses to a given AES. An information-theoretic multi-model selection framework (Burnham
& Andersson 2002 & 2004) can then be used to quantify the support from monitoring data for
the different hypotheses.
We applied the approach to a rather unique study area in France where the land use of every
single field has been monitored twice every year over a large area since 1995 (c.430 km2 with
around 19000 fields), and where 12 different AES types are currently managed for a total of
more than 7,000 hectares (i.e. around 6% of the total area). As case study we focus on
variation in the relative abundance of corn buntings Miliaria calandra a farmland specialist bird
in severe decline throughout Europe (Wilson et al. 2009; PECBMS 2010), in response to a suite
of different AES targeted towards other species or ecosystem services. Perkins et al. (2011)
showed that Corn buntings in Scotland increased on farms with targeted AES, remained stable
on farms with non-target AES but declined on farms with no AES. However, the authors
suggested that while AES management aimed to increase food availability for corn buntings, in
farms dominated by grasslands positive effects were mainly due to an additional AES option
that delayed mowing. Hence a specific aim of our study is to use our approach, combined with
detailed fine-scale data, to identify the mechanism through which AES schemes act on corn
bunting abundance in an intensive agro-ecosystem and assess the degree of spatial and
temporal context dependence over multiple scales.
MATERIALS AND METHODS
Study area and Agri-Environment Schemes
The study site (c.430 km2) is part of a long-term ecological research area
(www.zaplainevaldesevre.fr) located in central western France, in the south of the Deux-
Sèvres district in the Poitou-Charentes region (46.23°N, 0.41 W; Fig. 1). It is an agricultural
landscape mainly dedicated to intensive cereal production (44% cereals, 14% meadows and
alfalfa grasslands, 4% of woods and villages in 2010) with an average field size of 4-5 ha.
73
Around half of the study area (48.5%) encompasses a Special Protection Area, part of the
European Natura 2000 network, designated in 2004 due to the presence of several species of
conservation concern included in Annex 1 of the 1979 EU Birds Directive. All land use has
been recorded for each of the c. 19000 fields twice per year since 1995 (April and June – in
order to record both early-harvested and late-sowed crops) and mapped onto a GIS
geodatabase. In total 47 land-use categories, comprising 42 agricultural, three urban, and two
forest use categories, where digitized on vector maps, updating field limits when necessary,
using Arc Map version 9.3 in ArcGIS 9.3 (ESRI, Redlands, California). Agro-Environment
Schemes (AES) have been implemented since 2004 by a single operator in charge, the CNRS
research lab of Chizé (Bretagnolle et al. 2010, 2011), and the exact location and extent has
been recorded in a GIS geodatabase as for the land-use (Fig. 1). Overall 12 different AES
management action types have been implemented, with different aims. Some AES targeted
specifically the Little Bustard (Tetrax tetrax Linnaeus, 1758), a highly threatened steppe bird,
while others were more generic (e.g., organic faming or water protection, see Table 1).
The corn bunting (Miliaria calandra), our study model, is a sedentary, territorial European
farmland bird (Cramp & Perrins 1994). It breeds up to two times per year between May and
July, building the nest on the ground, generally in cereal fields or grasslands (Brickle et al.
2000). In our study site, it is strongly suspected that most nests are located in grasslands,
especially second clutch nests, since winter cereals are harvested in late June-early July and
spring cereals are mostly absent (c. 1% of total area). However, alfalfa and mown grass fields
are subjected to frequent mowing (starting in the first decade of May, and up to four cuts until
Autumn; Badenhausser et al. 2008), and thus may constitute ecological traps leading to high
nest-loss (see e.g. Wilson et al. 2007). Adults feed on seeds (weeds and cereals), but require
insects to feed the chicks during the breeding season. Based on the biology of our study
species, we classified the AES schemes into four functional groups based on corn bunting
biology and ecological requirements (see Table 1).
1. “Food resources” – A group of four schemes primarily aimed at improving water quality in
intensive arable land. The schemes request a progressive reduction of herbicide application by
c.50% in 3 years, or limitation of fertilization to 120 UN/ha for 50% of the cultivations of each
farmer, or both herbicide and fertilization reduction, or “no- tillage”, i.e. limiting the depth of
ploughing to 10 cm, combined with direct surface sowing, in order to avoid soil destruction.
While these schemes are clearly non-targeted actions, they indirectly increase food resources
for farmland birds in general by increasing availability of weeds and soil invertebrates
(Hollande, 2004). They apply both on arable crops and grasslands, but are mainly found on
arable land (about 90% in 2009 and 2010, with respectively 56% and 69% of cereals crops).
2. “Organic farming” – Two schemes subsidizing the conversion to organic production or the
maintenance of organic production, resulting in direct improvement of food resources in those
74
fields. The quality of habitats is enhanced by the prohibition of chemical inputs (pesticides,
herbicides, and mineral fertilizers) and limitation of organic fertilization to 120 UN/ha/year. The
two schemes differ only by the time lag: a production can be designated as organic only five
years after having started to adopt organic production methods and thus the AES action
‘maintain organic’ can only start to be applied five years after the ‘conversion to organic’ one.
3. “Habitat grassland” – Here we combined three general purpose schemes, which aim to
enhance biodiversity through the creation and consolidation of a grassland network in arable
landscapes. Two schemes subsidized the conversion of arable lands to grassland or alfalfa
fields; another, the maintenance of perennial crops. The schemes included a limitation of
fertilization to 60 uN, 90 uP, 160 uK/ha/year, respectively.
4. “Safe nesting” – Three schemes are involved here, with delayed mowing actions. These
schemes concerned alfalfa or grass/legume mix, with no mowing from 15th May to 31th July or
31st August, and are furthermore associated with herbicide and fertilizer prohibition. Given corn
bunting life-history and breeding ecology, as well as the results of Perkins et al. (2011), we
predicted that these four groups of AES actions should have increasing effect on population
abundance, from a low effect of the ‘Increased food resources’ to a strong effect of the ‘safe
nesting’ and ‘organic farming’ measures.
We quantified the effects of spatial context dependence by including the effects of local habitat
structure on corn bunting abundance, as well as testing for differences between areas within
and outside the Natura2000 Special Protection Area (Brodier et al. submitted). Using a cross-
sectional design (space-for-time substitution) we also evaluated the influence of temporal
context dependence, by quantifying variation in response to AES over time, as well as the
influence of historical stability of grassland fields.
Monitoring corn bunting abundance
Point count data were collected by experienced bird watchers (13 different observers) using a
grid of 355 points distributed over the entire study area, with a mean distance between
neighbouring points of 750m (sd=200 m). Each point was sampled twice during each breeding
season: mean sampling dates were 30 April (sd=7 days) and 9 June (sd=14 days) in 2009 and 5
May (sd= 6 days) and 12 June (sd=6 days) in 2010. A total of 1420 records were obtained, from
which we excluded 60 records without associated information on historical stability of grassland
fields (see below the historical stability index). Counts were performed in the morning (mean
2.7h after sunrise) using standardized protocols, with all birds and their behaviour (singing,
flying, foraging) recorded inside a radius of 200 meters during 5 minutes (Bibby et al. 2002).
Weather conditions (rainfall, wind strength, cloud cover) were also reported and point counts
were conducted only with acceptable weather conditions, defined as no rain, no thick fog, wind
<5 on the Beaufort scale.
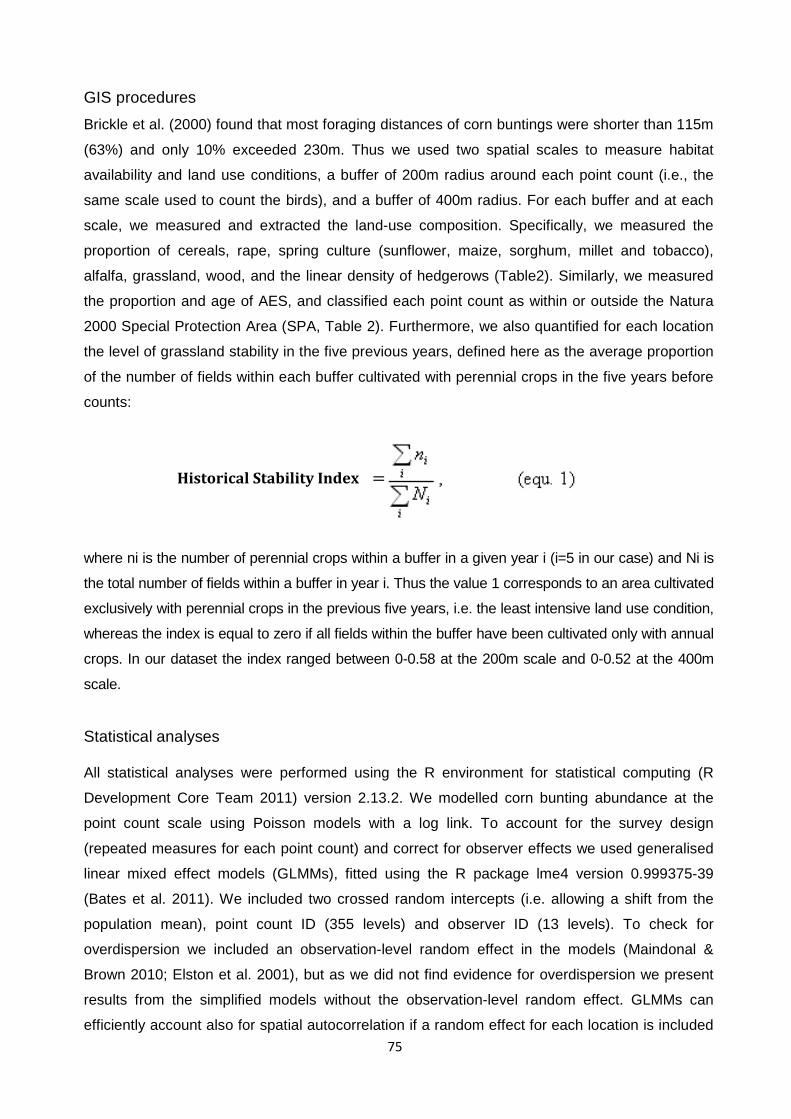
75
GIS procedures
Brickle et al. (2000) found that most foraging distances of corn buntings were shorter than 115m
(63%) and only 10% exceeded 230m. Thus we used two spatial scales to measure habitat
availability and land use conditions, a buffer of 200m radius around each point count (i.e., the
same scale used to count the birds), and a buffer of 400m radius. For each buffer and at each
scale, we measured and extracted the land-use composition. Specifically, we measured the
proportion of cereals, rape, spring culture (sunflower, maize, sorghum, millet and tobacco),
alfalfa, grassland, wood, and the linear density of hedgerows (Table2). Similarly, we measured
the proportion and age of AES, and classified each point count as within or outside the Natura
2000 Special Protection Area (SPA, Table 2). Furthermore, we also quantified for each location
the level of grassland stability in the five previous years, defined here as the average proportion
of the number of fields within each buffer cultivated with perennial crops in the five years before
counts:
where ni is the number of perennial crops within a buffer in a given year i (i=5 in our case) and Ni is
the total number of fields within a buffer in year i. Thus the value 1 corresponds to an area cultivated
exclusively with perennial crops in the previous five years, i.e. the least intensive land use condition,
whereas the index is equal to zero if all fields within the buffer have been cultivated only with annual
crops. In our dataset the index ranged between 0-0.58 at the 200m scale and 0-0.52 at the 400m
scale.
Statistical analyses All statistical analyses were performed using the R environment for statistical computing (R
Development Core Team 2011) version 2.13.2. We modelled corn bunting abundance at the
point count scale using Poisson models with a log link. To account for the survey design
(repeated measures for each point count) and correct for observer effects we used generalised
linear mixed effect models (GLMMs), fitted using the R package lme4 version 0.999375-39
(Bates et al. 2011). We included two crossed random intercepts (i.e. allowing a shift from the
population mean), point count ID (355 levels) and observer ID (13 levels). To check for
overdispersion we included an observation-level random effect in the models (Maindonal &
Brown 2010; Elston et al. 2001), but as we did not find evidence for overdispersion we present
results from the simplified models without the observation-level random effect. GLMMs can
efficiently account also for spatial autocorrelation if a random effect for each location is included
Historical Stability Index
76
(Betts et al. 2009), i.e. the point counts in our case. To check this we plotted model residuals
using variograms in the geoR library version 1.6-29 (Ribeiro Jr and Diggle 2001) and confirmed
the absence of residual spatial autocorrelation (not shown). To aid model convergence and the
interpretation of effect sizes and parameter estimates we mean-centred and standardized all
numerical covariates; specifically, to facilitate comparison between numerical covariates and
factors, we standardized the numeric covariates by dividing by two standard deviations (Gelman
2008, Schielzeth 2010).
We repeated all analyses at both spatial scales (200m and 400m buffer). We devised five a
priori competing models of increasing complexity: the baseline model, the habitat model, the
temporal stability model, the conservation-area model, and the AES model, with all models
containing the same random-effects structure, accounting for the survey design.
We used an information-theoretic multi-model selection framework to evaluate the support from
the data for the competing models; specifically, we utilized the second-order Akaike Information
Criterion (AICc, Burnham and Andersson 2002 & 2004) within the MuMIn library in R (version
1.6.5., Barton 2011). The competing models of corn bunting abundance are:
(i) The baseline model, based on the hypothesis that all observed variation in number of corn
buntings is accounted for by observer effects, site-specific drivers accounted for by the point
count ID random effect (but not related to any of the land use covariates), differences between
the two years (included as 2-level fixed effects dummy factor when supported by a reduction in
AICc) and seasonal and daily variation (both fitted as linear covariates, the former quantified as
‘Day of the year’, the latter as hours since sunrise; we found no support for including also a
quadratic term, and neither for interactions). We also checked for effects of weather conditions
(wind and cloud cover fitted as linear covariates) on the number of corn bunting heard or seen,
but found no support for their inclusion.
(ii) The habitat model hypothesizes that the number of corn buntings varies also depending on
the availability of certain habitat types. It includes all covariates of the baseline model, plus a
combination of habitat covariates: proportion of crop types and land cover types and the density
of hedgerows within each point count buffer. We fitted the habitat covariates as linear and
quadratic covariates (the latter to test for a non-linear functional response), limiting interaction
depth to two-way interactions to avoid overly complex models, and selected the most
appropriate set of habitat covariates by minimising the AICc value.
(iii) In the temporal stability model we evaluated the support for the hypothesis that differences
in land use in the five years previous to the point count, additionally affect corn bunting
abundance, directly or through a modification of the response to AES. To build this model we
added the historical stability index (equ. 1) covariate to the habitat model, and selecting the
most appropriate model complexity by minimising the AICc criterion.
(iv) With the conservation-area model we evaluated support for the hypothesis that corn bunting
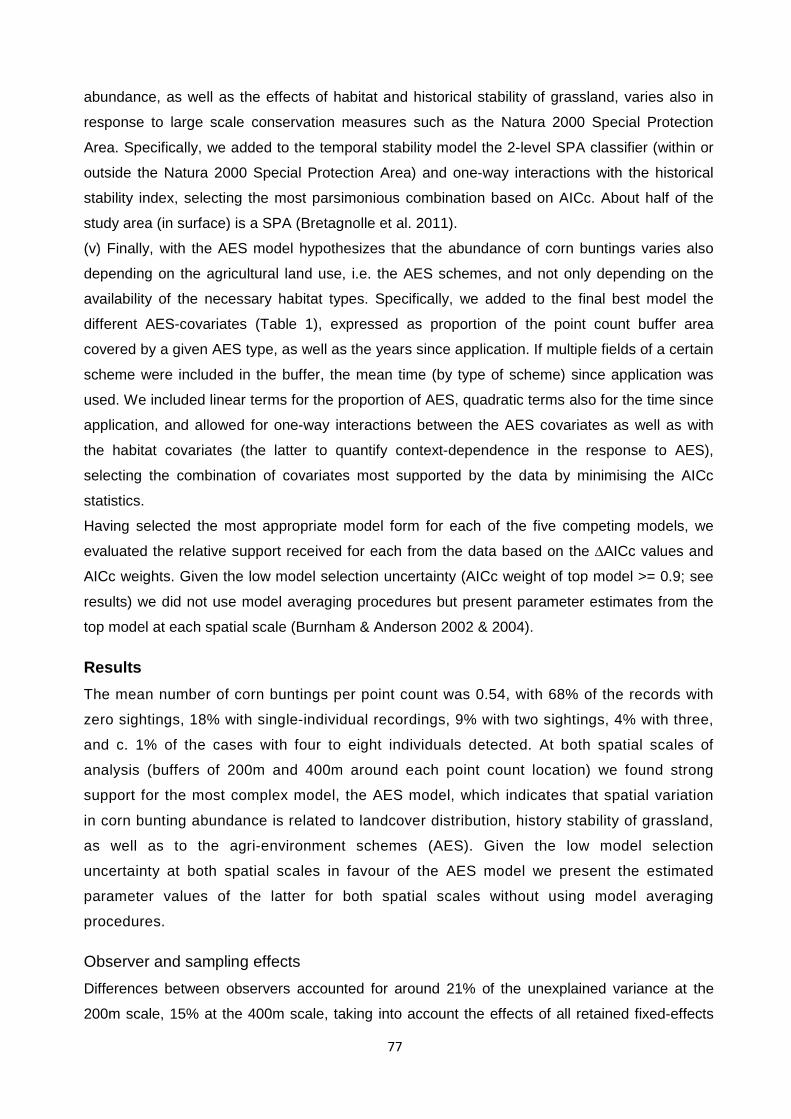
77
abundance, as well as the effects of habitat and historical stability of grassland, varies also in
response to large scale conservation measures such as the Natura 2000 Special Protection
Area. Specifically, we added to the temporal stability model the 2-level SPA classifier (within or
outside the Natura 2000 Special Protection Area) and one-way interactions with the historical
stability index, selecting the most parsimonious combination based on AICc. About half of the
study area (in surface) is a SPA (Bretagnolle et al. 2011).
(v) Finally, with the AES model hypothesizes that the abundance of corn buntings varies also
depending on the agricultural land use, i.e. the AES schemes, and not only depending on the
availability of the necessary habitat types. Specifically, we added to the final best model the
different AES-covariates (Table 1), expressed as proportion of the point count buffer area
covered by a given AES type, as well as the years since application. If multiple fields of a certain
scheme were included in the buffer, the mean time (by type of scheme) since application was
used. We included linear terms for the proportion of AES, quadratic terms also for the time since
application, and allowed for one-way interactions between the AES covariates as well as with
the habitat covariates (the latter to quantify context-dependence in the response to AES),
selecting the combination of covariates most supported by the data by minimising the AICc
statistics.
Having selected the most appropriate model form for each of the five competing models, we
evaluated the relative support received for each from the data based on the ∆AICc values and
AICc weights. Given the low model selection uncertainty (AICc weight of top model >= 0.9; see
results) we did not use model averaging procedures but present parameter estimates from the
top model at each spatial scale (Burnham & Anderson 2002 & 2004).
Results
The mean number of corn buntings per point count was 0.54, with 68% of the records with
zero sightings, 18% with single-individual recordings, 9% with two sightings, 4% with three,
and c. 1% of the cases with four to eight individuals detected. At both spatial scales of
analysis (buffers of 200m and 400m around each point count location) we found strong
support for the most complex model, the AES model, which indicates that spatial variation
in corn bunting abundance is related to landcover distribution, history stability of grassland,
as well as to the agri-environment schemes (AES). Given the low model selection
uncertainty at both spatial scales in favour of the AES model we present the estimated
parameter values of the latter for both spatial scales without using model averaging
procedures.
Observer and sampling effects
Differences between observers accounted for around 21% of the unexplained variance at the
200m scale, 15% at the 400m scale, taking into account the effects of all retained fixed-effects
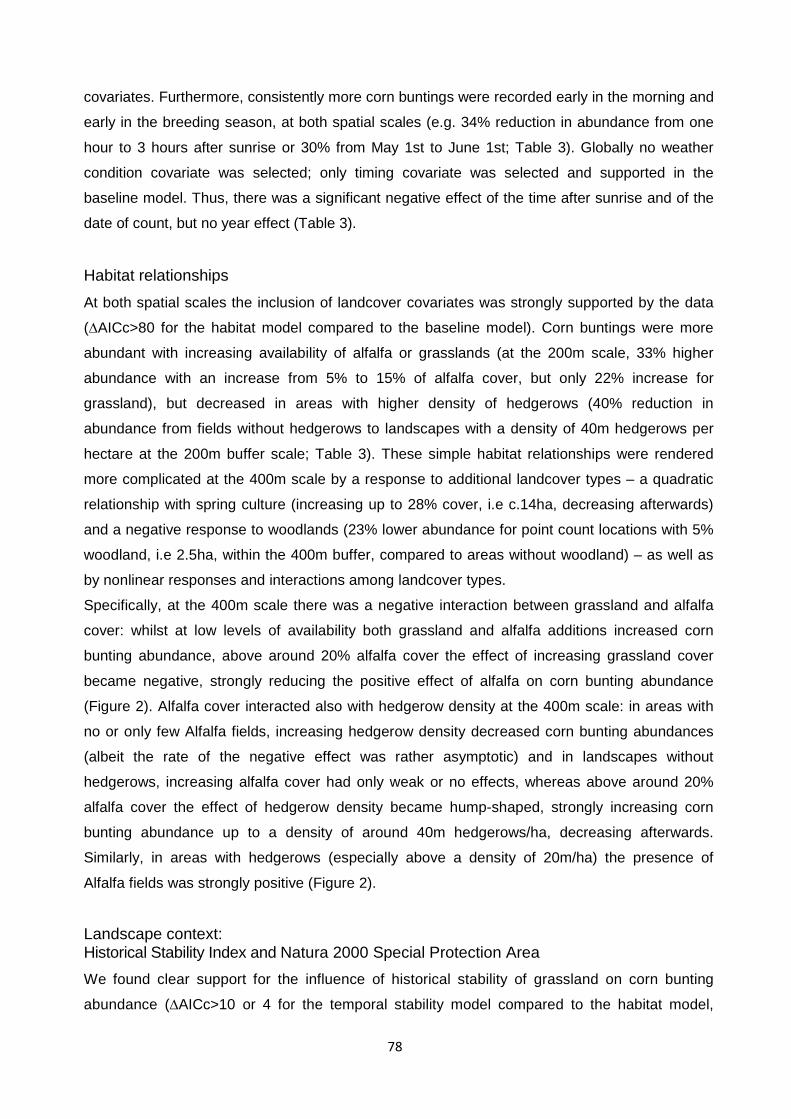
78
covariates. Furthermore, consistently more corn buntings were recorded early in the morning and
early in the breeding season, at both spatial scales (e.g. 34% reduction in abundance from one
hour to 3 hours after sunrise or 30% from May 1st to June 1st; Table 3). Globally no weather
condition covariate was selected; only timing covariate was selected and supported in the
baseline model. Thus, there was a significant negative effect of the time after sunrise and of the
date of count, but no year effect (Table 3).
Habitat relationships
At both spatial scales the inclusion of landcover covariates was strongly supported by the data
(∆AICc>80 for the habitat model compared to the baseline model). Corn buntings were more
abundant with increasing availability of alfalfa or grasslands (at the 200m scale, 33% higher
abundance with an increase from 5% to 15% of alfalfa cover, but only 22% increase for
grassland), but decreased in areas with higher density of hedgerows (40% reduction in
abundance from fields without hedgerows to landscapes with a density of 40m hedgerows per
hectare at the 200m buffer scale; Table 3). These simple habitat relationships were rendered
more complicated at the 400m scale by a response to additional landcover types – a quadratic
relationship with spring culture (increasing up to 28% cover, i.e c.14ha, decreasing afterwards)
and a negative response to woodlands (23% lower abundance for point count locations with 5%
woodland, i.e 2.5ha, within the 400m buffer, compared to areas without woodland) – as well as
by nonlinear responses and interactions among landcover types.
Specifically, at the 400m scale there was a negative interaction between grassland and alfalfa
cover: whilst at low levels of availability both grassland and alfalfa additions increased corn
bunting abundance, above around 20% alfalfa cover the effect of increasing grassland cover
became negative, strongly reducing the positive effect of alfalfa on corn bunting abundance
(Figure 2). Alfalfa cover interacted also with hedgerow density at the 400m scale: in areas with
no or only few Alfalfa fields, increasing hedgerow density decreased corn bunting abundances
(albeit the rate of the negative effect was rather asymptotic) and in landscapes without
hedgerows, increasing alfalfa cover had only weak or no effects, whereas above around 20%
alfalfa cover the effect of hedgerow density became hump-shaped, strongly increasing corn
bunting abundance up to a density of around 40m hedgerows/ha, decreasing afterwards.
Similarly, in areas with hedgerows (especially above a density of 20m/ha) the presence of
Alfalfa fields was strongly positive (Figure 2).
Landscape context: Historical Stability Index and Natura 2000 Special Protection Area
We found clear support for the influence of historical stability of grassland on corn bunting
abundance (∆AICc>10 or 4 for the temporal stability model compared to the habitat model,
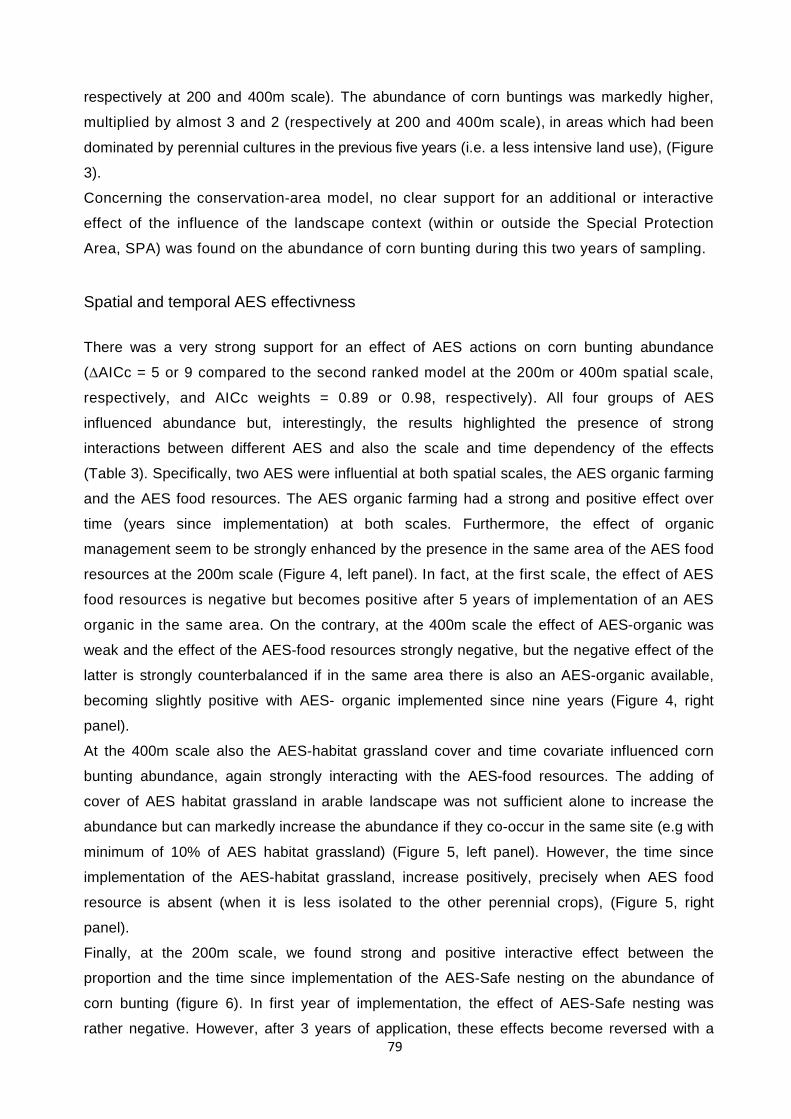
79
respectively at 200 and 400m scale). The abundance of corn buntings was markedly higher,
multiplied by almost 3 and 2 (respectively at 200 and 400m scale), in areas which had been
dominated by perennial cultures in the previous five years (i.e. a less intensive land use), (Figure
3).
Concerning the conservation-area model, no clear support for an additional or interactive
effect of the influence of the landscape context (within or outside the Special Protection
Area, SPA) was found on the abundance of corn bunting during this two years of sampling.
Spatial and temporal AES effectivness
There was a very strong support for an effect of AES actions on corn bunting abundance
(∆AICc = 5 or 9 compared to the second ranked model at the 200m or 400m spatial scale,
respectively, and AICc weights = 0.89 or 0.98, respectively). All four groups of AES
influenced abundance but, interestingly, the results highlighted the presence of strong
interactions between different AES and also the scale and time dependency of the effects
(Table 3). Specifically, two AES were influential at both spatial scales, the AES organic farming
and the AES food resources. The AES organic farming had a strong and positive effect over
time (years since implementation) at both scales. Furthermore, the effect of organic
management seem to be strongly enhanced by the presence in the same area of the AES food
resources at the 200m scale (Figure 4, left panel). In fact, at the first scale, the effect of AES
food resources is negative but becomes positive after 5 years of implementation of an AES
organic in the same area. On the contrary, at the 400m scale the effect of AES-organic was
weak and the effect of the AES-food resources strongly negative, but the negative effect of the
latter is strongly counterbalanced if in the same area there is also an AES-organic available,
becoming slightly positive with AES- organic implemented since nine years (Figure 4, right
panel).
At the 400m scale also the AES-habitat grassland cover and time covariate influenced corn
bunting abundance, again strongly interacting with the AES-food resources. The adding of
cover of AES habitat grassland in arable landscape was not sufficient alone to increase the
abundance but can markedly increase the abundance if they co-occur in the same site (e.g with
minimum of 10% of AES habitat grassland) (Figure 5, left panel). However, the time since
implementation of the AES-habitat grassland, increase positively, precisely when AES food
resource is absent (when it is less isolated to the other perennial crops), (Figure 5, right
panel).
Finally, at the 200m scale, we found strong and positive interactive effect between the
proportion and the time since implementation of the AES-Safe nesting on the abundance of
corn bunting (figure 6). In first year of implementation, the effect of AES-Safe nesting was
rather negative. However, after 3 years of application, these effects become reversed with a
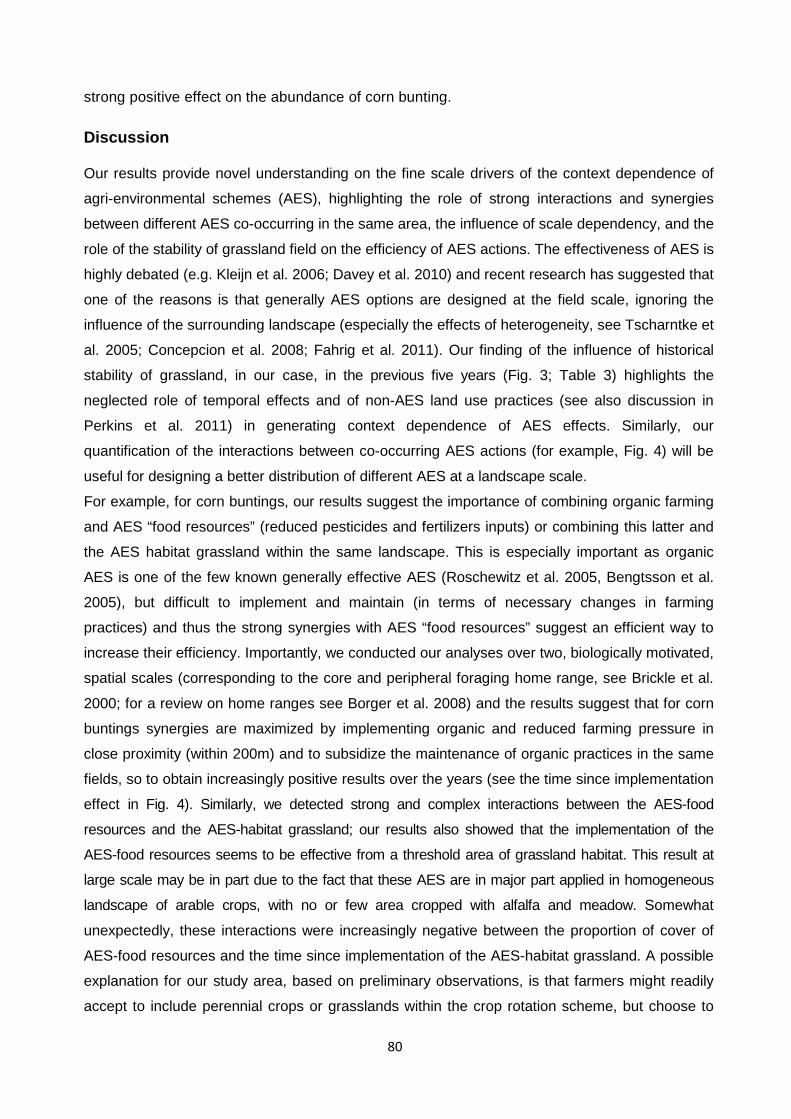
80
strong positive effect on the abundance of corn bunting.
Discussion Our results provide novel understanding on the fine scale drivers of the context dependence of
agri-environmental schemes (AES), highlighting the role of strong interactions and synergies
between different AES co-occurring in the same area, the influence of scale dependency, and the
role of the stability of grassland field on the efficiency of AES actions. The effectiveness of AES is
highly debated (e.g. Kleijn et al. 2006; Davey et al. 2010) and recent research has suggested that
one of the reasons is that generally AES options are designed at the field scale, ignoring the
influence of the surrounding landscape (especially the effects of heterogeneity, see Tscharntke et
al. 2005; Concepcion et al. 2008; Fahrig et al. 2011). Our finding of the influence of historical
stability of grassland, in our case, in the previous five years (Fig. 3; Table 3) highlights the
neglected role of temporal effects and of non-AES land use practices (see also discussion in
Perkins et al. 2011) in generating context dependence of AES effects. Similarly, our
quantification of the interactions between co-occurring AES actions (for example, Fig. 4) will be
useful for designing a better distribution of different AES at a landscape scale.
For example, for corn buntings, our results suggest the importance of combining organic farming
and AES “food resources” (reduced pesticides and fertilizers inputs) or combining this latter and
the AES habitat grassland within the same landscape. This is especially important as organic
AES is one of the few known generally effective AES (Roschewitz et al. 2005, Bengtsson et al.
2005), but difficult to implement and maintain (in terms of necessary changes in farming
practices) and thus the strong synergies with AES “food resources” suggest an efficient way to
increase their efficiency. Importantly, we conducted our analyses over two, biologically motivated,
spatial scales (corresponding to the core and peripheral foraging home range, see Brickle et al.
2000; for a review on home ranges see Borger et al. 2008) and the results suggest that for corn
buntings synergies are maximized by implementing organic and reduced farming pressure in
close proximity (within 200m) and to subsidize the maintenance of organic practices in the same
fields, so to obtain increasingly positive results over the years (see the time since implementation
effect in Fig. 4). Similarly, we detected strong and complex interactions between the AES-food
resources and the AES-habitat grassland; our results also showed that the implementation of the
AES-food resources seems to be effective from a threshold area of grassland habitat. This result at
large scale may be in part due to the fact that these AES are in major part applied in homogeneous
landscape of arable crops, with no or few area cropped with alfalfa and meadow. Somewhat
unexpectedly, these interactions were increasingly negative between the proportion of cover of
AES-food resources and the time since implementation of the AES-habitat grassland. A possible
explanation for our study area, based on preliminary observations, is that farmers might readily
accept to include perennial crops or grasslands within the crop rotation scheme, but choose to
81
maintain perennial cultures or grasslands only on marginal/poor quality fields. Similarly, Kleijn &
Sutherland (2003) identified a possible bias toward farmers who located schemes on the more
inaccessible or marginal fields within a farm. They suggested that this effect or non effect could
be got around by randomly allocating AES in the study. In our case of strong lobbying towards
AES guidance, we have used this type of accessible and attractive schemes as a bargaining tool
in order to apply precisely more stringent AES as safe nesting, we didn’t forget that the last word
belongs to the farmer (Witthingham, 2011). This aspect deserves further study and highlights the
somewhat neglected aspect of the human factor in determining the spatial allocation and
efficiency of AES policies.
Also the effect of AES schemes subsidizing delayed cutting of grasslands were scale-
dependent, being influential at the smaller spatial scale (200m radius), precisely in the core of
nesting and foraging home range, in accordance with the expectation that the importance of this
scheme lies in providing safe nesting habitat (see Perkins et al. 2011 and references therein). In
addition, Perkins et al. (2011) suggested that in areas dominated by arable crops AES providing
increased food resources may be sufficient, whereas in grassland dominated areas the provision
of safe nesting habitat may be crucial. Accordingly, we found that the AES provisioning food
(AES-food resources and AES-organic), was essential particularly at large scale, however we
show also that the increase of amount of AES-grassland is determinant to increase the colonization
potential of future nesting site in homogeneous landscape of arable crop. We can not globally rule on
the effectiveness of a scheme more than another, due to co-occurring effect, scale dependent and
context dependency. In this way, the AES safe nesting can play a key role if it’s applied very close to
the AES-habitat grassland, to reconcile in time the non-destruction of nests and a better access to the
resources, while increasing the connectivity between patches.
A crucial factor for obtaining this detailed understanding of the effects of AES was the availability
of the long-term and large scale land cover and land use monitoring GIS database, covering all
our study area. Recent research has highlighted that similar detailed data will be crucially needed
for obtaining a better understanding of how to maximize biodiversity in agricultural landscapes
(Fahrig et al. 2011). However, equally important for being able to use these data was the
functional approach for AES that we proposed, as it efficiently addressed the long-standing
problem of understanding the effects of the vast amount of different existing AES policy
measures, each one often addressing several objectives and applied together with multiple other
AES in the same landscape (Herzog 2005). An important aspect is also that this functional
approach can be directly linked with a multimodel selection framework to evaluate the support
from the data for different a priori biological hypotheses. Conceptually, the functional AES
approach is similar to the functional landscape heterogeneity approach of Fahrig et al. (2011)
82
and it might be interesting for future work to combine both approaches.
Finally, Perkins et al. (2011) suggested that also changes in non-AES land use might cause
differences in the abundance of corn buntings. Our results of the marked effects of land use and
land cover on corn bunting abundance, independent of the effects of AES (Fig. 2; Table 3)
supports this hypothesis. The importance of grasslands (set-aside, permanent and temporary
grassland) is already known (Brickle et al. 2000, Galowski et al. 2002, Fox et al. 2008) but we
especially showed in our intensive agro-ecosystem that alfalfa fields are in agreement with the
importance of these habitats for feeding and nesting (Badenhausser et al. 2008). The effects of
hedgerow density and woodland cover, and the strong scale-dependent interactions between
hedgerow density and alfalfa cover, suggests that these patterns may be also driven by a
response to differences in habitat heterogeneity. Accordingly, Pickett & Siriwardena (2011)
recently showed that differences in farmland heterogeneity are influential in determining
differences in farmland bird abundance, but that the responses might be markedly species-
specific. In particular, they showed that corn bunting abundance (at spatial scales ranging from 1-
25 km2) markedly increased in areas with a high degree of spatial mixing between farmland
habitat types and with roughly similar patch sizes, whereas the birds responded negatively to
landscapes characterized by smaller fields and more boundaries.
Synthesis and Applications
Our study showed that the implementation of AES in an intensive arable agro-ecosystem had a
strong positive effect on Corn bunting abundance. More particularly the interactions and
synergies between the different AES, coupled with the scale dependency, demonstrated a new
insight of the relation with the historical stability of grassland fields. The positive result of co-
occurring AES action could instigate new management ways, maximizing the cost-effectiveness
of AES. For instance, the AES-Organic farming should be spatially developed in combination
with a large spectrum of AES (considered as horizontal schemes), thus reducing by about 50%
the cost per unit of surface compared to uniform application of organic farming (with mean cost
of AES functional groups: 120€/ha for AES-food resources and 287€/ha for AES organic
farming).
Globally, the Little Bustard strategy applied to recover a viable population (Bretagnolle &
Inchausti 2005, Bretagnolle et al. 2011), contributed to significantly change the amount of
perennial crops, in particular alfalfa (see Brodier et al. submitted). This crop type in our
agricultural intensive context may be a key habitat in allowing the enhancement of trophic
resources (Badenhausser et al 2008, Bretagnolle et al. 2011, Brodier et al. submitted) and
nesting site for Corn bunting. Increasing the abundance of Corn bunting could also be achieved
by an increased of non discontinue AES alfalfa safe nesting patches plus improved coverage of
organic farming linked to the less expensive AES, as large reduced input schemes.
83
Future research investigating the direct and indirect (i.e. through habitat heterogeneity) effects
of land use changes and implementation of AES on farmland biodiversity, over time and over
multiple scales, will be crucially needed. It will likely profit from a combination of our functional
AES approach with the functional landscape heterogeneity approach of Fahrig et al. (2011).
Acknowledgements This research was supported by DREAL Poitou-Charentes and several ANR projects
(ECOGER, BIODIVAGRIM). We wish to thank A. Desternes, A. Theillout, O. Fontaine, A.
Guerard, J.F. Blanc, A. Villers, F. Vaidie, R. Huot, L, Renaudet, W. Gerbault, H. Bidault and
researchers who helped S.A. when conducting the work in fields. SA was supported by a
PHD grant from Conseil Général des Deux Sèvres and Région Poitou-Charentes, and LB
was supported by ANR Biodivagrim. We also thank H. Meiss, T. Cornulier and I.
Badenhausser for fruitful and stimulating discussions.
84
References Aebischer N.J, Evans A.D, Grice P.V, Vickery J.A, Aebischer N.J, Green R.E, Evans A.D. From science to recovery four cases studies of how research has been translated into conservation action in the UK. In Ecology and conservation of lowland farmland birds Aebischer N.J, Evans A.D, Grice P.V, Vickery J.A. (2000). pp. 43–54. Eds. Tring, UK:British Ornithologist Union. Auffret, A.G., Cousins, S.A.O. (2011). Past and present management influences the seed bank and seed rain in a rural landscape mosaic. Journal of Applied Ecology.48 (5) : 1278-1285. Badenhausseur I., Amouroux P., Lerin J., Bretagnolle V. (2008). Acridid sampling methodology and density fluctuations (Orthoptera: Acrididae) in European Grasslands. Acta Oecologica. Baines, D., Warren, P. & Calladine, J. (2002). Spatial and temporal differences in the abundance of black grouse and other moorland birds in relation to reductions in sheep grazing. Aspects of Applied Biology. 67: 245–252. Batary, P., Baldi, A., Sarospataki, M., Kohler, F., Verhulst, J., Knop, E., Herzog, F., Kleijn, D., (2010). Effect of conservation management on bees and insect-pollinated grassland plant communities in three European countries. Agric. Ecosyst. Environ. 136, 35–39. Bates, D., M. Maechler and B. Bolker (2011) lme4: Linear mixed-effects models using S4 classes. R package version 0.999375-42. http://CRAN.R-project.org/package=lme4 Bengtsson, J., Ahnström, J. & Weibull, A.-C. (2005). The effects of organic agriculture on biodiversity and abundance: a meta-analysis. Journal of Applied Ecology. 42, 261–269. Benton, Vickery, A. J., and Wilson, J. D.(2003). Farmland biodiversity: is habitat heterogeneity the key? TRENDS in Ecology and Evolution. 18(4) : 182-188. Betts, M. G., L. M. Ganio, M. M. P. Huso, N. A. Som, F. Huettmann, J. Bowman, and B. A. Wintle. 2009. Comment on "Methods to account for spatial autocorrelation in the analysis of species distributional data: a review". Ecography 32:374-378. Bretagnolle, V. & Inchausti, P. ( 2005). Modelling population reinforcement at a large spatial scale as a conservation strategy for the declining Little Bustard (Tetrax tetrax) in agricultural habitats. Anim. Conserv. 8: 59–68. Bretagnolle, V., Villers, A., Denonfoux, L., T. Cornulier, P. Inchausti, I., Badenhausseur. (2011). Rapid recovery of a depleted population of Little Bustards Tetrax tetrax following provision of alfalfa through an agri-environment scheme. Brickle, N.W. & Harper, D.G.C. 2002. Agricultural intensification and the timing of breeding of Corn Buntings Miliaria calandra. Bird Study 49: 219–228. Brickle, N.W. et al. (2000) Effects of agricultural intensification on the breeding success of corn buntings Miliaria calandra. J. Appl. Ecol. 37, 742–755. Broyer, J.(2011).Long-term effects of agri-environment schemes on breeding passerine populations in a lowland hay meadow system. Bird Study. 58 (2): 141-150. Concepcion, E.D., Diaz, M. & Baquero, R.A. (2008). Effects of landscape complexity on the ecological effectiveness of agrienvironment schemes. Landsc. Ecol., 23, 135–148.
85
Crick, H.Q.P., Dudley, C., Evans, A.D. & Smith, K.W. (1994) Causes of nest failure among buntings in the UK. Bird Study, 41, 88–94 . Donald, P.F. & Evans, A.D. (1995): Habitat selection and population size of Corn Buntings Miliaria calandra breeding in Britain in 1993, Bird Study, 42:3, 190-204. Donald, P.F. & Forrest, C. 1995. The effects of agricultural change on populations size of Corn Buntings Miliaria calandra on individual farms. Bird Study 42: 205–215. Donald, P.F. Green, R.E. & Heath, M.F. (2000) Agricultural intensification and the collapse of Europe’s farmland bird populations. Proceedings of the Royal Society London Series B, 268, 25–29. Elston, D. A. and R. Moss and T. Boulinier and C. Arrowsmith and X. Lambin. 2001. Analysis of aggregation, a worked example: numbers of ticks on red grouse chicks. Parasitology 122(5): 563-569 doi:10.1017/S0031182001007740. Fahrig, L. et al. 2010. Functional landscape heterogeneity and animal biodiversity in agricultural landscapes. Ecol. Lett. 14: 101-112. Fließbach, A., Oberholzer, H.-R., Gunst, L., Mader, P., 2007. Soil organic matter and biological soil quality indicators after 21 years of organic and conventional farming. Agriculture, Ecosystems and Environment. 118: 1– 4. Fox, T., and Heldbjerg, H. 2008 Which regional features of Danish agriculture favour the corn bunting in the contemporary farming landscape? Agriculture, Ecosystems and Environment. 126: 261–269 Fuentes-Montemayor, E.,Goulson,D.& Park, K.J. (2011). The effectiveness of agri- environment schemes for the conservation of farmland moths: assessing the importance of a landscape-scale management approach. Journal of Applied Ecology, 48, 532–542. Gabriel, D., Carver, S.J., Durham, H., Kunin, W.E., Palmer, R.C., Sait, S.M. et al. (2009). The spatial aggregation of organic farming in England and its underlying environmental correlates. Journal of Applied Ecology. 46: 323–333. Gabriel, D., Sait, S.M., Hodgson, J.A., Schmutz, U., Kunin, W.E. & Benton, T.G. (2010). Scale matters: the impact of organic farming on biodiversity at different spatial scales. Ecol. Lett., 13, 858–869. Gabriel, D., Tscharntke, T. (2007). Insect pollinated plants benefit from organic farming. Agric. Ecosyst. Environ. 118, 43–48. Geiger, F., Bengtsson, J., Berendse, F., Weisser, W.W., Emmerson, M., Morales, M.B., Ceryngier, P., Liira, J., Tscharntke, T., Winqvist, C., Eggers, S., Bommarco, R., Pärt, T., Bretagnolle, V., Plantegenest, M., Clement, L.W., Dennis, C., Palmer, C., Oñate, J.J., Guerrero, I., Hawro, V., Aavik, T., Thies, C., Flohre, A., Hänke, S., Fischer, C., Goedhart, P.W., Inchausti, P., (2010). Persistent negative effects of pesticides on biodiversity and biological control potential on European farmland. Basic and Applied Ecology 11, 97–105. Gillings, S. & Fuller, R.J. (1998) Changes in bird populations on sample lowland English farms in relation to loss of hedgerows and other non-crop habitats. Oecologia,116, 120-127. Golawski, A. & Dombrowski, A. 2002. Habitat use of Yellowhammers Emberiza citrinella,
86
Ortolan Buntings E. hortulana, and Corn Buntings Miliaria calandra in farmland of east- central Poland. Ornis Fennica 79: 164-172. Herzog, F. (2005) Agri-environment schemes as landscape experiments. Agriculture, Ecosystems and Environment, 108, 175–177. Hole, D.G., Perkins, A.J., Wilson, J.D., Alexander, I.H., Grice, P.V., Evans, A.D., 2005. Does organic farming benefit biodiversity? Biological Conservation. 122, 113-130. Jonason, D., Andersson, G., K., S., Öckinger, E., Rundlöf, M., Smith, H. G. and Bengtsson, J. (2011). Patch size matters more than dispersal distance in a mainland– island metacommunity. Journal of Applied Ecology. 48(3): 543–550. Kleijn, D. & Sutherland, W.J. (2003). How effective are European agri-environment schemes in conserving and promoting biodiversity? Journal of Applied Ecology. 40 : 947–969. Kleijn, D., Baquero, R.A., Clough, Y., Diaz, M., De Esteban, J., Fernández, F., Gabriel, D., Herzog, F., Holzschuh, A., Jöhl, R., Knop, E., Kruess, A., Marshall, E.J.P., Steffan- Dewenter, I., Tscharntke, T., Verhulst, J., West, T.M., Yela, J.L. (2006). Mixed biodiversity benefits of agri-environment schemes in five European countries. Ecology Letters. 9: 243-254. Maindonald, J. and J. Braun. 2010. Data Analysis and Graphics Using R, An Example- Based Approach. 3d ed., Cambridge University Press. Mason, C.F. & Macdonald, S.M. 2000. Influence of landscape and land-use on the distribution of breeding birds in farmland in eastern England. J. Zool., Lond. 251: 339–348. Memmott, J., Cadotte, M., Hulme, P.E., Kerby, G., Milner-Gulland, E.J. & Whittingham, M.J. (2010) Putting applied ecology into practice. Journal of Applied Ecology. 47: 1–4. Norris, K. (2008).Agriculture and biodiversity conservation: opportunity knocks.Conservation Letters. 1: 2–11. Peach W.J, Lovett L.J, Wotton S.R, Jeffs, C. (2001). Countryside stewardship delivers cirl buntings (Emberiza cirlus) in Devon. UK. Biol. Conserv. 101: 361–374. Pebesma, E.J., Heuvelink, G.B.M., 1999. Latin hypercube sampling of Gaussian random fields. Technometrics 41 (4), 303–312. PECBMS (2010). http://www.ebcc.info/pecbm.html Perkins, A.J., Maggs, H.E., Watson, A. & Wilson, J.D. (2011). Adaptive management and targeting of agri-environment schemes does benefit biodiversity: a case study of the corn bunting Emberiza calandra. Journal of Applied Ecology, 48, 514–522. Robinson, A.R, Sutherland, W.J .(2002).Post-war changes in arable farming and biodiversity in Great Britain. Journal of applied Ecology. 39 : 157–176. Roschewitz, I., Gabriel, D., Tscharntke, T. & Thies, C. (2005).Contrasting effects of landscape complexity on arable weeddiversity in organic and conventional farming. J. Appl. Ecol. 42, 873–882 Rundlof, M., Bengtsson, J., Smith, H.G., 2008a. Local and landscape effects of organic farming on butterfly species richness and abundance. Journal of Applied Ecology. 45: 813–820.
87
Rundlof, M., Nilsson, H., Smith, H.G., 2008b. Interacting effects of farming practice and landscape context on bumblebees. Biological Conservation. 141: 417–426. Siriwardena, G. M. (2010). The importance of spatial and temporal scale for agri- environment scheme delivery. Ibis. 152 : 515-529. Stoate, C., Boatman, N.D., Borralho, R.J., Carvalho, C.R., de Snoo, G.R. & Eden, P. (2001). Ecological impacts of arable intensification in Europe. Journal of Environmental Management. 63, 337–365. Taylor, A.J. & O’Halloran, J. 2002. The decline of the corn bunting, Miliaria calandra , in the republic of Ireland. Proc. R. Ir. Acad. 102B: 165–175. Thiébeau P., Badenhausser I., Meiss H., Bretagnolle V., Carrère P., Chagué J., Decourtye A., Maleplate T., Médiène S., Lecompte P., Plantureux S., Vertès F. (2010). Contribution des légumineuses à la biodiversité des paysages ruraux. Innovations Agronomiques. 11: 187-204. Tscharntke, T., Klein, A.M., Kruess, A., Steffan-Dewenter, I., Thies, C. (2005). Landscape perspectives on agricultural intensification and biodiversity-ecosystem service management. Ecology Letters. 8: 857–874. Verhulst, J., Kleijn, D. & Berendse, F. (2007). Direct and indirect effects of the most widely implemented Dutch agri-environment schemes on breeding waders. Journal of Applied Ecology. 44 (1). Whittingham, M.J. (2007). Will agri-environment schemes deliver substantial biodiversity gain, and if not why not? Journal of Applied Ecology. 44: 1–5. Whittingham, M.J. (2011). The future of agri-environment schemes: biodiversity gains and ecosystem service delivery? Journal of Applied Ecology. 48 (3): 509–513. Winqvist, C., Bengtsson, J., Aavik, T., Frank Berendse, Clement, L., W., Eggers, S., Fischer, C., Flohre, A., Geiger, F., Jaan Liira, Pärt, T., Thies, C., Tscharntke, T., Weisser, W. W., Bommarco, R. (2011).Mixed effects of organic farming and landscape complexity on farmland biodiversity and biological control potential across Europe. Journal of Applied Ecology.48 (3): 570–579.
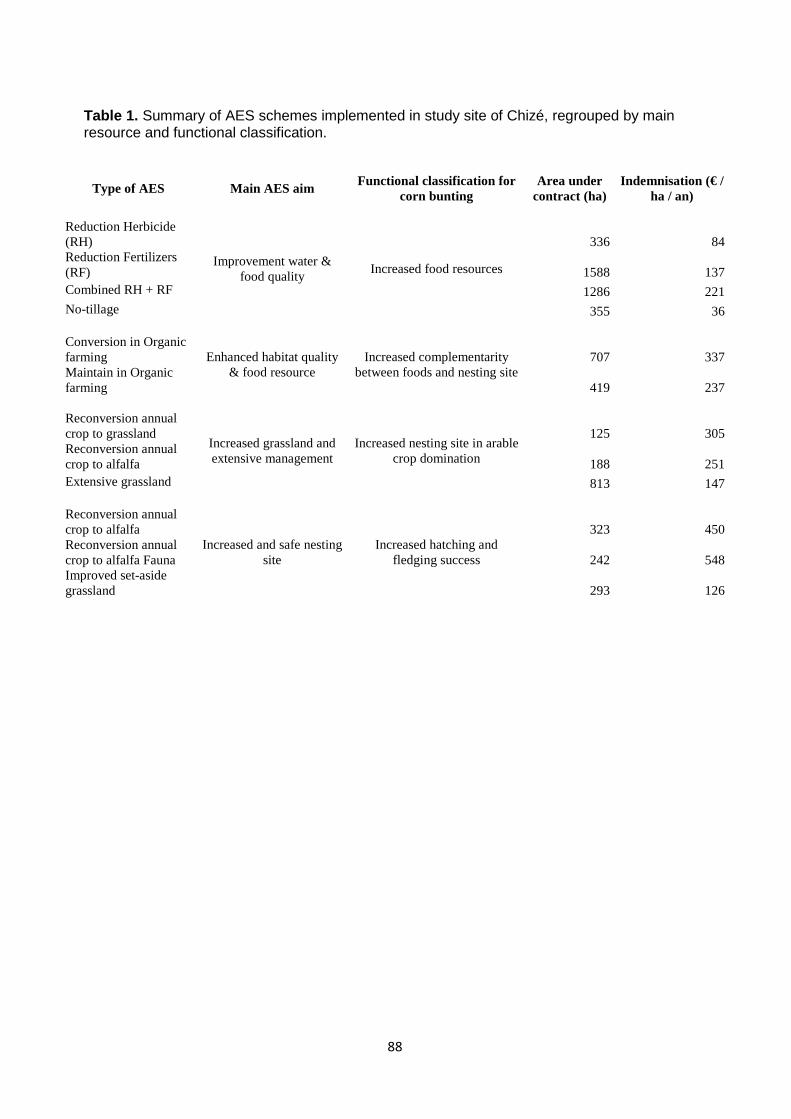
88
Table 1. Summary of AES schemes implemented in study site of Chizé, regrouped by main resource and functional classification.
Type of AES Main AES aim Functional classification for
corn bunting Area under
contract (ha) Indemnisation (€ /
ha / an) Reduction Herbicide (RH) 336 84 Reduction Fertilizers (RF) 1588 137 Combined RH + RF 1286 221 No-tillage
Improvement water & food quality
Increased food resources
355 36 Conversion in Organic farming 707 337 Maintain in Organic farming
Enhanced habitat quality & food resource
Increased complementarity between foods and nesting site
419 237 Reconversion annual crop to grassland 125 305 Reconversion annual crop to alfalfa 188 251 Extensive grassland
Increased grassland and extensive management
Increased nesting site in arable crop domination
813 147 Reconversion annual crop to alfalfa 323 450 Reconversion annual crop to alfalfa Fauna 242 548 Improved set-aside grassland
Increased and safe nesting site
Increased hatching and fledging success
293 126
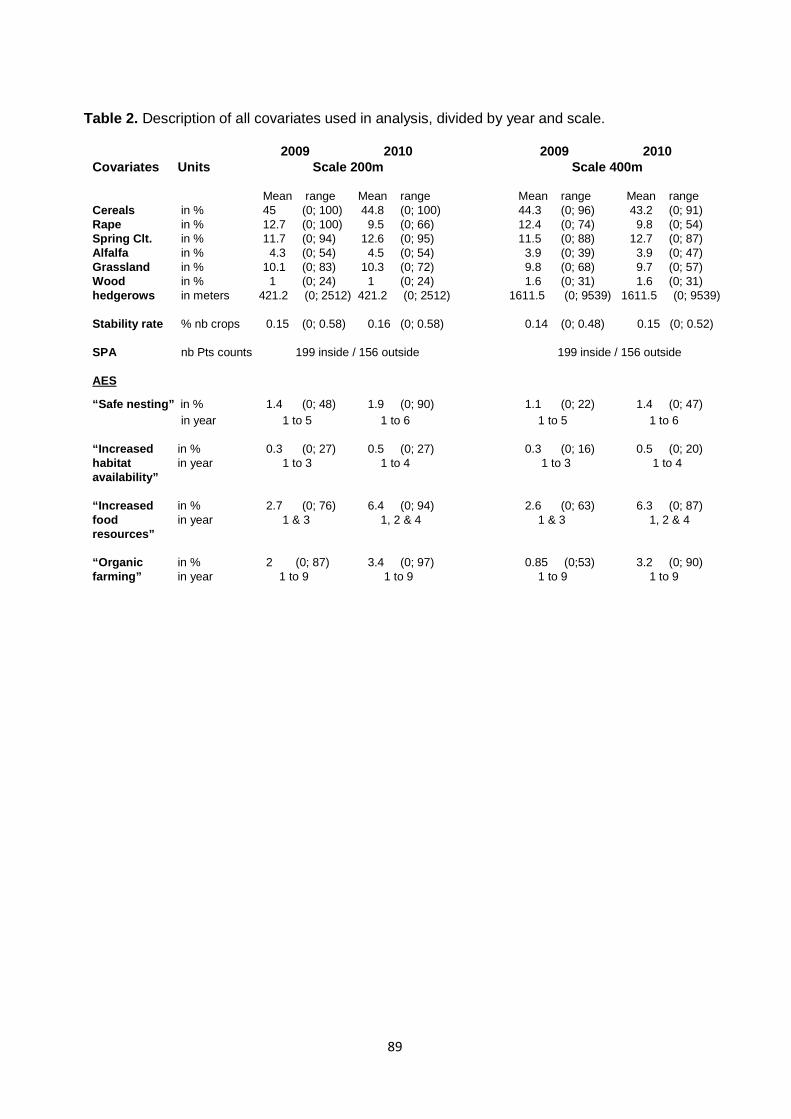
89
Table 2. Description of all covariates used in analysis, divided by year and scale.
2009 2010 2009 2010Covariates Units Scale 200m Scale 400m
Mean range Mean range Mean range Mean rangeCereals in % 45 (0; 100) 44.8 (0; 100) 44.3 (0; 96) 43.2 (0; 91)Rape in % 12.7 (0; 100) 9.5 (0; 66) 12.4 (0; 74) 9.8 (0; 54)Spring Clt. in % 11.7 (0; 94) 12.6 (0; 95) 11.5 (0; 88) 12.7 (0; 87)Alfalfa in % 4.3 (0; 54) 4.5 (0; 54) 3.9 (0; 39) 3.9 (0; 47)Grassland in % 10.1 (0; 83) 10.3 (0; 72) 9.8 (0; 68) 9.7 (0; 57)Wood in % 1 (0; 24) 1 (0; 24) 1.6 (0; 31) 1.6 (0; 31)hedgerows in meters 421.2 (0; 2512) 421.2 (0; 2512) 1611.5 (0; 9539) 1611.5 (0; 9539)
Stability rate % nb crops 0.15 (0; 0.58) 0.16 (0; 0.58) 0.14 (0; 0.48) 0.15 (0; 0.52)
SPA nb Pts counts 199 inside / 156 outside 199 inside / 156 outside
AES
“Safe nesting” in % 1.4 (0; 48) 1.9 (0; 90) 1.1 (0; 22) 1.4 (0; 47)in year 1 to 5 1 to 6 1 to 5 1 to 6
“Increased in % 0.3 (0; 27) 0.5 (0; 27) 0.3 (0; 16) 0.5 (0; 20)habitat in year 1 to 3 1 to 4 1 to 3 1 to 4 availability”
“Increased in % 2.7 (0; 76) 6.4 (0; 94) 2.6 (0; 63) 6.3 (0; 87)food in year 1 & 3 1, 2 & 4 1 & 3 1, 2 & 4resources”
“Organic in % 2 (0; 87) 3.4 (0; 97) 0.85 (0;53) 3.2 (0; 90) farming” in year 1 to 9 1 to 9 1 to 9 1 to 9
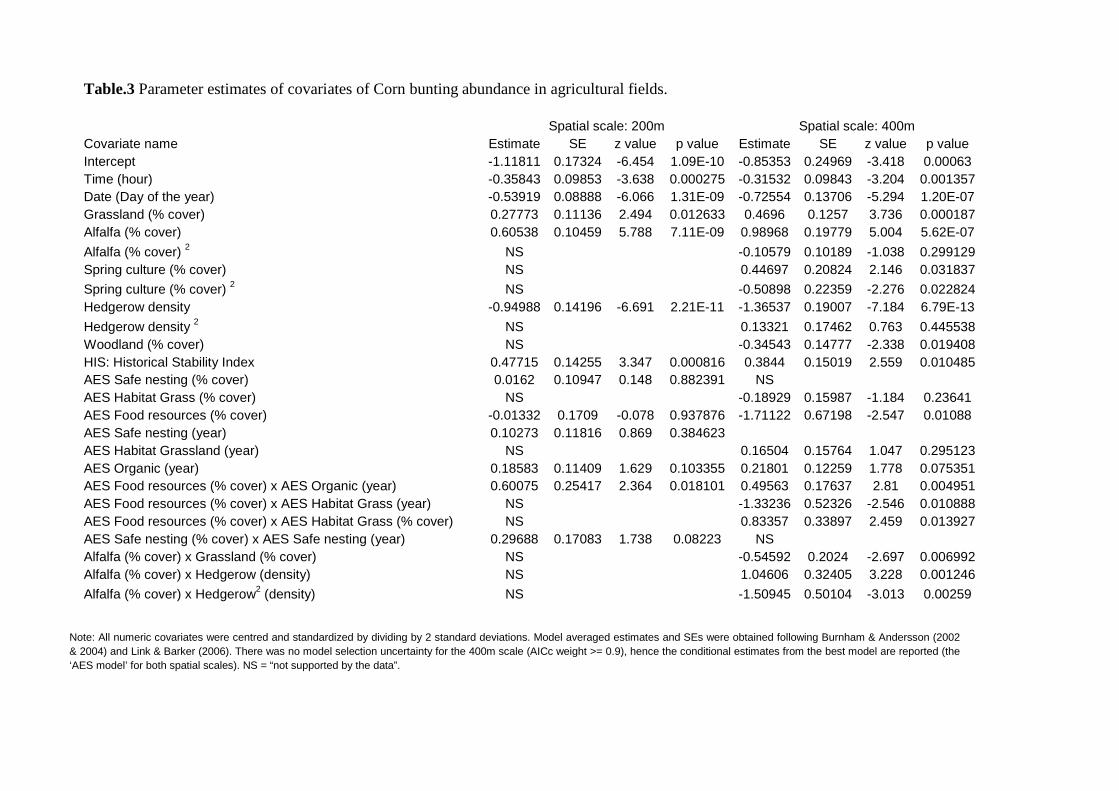
Table.3 Parameter estimates of covariates of Corn bunting abundance in agricultural fields.
Spatial scale: 200m Spatial scale: 400m Covariate name Estimate SE z value p value Estimate SE z value p value Intercept -1.11811 0.17324 -6.454 1.09E-10 -0.85353 0.24969 -3.418 0.00063 Time (hour) -0.35843 0.09853 -3.638 0.000275 -0.31532 0.09843 -3.204 0.001357 Date (Day of the year) -0.53919 0.08888 -6.066 1.31E-09 -0.72554 0.13706 -5.294 1.20E-07 Grassland (% cover) 0.27773 0.11136 2.494 0.012633 0.4696 0.1257 3.736 0.000187 Alfalfa (% cover) 0.60538 0.10459 5.788 7.11E-09 0.98968 0.19779 5.004 5.62E-07
Alfalfa (% cover) 2 NS -0.10579 0.10189 -1.038 0.299129 Spring culture (% cover) NS 0.44697 0.20824 2.146 0.031837
Spring culture (% cover) 2 NS -0.50898 0.22359 -2.276 0.022824 Hedgerow density -0.94988 0.14196 -6.691 2.21E-11 -1.36537 0.19007 -7.184 6.79E-13
Hedgerow density 2 NS 0.13321 0.17462 0.763 0.445538 Woodland (% cover) NS -0.34543 0.14777 -2.338 0.019408 HIS: Historical Stability Index 0.47715 0.14255 3.347 0.000816 0.3844 0.15019 2.559 0.010485 AES Safe nesting (% cover) 0.0162 0.10947 0.148 0.882391 NS AES Habitat Grass (% cover) NS -0.18929 0.15987 -1.184 0.23641 AES Food resources (% cover) -0.01332 0.1709 -0.078 0.937876 -1.71122 0.67198 -2.547 0.01088 AES Safe nesting (year) 0.10273 0.11816 0.869 0.384623 AES Habitat Grassland (year) NS 0.16504 0.15764 1.047 0.295123 AES Organic (year) 0.18583 0.11409 1.629 0.103355 0.21801 0.12259 1.778 0.075351 AES Food resources (% cover) x AES Organic (year) 0.60075 0.25417 2.364 0.018101 0.49563 0.17637 2.81 0.004951 AES Food resources (% cover) x AES Habitat Grass (year) NS -1.33236 0.52326 -2.546 0.010888 AES Food resources (% cover) x AES Habitat Grass (% cover) NS 0.83357 0.33897 2.459 0.013927 AES Safe nesting (% cover) x AES Safe nesting (year) 0.29688 0.17083 1.738 0.08223 NS Alfalfa (% cover) x Grassland (% cover) NS -0.54592 0.2024 -2.697 0.006992 Alfalfa (% cover) x Hedgerow (density) NS 1.04606 0.32405 3.228 0.001246
Alfalfa (% cover) x Hedgerow2 (density) NS -1.50945 0.50104 -3.013 0.00259
Note: All numeric covariates were centred and standardized by dividing by 2 standard deviations. Model averaged estimates and SEs were obtained following Burnham & Andersson (2002 & 2004) and Link & Barker (2006). There was no model selection uncertainty for the 400m scale (AICc weight >= 0.9), hence the conditional estimates from the best model are reported (the ‘AES model’ for both spatial scales). NS = “not supported by the data”.
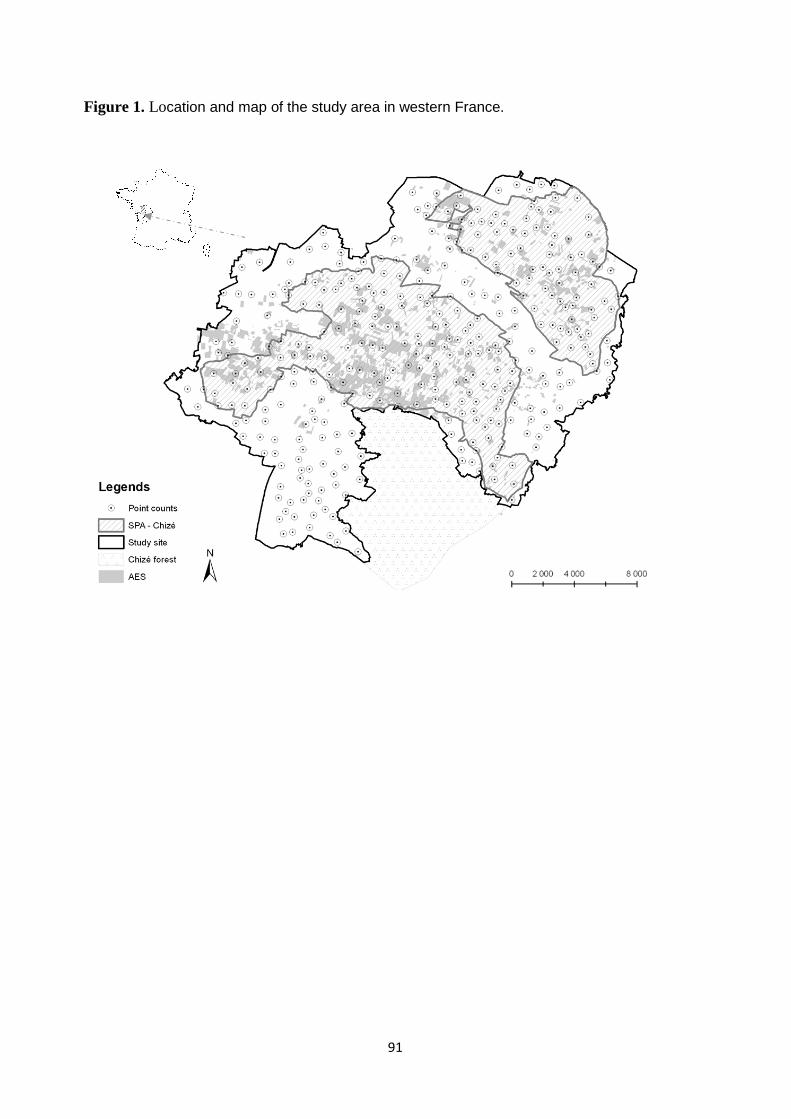
91
Figure 1. Location and map of the study area in western France.
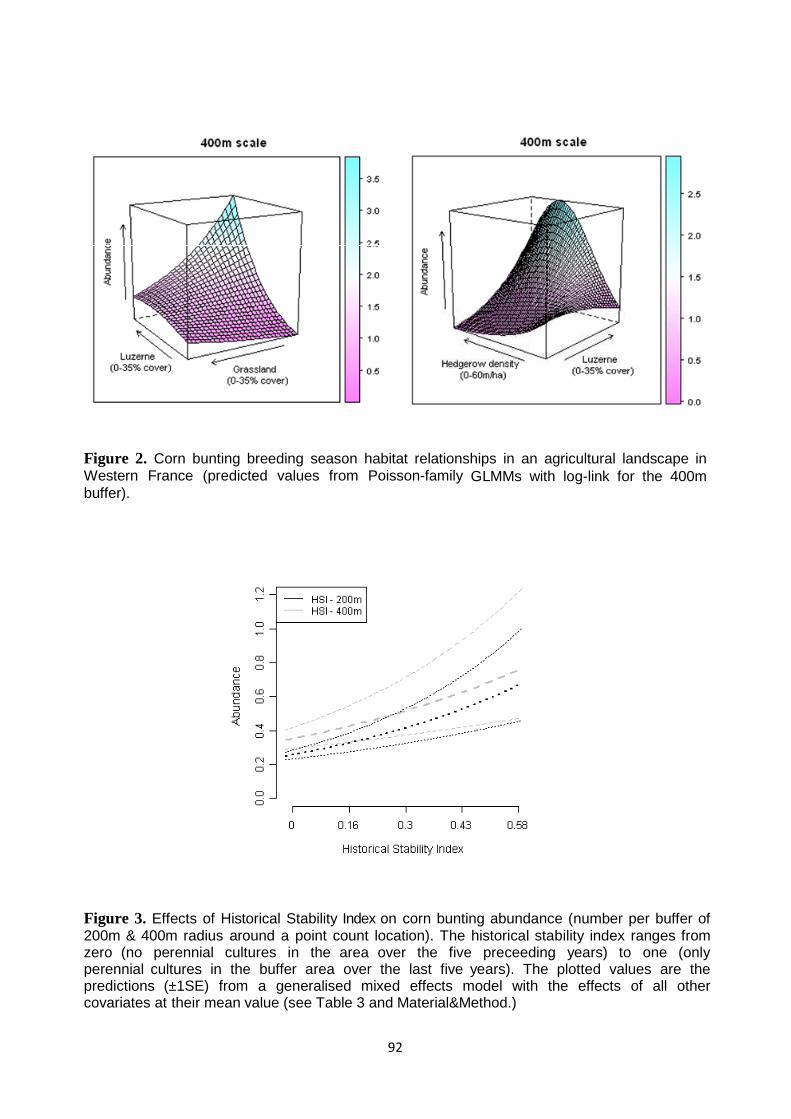
92
Figure 2. Corn bunting breeding season habitat relationships in an agricultural landscape in Western France (predicted values from Poisson-family GLMMs with log-link for the 400m buffer). Figure 3. Effects of Historical Stability Index on corn bunting abundance (number per buffer of 200m & 400m radius around a point count location). The historical stability index ranges from zero (no perennial cultures in the area over the five preceeding years) to one (only perennial cultures in the buffer area over the last five years). The plotted values are the predictions (±1SE) from a generalised mixed effects model with the effects of all other covariates at their mean value (see Table 3 and Material&Method.)
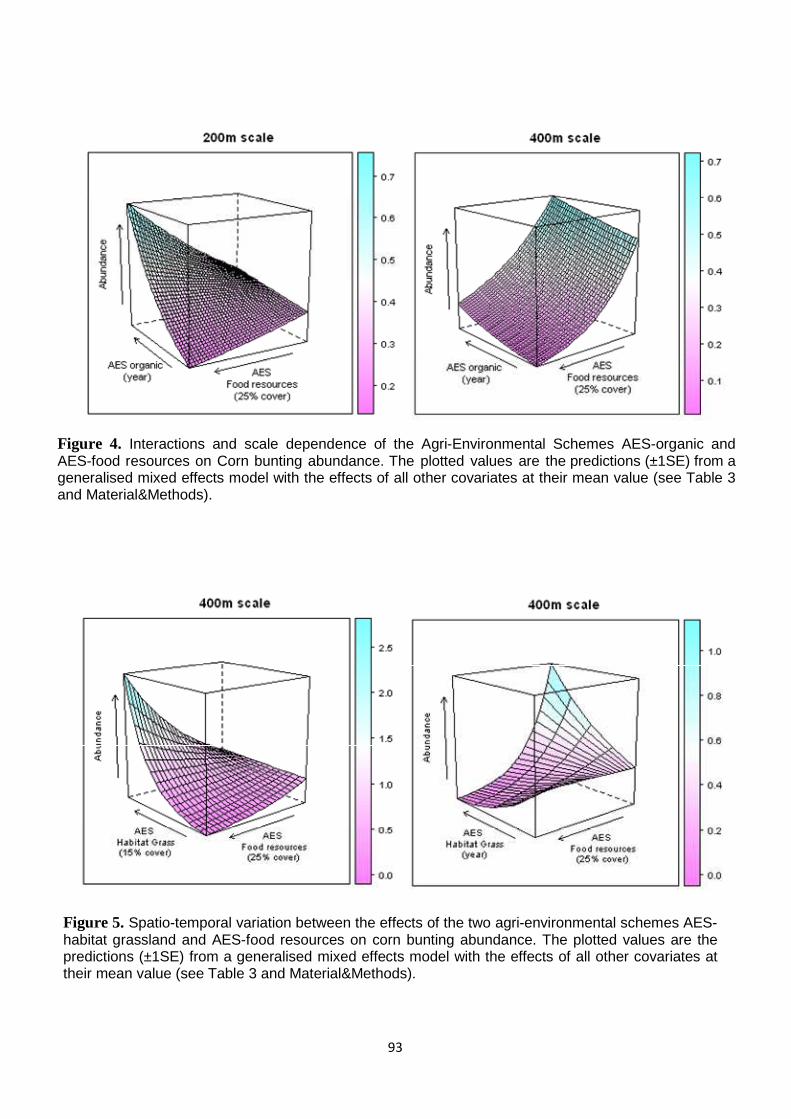
93
Figure 5. Spatio-temporal variation between the effects of the two agri-environmental schemes AES-habitat grassland and AES-food resources on corn bunting abundance. The plotted values are the predictions (±1SE) from a generalised mixed effects model with the effects of all other covariates at their mean value (see Table 3 and Material&Methods).
Figure 4. Interactions and scale dependence of the Agri-Environmental Schemes AES-organic and AES-food resources on Corn bunting abundance. The plotted values are the predictions (±1SE) from a generalised mixed effects model with the effects of all other covariates at their mean value (see Table 3 and Material&Methods).
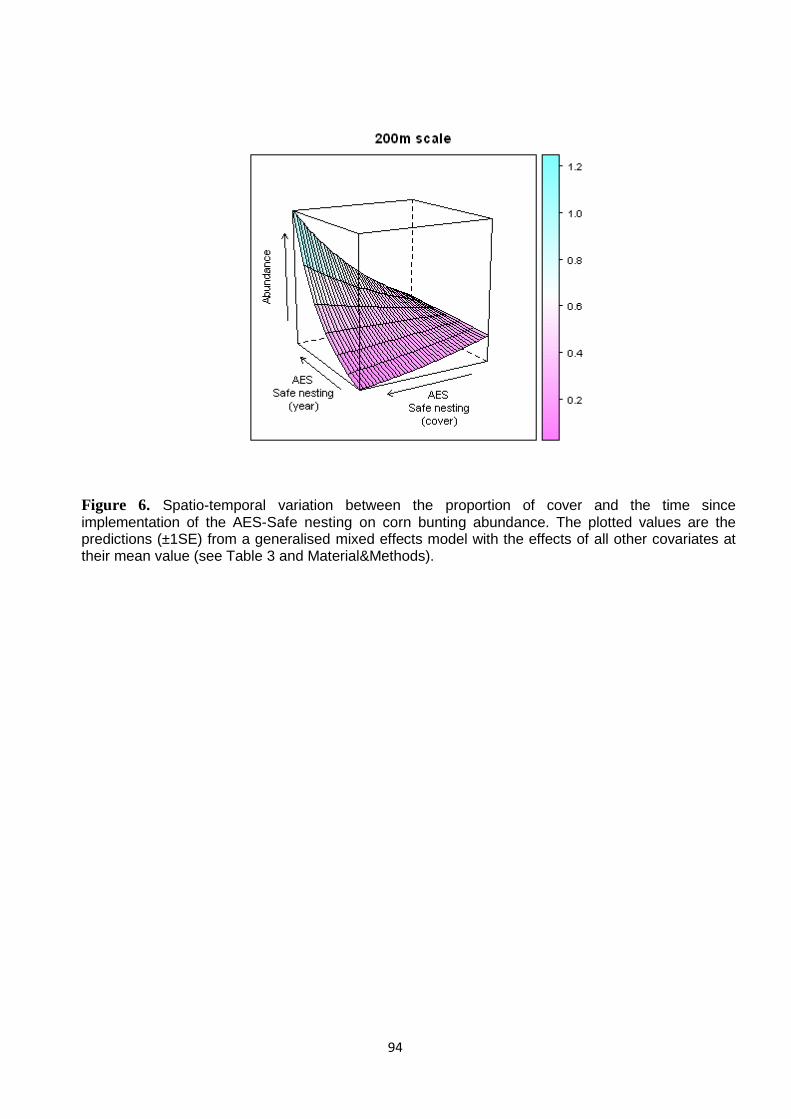
94
Figure 6. Spatio-temporal variation between the proportion of cover and the time since implementation of the AES-Safe nesting on corn bunting abundance. The plotted values are the predictions (±1SE) from a generalised mixed effects model with the effects of all other covariates at their mean value (see Table 3 and Material&Methods).
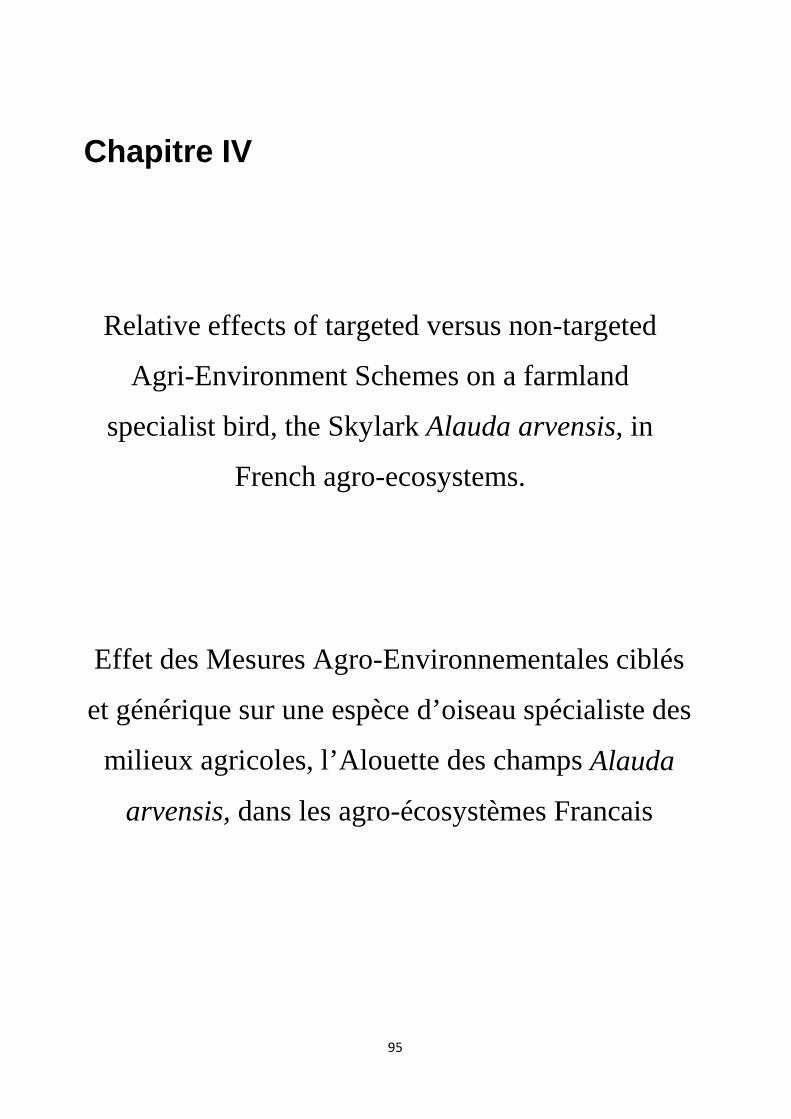
95
Chapitre IV
Relative effects of targeted versus non-targeted
Agri-Environment Schemes on a farmland
specialist bird, the Skylark Alauda arvensis, in
French agro-ecosystems.
Effet des Mesures Agro-Environnementales ciblés
et générique sur une espèce d’oiseau spécialiste des
milieux agricoles, l’Alouette des champs Alauda
arvensis, dans les agro-écosystèmes Francais
96
Target journal: Biological conservation Title : Relative effects of targeted versus non-targeted Agri-Environment Schemes on a farmland specialist bird, the Skylark Alauda arvensis, in French agro-ecosytems. Running Head : Non target AES effect Manuscript type: Article Authors : Steve Augiron1*, Luca Börger1, 2 §, Salomon Brodier1,3°, & Vincent Bretagnolle1 ‡ Affiliations :
1 Centre d’Etudes Biologiques de Chize, CNRS, 79360 Beauvoir-sur-Niort, France
2 INRA (USC 1339), CEBC-CNRS, 79360 Beauvoir-sur-Niort, France
3 Centre Ornithologique Lorrain, 5 rue de Nancy, 54690 Lay-Saint-Christophe, France e-mail addresses: * [email protected]; §[email protected]; °[email protected]; [email protected] Electronic appendices : Appendix1: Supplementary tables and figures Corresponding author : Steve Augiron Centre d’Etudes Biologiques de Chize CNRS Villiers-en-bois 79360 Beauvoir-sur-Niort, France Phone: + 33.549093551 Fax: + 33.549096526 E-mail: [email protected]
97
ABSTRACT Agri-Environnement Schemes were deployed to counteract the negative effects of intensive
agriculture on biodiversity. However, after more than 20 years of implementation, there is still a
need for research to improve their effectiveness. For instance, which strategy between precise
targeted schemes towards a rare emblematic species and generic schemes at a farm scale
should be applied to improve the status of common widespread species?
Here, we tackle this question in quantifying the relative effects of AES targeting the Little
bustard vs. generic AES (i.e. organic farming) on the skylark, a common but large scale
declining farmland specialist in an intensive arable land.
Using a dataset of 1420 count points on a large study area (450km2), we showed that targeted
AES, had more effect on skylarks overall, and that this effect was less scale-dependent than
generic AES. More specifically, the proportion and time of application of the AES “safe nesting”
had a positive effect, probably through providing unspoiled habitats throughout years and
during critical periods of the breeding season. We also showed that this effect was strongly
dependant on the proportion of grassland cover, and especially alfalfa fields.
Because targeted farming managements towards the skylark do not exist in France, the
development organic farming as well as conservation tools such as specific AES may be
important minimal requirements for the restoration of their populations.
Keywords
Agri-Environnementale Schemes, targeted schemes, organic farming, Special Protected Area, skylark
98
Introduction
Agricultural intensification has profoundly modified farmland habitats, with strong
consequences for biodiversity and ecosystems services (Benton et al. 2003; Tscharntke et al.
2005; MEA. 2005). With the reform of the Common Agricultural Policy (CAP) of the European
Union in 1992 a new policy was adopted consisting in measures within agri-environmental
schemes (AES, Henle et al. 2008). These measures were designed to counteract the negative
effects of intensive agriculture by offering financial incentives to farmers for adopting
environmentally friendly farming practices (Kleijn et al, 2006, Whittingham 2007). However, after
about 20 years of implementation, many studies have questioned the efficiency of AES with
regards to biodiversity. While some studies found a positive effect, often depending on the
species and/or on the taxonomic group considered (Kleijn & Sutherland. 2003, Bengtsson et al.
2005; Hole et al. 2005), others failed to detect an effect and some even found negative effects
(e.g., Bradbury & Allen. 2003). In addition, the effectiveness of management options appeares
to be modulated by landscape characteristics, such as landscape structure, composition and
scale (Tcharntke al. 2005, Batary et al. 2010, Fuentes-Montemayor et al. 2011; Winqvist et al.
2011; Smith et al. 2010), or by macro-scale factors such as precipitation (Amano et al. 2011).
Similarly, the efficiency of AES may vary over time, e.g. the time lag since AES establishment
(Fliessbach et al. 2007; Jonason et al. 2011).
Overall, two opposite AES strategies have been shown to be effective to conserve
biodiversity in certain circumstances (Benton et al. 2003; Whittimgham 2011), the holistic
approach (Mannion 1995), which is applied at the farm scale, a typical example being organic
farming (Gabriel & Tscharntke 2007; Rundlöf et al. 2008; Jonason et al. 2011), and the targeted
approach, i.e. the deployment of specific AES for one species (Aebischer et al., 2000; Baines,
Warren & Calladine 2002 ; Perkins et al. 2011; Bretagnolle et al. 2011), even so there is a vast
amount of different AES (Herzog 2005) and the difference between holistic and targeted
approaches is better seen to be on a continuum. A crucial question for evaluating the efficiency
of AES for biodiversity is therefore if specific schemes, targeted towards a certain species in
specific fields, can positively affect also non-target threatened species, or if the generic, farm-
scale approach is more efficient overall. For instance, targeted AES focusing on the last French
migratory population of the little bustard (Tetrax tetrax) not only allowed the recovery of the
population but had also positive effects on other biodiversity components, such as invertebrate
preys and plants (Badenhauser et al. 2008; Bretagnolle et al. 2011).
Here we address the question of whether, how, and to which extent, targeted AES affect
also non-targeted farmland birds. To do so we take advantage of a study system where a large
range of different AES have been applied in the same area, with their exact location mapped on
99
GIS together with all other land use activities, combined with concurrent monitoring schemes of
the responses of animal populations. We focus on the response of a specialist farmland bird,
the skylark (Alauda arvensis). Skylarks have been strongly declining in several countries of
Western Europe (Eaton et al 2007; Vorisek et al. 2010; CRBPO 2011) and are thus a good
model species to evaluate the impact of AES measures on farmland species. Specifically, we
quantified variation in the field-scale abundance of skylarks in relation to different AES,
separating the confounding effects of local and landscape habitat structure.
Methods
Study area
The study area was located in western France (46°23’N, 0°41’ W; see Fig. 1), in the Poitou-
Charentes region. It encompasses a Natura 2000 Special Protection Area (SPA) designated in
2004 (“Plaine de Niort Sud-Est”, FR5412007) owing to the presence of 17 species of the Annex
I of the Bird Directive, such as stone curlew Burhinus oedicnemus, little bustards Tetrax tetrax
and harriers Circus spp. The SPA occupies about half of the study area (450 km2 in total). The
agricultural landscape is characterized by a high proportion of arable land (>80%), of which a
large part is dedicated to cereal production (44% of cereals vs. 14% of meadows and alfalfa in
2010). Land use of all fields in the study area (around 18000 in total) has been surveyed twice a
year since 1995 and digitized using a geographical information system (ARCVIEW 9.2, ESRI,
Redlands, CA, USA).
Agri-Environment Schemes
Between 2004 and 2010, farmers were proposed AES contracts by the CNRS lab of Chizé
(www.cebc.cnrs.fr) which is in charge of promoting AES within this SPA. In 2010, 12 different
types of contracts, covering nearly 7000 ha, had been signed, following a spatially and
temporally adaptive design (Fig. 1) in order to improve the little bustard population, the original
aim of the AES (Berthet et al. in press). Initially AES consisted in implementing extensively
managed alfalfa or grassland fields (with limitation of chemical inputs and delayed mowing),
within and around historical and active leks of the little bustard, in order to halt habitat alteration
at the landscape scale and to enhance food resources (grasshoppers; see Badenhausser et al.
2008; Lemaire et al. 2011; Bretagnolle et al. 2011). Later on, these AES were implemented
away from existing leks, on historical but abandoned sites. Finally, non-target AES aiming at
improving ecosystem services and regulations (e.g. groundwater protection, organic farming)
were implemented all over the study area but especially within the SPA (Fig. 1). All contracts
were digitized on GIS every year to ensure a constant update.
100
We grouped the 12 different AES into four groups ranging from highly targeted to
completely untargeted measures (App. 1). The most general (non-targeted) group included all
measures related to organic farming (‘AES-organic’). Considering the ecology of skylarks, these
measures should especially increase available food resources. A second group included all
subsidies encouraging the conversion of arable fields to grasslands, a rare and limiting crop
type in intensive arable crop production systems (‘AES-grassland’). These AES are targeted in
general to farmland birds, but not to any specific species, as they increase habitat heterogeneity
in cereal landscapes. Furthermore, grasslands are known to host high nest densities of skylark
(Wilson et al. 1997; Henderson et al. 2000; Eraud & Boutin 2002). A third group consisted of
reduced-input (pesticides and fertilizers) AES targeted to increase food resources for the little
bustard (‘AES-food’). Given their supposed effect on seeds and small invertebrates, we
hypothesized a positive effect on skylarks, through an increase in food resources. The fourth
group included all measures that delay mowing and cutting of grasslands, in particular for alfalfa
fields, around active and former leks of the little bustard (‘AES-safe nesting’). We hypothesized
that these schemes will also reduce nest destruction and breeding failure for skylarks.
GIS procedures
All landscape covariates were extracted using ArcGIS 9.3 software, at two spatial scales – 200
and 400 meters. The 200m scale corresponds to the distance at which birds were recorded
during point count monitoring activities of farmland birds (see below). The second spatial scale
has been chosen in relation to the average home range size of skylarks (Eraud, 2002; Donald et
al, 2004). Crop types were summarised into 6 categories (wheat, rape, alfalfa, grassland, spring
culture, wood), which were extracted at the two buffer scales. Lastly, the linear density of
hedgerow within each of the point count buffers, the proportion and age of each AES, and the
location of the plot – within or outside the SPA – were also extracted.
Skylark monitoring
We used a large spatial scale monitoring scheme for the entire study site, based on a regular
grid of 355 point count locations separated by about 750m on average (Fig. 1) and sampled
twice during the breeding season (from early May to mid June) in 2009 and 2010, thus providing
1420 counts in total. Counts were performed in the morning (2.7h after sunrise on average). We
noted all birds observed or heard within a 200 m radius during 5 min. Their behaviour (singing,
flying, foraging) was also recorded, as well as weather conditions (rainfall, wind strength, and
cloud cover). Point counts were conducted only with acceptable weather conditions, defined as
no/light wind and rain.
101
Statistical analyses
All statistical modelling was performed using the R environment for statistical computing (R
Development Core Team 2010) version 2.13.0. We analysed count data for Skylark using
Generalised Linear Mixed Models (Poisson family with a log-link), fitted using the R package
lme4 version 0.999375-39 (Bates et al. 2011). We checked for overdispersion by including an
observation-level random effect in the models (Maindonal & Brown, 2010; Elston et al. 2001).
However, as we found no evidence of overdispersion we present results for simplified models
without the observation-level random effect. GLMMs can efficiently account also for spatial
autocorrelation if a random effect for each location is included (Betts et al. 2009; Zuur et al.
2009), i.e. the point counts in our case. To check this we plotted model residuals using
variograms in the geoR library version 1.6-29 (Ribeiro Jr and Diggle 2001) and confirmed the
absence of residual spatial autocorrelation (not shown). To aid model convergence and the
interpretation of effect sizes and parameter estimates we mean-centred and standardized all
numerical covariates (Schielzeth, 2010); specifically, to facilitate the comparison between
numerical covariates and factors, we standardized the numeric covariates by dividing by two
standard deviations (Gelman, 2008).
We used an information-theoretic multi-model selection framework to answer the
question of whether, how, and to which extent, targeted AES affect also non-targeted farmland
birds. Specifically, we devised four a priori competing models of increasing complexity: the
baseline model, the habitat model, the AES model, and the conservation-area model, with all
models containing the same random-effects structure, accounting for the survey design. For all
model selection and averaging procedures we used the second-order Akaike Information
Criterion (AICc, Burnham and Andersson 2002 & 2004) within the MuMIn library in R (version
1.6.5., Barton, 2011). For each of the competing models, we identified in a preliminary modelling
step the most parsimonious model structure (in terms of number of covariates included,
interaction terms, and quadratic effects, limiting interaction depth to two-way interaction to avoid
overly complex models), which we then used for the main model comparison step. We repeated
all analyses at both spatial scales (200m and 400m buffer).
The baseline model is included to allow for the possibility that none of the tested
covariates of direct interest (habitat, AES, etc.) has an effect on skylark abundance. Specifically,
we included all weather covariates (cloud cover, with values ranging from zero to eight, and a
two-level factor to account for the presence/absence of rain), as well as the Year (2-level factor)
and the sampling date (Julian day, April1 = day 1) and time (hours after sunrise). The habitat
model hypothesizes that the number of skylark varies also depending on the availability of
certain habitat types. It includes all covariates included in the baseline model, plus the most
102
parsimonious combination of habitat covariates: proportion of crop types and land cover types
and the density of hedgerows within each point count buffer (200m or 400m radius,
respectively). As for the baseline model, we fitted the habitat covariates as linear and quadratic
covariates (the latter to test for a functional response), limiting interaction depth to two-way
interactions to avoid overly complex models, and selected the most parsimonious model
structure by minimising the AICc criterion as for the baseline model. The AES model
hypothesized that the abundance of skylark responds also to AES, and not only depending on
the availability of certain habitat types. Specifically, we added to the habitat model the different
AES-covariates (Appendix 1), expressed as proportion of the point count buffer area covered by
a given AES type, as well as the years since application. If multiple fields of a certain scheme
were included in the buffer, the mean time (by type of scheme) since application was used. We
included linear and quadratic terms for the proportion of AES and for the time since application
and allowed for one-way interactions between the AES covariates as well as with the habitat
covariates (the latter to quantify context-dependence in the response to AES), again selecting
the combination of AES covariates most supported by the data by minimising the AICc statistics.
Finally, with the conservation-area model we evaluated support for the hypothesis that skylark
abundance, as well as the effects of AES and previous land use intensity, varies also in
response to large scale conservation measures such as the Natura 2000 Special Protection
Area. Specifically, we added to the AES model the 2-level SPA classifier (within or outside the
Natura 2000 Special Protection Area) and one-way interactions with the AES covariates,
selecting the most parsimonious combination based on AICc.
Having selected the most appropriate model form for each of the four competing models,
we evaluated the relative support for each received from the data, following standard
procedures (see Appendix 3) (Burnham & Anderson 2002 & 2004). For example, if the AES
model is the most parsimonious one, this would indicate that even after correcting for habitat
availability and sampling-related variation, certain AES actions do affect the number of skylarks,
but that this relation does not differ depending on previous land use intensity or between
protected and non-protected areas. Given the low model selection uncertainty (see Results) we
present estimates from the best model, as there was no need for model averaging procedures.
Results
Sampling effects and habitat relationships
At both spatial scales the number of skylarks detected varied depending on the time of
sampling, with an increase in numbers until 2 hrs after sunrise, followed by a decline until the
end of the morning (Table 1). Similarly, wood cover and hedgerow density (especially the latter)
had a strong negative effect on the abundance of skylarks, whereas alfalfa, other grasslands
103
(i.e., ray grass, pastures, hay meadows and set asides), cereals, and spring sown crops
positively affected skylark abundance. The negative effect of hedgerow density, however, was
mitigated by positive interactions with cereals (and also with grasslands and spring cultures at
the 400m scale only), whereas wood cover interacted negatively with cereal cover (Table 1).
AES effects
At both spatial scales, the model including AES effects, in addition to confounding covariates
and habitat variables, performed better than without AES effects (Table 1). Overall, all AES had
a significant positive influence on skylark abundance, except the reduced-input ‘AES-food’,
whose inclusion was never supported by the data.
Specifically, at the 200m scale skylarks responded especially to an increase in cover of AES
favouring the conversion of arable lands to grasslands (the effect decreased at higher values of
cover, i.e. a functional response; Fig. 2a), a group of mostly non-target AES (‘AES-grassland’).
Skylarks also responded positively to an increase in cover of the safe-nesting targeted AES (i.e.
schemes subsidising delayed cutting of grasslands around little bustard leks; ‘AES-safe
nesting’), although the effect was not strong and not precisely estimated. Surprisingly, instead,
there was no response to organic farming (‘AES-organic’), also not over time. There was also
no evidence of a variation over time (i.e. since implementation) of the effects of the AES at the
200m scale.
At the 400m scale, instead, there was no response to the AES-grassland and skylarks
responded similarly to an increase in cover of AES-organic (Fig. 2b) as well as to the AES-safe
nesting. Importantly, for the latter the time since implementation was important (a positive
relationship) and, especially, the effect size increased linearly with the proportion of cover
cultivated with grasslands or alfalfa (i.e. a context-dependent response; Fig. 3). There was no
support for the presence of interactions between different co-occurring AES measures. Finally,
there was a tendency for skylarks to be more abundant within the Natura 2000 Special
Protection Area (SPA), but only at the 200m scale (Table 1).
Discussion
Our results show that targeted AES measures can positively affect also the field-scale
abundance of a non-target farmland bird species, the skylark, and with a larger effect size than
non-target AES measures such as organic farming. Importantly, the results hold across two
different spatial scales of analysis and were independent of the effects of habitat parameters. All
parameter estimates for the latter were biologically realistic, which suggests that the models
were adequate. Specifically, alfalfa, other grasslands (including pastures and set asides),
cereals, and spring sown crops all positively affected skylark abundance, albeit in different,
104
scale-dependent ways. Cereals had the greatest positive effect at a 200m scale, alfalfa at the
400m scale (Table 1). Higher densities in grassland, and especially in set-aside, during the
breeding season are reported in the literature (Wilson et al 1997; Donald et al 2001; Browne et
al 2000; Eraud & Boutin 2002; Piha et al 2007), similarly for the nesting success (Poulsen et al
1998). Here, the effect of grassland at a fine scale does not seem as determinant compared to
other crops but our category may hide strong disparities (cultivated ray-grass, pastures and hay
meadows vs. set-asides). Dependance towards alfalfa has also been shown previously (Eraud
& Boutin 2002 ; Kragten et al 2008), although more rarely, probably because it is much less
common in the arable landscapes of the British isles were most ecological studies took place.
Skylarks were however also positively associated to spring crops and to cereals at both scales
(table 1). Such a result may look paradoxical because cereal extent comes at the expense of
perennial crops. Moreover, cereals are mainly represented by winter sown wheat in our study
site, a crop type known to hold fewer territories, at least in the late breeding season when the
vegetation structure becomes tall and dense (Wilson et al 1997; Poulsen et al 1998; Eraud &
Boutin 2002). This may result from the fact that the proportion of perennial crops remains small
in our study site (e.g. < 15% of perennial crops of which 4-5% of alfalfa) and hence increases in
wheat surface may foremost lead to a decrease of suboptimal habitats such as oilseed rape,
sunflower and maize crops. The positive effect of each crop type within certain limits may
illustrate the fact that uniform landscapes are suboptimal for breeders and that the diversity of
field types is known to be positively related to Skylark density (Chamberlain & Gregory 1999b;
Chamberlain et al 1999a). The negative effect of woodland and hedgerows was expected but
our results also showed an interaction at the 400m scale between hedgerows and the cover of
cereals, grasslands and spring cultures. Thus, the negative effect of hedgerows may be
moderated by habitat diversity which is once more in accordance with the known preference of
skylarks.
Both non-target and target AES had a positive effect on this non-target farmland bird species.
More specifically, AES targeted towards the little bustard were overall more influential, and
appeared to be less scale-dependent on the skylark than organic farming AES (Table 1). The
only group of AES that positively affected skylarks at both scales of analysis was the AES-safe
nesting. Although weakly significant, this effect was recurrent on skylark abundance,
considering both metrics (percentage of cover and duration) and scales. More particularly, the
duration of “safe nesting” in interaction with alfalfa and grassland proportion at a 400m scale
had the most important positive impact. Thus, the application of these measures on existing, or
historical, leks of the little bustard positively affected skylarks. In this case this may be due to
similar time requirements during the breeding season: Flade et al. (2003) estimated that
skylarks required a 7 week interval between two consecutive silage cuts (including the time
105
required to have a suitable vegetation structure) to nest successfully. Here, the AES “safe
nesting” consists in prohibiting mowing from the 15th May to the 15th July or 31th August. This
timing may be particularly advantageous for skylarks in intensive arable land, providing them
suitable and unspoiled habitats in this critical period of second and third clutches (cutting of
alfalfa generally occurs just before the 15th May, thus generating in the following month a
suitable short sward). Finally, Nitrogen inputs are completely prohibited under this AES, which
may enhance the availability of invertebrate resources as well as their accessibility. Such AES
may be especially important in the skylark population since “classic” but also attractive alfalfa
crops are subjected to frequent mowing that occasion high nest-loss rates and make them
ecological traps.
The proportion of cover of “AES-grassland” had a strong positive, hump-shaped effect, but only
at the 200m scale. Clearly, the effect of this AES is ambiguous because its implementation
results in the modification of habitat parameters. One the one hand, the increase of the cover in
grassland enhances habitat heterogeneity in areas dominated by cereals. In this way, the
positive effect up to a point was expected. On the other hand, such AES mainly involved
cultivated meadows of grass with slight reductions of fertilization (but prohibition of herbicides),
probably still suboptimal as nesting habitats but favourable as feeding sites. In other words, the
increase of the proportion of this AES may enhance food availability at a fine scale, generating
an increase up to a threshold constrained by nesting site availability. Yet, according to our
models, they seem still more attractive than basic grassland areas (1.9 skylarks for 12% of
cover). This difference is consistent with an additional effect of this extensive management,
likely to enhance invertebrate resources.
AES “Organic farming” had a positive effect, essentially at a 400m scale, with an
increase of 28% of skylark abundance with 80% of the crop cover dedicated to organic farming,
indicating that the magnitude of the effect was however slight. These results are consistent with
others studies that showed that organic farming increased biodiversity in homogenous
landscapes (Rundlof & Smith 2006; Smith et al. 2010). Organic farming involves several
extensive managements at a farm scale and has been shown in particular to have a positive
effect on skylark abundance (e.g. Wilson et al. 1997; Chamberlain et al. 1999b; Kragten et al.
2008) through the increase of invertebrate resources, of food accessibility (Morris et al. 2004;
Smith et al. 2009) and the improvement of vegetation structure for nesting (see also Wilson et
al. 1997 ; Poulsen et al. 1998 ; Henderson et al. 2000 ; Kragten et al. 2008). In particular,
Kragten et al. (2008) showed that nest densities were almost seven times higher on organic
farms than on conventional farms. They also pointed out that this may have especially result
both from a preference for alfalfa and spring cereals, and from the fact that these crops were
106
more often found in organic farms. Here, the proportion of alfalfa and several metrics of AES, of
which proportion of organic farming had clearly an additive effect on skylark abundance.
Finally, we didn’t find a clear effect of the delineation of the Special Protected Area on
the abundance of skylarks. At best, it is suggested at a fine scale but not at the large one,
possibly from a local strong heterogeneity within the SPA. Furthermore, no interaction between
AES implementation and the localization of count points within or without the SPA was selected,
which suggests that the eventual difference between habitat structures in the two sides was not
sufficient to modulate the different AES effectiveness on skylark. However this result shows that
the intrinsic quality affecting the long-term trends of skylarks (Brodier et al. submitted), could be
not visible on a short term study. One possible explanation could be the harshness of two
consecutive winters concurrent with the present counting sessions that may have strongly
reduced the difference between the population levels within and outside the SPA.
CONLUSION
In a context of intensive arable land, our study showed that AES dedicated to a rare
emblematic (so called “umbrella”) species may had also positive effects on a widespread but
passerine such as the skylark and may have locally counteract their decline (unpblished data).
Skylarks showed a clear dependance towards habitat heterogeneity which is mainly reflected in
our study site by both the diversity of crop types and the proportion of perennial crops, but they
were also positively affected by management as a whole (i.e.organic farming) and by specific
AES such as “safe nesting” and “grassland”, which may provide important alternative breeding
and feeding habitats respectively. However, our positive results depend on a sufficient cover of
perennial crops. In particular, alfalfa seems to play a key role in providing suitable feeding and
nesting habitats and in facilitating the effect of several AES. The extent to which these habitat
managements had a positive effect clearly depended on the scale considered. Overall, a large
enough landscape scale (i.e. 400m radius) should be considered to encompass all skylark
habitat requirements. Whereas specific habitat managements have been developed in England
(SAFFIE project, Morris et al. 2003, 2004), the global positive impact may be too low (Boatman
et al 2007) and further agricultural mitigation strategies will probably be needed (Boatman et al
2010). In France, such targeted farming managements towards the skylark do not exist. Thus,
the development organic farming as well as conservation tools such as the Natura 2000 network
involving specific AES may be important minimal requirements for the restoration, or at least
stabilization, of their populations.
107
Acknowledgements
This research was supported by DREAL Poitou-Charentes and several ANR projects
(ECOGER, BIODIVAGRIM). SA was supported by a PHD grant from Conseil Général des Deux
Sèvres and Région Poitou-Charentes. We thank A. Desternes, A. Theillout, O. Fontaine, A.
Guerard, J.F. Blanc, A. Villers, F. Vaidie, R. Huot, L, Renaudet, W. Gerbault, H. Bidault and all
researchers who helped S.A. during field work. We finally thank K. Norris for his helpful
comments on the manuscript.
108
References
Aebischer, N.J., Green, R.E., Evans, A.D. (2000). From science to recovery: four case studies of how research has been translated into conservation action in the UK. Ecology and Conservation of Lowland Farmland Birds (eds N.J.Aebischer, A.D.Evans, P.V.Grice & J.A.Vickery), pp. 43–56. British Ornithologist's Union, Tring, UK.
Amano, T., Kusumoto, Y., Okamura, H., Baba, Y. G., Hamasaki, K., Tanaka, K. and Yamamoto, S. (2011). A macro-scale perspective on within-farm management: how climate and topography alter the effect of farming practices. Ecol. Lett. 14: 1263–1272.
Badenhausser, I., Mediene, S., Paris Le Clerc, N. & Bretagnolle, V. (2008). Effects of agri-environnemental agreements on acridids and plant species richness in alfalfa crops. In Hopkins, A. et al. (eds) 22st InternationalSymposium of the European Grassland Federation: 54–56. Uppsala, Sweden: Swedish University of Agricultural Sciences (SLU).
Baines, D., Warren, P. & Calladine, J. (2002). Spatial and temporal differences in the abundance of black grouse and other moorland birds in relation to reductions in sheep grazing. Aspects Appl. Biol. 67: 245–252.
Barton (2011). MuMIn: Multi-model inference. R package version 1.6.6. http://CRAN.R-project.org/package=MuMIn
Batary, P., & Baldi, A., (2004). Evidence of an edge effect on avian nest success. Cons. Biol. 18, 389–400.
Batáry, P., Báldi, A., Kleijn, D., Tscharntke, T., (2011). Landscape-moderated biodiver-sity effects of agri-environmental management—a meta-analysis. Proc. R. Soc. B 278, 1894–1902.
Bates, D., Maechler M. and Bolker, B. (2011). lme4: Linear mixed-effects models using S4 classes. R package version 0.999375-42. http://CRAN.R-project.org/package=lme4.
Bengtsson, J., Ahnström, J. & Weibull, A.C. (2005). The effects of organic agriculture on biodiversity and abundance: a meta- analysis. J. Appl. Ecol., 42, 261–269.
Benton, Vickery, A. J., and Wilson, J. D. (2003). Farmland biodiversity: is habitat heterogeneity the key? Trends in Ecology and Evolution. 18(4): 182-188.
Berthet, E., Bretagnolle, V. and Segrestin, B. (In press). Introduction of semi-perennial forage crops in an intensive cereal plain to restore biodiversity: a need for collective management J. Sust. Agricult. Betts, M. G., L. M. Ganio, M. M. P. Huso, N. A. Som, F. Huettmann, J. Bowman, and B. A. Wintle. (2009). Comment on "Methods to account for spatial autocorrelation in the analysis of species distributional data: a review". Ecography 32:374-378. Boatman, N.D., Jones, N.E., Garthwaite, D. & Pietravalle, S. (2007). Option uptake in Entry Level Scheme agreements in England. In Boatman, N., Bradbury, R., Critchley, C., Holland, J., Marshall, J. & Ogilvy, S. (eds) Aspects of Applied Biology 81, Delivering Arable Biodiversity: 309–316. Wellesbourne: Association of Applied Biologists.
109
Boatman ND, Pietravalle S, Parry HR, Crocker J, Irving PV, Turley DB, Mills J, Dwyer JC (2010). Agricultural land use and Skylark Alauda arvensis: a case study linking a habitat association model to spatially explicit change scenarios. Ibis 152, 63–76
Bradury, R, B. and Allen, D, S. (2003). Evaluation of the impact of the pilot UK Arable Stewardship Scheme on breeding and wintering birds. Bird Study. 50, 131–141
Bretagnolle V., Villers A., Denonfoux L., Cornulier T., Inchausti P., Badenhausser I., (2011). Rapid recovery of a depleted population of Little Bustards Tetrax tetrax following provision of alfalfa through an agri-environmental scheme. Ibis 153, 4-13.
Browne, S., Vickery, J., & Chamberlain, D. (2000). Densities and population estimates of breeding Skylarks (Alauda arvensis) in Britain in 1997. Bird Study 47:52–65
Burnham, K. P. & Anderson, D. R. (2002) Model selection and multi-model inference. A practical information-theoretic approach. Springer Verlag, Berlin, Germany.
Burnham, K. P. & Anderson, D. R. (2004) Multimodel inference. Understanding AIC and BIC in model selection. Sociol. Meth. Res. 33(2): 261-304.
Chamberlain, D.E., & Gregory, R.D. (1999b). Coarse and finescale habitat associations of breeding skylarks Alauda arvensis in the UK. Bird Study, 46, 34–47.
Chamberlain, D.E., Wilson, A.M., Browne, S.J., Vickery, J.A., (1999a). Effects of habitat type and management on the abundance of skylarks in the breeding season. J. Appl. Ecol. 36, 856–870.
Chamberlain, D.E., Vickery, J.A. & Gough, S. (2000). Spatial and temporal distribution of breeding Skylarks Alauda arvensis in relation to crop type in periods of population increase and decline. Ardea 88: 61–73.
Dillon I A., Morris A. J., Bailey C. M. & Uney G., (2009). Assessing the vegetation response to differing establishment methods of ‘Skylark Plots’ in winter wheat at Grange Farm, Cambridgeshire, England. Conservation Evidence, 6, 89-97
Donald, P.F., Vickery, J.A., (2000). The importance of cereal fields for breeding and wintering Skylarks Alauda arvensis in the UK. Ecology and Conservation of Lowland Farmland Birds (eds N.J. Aebischer, A.D. Evans, P.V. Grice & J.A. Vickery), pp. 140–150. British Ornithologists’ Union, Tring, UK.
Donald, P.F., Evans, A.D., Muirhead, L.B, Burckingahm, D.L, & Wilson, J.D (2001a). Factors affecting the territory distribution of Skylarks Alauda arvensis wintering on lowland farmland. Bird Study. 48: 271-278.
Donald, P.F., Buckingham, D.L., Moorcroft, D., Muirhead, L.B., Evans, A.D., Kirby, W.B., (2001b). Habitat use and diet of skylarks Alauda arvensis wintering on lowland farmland in southern Britain. J. Appl. Ecol. 38, 536–547.
Donald, P.F., Evans, A.D., Muirhead, L.B., Buckingham, D.L., Kirby, W.B. & Schmitt, S.I.A., (2002). Survival rates, causes of failure and productivity of Skylark Alauda arvensis nests on lowland farmland. Ibis. 144, 652–664.
110
Donald P. F., (2004). The skylark London : T & A D Poyser
Eaton M.A., Brown A.F., Noble D.G., Musgrove A.J., Hearn R., Aebischer N.J., Gibbons D.W., Evans A. & Gregory R.D. (2009) Birds of Conservation Concern 3: the population status of birds in the United Kingdom, Channel Islands and the Isle of Man. British Birds, 102, 296-341.
Elston, D. A., Moss, R., Boulinier, T., Arrowsmith, C., and Lambin, X,. (2001). Analysis of aggregation, a worked example: numbers of ticks on red grouse chicks. Parasitology. 122(5): 563-569 Eraud, C. (2002). Ecologie de l'Alouette des Champs Alauda arvensis en Milieux Cultivés : Caractéristiques Ecologiques de l'Habitat et Perspectives de Conservation. PhD thesis, Ecole Pratique des Hautes Etudes, France.
Eraud, C., Boutin, J.M., (2002). Density and productivity of breeding skylarks Alauda arvensis in relation to crop type on agricultural lands in western France. Bird Study 49, 287–296.
Erdos, S,. Báldi, A., & Batáry, P., (2009). Nest site selection and breeding ecology of Sky Larks Alauda arvensis in Hungarian farmland. Bird Study. 56, 259-263
Flade, M., Platcher, H., Schmidt, R. & Werner, A. (2003). Nature Conservation in Agricultural Ecosystems: Results of the Schorfheide- Chorin Research Project. Wiebelsheim, Germany: Quelle & Meyer.
Flieβbach A., Oberholzer H.R., Gunst L. & Mäder P., 2007. Soil organic matter and biological soil quality indicators after 21 years of organic and conventional farming. Agric. Ecosystems Environ., 118, 273-274.
Fuentes-Montemayor, E., Goulson, D., Park, K.J., 2011. The effectiveness of agri- environment schemes for the conservation of farmland moths: assessing the importance of a landscape-scale management approach. J. Appl. Ecol. 48, 532–542.
Gabriel, D. & Tscharntke, T. (2007). Insect pollinated plants benefit from organic farming. Agr. Ecosyst. Environ. 118: 43–48
Gelman, A. (2008) Scaling regression inputs by dividing by two standard deviations. Statistics in Medicine, 27: 2865-2873.
Gillings, S., Fuller, R.J., (2001). Habitat selection by skylarks Alauda arvensis wintering in Britain in 1997/98. Bird Study, 48, 293–307.
Henderson, I.G., Cooper, J., Fuller, R.J. & Vickery, J. (2000). The relative abundance of birds on set-aside and neighbouring fields in summer. J. Appl. Ecol. 37: 335–347.
Henle. J., Alard. D., Clitherow, J., Cobb, P., Firbank, L., Kull, T., McCracken, D., Moritz, R.F.A., Niemelä, J., Rebane, M., Wascher, D., Watt, A., Young, J,. (2008). Identifying and managing the conflicts between agriculture and biodiversity conservation in Europe–A review. Agriculture, Ecosystems and Environment, 124, 60-71. Hole, D.G., Perkins, A.J., Wilson, J.D., Alexander, I.H., Grice, P.V. & Evans, A.D., (2005). Does organic farming benefit biodiversity? Biological Conservation, 122, 113–130.
Hutchinson, J.M.C. & Griffith, S.C., (2008). Extra-pair paternity in the Skylark Alauda arvensis. Ibis. 150, 90–97.
111
Jonason. D., Andersson. GKS., Ockinger. E., Rundlöf, M., Smith, HG., & Bengtsson, J. (2011) Assessing the effect of time since transition to organic farming on plants and butterflies. J. Appl. Ecol. 48:543–550
Kleijn, D., Berendse, F., Smit, R., Gilissen, N., Smit, J., Brak, B. & Groeneveld R (2004) Ecological effectiveness of agri-environment schemes in different agricultural landscapes in The Netherlands. Conserv. Biol. 18:775–786.
Kleijn, D. & Sutherland, W.J., (2003). How effective are European agri-environment schemes in conserving and promoting bio-diversity? J. Appl. Ecol., 40, 947–969.
Kleijn, D., Baquero, R.A., Clough, Y., Diaz, M., De Esteban,J., Fernandez, F., Gabriel, D., Herzog, F., Holzschuh, A.,Johl, R., Knop, E., Kruess, A., Marshall, E.J.P., Steffan-Dewenter, I., Tscharntke, T., Verhulst, J., West, T.M. & Yela, J.L., (2006). Mixed biodiversity benefits of agri-environment schemes in five European countries. Ecology Letters, 9, 243–254.
Kragten, S., Trimbos, K. B., De Snoo, G. R., (2008). Breeding skylarks (Alauda arvensis) on organic and conventional arable farms in The Netherlands. Agriculture, Ecosystems and Environment, 126, 163-167.
Lemaire, G., Hodgson, S., & Chabbi, A., (2011). Grassland productivity and ecosystem services. CAB international 2011. Chapter 26, 251-260.
Mannion, A. M., (1995). Agriculture and environmental change. Temporal and spacial dimensions. Wiley, Sussex.
Maindonald, J. and J. Braun. (2010). Data Analysis and Graphics Using R, An Example-Based Approach. 3d ed., Cambridge University Press.
Millennium Ecosystem Assessment, (2005). Ecosystems and Human Well-being: Synthesis, Island Press, Washington, DC, USA, 155 p.
MNHN, 2009. vigienature.mnhn.fr
Morris, A.J., Bradbury, R.B. & Evans, A.D. (2003) Sustainable Arable Farming For an Improved Environment: the effects of novel winter wheat sward management on Skylarks (Alauda arvensis). In BCPC International Congress – Crop Science & Technology 2003: Congress Proceedings: 227-232. Alton: BCPC
Morris, A.J., Holland, J.M., Smith, B., Jones, N.E., (2004). Sustainable Arable Farming for an Improved Environment (SAFFIE): managing winter wheat sward structure for Skylarks Alauda arvensis. Ibis, 146, 155–162.
Perkins, A.J., Maggs, H.E., Watson, A. & Wilson, J.D., (2011). Adaptive management and targeting of agri-environment schemes does benefit biodiversity: a case study of the corn bunting Emberiza calandra. J. Appl. Ecol. 48, 514–522.
Piha, M., Linden, A., Pakkala, T. & Tiainen, J. (2007). Linking weather and habitat to population dynamics of a migratory farmland songbird. Ann. Zool. Fenn. 44: 20–34.
Poulsen JG. (1996). Behaviour and parantal care of skylark Alauda arvensis chicks. Ibis 138:525–531.
112
Poulsen, J.G., Sotherton, N.W. & Aebischer, N.J. (1998). Comparative nesting and feeding ecology of skylarks Alauda arvensis on arable farmland in southern England with special reference to set-aside. J. Appl. Ecol., 35, 131–147.
Ribeiro Jr, P. J. & Diggle, P. J. (2001) geoR: a package for geostatistical analysis. R-News, 1, 15-18.
Robinson, R.A., Wilson, J.D., Crick, H.Q.P., 2001. The importance of arable habitat for farmland birds in grassland landscapes. J. Appl. Ecol. 38, 1059–1069.
Rundlöf, M., & Smith, H.G. (2006). The effect of organic farming on butterfly diversity depends on landscape context. J. Appl. Ecol. 43, 1121–1127.
Rundlöf, M., Bengtsson, J., and Smith, HG. (2008). Local and landscape effects of organic farming on butterfly species richness and abundance. Journal of Applied Ecology. 45, 813–820.
Schielzeth, H. (2010) Simple means to improve the interpretability of regression coefficients. Methods in Ecology and Evolution, 1: 103-113.
Smith, B., Holland, J., Jones, N., Moreby, S., Morris, A.J., Southway, S., (2009). Enhancing invertebrate food resources for Skylarks in cereal ecosystems: how useful are in-crop agri-environment scheme management options? J. Appl. Ecol. 46, 692–702.
Smith, H.G., Dänhardt, J., Lindström, Å., Rundlöf, M., 2010. Consequences of organic farming and landscape heterogeneity for species richness and abundance of farmland birds. Oecologia 162, 1071–1079.
Tscharntke, T., Klein, A.M., Kruess, A., Steffan-Dewenter, I., Thies, C. (2005). Landscape perspectives on agricultural intensification and biodiversity- ecosystem service management. Ecology Letters. 8: 857–874.
Vorisek P, Jiguet F, van Strien A, S korpilova J, Klvanova A, Gregory RD,. (2010). Trends in abundance and biomass of widespread European farmlands birds: how much have we lost? In: BOU proceedings - Lowland Farmland Birds III.
Walker, K.J., Stevens, P.A., Stevens, D.P., Mountford, J.O., Manchester, S.J & Pywell, R.F. (2004). The restoration and re-creation of species-rich lowland grassland on land formerly managed for intensive agriculture in the UK. Biol. Conserv. 119, 1–18.
Whittingham, M.J. (2007). Will agri-environment schemes deliver substantial biodiversity gain, and if not why not? J. Appl. Ecol, 44, 1–5.
Whittingham,M.J., (2011). The future of agri-environment schemes: biodiversity gains and ecosystem service delivery? J. Appl. Ecol, 48, 509-513.
Wilson, J.D., Evans, J., Browne, S.J. & King, J.R. (1997). Territory distribution and breeding success of Skylarks Alauda arvensis on organic and intensive farmland in southern England. J. Appl. Ecol. 34: 1462–1478.
Wilson, J.D. (2001). Foraging habitat selection by Skylarks Alauda arvensis on lowland farmland during ,the nestling period. In Donald, P.F. & Vickery, J.A. (eds) The Ecology and Conservation of Skylarks Alauda arvensis: 91-102. Sandy: RSPB.
113
Winqvist, C., Bengtsson, J., Aavik, T., Frank Berendse, Clement, L., W., Eggers, S., Fischer, C., Flohre, A., Geiger, F., Jaan Liira, Pärt, T., Thies, C., Tscharntke, T., Weisser, W. W., Bommarco, R. (2011). Mixed effects of organic farming and landscape complexity on farmland biodiversity and biological control potential across Europe. J. Appl. Ecol. 48 (3): 570–579.
Woodcock, B.A., Potts, S.G., Tscheulin, T., Pilgrim, E., Ramsey, A.J., Harrison-Cripps, J., Brown, V.K. & Tallowin, J.R. (2009). Responses of invertebrate trophic level, feeding guild and body size to the management of improved grassland field margins. J. Appl. Ecol, 46, 920–929.
Zahn, A., Englmaier, I. & Drobny, M. (2010). Food availability for insectivores in grasslands – arthropod abundance in pastures, meadows and fallow land. Appl. Ecol. Env. Res. 8, 87-100
Zuur, A. F., Ieno, E. N., Walker, N., Saveliev, A. A. & Smith, G. M. (2009) Mixed Effects Models and Extensions in Ecology with R, Springer-Verlag, New York.
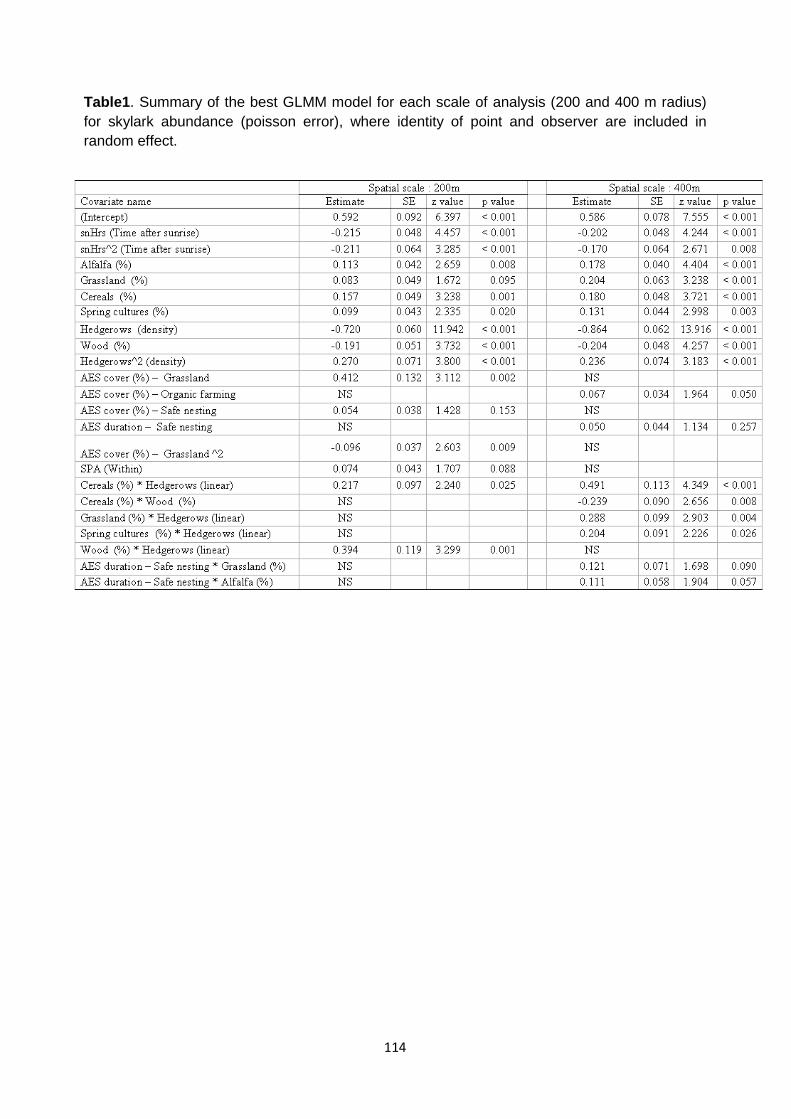
114
Table1 . Summary of the best GLMM model for each scale of analysis (200 and 400 m radius) for skylark abundance (poisson error), where identity of point and observer are included in random effect.
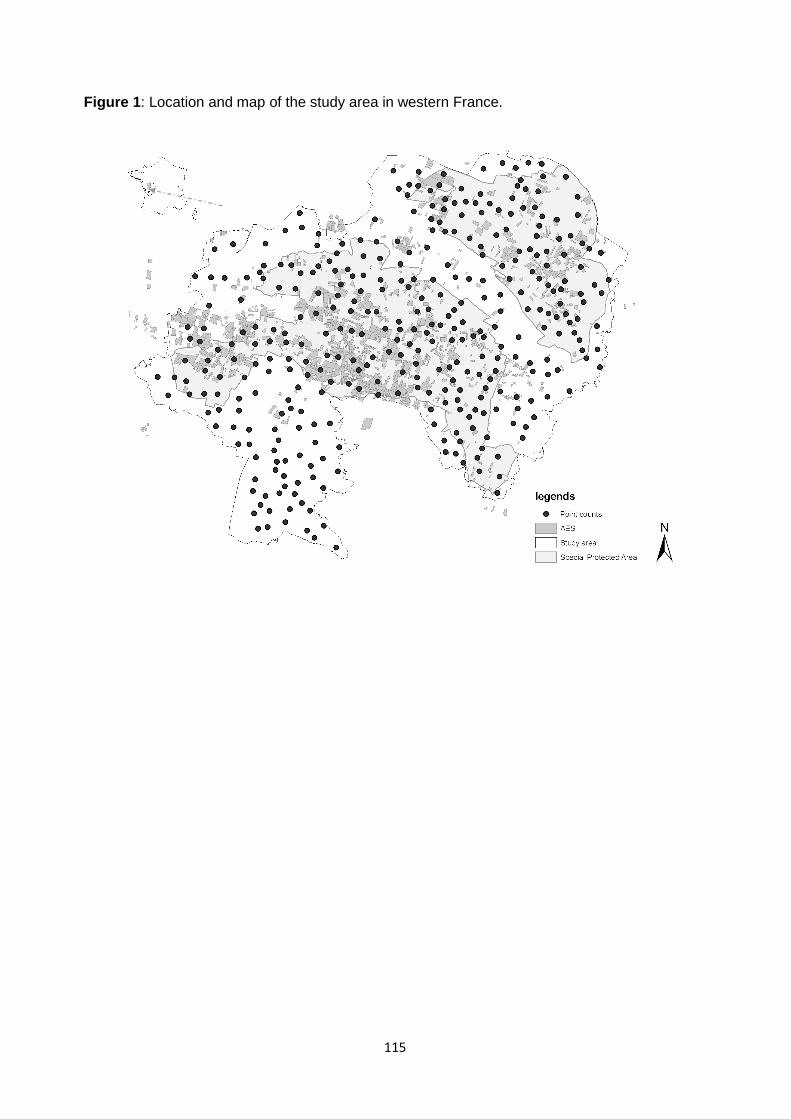
115
Figure 1 : Location and map of the study area in western France.
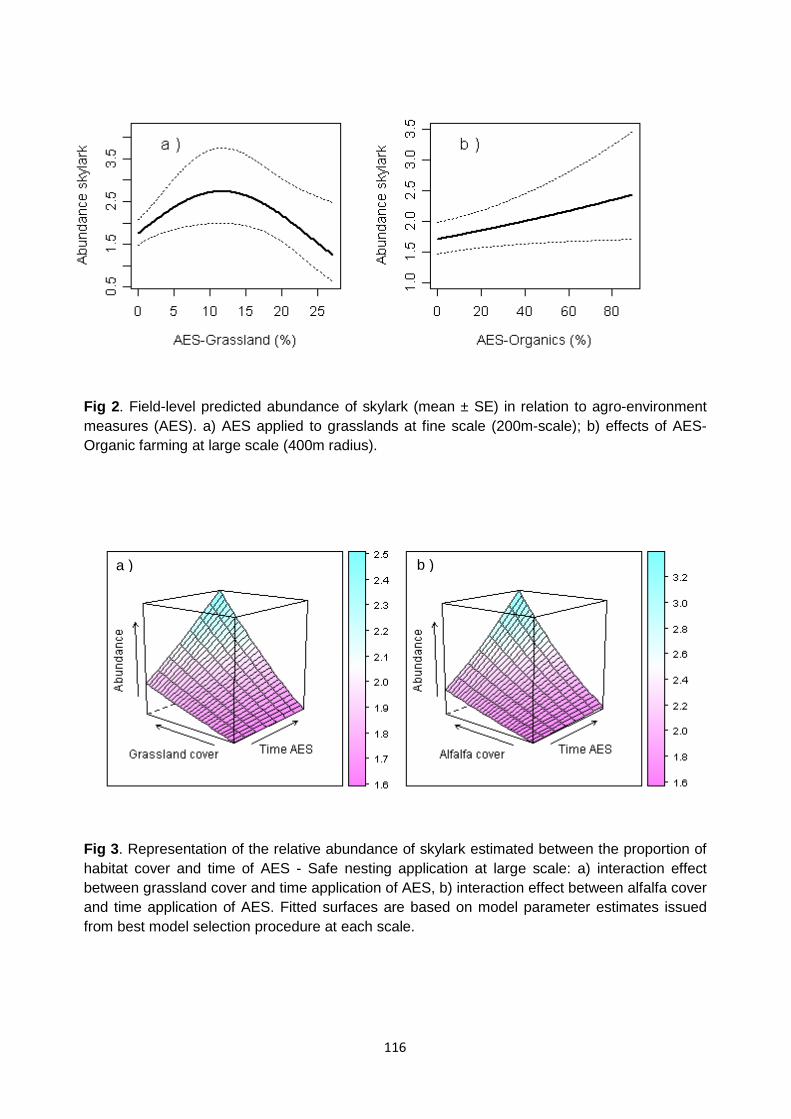
116
Fig 2 . Field-level predicted abundance of skylark (mean ± SE) in relation to agro-environment measures (AES). a) AES applied to grasslands at fine scale (200m-scale); b) effects of AES- Organic farming at large scale (400m radius).
Fig 3 . Representation of the relative abundance of skylark estimated between the proportion of habitat cover and time of AES - Safe nesting application at large scale: a) interaction effect between grassland cover and time application of AES, b) interaction effect between alfalfa cover and time application of AES. Fitted surfaces are based on model parameter estimates issued from best model selection procedure at each scale.
a ) b )
Appendix 1
Description of the four aims.
“Extensive arable crops schemes”: combined 4 schemes dedicated to the reduction by 40%
of herbicide application, limitation of fertilization to 120 UN/ha and combination of both at farm
scale, plus practical of no-tillage. This aim contributes to enhancing water quality and to
increase foods (weeds & invertebrate of soil), in intensive arable land, typically where this
schemes was applied.
“Organic farming”: was characterized by two schemes “organic conversion” and “organic
maintain”, where pesticide and herbicide was prohibited, and fertilization limited at 120
UN/ha/year. The aim was to increase at farm scale the quantity of weed and invertebrate
resources by the enhancement of the quality of habitats and no-agrochemical product.
“Grassland”: combined three schemes dedicated to perennial crops, both of them was used
for the conversion of arable land into grassland and alfalfa crops and the last was used
perpetuated the perennial crops, with limitation of fertilization to 60 uN, 90 uP, 160 uK/ha/year,
and herbicide prohibited. The aim combines to objective i) enhancing the number of stable
patch, for extensification of the matrix and improve the connectivity, ii) increase the resources
and provide the availability in nesting sites and resources.
“Safe nesting”: was characterized by the practice of mowing delayed on alfalfa or grassland,
with two time cut (15May-15Jully and 15May-31August), moreover in this fields, was banned
herbicide, fertilized. These schemes were applied to increase the nesting success by the
delayed cutting, and food resources abundance.
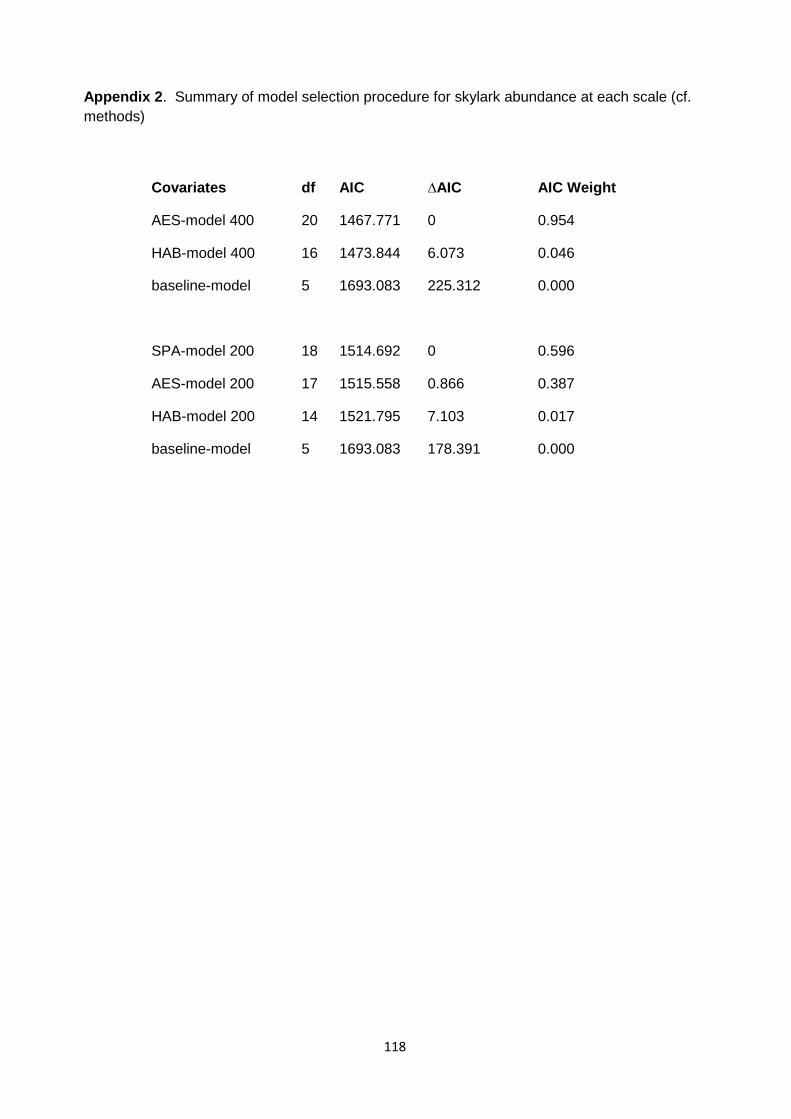
118
Appendix 2 . Summary of model selection procedure for skylark abundance at each scale (cf. methods)
Covariates df AIC ∆AIC AIC Weight
AES-model 400 20 1467.771 0 0.954
HAB-model 400 16 1473.844 6.073 0.046
baseline-model 5 1693.083 225.312 0.000
SPA-model 200 18 1514.692 0 0.596
AES-model 200 17 1515.558 0.866 0.387
HAB-model 200 14 1521.795 7.103 0.017
baseline-model 5 1693.083 178.391 0.000
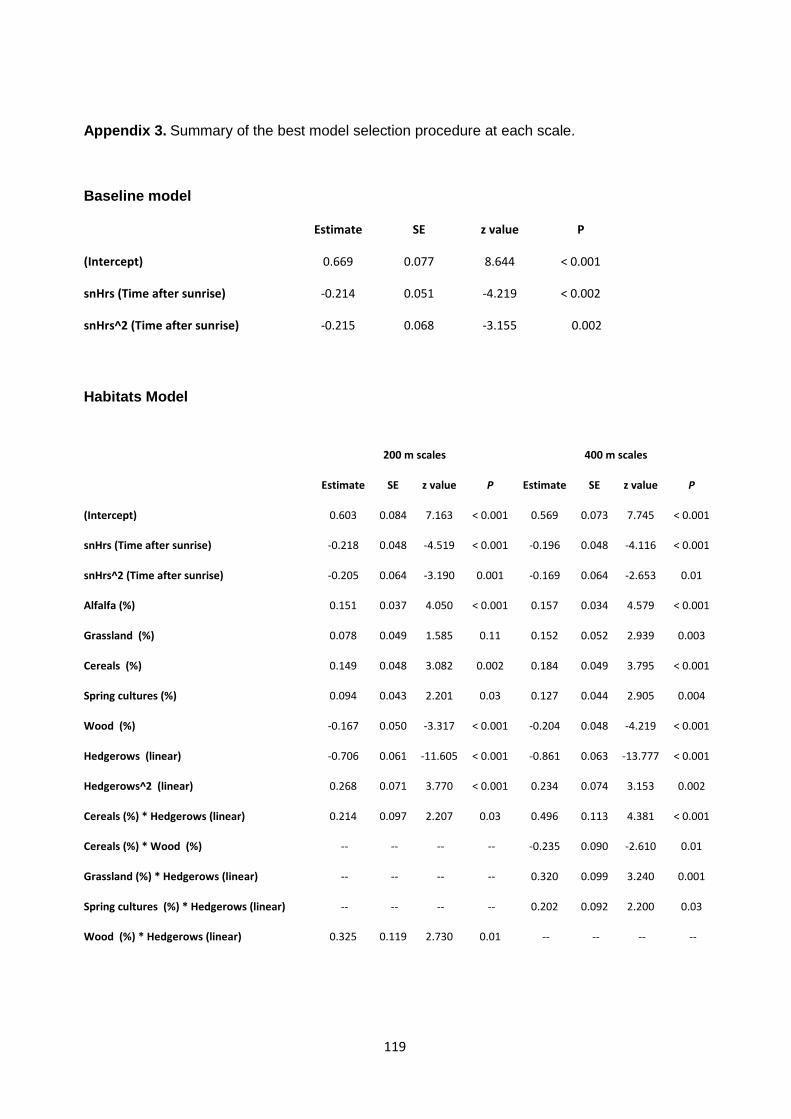
119
Appendix 3. Summary of the best model selection procedure at each scale.
Baseline model
Habitats Model
Estimate SE z value P
(Intercept) 0.669 0.077 8.644 < 0.001
snHrs (Time after sunrise) -0.214 0.051 -4.219 < 0.002
snHrs^2 (Time after sunrise) -0.215 0.068 -3.155 0.002
200 m scales 400 m scales
Estimate SE z value P Estimate SE z value P
(Intercept) 0.603 0.084 7.163 < 0.001 0.569 0.073 7.745 < 0.001
snHrs (Time after sunrise) -0.218 0.048 -4.519 < 0.001 -0.196 0.048 -4.116 < 0.001
snHrs^2 (Time after sunrise) -0.205 0.064 -3.190 0.001 -0.169 0.064 -2.653 0.01
Alfalfa (%) 0.151 0.037 4.050 < 0.001 0.157 0.034 4.579 < 0.001
Grassland (%) 0.078 0.049 1.585 0.11 0.152 0.052 2.939 0.003
Cereals (%) 0.149 0.048 3.082 0.002 0.184 0.049 3.795 < 0.001
Spring cultures (%) 0.094 0.043 2.201 0.03 0.127 0.044 2.905 0.004
Wood (%) -0.167 0.050 -3.317 < 0.001 -0.204 0.048 -4.219 < 0.001
Hedgerows (linear) -0.706 0.061 -11.605 < 0.001 -0.861 0.063 -13.777 < 0.001
Hedgerows^2 (linear) 0.268 0.071 3.770 < 0.001 0.234 0.074 3.153 0.002
Cereals (%) * Hedgerows (linear) 0.214 0.097 2.207 0.03 0.496 0.113 4.381 < 0.001
Cereals (%) * Wood (%) -- -- -- -- -0.235 0.090 -2.610 0.01
Grassland (%) * Hedgerows (linear) -- -- -- -- 0.320 0.099 3.240 0.001
Spring cultures (%) * Hedgerows (linear) -- -- -- -- 0.202 0.092 2.200 0.03
Wood (%) * Hedgerows (linear) 0.325 0.119 2.730 0.01 -- -- -- --
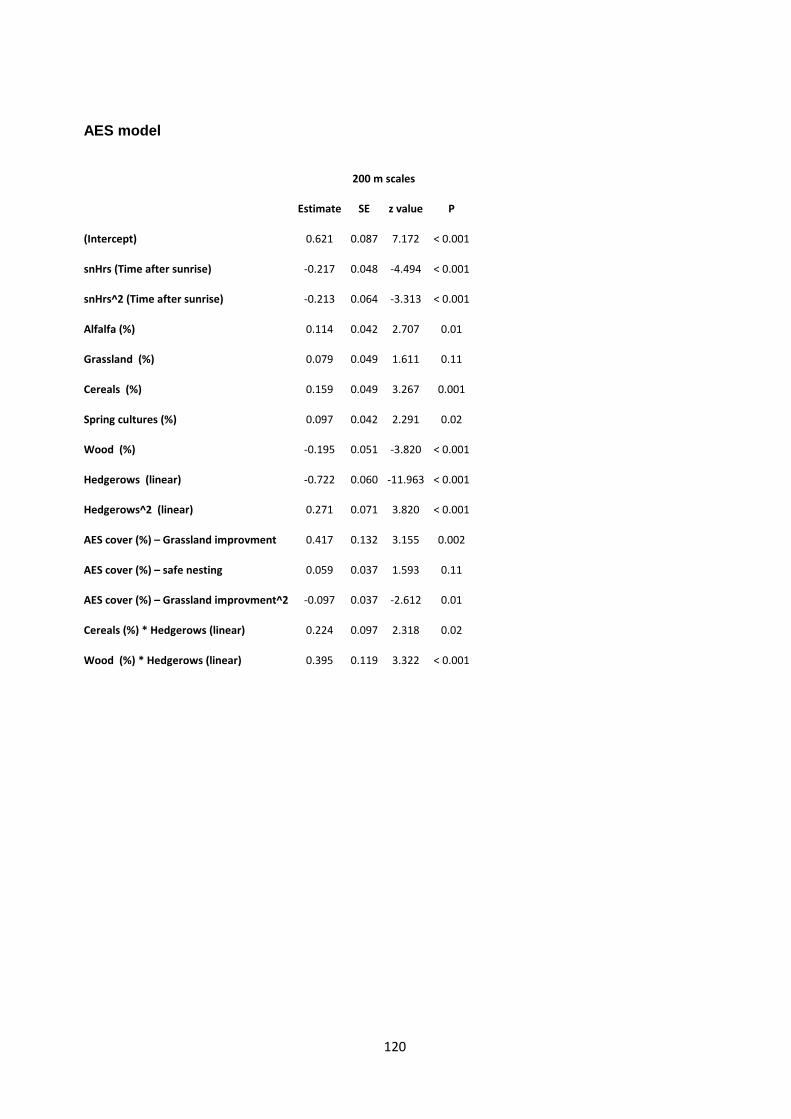
120
AES model
200 m scales
Estimate SE z value P
(Intercept) 0.621 0.087 7.172 < 0.001
snHrs (Time after sunrise) -0.217 0.048 -4.494 < 0.001
snHrs^2 (Time after sunrise) -0.213 0.064 -3.313 < 0.001
Alfalfa (%) 0.114 0.042 2.707 0.01
Grassland (%) 0.079 0.049 1.611 0.11
Cereals (%) 0.159 0.049 3.267 0.001
Spring cultures (%) 0.097 0.042 2.291 0.02
Wood (%) -0.195 0.051 -3.820 < 0.001
Hedgerows (linear) -0.722 0.060 -11.963 < 0.001
Hedgerows^2 (linear) 0.271 0.071 3.820 < 0.001
AES cover (%) – Grassland improvment 0.417 0.132 3.155 0.002
AES cover (%) – safe nesting 0.059 0.037 1.593 0.11
AES cover (%) – Grassland improvment^2 -0.097 0.037 -2.612 0.01
Cereals (%) * Hedgerows (linear) 0.224 0.097 2.318 0.02
Wood (%) * Hedgerows (linear) 0.395 0.119 3.322 < 0.001

121
Chapitre V
Disc uss ion, con clusion et pers pective s
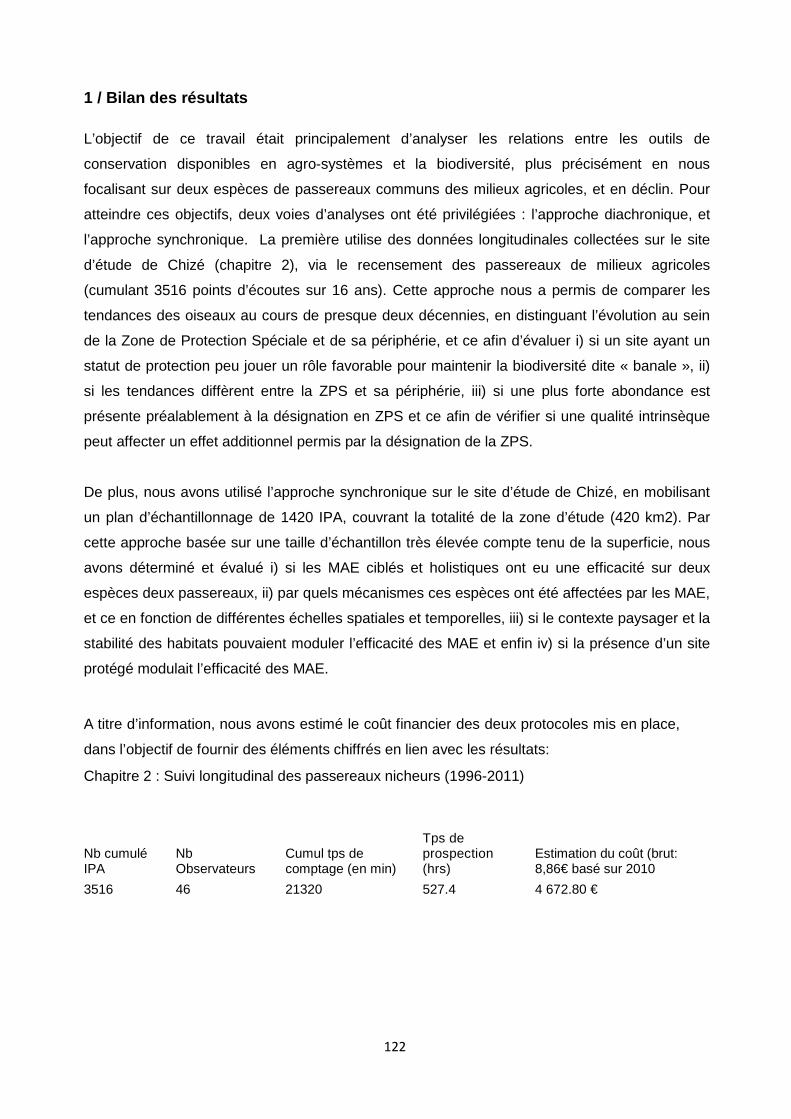
122
1 / Bilan des résultats L’objectif de ce travail était principalement d’analyser les relations entre les outils de
conservation disponibles en agro-systèmes et la biodiversité, plus précisément en nous
focalisant sur deux espèces de passereaux communs des milieux agricoles, et en déclin. Pour
atteindre ces objectifs, deux voies d’analyses ont été privilégiées : l’approche diachronique, et
l’approche synchronique. La première utilise des données longitudinales collectées sur le site
d’étude de Chizé (chapitre 2), via le recensement des passereaux de milieux agricoles
(cumulant 3516 points d’écoutes sur 16 ans). Cette approche nous a permis de comparer les
tendances des oiseaux au cours de presque deux décennies, en distinguant l’évolution au sein
de la Zone de Protection Spéciale et de sa périphérie, et ce afin d’évaluer i) si un site ayant un
statut de protection peu jouer un rôle favorable pour maintenir la biodiversité dite « banale », ii)
si les tendances diffèrent entre la ZPS et sa périphérie, iii) si une plus forte abondance est
présente préalablement à la désignation en ZPS et ce afin de vérifier si une qualité intrinsèque
peut affecter un effet additionnel permis par la désignation de la ZPS.
De plus, nous avons utilisé l’approche synchronique sur le site d’étude de Chizé, en mobilisant
un plan d’échantillonnage de 1420 IPA, couvrant la totalité de la zone d’étude (420 km2). Par
cette approche basée sur une taille d’échantillon très élevée compte tenu de la superficie, nous
avons déterminé et évalué i) si les MAE ciblés et holistiques ont eu une efficacité sur deux
espèces deux passereaux, ii) par quels mécanismes ces espèces ont été affectées par les MAE,
et ce en fonction de différentes échelles spatiales et temporelles, iii) si le contexte paysager et la
stabilité des habitats pouvaient moduler l’efficacité des MAE et enfin iv) si la présence d’un site
protégé modulait l’efficacité des MAE.
A titre d’information, nous avons estimé le coût financier des deux protocoles mis en place,
dans l’objectif de fournir des éléments chiffrés en lien avec les résultats:
Chapitre 2 : Suivi longitudinal des passereaux nicheurs (1996-2011)
Nb cumulé IPA
Nb Observateurs
Cumul tps de comptage (en min)
Tps de prospection (hrs)
Estimation du coût (brut: 8,86€ basé sur 2010
3516 46 21320 527.4 4 672.80 €
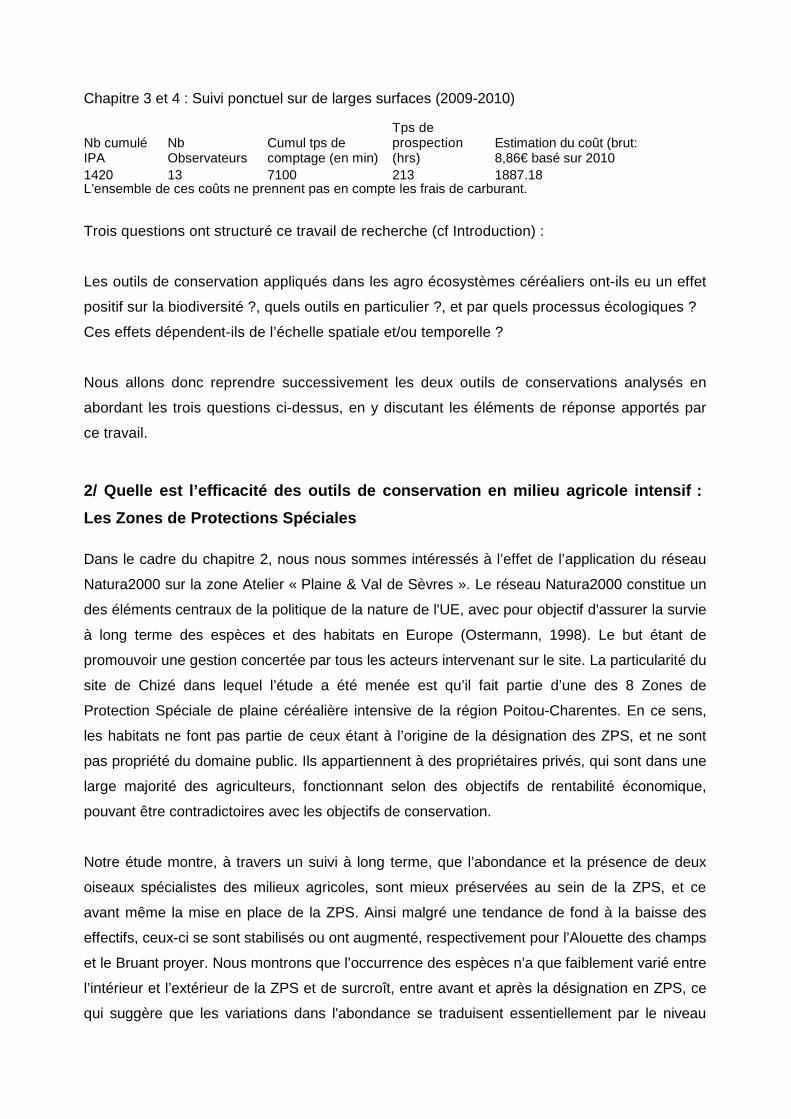
Chapitre 3 et 4 : Suivi ponctuel sur de larges surfaces (2009-2010)
Nb cumulé IPA
Nb Observateurs
Cumul tps de comptage (en min)
Tps de prospection (hrs)
Estimation du coût (brut: 8,86€ basé sur 2010
1420 13 7100 213 1887.18 L’ensemble de ces coûts ne prennent pas en compte les frais de carburant. Trois questions ont structuré ce travail de recherche (cf Introduction) :
Les outils de conservation appliqués dans les agro écosystèmes céréaliers ont-ils eu un effet
positif sur la biodiversité ?, quels outils en particulier ?, et par quels processus écologiques ?
Ces effets dépendent-ils de l’échelle spatiale et/ou temporelle ?
Nous allons donc reprendre successivement les deux outils de conservations analysés en
abordant les trois questions ci-dessus, en y discutant les éléments de réponse apportés par
ce travail.
2/ Quelle est l’efficacité des outils de conservati on en milieu agricole intensif :
Les Zones de Protections Spéciales
Dans le cadre du chapitre 2, nous nous sommes intéressés à l’effet de l’application du réseau
Natura2000 sur la zone Atelier « Plaine & Val de Sèvres ». Le réseau Natura2000 constitue un
des éléments centraux de la politique de la nature de l'UE, avec pour objectif d'assurer la survie
à long terme des espèces et des habitats en Europe (Ostermann, 1998). Le but étant de
promouvoir une gestion concertée par tous les acteurs intervenant sur le site. La particularité du
site de Chizé dans lequel l’étude a été menée est qu’il fait partie d’une des 8 Zones de
Protection Spéciale de plaine céréalière intensive de la région Poitou-Charentes. En ce sens,
les habitats ne font pas partie de ceux étant à l’origine de la désignation des ZPS, et ne sont
pas propriété du domaine public. Ils appartiennent à des propriétaires privés, qui sont dans une
large majorité des agriculteurs, fonctionnant selon des objectifs de rentabilité économique,
pouvant être contradictoires avec les objectifs de conservation.
Notre étude montre, à travers un suivi à long terme, que l’abondance et la présence de deux
oiseaux spécialistes des milieux agricoles, sont mieux préservées au sein de la ZPS, et ce
avant même la mise en place de la ZPS. Ainsi malgré une tendance de fond à la baisse des
effectifs, ceux-ci se sont stabilisés ou ont augmenté, respectivement pour l’Alouette des champs
et le Bruant proyer. Nous montrons que l’occurrence des espèces n’a que faiblement varié entre
l’intérieur et l’extérieur de la ZPS et de surcroît, entre avant et après la désignation en ZPS, ce
qui suggère que les variations dans l'abondance se traduisent essentiellement par le niveau
124
d'agrégation plutôt que par un processus de colonisation ou d’extinction. Cependant, il est
apparu un effet statistique interactif entre la variable ZPS et la période (avant/après désignation)
significatif, attestant d’un effet positif réel après 2004 sur l’abondance. Cette étude constitue
ainsi la première analyse issue d’une série à long terme sur l’évolution de deux espèces de
passereaux en déclin en agro-écosystème céréalier en relation avec la mise en place de
Natura2000. En ce sens la prise en compte d’espèces patrimoniales (cf Directive Oiseaux) dans
la désignation d’un site en ZPS, utilisées en partie comme garant des autres espèces vivant
dans un même milieu, a ainsi permis indirectement d’assurer le maintien voir l’augmentation de
deux espèces typiques de la biodiversité « ordinaire », mais spécialiste.
Eléments de méthodologie
Le protocole a été appliqué pour la première fois en 1996 avec pour objectif d’échantillonner et
de suivre les communautés de passereaux des milieux ouverts, et ce indépendamment de la
délimitation de la Zone d’Importance Communautaire pour les Oiseaux préalablement définis
pour l’ensemble du cortège d’espèces d’oiseaux présents sur certaine partie de la zone. La
réduction du périmètre de la ZPS lors de l’analyse (contraction de 500 mètres vers le centre)
avait ainsi pour objectif principal de se focaliser exclusivement sur le cœur des zones de fortes
concentrations en outardes. Cette décision nous est apparue judicieuse afin d’évaluer au
mieux l’effet du site, classé préalablement en Zone d’Importance Communautaire pour les
Oiseaux, puis en Zone de Protection Spéciale, vis-à-vis de sa périphérie et de l’extérieure de la
zone. Par la même occasion ceci a permis un réajustement de l’effectif dans le nombre de
points de comptage entre l’intérieur et l’extérieur de la zone, dans l’objectif d’améliorer la
capacité explicative des modèles au cours des 16 années de suivis. Il est alors intéressant de
noter que ce réajustement nous permet par la même occasion d’appuyer plus fortement encore
sur un effet ZPS, étant donné qu’une petite partie des points en périphériques (situé entre -
500m et la délimitation administrative) est été intégrée au pool hors ZPS.
Apport du monitoring a long terme:
Bien qu’encore exceptionnelle, l’utilisation de données à long terme tend à s’imposer comme
élément indispensable afin de déterminer et d’évaluer la relation existante entre l’évolution des
paysages, les tendances des espèces et les variations climatiques, et ce sur de larges
échelles (Chamberlain et al. 2001, Julliard et al. 2004a, Julliard et al. 2004b, Devictor et al.
2008). Dans notre cas le recours à ce type de données standardisées a été crucial afin
d’évaluer précisément l’apport environnemental de la désignation d’un site en Zone de
Protection Spéciale. Et qui plus est de vérifier si spatialement et temporellement nous
détections une ou plusieurs variation(s) dans les tendances de ces deux espèces en relation
avec le statut de conservation du site et l’évolution des habitats. La mise en lumière d’un effet
site pré-existant à la délimitation ZPS de 2004 précise qu’il est indispensable de prendre en
125
compte la qualité intrinsèque des sites lors de campagne d’échantillonnage et de suivi. Ce
résultat va clairement dans le sens des points soulignés par Kleijn & Sutherland, (2003) (cf.
introduction) qui explicitent que très peu d’études ont distingué si des différences initiales
existaient, ce qui tendaient à biaiser les résultats observés évaluant les relations entre des
variables de compositions et structures du paysage, avec l’effet de mesures compensatoires et
ce sur la biodiversité. En conclusion les zones ayant préalablement un statut de conservation
dans lesquelles des mesures compensatoires vont être appliquées peuvent soutenir une plus
forte biodiversité qu’à l’extérieur (Kleijn & van Zuijlen 2004).
Le réseau de ZPS à une échelle nationale …
Ainsi plus globalement en France la délimitation des sites Natura2000 a souvent été impulsée
par des opportunités, plutôt que par des analyses écologiques strictes. Aussi, et dans un souci
de limiter les conflits entre les différents acteurs, la désignation a été dans une large majorité
des cas orienté sur des sites préalablement désignés en Zone Naturelle d’Intérêts Ecologique
Faunistique et Floristique (ZNIEFF) ou en Zones d’Importance Communautaire pour les
Oiseaux (ZICO), bases actuelles des Zones Spéciale de Conservation et Zones de Protection
Spéciale (Comas, 2005). Qui dans une très large partie était déjà intégrées au sein des
espaces protégés tels que les Parcs Naturels Régionaux et Nationaux et réserves naturelles.
En dehors de toutes ces zones déjà répertoriées au niveau français, peu de sites
supplémentaires ont été créés (Berthet, 2011).
Une seule étude en France à notre connaissance a été menée à large échelle afin de tester
l’effet des ZPS sur l’abondance et estimer la part de la taille population d’une vingtaine
d’espèces de passereaux présents en ZPS, en utilisant une approche par krigeage issue de
983 carrés suivis dans le cadre du programme des oiseaux nicheurs entre 2001 et 2004 (Godet
et al.2007). Les résultats suggèrent que le réseau de ZPS n'a qu’une faible éfficacité en terme
de conservation au niveau national pour des espèces d’oiseaux les plus répandues, mais
permet d'atteindre une valeur cible de 5% pour les espèces les plus localisées (Godet et al.
2007). Ainsi pour l’alouette des champs, ils estiment que moins de 2.15 % de la taille de
population nationale est présente en ZPS, d’une manière générale ils montrent que sur les 20
espèces utilisées seules 3 atteignent le seuil de 5% (Anthus pratensis, Sylvia undata et
Emberiza hotulana). Cependant bien que le réseau Natura2000 couvre 12.6% du territoire
national (Insee, 2010), il couvre néanmoins une très large partie de sites englobant des zones
littorales ou montagneuses (Comas, 2005). Or près de la moitié de la surface du territoire
métropolitain est actuellement utilisée pour l’agriculture et près de 25% des espèces des
milieux agricoles enregistrent un large déclin sur la période 1989-2009 (MNHN, 2009). En ce
sens, étant basé sur des inventaires historiques et lié à la présence d’espèce classé dans
l’annexe I de la directive Oiseaux, ce réseau n’est pas spécifiquement destiné à la préservation
126
des espèces ordinaires, voire des passereaux plus globalement issus des zones agricoles et
forestières.
Viabilité du réseau :
Berthet (2011), mentionne dans le cadre du rapport que la Commission a transmis au Conseil
et au Parlement européen (2009), que « les mesures de conservation établies par la directive
ainsi que le financement et les autres instruments prévus dans le cadre des politiques
sectorielles peuvent donner de bons résultats ». Cependant l’évaluation vise pour une large
part un suivi de l’état de conservation des espèces et des habitats d’intérêt communautaire,
ainsi très précisément la biodiversité commune et les conditions de succès ou d’échec ne sont
pris en compte (Berthet, 2011).
De plus, une récente enquête menée par France Nature Environnement en 2011, fait état
qu’un minimum de 34,1% des ZPS et 19,1 % des ZSC sont touchées par des dégradations ou
sont susceptibles de l'être, et qu’environ respectivement 57 % et 40 % de celles-ci, citées dans
les rapports FNE de 2004 et 2006, le sont de nouveau dans l'enquête de 2011. Il conclut
qu'une part importante de ces sites Natura 2000 est encore concernée par des projets
néfastes ou susceptibles de les dégrader. Ainsi le devenir du réseau Natura 2000 en France
est conditionné par une réelle prise en compte par l'État des enjeux et par la mise en place de
moyens financiers à la hauteur des attentes engendrées (Vanpeene-Bruhier et Pacyna, 2005).
Le réseau de ZPS en agro-système :
Comme nous avons pu le démontrer dans le chapitre 2, il semble que la mise en place d’un
réseau de ZPS plus spécifiquement en milieu agricole, qui plus est intensif, soit un outil
essentiel et prépondérant dans l’objectif d’enrayer la perte de biodiversité. Ainsi à l’échelle de la
région Poitou-charentes (administrative), on observe une tendance positive des effectifs sur la
période 1996-2010. Ces résultats semblent valider le fait que le réseau Natura2000 composé
de 8 ZPS de plaine agricole, semble avoir permis le maintien de la qualité et/ou de la surface
des composantes du paysage d’origine, imputable en partie à l’obligation que pour tout projet
d’aménagement futur comporte une étude d’incidence préalablement menée, mais aussi lié à la
mise en place de pratique de gestion extensive. En ce sens, bien que non représentés comme
habitat prioritaire dans le cadre du réseau Natura2000, les milieux agricoles pourraient alors
bénéficier d’un outil efficace, permettant ainsi la mise en place d’un cortège de MAE, outils
indispensables au soutien et à l’implémentation de nouvelles pratiques plus respectueuses de
l’environnement.
Etudes complémentaires pouvant être menées :
Nos travaux nous ont permis de montrer qu’un site préalablement classé en ZICO, puis en ZPS
pouvait permettre de maintenir des abondances plus fortes voire de les augmenter par rapport
127
aux sites périphériques. Cependant ce travail n’est basé que sur un seul site, et se pose alors la
question de la généricité des résultats observés, bien qu’il soit fort envisageable que la majeure
partie des sites anciennement classés pour leurs richesses, le soit encore à l’heure actuelle. De
plus, dans le cadre de ce travail nous nous sommes spécifiquement orientés sur les
passereaux, l’Alouette des champs et le Bruant proyer, en tant qu’espèces communes, mais
assez spécialistes pour être vues comme deux espèces bio-indicatrices du bon fonctionnement
trophique.
Il serait alors intéressant d’évaluer plus finement si ces résultats peuvent s’étendre à d’autres
taxons et ce sur la même période afin d’analyser conjointement l’évolution des tendances entre
les différents niveaux trophiques. Une large part des relevés faunistique et floristique ont débuté
sur la zone Atelier de Chizé depuis la fin des années 90, ce qui pourrait alors permettre de
tester la généricité des résultats sur un panel de taxons et d’espèces échantillonnées.
Enfin, à plus large échelle, il semble maintenant, comme cela est établi pour le milieu
océanique, important de comprendre par quels mécanismes le réseau de ZPS en milieu
agricole peut avoir contrebalancé à une échelle régionale la tendance de l’Alouette par
exemple, à l’inverse de la tendance observée nationalement. Il est alors envisageable d’utiliser
le réseau de ZPS au niveau régional afin de déterminer si la taille (en région PC: 1420 à 37500
hectares), la distance et/ou la forme des sites peuvent avoir contribuées à améliorer la
persistance et l’abondance des passereaux en agro- écosystème intensif. Un résultat prédit par
la théorie, mais qui est sans doute particulièrement pertinent dans des habitats instables
comme les agro-écosystèmes céréaliers. Ces questions ont surtout été traitées à ce jour pour
les sites marins (Sala et al. 2002, Mumby 2006, Sunblad et al. 2009), où les études portant sur
l’efficience du réseau d’aires protégées reposent sur la théorie de biogéographie des îles
(MacArthur & Wilson 1967), avec l’analyse conjointe du nombre de patchs, de la taille et de
leurs connectivités (Whittaker et al. 2008) en relation avec des paramètres de dynamique de
population.
3/ Quelle est l’efficacité des outils de conservati on en milieu agricole intensif :
les Mesures Agri-environnementales
Dans les chapitres 3 et 4, nous avons pu exposer que les deux espèces étudiées de
passereaux en déclin ont réagi positivement à l’application des MAE. Nous montrons que les
MAE testées dans le cadre de ces études, destinées pour une large partie à répondre aux
enjeux d’une espèce patrimoniale (Bretagnolle et al. 2011), pouvaient affecter favorablement
deux espèces ordinaires ayant des exigences différentes. Nous avons alors tenté de
comprendre par quels mécanismes temporels et/ou spatiaux l’abondance de ces espèces
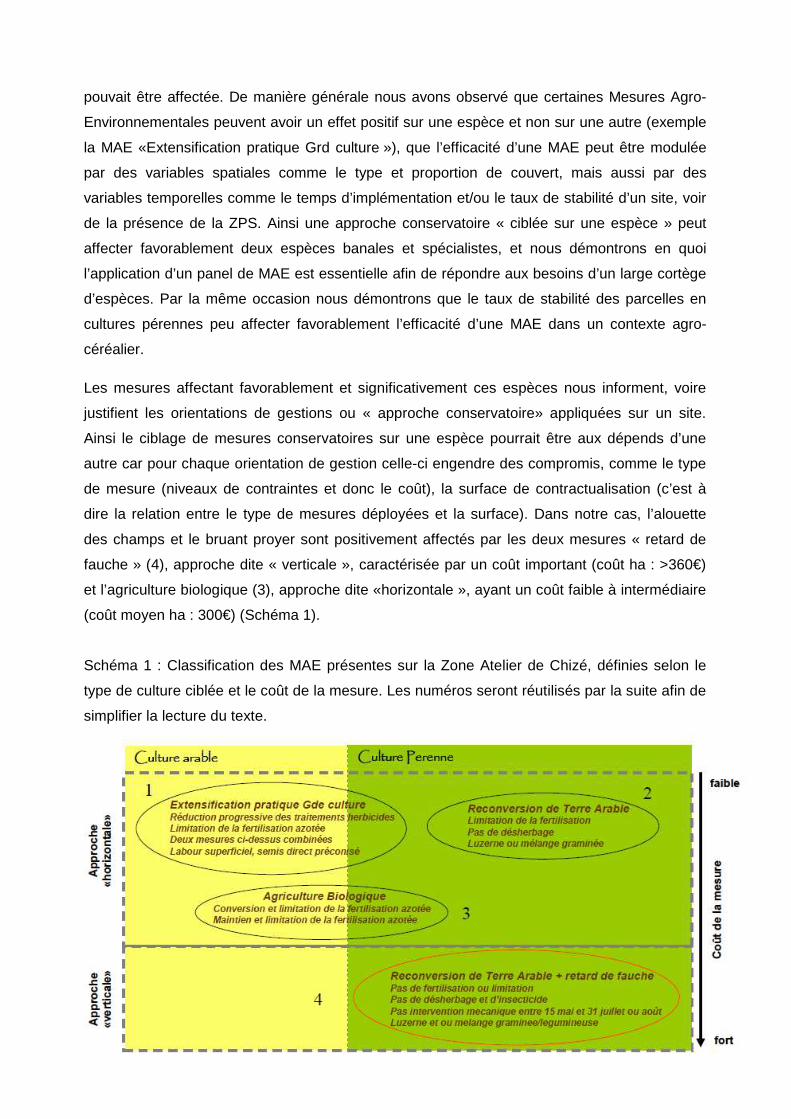
128
pouvait être affectée. De manière générale nous avons observé que certaines Mesures Agro-
Environnementales peuvent avoir un effet positif sur une espèce et non sur une autre (exemple
la MAE «Extensification pratique Grd culture »), que l’efficacité d’une MAE peut être modulée
par des variables spatiales comme le type et proportion de couvert, mais aussi par des
variables temporelles comme le temps d’implémentation et/ou le taux de stabilité d’un site, voir
de la présence de la ZPS. Ainsi une approche conservatoire « ciblée sur une espèce » peut
affecter favorablement deux espèces banales et spécialistes, et nous démontrons en quoi
l’application d’un panel de MAE est essentielle afin de répondre aux besoins d’un large cortège
d’espèces. Par la même occasion nous démontrons que le taux de stabilité des parcelles en
cultures pérennes peu affecter favorablement l’efficacité d’une MAE dans un contexte agro-
céréalier.
Les mesures affectant favorablement et significativement ces espèces nous informent, voire
justifient les orientations de gestions ou « approche conservatoire» appliquées sur un site.
Ainsi le ciblage de mesures conservatoires sur une espèce pourrait être aux dépends d’une
autre car pour chaque orientation de gestion celle-ci engendre des compromis, comme le type
de mesure (niveaux de contraintes et donc le coût), la surface de contractualisation (c’est à
dire la relation entre le type de mesures déployées et la surface). Dans notre cas, l’alouette
des champs et le bruant proyer sont positivement affectés par les deux mesures « retard de
fauche » (4), approche dite « verticale », caractérisée par un coût important (coût ha : >360€)
et l’agriculture biologique (3), approche dite «horizontale », ayant un coût faible à intermédiaire
(coût moyen ha : 300€) (Schéma 1).
Schéma 1 : Classification des MAE présentes sur la Zone Atelier de Chizé, définies selon le
type de culture ciblée et le coût de la mesure. Les numéros seront réutilisés par la suite afin de
simplifier la lecture du texte.
129
Condensé des résultats
Enfin et plus globalement, nous observons que l’implémentation des MAE (2, prairies) affecte
favorablement l’abondance des deux espèces, avec un seuil maximum de couverture (effet
quadratique) pour l’alouette des champs et un effet fort du groupe MAE (3, Agri bio), et ce plus
spécifiquement pour le bruant proyer. Le groupe de MAE ciblées (4, Rtd fauche) et la MAE (3,
Agri bio) mise en place à l’échelle de l’exploitation sont connues pour affecter positivement la
richesse et l’abondance en espèces (Hole et al.2005, Bengtsson et al. 2005, Gabriel et al.
2010, Perkins et al. 2011, Bretagnolle et al. 2011, Broyer, 2011). Ceci semble traduire
plusieurs mécanismes majeurs, aux échelles considérées, ainsi l’abondance des oiseaux est
limitée par un manque de ressources, voire de sites d’alimentations, mais aussi une
destruction des nichées, et plus globalement un manque d’hétérogénéité (dans notre cas très
forte sensibilité à l’ajout de parcelles en prairie dans le paysage). Nos résultats sont en accord
avec le constat général reliant les changements dans les populations d’oiseaux des milieux
agricoles, comme le manque de ressource en invertébrés et en graines (Wilson et al. 1999 ;
Benton et al. 2002 ; Holland 2004) et en particulier, la perte d’hétérogénéité (diminution des
haies, cultures pérennes et différents modes de gestion) causée par l’intensification de
l’agriculture (Benton et al. 2003).
Sélection d’habitat et mesure agro-environnementale : Notre étude a permis de distinguer l’effet de la proportion d’habitat dans le paysage et de
mesures compensatoires, en particulier le ratio surface de terres arables et pérennes, connu
pour influencer les communautés d’oiseaux des prairies (Robinson et al. 2001 ; Atkinson et al.
2002). Tout comme le bruant proyer, nous observons que l’alouette des champs est fortement
dépendante de la proportion de luzerne dans le paysage et plus globalement de la surface en
prairie. Ces résultats étant issus d’un vaste plan d’échantillonnage sur une surface importante,
ils nous permettent de confirmer et généraliser les résultats présentés par Eraud & Boutin
(2002) sur l’alouette des champs, où ils trouvaient de plus fortes densités de territoires estimés
dans les prairies, jachères et luzernes, et où la productivité à l’envol y est plus élevée dans les
jachères et luzernes. De la même manière nous avons mis en avant pour le Bruant proyer, la
présence d’un compromis à large échelle entre la proportion de luzerne et de prairie. Ainsi bien
que ces deux cultures aient un effet positif, nous montrons que de fortes proportions de luzerne
suffisent, indépendamment de la prairie (de graminée), à augmenter l’abondance du bruant
proyer. Nos résultats semblent clairement indiquer que ces deux espèces caractéristiques des
milieux ouverts, bien qu’ayant des exigences en terme d’association d’habitat différentes
(complémentarité entre des cultures arables et pérennes), sont limitées par la surface en
milieux « naturels » (prairies) en plaine céréalière. Pouvant être considéré comme un habitat
130
clef en termes de besoins en ressources alimentaires et en site de nidification. Cependant nous
observons qu’un assemblage de milieux est essentiel au maintien voire à l’augmentation de
l’abondance. En ce sens, les cultures de printemps ont elles aussi un effet positif sur les deux
taxons étudiés, ce groupe de culture testé, combine différent type de culture (tournesol, maïs,
sorgho, millet, tabac, etc.) maximisant l’hétérogénéité spatiale et temporelle des couverts, c’est
à dire procurant des semis différés, des structures de végétation, de recouvrement et de
hauteur variées autour de sites de nidification. Plus précisément notre étude a permis de mettre
en évidence que le maintien et/ou l’augmentation de ces espèces peuvent être en partie résolus
par une augmentation jusqu'à un certain seuil (en relation avec un effet saturant affectant
négativement l’abondance) de deux à trois types d’habitats fonctionnels, pouvant être décrit
comme la luzerne (bruant et alouette) et la céréale (alouette) pour l’alimentation et la
reproduction, et les cultures de printemps pour les deux espèces pour l’alimentation (dans notre
cas, une large part de ce groupe est composée de Tournesol). Il est alors envisageable qu’une
proportion minimum de cultures spécifiques soit plus pertinente qu’une forte diversité d’habitats
afin d’assurer le maintien de ces espèces (Boatman et al. 2010).
Suite à l’identification des relations existantes entre les variables d’habitats et l’abondance de
ces deux espèces, nous avons conclu qu’une partie des effets MAE est modulée par des
variables spatiales (habitat) et temporelles (âge du contrat, taux de stabilité des prairies) ou via
une association de contrats entre eux. Plusieurs résultats complexes sont apparus, indiquant
clairement des effets additifs entre les MAE, comme le cas de la proportion de la MAE (1, Ext
Gd cult) avec la proportion et l’âge de la MAE (2, prairies) et la proportion de la MAE (3, Agri
bio). L’ensemble de ces effets interactifs ou non montre un effet échelle dépendant, avec des
effets globalement fort à large échelle, comme la MAE (3, Agri bio) et (4, Rtd fauche) pour
l’Alouette des champs, de la MAE (2, prairies), (3, Agri bio) et (4, Rtd fauche) pour le Bruant
proyer à fine échelle. L’âge des contrats apparait comme un facteur prépondérant, pouvant
nous permettre de faire l’hypothèse qu’il n’est pas forcement nécessaire de contractualiser
massivement sur de larges surfaces, mais de travailler sur les associations entre contrats, tout
en maximisant spatialement de futurs ilots composés de contrats âgés. Plus globalement l’effet
positif additif voire multiplicatif des MAE vis a vis des variables d’habitats, nous suggère qu’une
modification des pratiques, voire du mode de gestion, est essentiel afin d’améliorer la qualité de
l’habitat initial, comme par exemple l’ajout de retard de fauche (4, Rtd fauche) et/ou
l’augmentation de patchs de prairies (2, prairies), gérés extensivement. Peut être d’ailleurs plus
particulièrement dans les paysages de plaines intensives, où il s’avère que la modification des
pratiques intensives vers une gestion extensive soit indispensable. Il a par exemple été montré
que les prairies gérées intensivement étaient généralement pauvres pour les oiseaux
granivores et insectivores, en liaison avec les fortes perturbations, comme les fauches
131
successives affectant les cycles phénologiques des espèces, la quantité de graines produites et
plantes a fleurs, ainsi que la diversité d’invertébrés (Morris, 2000 ; Mc Craken et al. 2004), mais
aussi en grande partie liée aux destructions des nichées (Wilson et al. 1997, Brickle et al. 2000,
Eraud et Boutin, 2002, Perlut et al. 2008). Ainsi, Dueilli & Obrist. (2003) ont montré que 63% de
l’ensemble des espèces d’insectes capturés le long de transects sur la partie ouest du plateau
Suisse, vivent dans des sites agricoles et dépendent de la présence d’habitats semi-naturels.
Dans cette étude, ils démontrent que le nombre d’espèces décroît avec l’augmentation de la
distance depuis un milieu semi-naturel. En ce sens, il apparaît que les habitats naturels ou
semi-naturels fournissent la plus importante source de nourriture pour les mesures agro-
environnementales en vue d’améliorer la biodiversité dans un paysage agricole appauvri. Folke
et al. (1996) expliquent alors que la revalorisation des écosystèmes perturbés repose selon
cette vision, exclusivement sur la diversité des populations sources dans le paysage
environnant, ce qui assure la résilience des systèmes pour une utilisation durable.
Les différentes études menées sur notre zone atelier depuis quelques années vont précisément
en ce sens, et consolident nos hypothèses quant aux processus sous- jacents affectant
l’abondance de ces espèces. Ainsi il a été montré que l’implémentation de culture pérenne et
l’extensification des pratiques favorisent l’augmentation de la richesse en plantes et la
modification des communautés, jouant ainsi un rôle régulateur, limitant certaines espèces
envahissantes et ce via l’intégration de rotation culturale couplant cultures pérenne/arable
(Meiss et al 2010). Bretagnolle et al (2011), décrivent que l’amélioration des cycles
phénologiques de Microtus arvalis, micromammifères abondant et jouant une place centrale
comme ressource trophique pour une large gamme de prédateurs carnivores, semblent
largement dépendant du maintien de surface en culture pérenne à l’échelle paysagère.
Deraison et al. (en prep) montrent que les prairies jouent un rôle majeur comme support de la
ressource trophique en agro-système, par la présence d’une très forte diversité β en
carabiques, pouvant s’expliquer par une forte diversité floristique au sein des prairies
(Badenhausser et al, 2008), favorisant alors une multitude de micro-sites favorables. De plus,
des suivis comparant des parcelles de luzerne gérées extensivement sans aucun intrant et avec
retard de fauche ont montré des densités en criquets presque 7 à 10 fois supérieures à des
parcelles conventionnelles (Badenhausser et al. 2008). Enfin, Bretagnolle et al (2011) ont mis
en avant que l’augmentation de la population de l’Outarde canepetière était en partie imputable,
aux effets direct et indirect des MAE sur la ressource et l’habitat de cette espèce.
Dans le cadre de ces deux chapitres nous montrons que la stratégie mise en place afin de
répondre à l’enjeu « Outarde » semble appropriée plus globalement à la biodiversité, car elle
traduit qu’un des facteurs clefs prépondérant à l’amélioration de la biodiversité en agro-
systèmes céréaliers est pour une large part lié à l’augmentation des surfaces en culture
132
pérenne, reflétant un manque certain en ressources trophiques et un manque d’accès à des
sites de nidification sécurisés.
Cependant nos résultats ne nous permettent pas de définir clairement une stratégie
conservatoire, pouvant être orientée soit sur le spatial (dans ce cas la surface prime), soit sur le
temporel (dans ce cas ce n’est plus tant la surface qui prime mais l’âge des contrats), ou sur un
type de contrat précis (une pratique plus qu’une autre, un mode de gestion plus qu’un autre),
étant donné qu’aucunes métriques MAE (spatiale et temporelle) identiques ne soient apparues
pour les deux espèces. Globalement nous observons une tendance positive et significative du
temps d’application des contrats sélectionnés sur les deux espèces, alors que la proportion de
contrat dans un buffer donne des résultats mitigés, pouvant être imputables à un effet « culture
dépendant » affectant ainsi négativement les espèces ciblées. Par exemple nous remarquons
dans le chapitre 3, un effet négatif de la surface de la MAE (1, Ext Gd cult) à large échelle sur
l’abondance de bruant proyer, celle relation peut en partie être imputée au fait que cette mesure
est spécifiquement implémentée en terre arable, ainsi la réponse négative du bruant proyer aux
fortes surfaces de ce contrat peut s’expliquer par une forte dominante de culture «non
favorable», plus qu’à la non efficacité de la mesure en tant que t’elle.
En quoi le temps d’application d’une MAE peut affec ter positivement la
biodiversité ?
La résilience d’un habitat suite à de fortes perturbations ne peut être envisageable que si les
changements de pratiques s’inscrivent dans le temps. Il est alors prédit que dans les paysages
dits « simples » (homogènes, avec de faibles surfaces en prairies), la restauration de
communautés riches en espèces (suite à la réintégration de gestion plus extensive), peut
prendre beaucoup plus de temps que celui d’un contrat MAE (5ans) (Walker et al 2004). Ce
n’est que depuis quelques années que sont apparues les premières études basées sur
l’analyse du temps d’application des contrats MAE, en partie dues au fait que peu de
chercheurs possèdent des jeux de données à long terme. Ainsi à titre d’exemple, Jonason et
al. 2011 ont analysé un jeu de données portant sur les papillons sur une période de 25 ans en
agriculture biologique ; leur étude montre des résultats positifs d’une évolution graduelle de
l’abondance en papillons (multipliée par 100), avec cependant une apparition rapide de la
richesse en papillons et en plantes au début de l’implémentation puis n’a plus évolué. De la
même manière, Perkins et al. (2011) montrent dans le cas du bruant proyer, un effet important
du temps d’application de la MAE avec retard de fauche sur la densité de territoire ; avec une
augmentation de 5.6% par an, passant de 1.2 males/km2 à 1.6 males/km2 en 7ans
d’application. Enfin Roth et al. (2008) présentent une évaluation des MAE (Ecological
Compensated Areas) adoptées par le canton d’Argovie en Suisse. La richesse des plantes
vasculaires et des escargots a augmenté au cours d’une période de 5 ans sur des parcelles
133
avec des MAE, et non sur des parcelles sans contrat.
En ce sens, la mise en place de mesures compensatoires sur de longues périodes au sein
d’habitats perturbés comme les agro-systèmes céréaliers, favorise l’amélioration de la qualité
d’habitat, pouvant être définie selon une plus forte abondance en ressource, un meilleur accès
à une source de nourriture et une augmentation voire sécurisation des sites de reproduction et
de pontes dans le temps. Ainsi l’amélioration des habitats peut favoriser i) un meilleur succès
reproducteur, ii) une plus forte fidélité aux sites et ainsi iii) une augmentation de l’abondance
en oiseaux. De plus, il semble que l’augmentation de l’abondance en alouette et en bruant soit
liée à des processus directs et indirects, agissant sur la régénération de la ressource
trophique, couplée à une augmentation de l’hétérogénéité des cultures et des pratiques dans
le temps. Pour exemple, dans le cas d’une luzerne avec retard de fauche, un semis de luzerne
et autres légumineuses éliminent les adventices présentes via la mise en place d’un couvert
dense, augmentant les zones ombragées au sol mais aussi favorisant une exclusion
compétitive de courte durée (Güsewell et Edwards, 1999 ; Bischoff et al. 2005 ; Li, Wu &
Wang, 2008). Bien que pouvant être moins attrayant pour la recherche de nourriture, voire la
nidification dans leur première année (lié au couvert dense et à de forte densité de semis), j’ai
pu observer qu’après plusieurs années, la densité et la structure de la luzerne tendent à
fortement varier dans le temps et l’espace à l’échelle de la parcelle et ainsi entre les parcelles.
Plusieurs hypothèses peuvent en être à l’origine, comme un effet du type ou de la structure du
sol, un effet de sécheresse ou d’inondation en hiver, ou encore, être lié à une déplétion du
réseau racinaire et à l’augmentation du nombre de galeries engendrées par de forte densité de
campagnols. Au final, les parcelles offrent au fur et à mesure des années une plus grande
hétérogénéité de structure (différentes hauteurs) et de couverture, mais aussi de diversité
(augmentation de la richesse en plantes), pouvant alors jouer favorablement pour l’accès à la
nourriture et/ou un nid (Henderson et al. 2000).
Effet de la surface en MAE sur la biodiversité :
Le nombre d’études évaluant l’effet de la surface en contrat reste encore limité
quantitativement et qualitativement, c’est à dire ne prenant en compte que la proportion totale
de contrat sans les différencier entre eux. Il est alors prédit qu’une parcelle sous contrat ne
peut fournir les ressources nécessaires pour soutenir des populations viables, en particulier
pour les espèces qui nécessitent de multiples ressources au cours de leur cycle de vie et / ou
qui ont un large site de reproduction (Gabriel et al. 2010). Pour exemple, Dallimer et al.
(2010) montrent que l’abondance des oiseaux dans les parcelles est plus élevée là où les
MAE sont en proportion importantes dans le paysage environnant. Cependant les MAE n’ont
pas eu d’effet sur l’abondance de l’Alouette des champs, ainsi dans leurs cas les mesures
sont essentiellement appliquées dans des habitats dominés par de forte densité de prairies,
134
où la mesure la plus communément employée est la limitation de la pression de pâturage, ce
qui au final semble invoquer une contre sélection de ce type d’habitat plus qu’une non
efficacité de la mesure. Plus généralement, Geiger et al. (2010) montrent que la proportion de
MAE (l’agriculture biologique en l’occurrence) affecte positivement le nombre d’espèces de
plantes et de carabiques, ainsi que le taux de prédation des pucerons, et cette relation
semble maintenue à des échelles paysagères plus larges. A cela, Merckx et al. (2009)
ajoutent que l’abondance et la diversité des espèces des papillons de nuits sont positivement
affectées lorsque les haies d’arbres son présentes, mais uniquement dans des paysages
ayant de fortes proportions de surface en MAE.
Dans notre cas, nous observons un effet globalement positif de la proportion en MAE autour
des points d’écoutes sur les deux espèces de passereaux, avec des effets clairement
échelles dépendant(s). Pour l’Alouette des champs, nous observons une réponse non linéaire
de la MAE (2, prairies) à fine échelle et une réponse linéaire à plus large échelle pour la MAE
(3, Agri bio). Concernant l’abondance du Bruant proyer, nous observons des résultats plus
complexes, avec des interactions entre contrats. Cependant deux types de contrats affectent
favorablement l’abondance, la MAE (1, Ext Gd cult) seule ou en interaction avec la durée
d’application de l’agriculture bio, à fine échelle, et à plus large échelle la MAE (1, Ext Gd cult)
en interaction avec l’augmentation des surfaces en MAE (2, prairies).
Nous montrons dans le cadre de ces études que la proportion de contrats affecte
positivement l’abondance des deux taxons ciblés, selon un effet d’échelle dépendance
définit dans notre cas selon les distances d’alimentation en période de reproduction,
respectivement 400m pour l’Alouette des champs (Donald et al. 2004) et 200 m pour le
Bruant proyer (Brickle et al. 2000). Ainsi dans les deux cas nous montrons que la distinction
des contrats selon des objectifs fonctionnels attendus est indispensable afin de guider à la
compréhension des mécanismes agissant sur les espèces ; ici la diminution et l’arrêt de
l’application d’intrants et de produits phytosanitaires par l’augmentation des surfaces en
contrats apparaissent comme prépondérants aux deux échelles testées. Ceci démontre le
besoin d’intégrer les différences spécifiques des espèces dans leurs réponses au contexte
paysagé (Shreeve et Dennis, 2011).
MAE et éléments naturels et semi-naturels, facteurs clefs pour la biodiversité Dans le cadre de ces deux études, il apparaît qu’une des limites à l’efficacité des mesures
puisse être imputable, outre à une certaine jeunesse des contrats, à un manque d’habitats
favorables, comme les prairies et luzernes, n’occupant actuellement que 10 et 5 % de notre
zone d’étude. Billeter et al. (2008) montrent dans une étude menée sur 25 paysages dans 7
pays européens, que la proportion d’éléments naturels dans le paysage est l’un des facteurs
135
principaux limitant la richesse en espèces. Cette relation entre contexte paysager et efficacité
des MAE, fait l’objet de nombreuses études (voir synthèse dans Le Roux et al, 2008), montre
que l’intensification de l’agriculture conventionnelle a des effets négatifs sur la biodiversité : ces
auteurs montrent que les facteurs clés peuvent varier selon les groupes taxonomiques et les
pratiques liées aux modes de production, et qu’à l’inverse, l’hétérogénéité du paysage et en
particulier l’importance des éléments semi-naturels ont des effets majeurs sur les différents
groupes taxonomiques.
On remarque alors globalement un effet positif de la complexité sur la richesse en espèces
(voire l’abondance) et ce, indépendamment de la mise en place de contrat (Tscharntke et al.
2005; Sutherland et al. 2010). Ainsi lorsqu’un contrat est implémenté, son efficacité sera
dépendante du niveau de complexité de l’environnement (Concepcion et al, 2008 ; Winqvist et
al. 2011).
Concepcion et al. (2008) suggèrent que les MAE seraient plus efficaces à des niveaux
intermédiaires de complexité du paysage, et que l’efficacité à améliorer la biodiversité devrait
tendre vers zéro dans des paysages extrêmes, fortement simplifiés ou très complexes. Deux
mécanismes sont invoqués : dans un paysage complexe, il semble se produire un effet de
saturation, la complexité est telle que l’on ne peut déceler la valeur ajoutée d’une MAE
(Tscharntke et al. 2005). Dans un paysage simple, il semble se produire un effet de dilution en
dessous d’un certain degré de complexité, ceci dû à un nombre trop faible d’habitats non-
cultivés et une répartition spatiale inadéquate (Duelli & Obrist, 2003 ; Conception et al. 2008).
Notre étude nous permet d’apporter des éléments nouveaux, quant à la relation de l’effet des
MAE en lien avec le paysage, en y ajoutant la notion de stabilité des sites. Notre étude sur le
bruant proyer indique qu’une manière de maximiser l’efficience des mesures agro-
environnementales est de déterminer préalablement des zones selon leurs niveaux de stabilité
(dans notre cas le nombre de patchs prairiaux différents restant en place sur les 5 dernières
années). Ainsi comme explicité ci- dessus, dans les paysages simples, l’objectif majeur doit
aller dans le sens d’une augmentation du nombre de patchs en culture pérenne, ceci afin
d’accroître le linéaire de bordures et diminuer les distances entre patchs. Cette relation spatiale
entre le nombre, la taille et distance entre patchs favorables est alors récurrente dans les
écosystèmes « perturbés », bien qu’encore précisement non élucidé dans le cas des MAE.
Cependant un grand nombre d’études a démontré une relation forte et négative avec la
distance pour la richesse ou l’abondance, par exemple pour les graines (Kohler et al. 2008 ;
Kiviniemi, 2008 ; Leng et al. 2009 ; Leng et al. 2010), mais aussi pour les syrphes, abeilles,
gastéropodes, et insectes phytophages (Albrecht et al. 2007 ; Kohler et al. 2008 ; Roth et al.
2008 ; Albrecht et al. 2010).
Ainsi ce n’est pas simplement une augmentation de la surface qui doit être visée mais le
136
nombre de patchs distincts permettant alors de créer de la disparité dans les types et structures
de végétations. Couplé à une diversification des modes de gestions entre les parcelles afin
d’augmenter l’hétérogénéité et augmenter la stabilité des sites. Plus globalement, l’intégration
de couverts prairiaux à fine et large échelles doit être accompagnée d’une extensification voire
dans le meilleur des cas d’une modification des modes de productions (comme l’Agriculture
Biologique). L’objectif serait de ne pas générer des « hotspots » de ressources via les
luzernières avec retard de fauche ou l’application de l’agriculture biologique, indépendamment
d’une extensification des pratiques sur les parcelles et cultures environnantes, dans un objectif
de limiter la création de « puits écologiques ».
4/ Outils de conservation et perspectives Les travaux réalisés pendant cette thèse, nous ont ainsi permis de montrer, et ce pour la
première fois à notre connaissance que les deux outils de conservation testés (i.e ZPS et
MAE) semblent complémentaires, d’autant plus en agro système intensif. Ainsi le noyau de la
ZPS anciennement classé Zone Importance Communautaire pour les Oiseaux, a accueilli et
maintenu au cours des deux dernières décennies une abondance plus importante de deux
passereaux en déclin. La qualité intrinsèque de la ZPS a donc été intégrée en tant que co-
variable lors de l’analyse de l’effet des MAE. Nous montrons ensuite que la désignation en
ZPS à partir de 2004 a permis globalement une augmentation des effectifs (chapitre 2),
pouvant être imputable à un effet additif voire multiplicatif de l’implémentation des MAE
(Chapitre 3 et 4). Nous concluons que toute future analyse se doit de prendre en compte
l’historicité du ou des sites protégés, ainsi que la proportion et l’âge des MAE, variables ne
pouvant être ignorées car agissant directement et indirectement sur le paysage.
A l’échelle de la région Poitou-Charentes, nous montrons, bien que corrélativement, que l’effet
positif observé sur la ZPS de Niort Sud Est est très fortement conforté. Ce type de résultat peut
alors soulever un problème général de fond, celui du devenir de la biodiversité hors des sites
Natura2000. En ce sens il pourrait être envisageable que les populations s’effondrent aussi à
l’échelle de la région PC en dehors des ZPS, ce qui pourrait alors engendrer une augmentation
des effectifs aux seins des ZPS, comme cela est actuellement le cas pour l’Outarde
canepetière (Bretagnolle et Villers données non publiés).
Cependant à de plus larges échelles, les populations continuent de diminuer malgré
l’ensemble du réseau d’aires protégées existant et des mesures compensatoires
implémentées. Il semble alors que ce type de politique conservatoire ne soit pas suffisant car
entièrement dépendant pour son bon fonctionnement, de subventions substantielles des états
(à titre d’exemple, le coût annuel moyen sur la zone NATURA 2000 de Niort est de 231 504€
137
sur la période2005/2010). Et ceci, aux dépends des 87.5% et 82% de territoire en dehors du
réseau Natura2000, respectivement en France et en Europe.
Les Mesures Agro-Environnementales ont des résultats globalement mitigés à l’échelle
européenne. Cependant elles ont sur le site d’étude de Chizé, voire même à l’échelle des ZPS
de Poitou-charentes (ce qui demande des analyses appropriées), eu des effets positifs sur
différents maillons de la chaine trophique (Badenhausser et al. 2008 ; Bretagnolle et al. 2011,
chapitre 3 et 4). Pour cela une majeure partie des effets positifs et significatifs sur la
biodiversité est induite par l’intégration de mesures, excluant soit la parcelle de la production
(type : Luzerne avec retard de fauche) ou impliquant l’exploitant à radicalement modifier le
mode de production (type : Agriculture Biologique).
Ainsi recréer et améliorer l’hétérogénéité au sein et en dehors des aires protégées, en
diminuant et stoppant l’utilisation de produits chimiques dans l’agriculture, semble la seule
option possible si nous voulons affecter positivement et significativement la biodiversité. Dans
un même temps, il faut revaloriser les services éco-systémiques, tout en garantissant des
revenus viables sans quoi cet objectif ne peut être durable. Cette dynamique se doit d’intégrer
plus profondément encore les décideurs politiques dans les programmes de recherche afin de
concrétiser plus rapidement les différents résultats obtenus dans de nouvelles politiques plus
cohérente vis a vis des enjeux auxquels nous devons faire face.
Mise en place d’une cohérence de conservation à l’é chelle nationale:
Au vu des pressions complexes et diverses agissant sur les règles décisionnelles de
l’agriculture de demain, il y a fort à penser que le soutien en faveur de la biodiversité via les
Mesures Agro-Environnementales ne puissent être efficientes et durables que si elles sont
accompagnées par un autre mode de gestion, une nouvelle logique de production. Il semble
que pour répondre à l'enjeu de stopper la perte de biodiversité, nous devons modifier les
échelles sur lesquelles sont basées les délimitations des sites Natura2000 actuels, à un niveau
plus cohérent, celui de l'échelle nationale, voire supra nationale.
Ainsi une extension du réseau Natura2000 pourrait être établie sur l'ensemble de la future
Trame Verte et Bleue, actuellement définie comme : « un outil d’aménagement du territoire qui
vise à (re)constituer un réseau écologique cohérent, à l’échelle du territoire national, pour
permettre aux espèces animales et végétales, de circuler, de s’alimenter, de se reproduire, de
se reposer... En d’autres termes, d’assurer leur survie, et permettre aux écosystèmes de
continuer à rendre à l’homme leurs services » (developpement-durable.gouv.fr, 2011).
C'est précisément ce a quoi tente de répondre le réseau natura2000 !
Ainsi un élargissement du cadre juridique pourrait permettre d’éviter de noyer le projet TVB
parmi une multitude de sous ensembles disposant ou non de bases juridiques, source de
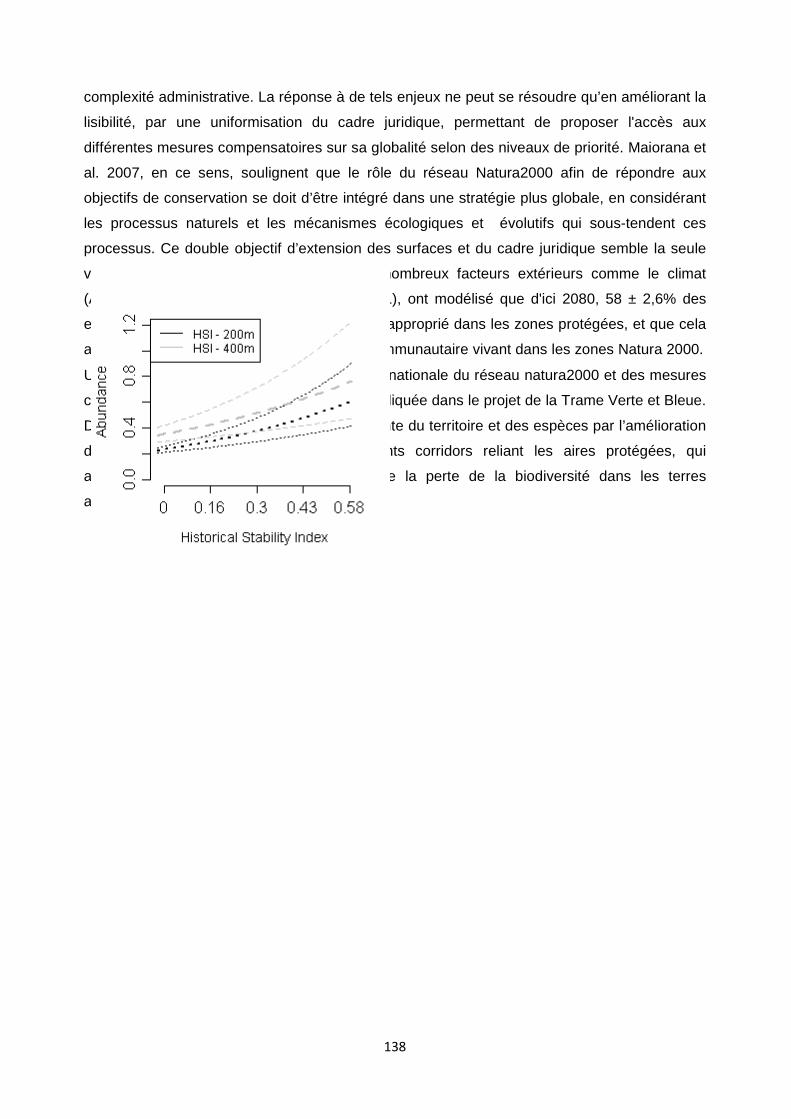
138
complexité administrative. La réponse à de tels enjeux ne peut se résoudre qu’en améliorant la
lisibilité, par une uniformisation du cadre juridique, permettant de proposer l'accès aux
différentes mesures compensatoires sur sa globalité selon des niveaux de priorité. Maiorana et
al. 2007, en ce sens, soulignent que le rôle du réseau Natura2000 afin de répondre aux
objectifs de conservation se doit d’être intégré dans une stratégie plus globale, en considérant
les processus naturels et les mécanismes écologiques et évolutifs qui sous-tendent ces
processus. Ce double objectif d’extension des surfaces et du cadre juridique semble la seule
voie possible au vu de l’imprévisibilité de nombreux facteurs extérieurs comme le climat
(Araujo et al. 2011). Ainsi Araujo et al. (2011), ont modélisé que d'ici 2080, 58 ± 2,6% des
espèces perdraient les avantages d’un climat approprié dans les zones protégées, et que cela
affecterait 63 ± 2,1% des espèces d'intérêt communautaire vivant dans les zones Natura 2000.
Une impulsion forte et d’envergure à l’échelle nationale du réseau natura2000 et des mesures
compensatoires se doit d’être proposée et appliquée dans le projet de la Trame Verte et Bleue.
Dans l’objectif de garantir une gestion cohérente du territoire et des espèces par l’amélioration
de la qualité des habitats sur les différents corridors reliant les aires protégées, qui
actuellement portent une part importante de la perte de la biodiversité dans les terres
agricoles.
139
Référence bibliographique Albrecht, M. et al. 2007. The Swiss agri-environment scheme enhances pollinator diversity and plant reproductive success in nearby intensively managed farmland. J. Appl. Ecol. 44: 813_822. Albrecht, M., Schmid, B., Obrist, M.K., Schüpbach, B., Kleijn, D., Duelli, P., 2010. Effects of ecological compensation meadows on arthropod diversity in adjacent intensively managed grassland. Biol. Conserv. 143, 642–649. Atkinson, P.W., Fuller, R.J., Vickery, J.A., 2002. Large-scale patterns of summer and winter bird distribution in relation to farmland type in England and Wales. Ecography 25, 466–480. Badenhausser I., Médiene S., Paris Le Clerc N., Bretagnolle V., 2008. Effects of agri- environnemental agreements on acridids and plant species richness in alfalfa crops. Proceedings of the 21st General Meeting of the European Grassland Federation, Uppsala, Sweden, 9-12 June. Batary, P., Baldi, A., Sarospataki, M., Kohler, F., Verhulst, J., Knop, E., Herzog, F., Kleijn, D., (2010). Effect of conservation management on bees and insect-pollinated grassland plant communities in three European countries. Agric. Ecosyst. Environ. 136, 35–39. Batáry, P., Báldi, A., Kleijn, D., Tscharntke, T., 2011. Landscape-moderated biodiver- sity effects of agri-environmental management—a meta-analysis. Proc. R. Soc. B 278, 1894–1902. Bengtsson, J., Ahnström, J. & Weibull, A.C. 2005. The effects of organic agriculture on biodiversity and abundance: a meta- analysis. J. Appl. Ecol., 42, 261–269. Benton, T.G. et al., 2002. Linking agricultural practice to insect and bird populations: a historical study over 3 decades. J. Appl. Ecol. 39, 673–687 Benton, T.G., Vickery, J.A. & Wilson, J.D., 2003. Farmland biodiversity: is habitat heterogeneity the key? Trends Ecol. Evol., 18, 182–188. Berthet, E. 2010. La conception innovante à l’appui d’une gestion collective des services écosystémiques. Etude d’un cas de mise en œuvre de Natura 2000 en plaine céréalière. Mémoire de Master 2. Université Paris Ouest Nanterre La Défense, Mines ParisTech, ESCP Billeter, R., Liira, J., Bailey, D., Bugter, R., Arens, P., Augenstein, I. (2008). Indicators for biodiversity in agricultural landscapes: a pan-European study. J. Appl. Ecol., 45. Bischoff, A., Auge, H. &Mahn, E.-G. (2005) Seasonal changes in the relationship between plant species richness and community phytomass in early succession. Basic and Applied Ecology, 6, 385–394. Boatman ND, Pietravalle S, Parry HR, Crocker J, Irving PV, Turley DB, Mills J, Dwyer JC (2010). Agricultural land use and Skylark Alauda arvensis: a case study linking a habitat association model to spatially explicit change scenarios. Ibis 152, 63–76 Bretagnolle V., Villers A., Denonfoux L., Cornulier T., Inchausti P., Badenhausser I., 2011. Rapid recovery of a depleted population of Little Bustards Tetrax tetrax following provision of
140
alfalfa through an agri-environmental scheme. Ibis 153, 4-13. Brickle, N.W., Harper, D.G.C., Aebischer, N.J. & Cockayne, S.H. 2000. Effects of agricultural intensification on the breeding success of corn buntings Miliaria calandra. J. Appl. Ecol. 37: 742–755. Broyer, J.(2011). Long-term effects of agri-environment schemes on breeding passerine populations in a lowland hay meadow system. Bird Study. 58 (2): 141-150. Concepcion, E.D., Diaz, M. & Baquero, R.A., 2008. Effects of landscape complexity on the ecological effectiveness of agrienvironment schemes. Landsc. Ecol., 23, 135–148. Dallimer, M., Gaston, K.J., Skinner, A.M.J., Hanley, N., Acs, S. & Armsworth, P.R. (2010) Field-level bird abundances are enhanced by landscape scale agri- environment scheme uptake. Biology Letters, 6, 643–646. Deraison et al. Community structure in dynamic environments: comparing carabid beetle assemblages in perennial and annual crops. (en preparation) Donald P. F., (2004). The skylark London : T & A D Poyser Donald PF, Sanderson FJ, Burfield IJ, van Bommel FPJ, 2006. Further evidence of continent-wide impacts of agricultural intensification on European farmland birds, 1990–2000. Agric. Ecosyst. Environ, 116:189–196. Donald, P.F. & Evans, A.D., 2006. Habitat connectivity and matrix restoration: the wider implications of agri-environment schemes. J. Appl. Ecol, 43, 209–218. Donald, P.F., 1997. The Corn Bunting Miliaria calandra in Britain: a review of current status, patterns of decline and possible causes. In: Donald, P.F., Aebischer, N.J. (Eds.), The Ecology and Conservation of Corn Buntings Miliaria calandra: UK Nature Conservation No. 13. Joint Nature Conservation Committee, Peterborough, pp. 11– 26. Duelli, P. & Obrist, M.K., 2003. Regional biodiversity in an agricultural landscape: the contribution of seminatural habitat islands. Basic and Applied Ecology, 4, 129– 138. Eraud, C., Boutin, J.M., 2002. Density and productivity of breeding skylarks Alauda arvensis in relation to crop type on agricultural lands in western France. Bird Study 49, 287–296. Flieβbach A., Oberholzer H.R., Gunst L. & Mäder P., 2007. Soil organic matter and biological soil quality indicators after 21 years of organic and conventional farming. Agric. Ecosystems Environ., 118, 273-274. Folke C, Holling CS, and Perrings C. 1996. Biological diversity, ecosystems and the human scale. Ecol Appl. 6: 1018–24. Fuentes-Montemayor, E., Goulson, D., Park, K.J., 2011. The effectiveness of agri- environment schemes for the conservation of farmland moths: assessing the importance of a landscape-scale management approach. J. Appl. Ecol. 48, 532–542. Gabriel, D., Sait, S.M., Hodgson, J.A., Schmutz, U., Kunin, W.E. & Benton, T.G., 2010. Scale matters: the impact of organic farming on biodiversity at different spatial scales. Ecol. Lett., 13, 858–869.
141
Geiger, F., Bengtsson, J., Berendse, F., Weisser, W.W., Emmerson, M., Morales, M.B., Ceryngier, P., Liira, J., Tscharntke, T., Winqvist, C., Eggers, S., Bommarco, R., Pärt, T., Bretagnolle, V., Plantegenest, M., Clement, L.W., Dennis, C., Palmer, C., Oñate, J.J., Guerrero, I., Hawro, V., Aavik, T., Thies, C., Flohre, A., Hänke, S., Fischer, C., Goedhart, P.W., Inchausti, P., 2010. Persistent negative effects of pesticides on biodiversity and biological control potential on European farmland. Basic and Applied Ecology. 11, 97–105. Güsewell, S. and Edwards, P. 1999. Shading by common reed (Phragmites australis Trin.): a threat for species-rich fen meadows? Appl. Veg. Sci. 2: 61–70. Godet, L., Devictor, V., Jiguet, F., 2007. Estimating relative population size included within protected areas. Biodiversity and Conservation. 16: 2596-2598 Hole, D.G., Perkins, A.J., Wilson, J.D., Alexander, I.H., Grice, P.V. & Evans, A.D., 2005. Does organic farming benefit biodiversity? Biological Conservation, 122, 113– 130. Holland 2004 Jonason et al,. 2011. Assessing the effect of the time since transition to organic farming on plants and butterflies. J. Appl. Ecol. 48: 543–550Kiviniemi, 2008 Kleijn, D. & Sutherland, W.J., 2003. How effective are European agri-environment schemes in conserving and promoting bio-diversity? J. Appl. Ecol., 40, 947–969. Kleijn, D., Baquero, R.A., Clough, Y., Diaz, M., De Esteban,J., Fernandez, F., Gabriel, D., Herzog, F., Holzschuh, A.,Johl, R., Knop, E., Kruess, A., Marshall, E.J.P., Steffan-Dewenter, I., Tscharntke, T., Verhulst, J., West, T.M. & Yela, J.L., 2006. Mixed biodiversity benefits of agri-environment schemes in five European countries. Ecology Letters, 9, 243–254. Kleijn, D. & van Zuijlen, G.J.C. (2004). The conservation effects of meadow bird agreements on farmland in Zeeland, the Netherlands, in the period 1989–1995. Biol. Conserv., 117, 443–451. Kohler, F., Verhulst, J., van Klink, R. & Kleijn, D., 2008. At what spatial scale do high- quality habitats enhance the diversity of forbs and pollinators in intensively farmed landscapes? J. Appl. Ecol., 45, 753–762. Leng, X., Musters, C.J.M., de Snoo, G.R., 2009. Restoration of plant diversity on ditch banks: seed and site limitation in response to agri-environment schemes. Biological Conservation, 142, 1340–1349. Leng, X; Musters, CJM; de Snoo, GR., 2010. Synergy between nature reserves and agri-environmental schemes in enhancing ditch bank target species plant diversity. Biological Conservation, 143, 1470-1476. Le Roux, X., Barbault, R., Baudry, J., Burel, F., Doussan, I., Garnier, E. et al. (eds) (2008). Agriculture et Biodiversite´. Valoriser les Synergies. Expertise scientifique collective, synthe`se du rapport, INRA, France. Li, J.-H., Xu, D.-H. & Wang, G. (2008)Weed inhibition by sowing legume species in early succession of abandoned fields on Loess Plateau, China. Acta Oecologica, 33, 10–14. MacArthur, R.H. & Wilson, E.D. (1967). The theory of island biogeography. Princeton Univerity Press.
142
Maiorano, L., A. Falcucci, E. O. Garton, and L. Boitani. 2007. Contribution of the Natura 2000 network to biodiversity conservation in Italy. Conservation Biology 21:1433–1444. Meiss H., 2010. Diversifying crop rotations with temporary grasslands: potentials for weed management and farmland biodiversity. PhD-thesis, Institut National de la Recherche Agronomique & Institut für Landschaftsökologie und essourcenmanagement. Université de Bourgogne, France & Justus-Liebig- Universität Gießen, Germany, 233 p. Merckx, T., Feber, R.E., Dulieu, R.L., Townsend, M.C., Parsons, M.S., Bourn, N.A.D., Riordan, P., Macdonald, D.W., 2009. Effect of field margins on moths depends on species mobility: field-based evidence for landscape-scale conservation. Agric. Ecosyst. Environ. 129, 302–309 McCracken, D.I. & Tallowin, J.R. 2004. Swards and structure: an overview of the interactions between farming practices and bird food resources in lowland grasslands. Ibis 146 (Suppl. 2): 108–114. Mumby, P.J. (2006) Connectivity of reef fish between mangroves and coral reefs: algorithms for the design of marine reserves at seascape scales. Biological Conservation, 128, 215–222. Osterman, O.P. (1998) The need for management of nature conservation sites designated under Natura 2000. Journal of Applied Ecology, 35, 968–973. Perkins, A.J., Maggs, H.E., Watson, A. & Wilson, J.D., 2011. Adaptive management and targeting of agri-environment schemes does benefit biodiversity: a case study of the corn bunting Emberiza calandra. J. Appl. Ecol., 48, 514–522. Perlut, N.G., Strong, A.M., Donovan, T.M., Buckley, N.J., 2008. Grassland songbird survival and recruitment in heterogeneous agricultural landscapes: implications for source–sink demography. Ecology 89, 1941–1952. Robinson, R.A. et al. 2001. The importance of arable habitat for farmland birds in grassland landscapes. J. Appl. Ecol. 38, 1059–1069 Roth, T., Amrhein, V., Peter, P., Weber, D., 2008. A Swiss agri-environment scheme effectively enhances species richness for some taxa over time. Agric. Ecosyst. Environ. 125, 167–172. Sala E, Aburto-Oropeza O, Paredes G, Parra I, Barrera JC, Dayton P. 2002. A general model for designing networks of marine reserves. Science 298: 1991–1993. Shreeve, T.G., Dennis, R.L.H., 2011. Landscape scale conservation: resources, behaviour, the matrix and opportunities. J. Insect Conserv. 15, 179–188. Sundblad, G., U. Bergström, & A. Sandström. 2011. Ecological coherence of marine protected area networks: a spatial assessment using species distribution models. Journal of Applied Ecology 48:112-120. Sutherland, W.J., Clout, M., Cote, I.M., Daszak, P., Depledge, M.H., Fellman, L., Fleishman, E., Garthwaite, R., Gibbons, D.W., De Lurio, J., Impey, A.J., Lickorish, F., Lindenmayer, D., Madgwick, J., Margerison, C., Maynard, T., Peck, L.S., Pretty, J., Prior, S., Redford, K.H., Scharlemann, J.P.W., Spalding, M., and Watkinson, A.R. (2010) A horizon scan of global conservation issues for 2010. Trends in Ecology and Evolution, 25, 1–7. Vanpeene-Bruhier, S. et Pacyna, S., 2005. État des lieux de la procédure Natura 2000 en France et analyse de l’importance de la gestion par l’agriculture et la sylviculture. In:
143
Ingénieries - E A T, n°44. Vickery, J.A. et al. 2001. The management of lowland neutral grasslands in Britain: effects of agricultural practices on birds and their food resources. J. Appl. Ecol. 38, 647–664 Vorisek P, Jiguet F, van Strien A, S korpilova J, Klvanova A, Gregory RD,. 2010. Trends in abundance and biomass of widespread European farmlands birds: how much have we lost? In: BOU proceedings - Lowland Farmland Birds III. Walker, B., C. S. Holling, S. R. Carpenter, and A. Kinzig. 2004. Resilience, adaptability and transformability in social–ecological systems. Ecology and Society 9(2): 5. Whittaker, R. J., Triantis, K. A. & Ladle, R. J. A general dynamic theory of oceanic island biogeography. J. Biogeogr. 35, 977–994 (2008). Wilson, J.D., Morris, A.J., Arroyo, B.E., Clark, S.C. & Bradbury, R.B. (1999) A review of the abundance and diversity of invertebrate and plant foods of granivorous birds in northern Europe in relation to agricultural change. Agriculture, Ecosystems and Environment, 75, 13–30. Wilson, J.D., Evans, J., Browne, S.J., King, J.R., 1997. Territory distribution and breeding success of skylarks Alauda arvensis on organic and intensive farmland in southern England. J. Appl. Ecol. 34, 1462–1478. Winqvist, C., Bengtsson, J., Aavik, T., Frank Berendse, Clement, L., W., Eggers, S., Fischer, C., Flohre, A., Geiger, F., Jaan Liira, Pärt, T., Thies, C., Tscharntke, T., Weisser, W. W., Bommarco, R. (2011). Mixed effects of organic farming and landscape complexity on farmland biodiversity and biological control potential across Europe. J. Appl. Ecol. 48 (3): 570–579. Sites internet developpement-durable.gouv.fr (2011) www.insee.fr (2010) www.mnhn.fr (2009)
144
Abstract
The aim of this thesis was to evaluate the effectiveness of two conservation tools developed
in Europe and France (Natura 2000 and Agro-Environnemental Schemes). Our analysis
focused on agro-ecosystems, and two specialist passerines: the Skylark and the Corn
Bunting.
The effect of the SPA delineation was tested over the period 1996-2011. The results show i)
that the presence and abundance of both species were initially more important within than
outside the SPA, ii) the trend in Skylark abundance had stabilized after the designation
(contrasting with a decrease outside), and increased in Corn bunting abundance, iii) that the
trends of both species outside of the SPA are broadly similar to national and European
observations, and iv) that the presence of a network of eight SPA in agrosystem seems to
have reversed the trend of the Skylark at the regional scale compared to the national one.
The evaluation of AES allowed us to show that i) two common species may benefit from the
positive effects of a device that aimed at the preservation of a patrimonial species (the Little
Bustard), ii) two measures in particular are responsible for the positive observed effects: the
AES “delayed mowing” and “Organic farming”, iii) a low-cost efficiency can be obtained via a
combination of AES established according to a functional approach, and iv) the effectiveness
of AES is modulated by the landscape context, land use intensity, the scale of analysis and by
the presence or absence of the SPA.
It finally appears that the two conservation tools applied in intensive agro-ecosystem
contribute to the improvement of the abundance of these two passerines and thus to the
persistence of their populations.
In conclusion, we propose the use of a functional approach as a precise and efficient method
to assess the effectiveness of AES, in connection with land use data at a fine scale.
Keywords: Agriculture; Conservation; Natura 2000 network; Agri-Environmental Schemes, Farmland birds,
skylark, Corn bunting
145
Résumé Cette thèse avait pour but d’évaluer l’efficacité de deux outils de conservation mis en place en
Europe et en France (NATURA 2000 et les Mesures Agro- Environnementales). Nos analyses
ont porté sur les agro-écosystèmes et deux passereaux spécialistes : l’Alouette des champs et
le Bruant proyer.
L’évaluation des effets de la mise en place d’une ZPS a été testée sur la période1996-2011.
Les résultats montrent, i) que la présence et l’abondance des deux espèces étaient initialement
plus importantes au sein de la ZPS qu’à l’extérieur, ii) que la tendance de l’abondance s’est
stabilisée chez l’Alouette après la désignation (contrastant avec une diminution en dehors), et a
augmenté dans le même temps chez le Bruant , iii) que les tendances des deux espèces en
dehors de la ZPS sont globalement similaires aux observations nationales et Européennes, et
enfin, iv) que la présence d’un réseau de huit ZPS en agro-système semble avoir inversé la
tendance de l’abondance de l’Alouette à l’échelle régionale par rapport à la tendance nationale.
L’évaluation des MAE nous a permis de montrer que i) deux espèces ordinaires peuvent
bénéficier de l’effet positif d’un dispositif orienté vers la sauvegarde d’une espèce patrimoniale
(l’Outarde canepetière), ii) deux mesures sont plus particulièrement à l’origine des effets
observés: les MAE « retard de fauche » et « agriculture biologique », iii) une efficacité à coût
modéré peut être obtenue via la combinaison de MAE établies selon une approche
fonctionnelle, enfin iv) l’efficacité des MAE est modulée par le contexte paysager, la stabilité des
sites, l’échelle d’analyse et la présence ou non de la ZPS.
Il apparaît au final que ces deux outils de conservation appliqués en agro-système intensif
contribuent à l’amélioration des effectifs de ces deux passereaux et ainsi à la persistance des
populations.
En conclusion, nous proposons l'utilisation d'une approche fonctionnelle en tant que méthode
précise et efficace pour évaluer l'efficacité des MAE, en relation avec les données d’occupation
des sols à une échelle fine.
Mots clefs:
Agriculture; Conservation; Natura2000; Mesures Agro-Environnementales, Oiseaux de plaine,
Alouette des champs, Bruant proyer


![[ French Humour Blague Drole Fun Joke] Au Boulot](https://img.pdfslide.fr/doc/110x75/54933614b479598b6d8b46d3/-french-humour-blague-drole-fun-joke-au-boulot.jpg)