Embed Size (px)
Citation preview
Biochimica et Biophysica Acta, 493 (1977) 167-177 © Elsevier/North-Holland Biomedical Press
BBA 37693
N A T U R A L FLUORESCENCE PROPERTIES OF PROTEIN
BROME MOSAIC VIRUS
M. HERZOG a, D. G E R A R D ~, L. HIRTH a and G. LAUSTRIAT b
QLaboratoire de Virologie, Institut de Biologie Mol~culaire et CeHulaire du CNRS, 15, rue Descartes, 67000 Strasbourg and bLaboratoire de Biophysique, U.E.R. des Sciences pharmaceutiques, 67083 Strasbourg (France)
(Received January 18th, 1977)
S U M M A R Y
Some of the fluorescence properties of brome mosaic virus protein in different states of aggregation (dimer, capsid) have been studied, in particular the emission spectra, fluorescence quantum yields and lifetimes, as well as the effect of external quenchers and of temperature on the fluorescence. Brome mosaic virus protein, which contains two tryptophan and five tyrosine residues per monomer, displayed an unusual fluorescence spectrum maximum of 308 nm at pH 7.4 when excited at 280 nm. The emission maximum was shifted to 327 nm when excited at 295 nm. Analysis of the results showed that the tyrosine emission is characterized by a high value for the quantum yield (~ = 0.07), which is consistent with a location of most of these residues in helical regions of the protein, while the tryptophan emission is strongly quenched (~ = 0.035). The effects of external quenchers suggested that two kinds of tryptophan residues might exist, one buried (tp = 0.056) and one exposed, the quantum yield of the latter being particularly low (~ ~ 0.014). The tryptophan fluorescence quenching is partially removed at pH 8.4 and totally eliminated after chemical (guanidinium chloride) or thermal denaturation of the protein.
Formation of capsid induced an additional quenching of the exposed trypto- phan residue while interaction with the RNA in the virus did not modify the emission parameters of the protein.
INTRODUCTION
Brome mosaic virus (BMV) is a small multicomponent plant virus consisting of three types of particles [1], one containing an RNA of 1.1.106 daltons, the second containing an RNA of 1.0. l06 daltons, and the last containing two RNA of 0.3 and 0.7. l06 daltons. The BMV particles can be degraded into free RNA and dissociated protein (dimers) by high salt treatment. The dissociated protein is able to aggregate in vitro into RNA-free capsid. These empty protein shells (pseudo top component, Bancroft et al. [2]) can also be produced in vitro by total release of the RNA from the native particles, without breakdown of the capsid (artificial top component, Pfeiffer and Hirth [3]). Empty protein capsids were never found in native BMV

168
preparations. Recently, nucleocapsids containing only the smallest RNA component (Mr = 0.3.106) were obtained in vitro by partial release of the RNA from the native particles (Herzog et al. [4]).
Very little is known of the conformation of BMV protein and of the molecular interactions (protein-protein and RNA-protein) it can undergo when it is in aggre- gated forms. Accordingly, we have performed a detailed study of the natural fluo- rescence of BMV protein (which contains two tryptophan (Trp) and five tyrosine (Tyr) residues) in its different states of aggregation.
MATERIAL AND METHODS
Materials Preparation of BMV prote&. BMV protein was prepared as previously de-
scribed by Pfeiffer and Hirth [5] by high salt treatment of the particles. BMV particles at 5 mg/ml in distilled water were dialysed against 1 M CaClz, 0.05 M sodium caco- dylate (pH 6.6). This treatment degrades the nucleocapsids into protein dimers (Stubbs and Kaesberg [6]); the RNA precipitates as its insoluble calcium salt and can be removed by centrifugation (10 min at 7000 rev./min). The supernatant containing the dissociated protein was then extensively dialysed against 0.01 M Tris. HC1 buffer containing 0.5 M NaC1, adjusted to pH 7.4 or 8.4.
Preparation of RNA-free eapsids. Empty capsids (artificial top components) were prepared by dialyzing the BMV particles against 0.05 M sodium acetate buffer containing 1.5 M NaC1, adjusted to pH 5.5 [3]. Pseudo top components were ob- tained by dialysis of the protein preparation (0.5 M NaCI, pH 7.4) against sodium acetate buffer pH 5.0 containing 0.5 M NaC1. Both types of capsids are stable only at high ionic strength (I > 0.3) and low pH (pH < 5).
Preparation of RNA-defectiveparticles. The viral genome is divided into 4 RNA components, each particle containing one or two RNA molecules. Nucleocapsids containing only the smallest RNA were prepared in vitro by high salt treatment of the virus [3] and isolated by isopycnic centrifugation [4]. These RNA defective particles (called intermediate component 3) are stable in the same conditions of low pH and high ionic strength as free capsids.
Solutions. Tryptophan (Sigma grade) was dissolved in bidistilled water. The buffers used for quantum yields and decay times determinations were the following: dissociated protein, 0.01 M Tris. HCI, 0.05 M NaC1 adjusted to pH 7.4 or 8.4; empty capsids (artificial top component and pseudo top component) and defective nucleo- capsids (intermediate component 3), 0.05 M sodium acetate, 0.5 M NaC1, pH 5.0.
The protein concentrations were such as to give an absorbance at 280 nm not exceeding 0.25 for dissociated protein and 0.4 for empty capsids. For defective nucleocapsids (intermediate component 3) the concentration was doubled and 4 mm path length quartz cells were used.
Denaturation of BMV protein was achieved by treatment with 6 M guani- dinium chloride (Schwartz Mann, Ultrapur) at pH 7.4.
Methods Absorption spectra were recorded with a Cary 15 spectrophotometer. They
were corrected for light scattering, using the expression log As----A log ()'nm)-~-B

169
(Chih and Fasman [7]) where As is the absorbance simulated by light scattering, and A and B are coefficients determined in the spectral region where the protein does not absorb.
Fluorescence spectra were obtained with an absolute differential spectro- fluorimeter (FICA 55). Samples were excited at 280 nm :~ 2.5 nm or 295 nm ± 2.5 n l l l .
Quantum yields (9)) were calculated from areas under the fluorescence spectra plotted in wavenumbers at constant wavenumber resolution taking as a reference
= 0.14 at 25 °C for a tryptophan solution of similar absorbance (Eisinger and Navon [8]). Quantum yields were corrected to account for the screening effect of the scattered light or, when it occurred for the absorption due to the RNA. The light intensity (Ip) effectively absorbed by the protein is (Helene et al. [9]):
IoAp [1 _ 10_(ap+a)] Ip-- A p + A
where I0 is the incident light intensity, .Ap is the true absorbance of the protein, .4 is the absorbance simulated by light scattering or the true absorbance of the RNA. The protein yield q~p is therefore:
((,Ap + _,4) (1 -- 10 -ap)
Fluorescence decay times (3) were determined by the monophoton sampling technique previously described by Laustriat et al. [10, 11]. This consists of excitation of the protein solution by a short flash (width: 3-4 ns at half maximum) of mono- chromatic light (280 nm -q- 7.5 nm or 295 nm ~: 7.5 nm) and detection of the emission by a fast photomultiplier (Dario 56 UVP) viewing the fluorescence through an inter- ference filter which excludes the scattered excitation light (maximum transmission 305 n m ± 9 nm, and 328.5 nm -+- 9 nm). The lifetime value was given by a computer comparison of theoretical and experimental curves with a precision of 0.2 ns.
Degree of polarization (p) was obtained with a laboratory built Weber type photopolarimeter (Weber [12]). Excitation conditions were identical to those used for decay time measurements. Emission was observed at 342 nm ~ 9.5 nm.
R E S U L T S
Absorption spectra The absorption spectrum of the dissociated coat protein is given on Fig. la.
It presents the marked shoulder at 292 nm which characterizes hydrophobic trypto- phan. Identical spectra were obtained for the two types of RNA-free capsids (artificial top and pseudo top components).
Fluorescence spectra The emission spectra of BMV protein in the different states of aggregation and
with RNA are also presented in Fig. 1. In all cases, two excitation wavelengths were choosen: 280 nm were both tyrosine and tryptophan residues absorb, and 295 nm
170
0 4
< Q2
8 c 8 io
o
"d 5
Q
8 A c
:"''. ~F ~, / ' - ~ ~ 10
- / i : ,' \ .o - / ~. I ', " ." I ®
• "" ,,E >
/ i ',
I~ I ' , ' ,
25O 30O 350 4OO
C
K
o p
01
, i , J | 25O
o
250 300 350 4 0 0 2730 300 350 4 0 0
A ( n m ) 3. ( n m )
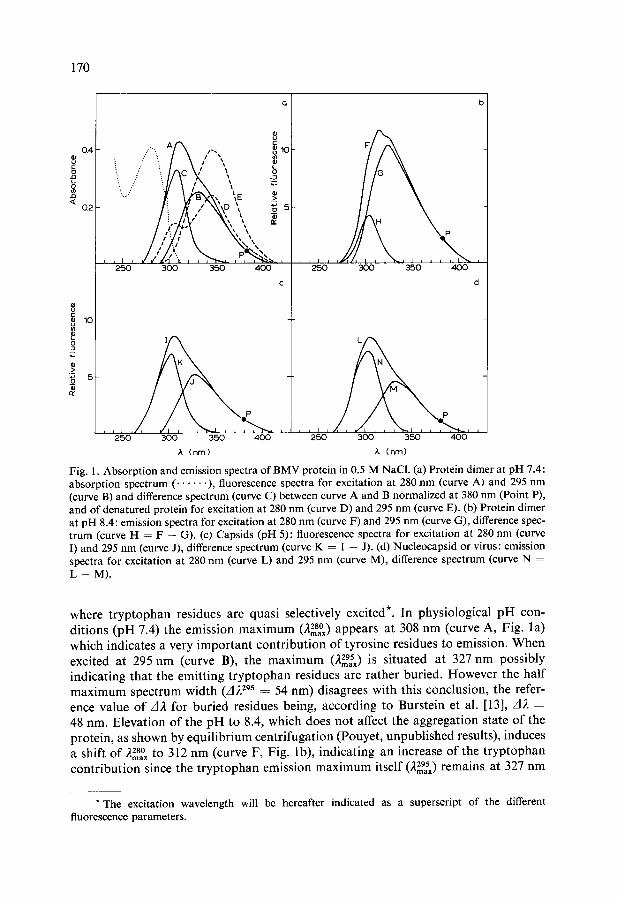
Fig. 1. Absorption and emission spectra of B M V protein in 0.5 M NaC1. (a) Protein dimer at pH 7.4: absorption spectrum ( . . . . . . ), fluorescence spectra for excitation at 280 nm (curve A) and 295 nm (curve B) and difference spectrum (curve C) between curve A and B normalized at 380 nm (Point P), and of denatured protein for excitation at 280 nm (curve D) and 295 nm (curve E). (b) Protein dimer at pH 8.4: emission spectra for excitation at 280 nm (curve F) and 295 nm (curve G), difference spec- trum (curve H = F -- G). (c) Capsids (pH 5): fluorescence spectra for excitation at 280 nm (curve I) and 295 nm (curve J), difference spectrum (curve K -- I -- J). (d) Nucleocapsid or virus: emission spectra for excitation at 280 nm (curve L) and 295 nm (curve M), difference spectrum (curve N = L - - M ) .
where tryptophan residues are quasi selectively excited*. In physiological pH con- ditions (pH 7.4) the emission maximum (228°) appears at 308 nm (curve A, Fig. l a) which indicates a very important contribution of tyrosine residues to emission. When excited at 295 nm (curve B), the maximum (229,sx) is situated at 327 nm possibly indicating that the emitting tryptophan residues are rather buried. However the half maximum spectrum width (d229s = 54 nm) disagrees with this conclusion, the refer- ence value of A2 for buried residues being, according to Burstein et al. [13], d}t = 48 nm. Elevation of the pH to 8.4, which does not affect the aggregation state of the protein, as shown by equilibrium centrifugation (Pouyet, unpublished results), induces a shift of ~ 2 m 8 a 0 x t o 312 nm (curve F, Fig. lb), indicating an increase of the tryptophan contribution since the tryptophan emission maximum itself (229~x) remains at 327 nm
* The excitation wavelength will be hereafter indicated as a superscript of the different fluorescence parameters.

171
(curve G). On the o ther hand, the reassocia t ion into capsids (pseudo top components ) , which occurs at p H 5, p roduces an oppos i te shift of the emission spec t rum (22~° X = 303 nm; curve I, Fig. 1 c) indica t ing a decrease o f the t r yp topha n emission, the charac- terist ics o f which again remain ident ical (22mg~x ~ 327 nm; curve J). The same results were ob ta ined with art if icial top componen t s (capsids) and with in termedia te com- ponen t 3 (nucleocapsids , Fig. ld) . F o r these aggregated structures and for the whole virus i tself the de te rmina t ion o f A~. was rendered difficult due to the over lapping between the b roadened Rayle igh scat ter ing peak and the t rue emiss ion spectrum.
Af ter dena tura t ion , the p ro te in emiss ion presents two dis t inct m a x i m a [22mSYx ~ 303 nm (tyrosine) and 346 nm ( t ryptophan) , curve D, Fig. la] when excited at 280 nm, and one m a x i m u m [22mg~x = 346 nm ( t ryptophan) , curve E, Fig. la] when excited at 295 nm.
Fluorescence quantum yields In o rder to evaluate the quan tum yields of t r yp tophan and tyrosine f rac t ional
emiss ions for each state o f BMV pro te in aggregat ion, the to ta l emission quan tum yield has been de te rmined for exci ta t ion at 280 nm (q~80) and 295 nm (qjzgs). Values given in Table I show tha t the BMV pro te in (in d imer form) has a very low t ryp topha n quan tum yield at p H 7.4 (qj~95 = 0.035), and an even lower one when the pro te in is aggregated into capsids (q~295 = 0.027). On the con t ra ry an increase o f the p H induces a par t ia l removal o f the t r yp tophan quenching (q~95 = 0.075).
TABLEI
FLUORESCENCE CHARACTERISTICS OF BMV PROTEIN IN THE DIFFERENT AGGREGATION STATES
Solutions ~.cxc ;tmax A~, q~p (nm) (nm) (nm) (ns)
280 307 56 0.050 2.1 * Protein dimer pH 7.4 295 327 53 0.035 2.4**
280 312 58 0.090 2.0 ~ Protein dimer pH 8.4 295 327 54 0.075 2.6"*
280 303 -- 0.038 2.0" Capsid pH 5.0 295 327 -- 0.027 2.3"*
280 303 -- 0.037 -- Nucleocapsid pH 5.0 295 327 -- 0.029 --
280 303 + 346 -- 0.150 -- Denatured protein 295 346 63 0.120 --
* Observation at 305 nm for excitation at 280 nm. ** Observation at 328.5 nm for excitation at 295 nm.
The ident i ty o f the emiss ion pa ramete r s (spectra and qua n tum yields) o f art if icial top componen t s and pseudo top components , shows tha t the two prepa- ra t ions o f capsids, e i ther by release o f the R N A from the vir ions (artificial top com- ponents) or by po lymer i sa t ion o f the dissocia ted pro te in (pseudo top components ) lead to structures p robab ly having the same conformat ion .

172
Denatured protein emission is characterized by a strong increase of ~g80 and q~g9s, showing that the quenching of tryptophan is eliminated by destruction of the tertiary and secondary structures.
As to the respective contributions of tyrosine and tryptophan, an evaluation could be obtained from the decomposition of the 280 nm excited emission spectrum into its two components. If one assumes, as in previous studies [14, 15], that the fluorescence emitted at 380 nm originates from tryptophan only, the difference be- tween the 280 and 295 nm excited emission spectra, normalized at 380 nm, should give the emission spectrum of tyrosine (Fig. 1, curves C, H, K, N).
For the protein dimers at pH 7.4, the fractional yields are:
SB ~8o (Trp) = ~ao SA
~ 2 8 o _ 2 s o Sc p (Tyr) =~vp SA
--280 -- ~p × 0.52 = 0.026
~,280 = ~a × 0.48 = 0.024
where S denotes the area under the curves of Fig. 1 indicated in subscript. An identical treatment for the protein at pH 8.4 (curves F, G and H) led to 90280 (Yrp) = 0.07 and q0 za° (Tyr) = 0.02 showing, as expected, an increase in the tryptophan yield. Such a spectral decomposition is more hazardous for higher molecular weight struc- tures (such as capsids and nucleocapsids) due to the presence of the scattering peak referred to above in the presentation of fluorescence spectra.
Emission decay times Mean values of fluorescence lifetimes are indicated in Table I for two obser-
vation conditions: 305 nm (tyrosine emission domain, 2~xc = 280 nm) and 328.5 nm (tryptophan emission domain, 2ex~ -- 295 rim). Concerning the tryptophan emission, the low values of the decay times (2.3-2.6 ns) correlate well with the low quantum yields, showing that a dynamic quenching process is occurring. Concerning the tyrosine emission, the values (2.0-2.1 ns) are close to these most commonly reported in the literature for this kind of residue.
Fluorescence quenching by ions The effect of ionic quenchers has been investigated in order to evaluate the
exposure of the emitting residues to the aqueous medium in dissociated protein and capsids. Two ions of opposite charge, such as I - and Cs +, are generally used [13, 14] in order to account for possible electrostatic effects. In the present case, KI could not be used since it induced a slight precipitation of the protein. The presence of 1 M CsC1 elicited a decrease of about 10 % in the total fluorescence intensity (2~xc = 280 nm) without any noticeable shift of the emission maximum, indicating a partial ex- posure of most of the emitting residues. With regard to the tryptophan residues, the effect of CsC1 on the 295 nm excited emission spectrum was found to increase as a function of the emission wavelength (Fig. 2). The more important quenching in the domain of the exposed tryptophan's emission denotes the presence of two kinds of tryptophan residues in the native structure, one exposed and one buried; this result in part explains the discrepancy observed between 22m9,S x and A2295. As expected, this

173
I I I I I U I I
A 4O
3O
i ~ , ~ o ~ e S ~ a F " " o ~ o i . . ~
I I I ~o ~o ~
A (rim)
• ~ Q • • • • •
380 400
Fig. 2. Tryptophan fluorescence quenching by 1 M CsC1 as a function of emission wavelength (excitation at 295 nm): Protein dimer at pH 7.4 (Q- -O) and pH 8.4 (T--T), denatured protein (o--o) .
behaviour is not observed for denatured protein where the two t ryp tophan residues are bo th fully exposed (Fig. 2).
Influence of temperature In order to detect thermally induced conformat iona l changes, the effect o f
tempera ture on emission parameters was investigated (Fig. 3). The overall confor-
10 ° " ~ " ° ~ ° ~ o ~ , D . . . . _ . ° v
_v__v~v__v__v__v/~L~ 330
5 ~o----. / 320 0"'" 0 """ 0 "-"-0 -----'0/ 310
i o ~b ' d o ' 3b ' ~o
I
"''°""-o---.... - / " " J 320 , , /
- - T - - I - - I - - L - - I I I I 310 0 10 20 30 40
__~__v~l<v._._._v__v__ 330 0"-'-~ O ~ O _ _
5 320
-'-0-"-'-0~0~0~0 0--0-- 310
--T 7---T--?--r T--'r- /
(a)
"~ (b)
g E
(c)
0 10 20 30 4.0
T (°C)
Fig. 3. Temperature effect on fluorescence parameters: (a) Protein at pH 7.4, (b) protein at pH 8.4, (c) capsids: Fluorescence intensity for excitation at 280 nm (0---0) and 295 nm ( O - - O ) , ~.max for excitation at 280 nm (W--V) and 295 nm ( V - - V ) .

174
mation of the protein at pH 7.4 is not modified between 0 and 30 °C, as shown by the monotonic decrease of q) without any change in ;tmax (Fig. 3a). Near 35 °C, the fluorescence intensity strongly increases and 2m,x is shifted to the red (,;t2mSOx passes from 307 to 330 nm, and 22mg, Sx from 327 to 340 nm), reflecting a partial denaturation state, since tryptophans are more exposed and the tryptophan quenching partially eliminated.
At pH 8.4 (Fig. 3b) the thermal transition occurs at a lower temperature (30 °C), as shown by the red shift observed for an excitation at 280 nm (22ma°x shifts from 312 to 327 nm). However, 229f~ remains constant (327 nm) indicating that the thermal transition for protein dimers at pH 8.4 does not affect the tryptophan en- vironment.
In the case of capsids (Fig. 3c), no thermal denaturation is evidenced at 35 °C, suggesting a greater thermal stability for the aggregated protein structures.
DISCUSSION
Since most of the expected information on the BMV protein, in particular the kind and the localization of the emitting residues, have been presented with the experimental data in Results, the discussion will be focused on two particular points: first an analysis of the unusual fluorescence of this protein and secondly the infor- mation obtained on the mode of protein aggregation and on the interactions of the capsid with the RNA.
(1) Emission mechanism The principal feature of the BMV protein fluorescence is that the quantum
yield of tryptophan emission is very low whereas that of tyrosine is relatively high. The explanation of this singular situation requires the quantitative determination of the yields of each kind of fluorophore (tyrosine, exposed tryptophan and buried tryptophan). The protein fluorescence may result from several processes:
(i) emission of optically excited tyrosine (characterized by ~0Tyr), (ii) emission of optically excited tryptophan (characterized by q)Trp),
(iii) sensitized emission from tryptophan excited by energy transfer from tyrosine with a quantum efficiency ~/.
Evaluation of these various parameters requires the knowledge of the protein emission yields (q~8o; q~9s) and of their components q0~ ° (Tyr), ~8o (Trp) (which have already been determined) and also the values of the fractional absorptions f by the different kinds of residues at the two excitation wavelengths.
The tyrosine yield (~Ty0 can be deduced from the following equations:
280 ~ve (Tyr) ~ T y r - - / ' 280
J Tyr
280 ne eo ~- nb eb f T y r = ~ F/t Ct

175
where e are the molar extinction coefficients, n the number o f residues exposed (subscript e) or buried (subscript b), the prime index refers to the tyrosine residues. To evaluate e we used model systems consisting o f solution o f N-acetyltyrosinamide or N-acetyl t ryptophanamide either in water or in dioxane for the exposed and buried residues respectively; dioxane has been previously shown to behave as a good model solvent for the intraglobular medium [16]. At 280 nm one has e'e ~ 1180, e'b = 1500, ee = 5600, eb = 6000. Assuming an average degree o f exposure o f the five tyrosine residues to the solvent n ' , = n'b = 2.5 and taking for t ryptophan n, = n b z 1 as
2 8 0 indicated by the quenching effect (see Results), the calculation leads to fTyr = 0.36 and q)Tyr = 0.07.
For the t ryp tophan emission direct measurements at 295 nm gave ~029s = 0.035. Moreover the quan tum yields o f bo th (exposed and buried) Trp residues can be determined by decomposing the 295 nm excited fluorescence spectrum in the follow- ing way (Fig. 4). I f the fluorescence at 400 nm can be assumed to be due to the exposed residue only (which is very likely if one considers that the emission of buried residue model solutions is quite nul at wavelengths superior to 390 nm [16]), the emission spectrum o f the residue therefore can be reconstituted f rom the 400 nm intensity value, taking into account the spectral characteristics o f an exposed Trp residue (;tm,x = 350 nm and A2 = 65 nm). The emission spectrum of the buried residue is then given by the difference between this reconstituted spectrum (Fig. 4, curve B) and the total emission spectrum (curve A). The characteristics of the differ- ence spectrum (;tin. ~ = 325 nm and d 2 = 48 nm (curve C)) are typical o f the emission of a buried residue according to Burstein [13] and Gerard [14], which supports the validity o f the method.
t L + ' i i I J i I
1 5
- - 1 0
r v
5
3O0 35O 400
k (nrn)
Fig. 4. Spectral decomposition of tryptophan emission in BMV protein emission at pH 7.4. Total spectrum (2.x~ = 295 nm) (curve A), reconstituted emission spectrum of the exposed residue (see text) (curve B) and difference spectrum (curve C = A -- B) characteristic of the burried residue.

176
From the areas under curves B and C, we can deduce pTrl) (exposed) = 0.014 and P)=_, (buried) = 0.056, which denotes by comparison with the reference yields of exposed and buried Trp (0.14 and 0.40 respectively [13, 141) that the quenching rate is of the same order for both residues. This indicates that the single analysis of ii,,, is not sufficient to draw conclusions concerning the localization of the tryptophan emitting residues. In effect, in the presence of several kinds of residues, the position of the maximum of the protein fluorescence spectrum can be either the average between 1 max of the different components if the yields of each residue are of same order of magnitude, or characteristic of the higher emitting residue only when a large yield difference exists between the residues, as in the case of BMV protein.
Concerning the tyrosine to tryptophan energy transfer, its efficiency can be deduced from
with
AD = 1 -fTyr
which, using values previously calculated, leads to q = 0.6 f 0.1. The above data deserved the following comments: (i) The quantum yield of tyrosine emission (0.07) is noticeably higher than
the most commonly found values for protein (0.03; 0.04). This shows that most of these residues are located in a particular environment, partially sheltered from the quenching that tyrosine residues usually undergo. Such a localisation could be in a helical part of the protein since Cowgill [17] has shown that tyrosine yield in muscle proteins (which contain 95% of a helix) is unusually high.
(ii) Concerning the tryptophan emission, no concrete explanation can be offered for the very low values of quantum yield, since the strongest quenching groups (such as protonated histidine and disulfide bridges) are missing in the protein dimer at pH 7.4. Furthermore, the partial removal of this quenching at pH 8.4 cannot be assigned to the pH variation (to our knowledge, no chemical quenching group titrate in this range); it is therefore due to a structural modification which removes the quenching group further from the vicinity of tryptophan residues.
(2) Protein aggregation and interaction with RNA Most of the data which were analysed in the first part of the discussion concern
the dimer structure at pH 7.4. Modification of the fluorescence properties at pH 8.4 (where the dimer structure is preserved) shows that the dimer can exist in another conformation whose structure is less rigid. This was indicated by the decrease of the thermal stability (see temperature effect, Fig. 3) and by the lowering of the degree of polarization which passes from 0.30 at pH 7.4 to 0.26 at pH 8.4.
Concerning the capsids, this study indicates that the thermal stability of the protein is increased by the higher aggregation state (Fig. 3c) and sheds some light on the protein-protein interaction process. In effect, the additional tryptophan quenching which is observed upon the protein aggregation at pH 5 can be assigned to the total quenching of the exposed tryptophan residue, since the emission is not modified by the presence of ionic quenchers, contrary to what is observed with dimers. This

177
behav iour can be a t t r ibu ted to the local iza t ion o f this t r yp topha n residue in the in terac t ion area between two p ro te in subuni ts be longing to two ad jo in ing dimers. The to ta l quenching of this t r yp tophan residue s h o u l d b e due to the contac t wi th a quenching group o f the ne ighbour ing pro te in subunit .
As to R N A - p r o t e i n interact ions, no p rominen t in fo rmat ion can be deduced f rom these da ta since the emiss ion spec t rum is not modif ied by the presence o f R N A . Such a result is expected since the exposed t r yp t opha n residue is to ta l ly quenched in the R N A - f r e e caps id and since the o ther residue, bur ied inside the prote in , cannot in teract with nucleic bases.
ACKNOWLEDGEMENTS
The au thors t hank Dr. K. R ichards for the cri t ical reading o f the manuscr ip t . This work was suppor t ed by grants f rom D.G .R .S .T . (nr. 73.7.1622) and f rom I .N .S .E .R .M. (C.R.L. nr. 74.1.225.0).
REFERENCES
1 Lane, L. C. and Kaesberg, P. (1971) Nat. New Biol. 232, 40-43 2 Bancroft, J. B., Wagner, G. W. and Bracker, C. E. (1968) Virology 36, 146-149 3 Pfeiffer, P. and Hirth, L. (1974a) Virology 58, 362-368 4 Herzog, M., Pfeiffer, P. and Hirth, L. (1976) Virology 69, 394-407 5 Pfeiffer, P. and Hirth, L. (1974b) Virology 61, 160-167 6 Stubbs, J. D. and Kaesberg, P. (1964) J. Mol. Biol. 8, 314-323 7 Shih, T. Y. and Fasman, G. D. (1972) Biochemistry 11,398-404 8 Eisinger, J. and Navon, G. (1969) J. Chem. Phys. 50, 2069-2077 9 Helene, C., Brun, F. and Yaniv, M. (1971) J. Mol. Biol. 58, 349-355
10 Laustriat, G., Pfeffer, G., Lami, H. and Coche, A. (1963) Colloque International d'l~lectronique Nucl6.aire de Paris, 93-98
11 Laustriat, G., Pfeffer, G., Lami, H. and Coche, A. (1964) Acta Phys. Polon. 26, 449-453 12 Weber, G. (1956) J. Opt. Soc. Am. 46, 962-971 13 Burstein, E. A., Vedenkina, N. S. and Ivkova, M. N. (1973) Photochem. Photobiol. 18, 263-279 14 Gerard, D., Lemieux, G. and Laustriat, G. (1975) Photochem. Photobiol. 22, 89-95 15 Kronman, M. J. and Holmes, L. G. (1971) Photochem. Photobiol. 14, 113-134 16 Gerard, D., Laustriat, G. and Lami, H. (1972) Biochim. Biophys. Acta 263, 482-495 17 Cowgill, R. W. (1968) Biochim. Biophys. Acta 168, 431-446